1 Coastal Hydrology for the Mission-Aransas Estuary February 22, 2011 Bays & Estuaries Program Surface Water Resources Division Texas Water Development Board 1700 N. Congress Avenue Austin, Texas 78711 Technical Authors Caimee Schoenbaechler, M.E.M. Carla G. Guthrie, Ph.D. Technical Contributor Qingguang Lu, P.E. Purpose This technical memo documents the procedure for estimating combined freshwater inflow data for the Mission-Aransas Estuary and the specifics related to producing hydrology dataset versions #TWDB201001 and #TWDB201004 for this estuary. Introduction The goal of the Texas Water Development Board (TWDB) Coastal Hydrology program is to provide estimates of historical freshwater inflows into Texas bays and estuaries to support environmental and water planning studies. The earliest freshwater inflow estimates were compiled in a series of reports published by the Texas Department of Water Resources between 1980 and 1983. Monthly inflows to the seven major estuaries in Texas for the period 1941-1976 were estimated in those studies, with estimates for the Mission-Aransas Estuary published in Chapter 4 of LP-108, Nueces and Mission- Aransas Estuaries: A Study of the Influence of Freshwater Inflows (TDWR 1981, available on the TWDB website or upon request). Inflow records for each estuary have been updated periodically since then in support of ongoing research and planning studies both within and external to TWDB. Additionally, subsequent updates are provided in daily as well as monthly format. This report covers the most recent update of freshwater inflow estimates for the Mission-Aransas Estuary and extends the hydrology through 2009. Therefore, complete hydrology is available for this estuary for 1941-2009, with daily estimates of inflows available only after 1977. Estimates of Combined Freshwater Inflows Estimates of hydrology for the areas draining to the Mission-Aransas Estuary include gaged and ungaged portions of the Mission and Aransas river basins, as well as other small coastal basins. The combination of Gaged Inflows + Ungaged Inflows + Return Flows - Diversions below the last gage station provide for estimates of Combined Freshwater Inflow to the estuary. The Freshwater Inflow Balance then consists of Combined Inflows + Precipitation on the estuary – Evaporation from the estuary. Although inflow estimates are updated on an ongoing basis, there are two distinct periods of estimation. Before 1977,

Welcome message from author
This document is posted to help you gain knowledge. Please leave a comment to let me know what you think about it! Share it to your friends and learn new things together.
Transcript

1
Coastal Hydrology for the Mission-Aransas Estuary
February 22, 2011
Bays & Estuaries Program Surface Water Resources Division Texas Water Development Board
1700 N. Congress Avenue Austin, Texas 78711
Technical Authors
Caimee Schoenbaechler, M.E.M. Carla G. Guthrie, Ph.D.
Technical Contributor
Qingguang Lu, P.E.
Purpose
This technical memo documents the procedure for estimating combined freshwater inflow data for the Mission-Aransas Estuary and the specifics related to producing hydrology dataset versions #TWDB201001 and #TWDB201004 for this estuary.
Introduction
The goal of the Texas Water Development Board (TWDB) Coastal Hydrology program is to provide estimates of historical freshwater inflows into Texas bays and estuaries to support environmental and water planning studies. The earliest freshwater inflow estimates were compiled in a series of reports published by the Texas Department of Water Resources between 1980 and 1983. Monthly inflows to the seven major estuaries in Texas for the period 1941-1976 were estimated in those studies, with estimates for the Mission-Aransas Estuary published in Chapter 4 of LP-108, Nueces and Mission-Aransas Estuaries: A Study of the Influence of Freshwater Inflows (TDWR 1981, available on the TWDB website or upon request).
Inflow records for each estuary have been updated periodically since then in support of ongoing research and planning studies both within and external to TWDB. Additionally, subsequent updates are provided in daily as well as monthly format. This report covers the most recent update of freshwater inflow estimates for the Mission-Aransas Estuary and extends the hydrology through 2009. Therefore, complete hydrology is available for this estuary for 1941-2009, with daily estimates of inflows available only after 1977.
Estimates of Combined Freshwater Inflows
Estimates of hydrology for the areas draining to the Mission-Aransas Estuary include gaged and ungaged portions of the Mission and Aransas river basins, as well as other small coastal basins. The combination of Gaged Inflows + Ungaged Inflows + Return Flows - Diversions below the last gage station provide for estimates of Combined Freshwater Inflow to the estuary. The Freshwater Inflow Balance then consists of Combined Inflows + Precipitation on the estuary – Evaporation from the estuary. Although inflow estimates are updated on an ongoing basis, there are two distinct periods of estimation. Before 1977,

2
inflow estimates are available only in monthly intervals. Starting in 1977 and thereafter, inflow estimates became available on a daily basis.
1941-1976 Period of Record This period of record uses measurements from U.S. Geological Survey (USGS) stream gages along with rainfall-runoff estimates from a water yield model to determine flows in gaged and ungaged watersheds (TDWR 1981). In these early estimates of coastal hydrology, flows in ungaged areas were adjusted for known agricultural, municipal, and industrial return flows obtained from the Texas Department of Water Resources or equivalent agency (TDWR 1981). However, LP-108 does not clearly document the treatment of diversion data when estimating combined inflows to the estuary. Data on inflows to the Mission-Aransas Estuary for the 1941-1976 period is available as monthly or annual estimates. 1977-2009 Period of Record
This period of record uses measurements from USGS stream gages along with rainfall-runoff estimates from the Texas Rainfall-Runoff (TxRR) model, adjusted for known diversion and return flows obtained from the TCEQ (or equivalent agency), the South Texas Water Master, and the TWDB Irrigation Water Use estimates. In some cases, diversion and return data may be obtained through other entities, such as in the TWDB report on Coastal Hydrology for the Guadalupe Estuary (Guthrie and Lu 2010) where recent diversion and return data were obtained from HDR Inc. Data on inflows to the Mission-Aransas Estuary for the 1977-2009 period is available as daily, monthly, or annual estimates. Gaged Watersheds
Four USGS stream gages have been used to develop the gaged inflow component of combined inflows to the Mission-Aransas Estuary. The gage location at the Mission River at Refugio has been utilized since 1939. Table 1 lists these USGS stream gages and the corresponding period of record utilized in estimating combined inflows. Approved USGS stream gage data was available through November 2009 and was provisional for December 2009.
Table 1. USGS stream gages used to develop the gaged inflow component of combined inflows to the Mission-Aransas Estuary. Gage number, location, and period of record utilized in estimating inflows are shown.
Estuary Gage Station Number Gage Location Utilized Period of Record
Mission-Aransas
08189800 Chiltipin Creek at Sinton 1970-1991
08189700 Aransas River near Skidmore 1964-present
08189500 Mission River at Refugio 1939-present
08189200 Copano Creek near Refugio 1970-present
Ungaged Watersheds
The number of ungaged watersheds for which ungaged inflows are estimated has changed through time as USGS gages become available or unavailable. Figures 1-3 show watershed boundaries for the ungaged watersheds during the period from 1941 to present. Major differences in watersheds occur as

3
watersheds #20125 and #20030 transitioned from ungaged to gaged in 1970, and as watershed #20030 transitioned back to ungaged in 1991 (Figures 1-3). Also, watershed #20010 was divided into two watersheds, #20012 and #20014, in 1977 (Figure 2).
The ungaged inflow component of combined inflows is estimated using a rainfall-runoff model. Before 1977, stream flows in ungaged watersheds were obtained using a water yield model which required daily precipitation, Soil Conservation Service average curve numbers, and soil depletion index (TDWR 1981). This water yield model provided for monthly estimates of ungaged inflows – not daily. TWDB does not have daily estimates of ungaged inflows for the period prior to 1977.
Since 1977, however, TWDB has used the Texas Rainfall-Runoff (TxRR) model to estimate daily stream flows in ungaged watersheds. This model is conceptually similar to the Agricultural Research Service (ARS) rainfall-runoff model which is based on the Soil Conservation Service’s curve number method to estimate direct runoff from a precipitation event. TxRR, however, has three key differences: (1) use of a simpler and more straightforward mathematics, (2) introduction of 12 monthly depletion factors, instead of single depletion factor used in the ARS Model, and (3) introduction of a base flow component into the model. TxRR has been used to estimate daily stream flows from over 50 coastal ungaged watersheds as a part of the Bays & Estuaries Coastal Hydrology Program to study the effect of freshwater inflows to Texas bays and estuaries.

4
Figure 1. Ungaged watershed delineation used to determine ungaged inflows to the Mission-Aransas Estuary from 1941 to 1970. From 1970 to 1976, watersheds #20125 (upper right) and #20030 (lower left) transitioned from ungaged to gaged watersheds as shown in Figure 2. Triangles represent USGS Streamflow Gages. Ungaged watersheds are identified by cross-hatching.
Figure 2. Ungaged watershed delineation used by TxRR to determine ungaged inflows to the Mission-Aransas Estuary from 1977 to 1991. Gaged watersheds are identified by yellow cross-hatching. Watershed numbers changed when watershed# 20010 (lower right, see Figure 1) was split into two watersheds, #20012 and #20014, and ungaged watersheds #20125 and #20030 transitioned to gaged watersheds in 1970.

5
Figure 3. Ungaged watershed delineation used in TxRR to determine ungaged flows to
the Mission-Aransas Estuary from 1991 to Present. Gaged watersheds are identified by yellow cross-hatching. Watershed #20030 (lower left) transitioned back to an ungaged watershed in 1991.

6
Diversion and Return Points
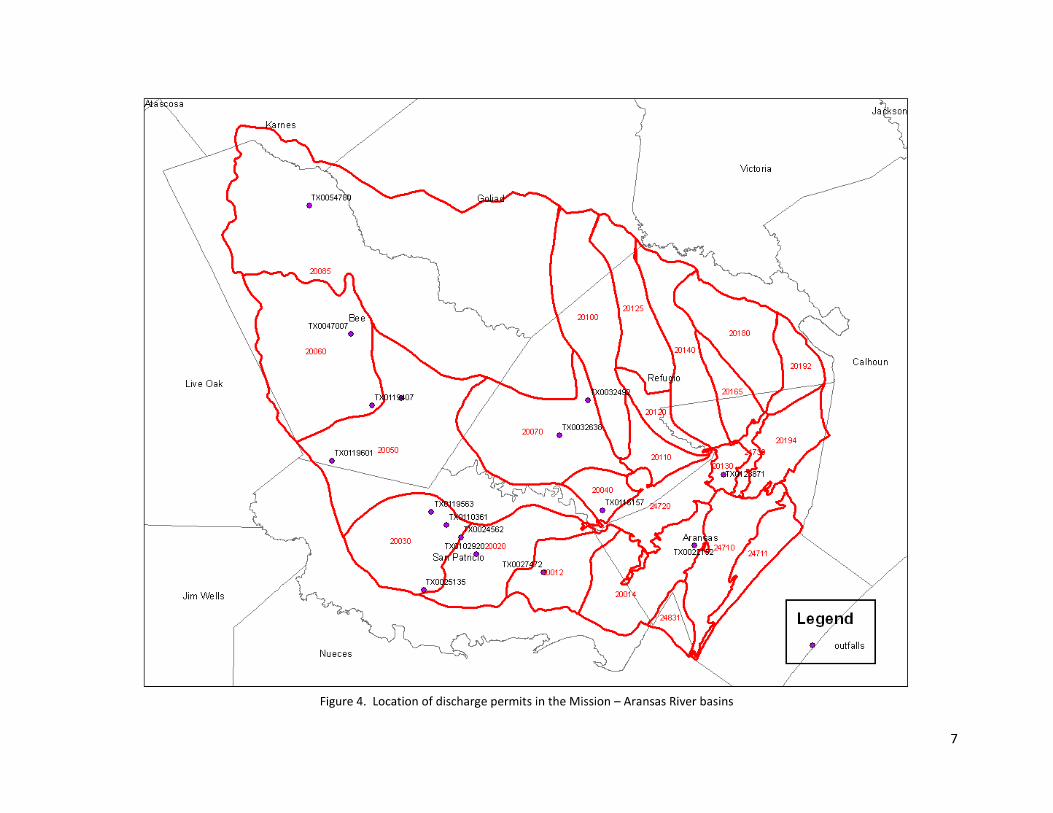
The major discharge permits and dischargers providing return flows to the Mission-Aransas Estuary are listed in Table 2, with locations shown in Figure 4. Although the TWDB coastal hydrology database includes several small diversions in the 1980’s (Appendix A), owners of these diversion permits are unknown at this time.
Table 2. Major discharge permits in the Mission-Aransas basin below the lowest USGS streamgages.
RETURN FLOWS
National Pollutant Discharge Elimination System Number
OWNER
TX0022152 City Of Rockport
TX0024562 City Of Sinton
TX0025135 City Of Odem
TX0027472 City Of Taft
TX0032492 Town Of Refugio
TX0032638 Town Of Woodsboro
TX0047007 City Of Beeville
TX0054780 Pettus Mud
TX0102920 Texas Dept Of Transportation
TX0110361 City Of Sinton
TX0113859 City Of Beeville
TX0116157 Town Of Bayside
TX0119407 Skidmore WSC
TX0119563 St Paul WSC
TX0119601 Tynan WSC
TX0123871 Holiday Beach WSC
7
Figure 4. Location of discharge permits in the Mission – Aransas River basins

8
Estimates of Freshwater Inflow Balance
Total Freshwater Inflow to the estuary may include estimates of Combined Freshwater Inflow to the estuary + Precipitation on the estuary. The Freshwater Inflow Balance, then, considers the effect of Evaporation from the estuary. Due to limitations on estimates of evaporation throughout the period of record, estimates of the freshwater inflow balance are available only in monthly intervals.
Precipitation and Evaporation
Direct precipitation onto the surface of the Mission-Aransas Estuary was calculated using Thiessen-weighted precipitation techniques as described in LP-108 (TDWR 1981). Station based rainfall data were obtained from the National Weather Service (NWS) and processed using Arc/Info Macro Language (AML). Figure 5 shows the Thiessen polygons that were built over the rainfall stations to calculate watershed rainfall.
Figure 5: Rainfall stations () and Thiessen polygons (red lines) used to estimate direct precipitation onto the Mission-Aransas Estuary.

9
Evaporation was calculated for the surface area of the bay using TWDB and NWS pan evaporation data to estimate evaporation rates. Bay watersheds used to calculate evaporation include watershed #24720, #24730, and #24710 which are located within quadrangles 910, 911, 1010, and 1011 (Figure 6). The total water evaporated from this watershed is calculated by multiplying the watershed area by the evaporation rates obtained from the TWDB. Evaporation rates were determined with a GIS based program, ThEvap, using TWDB and NWS pan evaporation data. The ThEvap program replaced an older program, WD0300, previously run by the Texas Department of Water Resources (http://midgewater.twdb.state.tx.us/Evaporation/evap.html).
Figure 6. TWDB evaporation quadrangles used to estimate evaporation for the Mission-Aransas Estuary. Quadrangles 910, 911, 1010, and 1011 are used to estimate evaporation from the Mission-Aransas Estuary segments #24720, #24730, #24710, and #24831.

10
Hydrology: Version #TWDB201001
TWDB coastal hydrology version #TWDB201001 for the Mission-Aransas Estuary included gaged and ungaged inflows through December 2008. There were no diversion permits found for the period 1941 through 1976 or in the raw diversion data obtained from the South Texas Water Master (STWM) for the period from 1989 through October 2005. Although the TWDB coastal hydrology database includes a few diversions in the 1980’s, the permit owners are unknown at this time. Industrial and municipal return flow data was obtained from the Texas Department of Water Resources (TDWR) self-reporting system from 1941 through 1976 and from TCEQ for the period from 1977 to 2007. Additional return flow data was obtained from TWDB’s agricultural return flow estimates through December 2005.
Hydrology: Version #TWDB201004
TWDB coastal hydrology version #TWDB201004 for the Mission-Aransas Estuary extended the gaged data through November 2009 and used provisional data for December 2009. Ungaged inflows were updated from coastal hydrology version #TWDB201001 using approved daily precipitation data from the National Weather Service through November 2009, with provisional data for December 2009. Diversions were the same as in version #TWDB201001, but additional data from the STWM extended the dataset to 2009. Return flows were the same as in version #TWDB201001 and additional data obtained from TCEQ was updated through December 2009, and agricultural return flows data obtained from TWDB were extended to December 2007. Figure 7 displays the combined freshwater inflow to the Mission-Aransas Estuary as calculated by this version.
Figure 7: Combined freshwater inflow to the Mission-Aransas Estuary as calculated for version #TWDB201004.

11
Conclusion Version #TWDB201004 of coastal hydrology for the Mission-Aransas Estuary is the most up-to-date data set representing not only combined freshwater inflows but also the individual components of inflows (i.e., gaged flows, ungaged flows, diversions, return flows) for this estuary. Appendix A summarizes recent updates, by version, to hydrology for the Mission-Aransas Estuary. Appendix B lists the annual combined freshwater inflow along with the four components, as well as estimates for evaporation and precipitation on the estuary and the total freshwater inflow balance of the Mission-Aransas Estuary. Appendix C lists summary statistics for the inflow components over the 1941 through 2009 period. Over the period from 1941 to 2009, gaged inflow from the Mission and Aransas Rivers accounted for approximately 29 percent of combined inflow, while ungaged flows accounted for nearly 70 percent of combined inflow. In general, net diversions accounted for only a small percent of the combined freshwater inflow to the estuary. In the Mission and Aransas river basins, annual average diversions total 0.02 percent of combined freshwater inflows, and annual average return flows total 0.94 percent of inflows. The difference then between diversions and returns accounts for 0.92 percent of the total combined freshwater inflow to the estuary. Nonetheless, it is still important to obtain the best data to allow for the most accurate representation of coastal hydrology and total freshwater inflows to the Mission-Aransas Estuary. Average combined surface inflow to the Mission-Aransas Estuary over the study period was approximately 490,000 acre-feet per year and the median surface inflow was approximately 366,000 acre-feet per year. Finally, when considering total freshwater inflow balance, evaporation from and precipitation onto the surface of the estuary also must be considered. In 24 out of 69 years, there is a negative freshwater inflow balance, which indicates that evaporation exceeded precipitation and combined inflow to the estuary during periods of extreme drought. During the study period, annual average evaporation was approximately 583,000 acre-feet, while annual average precipitation was 373,000 acre-feet over the surface of the Mission-Aransas estuary. Surface evaporation from the Mission-Aransas estuary, when compared to both combined freshwater inflow and precipitation input, was 68% of the freshwater inflow balance. For the 1941 through 2009 period, the average freshwater inflow balance for the Mission-Aransas estuary was approximately 280,000 acre-feet per year. However, as Appendix B shows, wide variations from the mean freshwater inflow balance occur as a result of drought and flood conditions. Literature Cited TDWR. 1981. Nueces and Mission-Aransas Estuaries: A study of the influence of freshwater inflows. LP-
108. Texas Department of Water Resources, Austin, Texas. Guthrie, C.G. and Q.Lu. 2010. Coastal Hydrology for the Guadalupe Estuary: Updated Hydrology with
Emphasis on Diversion and Return Flow Data for 2000-2009. Texas Water Development Board, Austin, Texas.
12
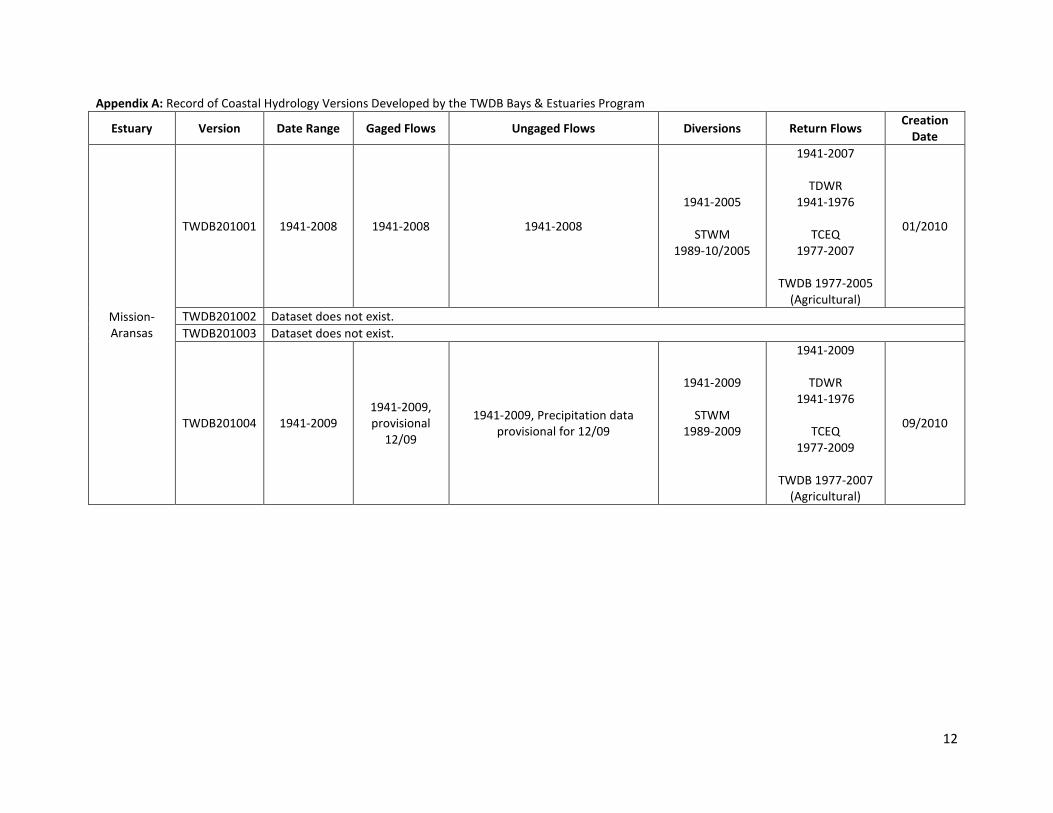
Appendix A: Record of Coastal Hydrology Versions Developed by the TWDB Bays & Estuaries Program
Estuary Version Date Range Gaged Flows Ungaged Flows Diversions Return Flows Creation
Date
Mission-Aransas
TWDB201001 1941-2008 1941-2008 1941-2008
1941-2005
STWM 1989-10/2005
1941-2007
TDWR 1941-1976
TCEQ
1977-2007
TWDB 1977-2005 (Agricultural)
01/2010
TWDB201002 Dataset does not exist.
TWDB201003 Dataset does not exist.
TWDB201004 1941-2009 1941-2009, provisional
12/09
1941-2009, Precipitation data provisional for 12/09
1941-2009
STWM 1989-2009
1941-2009
TDWR 1941-1976
TCEQ
1977-2009
TWDB 1977-2007 (Agricultural)
09/2010

13
Appendix B: Annual Hydrology for the Mission-Aransas Estuary, Version #TWDB201004. Included are estimates of gaged and ungaged (modeled) inflows, diversions and return flows, combined surface inflow to the estuary, as well as evaporation and direct precipitation on the estuary and the total freshwater balance of the estuary. All values are in units of acre-feet.
Year Gage Model Diversion Return Surface Inflow Evaporation Precipitation
Freshwater Balance
1941 219,803 623,229 0 0 843,032 457,000 473,435 859,467
1942 262,749 501,053 0 0 763,802 448,000 404,849 720,651
1943 35,025 41,629 0 0 76,654 543,000 263,866 -202,480
1944 48,814 89,152 0 0 137,966 476,000 344,836 6,802
1945 36,359 157,883 0 0 194,242 533,000 336,261 -2,497
1946 83,160 344,549 0 0 427,709 487,000 447,713 388,422
1947 59,378 48,831 0 0 108,209 506,000 291,490 -106,301
1948 5,681 60,294 0 0 65,975 534,000 282,917 -185,108
1949 33,262 148,509 0 0 181,771 503,000 385,797 64,568
1950 2,677 4,826 0 0 7,503 571,000 158,128 -405,369
1951 28,230 105,086 0 0 133,316 581,000 294,349 -153,335
1952 102,799 185,744 0 0 288,543 580,000 276,249 -15,208
1953 38,274 217,717 0 0 255,991 553,000 315,304 18,295
1954 4,431 82,384 0 0 86,815 628,000 203,855 -337,330
1955 3,875 53,053 0 0 56,928 742,000 224,809 -460,263
1956 8,078 14,428 0 7,000 29,506 705,000 215,285 -460,209
1957 111,735 251,719 0 7,000 370,454 600,000 377,223 147,677
1958 144,141 479,856 0 7,000 630,997 467,000 432,473 596,470
1959 45,931 232,007 0 9,000 286,938 599,000 434,378 122,316
1960 156,612 823,953 0 9,000 989,565 582,000 558,215 965,780
1961 58,922 256,306 0 9,000 324,228 542,000 347,694 129,922
1962 36,622 15,304 0 9,000 60,926 667,000 261,960 -344,114
1963 4,613 2,365 0 11,000 17,978 627,000 198,138 -410,884
1964 11,985 83,785 0 11,000 106,770 600,000 261,963 -231,267
1965 48,267 54,631 0 11,000 113,898 560,000 305,780 -140,322
1966 105,499 326,999 0 11,000 443,498 515,000 326,737 255,235
1967 526,022 1,005,120 0 11,000 1,542,142 609,000 482,007 1,415,149
1968 122,031 579,369 0 13,000 714,400 506,000 488,676 697,076
1969 72,212 174,141 0 13,000 259,353 630,000 372,460 1,813
1970 73,723 293,522 0 14,000 381,245 591,000 405,801 196,046
1971 575,207 567,252 0 14,000 1,156,459 603,000 421,042 974,501
1972 248,755 288,225 0 14,000 550,980 524,000 406,753 433,733
1973 475,001 582,150 0 14,000 1,071,151 530,000 492,486 1,033,637
1974 157,347 361,301 0 14,000 532,648 582,000 442,001 392,649
1975 43,335 23,898 0 11,000 78,233 565,000 308,000 -178,767
1976 313,240 341,599 0 13,000 667,839 554,000 468,000 581,839
1977 141,904 302,670 0 2,663 447,237 674,051 364,231 137,417

14
Year Gage Model Diversion Return Surface Inflow Evaporation Precipitation
Freshwater Balance
1978 115,249 122,594 0 2,480 240,323 645,303 354,312 -50,668
1979 196,633 557,621 0 2,739 756,993 614,076 547,375 690,292
1980 165,705 434,414 0 1,658 601,777 707,112 349,314 243,979
1981 471,440 961,019 36 2,208 1,434,631 623,658 601,028 1,412,001
1982 139,482 190,128 45 1,952 331,517 688,483 266,682 -90,284
1983 261,437 898,610 0 2,265 1,162,312 651,548 505,662 1,016,426
1984 67,245 204,064 37 2,444 273,716 749,864 290,438 -185,710
1985 126,505 410,152 32 2,665 539,290 640,568 427,902 326,624
1986 45,745 92,422 23 2,306 140,450 746,956 350,598 -255,908
1987 151,820 217,186 5,804 2,390 365,592 719,175 382,596 29,013
1988 15,841 56,553 18 2,018 74,394 634,645 259,838 -300,413
1989 3,286 87,246 17 1,852 92,367 548,174 236,132 -219,675
1990 214,070 242,522 0 1,892 458,484 572,299 317,046 203,231
1991 162,806 423,751 0 2,117 588,674 565,512 546,972 570,134
1992 355,862 1,053,362 0 2,781 1,412,005 500,689 425,136 1,336,452
1993 255,049 796,805 0 2,394 1,054,248 602,660 397,677 849,265
1994 103,393 205,842 0 1,977 311,212 497,784 296,538 109,966
1995 32,895 247,815 0 3,789 284,499 521,476 377,707 140,730
1996 28,553 51,518 0 3,778 83,849 556,577 192,953 -279,775
1997 299,426 708,101 0 4,065 1,011,592 554,661 538,646 995,577
1998 301,923 543,970 0 3,941 849,834 591,382 428,117 686,569
1999 36,633 186,141 0 3,298 226,072 551,579 465,546 140,039
2000 24,042 273,549 0 2,567 300,158 671,170 381,441 10,429
2001 385,955 357,397 0 2,099 745,451 583,517 323,714 485,648
2002 225,341 1,093,435 0 2,590 1,321,366 563,826 530,126 1,287,666
2003 106,469 602,926 0 3,104 712,499 472,284 387,971 628,186
2004 413,158 705,719 0 3,098 1,121,975 468,820 594,562 1,247,717
2005 124,984 192,852 0 2,315 320,151 622,738 264,702 -37,885
2006 62,250 467,072 0 2,305 531,627 625,456 522,172 428,343
2007 395,194 1,161,317 0 3,226 1,559,737 528,791 528,811 1,559,757
2008 14,358 87,450 0 2,364 104,172 634,300 228,710 -301,418
2009 120,827 263,185 0 2,394 386,406 586,431 343,597 143,572
*Surface Inflow = Gage + Model - Diversion + Return **Freshwater Balance = Surface Inflow - Evaporation+ Precipitation

15
Appendix C: Summary statistics for annual freshwater inflow (in acre-feet) over the 1941-2009 period for the Mission-Aransas Estuary, Version #TWDB201004.
Gage Model Diversion Return Surface Inflow*
Evaporation Precipitation Freshwater Balance**
MIN 2,677 2,365 0 0 7,503 448,000 158,128 -460,263
5%ile 4,504 18,742 0 0 58,527 470,206 208,427 -380,867
10%ile 11,204 50,981 0 0 76,202 495,627 234,648 -300,614
25%ile 36,622 92,422 0 1,892 137,966 533,000 291,490 -140,322
MEDIAN 105,499 251,719 0 2,567 365,592 581,000 372,460 140,039
MEAN 143,033 342,337 87 4,605 489,888 582,834 373,032 280,085
75%ile 214,070 501,053 0 9,000 714,400 627,000 442,001 628,186
90%ile 361,881 802,235 17 13,000 1,128,872 676,937 529,074 1,019,868
95%ile 448,127 987,480 34 14,000 1,375,749 714,350 547,214 1,316,938
MAX 575,207 1,161,317 5,804 14,000 1,559,737 749,864 601,028 1,559,757
TOTAL All Years 9,869,275 23,621,277 6,012 317,734 33,802,274 40,215,565 25,739,182 19,325,891
% of Total Surface Inflow 29.20 69.88 0.02 0.94 100 - - -
Related Documents