Estuaries Vol. 25, No. 4b, p. 848-861 August 2002 Coastal Eutrophication and and Assessment Program the Danish National Aquatic Monitoring DANIEL J, CONLEY 1., STIIG MARKAGER 1, JESPER ANDERSEN 2, THOMAS ELLERMANN s, and EARS M, SVENDSEN 4 1 Depart.metal of Ma'rine Ecology, National Environmental Research Institute, P. O. Box 358, DK-4000 Roskilde, Der~ma,d~ Danish Environmental Protection Agency, Strandgade 29, DK 1401 Copenhagen, Denmark s Depart'mere of At'mospheric Environment, National Environmer~tal Research Institute, P. O. Box 358, DK-4000 Roskitde, Der~mark 4 Environmental Monitoring Coordination ,Section, National Environmental Research Institute, P O. Box 358, DK-4000 Roskitde, Denma'~k ABSTRACT: Nutrient over-enrichment and cultural eutrophication are significant problems in the Danish nlarine en- viromuent. Symptonls of eutrophication include periods of hypoxia and anoxia in bottonl waters, death of benthic- dwelling organisnls during anoxia, long-ternl reductions in the depth distribution of nlacrophyte conmlunities, changes in the species conlposition of nlacrophyte conlnlunities, and increases in reports of harmful algal blooms. In 1987 tile Action Plan on the Aquatic Environment was adopted to combat nutrient pollution of the aquatic environmentwith the overall goal of reducing nitrogen loads by 50% and point source phosphorus loads by 80%. The Danish Aquatic Nation- wide Monitoring Program was begun in 1988 in order to describe the status of point sources (industry, sewage treatment plants, stormwater outfalls, scattered dwellings, and fish farms)~ ground water~ springs~ agricultural watersheds~ streams~ lakes, atmospheric deposition~ and the marine environment. Another important aspect of the program was to document the effects on the aquatic enviromnent of tile nleasures and investments taken for nutrient reduction as outlined in tile Action Plan. The nlonitoring progranl should deternline if reductions in nutrients are achieved by tile nleasures taken and should help decision nlakers choose appropriate additional measures to fulfill tile objectives. Coordination with international progranls and colnlnissions is an important conlponent of tile nronitoring program to nleet internationally agreed upon reductions in nutrient inputs. The future and direction of the Danish National Aquatic Monitoring and Assessment Program will be to a large extent shaped by both the Water Framework Directive and Habitat Directive adopted by the European Union. Introduction Nutrient over-enrichment and cultural eutrophi- cation of surface waters have been recognized as being one of the most urgent problems to over- come in order to improve the environmental state of lakes, streams, and marine waters in Denmark. Nutrient loading from Denmark expressed on an area basis ranks among the highest in Europe (Paa- by and Mohlenberg 1996) and reflects the density of the population and the intensity of agriculture. Danish marine waters display all the classic symp- toms associated with eutrophication including in- creased phytoplankton biomass and harmful algal blooms (Kaas et al. 1999), reductions in the depth distribution of macrophyte communities (Sand- Jensen et al. 1994), changes in the species com- position of macrophyte communities (Middleboe and Sand-Jensen 2000), periods of hypoxia and an- oxia in bottom waters (Conley and Josefson 2001), * Corresponding author: tele: +45 4630 1200; fax: +45 4630 1114; e-marl: [email protected]. and the death of benthic-dwelling organisms dur- ing anoxia (Fallesen et al. 2000). During the 1980s a series of oxygen (Oz) deple- tion events catalyzed the environmental movement and led to the passage of the Action Plan on the Aquatic Environment (Christensen et al. 1998). In addition to creating a national agenda to reduce the over-enrichment of natural waters with nutri- ents, the Action Plan established a coordinated Aquatic Nationwide Monitoring Program (Kron- vang et al. 1998) leading to the creation of the National Environmental Research Institute (NERI). The 1987 Action Plan on the Aquatic En- vironment I was only the first of a series of legis- lative actions in combination with international agreements that have arisen to reduce nutrient over-enrichment and the symptoms of eutrophi- cation in Denmark with the overall objective of a clean and healthy aquatic environment. Most of the Action Plans are concerned with reduction of discharges, loads, and emission of nutrients. The current Danish National Aquatic Monitoring and 2002 Estuarine Research Federation 84-8

Welcome message from author
This document is posted to help you gain knowledge. Please leave a comment to let me know what you think about it! Share it to your friends and learn new things together.
Transcript
Estuaries Vol. 25, No. 4b, p. 848-861 August 2002
Coastal Eutrophication and
and Assessment Program
the Danish National Aquatic Monitoring
DANIEL J , CONLEY 1. , STIIG MARKAGER 1, JESPER ANDERSEN 2, T H O M A S ELLERMANN s, and EARS M, SVENDSEN 4
1 Depart.metal of Ma'rine Ecology, National Environmental Research Institute, P. O. Box 358, DK-4000 Roskilde, Der~ma,d~
Danish Environmental Protection Agency, Strandgade 29, DK 1401 Copenhagen, Denmark s Depart'mere of At'mospheric Environment, National Environmer~tal Research Institute, P. O. Box
358, DK-4000 Roskitde, Der~mark 4 Environmental Monitoring Coordination ,Section, National Environmental Research Institute,
P O. Box 358, DK-4000 Roskitde, Denma'~k
ABSTRACT: Nutr ien t over -enr ichment and cultural eut rophica t ion are s ignif icant p r o b l e m s in the Danish nlarine en- v i romuent . Symptonls of eut rophica t ion include per iods of hypoxia a n d anoxia in bot tonl waters, dea th of benthic- dwelling organisnls du r ing anoxia, long-ternl reduc t ions in the dep th dis t r ibut ion of nlacrophyte conmluni t ies , changes in the species conlposi t ion of n lacrophyte conlnlunit ies , a n d increases in repor ts of ha rmfu l algal blooms. In 1987 tile Action Plan on the Aquatic Env i ronmen t was a d o p t e d to c o m b a t nu t r i en t pollut ion of the aquatic e n v i r o n m e n t w i t h the overall goal of reduc ing ni t rogen loads by 50% a n d po in t source p h o s p h o r u s loads by 80%. T h e Danish Aquatic Nation- wide Moni tor ing Program was begun in 1988 in o rder to descr ibe the s ta tus o f po in t sources (industry, sewage t r ea tmen t plants , s to rmwater outfalls , sca t te red dwellings, and fish farms)~ g r o u n d water~ springs~ agricultural watersheds~ streams~ lakes, a tmospher ic deposition~ and the mar ine env i ronment . Ano the r impor t an t aspect of the p rog ram was to d o c u m e n t the effects on the aquatic env i romnen t of tile n leasures and inves tments taken for nu t r ien t reduct ion as ou t l ined in tile Action Plan. T h e n loni tor ing progranl s h o u l d de te rn l ine if reduc t ions in nut r ien ts are achieved by tile n leasures taken and s h o u l d help decision nlakers choose appropr ia te addit ional m e a s u r e s to fulfill tile objectives. Coord ina t ion with in ternat ional progranls and colnlnissions is an impor t an t con lponen t o f tile nroni tor ing p rog ram to nleet internat ional ly agreed upon reduc t ions in nu t r i en t inputs. The fu tu re and direct ion of the Danish National Aquatic Moni tor ing and A s s e s s m e n t P rog ram will be to a large ex ten t s h a p e d by both the Water Framework Directive a n d Habi ta t Directive a d o p t e d by the European Union.
In t roduc t ion
Nut r i en t over -enr ichment and cultural eut rophi- cation of surface waters have been recognized as being one of the most u rgen t p rob l ems to over- come in o rder to improve the env i ronmenta l state of lakes, streams, and mar ine waters in Denmark . Nut r ien t loading f rom D e n m a r k expressed on an area basis ranks a m o n g the highest in Europe (Paa- by and Moh lenbe rg 1996) and reflects the density of the popu la t ion and the intensity of agriculture. Danish mar ine waters display all the classic symp- toms associated with eu t roph ica t ion including in- creased phy top lank ton biomass and ha rmfu l algal b looms (Kaas et al. 1999), reduct ions in the depth distr ibution of mac rophy te communi t ies (Sand- J ensen et al. 1994), changes in the species com- posit ion of mac rophy te communi t i e s (Middleboe and Sand-Jensen 2000), per iods of hypoxia and an- oxia in bo t t om waters (Conley and Josefson 2001),
* Cor re spond ing author: tele: +45 4630 1200; fax: +45 4630 1114; e-marl: [email protected].
and the death of benthic-dwelling organisms dur- ing anoxia (Fallesen et al. 2000).
Dur ing the 1980s a series of oxygen (Oz) deple- tion events catalyzed the env i ronmenta l m o v e m e n t and led to the passage of the Action Plan on the Aquatic E n v i r o n m e n t (Chris tensen et al. 1998). In addi t ion to creat ing a nat ional agenda to reduce the over -enr ichment of natural waters with nutri- ents, the Action Plan established a coord ina ted Aquatic Nationwide Moni tor ing P rogram (Kron- vang et al. 1998) leading to the creat ion of the N a t i o n a l E n v i r o n m e n t a l R e s e a r c h I n s t i t u t e (NERI). T h e 1987 Action Plan on the Aquatic En- v i r o n m e n t I was only the first of a series of legis- lative act ions in combina t ion with in terna t ional ag reemen t s that have arisen to reduce nu t r i en t over -enr ichment and the symptoms of eut rophi- cation in D e n m a r k with the overall objective of a clean and heal thy aquatic envi ronment . Most of the Action Plans are conce rned with reduct ion of discharges, loads, and emission of nutrients. The cur ren t Danish Nat ional Aquatic Moni tor ing and
�9 2002 Estuarine Research Federation 84-8
Assessment P rogram which began in 1998 is de- s igned to run th rough 2003 and is probably one of the most comprehens ive p rog ram s globally.
T h e pu rpose of this p a p e r is to provide an over- view of the cur ren t efforts in D e n m a r k to reduce nu t r i en t over -enr ichment of mar ine waters and to m o n i t o r the aquatic envi ronment . We presen t the various Nat ional Action Plans and relevant parts of derived legislation f rom the last 15 years that aim to reduce nu t r i en t inputs, we provide an overview of the Danish Nat ional Aquatic Moni tor ing and As- sessment P rogram focusing on the mar ine environ- m e n t and the m e a s u r e m e n t of nu t r i en t inputs, and we briefly examine the d o c u m e n t e d changes in nu- trient loading and the effects on the aquatic envi- r onmen t . We also address various aspects of the mon i to r ing p rogram.
Strategies and Measures to R e d u c e Nutr ient Inputs to the Danish Aquatic Env ironment
POLITICAL OBJECTIVES
Since the mid-1980s a high priority has been giv- en to the quality and pro tec t ion of g round water and surface water in D e n m a r k with an overall goal of ensur ing that the waters are clean. The endeav- ors are described in the Env i ronmenta l Policy White Pape r (Ministry of E n v i r o n m e n t and Energy 1999), which states that the G o v e r n m e n t will work towards ensur ing that streams, lakes, and mar ine waters are clean and of a satisfactory quality with regard to heal th and hygiene; that exploi tat ion of the water bodies and associated resources takes place in a sustainable manner ; and that the objec- tives of re levant in terna t ional ag reemen t s will be fulfilled. The central legal i n s t rumen t to fulfill these political objectives is the Consol idated Envi- r o n m e n t a l Protec t ion Act, which aims to safeguard the env i ronment , to suppor t a sustainable social deve lopment , and to conserve the f lora and fauna (Ministry of E n v i r o n m e n t and Energy 1998).
Overall objectives for s t reams state that water flow mus t be adequate , that obst ruct ions mus t no t h inde r the dispersal of fish and macroinver te- brates, that there shall be 2-m wide borders free of cultivation a long natural streams, that s t reams have good oxygen condit ions, and that they contain a varied and natural fauna and flora. Overall objec- tives for Danish lakes are that animal and p lant communi t i e s should be natural , that the water should be clear and that submerged macrophy tes should be presen t in the shallow parts of the lakes (Ministry of E n v i r o n m e n t and Energy 1999).
T h e overall objectives for Danish mar ine waters are based on the 1992 Helsinki Conven t ion on Pro- tection of the Marine Env i ronmen t in the Baltic Sea Region (HELCOM 1992), the 1992 Conven-
Danish Monitoring and Assessment Program 849
tion for the Protec t ion of the Marine E n v i r o n m e n t of the Nor theas t Atlantic (OSPAR 1992), and the 1995 Declarat ion of the 4th In te rna t iona l Confer- ence on the Protect ion of the Nor th Sea (Danish Env i ronmenta l Protec t ion Agency 1995). T h e over- all objectives are that the fauna and f lora may only be insignificantly or slightly affected by an th ropo- genic pol lut ion and h u m a n activities, that nu t r i en t levels have to be at a natural level, the clarity of the water has to be normal , unna tu ra l b looms of toxic phy top lank ton or po l lu t ion -dependen t ma- croalgae mus t no t occur, and oxygen deficiency may only occur in areas where it is natural , and that the levels of hazardous substances have to be at background levels in the case of naturally oc- curr ing substances and close to zero in the case of h a z a r d o u s substances . C o m m e r c i a l exp lo i t a t ion (fisheries, navigation, drainage, offshore industry, minerals extract ion, mar ine d u m p i n g of seabed material , recreat ional activities, and o ther uses of surface water) has to be conduc ted in a m a n n e r that respects env i ronmenta l and natural wealth and is sustainable (Ministry of E n v i r o n m e n t and Energy 1999).
STRATEGIES AND MEASURES
T h e p r imary means of achieving the quality ob- jectives for bo th g round water and surface waters are reduct ions in nut r ien t loads. On N o v e m b e r 28, 1986 the Danish Par l iament adop ted an ag en d a that inst ructed the G o v e r n m e n t to r educe total loads of n i t rogen (N) and p h o s p h o r u s (P) to the aquatic env i ronmen t by 50% and 80%, respective- ly. These reduct ions co r respond to a change in an- nual loads f rom a level of 283,000 tonnes N and 9,120 tonnes P at the t ime the p lan was adop ted to levels of abou t 141,600 tonnes N and 1,820 tonnes P (Folket inget 1987). During the political process in 1987, these overall reduct ion targets changed f rom be ing targets for loads to the aquatic env i ronmen t to reduc t ion targets for the discharg- es and losses f rom three sectors: agricul ture, mu- nicipal wastewater t r ea tmen t plants (WWTP), and poin t industrial discharges. It could be a rgued that this change was rat ional since these three sectors are the most re levant to r educ ing eut rophicat ion . As a result of the change, which was not in accor- dance with the N o v e m b e r 28 Agenda, the adop ted Action Plan on the Aquatic Env i ronmen t did no t include a reduct ion target for emissions of N to the a tmosphe re , reduct ion targets for discharges or losses f rom aquacul ture , scat tered set t lements , s tormwater overflows, and offshore activities, and a reduct ion target for P losses f rom agricultural fields.
It is widely recognized that pol lu t ion of mar ine waters crosses political boundar ies . T h e countr ies
850 D. Conley et al.
around Denmark in the Nor th Sea and Baltic Sea adopted similar reduct ion targets through three different conventions. The Nor th Sea Conference in L o n d o n in 1987 (the countries of the Nor th Sea region excluding the United Kingdom) adopted the goal of reducing N and P inputs to the sea by 50% over the period 1985-1995 in areas where these could cause pollution. These reduct ion tar- gets were reiterated at the conferences in The Hague in 1990 and Esbjerg in 1995. The Paris Commission in June 1988 adopted a 50% reduc- tion target for nutr ient inputs to marine waters sus- ceptible to eutrophicat ion and also adopted a pro- gram to achieve the reductions. In 1989, the re- duction targets were specified in relation to specif- ic sectors. In 1999, it was decided to integrate the Oslo and Paris Conventions (the OSPAR Conven- tion), bo th of which aimed to prevent marine pol- lution of the Northeast Atlantic region from dump- ing and land-based sources of pollution. In Feb- ruary 1988 the Helsinki Commission (HELCOM) adopted a declaration specifying a 50% reduct ion target for discharges of polluting substances, in- cluding nutrients, over a 10-yr period. In 1998, the ministers conf i rmed their commi tmen t to attain- ing the strategic goal from 1988 and defined spe- cific objectives that must be achieved before the year 9005.
E n a c t e d Measures T a k e n to A c h i e v e N u t r i e n t R e d u c t i o n s
SPECIFIC REDUCTION TARGETS FOR THE AGRICULTURAL SECTOR
Since the mid-1980s, a number of action plans and strategies have been adopted by the Danish Parliament to regulate development of the agri- cultural sector, one of the main sources of nutri- ents to the aquatic environment. The action plans include the NPo (nitrogen, phosphorus , and or- ganic matter) Action Plan in 1985, the Action Plan on the Aquatic Environment I in 1987, the Action Plan for Sustainable Agriculture in 1991, parts of the Government ' s 10-Point Program for Protect ion of the Ground Water and Drinking Water in 1994, follow-up on the Action Plan for Sustainable Agri- culture in 1996, the Action Plan on the Aquatic Environment II in 1998, and the Agreement on May 9, 9001 on Supplement ing Initiatives and Preparations for the Action Plan III.
The reduct ion targets for N and P stipulated in the Action Plan on the Aquatic Envi ronment I are an approximate halving of point source N loads and a 80% reduct ion of point source P loads, in- cluding the elimination of the P farmyard load. The reduct ion targets were to be attained by 199S through the following measures carried out by the
agricultural sector: establishment of sufficient ca- pacity to store 9 mo of manure produc t ion so that manure can be stored until the crop growth season begins, establish crop rotat ion and fertilization plans to ensure that the N content of fertilizer is optimally exploited, agricultural fields must have green cover during the winter period, manure has to be plowed in or in some other way deployed into the soil within 19 h of application, and limits on the amoun t of livestock manure applied to ag- ricultural fields (Table 1).
It soon became clear that it would not be pos- sible to attain the reduct ion targets by 1993 (Min- istry of Agriculture 1991). The measures stipulated in the Action Plan on the Aquatic Envi ronment I were t ightened in 1991 in the Action Plan for Sus- tainable Agriculture. The reduct ion target was maintained, but the time frame was extended to the year 9000. The measures were fertilization ac- counts so that fertilizer application could be doc- umented; more stringent and fixed requirements on utilization of the N content of livestock manure; all farms must establish sufficient capacity to store 9 mo of manure product ion; and a ban on the application of liquid manure between harvest time and February except on agricultural fields cultivat- ed with winter rape or grass. Since the Action Plan for Sustainable Agriculture there have been a num- ber of follow-up plans for reducing the impact of the ag r i cu l tu ra l sector, i n c l u d i n g the Gove rn - ment ' s 1994 10-Point Program for Protect ion of the Ground Water and Drinking Water in Den- mark.
The need to fur ther tighten the regulation of agricultural loads of N has become even more nec- essary because Denmark must comply with the Eu- ropean Union (EU) Nitrates Directive by the year 2008. The directive restricts the application of live- stock manure to 170 kg N ha 1 yr 1. In the case of some farms this is less than the levels currently per- mitred. Denmark has sought permission to deviate from the 170 kg N ha -1 yr -1 rule on cattle holdings to enable the application of up to 230 kg N ha yr -1 on a small n u m b e r of these holdings.
In February 1998, the Danish Parl iament adopt- ed several new instruments aimed at achieving the reduct ion targets. The Action Plan on the Aquatic Environment II will reduce N leaching by a fur ther 37,000 tonnes N yr -~ to enable the reduct ion target of 100,000 tonnes N yr ~ to be achieved no later than the end of the year 9003 (Table 1; Danish Environmental Protect ion Agency 2000). U n d e r the Action Plan on the Aquatic Envi ronment II, 16,000 ha of wet meadow will be re-established to help reduce N leaching through denitrification, 90,000 ha forest will be planted before 9009, and agri-environmental measures that include financial
Danish Monitoring and Assessment Program 851
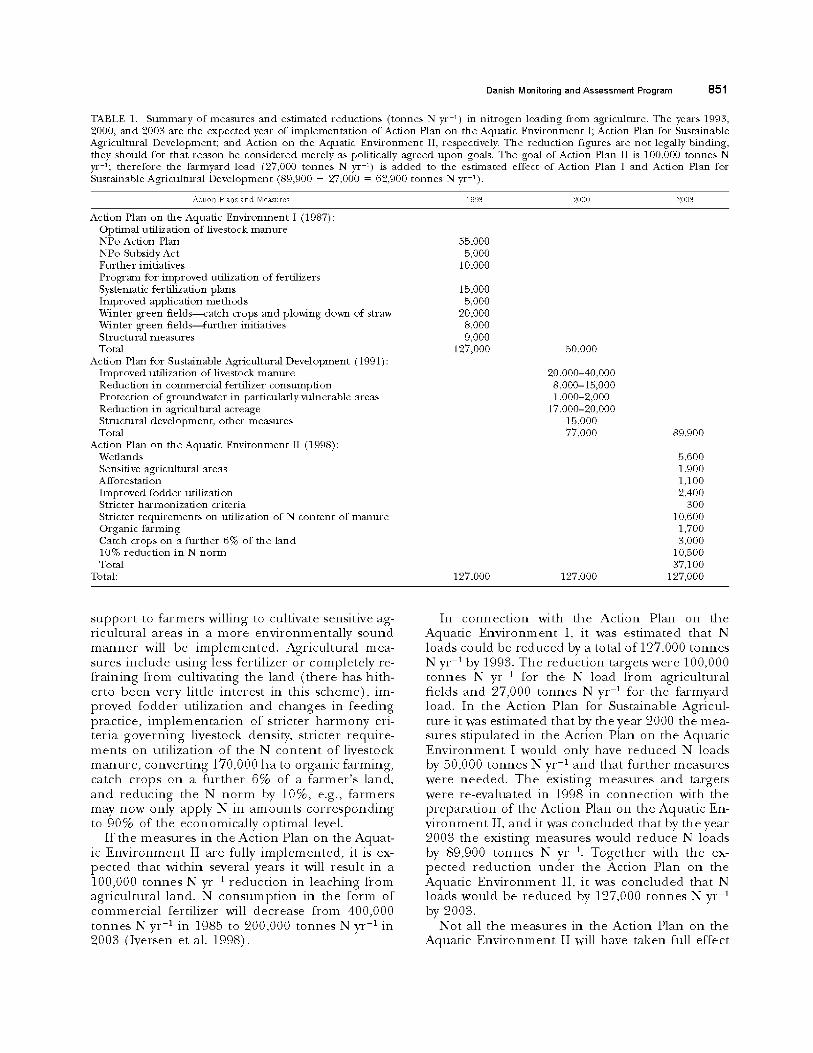
TABLE 1. Summary of measures and esthnated reductions (tonnes N yr z) in nitrogen loading fl-om agriculture. The years 1995, 2000, and 2003 are the expected year of implementation of Action Plan on the Aquatic Environment I; Action Plan for Sustainable Agricultural Development; and Action on the Aquatic Environment II, respectively. The retluction figures are not legally binding, they should for that reason be considered merely as politically agreed upon goals. The goal of Action Plan II is 100,000 mnnes N yr 1; therefore the tZannym-d load (27,000 tonnes N yr 1) is added to the esthnated effect of Action Plan I and Action Plan for Sustainable Agricultural Development (89,900 - 27,000 = 62,900 tonnes N yr-1).
Action Plans and Measures i993 2000 2008
Action Plan on the Aquatic Environment I (1987): Optimal utilization of livestock manure NPo Action Plan NPo Subsidy Act Further initiatives Program for improved utilization of fertilizers Systematic fertilization plans Improved application methods Winter green fields---catch crops and plowing down of straw Winter green fields further initiatives Structural measures Total
Action Plan for Sustainable Agricultural Development (1991): Improved utilization of livestock manure Reduction in commercial fertilizer consumption Protection of groundwater in particularly vulnerable areas Reduction in agricultural acreage Structural development, other measures Total
Action Plan on the Aquatic Environment II (1998): Wetlands Sensitive agricultural areas Afforestation Improved fodder utilization Stricter harmonization criteria Stricter requirements on utilization of N content of manure Organic farming Catch crops on a further 6% of the land 10% reduction in N norm Total
Total:
55,000 5,000
10,000
15,000 5,000
20,000 8,000 9,000
127,000 50,000
127,000 127,000
20,000-40,000 8,000-15,000 1,000-2,000
17,000-20,000 15,000 77,000 89,900
5,600 1,900 1,100 2,400
800 10,600 1,700 3,000
10,500 37,100
127,000
s u p p o r t to f a r m e r s wil l ing to cul t ivate sensi t ive ag- r i cu l tu ra l areas in a m o r e e n v i r o n m e n t a l l y s o u n d m a n n e r will be i m p l e m e n t e d . Agr i cu l t u r a l m e a - sures i n c l u d e us ing less fer t i l izer or c o m p l e t e l y re- f r a in ing f r o m cul t iva t ing the l and ( t h e r e has h i th- er to b e e n ve ry lit t le in t e res t in this s c h e m e ) , im- p r o v e d f o d d e r u t i l iza t ion a n d c h a n g e s in f e e d i n g p rac t i ce , i m p l e m e n t a t i o n o f s t r ic te r h a r m o n y cri- te r ia g o v e r n i n g l ivestock density, s t r ic te r r e q u i r e - m e n t s on u t i l i za t ion o f the N c o n t e n t o f l ivestock m a n u r e , c o n v e r t i n g 170,000 h a to o rgan ic f a rming , ca tch c rops on a f u r t h e r 6% of a f a r m e r ' s land, a n d r e d u c i n g the N n o r m by 10%, e.g., f a r m e r s may n o w only apply N in a m o u n t s c o r r e s p o n d i n g to 90% of the e c o n o m i c a l l y o p t i m a l level.
If the m e a s u r e s in the A c t i o n Plan on the Aqua t - ic E n v i r o n m e n t II a re fully i m p l e m e n t e d , it is ex- p e c t e d that wi th in several years it will resu l t in a 100,000 t o n n e s N yr 1 r e d u c t i o n in l e a c h i n g f r o m ag r i cu l tu r a l land. N c o n s u m p t i o n in the f o r m of c o m m e r c i a l fer t i l izer will d e c r e a s e f r o m 400,000 t o n n e s N yr -1 in 1985 to 200,000 t o n n e s N yr -1 in 200S ( Iversen et al. 1998).
In c o n n e c t i o n with the A c t i o n Plan on the A q u a t i c E n v i r o n m e n t I, it was e s t i m a t e d that N loads cou ld be r e d u c e d by a total o f 127,000 t o n n e s N yr -1 by 1993. T h e r e d u c t i o n targets were 100,000 t o n n e s N yr 1 for the N load f r o m agr i cu l tu ra l f ie lds a n d 27,000 t o n n e s N yr 1 for the f a rmyard load. In the A c t i o n P lan for Sus ta inab le Agr icu l - ture it was e s t ima ted tha t by the year 2000 the m e a - sures s t ipu la ted in the A c t i o n Plan on the A q u a t i c E n v i r o n m e n t I wou ld only have r e d u c e d N loads by 50,000 t o n n e s N yr -1 and tha t f u r t h e r m e a s u r e s were n e e d e d . T h e exis t ing m e a s u r e s a n d targets were r e - eva lua t ed in 1998 in c o n n e c t i o n with the p r e p a r a t i o n o f the A c t i o n Plan on the A q u a t i c En- v i r o n m e n t II, and it was c o n c l u d e d tha t by the year 200S the exis t ing m e a s u r e s wou ld r e d u c e N loads by 89,900 t o n n e s N yr 1 T o g e t h e r wi th the ex- p e c t e d r e d u c t i o n u n d e r the A c t i o n P lan on the A q u a t i c E n v i r o n m e n t II, it was c o n c l u d e d tha t N loads wou ld be r e d u c e d by 127,000 t o n n e s N yr 1 by 2002,.
N o t all the m e a s u r e s in the A c t i o n Plan on the A q u a t i c E n v i r o n m e n t II will have t aken full e f fec t

852 D. CoNey et al.
by 2008. A mid- te rm evaluation in late 2000 indi- cated that fu r ther measures were n e e d e d to fulfill the 100,000 tonnes N yr 1 reduc t ion of root zone losses. It is assumed that an Action Plan III will be passed in the Danish Par l i ament in 2003 or 2004 with regional r educ t ion targets including measures against diffuse P losses.
SPECIFIC REDUCTION TARGETS FOR MUNICIPAL WASTEWATER TREATMENT PLANTS
Discharges f rom munic ipa l WWTP are regulated by the Envi ronmenta l Protect ion Act and deriva- tive s tatutory orders. The EU Council Directive 9 1 / 2 7 1 / E E C conce rn ing Urban Wastewater Treat- m e n t as a m e n d e d by Commiss ion Directive 9 8 / 15/EU, comm on l y re fe r red to as the Urban Waste- water Directive, is one of the mos t impor t an t legal documen t s in the EU concern ing water quality. T h e purpose of the directive is to pro tec t the en- v i r o n m e n t against the negative effects associated with the discharge of inadequately t reated u rban wastewater and discharges of biologically degrad- able industrial wastewater f rom the food process- ing industry. Accord ing to the directive, wastewater discharges mus t be subjected to a level of treat- meri t app rop r i a t e to the env i ronmen t in quest ion and to the designated use of the rec ip ient water body. D e n m a r k i m p l e m e n t e d the provisions of the directive in 1994 legislation.
T h e Action Plan on the Aquatic Env i ronmen t ' s reduct ion targets for munic ipa l WWTP were ad- jus ted in 1990 on the basis of the results of the Nat ionwide Aquatic Moni to r ing P rogram (Danish Envi ronmenta l Protect ion Agency 1991). In the case of N, annua l discharges in t reated wastewater were to be reduced f rom 18,000 tonnes N yr ~ to 6,600 tonnes N yr -1. P discharges were r educed f rom 4,470 tonnes P yr -1 to 1,220 tonnes P yr -1. T h e reduct ion in N cor responds to all new or up- graded plants exceeding 5,000 personal equiva- lents (PE) and all existing plants exceeding 1,000 PE having to i m p l e m e n t biological t r ea tmen t with N removal down to an annual average of 8 mg N 1-1. Municipal WWTP exceeding 5,000 PE have to remove P down to an annual average of 1.5 mg P 1 1.
SPECIFIC REDUCTION TARGETS FOR POINT INDUSTRIAL DISCHARGES
Point discharges f rom industry are regula ted by the Consol idated Envi ronmenta l Protect ion Act and the EU Directive on Pollution Prevent ion and Control (IPPC Directive) and derivative s ta tutory orders. The IPPC Directive aims at in tegra ted pre- vent ion and control of pol lut ion by major indus- tries. T h e directive specifically regulates the energy industry (e.g., power stations and refineries) , pro-
duct ion and process ing of metals, the minera l in- dustry, the chemical industry, waste m a n a g e m e n t plus a n u m b e r of o ther activities such as p a p e r manufac turers , textiles p re - t r ea tmen t and dyeing, s laughterhouses and dairies, and installations for intensive rear ing of poul t ry and pigs exceeding a certain capacity. T h e IPPC Directive contains mea- sures designed to prevent or, where that is not practicable, to reduce emissions to the air, water, and land. Because of the large differences between ind iv idua l e n t e r p r i s e s a n d the i r d i s c h a r g e s of wastewater, the Action Plan on the Aquatic Envi- r o n m e n t I did not stipulate general discharge re- qu i rements for indust ry as it did for WWTP. In- dustry was to reduce its discharges th rough the ap- plication of Best Available Technology (BAT) at the level of t r ea tment that is technically a t ta inable and economical ly viable.
Costs o f Action Plans T h e costs of Act ion Plan on the Aquatic Envi-
r o n m e n t I for the per iod 1985-1989 have been es- t imated in 1990 to be 1.2 billion e (Danish Envi- r onmen ta l Protect ion Agency 1991). This figure in- cludes some investments agreed u p o n already in the 1985 NPo Action Plan and rea f f i rmed in the 1987 Action Plan. T h e investments in agr icul ture dur ing the per iod 1985-1992 have been 400 mil- lion g with total inves tments in munic ipa l WWTP of 1.1 billion e including bo th const ruct ion of new plants and en l a rgemen t and i m p r o v e m e n t of ex- isting plants. In addit ion, industries with separate t r ea tmen t and discharge of wastewater invested 135 mill ion g in improved wastewater t rea tment . T h e cost of Action Plan II is expec ted to be 135 million g , hal f of which will be f inanced by the agricultural sector (Iversen et al. 1998). The ex- penses of wetland restorat ion, g roundwate r protec- tion areas, afforestat ion, and deve lopmen t of or- ganic fa rming will be f inanced by different govern- m e n t agencies.
T h e total annua l costs are 1.28 billion g total for p lann ing and m a n a g e m e n t of the aquatic environ- m e n t by state, regional , and local authorities: 68 billion e , ma in t enance and restorat ion of rivers, s t reams and lakes: 81 mill ion g , nat ional moni tor - ing of the aquatic envi ronment : 40 mill ion g , su- pervision by the counties and local communi t ies : 11 mill ion g , supply of clean and heal thy dr inking water: 405 mill ion ~, and discharge and cleaning of wastewater f rom households and industries: 676 million e (Chris tensen personal communica t ion ) .
The Danish National Aquatic Monitoring and Assessment Program
MONITORING OF ATMOSPHERIC DEPOSITION OF NUTRIENTS TO DANISH MARINE WATERS
T h e a tmospher ic c o m p o n e n t of the Act ion Plan on the Aquatic E n v i r o n m e n t was initiated in 1989
with the focus of de te rmining atmospheric N de- position to Danish waters. The first moni to r ing p rogram (1989-1994) expanded upon existing moni to r ing stations for better geographical cover- age. The p rogram consisted of 6 stations for wet and dry deposit ion of different N species and 12 stations where only wet deposit ion was measured. About half of the stations were placed close to the coast. Interpolat ions of measurements between sta- tions were used to obtain the overall deposit ion to Danish waters.
The p rogram consists of sampling at the main stations for wet deposit ion with bulk samplers on a half-month basis. The precipitat ion samples are analyzed tbr their content of nutrients (mainly am- m o n i u m and nitrate) and a n u m b e r of o ther air pollutants ( including 9 heavy metals). The gas phase and particulate phase air pollutants are col- lected on a daily basis on various types of filters, which after extraction and analysis are used to de- termine the atmospheric conten t of N (ammonia, particulate ammonium, and the sum of nitric acid and particulate nitrate) and other impor tan t air pollutants. Dry deposit ion at the moni to r ing sta- tions is subsequently calculated by use of literature data for the deposit ion velocities and measured concentra t ions and meteorology.
During the early 1990s a comprehensive model for calculation of deposit ion to Danish mar ine wa- ters was developed, the AGDEP-model (Atmo- spheric Chemistry and Deposition; Hertel et al. 1995). The AGDEP model is a trajectory mode l that calculates the atmospheric concentra t ions and the wet and dry deposit ion of nutrients and other impor tan t air pollutants to 30 • 30 km grids cov- ering Danish mar ine waters and land. The trans- por t of air pollutants is de te rmined by using 96-h back trajectories calculated by use of meteorolog- ical data f rom NERI (Brandt et al. 2000) and Go- operative P rogramme for Moni tor ing and Evalua- tion of the Long Range Transmission of Air Pol- lutants in Europe (EMEP). The model is supplied with informat ion of initial concentra t ions based on a coarser long-range t ransport model (Brandt et al. 2000) and emissions (from NERI and EMEP) of the air pollutants, and simulates the vertical and horizontal transport, chemical t ransformations (80 reactions), and the wet and dry deposition of .87 air pollutants.
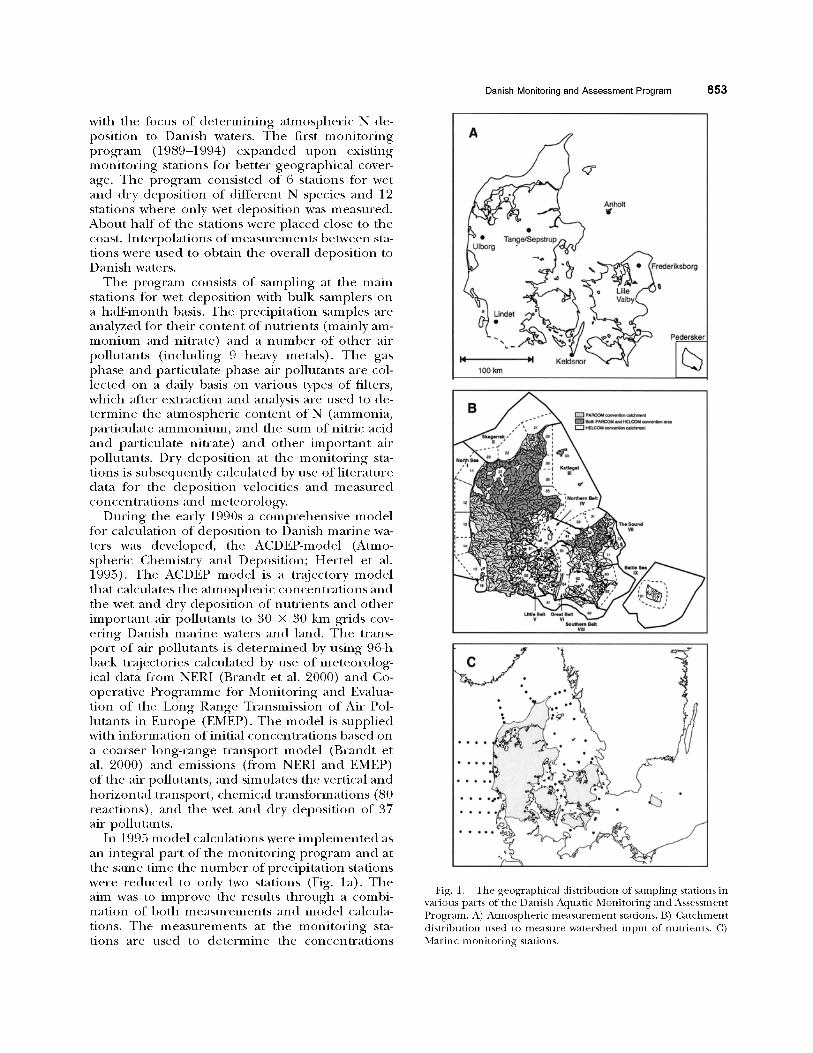
In 1995 model calculations were implemented as an integral part of the moni to r ing program and at the same time the n u m b e r of precipitation stations were reduced to only two stations (Fig. la) . The aim was to improve the results th rough a combi- nat ion of both measurements and model calcula- tions. The measurements at the moni to r ing sta- tions are used to de termine the concentra t ions
Danish Monitoring and Assessment Program 853
A
Lindet
,,, Xor*'
" " IX
C e j i>I
Fig. 1. The geographical distribution of sampling stations in various parts of the Danish Aquatic Monitoring and Assessment Program. A) Atmospheric measurement stations. B) Catchment distribution used to measure watershed input of nutrients. C) Marine monitoring stations.
854 D. Conley et al.
2.0
1.8
1.6 E
g 1.4
~.a
1.0
~- 0 .8 r (D o 0.6 c -
O 0.4 0
- ' i ;rtioulate ammonium
Sum nitrate , o, , ,~,
,-D,
" ' " J ~ - E l ,
""El"
Ammonia
0.2 _ _- _-m~ �9 m. m- -m �9 r , _ __
m m
0.0 . . . . . 1989 1991 1993 1995 1997 1999
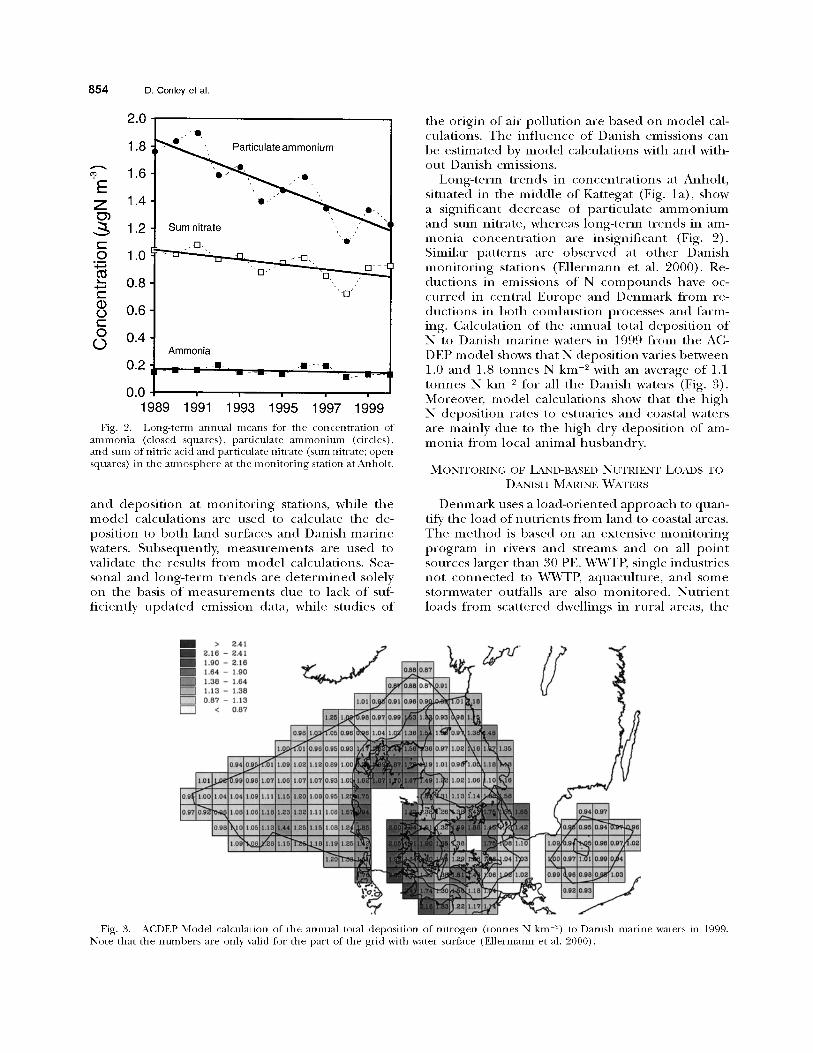
Fig. 2. Long-term annual means for the concentrat ion of ammonia (closed squares), particulate a m m o n i u m (circles), and sum of nitric acid and particulate nitrate (sum nitrate; open squares) in the a tmosphere at the moni tor ing station at Anholt.
a n d d e p o s i t i o n at m o n i t o r i n g s ta t ions , wh i l e t h e m o d e l c a l c u l a t i o n s a r e u s e d to ca l cu l a t e t h e de- p o s i t i o n to b o t h l a n d su r faces a n d D a n i s h m a r i n e waters . Subsequen t ly , m e a s u r e m e n t s a re u s e d to va l i da t e t h e resu l t s f r om m o d e l ca lcu la t ions . Sea- sona l a n d l o n g - t e r m t r e n d s a r e d e t e r m i n e d sole ly o n the basis o f m e a s u r e m e n t s d u e to l ack o f suf- f i c i en t ly u p d a t e d e m i s s i o n da ta , wh i l e s tud ies o f
t h e o r i g i n o f a i r p o l l u t i o n a r e b a s e d o n m o d e l cal- cu la t ions . T h e i n f l u e n c e o f D a n i s h emi s s ions can b e e s t i m a t e d by m o d e l c a l c u l a t i o n s wi th a n d with- o u t D a n i s h emiss ions .
L o n g - t e r m t r e n d s in c o n c e n t r a t i o n s at A n h o l t , s i t u a t e d in t he m i d d l e o f K a t t e g a t (Fig. l a ) , show a s ign i f i can t d e c r e a s e o f p a r t i c u l a t e a m m o n i u m a n d sum n i t r a t e , w h e r e a s l o n g - t e r m t r e n d s in am- m o n i a c o n c e n t r a t i o n a re i n s i g n i f i c a n t (Fig. 2). S imi l a r p a t t e r n s a r e o b s e r v e d at o t h e r D a n i s h m o n i t o r i n g s t a t ions ( E l l e r m a n n et al. 2000) . Re- d u c t i o n s in emi s s ions o f N c o m p o u n d s have oc- c u r r e d in c e n t r a l E u r o p e a n d D e n m a r k f r o m re- d u c t i o n s in b o t h c o m b u s t i o n p r o c e s s e s a n d f a r m - ing. C a l c u l a t i o n o f t he a n n u a l to ta l d e p o s i t i o n o f N to D a n i s h m a r i n e wa te r s in 1999 f r o m t h e AC- DEP m o d e l shows t h a t N d e p o s i t i o n var ies b e t w e e n 1.0 a n d 1.8 t o n n e s N k m 9 wi th an ave rage o f 1.1 t o n n e s N k m 9 fo r all t he D a n i s h wa te r s (Fig. 3). Moreove r , m o d e l c a l c u l a t i o n s show tha t t h e h i g h N d e p o s i t i o n r a t e s to e s tua r i e s a n d coas ta l wa te r s a r e m a i n l y d u e to t h e h i g h d r y d e p o s i t i o n o f am- m o n i a f r o m loca l a n i m a l h u s b a n d r y .
MONITORING OF LAND-BASED NUTRIENT LOADS TO
DANISII MARINE WATERS
D e n m a r k uses a l o a d - o r i e n t e d a p p r o a c h to quan - tify t h e l o a d o f n u t r i e n t s f r o m l a n d to coas ta l areas . T h e m e t h o d is b a s e d o n an ex t ens ive m o n i t o r i n g p r o g r a m in r ivers a n d s t r e ams a n d on all p o i n t sou rce s l a r g e r t han 30 PE. WWTP, s ingle i n d u s t r i e s n o t c o n n e c t e d to WWTP, a q u a c u l t u r e , a n d s o m e s t o r m w a t e r ouffa l l s a r e also m o n i t o r e d . N u t r i e n t l o a d s f r o m s c a t t e r e d dwe l l ings in r u r a l areas , t h e
m > 2 . 4 1
m 1.90 - 2.16 m 1.64 - 1.90
1 , a s - 1.64
[ - - - ] h i 3 - 1.a8
~ 0.99 ~176 0.,i , / , t M ~ ~7 . ,0 0.9, :.0~ ~ ! ~ . ~ 1.~ 9 . 9 1 ~ , . , ,.9~ ,.,~ o., ,.oolOfl ~ m m - - ~ , ,.9, o . , . , . a , . , o~
lo,A~ ~- l-',- 0.gt~:oo,., 1.0, ,.0,1.,1 ,.,~ 1.~< ,.09 9.9~ , . : ~ ~ . . ( 4 t ~ , . . 1 . . I , . , ~ 0 . 9 , ~ , ..... 09 ,.,, , = ,.00 ,.,, ,.0~ 7 4 m N
Y j 0.94 ~1 ..9~ ~4
Fig. 3. ACDEP Model calculation of the annual total deposition of ni t rogen (tonnes N km 2) t o Danish marine waters in 1999. Note that the numbers are only valid for the part of the grid with water surface (Ellermann et al. 2000).

remaining stormwater outfalls, and other point sources less than g0 PE are estimated by standard values or models. A characteristic feature of the Danish landscape is the lack of large rivers. Be- cause it is economically and practically impossible to moni to r the several thousand small streams that cover the landscape, the count ry has been divided into moni to red and unmoni to red regions in rela- tion to deriving riverine loads.
Nutr ient loads are determined using approxi- mately 130 river moni tor ing stations situated down- stream in rivers. About 55% of the land surface area is covered by riverine measurements. Water samples are taken generally between 12 and 26 (av- erage 19) times per year, the stage is continuously recorded, and stage-discharge relationships are used to calculate load. In addit ion to moni tor ing stations in rivers located near the coast, 150 sam- piing stations are situated in small agricultural catchments (5 to 60 km 2) with only minor inputs f rom point sources. The loads in the unmon i to red part of the count ry are calculated using flow- weighted concentra t ions and discharge from agri- cultural catchments with cor responding climate, soil type, geology, and agricultural practices as found in the moni to red catchments, and then add- ing moni to red point sources.
The total loads to coastal areas are de termined by summing the total moni to red load, the total un- moni to red load, and nutr ient loads from point sources discharging directly to coastal areas (Fig. lb). Source appor t i onmen t is pe r fo rmed on the total load to evaluate the impor tance of different n u t r i e n t sources . N u t r i e n t loads f rom diffuse sources, such as agricultural land and forested ar- eas, are estimated as the difference between the gross transport, including retent ion in rivers and lakes, and the total load from point sources. Nu- trient loads from cultivated areas include the esti- mated potential load from scattered dwellings en- tering the surface freshwater system.
Natural background loads of N and P constitute a part of the total estimated nutr ient inputs to sur- face water and include loads from unmanaged land and that part of the loads of N and P from managed land that would occur irrespective of an- thropogenic activities. The natural background loads are de termined from measurements of nu- trient loads in 9 small non-agricultural catchments and subdivided into sandy and loamy catchments. The means for these 9 natural watersheds from 1989 to 1999 were 1.50 + 0.15 mg N 1-1 (2.20 + 0.76 kg N ha x) and 50 _+ 6 Tg P 1 1 (0.078 _+ 0.04 kg P ha x).
Nutr ient loads to freshwater are often greater than the measured nutr ient t ransport to coastal wa- ters due to the retent ion of nutrients in lakes and
Danish Monitoring and Assessment Program 855
rivers. Retent ion plays a key role for the amoun t and the composi t ion of nutr ient fluxes, especially P, th rough river systems (Billen et al. 1991). Reten- tion in the ca tchment must be added to the mea- sured load to estimate the amoun t of diffuse source (natural background + agriculture + scat- tered dwellings) loads to freshwater. In larger riv- ers, N loss th rough denitrification can have a sig- nificant influence on the total load from the river system. In-stream river retent ion of N in Danish streams can be high, primarily during the summer, but over an annual cycle is negligible and there- fore not included in the calculations. The reten- tion of P is especially impor tan t in streams where over bank f looding occurs. For the total load from Denmark to coastal areas the net retent ion of N and P in rivers and streams is less than 1% to 2% (Svendsen et al. 1995). Retent ion in lakes consti- tutes 8% to 12% of the gross riverine N load and 0% to 2% of the gross riverine P load from 1989- 1999 (Svendsen et al. 1998). The retent ion in lakes is calculated from mass balance calculations in about 80 intensively moni tored lakes.
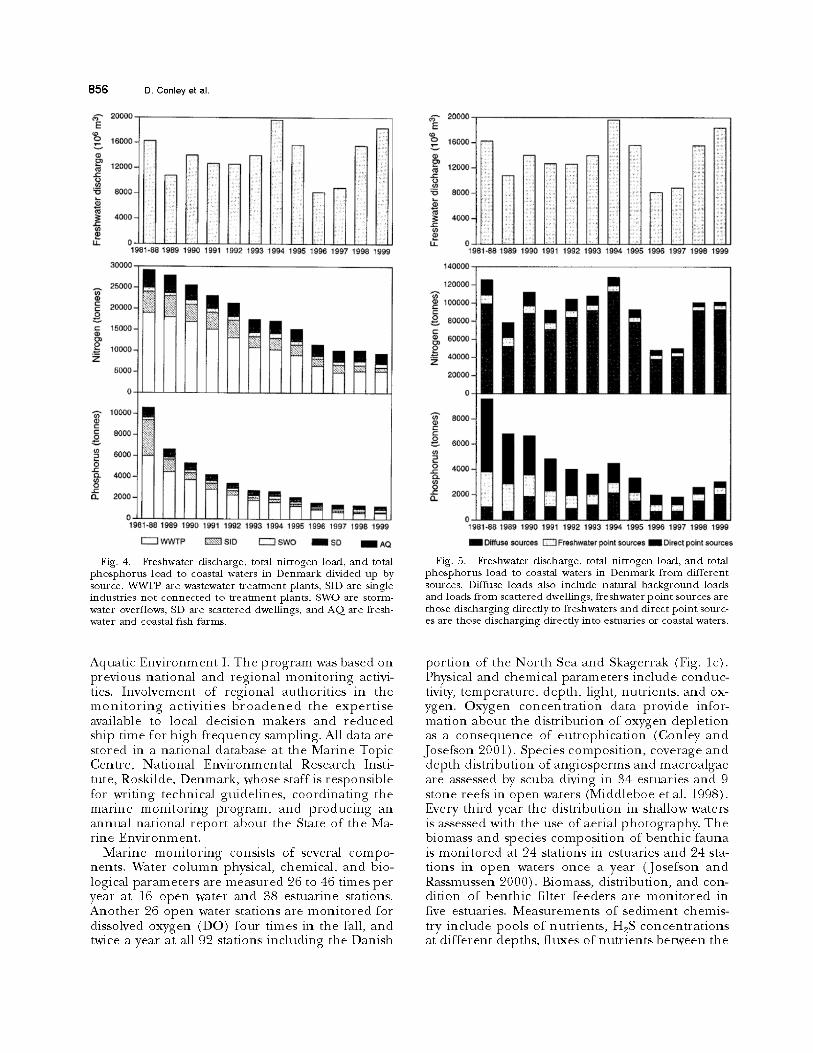
The measures taken to reduce the load from point sources in Denmark have been successful. Since 1989 the N load from point sources has been reduced by 66% and fox- P by 81% (Fig. 4). The main part of the reduct ion has taken place by im- proved and extended purification of wastewater f rom WWTP and from single industrial plants no t connected to t reatment plants (SID). The N load from WWFP has been reduced by 74% and for P by 90% and the cor responding figures for SID are 85% and 95%, respectively. Further, the use of de- tergents without P reduced the P load from scat- tered dwellings. Thus, the original reduct ion tar- gets for P have been fulfilled.
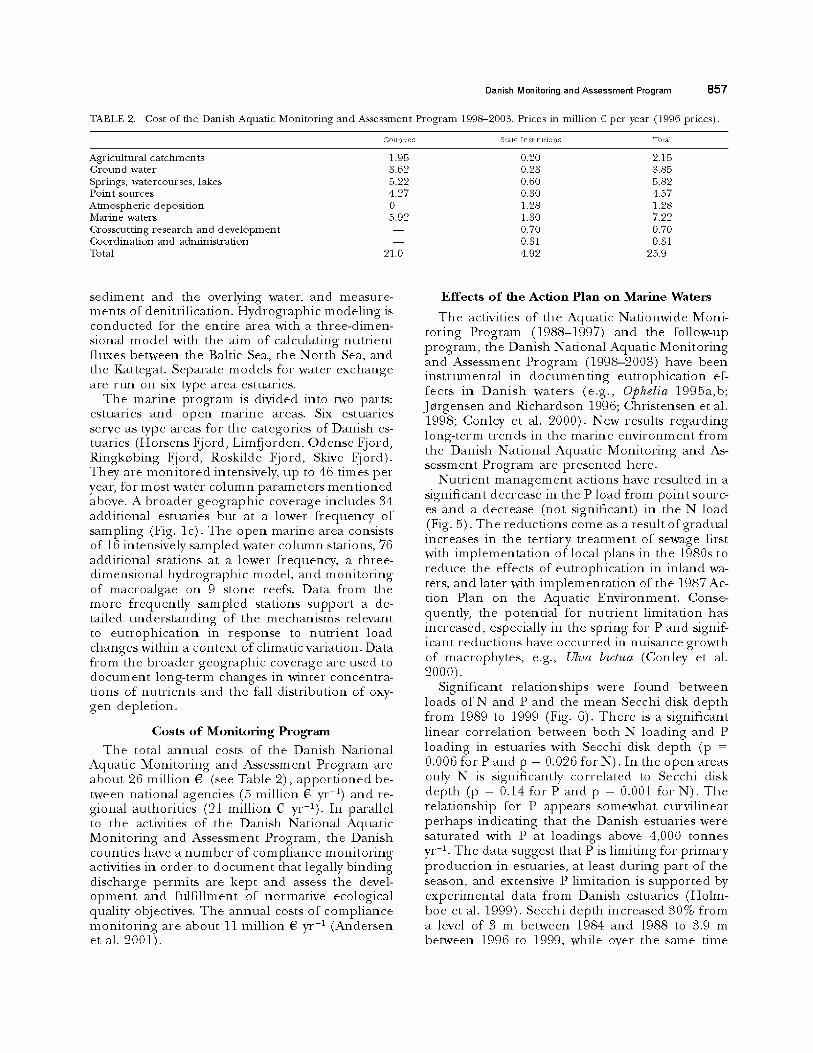
The total load of N to coastal waters is closely related to runof f (Fig. 5). P loads have been dom- inated by inputs via wastewater load, but after 1994 the diffuse loading of P has been a significant por- tion of the load to coastal areas. The reduct ion in the contr ibut ion of point sources means that P loading is now correlated to runoff. Diffuse sourc- es are the biggest N source. In 1999 81% of the total N load originated from agricultural sources, 11% from natural background loads, and 8% from point source loads. There has been a significant reduct ion (Kendall trend test, p < 0.01) in the to- tal P load to coastal areas. There is a tendency of a minor reduct ion in diffuse N loads, but it is no t significant (p > 0.05).
Marine Monitoring
A marine c o m p o n e n t of the Aquatic Nationwide Moni tor ing Program was initiated in October 1988 with implementa t ion of the Action Plan for the
8 5 6 D. Conley et al.
&-" 20000 E
r
"O
U.
1 6 0 0 0 -
12000=
8000-
4000-
- " i!:
1981-881889 1990 1991 1992 1999 199,4 1995 t996 1997 1998 1999
30000-
20000 - g
15900 -
.__._ 10000- Z
5000 -
0~
6000 - v
6000 -
O J~ . ~ 4000 -
~ 21100 -
0 ,
1~)Bt-86 1989 1990 1991 1992 1993 1804 1895 1896 1997 1998 1999
WWFP ~ SID ~ SWO ~ SO ~ AQ
Fig. 4. Freshwater discharge, total nitrogen load, and total phosphorus load to coastal waters in Denmark divided up by source. WWTP are w-astew-ater treatment plants, SID are single industries not connected to t~-eatu~ent plants, SWO are stop'm- water overflows, SD are scattered dwellings, and AQ are fresh- water and coastal fish farms.
20000 E
~ 1 6 0 O 0 -
12000- ,,I=
80O0-
4000-
u_
IRHI T'?j
.!_/
�9 ;;, : 1
,.:" ,, �9
:'H ,:::.
!i! : ; i ::.: ;{:
:~ '.~.
] . :" '. : �9 , , .~
i'::~ [fi
:; i, 2:
,!~.
"1981-88 1989 1990 1991 1992 1993 1994 "~995 1996 1997 1998 1999
140000
120000-
" ~ 1 0 O 0 O 0 -
o 80000 -
60000 -
2 40000 -
2 0 0 0 0 -
0 -
.oooli Q. 4{)00
~ 2oo Q.
0 1961-B8 1989 1990 1991 1992 1983 "~994 "~995 1996 1997 1998 1999
B B Diflu.~e sources ~ Freshwater polnt sources m Direct point sOurces
Fig. B. Freshw-ater discharge, total nitrogen load, and total phosphorus load to coastal waters in Denmark from different s o u r c e s . D i f f u s e l o a d s a l so i n c l u d e n a t u r a l b a c k g r o u n d l o a d s
a n d l o a d s f r o m s c a t t e r e d d w e l l i n g s , f r e s h w a t e r p o i n t s o u r c e s a r e t h o s e d i s c h a r g i n g d i r e c t l y to f r e s h w - a t e r s a n d d i r e c t p o i n t s o u r c -
es a r e t h o s e d i s c h a r g i n g d k - e c t l y i n t o e s t u a r i e s o r c o a s t a l w a t e r s .
A q u a t i c E n v i r o n m e n t 1. T h e p r o g r a m was b a s e d on p r e v i o u s n a t i o n a l a n d r e g i o n a l m o n i t o r i n g activi- ties. I n v o l v e m e n t o f r e g i o n a l a u t h o r i t i e s in the m o n i t o r i n g a c t i v i t i e s b r o a d e n e d t h e e x p e r t i s e ava i lab le to loca l d e c i s i o n m a k e r s a n d r e d u c e d sh ip t ime fo r h i g h f r e q u e n c y s amp l ing . Al l d a t a a re s t o r e d in a n a t i o n a l d a t a b a s e at t he M a r i n e Top ic C e n t r e , N a t i o n a l E n v i r o n m e n t a l R e s e a r c h Inst i - tu te , Rosk i lde , D e n m a r k , whose s taff is r e s p o n s i b l e for v a i t i n g t e c h n i c a l g u i d e l i n e s , c o o r d i n a t i n g the m a r i n e m o n i t o r i n g p r o g r a m , a n d p r o d u c i n g an a n n u a l n a t i o n a l r e p o r t a b o u t the S ta te o f t he Ma- r ine E n v i r o n m e n t .
M a r i n e m o n i t o r i n g consis ts of severa l c o m p o - nen t s . W a t e r c o l u m n phys ica l , c h e m i c a l , a n d b io- logica l p a r a m e t e r s a re m e a s u r e d 26 to 46 t imes p e r y e a r a t 16 o p e n wa te r a n d 88 e s t u a r i n e s ta t ions . A n o t h e r 26 o p e n wa te r s t a t ions a re m o n i t o r e d for d isso lved o x y g e n (DO) f o u r t imes in t he fall, a n d twice a y e a r a t all 92 s ta t ions i n c l u d i n g the D a n i s h
p o r t i o n o f the N o r t h Sea a n d S k a g e r r a k (Fig. l c ) . Physical a n d c h e m i c a l p a r a m e t e r s i n c l u d e c o n d u c - tivity, t e m p e r a t u r e , d e p t h , l ight , n u t r i e n t s , a n d ox- ygen . O x y g e n c o n c e n t r a t i o n d a t a p r o v i d e infor- m a t i o n a b o u t the d i s t r i b u t i o n o f o x y g e n d e p l e t i o n as a c o n s e q u e n c e o f e u t r o p h i c a t i o n ( C o n l e y a n d J o s e f s o n 9001) . Spec i e s c o m p o s i t i o n , cove rage a n d d e p t h d i s t r i b u t i o n o f a n g i o s p e r m s a n d m a c r o a l g a e a re assessed by s c u b a d iv ing in $4 e s tua r i e s a n d 9 s tone reefs in o p e n waters ( M i d d l e b o e e t a l . 1998). Every th i rd y e a r the d i s t r i b u t i o n in sha l low wate r s is assessed wi th the use o f a e r i a l p h o t o g r a p h y . T h e b i o m a s s a n d spec i e s c o m p o s i t i o n o f b e n t h i c f a u n a is m o n i t o r e d at 94 s ta t ions in es tuar ies a n d 94 sta- t ions in o p e n waters o n c e a y e a r ( J o s e f s o n a n d Ras smussen 2000) . Biomass , d i s t r i b u t i o n , a n d con- d i t i on o f b e n t h i c f i l ter f e e d e r s a re m o n i t o r e d in five es tuar ies . M e a s u r e m e n t s o f s e d i m e n t chemis - t ry i n c l u d e p o o l s of n u t r i e n t s , H~S c o n c e n t r a t i o n s at d i f f e r e n t d e p t h s , f l uxes of n u t r i e n t s b e t w e e n the
Danish Monitoring and Assessment Program 85"/'
TABLE 2. Cost of the Danish Aquatic Monitoring and Assessment Program 1998-2003. Prices in million r per year (1996 prices).
Counties State In stltutions Total
Agricul tura l ca tchments 1.95 0.20 2.15 G r o u n d water 8.62 0.28 8.85 Springs, x~-atercourses, lakes 5.22 0.60 5.82 Poin t sources 4.27 0.80 4.57 Amaospher ic depos i t ion 0 1.28 1.28 Marine waters 5.92 1.80 7.22 Crosscutt ing research and d e v e l o p m e n t - - 0.70 0.70 Coord ina t ion and adminis t ra t ion - - 0.51 0.31 Total 21.0 4.92 25.9
sed iment and the overlying water, and measure- ments of denitrification. Hydrograph ic mode l ing is conduc ted for the entire area with a three-dimen- sional mode l with the aim of calculating nu t r i en t fluxes between the Baltic Sea, the Nor th Sea, and the Kattegat. Separate mode l s for water exchange are run on six type area estuaries.
T h e mar ine p r o g r a m is divided into two parts: estuaries and open mar ine areas. Six estuaries serve as type areas for the categories of Danish es- tuaries (Horsens Fjord, Limfjorden , Odense Fjord, R i n g b b i n g Fjord, Roskilde Fjord, Skive Fjord). They are m o n i t o r e d intensively, up to 46 times per year, for most water co lumn pa rame te r s m e n t i o n e d above. A b roa de r geograph ic coverage includes 84 addi t ional estuaries but at a lower f requency of sampl ing (Fig. lc) . T h e open mar ine area consis ts of 16 intensively sampled water co lumn stations, 76 addi t ional stations at a lower frequency, a three- d imensional hydrograph ic model , and moni to r ing of macroa lgae on 9 stone reefs. Data fi-om the m o r e f requent ly sampled stations suppor t a de- tailed unde r s t and ing of the mechan i sms relevant to eu t rophica t ion in response to nu t r i en t load changes within a context of climatic variation. Data f rom the b roa de r geograph ic coverage are used to d o c u m e n t long- term changes in winter concentra- tions of nutr ients and the fall distr ibution of oxy- gen deplet ion.
C o s t s o f M o n i t o r i n g P r o g r a m
T h e total annual costs of the Danish Nat ional Aquatic Moni tor ing and Assessment P rogram are abou t 26 mill ion g (see Table 2), a p p o r t i o n e d be- tween nat ional agencies (5 mill ion C yr 1) and re- gional authori t ies (21 mill ion C yr-1). In parallel to the activities of the Danish Nat ional Aquatic Moni tor ing and Assessment Program, the Danish counties have a n u m b e r of compl iance moni to r ing activities in order to d o c u m e n t that legally b inding discharge permi t s are kept and assess the devel- o p m e n t and fulfi l lment of normat ive ecological quality objectives. T h e annua l costs of compl iance mon i to r ing are abou t 11 mill ion g yr -1 (Andersen et al. 2001).
E f f e c t s o f the A c t i o n P lan o n Mar ine Waters
T h e activities of the Aquatic Nat ionwide Moni- toring P rogram (1988-1997) and the follow-up p rog ram, the Danish Nat ional Aquatic Moni tor ing and Assessment P rog ram (1998-2003) have been ins t rumenta l in d o c u m e n t i n g eu t rophica t ion ef- fects in Dan i sh wa te r s (e.g. , Ophelia 1995a,b; J~ rgensen and Richardson 1996; Chr is tensen et al. 1998; Conley et al. 2000). New results regard ing long- te rm trends in the mar ine env i ronmen t f rom the Danish Nat ional Aquatic Moni to r ing and As- sessment P rogram are p resen ted here.
Nut r ien t m a n a g e m e n t actions have resulted in a significant decrease in the P load f rom poin t sourc- es and a decrease (not significant) in the N load (Fig. 5). T h e reduct ions come as a result of gradual increases in the tert iary t r ea tmen t of sewage first with imp lemen ta t i on of local plans in the 1980s to reduce the effects of eu t roph ica t ion in inland wa- ters, and later with i m p l e m e n t a t i o n of the 1987 Ac- tion Plan on the Aquatic Envi ronment . Conse- quently, the potent ia l for nu t r i en t l imitat ion has increased, especially in the spr ing for P and signif- icant reduct ions have occur red in nuisance growth of macrophytes , e.g., Ulva lactua (Conley et al. 2000).
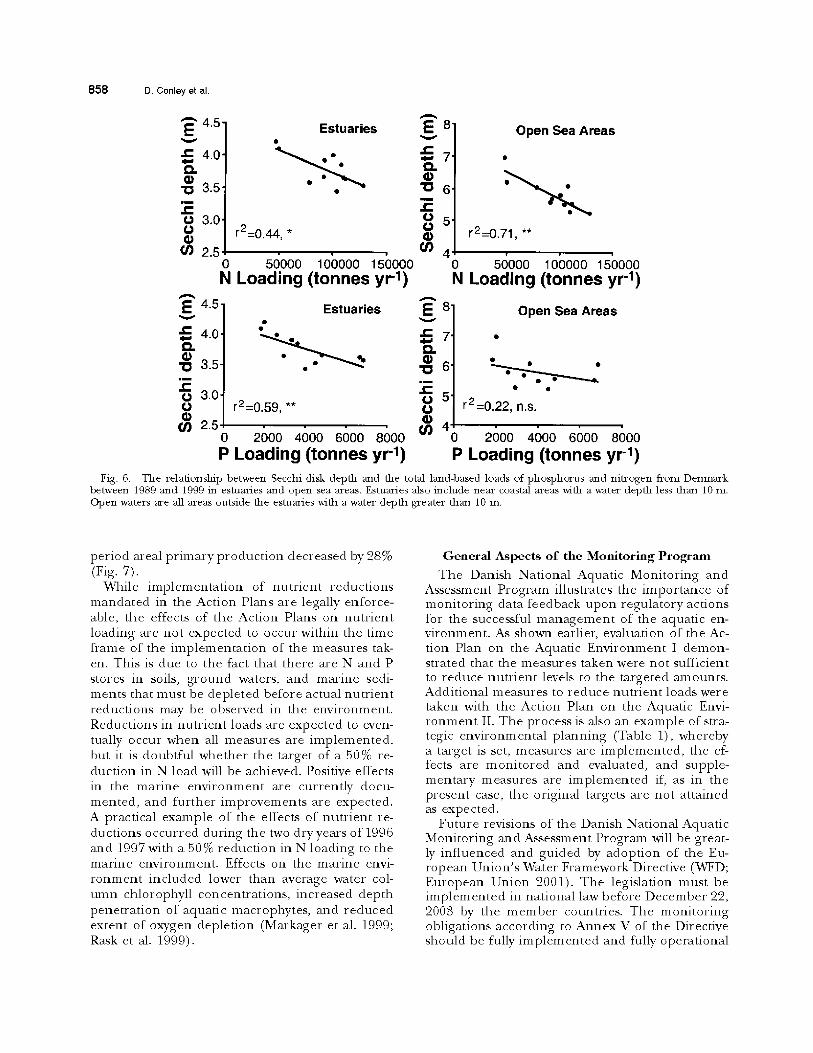
Significant relat ionships were found be tween loads of N and P and the m e a n Secchi disk dep th f rom 1989 to 1999 (Fig. 6). T h e r e is a significant l inear corre la t ion between bo th N loading and P loading in estuaries with Secchi disk depth (p - 0.006 for P and p - 0.026 for N). In the open areas only N is significantly corre la ted to Secchi disk dep th (p - 0.14 for P and p - 0.001 for N). T h e rela t ionship for P appears somewhat curvi l inear pe rhaps indicat ing that the Danish estuaries were saturated with P at loadings above 4,000 tonnes yr -1, The data suggest that P is l imiting for p r ima ry p roduc t i on in estuaries, at least during par t of the season, and extensive P l imitat ion is suppor t ed by exper imen ta l data f rom Danish estuaries (Holm- boe et al. 1999). Secchi dep th increased 80% f rom a level of S m be tween 1984 and 1988 to 8.9 m between 1996 to 1999, while over the same time
8 5 8 D. Conley et al.
E J~ Q.
"O i m r
tJ (D 03
E v
Q.
I0
O O r
03
4 , 5 "
4.0"
3.5 �9
3,0 r2=0.44, *
2.5 0 56000 I00000 15()000 N Loading (tonnes yr-1)
Estuaries
4 , 5 "
4.0.
3.5-
3.0-
2.5
Estuaries
k
E 8 v
�9 ~ 7 Q.
'I~ 6 w~ ,,C
5
0 3 4
Open Sea Areas
E v
r Ca
r2=0.71, **
o sdooo lobooo lsbooo N Loading (tonnes yr -1)
Open Sea Areas ,
7'
6'
5' r2=0.59, ** ~ r2=0.22, n.s.
0 2600 4600 e600 8600 03 40 2600 4600 6600 8600 P Loading (tonnes yr -1) P Loading (tonnes yr -1)
Fig. 6. The relationship between Secchi disk depth and the total land-based loads of phosphorus and nitrogen from Denmark between 1989 and 1999 in estuaries and open sea areas. Estuaries also include near coastal areas with a x*~ter depth less than 10 m. Open waters are all m-eas outside the estuaries with a water depth greater than 10 m.
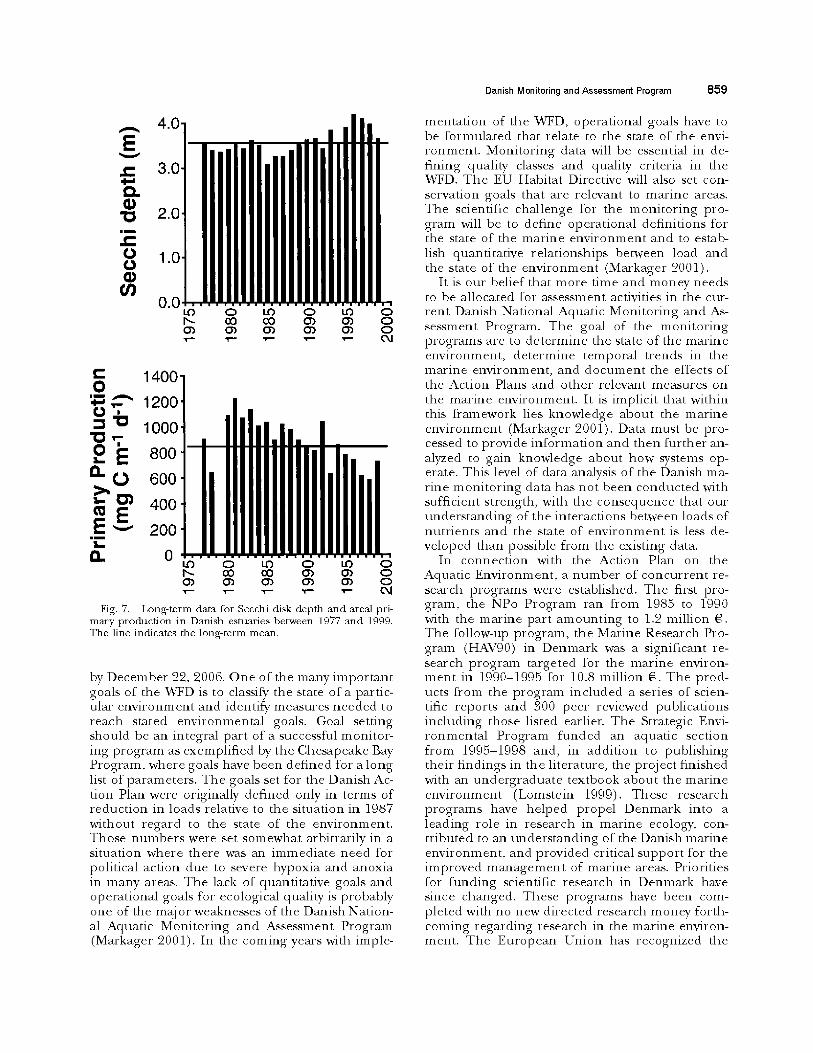
p e r i o d a rea l p r i m a r y p r o d u c t i o n d e c r e a s e d by 28% (Fig. 7).
W h i l e i m p l e m e n t a t i o n o f n u t r i e n t r e d u c t i o n s m a n d a t e d in the A c t i o n P lans a r e lega l ly e n f o r c e - ab le , t he effects of t he A c t i o n P lans on n u t r i e n t l o a d i n g a re n o t e x p e c t e d to o c c u r wi th in the t ime f r a m e of the i m p l e m e n t a t i o n of the m e a s u r e s tak- en. Th i s is d u e to t he fact t ha t t h e r e a re N a n d P s tores in soils, g r o u n d waters , a n d m a r i n e sedi- m e n t s tha t m u s t be d e p l e t e d b e f o r e ac tua l n u t r i e n t r e d u c t i o n s m a y be o b s e r v e d in t he e n v i r o n m e n t . R e d u c t i o n s in n u t r i e n t l oads a r e e x p e c t e d to even- tual ly o c c u r w h e n all m e a s u r e s a re i m p l e m e n t e d , b u t it is d o u b t f u l w h e t h e r t he t a rge t of a 50% re- d u c t i o n in N l o a d will be ach i eved . Posi t ive effects in the m a r i n e e n v i r o n m e n t a re c u r r e n t l y d o c u - m e n t e d , a n d f u r t h e r i m p r o v e m e n t s a r e e x p e c t e d . A p r a c t i c a l e x a m p l e o f the effects of n u t r i e n t re- d u c t i o n s o c c u r r e d d u r i n g the two d r y y e a r s o f 1996 a n d 1997 wi th a 50% r e d u c t i o n in N l o a d i n g to the m a r i n e e n v i r o n m e n t . Effects on the m a r i n e envi- r o n m e n t i n c l u d e d lower t h a n ave rage wa te r col- u m n c h l o r o p h y l l c o n c e n t r a t i o n s , i n c r e a s e d d e p t h p e n e t r a t i o n o f a q u a t i c m a c r o p h y t e s , a n d r e d u c e d e x t e n t of o x y g e n d e p l e t i o n ( M a r k a g e r et al. 1999; Rask et al. 1999).
General A s p e c t s o f t h e M o n i t o r i n g Program T h e D a n i s h N a t i o n a l A q u a t i c M o n i t o r i n g a n d
A s s e s s m e n t P r o g r a m i l lus t ra tes the i m p o r t a n c e o f m o n i t o r i n g d a t a f e e d b a c k u p o n r e g u l a t o r y ac t i ons for the successfu l m a n a g e m e n t of the a qua t i c en- v i r o n m e n t . As shown ear l ier , e v a l u a t i o n o f t he Ac- t ion P lan on the A q u a t i c E n v i r o n m e n t I d e m o n - s t r a t ed tha t the m e a s u r e s t a k e n were n o t su f f i c i en t to r e d u c e n u t r i e n t levels to t he t a r g e t e d a m o u n t s . A d d i t i o n a l m e a s u r e s to r e d u c e n u t r i e n t l o a d s were t a k e n with t he A c t i o n P l an on the A q u a t i c Envi- r o n m e n t II. T h e p r o c e s s is also an e x a m p l e of stra- tegic e n v i r o n m e n t a l p l a n n i n g (Tab le 1), w h e r e b y a t a r g e t is set, m e a s u r e s a re i m p l e m e n t e d , the ef- fects a re m o n i t o r e d a n d eva lua t ed , a n d s u p p l e - m e n t a r y m e a s u r e s a re i m p l e m e n t e d if, as in the p r e s e n t case, t he o r ig ina l t a rge t s a r e n o t a t t a i n e d as e x p e c t e d .
F u t u r e rev i s ions of t he D a n i s h N a t i o n a l A q u a t i c M o n i t o r i n g a n d A s s e s s m e n t P r o g r a m will be g rea t - ly i n f l u e n c e d a n d g u i d e d by a d o p t i o n of the Eu- r o p e a n U n i o n ' s W a t e r F r a m e w o r k Di rec t ive (WFD; E u r o p e a n U n i o n 2001) . T h e l eg i s l a t i on m u s t be i m p l e m e n t e d in n a t i o n a l law b e f o r e D e c e m b e r 22, 2003 by the m e m b e r coun t r i e s . T h e m o n i t o r i n g o b l i g a t i o n s a c c o r d i n g to A n n e x V of the Di rec t ive s h o u l d be ful ly i m p l e m e n t e d a n d fully o p e r a t i o n a l
g 4.0
~ . 3.0
"t~ 2.0
1.0
03 0.0-
tr) 0 tF~ 0 tO 0
O~ 0") O~ 0"~ O~ 0
14~176 1 '_.~,_ ~ 1200t I t Illl v ooo , I 1 , 1 1 . I _ : oo OO llllllllllllllllll][lii a. 0 . . . . . . . . . . . . . . . . . . . . . . . . . . .
tl') Ca tO O it) (D I ~ CO CO O~ CD 0 o~ o~ o~ o~ o ) o
Fig. 7. Long-term data for Secchi disk depth and areal pri- mary product ion in Danish estuaries between 1977 and 1999. The line indicates the long-term mean.
by December 22, 2006. One of the many impor tan t goals of the WFD is to classify the state of a partic- ular envi ronment and identify measures needed to reach stated environmental goals. Goal setting should be an integral part of a successful monitor- ing program as exemplified by the Chesapeake Bay Program, where goals have been defined for a long list of parameters. The goals set for the Danish Ac- tion Plan were originally defined only in terms of reduct ion in loads relative to the situation in 1987 without regard to the state of the environment . Those numbers were set somewhat arbitrarily in a situation where there was an immediate need for political action due to severe hypoxia and anoxia in many areas. The lack of quantitative goals and operational goals for ecological quality is probably one of the major weaknesses of the Danish Nation- al Aquatic Moni tor ing and Assessment Program (Markager 2001). In the coming years with imple-
Danish Monitoring and Assessment Program 8 5 9
menta t ion of the WFD, operat ional goals have to be formulated that relate to the state of the envi- ronment . Moni tor ing data will be essential in de- fining quality classes and quality criteria in the WFD. The EU Habitat Directive will also set con- servation goals that are relevant to marine areas. The scientific challenge for the moni tor ing pro- gram will be to define operational definitions for the state of the marine envi ronment and to estab- lish quantitative relationships between load and the state of the envi ronment (Markager 2001).
It is our belief that more time and money needs to be allocated for assessment activities in the cur- rent Danish National Aquatic Moni tor ing and As- sessment Program. The goal of the moni tor ing programs are to determine the state of the marine environment , determine temporal trends in the marine environment , and d o c u m e n t the effects of the Action Plans and other relevant measures on the marine environment. It is implicit that within this framework lies knowledge about the marine envi ronment (Markager 9001). Data must be pro- cessed to provide informat ion and then fur ther an- alyzed to gain knowledge about how systems op- erate. This level of data analysis of the Danish ma- rine moni tor ing data has not been conducted with sufficient strength, with the consequence that our unders tanding of the interactions between loads of nutrients and the state of envi ronment is less de- veloped than possible from the existing data.
In connect ion with the Action Plan on the Aquatic Environment , a number of concur ren t re- search programs were established. The first pro- grant, the NPo Program ran from 1985 to 1990 with the marine part amoun t ing to 1.2 million g. The follow-up program, the Marine Research Pro- grant (HAV90) in Denmark was a significant re- search program targeted for the marine environ- ment in 1990-1995 for 10.8 million g. The prod- ucts front the program included a series of scien- tific reports and 300 peer reviewed publications including those listed earlier. The Strategic Envi- ronmenta l Program funded an aquatic section front 1995-1998 and, in addit ion to publishing their findings in the literature, the project finished with an undergradua te textbook about the marine envi ronment (Lomstein 1999). These research programs have helped propel Denmark into a leading role in research in marine ecology, con- tributed to an unders tanding of the Danish marine environment , and provided critical support for the improved m a n a g e m e n t of marine areas. Priorities for funding scientific research in Denmark have since changed. These programs have been com- pleted with no new directed research money forth- coming regarding research in the marine environ- ment. The European Union has recognized the
8 6 0 D. CoNey et al.
i m p o r t a n c e o f u s i n g t h e w e a l t h o f d a t a c o l l e c t e d w i t h i n n a t i o n a l m o n i t o r i n g p r o g r a m s , a n d re- s e a r c h f u n d i n g w i t h i n t h e E u r o p e a n U n i o n (h t tp : / / w w w . c o r d i s . l u ) h a s e n c o u r a g e d t h e u t i l i z a t i o n o f m o n i t o r i n g d a t a w i t h i n r e s e a r c h p r o g r a m s .
T h e D a n i s h N a t i o n a l A q u a t i c M o n i t o r i n g a n d A s s e s s m e n t P r o g r a m p r o b a b l y h o l d s o n e o f t h e bes t d a t a b a s e s in t h e w o r l d fo r e v a l u a t i o n o f t h e e f f ec t s o f n u t r i e n t l o a d i n g o n t h e m a r i n e e n v i r o n - m e n t . T h e p r o g r a m h a s b e e n c r i t i c i z e d w i t h i n D e n - m a r k fo r n o t b e i n g cos t - e f f ec t i ve , n o t p r o v i d i n g s u f f i c i e n t d a t a f o r c a l i b r a t i o n o f m o d e l i n g e f fo r t s , a n d n o t i n c l u d i n g e n o u g h m o d e l i n g e f f o r t s i n t o t h e d a t a ana lys i s ( D a h l - M a d s e n 9 0 0 0 ) . S o m e o f t h e c r i t i c i s m s w e r e va l id ( R i e m a n n e t al. 2 0 0 1 ) , a n d m o d e l i n g e f f o r t s a r e c u r r e n t l y b e i n g d i r e c t e d a t s eve r a l l eve ls ( e m p i r i c a l m o d e l s , s i m p l e b u d g e t s , a n d m o r e a d v a n c e d m o d e l s ) . T h e r e c e n t e x p e r i - e n c e f r o m t h e C h e s a p e a k e Bay P r o g r a m W a t e r - Q u a l i t y M o d e l r e v i e w o f t h e t h r e e - d i m e n s i o n a l c o u p l e d h y d r o d y n a m i c - w a t e r q u a l i t y m o d e l (Sci- en t i f i c a n d T e c h n i c a l A d v i s o r y C o m m i t t e e 9000) h i g h l i g h t s t h e d a n g e r o f r e l y i n g o n o n l y o n e m o d e l in o r d e r to d e v e l o p m a n a g e m e n t a l t e r n a t i v e s .
T h e D a n i s h N a t i o n a l A q u a t i c M o n i t o r i n g a n d A s s e s s m e n t P r o g r a m h a s b e e n m o d i f i e d s i n c e its i n c e p t i o n b a s e d o n i n t e r n a l a n d e x t e r n a l eva lua - t i ons a n d r e f l e c t s c o m p r o m i s e s a m o n g p o l i t i c a l goa l s , g o v e r n m e n t i n s t i t u t i o n s , l oca l a u t h o r i t i e s , a n d a v a i l a b l e f u n d i n g . M o d i f i c a t i o n s will o c c u r w i t h t h e n e x t p h a s e p l a n n e d to r u n f r o m 9 0 0 4 - 2009. W h i l e m o n i t o r i n g p r o g r a m s by t h e i r n a t u r e a r e e s sen t i a l l y c o n s e r v a t i v e , in o r d e r to m a i n t a i n l o n g t i m e s e r i e s e s s e n t i a l to d o c u m e n t l o n g - t e r m c h a n g e s , t h e p r o g r a m m u s t a lso h a v e t h e f l ex ib i l i t y to a d a p t to c h a n g i n g n e e d s . F u t u r e r e v i s i o n s o f t h e D a n i s h N a t i o n a l A q u a t i c M o n i t o r i n g a n d Assess- m e n t P r o g r a m wil l e n c o u n t e r i n c r e a s e d r e s p o n s i - b i l i t i e s e s p e c i a l l y r e g a r d i n g E u r o p e a n U n i o n leg- i s l a t i o n a n d t h e W a t e r F r a m e w o r k D i r e c t i v e a n d t h e H a b i t a t D i r e c t i v e , a n d will n e e d to a d a p t to p r o p o s e d d e c r e a s e s in f u n d i n g l eve l s a n d t h e ad- d i t i o n o f e m e r g i n g t e c h n o l o g i e s , s u c h as sh ips -of - o p p o r t u n i t y a n d i n s t r u m e n t buoys .
ACKNOWLEDGMENTS
We express our thanks to Join Kirkegaard and Tony Chris- tensen, Danish Environmental Protection Agency and Kitt Bell Andersen, Department of Agncultm-e and Biotechnology, Dan- ish Forest and Nature Agency.
LITERATURE CITED
ANDFa~SEN, J., L. M. Mtmt~ AND S. PEDFa~SEN. 2001. Vanch-am- medirektivet, indhold og perspektiver. Vand ogJord 8:17-21.
BILLEN, G., C. LANCELOT, AND M. MEYBECK. 1991. N, R and Si retention along the aquatic continmma from land to ocean, p. 19-44. In R. F. C. Mantoura, J.-M. Martin, and R. Wollast
(eds.). Ocean Margin Processes in Global Change.Jolm Wiley & Sons Ltd., Chichester, U.K.
BRANDT, J., J. H. CHmSTE~NSFa~, L. M. FROItN, R. BFa~OWlCZ, AND E PAI~OF, EN. 2000. The DMU-ATMI THOR air pollution fore- cast system--System description. Report No. 321. Ministry of the Envn-onment and Energy, National Environmental Re- search Institute, Rosldlde, Denmark.
CHmSTF~SEN, R B., F. M~HLF~FXO, L. C. LUND-HANsF~,J. BOR- ~ , C. CHF, ISTENSEN, S. E. LADEN, M. E. HANSEN,J. ANDFXSEN, AND J. tOR~OAARD. 1998. The Danish marine envh-onment: Has action improved its state? Havforskning fra Milj0styrelsen No. 62. Danish Envn-onmental Protection Agency, Copenha- gen, Denmark.
CONEY, D. J. AND A. B. JOSF~SON. 2001. Hypoxia, nutrient man- agement and restoration in Danish waters, p. 425-454. /}~ N. N. Rabalais and R. E. Turner (eds.). Coastal Hypoxia: Con- sequences for Living Resources and Ecosystems. Coastal and Estuarine Studies No. 58. American Geophysical Union, Washington, D.C.
CONLEY, D. J., H. KA~, E MeHLENBERO, B. RASMUSSEN, AND J. WINDOI~. 2000. Characteristics of Danish estuaries. Est'~aries 23:820-837.
D~L-MADsEN, K. I. 2000. Overv~gning af vandmiljoet i Dan- mark kan det ikke gores lidt beth-e? Vand og'Jerd 7:109-110.
DANISH ENVIRONMENTAL PROTECTION AOENCY. 1991. Environ- mental impacts of nutr ient emissions in Denmark. Re- degorelse fra Miljostyrelsen No. 1. Danish Environmental Pro- tection Agency, Copenhagen, Denmark.
DAMSH ENVmONNF~,rrAL PROTECTION AOENCY. 1995. Esbjerg Declaration. 4dx International Conference on the Protection of the North Sea, Esbjerg, Denmark, 8-9June 1995. Ministry of Environment and Energy. Danish Environmental Protec- tion Agency, Copenhagen, Denmark.
DAN~H ENVmONNF, brrAL PROTECTION AOF~qCZ 2000. Aquatic En- vironment 1999. Redegorelse fra Miljostyrelsen No. 3. Danish Environmental Protection Agency, Copenhagen, Denmark.
E ~ , 21, O. HF~T~, AND C. A. SN~TH. 2000. Atmosf~isk deposition 1999, NOVA 2003. Report No. 332. Ministry of the Environment and Energy, National Envh-onmental Research Institute, Roskilde, Denmark.
EUROPEAN UNION. 2001. Directive 2000/60/EC of the European Parliament and of the Coundl of 23 October 2000 establish- ing a framework for community action in the field of water policy. Official Journal of the European Communities, 43: L327:1-72, Brussels, Belgium.
FALLF, SF~q, G., F. ANDERSEN, AND B. LARSF~q. 2000. Life, death and revival of the hypertrophic Mariager Fjord, Denmark. Jc,~rr~al of Marine Systems 25:313-321.
FOLKETINGET. 1997. Handlingsplan rood forurening af det dan- ske vandmiljo reed nmringssalte. Folketinget 1986-87. Blad m-. 1100, Copenhagen, Denmark.
HELCOM. 1992. Convention on the protection of the marine envn-onment of the Baltic Sea area. Helsinld Commission, Helsinki, Finland.
HF~TEL, O., J. CHF, ISTENSEN, E. H. RUNGE, W. A. H. AS~N, R. BF~KOWlCZ, M. F. HOVa~ND, ANI) O. HoV. 1995. Development and testing of a new- variable scale air pollution model--AC- DEE At~ospizericEnviron~ent 29:1267-1290.
HOI~BOE, N., H. JENSEN, AND E O. ANDF~SEN. 1999. Nutrient addition bioassays as indicators of nutAent limitation of plxy- toplankton in an eutrophic estuary. Marine Ecology Prog'res~ Se- ries 186:95-104.
IVERSEN, 21 M., R. GRANT, AND K. NIELSEN. 1998. Nitrogen en- richment of European inland and maAne waters with special attention to Danish policy measures. Er~vironmental Pdl,~tion 102:771-780.
J~RCENSEN, B. B. AND K. RICHARDSON (F~S.). 1996. Eutrophica- tion in coastal marine ecosystems. Coastal and Estuarine Stud-

ies Series, No. 52. Amer ican Geophysical Un i on , Washington , D.C.
JosFa~SON, A. B. AND B. RASMUSSEN. 2000. NuU-ient r e ten t ion in ben th ic b iomass of Danish estuaries: Impor t ance o f n u t r i e n t load and res idence tsne . Est'garine Coastal and StwlfScience 50: 205-216.
KAY, H., O. MOF, STRtre, j . kxgsFaq, AND R 14mYm~Faq. 1999. Gif- tige alger og a lgeopblomstr inger . Ministry o f the Environ- m e n t and Energy, National Env i ronmenta l Research Insti tute, Roskilde, Denmark .
KRONVANO, B., G. eEI~T~J~O, R. GRANT, R KRISTF2VSF, N, M. HOV- MAND, AND J. KIRKeoAARI). 1993. Nationwide m o n i t o r i n g of nu t r i en t s and their ecological effects: State o f the Danish aquat ic env i ronment . Ambio 22:176-187.
LOm_TEIN, B. (ED.). 1999. Havmil j0et r ed firtusindskiftet. Olsen & Olsen, Fredensborg , Denmark .
MARKAGF, R, S. 2001. Milj0overvSgning og forskning To sider af s a m m e sag. Vand &Jord 8:76-78.
MARF~OER, S., T. G. NIELSEN, J. CAI~STENSEN, D. CONLEY, K. DAHL, J. HANSEN, R HENRIKSEN, A. JOSEFSON, M. LARSEN, B. PEDF, P, SEN, B. RAs~rtsSSEN, J. STRAND, C. iEl~TEa~lraO, H. FOSS- ING, J. s. LAUERSEN, O. HF~TEL, H. NKOV, L. M. SVeNDSEN, M. CI.EX2vIANN, AND G. PRITZL. 1999. Ma~ne omrf ider - -S ta tus over mil j0t i ls tand i 1998. Repor t No. 290. Ministry of the En- vh-onment and Energy, National Env i ronmenta l Resem-ch In- stitute, Roskilde, Denmark .
MmI)I~mO~, A. L. AND K. SAND-JENsEN. 2000. Long- te rm changes in macroa lga l c o m m u n i t i e s in a Danish estuary. PhTcologia 39: 245-257.
MmDLF~OE, A. L., K. SANI>JENsEN, AND D. KV, AusE-JENsEN. 1998. Pa t te rns o f macroalga l species diversity in Danish estuaries. Est'garies 84:457-466.
MINlST~u OF AORICULTUm~. 1991. Handl ingsp lan for bmredygtig udvitding i l andbruge t . Ministry o f Agricultm-e, C o p e n h a g e n , Denmark .
MINISTRY OV ENVIRONMENT AND ENFa~GY. 1998. Lov o m milj~beskyttelse. Lovbekendtg~re lse nr. 698 af 22. Sep tember 1998. Ministry of E n v i r o n m e n t a n d Energy, C o p e n h a g e n , Denmark .
MINISTIW OF ENVmONNENT AND ENEI~Ou 1999. Natur- og Miljopohtisk Redegorelse . Ministry o f E n v i r o n m e n t and En- ergy, C o p e n h a g e n , Denmark .
Danish Monitoring and Assessment Program 861
OPSrEZrA. 1995a. In te rna t iona l Jom 'na l of Mar ine Biology, Vol- u m e 41.
OPHEZZA. 1995b. In te rna t iona l J o u r n a l o f Marine Bidogy, Vol- u m e 42.
OSPAR. 1992. Convent ion for the Protect ion of the Marine En- v i r o n m e n t o f the North-East Atlantic. Oslo-Paris Commiss ion , Lon don.
PAABu H . AND F. M~I-mENBERO. 1996. Kvmlstofbelasming a f h a - vmilj~et. Danish Ministry of the E n v i r o n m e n t and Energy, Na- t ional Env i ronmenta l Research Institute, Thema t i c Repor t 1996/9 , Roskilde, Denmark .
RASK, N., S. E. Pea)ERSF~, AND M. H. JeNSF~. 1999. Response to lowered n u t r i e n t dischm-ges in the coastal waters m 'o tmd the is land o f Funen , Denmark . HTdrobiologia 393:69-81.
RmuA>~, B., S. MAK~GEa, AND J. CARSaW~NSF, N. 2001. Overfign- ing a fvandmi l j oe t I D a n m a r k Det kan gores bedre . Vand og Jord 7:122-124.
SAND-JENsEN, K., S. L. NIFLSeN, J. BORUM, AND O. GEF~TZ-HAN- SF, N. 1994. Phytoplankton and macrophy te d e v e l o p m e n t in the Danish coast zone. Havforskning fra Milj0styrelsen No. 30. Danish Envixonmenta l Protect ion Agency, C o p e n h a g e n , Den- mark.
SCIEN'I3~IC AND T'ECHNIGAJ~ ADVISORY COMMITIEE. 2000. Review of the Water Quali ty Model. Chesapeake Bay P rogram Office, A n n a p d i s , Maryland.
SVENDSEN, g. M., B. KRONGVANG, P. KR,ISTENSEN, AND P. GKaa~;~LL. 1995. Dynamics of p h o s p h o r u s c o m p o u n d s in a lowland river system: Impor t ance of r e ten t ion a n d n o n - p o i n t sources. H'ydrdog@al Processes 9:119-142.
SVENI)SeN, L. M., B. KRONGVANC, A. R. LALrBEL, S. E. LARSEN, AND B. ANDERSEN. 1998. P h o s p h o r u s re ten t ion in a Danish lowland river system. Verhandlu~gen I~ternatio~le Verei~iga~gfi& Limnolog{e 26:956-962.
SOURCES OF UNPUBLISHED MATERIALS
CHmSTENSEN, T Personal communica t ion . Danish Env i ronmen- tal Protection Agency, 29 St randgade, C o p e n h a g e n , Den- mark.
Received f~r consideratior~, J~l~ 6, 2001 Accepted forpublication, Febr*zar 7 19~ 2002
Related Documents