Working Paper Coastal Capital: Jamaica Coral Reefs, Beach Erosion and Impacts to Tourism in Jamaica BENJAMIN KUSHNER, PETER EDWARDS, LAURETTA BURKE, and EMILY COOPER Suggested Citation: Kushner, B., P., Edwards, L. Burke, and E. Cooper. 2011. Coastal Capital: Jamaica. Coral Reefs, Beach Erosion and Impacts to Tourism in Jamaica. Working Paper. Washington, DC: World Resources Institute. Available online at http://www.wri.org/coastal-capital. World Resources Institute 10 G Street, NE Washington, DC 20002 Tel: 202-729-7600 www.wri.org June 2011 Photo credit: Emily Cooper

Welcome message from author
This document is posted to help you gain knowledge. Please leave a comment to let me know what you think about it! Share it to your friends and learn new things together.
Transcript
Working Paper
Coastal Capital: Jamaica
Coral Reefs, Beach Erosion and Impacts to Tourism in Jamaica BENJAMIN KUSHNER, PETER EDWARDS, LAURETTA BURKE, and EMILY COOPER
Suggested Citation: Kushner, B., P., Edwards, L.
Burke, and E. Cooper. 2011. Coastal Capital: Jamaica.
Coral Reefs, Beach Erosion and Impacts to Tourism in
Jamaica. Working Paper. Washington, DC: World
Resources Institute. Available online at
http://www.wri.org/coastal-capital.
World Resources Institute
10 G Street, NE
Washington, DC 20002
Tel: 202-729-7600
www.wri.org
June 2011
Photo credit: Emily Cooper

2
World Resources Institute Working Papers contain preliminary research, analysis, findings, and recommendations.
They are circulated to stimulate timely discussion and critical feedback and to influence ongoing debate on
emerging issues. Most working papers are eventually published in another form and their content may be revised.
Project Partners
The Coastal Capital project in Jamaica was implemented in collaboration with the University of the West
Indies (UWI) Marine Geology Unit (MGU) and the Mona GeoInformatics Institute (MGI). This project
would not have been possible without the financial support of the John D. and Catherine T. MacArthur
Foundation.

3
Table of Contents
Acknowledgments ......................................................................................................................................... 4
Glossary ........................................................................................................................................................ 5
Executive Summary ...................................................................................................................................... 7
Introduction: Jamaica’s Coastal Capital ..................................................................................................... 10
1. Coral Reefs and Beaches in Jamaica ................................................................................................... 14
Beach Erosion in Long Bay, Negril ........................................................................................................ 14
Current Rates of Beach Erosion in Negril........................................................................................... 16
Modeling the Impact of Reef Degradation on Beach Erosion ............................................................ 16
Beach Erosion in Montego Bay and Ocho Rios...................................................................................... 19
2. Economic Contributions of Reefs and Beaches to Tourism in Jamaica ............................................. 24
Economic Importance of Tourism .......................................................................................................... 24
Dependence of Tourism on Reefs and Beaches ...................................................................................... 24
Putting a Dollar Value on Beach Loss .................................................................................................... 26
Overview of Methodology for Determining Welfare Loss of Beach Erosion .................................... 26
Loss in Consumer Surplus Associated with a Beach Loss ................................................................. 27
Loss of Consumer Surplus and Resulting Economic Impacts ............................................................ 30
Conclusions and Recommendations ........................................................................................................... 32
References ................................................................................................................................................... 35
Appendix 1. Reef Profiles for Negril, Montego Bay, and Ocho Rios from the University of the West
Indies, Mona GeoInfomatics Institute (MGI) .......................................................................................... 38
Appendix 2. Summary of Results, Data Sources, and Input Values used in the Application of the
Sheppard Model in Negril, Montego Bay, and Ocho Rios ..................................................................... 46
Appendix 3. Visitor Interest Survey 2007 (JTB 2006) ........................................................................... 51
Appendix 4. Choice Experiments and Simulation of Consumer Welfare............................................... 52
Use of Choice Experiment Approaches in Ecosystem Services Valuation ........................................ 52
Appendix 5. Welfare Simulation ............................................................................................................ 54

4
Acknowledgments
We are indebted to the following people and organizations in Jamaica for their generous assistance in
providing data, guidance, and review. Shakira Khan and Ted Robinson (Marine Geology Unit, University
of the West Indies) were vital in the collection of data, the identification of potential partners and case
studies, and in the review of this paper. Karen McIntyre, Helen Liu and Ava Maxam (Mona
GeoInformatics Institute, University of the West Indies) provided infrastructure and reef maps, reef
profiles, and critical data. Owen Day (The CARIBSAVE Partnership), Deirdre Shurland (International
Union for the Conservation of Nature/IUCN), and Krishna Desai provided advice and reviewed this
paper. Chris Houser (Texas A&M University) worked with MIKE 21 in Jamaica.
At WRI, we thank the many staff who assisted with fundraising, administration, and communication of
results, including Craig Hanson, Janet Ranganathan, Ashleigh Rich, Beth Bahs-Ahern, Michael Oko,
Camilo Ramirez, Richard Waite, and Elsie Velez-Whited. The content of this report also benefitted
tremendously from internal review and editing by Mercedes Stickler, Richard Waite, John Talberth,
Carole Excell, David Tomberlin, and Robert Winterbottom. Additionally, we would like to thank David
Boylan-Kolchin for his review of this paper and guidance in the development of our economic analysis,
as well as Kathleen Reytar for her contribution of data and maps.

5
Glossary
Access value. The value of compensating tourists if they were to experience a total loss of the beach and
coral reef recreational services at their destination.
Beach nourishment. The placement of sand on the beach, which offers protection by reducing the wave
energy near-shore and creating sacrificial beach to be eroded during a storm.
Breakwaters. Structures constructed on coasts to reduce the intensity of wave action in inshore waters to
reduce beach erosion.
Consumer surplus (also consumer welfare). The difference between the maximum price a consumer is
willing to pay and the actual market price they do pay.
Contingent valuation approach. Economic valuation technique that asks individuals for their
preferences by conducting surveys that construct a hypothetical.
Coral cover. A measure of the proportion of the reef surface covered by live, hard coral cover.
Coralline. Originating from offshore coral reefs, including calcareous algae and other calcareous-
producing organisms.
Ecosystem services. The tangible benefits provided by ecosystems that sustain and fulfill human life.
Elasticity of demand. The percent drop in demand associated with a percent increase in price.
Fringing reef. A reef that follows the coastline, tracing the shore tens or hundreds of meters from the
coast.
Marine protected area. Any area of the intertidal or subtidal terrain—together with its overlying water
and associated flora, fauna, historical, and cultural features—that has been reserved by law or other
effective means to protect part or all of the enclosed environment (IUCN World Conservation Union).
One-year storm event. Refers to the largest storm that occurs at a specific location during a typical year.
Patch reef. A reef outcrop, typically part of a lagoon or embayment.
Payment for ecosystem services (PES). Offering incentives in exchange for an ecological service.
Real gross domestic product. A measure of the value of an economy’s output, adjusted for inflation.
Rugosity. Refers to the ―roughness‖ or three dimensional-complexity of the ocean floor, and thus its
frictional quality.
Stated choice approach. An economic valuation method that utilizes surveys to ask individuals to state
their preferences for an environmental good or service, according to a hypothetical situation.
Stopover. A visitor staying at least 24 hours in the country.

6
Value. The quality of a thing according to which it is thought of as being more or less desirable, useful,
estimable, or important.
Willingness to pay (WTP). The maximum amount an individual is willing to pay to receive a good or
avoid something undesirable.

7
Executive Summary
Coral reefs provide a diverse array of goods and services to the people and economy of Jamaica. They
buffer coastlines from storms; slow erosion; provide habitat for commercial, artisanal, and sport fisheries;
attract local and international tourists to the coast; and are a source of cultural and spiritual significance to
many people. However, their value is often not reflected in policy and development decisions. A lack of
information and knowledge of the extent and value of the benefits provided by reefs hinders effective
decision-making in support of reef conservation and contributes to the continued degradation of Jamaica’s
reefs from widespread overfishing, coastal development, and pollution.2 Jamaica’s white coralline
beaches represent an important draw and the primary focus of most international tourists, and thus
provide a critically important contribution to Jamaica’s economy. To help illuminate the importance of
reefs, this study assesses the economic value of the contribution of reefs to erosion control and the
economic benefits derived from beach tourism. The Coastal Capital: Jamaica project also examines two
other ―ecosystem services‖ that coral reefs provide to Jamaica: coral reef-associated fisheries, and the role
of coral reefs in reducing coastal flooding during storms. Working papers on these topics can be found at
www.wri.org/coastal-capital.
This study focused on the three main beach tourist destinations in Jamaica—Negril, Montego Bay, and
Ocho Rios—which are all impacted by coral reef degradation and associated beach erosion (Map ES-1).
An average current beach erosion rate of 0.3 m/yr was used for each of these beaches. We applied a
model developed by Sheppard et al. (2007) to each of the three sites, to estimate how the further loss of
live reef structure and the subsequent erosion of the reef substrate over 10 years would lead to increased
wave heights and thus increased beach erosion.3 We found that increased coral degradation would lead to
significant increases in beach erosion in all three sites over 10 years—more than 50 percent for Montego
Bay, 70 percent for Ocho Rios, and more than 100 percent for Negril compared to the current rate.
Map ES-1. Jamaica’s reefs are at risk from overfishing, coastal development, watershed-based pollution, and
marine-based pollution
Source: Burke et al. 2011.

8
Using the increased erosion rates as inputs, we then determined the loss in consumer welfare associated
with a decline in beach quality due to erosion at each site. A study by Edwards (2009), which looked at
visitors’ willingness to pay for environmental quality, was used as the basis to determine the welfare loss
per meter loss of beach width.4
We estimate that at the end of 10 years, current erosion rates at the beaches in Negril, Montego Bay, and
Ocho Rios will cause a US$19 million annual loss in value. If reefs degrade further, we estimate that the
additional beach erosion will increase this loss to US$33 million that year. This represents an additional
US$13.5 million—a 70 percent increase in the annual loss of value if the reef degrades further. This loss
of value is projected to have knock-on impacts by reducing tourist visitation between 9,000 and 18,000
stopover visitors per year, costing an estimated US$9 million to US$19 million per year to the Jamaican
tourism industry and US$11 million to US$23 million per year to the entire Jamaican economy.
Jamaican coastal tourism is highly dependent on the quality of the natural environment. With improved
coastal and fisheries management, the ecosystem services provided by Jamaica’s coral reefs and beaches
could recover—and thus their value to coastal tourism and other services and benefits to the Jamaican
economy would increase. More revenue from ecosystem services associated with coral reefs would in
turn correspond to an increase in the economic feasibility of protecting and restoring beaches affected by
erosion.
The continued contribution of coastal tourism to Jamaica’s economy rests on the ability of key
stakeholders to better protect the coral reefs and coastal ecosystems the industry is so critically dependent
upon. The estimates produced in this study are meant to inform decision-making, while also encouraging
new opportunities to finance reef and coastal conservation measures. We offer several strategies to utilize
our results in ways that will promote reef conservation, including:
Build national political will for greater reef conservation. History demonstrates that conserving
ecosystems begins with widespread awareness of the benefits they provide and the political will
to act. In order to leverage these results, it is important to publicize and disseminate the key
findings of this paper to the Jamaican government, citizens, conservation groups, industry, and
development agencies.
Strengthen environmental policy. Policies that address the main drivers of coral reef degradation
(overfishing, coastal development, and pollution) over short-term measures such as beach
nourishment must be developed. This includes strengthening existing policy opportunities, such
as the draft National Fisheries Policy, with language that makes the economic case for more
holistic conservation measures. Current laws—such as the Tourism Enhancement Fund, the
Natural Resources Conservation Act, and the Beach Control Act—must also be examined to
assess how well existing institutional mechanisms, norms, and regulations address local threats to
coral reefs.
Create new opportunities for long-term conservation funding. By quantifying the economic
losses likely to occur due to degradation of reefs, it is possible to tap public and private funding
for coastal management, gain access to new markets, initiate payments for ecosystem services,
and charge polluters for damages. Key stakeholders must invest in solutions to protect and restore
the beaches and coral reefs that support Jamaican tourism over the long term.

9
The Coastal Capital Project
This study is part of the World Resources Institute’s (WRI) Coastal Capital project. The project was launched
in 2005 and aims to provide decision-makers in the Caribbean with information and tools that link the health
of coastal ecosystems with the attainment of economic and social goals. WRI and its local partners have
conducted economic valuation studies of coral reefs and mangroves at national and subnational levels in five
countries: Trinidad and Tobago, St. Lucia, Belize, the Dominican Republic, and Jamaica. We are using the
results to identify and build support for policies that help to ensure healthy coastal ecosystems and sustainable
economies.
Products from Coastal Capital: Jamaica, in addition to this paper, include a working paper on coral-reef
associated fisheries; a working paper by the University of the West Indies, Mona GeoInformatics Institute, on
coastal inundation; an 8-page summary of results for decision-makers; and a literature review and summary of
14 previous coral reef valuation studies from Jamaica. These products, along with additional information
about WRI’s Coastal Capital series, are available online at http://www.wri.org/coastal-capital.

10
Introduction: Jamaica’s Coastal Capital
Coral reefs provide a diverse array of goods and services to the people and economy of Jamaica. They
buffer coastlines from storms; slow erosion; provide habitat for commercial, artisanal, and sport fisheries;
attract local and international tourists; and are a source of cultural and spiritual significance to many
people. However, the full value of these reefs and coastal ecosystems—and the goods and services they
provide—is often not reflected in policy and development decisions. A lack of information and
knowledge of the extent and value of the benefits provided by reefs hinders effective decision-making
about investments, conservation efforts, and management.
Jamaica is a mountainous archipelagic state surrounded by a narrow discontinuous coastal plain. The
mainland island extends 234 km in length and 82 km in width, encompassing a land area of 11,000 square
kilometers, making it the third largest island in the Caribbean Sea. Its 1,022 km coastline has many
coralline beaches, as well as rivers and wide marshy flats, providing a diverse coastal environment.5, 6
Jamaica’s reefs are some of the most diverse in the Atlantic and also among the best studied in the world,
with data available since the 1950s.7 Its fringing reefs are broadly distributed along a narrow 1–2 km shelf
on the northern coastline and also, although to a lesser degree, on the broader 20 km wide southern shelf.8
Additionally, reefs and corals can be found on its two largest offshore banks, Pedro Cays, 80 km to the
south, and the Morant Cays, 50 km to the southwest. Jamaican reefs face several serious human pressures.
Overfishing, the most prevalent human pressure, threatens all of Jamaica’s reefs. Watershed-based
pollution and coastal development threaten nearly 60 percent of the country’s reefs, while marine-based
pollution threatens over 30 percent of reefs (Map 1 and Figure 1).2
Map 1. Jamaica’s reefs are at risk from overfishing, coastal development, watershed-based pollution, and
marine-based pollution
Source: Burke et al. 2011.
11
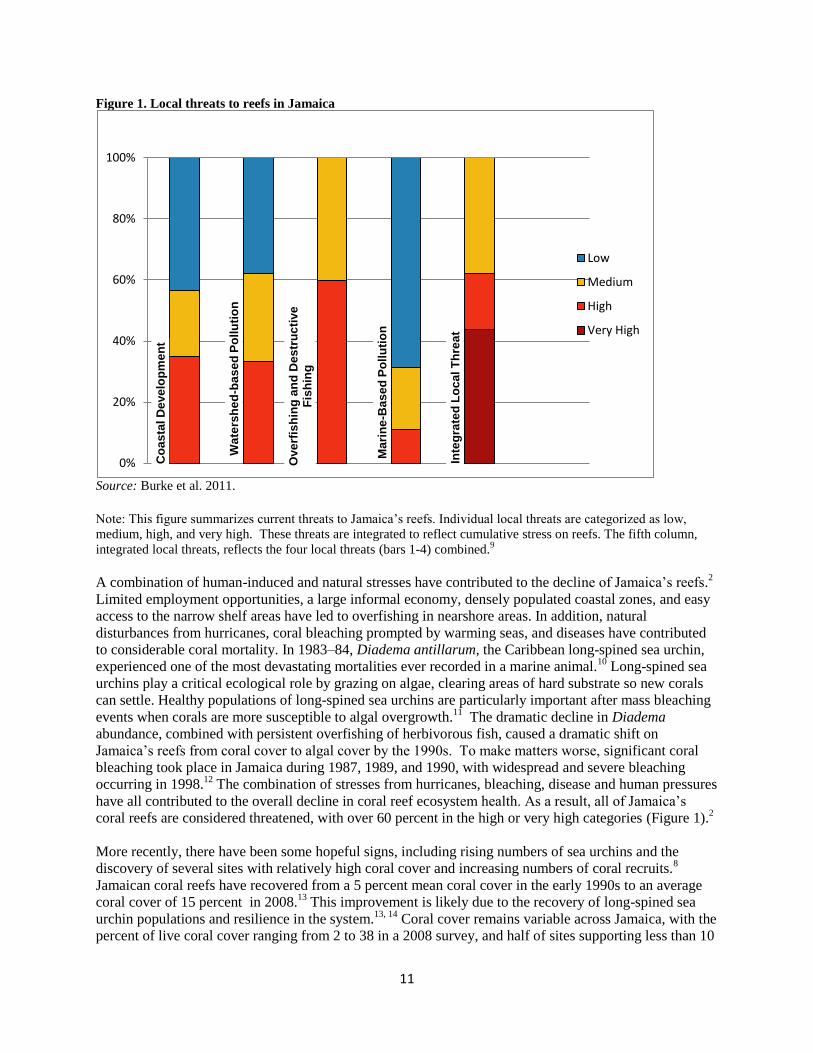
Figure 1. Local threats to reefs in Jamaica
Source: Burke et al. 2011.
Note: This figure summarizes current threats to Jamaica’s reefs. Individual local threats are categorized as low,
medium, high, and very high. These threats are integrated to reflect cumulative stress on reefs. The fifth column,
integrated local threats, reflects the four local threats (bars 1-4) combined.9
A combination of human-induced and natural stresses have contributed to the decline of Jamaica’s reefs.2
Limited employment opportunities, a large informal economy, densely populated coastal zones, and easy
access to the narrow shelf areas have led to overfishing in nearshore areas. In addition, natural
disturbances from hurricanes, coral bleaching prompted by warming seas, and diseases have contributed
to considerable coral mortality. In 1983–84, Diadema antillarum, the Caribbean long-spined sea urchin,
experienced one of the most devastating mortalities ever recorded in a marine animal.10
Long-spined sea
urchins play a critical ecological role by grazing on algae, clearing areas of hard substrate so new corals
can settle. Healthy populations of long-spined sea urchins are particularly important after mass bleaching
events when corals are more susceptible to algal overgrowth.11
The dramatic decline in Diadema
abundance, combined with persistent overfishing of herbivorous fish, caused a dramatic shift on
Jamaica’s reefs from coral cover to algal cover by the 1990s. To make matters worse, significant coral
bleaching took place in Jamaica during 1987, 1989, and 1990, with widespread and severe bleaching
occurring in 1998.12
The combination of stresses from hurricanes, bleaching, disease and human pressures
have all contributed to the overall decline in coral reef ecosystem health. As a result, all of Jamaica’s
coral reefs are considered threatened, with over 60 percent in the high or very high categories (Figure 1).2
More recently, there have been some hopeful signs, including rising numbers of sea urchins and the
discovery of several sites with relatively high coral cover and increasing numbers of coral recruits.8
Jamaican coral reefs have recovered from a 5 percent mean coral cover in the early 1990s to an average
coral cover of 15 percent in 2008.13
This improvement is likely due to the recovery of long-spined sea
urchin populations and resilience in the system.13, 14
Coral cover remains variable across Jamaica, with the
percent of live coral cover ranging from 2 to 38 in a 2008 survey, and half of sites supporting less than 10
Co
as
tal D
eve
lop
me
nt
Wa
ters
he
d-b
as
ed
Po
llu
tio
n
Ove
rfis
hin
g a
nd
De
str
uc
tive
F
ish
ing
Ma
rin
e-B
as
ed
Po
llu
tio
n
Inte
gra
ted
Lo
ca
l T
hre
at
0%
20%
40%
60%
80%
100%
Low
Medium
High
Very High

12
percent live coral cover.8,15
However, in general, Jamaica’s reefs remain degraded, as many human-
induced and natural stresses persist.13
Furthermore, the projected increase in sea level and the intensity of
hurricanes from climate change is expected to further exaggerate the impact of degrading reef
structure.2, 16
These human pressures and other stresses and threats have led to the widespread degradation of
Jamaica’s coral reefs.2, 7
To reverse the degradation of Jamaica’s reefs, it will be essential to curb these
threats. Economic valuation—which assigns a monetary value to the goods and services provided by
ecosystems—gives policy makers an important tool with which to set priorities and improve decision-
making around natural resources. By highlighting the long-term economic benefits derived from effective
management of reefs, we make the case that reef conservation efforts are investments in ―coastal capital‖
that have real economic benefits.
Reefs provide an important source of white sand for beaches and also dissipate wave energy to reduce
erosion and lower inundation and wave damage during storms. This analysis emphasizes the contribution
of reefs to beach erosion control and the economic benefits derived from beach tourism, as white sand
beaches represent an important draw and the primary focus of most international tourists to Jamaica. The
paper focuses on Negril, Montego Bay, and Ocho Rios—the three main beach tourist destinations in
Jamaica. These beautiful white sand beaches are threatened by erosion in many places along the coast.
We chose Long Bay in Negril as the primary case study, as beach dynamics are best documented and
understood there and considerable data were available.
The analysis proceeds in two parts, where we quantify (1) the relationship between coral reef degradation
and beach erosion in Jamaica; and (2) the relationship between beach erosion and potential losses of
tourism revenue in Jamaica. This analysis will demonstrate how continued coral reef degradation will result in economic losses for
Jamaica’s travel and tourism industry, which is forecast to account for nearly 24 percent of Jamaica’s
gross domestic product in 2011.17
Our results make a compelling case for greater investment in reef
protection and conservation in Jamaica, including managing coastal development, reducing watershed-
based pollution and sedimentation, and promoting sustainable fishing practices.

13
Box 1. Economic Valuation of Coral Reefs
Economic valuation is a tool that can aid decision-making by quantifying ecosystem services, such as those
provided by coral reefs, in monetary terms. In traditional markets, ecosystem services are often overlooked or
unaccounted for, an omission that regularly leads to decisions favoring short-term economic gains at the expense of
long-term benefits. Economic valuation provides more complete information on the economic consequences of
decisions that lead to degradation and loss of natural resources, as well as the short- and long-term costs and
benefits of environmental protection.
Many studies have quantified the value of one or more ecosystem services provided by coral reefs. These studies
vary widely in terms of spatial scale (from global to local), method used, and type of value estimated. Of the many
ecosystem services provided by coral reefs, reef-related fisheries, tourism, and shoreline protection are among the
most widely studied because their prices are traceable in markets and are thus relatively easy to calculate.
Although cultural, aesthetic, and future benefits associated with reefs are also significant, they have largely been
absent in valuation studies due to a lack of information from existing or comparable markets.
Ultimately, the goal of economic valuation is to influence decisions that will promote sustainable management of
reefs. By quantifying the economic benefits or losses likely to occur due to degradation of reefs, it is possible to tap
public and private funding for coastal management, gain access to new markets, initiate payments for ecosystem
services, and charge polluters for damages.
Challenges and Limitations
Despite the usefulness of economic valuation, there are still many challenges to its practical application. This is
evidenced by the wide variation in the quality and consistency of existing economic valuation studies. Economic
valuation can produce only a partial estimate of total ecosystem value, as humankind’s limited technical, economic,
and ecological knowledge prevents us from ever truly identifying, calculating, and ranking all of an ecosystem’s
values. Ultimately, valuation results should be used as part of a larger decision-making ―toolbox‖ rather than being
relied upon in a vacuum. In particular, valuation studies need to take into account the local context—both social
and biological—and be undertaken with an eye toward the bigger picture. For example, what are the implications
of under- or overestimating a given ecosystem service? Who will be the winners and losers if an ecosystem service
is gained or lost? It is critically important when undertaking economic valuation to engage local stakeholders,
document all data and assumptions, and carefully explain the uses and limitations of the research. Despite these
challenges, economic valuation provides a powerful tool to target key decision-makers, while making the economic
case for greater investment in conservation efforts.

14
1. Coral Reefs and Beaches in Jamaica
Beaches, in their natural state, are in dynamic equilibrium between the sources that supply sand and the
forces that erode it.18
The remains of corals provide an important source of sand, and are deposited along
beaches by wind, waves, and currents. Living corals, and remains of corals, also contribute to the three-
dimensional complexity and bottom friction of the ocean floor, which is an important factor in the
dissipation of wave energy.3 Coral reefs can reduce wave energy by more than 75 percent.
19 By reducing
the energy of incoming waves, coral reefs help to control beach erosion. If living coral no longer covers
the ocean floor, the substrate of old coral skeletons that make up a reef becomes exposed to waves and
erode. This increases the depth of the water, leading to an increase in wave energy. The ability of coral
reefs to control beach erosion thus becomes impaired and beaches lose sand.18
Beach Erosion in Long Bay, Negril
Negril Beach, located on Jamaica’s west coast and shared by both Hanover and Westmoreland parishes,
has two carbonate beaches known as Long Bay and Bloody Bay that stretch a total of 9.1 km.20
Long
Bay, the focus of this case analysis, has a total length of 7 km and an average width of 15 m, with beach
width ranging from as low as 1 m to as wide as 43 m in the central section.21
In general, the beach is
shallow with a mild slope average of 10 percent. Large all-inclusive resorts are, for the most part, found
on the northern end of Long Bay, while smaller restaurants and hotels occupy the southern section of the
bay. There is a 500 m long patch reef located 1.4 km offshore in front of the widest section of beach on
Long Bay, and a fringing reef situated 2–3 km offshore on the outer shelf of the reef with a water depth of
20 to 50 meters.20, 22, 23
Negril’s reefs averaged 15 percent coral cover in 2007.8 Please see Appendix 1 for
a reef profile for Negril.

15
Map 2. Negril infrastructure and reef map
16
Current Rates of Beach Erosion in Negril
Negril’s beach is extremely dynamic, as beach width in some sections has been recorded to fluctuate
more than 30 m in a single year.20
A study by Smith-Warner reports a 40 m loss of beach in certain areas
over the past 40 years, or an average rate of beach erosion of 1 m per year during that period.20
The
University of the West Indies’ Marine Geology Unit (MGU) found a net average beach loss of 8.4 m for
Long Bay from 1971 to 2008, or 0.23 m per year.21
Although these averages vary, both studies conclude
that overall the beach width has been diminishing in recent decades. This beach loss has not occurred
gradually over time, but rather sporadically through periods of accretion, recession, and relative stability,
and losses have most notably followed hurricanes and big storm events.20, 21
Negril’s beach is, for the most part, a natural beach and has had few engineering interventions. There
have been some steps taken to conserve Negril’s reefs, most notably in 1998 with the establishment of the
16,000 ha Negril Marine Park. The park includes almost all of Negril, stretching from the high water
mark on shore to 3.2 km out to sea. The park incorporates coral reef, sea grass, and mangrove habitat and
is zoned to provide for mixed uses.24
Modeling the Impact of Reef Degradation on Beach Erosion
We applied two models to explore the implications of further coral reef degradation and the resulting
changes to wave height, wave energy, and impact on beach erosion. The first, simpler model, developed
by Sheppard et al. (2007), predicts how the loss of live reef structure and the subsequent erosion of the
reef substrate increase beach erosion through increased wave heights.3,25,18
The second model, MIKE 21,
is a hydrodynamic model, which can be run in both two- and three- dimensional modes and models how
corals attenuate wave height for a variety of storm conditions.26
We applied the Sheppard model for all
three sites, but we only had data required to apply MIKE 21 for Negril.
Sheppard Model Application and Results
The aim of the analysis was to understand how future degradation and death of coral reefs in Long Bay,
Negril, and the subsequent erosion of the dead coral colony would affect beach erosion through increased
wave height. The modeled scenario involved the loss of friction from live, standing coral cover, followed
by the erosion of the coral substrate. Within the Sheppard model, the frictional coefficient was reduced
from .14 to .10, which corresponds to a shift between two categories of live coral cover in Sheppard et al.
from 10–25 percent live coral cover to 75–100 percent smooth coral rock.3 In addition, a 6 mm per year
erosion rate of the coral rock was used to evaluate the effects of erosion of the reef substrate over 10
years, subsequent to the loss of friction from the live, standing coral. The increase in beach erosion is
calculated using a base erosion rate for Negril of .3 m/yr, which is fairly conservative, in light of the .23
m/yr estimate from MGU and the 1 m/yr estimate from Smith-Warner. We examine this increase in
beach erosion due to loss of reef rugositya and height relative to this base (current) erosion rate.
Application of the Sheppard model for Negril suggests wave height could increase by 30 percent due to
the initial loss of rugosity from live standing coral and up to 36 percent by year 10 due to the additional
erosion of the reef. These increases in wave height from 30 to 36 percent would result in roughly a
doubling (118 percent) of the rate of beach erosion relative to current conditions (3.0 m beach loss by
year 10). Under the status quo, the beach erodes about three meters over a 10-year period. Under this
scenario of enhanced coral degradation and reef erosion, the beach erodes at about 6.2 meters over the 10
a Rugosity refers to the ―roughness‖ or 3-D complexity of the ocean floor, and thus its frictional quality.
17
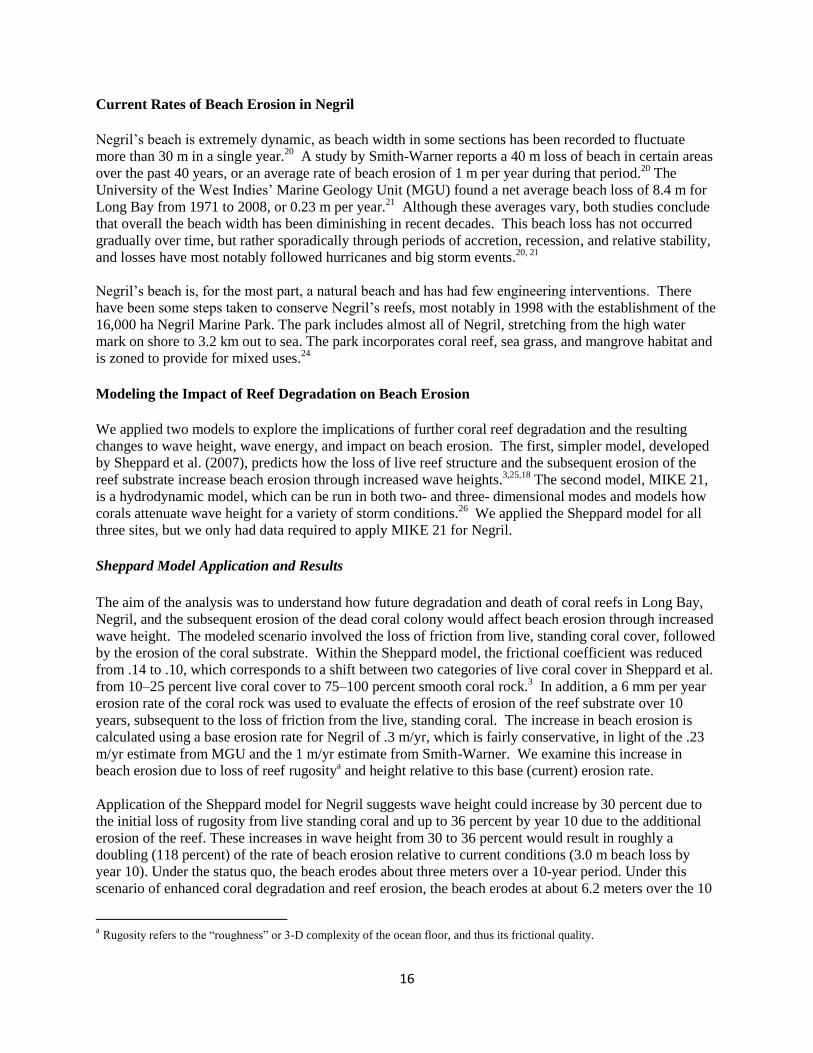
year period. Please see Table 1 for a summary of the modeling results and Appendix 2 for the full results,
data sources, and input values used in the application of the Sheppard model for Negril.
Table 1. Sheppard model results for Long Bay, Negril
Model Scenario Inshore
Wave
Height (m)
% increase in
inshore wave
height
% increase in erosion
rate relative to
current
Beach loss (using a
base erosion rate .3
m/yr)
Current 15% live
coral cover (baseline) .159 0 (current) 0 (current) .30
No live coral cover
(bottom friction is
reduced)
.207 30 94
Year 1 of erosion .208 31 96 .59
Year 10 of erosion .217 36 118 .65
Total loss of beach width after 10 years (average for Long Bay, in m)
If reef degrades and erodes 6.2
Base scenario – Reef unchanged, current erosion
rate of 0.3 m / yr continues 3.0
MIKE 21 Application and Results
The MIKE 21 model was applied in both two- and three-dimensional modes for Negril to examine how
coastal inundation is likely to change if the reefs in Long Bay degrade further.b Using the outputs of that
modeling effort, a specific storm scenario was examined that most closely matches the scenario evaluated
above using the Sheppard model. The scenario uses the ―1-year storm event‖c for Negril and a 1 meter
loss of reef height (the water level above the reef increases from 1 m to 2 m). The estimated model output
of change in inshore wave heights from the MIKE 21 model was used to compare to the equivalent output
from the Sheppard model. In both cases, the percent change in wave height was used to estimate the
likely change in beach erosion.
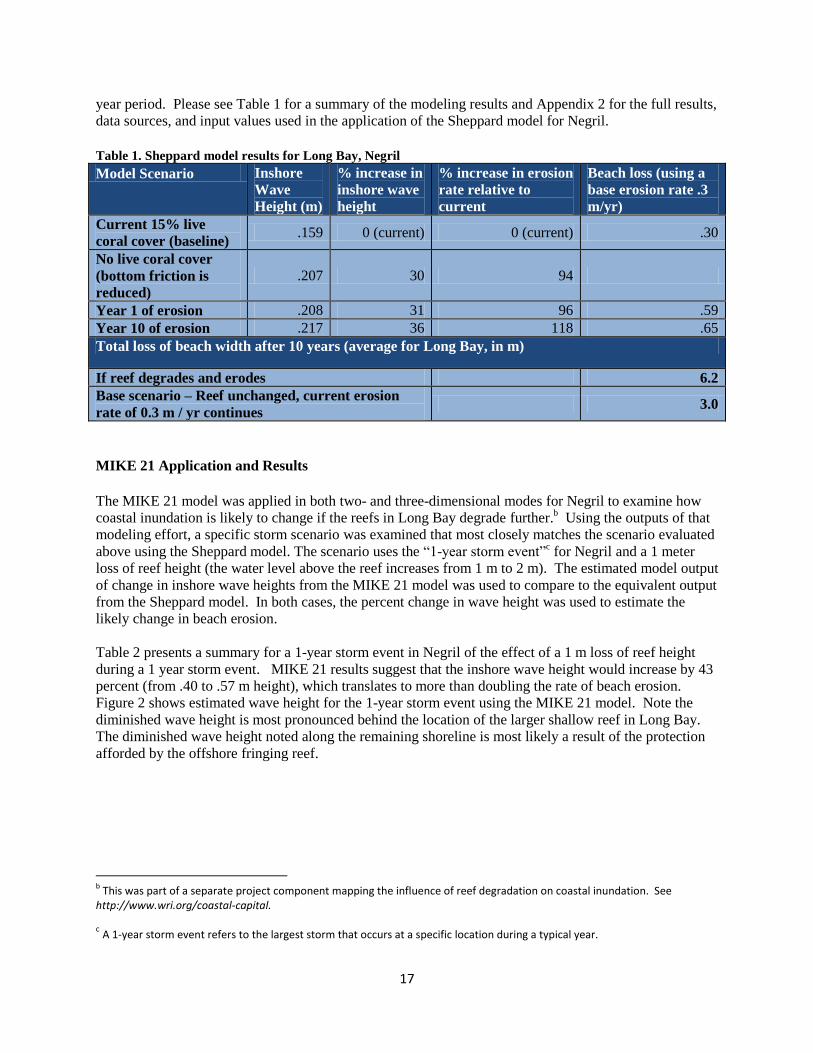
Table 2 presents a summary for a 1-year storm event in Negril of the effect of a 1 m loss of reef height
during a 1 year storm event. MIKE 21 results suggest that the inshore wave height would increase by 43
percent (from .40 to .57 m height), which translates to more than doubling the rate of beach erosion.
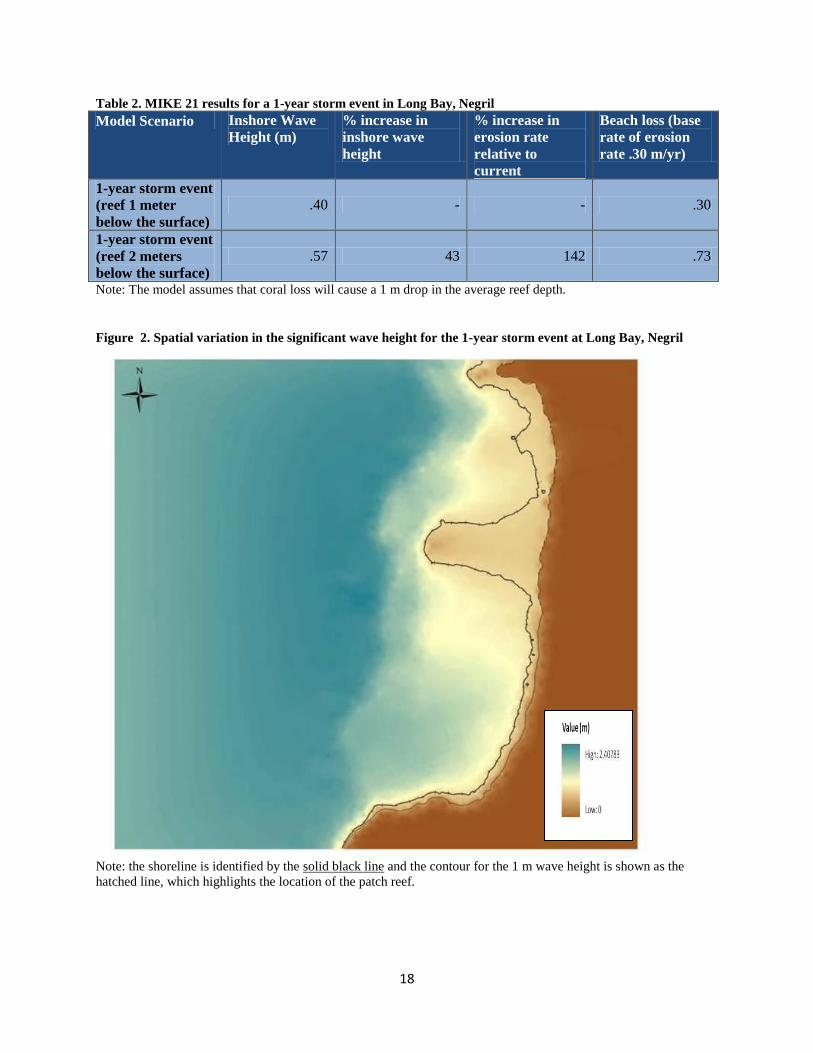
Figure 2 shows estimated wave height for the 1-year storm event using the MIKE 21 model. Note the
diminished wave height is most pronounced behind the location of the larger shallow reef in Long Bay.
The diminished wave height noted along the remaining shoreline is most likely a result of the protection
afforded by the offshore fringing reef.
b This was part of a separate project component mapping the influence of reef degradation on coastal inundation. See
http://www.wri.org/coastal-capital.
c A 1-year storm event refers to the largest storm that occurs at a specific location during a typical year.
18
Table 2. MIKE 21 results for a 1-year storm event in Long Bay, Negril
Model Scenario Inshore Wave
Height (m)
% increase in
inshore wave
height
% increase in
erosion rate
relative to
current
Beach loss (base
rate of erosion
rate .30 m/yr)
1-year storm event
(reef 1 meter
below the surface)
.40 - - .30
1-year storm event
(reef 2 meters
below the surface)
.57 43 142 .73
Note: The model assumes that coral loss will cause a 1 m drop in the average reef depth.
Figure 2. Spatial variation in the significant wave height for the 1-year storm event at Long Bay, Negril
Note: the shoreline is identified by the solid black line and the contour for the 1 m wave height is shown as the
hatched line, which highlights the location of the patch reef.

19
Comparison: MIKE 21 and Sheppard Model Results for Negril
We found that the 10-year scenario in the Sheppard model is similar to the results of a 1 m loss of reef
height in the MIKE 21 model. Although the Sheppard and MIKE 21 applications project somewhat
different wave heights for present conditions, they project fairly similar changes in wave height as the
reef degrades. The results of the Sheppard model showed a 36 percent increase in wave height, compared
to a 43 percent increase in wave height (with the erosion of the reef 1 m to a 2 m depth below the water
level) from MIKE 21. Both models predicted that beach erosion would more than double.
Beach Erosion in Montego Bay and Ocho Rios
The Montego Bay and Ocho Rios beaches are located on Jamaica’s northwestern coast. Montego Bay,
the capital of St. James parish, is Jamaica’s second largest city and a magnet for tourists, drawing over 80
percent of Jamaica’s visitors through the Sir Donald Sangster International Airport.27
Ocho Rios, located
in the St. Ann parish, represents another important tourist destination, drawing nearly 65 percent of all
Jamaican cruise ship visitors to its port each year. Both Montego Bay and Ocho Rios have had significant
engineering interventions to stabilize and nourish beaches, particularly in comparison to Long Bay,
Negril.28
Beaches and Resorts Impacted by Reef Degradation
Montego Bay’s most prominent beaches form discontinuous patches of white sand that are separated by
limestone ledges and extend from Sangster Airport south toward the city. Walter Fletcher and Cornwall
Beach are the only public beaches, while numerous resorts, hotels, restaurants, and bars dot Montego
Bay’s coastline. Thirteen small pocket beaches that stretch east along the St. James coast approximately 8
km from the airport were also included in the analysis due to their proximity to Montego Bay and their
importance as tourism beaches.
Montego Bay’s coastline below Sangster Airport is buffered by a patch reef located 500 m offshore,
which contains approximately 4,300 ha of coral reef substrate (see Map 3).22, 23, 29
South of Doctor’s
Cave, the reef transitions to a fringing reef.22
As of 2000, several sites had a 7 percent average live coral
cover.7 There are a number of threats confronting these reefs, including poor waste disposal, habitat
clearance for hotel development, overfishing, hurricanes, and bleaching events. Additionally, physical
damage caused by boat anchors and careless divers has also impacted reef health.29
The Montego Bay
Marine Park, which encompasses 1,530 ha and includes Dead End, Cornwall, Doctor’s Cave, Walter
Fletcher, and Dump Up beaches, extends from the Sangster Airport all the way south to the Great River.
The Montego Bay Marine Park manages for the mixed use of the coastline, but confronts a number of
challenges, including a lack of sufficient funding and conflict among user groups.27, 29
The center of activity in the town of Ocho Rios is the Ocho Rios Bay Beach, a sandy and relatively wide
0.6 km long patch of white sand surrounded by hotels, resorts, restaurants, bars, and an active cruise ship
port (see Map 4). Ocho Rios also has a fringing reef that lies 1,000 m offshore.22, 23
In 2000, a survey
showed a site in Ocho Rios with only 2 percent coral cover.7 The reefs in Ocho Rios face similar
challenges as those of Montego Bay, but are also subject to heavier boat traffic, particularly from cruise
ships.27
Beach width also has been rapidly shrinking due to new hotel developments coupled with land
encroachment, as highlighted by the large loss of beach that resulted from the construction of the massive
Sunset Jamaica Grande Resort.27
The Ocho Rios Marine Park, which is bordered by 13.5 km of shoreline,
was delineated to protect Ocho Rios’ coral reefs, but is considered a ―paper park.‖ 2, 30, 31

20
Map 3. Montego Bay infrastructure and reef map

21
Map 4. Ocho Rios infrastructure and reef map

22
Results of Modeling (Sheppard) of Reef Degradation on Beach Erosion in Montego Bay and Ocho
Rios
Using a similar scenario as Negril, the loss of all live coral cover (and associated friction) followed by 10
years of erosion of reef substrate was applied to Montego Bay and Ocho Rios. The starting condition is
slightly different due to lower coral cover in Montego Bay and Ocho Rios compared to Negril. A base
erosion rate of 0.3 m/yr also was used for Montego Bay and Ocho Rios. The application of this model
scenario for Ocho Rios produced a 26 percent increase in wave height and a 77 percent increase in beach
erosion, resulting in a 5.1 m loss of beach width over 10 years or a 2.1 m loss above the base scenario. In
comparison, the loss of reef in Montego Bay is slightly less influential, resulting in a 21 percent increase
in wave height and a 60 percent increase in erosion. This increase in erosion is anticipated to result in a
4.6 m loss of beach over 10 years, compared to a 3 m loss of beach if the reef remains in its current
condition. As seen in Table 3, the greatest influence of reef loss on the subsequent erosion of beach is in
Long Bay, Negril, followed by Ocho Rios. See Appendix 2 for more detailed results, data sources, and
input values used in the application of the model in Montego Bay and Ocho Rios.
Table 3. Comparison of results for erosion over 10 years for Negril, Montego Bay, and Ocho Rios
Location Inshore Wave
Height (m)
Beach Erosion Rate
(m)
Beach Loss over
10-Year Period (m)
Current
Reef
Degraded
Reef
%
Increase
Current
Reef
Degraded
Reef
%
Increase
Current
Reef
Degraded
Reef
%
Increase
Negril 0.159 0.217 36 0.3 0.65 118 3 6.2 107
Montego
Bay 0.344 0.415 21 0.3 0.48 60 3 4.6 53
Ocho
Rios 0.219 0.276 26 0.3 0.53 77 3 5.1 70
Note: Inshore wave height and annual beach erosion rate are for year 10, while beach loss over 10-year period is for
years 1–10.

23
Figure 3. Comparison of predicted beach loss over a 10-year period
Considerations and Limitations on Modeling Beach Erosion for Negril, Montego Bay, and Ocho Rios
Our analysis of future beach erosion rates combines information from multiple sources in a complex,
multi-stage analysis. We applied the Sheppard model for all three sites, but we only had data required to
apply MIKE 21 for Negril. We found local information for several variables within the Sheppard
model—such as beach slope and erosion rates—in Negril (0.3 m/yr). Where local input values were not
available, we averaged values from the Caribbean—such as for offshore wave height, offshore wave
period, and reef erosion rates. Additionally, for Montego Bay and Ocho Rios, where erosion estimates
were not available, we assumed a similar erosion rate as Negril. We also used the ―ruler tool‖ of
GoogleTM
Earth 5.0 to determine variables such as average beach width for Montego Bay and Ocho Rios.
We derived reef height from reef profiles provided by the Mona GeoInformatics Institute (MGI). The
scenarios we explored focused on coral death, degradation, followed by erosion of the reef substrate.
However, current trends in live coral cover and reef health are not clearly established and thus this
scenario represents only a possible scenario of unmitigated threats and degradation, resulting in the death
of all corals.
Our estimate of a beach erosion rate is based on a change from the current base erosion rate. There is
uncertainty in this rate due to the difficulty in tracking shoreline modifications due to changes in
vegetation from development and coastal infrastructure (breakwaters, groynes, etc). The fairly large
disparity in estimates for current erosion rates between Marine Geology Unit (0.23 m/yr) and Smith-
Warner (1 m/yr) further highlights this uncertainty. Additionally, the most significant increase in wave
height occurs with the loss of rugosity, but it is not fully understood how long it takes to lose or what
stage of degradation the reefs in Negril, Montego Bay, and Ocho Rios have already reached.
It is clear, however, that Jamaica’s beaches are eroding and that further degradation of Jamaica’s coral
reefs would probably result in accelerated rates of erosion. Below, we examine the potential negative
effects of increased beach erosion rates on Jamaica’s tourism economy.
0
1
2
3
4
5
6
7
Negril Montego Bay Ocho Rios
m
Increased erosion due to reef degradation
Current rate of beach erosion

24
2. Economic Contributions of Reefs and Beaches to Tourism in Jamaica
Economic Importance of Tourism
The travel and tourism sector plays a critical role in the Jamaican economy alongside remittances and the
bauxite/alumina industry. Travel and tourism is the largest contributor to Jamaica’s gross domestic
product (GDP), and is projected to directly contribute over US$1 billion or 7.4 percent of the country’s
GDP in 2011.17
The total contribution, including its wider economic impacts, is forecast to contribute
nearly US$4 billion or 24 percent of the GDP in that same year.17
The industry also is expected to
directly employ over 7 percent of the workforce in 2011, while the wider tourism economy, including
supporting industries (such as food, infrastructure, communications) is expected to account for nearly 23
percent of employment.17
Jamaica has the fourth largest tourism economy in the Caribbean. Visitor
spending in 2011 is expected to generate roughly US$2 billion in foreign exchange for the country.17
In
2009, Jamaica drew 1.8 million stopover visitors and an additional 900,000 cruise tourists.32
Jamaica is facing a number of economic challenges, including high unemployment, a 12.6 percent
inflation rate in 2010, and a large foreign debt.6 The global downturn has put additional pressure on the
economy, reducing its real GDP growth to -1.1 percent in 2010.33
The state of the economy puts
additional pressure on elected officials to encourage foreign investment, hotel, and cruise-related
development in the short term. Unfortunately, without careful planning, many of these projects degrade or
threaten the longer-term health of the coastal ecosystems upon which much of the country’s tourism
depends.
Below, we establish the importance of the coralline beaches at Negril, Montego Bay, and Ocho Rios to
Jamaica’s appeal as a tourism destination, using existing surveys of visitors and analysis of tourism data,
and by placing a dollar value on the loss or degradation of beaches in the country.
Dependence of Tourism on Reefs and Beaches
A key challenge in estimating the contribution of coral reefs to the larger tourism economy is identifying
the percentage of visitation or visitor spending attributed to the presence of coral reefs. In addition to
visiting beaches and reefs, many people also travel inland to visit Jamaica’s beautiful waterfalls,
wetlands, and mountains; others come primarily to experience the culture, music, or history of the
country. Since this analysis is limited to secondary data sources, estimating the contribution of reefs and
beaches to Jamaican tourism is particularly challenging. For this analysis, we examined tourism data and
visitor surveys to produce a rough estimate of the importance of beaches to tourists. These estimates
could be improved by follow-up surveys on the ground—a possibility for future research.
According to the Jamaica Tourist Board (JTB),d the vast majority of tourist days are spent in one of the
three major beach destinations in the country. Montego Bay, Ocho Rios, and Negril account for roughly
72 percent of total overnight (non-cruise) visitors, and 93 percent of total ―bed-nights‖ (i.e. nights spent in
hotels in the country) recorded by the JTB from 2006 to 2009 (Table 4). The ports of Montego Bay and
Ocho Rios also account for nearly 92 percent of cruise ship arrivals.32
Furthermore, these three
destinations provide an important source of jobs, employing nearly 87 percent of the staff from the
accommodation sector in 2009.32
If only the accommodation numbers are considered, beaches and
coastal tourism strongly dominate the time spent by tourists in the country. However, these figures inflate
d The JTB, a component of the Ministry of Tourism, is the lead organization responsible for promoting and marketing Jamaica as
a lead tourism destination.

25
the role of coastal tourism somewhat, in part because although most people stay on the beach, many take
day trips to the interior where accommodation is scarcer.
Table 4. Average number and percent of total tourists visiting the three largest coastal tourism destinations in
Jamaica over the past 5 years (2006–09)
Destination Avg. # of
overnight
visitors / year
% of total
visitors
Avg. # of
bed nights /
year
% of total
bed nights
Avg. # of
cruise
visitors/year
Negril 360,927 21 2,119,240 28 0
Montego Bay 466,075 27
2,379,106 31 399,883
Ocho Rios 425,026 24 2,510,664 33 726,779
Coastal
Destination
Total
1,252,028 72 7,009,009 92 1,132,778
Source: Jamaica Tourism Board, 2006, 2009. 32, 34
We also examined information on the role of beaches in attracting tourists to the country. For instance, it
would be ideal to know how many tourists would choose to go elsewhere if the beaches were severely
degraded. There are some partial answers to this question. A 2006 JTB visitor survey asked tourists to
rate features of their trip by level of interest (very, somewhat, or not very interested) and found 78.5
percent of visitors to be ―very interested‖ in beaches, which was the top choice by a wide margin (see
Appendix 3).35
Taking another approach, Edwards (2009) conducted a ―stated preference‖e survey of visitors to the island
to estimate the recreational value visitors place on the presence of beaches and nearshore coastal waters.4
36 Using a contingent choice modeling approach
f, Edwards estimated that the average access
(recreational) value for an overall coral reef and beach was US$128 per visitor. This amount represents
the value of compensating tourists if they were to experience a total loss of the beach and coral reef
recreational services at their destination. It can also be expressed as the tourist’s willingness to pay
(WTP)g to avoid the decline. It is also possible to disaggregate the attributes of a coastal vacation in order
to focus on the value the beach adds to visitors’ enjoyment; this will be discussed in further detail in the
next section. Using the survey results and tourism data, we estimated that between 70 and 80 percent of
tourists care strongly about the presence of beaches in their visits to Jamaica. It should also be noted that
like the tourist board study, Edwards’ survey respondents also indicated that beach and beach-related
activities played a key role in deciding to take their vacation in Jamaica.
e A stated preference approach is an economic valuation method that utilizes surveys to ask individuals to evince their desire
for an environmental good or service according to a hypothetical situation.
f A contingent valuation approach asks individuals for their preferences by conducting surveys that construct a hypothetical market where individuals must state their willingness to pay for an asset or their willingness to receive payment to give something up.
g Willingness to Pay (WTP) is defined as the maximum amount an individual is willing to pay to receive a good or avoid
something undesirable.

26
In the study mentioned above, Edwards examined the loss of consumer surplush stemming from changes
in the quality of beaches and other elements of the coastal environment in Jamaica.4 The study placed a
dollar value on the loss of consumer surplus associated with a loss of environmental quality. A randomly
sampled set of visitors to Jamaica was given a survey that included different coastal management
scenarios and associated levels of environmental quality. The survey then identified the respondent’s
willingness to pay (WTP) to achieve or maintain that level of quality. An example of a hypothetical
scenario and survey question is shown below in Figure 4. For a full description of the methods and results
used in the study, see Appendix 4.
Figure 4. Example of a WTP question included in a stated choice survey (US$)
Source: Edwards (2009).
Putting a Dollar Value on Beach Loss
Overview of Methodology for Determining Welfare Loss of Beach Erosion
Edwards’ original study question focuses on visitors’ WTP for overall coastal environmental quality, but
it is possible to isolate the loss of value (consumer surplus) associated with a loss of quality for any of the
attributes (i.e., beach quality, water quality, coral reef quality, fish size and abundance) using econometric
simulation techniques (see Appendix 5). Consistent with other surveys of Jamaican tourists, respondents
exhibited the highest willingness to pay for preservation of beach quality; the average tourist was not
interested in paying higher fees for better fish or reef quality alone.
For the purposes of this study, we were interested in the value that tourists place on beach quality alone.
Edwards’ survey defines beach quality by the width of the beach and the quality of the sand.37
In order to
translate Edwards’ results into a useable format for this analysis, the authors needed to define quantitative
h Consumer surplus (used interchangeably with consumer welfare) is defined as the difference between the maximum price a
consumer is willing to pay and the actual market price they do pay. For example, if a tourist pays $30 to go on a snorkeling trip,
but would have been willing to pay $50, there is a $20 consumer surplus, which represents the benefit the tourist got for free.
Suppose you were planning to take a trip to Jamaica and one of the previously mentioned management
options were already implemented. Suppose also that each option would vary by the cost of the
tourism surcharge as well as environmental quality.
First, assume you were faced with one of the following three options
Low Management Basic Management Advanced
Management
Per person-Tourism
Surcharge
Beach Quality
Water Clarity
Coral Reef
Fish
$10
Fair
Fair
Fair
Fair
$40
Good
Good
Fair
Fair
$80
Good
Excellent
Good
Good
…which of the options (if any) would you prefer?

27
bounds for the qualitative descriptions of beach quality included in the survey. These beach width
estimates are provided in Table 5 below.
Table 5. Quantitative beach width ranges associated with each quality level in Edwards (2009)
The changes in value as a result of these changes in quality can be modeled using the estimated
parameters from the contingent choice data. The movement from good to fair (or good to poor)
beach quality can therefore be represented by a change in economic value (consumer surplus) to
visitors. This information on the loss in value due to beach degradation can be useful to the
tourism industry over the long term, given their concerns regarding current rates of beach loss, as
well as visitor demand and pricing.
Loss in Consumer Surplus Associated with a Beach Loss
Table 6 shows the results of simulating the changes in value for a change in beach quality. All
other attributes except beach quality were kept constant, thus these results represent consumer
welfare changes for the beach attribute only. The results below show that if current beach width
at an average of 15 meters (―good quality‖) were to decline by 12 m to a 3 meter width or less
(―poor‖), this would be equivalent to a loss in value of US$95 per person. If this figure is divided
by the average number of days spent per visitor as per Edwards’ study (7 nights), then this would
be a per-person loss of approximately US$14 per person per day. A less dramatic decline from
good to fair would represent a loss in value of US$51 per person per visit. The consumer surplus
associated with preventing a total loss of the recreational services of the beach is estimated at
US$105 per person.
To get a sense of what this result means, one can compare the figure of US$105 to the total access
value associated with combined beach and reef ecosystem services of US$128, as discussed in the
previous section. As noted above, access value represents the amount of compensation that
would be necessary if a tourist visited Jamaica and (because of some disaster such as a hurricane
or environmental accident) the tourist had no access to the beaches and coral reefs. Based on the
estimated access value for the beach attribute, one can see that the recreational value of beach is a
significant component of the overall access value.38
Beach quality Associated beach width
Poor 0–15 ft/ 0–5m
Fair 16–30 ft/ 5.1–10m
Good 31–60ft/ 10.1–20m
Excellent 61–100ft/ 20.1–30m

28
Table 6. Results of simulating the welfare changes for a change in the beach attribute for beach quality
Beach Quality
Change
Economic Value* per
Person (US$)
Good to Poor (15m
loss)
-$95
Good to Fair (10m
loss)
-$51
Fair to Poor (5m
loss)
-$44
Maintain at Good
Quality (Access value
of the beach alone)
$105
*Negative sign represents a loss in value or consumer surplus.
Table 7 below presents the consumer welfare loss of the simulation model, showing a decline in
attribute quality per meter of beach loss. Per-meter loss was calculated based on the beach
quality thresholds, as a means to capture instances where beach loss did not result in a threshold
being crossed, although this was still significant. Due to the qualitative aspect of the model, these
assumptions of per-meter loss in consumer welfare are best estimates based on professional
judgment. The table reflects the annual loss of consumer welfare for the tenth year of the
degradation scenario. More details on the model simulation are provided in Appendix 4.
Current erosion at beaches is estimated to have grown to over US$19 million in loss of consumer
surplus in the tenth year of the scenario. Additional erosion caused by further reef degradation is
estimated to increase this loss to US$33 million by year 10. This represents an additional
US$13.5 million loss of consumer welfare if the reef degrades further—an annual increase of 70
percent from the base scenario. As seen in Table 7, the deterioration of reef has the greatest
impact on consumer welfare in Long Bay, Negril, which would lose an additional US$5.3 million
from the baseline scenario. Next, Ocho Rios would lose US$11.1 million in year 10 if its reef
degrades, compared to US$6.5 million if the reef remains unchanged. This represents an
additional US$4.6 million. Finally, Montego Bay is estimated to lose an additional US$3.6
million if its reef degrades further (increasing from US$7.1 to US$10.7 million).

29
Figure 5. Annual welfare loss (US$ millions): status quo vs. reef degradation scenario for Negril, Montego
Bay, and Ocho Rios
Table 7. Annual loss in consumer satisfaction (US$) at beaches due to coral reef degradation (after 10 years of
erosion)
Locatio
n
Current quality
rating
Future rating if
reef remains
unchanged
Loss in value
due to current
rates of beach
erosion($US)
Future rating
if reef erodes
further
Loss in
value if the
beach erodes
faster due to
reef
degradation
($US)
Difference
due to
further reef
degradation
($US)
Negril Good (14.6 m) Good (11.6 m) $5.5 million Fair (8.7 m) $10.9 million $5.3 million
Montego
Bay Good (18.6 m) Good (15.6 m) $7.0 million Good (14.1 m) $10.7 million $3.6 million
Ocho
Rios Excellent (25 m) Excellent (22 m) $6. 5 million Good (19.9 m) $11.1 million $4.6 million
Total: $19.2 million $32.7 million $13.5 million Note: The welfare loss was calculated using a per meter value of $5.11 per visitor, coupled with the average number
of overnight visitors a year for each site: Negril (360,927); Montego Bay (466,075); and Ocho Rios (425,026).
Figures may not total correctly due to rounding.
0.0
2.0
4.0
6.0
8.0
10.0
12.0
Negril Montego Bay Ocho Rios
$U
S m
illio
ns
Reef Degrades
Status Quo
30
Loss of Consumer Surplus and Resulting Economic Impacts
Beach degradation and the resultant decline in consumer welfare could reduce demand for Jamaica’s
tourism product, leading tourists to consider substitute destinations. Measuring this loss in demand
requires the identification of the elasticity of demandi for Jamaican tourists—the percent drop in tourism
associated with a 1 percent increase in price. While a study has not been identified that measures the
elasticity of demand specifically for Jamaican tourists, the impact can be roughly estimated based on
research from other Caribbean locations and more general tourist studies.
It is important to note, in reference to calculations made using price elasticity of demand, we have
assumed that a loss in consumer surplus is equivalent to an identical increase in the price of the vacation,
and used this assumption to predict changes in demand for tourism to Jamaica. The price elasticity of
demand may have some aspects of beach quality included, but there may be other dominating market
factors, such as air fare, food, and beverage costs. As a result, demand based on beach quality is different
from demand based on price, and changes in beach quality could then have a different effect on tourists’
decisions than a rise in prices. In other words, prices could go up quite a bit without having a large
impact on demand, but should the attribute degrade, demand would then be substantially impacted.
Accordingly, there may be some effect on demand from a loss in consumer surplus, but not necessarily a
direct correlation.
In a survey of studies on demand for international tourism, Crouch finds the average price elasticity of
demand to be between -0.6 and -0.8. Eilat and Einav’s 2004 study supports this range, finding an average
elasticity of -0.7 for a sampling of eleven countries. 39
40
For the Caribbean region, Tsounta41
finds that
price competition is an important factor for tourists choosing destinations, and that competitiveness is of
―paramount importance in attracting tourism flows.‖ Estimates of overall price elasticity of demand for
the Caribbean tend to be in line with the low end of the studies mentioned above: Craigwell and Worrell 42
found a price elasticity of demand to be -0.71 for fifteen Caribbean nations (including Jamaica), and
Gawande et al.,43
using changes in real exchange rates for the Caribbean area as a whole, estimate it to be
between -0.41 and -0.48. In looking only at demand for Aruban vacations from U.S. tourists, Croes and
Vanegas44
estimate long-run price elasticity of demand to be -0.22. As a whole, these studies provide
reasonable guidance that a percentage point increase in price (or, identically, decline in tourist welfare)
for Jamaica can be expected to reduce tourism by between one-quarter and one-half of a percent.45
This analysis finds an average per visitor loss in consumer welfare due to beach erosion associated with
coral degradation. In the case of Jamaica, coral degradation could result in loss of consumer welfare from
beach erosion averaging US$26.10 per vacation. According to the JTB (2009), there were 1.83 million
stopover tourists, and a total stopover expenditure of US$1.85 billion, or US$1,009 per person. We
assumed a conservative average airfare estimate of US$300, bringing the total vacation cost to US$1,300
per person. The loss of consumer welfare represents an effective price increase for the vacation as a
whole of 2.0 percent.32
The quality of the vacation experience will thus decrease as a result of beach loss,
while the actual price of the vacation remains unchanged.
Using the estimated elasticity figures of one-quarter and one-half of a percent, this leads to a decline in
tourism of 0.5 percent to 1.0 percent, representing a loss of between 9,200 and 18,400 stopover visitors
per year, costing the tourism industry between US$9 million and US$19 million. The loss to Jamaica as a
whole is amplified as the effects ripple through the economy. While income multipliers tend to be
i Price elasticity of demand (PED)-the percent drop in demand associated with a percent increase in price. A good or service is
considered relatively inelastic when PED is less than 1. Thus a change in price has relatively little effect on the quantity of a
good demanded.
31
relatively low for small-island economies like Jamaica, they are still positive, with each stopover tourist
dollar generating an estimated additional US$ 0.23 cents for the rest of the economy.46
The final loss to
the Jamaican economy from decreased tourism due to degraded beaches could thus range from US$11
million to as high as US$23 million, depending on the extent of erosion and the associated loss of
tourism.47
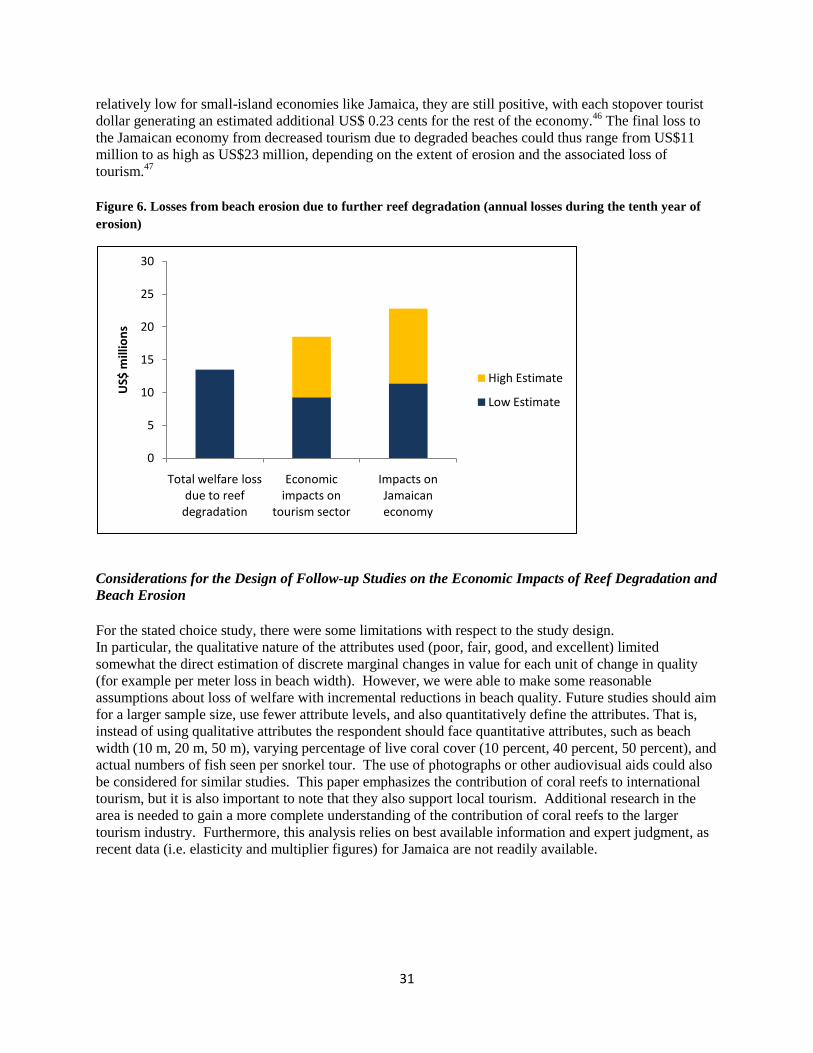
Figure 6. Losses from beach erosion due to further reef degradation (annual losses during the tenth year of
erosion)
Considerations for the Design of Follow-up Studies on the Economic Impacts of Reef Degradation and
Beach Erosion
For the stated choice study, there were some limitations with respect to the study design.
In particular, the qualitative nature of the attributes used (poor, fair, good, and excellent) limited
somewhat the direct estimation of discrete marginal changes in value for each unit of change in quality
(for example per meter loss in beach width). However, we were able to make some reasonable
assumptions about loss of welfare with incremental reductions in beach quality. Future studies should aim
for a larger sample size, use fewer attribute levels, and also quantitatively define the attributes. That is,
instead of using qualitative attributes the respondent should face quantitative attributes, such as beach
width (10 m, 20 m, 50 m), varying percentage of live coral cover (10 percent, 40 percent, 50 percent), and
actual numbers of fish seen per snorkel tour. The use of photographs or other audiovisual aids could also
be considered for similar studies. This paper emphasizes the contribution of coral reefs to international
tourism, but it is also important to note that they also support local tourism. Additional research in the
area is needed to gain a more complete understanding of the contribution of coral reefs to the larger
tourism industry. Furthermore, this analysis relies on best available information and expert judgment, as
recent data (i.e. elasticity and multiplier figures) for Jamaica are not readily available.
0
5
10
15
20
25
30
Total welfare loss due to reef
degradation
Economic impacts on
tourism sector
Impacts on Jamaican economy
US$
mill
ion
s
High Estimate
Low Estimate
32
Conclusions and Recommendations
This study models a link between reef degradation, wave energy, and beach erosion to assess the
economic impacts of beach erosion on tourism and the Jamaican economy. Loss of live coral and
subsequent erosion of reefs protecting major tourist beaches would significantly increase the rate of beach
erosion and result in an increased loss of consumer satisfaction amounting to US$13.5 million in the tenth
year of our scenario. This represents direct revenue losses of US$9 million to US$19 million per year to
the tourism industry and an annual loss of US$11 million to as high as US$23 million to the entire
Jamaican economy.
This study combines physical oceanography and coastal modeling with natural resource economics and
presents a scenario of the potential loss of ecosystem services and the corresponding loss in economic
benefits to Jamaica. This biophysical-economic approach is innovative and based on the valuation of
ecosystem services and the tangible benefits they provide to society. An analysis is presented that
incorporates reductions in tourists’ economic welfare as a result of decline in beach quality (width). This
reduced potential consumer surplus would have the likely result of reducing rates of tourist visitation to
the island of Jamaica, which in turn would result in the loss of crucial revenue for the tourism industry
and jobs for many Jamaicans.
Jamaican coastal tourism is dependent on the health of Jamaica’s coral reefs and is further enhanced by
the culture and history of the people of Jamaica.48
Jamaica’s coral reefs have suffered significant
mortality in recent decades as a result of many factors, including overfishing, pollution, and coastal
development. However, with adequate coastal and fisheries management it is highly likely that Jamaica’s
reefs could recover critically important and valuable ecosystem services that have positive impacts on
beaches. The recovery of these services would likely increase their economic contribution to Jamaica’s
tourism industry. This rise in value would, in turn, correspond to a reduction in coastal protection costs
and an increase in the value of coastal tourism.
Overfishing, coastal development, and runoff from the land are all major threats to the country’s reef
ecosystems.2 A number of well-intended but insufficient actions have already been taken to mitigate
these threats and their effects, including the passage of legislation, the creation of several marine
protected areas (―paper parks‖), and beach engineering. However, enforcement of laws protecting coastal
ecosystems (and including inside MPAs) has been weak thus far, due to in large part to a lack of financial
support for these activities. Furthermore, individual hotels are spending a lot of money on beach
engineering solutions such as beach nourishment and the construction of near-shore breakwaters. A study
by Smith-Warner estimated that beach nourishment efforts over 20 years in Negril would cost US$5.0–
$7.5 million, and an additional US$12.8–$16.0 million if breakwaters were also constructed.20
These
engineering solutions are expensive and—since they fail to address the root causes of beach erosion—will
need to be repeated in the future. Furthermore, beach engineering solutions may cause additional
environmental impacts, including the destruction of habitat, increased sedimentation, and the alteration of
hydrological processes.
The economic risks to the Jamaican tourism industry are large, as beach erosion due to reef degradation
will reduce visitor demand and the costs from beach engineering solutions will likely increase in the
future. According to the World Economic Forum’s Travel & Tourism Competitiveness 2011 rankings,
Jamaica now ranks 65th out of 139 countries (down from 60
th in 1990).
49 The report also highlights sub-
indices of uncompetitive performance by Jamaica, including ranking 110th for natural resources and 116
th
for environmental sustainability.49
Jamaica’s inability to protect its coral reefs and prevent beach erosion
will continue to put it at a competitive disadvantage.
33
The importance of coastal tourism’s continued contribution and potential future benefits to Jamaica’s
economy rests upon the ability of key stakeholders to protect coral reefs, focusing on managing coastal
development, reducing watershed-based pollution and sedimentation, and promoting sustainable fishing
(see Box 1). It is beyond the scope of this project to provide an exhaustive set of recommendations, as
this would require a more detailed examination of the institutional, legal, political, and economic factors
that drive conservation success and failure in Jamaica. Rather, we offer strategies to utilize our results in
ways that will promote reef conservation, including:
Build national political will for greater reef conservation. History demonstrates that conserving
ecosystems begins with widespread awareness of the benefits they provide and the political will
to act. In order to leverage these results, it is important to publicize and disseminate the key
findings of this paper to the Jamaican government, citizens, conservation groups, industry, and
development agencies.
Strengthen environmental policy. Policies that address the main drivers of coral reef degradation
(overfishing, coastal development and pollution) over short-term measures such as beach
nourishment must be developed. This includes strengthening existing policy opportunities, such
as the draft National Fisheries Policy, with language that makes the economic case for more
holistic conservation measures. Current laws—such as the Tourism Enhancement Fund, the
Natural Resources Conservation Act, and the Beach Control Act—must also be examined to
assess how well existing institutional mechanisms, norms, and regulations address local threats to
coral reefs.
Create new opportunities for long-term conservation funding. By quantifying the economic
losses likely to occur due to degradation of reefs, it is possible to tap public and private funding
for coastal management, gain access to new markets, initiate payments for ecosystem services,
and charge polluters for damages. There are numerous examples of economic analyses
successfully informing policy. For example, in the United States, the states of Hawaii and Florida
adopted legislation setting amounts for monetary penalties per square meter of damaged coral
reef, based on calculations from valuation studies. The Belize government used an economic
valuation study of its coral reefs as the premise to sue for damages after the container ship
Westerhaven ran aground on its reef in January 2009, resulting in the Belizean Supreme Court
ruling that the ship’s owners must pay the government US$6 million in damages. The Bonaire
National Marine Park, one of the world’s few self-financed marine parks, used economic
valuation to determine appropriate user fees. Finally, a hydropower company in Costa Rica,
Emergia Global, makes payments to a forest protection fund that pays landowners to restore tree
cover, reducing river siltation.50
To encourage new opportunities, such as those listed above, it is
critical that key stakeholders who use or impact reefs and beaches are targeted. Important
stakeholders include nonprofit conservation groups, hotels, tourism operators, academic
institutions such as the University of the West Indies, and the government of Jamaica, as well as
Caribbean regional decision-makers and governments. Key stakeholders must invest in solutions
to protect and restore the beaches and coral reefs that support Jamaican tourism over the long
term.
The results of this analysis are clear. Reefs provide Jamaica’s economy real economic benefits in their
role as buffers against beach erosion and as a foundation for the continued prosperity and vitality of the
tourism industry. Continued degradation of Jamaica’s reefs could result in destructive beach erosion
valued at tens of millions of dollars. Many other critically important and economically valuable
ecosystem services that reefs provide could also be lost, including tourism, shoreline protection, and
habitat for fisheries, resulting in losses of jobs, revenue, and increased erosion and property damage
34
during storms. The extent and severity of threats to reefs in Jamaica, in combination with the critically
important ecosystem services they provide, point to an urgent need for action. Jamaica’s reefs can
recover, but this will require effective management and protection. In order to promote reef protection, it
is crucial that development plans take full account of the economic value of reef-based ecosystem
services, environmental policy be strengthened, and new opportunities for long-term conservation funding
be secured by tapping key stakeholders with direct interests in the goods and services that reefs provide.
Box 2. Summary of Key Findings on Recommendations for Improving Ecosystem Management
of Coral Reefs
In 2010, the United Nations Environment Programme (UNEP) collaborated with the Planning Institute of
Jamaica to investigate the role of ecosystems in reducing human vulnerability to natural disasters.1 The
project brought together Jamaican stakeholders from the national to community levels to discuss
improved ecosystem management for reducing human vulnerability. The study recommends the
following actions:
Manage coastal development wisely:
Improve wastewater management. Improved management of waste and runoff from the hotel and construction industries would improve coastal water quality, benefiting both coral reefs and fish.
Protect mangroves. Mangroves serve as important fish habitats, and also act as buffers, preventing agricultural runoff from reaching coral reefs. The government should seek to protect remaining mangroves from clearance for beach and coastal development, particularly in sensitive areas.
Improve land-use planning and zoning. Reassessment of the government’s current setback regulations would establish a more adequate buffer zone between beaches and coastal infrastructure, protecting both coastal ecosystems and beachside hotels.
Reduce watershed-based sedimentation and pollution:
Promote improved agricultural techniques. Improved soil conservation (using terracing) and reduced use of chemicals would reduce flows of sediment and pollutants to coastal waters.
Retain and restore vegetation. Reforestation—using local species—would help reduce erosion, especially on steep slopes and in riparian areas.
Promote Sustainable Fishing:
Manage fisheries. Develop fisheries management plans that define specific restrictions and regulations, and increase the legal authority of officials to enforce fines.
Utilize Marine Protected Areas. Develop long-term funding for integrated management efforts, including the expansion of protected area networks and fish sanctuaries.
Reduce excessive fishing. Provide for alternative livelihoods of artisanal fishers and remove perverse fishing subsidies.
Est
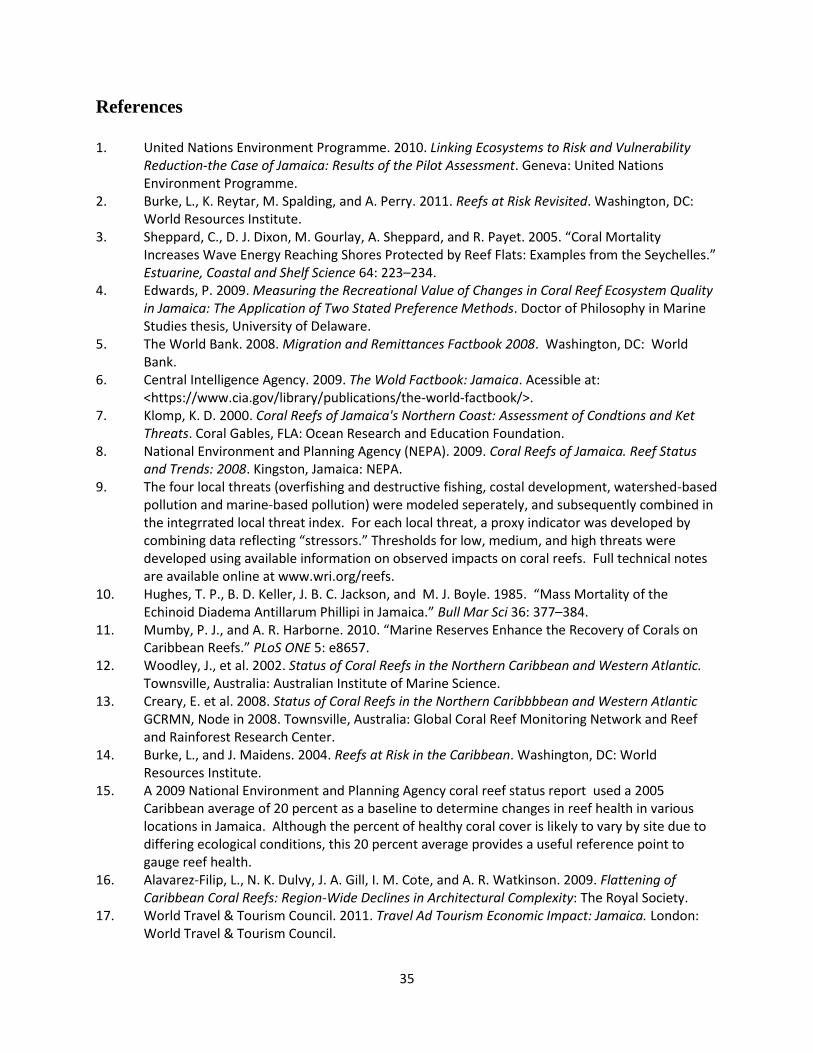
35
References
1. United Nations Environment Programme. 2010. Linking Ecosystems to Risk and Vulnerability
Reduction-the Case of Jamaica: Results of the Pilot Assessment. Geneva: United Nations Environment Programme.
2. Burke, L., K. Reytar, M. Spalding, and A. Perry. 2011. Reefs at Risk Revisited. Washington, DC: World Resources Institute.
3. Sheppard, C., D. J. Dixon, M. Gourlay, A. Sheppard, and R. Payet. 2005. “Coral Mortality Increases Wave Energy Reaching Shores Protected by Reef Flats: Examples from the Seychelles.” Estuarine, Coastal and Shelf Science 64: 223–234.
4. Edwards, P. 2009. Measuring the Recreational Value of Changes in Coral Reef Ecosystem Quality in Jamaica: The Application of Two Stated Preference Methods. Doctor of Philosophy in Marine Studies thesis, University of Delaware.
5. The World Bank. 2008. Migration and Remittances Factbook 2008. Washington, DC: World Bank.
6. Central Intelligence Agency. 2009. The Wold Factbook: Jamaica. Acessible at: <https://www.cia.gov/library/publications/the-world-factbook/>.
7. Klomp, K. D. 2000. Coral Reefs of Jamaica's Northern Coast: Assessment of Condtions and Ket Threats. Coral Gables, FLA: Ocean Research and Education Foundation.
8. National Environment and Planning Agency (NEPA). 2009. Coral Reefs of Jamaica. Reef Status and Trends: 2008. Kingston, Jamaica: NEPA.
9. The four local threats (overfishing and destructive fishing, costal development, watershed-based pollution and marine-based pollution) were modeled seperately, and subsequently combined in the integrrated local threat index. For each local threat, a proxy indicator was developed by combining data reflecting “stressors.” Thresholds for low, medium, and high threats were developed using available information on observed impacts on coral reefs. Full technical notes are available online at www.wri.org/reefs.
10. Hughes, T. P., B. D. Keller, J. B. C. Jackson, and M. J. Boyle. 1985. “Mass Mortality of the Echinoid Diadema Antillarum Phillipi in Jamaica.” Bull Mar Sci 36: 377–384.
11. Mumby, P. J., and A. R. Harborne. 2010. “Marine Reserves Enhance the Recovery of Corals on Caribbean Reefs.” PLoS ONE 5: e8657.
12. Woodley, J., et al. 2002. Status of Coral Reefs in the Northern Caribbean and Western Atlantic. Townsville, Australia: Australian Institute of Marine Science.
13. Creary, E. et al. 2008. Status of Coral Reefs in the Northern Caribbbbean and Western Atlantic GCRMN, Node in 2008. Townsville, Australia: Global Coral Reef Monitoring Network and Reef and Rainforest Research Center.
14. Burke, L., and J. Maidens. 2004. Reefs at Risk in the Caribbean. Washington, DC: World Resources Institute.
15. A 2009 National Environment and Planning Agency coral reef status report used a 2005 Caribbean average of 20 percent as a baseline to determine changes in reef health in various locations in Jamaica. Although the percent of healthy coral cover is likely to vary by site due to differing ecological conditions, this 20 percent average provides a useful reference point to gauge reef health.
16. Alavarez-Filip, L., N. K. Dulvy, J. A. Gill, I. M. Cote, and A. R. Watkinson. 2009. Flattening of Caribbean Coral Reefs: Region-Wide Declines in Architectural Complexity: The Royal Society.
17. World Travel & Tourism Council. 2011. Travel Ad Tourism Economic Impact: Jamaica. London: World Travel & Tourism Council.

36
18. Wielgus, J., E. Cooper, R. Torres, and L. Burke. 2010. Coastal Capital: Dominican Republic Case Studies on the Economic Value of Coastal Ecosystems in the Dominican Republic. Washington, DC: World Resources Institute.
19. Brander, R. W., P. Kench, and D. Hart. 2004. “Spatial and Temporal Variations in Wave Characteristics across a Reef Platform, Warraber Island, Torres Strait, Australia.” Marine Geology 207: 169–184.
20. Smith Warner International Limited. 2007. “Preliminary Engineering Report for Beach Restoration Works at Negril.” Smith Warner International Limited.
21. Khan, S., E. Robinson, R. Coutou, and M. Johnson. 2010. Shoreline Changes and Sea-Level Rise at Long Bay, Negril, Western Jamaica. Kingston, Jmaica: University of the West Indies, Marine Geology Unit, Dept. of Geography & Geology.
22. Mona GeoInformatics Institute, University of the West Indies. 2010. Economic Valuation of Coastal Ecosystems in Jamaica: Coastal Inundation Map Series. Kingston,Jamaica: Mona GeoInformatics Institute.
23. Mona GeoInformatics Institute, University of the West Indies. 2010. Evaluation of Reef Resources: 2d Profiles for Negril, Montego Bay and Ocho Rios. Kingston, Jamaica: Mona GeoInformatics Institute.
24. Negril Coral Reef Preservation Society. 2011. Negril Marine Park. Accessible at: <http://negril.com/ncrps/?page_id=10>.
25. The proportional increase in net offshore transport of sand from a beach (erosion) is assumed to be roughly equivalent to the proportional increase in wave height to the 2.5 power. This relationship was used to study the effects of increasing wave height (obtained from the Sheppard model) on beach erosion.
26. Danish Hydraulic Institute. 2010. Modelling the World of Water: Mike by Dhi Software. Accessible at: <http://mikebydhi.com/> .
27. Polly, Thomas, and A. Vaitlingam. 2007. The Rough Guide to Jamaica. 4th Ed. New York: Rough Guides.
28. Desai, K. 2011. (ed Benjamin Kushner) (Washington, DC, 2011). 29. Bunce, L., K. Gustavson, J. Williams, and M. Miller. 1999. “The Human Side of Reef Management:
A Case Study Analysis of the Socioeconomic Framework of Montego Bay Marine Park.” Coral Reefs 18(4): 369-380.
30. Environmental Management Unit. 2001. Socio-Economic Valuation Study of the Ocho Rios Marine Park. Kingston, Jamaica: Department of Geology and Geography, University of the West Indies, Mona.
31. This designation of Ocho Rios Marine Park as a "paper park" is derived from Burke et al. (2011), which rates this park as “ineffective,” meaning that the site is unmanaged, or management is insufficient to reduce in situ threats in any meaningful way.
32. Jamaica Tourism Board. 2009. Annual Travel Statistics 2009. Kingston, Jamaica: Jamaica Tourism Board.
33. International Monetary Fund. 2011. Country-specific notes: Jamaica. Washington, DC: International Monetary Fund.
34. Jamaica Tourism Board. 2006. Annual Travel Statistics 2006. Kingston, Jamaica: Jamaica Tourism Board.
35. Jamaica Tourism Board. 2007. Visitor Opinion Survey: Jan-March & Sept-Dec 2007. Kingston, Jamaica: Jamaica Tourism Board.
36. For a more detailed summary of how Edwards’ (2009) research was conceived and conducted, please refer to case study #2 in the Coastal Capital Literature Review: Economic Valuation of

37
Coastal and Marine Resources in Jamaica, available online at <http://www.wri.org/coastal-capital>.
37. This analysis focuses on the quantitative bounds for beach width, and not sand quality, as the latter is more difficult to define. Additionally, net erosion suggets a deficit in sand budget, including finer grain size. The assumption is being made that a reduction in width (sand quantity) would likely occur simultaneusly with a reduction in sand quality. Beach width is therefore a proxy for sand quality as well.
38. Because of the underlying economic assumptions used in this analysis, the estimated beach component should not be considered to be a percentage of the overall access value.
39. Crouch, G. I. 1995. “Price Elasticities in International Tourism.” Journal of Hospitality and Tourism Research 17: 27–39.
40. Eilat, Y., and L. Einav. 2004. “Determinants of International Tourism: A Three-Dimensional Panel Data Analysis.” Applied Economics 36: 1315–1327.
41. Tsounta, E. 2008. What Attracts Tourists to Paradise? Washington, DC: International Monetary Fund.
42. Craigwell, R., and DeLise Worrell. 2008. The Competitiveness of Selected Caribbean Tourism Markets. Social and Economic Studies 57(1):72-107.
43. Gawande, K., W. Maloney, and G. Montes-Rojas. 2009. “Foreign Informational Lobbying Can Enhance Tourism: Evidence from the Caribbean.” Journal of Development Economics 90: 267–275.
44. Croes, R. R., and M. Vanegas Sr. 2005. “An Econometric Study of Tourist Arrivals in Aruba and Its Implications.” Tourism Management 26: 879–890.
45. The results of our literature review of price elasticity of demand for international tourism showed a variety of values, ranging from relatively high (global studies) to relatively low (Caribbean studies). Drawing on these studies and based on professional judgment, we estimate a price elasticity of demand for international tourists to Jamaica of between 1/4 to 1/2 of a percent.
46. Doswel, R. 1997. Tourism-How Effective Management Makes the Difference. Woburn, MA: Butterworth-Heinemann.
47. These values are based on the best available information for a tourist income multiplier in Jamaica. However, the World Travel and Tourism Council provides much larger estimates for the contribution of tourism to the wider economy, suggesting that this value may be much higher.
48. Edwards, P. 2010. No To Tourism Tax, Yes To Environmental Tax. The Gleaner, Dec 19, 2010. Acessible at: <http://jamaica-gleaner.com/gleaner/20101219/lead/lead8.html>
49. Blanke, J., and C. Thiea. 2011. The Travel & Tourism Competitiveness Report 2011: Beyond the Downturn. Geneva: The World Economic Forum.
50. Hanson, C., J. Talberth, and L. Yonavjak. 2011. Forest for Water: Exploring Payments for Watershed Services in the U.S. South. Washington, DC: World Resources Institute.

38
Appendix 1. Reef Profiles for Negril, Montego Bay, and Ocho Rios from the University of the West Indies,
Mona GeoInformatics Institute (MGI)
Negril
Figure 1. Reef Profile for Long Bay, Negril (based on a 3000 m transect)
-200
-180
-160
-140
-120
-100
-80
-60
-40
-20
0
0 500 1,000 1,500 2,000 2,500 3,000 3,500
Distance (m)
Dep
th (m
)
Transect A

39
Figure 2. Reef Profile for Long Bay, Negril (based on a 2000 m transect)
-40
-35
-30
-25
-20
-15
-10
-5
0
5
10
0 500 1,000 1,500 2,000
Distance (m)
Dep
th (m
)
Transect A

40
Montego Bay
Figure 3. Reef Profile for Montego Bay (based on a 1,500 m transect)
-240
-220
-200
-180
-160
-140
-120
-100
-80
-60
-40
-20
0
20
0 500 1,000 1,500
Distance (m)
Dep
th (m
)
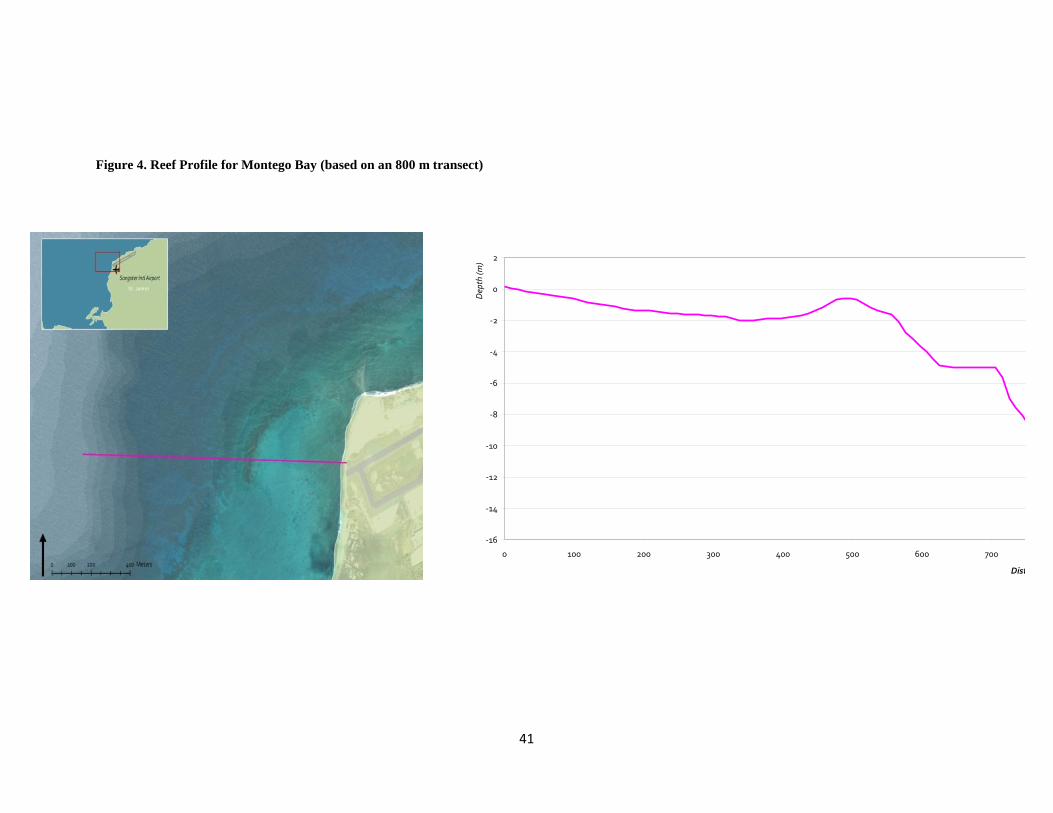
41
Figure 4. Reef Profile for Montego Bay (based on an 800 m transect)
-16
-14
-12
-10
-8
-6
-4
-2
0
2
0 100 200 300 400 500 600 700 800
Distance (m)
Dep
th (m
)

42
Ocho Rios
Figure 5. Reef Profile for Ocho Rios (based on a 2000 m transect)
Transect A:
-200
-180
-160
-140
-120
-100
-80
-60
-40
-20
0
20
0 500 1,000 1,500 2,000
Distance (m)
Dep
th (m
)

43
Figure 6. Reef Profile for Ocho Rios (based on a 1,200 m transect (transect A))
-10
-8
-6
-4
-2
0
2
0 200 400 600 800 1,000 1,200
Distance (m)
Dep
th (m
)

44
Figure 7. Reef Profile for Ocho Rios (based on a 2000 m transect (transect B))
-200
-180
-160
-140
-120
-100
-80
-60
-40
-20
0
20
0 500 1,000 1,500 2,000
Distance (m)
Dep
th (m
)
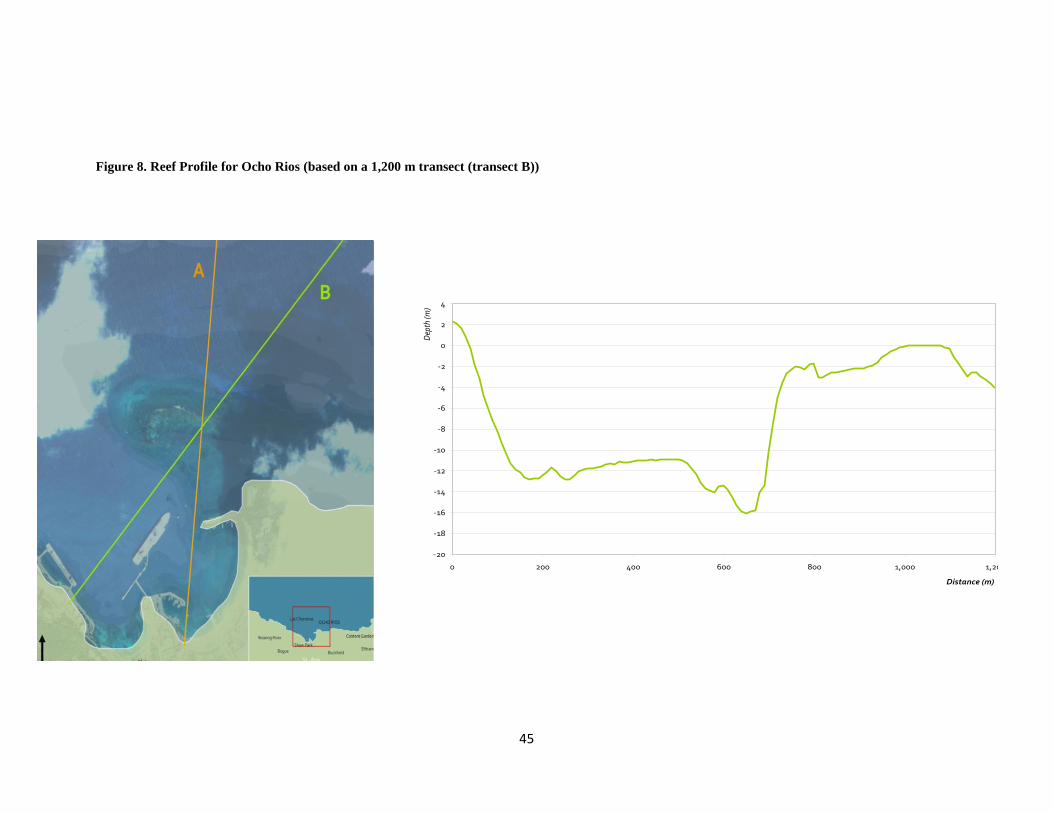
45
Figure 8. Reef Profile for Ocho Rios (based on a 1,200 m transect (transect B))
-20
-18
-16
-14
-12
-10
-8
-6
-4
-2
0
2
4
0 200 400 600 800 1,000 1,200
Distance (m)
Dep
th (m
)

46
Appendix 2. Summary of Results, Data Sources, and Input Values used in the
Application of the Sheppard Model in Negril, Montego Bay, and Ocho Rios
The Excel spreadsheet model requires information for the following parameters (see Sheppard et al. 2005
for details):
1) slope of the edge of the reef where the waves break (reef face);
2) depth of the reef edge (he/ha);
3) average depth of the reef (multiple points) (hr);
4) average width of the reef from the edge to the beach (W);
5) slope of the beach;
6) root mean square (RMS) of offshore wave height (Hoff);
7) mean offshore wave period (T); and
8) the coefficient of bottom friction of the reef flat (Fw).
Diagram of reef structure used in model
Reef flat
Reef edge
Shore
Reef face
47
Table 1. Summary of results of Sheppard Model: Negril, Montego Bay, and Ocho Rios
Inputs
Long
Bay_Negril
Montego
Bay
Ocho
Rios Comments:
Kp (reef
profile)
.60 .67 .67
The angle of the slope of the reef face is used to look
up the Kp value in the Sheppard chart (2005). This
was determined using MGI reef profiles. An angle
of the slope of 30° was used for Negril and 20° for
Ocho Rios and Montego Bay.
Tangent of the
angle of the
reef (tan alpha
reef)
.36 .58 .58 This is the tangent of angle of the reef slope.
Hoff (RMS of
offshore wave
height)
1.2 1.2 1.2
Root Mean Square (RMS) estimates of significant
wave height (the mean of the highest 1/3 of waves)
for the Caribbean were found in Calverley et al.
(2001). Significant wave height (SWH) was
converted to RMS wave height by using the equation
SWH = 1.4•RMS (Gourlay 1997). An offshore wave
height of 1.7 was used.
T (offshore
wave period
seconds)
5.2 5.2 5.2 RMS estimates of significant offshore wave period
was used from Calverley et al. (2001).
hr (reef flat
depth in m) 2 2 2 This was determined using MGI reef profiles.
he/ha (depth of
reef edge/avg
reef rim depth
in m)
7 .5 0 This was determined using MGI reef profiles.
nr (initial wave
setup)
.2 .2 .2
This variable was extracted from Wielgus et
al.(2010), based on the authors’ application of the
Sheppard model to the Dominican Republic.
nw
(meterological
surge)
0 0 0 From Wielgus et al.(2010)
Tangent of the
angle of the
beach slope
.11 .11 .11 For Negril, this was determined using a 6° beach
slope, taking beach slope data from MGU (2008).
W ( distance
reef is offshore
in m)
1400 500 1000 This was determined using MGI reef profiles.
dx (increment
wave height
decay
calculation)
10 10 10 From Wielgus et al.(2010)
Percent of live
coral cover
15% 7-10% 7-10%
Comes from 2007 Reef Check assessment in NEPA
(2008) and from expert judgment through
MGU/MGI.
Fw (frictional
coefficient) .14 .13 .13
The average percent of coral cover is used to look up
the Fw value in the Sheppard chart.

48
Table 2. Model results predicting the impact of reef degradation (indicated by increasing wave height over
the reef) on beach erosion for Long Bay, Negril (assumes a dead reef erodes 0.3 m/yr)
Long Bay, Negril
Wave height (m)
Ho is the initial
wave height with
the reef intact, and
H is the wave
height for each
period after all
corals die
% increase
in wave
height
% increase in erosion
relative to current
100*1
5.2
oH
H
Beach loss (in
meters)
(This erosion
rate includes
the current
(base) erosion
rate of 0.3
m/yr)
Current (live coral
cover = 15%) Ho =.159 - - -
No live coral
(bottom friction is
reduced)
H=.207 30.19 94.00 -
Year 1 (erosion of
the reef substrate
begins)
H=.208 30.82 95.73 0.59
Year 2 H=.209 31.45 98.09 0.59
Year 3 H=.210 32.08 100.47 0.60
Year 4 H=.211 32.70 102.87 0.61
Year 5 H=.212 33.33 105.28 0.62
Year 6 H=.213 33.96 107.71 0.62
Year 7 H=.214 34.59 110.16 0.63
Year 8 H=.215 35.22 112.62 0.64
Year 9 H=.216 35.85 115.10 0.65
Year 10 H=.217 36.48 117.60 0.65
Sum 6.20
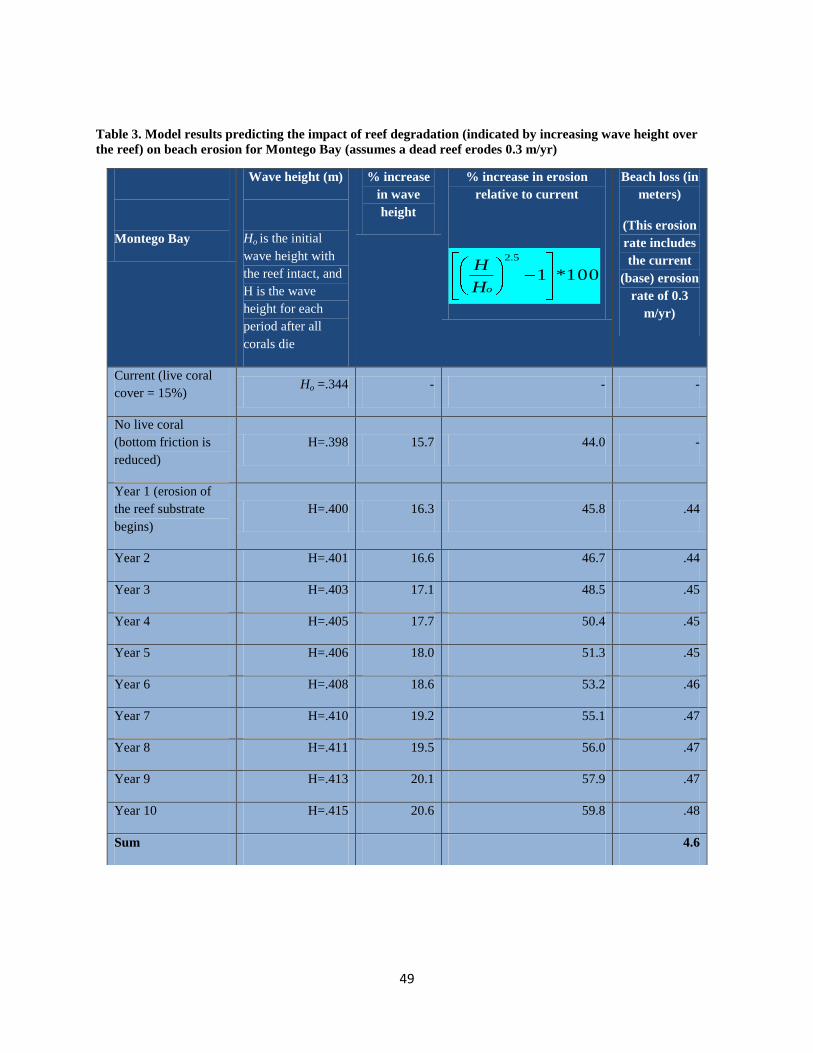
49
Table 3. Model results predicting the impact of reef degradation (indicated by increasing wave height over
the reef) on beach erosion for Montego Bay (assumes a dead reef erodes 0.3 m/yr)
Montego Bay
Wave height (m)
Ho is the initial
wave height with
the reef intact, and
H is the wave
height for each
period after all
corals die
% increase
in wave
height
% increase in erosion
relative to current
100*1
5.2
oH
H
Beach loss (in
meters)
(This erosion
rate includes
the current
(base) erosion
rate of 0.3
m/yr)
Current (live coral
cover = 15%) Ho =.344 - - -
No live coral
(bottom friction is
reduced)
H=.398 15.7 44.0 -
Year 1 (erosion of
the reef substrate
begins)
H=.400 16.3 45.8 .44
Year 2 H=.401 16.6 46.7 .44
Year 3 H=.403 17.1 48.5 .45
Year 4 H=.405 17.7 50.4 .45
Year 5 H=.406 18.0 51.3 .45
Year 6 H=.408 18.6 53.2 .46
Year 7 H=.410 19.2 55.1 .47
Year 8 H=.411 19.5 56.0 .47
Year 9 H=.413 20.1 57.9 .47
Year 10 H=.415 20.6 59.8 .48
Sum 4.6

50
Table 4. Model results predicting the impact of reef degradation (indicated by increasing wave height over
the reef) on beach erosion for Ocho Rios (assumes a dead reef erodes 0.3 m/yr)
Ocho Rios
Wave height (m)
Ho is the initial
wave height with
the reef intact, and
H is the wave
height for each
period after all
corals die
% increase
in wave
height
% increase in erosion
relative to current
100*1
5.2
oH
H
Beach loss (in
meters)
(This erosion
rate includes
the current
(base) erosion
rate of 0.3
,m/yr)
Current (live coral
cover = 15%) Ho =.219 - - -
No live coral
(bottom friction is
reduced)
H=.264 20.5 59.5 -
Year 1 (erosion of
the reef substrate
begins)
H=.265
21.0 61.1 0.48
Year 2 H=.266 21.5 62.6 0.49
Year 3 H=.267 21.9 64.1 0.49
Year 4 H=.268 22.4 65.7 0.50
Year 5 H=.270 23.3 68.8 0.51
Year 6 H=.271 23.7 70.3 0.51
Year 7 H=.272 24.2 71.9 0.52
Year 8 H=.273 24.7 73.5 0.52
Year 9 H=.275 25.6 76.7 0.53
Year 10 H=.276 26.0 78.3 0.53
Sum 5.1

51
Appendix 3. Visitor Interest Survey 2007 (JTB 2006)
Jan–Mar
2007*
Apr–Dec
2007*
Average for 2007
very
interested
very
interested
very
interested
somewhat
interested
not very
interested
% % % % %
How interested were
you in visiting nature
areas
35 38 36.5 33.5 29.5
How interested were
you in guided tours
23 28 25.5 35.5 39
How interested were
you in shopping
29 30 29.5 37.5 34
How interested were
you in dining out
49 47 48 31 21.5
How interested were
you in beaches
81 76 78.5 13.5 8.5
How interested were
you in water sports
39 41 40 33 27
How interested were
you in nightlife
activities
34 33 33.5 37.5 30
How interested were
you in other activities
54 44 49 17 34
Note: The yellow highlight represents the value used in our estimate to determine what percent of tourists care
strongly about the presence of beaches in their visits to Jamaica. For brevity, only the 6th
month breakdown of
results was shown for ―very interested.‖ For a breakdown of all categories by 6-month period, see JTB 2008a.
52
Appendix 4. Choice Experiments and Simulation of Consumer Welfare
Use of Choice Experiment Approaches in Ecosystem Services Valuation
Choice modeling (CM) techniques include choice experiments (CE), contingent ranking, contingent
rating, and paired comparisons. Choice experiments are based on the theory that individuals derive their
utility (well being or satisfaction) from the combination of characteristics that make up a given good
(including environmental goods and services), not only from the consumption of the good itself. Survey
response data from CM techniques can provide information to researchers for estimating components of
respondents’ utility and the economic values they hold for those components.
Choice models predict how individuals would react in a particular situation. Unlike a poll or a survey, the
tool allows predictions to be made over a very large number of scenarios. Choice modeling is highly
regarded as a reliable, general purpose tool for making probabilistic predictions about human decision-
making behavior. In addition, choice modeling is regarded as the most suitable method for estimating
consumers’ willingness to pay for quality improvements in multiple dimensions (multiple attributes).
In general, it is assumed that individuals maximize their utility, meaning that, when presented with two
options with differing characteristics or ―attributes,‖ they will choose the option that will yield the highest
level of satisfaction given certain constraints such as income, leisure time, etc. If a good (such as an
environmental restoration program) can be described in terms of its attributes (such as acres of marsh
restored in a restoration program, or number of corals re-planted in a reef restoration program), then
changing those levels (such as restoring 5 vs. 10 acres of marsh) will result in a different ―good‖ being
produced.
Choice experiments tend to focus on the value of changes in the individual attributes and are therefore
particularly useful in the context of policy analysis because they allow for the identification of the
following:
Attributes that are significant determinants of the values for non-market goods
Implied ranking of these attributes
Value of simultaneously changing more than one attribute
Economic value of a resource, good, or service.
Results from stated choice experiments can be used to guide policy and inform the best use of the public’s
resources for managing and restoring natural resources.
There are five general design stages for choice experiments as outlined by Bateman et al. (2002). The
table below describes these stages.
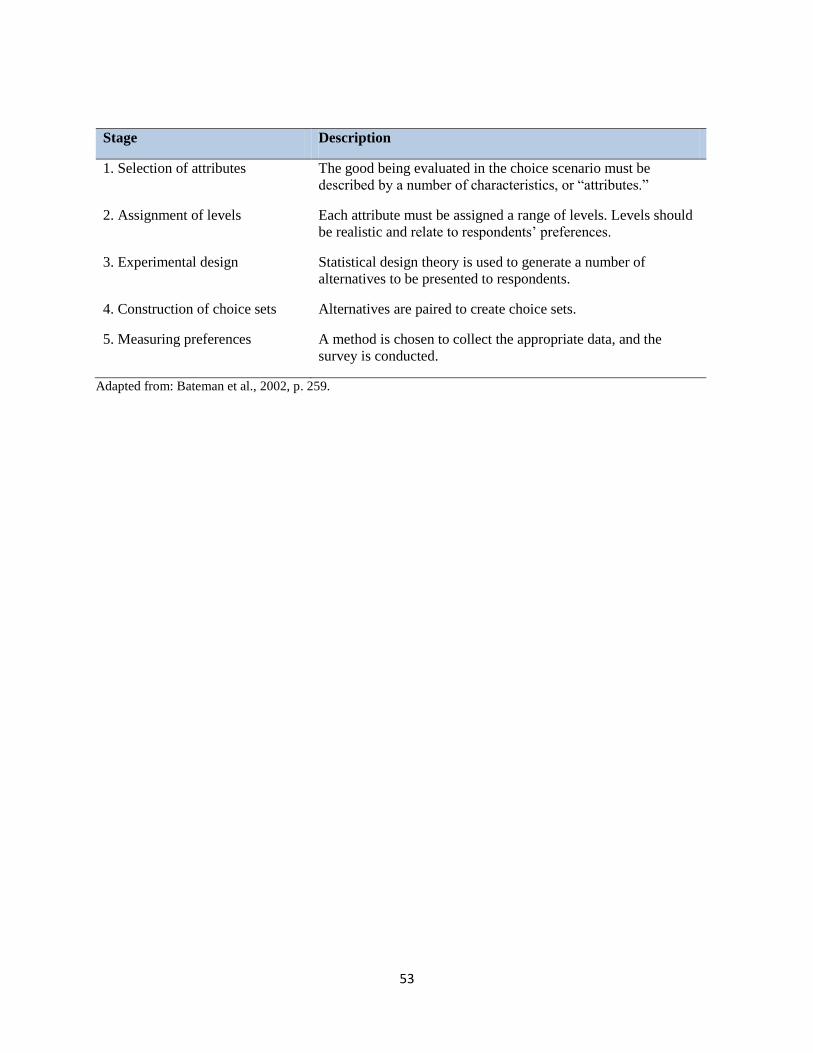
53
Stage Description
1. Selection of attributes The good being evaluated in the choice scenario must be
described by a number of characteristics, or ―attributes.‖
2. Assignment of levels Each attribute must be assigned a range of levels. Levels should
be realistic and relate to respondents’ preferences.
3. Experimental design Statistical design theory is used to generate a number of
alternatives to be presented to respondents.
4. Construction of choice sets Alternatives are paired to create choice sets.
5. Measuring preferences A method is chosen to collect the appropriate data, and the
survey is conducted.
Adapted from: Bateman et al., 2002, p. 259.

54
Appendix 5. Welfare Simulation
(Edwards, 2009)
Simulations for possible scenarios of changes in beach attribute quality were conducted based on the
parameter estimated derived from the following econometric model.
Where utility Ui = UB, UL, or UA (basic, low and advanced management) and UN (no trip) = 0. β1 is the
coefficient on the environmental surcharge (fee), while β 2 through to β 5 are coefficients that correspond
to the different levels of attribute quality for each alternative. εi represents the error terms of the four
options.
The quality attributes for the status quo remained the same while for the policy scenarios, the beach
quality attributes were made to decline by various levels (from good to fair or good to poor), while all
other attributes were held at the status quo. The surcharge (fee) remained fixed at $10 for all scenarios.
Welfare Calculation
The simulations are based on the aforementioned qualitative ratings of attribute quality (i.e. 0 =
poor, 1 = fair, 2 = good, 3= excellent). This requires the simulation of a mean compensating variation,
which refers to the amount of additional money an individual would need to reach his/her initial utility
(feeling of well being) for, in this example, a decline in attribute quality, which takes the following form:
The beta’s are the same as the previous equation. The first term in brackets describes the given change in
environmental quality (future scenario). In our simulation all other attributes are held to the status quo,
while the beach attribute is changed. The second term describes the status quo (i.e. good beach and good
water clarity and fair reef and fish).
It should be noted in the equation above, that the status quo ratings for the attributes are beach = 2, water
= 2, reef = 1, and fish =1. The model was estimated using LIMDEP© econometric software.
Potential levels of quality change in Jamaican coastal ecosystems (from Edwards, 2009)
Attribute Levels of environmental quality
Poor Fair Good
Excellent
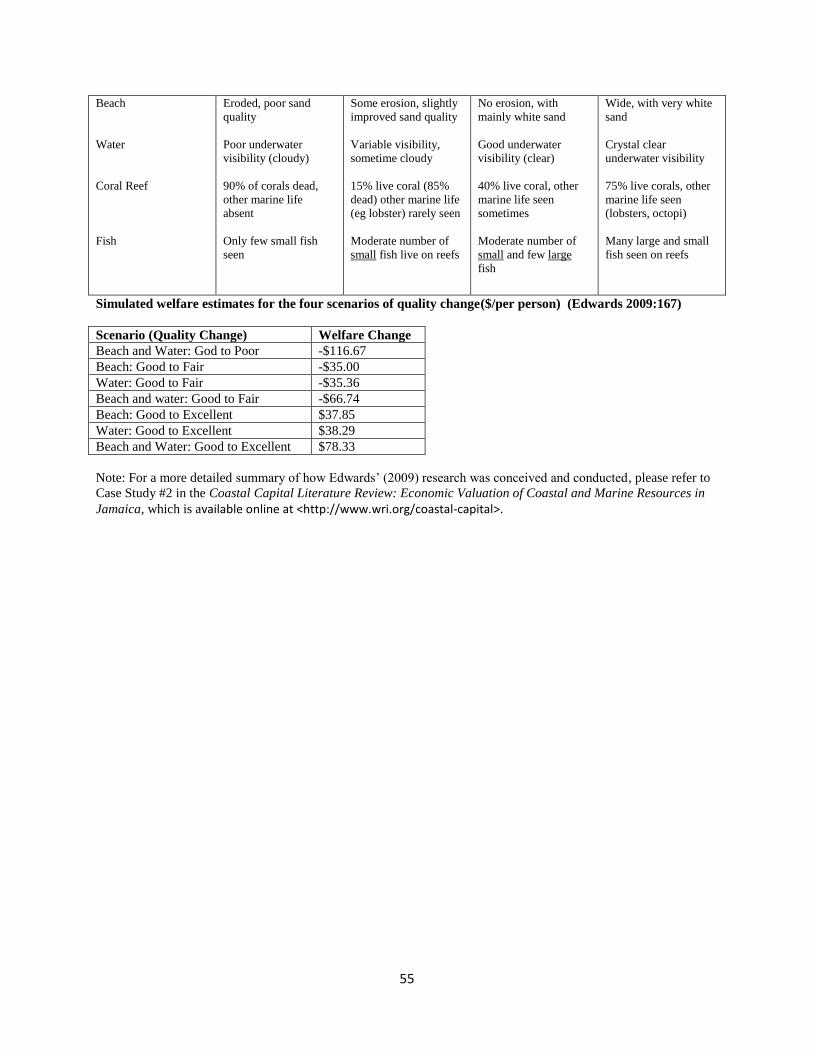
55
Beach
Water
Coral Reef
Fish
Eroded, poor sand
quality
Poor underwater
visibility (cloudy)
90% of corals dead,
other marine life
absent
Only few small fish
seen
Some erosion, slightly
improved sand quality
Variable visibility,
sometime cloudy
15% live coral (85%
dead) other marine life
(eg lobster) rarely seen
Moderate number of
small fish live on reefs
No erosion, with
mainly white sand
Good underwater
visibility (clear)
40% live coral, other
marine life seen
sometimes
Moderate number of
small and few large
fish
Wide, with very white
sand
Crystal clear
underwater visibility
75% live corals, other
marine life seen
(lobsters, octopi)
Many large and small
fish seen on reefs
Simulated welfare estimates for the four scenarios of quality change($/per person) (Edwards 2009:167)
Scenario (Quality Change) Welfare Change
Beach and Water: God to Poor -$116.67
Beach: Good to Fair -$35.00
Water: Good to Fair -$35.36
Beach and water: Good to Fair -$66.74
Beach: Good to Excellent $37.85
Water: Good to Excellent $38.29
Beach and Water: Good to Excellent $78.33
Note: For a more detailed summary of how Edwards’ (2009) research was conceived and conducted, please refer to
Case Study #2 in the Coastal Capital Literature Review: Economic Valuation of Coastal and Marine Resources in
Jamaica, which is available online at <http://www.wri.org/coastal-capital>.

56
ABOUT THE AUTHORS
Benjamin Kushner is a Research Analyst in the People and Ecosystems Program at WRI.
Contact: [email protected].
Peter Edwards is a Natural Resource Economist at NOAA Fisheries.
Contact: [email protected].
Lauretta Burke is a Senior Associate in the People and Ecosystems Program at WRI.
Contact: [email protected].
Emily Cooper is a consultant for Environmental Resources Management (ERM).
Contact: [email protected]
ABOUT WRI
The World Resources Institute is a global environmental think tank that goes beyond research to
put ideas into action. WRI spurs progress by providing practical strategies for change and
effective tools to implement them. Our mission is to move human society to live in ways that
protect Earth’s environment and its capacity to provide for the needs and aspirations of current
and future generations.
Copyright 2011 World Resources Institute.
This work is licensed under the Creative Commons Attribution-NonCommercial-NoDerivative Works 3.0 License.
To view a copy of the license, visit http://creativecommons.org/licenses/by-nc-nd/3.0/
Related Documents