COAL MARKETING IN SOUTH AFRICA: THE INTRICASIES OF PRODUCT, DISTRIBUTION, PRICE AND PROMOTION IN DOMESTIC AND EXPORT MARKETS Melanie Steyn Master of Science in Engineering by advanced coursework and research: A research report submitted to the Faculty of Engineering and the Built Environment, University of the Witwatersrand, Johannesburg, in partial fulfillment of the requirements for the degree of Master of Science in Engineering Johannesburg, 2009

Welcome message from author
This document is posted to help you gain knowledge. Please leave a comment to let me know what you think about it! Share it to your friends and learn new things together.
Transcript
COAL MARKETING IN SOUTH AFRICA:
THE INTRICASIES OF PRODUCT, DISTRIBUTION, PRICE AND
PROMOTION IN DOMESTIC AND EXPORT MARKETS
Melanie Steyn
Master of Science in Engineering by advanced coursework and
research:
A research report submitted to the Faculty of Engineering and the
Built Environment, University of the Witwatersrand,
Johannesburg, in partial fulfillment of the requirements for the
degree of Master of Science in Engineering
Johannesburg, 2009
2
CONTENTS Page
DECLARATION 9
ABSTRACT 10
ACKNOWLEDGEMENTS 12
3
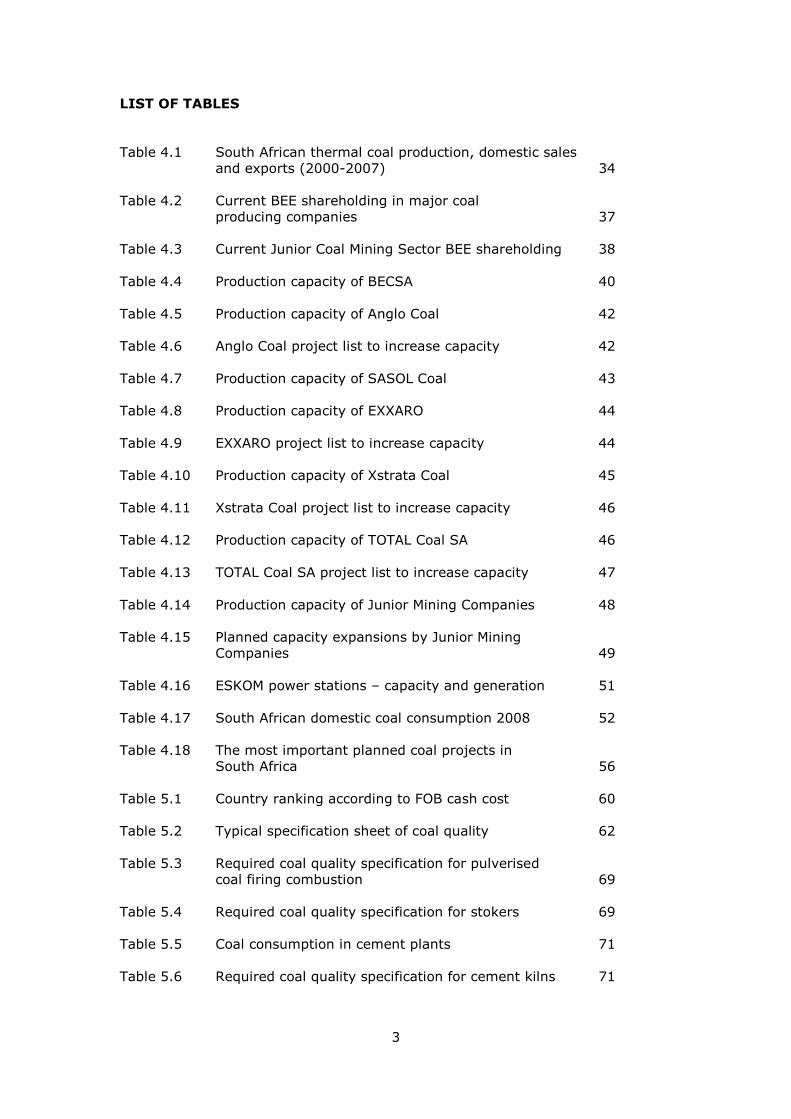
LIST OF TABLES
Table 4.1 South African thermal coal production, domestic sales and exports (2000-2007) 34 Table 4.2 Current BEE shareholding in major coal
producing companies 37
Table 4.3 Current Junior Coal Mining Sector BEE shareholding 38 Table 4.4 Production capacity of BECSA 40 Table 4.5 Production capacity of Anglo Coal 42 Table 4.6 Anglo Coal project list to increase capacity 42 Table 4.7 Production capacity of SASOL Coal 43 Table 4.8 Production capacity of EXXARO 44 Table 4.9 EXXARO project list to increase capacity 44 Table 4.10 Production capacity of Xstrata Coal 45 Table 4.11 Xstrata Coal project list to increase capacity 46 Table 4.12 Production capacity of TOTAL Coal SA 46 Table 4.13 TOTAL Coal SA project list to increase capacity 47 Table 4.14 Production capacity of Junior Mining Companies 48 Table 4.15 Planned capacity expansions by Junior Mining
Companies 49
Table 4.16 ESKOM power stations – capacity and generation 51 Table 4.17 South African domestic coal consumption 2008 52 Table 4.18 The most important planned coal projects in
South Africa 56 Table 5.1 Country ranking according to FOB cash cost 60 Table 5.2 Typical specification sheet of coal quality 62 Table 5.3 Required coal quality specification for pulverised
coal firing combustion 69
Table 5.4 Required coal quality specification for stokers 69 Table 5.5 Coal consumption in cement plants 71 Table 5.6 Required coal quality specification for cement kilns 71
4
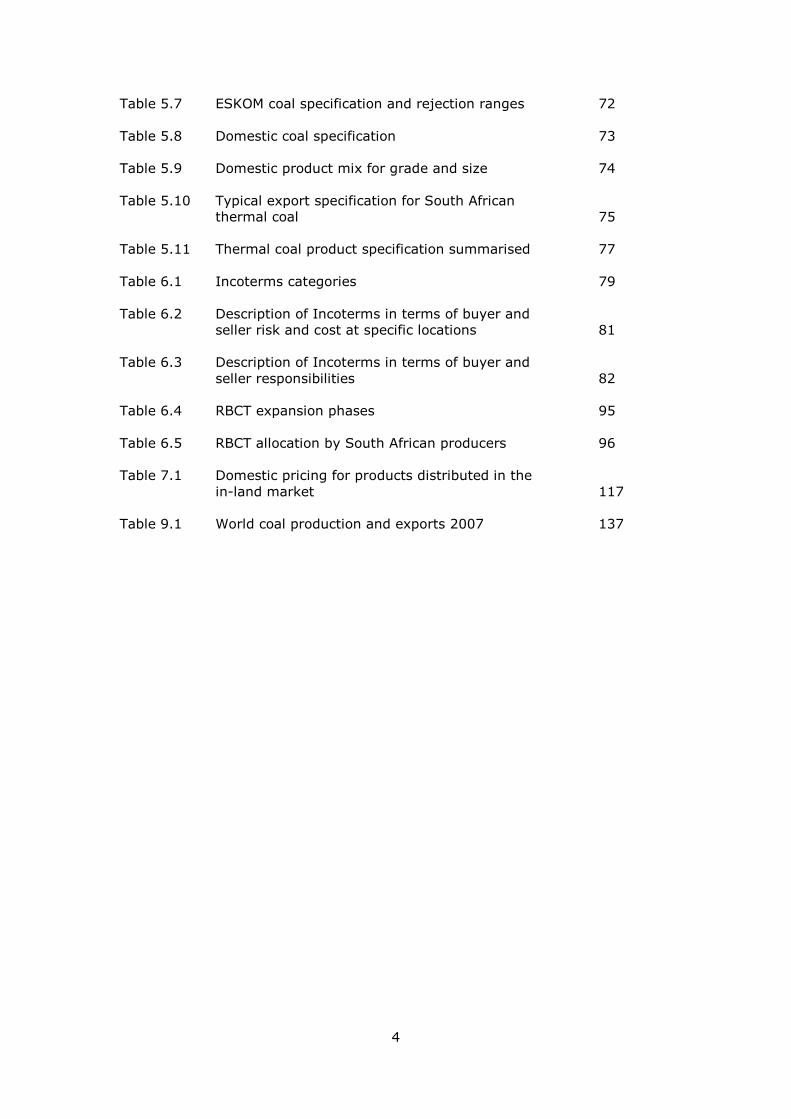
Table 5.7 ESKOM coal specification and rejection ranges 72 Table 5.8 Domestic coal specification 73 Table 5.9 Domestic product mix for grade and size 74 Table 5.10 Typical export specification for South African
thermal coal 75
Table 5.11 Thermal coal product specification summarised 77 Table 6.1 Incoterms categories 79 Table 6.2 Description of Incoterms in terms of buyer and
seller risk and cost at specific locations 81
Table 6.3 Description of Incoterms in terms of buyer and seller responsibilities 82
Table 6.4 RBCT expansion phases 95 Table 6.5 RBCT allocation by South African producers 96 Table 7.1 Domestic pricing for products distributed in the
in-land market 117 Table 9.1 World coal production and exports 2007 137
5
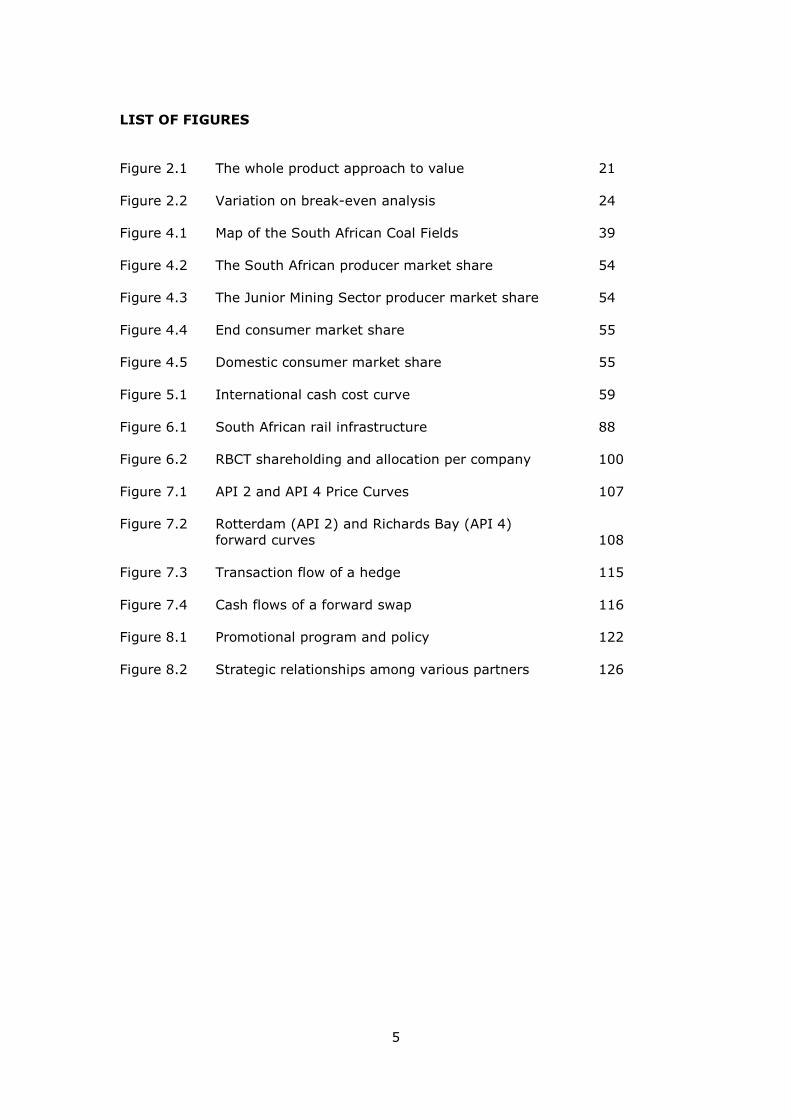
LIST OF FIGURES
Figure 2.1 The whole product approach to value 21 Figure 2.2 Variation on break-even analysis 24 Figure 4.1 Map of the South African Coal Fields 39 Figure 4.2 The South African producer market share 54 Figure 4.3 The Junior Mining Sector producer market share 54 Figure 4.4 End consumer market share 55 Figure 4.5 Domestic consumer market share 55 Figure 5.1 International cash cost curve 59 Figure 6.1 South African rail infrastructure 88 Figure 6.2 RBCT shareholding and allocation per company 100 Figure 7.1 API 2 and API 4 Price Curves 107 Figure 7.2 Rotterdam (API 2) and Richards Bay (API 4)
forward curves 108
Figure 7.3 Transaction flow of a hedge 115 Figure 7.4 Cash flows of a forward swap 116 Figure 8.1 Promotional program and policy 122 Figure 8.2 Strategic relationships among various partners 126
6
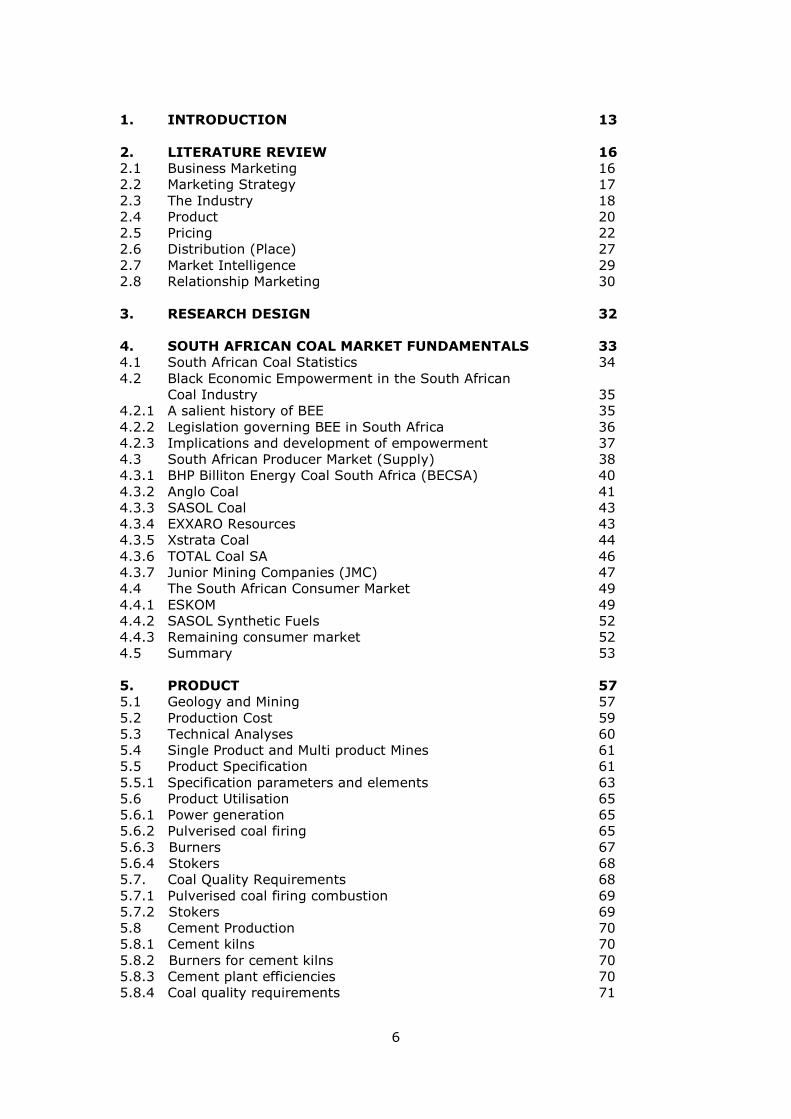
1. INTRODUCTION 13
2. LITERATURE REVIEW 16 2.1 Business Marketing 16 2.2 Marketing Strategy 17 2.3 The Industry 18 2.4 Product 20 2.5 Pricing 22 2.6 Distribution (Place) 27 2.7 Market Intelligence 29 2.8 Relationship Marketing 30 3. RESEARCH DESIGN 32 4. SOUTH AFRICAN COAL MARKET FUNDAMENTALS 33 4.1 South African Coal Statistics 34 4.2 Black Economic Empowerment in the South African
Coal Industry 35 4.2.1 A salient history of BEE 35 4.2.2 Legislation governing BEE in South Africa 36 4.2.3 Implications and development of empowerment 37 4.3 South African Producer Market (Supply) 38 4.3.1 BHP Billiton Energy Coal South Africa (BECSA) 40 4.3.2 Anglo Coal 41 4.3.3 SASOL Coal 43 4.3.4 EXXARO Resources 43 4.3.5 Xstrata Coal 44 4.3.6 TOTAL Coal SA 46 4.3.7 Junior Mining Companies (JMC) 47 4.4 The South African Consumer Market 49 4.4.1 ESKOM 49 4.4.2 SASOL Synthetic Fuels 52 4.4.3 Remaining consumer market 52 4.5 Summary 53 5. PRODUCT 57 5.1 Geology and Mining 57 5.2 Production Cost 59 5.3 Technical Analyses 60 5.4 Single Product and Multi product Mines 61 5.5 Product Specification 61 5.5.1 Specification parameters and elements 63 5.6 Product Utilisation 65 5.6.1 Power generation 65 5.6.2 Pulverised coal firing 65 5.6.3 Burners 67 5.6.4 Stokers 68 5.7. Coal Quality Requirements 68 5.7.1 Pulverised coal firing combustion 69 5.7.2 Stokers 69 5.8 Cement Production 70 5.8.1 Cement kilns 70 5.8.2 Burners for cement kilns 70 5.8.3 Cement plant efficiencies 70 5.8.4 Coal quality requirements 71
7
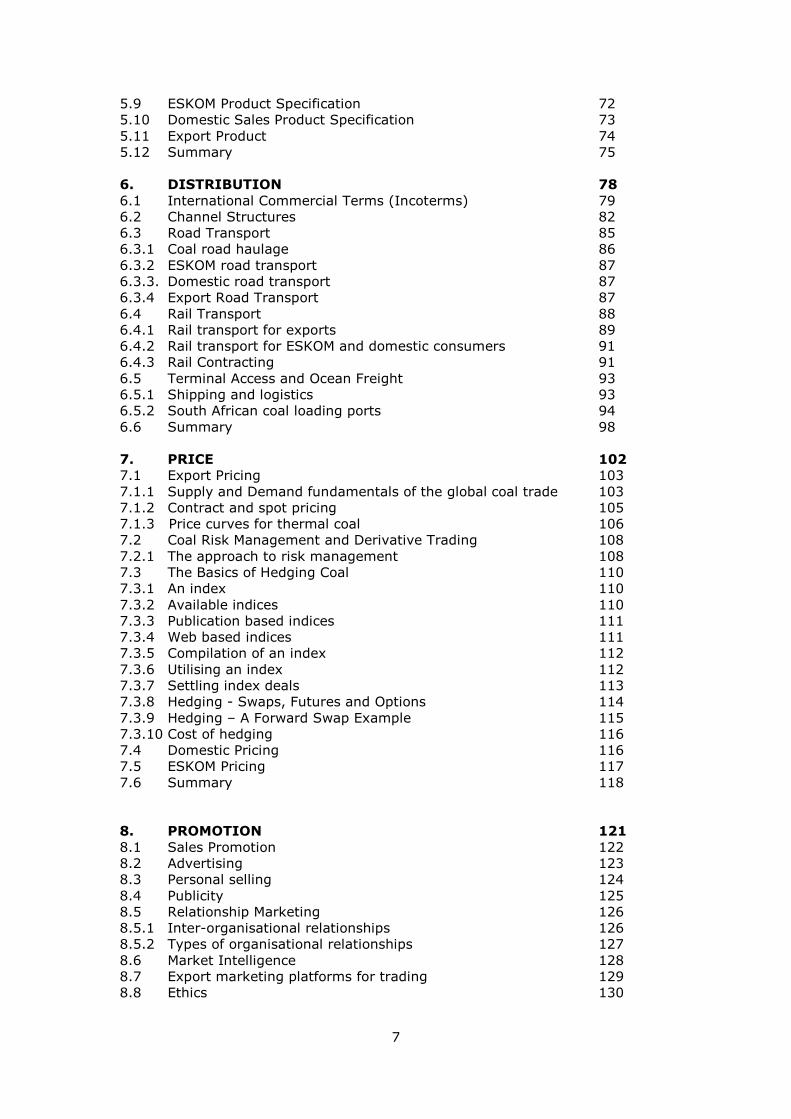
5.9 ESKOM Product Specification 72 5.10 Domestic Sales Product Specification 73 5.11 Export Product 74 5.12 Summary 75 6. DISTRIBUTION 78
6.1 International Commercial Terms (Incoterms) 79 6.2 Channel Structures 82 6.3 Road Transport 85 6.3.1 Coal road haulage 86 6.3.2 ESKOM road transport 87 6.3.3. Domestic road transport 87 6.3.4 Export Road Transport 87 6.4 Rail Transport 88 6.4.1 Rail transport for exports 89 6.4.2 Rail transport for ESKOM and domestic consumers 91 6.4.3 Rail Contracting 91 6.5 Terminal Access and Ocean Freight 93 6.5.1 Shipping and logistics 93 6.5.2 South African coal loading ports 94 6.6 Summary 98 7. PRICE 102 7.1 Export Pricing 103 7.1.1 Supply and Demand fundamentals of the global coal trade 103 7.1.2 Contract and spot pricing 105 7.1.3 Price curves for thermal coal 106 7.2 Coal Risk Management and Derivative Trading 108 7.2.1 The approach to risk management 108 7.3 The Basics of Hedging Coal 110 7.3.1 An index 110 7.3.2 Available indices 110 7.3.3 Publication based indices 111 7.3.4 Web based indices 111 7.3.5 Compilation of an index 112 7.3.6 Utilising an index 112 7.3.7 Settling index deals 113 7.3.8 Hedging - Swaps, Futures and Options 114 7.3.9 Hedging – A Forward Swap Example 115 7.3.10 Cost of hedging 116 7.4 Domestic Pricing 116 7.5 ESKOM Pricing 117 7.6 Summary 118 8. PROMOTION 121
8.1 Sales Promotion 122 8.2 Advertising 123 8.3 Personal selling 124 8.4 Publicity 125 8.5 Relationship Marketing 126 8.5.1 Inter-organisational relationships 126 8.5.2 Types of organisational relationships 127 8.6 Market Intelligence 128 8.7 Export marketing platforms for trading 129 8.8 Ethics 130
8
8.8.1 Responsibilities of the marketer (producing company) 130 8.8.2 Honesty and fairness 131 8.8.3 Rights and duties of parties in the marketing exchange
process 131 8.8.4 Ethics in product development and management 131 8.8.5 Ethics in promotion 131 8.8.6 Ethics in distribution 131 8.8.7 Ethics in pricing 132 8.8.8 Ethics in marketing research 132 8.8.9 Ethics in organisational relationships 132 8.9 Summary 132 9. CONCLUSIONS, IMPLICATIONS AND
RECOMMENDATIONS FOR FUTURE RESEARCH 135 9.1 The South African Producer (Supply) 135 9.2 The South African Market (Consumer) 137 9.3 South Africa in the Global Coal Market Context 138 9.4 From Geology to Mining to Product 139 9.5 Product Specification 140 9.6 Product Utilisation 141 9.7 Channel Structures for Distribution 142 9.8 Incoterms and Contracting 143 9.9 Modes of Transport 144 9.10 South African Port Allocation 145 9.11 Export Pricing and Risk Management 146 9.12 Domestic and ESKOM Pricing 147 9.13 Relationship Marketing Yields Market Intelligence 148
10. REFERENCES 150
9
DECLARATION
I declare that this research report is my own unaided work. It is being
submitted to the Degree of Master of Science to the University of the
Witwatersrand, Johannesburg. It has not been submitted before for any
degree or examination to any other University.
_________________________
__________day of _______________year______________

10
ABSTRACT
The study aims at examining all the individual activities during the marketing
process of bulk commodity coal. This involves integrating all the concepts of
the marketing mix, namely: product, price, distribution and promotion. The
marketing mix elements all focus on industrial marketing fundamentals, which
are essentially different to those in usual product and service marketing. The
marketing mix is discussed in theoretical and practical detail which is essential
for reaching markets at optimal pricing structures to ensure the longevity of
the producing company. The research was conducted on an exploratory
descriptive basis.
The study focuses on ESKOM, Domestic Sales and Export Sales ex Richards
Bay Coal Terminal, as the three existing markets for coal in South Africa.
Reference is made to Durban and Maputo Terminals as alternative ports for
coal exports from South Africa.

11
To Henk and Lara

12
Acknowledgements
• My Father in Heaven
• Professor Dick Minnitt from WITS University
• SACMH Limited
• Dr Stephen Meijes
• The South African and International Coal Fraternity
• My friend Susan Pretorius
13
The study aims at examining all the individual activities during the marketing
process of bulk commodity coal. This involves integrating all the concepts of the
marketing mix, namely: product, price, distribution and promotion. The
marketing mix elements all focus on industrial marketing fundamentals, which
are essentially different to those in retail and consumer product and service
marketing. The marketing mix is discussed in theoretical and practical detail
which is essential for reaching markets at optimal pricing structures to ensure the
longevity of the producing company.
The study focuses on ESKOM, Domestic Sales and Export Sales ex Richards Bay
Coal Terminal, as the three existing markets for coal in South Africa. Reference is
made to Durban and Maputo Terminals as alternative ports for coal exports from
South Africa.
A comprehensive literature review concentrates on the relevant industrial
marketing theory concepts, and includes a discussion of industry, business and
marketing strategy. The literature review emphasises the exploratory and
descriptive nature of the research conducted to complete the study.
In an effort to comprehend the development, growth and evolution of the South
African coal industry, a complete discussion on market fundamentals is
presented. These include examining Black Economic Empowerment and the
influence of mining legislation after 1994. In terms of supply, each coal
producing entity (including the Junior Mining Companies (JMC) involved with coal)
is discussed with reference to its current production capacity and project pipe-
line. Demand for domestic thermal coal centres around consumer facts on
ESKOM, SASOL Synthetic Fuels and the remainder of the domestic market.
CHAPTER 1
INTRODUCTION
14
The study focuses on thermal coal as the ultimate product and its marketing in
South Africa. Mining and production are viewed as the preliminary and first
essential inputs to the ultimate marketing plan. In an effort to analyse the
product, technical specifications and composition are the main determinants of
product utilisation. Coal quality requirements for power generation and cement
manufacturing are determined by burner and stoker qualities. Product
specifications are derived and established for ESKOM, export and domestic
products.
The distribution function divides the supply chain and its various technical fields
to reflect the intricacies of the logistics chain based on road, rail and sea freight.
Road transport has become an important coal transport mode in recent years.
This is mainly as a result of a lack of rail infrastructure, but the impact on South
Africa and its economy will be lasting. Railage is the most crucial supply chain
component and the difference between General Freight Business (GFB) and
Transnet Freight Rail (TFR) contracts is highlighted with a view to understanding
the constraints. Although sea freight explore the final link in the supply chain for
global customers in exports, Incoterms and sea freight concepts are examined
mainly up to a free-on-board (FOB) basis.
Furthermore, a detailed assessment of price determination is made for all
markets. Developments in coal price derivatives are reviewed with special
consideration of the methodology of indices and hedging as a risk management
tool. The pricing regime for ESKOM, domestic sales and exports have evolve over
the past 8 years, but very aggressively since 2007 when economic structural
changes became evident in the economy. This section focuses on explaining the
changes that occurred and how the market operates within the new framework.
Promotion as the final element of coal marketing, embraces topics such as
relationship marketing, market intelligence and ethics. The promotional elements
of sales promotion, personal selling, advertising and publicity together with these
three factors are essential for the successful placement, growth and longevity of a
producer in the industry. Relationship marketing is confirmed as the single most
important aspect for inter-organisational, global customer and supplier
relationships.
The culmination of the research, facts and proposed future research is found in
the final chapter. Market players cannot develop a marketing strategy without a
15
critical understanding of the market it operates within. This understanding of the
market and its building blocks will grow, improve and sustain a coal producing
company in its operating environment, dependant off course on the markets it
produces for and the availability of infrastructure to the producing company.
Recommendations for further research are made, as the findings of the study
allude to further marketing concepts and unexplored theories and practices.

16
The literature review encompasses business marketing concepts, particularly
the theory dealing with industry matters. Marketing theory is discussed in
terms of the marketing mix and each field’s components as the basis for the
literature review.
The literature review is divided into logical sectors, discussing all relevant
terms and theory from a strategic to operational viewpoint.
2.1 Business Marketing
Business marketing is defined as the marketing of products and services to
commercial enterprises and governments for the products and services, they
produce (Hayes, Jenster and Aaby: 1996).
The magnitude of business marketing is described by Dwyer and Tanner
(2002), as purchases made by companies, government institutions and
agencies account for more than half of the economic activity in industrialised
countries, making business marketing an important activity.
Furthermore, Melnyk and Denzler (1996), consider this aspect of marketing as
managing the interface between the customer and the company. It identifies
the needs and expectations of the customer and communicates that
information to the rest of the company. It also helps to shape these
expectations through activities that communicate the capabilities of the
company to current and potential customers. Marketing also monitors
interactions between customers to identify any changes in needs and
expectations, and it tracks competitors to identify any actions that might
adversely affect the company’s position in the marketplace. Bulk commodity
CHAPTER 2
LITERATURE REVIEW
17
marketing plays a critical role in helping company managers identify the
meaning of value to either current or future customers.
The marketing system identifies the major components that interact in the
company’s environment to enable the company to successfully provide
products and or services to the marketplace. The external environment that
influences the marketing system includes: the economy, culture, technology,
demand, legal concerns, politics and raw materials. The internal environment
of the marketing system includes: financial resources, personnel resources,
research and development, capital equipment, suppliers, the corporate
mission and corporate goals and objectives (Hisrich and Peters: 1991).
Marketing (of commodities) is both a set of activities performed by
organisations and a social process. This indicates that marketing exists at
both micro and macro levels. Micro-marketing looks at the customers and the
companies that serve them, while macro-marketing takes a broad view of the
production-distribution system (Perrault and McCarthy: 1996).
2.2 Marketing Strategy
The marketing strategy should have two purposes: (1) to provide broad
guidance for the development of the business strategy, and (2) to guide and
direct marketing activities. The marketing strategy has customer-focused
objectives that guide and support the business strategy and decisions and
actions with respect to target customers, price, product, promotion and
distribution necessary to achieve the objectives (Hayes et.al: 1996).
The marketing mix describes the interaction of four factors that represents the
core of the company’s marketing system: product, price, distribution and
promotion. Within each of the four factors that make up the marketing mix
there are countless other variables. For example, the product area
encompasses packaging, branding, product design and product development.
In pricing, management must be concerned with costs, discounts, freight and
other price-related factors. Distribution represents those activities related to
providing place utility to the customer, providing the product to the customer
when and where it is needed. Choosing the type, number and location of
distributors are some of the countless decisions that must be made as part of
18
the company’s distribution plan. Promotion includes advertising, personal
selling, sales promotion and publicity (Hisrich and Peters: 1991).
According to Cravens (1997), the marketing plan guides implementation and
control, indicating marketing objectives and the strategy and tactics for
accomplishing these objectives. Cravens (1997), furthermore describes the
marketing plan in four phases, where all phases are underlined by information
derived from each phase, market research as well as the evaluation of the
plan and its performance.
The following phases are depicted:
Phase 1 – The preliminary analyses and screening phase. Here company and
country needs are matched in terms of environmental uncontrollables,
company character and screening criteria.
Phase 2 – Adapting the marketing mix to target markets, essentially
analyzing the 4 Ps.
Phase 3 – Developing the marketing plan, which include situation analyses,
objectives and goals, strategy and tactics, budgets and action plans.
Phase 4 – Implementation, evaluation and control of objectives, standards,
assigning responsibilities, measuring performance and correcting errors.
2.3 The Industry
When profiling an industry, in this case, the South African coal producing
industry as well as buyers domiciled in South Africa and globally, the following
questions are asked:
• Who are the competitors? This include direct competitors as well as
those sufficiently close enough to be taken into account (Hayes et.al:
1996);
• Who are the buyers, suppliers, potential entrants and possible
substitutes, and what are their major characteristics? (Hayes et al:
1996)
• What is the size of the industry, and what is its growth rate in physical
tonnes and South African Rand (ZAR) value?
• What are the key characteristics of the industry, in terms of its
technologies, capital structures, logistical constraints and available
natural resources?
19
The arena of competition within which an industry member should fight will be
described in terms of its boundaries, its rules of the game, and its players.
Differentiated marketing aims to increase sales and efficiency by increasing
the customer base. Demand thereby creates economies of scale in
distribution and production (Hisrich and Peters: 1991).
Favourable factors are those that will positively affect a product’s sales, and
these are highly dependant on the type of product, as well as the market
focus – consumer, industrial or governmental. Certain economic and business
activity indicators will also provide an indication of probable sales of a
product. These indicators include increased demand for goods; low
unemployment rate; increasing consumer, industrial, and government
purchases; reasonable balance of trade; and inventories in line with sales
(economic supply and demand fundamentals).
Unfavourable factors are those that can negatively affect the sales of a
product. The following indicators generally have a negative effect on sales:
high interest rates; rising prices and threat of inflation; decline in
construction; decline in automotive sales; labour discontent and strikes;
restrictive monetary policy; and a decline in the stock market.
The coal industry is perceived to be in a mature phase, or coal as a product -
to be a mature product. A mature industry or product is likely to involve a
mass market, many channels, low prices, many competitors, lowest gross
margins, high incentives to customers and trade, superior product quality and
optimum capacity (Hisrich and Peters: 1991).
Perrault and McCarthy (1996), remark that wherever many companies sell
homogenous products, such as coal, the demand curve seen by each producer
tends to become flat. Markets tend to become more competitive, moving
toward pure competition. On the way to pure competition, prices and profits
are pushed down until some competitors are forced out of business, however,
in long-run equilibrium, the price level is only high enough to keep the
survivors in business.
Business-to-business market places (also referred to as B2B exchanges) are
defined by Vogt, Piennaar and de Wit (2002), as electronic market places on

20
the Internet where suppliers and buyers interact to conduct business
transactions. These market places provide an opportunity for huge value
creation through the reduction in transaction costs, improved supply chain
visibility, and more efficient allocation of supply and demand.
B2B communication occurs when an order from a customer is transmitted to
the supplier after all the necessary marketing interventions have taken place.
B2B communication can be done by telephone, fax, or via electronic data
interchange (EDI) or the Internet (Vogt et al:2002).
2.4 Product
According to Dwyer and Tanner (2002), product is a collection of features and
advantages and has benefit or satisfies the need of buyers. Product is defined
in terms of core product – which is the tangible product that is offered. The
augmented product is that part of the offering that is somewhat customised
for each particular customer.
Figure 2.1 shows the “whole product” the customer buys and should be
viewed as a bundle of tangible and intangible attributes from which customers
derive benefit and value. The attributes and importance vary among
customers. From some customers joint product development is an important
attribute, for others it is the support of the firm’s marketing effort. This
suggests that the product is not a fixed element of marketing strategy.
Rather, it is a variable whose attributes can be changed, depending on the
needs of the particular customer or marketing segment.
Even for commodity products, normally considered undifferentiable, the whole
product concept suggest opportunities exist for differentiation on attributes
such as packaging, comprehensiveness of the product line, one-stop shopping
convenience or special services. For all products the core of generic attributes
should be the starting point of development of a whole product from which
consideration is given to other product features appropriate for particular
customer needs.

21
Figure 2.1 The whole product approach to value
(Source: Regis and McKenna, Summer 1994 (derived from Hayes et al:
1996).)
The concept of quality is inextricably intertwined with the concept of product.
Melnyk and Denzler (1996), defined that quality represents how well the good
or service meets or exceeds the expectations of the customer at the time of
purchase. However, they also indicate that confusion surrounds the distinction
between what quality is and what it is not.
According to a review of the literature there are five different views (and
definitions) of quality:
• Transcendental View – A condition of excellence implying fine quality
as distinct from poor quality. Quality is achieving or reaching for the
highest standards as against being satisfied with the sloppy or
fraudulent;
• Product-Based View – Differences in quality amount to differences in
the quantity of some desired ingredient or attribute;
• User-Based View – The capacity to satisfy wants. In the final
analysis of the market place, the quality of a product depends on how
well it fits patterns of consumer preference;
VALUE
Market Acceptance of the Technology
Compatibility with Existing Systems
Satisfying Management’s Demands
Price, Cost of Ownership
Product, Features, Benefits
Availability and Quality of Service/Support
Reputation and Experience of Vendor
Support of Industry Standards
VALUE
22
• Manufacturing-Based View – Conformance to requirements. The
degree to which a specific product conforms to a design or
specification; and
• Value-Based View – The degree of excellence at an acceptable price
and the control of variability at an acceptable cost. Best for customer
conditions: (a) the actual use and (b) the selling price of the product.
Particularly important and interesting, specifically to commodity marketing
and production is the concept of Total Involvement in the Quality Undertaking.
Melnyk and Denzler (1996) argue that for a commodity product such as coal,
which incorporates various entities in the production and delivery process,
quality will rely on three different types of team work:
• Vertical Teamwork – Total Quality Management (TQM) requires on-
going vertical co-operation between top management and functional
groups. Actions within engineering must contribute to the strategic
orientation and goals of the company.
• Horizontal Teamwork – Horizontal teams bring together
representatives from various functional groups. The production of
thermal coal will involve representatives from mining, beneficiation,
marketing, logistics, quality assurance and finance.
• Inter-organisational Teamwork – The final type of teamwork brings
together representatives of the company with suppliers and customers.
This type of teamwork ensures that the firm coordinates its quality
activities with those of suppliers, and these activities meet or exceed
the expectations of customers.
2.5 Pricing
Business marketing looks beyond economic theories in the pricing decision
process. Pricing of industrial products involve the company’s costs, customers’
perception of value, and competitors’ prices for similar goods (The three C’s).
Beyond the three C’s, most marketers must also make their pricing decisions
in the context of the company’s overall objectives for pricing policy. The
company’s objective remains to produce a profit. Profit objectives, however,
may be stated in terms of return on investment or return on sales. It may
also be stated in terms of expected gross margin or profit contribution after
marketing expense (Hayes et al: 1996).
23
Few firms rely solely on a cost-based approach to pricing, although costs are a
major determinant of profit. It is important to distinguish among fixed, semi-
fixed and variable costs.
• Fixed costs - do not vary as a function of volume produced. It includes
items such as physical plant and equipment, long term leases, or interest
on long term debt.
• Semi fixed costs - do not vary as a function of volume produced but can
be changed in the short term by management decision. It includes such
items as salaries, general administrative expenses, R&D expenses, or
advertising commitments.
• Variable costs - vary directly with the number of units produced. It
include items such as raw materials, direct manufacturing labour, freight
and commissions.
This holds true especially in the coal industry where cash cost is an important
lever to establish a company’s sustainability in a volatile market.
According to Nagle and Holden (1995:39) there are a number of key aspects
of costs that need to be taken into account for pricing decisions. Few
companies make an investment in fixed costs that cannot be recovered in an
appropriate time period. Breakeven is a must, although few companies are
interested in simply breaking even. The price, therefore must not only cover
variable costs but must also result in sufficient volume so that the total
contribution (revenue minus variable costs) covers all fixed costs and returns
some desired level of contribution to profit, R&D or investment in other
opportunities. Even fewer companies price below variable costs. Hence, a
company’s variable costs become the floor for the pricing decision. It is
important to recognise that the term total cost takes on meaning only for a
specific volume.
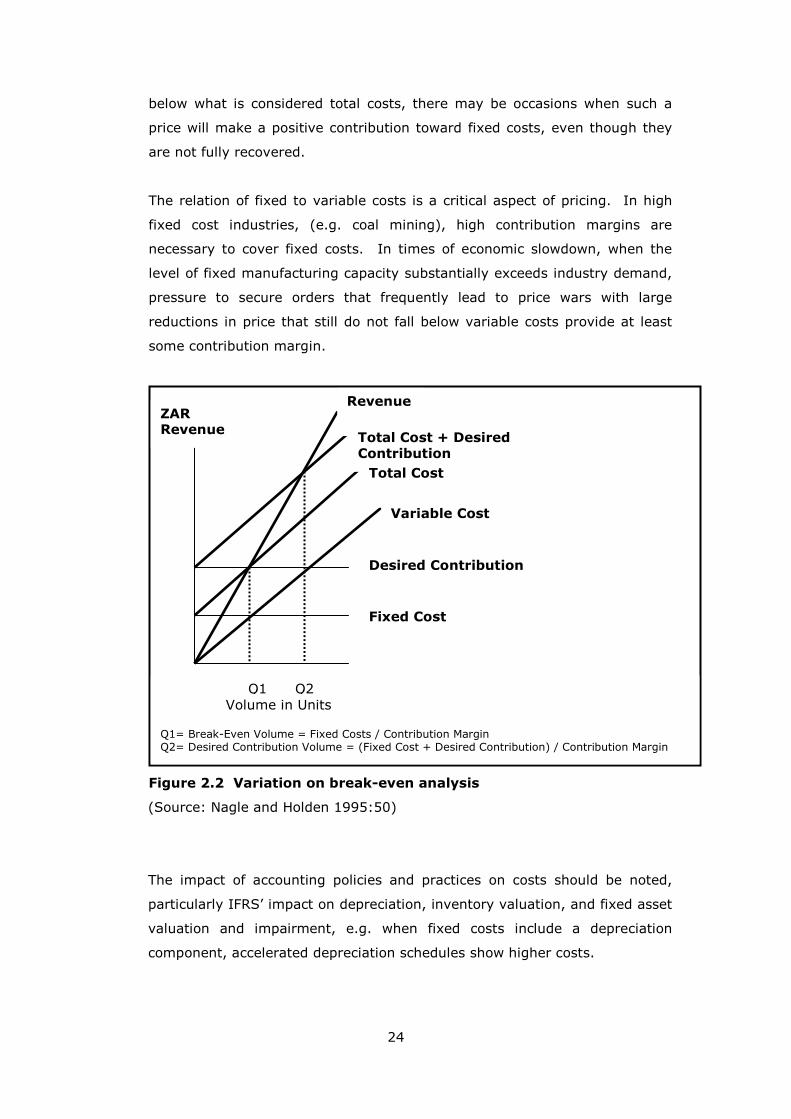
These relationships can be seen in a variation of the familiar break-even
chart, as shown in Figure 2.2, adapted from Nagle and Holden (1995:50). A
key concept is the per unit contribution or the difference between unit
revenue and per unit variable cost. Break-even volume, where revenue
equals total cost (Q1), is calculated by dividing fixed costs per unit
contribution. In the illustration, the desired profit contribution is constant.
Here the required volume is where revenues equal total cost plus desired
contribution (Q2). While most companies avoid pricing at a level that falls
24
below what is considered total costs, there may be occasions when such a
price will make a positive contribution toward fixed costs, even though they
are not fully recovered.
The relation of fixed to variable costs is a critical aspect of pricing. In high
fixed cost industries, (e.g. coal mining), high contribution margins are
necessary to cover fixed costs. In times of economic slowdown, when the
level of fixed manufacturing capacity substantially exceeds industry demand,
pressure to secure orders that frequently lead to price wars with large
reductions in price that still do not fall below variable costs provide at least
some contribution margin.
Figure 2.2 Variation on break-even analysis
(Source: Nagle and Holden 1995:50)
The impact of accounting policies and practices on costs should be noted,
particularly IFRS’ impact on depreciation, inventory valuation, and fixed asset
valuation and impairment, e.g. when fixed costs include a depreciation
component, accelerated depreciation schedules show higher costs.
ZAR Revenue
Revenue
Total Cost + Desired Contribution
Variable Cost
Total Cost
Fixed Cost
Desired Contribution
Volume in Units Q1= Break-Even Volume = Fixed Costs / Contribution Margin Q2= Desired Contribution Volume = (Fixed Cost + Desired Contribution) / Contribution Margin
Q1 Q2
25
Perhaps the most salient aspect of pricing is that customers are not passive
entities in the exchange process. Rather they are professionals who carefully
analyse a company’s offerings in terms of value, both intrinsically and relative
to competitive offerings. For bulk commodities such as coal, given that a
terminal market exists, market price is transparent, and pricing is usually
fixed, depending on the strategy of the producer and its recovery within the
price.
The pricing decision must take into account the presence of existing
competitors. For bulk commodities, such as coal, and mature products, the
company’s pricing flexibility will depend on the extent to which customers
perceive differences between competitive offerings. In the coal industry,
price leaders are found; that is, companies, by virtue of size, reputation or
past practice play a major role in determining the overall level of prices in the
industry. In some instances, the price leader may take the lead in initiating
price changes that are widely followed by others in the industry. More
frequently, and in particularly with respect to price reductions, the initiative
to change prices is taken by smaller companies, but it is the action by the
price leader that legitimises the new price level.
In times of increased demand the opportunity may exist to increase industry
prices, but some companies may elect to forgo price increases in an attempt
to increase share. Similarly, in times of increasing costs the pressure may
exist to pass cost increases on to customers, but again, some companies may
elect, instead, to forgo price increases in order to increase share (Hayes et
al: 1996). Given the major volatility experienced in coal markets since mid-
2008, market share increase became an important objective to producers, as
the market created opportunities to take advantage of increased market
share.
Coal products are directly related to the quantity of a customer’s product or
service being produced. Here, demand is fundamentally determined by the
customer’s demand, and total or industry demand for the product or service
may not be influenced by price. In the long run, demand for capital goods is
also associated with the quantity of the customer’s product being produced.
This suggests the difficulty of precisely estimating industry price elasticity of
demand. Nagle and Holden (1995:53) maintain that assumptions can be
made as to whether demand is in the elastic zone, in which case an industry
26
price increase will result in revenue decrease, or in an inelastic zone, in which
case an industry price increase will lead to a revenue increase. These
assumptions play a major role in determining price levels in an industry and
can significantly affect responses to competitors’ price moves.
If a company sells directly to its customers, it has complete control over the
price at which it offers its product(s). Where distributors or other
intermediaries are involved, the price at which goods are offered, should take
theses costs into account in the price determination process. Vertical price
fixing is illegal between producers and distributors.
Crowson and Sampson (2000), define risk, and specifically price risk, in
terms of supply and demand fundamentals. Demand for coal is primarily
influenced by the level and structure of economic activity, by technological
developments, and by relative price levels. Strong economic growth will
bring increased consumption and the restocking of industrial commodities.
Increased prosperity and confidence about the future course of economic
growth will also induce consumers to buy more goods and industrialists to
invest in new plant and buildings.
During periods of recession or weak economic growth the opposite happens:
fabricators and merchants will rapidly run down their inventories and buy
their raw materials on a strictly hand to mouth basis. Consumers spend less
and industrialists postpone capital spending programmes to curtail them. All
these factors became evident in late 2008 and throughout 2009, as the coal
industry started its recovery from the world-wide recession.
There is no reason to expect the various influences on supply and demand to
move in offsetting ways. A natural disaster reducing supply can happen at
any time, regardless of the state of demand, while a major strike is probably
more likely to be staged when the product is in great demand. Since the
supply of commodities is relative inflexible in the short term, changes in
demand linked to cyclical fluctuations in business activity are directly
reflected in changes in the level of inventories and in prices. Fluctuations in
prices are seldom predictable with any degree of accuracy.
Hedging is defined by Crowson and Sampson (2000), as the process
undertaken by users of derivative instruments to lock in the coal prices they

27
will pay or receive for future deliveries. This is done because the hedger
wants to lock-in a known coal price on a particular operation, or because the
coal prices currently available on the forward market are attractive and the
hedger wishes to fix these prices against anticipated business. There are
basically two main motivations for hedging:
• To lock in coal prices which are attractive relative to one’s internal costs;
and
• To secure a coal price to set against an external contract.
2.6 Distribution (Place)
Distribution modes in the coal industry are road, rail and sea freight. In
some cases (ESKOM specific), conveyors are used to deliver coal to power
stations, directly from the mine. This study focuses on the road, rail and sea
transport of bulk coal products.
Road freight transport is more flexible and versatile than other modes of
transport because of vast networks of roads. Currently in South Africa, as a
result of a lack of rail infrastructure investment, and depleting coal reserves,
road freight transport is often transporting bulk commodities, where rail
freight cannot reach. Road freight transport is an essential part of the
distribution channel for the following reasons:
• No rail lines available at consumer points;
• Rail lines are not immediately adjacent to producing mines;
• Inconsistency of rail freight service (Vogt et al: 2002).
Of all the forms of transport, road transport has the highest proportion of
variable cost to total costs. The main reason is that:
• The road infrastructure is publicly owned; Government typically recover
road-user cost responsibility through levies included in the price of fuel,
thereby converting fixed cost into a variable transport expenditure;
• Terminal facilities are less capital intensive than the terminal facilities of
other forms of transport; and
• The fuel consumption of road transport vehicles is relatively high, making
fuel cost a proportionally larger variable cost component.
Rail transport can carry large and high-density commodities and bulk
consignments, such as coal over long distances and at low cost. Rail
28
transport is therefore well suited to carry raw materials and semi-finished
good. In the bulk, long-distance transport market, throughput and price are
more important to the company than transit time.
Vogt et al (2000:48), note that due to the high capital investment in
infrastructure (e.g. railway lines and terminal facilities, stations, marshalling
and classification yards, sheds, goods depots and workshops) and the
longevity of rolling stock such as freight wagons, the ratio of fixed costs to
total costs are very high. Because the unit costs decreases when output
increases, rail transport can gain the benefits of economies of scale when
utilisation increases. As a result, rail transport posses a cost advantage over
road transport with respect to bulk coal loads that are conveyed over long
distances.
Sea transport or ocean carriage is the most cost-effective way of transporting
high-bulk commodities over long distances and is therefore the most widely
used international shipment method. Bulk carriers carry cargoes with low
value-to-weight ratios, such as coal.
The cost structure of sea transport is characterised by a high proportion of
variable cost due to the fact that the way (the sea) does not require
investment and sea ports are not owned or supplied by shipping firms (Vogt
et al:2000:56). Expenses at ports arise when a port is visited.
A terminal is a special area situated at the end of a route or where different
routes meet, branch out or cross- including structures and equipment, where
in-transit goods are transferred between different carriers, modes of
transport or vehicles of the same mode. In Southern Africa, notably Richards
Bay Coal Terminal (RBCT) and Grinrod TCM Matola coal terminal in Maputo.
Terminals provide a freight consolidation function by receiving small
consignments and combining it into larger loads. Consolidation can maximize
the utilisation of vehicle payload capacity. Terminals provide a bulk breaking
service, warehousing and transferring service, as well as re-fueling, garaging,
and maintenance of vehicles and equipment.
International Commercial Terms (Incoterms) are a set of contractual
instruments facilitating the sale and transport of goods in domestic and

29
international transactions. These are discussed in detail in Section 6.
Incoterms are included in a contract of sale if parties:
• Complete a sale of goods;
• Indicate each contracting party’s costs, risks and obligations with regard
to delivery of the goods; and
• Establish basic terms of transport and delivery in short format.
2.7 Market Intelligence
Cravens (1997), states that information performs a vital strategic role in a
company. Information capability creates a sustainable competitive
advantage by improving the speed of decision-making results. Managers’
models of their markets guide the interpretation of information and the
resulting strategies designed to keep the company ahead of its competition.
Business marketing intelligence is the collection, analysis and interpretation
of relevant internal and external marketing information. It is comprised of all
kinds of market and marketing research; the collection and analysis of
internal data; competitive analysis; analysis and reverse engineering of
competitors’ products; understanding how and where to add value for
customers; and the process of synthesizing large amounts of informally
gathered information about the environment (Hayes et al: 1996).
Cravens (1997), further affirms that marketing information capabilities
include marketing research, marketing information systems, database
systems, decision-support systems and expert systems. Research
information supports marketing analyses and decision making. The
information may be obtained from internal sources, standardised information
services and special research studies.
Computerised information systems include management information systems,
database systems and decision-support systems. These systems have
capabilities for information processing, analysis of routine decision-making,
and decision recommendations for complex decision situations.
The vast array of information processing and telecommunications technology
that is available offers many opportunities to enhance the competitive
advantage of companies. Coal producing companies have historically been
30
implementing direct order systems, such as SAP R/3 and using electronic
data interface (EDI) systems to customers to create expected management
information on a weekly, monthly and annual basis.
2.8 Relationship Marketing
The buyer-seller relationship is the close relationship between customers and
their suppliers, and their mutual dependency strongly influences the product
management process (Hayes et al: 1996).
Researchers have since the 1980’s drawn attention to the need to retain, as
well as attract, customers. Lovelock (1996) concurs with this, explaining that
relationship marketing recognises the value of current customers and the
need to provide continuing services to existing customers, so that they will
remain loyal.
The research on relationship marketing and customer retention has taken
various forms. For example, some research focus on constructs, such as trust
and relationship commitment and how these relate to customer satisfaction
and loyalty. Other researchers have focused on specific breakthrough
strategies for retaining customers, such as building an effective recovery
strategy for service failure situations or offering service guarantees to reduce
risk and build loyalty.
In a research article, Sheth (2002) believes that a company must be selective
in its use of relationship marketing. Indeed a company must consider
segmenting the market into relational and transactional markets. Therefore,
unlike total quality management (TQM), relationship marketing is likely to
remain more selective and targeted.
Relationship marketing have indeed transformed into customer relationship
management (CRM), with a hybrid of marketing relationship programmes
that range from relational to transactional to outsourcing market exchanges
and customer interactions.
The strategies thought to be most relevant to address strategic (coal)
customer objectives are:
• Customer service;
31
• Key account management; and
• Customer communication – either personally via sales team or
impersonally using another method of communication; and
• Product availability – the assured availability of current products is seen as
more important than introducing new products (Palmer: 2002).
32
The study will investigate exploratory and descriptive research.
The exploratory research is undertaken to gain a preliminary understanding
of the nature, context potential impact and possible causes of as well as the
possible factors contributing to the phenomena of minerals marketing,
moreover that of coal marketing in the South African context.
The research involves a review of existing literature available on the topic
and other qualitative data collection techniques. It involves an open and
flexible research approach aimed at ensuring comprehension and generating
insights and the research design evolves as the study reveals more about the
issue under investigation.
In terms of descriptive research, the characteristics of situations, events,
processes, and entities based on qualitative and or quantitative observations
are described. This includes creating classifications, categorisations or
typologies of entities, as well as describing the nature of the relationship
between concepts.
This descriptive study provides a qualitative in-depth description of the coal
industry, its processes, groups, companies and other organisations which
contribute to the successful placement of the bulk material to customers,
both domestically and internationally.
CHAPTER 3
RESEARCH DESIGN

33
South Africa remains one of the most important coal producers in the world.
Different grades of good quality coal are produced for export and domestic
markets, with a vast amount of low quality material being consumed by the
domestic electricity producer (ESKOM), and the synthetic fuel industry
(SASOL).
As with the rest of the mining industry, the coal industry has evolved over
the past 10 years whilst incorporating Black Economic Empowerment (BEE).
The industry saw the birth of a thriving new Junior Mining Sector, and all
major coal producers had to include a minimum of 26% BEE shareholding.
The major coal export facility, Richards Bay Coal Terminal (RBCT), has
announced various new phases to increase the export allocation to Junior and
BEE entities. Although the increase in terminal allocation have been
welcomed across the board, Transnet Freight Rail (TFR), have cited that the
rail capacity will not be available without significant capital expenditure over
the next 8 years.
This chapter gives a detailed overview of BEE legislation in South Africa, in
order to explain the changes of the industry over the past 14 years. The
major producers will be discussed, along with the new Junior Mining fraternity
to give an accumulated view of the producer market. ESKOM and SASOL are
discussed as the major consumers of domestic coal. For completeness, the
remainder of the domestic market is reviewed.
The coal supply situation in South Africa has been very topical over the past
18 months, due to the potential looming electricity crisis in the country. The
continuing load shedding programs and ESKOM’s public request for more coal
has fuelled the question of how sustainable the thermal coal exports from
South Africa would be in the medium to long term. This build-up has also
CHAPTER 4
SOUTH AFRICAN MARKETING FUNDAMENTALS
34
contributed in 2008 to the soaring export price with the API #4 hovering
above the US$ 100.00/mt FOB level for a period of 6 months. A concise
overview of the producer and consumer market will aim at giving a better
understanding of the matters that drive the coal industry in South Africa.
These matters include a historical overview of coal supply and demand from
South Africa, Black Economic Empowerment, production breakdown per
producer and capital expenditure plans and a consumer list detailing annual
consumed tonnage.
4.1 South African Coal Statistics
The latest coal statistical information available from Department of Minerals is
for the end of 2007. Although 2008 was the most tumultuous year in the
history of coal, these statistics will only be available at the end of 2009.
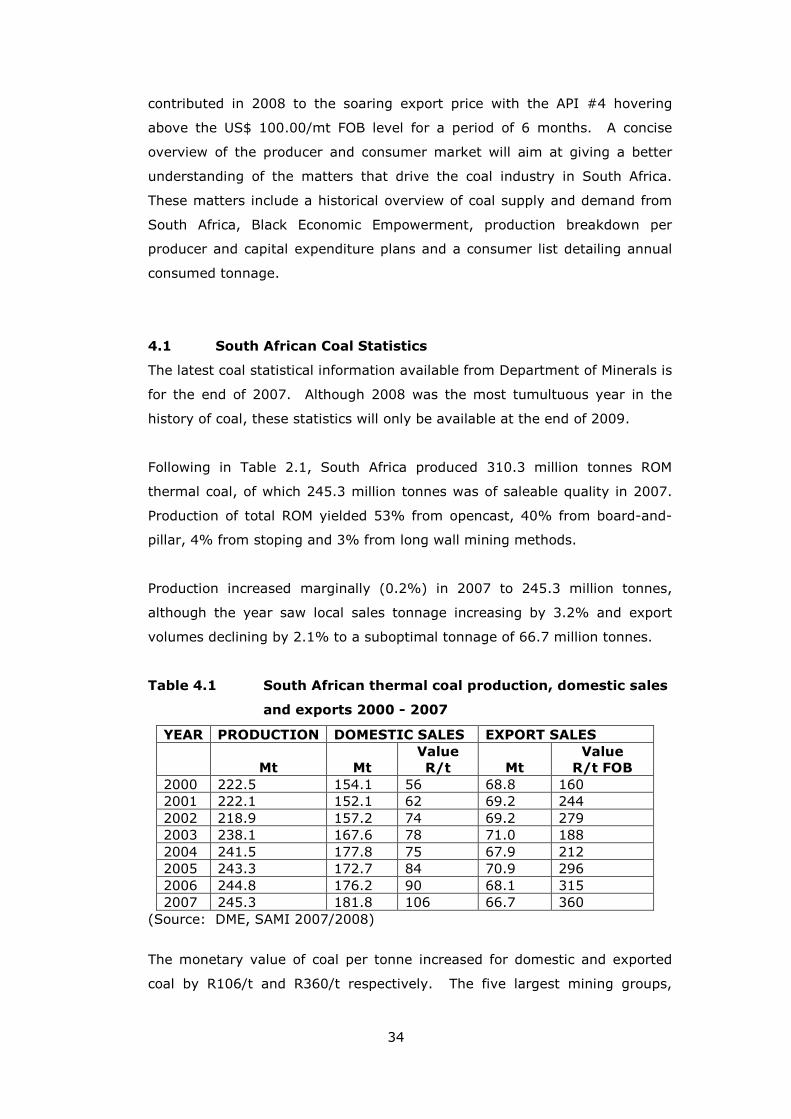
Following in Table 2.1, South Africa produced 310.3 million tonnes ROM
thermal coal, of which 245.3 million tonnes was of saleable quality in 2007.
Production of total ROM yielded 53% from opencast, 40% from board-and-
pillar, 4% from stoping and 3% from long wall mining methods.
Production increased marginally (0.2%) in 2007 to 245.3 million tonnes,
although the year saw local sales tonnage increasing by 3.2% and export
volumes declining by 2.1% to a suboptimal tonnage of 66.7 million tonnes.
Table 4.1 South African thermal coal production, domestic sales
and exports 2000 - 2007
YEAR PRODUCTION DOMESTIC SALES EXPORT SALES
Mt Mt Value
R/t Mt Value
R/t FOB
2000 222.5 154.1 56 68.8 160 2001 222.1 152.1 62 69.2 244 2002 218.9 157.2 74 69.2 279 2003 238.1 167.6 78 71.0 188 2004 241.5 177.8 75 67.9 212 2005 243.3 172.7 84 70.9 296 2006 244.8 176.2 90 68.1 315 2007 245.3 181.8 106 66.7 360
(Source: DME, SAMI 2007/2008)
The monetary value of coal per tonne increased for domestic and exported
coal by R106/t and R360/t respectively. The five largest mining groups,
35
Anglo Coal, BHP Billiton, EXXARO, SASOL and Xstrata produced over 80% of
the saleable production. Furthermore in 2007, South African coal was
exported to 34 countries, of which 84.5% to the European Community (with
the largest off-takers being the United Kingdom, Spain, France, Italy and
Germany). Other regions constitute Africa, South America, the Far East and
the Middle East.
4.2 Black Economic Empowerment in the South African Coal
Industry
The BEE policy introduced by the newly democratically elected government,
elected in 1994 in South Africa, counters the economic effects of the
exclusion of black people as entrenched in the country’s previous policy of
apartheid. BEE aims to de-racialise the economic activity and ownership of
assets in South Africa, which will ultimately lead to the transformation of the
socio-economic landscape. BEE has since been implemented, but has also
been encouraged in the coal industry in terms of employment equity, skills
development and procurement.
4.2.1 A salient history of BEE
Early Empowerment (1994 – 2000)
Early empowerment was characterised by the ad-hoc transfer of equity
ownership to a number of high profile black individuals facilitated in some
instances by unsustainable funding structures. Initially, there was no
legislation governing empowerment of regulating the level of equity
ownership. Furthermore, the Government addressed empowerment by way
of a promise of wide-scale privatizations, although the only significant
privatizations have been Telkom SA Limited and Airports Company of South
Africa. The Government went on to establish the National Empowerment
Fund as a vehicle to receive allocations of shares in privatized entities on
behalf of historically disadvantaged individuals. Companies in the private
sector established schemes to encourage broad-based black participation.
Focused Empowerment (2000 – present)
Given the slow progress of empowerment and the limited success of the early
empowerment deals, Government formalised the empowerment process by:

36
1. Promulgating the Broad Based Black Economic Empowerment Act (BEE
Act);
2. Encouraging the development of various industry-specific charters;
and
3. Releasing the Department of Trade and Industry’s Codes of Good
Practice (DTI Code).
These actions made empowerment imperative to maintaining market share
and attain growth. Furthermore, BEE scorecards included in the charters and
the DTI Code have increased the pressure on companies to negotiate
sustainable BEE deals by prescribing measurement dates and allocation
points to BEE ownership.
4.2.2 Legislation governing BEE in South Africa
The BEE Act provides legislative endorsement of the sector charters which
must meet the objectives of the BEE Act. The BEE Act sets out clear
objectives for achieving broad-based empowerment. The DTI Code has been
issued as a guideline to the act, in order to facilitate the implementation of
the BEE Act.
The final DTI Code was released and published on 1 November 2005 and
deals with, amongst others, the measurement of equity ownership of BEE
participants and the extent of BEE management. Whilst the DTI Code is
effective for a period of at least 10 years, it is essential that private sector
enterprises apply these principles and guidance in their interactions with
organs of state and public entities in order to ensure full recognition for their
empowerment efforts.
The Mining Charter was signed in 2002. The minimum black ownership
requirement by 1 May 2009 was 15%, and 26% by 2014 at company or asset
level. The following important measures in the Mining Charter are
highlighted:
• Holders of “old order mining rights” are allowed a period of exclusivity in
which to apply for conversion into “new order mining rights”, otherwise
the mining rights revert back to the State;
• The Mining Charter requires that ownership be measured using
attributable units of production. The current debate is whether production
is based on volume or value; and
37
• Historically Disadvantaged South Africans (HDSAs) ownership
commitments can be offset against the value of the level of beneficiation.
4.2.3 Implications and development of empowerment
In South Africa today, the average BEE equity ownership regulatory
requirement is 25%. Initial BEE transactions have been criticised for
benefiting a small group of politically well connected black individuals, as a
result, the second wave of empowerment has focused on including a broad-
base of individuals such as staff and charitable trusts.
Due to the lack of available funds, most BEE transactions require significant
vendor facilitation in the form of significant price discounts, reduced funding
rates, donation elements, increased dividend payouts etc. This vendor
facilitation ultimately results in a cost to shareholders, on average between
3% and 5%.
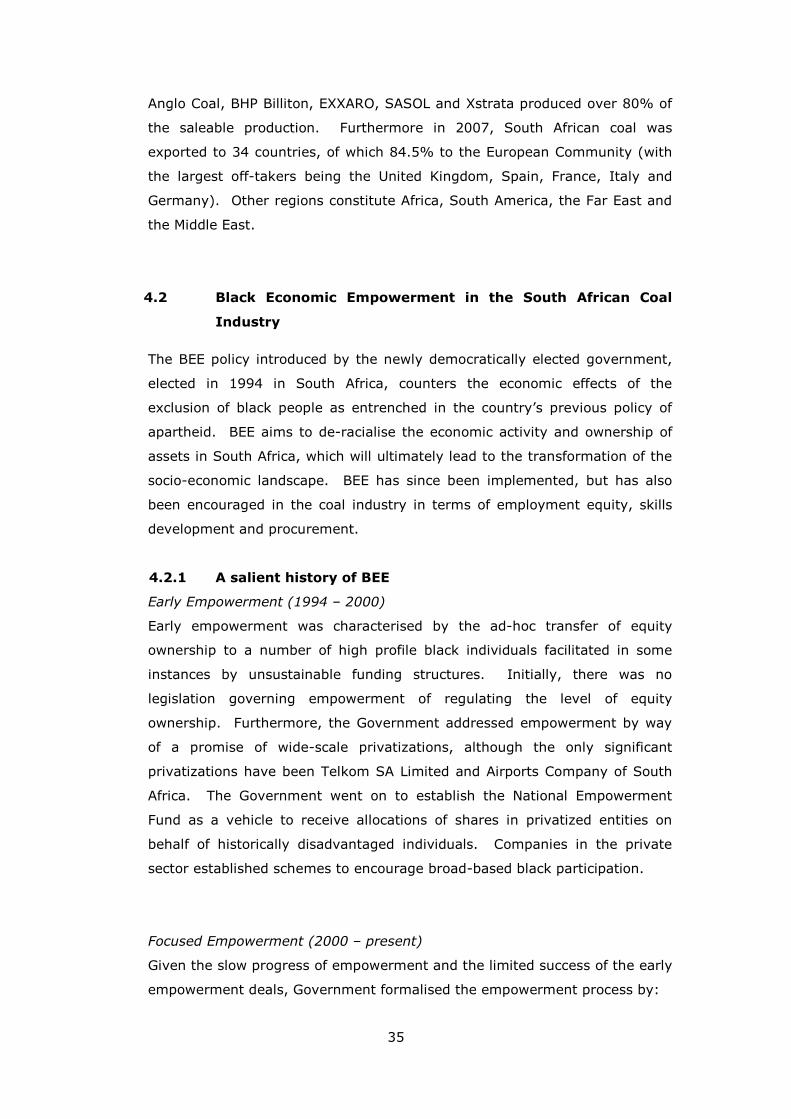
The following table constitutes current coal producing companies with its
proportioned BEE shareholding:
Table 4.2 Current BEE shareholding in major coal producing
companies
Producer BEE Partner % BEE Shareholding
Anglo Coal Pamodzi Coal 15%
BHP Billiton (BECSA) No BEE Partner Optimum and Koornfontein assets were sold to 100% BEEs
0 %
EXXARO Resources Eyesizwe – Anglo / Newcoal transaction from listing Kumba coal assests in 2007
51%
Sasol Mining Igoda through EXXARO Resources 26% Xstrata Coal African Rainbow Minerals 20.2% Total Coal SA Mmkau Mining 15-51%
(Source: DME Coal Industry Task Group, 2009)
The following table constitutes companies that have developed as a result of
BEE legislation, and makes up most of the Junior Mining Companies (JMC).
The effective BEE shareholding is as follows:
38
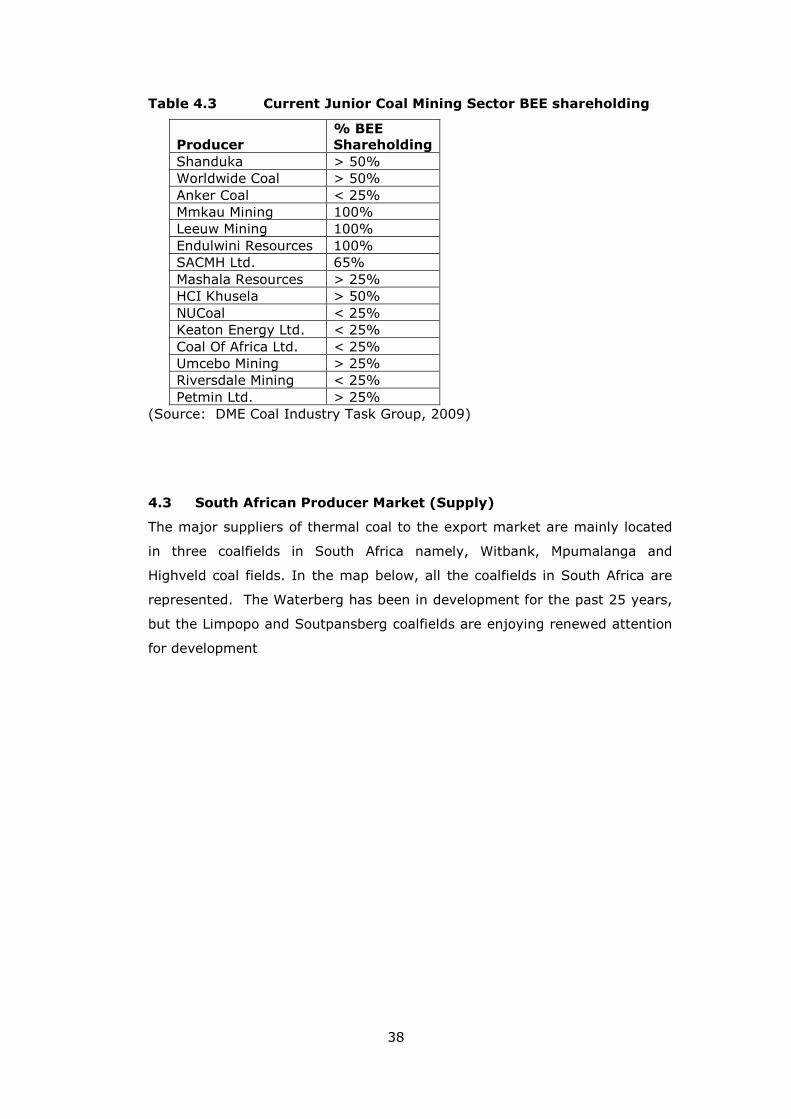
Table 4.3 Current Junior Coal Mining Sector BEE shareholding
Producer % BEE Shareholding
Shanduka > 50% Worldwide Coal > 50% Anker Coal < 25% Mmkau Mining 100% Leeuw Mining 100% Endulwini Resources 100% SACMH Ltd. 65% Mashala Resources > 25% HCI Khusela > 50% NUCoal < 25% Keaton Energy Ltd. < 25% Coal Of Africa Ltd. < 25% Umcebo Mining > 25% Riversdale Mining < 25% Petmin Ltd. > 25%
(Source: DME Coal Industry Task Group, 2009)
4.3 South African Producer Market (Supply)
The major suppliers of thermal coal to the export market are mainly located
in three coalfields in South Africa namely, Witbank, Mpumalanga and
Highveld coal fields. In the map below, all the coalfields in South Africa are
represented. The Waterberg has been in development for the past 25 years,
but the Limpopo and Soutpansberg coalfields are enjoying renewed attention
for development

39
Figure 4.1 Map of the South African Coal Fields
(Source: DME Report of Coal Operations, 2009)
Total coal production in South Africa is approximately 244 million tonnes per
annum. Of this, thermal coal exports has remained stagnant around the 65
million tonnes per annum level for the last couple of years although the
current export capacity of the Richards Bay Coal Terminal (RBCT) is 72
million tonnes per annum. An additional 3 million tonnes per annum are
exported through the Matola Coal Terminal in Maputo and Bulk Connections
in Durban, resulting in total exports in the order of 68 million tonnes per
annum (DME, 2009) Coal produced for ESKOM, SASOL and the remaining
domestic consumers is discussed under Section 4.3, hereunder.
The top four coal mining companies (BHP Billiton, Anglo Coal, Sasol Mining
and EXXARO Resources) in South Africa produce more than 80% of the
country’s total production and are also to major players in the thermal export
market. Around 53 million tonnes of the 65 million tonnes exported are
produced by these four producers, as well as approximately 100 million
40
tonnes of the 110 million tonnes consumed by ESKOM. The following is a
detail description of their operations.
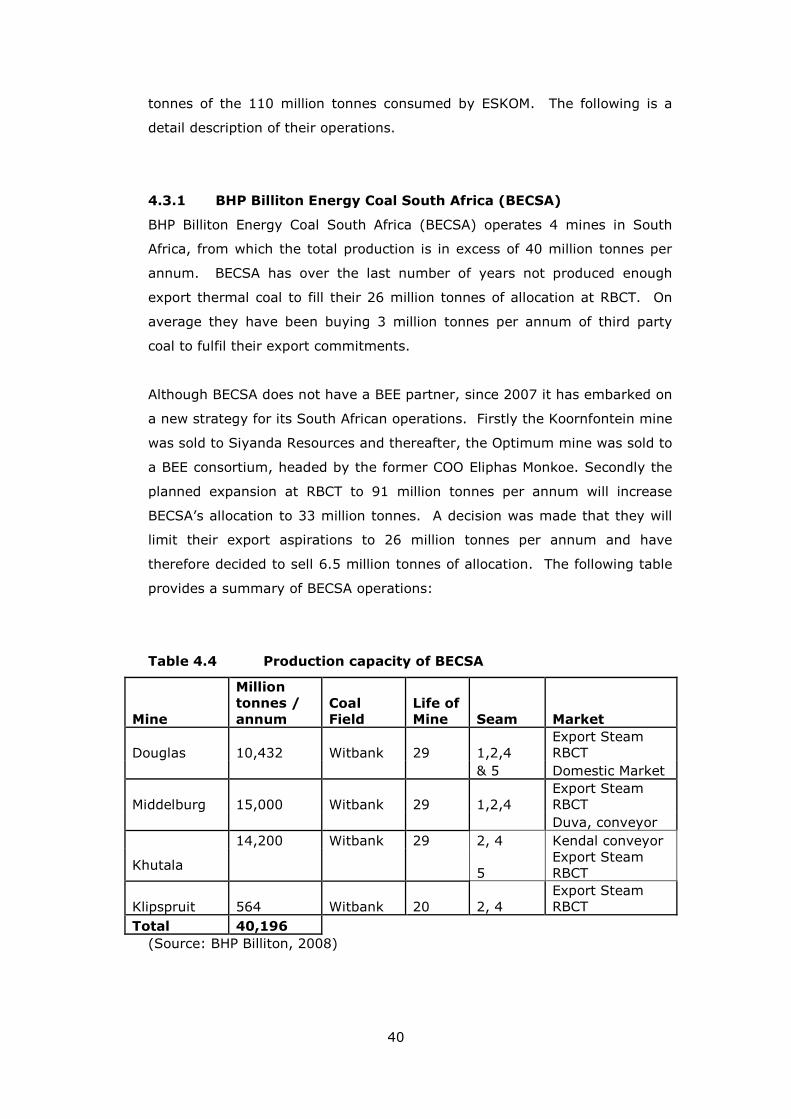
4.3.1 BHP Billiton Energy Coal South Africa (BECSA)
BHP Billiton Energy Coal South Africa (BECSA) operates 4 mines in South
Africa, from which the total production is in excess of 40 million tonnes per
annum. BECSA has over the last number of years not produced enough
export thermal coal to fill their 26 million tonnes of allocation at RBCT. On
average they have been buying 3 million tonnes per annum of third party
coal to fulfil their export commitments.
Although BECSA does not have a BEE partner, since 2007 it has embarked on
a new strategy for its South African operations. Firstly the Koornfontein mine
was sold to Siyanda Resources and thereafter, the Optimum mine was sold to
a BEE consortium, headed by the former COO Eliphas Monkoe. Secondly the
planned expansion at RBCT to 91 million tonnes per annum will increase
BECSA’s allocation to 33 million tonnes. A decision was made that they will
limit their export aspirations to 26 million tonnes per annum and have
therefore decided to sell 6.5 million tonnes of allocation. The following table
provides a summary of BECSA operations:
Table 4.4 Production capacity of BECSA
Mine
Million tonnes /
annum Coal Field
Life of Mine Seam Market
Douglas 10,432 Witbank 29 1,2,4 Export Steam RBCT
& 5 Domestic Market
Middelburg 15,000 Witbank 29 1,2,4 Export Steam RBCT
Duva, conveyor 14,200 Witbank 29 2, 4 Kendal conveyor
Khutala 5
Export Steam RBCT
Klipspruit 564 Witbank 20 2, 4 Export Steam RBCT
Total 40,196 (Source: BHP Billiton, 2008)
41
In order to sustain this export level as well as maintaining their supply to the
domestic market, two new projects have been approved. Klipspruit Colliery
has already started and is currently in the ramp-up phase. The mine should
reach full production of 7.4 million tonnes per annum by the end of 2009. Of
this production 4.5 million tonnes per annum will be exported and 2.9 million
tonnes per annum will be sold to ESKOM. The second project entails the
combination of Douglas and Middelburg Collieries in a new optimisation
program of reserves, mining and beneficiation. The project should result in a
total production of 22 million tonnes per annum by the end of 2009. A total
of 12 million tonnes per annum will be exported and the balance will be
provided to ESKOM. The BHP Billiton board has recently also approved the
start of a feasibility study of the Weltevreden reserve with the aim of
developing a mine with a potential production capacity of at least 10 million
tonnes per annum. It is apparent from this new strategy that BHP Billiton
should easily meet their long term commitments to both ESKOM and the
export market.
4.3.2 Anglo Coal
Anglo Coal is most likely the most stable and focused coal producer in South
Africa. Anglo operates 11 coal mines and has overtaken BHP Billiton as the
largest coal producer in the country.
Anglo Coal operations comprise of the following mines below:

42
Table 4.5 Production capacity of Anglo Coal
Mine
Million tonnes /annum Coal Field Seam Market
Greenside 3,182 Witbank / Highveld
4.5 Export Steam RBCT
Goedehoop 8,112 Witbank 2, 4 Low Ash Export Export Steam RBCT Local Met Market Isobonelo 5,224 Highveld 4 Sasol Synfuels Kriel 11,660 Highveld 4 Kriel Conveyor Kleinkopje 3,690 Witbank 1,2 &4 Low Ash Export Export Steam RBCT Local Met Market Landau 3,770 Witbank 1,2 Export Steam RBCT Local Steam New Denmark 5,572 Highveld 4 Tutuka Conveyor New Vaal 16,112 Sasol /
Vereeniging Top, Mid & Bottom
Lethabo Conveyor
Nooitgedacht 566 Witbank / Highveld
5 Export Steam RBCT
Mafube 870 Witbank 2 Arnot Truck Export Steam RBCT Total 58,758
(Source: Anglo Amercian,2009)
Anglo Coal has a project list that amounts to a total additional production of
37 million tonnes per annum at a capital investment of US$ 1.59 million over
the next 10 years. Anglo also plans a coal gasification project in the
Waterberg coalfield. This project will produce 23.9 mmcf at a capital
investment of US$ 355 million. The table provided lists the coal projects
according to completion date. It is clear that Anglo Coal is well positioned to
provide long term secured coal supplies to both their export and domestic
customers.
Table 4.6 Anglo Coal project list to increase capacity
Project Name Estimated Full
Production Date
Capital Expenditure
US$ million
Million tonnes
/annum
Zondagsfontein 2009 335 6,600 MAC West 2009 90 2,700 Elders O/C 2011 335 6,500 Elders U/G 2013 180 4,000 Heidelberg U/G 2013 120 4,000 New Largo 2017 530 13,700 Total 1,590 37,500
(Source: Anglo Amercian,2009)
43
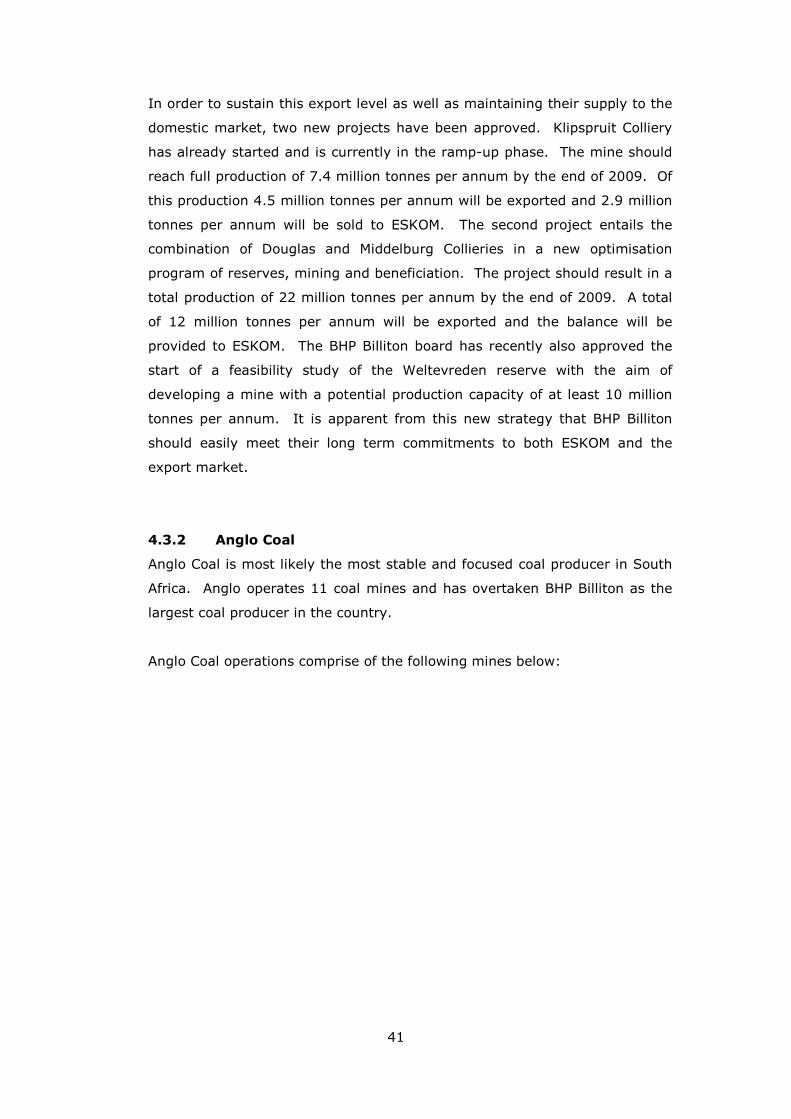
4.3.3 Sasol Coal
Sasol Coal is in essence the third largest producer of coal in the country, but
they have decided to retreat from the export market. Its main operations are
the Sigma: Mooikraal Colliery near Sasolburg and the Bosjesspruit,
Brandspruit, Middelbult and Syferfontein collieries and the Twistdraai export
operations at Secunda.
Of the 46 million tonnes per annum production only the Twistdraai low ash
product was exported at around 3.7 million tonnes per annum. In 2008,
Sasol Coal entered into an agreement with EXXARO whereby the Twistdraai
assets were placed in a new company called Igoda. EXXARO has an equity
stake of 35% and will be responsible for the marketing of the 4 million tonnes
per annum.
Table 4.7 Production capacity of SASOL
Mine
Million tonnes / annum Coal Field Market
Mooikraal 1,700 Vereeniging / Sasolburg SASOL Synthetic Fuels
Bosjesspruit Vereeniging / Sasolburg SASOL Synthetic Fuels Brandspruit Vereeniging / Sasolburg SASOL Synthetic Fuels Middelbult Vereeniging / Sasolburg SASOL Synthetic Fuels Syferfontein
43,000
Vereeniging / Sasolburg SASOL Synthetic Fuels Total 44,700
(Source: SASOL, 2009)
4.3.4 EXXARO Resources
EXXARO Resources is the result of the merger between Eyesizwe Coal and
the non-iron ore businesses of Kumba Resources. This merger has pushed
EXXARO into the fourth largest place as a coal producer in the South African
market. EXXARO operates 7 mines producing around 40 million tonnes per
annum.
EXXARO has aspirations to increase their exports to around 5 million tonnes
per annum but they also have a number of advanced projects in place to
achieve this target and further production increases. The largest project is
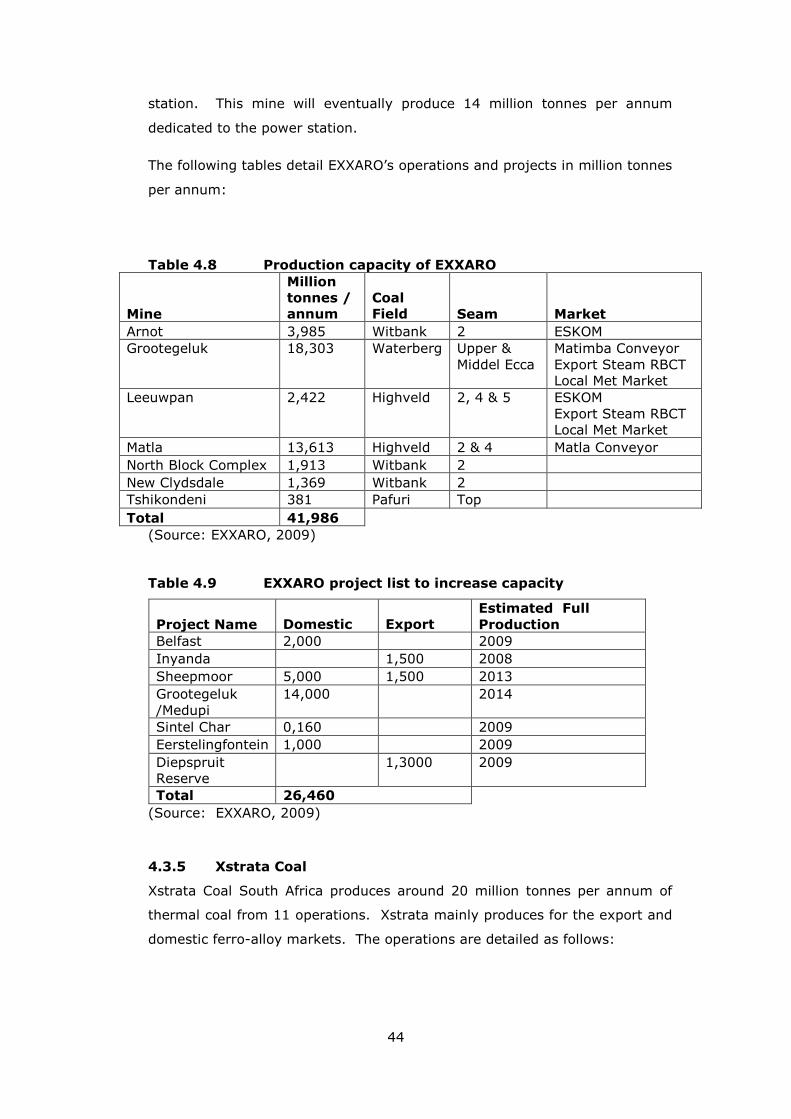
the second mine in Lepalale (Waterberg coal field) to feed the Medupi power
44
station. This mine will eventually produce 14 million tonnes per annum
dedicated to the power station.
The following tables detail EXXARO’s operations and projects in million tonnes
per annum:
Table 4.8 Production capacity of EXXARO
Mine
Million tonnes / annum
Coal Field Seam Market
Arnot 3,985 Witbank 2 ESKOM Grootegeluk 18,303 Waterberg Upper &
Middel Ecca Matimba Conveyor Export Steam RBCT Local Met Market
Leeuwpan 2,422 Highveld 2, 4 & 5 ESKOM Export Steam RBCT Local Met Market
Matla 13,613 Highveld 2 & 4 Matla Conveyor North Block Complex 1,913 Witbank 2 New Clydsdale 1,369 Witbank 2 Tshikondeni 381 Pafuri Top Total 41,986
(Source: EXXARO, 2009) Table 4.9 EXXARO project list to increase capacity
Project Name Domestic Export Estimated Full
Production
Belfast 2,000 2009 Inyanda 1,500 2008 Sheepmoor 5,000 1,500 2013 Grootegeluk /Medupi
14,000 2014
Sintel Char 0,160 2009 Eerstelingfontein 1,000 2009 Diepspruit Reserve
1,3000 2009
Total 26,460
(Source: EXXARO, 2009)
4.3.5 Xstrata Coal
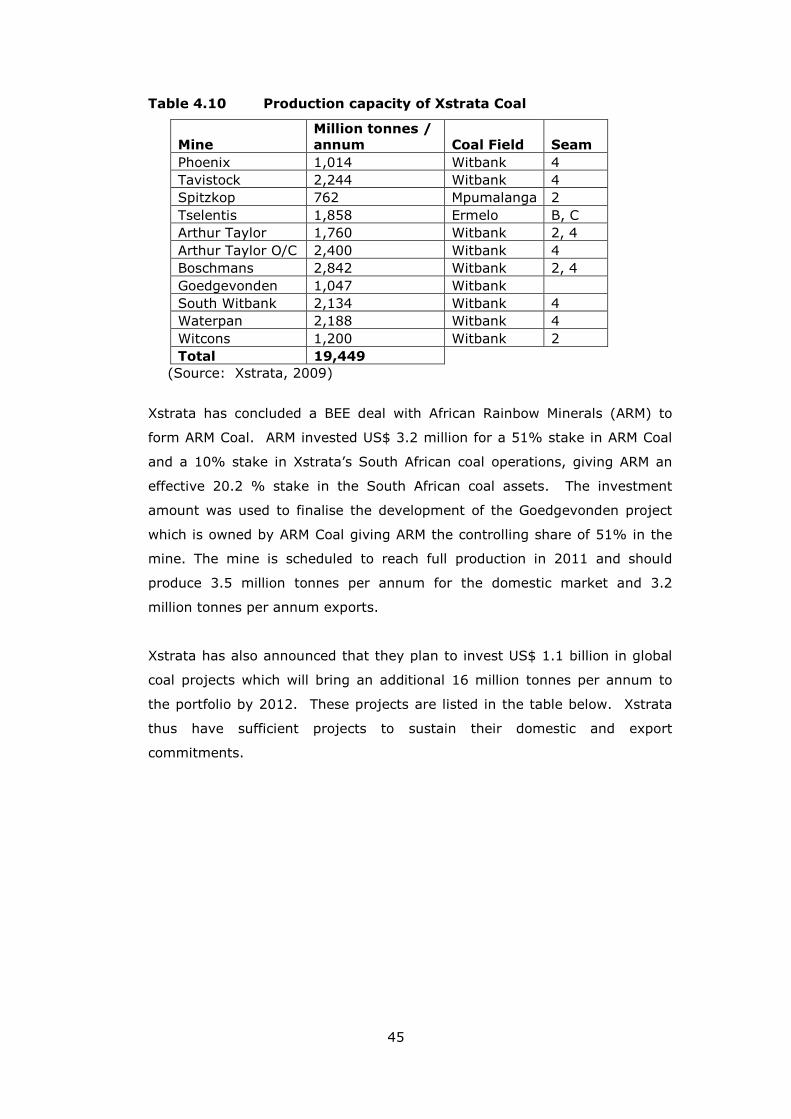
Xstrata Coal South Africa produces around 20 million tonnes per annum of
thermal coal from 11 operations. Xstrata mainly produces for the export and
domestic ferro-alloy markets. The operations are detailed as follows:
45
Table 4.10 Production capacity of Xstrata Coal
Mine Million tonnes / annum Coal Field Seam
Phoenix 1,014 Witbank 4 Tavistock 2,244 Witbank 4 Spitzkop 762 Mpumalanga 2 Tselentis 1,858 Ermelo B, C Arthur Taylor 1,760 Witbank 2, 4 Arthur Taylor O/C 2,400 Witbank 4 Boschmans 2,842 Witbank 2, 4 Goedgevonden 1,047 Witbank South Witbank 2,134 Witbank 4 Waterpan 2,188 Witbank 4 Witcons 1,200 Witbank 2 Total 19,449
(Source: Xstrata, 2009)
Xstrata has concluded a BEE deal with African Rainbow Minerals (ARM) to
form ARM Coal. ARM invested US$ 3.2 million for a 51% stake in ARM Coal
and a 10% stake in Xstrata’s South African coal operations, giving ARM an
effective 20.2 % stake in the South African coal assets. The investment
amount was used to finalise the development of the Goedgevonden project
which is owned by ARM Coal giving ARM the controlling share of 51% in the
mine. The mine is scheduled to reach full production in 2011 and should
produce 3.5 million tonnes per annum for the domestic market and 3.2
million tonnes per annum exports.
Xstrata has also announced that they plan to invest US$ 1.1 billion in global
coal projects which will bring an additional 16 million tonnes per annum to
the portfolio by 2012. These projects are listed in the table below. Xstrata
thus have sufficient projects to sustain their domestic and export
commitments.

46
Table 4.11 Xstrata Coal project list to increase capacity
Project
Estimated Full Production
Capex US$ mil
Million tonnes/annum
Southstock 5 Seam U/G 2008 70 3,000 Klipoortjie 2009 75 1,500 Tweefontein 2011 350 4,500 Goedgevonden ext 2012 300 4,400 Zonnebloem 2012 400 3,000 Total 1,195 16,400
(Source: Xstrata, 2009)
4.3.6 TOTAL Coal South Africa
TOTAL Coal SA has 4 million tonnes of export allocation at RBCT. The
company has been struggling to ensure equal production capacity, and as a
result have been rolling out a number of projects of the past 2 years in order
to guarantee full utilisation of its allocation. Forzando South and North were
developed along with Dorstfontein to ensure a minimum tonnage of 2,5
million tonnes. TOTAL Coal is responsible for the development of the Tumelo
Mine and Project, whilst its BEE partner Mmkau Mining is responsible for
operations.
Table 4.12 Production capacity of Total Coal SA
Mine
Million tonnes /annum Coal Field Market
Forzando 2,200 Highveld Export
Dorstfontein 0,700
Highveld Domestic and Export
Tumelo Mine 0,600 Ermelo
Export using wash plant at Forzando
Total 3,500 (Source: TOTAL Coal SA, 2009)
TOTAL Coal has one of the most significant BEE partners in the Coal Industry.
Mmkau Mining with chief executive Bridgette Radebe, have ensured an
additional Phase V RBCT allocation of 1 million tonnes. Although TOTAL Coal
has been managing all the mines and operations in the portfolio, Tumelo was
Mmkau Mining’s first controlling attempt at operations. Speculation in the
market is that Mmkau will eventually do a leveraged buy-out (on the back of
listing rumours) whereby TOTAL Coal will exit the industry.
47
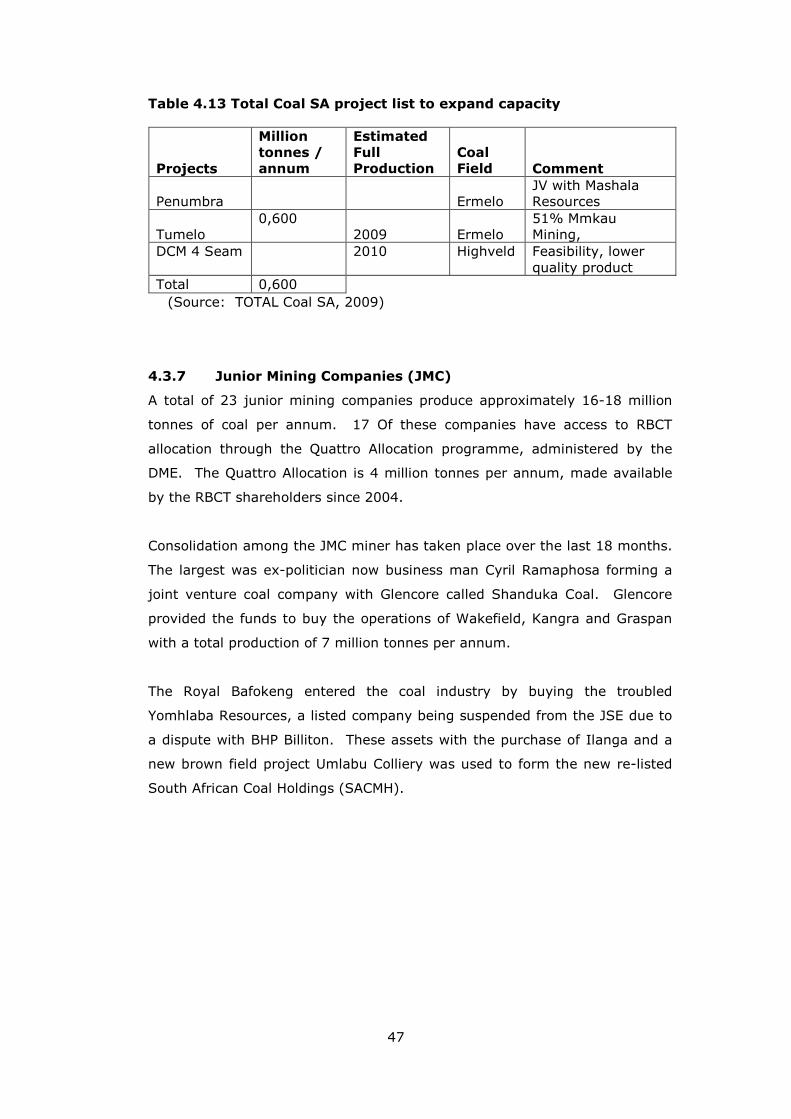
Table 4.13 Total Coal SA project list to expand capacity
Projects
Million tonnes / annum
Estimated Full Production
Coal Field Comment
Penumbra
Ermelo JV with Mashala Resources
Tumelo 0,600
2009 Ermelo 51% Mmkau Mining,
DCM 4 Seam
2010 Highveld Feasibility, lower quality product
Total 0,600 (Source: TOTAL Coal SA, 2009)
4.3.7 Junior Mining Companies (JMC)
A total of 23 junior mining companies produce approximately 16-18 million
tonnes of coal per annum. 17 Of these companies have access to RBCT
allocation through the Quattro Allocation programme, administered by the
DME. The Quattro Allocation is 4 million tonnes per annum, made available
by the RBCT shareholders since 2004.
Consolidation among the JMC miner has taken place over the last 18 months.
The largest was ex-politician now business man Cyril Ramaphosa forming a
joint venture coal company with Glencore called Shanduka Coal. Glencore
provided the funds to buy the operations of Wakefield, Kangra and Graspan
with a total production of 7 million tonnes per annum.
The Royal Bafokeng entered the coal industry by buying the troubled
Yomhlaba Resources, a listed company being suspended from the JSE due to
a dispute with BHP Billiton. These assets with the purchase of Ilanga and a
new brown field project Umlabu Colliery was used to form the new re-listed
South African Coal Holdings (SACMH).
48
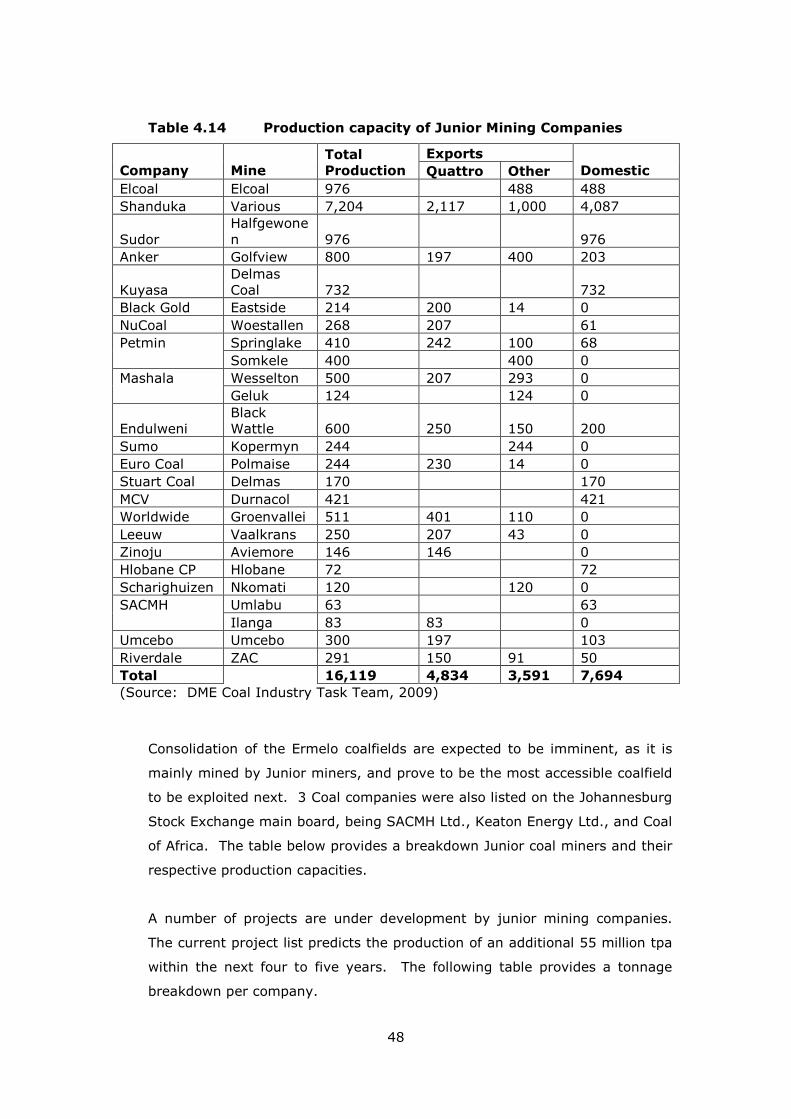
Table 4.14 Production capacity of Junior Mining Companies
Exports
Company Mine Total Production Quattro Other Domestic
Elcoal Elcoal 976 488 488 Shanduka Various 7,204 2,117 1,000 4,087
Sudor Halfgewonen 976 976
Anker Golfview 800 197 400 203
Kuyasa Delmas Coal 732 732
Black Gold Eastside 214 200 14 0 NuCoal Woestallen 268 207 61 Petmin Springlake 410 242 100 68 Somkele 400 400 0 Mashala Wesselton 500 207 293 0 Geluk 124 124 0
Endulweni Black Wattle 600 250 150 200
Sumo Kopermyn 244 244 0 Euro Coal Polmaise 244 230 14 0 Stuart Coal Delmas 170 170 MCV Durnacol 421 421 Worldwide Groenvallei 511 401 110 0 Leeuw Vaalkrans 250 207 43 0 Zinoju Aviemore 146 146 0 Hlobane CP Hlobane 72 72 Scharighuizen Nkomati 120 120 0 SACMH Umlabu 63 63 Ilanga 83 83 0 Umcebo Umcebo 300 197 103 Riverdale ZAC 291 150 91 50 Total 16,119 4,834 3,591 7,694
(Source: DME Coal Industry Task Team, 2009)
Consolidation of the Ermelo coalfields are expected to be imminent, as it is
mainly mined by Junior miners, and prove to be the most accessible coalfield
to be exploited next. 3 Coal companies were also listed on the Johannesburg
Stock Exchange main board, being SACMH Ltd., Keaton Energy Ltd., and Coal
of Africa. The table below provides a breakdown Junior coal miners and their
respective production capacities.
A number of projects are under development by junior mining companies.
The current project list predicts the production of an additional 55 million tpa
within the next four to five years. The following table provides a tonnage
breakdown per company.

49
Table 4.15 Planned capacity expansions by Junior Mining
Companies
Junior Mining
Company
Tonnage
Expansion
Black Gold 3,000
Coal of Africa Ltd. 9,200
Elitini Coal 10,000
Homeland Energy 8,500
Worldwide Coal 2,000
Endulwini 700
Keaton Energy 2,000
Khusela 2,000
Kuyasa 6,000
Mashala 5,000
SACMH Ltd. 1,500
Sudor 8,900
Total 55,800
(Source: DME Coal Industry Task Team, 2009)
The implementation of these projects should lift the junior miner contribution
to 71.6 million tonnes production per annum. At this stage export figures are
not available but is all these projects are completed a total of 10 million
tonnes per annum could be exported.
4.4 The South African Consumer Market
South Africa consumes approximately 175 million tonnes of coal per annum.
The following sections will discuss South African consumption in some degree
of detail.
4.4.1 ESKOM
ESKOM is a South African electricity public utility, established in 1923 as the
Electricity Supply Commission (ESCOM) by the government of South Africa in
terms of the Electricity Act (1922). The utility is the largest producer of
electricity in Africa, is among the top seven utilities in the world in terms of
50
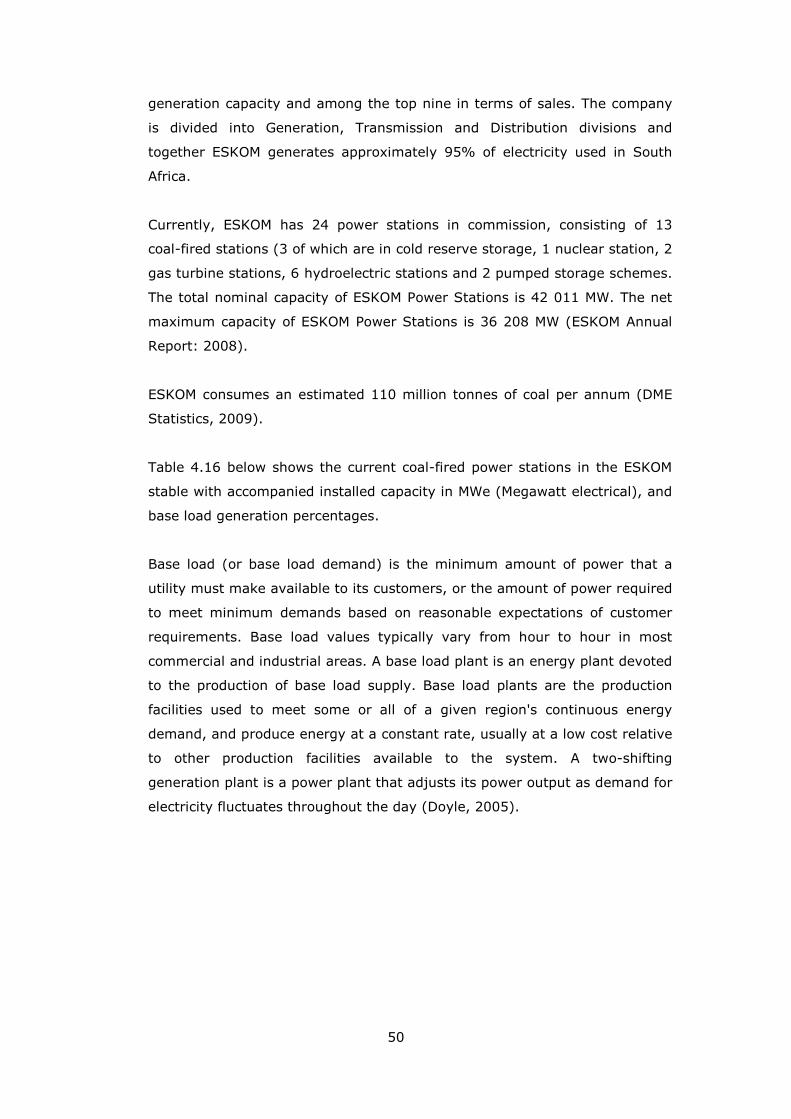
generation capacity and among the top nine in terms of sales. The company
is divided into Generation, Transmission and Distribution divisions and
together ESKOM generates approximately 95% of electricity used in South
Africa.
Currently, ESKOM has 24 power stations in commission, consisting of 13
coal-fired stations (3 of which are in cold reserve storage, 1 nuclear station, 2
gas turbine stations, 6 hydroelectric stations and 2 pumped storage schemes.
The total nominal capacity of ESKOM Power Stations is 42 011 MW. The net
maximum capacity of ESKOM Power Stations is 36 208 MW (ESKOM Annual
Report: 2008).
ESKOM consumes an estimated 110 million tonnes of coal per annum (DME
Statistics, 2009).
Table 4.16 below shows the current coal-fired power stations in the ESKOM
stable with accompanied installed capacity in MWe (Megawatt electrical), and
base load generation percentages.
Base load (or base load demand) is the minimum amount of power that a
utility must make available to its customers, or the amount of power required
to meet minimum demands based on reasonable expectations of customer
requirements. Base load values typically vary from hour to hour in most
commercial and industrial areas. A base load plant is an energy plant devoted
to the production of base load supply. Base load plants are the production
facilities used to meet some or all of a given region's continuous energy
demand, and produce energy at a constant rate, usually at a low cost relative
to other production facilities available to the system. A two-shifting
generation plant is a power plant that adjusts its power output as demand for
electricity fluctuates throughout the day (Doyle, 2005).
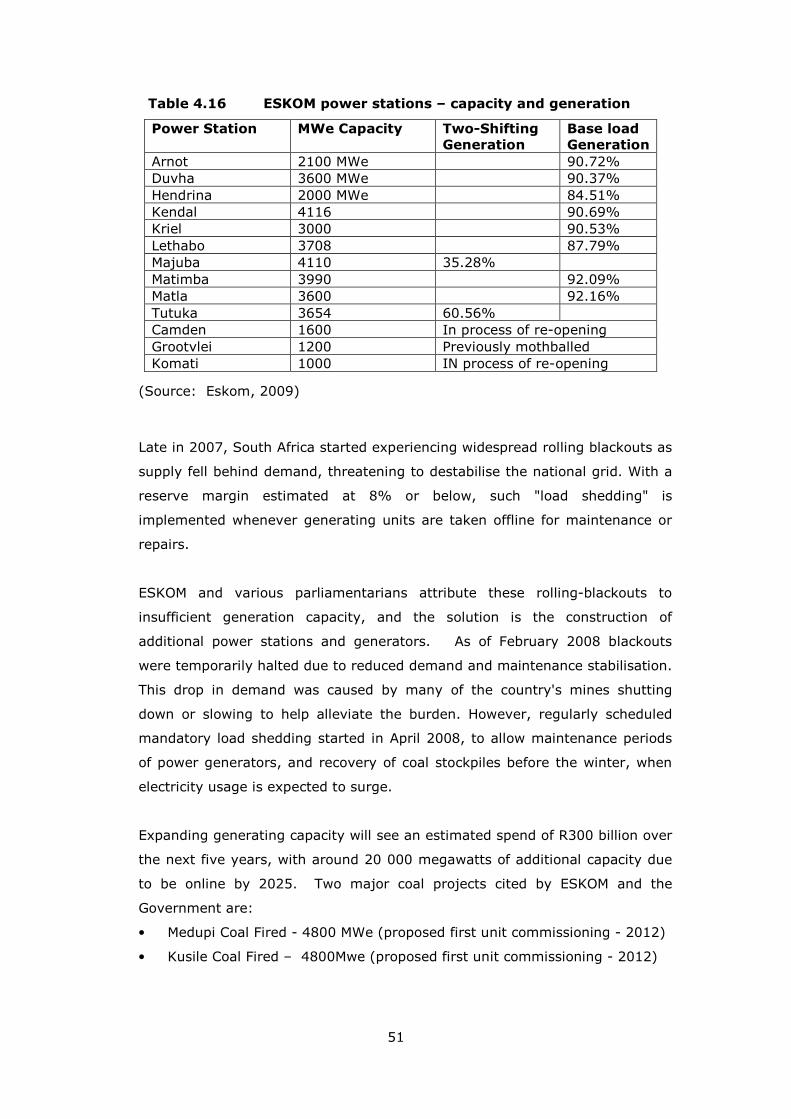
51
Table 4.16 ESKOM power stations – capacity and generation
Power Station MWe Capacity Two-Shifting Generation
Base load Generation
Arnot 2100 MWe 90.72% Duvha 3600 MWe 90.37% Hendrina 2000 MWe 84.51% Kendal 4116 90.69% Kriel 3000 90.53% Lethabo 3708 87.79% Majuba 4110 35.28% Matimba 3990 92.09% Matla 3600 92.16% Tutuka 3654 60.56% Camden 1600 In process of re-opening Grootvlei 1200 Previously mothballed Komati 1000 IN process of re-opening
(Source: Eskom, 2009)
Late in 2007, South Africa started experiencing widespread rolling blackouts as
supply fell behind demand, threatening to destabilise the national grid. With a
reserve margin estimated at 8% or below, such "load shedding" is
implemented whenever generating units are taken offline for maintenance or
repairs.
ESKOM and various parliamentarians attribute these rolling-blackouts to
insufficient generation capacity, and the solution is the construction of
additional power stations and generators. As of February 2008 blackouts
were temporarily halted due to reduced demand and maintenance stabilisation.
This drop in demand was caused by many of the country's mines shutting
down or slowing to help alleviate the burden. However, regularly scheduled
mandatory load shedding started in April 2008, to allow maintenance periods
of power generators, and recovery of coal stockpiles before the winter, when
electricity usage is expected to surge.
Expanding generating capacity will see an estimated spend of R300 billion over
the next five years, with around 20 000 megawatts of additional capacity due
to be online by 2025. Two major coal projects cited by ESKOM and the
Government are:
• Medupi Coal Fired - 4800 MWe (proposed first unit commissioning - 2012)
• Kusile Coal Fired – 4800Mwe (proposed first unit commissioning - 2012)

52
4.4.2 SASOL Synthetic Fuels
SASOL Synthetic Fuels consumption: Estimated 42.5 million tonnes per annum
(DME Statistics 2009).
The coal is consumed mostly for gasification feedstock and utilises coal for
SASOL’s complexes in Secunda and Sasolburg, and is produced mainly by
SASOL Mining operations. SASOL is the second largest consumer of thermal
coal in South Africa.
4.4.3 Remaining consumer market
Remaining coal consumption: Estimated 22.7 million tonnes per annum.
This includes approximately 4 million tonnes of anthracite and semi-soft coking
coal. The estimated thermal coal consumption is 18 million tonnes per annum
(DME, 2008).
Table 4.17 below provides the total coal tonnage consumption on an annual
basis in South Africa.
Table 4.17 South African domestic coal consumption in 2008
Industry Consumption /annum
Gold and Uranium Mines 8,736 Agriculture 27,324 Brick and Tile 68,628 Mining 536,040 Cement and Lime 815,532 Mittal Steel 1,083,372 Electricity 1,299,060 Metallurgical 1,531,560 Chemical Industries 1,754,628 Iron and Steel 3,156,144 Industries 3,845,256 Merchants and Domestic 8,599,320 TOTAL 22,725,600
(Source: DME, December 2008)
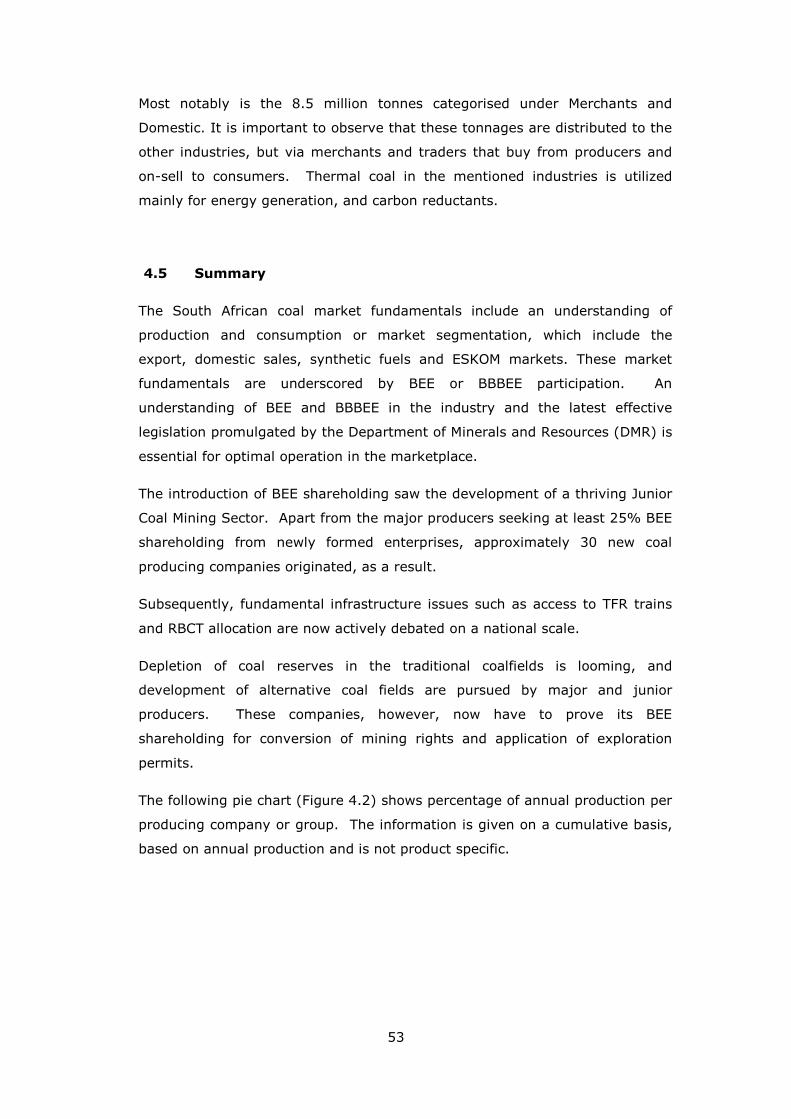
53
Most notably is the 8.5 million tonnes categorised under Merchants and
Domestic. It is important to observe that these tonnages are distributed to the
other industries, but via merchants and traders that buy from producers and
on-sell to consumers. Thermal coal in the mentioned industries is utilized
mainly for energy generation, and carbon reductants.
4.5 Summary
The South African coal market fundamentals include an understanding of
production and consumption or market segmentation, which include the
export, domestic sales, synthetic fuels and ESKOM markets. These market
fundamentals are underscored by BEE or BBBEE participation. An
understanding of BEE and BBBEE in the industry and the latest effective
legislation promulgated by the Department of Minerals and Resources (DMR) is
essential for optimal operation in the marketplace.
The introduction of BEE shareholding saw the development of a thriving Junior
Coal Mining Sector. Apart from the major producers seeking at least 25% BEE
shareholding from newly formed enterprises, approximately 30 new coal
producing companies originated, as a result.
Subsequently, fundamental infrastructure issues such as access to TFR trains
and RBCT allocation are now actively debated on a national scale.
Depletion of coal reserves in the traditional coalfields is looming, and
development of alternative coal fields are pursued by major and junior
producers. These companies, however, now have to prove its BEE
shareholding for conversion of mining rights and application of exploration
permits.
The following pie chart (Figure 4.2) shows percentage of annual production per
producing company or group. The information is given on a cumulative basis,
based on annual production and is not product specific.
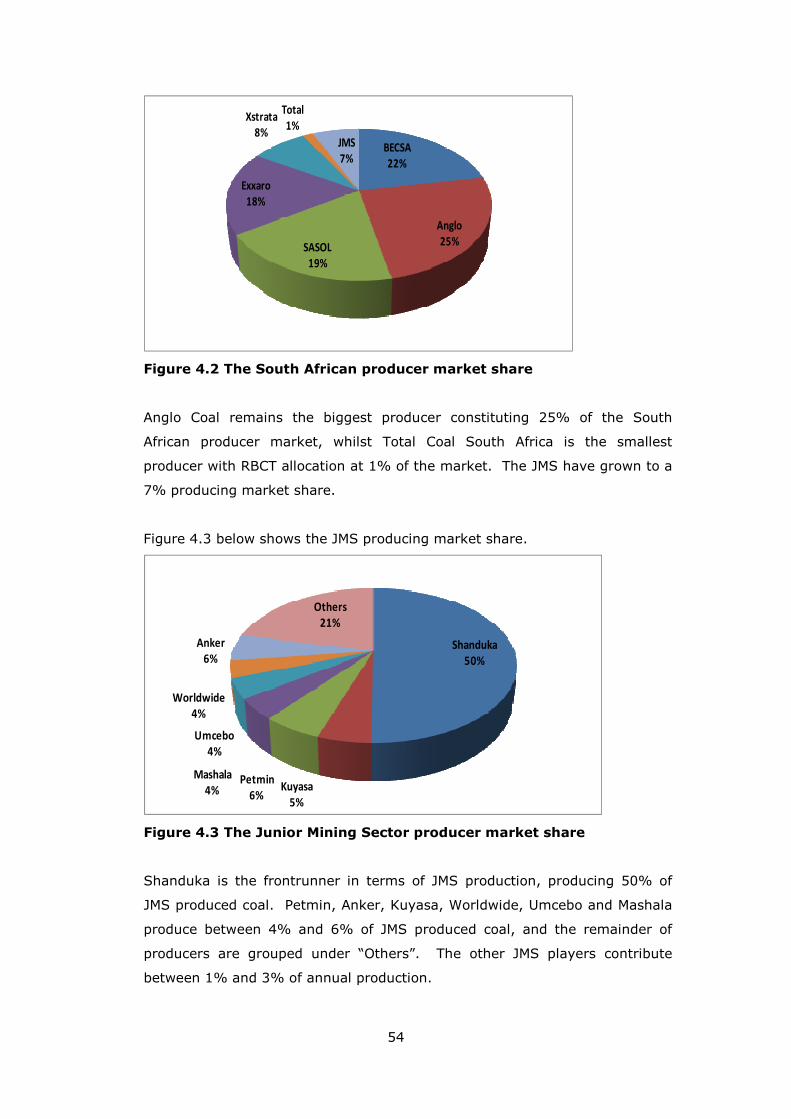
54
BECSA
22%
Anglo
25%SASOL
19%
Exxaro
18%
Xstrata
8%
Total
1%
JMS
7%
Figure 4.2 The South African producer market share
Anglo Coal remains the biggest producer constituting 25% of the South
African producer market, whilst Total Coal South Africa is the smallest
producer with RBCT allocation at 1% of the market. The JMS have grown to a
7% producing market share.
Figure 4.3 below shows the JMS producing market share.
Shanduka
50%
Kuyasa
5%
Petmin
6%
Mashala
4%
Umcebo
4%
Worldwide
4%
Anker
6%
Others
21%
Figure 4.3 The Junior Mining Sector producer market share
Shanduka is the frontrunner in terms of JMS production, producing 50% of
JMS produced coal. Petmin, Anker, Kuyasa, Worldwide, Umcebo and Mashala
produce between 4% and 6% of JMS produced coal, and the remainder of
producers are grouped under “Others”. The other JMS players contribute
between 1% and 3% of annual production.
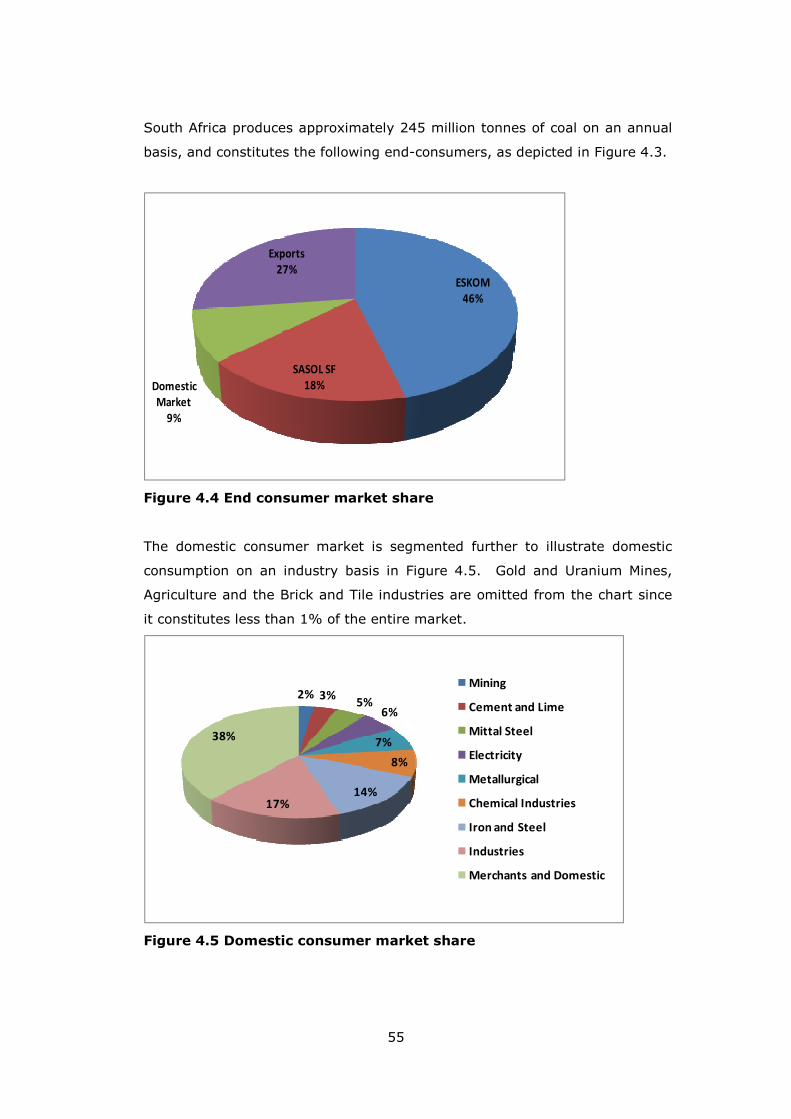
55
South Africa produces approximately 245 million tonnes of coal on an annual
basis, and constitutes the following end-consumers, as depicted in Figure 4.3.
ESKOM
46%
SASOL SF
18%Domestic
Market
9%
Exports
27%
Figure 4.4 End consumer market share
The domestic consumer market is segmented further to illustrate domestic
consumption on an industry basis in Figure 4.5. Gold and Uranium Mines,
Agriculture and the Brick and Tile industries are omitted from the chart since
it constitutes less than 1% of the entire market.
2% 3%5%
6%
7%
8%
14%17%
38%
Mining
Cement and Lime
Mittal Steel
Electricity
Metallurgical
Chemical Industries
Iron and Steel
Industries
Merchants and Domestic
Figure 4.5 Domestic consumer market share

56
A number of very important projects are planned to increase production or
replace depleted mines. The most important and certain projects to be in full
production by 2012 are listed below. (Note that EXXARO’s Grootegeluk is
included as the project is of national interest).
Table 4.18 The most important planned coal projects in South Africa
Company Name
Project Name Million tonnes /annum
Estimated Date of Full Production
BECSA Klipspruit 7,400 2009 Douglas-Middelburg 22,000 2009 Anglo Coal Zondagfontein 6,600 2009 MAC West 2,700 2009 Elders O/C 6,500 2011 EXXARO Belfast 2,000 2009 Inyanda 1,500 2008 Sintel Char 0,160 2009 Grootegeluk 14,000 2014 Eerstelingfontein 1,000 2009 Xstrata Southstock 5 Seam 3,000 2008 Klipoortjie 1,500 2009 Tweefontein 4,500 2011 Goedgevonden Ext 4,400 2012 Zonnebloem 3,000 2012 Total / Mmkau Tumelo 0,600 2009 TOTAL Project Production 80,100

57
The bulk commodity or product in this study is thermal coal. Given the
characteristics of South African coal production, semi-soft coking coal, coking
coal and anthracite will not be discussed as part of this study. Thermal coal
divided into 3 categories, namely ESKOM, Domestic and Export Sales, each
product having its own petrographic characteristics, sizing, value-in-use and
markets.
The market for thermal coal can be described as a mature market with very
little in the way of product development. However, as coal resources are
depleted on a global scale and mining conditions become more difficult,
consumers adapt qualities where necessary and if possible.
Although geology dictates the product to be marketed, mining and
beneficiation often has to be revised or additional beneficiation measures
have to be applied to deliver a product according to consumer specifications.
This always has a cost implication, and marketing and production has to
measure the cost increase to the reigning market price at all times. The
international cost curve based on FOB cash costs indicates the
competitiveness of each coal producing nation. An understanding of the cost
curve is essential from a macro economic perspective.
The importance of understanding thermal coal consumption lies in the
technical understanding of burners, kilns and stokers, which is discussed in
depth in this chapter. Marketing professionals need to understand technical
conditions from each consumer, in order to forge relationships and ensure
long term off-take from global customers.
5.1 Geology and Mining
The inherent quality of an operation’s geology will determine its market
focus. The geology will indicate the washability of the run-of-mine production,
CHAPTER 5
PRODUCT

58
which in turn will determine the product that can be sold into the market
given that beneficiation and/or crushing and screening are required.
The mine plan is determined from extensive drilling as part of pre-mining
exploration and dictates the marketing plan for years in advance. This is
essential for planning in terms entering into long term contracts with
consumers and buyers. The method of mining is usually a good determining
factor to indicate the quantity of product that will be available for sales.
Mining is characterised as either underground or open cast mining.
Underground mining in coal production is often referred to as adit mining,
since it is not conventional underground mining with shaft sinking and the
seams are reached from a surface incline. Different mining methods are used
applied lower seam availability than for thicker seams, which indirectly
indicate the quantities available from the geology. Lower seams (0.7-4
meters) have lower production yields than thicker accessible seams where (2-
8 meters). Strip ratios in opencast mining indicate the amount of overburden
that has to be removed within the mining area, to mine the coal available as
part of the geology. Strip ratios vary from 1:1 to 1:7 and usually indicate the
mining method, timing and cost before the actual product can be mined, but
forms part of the ultimate production cost.
Some coals can be placed on the market without the need for any form of
beneficiation. This does however, indicate that the seam thickness of the
geology should be large enough to ensure clean seam mining. In the case of
lower seam thicknesses screening, crushing, hand picking and beneficiation
becomes essential. Such processes are costly and increase production costs,
but ultimately ensure production of high quality product(s), and higher
achieved prices.
Beneficiation plants are erected with the company’s ability to produce run-of-
mine and successfully feeding the plant without unnecessary stoppages.
Beneficiation plants are characterized as a certain tonnage per hour feed, e.g.
100 tonnes per hour etc. This is also a clear indication to marketing on daily,
monthly and annual production numbers in order to contract appropriately
with consumers and buyers.

59
5.2 Production Cost
Costing is discussed in detail in Chapter 2, and it also related on a micro-
economic level to pricing in Chapter 7. Production cost is discussed in this
chapter from a macro-economic perspective, thus relating to each specific
producing nation and its accompanied free-on-board (FOB) cash cost. This
comparison is reviewed to gain insight into the competitiveness of producing
nations, and indicates the lowest level of FOB pricing which an individual
country can profitably relate to.
The production costs are aggregated for export pricing and exporters on a
cumulative basis. The cash costs could be related for domestic costs (free –
on-mine) by subtracting freight and port loading costs.
Figure 5.1 International cash cost curve
(Source: Macquarie Bank, Coal Analyses 2009)

60
Figure 5.1 depicts the various coal producing countries and its accompanied
FOB cost, which comprises labour, mining and processing, royalties, freight
and port loading. Table 5.1 supplements Figure 5.1 by representing the
various different coal producing countries, their ranking in terms of cash cost
and its annual production.
Table 5.1 Country ranking according to FOB cash cost
Country Export Mt Cash Cost US$/t Rank
Venezuela 5.7 27.07 1
Colombia 65.4 27.20 2
China 49.2 28.59 3
South Africa 59.5 32.15 4
Indonesia 145.7 33.37 5
Australia 121.9 38.32 6
New Zealand 0.2 40.58 7
Russia 10.7 48.12 8
USA 5.0 50.64 9
Canada 4.7 57.03 10
Total / Average 468.0 33.81
(Source: Macquarie Bank, Coal Analyses 2008)
Venezuela, Colombia and China rank 1-3 respectively on the international
cost curve, indicating that their cash costs are the cheapest globally. South
Africa ranks as number four on the international production cost curve, which
indicates its competitiveness in global coal production, but also indicates its
continuous drive to keep costs at a level below US$ 33/ tonne. Indonesia
and Australia are by far the largest producers of coal (thermal and coking
coal) and continuous to have a production cost level below US$ 39/ tonne.
Canada, the USA, Russia and New Zealand are the highest cost producers
and will be the first countries to loose its competitiveness when prices fall to
production cost levels (at US$ 40 – 57).
5.3 Technical Analyses
Petrographic and proximate analyses throughout the production process are
of paramount importance. Typically, a mining operation has to establish an
on-site laboratory for these purposes. Currently in South Africa, mining

61
companies contract with third party independent service providers such as
Inspectorate MacLauchlan and Lazaar, SGS, South African Bureau of
Standards or Witlab. Major producers operate laboratories which are ISO and
SABS accredited.
The on-site lab is an independent supplier of technical information on the
geology via exploration activities, product in process and final product. The
on-site laboratory has a major responsibility in terms of delivering in-time
technical information to the production and marketing team in order to
ensure that the product delivered to consumers and buyers is within
prescribed specification.
Sampling is a key element of technical analyses and it is the responsibility of
the third party independent on-site laboratory or the producer to provide
skilled staff to ensure scientific and efficient sampling is done for analytical
purposes.
5.4 Single Product and Multi Product Mines
Some geology only makes provision for power station coal, or lower graded
domestic material. These mines are referred to as single product mines.
Mines mining multiple seams can yield export or A-grade domestic material
as well as power station coal. These are usually mega operations servicing
production to ESKOM, municipal power stations, the domestic market and the
export market.
5.5 Product Specification
Thermal coal is defined in terms of its typical quality. The typical quality is
classified in the composite of proximate analyses, ultimate analyses, calorific
value, forms of sulphur and milling. Consumers and buyers often request
additional analyses on milling, ash composition and ash fusion temperatures.
Table 5.1 is a typical example of a specification sheet for marketing purposes
taken from an operating mine in South Africa. The specification sheet is for
typical export product, but can also be applied for domestic marketing
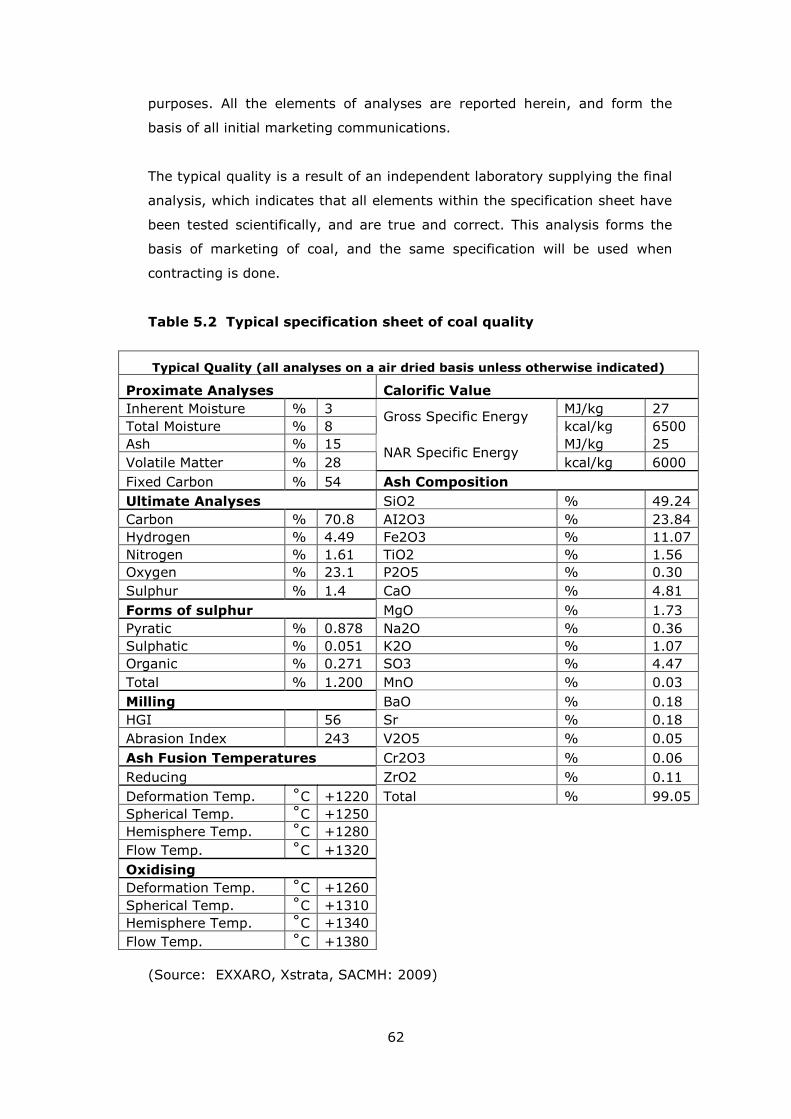
62
purposes. All the elements of analyses are reported herein, and form the
basis of all initial marketing communications.
The typical quality is a result of an independent laboratory supplying the final
analysis, which indicates that all elements within the specification sheet have
been tested scientifically, and are true and correct. This analysis forms the
basis of marketing of coal, and the same specification will be used when
contracting is done.
Table 5.2 Typical specification sheet of coal quality
Typical Quality (all analyses on a air dried basis unless otherwise indicated)
Proximate Analyses Calorific Value
Inherent Moisture % 3 MJ/kg 27 Total Moisture % 8
Gross Specific Energy kcal/kg 6500
Ash % 15 MJ/kg 25 Volatile Matter % 28
NAR Specific Energy kcal/kg 6000
Fixed Carbon % 54 Ash Composition
Ultimate Analyses SiO2 % 49.24 Carbon % 70.8 AI2O3 % 23.84 Hydrogen % 4.49 Fe2O3 % 11.07 Nitrogen % 1.61 TiO2 % 1.56 Oxygen % 23.1 P2O5 % 0.30 Sulphur % 1.4 CaO % 4.81
Forms of sulphur MgO % 1.73 Pyratic % 0.878 Na2O % 0.36 Sulphatic % 0.051 K2O % 1.07 Organic % 0.271 SO3 % 4.47 Total % 1.200 MnO % 0.03 Milling BaO % 0.18 HGI 56 Sr % 0.18 Abrasion Index 243 V2O5 % 0.05
Ash Fusion Temperatures Cr2O3 % 0.06 Reducing ZrO2 % 0.11 Deformation Temp. ˚C +1220 Total % 99.05 Spherical Temp. ˚C +1250 Hemisphere Temp. ˚C +1280 Flow Temp. ˚C +1320
Oxidising Deformation Temp. ˚C +1260 Spherical Temp. ˚C +1310 Hemisphere Temp. ˚C +1340 Flow Temp. ˚C +1380
(Source: EXXARO, Xstrata, SACMH: 2009)
63
The typical quality is reported for proximate analysis, ultimate analysis, forms
of sulphur, milling, ash fusion temperatures, oxidizing temperatures, calorific
value and ash composition. These analyses are discussed hereunder in full
detail.
5.5.1 Specification parameters and elements
According to Doyle, (2005:1-15) the following parameters and elements are
recorded for technical and typical specification in the marketing process:
• Air dried basis: This basis is equivalent to as analysed basis when the
analyses have been performed on an air dried basis.
• As received basis: Analytical data calculated to an as received moisture
content.
• Dry basis: Calculation of analytical data to a condition of zero moisture.
• Proximate analyses: Ash content as a percentage, volatile matter as a
percentage, inherent moisture as a percentage, total moisture as a
percentage, and fixed carbon as the sum of the aforementioned. Ash is the
inorganic residue after the incineration of coal to constant weight under
standard conditions is less than the mineral matter because of the
chemical changes occurring during incineration, with most important
differences being loss of water or hydration, loss of carbon dioxide, and
loss of sulphurous gasses from sulphides. Volatile matter is the loss in
mass, less that due to moisture, when coal is heated under standard
conditions and out of contact with air. Inherent moisture is used to
indicate air dried moisture. Total moisture in the coal as sampled and
removable under standard conditions. Fixed carbon is a component of
proximate analysis, calculated by difference, i.e. 100% less the sum of
moisture, ash and volatile matter. Intended to give an indication of char
yield.
• Ultimate analyses: The analysis of coal expressed in terms of carbon,
hydrogen, nitrogen, oxygen and sulphur – all expressed as a percentage.
The analysis refers to the carbonaceous material only and hence is
expressed on a dry ash free basis or dry mineral matter free basis.
Oxygen is estimated by difference.
64
• Forms of sulphur: Sulphur can be part of the carbonaceous material in
coal or part of the minerals as sulphates or sulphised. Forms of sulphur
dioxide during coal combustion, which is a pollutant and many countries,
have regulations regarding emissions to the atmosphere. Pyratic,
sulphatic, organic and the total sulphur content is the sum of the
aforementioned three forms, expressed as a percentage. Where the
sulphur is pyretic or sulphatic it is part of the mineral matter and its
content can be lowered by beneficiation. Organic sulphur is distributed
through the carbonaceous part of the coal and cannot be beneficiated to a
lower content. Pyritic sulphur is often blamed for spontaneous
combustion.
• Calorific value: Calorific Value is the energy value carried in he coal and
the major indication of heat value that can be expected by consumers and
buyers in their processes. Calorific value is expressed as Kcal/kg in
exports markets and as Mj/kg in the domestic market. The index gives an
indication of the propensity for the coal to cause slagging problems during
combustion.
• Milling: Milling refers to the hardness of the material, and gives an
indication of contamination with mining matter during the mining process.
The Hardgrove Index and Abrasion Index indicate the milling of the
product. The Hardgrove Grindability index relative grindability or ease of
pulverization. High values indicate a coal easy to pulverize and low values
indicate coals hard to pulverize. The Abrasion Index indicates the
abrasiveness of coal by monitoring indicates the loss in weight of four
metal blades which mechanically stir a sample of coal. The index is the
number of milligrammes of metal abraded from the metal blades per
kilogram of coal used.
• Ash analysis: Ash composes complex oxides and the ash analysis
expresses this composition in terms of its component oxides. Ash
generally consists of mostly silica (SiO2) and alumina (A12O3). The
presence of large amounts of the oxides of iron (Fe2O3), calcium (CaO),
sodium (Na2O) and or potassium (K2O) generally indicates an ash with
low ash fusion temperatures. The ash analyses differ from the
composition of minerals in the parent coal.
• Ash Fusion Temperatures: Ash Fusion temperatures are reported in
terms of oxidizing and reducing characteristics and are expressed in
temperatures range between 900oC up to 1600oC. The temperatures

65
which can be recorded are initial deformation temperature, softening
temperature, hemisphere temperature and flow temperature.
5.6 Product Utilisation
Thermal coal is used for energy generation by two basic markets, namely the
power generators and cement manufacturers. Power generators in the
domestic market are ESKOM and municipal power stations, but also include
kiln energy (for cement producers). In the export market, the use of coal is
far more sophisticated in terms of the quality of material that can be utilised
in processes. Cement manufacturers both domestically and for export
consumption use thermal coal in the process of manufacturing.
5.6.1 Power generation
Coal fired power stations generate electricity via steam. At high temperature
and pressure, steam is generated in the power station boilers and this drives
the turbines to generate the electricity. When steam is used as generating
medium, only one third of the available energy in the coal is utilised. The
remainder is passed to the atmosphere vial cooling towers or water cooling,
or can be utilised, as in Scandinavia, for district heating.
Modern power stations can achieve efficiencies of 35-38%, while older
stations may only be 30% efficient with older smaller units achieving only
efficiencies in the mid-twenty percentage (GWC Coal Handbook, 1991).
5.6.2 Pulverised coal firing
Merrick (1984) explains that pulverised coal firing is combustion of powdered
coal suspended as a cloud of small particles in the combustion air. It does
not require a supporting grate and therefore eliminates restrictions on
equipment size, and the reason for its wide scale adoption is its suitability in
very large boilers. Significantly more heat is released per unit volume than in
stoker firing. Because the coal is carried by the combustion air, residence
times are much shorter than for stokers, just a few seconds. Despite the
short residence time, good burnout can be achieved as long as the coal is
66
sufficiently finely divided; depending on the rank of the coal, between 60%
and 90% should pass through a 200 mesh screen (75 microns).
When considering a bituminous coal of medium or high volatiles, 70% of the
coal should be this fine. The most important use of pulverised coal firing is in
steam raising for electricity generation, but it is also the method used for
firing cement kilns.
Pulverisation is usually achieved in air-swept impact or attrition mills that
also classify the coal, and coal of the required fineness is pneumatically
conveyed to burners in the walls of the furnace. The air that transports the
coal through the mill to the burner is call the primary air and will be 20-25%
of the total combustion air. It is heated to a temperature which will depend
on the moisture content of the coal, but which is normally 250-350°C, and
which is set so that the coal is dried as it passes through the mill and that the
exit temperature as it leaves the mill and transports the coal to the burner, is
no higher than 85°C. The remainder of the air, which is called the secondary
air, is injected around each burner to promote fast combustion close to the
burner tip (GWC Coal Handbook, 1991).
Indirect firing is when the pulverised coal is stored prior to combustion –
direct firing is when the pulverised coal is burnt immediately as it has been
pulverised.
Approximately, 10-40% of the ash ends up being removed from the bottom
of the furnace with the rest removed as fly ash from the exhaust gas,
normally by means of an electrostatic precipitator. The system can either be
designed for the ash removal at the bottom of the furnace to be in a dry
state, a dry bottom boiler, or for it to be a molten slag, a wet bottom boiler.
Coals to be used in the latter type of furnace are restricted to those with a
low flow ash fusion temperature, typically 1,250°C, though some furnaces
are designed for 1,350°C.
An example of the wet bottom furnace is the cyclone furnace in which coal is
injected tangentially into a cylindrical horizontal cyclone furnace and burns
while it spirals to the opposite end. This system can handle larger sized coal
than normal pulverised firing, and 90% of the ash is discharged as a molten
slag but it has the drawback of a high NOx level. Generally, power stations
67
operate with dry bottom furnaces. There needs to be sufficient radiant heat
transfer surface area in the furnace to ensure adequate cooling of the furnace
exit gasses before it encounters the convective heat transfer surfaces to bring
the temperature down to below 1,050°C so that it is below the initial fusion
temperature of the ash (Merrick, 1984:358)
5.6.3 Burners
The following burners are classified by Doyle (2005) and the GWC Coal
Handbook, (1991):
• Pulverised coal firing burners
Burner function is to introduce the pulverised firing and the combustion air
into the furnace in such a way that a stable flame-front is formed some
distance from the burner. The aim is to achieve rapid and efficient mixing
of the coal and the air, and to direct the incoming gasses so that the full
volume of the furnace chamber is utilised but without impingement of the
flame on the furnace wall.
Three main types of burners are used in dry bottom power station boilers, as
discussed below.
• Turbulent burners
Construction to these burners is the same as those used for oil-firing.
Stable combustions are dependent on the fuel being sufficiently easily
ignited for the flame to be established within the limits of an outer and
inner recirculation eddy. The burners are usually spaced uniformly across
the width of the front or rear wall. Each burner has its own independent
flame envelope.
• Tangential or corner burners
Coal and air are fed from each of the four corners and there is essentially
a simple overall flame envelope. The flame does not develop close to the
walls or burner and different fuel: air rations at the burners do not have
such consequences as with wall fired boilers. The incoming streams are
thoroughly mixed due to the rotation of the central core of gas. The
burners can be tilted in a vertical plan between 30° above and 30° below
the horizontal in order to control the position of the zone of maximum
temperature up or down. There is therefore more control over the peak
flame temperature with this type of burner and as a result, lower NOx
levels can be achieved.
68
• Down-firing burners
These burners are used for anthracite and semi-anthracite. The aim is to
delay the mixing with secondary air until the coal/primary air mixture has
been heated to 800-900°C, the temperature required for high rank coals.
5.6.4 Stokers
A stoker consist of a feed and a grate and is used for feeding coal into a
furnace, distributing it over a grate, admitting air to the coal for combustion
and providing a means for discharge of ash. Today’s stokers can be sorted
into three categories based on the wait in which coal is fed into the grate.
The following burners are classified by Doyle (2005).
• Underfeed stokers
Coal is introduced through retorts at a level below the location of air
admission to the fuel bed, i.e. the coal is introduced into the combustion
zone from below.
• Overfeed stokers
Feeding A stoker in which is fed onto grates above the point of air
admission to the fuel bed. The most common forms are the chain and
travelling grate stokers which have a moving endless grate which conveys
coal into and through the furnace where it is burned, after which it
discharges the ash. In the chain grate stoker a moving endless chain acts
as the grate surface. In the travelling grate stoker the grate is separate
from but is supported on and driven by chains.
• Spreader stoker
Coal is distributed into the furnace from a location above the fuel be with a
portion of the coal burned in suspension and a portion on the grate.
Spreader stokers can either be fixed bed with a stationary grate, or a
dump grate in which fuel is fed onto a non-moving grate which is arranged
to allow intermittent discharge of ash through tilting action of the grate
bars in which the grate moves from the rear to the front of the boiler.
5.7. Coal Quality Requirements
The following specifications should normally be adhered to for pulverised coal
firing and stokers (Doyle, 2005).
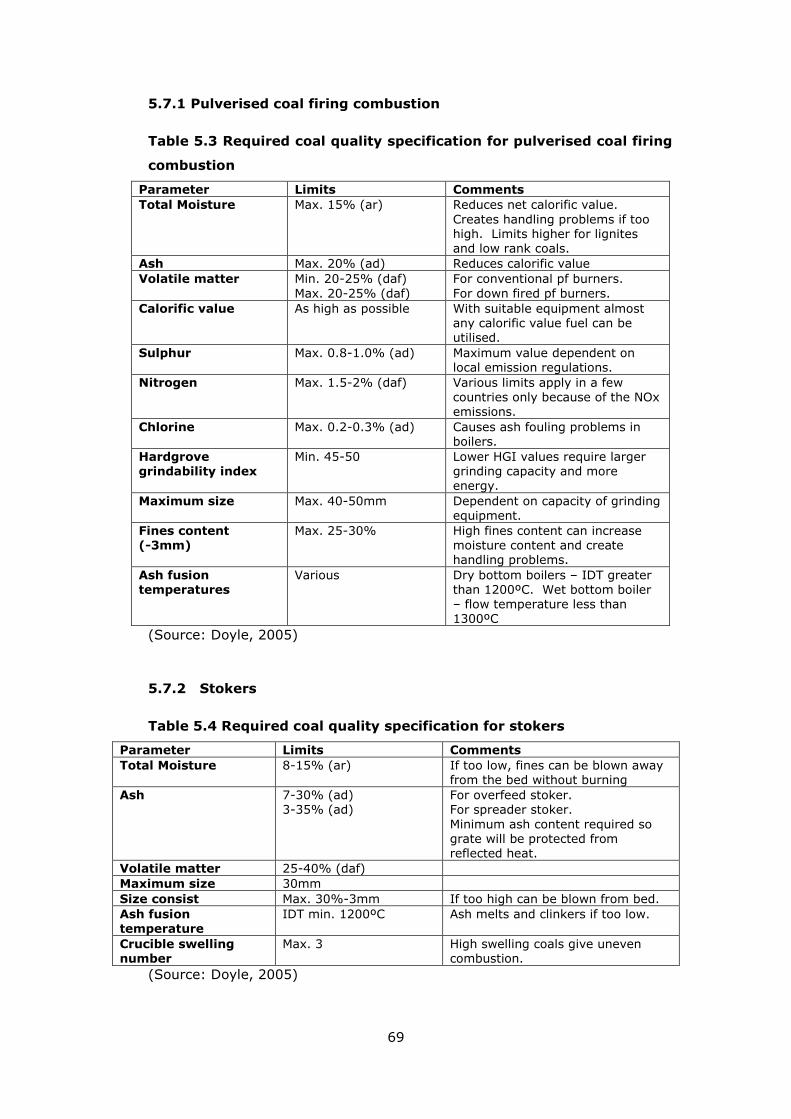
69
5.7.1 Pulverised coal firing combustion
Table 5.3 Required coal quality specification for pulverised coal firing
combustion
Parameter Limits Comments
Total Moisture Max. 15% (ar) Reduces net calorific value. Creates handling problems if too high. Limits higher for lignites and low rank coals.
Ash Max. 20% (ad) Reduces calorific value Volatile matter Min. 20-25% (daf)
Max. 20-25% (daf) For conventional pf burners. For down fired pf burners.
Calorific value As high as possible With suitable equipment almost any calorific value fuel can be utilised.
Sulphur Max. 0.8-1.0% (ad) Maximum value dependent on local emission regulations.
Nitrogen Max. 1.5-2% (daf) Various limits apply in a few countries only because of the NOx emissions.
Chlorine Max. 0.2-0.3% (ad) Causes ash fouling problems in boilers.
Hardgrove grindability index
Min. 45-50 Lower HGI values require larger grinding capacity and more energy.
Maximum size Max. 40-50mm Dependent on capacity of grinding equipment.
Fines content (-3mm)
Max. 25-30% High fines content can increase moisture content and create handling problems.
Ash fusion temperatures
Various Dry bottom boilers – IDT greater than 1200ºC. Wet bottom boiler – flow temperature less than 1300ºC
(Source: Doyle, 2005)
5.7.2 Stokers
Table 5.4 Required coal quality specification for stokers
Parameter Limits Comments
Total Moisture 8-15% (ar) If too low, fines can be blown away from the bed without burning
Ash 7-30% (ad) 3-35% (ad)
For overfeed stoker. For spreader stoker. Minimum ash content required so grate will be protected from reflected heat.
Volatile matter 25-40% (daf) Maximum size 30mm Size consist Max. 30%-3mm If too high can be blown from bed. Ash fusion temperature
IDT min. 1200ºC Ash melts and clinkers if too low.
Crucible swelling number
Max. 3 High swelling coals give uneven combustion.
(Source: Doyle, 2005)
70
5.8 Cement Production
Albeit that cement plants throughout the world differ one from the other, they all
perform the same basic process.
Grinding and blending of raw materials to give a uniform chemical composition of
calcium carbonate, silica, alumina, iron oxide and other components. The
blended mix is introduced into a kiln to remove all moisture. Calcinations at
about 800ºC take place during which carbon dioxide is evolved. Final clinkering
takes place at about 1400ºC. The clinker is cooled, ground, mixed with 3-5%
gypsum and dispatched as cement.
The two basic processes in cement production are the wet and dry processes,
which are named after the manner in which the raw mix is ground and introduce
into the kiln. The mix is introduced into the kiln as slurry with 20-40% moisture
in the wet process. Reduction of moisture content improves plant fuel
efficiencies. The mix is ground and introduced dry into the kiln in the dry
process. Dry process kilns are generally shorter because there is no need to
evaporate the slurry moisture from the mix. Fuel efficiencies are improved as
well (Doyle, 2005 and GWC Coal Handbook, 1991)
5.8.1 Cement kilns
These kilns are rotating cylinders up to 200m long and 6m in diameters. They
are inclined at a few degrees from the horizontal to assist in the movement of the
contents down the kiln and are fired from the end opposite to introduction of the
mixture. Pulverised coal is the most common fuel. Ash forms part of the
product, so its composition should be suitable; it should also not induce build-up
on the walls of the kiln. These requirements are generally not onerous.
5.8.2 Burners for cement kilns
A fairly long flame is needed and flame stability not required as a result of the
high temperature in the kiln. A simple form of burner is sufficient in which the
pulverised coal and primary air enter through a central pipe and the rest of the
combustion air is drawn in around this pipe after passing through a heat
exchanger in which it received heat from the clinker leaving the kiln.
5.8.3 Cement plant efficiencies
Cement production is an energy intensive process involving both heat (clinker
production) and electricity (grinding of feed and clinker). Modern plants in use

71
currently, use the dry process and have pre-calcination and pre-heaters consume
around 80kWh of electricity per tonne of clinker and 750kcals of heat for each kg
of clinker produced. Less modern dry process plants use up to 1100kcals of
heat/kg of clinker and older wet process plants can use up to 1700kcals/kg of
clinker produced.
Table 5.5 Coal consumption in cement plants
Type of Plant Heat required
kcal/kg
clinker
Tonnes clinker
per tonne coal*
Tonnes coal*
per 106 tonnes
clinker
Most modern dry process,
pre-heating
750 8.0 125,000
Less modern dry process,
semi-dry process
1100 5.5 180,000
Least modern wet process 1700 3.5 280,000
* Calorific value = 6000 kcal/kg net as received basis.
(Source: Doyle, 2005)
5.8.4 Coal quality requirements
There are few limitations on coal quality for cement production, but the table
hereunder gives an outline of the coal specification requirements and limitations.
Table 5.6 Required coal quality specification for cement kilns
Parameter Limits Comments
Total moisture Max. 15% (ar) Creates handling problems if too high.
Ash Max. 25% (ad) Generally little influence – composition must suit kiln feed composition.
Volatile matter Virtually no limit Calorific value Various Depends on grinding capacity
and throughput. Sulphur Max. 2% (ad) Dry process. Limit less severe
for wet process. Chlorine Max. 0.1% (ad) Dry process. Limit less severe
for wet process. Hardgrove grindability index
Various Limit set by capacity o grinding equipment and CV of coal used.
Maximum size Max. 30-50mm Dependent on grinding equipment.
Fines content (-3mm) Max. 25-30% Creates handling problems if too high.
(Source: Doyle, 2005)
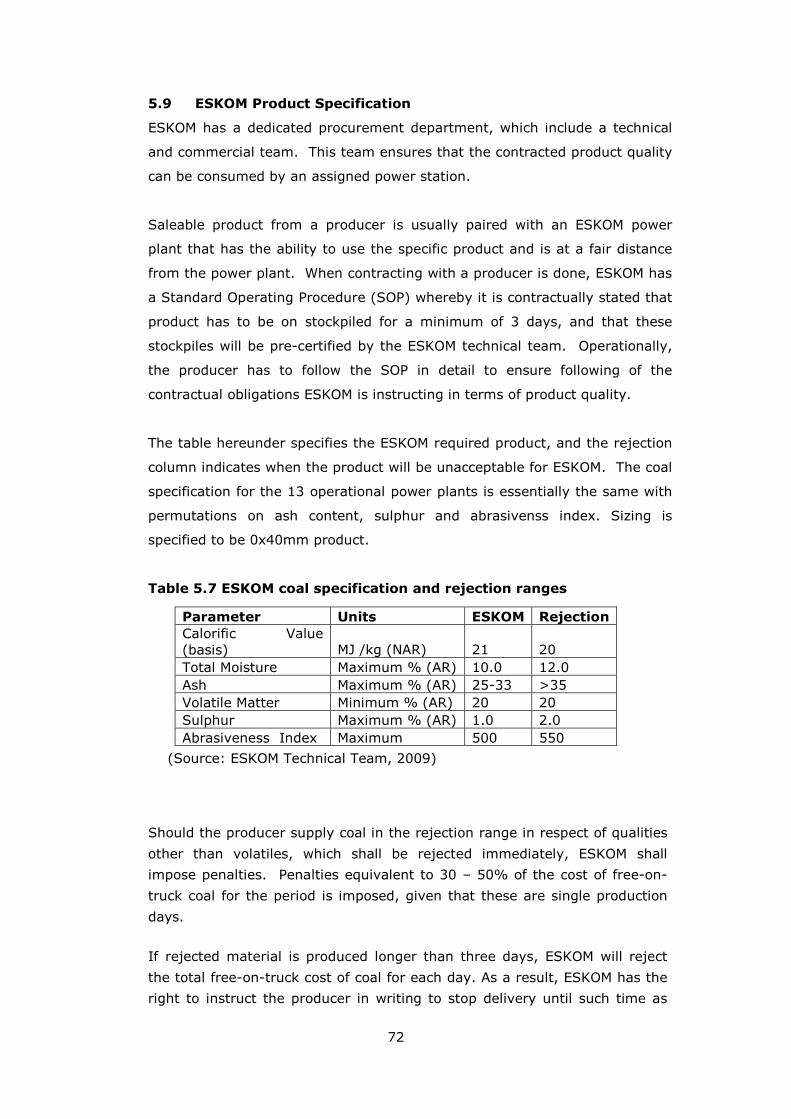
72
5.9 ESKOM Product Specification
ESKOM has a dedicated procurement department, which include a technical
and commercial team. This team ensures that the contracted product quality
can be consumed by an assigned power station.
Saleable product from a producer is usually paired with an ESKOM power
plant that has the ability to use the specific product and is at a fair distance
from the power plant. When contracting with a producer is done, ESKOM has
a Standard Operating Procedure (SOP) whereby it is contractually stated that
product has to be on stockpiled for a minimum of 3 days, and that these
stockpiles will be pre-certified by the ESKOM technical team. Operationally,
the producer has to follow the SOP in detail to ensure following of the
contractual obligations ESKOM is instructing in terms of product quality.
The table hereunder specifies the ESKOM required product, and the rejection
column indicates when the product will be unacceptable for ESKOM. The coal
specification for the 13 operational power plants is essentially the same with
permutations on ash content, sulphur and abrasivenss index. Sizing is
specified to be 0x40mm product.
Table 5.7 ESKOM coal specification and rejection ranges
(Source: ESKOM Technical Team, 2009)
Should the producer supply coal in the rejection range in respect of qualities
other than volatiles, which shall be rejected immediately, ESKOM shall
impose penalties. Penalties equivalent to 30 – 50% of the cost of free-on-
truck coal for the period is imposed, given that these are single production
days.
If rejected material is produced longer than three days, ESKOM will reject
the total free-on-truck cost of coal for each day. As a result, ESKOM has the
right to instruct the producer in writing to stop delivery until such time as
Parameter Units ESKOM Rejection
Calorific Value (basis) MJ /kg (NAR) 21 20 Total Moisture Maximum % (AR) 10.0 12.0 Ash Maximum % (AR) 25-33 >35 Volatile Matter Minimum % (AR) 20 20 Sulphur Maximum % (AR) 1.0 2.0 Abrasiveness Index Maximum 500 550

73
ESKOM is satisfied that the Coal qualities are acceptable. Furthermore,
ESKOM has the right to cancel an agreement should any coal quality be in
rejection range for any cumulative 7 (seven) days of a specific calendar
month.
5.10 Domestic Sales Product Specification
The domestic coal market uses different sized products. These products are
produced from active screening. Three coal products, according to sizing are
consumed domestically:
• Duff - 0 x 6 mm;
• Peas – 6 x 25 mm; and
• Small nuts – 25 x 40mm.
The domestic market also has the ability to consume A-D grade coal. The
distinction between grades of coal is dependent on the ash content and
calorific value. The lower the ash content and higher the calorific value, the
higher the grade of coal, as indicated below. Note that domestic coal calorific
value is expressed as MJ /kg, whilst export product calorific value is
expressed in kcal/kg.
Table 5.8 Domestic coal specification
(Source: South African Classification, 2009)
A product mix is indicated in Table 5.8. The table provides information on
the coal consumers (industry) within the South African coal market coupled
with the coal sizing and grade of material that can be consumed within that
industry.
Parameter Units A Grade
B Grade
C Grade
D Grade
Calorific Value MJ /kg ad >27.5 >26.5 >25.5 >24.5 Total Moisture Maximum % (AR) 12.0 12.0 8.0 8.0 Ash Maximum % (AR) 15.0 16.0 18. 21.0 Volatile Matter Minimum % (AR) 24. 23. 23.0 23.0 Sulphur Maximum % (AR) 1.0 1.0 1.0 1.5
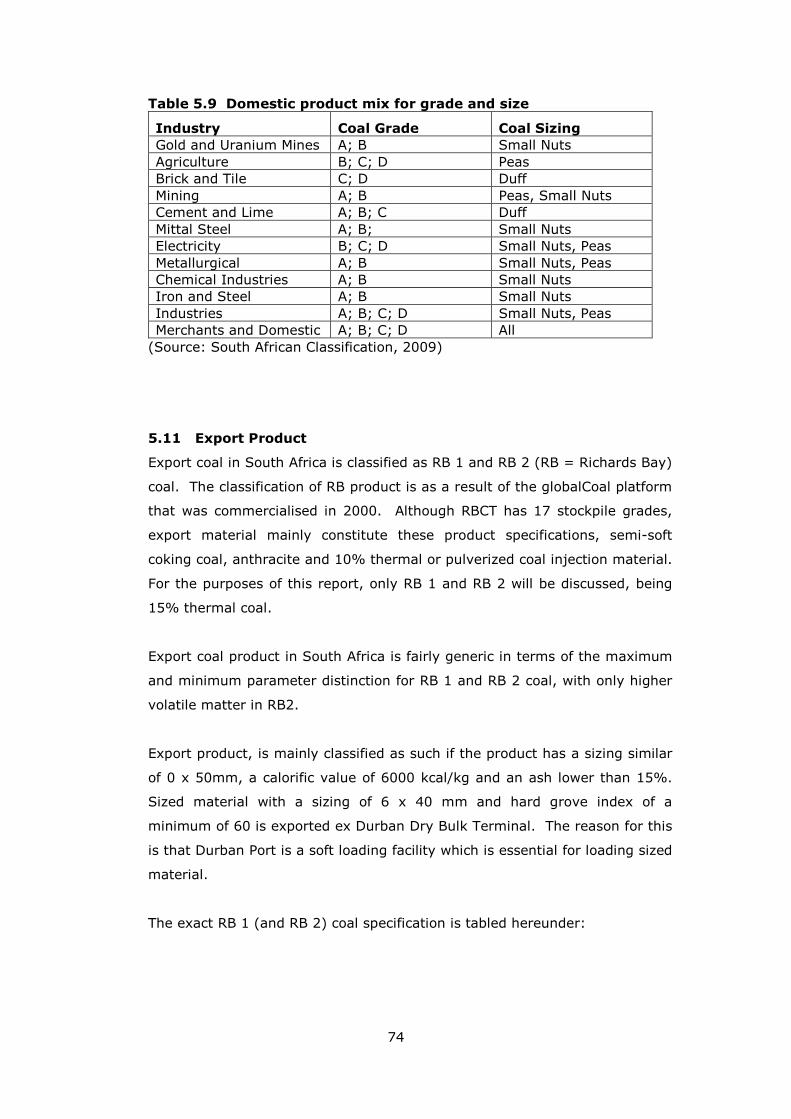
74
Table 5.9 Domestic product mix for grade and size
Industry Coal Grade Coal Sizing
Gold and Uranium Mines A; B Small Nuts Agriculture B; C; D Peas Brick and Tile C; D Duff Mining A; B Peas, Small Nuts Cement and Lime A; B; C Duff Mittal Steel A; B; Small Nuts Electricity B; C; D Small Nuts, Peas Metallurgical A; B Small Nuts, Peas Chemical Industries A; B Small Nuts Iron and Steel A; B Small Nuts Industries A; B; C; D Small Nuts, Peas Merchants and Domestic A; B; C; D All (Source: South African Classification, 2009)
5.11 Export Product
Export coal in South Africa is classified as RB 1 and RB 2 (RB = Richards Bay)
coal. The classification of RB product is as a result of the globalCoal platform
that was commercialised in 2000. Although RBCT has 17 stockpile grades,
export material mainly constitute these product specifications, semi-soft
coking coal, anthracite and 10% thermal or pulverized coal injection material.
For the purposes of this report, only RB 1 and RB 2 will be discussed, being
15% thermal coal.
Export coal product in South Africa is fairly generic in terms of the maximum
and minimum parameter distinction for RB 1 and RB 2 coal, with only higher
volatile matter in RB2.
Export product, is mainly classified as such if the product has a sizing similar
of 0 x 50mm, a calorific value of 6000 kcal/kg and an ash lower than 15%.
Sized material with a sizing of 6 x 40 mm and hard grove index of a
minimum of 60 is exported ex Durban Dry Bulk Terminal. The reason for this
is that Durban Port is a soft loading facility which is essential for loading sized
material.
The exact RB 1 (and RB 2) coal specification is tabled hereunder:

75
Table 5.10 Typical export specification for South African thermal coal
* For RB2 Specification, volatile matter has to be a minimum of 25% (Source: SCOTA, 2009)
South African producers have seen a permutation, of what has always been
known as standard export specification, with the emergence of India as a
major buyer. Higher ash content with associated lower calorific value
material is bought by Indian consumers since Indian power plants are
designed to utilized lower quality input coal. Producers are often faced with
the decision to beneficiate lower quality material at a higher yield, but at a
discounted price.
5.12 Summary
In considering thermal coal as the product consumed by ESKOM, the export
and the domestic market, it is clear that each market has distinctive product
specifications and marketing terms associated with it. This means that the
product sold to ESKOM is intrinsically different to the product that South Africa
exports, and to the A-D grade products used in domestic industries.
Production of each product originating from different coal seams is often
interdependent as geology and mining makes provision for different products
from one mining process. Differentiation in product only occurs once
beneficiation takes place. Geology and washability of the coal is the first step
in developing a marketing plan and strategy. The producer cost curve, based
on FOB cash costs is the curve ranking each producing country in terms of
costs competitive and contribute to South African producers driving cost down
in an effort to stay globally competitive. It has to be noted that production is
derived from multi-seam mining in South Africa, and middling product is often
the delivered ESKOM product. It would be highly inefficient and unprofitable
Parameter Units RB1 Maximum RB1 Minimum
Calorific Value kcal/kg (NAR) 6,000 5,850 Total Moisture % (AR) 12.0 Ash % (AR) 15.0 Volatile Matter % (AR) 22.0 * Sulphur % (AR) 1.0 Hardgrove Index 70 45 Ash Fusion Temp oC 1,250 Calsium Oxide in Ash % (DB) 12 Sizing 0 x 50 mm

76
to mine only particular coal seams and not extracting value from multiple
seams for ESKOM and export products.
Technically, the product is the most important element in the marketing mix,
since the technical analyses and composition is marketed in bulk, and the
product is bought from a technical specification. It is evident that the
marketing manager should have superior technical (preferably mining or
metallurgical) knowledge of the product, but also of the process in which the
coal will be used as energy fuel. The technical specification sheet is the
fundamental starting block of marketing coal, and a full understanding of
proximate and ultimate analyses, ash fusion temperatures, calorific value and
ash composition is essential for successful marketing.
Thermal coal is used by the various markets in two applications - power
generation and cement manufacturing. Coal is used either in a pulverised or
sized form as feeder fuel in burners and stokers. Stokers and burners have
different specifications and usually the product can be adapted in terms of size
for optimal utilisation. In cement manufacturing coal is fed according to the
kiln feed composition and fine material is used. Technically, the marketing
manager need a full understanding of the product required by individual
customers, based on their stoker, burner or kiln specifications and
requirements.
Table 5.10 represent a summary of the different coal products with its typical
specification. As indicated, it is clear that the parameters not only differ per
product, but each product has individual parameter applications. The
information is summarised for ESKOM, domestic and export market products.
Products can be marketed on a dry, air dried or as received basis, and the
marketer should ensure that the consumer or buyer understand the basis of
contracting.

77
Table 5.11 Thermal coal product specifications summarised
Parameter Units ESKOM Domestic Export
Calorific Value (NAR) 21-24 Mj/kg 24.5-27.5 Mj/kg 5850-6000kcal/kg Total
Moisture % (AR) 8-12 8-12 8-12 Ash % (AR) 25-34 15-21 15 Volatile
Matter % (AR) 20-30 23-30 22-20 Sulphur % (AR) 0-2 0-1.5 0-1.0 Hardgrove Index 45-70 45-70 Ash Fusion Temp
oC 1.250 Phosphorus % 0.001-0.01 0.001-0.01 Calsium Oxide in Ash % (DB) 12
Sizing 0x40mm
0x6mm 6x25mm 25x40mm 0x50mm

78
Distribution of bulk coal is discussed in light of contemporary South African
logistics. The distribution of coal is a value-adding action, since a particular
cost is associated with the method of distribution, which includes a channel,
road, rail or shipping costs. The distribution pattern dictates when a product
is in fact sold or when risk is transferred from seller to buyer. This point also
indicates the terms of the sale and the delivery point which is explained in
terms of international Incoterms.
An important aspect of distribution is whether a channel structure is used.
Channel structures are the utilisation of an agent or trader to act as a third
party to move the commodity from the producer to the consumer, often
pricing in a commission or fee.
Distribution forms part of the integral marketing strategy and plan and apart
from place value, also has storage characteristics, which in coal is an
important issue since coal has the risk to spontaneous combust if not
stockpiled correctly or shipped at the appropriate time.
Although access to distribution channels are often viewed in simplicity and
access is assumed, this is not the case for coal producers in South Africa.
Participation in the rail infrastructure of South Africa requires rigid financial
guarantees and contracting with General Freight Business (GFB) and
Transnet Freight Rail (TFR) are done on different terms. Export allocation
through Richards Bay Coal Terminal (RBCT), have been a contentious subject
for many years in South Africa, since the terminal is historically privately
owned by the major coal producers, and this restricts junior BEE miners from
participation. The other available ports in South Africa have restrictions
which will also be discussed in detail.
CHAPTER 6
DISTRIBUTION
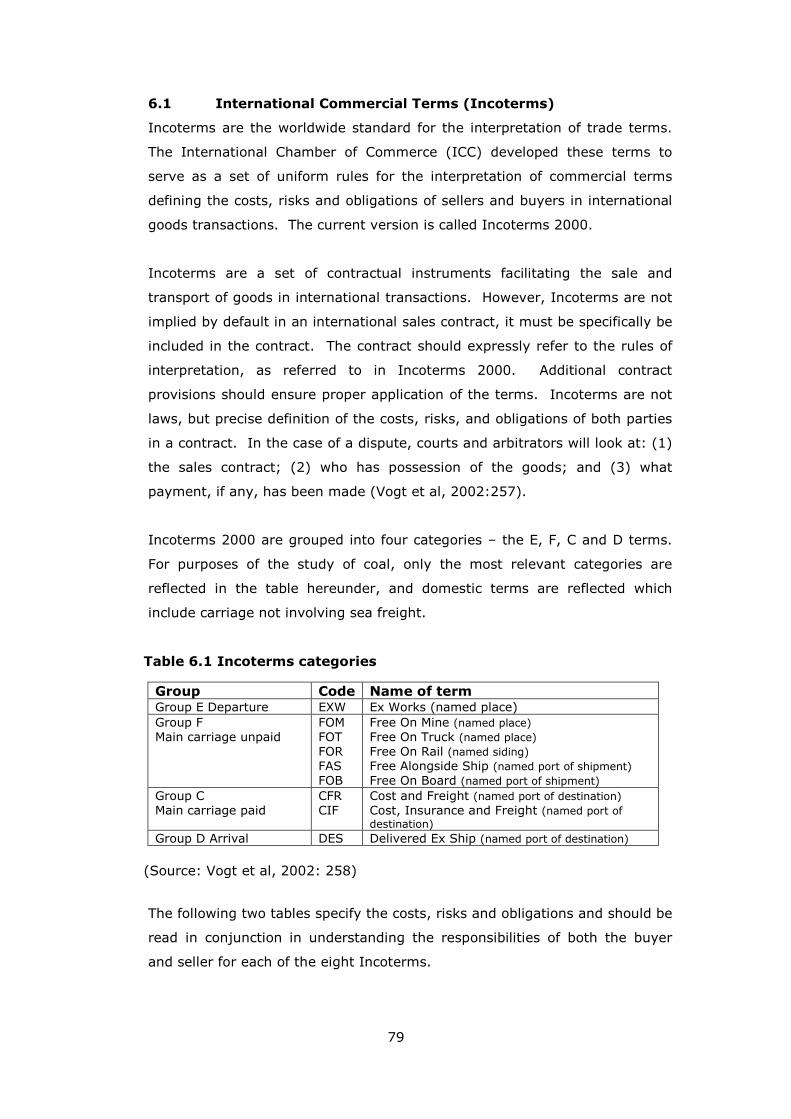
79
6.1 International Commercial Terms (Incoterms)
Incoterms are the worldwide standard for the interpretation of trade terms.
The International Chamber of Commerce (ICC) developed these terms to
serve as a set of uniform rules for the interpretation of commercial terms
defining the costs, risks and obligations of sellers and buyers in international
goods transactions. The current version is called Incoterms 2000.
Incoterms are a set of contractual instruments facilitating the sale and
transport of goods in international transactions. However, Incoterms are not
implied by default in an international sales contract, it must be specifically be
included in the contract. The contract should expressly refer to the rules of
interpretation, as referred to in Incoterms 2000. Additional contract
provisions should ensure proper application of the terms. Incoterms are not
laws, but precise definition of the costs, risks, and obligations of both parties
in a contract. In the case of a dispute, courts and arbitrators will look at: (1)
the sales contract; (2) who has possession of the goods; and (3) what
payment, if any, has been made (Vogt et al, 2002:257).
Incoterms 2000 are grouped into four categories – the E, F, C and D terms.
For purposes of the study of coal, only the most relevant categories are
reflected in the table hereunder, and domestic terms are reflected which
include carriage not involving sea freight.
Table 6.1 Incoterms categories
(Source: Vogt et al, 2002: 258)
The following two tables specify the costs, risks and obligations and should be
read in conjunction in understanding the responsibilities of both the buyer
and seller for each of the eight Incoterms.
Group Code Name of term Group E Departure EXW Ex Works (named place) Group F Main carriage unpaid
FOM FOT FOR FAS FOB
Free On Mine (named place) Free On Truck (named place) Free On Rail (named siding) Free Alongside Ship (named port of shipment) Free On Board (named port of shipment)
Group C Main carriage paid
CFR CIF
Cost and Freight (named port of destination) Cost, Insurance and Freight (named port of destination)
Group D Arrival DES Delivered Ex Ship (named port of destination)
80
A definition for each term is included in Table 6.2 in the first column, together
with the type of payment for each transaction as per a typical coal contract.
The table should be read from left (Seller / Exporter Premises) to the right-
hand side (Buyer / Importer Premises). The red arrows are indicative of risk
and cost. The table headers in between are indicative of the chronological
actions of shipping coal to its end destination. He solid red arrows start at
the seller and ends at the indicated Incoterm transportation or shipping
activity. This means that the seller’s responsibility ends where the dotted line
starts, which in turn, indicate the start of the buyer’s responsibility, with
respect to the following:
• The conditions that constitute completion of delivery;
• How one party ensures that the other party has met the required
conditions;
• Which party must comply with requisite license requirements and/or
government imposed formalities;
• The mode and terms of carriage;
• The stage when the risk of loss will transfer from the seller to the buyer;
• How transport costs will be divided between parties; and
• The notices that parties are required to give to one another regarding the
transport and transfer of goods.
81
Table 6.2 Description of Incoterms in terms of buyer and seller risk and cost at specific locations

- 82 -
As indicated in Table 6.3 hereunder, when read in conjunction with Table 6.2
above, finalise a concise description of action actions and costs borne by
either the seller of the buyer.
Table 6.3 Description of Incoterms in terms of buyer and seller responsibilities
* Include Incoterms for inland carriage (FOM/FOT/FOR) (Source: Vogt et al, 2002)
6.2 Channel Structures
Distribution channels in domestic and international trade are the marketing
routes that coal follows to flow from the seller (producer/ exporter) to the
buyer (consumer/ importer). A seller can choose an appropriate distribution
channel for its coal once it has identified a target market (Adendorf and De
Witt, 1999).
An appropriate distribution channel enhances the efficiency of the domestic
and international marketing effort. Seller and logistics managers involved in
SERVICES Ex
Works
Free
Carrier*
Free
Alongside Ship
Free
Onboard Vessel
Cost &
Freight
Cost
Insurance & Freight
Delivered
Ex Ship
Warehouse Storage Seller Seller Seller Seller Seller Seller Seller Warehouse Labour Seller Seller Seller Seller Seller Seller Seller Export Packing Seller Seller Seller Seller Seller Seller Seller Loading Charges Buyer Seller Seller Seller Seller Seller Seller
Buyer/ Inland Freight Buyer Seller Seller Seller Seller Seller Seller
Terminal Charges Buyer Buyer Seller Seller Seller Seller Seller Forwarder's Fees Buyer Buyer Buyer Buyer Seller Seller Seller Loading On Vessel Buyer Buyer Buyer Seller Seller Seller Seller Ocean/Air
Freight Buyer Buyer Buyer Buyer Seller Seller Seller
Charges On
Arrival At Destination Buyer Buyer Buyer Buyer Buyer Buyer Buyer
Duty, Taxes & Customs Clearance Buyer Buyer Buyer Buyer Buyer Buyer Buyer
Delivery To Destination Buyer Buyer Buyer Buyer Buyer Buyer Buyer

- 83 -
domestic and international marketing and distribution must acquaint
themselves with distribution channels as they need to understand their own
organizational shortcomings, historical and cultural product flow to
customers.
Successful international marketing often results from partnering with a key
intermediary who has access to distribution channels in the foreign market.
Sellers need to appreciate the importance of the role of intermediaries in
getting products to their target markets and ensuring that they receive them
at a reasonable price.
According to Adendorf and De Witt (1999), forming a business alliance with a
reputable partner who can channel export products to appropriate distribution
points is called a ‘push strategy’. The longer the distribution channel, the
greater the number of intermediaries and this results in less profit accruing to
the seller. Sellers use the following criteria to determine the length of their
distribution channels:
• Complexity of technical requirements;
• Lifespan of the product;
• Price of the product;
• Service requirements; and
• Turnover.
If coal producers (sellers) were to market their coal to end-users by means of
their own sales force, they would be the only profit-earning party. However,
direct marketing in foreign countries may be very difficult and extremely
expensive, eroding all profits. Exporters therefore have to trade off the costs
and benefits of employing intermediaries instead of conducting their own
sales, and of continuously monitoring the situation. Choosing to deliver
products directly is called a ‘pull strategy’.
Producers who enter the international market may be tempted to entrust the
entire export process to an established international distributor. In doing so,
seller may not become aware of the way consumers react to their coal.
Furthermore, all the initiative for increasing market share rests with the
distributor. This strategy of cost avoidance may cost producers dearly in lost
marketing opportunities.
- 84 -
Traditionally sales agents were required in markets such as Japan and India.
During the last number of years Japanese steel mills and utilities started
buying directly from suppliers circumventing the traditional Japanese trading
houses. In India large companies are changing their procurement policies to
buy directly from suppliers. In European markets the marketing of coal has
been done directly for a number of years. The exception to this is the sale of
thermal coal to the industrial market in southern India. A number of small
cement, brick and ferro-alloy producers require coal in this region and they
prefer the coal to be delivered to their factories directly. A sales agent will be
needed to distribute the coal to the various customers from the discharge
port.
Domestic agents and traders are often used by producers that cannot incur
the cost of establishing a marketing function, or they choose to only focus on
production. The following domestic distributors and traders operate within the
South Africa domestic market. These companies distribute in excess of 8
million tonnes coal from producers to domestic users annually (DME Statistics:
2008).
• Wescoal Ltd.;
• Cullen Coal;
• Coal Marketing Services;
• Macphail Distributors; and
• Glencore South Africa.
International traders and agents have been operating locally in South Africa
for decades. These companies are used by major and junior producers the
like, although they do give junior miners and Quattro members low cost
access to the international market. Junior miners almost exclusively use
traders to export their coal through common stockpile allocation at RBCT and
other terminal. The tradability of coal as a commodity at the different
terminals sees traders often buying from major producers and then
channelling it into the international market. Glencore is by far the biggest
trader present in South Africa, but with international accolades as trader and
agent. Glencore negotiated a dedicated stockpile at RBCT a number of years
ago, which enhanced its trading business, whilst other traders have to use the
common stockpile. Coal Procurement is oldest profitable South African
trading company, trading coal internationally, mostly through Maputo and
Durban.
- 85 -
The following international traders and agents are operational within the
South African market:
• Glencore South Africa and Glencore International AG;
• Coal Procurement SA;
• Cargill;
• Noble;
• Oxbow; and
• Vittol.
6.3 Road Transport
According to the Department of Transport, South Africa moves approximately
700 million tonnes of freight domestically annually, 74% by road and 26% by
rail. Most of freight in South Africa is moved by road because it is more
flexible than rail transport.
With the deregulation of road transport in the late 1980’s, together with
failings of the rail system, a migration in cargo ensued from rail to road, which
has resulted in high growth in cargo movement by road. In general, road
transport has responded well to the demands of the freight industry, having
short turnaround times and enabling sophisticated transport logistic systems
that respond to complex client supply requirements.
Relative to other modes of transport, the road system is facing serious
degradation as a result of underlying shortcomings from increased road
usage. The reason is twofold, one being that investment levels in the road
network are estimated to be half of what it should be. Secondly, the
significant increase in heavy vehicle traffic volumes on the road networks is
shortening the maintenance and rehabilitation cycles of the road network
(Department of Transport, 2009).
Initiatives that have been implemented to curb the practice of overloading on
the country’s roads have resulted in an unintended consequence of heavy
vehicle transporters circumventing the primary road system by using the
secondary road network instead. This road network is not designed for heavy
loads and high heavy vehicle traffic exposure, and thus rapidly deteriorating,
- 86 -
resulting in efficiency and road safety problems (National Freight Logistics
Strategy: 2005).
6.3.1 Coal road haulage
Road haulage in the coal industry is a major business in South Africa today.
Road haulage is contracted on a Rand /tonne /kilometer basis, given the DME
report on reigning price for Diesel 0.005%, generally in Zone 9C (Gauteng).
Road haulage is done by 30 tonne loads, or a maximum of 60 tonnes when
interlinked trucks are utilized. Coal is transported in South Africa between the
following points:
• Plant to stockpile;
• Mine stockpile to rail siding;
• Mine stockpile to buyer / consumer stockpile;
• Mine stockpile to distributor depot;
• Distributor depot to buyer / consumer stockpile; and
• Mine stockpile to port – only in the case of Kwa-Zulu Natal anthracite
producers which are in very close proximity to the respective ports.
Dependant on the Incoterms of the coal sale contract, the producer (or mine)
usually contracts with the road haulage company for transport between said
points. A vast number of road haulage companies have developed in South
Africa over the past 10 years, mostly as procurement policies developed to
include BEE road haulers. A number of major road haulers have since
included BEE partners, but enterprise has grown significantly to individual
companies owning 200- 300 trucks in order to facilitate road transport in the
coal industry.
Depending on the size of the producing mine (or company) and the distance
haulage required, a large or smaller road haler is usually contracted by the
producer. Flexibility in terms of operating hours, number of trucks and
security are major concerns that the contracting party should consider.
- 87 -
6.3.2 ESKOM road transport
ESKOM only procures coal on a free-on-conveyor (FOC), free-on-truck (FOT),
or free-on-rail (FOR) basis. ESKOM prefers to negotiate and pay transporters,
since it has the advantage of economy of scale, but moreover, since it has a
very strict procurement policy to use BEE companies in the transport function.
Forced by environmental groups, community stakeholders and road safety
regulations, ESKOM is currently in the process of reducing road transport to
its various power plants. ESKOM has engaged in an alternative strategy to
rail coal to the power plants that have access to sidings on-site. This strategy
will be on-going in an effort to reduce road transport with 25% by 2010.
The current economic climate constitute that this will be possible. However,
considering that 80% of all chrome mines, 25% of platinum mines and 10%
of coal mines in South Africa have entered into a care and maintenance
phase, rail capacity is available. Should the economy reach its turning point,
and Transnet have not made provisions for additional capacity, the rail
capacity will most likely not be available. In addition to the slowed economic
activity, ESKOM has publicly estimated that it would need 40 new coal mines
to supply in its planned demand from 2011 onwards.
6.3.3. Domestic road transport
Wherever consumers do not have rail siding available for discharge, or the
producing mine do not have access to a siding, road transport is used.
Depending on the size of the seller and buyer, the larger company will usually
negotiate the road transport contract. The sales contract is then set as free-
on-truck or delivered at the consuming plant.
6.3.4 Export Road Transport
When coal is exported, it has to be delivered to a loading rail siding. Road
transport is contracted for this function, should the mine stockpile and siding
not be in a very short distance (shorter than 500 meters).
The ports in South Africa do not accept road haulage into stockpiles, although
producing mines that are in very close proximity (less than 70 kilometres),
have special arrangements with ports to accept road hauled coal, e.g.
Springlake Anthracite and Riversdale Anthracite.

- 88 -
PIETERMARITZBURG
LADYSMITH
DURBAN
STANGER
EMPANGENI
RICHARDS BAYRICHARDS BAY
ESHOWE
GINGINDLOVU
NKWALINI
VRYHEIDVRYHEIDVRYHEID
HLOBANE
HLUHLUWE
MTUBATUBA
NSESE
PAULPIETERSBURG
PIET RETIEF
GOLELA
MKUSI
GLENCOE
NEWCASTLE
UTRECHT
VOLKSRUST
STANDERTON
TRICHARDT
BETHAL
MACHADODORP
NELSPRUIT
BARBERTON
KOMATIPOORT
TO MAPUTOWITBANK
MIDDELBURG WONDERFONTEIN
CAROLINA
BREYTENLOTHAIR
ERMELOERMELO
PULLENSHOPEBSP
OGIES
SA INSET
SWAZILANDSWAZILAND
= COAL EXPORT LINES= COAL EXPORT LINES
= OTHER LINES= OTHER LINES
PYRAMID S
SENTRARAND
PTA
GMR
WGD
SPR
HEIDELBERG
TO VEREENIGING
RIETVALLEI
BLACKHILLBLACKHILL
PIET RETIEFPIET RETIEF
PAULPIETERSBURGPAULPIETERSBURG
ULUNDIULUNDI
6.4 Rail Transport
According to Transnet (Transnet Annual Report: 2008), approximately 82
million tonnes of coal is transported by the rail system in South Africa on an
annual basis. This number is dependent on capacity and operational
efficiency by Transnet.
The following map provides the rail line infrastructure linking the centre of
the country to the east coast. Although other General Freight Business (GFB)
lines run through the rest of the country, the lines indicated in the map are at
the centre of the coal industry and are generally referred to from a Transnet
perspective.
Figure 6.1 South African rail infrastructure
(Source: TFR, 2009)
- 89 -
The ‘red’ line, as indicated in Figure 6.1, is viewed as the most important line,
operated by Transnet Freight Rail (TFR) and carrying up to a planned 67
million tonnes per annum. The ‘green’ or other lines are the rail lines carrying
domestic coal to domestic consumers and export coal to Durban and Maputo
ports. These lines are operated by General Freight Business (GFB). There
are vast differences in capacity and rank between the two line systems,
which will be discussed hereunder.
6.4.1 Rail transport for exports
• RBCT Exports
The coal export line was commissioned in 1976 with an initial capacity of only
4.2 million tonnes per annum. It has grown to a capacity of 72 million
tonnes per annum in 2006/7 (although only 67 million tonnes have been
achieved). The line was initially managed by separate entity within Spoornet
called CoalLink. CoalLink employed 2 000 people and operated a rolling stock
of 7 400 wagons and 235 locomotives. The average distance from the
Witbank / Middelburg coalfields to RBCT is 600 km. The success of CoalLink
can be attributed to this independency and the fact that CoalLink has
exclusive and preferential use of the line to transport coal to RBCT. In late
2007 it was decided to integrate CoalLink into the restructured TFR business
(TFR Public Presentation: 2009).
Rail performance has declined in recent years from a capacity of 72 million
tonnes to a maximum of 67 million tonnes in 2006, and the worst in 2008 of
60 million tonnes. With the expansion of RBCT came the aim of exporting 91
million tonnes within the next 5 years.
The coal export industry has cited that the bottleneck in achieving the
increase in export coal volume from the current declined rail performance
figure of 60 million tonnes per annum to the planned 91 million tonnes per
annum is TFR. However, TRF maintains that the export of 91 million tonnes
per annum is not only questionable but it will take longer than 5 years to
match the rail capacity with the export capacity at RBCT. The main
arguments posted by TFR (TFR Public Presentation: 2009) are:
• According to TFR’s own assessment an attainable long term export rate
based on mining performance and evaluation of the mining project pipe
line will only be 77 million tonnes per annum;
- 90 -
• Increasing capacity by 25 million tonnes per annum from an estimated 66
to 91 million tonnes per annum is larger than the total production of any
of the current producers;
• Additional investment is required for the upgrade of the line and the
procurement of additional rolling stock is required and this will take time.
TFR’s estimation is that the rail capacity of 91 million tonnes per annum
can only be reached by 2014/15;
• Capital investment required to reach the target rail capacity will amount to
US$ 2.8 billion, with expenditure starting in 2009;
• Given the current trends, new capacity investment is a risk;
• The risk-reward profile is skewed. TFR will have to take 95% of the risk
and only obtain a reward of 6 to 8 % (figure based of a coal price of
US$100.00/mt CIF ARA).
Based on the above arguments, TFR increased tariffs by an average of 38%
in January 2009, with a back-dated payment to be made from July 2008. In
order to address their risk exposure, TFR also announced that it will not
invest capital without some form of security.
The following approaches to the expansion will be followed by TFR:
• Comprehensive Market Due-diligence, which include global and domestic
market conditions and the coal commodity cycle and price competitiveness
of South African producers;
• Collaborative, open-book planning process with all stakeholders;
• Operate within the framework set by the Competition Commission;
• Expansion targets and investment linked to contracted volumes only; and
• Continuous business risk assessment and mitigation.
TFR and RBCT are currently on a mutual drive to optimise scheduling for all
RBCT exporters.
• Durban and Maputo Exports
Coal transported by rail to Durban and Maputo ports fall under GFB. Block
loads (train mass) are usually only 1 200 tonnes as opposed to 5 800 or
8 400 tonnes per train run by TFR.

- 91 -
Producers exporting sized coal (usually to Turkey) have to export via Durban
port as it is the only soft-loading facility in the country. These producers
usually contract with GFB for railage of the coal, adhering to the stockpile
constraints and shipping schedule of the port.
TCM Matola in Mozambique has been used as an alternative port for 15 years.
This port has been used mostly by smaller junior producers with no access to
RBCT. The greatest constraint has been the relationship between Transnet
and CFM, specifically when rail trucks leave South Africa and enter
Mozambique, and the related turn-around time for these trucks to return to
South Africa. The rail line also needs upgrading between Rosanna Garcia and
Maputo, an issue which is currently receiving private equity attention. TCM
Matola is currently the best alternative for produces without RBCT allocation,
but the costs associated with railage are much higher than for TFR railage,
and considering that block loads are considerably smaller, it takes effective
planning and an astute logistics team to effectively export through
Mozambique.
6.4.2 Rail transport for ESKOM and domestic consumers
Rail transport for ESKOM and large domestic consumers such as PPC, Sappi,
the ferro-alloy industry and platinum smelters all contract with GFB for
domestic railage of coal. Siding capacity for loading and discharge are the
same as for TFR business. Usually, fewer rail wagons and wagons with
smaller capacity are used for in-land business.
6.4.3 Rail Contracting
TFR has recently concluded a new 10 year rail contract with all the RBCT
users. This included a different penalty system and a 38% rail hike. A
standard service level agreement was negotiated with the rail company,
contracting a service based on volume, rail rate and an overall weekly
capacity plan for the entire industry. TFR contract individually with the major
producers, and collectively with the Quattro members through Mhlatuze Bay
Administrators.
GFB users are contractually bound by either an annual contract or on a
monthly usage contract. GFB Railage rates are approximately 50% higher
- 92 -
than the dedicated TFR rates, as general freight include all bulk freight
moving in South Africa, and this is seasonal of nature, i.e. soft commodities.
In order to be able to negotiate an acceptable rail rate the following issues
should be considered:
• Guaranteed train load rates;
• Guaranteed train turn-around-times; and
• Guaranteed quantities of coal to be moved per year
An integrated rail plan, in balance with sales and production, is provided to
TFR and GFB on a regular basis. This plan should include a weekly, monthly
and annual plan. The weekly plan will be revised on a weekly basis to reflect
the actual requirements for the next week and will be used as the execution
plan. The monthly plan is used by TFR and GFB to schedule rolling stock and
train slots a month in advance and the annual plan will be used by TFR and
GFB to plan capacity as required by the mine. It is of utmost importance that
the entire sales channel be optimised and managed to ensure a high level of
service delivery to customers.
Siding access and usage is an essential element of rail access in South Africa.
If a mine does not have an affiliated siding, it can either part use with
another company that holds a lease or operate a private siding, or build a
new siding in close proximity to the mine. Often capacity does not exist to
part use, and the only option is to build a new siding.
TFR Properties are responsible for siding leases. The land on which the siding
is build is owned by TFR, but the user can lease the land and then operate
the siding given TFR rules and regulations in terms of safety and
environmental requirements. Usually the lease is valid for 4 years and 11
months and renewable after this time. Sidings can not be sub-leased.
When a producing company decides to build a new siding, it can either do so
on TFR land or on its own acquired land. Accredited consulting engineer firms
are commissioned to design the siding, which has to be approved by TFR
Industry. Not only has the producing company have to adhere to providing
and Environmental Impact Assessment (EIA), but also adhere to the
operational regulations and rules of the Rail Safety Regulator. TFR Industry
will sign-off all final construction, and the Rail Safety Regulator will issue a

- 93 -
permit for operations to start. New sidings currently reach final costs of
between R20 – R55 million, but are 24 hour operated sites with a maximum
turnaround time of 6 hours per 100 trucks.
6.5 Terminal Access and Ocean Freight
Coal export terminals are the final mode of distribution when contracting is
done on a FAS or FOB basis. Producing companies (sellers) will only sell on a
CFR or DES basis, if its internal marketing and logistics function is
sophisticated enough to handle freight. This is usually on done by the major
producing companies, and the freight offices are often located in London,
Singapore, The Hague or Geneva.
A brief overview of shipping will follow, in order to explain the wide field of
expertise that marketing professionals are dealing with in the process to
market coal as a commodity.
6.5.1 Shipping and logistics
Operational parameters in shipping refer particularly to the suitability of a
terminal to load various classes of bulk carriers. Bulk carriers are
characterized by three dimensions namely:
• The length overall (LOA);
• The width of the vessel (beam); and
• The maximum allowable draft of a fully laden vessel (draft).
The physical dimensions of the berth/s in a terminal dictate the maximum
dimensions of vessels that can be loaded at the terminal. As an example if a
berth has a maximum depth of 17 m, the terminal will only allow vessels with
a maximum draft of 16 m to be loaded at the berth. It is thus apparent that
not all bulk carriers can be loaded or discharged at all coal terminals. A
terminal will have an advantage if it is able to accommodate a large variety
of vessels, thus having flexibility in minimising freight rates by loading the
lowest cost vessels for each of the required routes i.e. RBCT (Doyle 2005:
64).
The load rate guaranteed by the terminal as well the discharge rate
guaranteed by the discharge port have a profound impact on freight rates.
The time it takes to load a vessel is determined by the load rate and as the

- 94 -
cost of chartering a vessel is based on the duration of the voyage the time
taken to load the vessel is included as part of the voyage time. The higher
the guaranteed load rate, the faster the vessel will be loaded and thus the
lower the ultimate freight rate payable.
Commercial factors such as port charges, canal charges, local taxation
regimes, bunkering patterns and prices, and political considerations can also
affect competitiveness. From a charter party point of view, the allowed turn
time could also influence competitiveness of a specific port. In general, turn
time of 12 hours is standard in most ports. RBCT requires a turn time of 18
hours, for example.
The three types of bulk carriers used in coal shipping are the following:
• Handymax: Typically 150-200 meters in length, though certain bulk
terminal restrictions dictate that many handymax ships are just less than
190 meters in overall length. Modern handymax designs are typically
between 35 000 and 60 0000 tonnes deadweight (DWT) in size, have five
cargo holds, and four cranes of 30 metric ton lifting capacity;
• Panamax: Ships are of the maximum dimensions that will fit through the
locks of the Panama Canal, and are typically 294 meters in length and
have a displacement of 65 000 tonnes DWT; and
• Capesize: Ships are cargo ships originally too large to transit the Suez
Canal (i.e., larger than panamax vessels). To travel between oceans, such
vessels used to have to pass either the Cape of Good Hope or Cape Horn.
Vessels this size can now transit the Suez Canal as long as they meet the
draft restriction of 18.91metres as of 2008. Capesize vessels are typically
above 150,000 tonnes DWT. A standard capesize bulker is around
175,000 DWT. The large dimensions and deep drafts of such vessels
mean that only the largest deep water terminals can accommodate them
(Doyle, 2005:66-67).
6.5.2 South African coal loading ports
• Richards Bay Coal Terminal
The Richards Bay Coal Terminal (RBCT) is the major coal export facility for
thermal coal exports from South Africa and is the largest export facility in the
southern hemisphere. It was originally established by the Transvaal Coal
Owners Association (TCOA) in 1974.
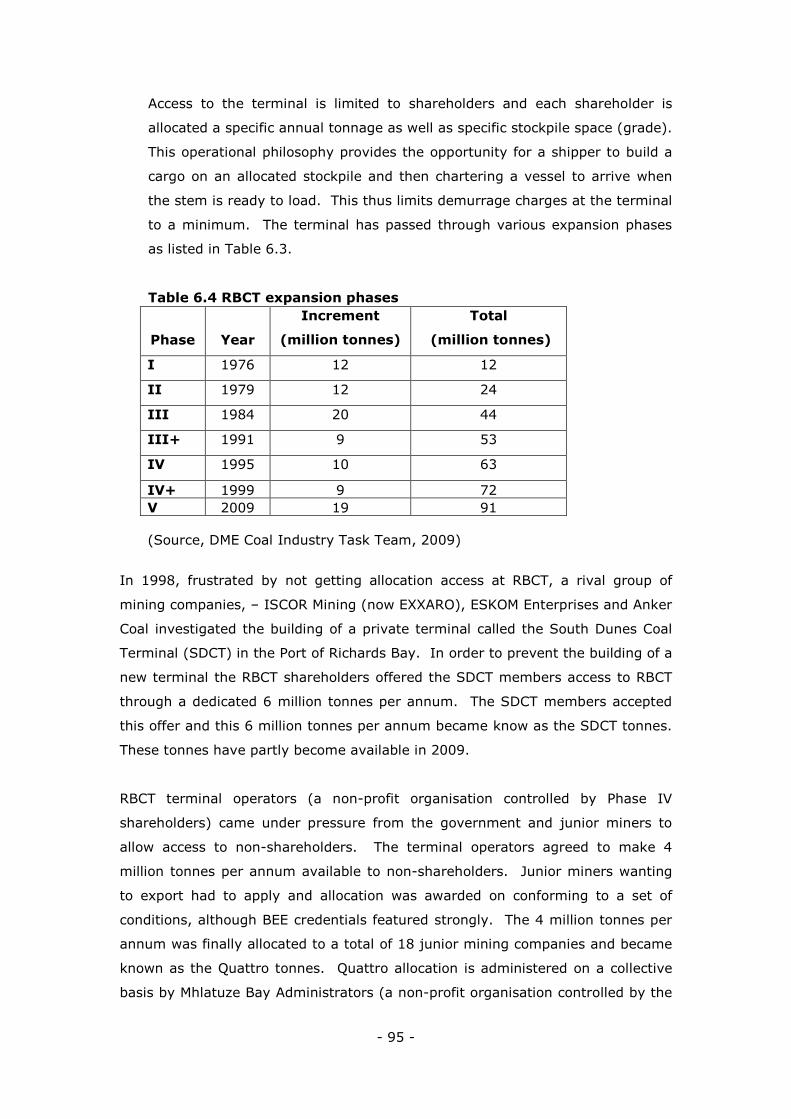
- 95 -
Access to the terminal is limited to shareholders and each shareholder is
allocated a specific annual tonnage as well as specific stockpile space (grade).
This operational philosophy provides the opportunity for a shipper to build a
cargo on an allocated stockpile and then chartering a vessel to arrive when
the stem is ready to load. This thus limits demurrage charges at the terminal
to a minimum. The terminal has passed through various expansion phases
as listed in Table 6.3.
Table 6.4 RBCT expansion phases
(Source, DME Coal Industry Task Team, 2009)
In 1998, frustrated by not getting allocation access at RBCT, a rival group of
mining companies, – ISCOR Mining (now EXXARO), ESKOM Enterprises and Anker
Coal investigated the building of a private terminal called the South Dunes Coal
Terminal (SDCT) in the Port of Richards Bay. In order to prevent the building of a
new terminal the RBCT shareholders offered the SDCT members access to RBCT
through a dedicated 6 million tonnes per annum. The SDCT members accepted
this offer and this 6 million tonnes per annum became know as the SDCT tonnes.
These tonnes have partly become available in 2009.
RBCT terminal operators (a non-profit organisation controlled by Phase IV
shareholders) came under pressure from the government and junior miners to
allow access to non-shareholders. The terminal operators agreed to make 4
million tonnes per annum available to non-shareholders. Junior miners wanting
to export had to apply and allocation was awarded on conforming to a set of
conditions, although BEE credentials featured strongly. The 4 million tonnes per
annum was finally allocated to a total of 18 junior mining companies and became
known as the Quattro tonnes. Quattro allocation is administered on a collective
basis by Mhlatuze Bay Administrators (a non-profit organisation controlled by the
Phase Year
Increment
(million tonnes)
Total
(million tonnes)
I 1976 12 12
II 1979 12 24
III 1984 20 44
III+ 1991 9 53
IV 1995 10 63
IV+ 1999 9 72 V 2009 19 91

- 96 -
DME). Quattro has been operational since 2004. The current allocation of
tonnage per company is depicted hereunder.
Table 6.5 RBCT allocation by South African producers
Mining Company
Phase
IV+ Quattro SDCT
Phase
V
Total /
Company
BHP Billiton 26.960 26.960
Anglo 19.780 1.246 21.026
Xstrata 15.050 1.539 16.589
Tot 4.090 0.422 4.512
Sasol (EXXARO) 3.600 0.369 3.969
Kangra (Shanduka) 1.650 0.173 1.823
Eyesizwe (EXXARO) 0.870 0.289 0.086 1.245
Siyanda 1.652 1.652
SDCT 1.652 1.652
EXXARO 0.105 2.000 1.102 3.207
ESKOM Enterprises 3.000 3.000
Anker 0.197 1.000 1.197
Black Gold 0.200 0.200
Endulwini 0.250 0.250
SACMH 0.207 0.500 0.707
Leeuw 0.207 0.207
Mashala 0.207 0.207
Mmakau 0.247 0.247
Polmaise 0.230 0.230
Shanduka Coal 0.197 0.197
Shanduka Res 0.270 0.270
Tweewaters Fuel 0.242 0.242
Umcebo 0.197 0.197
Nucoal 0.207 0.207
Worldwide Coal 0.401 0.401
Riversdale 0.150 0.150
Slater 0.197 0.197
Total 72.000 4.000 6.000 9.000 91.000
Cum Total 72.000 76.000 82.000 91.000
Note: () indicate controlling company; * Company names indicate shareholders
(Source: DME Coal Industry Task Team, 2009)
- 97 -
In terms of Phase V, the industry in general had been very skeptical about
the increase from 82 million to 91 million tonnes per annum. A number of
market analyst and mineral economists are of the opinion that the 19 million
tonnes per annum increase is not sustainable in the long run.
It is apparent from the production discussion in chapter 5 that the major
mining companies - BHP Billiton, Anglo Coal, Xstrata, EXXARO and Total will
maintain their export quantities over the long term. If the tonnage from
Shanduka is added it will be safe to say that the total from these companies
is 79 798 million tonnes per annum, which will be sustainable over the long
term.
Considering the project pipeline of junior mining companies it should be
possible for the majority of them to sustain their exports in the long term.
However questions still arise on the 3 million tonnes per annum, allocated to
ESKOM Enterprises, the 1.197 million tonnes per annum allocated to Anker
Coal and the 1.652 million tonnes per annum allocated to SDCT.
ESKOM acquired its allocation as a member of SDCT. At that stage ESKOM
had some mining assets which were housed in a subsidiary company, ESKOM
Enterprises. The ESKOM board has decided to divest in non-core business
and the mining assets were sold. ESKOM has announced that the 3 million
tonnes per annum SDCT allocation is up for sale, but for the last 18 months,
very little information had been forthcoming from the state enterprise.
Anker Coal SA has been struggling over the last couple of years and was
subjected to many failed hostile take-over bids. The life spans of their
current operations are not sufficient to sustain the export allocation in the
long term and they have not been successful in obtaining new reserves.
SDCT is a management company and does not have any mining operations.
With EXXARO being accommodated already and ESKOM divesting it will be
difficult for SDCT to source 1.652 million tonnes per annum on a continued
basis.
In summary then it seems that sufficient long term tonnage is available to
sustain a minimum of 85 million tonnes per annum. TFR, however, will
remain the major concern in terms of railage capacity of the 85 million
- 98 -
tonnes. Junior BEE mining companies will continue to put pressure on RBCT
shareholders and the DME to make additional allocation tonnage available at
the terminal.
• Durban
The Bulk Connections terminal in the port of Durban is the only export facility
in the region that is able to soft-load sized coal. The port is limited to
Handymax vessels and although it has a design capacity of 3 million tonnes
per annum it only handles approximately 1.5 million tonnes per annum due
to insufficient rail services to the port. This port will retain its current
customers who focus on the export sized coal market.
• Maputo
The Matola Coal Terminal is owned and operated by Grindrod Limited a major
international logistics company. The terminal is the closest export facility to
the Witbank and Middelburg coal fields at only 415 km.
The terminal has over the years maintained an average export quantity of
1.2 million tonnes per annum and has secured three major anchor
customers. Although the terminal has aspirations to increase its coal exports
to 2 million tonnes per annum by 2010, it is not sure if the rail support from
TFR and CFM will be available. The port is limited handling Handymax and
Panamax vessels up to 65 000 tonnes loaded.
6.6 Summary
The physical distribution of coal in South Africa might well be the most
contentious issue in the industry. Mostly, a lack of capacity is to blame in
each mode of transport, which worsens with the continuous entrance of new
JMS and BEE players.
An understanding of Incoterms, specifically Ex Works, FOM, FOT, FOR, FAS
and FOB are essential to managing coal deliveries and contracting with
ESKOM, domestic consumers and for exporting coal. The implication, cost and
responsibility considered for each Incoterm is different and the marketing
function should not only understand these intricacies, but also be able to
manage, cost and deliver upon any requested mode of transport.
- 99 -
The concept of distribution and channels also includes channel members such
as traders and agents. Complete knowledge of each agent and trader’s
capabilities, cost and service levels is essential as the producer will relinquish
its sales function to these channel members. Channel members have
different functions, costs and responsibility in the domestic and export
market functions.
Road transport is predominantly used in the absence of rail sidings, but to a
large extent by ESKOM. The significant increase in road transport over the
past five years has seen serious deterioration of national roads since only 30
tonnes of coal can be moved by a single road truck, and vast tonnages are
currently moved by contracted road transporters, of which a large number
are emerging BEE players as a prerequisite to the mining scorecard.
Transnet provides the TFR and GFB services to coal producers. TFR only
contracts with RBCT shareholders and allocation members, whilst other
producers have to contract with significantly smaller GFB wagons to transport
coal to alternative ports (Durban and TCM Matola). Railage to ESKOM and
domestic customers (Mittal, Sappi, PPC etc.) is based on both producer and
consumer rail siding requirements and the companies’ effectively managing
loading and discharge requirements.
In terms of exports, TFR had also re-negotiated the industry’s contract to
reflect stringent conditions in terms of cancellations and the industry will be
required in 2010 to contract for a 10 year period. TFR is currently planning
major capital expenditure in terms of maintaining the RBCT line, but also
adding additional rolling stock wagons and locomotives. The capital
expenditure is based on increased planned port capacity and will be
implemented over eight years.
Private and partnership sidings are the key to access to trains, and without
access to a siding, a mining group have very little access to export trains, or
trains delivering coal to the domestic market. Major siding projects are
currently underway implemented by both large and small producers at major
cost. There is however, a mismatch in TFR capacity and current production
numbers for export, and TFR will address this with annual increased
guaranteed capacity, based on its capital expenditure programme.
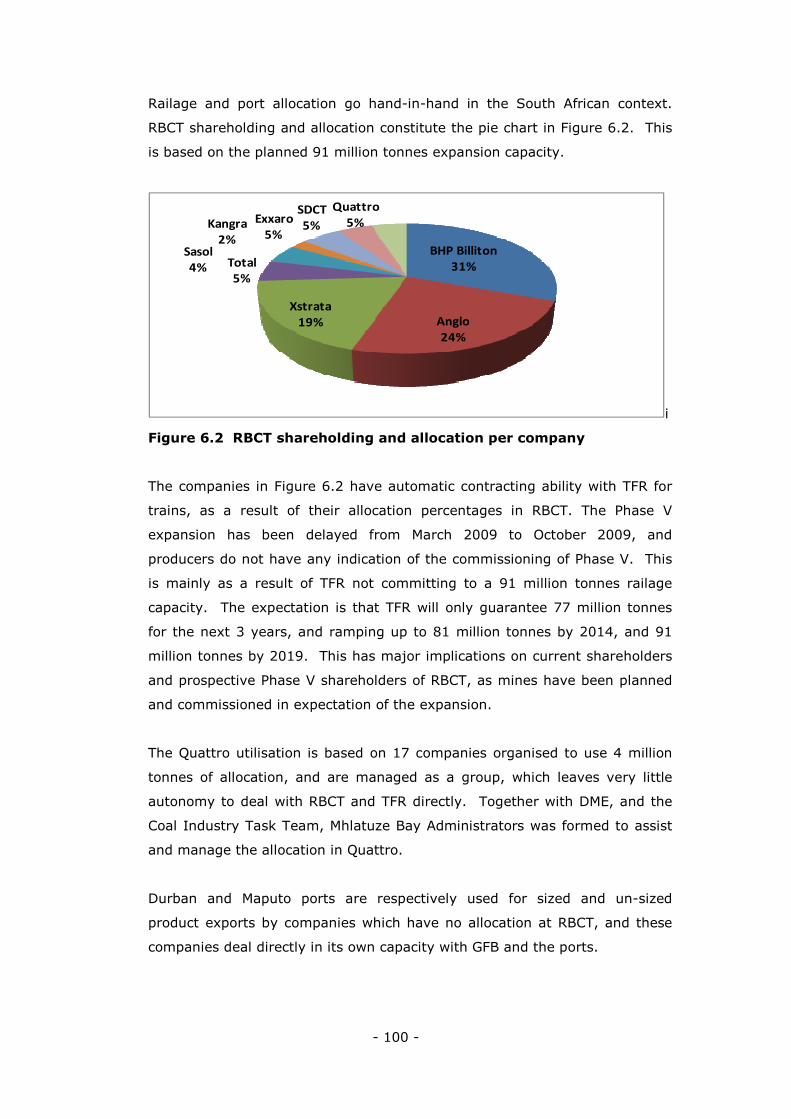
- 100 -
Railage and port allocation go hand-in-hand in the South African context.
RBCT shareholding and allocation constitute the pie chart in Figure 6.2. This
is based on the planned 91 million tonnes expansion capacity.
BHP Billiton
31%
Anglo
24%
Xstrata
19%
Total
5%
Sasol
4%
Kangra
2%
Exxaro
5%
SDCT
5%
Quattro
5%
i
Figure 6.2 RBCT shareholding and allocation per company
The companies in Figure 6.2 have automatic contracting ability with TFR for
trains, as a result of their allocation percentages in RBCT. The Phase V
expansion has been delayed from March 2009 to October 2009, and
producers do not have any indication of the commissioning of Phase V. This
is mainly as a result of TFR not committing to a 91 million tonnes railage
capacity. The expectation is that TFR will only guarantee 77 million tonnes
for the next 3 years, and ramping up to 81 million tonnes by 2014, and 91
million tonnes by 2019. This has major implications on current shareholders
and prospective Phase V shareholders of RBCT, as mines have been planned
and commissioned in expectation of the expansion.
The Quattro utilisation is based on 17 companies organised to use 4 million
tonnes of allocation, and are managed as a group, which leaves very little
autonomy to deal with RBCT and TFR directly. Together with DME, and the
Coal Industry Task Team, Mhlatuze Bay Administrators was formed to assist
and manage the allocation in Quattro.
Durban and Maputo ports are respectively used for sized and un-sized
product exports by companies which have no allocation at RBCT, and these
companies deal directly in its own capacity with GFB and the ports.

- 101 -
Coal export companies furthermore, have to manage arrange and be
knowledgeable about freight and shipping logistics. The three coal terminals
have different terminal and shipping regulations, which exporters have to
adhere to and understand in great detail.
Shipping logistics include port stockpile management, vessel acceptance,
laycan date planning, loading instructions and bill of lading documentation.
This specialised function has to be managed in-house and will form part of
the marketing department function.
- 102 -
Pricing is different for each delivered segment (ESKOM, domestic and
export), and often the three different markets have an inter-related
relationship at specific time intervals. The relationship between the different
markets and its pricing were not as strongly defined historically as it has
converged over the past two years. Although ESKOM and export products
have completely different product specifications, many mines produce both
these products, and pricing is often calculated as a function of a cost sharing
basis.
In 1998, a pricing platform for globally traded coal was established, called
GlobalCoal. From the platform, and indices for FOB RBCT and Newcastle and
CIF Europe prices were established, called API 4, API Newcastle and API 2
respectively. This was the start of a terminal market that brought
transparency to the industry for the first time, and risk management by
derivative trading instruments were introduced. Standardisation of product
specifications was effected, namely, RB1 and RB 2 specification for thermal
coal.
Pricing still remains a function of supply and demand. South African domestic
supply and demand follows the same economic cycles as the global industry,
although it does not account for electricity fundamentals, which are
essentially ESKOM-driven. An understanding of the global macro–economic
environment and the domestic micro-economic environment is essential to
plan and execute optimal pricing structures for the three coal markets.
South African domestic prices started vacillating around the API 4 Index in
2007 when structural changes, such as definite cost hikes in the industry
became evident. This had a major impact on pricing within the domestic
sphere as demand and supply fundamentals were directly applied.
CHAPTER 7
PRICE
- 103 -
ESKOM prices are usually fixed within a band and dependant on the
producers’ status as a BEE or BBBEE player and given the technological
advances in the beneficiation of the coal supplied to ESKOM. ESKOM usually
pay at the bottom of the band if the coal is mined as ROM and supplied,
versus that the ROM goes through a particular stage of beneficiation,
generally to reduce the abrasive index. ESKOM also have long term contracts
with major producers in excess of 1 million tonnes per annum. The pricing
structure for these contracts is also different based on cost-plus pricing,
which will be discussed in detail in the study.
The various characteristics of pricing in the different segments, starting with
export and globally traded coal is discussed in this section. The influence of
export prices on domestic coal prices and finally, ESKOM pricing are
discussed.
7.1 Export Pricing
7.1.1 Supply and Demand fundamentals of the global coal trade
The following macro-economic, environmental and seasonal factors influence
the demand and supply of coal, and are generally an indicating factor of the
direction of the market over the short term, which include forward prices.
Demand
• GDP growth projections per nation or major economic activity per region
indicates an increase in demand for electricity and energy and vice versa;
• Long vessel queues and high stocks in discharging ports affect demand
negatively, and is an indication that demand might becoming depressed,
and usually signals the start of a price downturn;
• Traders taking long positions on a particular indexed coal, resulting in
above normal levels of stocks building up once the price index starts to
fall, which further exacerbates an already down-turning price trend;
• Dry summer conditions can result in reduced barging capacity along the
major rivers which are used for in-land coal transport;
• The Brent Crude price has become an indicator of the direction in which
coal prices will move, as it lags Brent Crude with 3-5 days. This is mainly
as both commodities are energy fossil fuels;
• The unwinding of thermal coal paper positions by financial institutions and
banks;

- 104 -
• Global economic sentiment and the projected impact on China GDP growth
and other economies, particularly India and Brazil. High growth in
developing economies indicate increasing coal consumption;
• Ocean freight rates and the Bulk Commodity Index is a leading indicator of
demand for bulk commodities;
• The depreciation and/ or appreciation of coal producing countries’
(Australia, South Africa, Indonesia) currencies against the US Dollar.
Currency depreciation usually has a lowering effect on US Dollar coal
prices, and appreciation of these currencies usually sees coal prices
increase. The vacillation effect takes between 5 and 10 days on average;
• The effect of construction and increased Nuclear power plants as an
alternative energy source;
• The effect of Carbon trading, and Clean Coal requirements have a
diminishing affect on coal demand, and often these elements make the
price of tradeable coal more expensive than reigning market prices; and
• Sentiment, above fundamentals often drives the market, but only for a
short period.
Supply
• Reserves and resources available, mine-ability and stage of
development of projects indicate planned supply. Planned supply is
usually driven by demand already expressed;
• Economic activity in terms of energy (electricity) generation is a major
indication of policies to restrict coal exports from producing nations.
Once the State of a particular nation places a moratorium on or use
related governmental policies to restrict thermal coal exports, supply
immediately is reduced on a global scale Other producing nations
immediately start planning to supply in the short fall. To this end, in
terms of global thermal coal supply, China’s influence remains critical.
China moved from a net importer of thermal coal position in March
2008, to a net exporter of coal by the end of that year. Infrastructure
bottlenecks in China have also raised concerns within China about
their ability to fully satisfy domestic demand.
• Lack of funding for development of projects – mining, infrastructure,
exploration and new power projects. This is particularly evident in
current market conditions which are viewed as a global financial crisis.
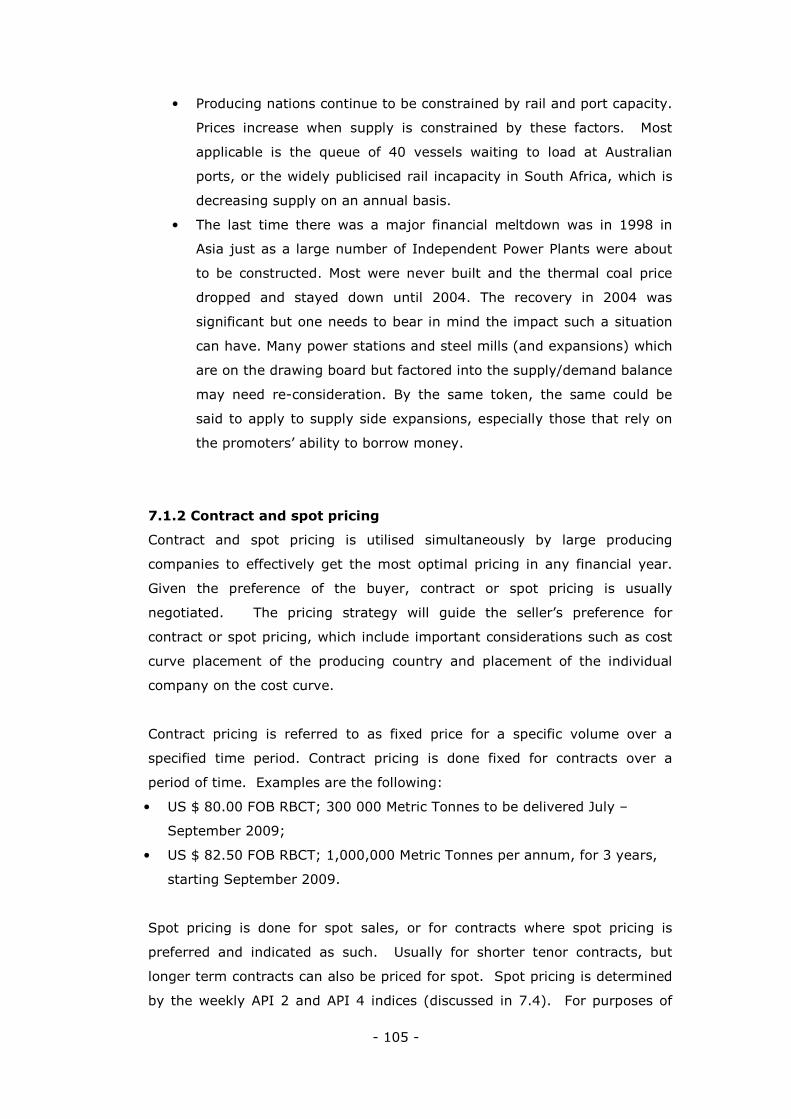
- 105 -
• Producing nations continue to be constrained by rail and port capacity.
Prices increase when supply is constrained by these factors. Most
applicable is the queue of 40 vessels waiting to load at Australian
ports, or the widely publicised rail incapacity in South Africa, which is
decreasing supply on an annual basis.
• The last time there was a major financial meltdown was in 1998 in
Asia just as a large number of Independent Power Plants were about
to be constructed. Most were never built and the thermal coal price
dropped and stayed down until 2004. The recovery in 2004 was
significant but one needs to bear in mind the impact such a situation
can have. Many power stations and steel mills (and expansions) which
are on the drawing board but factored into the supply/demand balance
may need re-consideration. By the same token, the same could be
said to apply to supply side expansions, especially those that rely on
the promoters’ ability to borrow money.
7.1.2 Contract and spot pricing
Contract and spot pricing is utilised simultaneously by large producing
companies to effectively get the most optimal pricing in any financial year.
Given the preference of the buyer, contract or spot pricing is usually
negotiated. The pricing strategy will guide the seller’s preference for
contract or spot pricing, which include important considerations such as cost
curve placement of the producing country and placement of the individual
company on the cost curve.
Contract pricing is referred to as fixed price for a specific volume over a
specified time period. Contract pricing is done fixed for contracts over a
period of time. Examples are the following:
• US $ 80.00 FOB RBCT; 300 000 Metric Tonnes to be delivered July –
September 2009;
• US $ 82.50 FOB RBCT; 1,000,000 Metric Tonnes per annum, for 3 years,
starting September 2009.
Spot pricing is done for spot sales, or for contracts where spot pricing is
preferred and indicated as such. Usually for shorter tenor contracts, but
longer term contracts can also be priced for spot. Spot pricing is determined
by the weekly API 2 and API 4 indices (discussed in 7.4). For purposes of
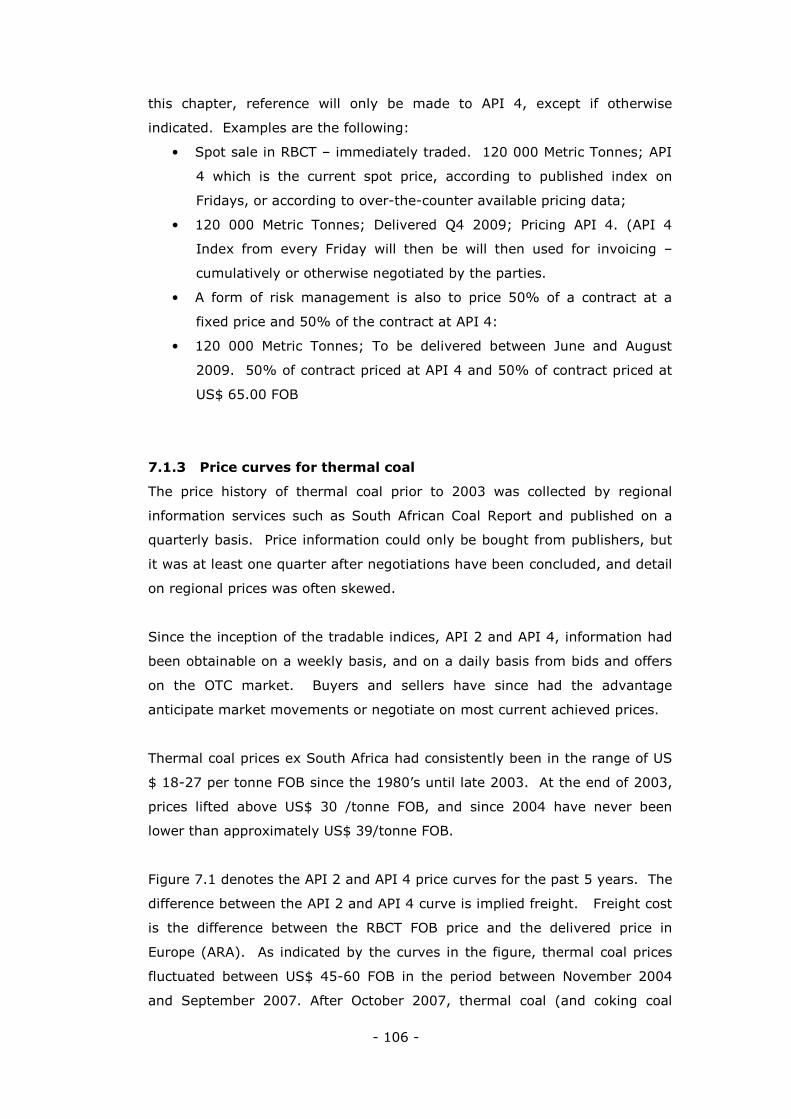
- 106 -
this chapter, reference will only be made to API 4, except if otherwise
indicated. Examples are the following:
• Spot sale in RBCT – immediately traded. 120 000 Metric Tonnes; API
4 which is the current spot price, according to published index on
Fridays, or according to over-the-counter available pricing data;
• 120 000 Metric Tonnes; Delivered Q4 2009; Pricing API 4. (API 4
Index from every Friday will then be will then used for invoicing –
cumulatively or otherwise negotiated by the parties.
• A form of risk management is also to price 50% of a contract at a
fixed price and 50% of the contract at API 4:
• 120 000 Metric Tonnes; To be delivered between June and August
2009. 50% of contract priced at API 4 and 50% of contract priced at
US$ 65.00 FOB
7.1.3 Price curves for thermal coal
The price history of thermal coal prior to 2003 was collected by regional
information services such as South African Coal Report and published on a
quarterly basis. Price information could only be bought from publishers, but
it was at least one quarter after negotiations have been concluded, and detail
on regional prices was often skewed.
Since the inception of the tradable indices, API 2 and API 4, information had
been obtainable on a weekly basis, and on a daily basis from bids and offers
on the OTC market. Buyers and sellers have since had the advantage
anticipate market movements or negotiate on most current achieved prices.
Thermal coal prices ex South Africa had consistently been in the range of US
$ 18-27 per tonne FOB since the 1980’s until late 2003. At the end of 2003,
prices lifted above US$ 30 /tonne FOB, and since 2004 have never been
lower than approximately US$ 39/tonne FOB.
Figure 7.1 denotes the API 2 and API 4 price curves for the past 5 years. The
difference between the API 2 and API 4 curve is implied freight. Freight cost
is the difference between the RBCT FOB price and the delivered price in
Europe (ARA). As indicated by the curves in the figure, thermal coal prices
fluctuated between US$ 45-60 FOB in the period between November 2004
and September 2007. After October 2007, thermal coal (and coking coal
- 107 -
alike) prices rallied to unprecedented levels, almost reaching US$ 200/tonne
FOB in July 2008.
20.00
40.00
60.00
80.00
100.00
120.00
140.00
160.00
180.00
200.00
M-03
J-03
S-03
N-03
J-04
M-04M-04
J-04
S-04
N-04
J-05
M-05
M-05
J-05
S-05
N-05
J-06M-06
M-06
J-06
S-06
N-06
J-07M-07
M-07
J-07
S-07
N-07
J-08
M-08M-08
J-08
S-08
N-08
J-09
M-09
API2 API4
US $ / tonne
Figure 7.1 API 2 and API 4 Price Curves
(Source: Reuters, May 2009)
A global commodity boom controlled both producers and buyers at the time.
The global boom saw heavy speculative participation from hedge funds,
which saw prices rallying for almost 12 months. In October 2008, major
global financial crises erupted and prices plummeted in free-fall to levels
below US$ 60/tonne FOB. The financial crises have influenced producers and
consumers alike as demand had diminished and over supply became evident
on a global scale.
Currently, producers and sellers are struggling to find price direction in the
market. Demand for thermal coal has been significantly altered, and a
subsequent oversupply situation is evident. The terminal coal market
supplies forward curves on a weekly basis to the industry. Forward curves
aim at directing the market price for a maximum forward period of 3 years.
Forward curves are derived from micro and macro-economic information,
coupled with price information from most recent trades.
Producers and consumers use forward curves for various different reasons,
and for indicative price levels at different timeframes. Forward curves often
- 108 -
form the basis of the hedging decision, indicating a decreasing or increasing
price over the 3 year period.
Figure 7.2 Rotterdam (API 2) and Richards Bay (API 4) forward
curves
(Source: Argus Coal Report, May 2009)
As seen in Figure 7.2, both the Rotterdam and Richards Bay forward curves
have a steep upward tail curve. Overall, the curve is viewed to be in
contango, which indicates a strong increase in price over the 3 years (tail
part of curve higher than starting point). In the event that the tail part of
the curve is lower than the starting point of the curve, called backwardation,
it implies that forward period price s set to decrease. In Figure 7.2 above, a
view is taken in February 2009. It is clear that the short term price is set to
decline (backwardated) by Q2 2009, but it then changes to a contango
position to show a steep price increase by 2011. The difference between the
Rotterdam and Richards Bay curve is implied freight, which is the difference
between loaded and delivered material.
7.2 Coal Risk Management and Derivative Trading
7.2.1 The approach to risk management
According to Pringle (1985:4-3), there are four stages of continuous risk
management:
• Identification: Identify the risks that can be managed (production risk,
credit risk, coal price risk, rail and freight price risk, currency risk etc.)
- 109 -
• Quantification: Assess the severity of the risk (i.e. its impact on the
business, and the probability of occurrence. This makes it easier to rank the
risks in the order of preference to actively manage it.
• Managing: The company must now establish a strategy of how to
manage the risk. The company must understand the impact of the risk, and
the impact of managing it, along with the costs involved. The company must
then plot a course of action as to how to deal with the risk management.
• Monitoring: Risk factors vary from time to time, and the company should
continuously update its risk management strategy in order to cope with
changes in the risk profiles. Additionally, a control process must be
implemented which ensures that the trades are kept within their mandate for
risk management actions
For the purposes of risk management in this section, the term hedging will be
used. Hedging is relevant to coal price risk and currency risk. Adapted from
Haug (2007:198), the key issues related to coal price hedging are the
following:
Credit: The coal market is not currently a cleared market, and hence there
is no day to day margining. As a result, and with prices being somewhat
volatile, swaps counterparties may see rather large changes in their credit
exposure to each other. Currently, most companies that trade coal swaps
are very careful as whose credit they will accept. Moreover so now that
many companies have credit default status;
Performance: Performance or production risk is very relevant when
hedging, as changes in the coal availability will immediately impact the
effectiveness of the hedge;
Liquidity: The liquidity of the market directly affects the ability of a risk
manager to effectively hedge. It is important that a large position can easily
be bought or sold without major movements in the market, and generally the
maturity of a market impacts on its liquidity; and
Strategy: Implementing a risk management strategy is of vital importance.
Generally, the most important is to keep transaction confidential, to use the
most suitable financial institution, act decisively when the opportunity arises,
and stick with the goals (i.e. to sell or buy at a fair price).
- 110 -
7.3 The Basics of Hedging Coal
7.3.1 An index
An index refers to a price marker that is supposed to be representative of the
underlying market price of a specific product for delivery during a specific
time period. An index can be objectively or subjectively derived. Traditional
transactions (physical) can be linked to indices whilst swap trades
(derivatives) are always based on an index. Furthermore, an index (1)
provides independently determined benchmark pricing; (2) allows parties to
trade “at market”; (3) promotes security of off-take and supply even during
times when buyers and sellers have very different views on where prices
should be; and (4) provides flexibility (Pardo, 2008:74).
Buyers and sellers can independently hedge their cargoes, and thus they can
achieve different prices form the same cargo. However, where derivatives
are used, buyers and sellers must take care to clearly identify what
objectives they wish to achieve. Derivatives, when used properly, provide a
very effective risk management tool.
Critical elements for an Index to work effectively are:
• Liquidity and transparency – the index must attract a sufficiently large
group of buyers and sellers. This group normally does not just consist
of producers and consumers, but also traders and financial institutions;
• The index numbers must be determined using reliable methodologies.
This can be by using reputable publications, or by using trading
platforms. Both such systems have been effectively used in other
commodity markets; and
• The market participants need to be comfortable that index numbers
reflect the actual physical market.
7.3.2 Available indices
For the international coal market, there are currently two relatively liquid
publication based indices, one for coal delivery into Europe (API 2) and
another for coal delivery ex South Africa (API 4). There are also web based
indices, of which the Newcastle index is the most liquid (globalCOAL NEWC).
Others are being developed for the Far East markets.
- 111 -
For purposes of this chapter, only the traded indices from and related to
South Africa will be discussed, i.e. API 4 and API 2.
7.3.3 Publication based indices
European Index: The TFS API 2 index, for coal delivery into ARA
(Amsterdam, Rotterdam and Antwerp, which are the major coal ports in
Europe). This index is related to coal coming from Russia, South Africa,
Colombia, Indonesia, Australia and others. Physical coal traded into this
market is approximately 190 million tonnes per year, of which a reasonably
large portion is priced against the index. Financially traded coal, which also
settles against this index, is now approaching 650 million tonnes per year,
and growing (which is a phenomenal achievement, considering that the
financial coal deals only started trading in 1998, showing that this market has
been one of the fastest developing derivative markets).
South African Index: The TFS API 4 index is for coal delivery from South
Africa. It relates to coal exported from Richards Bay Coal Terminal. Physical
coal exported via this terminal is currently approximately 60 million tonnes
per year, and coal derivative trades against this index are currently over 250
million tonnes per year. This index only started trading in February 2001,
showing good growth since then.
Australian Index: The Argus / McCloskey Newcastle index is for coal
shipped from Newcastle. Although this index has not had many physical or
paper trades against it and suffers from a lack of liquidity, trade has
increased over the past 18 months.
7.3.4 Web based indices
South African Index: The RB 1 Index is for coal delivery from South Africa.
Similarly to the API 4 index, it relates to coal loaded at RBCT. Large volumes
of this specification coal are traded on the OTC broker market.
Australian Index: The NEWC Index is for coal delivery from Newcastle.
This index is based on a relatively liquid market, where large volumes of
NEWC specification coal are traded on the globalCOAL website as well as in
the OTC market.
- 112 -
7.3.5 Compilation of an index
PUBLICATION BASED = TFS API 2, 4 and Newcastle Index:
These indices are all calculated and published by independent publications on
a weekly basis, and the average of the weekly numbers for any given month
makes up the official index number for that month. The numbers are based
on a combination of actual deals and a market survey for prompt delivery
(being within the 90 days).
The relevant publications available are as follows:
• The prices used for TFS API 2 (CIF ARA) are the average numbers of
the McCloskey Coal Report and the Argus Energy Coal Daily Report;
• The prices used for TFS API 4 are the average numbers of the
McCloskey Coal Report, the Argus Energy Coal Daily Report and the
South African Coal Report;
• The prices used for the Newcastle Index (FOB Newcastle) are the
average of the numbers of the McCloskey Coal Report and the Argus
Energy Daily Coal Report; and
• The prices used for Argus / McCloskey FOB Newcastle are the average
of the numbers of the McCloskey Coal Report and the Argus Energy
Coal Daily Report.
WEB BASED = RB and NEWC indices, both from globalCOAL:
Both the RB and NEWC indices are calculated by using a combination of
actual deals done on the platform and an average of bids and offers within a
certain range in order to arrive at index number. This is usually done at the
end of each week, and a monthly number is compiled from the weekly
averages.
7.3.6 Utilising an index
An index is used with physical and derivative transactions, given it is for
hedging or speculative purposes (Pringle, 1985: 4-8, 9).
Physical Deals: Index pricing can be used for either spot or contract (term)
business. This becomes particularly useful where buyers and sellers cannot
agree on what fixed price to use, but they still wish shipments to continue.
Similarly, where the parties have a strategy to continuously price coal “at
market”, index pricing becomes very effective. Buyers and sellers simply
agree which index period will apply to each relevant shipment and the seller
invoices the buyer once the index numbers becomes known. For example,

- 113 -
the parties can agree that the shipment will be priced against the average
index number for the month of shipment. Should the shipment take place
very early in the month, the parties may consider doing a provisional invoice
for cash flow purposes, and the final invoice once the month average index is
published.
Derivative Deals – Hedging: As an example, a buyer has bought a cargo
at index. After the purchase, but before delivery, the market conditions
might change, and perhaps the buyer now firmly believes that coal prices will
rise. The cargo may thus be invoiced at higher numbers than initially
expected. As a result, the buyer might want to convert to a fixed price basis,
using derivatives, in order to limit the risk that prices will increase. Thus, a
fixed price is locked in, effectively hedging the purchase against higher
prices.
Derivative Deals – Speculative: Some companies, (producers, consumers,
financial institutions and traders) have set up coal trading desks in the
European market, and a similar trend is expected in the Far East. The
trading desks are prepared to do deals, other than pure hedging. They are
prepared to speculate on pricing movements, either in the physical or
financial markets, and thus, will enter into speculative deals. This is a
specialised business strategy, and any company considering this route needs
to carefully consider its objectives and methods. Speculative trading is part
and parcel of any developed market, and contrary to popular belief,
speculators provide much needed liquidity to the market (Adapted from
Pringle, 1985: 5-15, 18).
7.3.7 Settling index deals
Physical: Coal shipped against an index is simply invoiced for at the relevant
official index for the relevant month or quarter of shipment. Although coal
sales trade against an index vary from Handy sized vessels to Cape sized
vessels, it is possible to buy and sell coal in clips of 5 000 tonnes each (but
always subject to the minimum load regulations of the relevant port).
Financial: Coal derivative deals are traded in clips of between 5 000 tonnes
per month, or multiples thereof. Where a trade is done for a quarter or for a
year, the tonnage is still refer to on a monthly basis, i.e. a deal done for

- 114 -
Calendar 2007 for 20 000 tonnes per month, covers 240 000 tonnes. Deals
settle monthly, so at the end of each month the fixed price of each deal is
compared to the index price for that relevant month, and a cash settlement
takes place between the parties. Generally, deals are done for the next two
or three months, the next six quarters, and the next three years. On
occasion, deals are done for settlement three or four years out, and for
structured deals it is possible to get quotes up to ten years out.
The coal derivative market is not an exchange traded market and is not
cleared. No daily margining takes place and counterparties fix credit lines
between themselves. Brokers will quote minute-by-minute forward numbers
against the relevant indices, and it is thus easy to follow changes in the
market. At the end of each day, counterparties use broker reports to
market-to-market their book positions.
7.3.8 Hedging – Swaps, Futures and Options
By definition, a derivative is a paper transaction which value depends, at
least in part, upon a related commodity, in this instance coal. Derivative
therefore is the generic term, the three main sub groups being swaps, futures
and options (Pardo, 2008:74-77).
A swap is a paper agreement between two counterparties: A buyer who
believes in higher coal prices over a nominated period and a seller who
believes in lower coal prices over a nominated period. The name swap arises
from the fact that the transaction is effectively an exchange of a fixed price
(the swap price) for a floating price (the chosen index).
A future is an agreement to buy/sell, on an organised exchange, a standard
quantity of a specific commodity, financial instrument, or currency at a future
date at a price agreed between two parties (coal swaps are not exchange
traded).
An option is a contract, which confers the right but not the obligation to buy
or sell an asset (being either a swap or physical coal) at a given price on or
before a given date. For the purpose of this chapter, options will not be
discussed, since the liquidity for options is very small, which make options
extremely expensive.
A bid is made by a buyer, indicating the price the buyer is willing to pay; and
an offer is made by a seller, at a price a seller is prepared to sell at. The

- 115 -
bid/offer spread is the difference between the buy and sell prices. In order to
get a deal done, one party often has to cross the spread to meet somewhere
between (i.e. the buyer has to increase his buy price and /or the seller has to
decrease his sell price).
7.3.9 Hedging – A Forward Swap Example
API 4 is used as an example – the example will hold the same for API 2,
Newcastle Index and Freight Forwards. Please see Figure 7.4 and 7.5
hereunder:
The Producer (Seller) wishes to lock in a fixed monthly API 4 price for Coal
from April 09 to September 09.
The transaction: Producer (seller) sells a Fixed Price Swap and buys a
Floating Price Swap. A suitable financial institution buys a Fixed Price Swap
and sells a Floating Price Swap. Floating Price Swap is the 6 monthly average
price of API 4, quoted by TFS/McCloskey/ Argus reports.
Figure 7.3 Transaction flow of a hedge
The major attribute to using a forward swap is that a guaranteed price is
locked in, whilst no upfront premium is payable. Opportunity costs arise if the
price moves higher than the fixed or locked-in price, but the producing
company is guaranteed the fixed price. The fixed price swap is transacted for
April to September 2009 at a fixed price of $ 54/t.
There is an exchange of cashflows between Producer (Seller) and the financial
institution that reflects the monetary value of the difference between the
Fixed Price and the monthly average of API 4 quoted by TFS/McCloskey
/Argus reports.
Producer
(Seller)
Fixed
Floating
Financial
Institution
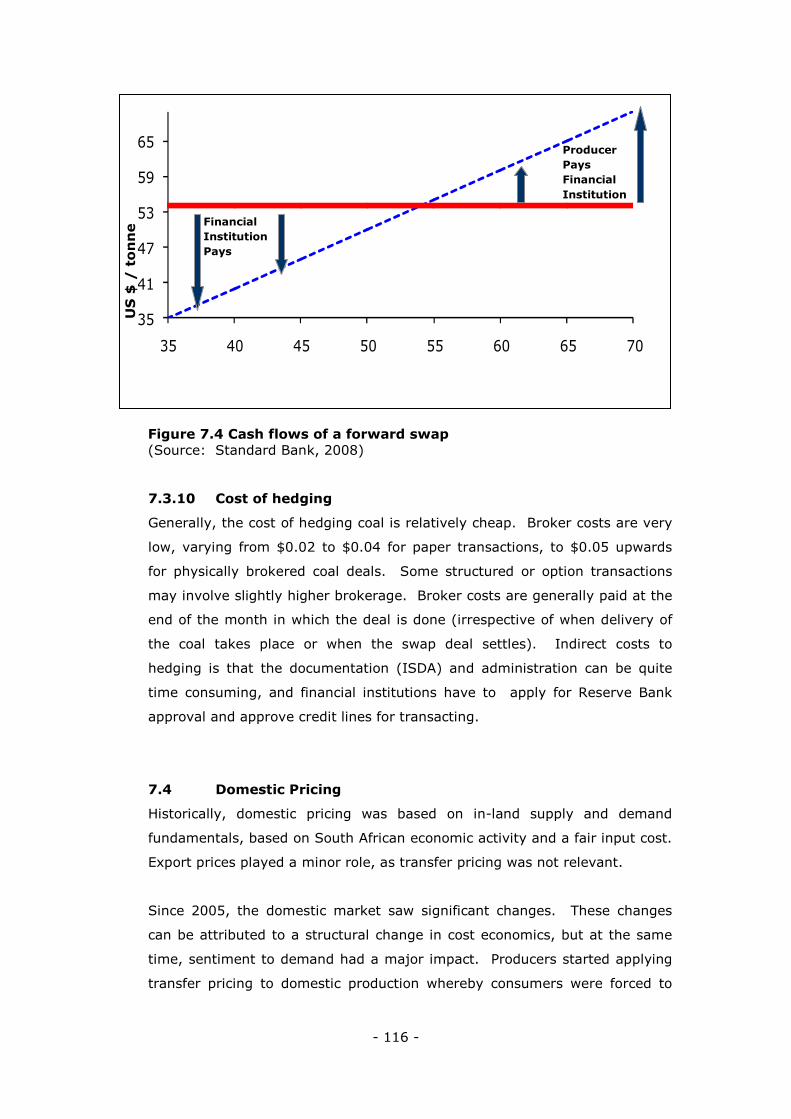
- 116 -
Figure 7.4 Cash flows of a forward swap (Source: Standard Bank, 2008)
7.3.10 Cost of hedging
Generally, the cost of hedging coal is relatively cheap. Broker costs are very
low, varying from $0.02 to $0.04 for paper transactions, to $0.05 upwards
for physically brokered coal deals. Some structured or option transactions
may involve slightly higher brokerage. Broker costs are generally paid at the
end of the month in which the deal is done (irrespective of when delivery of
the coal takes place or when the swap deal settles). Indirect costs to
hedging is that the documentation (ISDA) and administration can be quite
time consuming, and financial institutions have to apply for Reserve Bank
approval and approve credit lines for transacting.
7.4 Domestic Pricing
Historically, domestic pricing was based on in-land supply and demand
fundamentals, based on South African economic activity and a fair input cost.
Export prices played a minor role, as transfer pricing was not relevant.
Since 2005, the domestic market saw significant changes. These changes
can be attributed to a structural change in cost economics, but at the same
time, sentiment to demand had a major impact. Producers started applying
transfer pricing to domestic production whereby consumers were forced to
35
41
47
53
59
65
35 40 45 50 55 60 65 70
Financial
Institution
Pays
Producer
Producer
Pays
Financial
Institution
US $
/ tonne

- 117 -
pay approximately the same price in SA Rand for coal domestically
consumed, as the price in US Dollar received for exports. Producers took
advantage of the rally in export prices during the time, as well as sentiment
that coal might be in tight supply. This was all exacerbated by the ESKOM
demand situation, and that ESKOM claimed it had been under-supplied as a
result of growing exports.
Table 7.1 below constitutes current domestic prices per product and grade,
free-on-truck, excluding Value Added Tax in Rand.
.
Table 7.1 Domestic pricing for products distributed in the in-land
market
Grade Rand FOT
Duff Peas Small Nuts
Large Nuts
A Grade R 520 650 600 600 B Grade R 450 600 600 600 C Grade R 400 550 530 530 D Grade R 300 550 530 530 (Source: EXXARO Domestic Marketing, 2009)
The prices above showed a 41% increase year-one-year between 2007 and
2008, and a 60% decrease between 2008 and 2009. It is evident that the
global recession and depressed coal prices filtered to the South African
domestic coal market.
Producers develop a pricing strategy based on available sales tonnage per
market, given that the correct qualities per market can be supplied according
to its geology and mine plan. Export allocation and access to infrastructure
coupled with achievable prices dictate where the producer will ultimately
market and sell coal. Often an optimisation programme is utilised to
effectively select the correct off-takers, based on their ability to pay asked
prices.
7.5 ESKOM Pricing
ESKOM prices are usually fixed within a band and dependant on the
producers’ status as a BEE or BBBEE (Broad Based Black Economic
Empowerment) player and given the technological advances in the
beneficiation of the coal supplied to ESKOM.
- 118 -
ESKOM usually pay at the bottom of the price band if the coal is mined as
ROM and supplied, as opposed to ROM that goes through a particular stage of
beneficiation, generally to reduce the abrasive index. These contracts are
based on Cost Plus pricing. Cost Plus pricing indicates a percentage added to
the cost of producing the coal for ESKOM. The percentage margin is usually
between 10% and 30%, depending on the producer keeping costs at a
minimum.
ESKOM also have long term contracts with major producers in excess of 1
million tonnes per annum. The pricing structure for these contracts is also
based on Cost Plus pricing. Since these contracts were negotiated between
5-10 years ago, have a tenor of a minimum of 5 years and given the mass
quantity, the margin is usually between 10% and 20%.
7.6 Summary
The macro-economic pricing of coal is dependent on the cost structure for
each company or operation, and the FOB cash costs are indicative of the
producer’s longevity as a market player (see Chapter 5).
On the micro-economic level, pricing will be derived from fixed and variable
cost structures and return on investment prerequisites. Although the micro-
and macro-economic fundamentals of costs are the foundation of pricing, the
different consumer markets follow different pricing regimes i.e. export prices
in general dictate domestic price structures by applying transfer pricing,
whilst ESKOM generally operates on a cost-plus structure.
Export pricing have always been based fundamentally on global supply and
demand fundamentals and have either been contracted or spot price
contracts. The coal market have however, evolved to the extent that
financial institutions, commodity traders and hedge funds are now
participators trading the commodity based on its price volatility. This
resulted in the determination of price based on volatility, rather than actual
demand and supply. Chinese and Indian-lead energy demands have
contributed to the major growth in global coal demand, whilst supply side
economics have been focussing on infrastructure solutions in Australia,
Indonesia and South Africa.
- 119 -
Furthermore, the industry had to absorb structural changes such as renewed
nuclear interest and planned power plant construction and the effect of
carbon trading and clean coal technologies and requirements.
In recent years, the development of coal derivatives has contributed
significantly to forward price hedging. The API #2, API #4 and API Newcastle
indices are published on a weekly basis by Argus International and McCloskey
Coal Research and are used for price setting, forward derivatives and
contracting.
Furthermore, the RB1 and RB2 indices have also been developed for South
African OTC traded coal. The use of derivative pricing is for producers are
exclusively for risk management, although speculative practices by hedge
funds have contributed to the vast growth of this terminal market.
Swaps, futures and options are the traded derivates available in coal trading.
Although swaps and futures are widely traded, the coal market’s illiquidity
restricts the trading of options.
Domestic (ferroalloy, cement, paper and pulp and Mittal) coal price structures
are set by each industry, derived from reigning FOB export prices. Producers
base domestic prices on import parity fundamentals. When export prices are
favourable, it dictates domestic coal prices since producers would rather
export at a premium than to sell product domestically. Since domestic prices
relate closely to FOM prices, producers are eager to sell domestically.
Consumers have been arguing import parity citing the influence of the
constricting port capacity in South Africa.
Albeit those South African domestic prices rose in conjunction with export
prices in recent years, the global economic downturn saw domestic prices
plunge based on international demand fundamentals in late 2008. Export
prices have showed some recovery during 2009, but considering the strong
Rand, domestic prices have lost over 50% of its 2008 value. Domestic
contracts generally escalate each year with a percentage of Producer Price
Index (PPI), but the latest market movements have shown that prices could
decrease.

- 120 -
ESKOM pays relatively low prices, based on the comparative low quality of
the coal it consumes. The national electricity producer has been under
tremendous scrutiny following electricity shortages in 2008. ESKOM
requested new quotations from all its current suppliers, and the industry
reacted overwhelmingly to participate in the project. ESKOM is expected to
review current contracts, whilst still incorporating BEE and BBBEE scorecard
fundamentals. ESKOM pricing is a function of substituted production cost,
and ESKOM favours a cost-plus structure. In lieu of expected increases in
electricity prices, the coal producing industry is confident to receive an
increased percentage on cost.
- 121 -
The promotion of a producer’s product starts with an integrated approach to
market intelligence and relationship marketing. The producer needs to
understand the macro and micro economic environment it is operating within.
This knowledge only develops once a producer become an active participant
within the industry and partaking in the many opportunities to promote the
company and its product.
Relationship marketing is the foundation of promoting a product such as coal.
Active coal marketing in South Africa has been evolving since 1974, which
was the operational start date of RBCT. Domestic marketing has been
developing since the late 1980’s as more producers came into being, product
diversification increased and transfer pricing became eroded between parent
companies and their subsidiaries.
Active reports available on a weekly and monthly basis developed only since
the early 2000, as no terminal market existed for coal up to that point. Once
the derivative market opened and started full trading, have reports and
information become commonplace as part of the marketing function.
Together with relationship marketing, the information available aids marketing
departments and directors in developing and executing a sustainable
marketing strategy, based on ethical trade.
The section on promotion focuses on various promotional efforts, and the
significance thereof within the South African context of coal production.
Promotion is communicating information between seller and potential buyer or
others in the channel to influence attitudes and behaviour (Perrault and
McCarthy 1996:420-421). The marketing manager’s main promotion job is to
tell target customers that the right Product is available at the right Place at
the right Price.
In commodity marketing (or industrial marketing), several promotion methods
exist – sales promotion, advertising, personal selling and publicity, see Figure
CHAPTER 8
PROMOTION
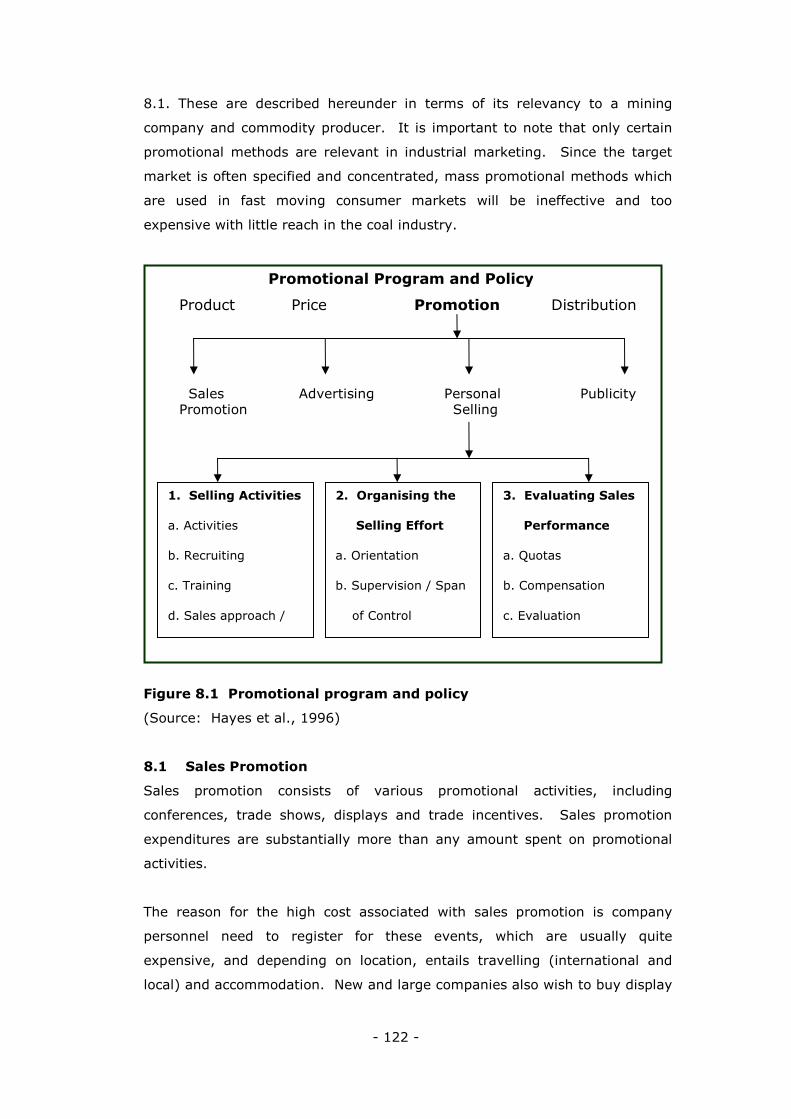
- 122 -
8.1. These are described hereunder in terms of its relevancy to a mining
company and commodity producer. It is important to note that only certain
promotional methods are relevant in industrial marketing. Since the target
market is often specified and concentrated, mass promotional methods which
are used in fast moving consumer markets will be ineffective and too
expensive with little reach in the coal industry.
Figure 8.1 Promotional program and policy
(Source: Hayes et al., 1996)
8.1 Sales Promotion
Sales promotion consists of various promotional activities, including
conferences, trade shows, displays and trade incentives. Sales promotion
expenditures are substantially more than any amount spent on promotional
activities.
The reason for the high cost associated with sales promotion is company
personnel need to register for these events, which are usually quite
expensive, and depending on location, entails travelling (international and
local) and accommodation. New and large companies also wish to buy display
Product Price Promotion Distribution
Sales Advertising Personal Publicity Promotion Selling
1. Selling Activities
a. Activities
b. Recruiting
c. Training
d. Sales approach /
2. Organising the
Selling Effort
a. Orientation
b. Supervision / Span
of Control
3. Evaluating Sales
Performance
a. Quotas
b. Compensation
c. Evaluation
Promotional Program and Policy
- 123 -
space, and these companies have to provide visual material and a resource to
operate the stand. Trade incentives are not common, but producers, traders
and consumers often enter into optional trade incentives, whereby the buyer
or the seller has an option to extend the contract by pre-determined
tonnages. Often a company employee is invited to present the company at
the conference, which is also an opportunity to active sales promotion.
The following conferences are essential for Coal Industry presence. It is
important that the same individual attend the different events, as this person
will become the brand ambassador and relationships will be forged initially
with this person.
o CoalTrans South Africa: Annual event in Johannesburg in September;
o CoalTrans Europe: Annual event in an European city, the annual
international coal event.
o McCloskey Coal Europe: Annual international event in Nice in May.
o McCloskey Coal Conference: Annual event in Cape Town in January.
o Fossil Fuel Foundation: Twice per annum in Johannesburg and Durban.
o Mining Indaba: Annual event in Cape Town in February.
8.2 Advertising
Advertising is any paid form of non-personal presentation and promotion of
goods or services by a specified company. Advertising is not a preferred
industrial marketing tool, but coal producing companies can consider a
market development strategy in terms of the low cost per exposure, the
variety of media (journals and newspapers, internet advertisement), control
of exposure and the consistent message content. Listed coal producers or
new producers entering the market are often participants in industry
advertising. Coal producers usually participate in a few, but important print
advertising opportunities per year, and are as follws:
• Mining Weekly –Coal Supplement;
• Engineering news – Coal Supplement; and
• Mining Review – Coal Edition
Furthermore, coal companies wishing to enhance or build the company brand
can run a web-based advertising campaign. Coal industry players read daily
information on the web, and this has become a significant tool to build
- 124 -
awareness. The following websites are significant in covering the coal
industry, the players and any considerable change in market movements:
• MiningMx;
• Mineweb; and
• Mining Weekly Online.
8.3 Personal selling
Personal selling is the oral presentation in a conversation with one or more
prospective purchasers for the purpose of making a sale. Personal selling is
expensive as it includes travelling, accommodation and entertainment, but
have unique strengths. Salespeople can target and interact with potential
buyers to answer questions and overcome objections, accumulate market
knowledge and provide feedback. The art of relationship marketing is found
in personal selling, and this is also the starting point of relationships with
market players, (see section 8.2). Sincere and ethical relationships
compliment personal selling.
Referring to Figure 8.1, personal selling is divided into 3 sets of sales
management activities as identified by Churchill, Ford and Walker (1990) in
Hayes et al, (1996: 373,375, 377). Although different strategies for products
yield different propositions for each if the three areas, the proposition relevant
in coal marketing is achieving superior performance on the critical measures
of sales of products and increased volume and market share. Figure 8.1
indicate the following specific activities:
• Selling activities and account management policies
o Focus on a relatively narrow range of activities such as product
presentations, prospecting for new customers and identifying new
market opportunities;
o Recruiting sales persons with high levels of technical skills;
o Low emphasis on sales training, high emphasis on product training;
and
o Reflect a system sales or major account management sales
strategy, and encourage a customer orientated selling approach.
• Organising the selling effort
o Reflecting a customer organisation;
o A company marketing department, focussed particular coal

- 125 -
o products; and
o High technical support with focus on trial cargoes, as and when it is
required.
• Evaluating the selling effort
o Setting quotas based on production, infrastructure and port
capability and allocation;
o Compensating marketing personnel on a straight salary plan; and
o Adopting a behaviour-based control system.
Active personal selling determines WHO should be addressing potential and
existing customers (given technical skills paired with technicality of products,
i.e. thermal and coking coal) WHERE, WHEN and WHY.
8.4 Publicity
Publicity is non-personal stimulation of demand for a product by means of
commercially significant news planted in the mass media and not paid for
directly by the company. However, publicity can be negative as well as
positive, and cannot be controlled. Since the company does not purchase the
media coverage, publicity is a cost effective method of communication.
Again, publicity will only be considered by coal producers to establish the
company in the mining industry, given that it is a large or listed entity, or it
has an aim of promoting its safety, environmental or community accolades
and involvement. Usually, publicity is not used to primarily to sell coal
products, but it can be effectively used to keep the industry and market
updated on projects, and development within the company.

- 126 -
8.5 Relationship Marketing
Relationship marketing in the coal industry involves more than a single
organisation. The nature and scope of strategic relationships among various
partners is discussed, as depicted in Figure 8.2 below.
Figure 8.2 Strategic relationships among various partners
(Source: Cravens, 1997)
The drivers of inter-organisational relationships and the logic of underlying
collaborative relationships are discussed, along with the various different
relationships among companies and organisations, and issue concerning
global relationships.
8.5.1 Inter-organisational relationships
Christopher, Payne and Ballantyre (1991:21) state that strategic relationships
among companies and organisations consider the elements of overall
competitive strength – technology, costs and marketing. Unlike tactical
relationships, the effectiveness of these strategic agreements among
companies can affect the long-term performance of the business. In the coal
industry today, several factors create a need to establish cooperative strategic
relationships with other companies and organisations. These influences
include the diversity, turbulence, and riskiness of the global business
environment; the escalating complexity of technology; the existence of large
resource requirements; the need to gain access to global markets; and the
availability of information technologies for co-ordinating inter-company
CUSTOMERS
SUPPLIERS
CHANNEL MEMBERS
COMPETITORS
COMPANY
- 127 -
operations. According to Cravens (1996: 218) the drivers of these
relationships fall into two broad categories, namely (1) environmental
turbulence and diversity and (2) skills and resource gap. These will be
illustrated as part of the discussion on the types of organisational
relationships.
8.5.2 Types of Organisational relationships (see Figure 8.2)
• Supplier Relationships: Relationships with suppliers of raw materials and
equipment are managed by the mining team responsible for extraction and
beneficiation. These relationships are important in terms of technological
developments and cost-saving production methods. Relationship marketing
ensures that a company can stay at the forefront of production development;
• Channel Member Relationships: Relationships with channel members in
South Africa are increasingly important, given the restrictions on capacity to
transport bulk materials. These relationships include traders, agents and
specifically, road transporters, TFR, RBCT and other ports used for exports.
Distribution is planned in advance, but urgent changes can only be effected if
a good relationship exists between the parties. Good relationships are built,
based on timeous information sharing relating to availability of product or
resources, payments receivable and mutual respect between individuals.
Usually, the entire marketing and logistics department are responsible for
these relationships and relationship marketing efforts;
• Customer Relationships: Relationships with customers are often seen as an
obvious bond, although not more important than the other strategic
relationships mentioned. Firstly, the coal producer needs to be customer
focused, understanding needs and wants and how to satisfy requirements and
preferences. In the coal industry, this constitutes an astute technical ability in
terms of logistics and product. Relationship strategies need to recognise
differences in the value of customers. A coal producer will focus heavily on
customer relationships if it has a high production rate, prioritising customers
in terms of value to the company. Higher valued companies will receive more
relationship marketing efforts than lower valued customers, given their
geographical location and access;
• Competitor Relationships: Relationships with competitors have become an
important asset within the South African coal industry. Given logistic
difficulties, competitors do assist one another with product supply when a
vessel laycans and in the Junior mining sector, these relationships are often
the origins for consolidation strategies. Given the fierce competition to gain

- 128 -
access to ports and trains, it is essential that coal producer competitors
understand their environment, and what functional competition is expected
within the industry. Relationship marketing with competitors is either done
directly to the competitive company, or indirectly at various industry functions
and conferences between marketing directors or managers.
8.6 Market Intelligence
Market intelligence constitutes a daily and weekly understanding and
interpretation of domestic and international movements in the market. These
movements include weather conditions which affects producers, rail accidents,
port congestion, consumer production, ramp-up of new production entities,
calling for tender participation, capital expenditure announcements and
economic indicators.
Morris (2009:408-409) states that intelligence studies is an on-going activity,
and includes external environment monitoring and assessment of internal
performance measures; impact analyses; feasibility studies; profitability, pay-
off, and acceptance analyses; performance studies; comparative studies and
marketing audits. Since the coal industry became a terminal market,
information are more readily available from accredited and accepted sources.
The reports available for domestic and international market analyses to reach
the intelligence as set out by Morris (2009:408-9) are the following:
• The South African Coal Report: Published by Wood Mackenzie
(previously Barlow Jonker), is a monthly report on domestic production
and consumption in South Africa. This report gives important
intelligence on projects, producers, consumers, prices and domestic
market indicators;
• The McCloskey Coal Report: This report is published monthly, and
reviews international market movements in terms supply, demand and
price. This report gives important medium term intelligence on coal
prices, producers and consumers, the effects of global weather,
resource incidents and global shipment of coal for the month;
• The McCloskey Weekly Fax: A weekly publication that summarises
price movements and immediate market movements that impact
supply and demand, such as force majeure incidents, mine accidents
and weather forecasts;
- 129 -
• The Argus Daily Coal Report: A daily report on the previous day
market movements and the reasons for volatility shifts;
• McCloskey e-mail service: This is an hourly updated subscription
service. As information is released to the market, this service
interprets and distributes it for immediate consumption;
• The London Commodity News: A brokerage information service
that is free of charge and distributed every day. Very useful concise
coal market information, particularly on stock levels at dispatching and
receiving ports.
• Analyst reports: Macquarie Bank, Barnard Jacobs Mellett, JPMorgan,
Deutsche Bank and Citi Group publish monthly reviews of companies
and the market in general. Good market intelligence to interpret
producer movements on a global scale;
• Reserve bank and commercial bank reports: Weekly and monthly
economic reviews are vital to understanding international and domestic
commodity markets. This market intelligence is used to make effective
assumptions on pricing, the exchange rate and supply and demand of
coal by South African industries;
• Daily exchange rate report: Commercial banks have up-to-date
information available on daily traded exchange rates. When banks are
not used, Reuters is utilised for 5 minute updated rates, and
interpretation in terms of landed ZAR price can effectively be made on
a daily basis.
8.7 Export marketing platforms for trading
An extension of the promotional function in terms reaching producers and
consumers has undoubtedly been the web-based trading platform GlobalCoal,
Over-the Counter brokers (OTC), voice brokers and credit and clearing
houses.
Essentially these platforms are business-to business marketing tools and the
industry have embraced it since 2000. The coal industry market place has
evolved to enjoy enhanced transparency, real-time trading, total anonymity,
process efficiency, and trading and hedging advice. On-line brokers have
been a very important part of the process and they play a vital role in trading.
Brokers assist in the promotional function by matching up counterparties by
continually canvassing the entire market for the highest bids and the lowest
- 130 -
offers in all of the various indexed products. These brokers also provide new
market entrants with advice regarding the development and execution of
trading strategies.
The following brokerages actively broker coal swaps as well as physical
products and effectively play an active role in promotion:
• Amerex – London and Singapore;
• Evolution Carbon – New York;
• GFI – London;
• GlobalCoal – London;
• ICAP – London and South Africa; and
• TFS –London.
8.8 Ethics
According to Gummesson (2000:229) marketing ethics are the moral
standards that guide marketing decisions and actions. Each individual
develops moral standards based on his or her own values. This explains why
opinions about what is right or wrong often vary from one person to another,
from one society to another, and among different groups within a society.
Even so, such opinions may have a very real influence on whether a
company’s marketing decisions and actions are accepted or rejected.
Marketing ethics are not a philosophical issue – it is also of pragmatic
concern. The following issues are embraced and build the foundation for a
code of ethics. This was adapted from the American Marketing Association
(AMA) in Perrault and McCarthy, (1996:47):
8.8.1 Responsibilities of the marketer (producing company)
Marketers must accept responsibility for the consequences of their activates
and make every effort to ensure that their decisions, recommendations and
actions function to identify, serve and satisfy all relevant publics,
organisations and society. This must be guided by:
• The basic rule of professional ethics: not knowingly to do harm;
• The adherence to all applicable laws and regulations;
• The accurate representation of education, training and experience; and
• The active support, practice and promotion of ethics.
- 131 -
8.8.2 Honesty and fairness
Marketers shall uphold and advance integrity, honour and dignity by:
• Being honest in serving consumers, clients, employees, suppliers,
distributors and the public;
• Not knowingly participating in conflict of interest without prior notice to
all parties involved; and
• Establishing equitable fee schedules including payment or receipt of
usual customary and or legal compensation for marketing exchanges.
8.8.3 Rights and duties of parties in the marketing exchange process
Participants in the marketing exchange process should be able to expect that:
• Products and services offered are safe and fit for the intended process;
• Communications about offered products are not deceptive;
• All parties intend to discharge their obligations, financial and otherwise
in good faith; and
• Appropriate internal methods exist for equitable adjustment and / or
redress of grievances concerning purchase.
8.8.4 Ethics in product development and management
• Disclosure of all substantial risks associated with product or service
usage;
• Identification of any product component substitution that might
materially change the product or impact on the buyer’s purchase
decision; and
• Identification o extra-cost added features.
8.8.5 Ethics in promotion
• Avoidance of false and misleading advertising;
• Rejection of high pressure manipulations, or misleading sales tactics;
and
• Avoidance of sales promotions that use deception or manipulation.
8.8.6 Ethics in distribution
• Not manipulating the availability of a product for purpose of
exploitation;
• Not using coercion in the marketing channel; and
• Not exerting undue influence over the reseller’s choice to handle a
product.

- 132 -
8.8.7 Ethics in pricing
• Not engaging in price fixing;
• Not practicing predatory pricing; and
• Disclosing the full price associated with any purchase.
8.8.8 Ethics in marketing research
• Prohibiting selling under the guise of conducting research;
• Maintaining research integrity by avoiding misrepresentation and
omission of pertinent research data; and
• Treating outside clients and suppliers fairly.
8.8.9 Ethics in organisational relationships
Marketers should be aware of how behaviour may influence or impact on the
behaviour of others in organisational relationships. They should not demand,
encourage or apply coercion to obtain unethical behaviour in their
relationships with employees, suppliers and customers. The following should
be adhered to:
• Apply confidentiality and anonymity in professional relationships with
regards to privileged information;
• Meet obligations and responsibilities in contracts and mutual
agreements in a timely manner; and
• Avoid manipulation to take advantage of situations to maximise
personal welfare in a way that unfairly deprives or damages the
organisation.
8.9 Summary
Industrial promotion of coal is different form general retail or services
marketing and promotion in that it is a bulk commodity which cannot be
advertised for sales. However, sales promotion, advertising, personal selling
and publicity form part of the promotional programme of coal as a
commodity, although only certain promotional methods are relevant to
industrial marketing.
Sales promotion is viewed as relationships which can also be formed with new
and prospective buyers at international and national conferences, given the
available promotional activities which also include displays and trade

- 133 -
incentives. A number of important domestic and international conferences are
annually organised and have become well renowned for effective promotion,
i.e. McCloskey and CoalTrans conferences.
Advertising is not used for the promotion of sales, but moreover for the
promotion of the company as market participant, and can done via electronic
and printed media. Advertising can play an important role in the promotion of
the company’s investor relations or gaining cognisance as a new or growing
market participant.
Personal selling is the most important element of the promotional effort as it
encompasses most of the selling effort and the relationships to fulfil the
supply chain to the customer. The objective is to achieve superior
performance on the critical measures of sales, increased volume and market
share. This can only be attained by direct involvement and management of
the product supply chain, especially when the product has to be delivered to
the buyer.
Publicity cannot be controlled, but as part of the promotional programme
needs to be managed in terms of taking advantage of information reaching
the market on developments and production projects within the company.
Privacy in terms of strategy and market share needs control and should not
be used as a publicity tool.
The most important aspect of promotion and marketing products to the
domestic, ESKOM or export consumer market is relationship marketing.
Relationship marketing includes relationships to all stakeholders in the
marketing effort, and includes inter-organisational, suppliers, competitors,
channel members and customers. Internal relationships will dictate the
effectiveness of the marketing effort between production (mine), logistics
(loading and stockpiling), finance (invoicing) and marketing (technical after
sales service and customer management).
External relationships with suppliers, channel members (agents, traders, TFR,
port), customers and competitors (on a national and international scale) are
based on the need to increase market share and producing efficiently at low
cost, whilst aiming to be a responsible corporate citizen. These relationships
are the primary foundations of commodity marketing.
- 134 -
Market intelligence is vital to operate as a member of the producing fraternity,
as it forms the basis for relationships and to take advantage of market
opportunities. Not only can weekly and monthly publications be used for this
purpose, but the OTC market and the participating brokers prove to be a
rated source of knowledge and intelligence. Internal and external
relationships are also an important source of market intelligence and
information needs weekly and monthly collation to benefit the organisation at
all relevant levels.
Ethics guide the process of marketing and distribution and needs to be upheld
to the highest standard. Successful marketers have a good comprehension of
ethical standards and responsibility to the producing company, the customer
and all channel members, which ultimately constitute the market. Ethics
plays an important role in product development, promotion, distribution,
pricing and marketing research.
- 135 -
This chapter will include the salient features of each section discussed in this
study. Recommendations for future research are made in terms of each
relevant section. Albeit that a considerable amount of information had been
presented, the market evolves constantly. As a result, recommendations for
future research are made after each section, which based on market
intelligence which is currently driving the sustainability of this market.
9.1 The South African Producer (Supply)
The South African producer market historically consisted of the major mining
groups represented in South Africa, i.e. Anglo Coal, BECSA, Xstrata, SASOL,
TOTAL Coal South Africa and Kangra. These companies constituted captive
ESKOM production and the majority of South African exports.
The promulgation of the Minerals and Petroleum Resources Development Act
(MPRDA) 28 of 2002 saw the emergence of a very active Junior Mining Sector.
This sector mainly constitutes BEE and BBBEE companies, with the most
notable EXXARO Coal, which was formed from Kumba Resources and Eyesizwe
Coal in 2006.
Although most of these companies produce less than 1 million tonnes per
annum, the Mining Charter and procurement scorecard dictates that domestic
coal consumers and ESKOM be supplied from these companies. Most coal
producers cannot participate in the ESKOM market without producing an
export product, and vice versa.
The privately owned RBCT made 4 million tonnes of port allocation available to
these junior miners, and this allocation is managed by the DME and the Coal
Industry Task Team (CITT). RBCT made a decision to expand the port to a
capacity of 91 million tonnes per annum and successful BEE applicants will
CHAPTER 9
CONCLUSIONS, IMPLICATIONS AND
RECOMMENDATIONS FOR FUTURE RESEARCH

- 136 -
become shareholders in the port at commissioning of the expansion. Notably,
African Rainbow Minerals, Mmkau Mining, EXXARO Coal, Anker Coal, Umcebo
and Worldwide Carolina Coal will become the new breed of exporters through
the world’s largest coal exporting terminal.
Production in South Africa is most active in the Mpumalanga province,
although the Limpopo province with the Waterberg reserves is growing fast.
Coal producers are dependant on infrastructure to transport coal, and major
infrastructure development is currently undertaken to ensure a successful
supply chain.
Recommendations for Future Research
Ann assessment of the depletion of the Mpumalanga coal reserves, and the
migration of coal suppliers to the Limpopo Province. The historical
geographical supply area is bound to change within the next 5-10 years. This
will have a major impact on rail infrastructure, FOB costs and probably the
quality of coal available for consumption domestically and for exports.
The resurrection of and return to the Kwa-Zulu Natal coal reserves should also
be considered. A number of companies and the DMR are advocating the
resurrection of these coalfields, and a FOB cash cost comparison with the
Limpopo reserves should provide significant insight.
Consolidation within the BEE market. More than 20 BEE companies currently
operate in the South African Coal Industry, and 18 of these have to share in
Quattro allocation (4 million tonnes) at RBCT. The view is that economies of
scale and competitiveness are ignored, and consolidation between these
companies will yield far greater success in BEE mining and transformation.
In 2008, a major skill shortage was published. Skills transfer to the Junior
Mining Sector can shed important light and insight to the staffing of this
sector, as skills (talented individuals) are often recruited from larger
companies
- 137 -
9.2 The South African Market (Consumer)
Approximately 27% of all saleable coal produced in South Africa is exported to
energy providers, cement plants and metallurgical players in mainly Europe,
South America, China, and India.
ESKOM consumes substantial tonnages of low grade coal and contributes to
46% consumption of saleable production. SASOL Synthetic Fuel consumes
18% of South African production which is entirely produced by SASOL Mining.
The remaining 9% of saleable production is consumed by the domestic market,
which is divided in 12 user groups. 38% Of the domestic market production is
traded by merchants, which signals that an extensive trading market is also
operating within South Africa.
Recommendations for Future Research
The impact on domestic production as ESKOM increases its demand within the
next 5 years. The developing coal fields and infrastructure that will supply in
this significant growth has to be examined and quantified.
The role of domestic channel members and the quantification of their potential
margins have to be researched. The issue of B2B activities between major
producers and consumers needs to be examined whilst taking into account the
role of domestic channel members.
The role of SASOL developing new mines to feed its production to SASOL
Synthetic Fuels for the next 20 years. The impact on the South African
reserve and resource base as SASOL’s development starts.
The emergence of Independent Power Plants and the implication for domestic
consumers. This research will prove to be significant as these plants are not
regulated by ESKOM, and will consume similar B-D grade product, as currently
consumed by domestic users.
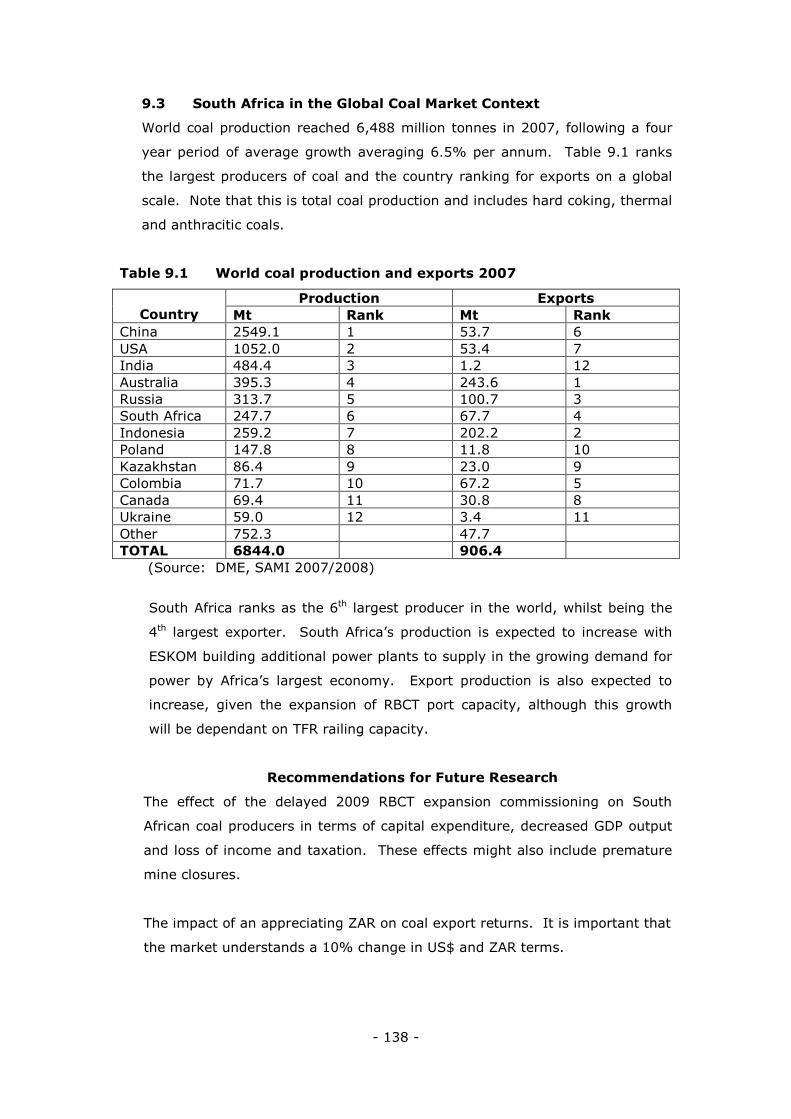
- 138 -
9.3 South Africa in the Global Coal Market Context
World coal production reached 6,488 million tonnes in 2007, following a four
year period of average growth averaging 6.5% per annum. Table 9.1 ranks
the largest producers of coal and the country ranking for exports on a global
scale. Note that this is total coal production and includes hard coking, thermal
and anthracitic coals.
Table 9.1 World coal production and exports 2007
Production Exports Country Mt Rank Mt Rank
China 2549.1 1 53.7 6 USA 1052.0 2 53.4 7 India 484.4 3 1.2 12 Australia 395.3 4 243.6 1 Russia 313.7 5 100.7 3 South Africa 247.7 6 67.7 4 Indonesia 259.2 7 202.2 2 Poland 147.8 8 11.8 10 Kazakhstan 86.4 9 23.0 9 Colombia 71.7 10 67.2 5 Canada 69.4 11 30.8 8 Ukraine 59.0 12 3.4 11 Other 752.3 47.7 TOTAL 6844.0 906.4
(Source: DME, SAMI 2007/2008)
South Africa ranks as the 6th largest producer in the world, whilst being the
4th largest exporter. South Africa’s production is expected to increase with
ESKOM building additional power plants to supply in the growing demand for
power by Africa’s largest economy. Export production is also expected to
increase, given the expansion of RBCT port capacity, although this growth
will be dependant on TFR railing capacity.
Recommendations for Future Research
The effect of the delayed 2009 RBCT expansion commissioning on South
African coal producers in terms of capital expenditure, decreased GDP output
and loss of income and taxation. These effects might also include premature
mine closures.
The impact of an appreciating ZAR on coal export returns. It is important that
the market understands a 10% change in US$ and ZAR terms.

- 139 -
Evaluating Southern African countries as new sources of coal production in
Southern Africa. These will include Mozambique, Botswana, Zambia and
Zimbabwe. The study needs to relate to infrastructure determination with
special mention of railage from these countries and utilisation of Walvis Bay
and Beira Port.
9.4 From Geology to Mining to Product
The project or mine geology is the fundamental starting block of the resource
model, the financial feasibility study and ultimately the business and
marketing plan of the company. The mining method for extraction is
determined based on the geological model, and beneficiation capacity erected
based on the washability curves yielded by ROM material.
The activities to reach mineable production are as follows:
• Early exploration;
• Detailed exploration to develop a pre-feasibility study;
• Developing and testing washability curves based on borehole analyses;
• Development of mine plan and beneficiation facility, which include
mining method and plant design;
• Obtaining of new order mining right, Environmental Impact
Assessment on beneficiation area and development of social and labour
plan to underwrite the objectives of environmental and community
sustainability; and
• Pre-mining exploration on an on-going basis to sustain an optimal mine
plan.
Once a project reach operational status, the operations are defined in terms of
the original geology, mining and beneficiation, infrastructure, railage and port
costs are added to determine the FOB cash costs. These costs are essential
to determine firstly a country’s competitive production position, and secondly
a company’s competitive ranking within a particular geographical area.
The FOB cash cost curve is the ultimate indication whether a company will
profitably produce if nominal prices decrease as a result of market conditions.
The cost curve is also an important management tool to plan for continuous

- 140 -
improvement in order to manage competitiveness and ensure the decrease of
real costs.
Recommendations for Future Research
The trading of reserves based on in-situ and ROM calculations. The
determination of reserves should be based on activities in the area as well as
the life cycle point in which the project finds itself.
9.5 Product Specification
Coal marketing as a function can only be initiated by a full product
specification, which is used as the basis of discussion between a producer and
consumer. The offered product has to be presented as a typical specification
to buyers, and has to include proximate analyses, ultimate analyses, forms of
sulphur, hardgrove index indications, ash fusion temperatures, analyses on
calorific value and an ash composition. Products can be marketed on a dry,
air dried or as received basis, and the marketer should ensure that the
consumer or buyer understand the basis of contracting.
Companies historically developed its branded typical specification sheet based
on the parameters set out above. In terms of domestic and ESKOM marketed
coal, these specification sheets are widely used.
The export market evolved to such an extent that the Standard Coal Trading
Agreement (SCoTA) specification parameters are used for basic trading. This
standard specification is known as RB1 and only includes analyses on calorific
value, total moisture, volatile matter, ash, sulphur, hardgrove and grindability
index, ash fusion temperature and calcium oxide in ash.
The study set out to compare and distinguish between the different basis of
reporting and product specification for each market, i.e. ESKOM, domestic (in-
land) and export.
Recommendations for Future Research
Value-in-use study per customer, i.e. domestic ferroalloy producers; European
and Indian thermal coal consumers and sized consumer market in Turkey.
This study is important to understand the potential pricing between markets,

- 141 -
and possible substitution. Based on these findings, producers will strategise
around a market of choice, and production will yield the specific product
quality to equal an acceptable return.
Blendability of product on South African and international stockpiles.
Producers require an understanding of its product blendability on stockpiles at
various port destinations. The value of this is to form alliances with other
producers and to create enhanced products in demand by end-consumers.
Understanding and determining the blendability of ESKOM consumed products
can be of the same value.
9.6 Product Utilisation
Thermal coal is mainly used for energy generation in boilers, burners and kilns.
The two main markets are identified as electricity generators and cement
manufacturers.
The size fraction of utilised coal is equally important, and the development of
pulverised coal injection since the 1970s saw sophistication and optimised
usage of thermal coal in powdered form.
ESKOM utilises coal for electricity generation, based on high ash thermal coal
consumption. The energy value required by ESKOM is inferior to domestic (A-
grade) and export quality production, but is customed for use in these power
plants. Moreover, the mineable product originates from different geological
coal seams which dictate that mining will yield more than one product,
marketable to different consumers. Efficiency and profitability are optimised
by extracting value from multiple seams.
Similarly, production for export and domestic utilisation is of superior quality
with substantial higher energy and calorific values, and products are custom
produced for these markets. The exception is B, C and D-grade production
destined for the domestic market, although these products will not be the
desired quality for ESKOM utilisation.
Superior technical knowledge and analyses are demanded of the technical and
marketing teams servicing the customer, albeit based on the specific
utilisation of the product.
- 142 -
Recommendations for Future Research
The impact of electrostatic precipitators on coal consumption in Europe. The
study has to define the increased or decreased use of coals with high sulphur
contents. This has to be studied considering that the remaining world coal
reserves have high sulphur contents.
The impact of Carbon Emission Trading on product consumption and
substitution after 2010. The EU specifically needs to be evaluated as a buyer
and importer of coal, which is also heavily scrutinised for its contribution to
reduced carbon emissions. Individual countries in the EU will contribute
significantly to this analysis.
9.7 Channel Structures for Distribution
Various channel structures exist in the three markets under discussion.
Agents and traders operate as middlemen between producers and ESKOM,
domestic consumers and international buyers and traders.
Small, medium and large producing entities have to consider the attributing
value an agent or trader could add to a specific business. The reasons for
utilising services from agents and traders could vary from lack of marketing
skills, specific cultural barriers, the stage of current product life cycle, or the
complexity of technical marketing required.
Added value should be the main driver for utilising the services provided by
domestic or international distribution structures, although producers should be
selective in choosing agents and traders for representation. These structures
have been developing and evolving for the past 20 years, and compliments
the distribution function of coal as a commodity, since these companies have
enhanced access to logistics and infrastructure, which could be essential for
smaller companies.
Channel structures are often utilised on short-term basis to gain access to
higher prices or blending facilities.
- 143 -
Recommendations for Future Research
Determination of relevant channel members at a specific life cycle stage. It
has to be determined which members, the quantity and the specific strategy
or reason these members are to be utilised in the introductory, growth,
maturity and decline phases of the product.
Current cost and determination of cost of channel members per market, i.e.
export, domestic and ESKOM should also be determined and evaluated in
terms of return on investment and return on equity.
9.8 Incoterms and Contracting
Incoterms form the basis of any domestic or export sales contract, and is the
worldwide standard for the interpretation of trade terms.
An understanding of Group E (ex works), Group F (FOM, FOT, FOR, FAS, FOB),
Group C (CFR, CIF), and Group D (DES) terms are essential for successful
contracting inside or outside the borders of South Africa. The seller stipulates
its risk and responsibility in terms of the trade contract, and the buyer
assumes risk and responsibility on the same basis.
Incoterms inherently include the conditions of a delivery which stipulate
requisite licences, government regulations and the overall framework for using
a mode of transport to fulfil a transaction at a specific time and place.
Recommendations for Future Research
Interpretation of free-on-carriage as an Incoterm, where production and
marketing is done on different continents. This is relevant for multi-national
corporations producing in e.g. Columbia and South Africa, but fulfilling its
marketing function in Europe.
Contractual comparison between SCOTA and OTC agreements. This study has
the potential to develop markets for a producer, whilst using international and
B2B platforms for trading.
- 144 -
The impact of Incoterms on tradable Letters of Credit (L/Cs). Although this
study will be all encompassing on L/Cs, the significance of Incoterms and the
thorough understanding thereof will become evident.
9.9 Modes of Transport
Coal in South Africa is transported by conveyor belts (ESKOM and SASOL),
road (30 tonne road hauling trucks), railage (5800 and 8400 tonnes per block
load), and vessels sailing from Durban, Maputo or RBCT (handy size, panamax
and cape size vessels).
Increased road transport has been affecting national roads and safety in South
Africa and this can mainly be attributed to a lack of rail infrastructure and a
growing demand for domestically traded and ESKOM consumed coal.
South African rail infrastructure will need minimum capital expenditure of at
least R 4bn over the short term to maintain and develop the immediate needs
of the coal industry. The recent expansion of RBCT to facilitate 91 million
tonnes remain questionable as TFR is not committing to rail capacity of more
than 73 million tonnes in 2010. Railage to alternative export facilities is
further exacerbated as GFB is responsible for this whilst providing a much
smaller fleet with greatly decreased capacity.
Producer sophistication dictates a company’s participation in shipping, and
exporting parties are dependent on competent logistics and shipping teams
taking responsibility for bulk movement of coal.
The most prevalent issue in South African coal logistics remain railage and the
industry is not expecting major growth or opportunities without the
commitment of TFR going into the future. The country is optimistic about the
future of commodities, but only increased infrastructure, rail and railage will
make increased output a reality.
Recommendations for Future Research
The impact of Private Public Participation (PPP) on rail projects. Given the
lack of rail infrastructure in South Africa, PPPs on locomotives, track and
- 145 -
wagons need to be investigated with specific attention to the role of the
Government and its participation to such options.
The planned TFR capital expenditure programme in South Africa, and its
impact on GFB and TFR lines. Capital amounts, areas and timing have
relevance in forming an optimal opinion on the planned and probable
investments.
The impact of the Competition Act on railage in South Africa, given the
homogeneity of coal producers. Recently, TFR formed a task group for these
purposes, and major changes are expected to minimise collusion. These
changes and limitations need to be articulated.
9.10 South African Port Allocation
RBCT remains the key coal exporting facility in South Africa. Albeit in the
hands of private shareholders since its inception in 1976, its Phase IV and V
expansions recently made provisions for inclusion of BEE Junior Mining
Companies.
Depleting reserves and mine-to-rail infrastructure constraints have seen RBCT
shareholders sub-leasing allocation to smaller developing producers, although
some major shareholders had to develop new projects to sustain their export
allocation.
The effect of some 18 new coal producing companies also saw a renewed
constraint in port allocation in South Africa. The Quattro Allocation is
insufficient for any junior company to gain economy of scale, and the freight
differential between state-owned ports and RBCT make competing within the
international coal arena very complicated.
Although state-owned ports make provision for coal exports, the recently
depressed markets can not sustain the FOB cash costs generated at these
ports. Port allocation cannot be viewed in isolation and accompanied rail
capacity remains the single most important element in planning and executing
coal exports through the available port network in South Africa.
- 146 -
Recommendations for Future Research
The feasibility of Richards Bay Dry Bulk Terminal in depressed markets needs
to be analysed. Given lower prices but very few alternatives, the business
case for RBDBT has to be examined in terms of producers buying into existing
markets as the only option available.
A global perspective of nationalisation of port networks. Given that RBCT is a
privately owned port in South Africa and excludes new and BEE producers, a
global perspective will enhance the opinion on nationalisation of such assets.
The link between port and rail capacity in terms of the operational supply
chain needs to be evaluated. By probing port and rail capacity, a company
can strategise around its production capacity and marketing ability for
domestic and export markets and switching products in the supply chain to
adhere to logistical constraints.
9.11 Export Pricing and Risk Management
Participation in the export market depends on various factors such as size of
production, access to infrastructure and particular channel structures, and the
influence a single producer can have on price.
An understanding of export pricing, based on global supply and demand
fundamentals is vital to anticipate changes in domestic product pricing and
ultimately to produce changes in pricing strategy for each product and market.
Planning horizons in mining can be extended periods and often future off-take
contracts are required for financial assistance to establish the project.
Managing the resulting risk or re-defining any financial risk in terms of pricing
can be done by utilising derivative instruments.
With the development of the terminal market for coal, financial institutions
became important market players and risk management through hedging and
limited options. Coal players currently have the opportunity to fix or hedge
future prices which can determine a company’s financial stability or success in
projects.
- 147 -
Price forward swaps give market players the opportunity to interpret contango
or backwardated curves to the best advantage of the company, but a hedging
strategy and adhering to international trading standards are prerequisites.
The indices used in derivatives are internationally recognised and form an
important basis of sales contracts.
Recommendations for Future Research
Development of a derivative and trading strategy for an individual coal
consumer and producer. All actions pertaining to derivative trading needs to
be determined and a step-by-step guide developed to direct a consumer or
producer to become a trader of coal derivatives.
Studying and determining the qualities of producers that classify them as price
setters or followers in the international market. Is the market small enough to
dictate a price to, and should all producers simply follow market prices?
Foreign ownership of producing assets and how it influences profitability of a
coal producer. This is currently the case of AIM and London listed entities with
reserves or operations in Indonesia and South Africa. It is important to
understand foreign investment and its desired returns on local producers.
9.12 Domestic and ESKOM Pricing
Price determination for domestically placed coal production as well as ESKOM
product has evolved as a result of major volatility in export prices experienced
since mid-2008 and structural economic changes in South Africa. It has to be
noted that the quality of domestically consumed and ESKOM product differs
substantially, and substitution is only possible between domestically consumed
product and export product (limited to A-grade domestic product).
Coal producers having access to export allocation dictated major price
increases to domestic consumers, on the basis of rather exporting production
than remaining in the domestic market. Previously, domestic prices were
similar for every grading of coal and the general annual escalation was based
on a percentage of Producer Price Index.

- 148 -
ESKOM announced in late 2009 that it will revisit its procurement strategy and
enquired new proposals from its existing suppliers. Although the outcome of
the tender process is not yet public domain information, expectations are that
ESKOM will be paying increased prices for coal, and passing the price increase
on to consumers of electricity. Historically, ESKOM priced at Rand per tonne,
but this also changes to Rand per gigajoule heat value.
Recommendations for Future Research
The impact de-regulation of electricity supply will have on ESKOM and the
South African economy. Certainly a topic of debate over the past 10 years. It
is important to understand why de-regulation has not yet transpired in South
Africa, and which foreign models can be used and applied in South Africa.
The influence of carbon emission limitation on domestic consumers,
specifically, ferroalloy producers and SASOL Synthetic Fuels needs to be
investigated. These companies need to limit their carbon footprint, given that
most are foreign listed entities. Will South Africa eventually adhere to
international standards of emission reduction and when will this happen?
Could this expedite the process for South Africa to participate on a global scale
of carbon emission reduction?
9.13 Relationship Marketing Yields Market Intelligence
The successful marketing of commodities is premised in understanding
products, customers, technology, markets, prices, channels and the internal
and external factors influencing these on a weekly, monthly and annual basis.
Market intelligence and analyses are the tools utilised to fully understand the
market place, but presence over a medium to long term horizon provides the
insight required to operate in an ever-changing environment. Relationship
marketing can only be fully developed over a period of time, and will ensure
optimal market intelligence and interpretation of market movements.
- 149 -
Recommendations for Future Research
The effect of electronic commerce on commodity marketing needs further
investigation. Whilst this incorporates the effects of B2B commerce and OTC
trading, the question remains: “why are relationships still so important and
essential in commodity marketing?”
The constraints of culture and language barriers in international commodity
marketing should be researched to determine whether different strategies are
essential per specific region. It should be determined which regions or countries
in the world will require similar language and culture for commercial trading.
- 150 -
Adendorff, SA. and De Witt. 1999. Production and Operations Management – A
South African Perspective. United Kingdom: Oxford University Press.
Argus Media. Argus Coal Daily International. Report Publish on daily basis –
Cited March to Deptember 2009.
Barradas, S. 2006. South Africa’s Road Industry 2006. Creamer Media’s
Research Channel. www.researchchannel.co.za Accessed 23 April 2009.
Bowersox, DJ. and Cooper, MB. 1992. Strategic Marketing Channel
Management. Singapore: McGraw-Hill International Editions.
Christopher, M. 1992. Logistics - The Strategic Issues. 1st ed. Great Britain:
Chapman & Hall.
Christopher, M., Payne, A. and Ballantyre, D. 1991. Relationship Marketing.
Oxford: Butterworth Heinemann.
Cravens, DW. 1997. Strategic Marketing. 5th ed. United States of America:
Irwin/McGraw-Hill.
Crowson, P. and Sampson, R. 2000. Managing Metals price Risk with the London
Metal Exchange. London: The London Metal Exchange.
De Kok, AG. and Graves, SC. 2003. Supply Chain Management: Design,
Coordination and Operation. Volume 11. Amsterdam, The Netherlands: Elsevier.
Department of Minerals and Energy. Incorporating Coal Industry Task Team
Statistics, 2008/2009.
Department of Minerals and Energy. South Africa’s Mineral Industry 2007-2008.
Directorate Minerals and Energy.
REFERENCES
- 151 -
Doyle Trading Consultants. 2005. The Coal Trading Handbook. United States:
Hill & Associates, Incorporated.
Dwyer, FR. and Tanner JF. 2002. Business Marketing. Connecting Strategy,
Relationships and Learning. 2nd ed. New York, United States of America:
McGraw-Hill.
Eskom Technical Team Presentation May 2009.
Gattorna, J. 2006. Living Supply Chains. How to mobilize the enterprise around
delivering what customers want. Great Britain: Pearson Education Limited.
Gummeson, E. 2000. Total Relationship Marketing. Oxford: Butterworth
Heinemann.
Global Coal Limited 2000 – 2007. Standard Coal Trading Agreement (SCoTA),
Version 6B.
Haug, EG. 2007. Derivative Models on Models. West Sussex, England: John Wiley
& Sons Limited.
Hayes, HM., Jenster, PV. and Aaby, N. 1996. Business Marketing – A Global
Perspective. United States of America: Irwin.
Hisrich, RD. and Peters, MP. 1991. Marketing Decisions for New and Mature
Products. United States: Macmillan Publishing Company.
Lovelock, CH. 1996. Services Marketing 3rd ed. United States of America:
Prentice Hall Inc.
Lynch, CF. 2000. Logistics Outsourcing – A Management Guide. United States
of America: Council of Logistics Management.
Melnyk, SA. and Denzler, DR. 1996. Operations Management – A value-driven
approach. United States of America: Irwin.
Merrick, M. 1984. Coal Combustion and Conversion Technology. Macmillan:
Hong Kong.
- 152 -
Morris, A. 2009. Industrial and Organisational Marketing. 2nd ed. New York:
Macmillan Publishing.
Nagle, TT. and Holden, RK. 1995. The strategy and Tactics of Pricing – A Guide
to Profitable Decision Making. 2nd ed. INC United States: Prentice Hall
International.
Palmer, R. 2002. Managerial understanding of contempory industrial marketing
issues. Qualitative Market Research: An international journal. Vol 5 No 2: 135-
143.
Pardo, R. 2008. The Evaluation and Optimisation of Trading Strategies. 2nd ed.
United Kingdom: John Wiley & Sons Incorporated.
Perreault Jr, WD. and McCarthy, EJ. Basic Marketing – A Global-Managerial
Approach. 12th ed. United States of America: Irwin.
Pringle, M. 1985. The McGraw-Hill Handbook of Commodities and Futures. New
York: McGraw-Hill Book Company.
Reuters 2009. Accessed for Pricing information – 12 May 2009.
Sheth, JN. 2002. The future of relationship marketing. Journal of Services
Marketing, Vol.16 No 7: 590-592.
Vogt, JJ. , Piennaar, WJ and de Wit PWC. 2002. Business Logistics Management –
Theory and Practice. Cape Town, South Africa: Oxford University Press.
Waterhouse, GW. 1991. GWC Coal Handbook 1991. Lincolnshire PE9 4RT:
George Waterhouse Consultants Limited.
www.angloamerican.com Anglo American Annual Report 2008 Cited 2 May 2009
www.eskom.co.za Eskom Annual Report 2008 Cited 23 April 2009
www.EXXARO.com Annual Report 2008 Cited 15 April 2009
- 153 -
www.sasol.com Sasol Annual Report Cited 5 May 2009
www.transnet.co.za Transnet Annual Report Cited 20 May 2009
www.xstrata.com Annual Report Cited 28 April 2009
Related Documents