Welcome message from author
This document is posted to help you gain knowledge. Please leave a comment to let me know what you think about it! Share it to your friends and learn new things together.
Transcript


Coal Energy Systems
ACADEMIC PRESS
SUSTAINABLE WORLD
SERIES
S E R I E S E D I T O R
RICHARD C. DORF
University of California, Davis
The Sustainable World series concentrates on books that deal with thephysical and biological basis of the world economy and our dependenceon the tools, devices, and systems used to control, develop and exploitnature. Engineering is the key element in developing and implementing thetechnologies necessary to plan for a sustainable world economy. If the indus-trialization of the world is to continue as a positive force, the creation andapplication of environmentally friendly technologies should be one of thehighest priorities for technological innovation in the present and future.
This series includes titles on all aspects of the technology, planning,economics, and social impact of sustainable technologies. Please contactthe editor or the publisher if you are interested in more information on thetitles in this new series, or if you are interested in contributing to the series.
Current published titles:
Technology, Humans and Society: Towards a Sustainable World,edited by Richard C. Dorf, 500 pages, published in 2001.
Wind Power in View: Energy Landscapes in a Crowded World, editedby Martin J. Pasqualetti, Paul Gipe, Robert W. Righter, 234 pages,published in 2002.

Coal Energy Systems
Bruce G. Miller
Amsterdam Boston Heidelberg London New York OxfordParis San Diego San Francisco Singapore Sydney Tokyo

Elsevier Academic Press30 Corporate Drive, Suite 400, Burlington, MA 01803, USA525 B Street, Suite 1900, San Diego, California 92101-4495, USA84 Theobald’s Road, London WC1X 8RR, UK
This book is printed on acid-free paper.
Copyright © 2005, Elsevier Inc. All rights reserved.
No part of this publication may be reproduced or transmitted in any formor by any means, electronic or mechanical, including photocopy, recording,or any information storage and retrieval system, without permissionin writing from the publisher.
Permissions may be sought directly from Elsevier’s Science & TechnologyRights Department in Oxford, UK: phone: (+44) 1865 843830,fax: (+44) 1865 853333, e-mail: [email protected]. You may alsocomplete your request on-line via the Elsevier homepage (http://elsevier.com),by selecting “Customer Support” and then “Obtaining Permissions.”
Library of Congress Cataloging-in-Publication DataApplication Sumitted
British Library Cataloguing in Publication DataA catalogue record for this book is available from the British Library
ISBN: 0-12-497451-1
For all information on all Academic Press publicationsvisit our Web site at www.academicpress.com
Printed in the United States of America04 05 06 07 08 09 9 8 7 6 5 4 3 2 1

Dedication
For my family, Sharon, Konrad, and Anna, for their patience and supportduring the writing of this book.

This page intentionally left blank
Contents
Preface xiii
1. Introduction to Coal 1What is Coal? 1Origin of Coal 1Coalification 2Classification of Coal 4
Basic Coal Analysis 5Rank of Coal 6Coal Type 7Grade of Coal 8Classification Systems 8
Coal Distribution and Resources 12Coal Reserves in the World 13Major Coal-Producing Regions in the World 17
References 26
2. Past, Present, and Future Role of Coal 29The Use of Coal in the Pre-Industrial Revolution Era 29
Early History of United States Coal Mining and Use 31The Use of Coal during the Industrial Revolution 31Post-Industrial Revolution Use of Coal 33Overview of Energy in the United States 33Coal Production in the United States 39
Synthetic Coal 48Coal Consumption in the United States 48U.S. Coal Exports and Imports 50World Primary Energy Production and Consumption 51
World Primary Energy Production 54World Primary Energy Consumption 58
Future Projections of Energy Use and Coal’sContribution to the Energy Mix 61
vii

viii Contents
World Energy Consumption of Oil 61World Energy Consumption of Natural Gas 63World Energy Consumption of Coal 63World Energy Consumption of Nuclear Energy 69World Energy Consumption of Renewable Energy 69Energy Outlook for the United States 70
Role of Coal in the United States’ 2001 Energy Policy 72References 75
3. The Effect of Coal Usage on Human Health and the Environment 77Coal Mining 78
Underground Mining 79Surface Mining 86Legislation/Reclamation 89
Coal Preparation 90Water Contamination from Preparation Plants 92Air Contamination from Preparation Plants 92Refuse Contaminants from Preparation Plants 93Health and Safety Issues 93
Coal Transportation 95Coal Combustion By-Products (CCB) 95Emissions from Coal Combustion 97
Sulfur Oxides 97Nitrogen Oxides (NOx ) 100Particulate Matter (PM) 103Organic Compounds 105Carbon Monoxide 106Trace Elements 107Greenhouse Gases: Carbon Dioxide 114
References 118
4. Coal-Fired Emissions and Legislative Action in theUnited States 123Major Coal-Related Health Episodes 123
Pre-Industrial Revolution 124Post-Industrial Revolution 124
History of Legislative Action for Coal-Fired Power Plants 125Pre-1970 Legislation 126Clean Air Act Amendments of 1970 128Clean Air Act Amendments of 1977 and Prevention of
Significant Deterioration 139Clean Air Act Amendments of 1990 141Additional NOx Regulations and Trading Programs 149New Source Review 152

Contents ix
Impending Legislation and Pollutants underConsideration for Regulation 155
Emissions Legislation in other Countries 162Sulfur Dioxide 162Nitrogen Oxides 164Particulate Matter 169Trace Elements/Mercury 170Carbon Dioxide 171
Air Quality and Coal-Fired Emissions 173Six Principal Pollutants 175Acid Rain 184Hazardous Air Pollutants 187Carbon Dioxide (CO2) 189
References 191
5. Technologies for Coal Utilization 195Coal Combustion 195
Brief History of Boilers and Coal Combustion Systems 196Basic Steam Fundamentals and Their Application to
Boiler Development 204Chemistry of Coal Combustion 207Coal Combustion Systems 212Influence of Coal Properties on Utility Boiler Design 229
Carbonization 237Brief History of Carbonization (High-Temperature) 238Coking Processes 239Coal Properties for Coke Production 241Coking Conditions 242Low-Temperature Carbonization 243
Gasification 246Brief History of Coal Gasification 247Principles of Coal Gasification 248Gasifier Types 249Influence of Coal Properties on Gasification 253Regional Distribution of Gasification Systems 255Commercial Gasification Systems 256
Liquefaction 267The Beginning of the Synthetic Fuel Industry 269Indirect Liquefaction: Fischer–Tropsch Synthesis 271Direct Liquefaction 273
References 278
6. Emissions Control Strategies for Power Plants 283Currently Regulated Emissions 284
Sulfur Dioxide (SO2) 284

x Contents
Nitrogen Oxides (NOx ) 322Particulate Matter 347
Pollutants with Pending Compliance Regulation 369Mercury 369
Potential Future Regulated Emissions 375Carbon Dioxide 376
Multipollutant Control 382ECO Process 383Airborne Process 384LoTOx Process 384Mobotec Systems 385Others 385
References 385
7. Future Power Generation (Near-Zero Emissions DuringElectricity Generation) 393Clean Coal Technology Demonstration Program 395
Clean Coal Technology Program Evolution 395CCT Program Funding and Costs 396CCT Program Projects 397CCT Program Accomplishments 418
Power Plant Improvement Initiative (PPII) 422PPII Projects 423Benefits of the PPII 424
Clean Coal Power Initiative (CCPI) 424Program Importance 425Round 1 CCPI Projects 427CCPI Benefits 431
Vision 21 432Vision 21 Technologies 434Vision 21 Benefits 435
FutureGen 435Benefits of the DOE’s Clean Coal Power
Program/Demonstrations 437References 439
8. Coal’s Role in Providing United States Energy Security 445Overview of U.S. Energy Security Issues 446National Energy Plan and Coal Utilization 448
Energy Conservation/Efficiency 449Diversity of Fuel Sources 449Environmental Protection 450Technological Innovations 450Global Alliances and Markets 450The Role of Coal in the National Energy Plan 450

Contents xi
Energy and the Economy 451Natural Gas Use in Power Generation 454The Potential of Coal to Reduce U.S. Dependency on
Imported Crude Oil 456The Resurgence of Coal in Electric Power Generation 458Production of Hydrogen from Coal 459The Role of Coal in Providing Security to the U.S. Food Supply 462Coal’s Role in International Energy Security and
Sustainable Development 464Concluding Statements 467References 468
Appendix A. Coal-Fired Emission Factors 473Appendix B. Original List of Hazardous Air Pollutants 499Appendix C. Initial 263 Units Identified in Phase I (SO2) of the
Acid Rain Program 505Appendix D. Commercial Gasification Facilities Worldwide 509
Index 513

This page intentionally left blank

Preface
Coal is currently a major energy source in the United States as well asthroughout the world, especially among many developing countries, andwill continue to be so for many years. Fossil fuels will continue to be thedominant energy source for fueling the U.S. economy, with coal playing amajor role for decades. Coal provides stability in price and availability, willcontinue to be a major source of electricity generation, will be the majorsource of hydrogen for the coming hydrogen economy, and has the potentialto become an important source of liquid fuels. Conservation and renewable/sustainable energy are important in the overall energy picture but will playa lesser role in helping us satisfy our energy demands.
It is recognized in the energy industry that the manner in which coalis used must, and will, change. Concerns over the environmental effectsof coal utilization are resulting in better methods for controlling emissionsduring combustion, as well as more research and development into technolo-gies to utilize coal more efficiently especially in non-traditional (i.e., directcombustion) methods. While major advances have been made in reducing theenvironmental impact when using coal, we have other technologies in hand,either near commercialization or under development, that will allow coal tobe used in an even more environmentally friendly manner. The roadblocksto implementing these technologies are the financial risks associated withnew technologies and the resulting higher costs of energy to the consumers.Consumers in the United States, for example, have become accustomed tolow energy prices and are reluctant to pay more for their energy, whether itbe transportation fuels for their vehicles, natural gas or propane for domesticheating, or electricity for their homes. The implementation of these tech-nologies that increase energy efficiency or reduce pollution will be driven bylegislative mandate and, to a lesser extent, the willingness of the consumerto pay more for energy.
The importance of coal to the economy is very evident—on a local levelas well as a global scale. Growing up in rural Beulah, North Dakota, whichis located in the heart of the northern lignite fields, I saw how important theenergy industry—mining, power generation, and methane production from
xiii

xiv Preface
coal gasification—is to a local economy. Located within a radius of about100 miles from Beulah in the 1970s were six mines, eight power plants, anda coal gasification plant. Coal was in my veins, as several relatives worked atthe mines or plants. One mine, in particular—the Knife River Coal Mine—helped me through my college years by providing me employment duringthe summer and allowed me to work with my father, who spent most of hiscareer at the mine until his retirement. Later in my education and over thenext nearly 25 years of my career, I came to realize the economic impor-tance of coal to larger regions such as the state of North Dakota, the othercoal states of the nation, and the world. Coal is widely dispersed throughoutthe world, unlike petroleum and natural gas; most countries (except for partsof the Middle East) contain coal reserves, thereby allowing them the oppor-tunity to be energy self-sufficient or, at the very least, providing options forrelying on domestic rather than imported energy.
It is my intention with this book to illustrate the importance of coal asan energy source both in the United States and in the world. The book beginswith an introduction to coal and its distribution and reserves in the world toprovide the reader with basic coal information as a prelude to the subsequentchapters. The second chapter presents a brief history of coal use, its currentstatus as an energy source, and the future role of coal. Coal is compared toother energy sources, including oil, natural gas, nuclear, and renewables.While coal has been instrumental in the advancement of civilization andwill continue to be a major fuel source for several decades, the value of coalis partially offset by the environmental issues it raises. These issues are dis-cussed in the third chapter, where some of these issues also have impactson human health. The fourth chapter presents a history of legislative actionin the United States as it pertains to coal-fired power plants and discussesimpending legislation. A brief discussion of emissions and legislation fromother countries and how they compare to the United States is also provided.Technologies used for generating power, heat, coke, and chemicals fromcoal are discussed in the fifth chapter and include combustion, carboniza-tion, gasification, and liquefaction. The emphasis in this chapter is on coalcombustion, as this is currently the single largest use of coal. The sixth chap-ter provides an in-depth discussion of emissions control strategies for powerplants, as electricity generation is the single largest use for coal today. Theprogress that has been made over the last approximately 30 years in reduc-ing emissions from power plants is discussed, as are commercial controlstrategies currently used and under development. Future power generation,with the goal of near-zero emissions, is discussed in the seventh chapter.Major research and development programs, sponsored primarily by the U.S.Department of Energy in partnership with industry, are also discussed in thischapter, as well as developing technologies to achieve near-zero emissionspower and clean fuel plants with carbon dioxide management capability. Thebook concludes by discussing the role of coal in providing energy security

Preface xv
to the United States, as well as its role in providing international energysecurity and sustainable development.
I will conclude by first stating that all errors or omissions are entirelymy own. I also want to express my thanks for all those who helped makethis book a reality. First and foremost, I want to thank my wife, Sharon, andchildren, Konrad and Anna, for supporting me these last 12 to 14 monthswhile I spent long hours writing and too few hours with them (missingfamily events and forgoing vacations). Thanks go to Harold Schobert forencouraging me to undertake this project; David Tillman, for constantlyhounding me to keep at it; and Donna Baney, for typing some of the tables inthe appendices. A very special thank you goes to Ruth Krebs for her work onthe figures. I would like to also thank my parents, Pearl (a schoolteacher herentire career) and Fred (a coal miner for most of his career), for recognizingthe value of an education and encouraging me to pursue various interests.And, finally, I thank God for providing me with the talent, ambition, anddrive to achieve all that I have accomplished.
Bruce G. Miller

This page intentionally left blank

CHAPTER 1
Introduction to Coal
This chapter presents an introductory overview of coal that includes adescription of coal along with discussions of how it is formed, coal resources,and recoverable reserves in the world, with an emphasis on the UnitedStates’ coals and coalfields, the types and characteristics of coal, and coalclassification systems relevant to commercial coal use. The purpose of thischapter is to provide the reader with basic coal information as a prelude tothe subsequent chapters.
What Is Coal?
An encompassing description of coal has been given by van Krevelen [1], inwhich he states: “Coal is a rock, a sediment, a conglomerate, a biologicalfossil, a complex colloidal system, an enigma in solid-state physics and anintriguing object for chemical and physical analyses.” In short, coal is achemically and physically heterogeneous, “combustible,” sedimentary rockconsisting of both organic and inorganic material. Organically, coal consistsprimarily of carbon, hydrogen, and oxygen, with lesser amounts of sulfurand nitrogen. Inorganically, coal consists of a diverse range of ash-formingcompounds distributed throughout the coal. The inorganic constituents canvary in concentration from several percentage points down to parts per billionof the coal. Coal is the most abundant fossil fuel in the United States, as wellas the world. At the end of 2000, recoverable coal reserves in the UnitedStates, which contains the world’s largest coal reserves, totaled 274 billionshort tons compared to a total world reserve of 1083 billion short tons [2].On an oil-equivalent basis, there is approximately twice as much recoverablecoal in the world as oil and natural gas combined [3]; consequently, coal hasbeen and will continue to be a major economic/energy resource, a topic thatwill be discussed in detail in subsequent chapters.
Origin of Coal
Coal is found in deposits called seams that originated through the accu-mulation of vegetation that has undergone physical and chemical changes.
1
2 Coal Energy Systems
These changes include decaying of the vegetation, deposition and burying bysedimentation, compaction, and transformation of the plant remains into theorganic rock found today. Coals differ throughout the world in the kinds ofplant materials deposited (type of coal), in the degree of metamorphism orcoalification (rank of coal), and in the range of impurities included (gradeof coal).
There are two main theories for the accumulation of the vegetal mat-ter that gives rise to coal seams [4]. The first theory, and the one mostaccepted as it explains the origin of most coals, is that the coal formedin situ (that is, where the vegetation grew and fell), and such a deposit is saidto be autochthonous in origin. The beginning of most coal deposits startedwith thick peat bogs where the water was nearly stagnant and plant debrisaccumulated. Vegetation tended to grow for many generations, with plantmaterial settling on the swamp bottom and converted into peat by microbi-ological action. After some time, the swamps became submerged and werecovered by sedimentary deposits, and a new future coal seam was formed.When this cycle was repeated, over hundreds of thousands of years, addi-tional coal seams were formed. These cycles of accumulation and depositionwere followed by diagenetic (i.e., biological) and tectonic (i.e., geological)actions and, depending upon the extent of temperature, time, and forcesexerted, formed the different ranks of coal observed today.
While the formation of most coals can be explained by theautochthonous process, some deposits are not easily explained by this model.Some coals appear to have been formed through the accumulation of vegetalmatter that has been transported by water. According to this theory (i.e.,allochthonous origin), the fragments of plants have been carried by streamsand deposited on the bottom of the sea or in lakes where they build up strata,which later become compressed into solid rock.
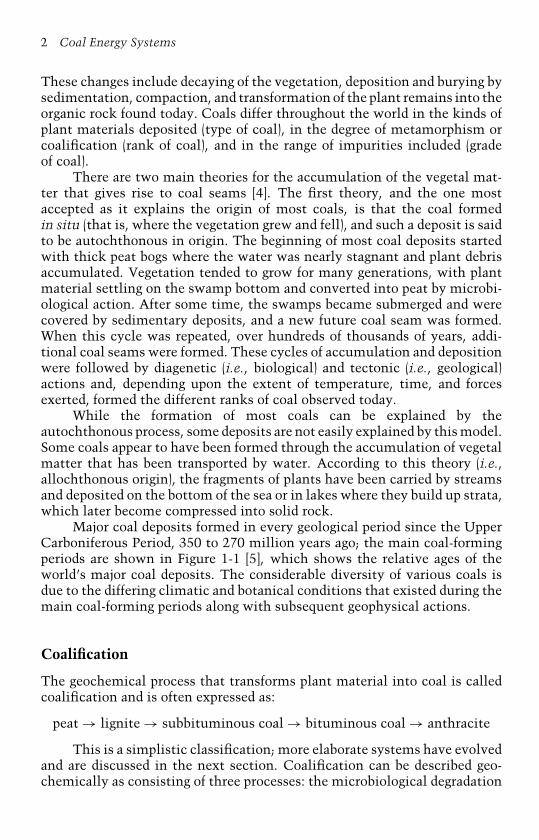
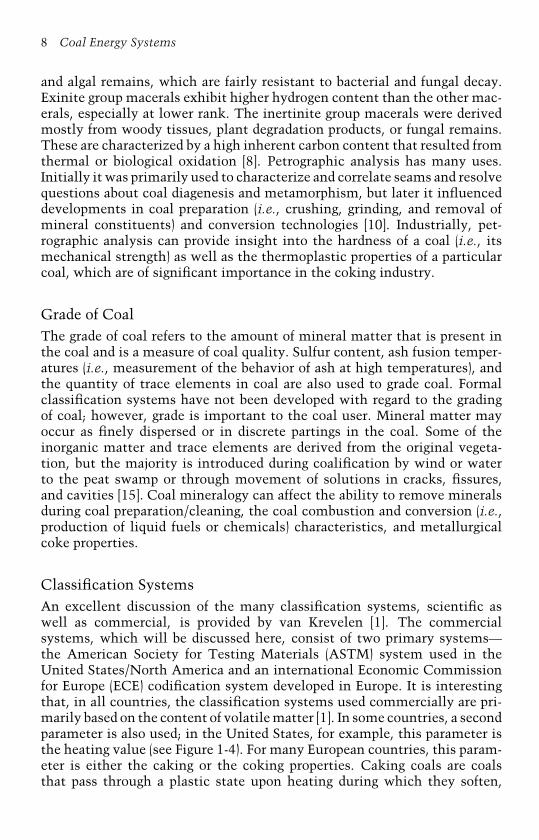
Major coal deposits formed in every geological period since the UpperCarboniferous Period, 350 to 270 million years ago; the main coal-formingperiods are shown in Figure 1-1 [5], which shows the relative ages of theworld’s major coal deposits. The considerable diversity of various coals isdue to the differing climatic and botanical conditions that existed during themain coal-forming periods along with subsequent geophysical actions.
Coalification
The geochemical process that transforms plant material into coal is calledcoalification and is often expressed as:
peat → lignite → subbituminous coal → bituminous coal → anthracite
This is a simplistic classification; more elaborate systems have evolvedand are discussed in the next section. Coalification can be described geo-chemically as consisting of three processes: the microbiological degradation

Introduction to Coal 3
Palaeozoic Mesozoic Cenozoic
QuaternaryTertiaryCretaceousJurassicTriassicPermianCarboniferous
EASTERN USA
UNITED KINGDOM
GERMANY
POLAND/CZECH REPUBLIC
CIS
CHINA
AUSTRALIA
INDIA
SOUTH AFRICA
WESTERN CANADA
WESTERN USA
COLOMBIA/VENEZUELA
INDONESIA
350 300 250 200 150 100 50Million Years
Age
Lignite
EraPeriod
FIGURE 1-1. Comparison of the geological ages of the world’s hard coal and lig-nite deposits. (From Walker, S., Major Coalfields of the World, IEA Coal Research,London, 2000. With permission.)
of the cellulose of the initial plant material, the conversion of the ligninof the plants into humic substances, and the condensation of these humicsubstances into larger coal molecules [6]. The kind of decaying vegeta-tion, conditions of decay, depositional environment, and movements of theEarth’s crust are important factors in determining the nature, quality, andrelative position of the coal seams [1]. Of these, the physical forces exertedupon the deposits play the largest role in the coalification process. Variationsin the chemical composition of the original plant material contributed to thevariability in coal composition [1,7]. The vegetation of various geologic peri-ods differed biologically and chemically. The conditions under which thevegetation decayed are also important. The depth, temperature, degree ofacidity, and natural movement of water in the original swamp are importantfactors in the formation of the coal [1,8].
The geochemical phase of the coalification process is the applicationof temperature and pressure over millions of years and is the most impor-tant factor of the coalification process. While there is some disagreement asto which has been more important in promoting the chemical and physicalchanges—high pressures exerted by massive overburdening strata or time-temperature factors—the changes are characterized physically by decreasing
4 Coal Energy Systems
Materials Partial Processes Main Chemical Reactions
DecayingVegetation
Peat
Lignite
Bituminous coal
Semianthracite
Anthracite
Peatification
Lignitification
Bituminization
Preanthracitization
Anthracitization
Graphitization
Bacterial and fungallife cycles
Air oxidation, followed by decarboxylation and dehydration
Decarboxylation and hydrogen disproportioning
Condensation to small aromatic ring systems
Condensation of small aromatic ring systems to larger ones; dehydrogenation
Complete carbonification
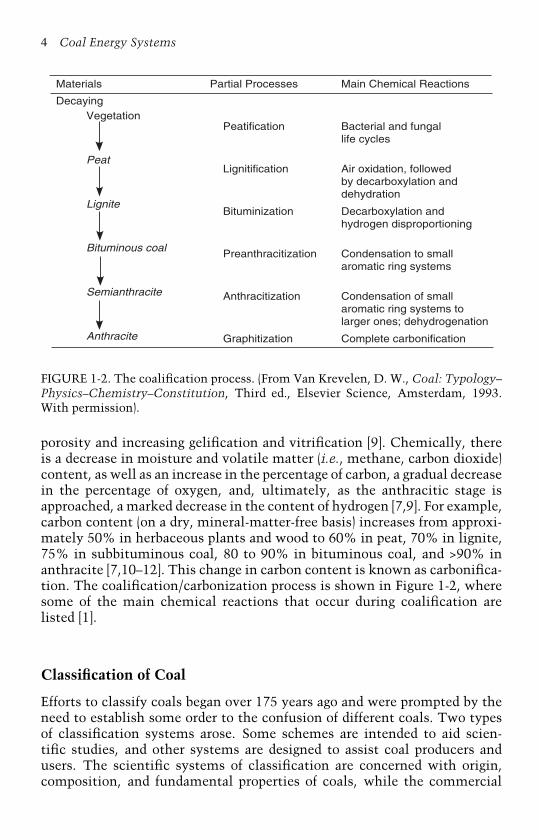
FIGURE 1-2. The coalification process. (From Van Krevelen, D. W., Coal: Typology–Physics–Chemistry–Constitution, Third ed., Elsevier Science, Amsterdam, 1993.With permission).
porosity and increasing gelification and vitrification [9]. Chemically, thereis a decrease in moisture and volatile matter (i.e., methane, carbon dioxide)content, as well as an increase in the percentage of carbon, a gradual decreasein the percentage of oxygen, and, ultimately, as the anthracitic stage isapproached, a marked decrease in the content of hydrogen [7,9]. For example,carbon content (on a dry, mineral-matter-free basis) increases from approxi-mately 50% in herbaceous plants and wood to 60% in peat, 70% in lignite,75% in subbituminous coal, 80 to 90% in bituminous coal, and >90% inanthracite [7,10–12]. This change in carbon content is known as carbonifica-tion. The coalification/carbonization process is shown in Figure 1-2, wheresome of the main chemical reactions that occur during coalification arelisted [1].
Classification of Coal
Efforts to classify coals began over 175 years ago and were prompted by theneed to establish some order to the confusion of different coals. Two typesof classification systems arose. Some schemes are intended to aid scien-tific studies, and other systems are designed to assist coal producers andusers. The scientific systems of classification are concerned with origin,composition, and fundamental properties of coals, while the commercial
Introduction to Coal 5
systems address trade and market issues, utilization, technological proper-ties, and suitability for certain end uses. It is the latter classification systemsthat will be discussed here. Excellent discussions on scientific classificationsare given elsewhere [1,10].
Basic Coal AnalysisPrior to discussing the rank, type, grade, and classification systems of coal,a brief description of basic coal analyses, upon which classification schemesare based, is provided. These analyses do not yield any information on coalstructure but do provide important information on coal behavior and areused in the marketing of coals. Three analyses are used in classifying coal,two of which are chemical analyses and one is a calorific determination. Thechemical analyses include proximate and ultimate analysis. The proximateanalysis gives the relative amounts of moisture, volatile matter, ash (i.e.,inorganic material left after all the combustible matter has been burned off),and, indirectly, the fixed carbon content of the coal. The ultimate analysisgives the amounts of carbon, hydrogen, nitrogen, sulfur, and oxygen com-prising the coal. Oxygen is typically determined by difference—that is, bysubtracting the total percentages of carbon, hydrogen, nitrogen, and sulfurfrom 100—because of the complexity in determining oxygen directly; how-ever, this technique accumulates all the errors that occur when determiningthe other elements into the calculated value for oxygen. The third importantanalysis, the calorific value, also known as heating value, is a measure of theamount of energy that a given quantity of coal will produce when burned.
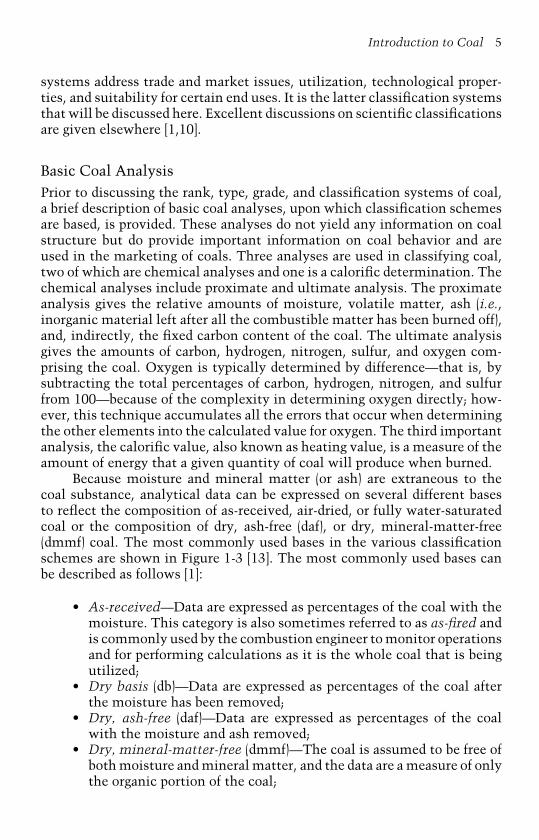
Because moisture and mineral matter (or ash) are extraneous to thecoal substance, analytical data can be expressed on several different basesto reflect the composition of as-received, air-dried, or fully water-saturatedcoal or the composition of dry, ash-free (daf), or dry, mineral-matter-free(dmmf) coal. The most commonly used bases in the various classificationschemes are shown in Figure 1-3 [13]. The most commonly used bases canbe described as follows [1]:
• As-received—Data are expressed as percentages of the coal with themoisture. This category is also sometimes referred to as as-fired andis commonly used by the combustion engineer to monitor operationsand for performing calculations as it is the whole coal that is beingutilized;
• Dry basis (db)—Data are expressed as percentages of the coal afterthe moisture has been removed;
• Dry, ash-free (daf)—Data are expressed as percentages of the coalwith the moisture and ash removed;
• Dry, mineral-matter-free (dmmf)—The coal is assumed to be free ofboth moisture and mineral matter, and the data are a measure of onlythe organic portion of the coal;
6 Coal Energy Systems
total moisture
mineralmatter
purecoal
surface moisture
inherent moisture
ash
volatile mineralmatter
volatile organic matter
volatile matter
fixed carbon
dry,
min
eral
mat
ter
free
dry,
ash
free
dry
as r
ecei
ved
air
drie
d
FIGURE 1-3. Relationship of different analytical bases to coal components. (FromWard, C. R., Ed., Coal Geology and Coal Technology, Blackwell Scientific, Mel-bourne, 1984, p. 66. With permission.)
• Moist, ash-free (maf)—The coal is assumed to be free of ash but stillcontains moisture;
• Moist, mineral-matter-free (mmmf)—The coal is assumed to be freeof mineral matter but still contains moisture.
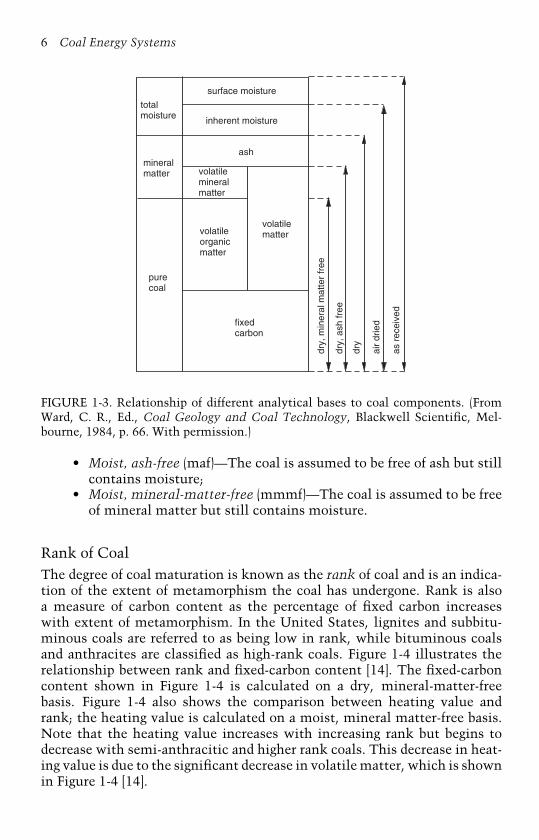
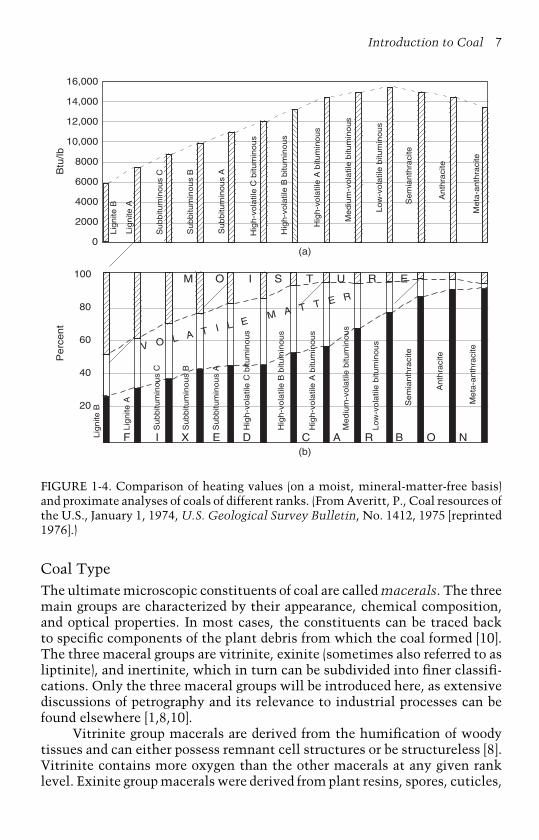
Rank of CoalThe degree of coal maturation is known as the rank of coal and is an indica-tion of the extent of metamorphism the coal has undergone. Rank is alsoa measure of carbon content as the percentage of fixed carbon increaseswith extent of metamorphism. In the United States, lignites and subbitu-minous coals are referred to as being low in rank, while bituminous coalsand anthracites are classified as high-rank coals. Figure 1-4 illustrates therelationship between rank and fixed-carbon content [14]. The fixed-carboncontent shown in Figure 1-4 is calculated on a dry, mineral-matter-freebasis. Figure 1-4 also shows the comparison between heating value andrank; the heating value is calculated on a moist, mineral matter-free basis.Note that the heating value increases with increasing rank but begins todecrease with semi-anthracitic and higher rank coals. This decrease in heat-ing value is due to the significant decrease in volatile matter, which is shownin Figure 1-4 [14].
Introduction to Coal 7
16,000
14,000
12,000
10,000
8000
6000
4000
2000
0(a)
100
Perc
ent
Btu
/lb
80
60
40
20
(b)F I X E D C A R B O N
M O I S T U R E
V O L A T I L EM A T T E R
Lig
nite
A
Lig
nite
B
Lig
nite
B
Lig
nite
A
Su
bb
itum
ino
us
CS
ub
bitu
min
ou
s C
Su
bb
itum
ino
us
BS
ub
bitu
min
ou
s B
Su
bb
itum
ino
us
AS
ub
bitu
min
ou
s A
Hig
h-v
ola
tile
C b
itum
ino
us
Hig
h-v
ola
tile
C b
itum
ino
us
Hig
h-v
ola
tile
B b
itum
ino
us
Hig
h-v
ola
tile
B b
itum
ino
us
Hig
h-v
ola
tile
A b
itum
ino
us
Hig
h-v
ola
tile
A b
itum
ino
us
Me
diu
m-v
ola
tile
bitu
min
ou
sM
ed
ium
-vo
latil
e b
itum
ino
us
Lo
w-v
ola
tile
bitu
min
ou
sL
ow
-vo
latil
e b
itum
ino
us
Se
mia
nth
raci
teS
em
ian
thra
cite
An
thra
cite
An
thra
cite
Me
ta-a
nth
raci
teM
eta
-an
thra
cite
FIGURE 1-4. Comparison of heating values (on a moist, mineral-matter-free basis)and proximate analyses of coals of different ranks. (From Averitt, P., Coal resources ofthe U.S., January 1, 1974, U.S. Geological Survey Bulletin, No. 1412, 1975 [reprinted1976].)
Coal TypeThe ultimate microscopic constituents of coal are called macerals. The threemain groups are characterized by their appearance, chemical composition,and optical properties. In most cases, the constituents can be traced backto specific components of the plant debris from which the coal formed [10].The three maceral groups are vitrinite, exinite (sometimes also referred to asliptinite), and inertinite, which in turn can be subdivided into finer classifi-cations. Only the three maceral groups will be introduced here, as extensivediscussions of petrography and its relevance to industrial processes can befound elsewhere [1,8,10].
Vitrinite group macerals are derived from the humification of woodytissues and can either possess remnant cell structures or be structureless [8].Vitrinite contains more oxygen than the other macerals at any given ranklevel. Exinite group macerals were derived from plant resins, spores, cuticles,
8 Coal Energy Systems
and algal remains, which are fairly resistant to bacterial and fungal decay.Exinite group macerals exhibit higher hydrogen content than the other mac-erals, especially at lower rank. The inertinite group macerals were derivedmostly from woody tissues, plant degradation products, or fungal remains.These are characterized by a high inherent carbon content that resulted fromthermal or biological oxidation [8]. Petrographic analysis has many uses.Initially it was primarily used to characterize and correlate seams and resolvequestions about coal diagenesis and metamorphism, but later it influenceddevelopments in coal preparation (i.e., crushing, grinding, and removal ofmineral constituents) and conversion technologies [10]. Industrially, pet-rographic analysis can provide insight into the hardness of a coal (i.e., itsmechanical strength) as well as the thermoplastic properties of a particularcoal, which are of significant importance in the coking industry.
Grade of CoalThe grade of coal refers to the amount of mineral matter that is present inthe coal and is a measure of coal quality. Sulfur content, ash fusion temper-atures (i.e., measurement of the behavior of ash at high temperatures), andthe quantity of trace elements in coal are also used to grade coal. Formalclassification systems have not been developed with regard to the gradingof coal; however, grade is important to the coal user. Mineral matter mayoccur as finely dispersed or in discrete partings in the coal. Some of theinorganic matter and trace elements are derived from the original vegeta-tion, but the majority is introduced during coalification by wind or waterto the peat swamp or through movement of solutions in cracks, fissures,and cavities [15]. Coal mineralogy can affect the ability to remove mineralsduring coal preparation/cleaning, the coal combustion and conversion (i.e.,production of liquid fuels or chemicals) characteristics, and metallurgicalcoke properties.
Classification SystemsAn excellent discussion of the many classification systems, scientific aswell as commercial, is provided by van Krevelen [1]. The commercialsystems, which will be discussed here, consist of two primary systems—the American Society for Testing Materials (ASTM) system used in theUnited States/North America and an international Economic Commissionfor Europe (ECE) codification system developed in Europe. It is interestingthat, in all countries, the classification systems used commercially are pri-marily based on the content of volatile matter [1]. In some countries, a secondparameter is also used; in the United States, for example, this parameter isthe heating value (see Figure 1-4). For many European countries, this param-eter is either the caking or the coking properties. Caking coals are coalsthat pass through a plastic state upon heating during which they soften,

Introduction to Coal 9
swell, and resolidify into a coherent carbonaceous matrix, while noncakingcoals do not become plastic when heated and produce a weakly coherentchar residue. Coking coals are strongly caking coals that exhibit character-istics that make them suitable for conversion into metallurgical and otherindustrial cokes [10].
ASTM Classification SystemThe ASTM classification system (ASTM D388) distinguishes among fourcoal classes, each of which is subdivided into several groups (see Table 1-1).As previously mentioned, high-rank coals (i.e., medium volatile bituminouscoals or those of higher rank) are classified based on their fixed-carbon andvolatile-matter contents (expressed on a dmmf basis), while low-rank coalsare classified in terms of their heating value (expressed on a mmmf basis).This classification system was developed for commercial applications buthas proved to be satisfactory for certain scientific uses as well [9]. If a given
TABLE 1-1ASTM Coal Classification by Rank
Class/Group Fixed Carbona Volatile Matterb Heating Valueb
(%) (%) (Btu/lb)
AnthraciticMeta-anthracite >98 <2 —Anthracite 92–98 2–8 —Semi-anthracite 86–92 8–14 —
BituminousLow-volatile 78–86 14–22 —Medium-volatile 69–78 22–31 —High-volatile A <69 >31 >14,000High-volatile B — — 13,000–14,000High-volatile C — — 10,500–13,000c
SubbituminousSubbituminous A — — 10,500–11,500c
Subbituminous B — — 9500–10,500Subbituminous C — — 8300–9500
LigniticLignite A — — 6300–8300Lignite B — — <6300
aCalculated on dry, mineral-matter-free coal. Correction from ash to mineral matter is madeby means of the Parr formula: mineral matter = 1.08[percent ash + 0.55(percent sulfur)]. Ashand sulfur are on a dry basis.bCalculated on mineral-matter-free coal with bed moisture content.cCoals with heating values between 10,500 and 11,500 Btu/lb are classified as high volatile Cbituminous if they possess caking properties or as subbituminous A if they do not.Source: Berkowitz, N., An Introduction to Coal Technology, Academic Press, New York, 1979.With permission.

10 Coal Energy Systems
coal is described as being a certain rank, then an estimate of some propertiescan be made; for example, if the coal is classified as subbituminous/ligniticor anthracitic, then it would not be considered for certain applications, suchas for coke production.
International Classification/Codification SystemsBecause of the increasing amount of coal trade in the world, the ECE CoalCommittee developed a new classification system in 1988 for higher rankcoals [1]. A shortcoming of the original international system was that it wasprimarily developed for trading Northern Hemisphere coals, which have dis-tinctly different characteristics than those from the Southern Hemisphere(e.g., Australia and South Africa). As trade of Southern Hemisphere coalsincreased, it became apparent that a new classification system was needed.This new system, which in reality is a system of codes, is better known asthe Codification System. The Codification System for hard coals, combinedwith the International Organization for Standardization (ISO) Codificationof Brown Coals and Lignites (which was established in 1974), provides acomplete codification for coals in the international trade. The ISO Codifi-cation of Brown Coals and Lignites is given in Table 1-2 [1]. Total moisturecontent of run-of-mine coal and tar yield (i.e., determination of the yieldsof tar, water, gas, and coke residue by low-temperature distillation) are thetwo parameters coded. The ECE International Codification of Higher RankCoals is much more complicated and is provided in Table 1-3. Eight basicparameters define the main properties of the coal, represented by a 14-digitcode number. The codification is commercial; includes petrographic, rank,grade, and environmental information; is for medium- and high-rank coalsonly; is for blends and single coals; is for raw and washed coals; and is forall end-use applications [1]. The major drawback of this system is that it iscomplicated.
TABLE 1-2Codification of Brown Coals and Lignites
Parameter Total Moisture Content Tar Yield(Run-of-Mine Coal) (Dry, Ash Free)
Digit 1 2Coding Code Weight % Code Weight %
1 ≤20 0 ≤102 >20–30 1 >10–153 >30–40 — —4 >40–50 2 >15–205 >50–60 3 >20–256 >60 4 >25
Source: Van Krevelen, D. W., Coal: Typology–Physics–Chemistry–Constitution, Third ed.,Elsevier Science, Amsterdam, 1993. With permission.

TABLE 1-3International Codification of Higher Rank Coalsa
Parameter Vitrinite Reflectance Characteristics of Maceral Group Composition (mmf)(Mean Random) Reflectogramb Inertinitec Liptinite
Digit 1, 2 3 4 5Petrographic
Coding Code Rrandom (%) Code Standard Deviation Type Code Vol.% Code Vol.% Tests
02 0.2–0.29 0 ≤1 No gap Seam coal 0 0 to <10 1 0 to <503 0.3–0.39 1 >0.1≤0.2 No gap Simple blend 1 10 to <20 2 5 to <1004 0.4–0.49 2 >0.2 No gap Complex blend 2 20 to <30 3 10 to <15— — 3 — 1 gap Blend with 1 gap — — — —48 4.8–4.89 4 — 2 gaps Blend with 2 gaps 7 70 to <80 7 30 to <3549 4.9–4.99 5 — >2 gaps Blend with >2 gaps 8 80 to <90 8 35 to <4050 ≥5.0 — — — — 9 ≥90 9 ≥40
Parameter Gross CalorificCrucible Swelling No. Volatile Matterd (daf) Ash, Dry Total Sulfur, Dry Value (daf)
Digit 6 7, 8 9, 10 11, 12 13, 14 TechnologicalCoding Code Number Code Wt.% Code Wt.% Code Wt.% Code MJ/kg Tests
0 0–0.5 48 ≥48 00 0 to <1 00 0 to <0.1 21 <221 1–1.5 46 46 to <48 01 1 to <2 01 0.1 to <0.2 22 22 to <232 2–2.5 44 44 to <46 02 2 to <3 02 0.2 to <0.3 23 23 to <24— — — — — — — — — —7 7–7.5 12 12 to <14 20 20 to <21 29 2.9 to <3.0 37 37 to <388 8–8.5 10 10 to <12 — — 30 3.0 to <3.1 38 38 to <399 9–9.5 09 9 to <10 — — — — 39 ≥39— — — — — — — — — —— — 02 2 to <3 — — — — — —— — 01 1 to <2 — — — — — —
aHigher rank coals are coals with gross calorific value (maf) of ≥24 MJ/kg, and those with gross calorific value (maf) of <24 MJ/kg provided meanrandom vitrinitic reflectance ≥0.6%. To convert from MJ/kg to Btu/lb, multiply by 429.23.bA reflectogram as characterized by code number 2 can also result from a high rank seam coal.cIt should be noted that some of the inertinite may be reactive.dWhere the ash content of the coal is more than 10%, it must be reduced before analysis to below 10% by dense medium separation. In these cases,the cutting density and resulting ash content should be noted.Source: Van Krevelen, D. W., Coal: Typology–Physics–Chemistry–Constitution, Third ed., Elsevier Science, Amsterdam, 1993. With permission.
12 Coal Energy Systems
Coal Distribution and Resources
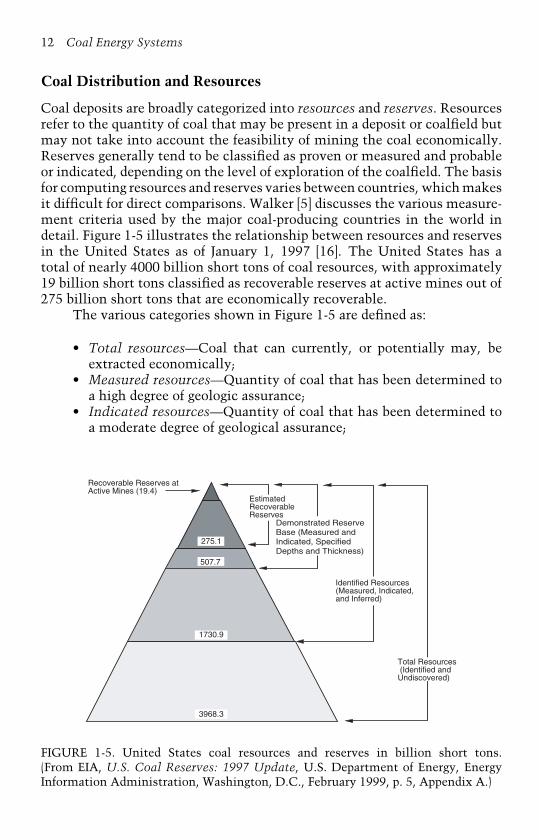
Coal deposits are broadly categorized into resources and reserves. Resourcesrefer to the quantity of coal that may be present in a deposit or coalfield butmay not take into account the feasibility of mining the coal economically.Reserves generally tend to be classified as proven or measured and probableor indicated, depending on the level of exploration of the coalfield. The basisfor computing resources and reserves varies between countries, which makesit difficult for direct comparisons. Walker [5] discusses the various measure-ment criteria used by the major coal-producing countries in the world indetail. Figure 1-5 illustrates the relationship between resources and reservesin the United States as of January 1, 1997 [16]. The United States has atotal of nearly 4000 billion short tons of coal resources, with approximately19 billion short tons classified as recoverable reserves at active mines out of275 billion short tons that are economically recoverable.
The various categories shown in Figure 1-5 are defined as:
• Total resources—Coal that can currently, or potentially may, beextracted economically;
• Measured resources—Quantity of coal that has been determined toa high degree of geologic assurance;
• Indicated resources—Quantity of coal that has been determined toa moderate degree of geological assurance;
Recoverable Reserves at Active Mines (19.4)
Demonstrated Reserve Base (Measured and Indicated, Specified Depths and Thickness)
Identified Resources (Measured, Indicated, and Inferred)
Total Resources (Identified and Undiscovered)
3968.3
1730.9
507.7
275.1
Estimated RecoverableReserves
FIGURE 1-5. United States coal resources and reserves in billion short tons.(From EIA, U.S. Coal Reserves: 1997 Update, U.S. Department of Energy, EnergyInformation Administration, Washington, D.C., February 1999, p. 5, Appendix A.)

Introduction to Coal 13
• Inferred resources—Quantity of coal that has been determined witha low degree of geologic assurance;
• Recoverable reserves—Coal that can be recovered economically withtechnology currently available or in the foreseeable future.
Terminology also varies among countries and can contribute to confusionwhen comparing coal resources and reserves. For purposes of discussion inthis chapter and to lessen confusion, recoverable coal reserves will primarilybe used when comparing world coal deposits.
Coal Reserves in the WorldCoal is the most abundant fossil fuel in the world. Grimston [3] reportedthat at the end of 1998, oil reserves were 143 gigatons (Gt) representing areserve-to-production (R/P) ratio of 41 years while natural gas reserves were132 gigatons of oil equivalent (Gtoe) with a R/P ratio of 63 years. Coal wasreported to have reserves of 486 Gtoe and a R/P ratio of 218 years, roughlydouble that of oil and natural gas combined. Coal reserves are also morewidely distributed throughout the world, as shown in Figure 1-6. All majorregions of the world contain coal, except for the Middle East, which containsalmost two-thirds of the world oil reserves and, along with the states of theFormer Soviet Union (FSU), contains more than two-thirds of the naturalgas reserves [3]. The Energy Information Administration (EIA) estimated thereserves of recoverable coal at over 1083 billion short tons as of January 1,2001 [2]. According to the EIA [17], this is enough coal to last approximately
Asia-231,272 millionshort tons
Oceania-91,122 millionshort tons
Africa-61,032million short tons
Middle East-1885 millionshort tons
Eastern Europe and FSU-290,183 million short tons
Western Europe-101,343 million short tons
North America-282,444 million short tons
Central and South America-23,977 million short tons
FIGURE 1-6. Distribution of recoverable coal reserves in the world.
14 Coal Energy Systems
230 years at current consumption levels, which is a projection similar to thatreported by Grimston [3,17].
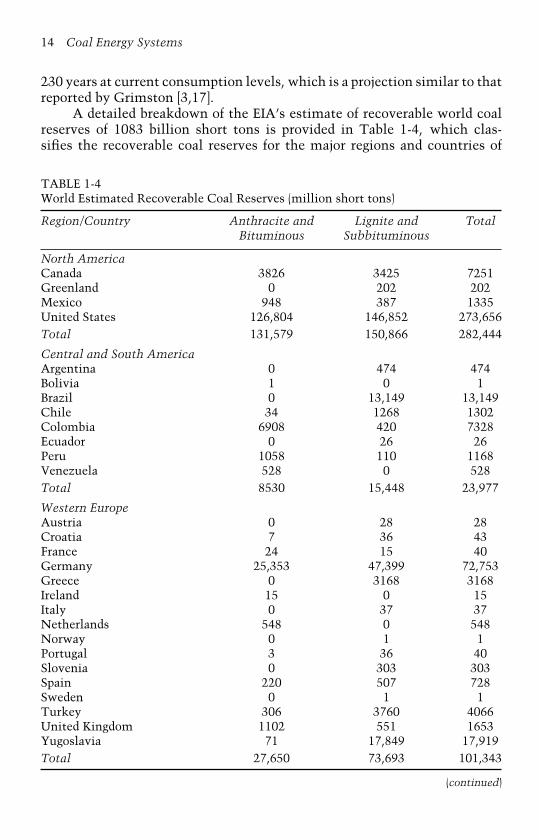
A detailed breakdown of the EIA’s estimate of recoverable world coalreserves of 1083 billion short tons is provided in Table 1-4, which clas-sifies the recoverable coal reserves for the major regions and countries of
TABLE 1-4World Estimated Recoverable Coal Reserves (million short tons)
Region/Country Anthracite and Lignite and TotalBituminous Subbituminous
North AmericaCanada 3826 3425 7251Greenland 0 202 202Mexico 948 387 1335United States 126,804 146,852 273,656Total 131,579 150,866 282,444
Central and South AmericaArgentina 0 474 474Bolivia 1 0 1Brazil 0 13,149 13,149Chile 34 1268 1302Colombia 6908 420 7328Ecuador 0 26 26Peru 1058 110 1168Venezuela 528 0 528Total 8530 15,448 23,977
Western EuropeAustria 0 28 28Croatia 7 36 43France 24 15 40Germany 25,353 47,399 72,753Greece 0 3168 3168Ireland 15 0 15Italy 0 37 37Netherlands 548 0 548Norway 0 1 1Portugal 3 36 40Slovenia 0 303 303Spain 220 507 728Sweden 0 1 1Turkey 306 3760 4066United Kingdom 1102 551 1653Yugoslavia 71 17,849 17,919Total 27,650 73,693 101,343
(continued)
Introduction to Coal 15
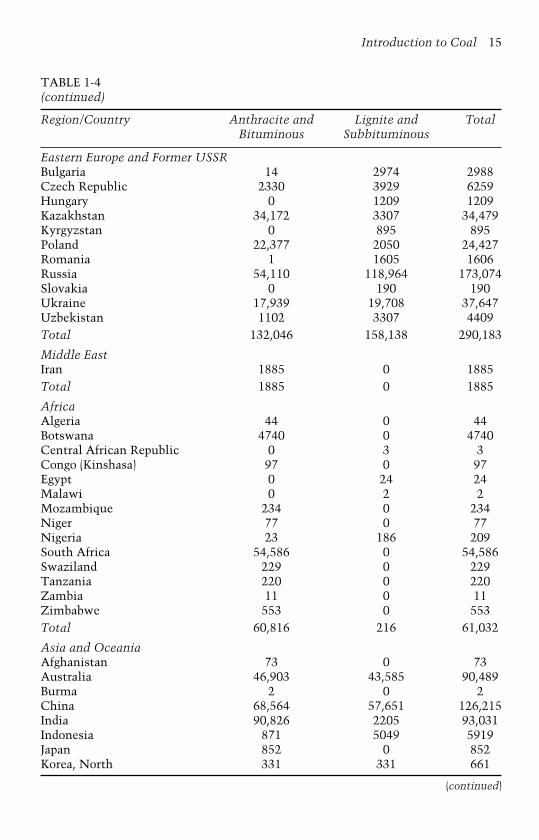
TABLE 1-4(continued)
Region/Country Anthracite and Lignite and TotalBituminous Subbituminous
Eastern Europe and Former USSRBulgaria 14 2974 2988Czech Republic 2330 3929 6259Hungary 0 1209 1209Kazakhstan 34,172 3307 34,479Kyrgyzstan 0 895 895Poland 22,377 2050 24,427Romania 1 1605 1606Russia 54,110 118,964 173,074Slovakia 0 190 190Ukraine 17,939 19,708 37,647Uzbekistan 1102 3307 4409Total 132,046 158,138 290,183
Middle EastIran 1885 0 1885Total 1885 0 1885
AfricaAlgeria 44 0 44Botswana 4740 0 4740Central African Republic 0 3 3Congo (Kinshasa) 97 0 97Egypt 0 24 24Malawi 0 2 2Mozambique 234 0 234Niger 77 0 77Nigeria 23 186 209South Africa 54,586 0 54,586Swaziland 229 0 229Tanzania 220 0 220Zambia 11 0 11Zimbabwe 553 0 553Total 60,816 216 61,032
Asia and OceaniaAfghanistan 73 0 73Australia 46,903 43,585 90,489Burma 2 0 2China 68,564 57,651 126,215India 90,826 2205 93,031Indonesia 871 5049 5919Japan 852 0 852Korea, North 331 331 661
(continued)
16 Coal Energy Systems
TABLE 1-4(continued)
Region/Country Anthracite and Lignite and TotalBituminous Subbituminous
Korea, South 86 0 86Malaysia 4 0 4Nepal 2 0 2New Caledonia 2 0 2New Zealand 36 594 631Pakistan 0 2497 2497Philippines 0 366 366Taiwan 1 0 1Thailand 0 1398 1398Vietnam 165 0 165Total 208,719 113,675 322,394
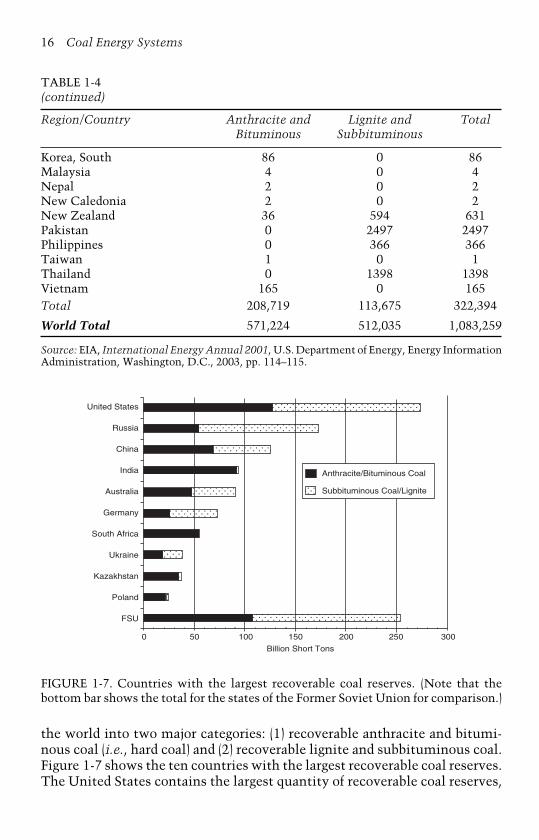
World Total 571,224 512,035 1,083,259
Source: EIA, International Energy Annual 2001, U.S. Department of Energy, Energy InformationAdministration, Washington, D.C., 2003, pp. 114–115.
United States
Russia
China
India
Australia
Germany
South Africa
Ukraine
Kazakhstan
Poland
FSU
0 50 100 150 200 250 300
Billion Short Tons
Anthracite/Bituminous Coal
Subbituminous Coal/Lignite
FIGURE 1-7. Countries with the largest recoverable coal reserves. (Note that thebottom bar shows the total for the states of the Former Soviet Union for comparison.)
the world into two major categories: (1) recoverable anthracite and bitumi-nous coal (i.e., hard coal) and (2) recoverable lignite and subbituminous coal.Figure 1-7 shows the ten countries with the largest recoverable coal reserves.The United States contains the largest quantity of recoverable coal reserves,

Introduction to Coal 17
∼274 billion short tons, or ∼25% of the world’s total. The country with thesecond largest quantity of recoverable coal reserves is Russia, which containsapproximately 16% of the world’s total reserves. If the Russian reserves arecombined with those of the other FSU countries, as is commonly done, thestates of the FSU contain nearly 23% of the world’s total reserves, or 254billion short tons (Figure 1-7). What is especially worth noting is that morethan 70 countries contain recoverable coal but the ten shown in Figure 1-7contain more than 983 billion short tons, or more than 90% of the world’stotal.
Major Coal-Producing Regions in the WorldCoal is found on all inhabited continents of the world. It is very likely thatcoal is also on Antarctica, particularly when one looks at the coal-formingperiods in history and the corresponding locations of the present-day con-tinents. A review of the major coal-producing countries in the world isprovided here, summarized by coal-producing region; specifically, the tencountries listed in Figure 1-7 are highlighted.
North AmericaThe recoverable coal reserves of North America are the second largest in theworld, with more than 282,000 million short tons identified (see Figure 1-7).Coal is found in the United States, Canada, Mexico, and, to a much lesserextent, Greenland (see Table 1-4).
United States The coal reserves of the United States are the largest of anycountry in the world: about 274,000 million short tons as of January 1,2001 [2]. Recoverable coal reserves are found in 32 of the states, and themajor coalfields are shown in Figure 1-8. The ten states with the largestrecoverable coal reserves (listed in Table 1-5) contain approximately 89% ofthe total coal in the United States [16]. The top five states contain more than70% of the total recoverable coal reserves in the United States.
Estimated low-sulfur recoverable coal reserves make up the largest por-tion of the total, at 36% [16]. Low-sulfur coal is defined as less than 0.8and 0.5% by weight (as-received) sulfur for high-grade bituminous coal andhigh-grade lignite, respectively. These sulfur contents are a quantitative rat-ing and have been correlated with U.S. sulfur emissions regulations fromcoal-fired power plants and the various stages of control that are required[16]. Estimated recoverable medium-sulfur reserves (0.8–2.2% for bitumi-nous coal and 0.5–1.3% for lignite) and high-sulfur reserves (>2.2% forbituminous coal and >1.3% for lignite) account for 31 and 33% of the total,respectively.
The U.S. Geological Survey has divided the reserves into sevenprovinces: (1) Eastern Province; (2) Interior Province; (3) Gulf Province;
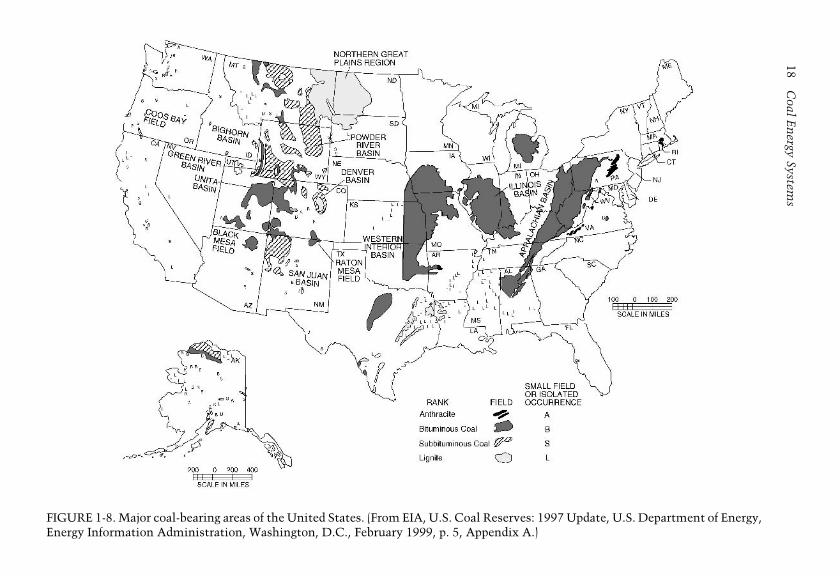
18C
oalE
nergy
Systems
FIGURE 1-8. Major coal-bearing areas of the United States. (From EIA, U.S. Coal Reserves: 1997 Update, U.S. Department of Energy,Energy Information Administration, Washington, D.C., February 1999, p. 5, Appendix A.)

Introduction to Coal 19
TABLE 1-5Top Ten States with the Largest Coal Reserves as of January 1, 1997
State Reserves (Million Short Tons)
Montana 75, 309.7Wyoming 44, 813.4Illinois 38, 205.6West Virginia 19, 322.0Kentucky 15, 976.6Pennsylvania 12, 397.3Ohio 11, 671.9Colorado 10, 044.9Texas 9953.9North Dakota 7167.2Total 244, 862.5Percentage of U.S. Total 89.5%
(4) Northern Great Plains Province; (5) Rocky Mountain Province; (6) PacificCoast Province; and (7) Alaskan Province. The provinces are further subdi-vided into regions, fields, and districts. Carboniferous coal deposits in theeastern United States occur in a band of coal-bearing sediments that includethe Appalachian and Illinois basins. Coal deposits in the western UnitedStates range from Upper Jurassic to Tertiary in age.
The Eastern Province includes the anthracite regions of Pennsylvaniaand Rhode Island, the Atlantic Coast region of middle Virginia and NorthCarolina, and the vast Appalachian basin, which extends from Pennsylvaniathrough eastern Ohio, eastern Kentucky, West Virginia, western Virginia,Tennessee, and into Alabama. The Eastern Province is about 900 miles longand 200 miles wide at its broadest point [7]. This province also containsthe greatest reserves of anthracite in the United States, with more than760 million short tons in eastern Pennsylvania.
The Appalachian basin contains the largest deposits of bituminous coalin the United States. In the northern region of the Appalachian basin, thecoal rank ranges from high-volatile bituminous coal in the west to low-volatile bituminous coal in the east. In the central region of the basin, thecoal includes low- to high-volatile bituminous rank. In the southern region,the coals are mainly of high-volatile bituminous rank with some medium-and low-volatile bituminous coals [5]. Coals are used for steam production,electricity generation, and metallurgical coke production. These coals havehigh heating values, low- to medium-ash contents (up to 20%), and variablesulfur contents, with much of the coal containing 2 to 4% sulfur.
The Interior Province is subdivided into three regions: the North-ern region, consisting of Michigan; the Eastern region or Illinois basin,consisting of Illinois, southern Indiana, and western Kentucky; and theWestern region, consisting of Iowa, Missouri, Nebraska, Kansas, Oklahoma,

20 Coal Energy Systems
Arkansas, and western Texas. The Eastern region is the most importantregion of this province as it has vast reserves contained in Illinois (i.e., morethan 38,000 million short tons) and western Kentucky (nearly 7000 millionshort tons of the approximately 16,000 million short tons listed in Table 1-5).The coal in the Interior Province is mainly bituminous in rank and tends tobe lower in rank and higher in sulfur than the Eastern Province bituminouscoals. Coals are used for steam production, electricity generation, and metal-lurgical coke production. Coal composition in this province is quite variable,with coals from the Illinois basin being noted for having a high sulfur content(3–7%). The ash content is variable.
The Gulf Province consists of the Mississippi region in the east and theTexas region in the west. The coals in this province, which extends fromAlabama through Mississippi, Louisiana, and into Texas, are lignitic in rankand are the lowest rank coals in the United States, having moisture contentsup to 40%.
The Northern Great Plains Province contains the large lignite depositsof North Dakota, South Dakota, and eastern Montana, along with the sub-bituminous fields of northern and eastern Montana and northern Wyoming.These lignite deposits are contained in the Fort Union Region and are thelargest lignite deposits in the world [7]. The coals are used primarily aspower station fuels. The lignite has a high-moisture (38%), low-ash (6%),and medium-sulfur (<1%) content and a heating value of approximately6800 Btu/lb. The Northern Great Plains Province also contains extensivesubbituminous coal reserves from the Powder River basin [18]. Wyomingand Montana are the states with the largest recoverable coal reserves in theUnited States. Wyoming’s coal reserves are split between the Northern GreatPlains Province and the Rocky Mountain Province. The Powder River basincoals are used primarily as power station fuels and average about 1% sulfurwith generally low ash content (3–10%).
The Rocky Mountain Province includes the coalfields of the mountain-ous districts of Montana, Wyoming, Utah, Colorado, and New Mexico. Thecoals range in rank from lignite through anthracite in this province. The mostimportant Rocky Mountain Province coals are the coals from Wyoming, pri-marily those from the Green River, Hanna, and Hanna Fork coalfields. Thesecoals are subbituminous in rank, typically contain low sulfur, and are usedin power generation stations.
The Pacific Coast Province is limited to small deposits in Washington,Oregon, and California. The coals range in rank from lignite to anthracite.The fields are small and scattered and are not being utilized to any greatextent.
The Alaskan Province contains coal in several regions [11]. These coalsvary in rank from lignite to bituminous with a small amount of anthracite.The total reserves are estimated to be 15% bituminous coal and 85% sub-bituminous coal and lignite; however, extensive mining is not performeddue to the low population density and pristine wilderness environment.

Introduction to Coal 21
Only fields close to main lines of transportation have been developed. Thecoals are used primarily as power station fuels.
Canada Canada has about 7300 million short tons of recoverable coal rang-ing in rank from anthracite to lignite. The coal deposits formed in lateJurassic, Cretaceous, and early Tertiary times. Most of the recoverablereserves are in British Columbia, Alberta, and Saskatchewan, which is anextension of the Great Plains province coals from the United States. Coalsfrom western Canada tend to be low in sulfur; those from Alberta andSaskatchewan are used as power station fuels, while British Columbia metal-lurgical coal is exported to the Far East. Coals from eastern Canada, primarilythe Cape Breton Island coalfield in Nova Scotia, are the most important in theAtlantic region. The coals are of high-volatile bituminous rank and vary frommedium to high sulfur. Coal production in Nova Scotia is a small percentageof the national output and is expected to decline further [5].
Eastern Europe and the States of the Former Soviet UnionEastern Europe and the FSU contain extensive recoverable coal reserves total-ing some 290,000 million short tons, or 27% of the world’s total. Four of thecountries listed in Table 1-4 contain over 90% of the recoverable reservesfor this region: Russia, Ukraine, Kazakhstan, and Poland.
Russia Russia has extensive coal reserves, more than 173,000 million shorttons (∼16% of the world total), of which 119,000 million short tons aresubbituminous and lignitic in rank. The coal resources in eastern Siberiaand the Russian Far East remain largely unused because of their remote-ness and lack of infrastructure [5]. Russia’s main coal basins contain coalsranging from Carboniferous to Jurassic in age. Most hard coal reserves are innumerous coalfields in European and central Asian Russia, particularly in theKuznetsk and Pechora basins and the Russian sector of the Dontesk basin.The Kansk–Achinsk basin in eastern Siberia is the country’s main source ofsubbituminous coal. The Moscow basin contains significant lignite reservesbut production has virtually stopped [5].
The Kuznetsk basin, which is located to the east of Novosibirsk,contains coals exhibiting a wide range in quality and rank from brown coalto semi-anthracite. The ash content of the coal is variable, and the sulfurcontent is generally low. High-quality coals with low moisture, ash, andsulfur contents are used for coking and steam coal production. This basin isnow the largest single producer in Russia providing coking and steam coal.
The Pechora basin is located in the extreme northeast of EuropeanRussia. The coal rank in the basin increases from brown coal in the west tobituminous coal and anthracite in the east. Ash content varies considerablyfrom 9 to 43%, while sulfur content, for the most part, does not exceed 1.5%.This basin is the principal supplier of coking coal.
22 Coal Energy Systems
The Dontesk basin is located in eastern Russia and western Ukraineand contains the entire range of coal rank from brown coal to anthracite,which increases in quantity toward the basin’s central and eastern sections.These coals tend to have ash contents of 15 to 20% and sulfur contents of2 to 4% and are used as coking and steam coals.
The Kansk-Achinsk basin, located adjacent to the east side of theKuznetsk basin, contains brown coals that are described as lignites orsubbituminous coals; however, their heating value is higher than that ofmost lignites. These coals have low to medium ash contents (6–20%) andlow sulfur contents (<1%), which make them attractive for power stationfuels.
Ukraine The Ukraine has significant coal reserves totaling approximately37,600 million short tons, which is nearly evenly split between hard coal(bituminous and anthracite) and brown coal as shown in Table 1-4 [2]. Mostof the coal resources are found in two coal basins: the Donetsk and Dneiperbasins. The Donetsk basin, which is Carboniferous in age, is located inthe east (and crosses over into Russia) and contains most of the country’shard coal resources. These coals contain medium ash (15–20%) and mediumto high sulfur (2–4%) contents. These coals are used for steam production,power station fuels, and metallurgical applications. The Dneiper basin isadjacent to the eastern edge of the Donetsk basin and stretches across muchof central Ukraine. This basin contains Ukraine’s brown coal reserves andcurrently is of relatively minor importance [5].
Kazakhstan Kazakhstan contains similar total recoverable coal reservesas the Ukraine: approximately 37,500 million short tons; however, unlikethe Ukraine, most of Kazakhstan’s reserves are hard coals that total morethan 34,000 million short tons. The coal deposits are late Carboniferousand Jurassic in age and are located mainly in the Karaganda and Ekibas-tuz basins, which produce hard coal. The coal deposits of these basins liealong the southern edge of the Siberian platform [5]. In the Karaganda basin,coking and steam coals are produced that have sulfur contents ranging from1.5 to 2.5% and high ash content (20 to 35%). Coals from the Ekibastuz basintypically have high ash (39% on average) and low sulfur (<1%) contents andare predominantly used for thermal power generation.
Poland Poland contains recoverable coal reserves of more than 24,000 mil-lion short tons, of which more than 22,000 million short tons are hardcoal. The hard-coal deposits are found in three main basins located in thesouthern half of the country: the Upper Silesian, Lower Silesian, and Lublinbasins. These basins are of Carboniferous age. Poland uses its hard coal inworld export markets. Poland’s lignite deposits are found in a number ofTertiary basins across the central and southwestern parts of the country.

Introduction to Coal 23
Poland ranks fourth in world lignite production and is the second largestEuropean producer after Germany. The lignite is used as a fuel for electric-ity generation. Polish lignite has variable ash contents (4–25%) and low tomedium sulfur contents (0.2–1.7%).
AsiaAsia contains significant recoverable coal reserves totaling over 231,000 mil-lion short tons, or approximately 21% of the world total. Two countriescomprise most of this total: China (126,000 million short tons) and India(93,000 million short tons).
China China contains more than 126,000 million short tons of recoverablecoal reserves in the world, third behind only the United States and Russia [2].These recoverable reserves are nearly equally divided between hard coal andlignite deposits (i.e., 68,500 and 57,700 million short tons, respectively),with the hard coals being of Carboniferous, Permian, and Jurassic age andthe lignite of Tertiary age. Coalfields are scattered throughout China, withthe largest deposits being found in western China, stretching from north tosouth with most of the reserves in the northern part, specifically in the InnerMongolia, Shanxi, and Shaanxi provinces. Significant anthracite deposits arefound in the Shanxi and Guizhou provinces. Bituminous coal deposits occurin the Heilongjiang, Shanxi, Jiangxi, Shandong, Henan, Anhui, and Guizhouprovinces [5]. China is the world’s largest coal producer; most of the coal isused internally for industry and electricity generation. The hard-coal rankappears to increase slightly northward from the Yangtze River, while locallyseam quality is very variable [5].
India India’s recoverable coal reserves rank fourth in the world with morethan 93,000 million short tons. These reserves vary in rank from lignites tobituminous coal, with most of it being hard coal (i.e., nearly 91,000 millionshort tons), although coal quality is generally poor. India’s coalfields arelocated mainly in the east in the states of Assam, Bihar, Uttar Pradesh,Madhya Pradesh, Andhra Pradesh, Orissa, and West Bengal [5]. India’s coalsare principally of Permian age with some of Tertiary age.
The most significant deposits are in the Raniganj and Jharia basins ofnortheast India. In the Raniganj basin, the rank increases from noncakingbituminous coal in the east to medium coking coal in the west. Ash contentvaries, though, from 15 to 35%; sulfur content is low (<1%). The Jhariacoalfield is India’s major source of prime coking coal, although it also con-tains significant non-coking coal as well. As with Raniganj basin coals, ashcontent varies from 15 to 35% and the coal has low sulfur contents in theJharia basin. Most of India’s lignite mining occurs in southern India in theNeyveli coalfield, although other areas contain larger resources. The ligniteis low ash (2–12%) and low sulfur (<1%); however, the moisture content

24 Coal Energy Systems
is high, varying between 45 and 55%. India’s coal is used primarily forpower production. Although India has substantial recoverable resources, coalimports are steadily rising to meet demands for coking coal as well as forsteam coal as new power plants begin operation [5].
AustraliaAustralian recoverable coal reserves total over 90,000 million short tons,which is nearly equally divided between hard coal and lignite deposits (i.e.,46,900 and 43,600 million short tons, respectively) with the hard coals beingof Carboniferous and Permian age and the lignite of Tertiary age. Coal ismined in all of the states except for the Northern Territory. New South Walesand Queensland produce both steam and metallurgical coal for export, whileproduction in Victoria, South Australia, and Western Australia is used forthermal electricity generation [5]. Hard coal is mined in New South Wales,Queensland, and Western Australia, while subbituminous and brown coal ismined in South Australia and Victoria. The major coal reserves are found ineastern Australia, with the Bowen, Sydney, and Gippsland basins being themost important.
The Bowen basin is located in Queensland and developed during earlyPermian times. The rank varies in this basin, increasing from west to east,with the higher rank coals ranging from low-volatile bituminous coal in thewest to semi-anthracites and anthracites in the east. The coals have a lowsulfur content (typically 0.3–0.8%) and ash contents of 8 to 10% and 8 to 16%for coking and thermal coals, respectively.
The Sydney basin is located in New South Wales, is of Permian age, andconsists of several coalfields. In general, the Sydney basin coals are medium-to high-volatile bituminous coal, with the highest rank being found in thenorthern portion of the basin. The coals in this basin have a low sulfur con-tent (<1%), and ash contents typically range from 6 to 24%, although onecoalfield exceeds 40% ash.
The brown coal resources found in the Gippsland basin lie within theLatrobe Valley in Victoria and are of Tertiary age. This area is noted for itsthick coal seams ranging from 330 to 460 feet in thickness. The brown coalshave low heating values (3400–5200 Btu/lb) due to high and very variablemoisture contents, which range from 49 to 70%. Ash contents, on the otherhand, are low and range from 0.5 to 2%.
Western EuropeWestern Europe contains approximately 101,000 million short tons of recov-erable coal reserves, with 72,800 million short tons in Germany alone.Fifteen other countries (see Table 1-4) comprise the balance; Yugoslavia con-tains by far the largest recoverable reserves of these countries (18,000 millionshort tons).
Introduction to Coal 25
Germany Germany contains nearly 73,000 million short tons of recover-able coal reserves, of which more than 25,000 and 47,000 million short tonsare hard coal and lignite, respectively. Germany is Europe’s largest indi-vidual lignite producer; the three main areas of lignite resources are theRhineland, Lusatian, and Central German basins, which are of Tertiary age.In addition, Germany has a substantial hard-coal capacity, which is of Car-boniferous age and located in the Ruhr and Saar basins. Of the three mainlignite basins, the Rhineland deposits are now the most important and arelocated between the River Rhine and the German/Dutch/Belgian border. TheCentral German and Lusatian basins are located in eastern Germany. Thelignites have heating values of 3350 to 5400 Btu/lb, and moisture contentsthat vary from 40 to 60%. Ash and sulfur contents vary from 1.5 to 8.5%and 0.2 to 2.1%, respectively, with Rhineland basin lignite having sulfurcontents of less than 0.5%. These coals are used for producing electricity ingenerating stations. Because of restructuring of the hard coal mining sector,which began in 1999, the Ruhr coalfield has greater economic significancethan the Saar coalfield as mines continue to close and overall productiondeclines [5]. The Ruhr coalfield primarily consists of bituminous coal, muchof which is coking coal. There are two small areas of anthracite in the basin.The ash and sulfur contents of the coals in this basin are 4 to 9% and lessthan 1%, respectively. The coals are used primarily for electricity generationalong with some industrial applications.
AfricaAfrica contains 61,000 million short tons of recoverable coal, with approx-imately 55,000 million short tons of those reserves being located in SouthAfrica. The balance is found in 13 other countries, with 11 of those coun-tries containing less than about 200 million short tons each of recoverablereserves (see Table 1-4).
South Africa South Africa’s recoverable coal reserves of 55,000 millionshort tons consist entirely of hard coal. These coals are of Carboniferousand Permian age with significant deposits in the Great Karoo basin. Thisbasin extends about 300 miles from west to east across northern Free StateProvince and south and east Mpumalanga, and about 700 miles from south-ern Mpumalanga in the north to the center of Kwazulu–Natal in the south [5].Although the Great Karoo basin is the largest, several other basins and a totalof 19 coalfields are located throughout South Africa. The hard coal consistsof bituminous coals, anthracite, and semi-anthracite. The ash content rangesfrom 7% for some anthracites to over 30% for bituminous coals. Sulfur con-tents range from less than 1% to nearly 3%. Domestically, the coal is used forelectricity generation and conversion into synthetic liquid fuels and chemi-cal feedstocks. South Africa exports significant quantities of steam coal withminor amounts of coking coal and anthracite.

26 Coal Energy Systems
Central and South AmericaCentral and South America contain approximately 24,000 million short tonsof recoverable coal reserves, or 2.2% of the world’s total. Coal is found inseveral countries, including Argentina, Bolivia, Brazil, Chile, Colombia,Ecuador, Peru, and Venezuela; however, two of the countries contain themajority of these reserves: Brazil (13,150 million short tons) and Colombia(7200 million short tons). Brazil’s coals are subbituminous and lignitic inrank, while Colombia’s coals are primarily high-volatile bituminous witha small amount of subbituminous coals. These coals formed during lateCretaceous to Tertiary times.
References
1. Van Krevelen, D. W., Coal: Typology–Physics–Chemistry–Constitution, Thirded. (Elsevier Science, Amsterdam, 1993).
2. EIA, International Energy Annual 2001 (U.S. Department of Energy, EnergyInformation Administration, Washington, D.C., March 2003), pp. 114–115.
3. Grimston, M. C., Coal as an Energy Source (IEA Coal Research, London,1999), p. 6.
4. Moore, E. S., Coal: Its Properties, Analysis, Classification, Geology, Extrac-tion, Uses, and Distribution (John Wiley & Sons, New York, 1922), p. 124.
5. Walker, S., Major Coalfields of the World (IEA Coal Research, London, 2000).6. Tatsch, J. H., Coal Deposits: Origin, Evolution, and Present Characteristics
(Tatsch Associates, Sudbury, MA, 1980), p. 5.7. Schobert, H. H., Coal: The Energy Source of the Past and Future (American
Chemical Society, Washington, D.C., 1987).8. Mitchell, G., Basics of Coal and Coal Characteristics (Selecting Coals for
Quality Coke Short Course, Iron and Steel Society, Warrendale, PA, 1997).9. Elliott, M. A. (editor), Chemistry of Coal Utilization, Second Suppl. Vol. (John
Wiley & Sons, New York, 1981).10. Berkowitz, N., An Introduction to Coal Technology (Academic Press, New
York, 1979).11. Singer, J. G. (editor), Combustion: Fossil Power Systems (Combustion
Engineering, Windsor, CT, 1981).12. Miller, B. G., S. Falcone Miller, R. Cooper, J. Gaudlip, M. Lapinsky, R. McLaren,
W. Serencsits, N. Raskin, and T. Steitz, Feasibility Analysis for Installing a Cir-culating Fluidized Bed Boiler for Cofiring Multiple Biofuels and Other Wasteswith Coal at Penn State University (U.S. Department of Energy, NationalEnergy Technology Laboratory, DE-FG26-00NT40809, 2003), Appendix J.
13. Ward, C. R. (editor), Coal Geology and Coal Technology (Blackwell Scientific,Melbourne, 1984), p. 66.
14. Averitt, P., Coal resources of the U.S., January 1, 1974, U.S. Geological SurveyBulletin, No. 1412, 1975 (reprinted 1976), 131 pp.

Introduction to Coal 27
15. Mackowsky, M. T., Mineral Matter in Coal: In Coal and Coal-Bearing Strata,D. Murchson and T. S. Westoll, editors (Oliver & Boyd, Ltd., London, 1968),pp. 309–321.
16. EIA, U.S. Coal Reserves: 1997 Update (U.S. Department of Energy, EnergyInformation Administration, Washington, D.C., February 1999), p. 5,Appendix A.
17. EIA, International Energy Outlook 2002 (U.S. Department of Energy, EnergyInformation Administration, Washington, D.C., March 2002), p. 72.
18. Keystone Coal Industry Manual (Intertec Publishing, Chicago, IL, 1997),p. 687.

This page intentionally left blank
CHAPTER 2
Past, Present, and FutureRole of Coal
A brief history of the use of coal is presented in this chapter along with acomparison to other energy sources. While the emphasis is on coal usagein the United States, a global perspective is also presented, especially withregard to comparing overall energy consumption. Types of technologies usedin the past and developed as part of the Industrial Revolution are briefly men-tioned as part of the history of coal use; however, a more in-depth discussionof major coal technologies is provided in Chapter 5 (Technologies for CoalUtilization). Similarly, the role of coal in the future energy mix of the UnitedStates, which is crucial to the U.S. economy and energy security, is intro-duced in this chapter but discussed in greater detail in Chapter 8 (Coal’s Rolein Providing U.S. Energy Security).
The Use of Coal in the Pre-Industrial Revolution Era
The use of coal as an energy source has been known from ancient times,although it was a minor resource until the Industrial Revolution. The firstmention of coal in European literature dates from the fourth century B.C. [1];however, scholars are certain that coal was first used in China as early as1000 B.C. [2]. By 1000 A.D., coal was a primary fuel source in China, andits use was reported by the Venetian traveler Marco Polo in the thirteenthcentury [3,4].
The first documented use of coal in Western civilization is attributedto the Greek philosophers Pliny, Aristotle, and Theophrastus, who wasAristotle’s pupil [1]. The first definitive record of the use of coal is foundin Aristotle’s Meteorology, where he writes of combustible bodies [1].Theophrastus, in his fourth-century Treatise on Stones, describes a fossilsubstance used as a fuel [5]. Theophrastus and Pliney both mention the useof coal by smiths [1,6]. The coal mentioned in these writings was apparentlybrown coal from Thrace in northern Greece and from Ligurai in northwest-ern Italy. This coal was not normally used in iron-smelting furnaces because
29

30 Coal Energy Systems
of its impurities and, hence, inability to produce the required high tempera-tures, although Pliney does mention its use in copper casting, which can bedone at considerably lower temperatures [6].
Although the Greeks and Romans knew of coal around 400 B.C., theydid not have much use for it because wood was plentiful. When wood isabundant, there is little incentive to mine coal. Coal was used as a domesticheating fuel in some parts of the Roman Empire, particularly in Britain, but itnever made more than a marginal contribution as a fuel resource [6]. As theRomans invaded northward, they encountered the mining and use of coalin the vicinity of St. Etienne in Gaul (France) as well as in Britain, wherecoal cinders in Roman ruins indicated that coal was used during the Romanoccupation, from approximately 50 to 450 A.D. [5].
In the middle ages, coal had to be rediscovered in Europe, and for sometime coal remained of very restricted local importance. Coal had been usedon a small scale in western Europe for thousands of years, as evidence showsfrom the discoveries of a Bronze Age corpse that was cremated with coalin South Wales, as well as remains of Roman coal-fueled fires on theirnorthern English frontier along Hadrian’s Wall; however, there is no evi-dence of European coal use for hundreds of years after the fall of the RomanEmpire [7]. During the middle ages, records show that coal had been givento the monks in the Abbey of Peterborough in 852 A.D. as an offering orin a settlement of a claim [2]. Coal was mined in Germany as early as the900s and was mentioned in the charter (dated 1025) of the French priory ofSt. Sauveuren-Rue [8].
While peasants probably continued to use surface coal for domesticheating fuel, evidence suggests that it was not until around 1200 thatindustrial uses were found. Coal was discovered to be a very good fuel foriron forges and metalworking, as it burned almost as slowly as charcoal,which is produced from wood and was the primary fuel of choice for vil-lage smiths. It is at this time that shipping records can be found for coalbeing marketed in western Europe because the smiths preferred coal overcharcoal if they could get it at a reasonable price [7]. Liège in Belgium,Lyonnais in France, and Newcastle in England became important miningcenters [7,8].
At first coal was used close to the areas where it was mined because itwas competing against wood and charcoal, which were less expensive thancoal to transport. Coal was bulky and therefore subject to the high landtransport costs common for bulky materials; however, as water transporta-tion on rivers and the sea increased and wood became scarce particularlyin the cities, coal became the fuel of choice. By the mid-1200s, the termsea-coal was used to distinguish coal from charcoal, and sea-coal was beingtransported to London by sea from Newcastle. By the 1370s, 84 coal boatswere traveling down the east coast of England to ten different ports alongthe European coast between France and Denmark, returning with iron, salt,cloth, and tiles [7].

Past, Present, and Future Role of Coal 31
Although coal became the fuel of choice for blacksmiths duringmedieval times, initially it had limited use as a heat source because of itsfumes; however, as wood became increasingly scarce and coal became lessexpensive in the cities, coal use began to increase. With the increased useof coal (mainly in fireplaces designed to burn wood) came increased pollu-tion problems, mainly black smoke and fumes. In 1257, Queen Eleanor wasdriven from Nottingham Castle by the smoke and fumes rising from thecity below. In 1283 and 1288, London’s citizens complained about the airquality as a result of coal being used in lime kilns. In 1307, a Royal Procla-mation forbade the use of coal in lime burners in parts of South London[7]. This proclamation did not work, however, and a later commission hadinstructions to punish offenders with fines and ransoms for a first offenseand to demolish their furnaces for a second offense. Eventually, economicsand a change in government policy won out over the populace’s comfort andLondon was to remain polluted by coal fumes for another 600 years [7]. Asthe price of firewood increased, it became more profitable to transport coalover longer distances. In addition, late sixteenth- and seventeenth-centuryEngland faced the dilemma of conserving its remaining forests and usingthe only available substitute: coal. In 1615, the English government encour-aged the substitution of coal for wood whenever possible. A fundamentalchange in English domestic building followed with more brick chimneysconstructed to accommodate the fumes from coal [7].
Early History of U.S. Coal Mining and UseCoal was reportedly used by the Indians of the Southwest prior to the arrivalof the early explorers in America [9]. The first record of coal in the UnitedStates is on a map prepared in 1673–1674 by the Frenchman Louis Joliet.It shows charbon de terra along the Illinois River in northern Illinois. In1701, coal was discovered near Richmond, Virginia, and a map drawn in 1736shows the location of several “cole mines’‘ on the upper Potomac River, nearwhat is now the border of Maryland and West Virginia. By the mid-1700s,coal was also reported in Pennsylvania, Ohio, and Kentucky, and the firstcommercial U.S. coal production was initiated near Richmond, Virginia [9].Blacksmiths in colonial days used small amounts of coal to supplement thecharcoal normally burned in their forges. Farmers dug coal from beds exposedat the surface and sold it. Although most of the coal for the larger cities alongthe eastern seaboard was imported from England and Nova Scotia, some ofit came from Virginia [9].
The Use of Coal during the Industrial Revolution
Several developments in the eighteenth century led to an expanded use ofcoal in England, culminating with the Industrial Revolution, which occurred
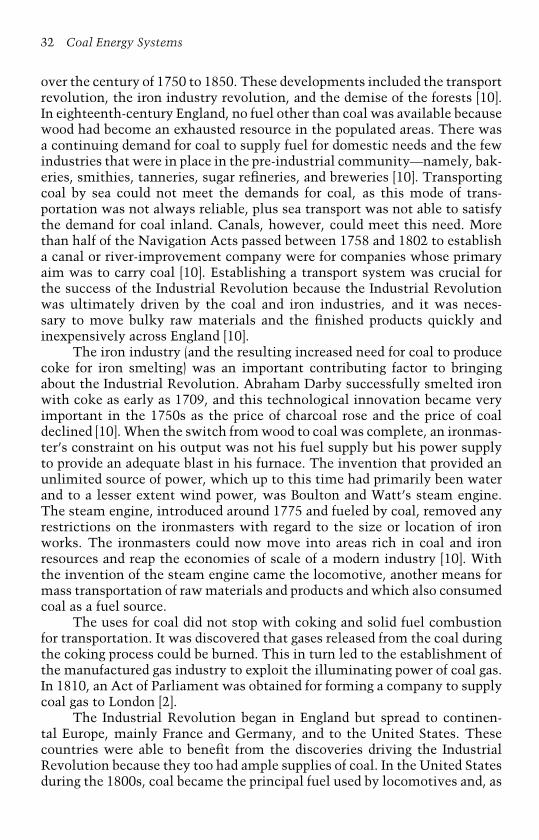
32 Coal Energy Systems
over the century of 1750 to 1850. These developments included the transportrevolution, the iron industry revolution, and the demise of the forests [10].In eighteenth-century England, no fuel other than coal was available becausewood had become an exhausted resource in the populated areas. There wasa continuing demand for coal to supply fuel for domestic needs and the fewindustries that were in place in the pre-industrial community—namely, bak-eries, smithies, tanneries, sugar refineries, and breweries [10]. Transportingcoal by sea could not meet the demands for coal, as this mode of trans-portation was not always reliable, plus sea transport was not able to satisfythe demand for coal inland. Canals, however, could meet this need. Morethan half of the Navigation Acts passed between 1758 and 1802 to establisha canal or river-improvement company were for companies whose primaryaim was to carry coal [10]. Establishing a transport system was crucial forthe success of the Industrial Revolution because the Industrial Revolutionwas ultimately driven by the coal and iron industries, and it was neces-sary to move bulky raw materials and the finished products quickly andinexpensively across England [10].
The iron industry (and the resulting increased need for coal to producecoke for iron smelting) was an important contributing factor to bringingabout the Industrial Revolution. Abraham Darby successfully smelted ironwith coke as early as 1709, and this technological innovation became veryimportant in the 1750s as the price of charcoal rose and the price of coaldeclined [10]. When the switch from wood to coal was complete, an ironmas-ter’s constraint on his output was not his fuel supply but his power supplyto provide an adequate blast in his furnace. The invention that provided anunlimited source of power, which up to this time had primarily been waterand to a lesser extent wind power, was Boulton and Watt’s steam engine.The steam engine, introduced around 1775 and fueled by coal, removed anyrestrictions on the ironmasters with regard to the size or location of ironworks. The ironmasters could now move into areas rich in coal and ironresources and reap the economies of scale of a modern industry [10]. Withthe invention of the steam engine came the locomotive, another means formass transportation of raw materials and products and which also consumedcoal as a fuel source.
The uses for coal did not stop with coking and solid fuel combustionfor transportation. It was discovered that gases released from the coal duringthe coking process could be burned. This in turn led to the establishment ofthe manufactured gas industry to exploit the illuminating power of coal gas.In 1810, an Act of Parliament was obtained for forming a company to supplycoal gas to London [2].
The Industrial Revolution began in England but spread to continen-tal Europe, mainly France and Germany, and to the United States. Thesecountries were able to benefit from the discoveries driving the IndustrialRevolution because they too had ample supplies of coal. In the United Statesduring the 1800s, coal became the principal fuel used by locomotives and, as
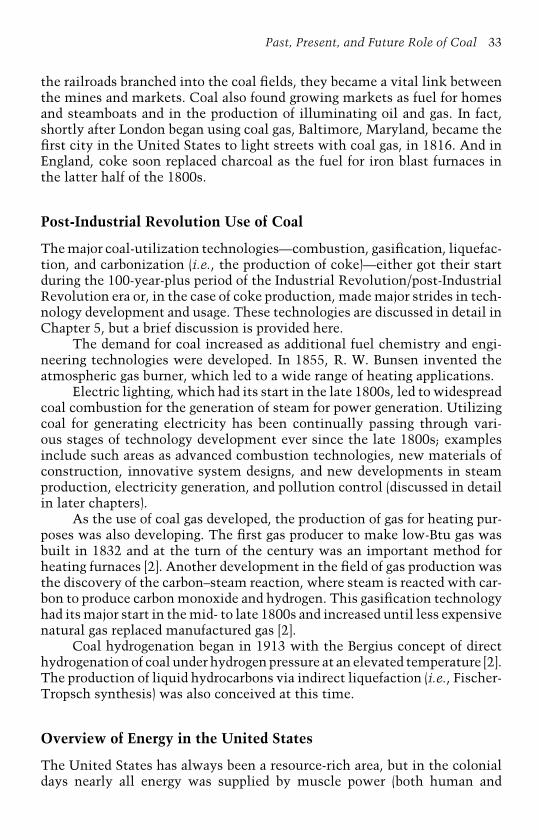
Past, Present, and Future Role of Coal 33
the railroads branched into the coal fields, they became a vital link betweenthe mines and markets. Coal also found growing markets as fuel for homesand steamboats and in the production of illuminating oil and gas. In fact,shortly after London began using coal gas, Baltimore, Maryland, became thefirst city in the United States to light streets with coal gas, in 1816. And inEngland, coke soon replaced charcoal as the fuel for iron blast furnaces inthe latter half of the 1800s.
Post-Industrial Revolution Use of Coal
The major coal-utilization technologies—combustion, gasification, liquefac-tion, and carbonization (i.e., the production of coke)—either got their startduring the 100-year-plus period of the Industrial Revolution/post-IndustrialRevolution era or, in the case of coke production, made major strides in tech-nology development and usage. These technologies are discussed in detail inChapter 5, but a brief discussion is provided here.
The demand for coal increased as additional fuel chemistry and engi-neering technologies were developed. In 1855, R. W. Bunsen invented theatmospheric gas burner, which led to a wide range of heating applications.
Electric lighting, which had its start in the late 1800s, led to widespreadcoal combustion for the generation of steam for power generation. Utilizingcoal for generating electricity has been continually passing through vari-ous stages of technology development ever since the late 1800s; examplesinclude such areas as advanced combustion technologies, new materials ofconstruction, innovative system designs, and new developments in steamproduction, electricity generation, and pollution control (discussed in detailin later chapters).
As the use of coal gas developed, the production of gas for heating pur-poses was also developing. The first gas producer to make low-Btu gas wasbuilt in 1832 and at the turn of the century was an important method forheating furnaces [2]. Another development in the field of gas production wasthe discovery of the carbon–steam reaction, where steam is reacted with car-bon to produce carbon monoxide and hydrogen. This gasification technologyhad its major start in the mid- to late 1800s and increased until less expensivenatural gas replaced manufactured gas [2].
Coal hydrogenation began in 1913 with the Bergius concept of directhydrogenation of coal under hydrogen pressure at an elevated temperature [2].The production of liquid hydrocarbons via indirect liquefaction (i.e., Fischer-Tropsch synthesis) was also conceived at this time.
Overview of Energy in the United States
The United States has always been a resource-rich area, but in the colonialdays nearly all energy was supplied by muscle power (both human and
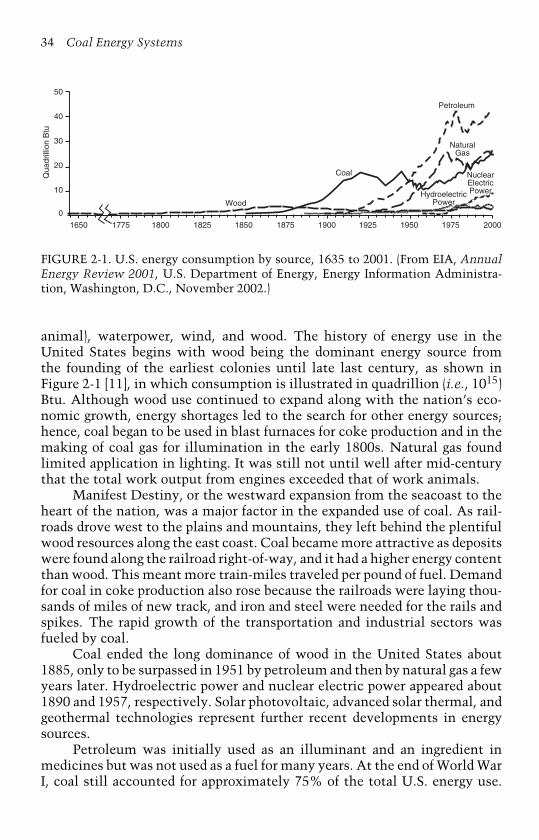
34 Coal Energy Systems
1650 1775 1800 1825 1850 1875 1900 1925 1950 1975 2000
Petroleum
Coal
Wood
NaturalGas
NuclearElectricPowerHydroelectric
Power
50
40
30
20
10
0
Qua
drill
ion
Btu
FIGURE 2-1. U.S. energy consumption by source, 1635 to 2001. (From EIA, AnnualEnergy Review 2001, U.S. Department of Energy, Energy Information Administra-tion, Washington, D.C., November 2002.)
animal), waterpower, wind, and wood. The history of energy use in theUnited States begins with wood being the dominant energy source fromthe founding of the earliest colonies until late last century, as shown inFigure 2-1 [11], in which consumption is illustrated in quadrillion (i.e., 1015)Btu. Although wood use continued to expand along with the nation’s eco-nomic growth, energy shortages led to the search for other energy sources;hence, coal began to be used in blast furnaces for coke production and in themaking of coal gas for illumination in the early 1800s. Natural gas foundlimited application in lighting. It was still not until well after mid-centurythat the total work output from engines exceeded that of work animals.
Manifest Destiny, or the westward expansion from the seacoast to theheart of the nation, was a major factor in the expanded use of coal. As rail-roads drove west to the plains and mountains, they left behind the plentifulwood resources along the east coast. Coal became more attractive as depositswere found along the railroad right-of-way, and it had a higher energy contentthan wood. This meant more train-miles traveled per pound of fuel. Demandfor coal in coke production also rose because the railroads were laying thou-sands of miles of new track, and iron and steel were needed for the rails andspikes. The rapid growth of the transportation and industrial sectors wasfueled by coal.
Coal ended the long dominance of wood in the United States about1885, only to be surpassed in 1951 by petroleum and then by natural gas a fewyears later. Hydroelectric power and nuclear electric power appeared about1890 and 1957, respectively. Solar photovoltaic, advanced solar thermal, andgeothermal technologies represent further recent developments in energysources.
Petroleum was initially used as an illuminant and an ingredient inmedicines but was not used as a fuel for many years. At the end of World WarI, coal still accounted for approximately 75% of the total U.S. energy use.

Past, Present, and Future Role of Coal 35
This situation changed, however, after World War II. Coal relinquished itsplace as the premier fuel in the United States as railroads lost business totrucks that operated on gasoline and diesel fuel. The railroads themselvesbegan switching to diesel locomotives. Natural gas also started replacingcoal in home stoves and furnaces. The coal industry survived, however,mainly because nationwide electrification created new demand for coalamong electric utilities.
Most of the energy produced today in the United States comes fromfossil fuels—coal, natural gas, crude oil, and natural gas plant liquids (seeFigure 2-2) [11]. Although U.S. energy production takes many forms, the useof all fossil fuels far exceeds that of all other forms of energy. In 2000, fossilfuels accounted for 80% of total energy production and were valued at anestimated $148 billion [11].
For most of its history, the United States was self-sufficient in energy,although small amounts of coal were imported from Britain and Nova Scotiaduring colonial times. Through the late 1950s, production and consumptionof energy were nearly in balance; however, beginning in the 1960s and contin-uing today, consumption outpaces domestic production (see Figure 2-3). Thisimbalance is further illustrated in Figure 2-4; in 2001, the United States pro-duced approximately 72 quadrillion Btu but consumed nearly 97 quadrillionBtu, and crude oil imports totaled nearly 25 quadrillion Btu [11]. Becauseof its insatiable demand for petroleum, U.S. petroleum imports reached a
Qua
drill
ion
Btu
25
20
15
10
5
0
23
20
12
8
3 3 3
<0.5
Coal NaturalGas
CrudeOil
NuclearElectricPower
Woodand
Waste
Hydro-electricPower
NaturalGasPlant
Liquids
Geo-thermal and
Other
FIGURE 2-2. U.S. energy production by source for 2000. (From EIA, Annual EnergyReview 2001, U.S. Department of Energy, Energy Information Administration,Washington, D.C., November 2002.)
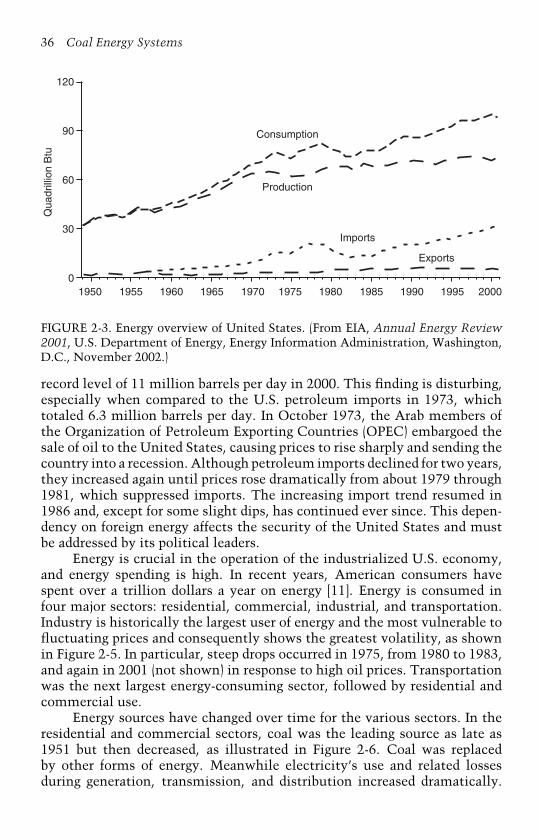
36 Coal Energy SystemsQ
uadr
illio
n B
tu
90
60
30
0
120
1950 1955 1960 1965 1970 1975 1980 1985 1990 1995 2000
Consumption
Production
Imports
Exports
FIGURE 2-3. Energy overview of United States. (From EIA, Annual Energy Review2001, U.S. Department of Energy, Energy Information Administration, Washington,D.C., November 2002.)
record level of 11 million barrels per day in 2000. This finding is disturbing,especially when compared to the U.S. petroleum imports in 1973, whichtotaled 6.3 million barrels per day. In October 1973, the Arab members ofthe Organization of Petroleum Exporting Countries (OPEC) embargoed thesale of oil to the United States, causing prices to rise sharply and sending thecountry into a recession. Although petroleum imports declined for two years,they increased again until prices rose dramatically from about 1979 through1981, which suppressed imports. The increasing import trend resumed in1986 and, except for some slight dips, has continued ever since. This depen-dency on foreign energy affects the security of the United States and mustbe addressed by its political leaders.
Energy is crucial in the operation of the industrialized U.S. economy,and energy spending is high. In recent years, American consumers havespent over a trillion dollars a year on energy [11]. Energy is consumed infour major sectors: residential, commercial, industrial, and transportation.Industry is historically the largest user of energy and the most vulnerable tofluctuating prices and consequently shows the greatest volatility, as shownin Figure 2-5. In particular, steep drops occurred in 1975, from 1980 to 1983,and again in 2001 (not shown) in response to high oil prices. Transportationwas the next largest energy-consuming sector, followed by residential andcommercial use.
Energy sources have changed over time for the various sectors. In theresidential and commercial sectors, coal was the leading source as late as1951 but then decreased, as illustrated in Figure 2-6. Coal was replacedby other forms of energy. Meanwhile electricity’s use and related lossesduring generation, transmission, and distribution increased dramatically.
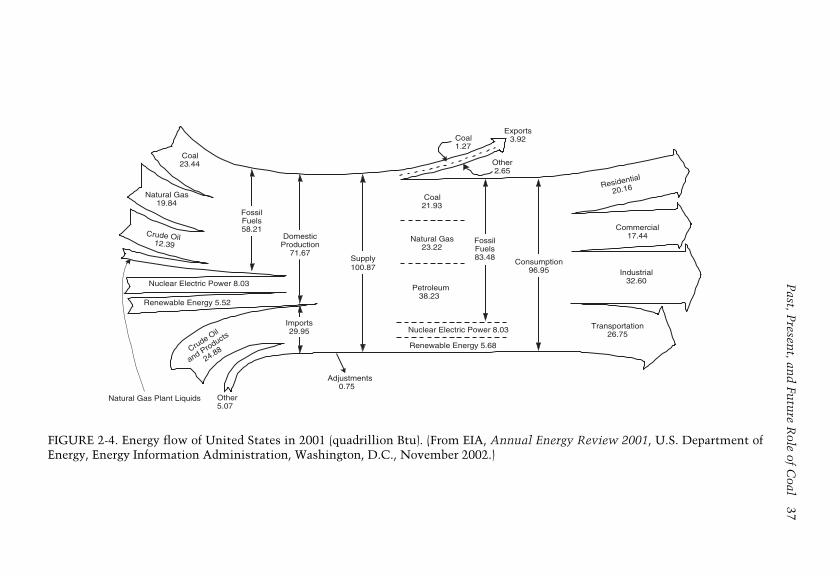
Past,P
resent,an
dFu
ture
Role
ofC
oal37
Crude Oil 12.39
Residential
20.16
Coal23.44
Natural Gas 19.84
Natural Gas Plant Liquids
Nuclear Electric Power 8.03
Renewable Energy 5.52
Other5.07
Adjustments 0.75
Coal1.27
Exports3.92
Other 2.65
Coal21.93
Natural Gas 23.22
Petroleum 38.23
Nuclear Electric Power 8.03
Renewable Energy 5.68
Commercial17.44
Industrial32.60
Transportation26.75
FossilFuels58.21
Consumption96.95
FossilFuels83.48Supply
100.87
DomesticProduction
71.67
Imports29.95
Crude Oil
and Products
24.88
FIGURE 2-4. Energy flow of United States in 2001 (quadrillion Btu). (From EIA, Annual Energy Review 2001, U.S. Department ofEnergy, Energy Information Administration, Washington, D.C., November 2002.)
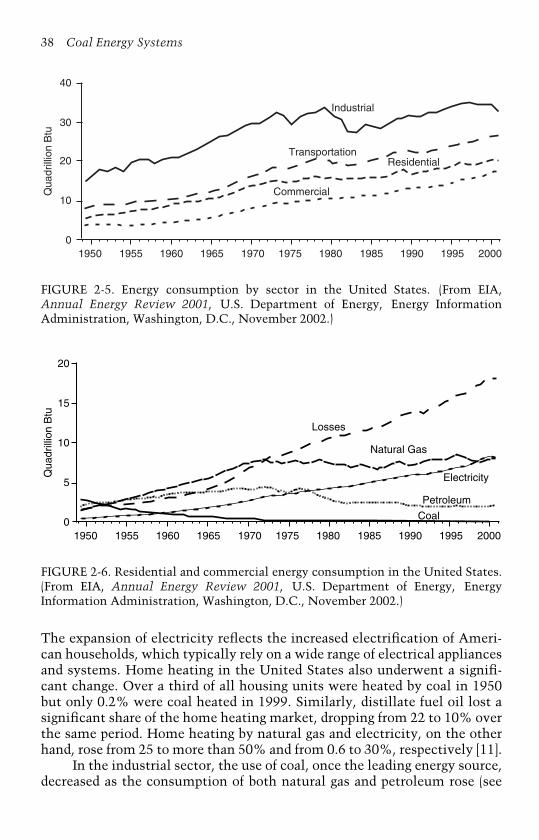
38 Coal Energy SystemsQ
uadr
illio
n B
tu
30
20
10
0
40
1950 1955 1960 1965 1970 1975 1980 1985 1990 1995 2000
Industrial
Transportation
Commercial
Residential
FIGURE 2-5. Energy consumption by sector in the United States. (From EIA,Annual Energy Review 2001, U.S. Department of Energy, Energy InformationAdministration, Washington, D.C., November 2002.)
Qua
drill
ion
Btu
15
10
5
0
20
1950 1955 1960 1965 1970 1975 1980 1985 1990 1995 2000
Losses
Electricity
Petroleum
Natural Gas
Coal
FIGURE 2-6. Residential and commercial energy consumption in the United States.(From EIA, Annual Energy Review 2001, U.S. Department of Energy, EnergyInformation Administration, Washington, D.C., November 2002.)
The expansion of electricity reflects the increased electrification of Ameri-can households, which typically rely on a wide range of electrical appliancesand systems. Home heating in the United States also underwent a signifi-cant change. Over a third of all housing units were heated by coal in 1950but only 0.2% were coal heated in 1999. Similarly, distillate fuel oil lost asignificant share of the home heating market, dropping from 22 to 10% overthe same period. Home heating by natural gas and electricity, on the otherhand, rose from 25 to more than 50% and from 0.6 to 30%, respectively [11].
In the industrial sector, the use of coal, once the leading energy source,decreased as the consumption of both natural gas and petroleum rose (see

Past, Present, and Future Role of Coal 39Q
uadr
illio
n B
tu
9
6
3
0
12
1950 1955 1960 1965 1970 1975 1980 1985 1990 1995 2000
Wood
Electricity
PetroleumNatural Gas
Coal
Losses
FIGURE 2-7. Industrial energy consumption in the United States. (From EIA,Annual Energy Review 2001, U.S. Department of Energy, Energy InformationAdministration, Washington, D.C., November 2002.)
Figure 2-7). Electricity and its associated losses also grew steadily in thissector. Approximately 60% of the energy consumed in the industrial sec-tor is used for manufacturing. The remainder goes to mining, construction,agriculture, fisheries, and forestry [11]. The large consumers of energy in themanufacturing industries, for which the fuel of choice is primarily naturalgas, include petroleum and coal products, chemicals and associated products,paper and associated products, and metal industries. Nearly 7% of all energyconsumed in the United States is used for nonfuel purposes such as asphaltand road oil for road construction and road conditioning; roofing products;liquefied petroleum gases for feedstocks at petrochemical plants; waxes forpackaging, cosmetics, pharmaceuticals, inks, and adhesives; and gases forchemical and rubber manufacture [11].
The transportation sector’s use of energy, which is mainly petroleum,has more than tripled over the last 50 years, as shown in Figure 2-8. Gasolineaccounts for about two-thirds of the petroleum consumed in this sector, withdistillate fuel oil and jet fuel being the other main petroleum products usedin this sector.
Coal Production in the United States
The total amount of coal consumed in the United States in all the years before1800 was an estimated 108,000 short tons, much of it imported [11]; however,production and consumption began to increase as a result of the IndustrialRevolution and the development of the railroads. From 1881 through 1951,coal was the leading energy source produced in the United States [11]. Coalwas surpassed by crude oil and natural gas until 1982/1984, at which timecoal regained its position as the top energy resource (see Figure 2-9).

40 Coal Energy SystemsQ
uadr
illio
n B
tu
21
14
7
0
28
1950 1955 1960 1965 1970 1975 1980 1985 1990 1995 2000
Petroleum
Total
FIGURE 2-8. Transportation energy consumption in the United States. (From EIA,Annual Energy Review 2001, U.S. Department of Energy, Energy InformationAdministration, Washington, D.C., November 2002.)
Qua
drill
ion
Btu
1950 1955 1960 1965 1970 1975 1980 1985 1990 1995 2000
Hydroelectric Power
Natural Gas
Natural Gas PlantLiquids
Crude Oil
Wood and Waste
Coal
Nuclear ElectricPower
0
5
10
15
20
25
FIGURE 2-9. Energy production in the United States from 1949 to 2001. (Adaptedfrom EIA, Annual Energy Review 2001, U.S. Department of Energy, Energy Informa-tion Administration, Washington, D.C., November 2002.)

Past, Present, and Future Role of Coal 41
Enormous quantities of coal are mined in the United States, and 1.09billion short tons of coal were mined in 2002, which was slightly less thanthe record level of 1.12 billion short tons of coal mined in 2001 [12]. Coal flowin the United States for 2002 is summarized in Figure 2-10. The trend in U.S.coal production for the last 112 years is illustrated in Figure 2-11 [9]. Coalproduction by region and state is provided in Table 2-1 for 2002 [12]. Coalproduction has shifted from mainly underground mines to surface mines, asillustrated in Figure 2-12. Also, coal resources west of the Mississippi River,especially those in Wyoming, have undergone tremendous development (seeFigure 2-13). Coal was produced in 26 states in 2002, with 15 of these stateslocated in the western United States.
The shift toward surface-mined coal, especially west of the MississippiRiver, came about because of the technological improvements in mining andthe geological nature of the deposits (i.e., thick coal seams that are locatednear the surface). Coal in the eastern United States generally occurs in seamsthat tend to be less than 15 feet thick. Thicker coalbeds are common inthe western United States, particularly Wyoming, where coal seams average65 feet, as illustrated in Figure 2-14 [9]. Coal seams that are more than 200feet under the surface are mined by underground methods. Most undergroundmines are less than 1000 feet deep, although several reach depths of about2000 feet [9]. The largest coal-producing western mines are surface mines.
Individual coalbeds commonly cover large geographical regions. Forexample, the heavily mined Pittsburgh coalbed is found in parts of Pennsyl-vania, West Virginia, Ohio, and Maryland. Similarly, the Wyodak coalbed,which is the leading source of coal in the United States, is estimated tocover at least 10,000 square miles in the Powder River Basin of Wyomingand Montana [9]. Consequently, although about 300 coalbeds were minedin the United States in 1993, nearly half of the coal produced that year wasfrom only the ten seams listed in Table 2-2.
The most important coal deposits in the eastern United States are inthe Appalachian Region, an area that encompasses more than 72,000 squaremiles and parts of nine states (see Figures 1-8 and 2-15). This region containslarge deposits of low- and medium-volatile bituminous coal and the principaldeposits of anthracite. Historically, this region has been the major source ofU.S. coal, accounting for approximately 75% of the total annual productionas recently as 1970 [9]; today the region produces less than 50% of the UnitedStates’ total, with 396 million short tons mined in 2002, with the reductionbeing due to increased coal production in the western United States (seeFigures 2-15 and 2-16). This region, however, is still the principal sourceof bituminous coal and anthracite, and three of the top four coal-producingstates (West Virginia, eastern Kentucky, and Pennsylvania) are found in thisregion. (Note that eastern Kentucky is in the Appalachian Region, whilewestern Kentucky is in the Interior Region.) These states, listed in Table 2-3,are among the top 10 producing states (of the 26 producing coal in 2003),which as a group produced over 85% of the coal in the United States.

42C
oalE
nergy
Systems
Surface724.1
BituminousCoal591.7
Production1093.8
Underground369.7
SubbituminousCoal 421.1
Lignite 77.7
Anthracite2.3
Unknown(1.0) Imports
16.9
Consumption1062.7
Losses andUnaccounted for
8.4
Exports39.6
Residential0.5
Commercial3.9
Industrial85.6
Electric Power 972.6
FIGURE 2-10. Coal flow in the United States in 2002 (million short tons). (Data from Freme, 2002; National MiningAssociation, 2003.)
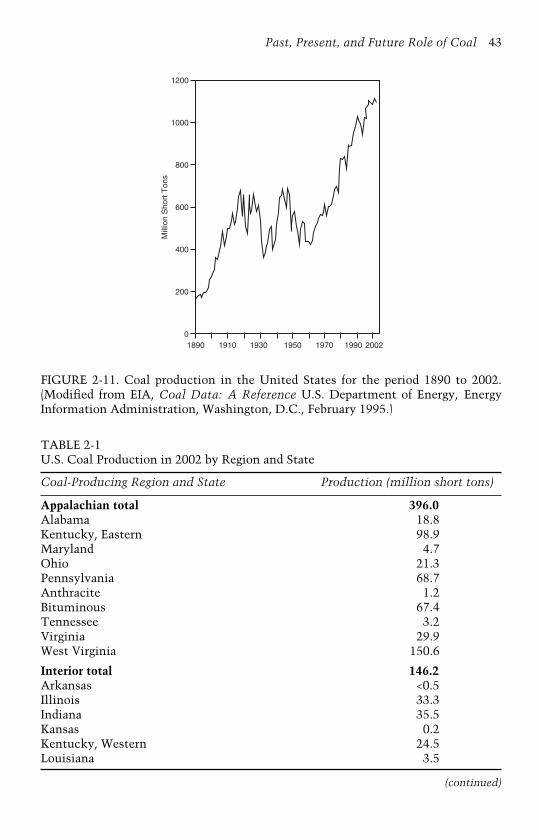
Past, Present, and Future Role of Coal 43
1200
1000
800
600
400
200
01890 1910 1930 1950 1970 1990 2002
Mill
ion
Sho
rt T
ons
FIGURE 2-11. Coal production in the United States for the period 1890 to 2002.(Modified from EIA, Coal Data: A Reference U.S. Department of Energy, EnergyInformation Administration, Washington, D.C., February 1995.)
TABLE 2-1U.S. Coal Production in 2002 by Region and State
Coal-Producing Region and State Production (million short tons)
Appalachian total 396.0Alabama 18.8Kentucky, Eastern 98.9Maryland 4.7Ohio 21.3Pennsylvania 68.7Anthracite 1.2Bituminous 67.4Tennessee 3.2Virginia 29.9West Virginia 150.6
Interior total 146.2Arkansas <0.5Illinois 33.3Indiana 35.5Kansas 0.2Kentucky, Western 24.5Louisiana 3.5
(continued)
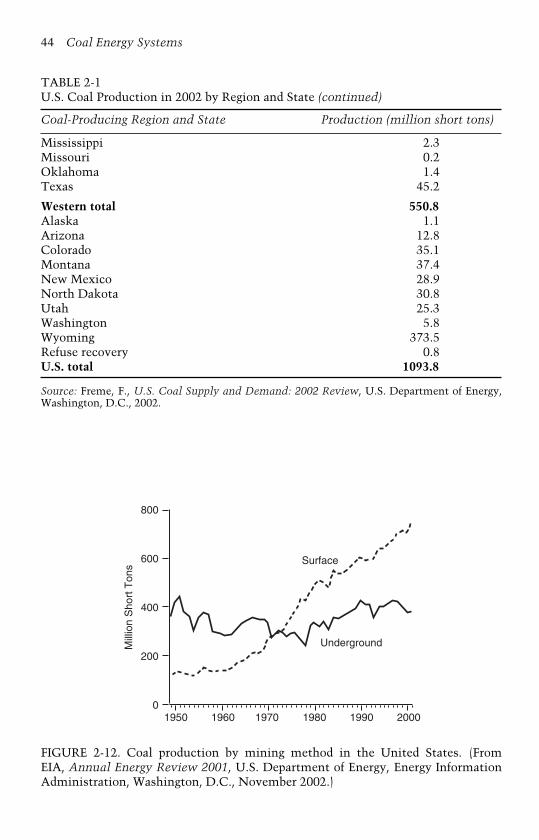
44 Coal Energy Systems
TABLE 2-1U.S. Coal Production in 2002 by Region and State (continued)
Coal-Producing Region and State Production (million short tons)
Mississippi 2.3Missouri 0.2Oklahoma 1.4Texas 45.2
Western total 550.8Alaska 1.1Arizona 12.8Colorado 35.1Montana 37.4New Mexico 28.9North Dakota 30.8Utah 25.3Washington 5.8Wyoming 373.5Refuse recovery 0.8U.S. total 1093.8
Source: Freme, F., U.S. Coal Supply and Demand: 2002 Review, U.S. Department of Energy,Washington, D.C., 2002.
Mill
ion
Sho
rt T
ons
800
600
400
200
01950 1960 1970 1980 1990 2000
Surface
Underground
FIGURE 2-12. Coal production by mining method in the United States. (FromEIA, Annual Energy Review 2001, U.S. Department of Energy, Energy InformationAdministration, Washington, D.C., November 2002.)
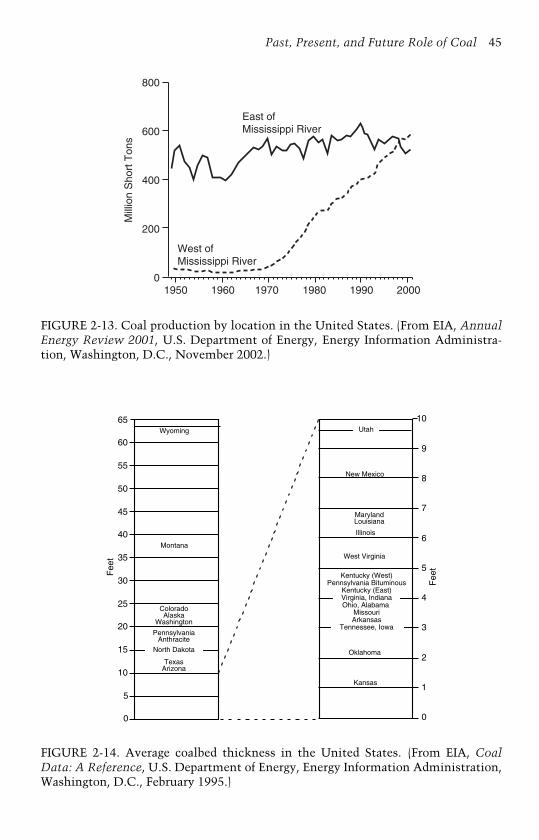
Past, Present, and Future Role of Coal 45
Mill
ion
Sho
rt T
ons
800
600
400
200
01950 1960 1970 1980 1990 2000
East ofMississippi River
West ofMississippi River
FIGURE 2-13. Coal production by location in the United States. (From EIA, AnnualEnergy Review 2001, U.S. Department of Energy, Energy Information Administra-tion, Washington, D.C., November 2002.)
65
60
55
50
45
40
35
30
25
20
15
10
5
0
Wyoming
Montana
ColoradoAlaska
Washington
PennsylvaniaAnthracite
North Dakota
TexasArizona
10
9
8
7
6
5
4
3
2
1
0
Utah
New Mexico
MarylandLouisiana
lIlinois
West Virginia
Kentucky (West)Pennsylvania Bituminous
Kentucky (East)Virginia, IndianaOhio, Alabama
MissouriArkansas
Tennessee, Iowa
Oklahoma
Kansas
Fee
t
Fee
t
FIGURE 2-14. Average coalbed thickness in the United States. (From EIA, CoalData: A Reference, U.S. Department of Energy, Energy Information Administration,Washington, D.C., February 1995.)
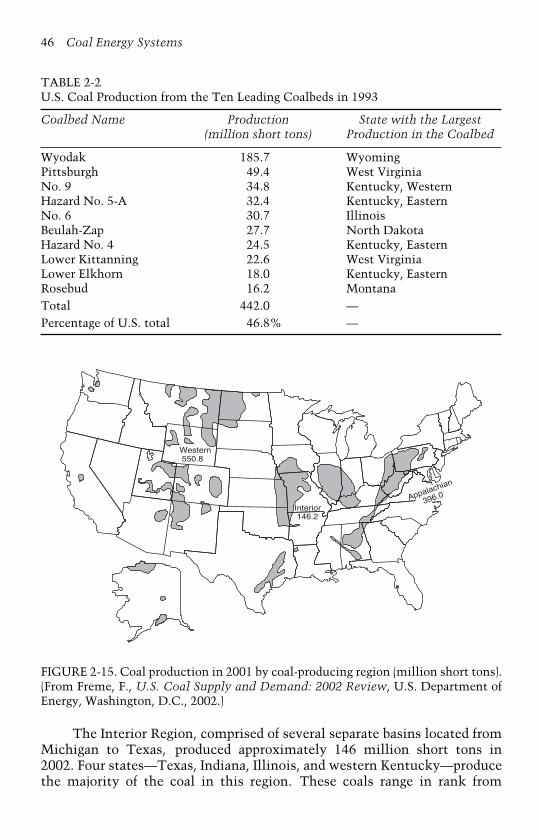
46 Coal Energy Systems
TABLE 2-2U.S. Coal Production from the Ten Leading Coalbeds in 1993
Coalbed Name Production State with the Largest(million short tons) Production in the Coalbed
Wyodak 185.7 WyomingPittsburgh 49.4 West VirginiaNo. 9 34.8 Kentucky, WesternHazard No. 5-A 32.4 Kentucky, EasternNo. 6 30.7 IllinoisBeulah-Zap 27.7 North DakotaHazard No. 4 24.5 Kentucky, EasternLower Kittanning 22.6 West VirginiaLower Elkhorn 18.0 Kentucky, EasternRosebud 16.2 MontanaTotal 442.0 —Percentage of U.S. total 46.8% —
Appalachian
396.0
Western 550.8
Interior 146.2
FIGURE 2-15. Coal production in 2001 by coal-producing region (million short tons).(From Freme, F., U.S. Coal Supply and Demand: 2002 Review, U.S. Department ofEnergy, Washington, D.C., 2002.)
The Interior Region, comprised of several separate basins located fromMichigan to Texas, produced approximately 146 million short tons in2002. Four states—Texas, Indiana, Illinois, and western Kentucky—producethe majority of the coal in this region. These coals range in rank from

Past, Present, and Future Role of Coal 47
Mill
ion
Sho
rt T
ons
1200
1000
800
600
400
200
01993 1994 1995 1996 1997 1998 1999 2000 2001 2002
U.S. Total
WesternAppalachian
Interior
FIGURE 2-16. Coal production by region (1993–2002). (From Freme, F., U.S. CoalSupply and Demand: 2002 Review, U.S. Department of Energy, Washington, D.C.,2002.)
TABLE 2-3Top Ten Coal-Producing States in 2002
State Production (thousand short tons)
Wyoming 373,528West Virginia 150,605Kentucky 123,333Eastern 98,866Western 24,467Pennsylvania 68,667Texas 45,176Montana 37,386Indiana 35,513Colorado 35,103Illinois 33,314North Dakota 30,799Total 933,424Percentage of U.S. total 85.3%
high-volatile bituminous coal in the northern part of the region to lignitein Texas.
The Western Region of the United States has several coal basins thatcontain all ranks of coal. Over half of the coal produced in the United Statescomes from this region; four of the states listed in Table 2-3 (Wyoming,Montana, Colorado, and North Dakota) produce approximately 44% of thetotal coal. Of these, Wyoming is by far the largest coal mining state in the

48 Coal Energy Systems
United States, as it produces approximately 34% of the country’s total coal.Lignite is mined in North Dakota and Montana, subbituminous coal is minedin southeastern Montana and northeastern Wyoming, and the principalbituminous coal mining production is in Utah, Colorado, and Arizona.
Synthetic CoalSynthetic coal, or synfuel, plants have recently assumed a larger share of theindustry picture. The birth of the synfuel industry resulted from the enact-ment of Section 29 of the U.S. Internal Revenue Code of 1986 [14–18]. Thislegislation was enacted as a result of the upheaval in U.S. energy markets bythe Arab oil embargo in 1973. Section 29 provides an income tax credit forfuels produced from nonconventional energy sources until 2007, when thecredit is scheduled to end. In 2002, nearly 83 million tons of coal waste andrun-of-mine coal were produced at more than 40 coal synfuel plants for theutility and industrial markets [12]. This volume is higher than early predic-tions, and it is projected that the quantity of synfuel produced will continueto increase even more, although these credits remain controversial [19–22].The original intent of the legislation, with respect to coal, was to utilizewaste coal and produce a nonconventional fuel such as a pellet. Many syn-fuel operators, however, are processing run-of-mine coal by simply sprayingit with petroleum mixtures or emulsions, thus qualifying for the tax credit[19]. The ensuing controversy is centered on allegations of unfair competitionwith coal producers; consequently, while some form of tax credit programencouraging the development of alternative fuels will likely be institutedafter 2007, standards for qualifying for the tax credit are expected to be morerigorous than the current ones [18].
Coal Consumption in the United States
Coal is used in all 50 states and the District of Columbia. In 2000, ten statesconsumed approximately 45% of the total coal produced in the United States(see Table 2-4). In 2002, most of the coal was consumed in the electric powersector, as shown in Figures 2-10 and 2-17. Nearly 92% of all coal consumedin 2002 was in the electric power sector, which includes both the electricutilities and independent power producers. Following is a breakdown, bysector, for coal consumption in 2002 (in 1000 short tons):
• Electric utilities—777,263;• Other power producers—195,415;• Coking—22,537;• Other industrial—63,077;• Residential/commercial—4369;• Total—1,062,662.

Past, Present, and Future Role of Coal 49
TABLE 2-4Top Ten Coal-Consuming States in 2000
State Consumption (thousand short tons)
Texas 101,579Indiana 70,583Ohio 59,348Alabama 39,797West Virginia 39,000Missouri 38,301Kentucky 37,586Michigan 36,298Georgia 35,150North Dakota 31,902
Total 489,544
Percentage of U.S. total 45.3%
Mill
ion
Sho
rt T
ons
1200
1000
800
600
400
200
01993 1994 1995 1996 1997 1998 1999 2000 2001 2002
U.S. Total
Coke PlantsResidential and Commercial
and Other Industrial
Electric Power
FIGURE 2-17. Coal consumption by sector (1993–2002). (From Freme, F., U.S. CoalSupply and Demand: 2002 Review, U.S. Department of Energy, Washington, D.C.,2002.)
The resurgence in coal consumption, after decreasing around 1950 (seeFigures 2-1 and 2-9), was driven by the Arab oil embargo in the first half ofthe 1970s, which caused significant price increases for petroleum, and bya natural gas shortage in the second half of the 1970s. Virtually all of thisgrowth was due to the increasing amounts of coal used to generate electric-ity, and coal became the dominant energy source in the electrical powerindustry. Nearly 50% of the electricity generated in the United States in2002 was from coal, as illustrated in Figure 2-18; however, in 2002, coal’sshare of electricity generation dropped below 50% for the first time since
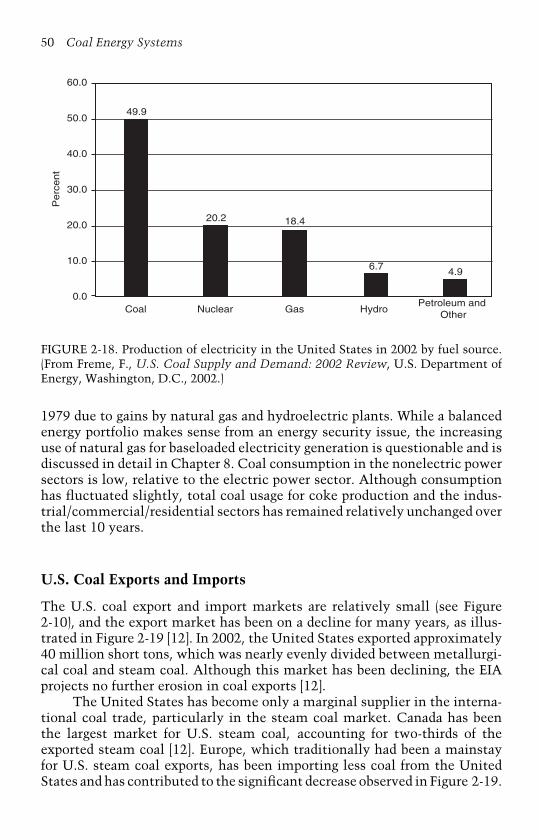
50 Coal Energy Systems
60.0
50.0
40.0
30.0
20.0
10.0
0.0Nuclear HydroGas
Petroleum and OtherCoal
20.2
6.7
18.4
4.9
49.9
Perc
ent
FIGURE 2-18. Production of electricity in the United States in 2002 by fuel source.(From Freme, F., U.S. Coal Supply and Demand: 2002 Review, U.S. Department ofEnergy, Washington, D.C., 2002.)
1979 due to gains by natural gas and hydroelectric plants. While a balancedenergy portfolio makes sense from an energy security issue, the increasinguse of natural gas for baseloaded electricity generation is questionable and isdiscussed in detail in Chapter 8. Coal consumption in the nonelectric powersectors is low, relative to the electric power sector. Although consumptionhas fluctuated slightly, total coal usage for coke production and the indus-trial/commercial/residential sectors has remained relatively unchanged overthe last 10 years.
U.S. Coal Exports and Imports
The U.S. coal export and import markets are relatively small (see Figure2-10), and the export market has been on a decline for many years, as illus-trated in Figure 2-19 [12]. In 2002, the United States exported approximately40 million short tons, which was nearly evenly divided between metallurgi-cal coal and steam coal. Although this market has been declining, the EIAprojects no further erosion in coal exports [12].
The United States has become only a marginal supplier in the interna-tional coal trade, particularly in the steam coal market. Canada has beenthe largest market for U.S. steam coal, accounting for two-thirds of theexported steam coal [12]. Europe, which traditionally had been a mainstayfor U.S. steam coal exports, has been importing less coal from the UnitedStates and has contributed to the significant decrease observed in Figure 2-19.
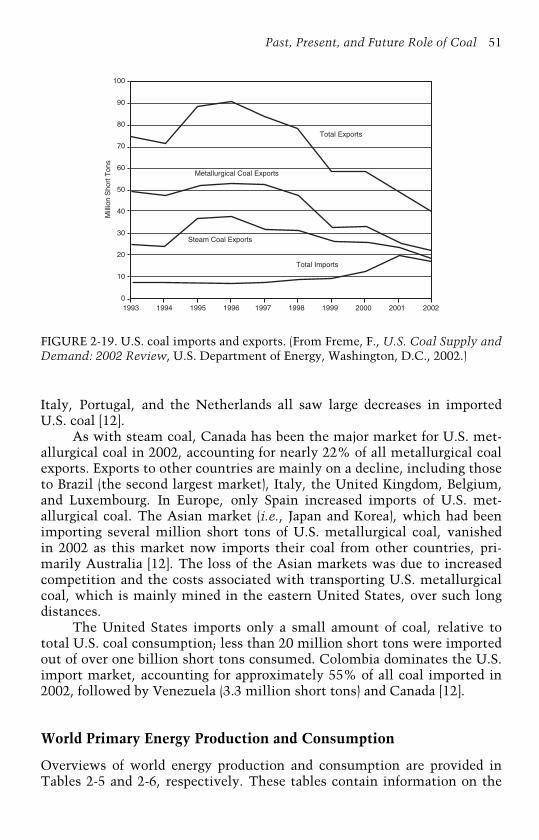
Past, Present, and Future Role of Coal 51
100
90
80
70
60
50
40
30
20
10
01993 1994 1995 1996 1997 1998 1999 2000 2001 2002
Total Exports
Total Imports
Steam Coal Exports
Metallurgical Coal Exports
Mill
ion
Sho
rt T
ons
FIGURE 2-19. U.S. coal imports and exports. (From Freme, F., U.S. Coal Supply andDemand: 2002 Review, U.S. Department of Energy, Washington, D.C., 2002.)
Italy, Portugal, and the Netherlands all saw large decreases in importedU.S. coal [12].
As with steam coal, Canada has been the major market for U.S. met-allurgical coal in 2002, accounting for nearly 22% of all metallurgical coalexports. Exports to other countries are mainly on a decline, including thoseto Brazil (the second largest market), Italy, the United Kingdom, Belgium,and Luxembourg. In Europe, only Spain increased imports of U.S. met-allurgical coal. The Asian market (i.e., Japan and Korea), which had beenimporting several million short tons of U.S. metallurgical coal, vanishedin 2002 as this market now imports their coal from other countries, pri-marily Australia [12]. The loss of the Asian markets was due to increasedcompetition and the costs associated with transporting U.S. metallurgicalcoal, which is mainly mined in the eastern United States, over such longdistances.
The United States imports only a small amount of coal, relative tototal U.S. coal consumption; less than 20 million short tons were importedout of over one billion short tons consumed. Colombia dominates the U.S.import market, accounting for approximately 55% of all coal imported in2002, followed by Venezuela (3.3 million short tons) and Canada [12].
World Primary Energy Production and Consumption
Overviews of world energy production and consumption are provided inTables 2-5 and 2-6, respectively. These tables contain information on the
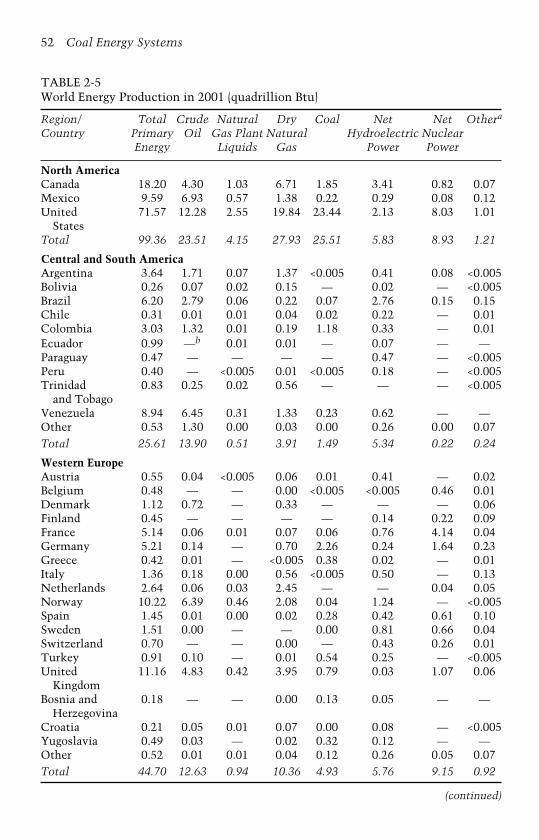
52 Coal Energy Systems
TABLE 2-5World Energy Production in 2001 (quadrillion Btu)
Region/ Total Crude Natural Dry Coal Net Net Othera
Country Primary Oil Gas Plant Natural Hydroelectric NuclearEnergy Liquids Gas Power Power
North AmericaCanada 18.20 4.30 1.03 6.71 1.85 3.41 0.82 0.07Mexico 9.59 6.93 0.57 1.38 0.22 0.29 0.08 0.12United
States71.57 12.28 2.55 19.84 23.44 2.13 8.03 1.01
Total 99.36 23.51 4.15 27.93 25.51 5.83 8.93 1.21
Central and South AmericaArgentina 3.64 1.71 0.07 1.37 <0.005 0.41 0.08 <0.005Bolivia 0.26 0.07 0.02 0.15 — 0.02 — <0.005Brazil 6.20 2.79 0.06 0.22 0.07 2.76 0.15 0.15Chile 0.31 0.01 0.01 0.04 0.02 0.22 — 0.01Colombia 3.03 1.32 0.01 0.19 1.18 0.33 — 0.01Ecuador 0.99 —b 0.01 0.01 — 0.07 — —Paraguay 0.47 — — — — 0.47 — <0.005Peru 0.40 — <0.005 0.01 <0.005 0.18 — <0.005Trinidad
and Tobago0.83 0.25 0.02 0.56 — — — <0.005
Venezuela 8.94 6.45 0.31 1.33 0.23 0.62 — —Other 0.53 1.30 0.00 0.03 0.00 0.26 0.00 0.07Total 25.61 13.90 0.51 3.91 1.49 5.34 0.22 0.24
Western EuropeAustria 0.55 0.04 <0.005 0.06 0.01 0.41 — 0.02Belgium 0.48 — — 0.00 <0.005 <0.005 0.46 0.01Denmark 1.12 0.72 — 0.33 — — — 0.06Finland 0.45 — — — — 0.14 0.22 0.09France 5.14 0.06 0.01 0.07 0.06 0.76 4.14 0.04Germany 5.21 0.14 — 0.70 2.26 0.24 1.64 0.23Greece 0.42 0.01 — <0.005 0.38 0.02 — 0.01Italy 1.36 0.18 0.00 0.56 <0.005 0.50 — 0.13Netherlands 2.64 0.06 0.03 2.45 — — 0.04 0.05Norway 10.22 6.39 0.46 2.08 0.04 1.24 — <0.005Spain 1.45 0.01 0.00 0.02 0.28 0.42 0.61 0.10Sweden 1.51 0.00 — — 0.00 0.81 0.66 0.04Switzerland 0.70 — — 0.00 — 0.43 0.26 0.01Turkey 0.91 0.10 — 0.01 0.54 0.25 — <0.005United
Kingdom11.16 4.83 0.42 3.95 0.79 0.03 1.07 0.06
Bosnia andHerzegovina
0.18 — — 0.00 0.13 0.05 — —
Croatia 0.21 0.05 0.01 0.07 0.00 0.08 — <0.005Yugoslavia 0.49 0.03 — 0.02 0.32 0.12 — —Other 0.52 0.01 0.01 0.04 0.12 0.26 0.05 0.07Total 44.70 12.63 0.94 10.36 4.93 5.76 9.15 0.92
(continued)
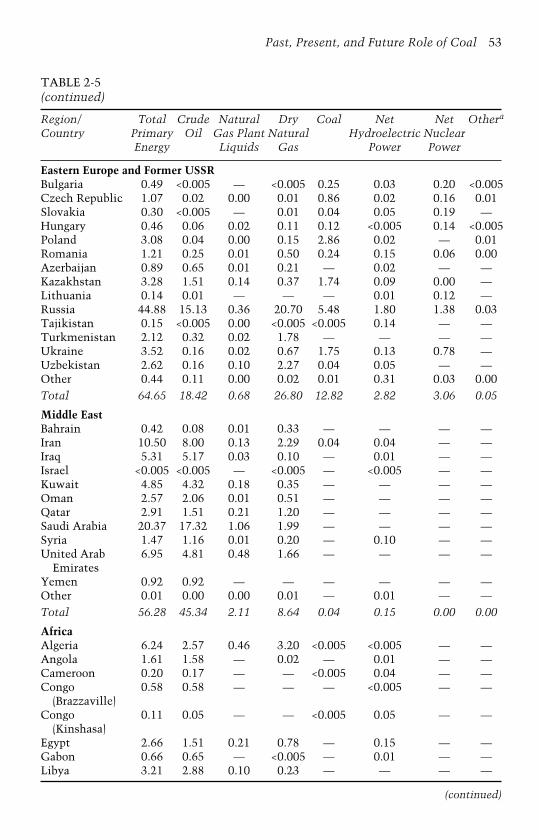
Past, Present, and Future Role of Coal 53
TABLE 2-5(continued)
Region/ Total Crude Natural Dry Coal Net Net Othera
Country Primary Oil Gas Plant Natural Hydroelectric NuclearEnergy Liquids Gas Power Power
Eastern Europe and Former USSRBulgaria 0.49 <0.005 — <0.005 0.25 0.03 0.20 <0.005Czech Republic 1.07 0.02 0.00 0.01 0.86 0.02 0.16 0.01Slovakia 0.30 <0.005 — 0.01 0.04 0.05 0.19 —Hungary 0.46 0.06 0.02 0.11 0.12 <0.005 0.14 <0.005Poland 3.08 0.04 0.00 0.15 2.86 0.02 — 0.01Romania 1.21 0.25 0.01 0.50 0.24 0.15 0.06 0.00Azerbaijan 0.89 0.65 0.01 0.21 — 0.02 — —Kazakhstan 3.28 1.51 0.14 0.37 1.74 0.09 0.00 —Lithuania 0.14 0.01 — — — 0.01 0.12 —Russia 44.88 15.13 0.36 20.70 5.48 1.80 1.38 0.03Tajikistan 0.15 <0.005 0.00 <0.005 <0.005 0.14 — —Turkmenistan 2.12 0.32 0.02 1.78 — — — —Ukraine 3.52 0.16 0.02 0.67 1.75 0.13 0.78 —Uzbekistan 2.62 0.16 0.10 2.27 0.04 0.05 — —Other 0.44 0.11 0.00 0.02 0.01 0.31 0.03 0.00Total 64.65 18.42 0.68 26.80 12.82 2.82 3.06 0.05
Middle EastBahrain 0.42 0.08 0.01 0.33 — — — —Iran 10.50 8.00 0.13 2.29 0.04 0.04 — —Iraq 5.31 5.17 0.03 0.10 — 0.01 — —Israel <0.005 <0.005 — <0.005 — <0.005 — —Kuwait 4.85 4.32 0.18 0.35 — — — —Oman 2.57 2.06 0.01 0.51 — — — —Qatar 2.91 1.51 0.21 1.20 — — — —Saudi Arabia 20.37 17.32 1.06 1.99 — — — —Syria 1.47 1.16 0.01 0.20 — 0.10 — —United Arab
Emirates6.95 4.81 0.48 1.66 — — — —
Yemen 0.92 0.92 — — — — — —Other 0.01 0.00 0.00 0.01 — 0.01 — —Total 56.28 45.34 2.11 8.64 0.04 0.15 0.00 0.00
AfricaAlgeria 6.24 2.57 0.46 3.20 <0.005 <0.005 — —Angola 1.61 1.58 — 0.02 — 0.01 — —Cameroon 0.20 0.17 — — <0.005 0.04 — —Congo
(Brazzaville)0.58 0.58 — — — <0.005 — —
Congo(Kinshasa)
0.11 0.05 — — <0.005 0.05 — —
Egypt 2.66 1.51 0.21 0.78 — 0.15 — —Gabon 0.66 0.65 — <0.005 — 0.01 — —Libya 3.21 2.88 0.10 0.23 — — — —
(continued)
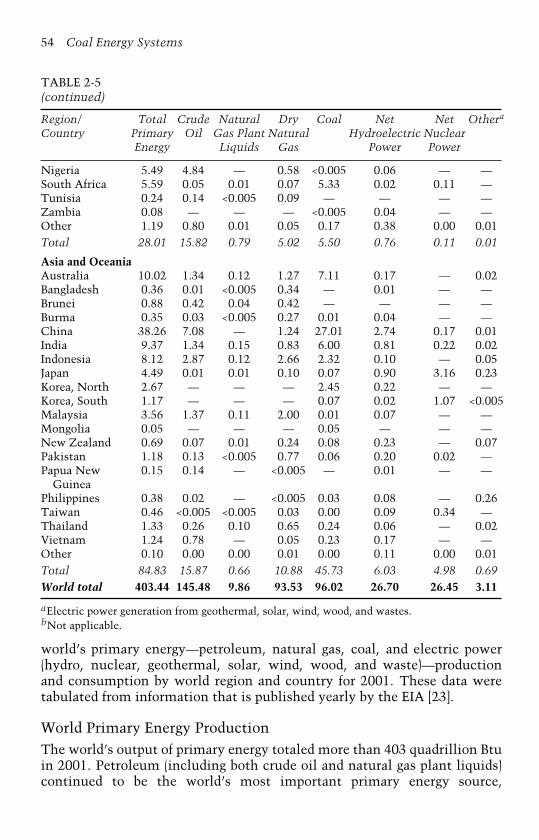
54 Coal Energy Systems
TABLE 2-5(continued)
Region/ Total Crude Natural Dry Coal Net Net Othera
Country Primary Oil Gas Plant Natural Hydroelectric NuclearEnergy Liquids Gas Power Power
Nigeria 5.49 4.84 — 0.58 <0.005 0.06 — —South Africa 5.59 0.05 0.01 0.07 5.33 0.02 0.11 —Tunisia 0.24 0.14 <0.005 0.09 — — — —Zambia 0.08 — — — <0.005 0.04 — —Other 1.19 0.80 0.01 0.05 0.17 0.38 0.00 0.01Total 28.01 15.82 0.79 5.02 5.50 0.76 0.11 0.01
Asia and OceaniaAustralia 10.02 1.34 0.12 1.27 7.11 0.17 — 0.02Bangladesh 0.36 0.01 <0.005 0.34 — 0.01 — —Brunei 0.88 0.42 0.04 0.42 — — — —Burma 0.35 0.03 <0.005 0.27 0.01 0.04 — —China 38.26 7.08 — 1.24 27.01 2.74 0.17 0.01India 9.37 1.34 0.15 0.83 6.00 0.81 0.22 0.02Indonesia 8.12 2.87 0.12 2.66 2.32 0.10 — 0.05Japan 4.49 0.01 0.01 0.10 0.07 0.90 3.16 0.23Korea, North 2.67 — — — 2.45 0.22 — —Korea, South 1.17 — — — 0.07 0.02 1.07 <0.005Malaysia 3.56 1.37 0.11 2.00 0.01 0.07 — —Mongolia 0.05 — — — 0.05 — — —New Zealand 0.69 0.07 0.01 0.24 0.08 0.23 — 0.07Pakistan 1.18 0.13 <0.005 0.77 0.06 0.20 0.02 —Papua New
Guinea0.15 0.14 — <0.005 — 0.01 — —
Philippines 0.38 0.02 — <0.005 0.03 0.08 — 0.26Taiwan 0.46 <0.005 <0.005 0.03 0.00 0.09 0.34 —Thailand 1.33 0.26 0.10 0.65 0.24 0.06 — 0.02Vietnam 1.24 0.78 — 0.05 0.23 0.17 — —Other 0.10 0.00 0.00 0.01 0.00 0.11 0.00 0.01Total 84.83 15.87 0.66 10.88 45.73 6.03 4.98 0.69World total 403.44 145.48 9.86 93.53 96.02 26.70 26.45 3.11
aElectric power generation from geothermal, solar, wind, wood, and wastes.bNot applicable.
world’s primary energy—petroleum, natural gas, coal, and electric power(hydro, nuclear, geothermal, solar, wind, wood, and waste)—productionand consumption by world region and country for 2001. These data weretabulated from information that is published yearly by the EIA [23].
World Primary Energy ProductionThe world’s output of primary energy totaled more than 403 quadrillion Btuin 2001. Petroleum (including both crude oil and natural gas plant liquids)continued to be the world’s most important primary energy source,

Past, Present, and Future Role of Coal 55
TABLE 2-6World Energy Consumption in 2001 (quadrillion Btu)
Region/ Total Petroleum Dry Coal Net Net Othera
Country Primary Natural Hydroelectric NuclearEnergy Gas Power Power
North AmericaCanada 12.51 3.79 2.95 1.69 3.41 0.82 0.07Mexico 6.00 3.77 1.45 0.27 0.29 0.08 0.12United States 97.05 38.33 23.22 21.97 2.29 8.03 1.01Other 0.02 0.02 —b — — — —Total 115.58 45.92 27.63 23.93 5.99 8.93 1.21
Central and South AmericaArgentina 2.66 0.99 1.15 0.02 0.41 0.08 <0.005Brazil 8.78 4.46 0.35 0.52 2.76 0.15 0.15Chile 1.06 0.49 0.24 0.09 0.22 — 0.01Colombia 1.13 0.50 0.19 0.11 0.33 — 0.01Cuba 0.39 0.36 0.02 <0.005 — — 0.01Venezuela 2.95 0.13 1.33 <0.005 0.62 — —Other 3.93 3.59 0.52 0.06 1.00 0.00 0.06Total 20.92 10.52 3.80 0.80 5.34 0.22 0.24
Western EuropeAustria 1.42 0.55 0.29 0.14 0.41 — 0.02Belgium 2.77 1.26 0.58 0.36 <0.005 0.46 0.01Denmark 0.90 0.45 0.21 0.17 — — 0.06Finland 1.33 0.44 0.16 0.17 0.14 0.22 0.09France 10.52 4.20 1.61 0.48 0.76 4.14 0.04Germany 14.35 5.82 3.27 3.15 0.24 1.64 0.23Greece 1.39 0.85 0.07 0.41 0.02 — 0.01Ireland 0.61 0.36 0.16 0.08 0.01 — <0.005Italy 8.11 3.88 2.57 0.54 0.50 — 0.13Netherlands 4.23 1.88 1.57 0.51 — 0.04 0.05Norway 1.91 0.40 0.16 0.07 1.24 — <0.005Portugal 1.09 0.70 0.10 0.12 0.14 — 0.02Spain 5.70 0.70 0.72 0.68 0.42 0.61 0.10Sweden 2.22 0.67 0.03 0.09 0.81 0.66 0.04Switzerland 1.30 0.59 0.11 0.01 0.43 0.26 0.01Turkey 2.89 1.25 0.59 0.76 0.25 — <0.005United
Kingdom9.81 3.45 3.47 1.63 0.03 1.07 0.06
Croatia 0.43 0.19 0.11 0.02 0.08 — —Yugoslavia 0.63 0.13 0.02 0.32 0.12 — —Other 1.15 2.93 0.10 0.27 0.16 0.05 0.05Total 72.76 30.70 15.90 9.98 5.76 9.15 0.92
(continued)
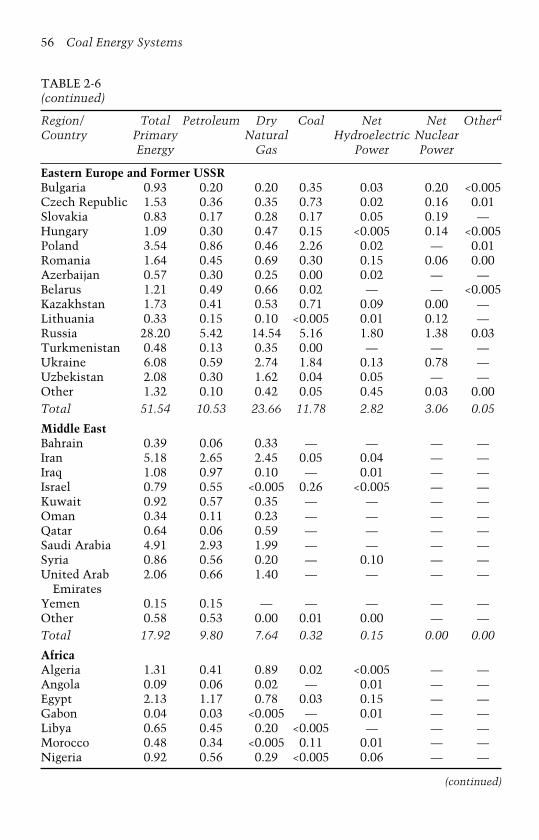
56 Coal Energy Systems
TABLE 2-6(continued)
Region/ Total Petroleum Dry Coal Net Net Othera
Country Primary Natural Hydroelectric NuclearEnergy Gas Power Power
Eastern Europe and Former USSRBulgaria 0.93 0.20 0.20 0.35 0.03 0.20 <0.005Czech Republic 1.53 0.36 0.35 0.73 0.02 0.16 0.01Slovakia 0.83 0.17 0.28 0.17 0.05 0.19 —Hungary 1.09 0.30 0.47 0.15 <0.005 0.14 <0.005Poland 3.54 0.86 0.46 2.26 0.02 — 0.01Romania 1.64 0.45 0.69 0.30 0.15 0.06 0.00Azerbaijan 0.57 0.30 0.25 0.00 0.02 — —Belarus 1.21 0.49 0.66 0.02 — — <0.005Kazakhstan 1.73 0.41 0.53 0.71 0.09 0.00 —Lithuania 0.33 0.15 0.10 <0.005 0.01 0.12 —Russia 28.20 5.42 14.54 5.16 1.80 1.38 0.03Turkmenistan 0.48 0.13 0.35 0.00 — — —Ukraine 6.08 0.59 2.74 1.84 0.13 0.78 —Uzbekistan 2.08 0.30 1.62 0.04 0.05 — —Other 1.32 0.10 0.42 0.05 0.45 0.03 0.00Total 51.54 10.53 23.66 11.78 2.82 3.06 0.05
Middle EastBahrain 0.39 0.06 0.33 — — — —Iran 5.18 2.65 2.45 0.05 0.04 — —Iraq 1.08 0.97 0.10 — 0.01 — —Israel 0.79 0.55 <0.005 0.26 <0.005 — —Kuwait 0.92 0.57 0.35 — — — —Oman 0.34 0.11 0.23 — — — —Qatar 0.64 0.06 0.59 — — — —Saudi Arabia 4.91 2.93 1.99 — — — —Syria 0.86 0.56 0.20 — 0.10 — —United Arab
Emirates2.06 0.66 1.40 — — — —
Yemen 0.15 0.15 — — — — —Other 0.58 0.53 0.00 0.01 0.00 — —Total 17.92 9.80 7.64 0.32 0.15 0.00 0.00
AfricaAlgeria 1.31 0.41 0.89 0.02 <0.005 — —Angola 0.09 0.06 0.02 — 0.01 — —Egypt 2.13 1.17 0.78 0.03 0.15 — —Gabon 0.04 0.03 <0.005 — 0.01 — —Libya 0.65 0.45 0.20 <0.005 — — —Morocco 0.48 0.34 <0.005 0.11 0.01 — —Nigeria 0.92 0.56 0.29 <0.005 0.06 — —
(continued)
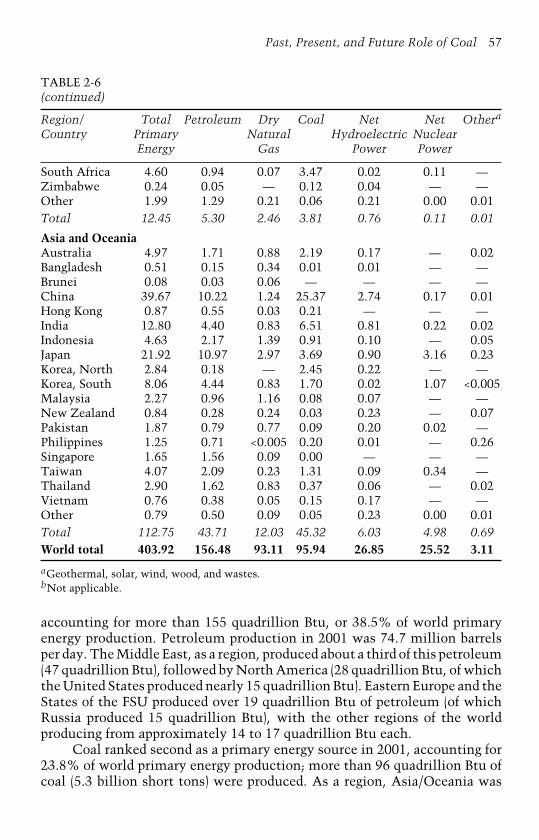
Past, Present, and Future Role of Coal 57
TABLE 2-6(continued)
Region/ Total Petroleum Dry Coal Net Net Othera
Country Primary Natural Hydroelectric NuclearEnergy Gas Power Power
South Africa 4.60 0.94 0.07 3.47 0.02 0.11 —Zimbabwe 0.24 0.05 — 0.12 0.04 — —Other 1.99 1.29 0.21 0.06 0.21 0.00 0.01Total 12.45 5.30 2.46 3.81 0.76 0.11 0.01
Asia and OceaniaAustralia 4.97 1.71 0.88 2.19 0.17 — 0.02Bangladesh 0.51 0.15 0.34 0.01 0.01 — —Brunei 0.08 0.03 0.06 — — — —China 39.67 10.22 1.24 25.37 2.74 0.17 0.01Hong Kong 0.87 0.55 0.03 0.21 — — —India 12.80 4.40 0.83 6.51 0.81 0.22 0.02Indonesia 4.63 2.17 1.39 0.91 0.10 — 0.05Japan 21.92 10.97 2.97 3.69 0.90 3.16 0.23Korea, North 2.84 0.18 — 2.45 0.22 — —Korea, South 8.06 4.44 0.83 1.70 0.02 1.07 <0.005Malaysia 2.27 0.96 1.16 0.08 0.07 — —New Zealand 0.84 0.28 0.24 0.03 0.23 — 0.07Pakistan 1.87 0.79 0.77 0.09 0.20 0.02 —Philippines 1.25 0.71 <0.005 0.20 0.01 — 0.26Singapore 1.65 1.56 0.09 0.00 — — —Taiwan 4.07 2.09 0.23 1.31 0.09 0.34 —Thailand 2.90 1.62 0.83 0.37 0.06 — 0.02Vietnam 0.76 0.38 0.05 0.15 0.17 — —Other 0.79 0.50 0.09 0.05 0.23 0.00 0.01Total 112.75 43.71 12.03 45.32 6.03 4.98 0.69World total 403.92 156.48 93.11 95.94 26.85 25.52 3.11
aGeothermal, solar, wind, wood, and wastes.bNot applicable.
accounting for more than 155 quadrillion Btu, or 38.5% of world primaryenergy production. Petroleum production in 2001 was 74.7 million barrelsper day. The Middle East, as a region, produced about a third of this petroleum(47 quadrillion Btu), followed by North America (28 quadrillion Btu, of whichthe United States produced nearly 15 quadrillion Btu). Eastern Europe and theStates of the FSU produced over 19 quadrillion Btu of petroleum (of whichRussia produced 15 quadrillion Btu), with the other regions of the worldproducing from approximately 14 to 17 quadrillion Btu each.
Coal ranked second as a primary energy source in 2001, accounting for23.8% of world primary energy production; more than 96 quadrillion Btu ofcoal (5.3 billion short tons) were produced. As a region, Asia/Oceania was
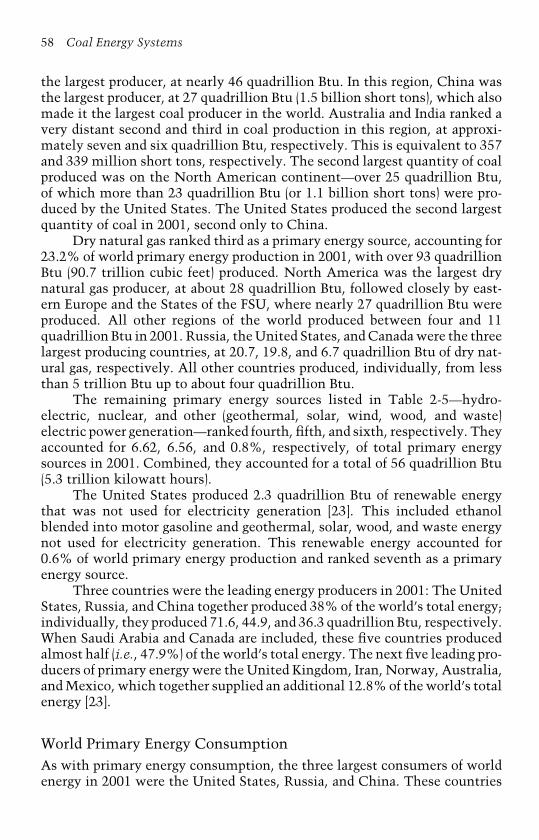
58 Coal Energy Systems
the largest producer, at nearly 46 quadrillion Btu. In this region, China wasthe largest producer, at 27 quadrillion Btu (1.5 billion short tons), which alsomade it the largest coal producer in the world. Australia and India ranked avery distant second and third in coal production in this region, at approxi-mately seven and six quadrillion Btu, respectively. This is equivalent to 357and 339 million short tons, respectively. The second largest quantity of coalproduced was on the North American continent—over 25 quadrillion Btu,of which more than 23 quadrillion Btu (or 1.1 billion short tons) were pro-duced by the United States. The United States produced the second largestquantity of coal in 2001, second only to China.
Dry natural gas ranked third as a primary energy source, accounting for23.2% of world primary energy production in 2001, with over 93 quadrillionBtu (90.7 trillion cubic feet) produced. North America was the largest drynatural gas producer, at about 28 quadrillion Btu, followed closely by east-ern Europe and the States of the FSU, where nearly 27 quadrillion Btu wereproduced. All other regions of the world produced between four and 11quadrillion Btu in 2001. Russia, the United States, and Canada were the threelargest producing countries, at 20.7, 19.8, and 6.7 quadrillion Btu of dry nat-ural gas, respectively. All other countries produced, individually, from lessthan 5 trillion Btu up to about four quadrillion Btu.
The remaining primary energy sources listed in Table 2-5—hydro-electric, nuclear, and other (geothermal, solar, wind, wood, and waste)electric power generation—ranked fourth, fifth, and sixth, respectively. Theyaccounted for 6.62, 6.56, and 0.8%, respectively, of total primary energysources in 2001. Combined, they accounted for a total of 56 quadrillion Btu(5.3 trillion kilowatt hours).
The United States produced 2.3 quadrillion Btu of renewable energythat was not used for electricity generation [23]. This included ethanolblended into motor gasoline and geothermal, solar, wood, and waste energynot used for electricity generation. This renewable energy accounted for0.6% of world primary energy production and ranked seventh as a primaryenergy source.
Three countries were the leading energy producers in 2001: The UnitedStates, Russia, and China together produced 38% of the world’s total energy;individually, they produced 71.6, 44.9, and 36.3 quadrillion Btu, respectively.When Saudi Arabia and Canada are included, these five countries producedalmost half (i.e., 47.9%) of the world’s total energy. The next five leading pro-ducers of primary energy were the United Kingdom, Iran, Norway, Australia,and Mexico, which together supplied an additional 12.8% of the world’s totalenergy [23].
World Primary Energy ConsumptionAs with primary energy consumption, the three largest consumers of worldenergy in 2001 were the United States, Russia, and China. These countries

Past, Present, and Future Role of Coal 59
consumed approximately 97, 28, and 40 quadrillion Btu, respectively, in2001, accounting for about 41% of the world’s total energy consumed. WhenJapan and Germany are included, the five largest consumers of primaryenergy in 2001 accounted for nearly 50% of the world’s total. The next fiveleading consumers were India, Canada, France, the United Kingdom, andBrazil, which together accounted for an additional 13.5% of world energyconsumption [23].
The United States consumed over 97 quadrillion Btu, by far the mostof any country; however, on a per capita basis, Kuwait was the largest con-sumer in the world, with 467 million Btu consumed per person, followed byCanada (403 million Btu/person), the United States (342 million Btu/person),
TABLE 2-7Per Capita Primary Energy Consumption in 2001
Region/ Energy Population Per Capita EnergyCountry Consumption (millions) Consumption
(Quadrillion Btu) (million Btu/person)
North America 115.58 416.93 277.2United States 97.05 283.97 341.8Canada 12.51 31.08 402.5Mexico 6.00 101.75 59.0
Central and SouthAmerica
20.92 426.20 49.1
Brazil 8.78 172.39 50.9Venezuela 2.95 24.63 119.8Cuba 0.39 11.22 34.8
Western Europe 72.76 482.42 150.8France 10.52 59.19 177.7Germany 14.35 82.36 174.2United Kingdom 9.81 59.54 164.8Italy 8.11 57.95 139.9Netherlands 4.23 16.04 263.7Portugal 1.09 10.02 108.8Denmark 0.90 5.33 168.9Croatia 0.63 4.66 135.2
Eastern Europe andFormer USSR
51.54 386.25 133.4
Russia 28.20 144.40 195.3Ukraine 6.08 49.11 123.8Poland 3.54 38.64 91.6Hungary 1.09 9.92 109.9Turkmenistan 0.48 4.88 98.4Lithuania 0.33 3.49 94.6
(continued)
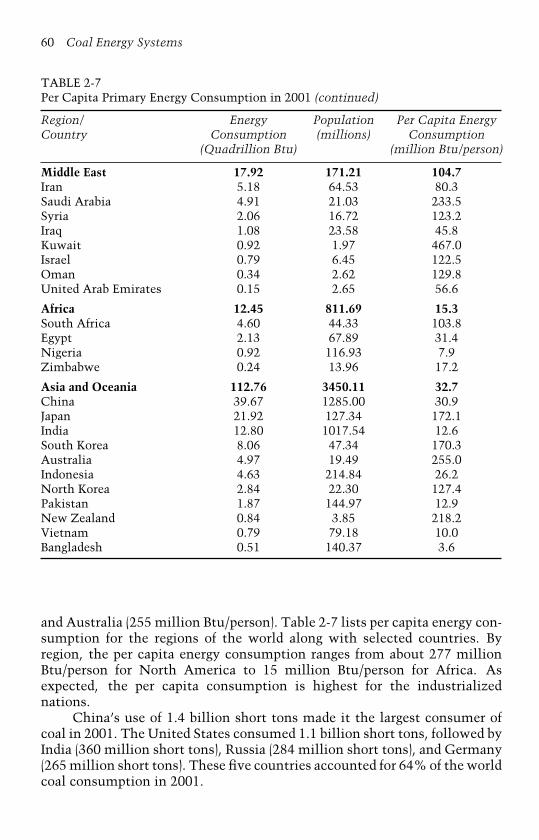
60 Coal Energy Systems
TABLE 2-7Per Capita Primary Energy Consumption in 2001 (continued)
Region/ Energy Population Per Capita EnergyCountry Consumption (millions) Consumption
(Quadrillion Btu) (million Btu/person)
Middle East 17.92 171.21 104.7Iran 5.18 64.53 80.3Saudi Arabia 4.91 21.03 233.5Syria 2.06 16.72 123.2Iraq 1.08 23.58 45.8Kuwait 0.92 1.97 467.0Israel 0.79 6.45 122.5Oman 0.34 2.62 129.8United Arab Emirates 0.15 2.65 56.6
Africa 12.45 811.69 15.3South Africa 4.60 44.33 103.8Egypt 2.13 67.89 31.4Nigeria 0.92 116.93 7.9Zimbabwe 0.24 13.96 17.2
Asia and Oceania 112.76 3450.11 32.7China 39.67 1285.00 30.9Japan 21.92 127.34 172.1India 12.80 1017.54 12.6South Korea 8.06 47.34 170.3Australia 4.97 19.49 255.0Indonesia 4.63 214.84 26.2North Korea 2.84 22.30 127.4Pakistan 1.87 144.97 12.9New Zealand 0.84 3.85 218.2Vietnam 0.79 79.18 10.0Bangladesh 0.51 140.37 3.6
and Australia (255 million Btu/person). Table 2-7 lists per capita energy con-sumption for the regions of the world along with selected countries. Byregion, the per capita energy consumption ranges from about 277 millionBtu/person for North America to 15 million Btu/person for Africa. Asexpected, the per capita consumption is highest for the industrializednations.
China’s use of 1.4 billion short tons made it the largest consumer ofcoal in 2001. The United States consumed 1.1 billion short tons, followed byIndia (360 million short tons), Russia (284 million short tons), and Germany(265 million short tons). These five countries accounted for 64% of the worldcoal consumption in 2001.
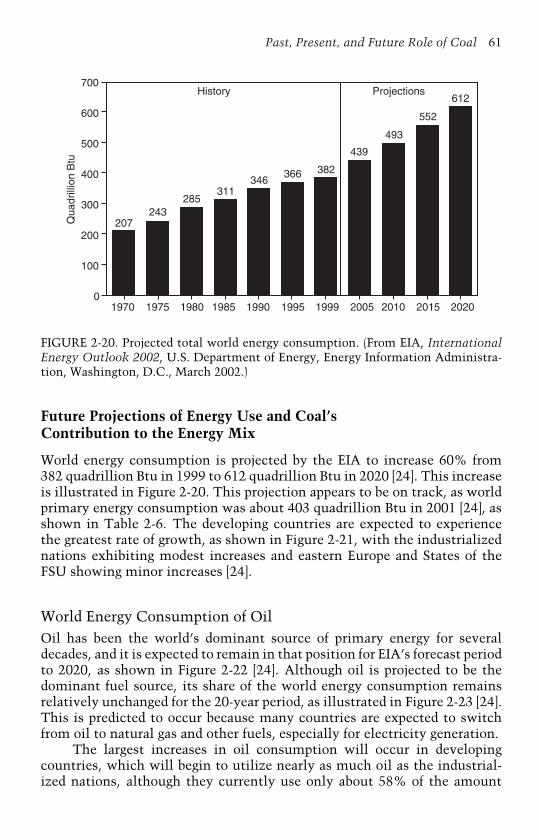
Past, Present, and Future Role of Coal 61
700
600
500
400
300
200
100
0
207243
285311
346366 382
439
493
552
612History Projections
1970 1975 1980 1985 1990 1995 1999 2005 2010 2015 2020
Qua
drill
ion
Btu
FIGURE 2-20. Projected total world energy consumption. (From EIA, InternationalEnergy Outlook 2002, U.S. Department of Energy, Energy Information Administra-tion, Washington, D.C., March 2002.)
Future Projections of Energy Use and Coal’sContribution to the Energy Mix
World energy consumption is projected by the EIA to increase 60% from382 quadrillion Btu in 1999 to 612 quadrillion Btu in 2020 [24]. This increaseis illustrated in Figure 2-20. This projection appears to be on track, as worldprimary energy consumption was about 403 quadrillion Btu in 2001 [24], asshown in Table 2-6. The developing countries are expected to experiencethe greatest rate of growth, as shown in Figure 2-21, with the industrializednations exhibiting modest increases and eastern Europe and States of theFSU showing minor increases [24].
World Energy Consumption of OilOil has been the world’s dominant source of primary energy for severaldecades, and it is expected to remain in that position for EIA’s forecast periodto 2020, as shown in Figure 2-22 [24]. Although oil is projected to be thedominant fuel source, its share of the world energy consumption remainsrelatively unchanged for the 20-year period, as illustrated in Figure 2-23 [24].This is predicted to occur because many countries are expected to switchfrom oil to natural gas and other fuels, especially for electricity generation.
The largest increases in oil consumption will occur in developingcountries, which will begin to utilize nearly as much oil as the industrial-ized nations, although they currently use only about 58% of the amount
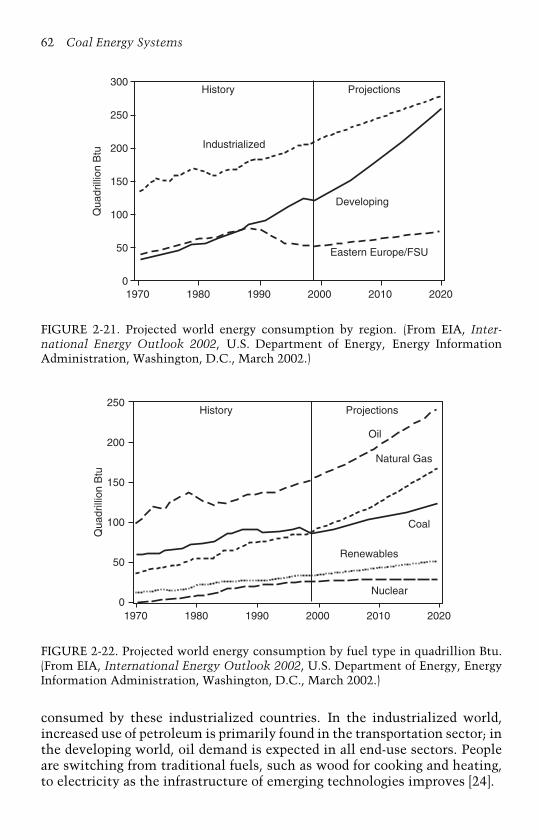
62 Coal Energy Systems
History Projections
Industrialized
Developing
Eastern Europe/FSU
300
250
200
150
100
50
0
Qua
drill
ion
Btu
1970 1980 1990 2000 2010 2020
FIGURE 2-21. Projected world energy consumption by region. (From EIA, Inter-national Energy Outlook 2002, U.S. Department of Energy, Energy InformationAdministration, Washington, D.C., March 2002.)
Qua
drill
ion
Btu
History Projections
Natural Gas
Renewables
Nuclear
250
200
150
100
50
01970 1980 1990 2000 2010 2020
Oil
Coal
FIGURE 2-22. Projected world energy consumption by fuel type in quadrillion Btu.(From EIA, International Energy Outlook 2002, U.S. Department of Energy, EnergyInformation Administration, Washington, D.C., March 2002.)
consumed by these industrialized countries. In the industrialized world,increased use of petroleum is primarily found in the transportation sector; inthe developing world, oil demand is expected in all end-use sectors. Peopleare switching from traditional fuels, such as wood for cooking and heating,to electricity as the infrastructure of emerging technologies improves [24].
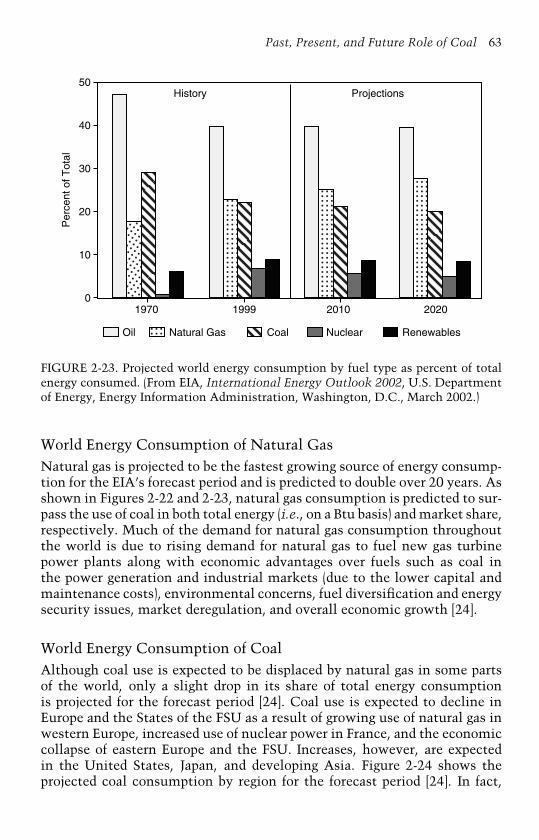
Past, Present, and Future Role of Coal 63
50
40
30
20
10
0
History Projections
1970 1999 2010 2020
Oil Natural Gas Coal Nuclear Renewables
Per
cent
of T
otal
FIGURE 2-23. Projected world energy consumption by fuel type as percent of totalenergy consumed. (From EIA, International Energy Outlook 2002, U.S. Departmentof Energy, Energy Information Administration, Washington, D.C., March 2002.)
World Energy Consumption of Natural GasNatural gas is projected to be the fastest growing source of energy consump-tion for the EIA’s forecast period and is predicted to double over 20 years. Asshown in Figures 2-22 and 2-23, natural gas consumption is predicted to sur-pass the use of coal in both total energy (i.e., on a Btu basis) and market share,respectively. Much of the demand for natural gas consumption throughoutthe world is due to rising demand for natural gas to fuel new gas turbinepower plants along with economic advantages over fuels such as coal inthe power generation and industrial markets (due to the lower capital andmaintenance costs), environmental concerns, fuel diversification and energysecurity issues, market deregulation, and overall economic growth [24].
World Energy Consumption of CoalAlthough coal use is expected to be displaced by natural gas in some partsof the world, only a slight drop in its share of total energy consumptionis projected for the forecast period [24]. Coal use is expected to decline inEurope and the States of the FSU as a result of growing use of natural gas inwestern Europe, increased use of nuclear power in France, and the economiccollapse of eastern Europe and the FSU. Increases, however, are expectedin the United States, Japan, and developing Asia. Figure 2-24 shows theprojected coal consumption by region for the forecast period [24]. In fact,

64 Coal Energy Systems
1980
IndustrializedCountries
EasternEurope/
FSU
China andIndia
Other DevelopingCountries
1999 2020
0
1
2
3
4
Bill
ion
Sho
rt T
ons
FIGURE 2-24. Projected world coal consumption by region. (From EIA, Inter-national Energy Outlook 2002, U.S. Department of Energy, Energy InformationAdministration, Washington, D.C., March 2002.)
coal’s share of total energy use (see Figure 2-23) would decline even furtherif it were not for the large increases projected in developing Asia, where coalcontinues to dominate many fuel markets.
Coal consumption is concentrated in the electricity generation sector,with about 65% of the coal consumed worldwide used for producing elec-tricity, while significant amounts of coal are also used for steel production[24]. Power generation accounts for almost all of the projected growth in coalconsumption worldwide. Natural gas is expected to gain market share in theindustrial, residential, and commercial sectors, except in China, where coalcontinues to be the main fuel in the industrial sector. Consumption of cokingcoal is expected to decline slightly in most regions of the world.
Overall, world coal consumption is projected to increase by approxi-mately 2 billion short tons to a level of 6.8 billion short tons in 2020. Thisincrease will be primarily observed in developing Asia, where an increase of1.8 billion short tons is projected. Together, China and India are projected toaccount for 29% of the total increase in energy consumption worldwide and83% of the projected increase in coal use [24]. China and India are projectedto add an estimated 100 and 65 gigawatts, respectively, of new coal-firedgenerating capacity by 2020.
Projected Coal Consumption in North AmericaCoal use in North America is dominated by U.S. consumption. In 2001, theUnited States consumed 1060 million short tons of coal, an amount that

Past, Present, and Future Role of Coal 65
is expected to increase to 1365 million short tons by 2020 [24]. Coal pro-vides nearly 50% of total electricity generation in the United States, whichis projected to decrease slightly to 46%. Coal use for electrical generation isexpected to continue as coal has a fuel cost advantage over oil and naturalgas for power production. Smaller quantities of coal are consumed in othersectors such as Independent Power Producers, metallurgical coal consump-tion for coke production, and residential/commercial and other industrialusers; however, each of these sectors uses only about 2 to 7% per category[25]. Although environmental issues and legislation will impact the use ofcoal (topics discussed in detail in subsequent chapters), the overall projec-tion for coal production and consumption is that it will continue to increasethrough 2020. Key features of the U.S. coal market over the next 20 yearsinclude [26]:
• Increased production of low-sulfur coal from the western coalfields;• Continuing decline in coal prices;• Steady improvements in productivity;• Decreasing transportation costs.
In 2001, coal provided over 13% of Canada’s primary energy consump-tion, most of which was used for generating electricity. Projections are thatcoal consumption in Canada will remain around this level through 2020 asdemand for electricity in western Canada will result in the need for morecoal-fired generation capacity, but the restart of six of Canada’s nucleargenerating units in eastern Canada will reduce the need for coal in easternCanada [24]. Canada is a net coal exporter, the fourth largest in the world,and exports coal from western Canada to the far East and western Europe[25]. Predictions for Canada’s export market vary, though, ranging from fore-casts for increased exports to the far East [25] to decreased exports to the farEast (due to increased competition from Australia) and western Europe (dueto increased shipping costs) [24,26].
Projected Coal Consumption in Eastern Europeand the States of the Former Soviet UnionIn eastern Europe and the States of the FSU, the process of economic reformcontinues as the transition to a market-orientated economy replacescentrally planned economic systems. While this is occurring, coal produc-tion and consumption have declined significantly. In many parts of theformer Communist world, energy supplies and electricity are not paid for;hence, there is little incentive for end users to employ techniques to improveefficiency [25]. The three main coal-producing countries of the FSU—Russia,Ukraine, and Kazakhstan—are facing similar problems and have developednational programs for restructuring and privatizing their coal industries, butthey are struggling with related technical and social problems [24]. For exam-ple, the Ukraine coal industry is plagued by poor safety, inefficiency, low
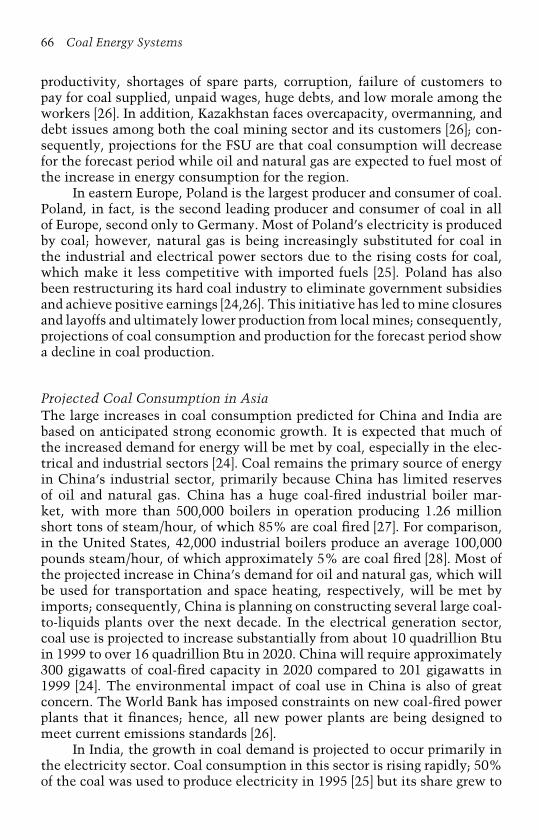
66 Coal Energy Systems
productivity, shortages of spare parts, corruption, failure of customers topay for coal supplied, unpaid wages, huge debts, and low morale among theworkers [26]. In addition, Kazakhstan faces overcapacity, overmanning, anddebt issues among both the coal mining sector and its customers [26]; con-sequently, projections for the FSU are that coal consumption will decreasefor the forecast period while oil and natural gas are expected to fuel most ofthe increase in energy consumption for the region.
In eastern Europe, Poland is the largest producer and consumer of coal.Poland, in fact, is the second leading producer and consumer of coal in allof Europe, second only to Germany. Most of Poland’s electricity is producedby coal; however, natural gas is being increasingly substituted for coal inthe industrial and electrical power sectors due to the rising costs for coal,which make it less competitive with imported fuels [25]. Poland has alsobeen restructuring its hard coal industry to eliminate government subsidiesand achieve positive earnings [24,26]. This initiative has led to mine closuresand layoffs and ultimately lower production from local mines; consequently,projections of coal consumption and production for the forecast period showa decline in coal production.
Projected Coal Consumption in AsiaThe large increases in coal consumption predicted for China and India arebased on anticipated strong economic growth. It is expected that much ofthe increased demand for energy will be met by coal, especially in the elec-trical and industrial sectors [24]. Coal remains the primary source of energyin China’s industrial sector, primarily because China has limited reservesof oil and natural gas. China has a huge coal-fired industrial boiler mar-ket, with more than 500,000 boilers in operation producing 1.26 millionshort tons of steam/hour, of which 85% are coal fired [27]. For comparison,in the United States, 42,000 industrial boilers produce an average 100,000pounds steam/hour, of which approximately 5% are coal fired [28]. Most ofthe projected increase in China’s demand for oil and natural gas, which willbe used for transportation and space heating, respectively, will be met byimports; consequently, China is planning on constructing several large coal-to-liquids plants over the next decade. In the electrical generation sector,coal use is projected to increase substantially from about 10 quadrillion Btuin 1999 to over 16 quadrillion Btu in 2020. China will require approximately300 gigawatts of coal-fired capacity in 2020 compared to 201 gigawatts in1999 [24]. The environmental impact of coal use in China is also of greatconcern. The World Bank has imposed constraints on new coal-fired powerplants that it finances; hence, all new power plants are being designed tomeet current emissions standards [26].
In India, the growth in coal demand is projected to occur primarily inthe electricity sector. Coal consumption in this sector is rising rapidly; 50%of the coal was used to produce electricity in 1995 [25] but its share grew to
Past, Present, and Future Role of Coal 67
more than 70% in 1999 [24]. Coal use for generating electricity is expectedto increase from current levels of about five quadrillion Btu to more than8 quadrillion Btu over the forecast period, with coal-fired capacity increasingfrom 59 to 125 gigawatts of coal-fired capacity over the same period.
Japan is the third largest user of coal in Asia (eighth in the world) andis the world’s leading coal importer [24]. Japan imports most of its coal fromAustralia, is the largest customer for Australian coal exports, and is thesecond largest customer for the United States [25]. Coal accounts for about20% of Japan’s primary energy needs; about one-third of the coal consumed isused for power generation and more than half of the consumed coal is used inthe steel industry. Japanese power companies plan to construct an additional16 gigawatts of new coal-fired capacity between 2001 and 2020 [24].
Projected Coal Consumption in AustraliaAustralia is the world’s leading coal exporter. In 1999, Australian coal pro-ducers shipped 189 million short tons of coal to international customers,while another 141 million short tons of Australian hard coal and lignite wereused domestically, primarily for power generation [24]. Coal-fired powerplants accounted for 78% of Australia’s total electricity generating needsin 1999 [24], a statistic that is not expected to increase very much over theforecast period as natural gas is becoming increasingly important [25].
Projected Coal Consumption in Western EuropeThe projected coal use in western Europe is uncertain as conflicting data areavailable. Coal use in western Europe fell for many years, as coal was firstreplaced by oil and then later by nuclear power and natural gas, especially inthe generation of electricity [25]. Data from several sources show decreases incoal consumption, both in tons and Btu, for many years [23–26]. Environmen-tal concerns have been a major factor in competition among coal, natural gas,and nuclear power in western Europe, and forecasts prepared around 1999 allpredict a continued decrease in coal usage [24–26]. However, primary worldenergy consumption data collected after these dates show a reversal in thetrend, with slight but progressive increases in coal consumption in 2000 and2001: 9.55 quadrillion Btu in 1999 to 9.79 and 9.98 quadrillion Btu in 2000and 2001, respectively [23]. Although these increases are small, they are sig-nificant in that coal consumption had been declining for years (e.g., 11.25quadrillion Btu in 1992 to 9.55 quadrillion Btu in 1999). This trend reversalis due to significant increases in coal consumption in the United Kingdom,which is the second largest consumer of coal in western Europe, and TheNetherlands. Combined with smaller increases over the last two years bycountries such as Italy, Belgium, Greece, and Yugoslavia, overall consump-tion of coal has reversed a declining trend observed for many years. Theincreases in the United Kingdom’s coal consumption may be the result of

68 Coal Energy Systems
the government reinstating coal production subsidies for 2000 through 2002in an effort to protect the country’s remaining coal operations, as many ofthem have shut down [24].
Coal consumption in Germany, the largest consumer of coal in westernEurope, has been declining over the entire reporting period. Much of thisreduction is in low-Btu lignite. Coal consumption has also been declining inseveral other countries including France. A modernization, rationalization,and restructuring plan submitted by the French government to the EuropeanCommission at the end of 1994 forecast the closure of all coal mines inFrance by 2005 [24].
Projected Coal Consumption in AfricaAfrica’s coal production and consumption are concentrated heavily in SouthAfrica. In 1999, South Africa produced 248 million short tons of coal, with70% of it going to domestic markets and the remainder to the export market[24]. South Africa is a major coal exporter but is experiencing competitionfrom South America and Australia, as these countries are building moreproduction capacity [26]. South Africa is the world’s largest producer of coal-based synthetic liquid fuels. In 1999, about 17% of the coal consumed inSouth Africa, on a Btu basis, was used to produce coal liquids, which inturn accounted for more than 25% of all liquid fuels consumed in SouthAfrica [24]. Coal consumption is projected to increase by 35 million shorttons by 2020, primarily to meet increased demand for electricity. Some ofthis increase is expected outside of South Africa in Kenya, Nigeria, Tanzania,and Morocco.
Projected Coal Consumption in Central and South AmericaHistorically, coal has not been a major source of energy in Central and SouthAmerica and today accounts for only about 5 to 6% of the total energyconsumption [24]. Hydroelectric power has provided much of the region’sdemand for electricity, and the use of natural gas is expected to accountfor most of the projected increase in electricity generation over the periodto 2020. Brazil, with the eighth largest steel industry in the world in 1999,accounts for more than 66% of the region’s coal demand on a tonnage basisand for more than 75% of the country’s total coal consumption [24].
Projected Coal Consumption in the Middle EastTurkey (which is sometimes included in European statistics) accounts foralmost 90% of the coal consumed in the Middle East. In 1999, Turkishcoal consumption was 84 million short tons, most of it lignite [24]. Coalconsumption, both lignite and hard coal, is projected to increase by 20 mil-lion short tons by 2020, primarily for coal-fired power production. Furtherincreases in the use of lignite for power generation in Turkey are planned
Past, Present, and Future Role of Coal 69
as part of an effort to reduce its dependence on foreign oil [26]. Most ofthe remaining coal use in the Middle East is consumed by Israel, whichconsumed 10 million short tons in 1999 [24]. Israel’s coal consumption isexpected to rise only slightly in the near future. Some environmental groupsand government officials are opposed to expanding new coal-fired generatingcapacity and instead support the use of natural gas from local and Egyptiansources for future electricity generation [24].
World Energy Consumption of Nuclear EnergyWorld nuclear energy consumption will remain relatively unchanged overthe forecast period. The highest growth is predicted for the developing worldwith Asia, in particular, expected to experience the greatest expansion innuclear generating capacity. This region currently has 16 reactors underconstruction, half of the world total [24].
World Energy Consumption of Renewable EnergyRenewable energy use is projected to increase by 53% over the forecastperiod; however, its share of total energy consumption is expected to remainrelatively unchanged at 8 to 9% [24]. Renewable energy consumption isexpected to be driven by new, large-scale hydroelectric projects, particularlyin China, India, Malaysia, and other developing Asian countries, but eventhese projects have had their share of bad publicity. Projects in China andMalaysia have continued amidst criticism of their environmental impactsand concerns about the welfare of people being relocated to accommodatethe projects [24]; similarly, a project under development in Iceland has beencriticized for its environmental impact [29].
Renewable energy use will be constrained by its higher fuel and capitalcosts and moderate fossil fuel prices. Emissions legislation, renewable energyportfolios, and tax incentives/subsidies in the industrialized countries willincrease the use of renewable energy for power generation and industrialapplications for chemicals and fuel production; however, renewable energywill make only a minor contribution to the overall energy mix due to itshigher fuel and equipment costs. As the hydrogen economy grows, it toohas the potential to increase the use of renewable energy. This technology,however, is still in its infancy, and the production of hydrogen, which iscurrently made predominantly from fossil fuels (i.e., mainly natural gas),would need to rely on other sources to impact fossil fuel consumption. In fact,as the hydrogen economy grows, gasification of coal may become the leadingsource of hydrogen. Details of the gasification technology are provided inChapter 5 (Technologies for Coal Utilization), and its potential to become amajor fuel source is discussed in Chapter 7 (Future Power Generation), wherefuture co-production technologies are presented.

70 Coal Energy Systems
Energy Outlook for the United StatesProjections of U.S. energy consumption and production to 2025 made by theEIA [30] are shown in Figures 2-25 and 2-26, respectively. These projectionshave been developed by focusing on long-term issues such as availabilityof energy resources, developments in U.S. electricity markets, technology
History Projections Petroleum
Natural Gas
Coal
60
50
40
30
20
10
01970 1980 1990 2001 2010 2025
Nuclear
NonhydroRenewablesHydro
Qua
drill
ion
Btu
FIGURE 2-25. U.S. energy consumption projected to 2025. (From EIA, InternationalEnergy Annual 2001, U.S. Department of Energy, Energy Information Administra-tion, Washington, D.C., March 2003.)
History Projections
Petroleum
Natural GasCoal
1970 1980 1990 2001 2010 2025
NuclearNonhydroRenewables
Hydro
Qua
drill
ion
Btu
0
5
10
15
20
25
30
FIGURE 2-26. U.S. energy production projected to 2025. (From EIA, InternationalEnergy Annual 2001, U.S. Department of Energy, Energy Information Administra-tion, Washington, D.C., March 2003.)
Past, Present, and Future Role of Coal 71
improvement, and the impact of economic growth on projected energydemand and prices. Less emphasis has been placed on near-term influencessuch as supply disruptions or political actions.
A major consideration for U.S. energy markets through 2025 will be theavailability of adequate natural gas supplies at competitive prices to meetgrowth in demand. EIA foresees growing dependence on new, large-volumenatural gas supply projects, including deepwater offshore wells, new andexpanded liquefied natural gas facilities, and major pipelines in Canada andthe United States to meet future demand levels [23].
Projected Energy Consumption in the United StatesEnergy consumption in the United States is projected to increase in all end-use sectors, with the demand for transportation energy expected to increasethe most [23]. Residential energy demand is expected to increase to more than25 quadrillion Btu/year in 2025 from current levels of about 20 quadrillionBtu/year (i.e., an increase of 1.0% per year), with the most rapid growthexpected for computers, electronic equipment, and appliances. Commercialenergy demand is expected to grow at an average annual rate of 1.6% peryear, increasing from about 17 to more than 25 quadrillion Btu/year in 2025,with the most rapid increases in demand being found in the use of computers,office equipment, telecommunications, and miscellaneous small appliances.Industrial energy demand is projected to increase by 1.3% per year and willincrease from about 33 to more than 44 quadrillion Btu/year in 2025. Trans-portation energy demand is projected to grow at an average annual rate of2.0% per year, increasing from about 27 to nearly 44 quadrillion Btu/yearby 2025 due to increased vehicle miles traveled and a lower level of vehicleefficiency. Demand for electricity is projected to increase by 1.8% per year to2025 due to rapid growth in electricity use for computers, office equipment,and electrical appliances in the residential and commercial sectors.
Projected energy consumption, by fuel, is shown in Figure 2-25 [23].Increases in all fuel types are projected over the period ending in 2025,although increases for nuclear energy and hydroelectric generation are antic-ipated to be small. Demand for natural gas is expected to increase by 1.8%per year to 2025, increasing from 22.7 to 34.9 trillion cubic feet primar-ily because of rapid growth in demand for electricity generation. Totalpetroleum demand is projected to grow at an annual rate of 1.7% through2025 due to demands from the transportation sector. Total renewable fuelconsumption, which includes ethanol for gasoline blending, is projected togrow at 2.2% per year to 2025.
Coal consumption is projected to increase by 1.3% per year from about1063 million short tons to 1444 million short tons in 2025 mainly due toprojected growth in the electric power sector. Total demand for industrialsteam coal is projected to rise slightly (by 8 million short tons in 2025), coaldemand for the residential and commercial sectors is expected to remain

72 Coal Energy Systems
relatively constant, and demand for coking coal is projected to decline by8 million short tons in 2025.
Coal is projected to maintain its fuel cost advantage over both oil andnatural gas; however, natural-gas-fired power generation is expected to bemore economical in the near term when capital, operating, and fuel costs areconsidered. The EIA [23], however, projects rising natural gas costs startingin 2005, increasing demand for electricity, and retirements of some existingfossil-fuel-fired steam capacity, which will lead to increased demand for coal-fired, baseloaded capacity.
Projected Energy Production in the United StatesTotal energy consumption in the United States is expected to increase morerapidly than domestic energy production through 2025, increasing to approx-imately 139 and 90 quadrillion Btu, respectively [23]. The shortfall of about49 quadrillion Btu in 2025 is projected to be met primarily through imports ofpetroleum (∼41 quadrillion Btu) and natural gas (∼8 quadrillion Btu). Crudeoil production is projected to decrease by 0.4% per year to 2025, as shown inFigure 2-26. By 2025, net petroleum imports, which include both crude oiland refined products, are expected to account for 68% of demand, up fromabout 55% in 2001 [23]. Domestic natural gas production is projected toincrease by 1.3% per year to 2025 from approximately 20 to 25 trillion cubicfeet. This increase, however, will not meet the total demand for natural gasin the United States, and the balance will be met through imports via pipelinefrom Canada and Mexico as well as shipments of liquefied natural gas.
Nuclear power generation is expected to increase modestly through2014 and then level off [23]. Renewable energy production, including hydro-electric generation, is projected to increase to over 9 quadrillion Btu in 2025from current levels of about 6 quadrillion Btu. U.S. coal production is pro-jected to increase to 1444 million short tons in 2025, an increase of 0.9% peryear, to meet the projected demand [23]. Higher electricity demand and lowerprices will be the primary reasons for the coal demand, as net coal exportsare expected to decline throughout the forecast period due to decliningdemand in some countries and competition from other international pro-ducers. Eastern coal production will remain relatively stable, while westerncoal production will continue to increase because of its lower sulfur contentand lower minemouth price. The mines of the Northern Great Plains, withthick seams and low overburden ratios, have higher labor productivity thanother coalfields, and this advantage is expected to be maintained throughoutthe EIA’s forecast period.
Role of Coal in the United States’ 2001 Energy Policy
In May 2001, the National Energy Policy Development (NEPD) Group,chaired by Vice President Dick Cheney, unveiled a National Energy Policyfor President George W. Bush. This report, titled Reliable, Affordable,
Past, Present, and Future Role of Coal 73
and Environmentally Sound Energy for America’s Future, is the firstdetailed energy policy that the United States has developed since PresidentJimmy Carter’s administration. President Bush directed the NEPD Groupto “develop a national energy policy designed to help bring together busi-ness, government, local communities and citizens to promote dependable,affordable and environmentally sound energy for the future’‘ [31]. In thereport’s cover letter to President Bush, Vice President Cheney states that thereport “envisions a comprehensive long-term strategy that uses leading edgetechnology to produce an integrated energy, environmental and economicpolicy. To achieve a 21st century quality of life—enhanced by reliable energyand a clean environment—we must modernize conservation, modernize ourinfrastructure, increase our energy supplies (including renewables), acceler-ate the protection and improvement of our environment, and increase ourenergy security’‘ [31]. The NEPD Group recognized the importance of coal inthe U.S. energy policy and security. The role of coal in the U.S. energy policyis introduced in this section, while its contribution to the energy security ofthe United States is discussed in detail in Chapter 8.
The United States’ energy strength lies in the abundance and diversityof its energy resources and in its technological leadership in developing andefficiently using these resources. The United States has significant domesticenergy resources—coal, oil, and natural gas—and remains a major producer;however, as outlined earlier in this chapter, the United States will needmore energy supply than it produces. This shortfall can be made up in onlythree ways: import more energy, improve energy efficiency even more thanexpected, or increase domestic energy supply. Coal, an abundant resourcein the United States, can be used to increase the domestic energy supplyeven more than projected through the use of advanced utilization tech-nologies (which are discussed in detail in Chapter 7). The NEPD Grouprecognized this; thus coal has been given a significant role in the UnitedStates’ energy policy.
The demand for electricity in the United States is projected to increasesubstantially, with 428 gigawatts of new generating capacity required for theperiod from 2001 to 2025 to meet this demand and replace retiring units [23].Coal, nuclear energy, natural gas, and hydropower account for about 95%of total electricity generation, with oil and renewable energy contributingthe remainder. Coal is used almost exclusively to generate electricity. Coal-fired power plants account for about 50% of all U.S. electricity generation(see Figure 2-18). Coal is attractive because electricity generation costs arelow and coal prices have proved stable.
Although coal is the most abundant fossil energy source in the UnitedStates, production and market issues affect the adequacy of supply. As high-lighted in the energy policy, issues such as protection of public health, safety,property, and the environment can limit production and utilization of somecoal resources and has led, over the last several years, to using natural gasfor power generation due to higher efficiencies, lower capital and operating

74 Coal Energy Systems
costs, and fewer emissions; however, technological advances in cleaner coaltechnology have allowed for significant progress toward reducing these barri-ers. Coal, with its more stable prices than natural gas, must play a significantrole in meeting the rising electricity demand in the United States.
Technology has been and will continue to be a key for the United Statesto achieve its energy, economic, and environmental goals. In recent years,technological advancements have led to substantial reductions in the costof controlling sulfur dioxide and nitrogen oxide emissions [31]. The U.S.Department of Energy (DOE), through its Clean Coal Technology Program,has worked to provide effective control technologies. Clean Coal Technol-ogy is a category of technologies that allow for the use of coal to generateelectricity while meeting environmental regulations at low cost. In the shortterm, the goal of the program is to meet existing and emerging environmentalregulations, which will dramatically reduce compliance costs for controllingsulfur dioxide, nitrogen oxides, fine particulate matter, and mercury at newand existing coal-fired power plants. In the mid-term, the goal of the programis to develop low-cost, superclean, coal-fired power plants with efficiencies50% higher than today’s average [31]. The higher efficiencies will reduceemissions at minimal costs. In the long term, the goal of the program isto develop low-cost, zero-emission power plants with efficiencies close todouble that of today’s fleet (see Chapter 7). The long-term goals also includeco-production of fuels and chemicals along with electricity, leading to thedevelopment of technologies that may result in coal being a major source ofhydrogen for the much publicized “hydrogen economy’‘ the United States ismoving toward.
The NEPD Group recognized the importance of looking toward tech-nology to help meet the goals of increasing electricity generation whileprotecting the environment. As a result, the NEPD Group recommendedthat President Bush direct the DOE to continue to develop advanced cleancoal technology by [31]:
• Investing $2 billion over 10 years to fund research in clean coaltechnologies;
• Supporting a permanent extension of the existing research anddevelopment tax credit;
• Directing agencies to explore regulatory approaches that will encour-age advancements in environmental technology.
In addition, the NEPD Group recommended that the President direct federalagencies to provide greater regulatory certainty relating to coal electric-ity generation through clearer policies that are easily applied to businessdecisions. President Bush has started implementing some of these recom-mendations, which are addressed in later chapters, including discussionson the first round of the clean coal technologies being demonstrated andregulatory/environmental legislation being proposed and implemented.

Past, Present, and Future Role of Coal 75
References
1. Moore, E. S., Coal: Its Properties, Analysis, Classification, Geology, Extrac-tion, Uses, and Distribution (John Wiley & Sons, New York, 1922).
2. Elliot, M. A. (editor), Chemistry of Coal Utilization, Second Suppl. Vol.(John Wiley & Sons, New York, 1981).
3. World Book Encyclopedia, Coal (World Book, Chicago, IL, 2001a), Vol. 4,pp. 716–733.
4. World Book Encyclopedia, Marco Polo (World Book, Chicago, IL, 2001b),Vol. 15, pp. 648–649.
5. Environmental Literacy Council, www.enviroliteracy.org/article.php/18.html(accessed May 2003).
6. Landels, J. G., Engineering in the Ancient World (University of California Press,Berkley, 1978), p. 32.
7. U.C. Davis (University of California at Davis), www-geology.ucdavis.edu/-GEL115/115CH11coal.html (accessed May 2003).
8. Schobert, H. H., Coal: The Energy Source of the Past and Future (AmericanChemical Society, Washington, D.C., 1987).
9. EIA, Coal Data: A Reference (U.S. Department of Energy, Energy InformationAdministration, Washington, D.C., February 1995).
10. Deane, P., The First Industrial Revolution, Second ed. (Cambridge UniversityPress, Cambridge, U.K., 1979), pp. 78, 103–105.
11. EIA, Annual Energy Review 2001 (U.S. Department of Energy, Energy Informa-tion Administration, Washington, D.C., November 2002).
12. Freme, F., U.S. Coal Supply and Demand: 2002 Review (U.S. Department ofEnergy, Washington, D.C., 2002).
13. National Mining Association, Most Requested Statistics: U.S. Coal Industry(National Mining Association, Washington, D.C., April 2003).
14. RDI, Inc., Synthetic Fuel Tax Credits: U.S. Coal Industry Impacts, June 2000.15. Sanderson, G., Section 29 Credit for Synthetic Fuels, paper presented at Coke
Summit 2001, October 15–17, 2001.16. Kalb, G. W., Tax Credit Plants Emerge, Coal Age, Vol. 105, No. 4, April 2000,
pp. 43–44.17. Morey, M. and C. Leshock, Tax Credit Synfuels Influence Coal Markets, Coal
Age, Vol. 105, No. 5, May 2000, pp. 35–36.18. Morey, M., Coal-Based Synfuel Continues to Grow, Coal Age, Vol. 107, No. 11,
November 2002, pp. 23–24.19. Anon., Sprayed Coal Tax Credits Under Fire, Coal Age, Vol. 106, No. 10,
October 2000, p.8.20. Anon., Feds Move to Probe Synfuel Tax Credits, Coal Age, Vol. 105, No. 11,
November 2000, p. 16.21. Anon., IRS Defines Synfuel Qualifications, Coal Age, Vol. 106, No. 6, June
2001.22. Coal Outlook: IRS, Treasury Reexamine Sect. 29 Policy, Congressman Says,
Financial Times Energy, September 18, 2000, p.11.23. EIA, Annual Energy Outlook 2003 (U.S. Department of Energy, Energy
Information Administration, Washington, D.C., January 2003).
76 Coal Energy Systems
24. EIA, International Energy Outlook 2002 (U.S. Department of Energy, EnergyInformation Administration, Washington, D.C., March 2002).
25. Grimston, M. C., Coal as an Energy Source (IEA Coal Research, London, 1999).26. Walker, S., Major Coalfields of the World (IEA Coal Research, London, 2000).27. CACETC, Coal-Fired Industrial Boiler in China and the Related Appli-
cable Advanced Technology (Cleaner Air and Cleaner Energy TechnologyCooperation, China, June 2002).
28. EPA, Report to Congress: Wastes from the Combustion of Fossil Fuels, Vol. 1.Executive Summary (U.S. Environmental Protection Agency, U.S. GovernmentPrinting Office, Washington, D.C., March, 1999), pp. 4–6.
29. Swan, J., Iceland Be Damned, Smithsonian, Vol. 23, No. 3, June 2002, pp. 90–97.30. EIA, International Energy Annual 2001 (U.S. Department of Energy, Energy
Information Administration, Washington, D.C., March 2003).31. NEPD, National Energy Policy (National Energy Policy Development Group,
U.S. Government Printing Office, Washington, D.C., May 2001).
CHAPTER 3
The Effect of Coal Usageon Human Health andthe Environment
Coal has played a significant role in the advancement of civilization and willcontinue to be a major fuel source for at least the next quarter century, asdiscussed in Chapter 2 (Past, Present, and Future Role of Coal). The value ofcoal is partially offset by the environmental issues it raises. Some of theseenvironmental issues also have impacts on human health.
Coal mining has a direct impact on the environment, as it disturbs largeareas of land and has the potential to affect surface water and groundwaterin the case of surface mining. In some surface mines, the generation of acidmine drainage (AMD) is a major problem. Other significant impacts includefugitive dust emissions and disposal of overburden and waste rock.
In underground mining, the surface disturbance is less obvious but theeffect of subsidence can be large. The generation and release of methaneand other gases can be a problem. As with surface mining, groundwater canalso be disturbed and AMD can become an issue. In addition, undergroundminers have a history of respiratory ailments and, until the last few decades,have experienced high injury and death rates from accidents.
Coal beneficiation is primarily based on wet physical processes thatproduce waste streams that must be dealt with. These include fine materialsthat are discharged as a slurry to a tailings impoundment and a coarse mate-rial that is hauled away as a solid waste. Storage, handling, and transportationof coal produce fugitive dust.
Coal utilization, specifically combustion, which is the focus of thischapter, produces several types of emissions that adversely affect the envi-ronment, particularly ground-level air quality. In addition, the generation ofcoal combustion by-products must be addressed, whether they are disposedof or reused/recycled.
Concern for the environment has in the past and will in the future con-tribute to policies that affect the consumption of coal. The main emissions
77

78 Coal Energy Systems
from coal combustion are sulfur dioxide (SO2), nitrogen oxides (NOx ), par-ticulate matter (PM), and carbon dioxide (CO2). Recent studies on the healtheffects of mercury have raised concerns about mercury emissions from coal-fired power plants. The environmental and health effects of these pollutants,along with other pollutants such as carbon monoxide (CO), lead, and organicemissions, are discussed in this chapter, as is the effect of coal utilization onhuman health and the environment. The impacts of mining, storage, han-dling, transportation, beneficiation, combustion by-products, and emissionsfrom coal-fired power plants are presented with a focus on activities in theUnited States.
Coal Mining
The negative aspects of mining operations can lead to confrontations amongcitizen groups, governmental agencies, and the mining industry. Theconflicts tend to be centered on the following issues [1]:
• Destruction of the landscape;• Degradation of the visual environment;• Disturbance of surface water and groundwater;• Destruction of agricultural and forest lands;• Damage to recreational lands;• Noise pollution;• Dust;• Truck traffic;• Sedimentation and erosion;• Land subsidence;• Vibration from blasting.
These issues, along with past operating procedures—unsafe workingconditions leading to injuries, deaths, and high incidences of respiratorydiseases; use of child labor; scarred landscapes; poor miner living conditions;contentious and sometimes extremely violent labor relations—resulted incoal mining being viewed negatively; consequently, a major effort has goneinto addressing these issues so that today coal mining is a highly regulatedindustry that has seen a number of significant changes in the approach tomining and resource development along with improving miner safety. Thesedevelopments include:
• Environmental impact assessment and public inquiries;• Conditions for mining permit approval;• Resource management and land-use planning;• Land reclamation and rehabilitation;• Regulations specifically addressing miner safety and training.

The Effect of Coal Usage on Human Health and the Environment 79
Coal mining falls into two categories: underground mining and surfacemining. Surface mining is used when the coal seam to be mined lies near thesurface, typically less than 200 feet from the surface. Each mining techniquehas its own set of technical and economic advantages and disadvantages, andeach mining technique has its own set of health and environmental impacts.In 2002, nearly 370 million short tons of coal were mined by undergroundmethods, while more than 724 million short tons of coal were removed bysurface mining [2].
Underground MiningUnderground mining is used for deep seams, and the mining methods varyaccording to the site conditions. Underground mines can be classified bythe types of access used to reach the coal (i.e., shaft mines, slope mines,and drift mines) but are primarily classified by the coal removal system:room and pillar mining, pitch mining, or longwall mining [3]. A shaft mineuses a vertical hole dug straight down from the surface to the coal seam. Aslope mine provides access at a slant and is used to follow a seam along itspitch or to cut through a mountain to reach the coal. A drift mine accessescoal outcrops on a mountainside. Room and pillar mining is used when thecoal seam lies relatively level, and it is carried out by using one of twoprocesses: conventional mining or continuous mining [3]. In 2002, over fourmillion short tons of the coal produced in underground mines were obtainedby conventional mining, but it is being replaced by other mining methods [2].In conventional mining, explosives are used to shatter the face of the seam,and the broken pieces are manually loaded onto tram cars or conveyors andhauled out of the mine. In continuous mining, used to produce more than175 million short tons of coal in 2002 [2], a machine that moves along oncaterpillar tracks cuts the coal from the face of the seam and automaticallyloads the coal onto tram cars or a conveyor. Pitch mining is a techniqueused when the coal seams are inclined and is frequently used in anthracitemining [4]. In pitch mining, the bottom of the seam is accessed, and thecoal is dropped into chutes that are gravity-fed into tram cars. Longwallmining is the removal of coal from one, long continuous face rather thanremoval from a number of short faces as occurs in room and pillar or pitchmining. Annual longwall mining production is similar to that of continuousmining and accounted for nearly 190 million short tons of coal producedin the United States in 2002 [2]. Regardless of the mining system used, thehealth and environmental impacts are common to every underground mine:land subsidence, generation of methane and other gases, liquid effluents,dust, solid waste, and miner safety.
SubsidenceSubsidence can have a major effect on the topography of the land surface. Fol-lowing the removal of the coal from an underground mine, the roof materials
80 Coal Energy Systems
may cave, causing collapse of the overlying rock strata and resulting in sub-sidence of the surface. The degree of collapse of the overlying rock strata canvary from practically no collapse with no resulting surface impacts to totalcollapse with more pronounced changes at the surface [5]. In general, minesubsidence problems develop where post-mining pillar support systems andcoal barriers ultimately fail. Many interrelated factors control when, where,and how failure will occur, including [1]:
• Thickness of coal removed;• Size, shape, and distribution of pillars and rooms;• Depth of mining;• Percent extraction of coal;• Thickness and physical characteristics (e.g., strength) of the over-
burden;• Method of mining, such as longwall, shortwall (which is a slight
modification of longwall mining), room and pillar, room and pillarwith full or partial retreat;
• Conditions in the mine (i.e., dry or flooded);• Actual or potential level and degree of fracturing in the overburden;• Mineralogy of the overburden (e.g., clay minerals that swell when
water is added, sulfide minerals that chemically and physicallychange in the presence of oxygen and moisture, minerals that reactwith water to form new minerals).
Over areas that have been longwall mined, the subsidence is often ashallow trough. In flat terrain, this trough is usually quite visible and cancause local changes in drainage. Subsidence from active coal mining has thelargest effect on the land surface in terms of area undermined, although theeffects are often small in terms of overall topography [5]. Subsidence impactson surface structures and subsurface hydrologic resources are generally ofmore importance than the impacts on topography or surface features.
Subsidence from shallow, abandoned coal mines often results in abruptbut localized changes in topography that reflect the collapse of individualrooms or voids. This type of subsidence can be an isolated, single collapse orcan involve a larger area with many individual subsidence pits.
Generation of GasesMethane (CH4) is produced during coalification, and only a fraction of thisgas remains trapped under pressure in the coal seam and surrounding rockstrata. This trapped methane is released during mining when the coal seamis fractured. The amount of methane released during coal mining dependson a number of factors, including coal rank, coal seam depth, and methodof mining [6]. As coal rank increases, the amount of methane producedalso increases. The adsorption capacity of coal increases with pressure, andpressure increases with depth of the coal seam; consequently, deeper coal
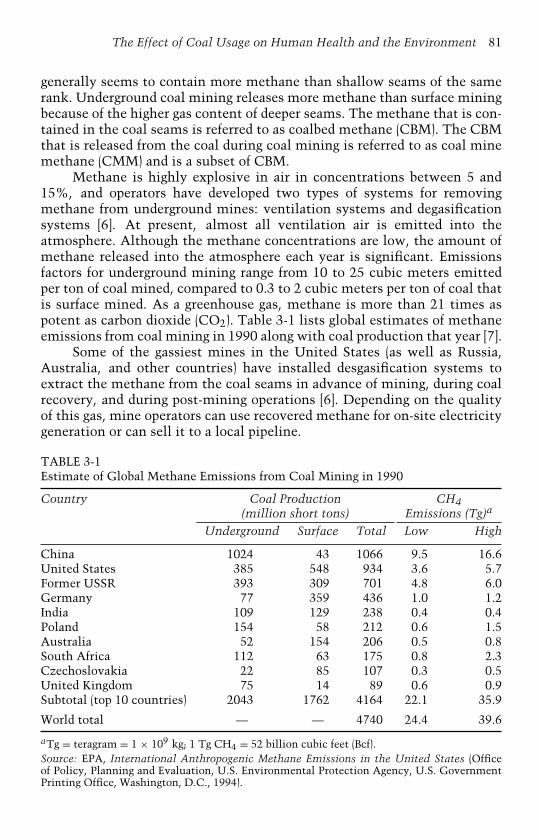
The Effect of Coal Usage on Human Health and the Environment 81
generally seems to contain more methane than shallow seams of the samerank. Underground coal mining releases more methane than surface miningbecause of the higher gas content of deeper seams. The methane that is con-tained in the coal seams is referred to as coalbed methane (CBM). The CBMthat is released from the coal during coal mining is referred to as coal minemethane (CMM) and is a subset of CBM.
Methane is highly explosive in air in concentrations between 5 and15%, and operators have developed two types of systems for removingmethane from underground mines: ventilation systems and degasificationsystems [6]. At present, almost all ventilation air is emitted into theatmosphere. Although the methane concentrations are low, the amount ofmethane released into the atmosphere each year is significant. Emissionsfactors for underground mining range from 10 to 25 cubic meters emittedper ton of coal mined, compared to 0.3 to 2 cubic meters per ton of coal thatis surface mined. As a greenhouse gas, methane is more than 21 times aspotent as carbon dioxide (CO2). Table 3-1 lists global estimates of methaneemissions from coal mining in 1990 along with coal production that year [7].
Some of the gassiest mines in the United States (as well as Russia,Australia, and other countries) have installed desgasification systems toextract the methane from the coal seams in advance of mining, during coalrecovery, and during post-mining operations [6]. Depending on the qualityof this gas, mine operators can use recovered methane for on-site electricitygeneration or can sell it to a local pipeline.
TABLE 3-1Estimate of Global Methane Emissions from Coal Mining in 1990
Country Coal Production CH4(million short tons) Emissions (Tg)a
Underground Surface Total Low High
China 1024 43 1066 9.5 16.6United States 385 548 934 3.6 5.7Former USSR 393 309 701 4.8 6.0Germany 77 359 436 1.0 1.2India 109 129 238 0.4 0.4Poland 154 58 212 0.6 1.5Australia 52 154 206 0.5 0.8South Africa 112 63 175 0.8 2.3Czechoslovakia 22 85 107 0.3 0.5United Kingdom 75 14 89 0.6 0.9Subtotal (top 10 countries) 2043 1762 4164 22.1 35.9
World total — — 4740 24.4 39.6
aTg = teragram = 1 × 10⁹ kg; 1 Tg CH4 = 52 billion cubic feet (Bcf).Source: EPA, International Anthropogenic Methane Emissions in the United States (Officeof Policy, Planning and Evaluation, U.S. Environmental Protection Agency, U.S. GovernmentPrinting Office, Washington, D.C., 1994).
82 Coal Energy Systems
The total volume of CMM liberated in the United States in 2000 was196 billion cubic feet (Bcf); of that, underground mining activities liberated142 Bcf [8]. CMM emissions account for approximately 10% of total U.S.methane emissions. Globally, coal mines account for 8% of all methaneemissions. Underground mines are the largest source of CMM and accountfor 72% of the total CMM liberated.
The U.S. coal industry has made substantial progress in recovering andusing CMM through drainage systems. Of the 142 Bcf of CMM liberated fromunderground mines in 2000, about 42 Bcf were emitted through drainagesystems, with the remainder being emitted through ventilation systems [8].Coal mines in the United States recovered 86%, or 36 Bcf, of the gas liberatedthrough the drainage systems, which is nearly a threefold increase over 1990,when only 14 Bcf of gas were recovered. Approximately 100 Bcf of CMM areemitted through ventilation systems each year. Ventilation air represents aconsiderable source of greenhouse gas emissions and is a major focus areafor recovery and use.
Some coal seams, particularly in Australia but also in France andPoland, contain high carbon dioxide concentrations, which can compriseas much as 100% of the gases in the coal seam [6]. This gas is thought tohave a magmatic origin. Although carbon dioxide is not toxic, it can causeasphyxiation by displacing breathable oxygen.
Liquid Effluents/Acid Mine DrainageThe generation of liquid effluents from major mining techniques tends to behigher for underground mining than for surface mining. For undergroundmining, liquid effluent rates of 1.0 and 1.6 tons per 1000 short tons ofcoal produced have been documented for conventional and longwall min-ing, respectively [9]. If groundwater systems are disturbed, the possibilitythen exists for serious pollution from highly saline or highly acidic water.
The highly acidic water, commonly known as acid mine drainage, isproduced by the exposure of sulfide minerals (most commonly pyrite) to airand water, resulting in the oxidation of sulfur and the production of acidityand elevated concentrations of iron, sulfate, and other metals [1]. Pyrite andother sulfide minerals are generally contained in the coal, overburden, andcoal processing wastes.
Historically, coal extraction in the northern Appalachian coalfields hasresulted in serious problems related to contaminated mine drainage [10].Acid drainage from closed and abandoned mines (both underground and sur-face) has far-ranging effects on water quality and, therefore, on fish andwildlife. Drainage from closed mines is particularly acidic in Pennsylvania,Ohio, northern West Virginia, and Maryland.
The formation of AMD is primarily a function of the geology, hydrol-ogy, and mining technology employed for the mine site [11,12]. AMD isformed by a series of complex geochemical and microbial reactions that occur
The Effect of Coal Usage on Human Health and the Environment 83
when water comes in contact with pyrite (iron disulfide minerals) in coal,refuse, or the overburden of a mine operation. The resulting water is usuallyhigh in acidity and dissolved metals. The metals stay dissolved in solutionuntil the pH raises to a level where precipitation occurs.
Four commonly accepted chemical reactions represent the chemistryof pyrite weathering to form AMD. An overall summary is:
4FeS2 + 15O2 + 14H2O −→ 4Fe(OH)−3 + 8H2SO4 (3-1)
Pyrite + Oxygen + Water −→ “Yellowboy′′ + Sulfuric Acid
The first reaction in the weathering of pyrite includes the oxidation of pyriteby oxygen. Sulfur is oxidized to sulfate and ferrous iron is released. Thisreaction generates 2 moles of acidity for each mole of pyrite oxidized:
2FeS2 + 7O2 + 2H2O −→ 2Fe2+ + 4SO2−4 + 4H+ (3-2)
Pyrite + Oxygen + Water −→ Ferrous Iron + Sulfate + Acidity
The second reaction involves the conversion of ferrous iron to ferric iron.The conversion of ferrous iron to ferric iron consumes one mole of acidity.Certain bacteria increase the rate of oxidation from ferrous iron to ferriciron. This reaction rate is pH dependent, with the reaction proceeding slowlyunder acidic conditions (pH of 2 to 3) with no bacteria present and severalorders of magnitude faster at pH values near 5. This reaction is often referredto as the rate-determining step in the overall acid-generating sequence:
4Fe2+ + O2 + 4H+ −→ 4Fe3+ + 2H2O (3-3)
Ferrous Iron + Oxygen + Acidity −→ Ferric Iron + Water
The third reaction which may occur is the hydrolysis of iron. Hydrolysisis a reaction which splits the water molecule. Three moles of acidity aregenerated as a by-product. Many metals are capable of undergoing hydrolysis.The formation of ferric hydroxide precipitate (i.e., a solid product) is pHdependent. Solids form if the pH is above about 3.5, but below pH 2.5 few orno solids will precipitate. The third reaction is:
4Fe3+ + 12H2O −→ 4Fe(OH)−3 + 12H+ (3-4)
Ferric Iron + Water −→ Ferric Hydroxide (“Yellowboy′′) + Acidity
The fourth reaction is the oxidation of the additional pyrite by ferric iron.The ferric iron is generated in Reactions (3-2) and (3-3). This is the cyclicand self-propagating part of the overall reaction that takes place very rapidlyand continues until either ferric iron or pyrite is depleted. Note that in thisreaction ferric iron is the oxidizing agent, not oxygen:
FeS2 + 14Fe3+ + 8H2O −→ 15Fe2+ + 2SO2−4 + 16H+ (3-5)
Pyrite + Ferric Iron + Water −→ Ferrous Iron + Sulfate + Acidity
84 Coal Energy Systems
Treatment of AMD includes both chemical and passive techniques. InPennsylvania, for example, strict effluent discharge limitations were placedon mine operations in 1968 [11]. Many companies used chemical treatmentmethods to meet these new effluent limits. In these systems, the acidityis buffered by the addition of alkaline chemicals such as calcium carbon-ate, sodium hydroxide, sodium bicarbonate, or anhydrous ammonia. Thesechemicals raise the pH to acceptable levels and decrease the solubility ofdissolved metals. Precipitates form from the solution. These chemicals areexpensive, however, and the treatment system requires additional costs asso-ciated with operation and maintenance as well as the disposal of metal-ladensludges.
Many variations of AMD passive treatment systems were studied asearly as 1978 [11]. During the last 15 years, passive treatment systems havebeen implemented on full-scale sites throughout the United States withpromising results. The concept behind passive treatment is to allow the natu-rally occurring chemical and biological reactions that aid in AMD treatmentto take place in the controlled environment of the treatment system andnot in the receiving water body. Passive systems do not require the expen-sive chemicals necessary for chemical treatment systems, and operation andmaintenance requirements are considerably less. Passive AMD treatmenttechnologies being implemented include:
• Aerobic wetland;• Compost or anaerobic wetland;• Open limestone channels;• Diversion wells;• Anoxic limestone drains;• Vertical flow reactors;• Pyrolusite process.
Hydrologic ImpactWith underground mining, subsidence and fracturing of overlying strata maycause surface runoff to be diverted underground and may disrupt aquifers,causing local water level declines and changing the direction of groundwaterflow near the mine [1]. Dewatering required by mining operations affectsgroundwater quantity by depleting aquifers when mine features extendbelow the water table and become a drain [5]. Although groundwater deple-tion is the most obvious and immediate effect of mining on groundwater,longer term effects on the environment may be equally important. Redis-tribution and/or change in groundwater recharge rates may affect the timeand degree to which aquifers will recover to a static condition. Conscien-tious management practices minimize water-related environmental impacts[13]. Coal mining activities are highly regulated, requiring extensive sur-face and groundwater sampling and monitoring to ensure compliance with
The Effect of Coal Usage on Human Health and the Environment 85
federal, state, and local statutes. Also, hydrological impacts must be takeninto consideration as part of the permitting process; therefore, coal com-pany hydrologists study and monitor the quality of surface and undergroundwater resources before, during, and after mining activity to ensure minimalhydrological impacts.
Health Effects/Miner SafetyThere is no argument that mining is a dangerous occupation and that histor-ically there has been a tremendous social cost associated with coal mining.Mine accidents and diseases have taken their toll on miners. In the UnitedStates, more than 100,000 miners died over the period of about 1885 to1985 [4]. In 1900, the annual death rate among underground miners was3.5 deaths per thousand miners [4]; however, a commitment to enhanc-ing safety training and the development of new technologies have yieldedremarkable improvements in the mine as a workplace. In addition, coalmines are subject to regular, comprehensive inspections by the federal MineSafety and Health Administration (MSHA), and safety and health reportingrequirements are much more stringent than those required by the Occupa-tional Safety and Health Administration (OSHA), which regulates most otherU.S. industries. According to MSHA, the twentieth century saw remarkableimprovements in safety and health for U.S. miners, and the rate of fatalinjuries for underground miners declined by 92% over the period from 1960to 1999 [13]. Data from the U.S. Department of Labor show that in 2002there were 12 fatalities in underground mining, 6 in surface mining, and 2 inpreparation plants [14]. This is an annual death rate of 0.2 per thousand min-ing personnel, nearly a 20-fold decrease since 1900. The annual death rate forunderground miners, which experienced the largest incidences of fatalitieswith 12, was 0.3 per thousand miners. According to the U.S. Department oflabor, mining has a lower rate of injuries and illness per 100 employees thanthe agricultural, construction, or retail trades [13]. The accident and injuryrates for miners today are comparable to those of grocery store workers.
Dust issues in mines, particularly underground mines, have had anegative impact on the coal industry. Many miners, particularly under-ground miners, have contracted respiratory diseases. These diseases—pneumoconiosis (black lung) and silicosis—have taken years to manifestthemselves, and the industry has been working to minimize dust in mines.In an underground mine, the walls of the tunnels or shafts are covered withpulverized limestone to help settle coal dust [13]. Water sprayers on themechanical equipment, such as in continuous and longwall mines, helpreduce dust concentrations in the mines. The ventilation fans that removemethane also remove the lingering dust, and a continuous supply of freshair is brought into the mine. Plus, miners now wear air-purifying systems.Dust production in underground mines is 0.0006 and 0.01 short tons per1000 short tons of coal produced for conventional and longwall mining,respectively [9].
86 Coal Energy Systems
Surface MiningSurface mining of coal is an alternative to underground mining and is prac-ticed as strip mining, the most common form, and auger mining. Some coalis also produced through dredging and culm bank (i.e., anthracite waste piles)recovery; however, these quantities are relatively small compared to under-ground, strip, and auger mining. The quantities of coal produced in 2002 bythe various methods, as reported by MSHA, are listed in Table 3-2 [14]. Notethat the production totals reported by MSHA and those of the National Min-ing Association/Energy Information Administration (see Figure 2-10) differslightly.
Strip mining is favored when the overburden (the overlying rock strata)is typically 200 feet or less in thickness but can be economical with over-burden thickness up to 600 feet [15]. Another factor that is considered whendetermining the economics of strip mining is the stripping ratio, which isthe ratio of overburden thickness to coal seam thickness. Typically, themaximum stripping ratio that is economical is 20 to 1 [4]. The two gen-eral methods of strip mining are area mining and contour mining. In areamining, a trench is dug, the overburden is piled to one side, and the coalis removed. As mining progresses, the overburden from the new trench isdumped into the first trench. In contour mining, which is used when coallies beneath hilly terrain or outcrops on a hillside, the overburden is removedand dumped on the downhill side of the mining operation [3].
Auger mining can be used for coal outcrops on a hillside or in stripmines where the stripping ratio has become too high to be economical forstrip mining [4]. In auger mining, an auger drills it way into the face ofthe coal seam, and the coal is removed via conveyor and loaded directly ontoa truck.
Many adverse environmental impacts could potentially result fromarea surface mining of coal if no reclamation practices are used. Suchmeasures are used with varying degrees of effectiveness in the UnitedStates [1]. Air quality can be affected in several ways. Fugitive dust from coal
TABLE 3-2Coal Production by Type in the United States in 2002
Mining Type Production (short tons)
Total underground 353,273,486Total surface 736,546,576Strip 730,630,458Auger 5,071,011Culm bank recovery 398,536Dredge 446,571
Total coal 1,089,820,062
The Effect of Coal Usage on Human Health and the Environment 87
haul roads, unvegetated spoil surfaces, topsoil stockpiles, and coal stock-piles is a potential problem. Overburden blasting can produce troublesomenoise, air shock, and ground vibration. The quality and quantity of surfacewater and groundwater can be affected if effective reclamation practices arenot used. Sedimentation of surface waters may occur. Erosion of reclaimedslopes is often experienced due to the unconsolidated nature of the reclaimedmaterials. Aesthetically, the disturbed land is very unsightly prior toreclamation.
Surface DisturbanceSurface mining leads to large-scale disturbances on the surface of the Earth.The natural land surface is drastically changed by the mining activitiesthrough the removal of soil, rock, and coal. Depending on mining condi-tions and equipment, widespread changes in the locations of materials willoccur [5]. For example, an inadequate amount of material may be availableto fill the final pit of a surface coal mine. As a result, the areas will usually begraded to a topography that includes a lake or basins with at least a portionof the area having relatively steep slopes. Reclamation of contour mines andsometimes mountain-top removal mines often results in some very steepslopes [5]. These areas are prone to erosion and mass failure due to the steep-ness of the slopes and the loose, nonhomogeneous nature of the materialspresent. Unfortunately, erosion and mass wasting are often found to be themajor problems associated with surface mining because these reclaimed landforms are often in states of disequilibrium relative to the natural environ-ment where they were created [5]. The primary role of reclamation, therefore,is to achieve a landscape that approximates pre-mining conditions assumedto be near equilibrium with the local environmental factors.
Generation of GasesAlthough a surface mine releases less methane than an underground mine,as discussed earlier, the amount emitted into the atmosphere is still signifi-cant due to the large amount of surface-mined coal. Measurements of actualemissions of methane from surface mining are technically difficult, costly,and generally not available for inventory purposes; however, emissionfactors have been developed from a number of country-specific studies [6].Irving and Tailakov [6] estimate that surface mining releases 0.3 to 2.0 cubicmeters of methane per metric ton of coal mined.
Liquid Effluents/Acid Mine DrainageSurface mining operations raise some of the same issues that undergroundmining does. Contour and area mining generates 0.24 and 1.2 tons of liq-uid effluents per 1000 tons of coal produced, respectively, as comparedto 1.0 and 1.6 tons, respectively, for conventional and longwall mining
88 Coal Energy Systems
operations [9]. The presence of soluble salts such as sodium in discardedoverburden can cause saline and caustic conditions in topsoils if conditionsallow the upward migration of these salts. Also, oxidation processes resultin significant changes in chemistry. As discussed previously, when sulfidessuch as pyrite are present, acid is produced, and the solubility of elementstends to increase; hence, acid mine drainage is produced.
Hydrologic ImpactSurface mining affects surface stream runoff. The runoff may increase andsubsequent channel erosion may occur as a result of reduced infiltrationrates [1]. Conversely, streams may also be affected by decreased surfacerunoff where more permeable rock strata become exposed by the surfacemining. Modifications of the local or regional recharge zones involve chang-ing the infiltration rates by removal of vegetative cover, alteration of soilprofiles, and compaction. Reduced infiltration rates decrease groundwaterstorage and reduce water availability. These disruptions are of particularconcern in the semi-arid western region of the United States. Shallow andcoal seam aquifers can be drained by mining activity, causing temporary orpermanent loss of existing wells near mined areas [1].
The disturbance of the overburden during surface mining also causessignificant changes in the chemical nature of the system [5]. Such changesare due to the influence of water on the now-available soluble salts andto the changing redox conditions resulting from the influx of oxygen intothe system that was previously oxygen depleted. The movement of highconcentrations of salts and/or elements into existing or reestablished ground-water aquifer systems can occur due to the disruption of the consolidatedoverburden and increased water penetration into reclaimed land.
Solid Waste/DustWaste rock is a product of the mining process that influences the post-miningland surface. In the case of mountain-top removal and contour mining meth-ods, waste materials are often used to fill adjacent canyons or hollow areas.When these materials are used for canyon fill, steep slopes are formed thattend to be very erosive. Surface mining produces more solid waste thanunderground mining techniques, with 10 tons of solid waste produced per1000 tons of coal removed for both contour and area mining [9]. Conven-tional and longwall underground mining, on the other hand, produces 3 and5 tons of solid waste, respectively, per 1000 tons of coal removed. Similarly,dustiness associated with surface mining is significantly greater than thatof underground mining. The World Bank Group [9] reports dust generationof 0.1 and 0.06 ton per 1000 tons of coal produced for contour and areamining, respectively, while only 0.0006 and 0.01 ton of dust is generatedduring conventional and longwall underground mining, respectively.
The Effect of Coal Usage on Human Health and the Environment 89
Health Effects/Miner SafetySurface miners experience different safety issues from underground min-ers; in 2002, the annual death rate for surface miners was 0.2 per thousandminers [14]. Historically, underground miners suffered a greater rate of res-piratory diseases than did surface miners until regulations improved dustcontrol practices and mandated the use of personal air-purifying systems.Now the fatality rates are similar for surface and underground miners.
Legislation/ReclamationBecause coal mining can have a significant impact on the environment andhealth of miners, coal producers are required to go through a complicatedprocess to obtain local, state, and federal permits to mine. Coal mining isone of the most extensively regulated industries in the United States [16,17].A company must comply with many laws and regulations, and meeting allthe requirements is a long and difficult process [16,18]. Up to 10 years canpass between the start of planning a mine and mining the first ton of coal.A coal company must provide detailed information on how the coal will bemined and how the land will be reclaimed, on the quality and quantity ofsurface and underground water sources and how the mining operations willaffect them, and on the method to transport the coal from the mine andhow the area will be affected by the transportation. The coal company has toreturn the land to approximately the same physical contour and to a state ofproductivity equal to or better than pre-mining conditions. Wildlife habitatcannot be permanently disrupted, and archeological sites must be protected.Companies must post bonds as high as $10,000/acre to ensure that the siteswill be reclaimed [16].
Unfortunately, concern for the environment was not always a highpriority in the past and as a result there are many abandoned mines. A taxon mined coal is earmarked for the Federal Abandoned Mines Land Fundto finance reclamation projects of these orphaned mines. Some states hadreclamation laws on their books since the 1930s; however, it was not until1977 that Congress enacted the Surface Mining Control and ReclamationAct (SMCRA), which mandated strict regulation of surface mining [16]. Thisact, along with other federal laws (specifically, the Clean Air Act, the CleanWater Act, and the National Environmental Policy Act), has had a significantimpact on surface mining. In addition, many other legislative acts affectsurface mining in the United States and, as noted from the names listedbelow, cover a host of subject areas [16]:
• American Indian Religious Freedom Act of 1978;• Antiquities Act of 1906;• Archeological and Historical Preservation Act of 1974;• Archeological Salvage Act;• Bald Eagle Protection Act of 1969;• Endangered Species Act of 1963;
90 Coal Energy Systems
• Fish and Wildlife Coordination Act of 1934;• Forest and Rangeland Resources Planning Act of 1974;• Historic Preservation Act of 1966;• Migratory Bird Treaty Act of 1918;• Mining and Minerals Policy Act of 1970;• Multiple Use–Sustained Yield Act of 1960;• National Forests Management Act of 1976;• National Trails System Act;• Noise Control Act of 1976;• Resource Conservation and Recovery Act;• Safe Drinking Water Act of 1974;• Soil and Water Resources Conservation Act of 1977;• Wild and Scenic Rivers Act;• Wilderness Act of 1964.
Although the mining industry must be cognizant of many laws andregulations, and past mining operations were not environmentally consci-entious, mine reclamation has become a success story in the United States.Mine operators are addressing the issues discussed earlier in this chapter, andas coal continues to be a major energy source for the United States the miningindustry; federal, state, and local governments; and the general public willhave to continue working closely together to minimize the environmentaland health impacts of coal mining.
Surface mining of coal should be regarded as a temporary land use. Theenactment of stringent laws requiring that the land be returned to its orig-inal condition or better has meant that restoration of the land surface andrehabilitation of the soil materials have now become normal parts of theplanning, approval, and operation of most surface mines. Many examples ofhigh-quality restored land can now be found, and the Office of Surface Miningannually recognizes companies and individuals whose efforts are exemplary.These companies and individuals are honored for not only doing the recla-mation required of them but also for going beyond the requirements toachieve outstanding landscape restoration [19]. Internationally, many coun-tries have legislation governing the restoration and rehabilitation of the land[17]. Major coal-producing countries, such as Canada, Germany, the UnitedKingdom, Australia, and South Africa, practice reclamation. Unfortunately,for economic reasons, in less-developed countries such as China, India, andIndonesia less reclamation is being practiced.
Coal Preparation
The purpose of coal preparation is to improve the quality of the coal to makeit suitable for a specific purpose by [20,21]:
• Crushing;• Screening;

The Effect of Coal Usage on Human Health and the Environment 91
• Conventional cleaning;• Deep cleaning;• Blending;• Dedusting.
Run-of-mine (ROM) coal generally falls into two major groups: thatfrom underground mining and that from strip mining. Underground miningtends to produce a finer product than strip mining; however, both productsare further crushed to produce the desired size for a coal cleaning processor directly for utilization (e.g., combustion or gasification) [20]. In addition,increased mechanization in the underground mining industry has decreasedselectivity and increased the volume of refuse [21]. Equipment such ascontinuous miners or longwall shearers often takes roof and floor rock inaddition to the coal. Also, equipment currently used to mine and transportcoal produces more fine coal particles than did earlier equipment [21].
End-use facilities such as power plants are designed for optimal com-bustion to burn a coal with a specific composition of ash, sulfur, energy, and,sometimes, volatile matter content. These requirements are becoming moredifficult to meet with ROM coal or coal from one specific source because ofseveral factors: coal variability (e.g., ash and sulfur contents) within the coalseam, considerable variation in underground mined coal quality due to theinclusion of roof and floor layers, the need for reduced sulfur content due tolimitations on sulfur dioxide emissions from power plants, and the declin-ing quality of coal being mined in the eastern United States as higher qualityreserves have been depleted. Consequently, techniques have been imple-mented to upgrade the coal quality, and the need for advanced coal cleaningprocesses for both coarse coal and fine coal has grown [21].
In the past, coal was predominantly cleaned by dry methods, whichhave been abandoned in recent years in favor of wet cleaning processes dueto several factors: particle size requirements (grinding the coal to finer sizesliberates more ash from the coal); dust emissions (which can be controlledby the use of water in underground mines); transportation issues; health,safety, and noise impacts; and the better performance of wet processes forcoal cleaning [21]. A coal preparation plant separates the material it receivesinto a product stream and a reject stream, which may be further divided intocoarse and fine refuse streams. Depending on the source, 20 to 50% of thematerial delivered to a coal preparation plant may be rejected [20]. One ofthe reject streams is a slurry, a blend of water, coal fines, silt, sand, and clayparticles, which is most commonly disposed of in an impoundment [21].
The coal cleaning processes predominantly in use now include densemedium separation, hydraulic separation, froth flotation, and agglomeration[20]. Dense medium separations include those coal preparation processesthat clean raw coal, coarse or fine, by immersing it in a fluid having adensity intermediate between clean coal and the rejects. Because there isa general correlation between ash content and specific gravity, it is possibleto achieve the required degree of removal of impurities from raw coal by

92 Coal Energy Systems
regulating the specific gravity of the separating fluid, which can be organicliquids, dissolved salts in water, aerated solids, or suspensions of fine solidssuspended in water [20]. Hydraulic separation jigging is a process of coarseparticle stratification in which the particle rearrangement results from analternative expansion and compaction of a bed of particles by pulsatingflow. The rearrangement results in layers of particles that are arranged byincreasing density from top to bottom of the bed, with the coal near the top.Hydraulic concentration of fine coal is performed using wet concentratingtables, cyclones, launders, feldspar jigs, and hydrorotators. These processesdepend on the physical characteristics—size, shape, and density—of parti-cles suspended in a liquid medium to effect a concentration of desired quality[20]. Froth flotation is a chemical process that depends on the selective adhe-sion of some solids (i.e., fine coal) to air and the simultaneous adhesion ofother particles (i.e., refuse) to water. A separation of coal from coal wastethen occurs as finely disseminated air bubbles are passed through a feedcoal slurry. Agglomeration works on a similar principal as froth flotation(i.e., differences in the surface properties of coal and inorganic matter), andfine coal particles in a suspension can be readily be agglomerated by theaddition of a bridging liquid (many different oils), under agitation, and thenrecovered while the inorganic constituents remain in the aqueous suspensionand are rejected.
These processes, briefly described here, impact the environment in sev-eral ways, including making it necessary to deal with the contaminationaspects of fine coal cleaning and “blackwater’‘ disposal, air contamination,refuse disposal and control, and operator health and safety.
Water Contamination from Preparation PlantsThe effluents from coal preparation plants and waters draining from plantsite surfaces contain fine coal and coal refuse materials in suspension. Atolder plants, the disposal of effluent continues to present a serious problemas it is becoming increasingly difficult to comply with the standards requiredby many water authorities and pollution control agencies [20]. New plants,however, are installing more complex clarification facilities, and new plantsare designed to operate on a closed circuit to satisfy pollution requirements.
Air Contamination from Preparation PlantsPreparation of fine coal can cause air pollution if proper dust and gas removalequipment is not installed. The air effluent from a fine coal preparationplant consists of entrained dust, both coal and ash, and various gases, pri-marily consisting of products of coal combustion from thermal dryers [20].Sources of particulates include thermal dryers, pneumatic coal-cleaningequipment, coal processing and conveying equipment, screening equipment,
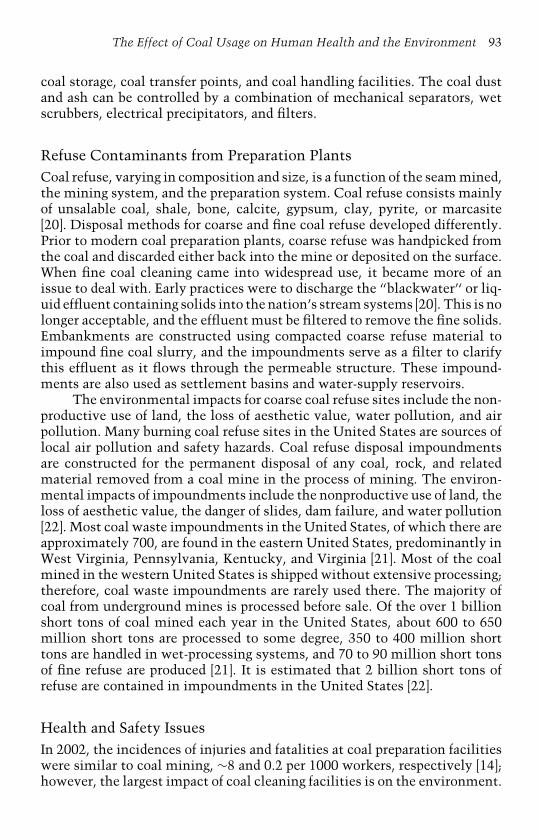
The Effect of Coal Usage on Human Health and the Environment 93
coal storage, coal transfer points, and coal handling facilities. The coal dustand ash can be controlled by a combination of mechanical separators, wetscrubbers, electrical precipitators, and filters.
Refuse Contaminants from Preparation PlantsCoal refuse, varying in composition and size, is a function of the seam mined,the mining system, and the preparation system. Coal refuse consists mainlyof unsalable coal, shale, bone, calcite, gypsum, clay, pyrite, or marcasite[20]. Disposal methods for coarse and fine coal refuse developed differently.Prior to modern coal preparation plants, coarse refuse was handpicked fromthe coal and discarded either back into the mine or deposited on the surface.When fine coal cleaning came into widespread use, it became more of anissue to deal with. Early practices were to discharge the “blackwater’‘ or liq-uid effluent containing solids into the nation’s stream systems [20]. This is nolonger acceptable, and the effluent must be filtered to remove the fine solids.Embankments are constructed using compacted coarse refuse material toimpound fine coal slurry, and the impoundments serve as a filter to clarifythis effluent as it flows through the permeable structure. These impound-ments are also used as settlement basins and water-supply reservoirs.
The environmental impacts for coarse coal refuse sites include the non-productive use of land, the loss of aesthetic value, water pollution, and airpollution. Many burning coal refuse sites in the United States are sources oflocal air pollution and safety hazards. Coal refuse disposal impoundmentsare constructed for the permanent disposal of any coal, rock, and relatedmaterial removed from a coal mine in the process of mining. The environ-mental impacts of impoundments include the nonproductive use of land, theloss of aesthetic value, the danger of slides, dam failure, and water pollution[22]. Most coal waste impoundments in the United States, of which there areapproximately 700, are found in the eastern United States, predominantly inWest Virginia, Pennsylvania, Kentucky, and Virginia [21]. Most of the coalmined in the western United States is shipped without extensive processing;therefore, coal waste impoundments are rarely used there. The majority ofcoal from underground mines is processed before sale. Of the over 1 billionshort tons of coal mined each year in the United States, about 600 to 650million short tons are processed to some degree, 350 to 400 million shorttons are handled in wet-processing systems, and 70 to 90 million short tonsof fine refuse are produced [21]. It is estimated that 2 billion short tons ofrefuse are contained in impoundments in the United States [22].
Health and Safety IssuesIn 2002, the incidences of injuries and fatalities at coal preparation facilitieswere similar to coal mining, ∼8 and 0.2 per 1000 workers, respectively [14];however, the largest impact of coal cleaning facilities is on the environment.
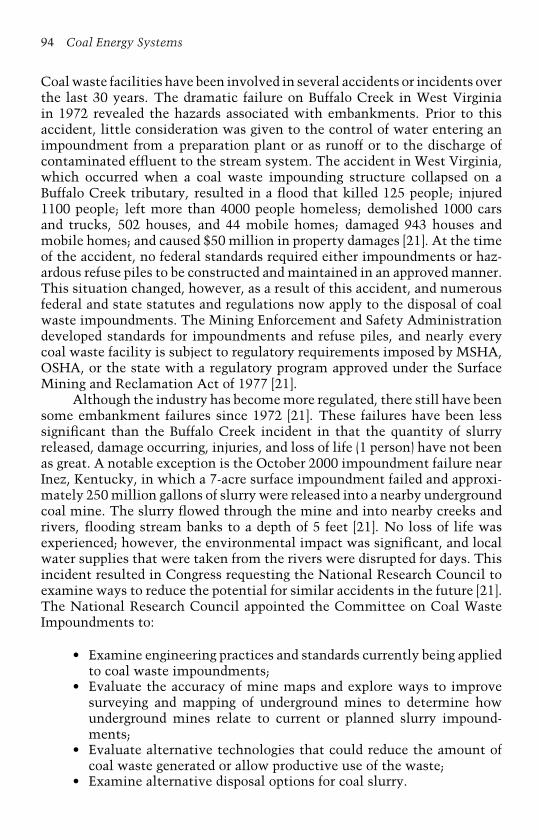
94 Coal Energy Systems
Coal waste facilities have been involved in several accidents or incidents overthe last 30 years. The dramatic failure on Buffalo Creek in West Virginiain 1972 revealed the hazards associated with embankments. Prior to thisaccident, little consideration was given to the control of water entering animpoundment from a preparation plant or as runoff or to the discharge ofcontaminated effluent to the stream system. The accident in West Virginia,which occurred when a coal waste impounding structure collapsed on aBuffalo Creek tributary, resulted in a flood that killed 125 people; injured1100 people; left more than 4000 people homeless; demolished 1000 carsand trucks, 502 houses, and 44 mobile homes; damaged 943 houses andmobile homes; and caused $50 million in property damages [21]. At the timeof the accident, no federal standards required either impoundments or haz-ardous refuse piles to be constructed and maintained in an approved manner.This situation changed, however, as a result of this accident, and numerousfederal and state statutes and regulations now apply to the disposal of coalwaste impoundments. The Mining Enforcement and Safety Administrationdeveloped standards for impoundments and refuse piles, and nearly everycoal waste facility is subject to regulatory requirements imposed by MSHA,OSHA, or the state with a regulatory program approved under the SurfaceMining and Reclamation Act of 1977 [21].
Although the industry has become more regulated, there still have beensome embankment failures since 1972 [21]. These failures have been lesssignificant than the Buffalo Creek incident in that the quantity of slurryreleased, damage occurring, injuries, and loss of life (1 person) have not beenas great. A notable exception is the October 2000 impoundment failure nearInez, Kentucky, in which a 7-acre surface impoundment failed and approxi-mately 250 million gallons of slurry were released into a nearby undergroundcoal mine. The slurry flowed through the mine and into nearby creeks andrivers, flooding stream banks to a depth of 5 feet [21]. No loss of life wasexperienced; however, the environmental impact was significant, and localwater supplies that were taken from the rivers were disrupted for days. Thisincident resulted in Congress requesting the National Research Council toexamine ways to reduce the potential for similar accidents in the future [21].The National Research Council appointed the Committee on Coal WasteImpoundments to:
• Examine engineering practices and standards currently being appliedto coal waste impoundments;
• Evaluate the accuracy of mine maps and explore ways to improvesurveying and mapping of underground mines to determine howunderground mines relate to current or planned slurry impound-ments;
• Evaluate alternative technologies that could reduce the amount ofcoal waste generated or allow productive use of the waste;
• Examine alternative disposal options for coal slurry.
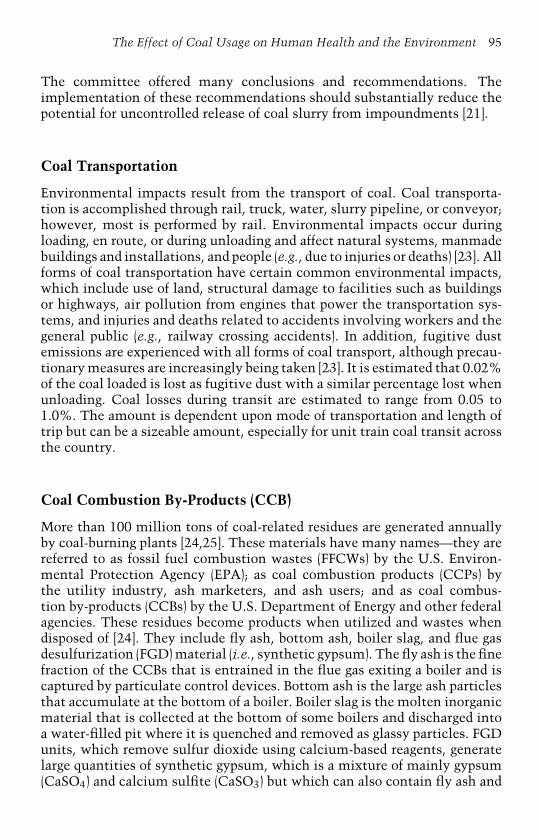
The Effect of Coal Usage on Human Health and the Environment 95
The committee offered many conclusions and recommendations. Theimplementation of these recommendations should substantially reduce thepotential for uncontrolled release of coal slurry from impoundments [21].
Coal Transportation
Environmental impacts result from the transport of coal. Coal transporta-tion is accomplished through rail, truck, water, slurry pipeline, or conveyor;however, most is performed by rail. Environmental impacts occur duringloading, en route, or during unloading and affect natural systems, manmadebuildings and installations, and people (e.g., due to injuries or deaths) [23]. Allforms of coal transportation have certain common environmental impacts,which include use of land, structural damage to facilities such as buildingsor highways, air pollution from engines that power the transportation sys-tems, and injuries and deaths related to accidents involving workers and thegeneral public (e.g., railway crossing accidents). In addition, fugitive dustemissions are experienced with all forms of coal transport, although precau-tionary measures are increasingly being taken [23]. It is estimated that 0.02%of the coal loaded is lost as fugitive dust with a similar percentage lost whenunloading. Coal losses during transit are estimated to range from 0.05 to1.0%. The amount is dependent upon mode of transportation and length oftrip but can be a sizeable amount, especially for unit train coal transit acrossthe country.
Coal Combustion By-Products (CCB)
More than 100 million tons of coal-related residues are generated annuallyby coal-burning plants [24,25]. These materials have many names—they arereferred to as fossil fuel combustion wastes (FFCWs) by the U.S. Environ-mental Protection Agency (EPA); as coal combustion products (CCPs) bythe utility industry, ash marketers, and ash users; and as coal combus-tion by-products (CCBs) by the U.S. Department of Energy and other federalagencies. These residues become products when utilized and wastes whendisposed of [24]. They include fly ash, bottom ash, boiler slag, and flue gasdesulfurization (FGD) material (i.e., synthetic gypsum). The fly ash is the finefraction of the CCBs that is entrained in the flue gas exiting a boiler and iscaptured by particulate control devices. Bottom ash is the large ash particlesthat accumulate at the bottom of a boiler. Boiler slag is the molten inorganicmaterial that is collected at the bottom of some boilers and discharged intoa water-filled pit where it is quenched and removed as glassy particles. FGDunits, which remove sulfur dioxide using calcium-based reagents, generatelarge quantities of synthetic gypsum, which is a mixture of mainly gypsum(CaSO4) and calcium sulfite (CaSO3) but which can also contain fly ash and

96 Coal Energy Systems
unreacted lime or limestone [24,25]. In 2000, CCB production in the UnitedStates was 108,050,000 short tons and was comprised of [25]:
• Fly ash—62,810,000 short tons, or 58.1% of the total generated;• Bottom ash—16,940,000 short tons, or 15.7% of the total generated;• Boiler slag—2,670,000 short tons, or 2.5% of the total generated;• FGD material—25,630,000 short tons, or 23.7% of the total
generated.
In the United States, approximately 30% of the CCBs are used in a varietyof applications, with the remainder being disposed of [25]. The componentsof the CCBs have different uses because they have distinct chemical andphysical properties that make them suitable for specific applications. CCBsare used in cement and concrete; mine backfill, agriculture, blasting grit, androofing applications; waste stabilization; wallboard production; acid minedrainage control; and as road base/subbase, anti-skid material, fillers, andextenders [24,25].
Globally, CCB use varies significantly. In Europe, more CCBs are usedthan in the United States; for example, in 1999, 56% of the CCBs were prof-itably used in Europe compared to about 30% in the United States [25]. TheCCBs are used in a number of applications, primarily in concrete, portlandcement manufacture, and road construction. Raw materials shortages andfavorable state regulations account for higher usage in Europe than in theUnited States. Countries such as Canada, India, and Japan utilize 27, 13, and84% of their CCBs, respectively [25]. Canada’s usage is similar to that of theUnited States, CCB usage in India is low due to the relatively large amountof CCBs produced because of the coal’s high ash content, and Japan utilizesmost of its CCBs due to the high cost of disposal in Japan.
Coal combustion by-products primarily contain elements such as iron,aluminum, magnesium, manganese, calcium, potassium, sodium, and sil-ica, which for the most part are innocuous. CCBs also contain small amountsof trace elements such as arsenic, barium, beryllium, cadmium, cobalt,chromium, copper, nickel, lead, selenium, zinc, and mercury. These ele-ments can be classified as essential nutrients, toxic elements, or prioritypollutants and are considered to have some environmental or public healthimpacts [24]. The risks include potential groundwater contamination of traceelements and above-ground human health impacts through inhalation andingestion of contaminants released through wind erosion and surface watererosion and runoff [26].
The Resource Conservation and Recovery Act (RCRA) has been theprimary statute governing the management and use of CCBs. The EPAwas considering some form of Subtitle C regulation (i.e., classify CCBs ashazardous wastes) under the RCRA for CCBs used in mine backfill or foragricultural applications [26]; however, the agency investigated the dangersof CCBs to human health and the environment and concluded that CCBs do
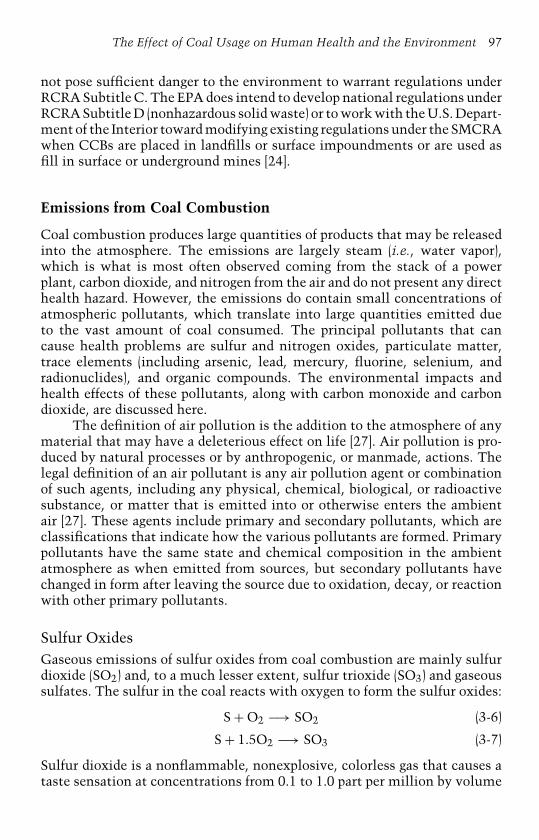
The Effect of Coal Usage on Human Health and the Environment 97
not pose sufficient danger to the environment to warrant regulations underRCRA Subtitle C. The EPA does intend to develop national regulations underRCRA Subtitle D (nonhazardous solid waste) or to work with the U.S. Depart-ment of the Interior toward modifying existing regulations under the SMCRAwhen CCBs are placed in landfills or surface impoundments or are used asfill in surface or underground mines [24].
Emissions from Coal Combustion
Coal combustion produces large quantities of products that may be releasedinto the atmosphere. The emissions are largely steam (i.e., water vapor),which is what is most often observed coming from the stack of a powerplant, carbon dioxide, and nitrogen from the air and do not present any directhealth hazard. However, the emissions do contain small concentrations ofatmospheric pollutants, which translate into large quantities emitted dueto the vast amount of coal consumed. The principal pollutants that cancause health problems are sulfur and nitrogen oxides, particulate matter,trace elements (including arsenic, lead, mercury, fluorine, selenium, andradionuclides), and organic compounds. The environmental impacts andhealth effects of these pollutants, along with carbon monoxide and carbondioxide, are discussed here.
The definition of air pollution is the addition to the atmosphere of anymaterial that may have a deleterious effect on life [27]. Air pollution is pro-duced by natural processes or by anthropogenic, or manmade, actions. Thelegal definition of an air pollutant is any air pollution agent or combinationof such agents, including any physical, chemical, biological, or radioactivesubstance, or matter that is emitted into or otherwise enters the ambientair [27]. These agents include primary and secondary pollutants, which areclassifications that indicate how the various pollutants are formed. Primarypollutants have the same state and chemical composition in the ambientatmosphere as when emitted from sources, but secondary pollutants havechanged in form after leaving the source due to oxidation, decay, or reactionwith other primary pollutants.
Sulfur OxidesGaseous emissions of sulfur oxides from coal combustion are mainly sulfurdioxide (SO2) and, to a much lesser extent, sulfur trioxide (SO3) and gaseoussulfates. The sulfur in the coal reacts with oxygen to form the sulfur oxides:
S + O2 −→ SO2 (3-6)
S + 1.5O2 −→ SO3 (3-7)
Sulfur dioxide is a nonflammable, nonexplosive, colorless gas that causes ataste sensation at concentrations from 0.1 to 1.0 part per million by volume
98 Coal Energy Systems
(ppmv) in air [28]. At concentrations greater than 3.0 ppm, the gas has apungent, irritating odor. Sulfur dioxide is partly converted to sulfur trioxideor sulfuric acid (H2SO4) and its salts by photochemical or catalytic processesin the atmosphere. Sulfur trioxide and water form sulfuric acid.
Environmental EffectsEnvironmental effects of sulfur compounds include impaired visibility, dam-age to materials, damage to vegetation, and deposition as acid rain. Fineparticles in the atmosphere reduce the visual range by scattering and absorb-ing light [28]. Aerosols of sulfuric acid and other sulfates comprise from 5 to20% of the total suspended particulate matter in urban air, thus contributingto the reduction in visibility.
Sulfur compounds are responsible for major damage to materials. Sulfuroxides generally accelerate metal corrosion by first forming sulfuric acideither in the atmosphere or on the metal surface. Sulfur dioxide is the mostdetrimental pollutant with regard to metal corrosion [28]. Temperature andrelative humidity also significantly influence the rate of corrosion. Sulfurousand sulfuric acids are capable of damaging a wide variety of building materialsincluding limestone, marble, roofing slate, and mortar. Textiles made ofnylon are also susceptible to pollutants in the atmosphere.
In general, the damage to plants from air pollution usually occurs inthe leaf structure, as the leaf contains the building blocks for the entireplant [28]. Sulfur dioxide enters the leaf, and the plant cells convert it tosulfite and then into sulfate. Apparently, when excessive sulfur dioxide ispresent, the cells are unable to oxidize sulfite to sulfate fast enough anddisruption of the cell structure begins. Spinach, lettuce, and other leafy veg-etables are most sensitive, as are cotton and alfalfa. Pine needles are alsoaffected, with either the needle tip or the entire needle becoming brown andbrittle.
Acidic deposition or acid rain occurs when emissions of sulfur diox-ide and oxides of nitrogen in the atmosphere react with water, oxygen, andoxidants to form acidic compounds. These compounds fall to the ground ineither dry form (i.e., gas and particles) or wet form (i.e., rain, snow, and fog).The acidity of water is reported in terms of the pH, where pH is the logarithm(base 10) of the molar concentration of hydrogen ions:
pH = −log10[H+] (3-8)
Pure water contains a hydrogen ion concentration that is approximately10−7 molar or pH = 7, which is referred to as neutral pH. Water dropletsformed in the atmosphere, however, normally have a pH of ∼5.6 becauseatmospheric carbon dioxide is dissolved in the rain and forms carbonicacid (H2CO3). When sulfur dioxide or nitrogen oxides are also dissolvedin the water, the pH drops; average yearly pH values of 4.0 to 4.5 arereported in the eastern United States [28]. Sulfur dioxide can be absorbed

The Effect of Coal Usage on Human Health and the Environment 99
from the gas phase into an aqueous droplet, creating acidic conditions asfollows [28]:
SO2(g) ⇐⇒ SO2(aq) (3-9)
SO2(aq) + H2O ⇐⇒ HSO−3 + H+ (3-10)
HSO−3 ⇐⇒ SO2−
3 + H+ (3-11)
SO2+3 + H2O ⇐⇒ SO2−
3 + 2H+ (3-12)
Several effects of acid rain are of concern. Acidification of natural watersources can have a devastating effect on fish; trout and salmon are partic-ularly sensitive to a low pH [28], and reproduction in many fish fails tooccur at a pH less than 5.5. A decrease in plankton and bottom fauna is alsoobserved as the pH drops which reduces the food supply for the fish. Leachingof nutrients occurs from the soil, and this demineralization can lead to lossin productivity of crops and forests or a change in natural vegetation. Vege-tation itself can be directly damaged. An increase in corrosion to materialsis also observed.
Health EffectsSulfur dioxide and other oxides of sulfur have been studied extensively; how-ever, many questions concerning the effects of sulfur dioxide upon healthremain unanswered [28]. Few epidemiological studies have been able todifferentiate adequately the effects of individual pollutants because sulfuroxides tend to occur in the same kinds of atmospheres as particulate mat-ter and high humidity. High concentrations of sulfur dioxide can result intemporary breathing impairment in asthmatic children and adults who areactive outdoors [29]. Short-term exposures of asthmatic individuals at mod-erate exertion to elevated sulfur dioxide levels may result in reduced lungfunction that may be accompanied by such symptoms as wheezing, chesttightness, or shortness of breath. Other effects that have been associatedwith longer term exposures to high concentrations of sulfur dioxide in con-junction with high levels of particulate matter include respiratory illness,alterations in the lung’s defenses, and aggravation of existing cardiovasculardisease. Those who may be affected under these conditions include individ-uals with cardiovascular disease or chronic lung disease, as well as childrenand the elderly.
The relationship between human health and the concentration of sul-fur dioxide in the atmosphere is a very complex one to decipher, especiallybecause compounding factors such as other pollutants (e.g., particulatematter) and high humidity often occur simultaneously. Consequently,the Electric Power Research Institute (EPRI) has designed a programcalled the Aerosol Research and Inhalation Epidemiology Study (ARIES) toaddress the issue of air pollution components by coupling an extensive air
100 Coal Energy Systems
quality monitoring effort with five health studies: daily mortality, emer-gency room visits, heart rate variability, arrhythmic events, and unscheduledphysician visits [30]. ARIES started in 1998 and Atlanta, Georgia, wasselected by the EPA to be the first site. In Atlanta, the health effects ofsuspended particulate matter (PM)—fine particulate matter less than 2.5 µm(PM2.5)—were studied, and preliminary results suggest that adverse healtheffects appear to be associated with carbon-containing PM and not the sul-fate and nitrate components primarily derived from coal combustion. Thestudy has been expanded to include Chicago and will be followed by studiesin four additional cities.
Nitrogen Oxides (NOx)Seven oxides of nitrogen are present in ambient air [28]. These include nitricoxide (NO), nitrogen dioxide (NO2), nitrous oxide (N2O), NO3, N2O3, N2O4,and N2O5. Nitric oxide and nitrogen dioxide are collectively referred toas NOx due to their interconvertibility in photochemical smog reactions.The term NOy is often used to represent the sum of the reactive oxides ofnitrogen and all other compounds that are atmospheric products of NOx .NOy includes compounds such as nitric acid (HNO3), nitrous acid (HNO2),nitrate radical (NO3), dinitrogen pentoxide (N2O5), and peroxyacetyl nitrate(PAN). It excludes N2O and ammonia (NH3) because they are not normallythe products of NOx reactions [28].
Nitrogen oxide emissions from coal combustion are produced fromthree sources: thermal NOx , fuel NOx , and prompt NOx . Nitrogen oxides areprimarily produced as a result of the fixation of atmospheric nitrogen at hightemperatures (thermal NOx ) and the oxidation of coal nitrogen compounds(fuel NOx ). Prompt NOx is formed when hydrocarbon radical fragments inthe flame zone react with nitrogen to form nitrogen atoms, which then formNO. The majority of the oxide species produced is NO, with NO2 accountingfor less than 5% of the total [31].
The production of thermal NO is a function of the combustion temper-ature and fuel-to-air ratio and increases exponentially at temperatures above2650◦F. Thermal NO can be predicted by the following equation [32]:
[NO] = K1e−k2/T [N2][O2]1/2t (3-13)
where T is temperature, t is time, K1 and K2 are constants, and [N2] and[O2] are concentrations in moles. Accordingly, thermal NO can be decreasedby reducing the time, temperature, and concentration of N2 and O2. Theprincipal reactions in the formation of thermal NO, which are referred to asthe extended Zeldovich mechanism, are:
N2 + O2 ⇐⇒ NO + N (3-14)
N + O2 ⇐⇒ NO + O (3-15)
N + OH ⇐⇒ NO + H (3-16)

The Effect of Coal Usage on Human Health and the Environment 101
Reaction (3-14) is assumed to be the rate-determining step due to the highactivation energy required to break the triple bond in the nitrogen molecule.Reaction (3-16) has been found to contribute under fuel-rich conditions. Thegeneral conclusion is that very little thermal NO is formed in the combustionzone and that the majority is formed in the post-flame region, where theresidence time is longer.
Prompt NO is produced by the reaction of hydrocarbon fragments andmolecular nitrogen in the flame front. Prompt NO is most significant in fuel-rich flames, where the concentration of radicals such as O and OH can exceedequilibrium values, thereby enhancing the rate of NO formation. Prompt NOoccurs due to the collision of hydrocarbons with molecular nitrogen in thefuel-rich flames to form HCN (hydrogen cyanide) and N. The HCN is thenconverted to NO by a series of reactions among NCO, H, O, OH, NH, and N.The amount of prompt NO generated is proportional to the concentration ofN2 and the number of carbon atoms present in the gas phase, but the totalamount produced is low in comparison to the total thermal and fuel NO incoal combustion. The two reactions believed to be the most significant withregard to the mechanism for formation of prompt NO are [33]:
CH + N2 ⇐⇒ HCN + N (3-17)
C + N2 ⇐⇒ CN + N (3-18)
Reaction (3-17) was originally proposed, and Reaction (3-18) was added as aminor, but non-negligible, contributor to prompt NO; its importance growswith increasing temperature.
Fuel NO is the primary source of NOx in flue gas from coal combus-tion and is formed from the gas-phase oxidation of devolatilized nitrogen-containing species and the heterogeneous combustion of nitrogen-containingchar in the tail of the flame [31]. At temperatures below 2650◦F, fuel NO canaccount for more than 75% of the measured NO in coal flames and can beas high as 95%. The reason for the dominance of fuel NO in coal systems isbecause of the moderate temperatures (2240–3140◦F) and the locally fuel-richnature of most coal flames. Fuel NO is produced more readily than thermalNO because the N–H and N–C bonds common in fuel-bound nitrogen areweaker than the triple bond in molecular nitrogen in the air, which must bedissociated to produce thermal NO. Combustion conditions and the nitrogencontent of a coal affect the quantity of NO emissions. During devolatiliza-tion, a portion of the coal nitrogen is released as HCN and to a lesser extentas NH3. HCN readily reacts with oxygen to form NO, but some of this NOcan be converted to N2 by reaction with hydrocarbon radicals in fuel-richzones:
Fuel N(
NH3HCN
)————>NO/Ox
(N2NO
)(3-19)

102 Coal Energy Systems
Nitrogen retained in the char is also oxidized to NO, which may react withthe char surface or hydrocarbon radicals to form N2. Much of the coal nitro-gen is initially converted to NO. The final NO emissions, however, aredetermined largely by the extent of conversion of NO to N2 in the vari-ous regions of the combustion unit. Unlike thermal NO, the productionof fuel NO is relatively insensitive to temperature over the range found inpulverized coal flames and more sensitive to the air-to-fuel ratio [32,34].
Environmental EffectsBoth NOx and NOy (i.e., HNO3) have been shown to accelerate damage tomaterials in the ambient air. NOx affects dyes and fabrics, resulting in fad-ing, discoloration of archival and artistic materials and textile fibers, andloss of textile fabric strength [28]. NO2 absorbs visible light and at a con-centration of 0.25 ppmv will cause appreciable reduction in visibility. NO2affects vegetation, as studies have shown suppressed growth of pinto beansand tomatoes and reduced yields of oranges. In the presence of sunlight,nitrogen oxides react with unburned hydrocarbons—volatile organic com-pounds (VOCs) that are emitted primarily from motor vehicles but also fromchemical plants, refineries, factories, consumer and commercial products,and other industrial sources—to form photochemical smog.
Nitrogen oxides also contribute to the formation of acid rain. NO andNO2 in the ambient air can react with moisture to form NO−
3 and H+ inthe aqueous phase (i.e., nitric acid), which can cause considerable corro-sion of metal surfaces. The kinetics of nitric acid formation are not as wellunderstood as those for the formation of sulfuric acid discussed earlier. Nitro-gen oxides contribute to changes in the composition and competition ofsome species of vegetation in wetland and terrestrial systems, acidificationof freshwater bodies, eutrophication (i.e., explosive algae growth leadingto depletion of oxygen in the water) of estuarine and coastal waters, andincreases in the levels of toxins harmful to fish and other aquatic life [29].
Health EffectsNitrogen dioxide acts as an acute irritant and in equal concentrations is moreinjurious than NO; however, at concentrations found in the atmosphere,NO2 is only potentially irritating and related to chronic obstructive pul-monary disease [28]. EPRI has shown from their early results from the ARIESstudy that the nitrate components of coal combustion do not have adversehealth effects [30]. The EPA reports that short-term exposures (e.g., less thanthree hours) to current NO2 concentrations may lead to changes in airwayresponsiveness and lung function in individuals with preexisting respiratoryillnesses and increases in respiratory illnesses in children from 5 to 12 yearsin age [29]. The EPA also reports that long-term exposures to NO2 may leadto increased susceptibility to respiratory infection and may cause alterationsin the lung. Atmospheric transformation of NOx can lead to the formation of

The Effect of Coal Usage on Human Health and the Environment 103
ozone and nitrogen-bearing particles (most notably in some western UnitedStates urban areas), which are associated with adverse health effects [29].
Particulate Matter (PM)Particulate matter is the general term used for a mixture of solid particles andliquid droplets found in the air. Some particles are large or dark enough tobe seen as soot or smoke, while others are so small they cannot be seen withthe naked eye. These small particles, which come in a wide range of sizes,originate from many different stationary and mobile sources as well as nat-ural sources [29]. Fine particles, those less than 2.5 µm (PM2.5), result fromfuel combustion from motor vehicles, power generation, industrial facilities,and residential fireplaces and woodstoves. Coarse particles, those larger than2.5 µm but classified as less than 10 µm (PM10), are generally emitted fromsources such as vehicles traveling on unpaved roads, materials handling,crushing and grinding operations, and windblown dust [29]. Some particlesare emitted directly from their sources, such as smokestacks and cars. Inother cases, gases such as SO2, NOx , and VOCs react with other compoundsin the air to form fine particles.
Coal generally contains from 5 to 20 weight percent (wt.%) mineralmatter (i.e., ash content per a proximate analysis) [5]. During combustion,most of the minerals are transformed into dust-sized glassy particles and,along with some unaltered mineral grains and unburned carbon, are emittedfrom smokestacks. Particle composition and emission levels are complexfunctions of firing configuration, boiler operation, and coal properties [27].In dry-bottom, pulverized coal-fired systems (various types of combustionsystems are described in Chapter 5), combustion is very good, and the parti-cles are largely composed of inorganic ash residue. In wet-bottom, pulverizedcoal-fired units and cyclone-fired boilers, the amount of fly ash is less thanin dry-bottom units because some of the ash melts and is removed from thesystem as slag. Spreader stokers, which fire a mixture of fine and coarsecoal, tend to have a significant quantity of unburned carbon in the fly ash.Overfed and underfed stokers emit considerably less particulate than pulver-ized coal-fired units or spreader stokers because combustion takes place on arelatively undisturbed bed [27]. Fly ash reinjection for increased consumptionof unburned carbon or load changes can also affect particulate emissions.
Environmental EffectsParticulate matter is responsible for reduction in visibility. Visibility is prin-cipally affected by fine particles that are formed in the atmosphere fromgas-phase reactions. Although these particles are not directly visible, car-bon dioxide, water vapor, and ozone in increased concentrations change theabsorption and transmission characteristics of the atmosphere [28]. Partic-ulate matter can cause damage to materials depending upon its chemical

104 Coal Energy Systems
composition and physical state [28]. Particles will soil painted surfaces,clothing, and curtains merely by settling on them. Particulate matter cancause corrosive damage to metals either by intrinsic corrosiveness or by theaction of corrosive chemicals absorbed or adsorbed by inert particles. Little isknown of the effects of particulate matter in general on vegetation [28]. Thecombination of particulate matter and other pollutants such as sulfur diox-ide may affect plant growth. Coarse particles, such as dust, may be depositeddirectly onto leaf surfaces and reduce gas exchange, increase leaf surface tem-perature, and decrease photosynthesis. Toxic particles containing elementssuch as arsenic or fluorine can fall onto agricultural soils or plants that areingested by animals and thus can affect the animal’s health.
Health EffectsParticulate matter alone or in combination with other pollutants constitutesa very serious health hazard. The pollutants enter the human body mainly viathe respiratory system. Inhalable particulate matter includes both fine andcoarse particles. These particles can accumulate in the respiratory systemand are associated with numerous health effects [29]. Exposure to coarse par-ticles is primarily associated with the aggravation of respiratory conditionssuch as asthma. Fine particles are most closely associated with such healtheffects as increased hospital admissions and emergency room visits for heartand lung disease, increased respiratory symptoms and disease, decreased lungfunction, and even premature death. Sensitive groups that appear to be atgreatest risk include the elderly, individuals with cardiopulmonary diseasesuch as asthma, and children [35].
As previously mentioned, because particulate matter has been linkedwith adverse health effects at levels currently observed in the United States,EPRI has initiated the epidemiological study ARIES and comprehensive airquality monitoring to identify many of the components that might be asso-ciated with a particular health endpoint [30]. This is a critical undertaking,as knowledge of the true causative agents allows for better protection ofpublic health through regulation of those sources that produce harmful pol-lutants, especially in light of the fact that health effects drive the regulatoryagenda for proposed multipollutant legislation and air quality standards (seeChapter 4 for a discussion of such legislation).
ARIES, initiated in 1998 in Atlanta, was designed to address the issueof air pollution components by coupling an extensive air quality monitoringeffort with five health studies focused on distinct endpoints to cover a widerange of possible health effects: a daily mortality study conducted by KlemmAnalysis Group; an emergency room visit study conducted by Emory Univer-sity; a heart rate variability study conducted by Harvard University; a cardiacarrhythmic events study conducted by Emory University; and an unsched-uled physician visit study conducted by Kaiser Permanente [30]. Atlanta isthe first of six cities that will be studied, with Chicago currently in the

The Effect of Coal Usage on Human Health and the Environment 105
planning stages to be followed (tentatively) by Houston, Texas; Pittsburgh,Pennsylvania; a northeast city; and a western city. The major findings fromthe Atlanta study include the following [30]:
• Current levels of air pollution in the United States appear to becausing health effects;
• Different pollutants appear to impact different health endpoints (e.g.,for respiratory disease, the links are stronger for large particles andgases);
• Particulate matter components are important, but gases should notbe overlooked;
• The most toxic fraction of fine particulate matter appears to be thecarbon-containing fractions (organic and elemental carbon);
• There are no statistically significant associations between healthimpacts and sulfates and nitrates;
• Controlling the wrong pollutants will not yield health benefits.
It is generally recognized that coal-fired power plants can be importantcontributors to ambient fine particulate matter (PM2.5) mass concentrationsand regional haze. In 1999, coal-fired power plants emitted 1.5% of thetotal primary PM2.5 in the United States [36]. In response to growing con-cerns over PM2.5 being emitted into the atmosphere from coal-fired powerplants, the U.S. Department of Energy, National Energy Technology Labora-tory (DOE-NETL) is pursuing a major research effort to provide the appliedscience necessary to quantitatively relate the emissions from energy pro-duction to ambient PM2.5 concentrations and composition at downwindreceptors and to inform decision makers about management options applica-ble to coal-fired power generation to achieve the national standards for PM2.5and regional haze. Special emphasis has been given to Pittsburgh, Pennsyl-vania, and the surrounding upper Ohio River valley region because, on manyoccasions throughout the year, this region is downwind of major coal-firedpower plants and other industrial sources of air emissions and upwind of theBoston–Washington corridor, the largest regional complex of urban areas inthe United States.
Organic CompoundsOrganic compounds are unburned gaseous combustibles that are emittedfrom coal-fired boilers but generally in very small amounts [37]; however,for brief periods, unburned combustible emissions may increase significantlysuch as during system startup or upsets. The organic emissions from pulver-ized coal-fired or cyclone-fired units are lower than from smaller stoker-firedboilers, where operating conditions are not as well controlled [28].
Organic emissions are due to constituents present in the coal orare formed as products of incomplete combustion. Polycyclic organic

106 Coal Energy Systems
matter (POM) has also been referred to as polynuclear or polycyclicaromatic compounds (PACs). Nine major categories of POM have beenidentified by the EPA [38]. The most common organic compounds inthe flue gas of coal-fired boilers are polycyclic aromatic hydrocarbons(PAHs). Hydrocarbons as a class are not listed as criteria pollutants,although a large number of specific hydrocarbon compounds are listedamong the 188 hazardous air pollutants under Title III of the CleanAir Act Amendments of 1990 (see Chapter 4 for a discussion of regula-tions). Furthermore, the EPA has identified 16 PAH compounds as prioritypollutants: naphthalene, acenaphthylene, acenaphthene, fluorene, phenan-threne, anthracene, fluoranthene, pyrene, chrysene, benzo[a]anthracene,benzo[b]fluoranthene, benzo[k]fluoranthene, benzo[a]pyrene, indeno[1,2,3-c,d]pyrene, benzo[g,h,i]perylene, and dibenzo[a,h]anthracene.
Environmental EffectsGaseous hydrocarbons as a broad class do not appear to cause any appreciablecorrosive damage to materials [28]. Of all the hydrocarbons, only ethylenehas adverse effects on plants at known ambient concentrations, includinginhibition of plant growth and injury to orchids and cotton.
Health EffectsStudies of the effects of ambient air concentrations of many of the gaseoushydrocarbons have not demonstrated direct adverse effects upon humanhealth [28]. Certain airborne PAHs, however, are known carcinogens. Also,studies of the carcinogenicity of certain classes of hydrocarbons indicate thatsome cancers appear to be caused by exposure to aromatic hydrocarbonsfound in soot and tars. An extreme example is the occurrence of highly ele-vated incidences of lung cancer in China from PAH exposure [39]. PAHs arereleased during unvented coal combustion of “smoky’‘ coal in homes, result-ing in lung cancer mortality that is five times the national average in China.
Carbon MonoxideCarbon monoxide (CO) is a colorless, odorless gas that is very stable andhas a life of 2 to 4 months in the atmosphere [28]. Similar to organiccompounds, it is formed when fuel is not burned completely. It is a com-ponent of motor vehicle exhaust, which contributes about 60% of all COemissions nationwide [29]. High concentrations of CO occur in areas withheavy traffic congestion where as much as 95% of all CO emissions maycome from automobile exhaust. Other sources include industrial processes,non-transportation fuel combustion, and natural sources such as wildfires.Carbon monoxide emissions from coal-fired boilers are generally low. Likeorganic hydrocarbon emissions, CO can be formed during system startupor upset. Also, systems with good combustion control, which is typical ofpower generation plants, produce little CO.
The Effect of Coal Usage on Human Health and the Environment 107
Environmental EffectsCarbon monoxide appears to have no detrimental effects on material surfaces[28]. Experiments have not shown that CO at ambient concentrations pro-duces harmful effects on plant life. Carbon monoxide has been found to bea minor participant in photochemical reactions leading to ozone formation.
Health EffectsHigh concentrations of CO can cause physiological and pathological changesand ultimately death. Carbon monoxide enters the bloodstream through thelungs and reduces the delivery of oxygen to the body’s organs and tissues[29]. The health threat from lower levels of CO is most serious for thosewho suffer from cardiovascular disease, such as angina pectoris. At muchhigher levels of exposure, CO can be poisonous and even healthy individualscan be affected. Visual impairment, reduced work capacity, reduced manualdexterity, poor learning ability, and difficulty in performing complex tasksare all associated with exposure to elevated CO levels.
Trace ElementsAll coals contain small concentrations of trace elements. Trace elementsenter the atmosphere through natural processes, and sources of trace ele-ments include soil, seawater, and volcanic eruptions. Human activities,such as power generation and industrial and commercial sectors, also leadto emissions of some elements. Although these elements are present insmall concentrations in the coal (i.e., parts per million, ppm, by weight),the large amount of coal burned annually mobilizes tons of these pollutantsas particles or gases.
Title III of the U.S. Clean Air Act Amendments (CAAA) of 1990 des-ignates 188 hazardous air pollutants (HAPs). Included in the list are eleventrace elements: antimony (Sb), arsenic (As), beryllium (Be), cadmium (Cd),chromium (Cr), cobalt (Co), lead (Pb), manganese (Mn), mercury (Hg), nickel(Ni), and selenium (Se). In addition, barium (Ba) is regulated by the ResourcesConservation and Recovery Act, and boron (B) and molybdenum (Mo) are reg-ulated by Irrigation Water Standards [37]. Vanadium (V) is regulated based onits oxidation state, and vanadium pentoxide (V2O5) is a highly toxic regulatedcompound. Other elements, such as fluorine (F) and chlorine (Cl), which pro-duce acid gases (i.e., HF and HCl) upon combustion, and radionuclides suchas radon (Rn), thorium (Th), and uranium (U) are also of interest.
The distribution of trace elements in the bottom ash, ash collected inthe air pollution control device, and fly ash and gaseous constituents emit-ted into the atmosphere depends on many factors, including the volatilityof the elements, temperature profiles across the system, pollution controldevices, and operating conditions [27,40]. Numerous studies have shownthat trace elements can be classified into three broad categories based on
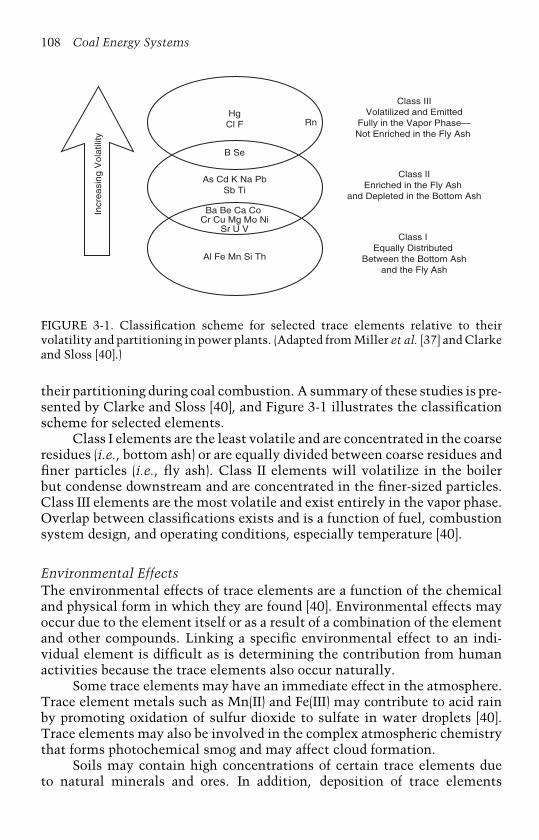
108 Coal Energy Systems
Hg Cl F
B Se
As Cd K Na Pb Sb Ti
Ba Be Ca Co Cr Cu Mg Mo Ni
Sr U V
Al Fe Mn Si Th
Class III Volatilized and Emitted
Fully in the Vapor Phase—Not Enriched in the Fly Ash
Class II Enriched in the Fly Ash
and Depleted in the Bottom Ash
Class I Equally Distributed
Between the Bottom Ash and the Fly Ash
Rn
Incr
ea
sin
g V
ola
tility
FIGURE 3-1. Classification scheme for selected trace elements relative to theirvolatility and partitioning in power plants. (Adapted from Miller et al. [37] and Clarkeand Sloss [40].)
their partitioning during coal combustion. A summary of these studies is pre-sented by Clarke and Sloss [40], and Figure 3-1 illustrates the classificationscheme for selected elements.
Class I elements are the least volatile and are concentrated in the coarseresidues (i.e., bottom ash) or are equally divided between coarse residues andfiner particles (i.e., fly ash). Class II elements will volatilize in the boilerbut condense downstream and are concentrated in the finer-sized particles.Class III elements are the most volatile and exist entirely in the vapor phase.Overlap between classifications exists and is a function of fuel, combustionsystem design, and operating conditions, especially temperature [40].
Environmental EffectsThe environmental effects of trace elements are a function of the chemicaland physical form in which they are found [40]. Environmental effects mayoccur due to the element itself or as a result of a combination of the elementand other compounds. Linking a specific environmental effect to an indi-vidual element is difficult as is determining the contribution from humanactivities because the trace elements also occur naturally.
Some trace elements may have an immediate effect in the atmosphere.Trace element metals such as Mn(II) and Fe(III) may contribute to acid rainby promoting oxidation of sulfur dioxide to sulfate in water droplets [40].Trace elements may also be involved in the complex atmospheric chemistrythat forms photochemical smog and may affect cloud formation.
Soils may contain high concentrations of certain trace elements dueto natural minerals and ores. In addition, deposition of trace elements
The Effect of Coal Usage on Human Health and the Environment 109
downwind from power plants can lead to high concentrations in the soils anduptake by plants. Some elements found in coal are major plant nutrients—specifically, calcium, magnesium, and potassium [40]. These elements arenot considered trace elements because they occur in quantities greater than1000 ppm (>0.1% by weight). Other elements (both major and trace) areconsidered minor plant nutrients, such as iron, manganese, copper, zinc,molybdenum, cobalt, and selenium. Elements such as aluminum, sodium,and vanadium are considered essential for some species while others arepotentially toxic including chromium, nickel, lead, arsenic, and cadmium.
Cadmium Cadmium (Cd) is a silvery metal and is both toxic and carcino-genic [41]. The correlation between soil concentration of cadmium and plantuptake is not clear; consequently, there is concern about cadmium concen-trations in the environment and ingestion of plant-based foods by the generalpopulation.
Mercury Mercury (Hg) is a liquid, silvery metal that is considered toxic;in the form of methyl mercury, it is extremely toxic [35,41]. The mercurydirectly emitted from power plants is measured as three forms: elemental(Hg◦), oxidized (Hg+2), and condensed on ash particles (Hgp). In the naturalenvironment, mercury can go through a series of chemical transformationsto convert it to a highly toxic form, methylmercury (CH3Hg), which isconcentrated in fish and birds [42]. Methylation rates in the ecosystemsare a function of mercury availability, bacterial population, nutrient load,acidity and oxidizing conditions, sediment load, and sedimentation rates.Methylmercury enters the food chain, particularly in aquatic organisms, andbioaccumulates. Volatile elements that are emitted from power plants, suchas mercury, are mostly found either in gaseous form or enriched on the sur-face of fine particles and physically should be available for uptake by plants[40]. There is evidence, however, that almost no mercury from the soil istaken into the shoots of the plants; hence, plants appear to be an importantbarrier against entry of mercury into the above-ground ecosystem, even ifaccumulation in the soil has occurred.
Lead Lead (Pb) is the only metal currently listed as a criteria pollutant.Lead is a gray metal with a low melting point. It is soft, malleable, ductile,resistant to corrosion, and a relatively poor electrical conductor [28]. Forthese reasons, lead has been used for over 4000 years for plates and cups,food storage vessels, paints, piping, roofing, storage containers for corrosivematerials, radiation shields, lead-acid batteries, and as an organolead additivein gasoline. As a result, lead can be found throughout the world, includingtrace amounts in Antarctica and the Arctic [28]. In the past, automotivesources were the major contributor of lead emissions to the atmosphere [29].Due to the EPA’s regulatory efforts to remove lead from gasoline, along with
110 Coal Energy Systems
banning lead from paint pigments and solder, a decline in lead emissions hasbeen observed. The highest concentrations of lead are found in the vicinityof nonferrous and ferrous smelters and battery manufacturers. Lead can bedeposited on the leaves of plants, presenting a hazard to grazing animals.
Selenium Crops, including animal forages are sensitive to the addition ofsmall amounts of selenium (Se) in the soil [40]. Selenium is a silvery metallicallotrope or red amorphous powder [41] and is toxic to plants at low con-centrations. It has been shown to cause stunting and brown spots in somevarieties of beans and to reduce germination and cause stunting in cerealsand cotton.
Other Trace Elements Clarke and Sloss [40] listed examples where traceelements from coal combustion may have beneficial effects in some areas.Boron is a micronutrient that is required in trace amounts by many plantsand animals, and the amount of boron released from coal-fired power plantsis likely to be beneficial to local agriculture. Copper, iron, manganese, andzinc are necessary for normal growth of plants. It is recognized, however, thatexcessive concentrations of copper and zinc lead to damage to root forma-tion and growth, but the quantities being deposited around coal-fired powerstations are likely to be beneficial to local soils. Also, manganese can beharmful in large doses, especially in acidic soils.
Health EffectsTrace element emissions have the potential to cause a number of harmfuleffects on human health. While there is no evidence that most trace elementsfrom coal-fired power plants are causing health effects at their low ambientair concentration, there is concern that pollutants may accumulate through-out the food chain. This is especially true of mercury, which is discussed inmore detail later in this section.
Arsenic The combustion of most coals is unlikely to contribute toxicamounts of arsenic (As) to air [43]. There is some concern, however, thatarsenic in fly ash disposal and coal cleaning wastes may be leached intothe groundwater. Arsenic, which is gray, metallic, soft, and brittle, may beconsidered essential; however, it is toxic in small doses [41]. Arsenic cancause anemia, gastric disturbance, renal symptoms, ulceration, and skinand lung cancer [40]. In addition, arsenic can damage peripheral nerves andblood vessels and is a suspected teratogen (i.e., causes damage to embryos andfetuses). The chemical form of arsenic can affect its toxicity, with organicforms of arsenic being more toxic than elemental arsenic. An extreme exam-ple of chronic arsenic poisoning is occurring in the Guizhou Province ofChina [39,44]. In this province, the villagers bring their chili pepper harvest

The Effect of Coal Usage on Human Health and the Environment 111
indoors in the autumn to dry. They hang their peppers over open-burningstoves, where arsenic-rich coal (up to 35,000 ppm) is used to heat and cook.These chili peppers, which normally contain <1 ppm arsenic, can containas much as 500 ppm arsenic after drying. About 3000 people are exhibit-ing typical symptoms of arsenic poisoning, including hyperpigmentation(flushed appearance, freckles), hyperkeratosis (scaly lesions on the skin, gen-erally concentrated on the hands and feet), Bowen’s disease (dark, horny,precancerous lesions of the skin), and squamous cell carcinoma.
Boron Boron (B) is similar to arsenic in that the concentration emitted tothe atmosphere is small and is unlikely to cause problems as an airbornepollutant [43]; however, boron in the fly ash can become soluble in ash dis-posal sites. Boron, a dark powder, is essential for plants but can be toxic inexcess [41].
Beryllium Beryllium (Be), a silvery, lustrous, relatively soft metal, is toxicand carcinogenic [41]. It can cause respiratory disease and lymphatic, liver,spleen, and kidney effects [40].
Cadmium Cadmium (Cd) has no known biological function and is there-fore not a nutritional requirement [40]. Cadmium is toxic, carcinogenic, andteratogenic [41] and can cause emphysema, fibrosis of the lung, renal injury,and possibly cardiovascular disease.
Chromium Chromium (Cr), a hard, blue-white metal, is an essential traceelement; however, its chromates are toxic and carcinogenic [41]. Chromium,which is ingested by humans through food and drink, can be toxic when itaccumulates in the liver and spleen [40]. The oxidation state of chromiumaffects its mobility and toxicity. Chromium (III) is nontoxic and has a ten-dency to absorb to clays, sediments, and organic matter and therefore is notvery mobile. Chromium (IV), however, is more mobile and toxic and mayaccount for ∼5% of the total chromium particles emitted from power plants.
Fluorine Fluorine (F) is a pale yellow gas and is the most reactive of allelements [41]. It is an essential element and is commonly used for pro-tecting the enamel of teeth, but excess fluoride is toxic. Fluorosis includesmottling of tooth enamel (dental fluorosis) and various forms of skeletal dam-age, including osteosclerosis, limited movement of the joints, and outwardmanifestations such as knock-knees, bow legs, and spinal curvature [39].Fluorosis, combined with nutritional deficiencies in children, can result insevere bone deformation. An extreme example of this is exhibited in China,where the health problems caused by fluorine volatilized during domes-tic coal use are far more extensive than those caused by arsenic [39,44].
112 Coal Energy Systems
More than 10 million people in the Guizhou Province and surroundingareas suffer from various forms of fluorosis caused by corn being dried overunvented ovens burning high-fluorine (>200 ppm) coal.
Mercury Mercury (Hg) exists in trace amounts in fossil fuels, includingcoal, vegetation, crustal material, and waste products. Through combustionor natural processes, mercury vapor can be released to the atmosphere, whereit can drift for a year or more, spreading with air currents over vast regionsof the world [45]. Research indicates that mercury poses adverse humanhealth effects, and fish consumption is the primary pathway for humanand wildlife exposure. Mercury bioaccumulates in fish as methylmercury(CH3Hg) and poses a serious health hazard for humans. Other research sug-gests that other forms of mercury may be harmful as well [46,47]. Ingestedmercury in elemental, organic, and inorganic form is converted to mercuricmercury, which is slowly eliminated from the kidneys but remains fixed inthe brain indefinitely [47]. Exposure to high levels of metallic, inorganic, ororganic mercury can permanently damage the brain, kidneys, and developingfetus [46]. Documented associations have been reported between low-dose,prenatal exposure to methylmercury and neurodevelopmental effects onattention, motor function, language, visual-spatial, and verbal abilities [48].Loss of sight has been associated with cases of extreme mercury ingestion[39]. Chronic thallium poisoning has been reported in the Guizhou Provincein China, where vegetables are grown on mercury-/thallium-rich miningslag. Most symptoms that have been reported, such as hair loss, are typicalof thallium poisoning; however, many patients from this region have losttheir vision, which is being attributed to mercury poisoning as the mercuryconcentration of this coal is 55 ppm, or about 200 times the average mercuryconcentration in U.S. coals.
Manganese Manganese (Mn) is unlikely to cause health problems as anairborne pollutant from the combustion of most coals, but leaching of ashmay be a concern [43]. Manganese, a hard, brittle, silvery metal, is consideredan essential nutrient, is nontoxic, and is a suspected carcinogen [41]. It is alsoreported to cause respiratory problems [40].
Molybdenum Molybdenum (Mo), a lustrous, silvery, and fairly soft metal,is an essential nutrient, is moderately toxic, and is a teratogen [41]. Undersome conditions, molybdenosis may occur in animals, notably ruminants,due to consumption of vegetation with relatively high concentrations ofmolybdenum [43].
Nickel Nickel (Ni), a silvery, lustrous, malleable, and ductile metal, hasno known biological role, and nickel and nickel oxide are carcinogenic [41].Nickel can cause dermatitis and intestinal disorders [40].
The Effect of Coal Usage on Human Health and the Environment 113
Lead Exposure to lead (Pb) occurs mainly through inhalation of air or inges-tion in food, water, soil, or dust. It accumulates in the blood, bones, and softtissues [29]. Lead can adversely affect the kidneys, liver, nervous system,and other organs. Excessive exposure to lead may cause neurological impair-ments, such as seizures, mental retardation, and behavioral disorders. Evenat low doses, lead exposure is associated with damage to the nervous systemof fetuses and young children. Lead may be a factor in high blood pressureand heart disease.
Selenium Selenium (Se) is considered an essential element but is toxic inexcess of dietary requirements and is also a carcinogen [41]. Livestock con-suming plants with excessive amounts of selenium can suffer two diseases,alkali disease or blind staggers, and can experience infertility and cirrhosisof the liver, as well as death in extreme cases [40]. In humans, selenium cancause gastrointestinal disturbance, liver and spleen damage, and anemia andis a suspected teratogen. Symptoms of selenium poisoning include hair andnail loss. Selenosis has been reported in southwest China, where selenium-rich carbonaceous shales, known locally as “stone coals,’‘ are used for homeheating and cooking [39]. The ash from this selenium-rich coal (as muchas 8400 ppm) is then used as a soil amendment, thereby introducing highconcentrations of selenium into the soil that is subsequently taken up bycrops.
Vanadium Vanadium (V), a shiny, silvery, soft metal, is an essentialtrace element, although some compounds, specifically vanadium pentoxide(V2O5), are quite toxic [41]. Health effects associated with vanadium includeacute and chronic respiratory dysfunction [40].
Radionuclides Radionuclides are listed generically as 1990 CAAA HAPs.Radioactivity arises mainly from isotopes of lead, radium, radon, tho-rium, and uranium [37,40,43,49]. Health effects from radiation are welldocumented and include various forms of cancer; however, radionuclideemissions from power plants are quite low [37,40]. During coal combustion,most of the uranium and thorium and their decay products are released fromthe original coal matrix and are distributed between the gas phase and solidcombustion products [49]. Virtually 100% of the radon gas present in the coalfeed is transferred to the gas phase and is lost in stack emissions. In contrast,less volatile elements, such as thorium and uranium, and the majority oftheir decay products are retained in the solid combustion wastes [37,49]. Flyash is commonly used as an additive to concrete building products, but theradioactivity of typical fly ash is not significantly different from that of moreconventional concrete additives or other building materials such as graniteor red brick [49].
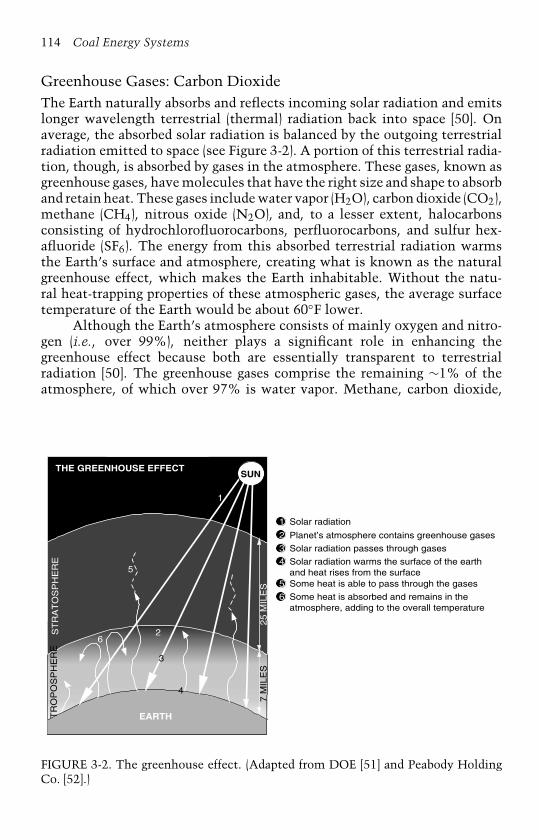
114 Coal Energy Systems
Greenhouse Gases: Carbon DioxideThe Earth naturally absorbs and reflects incoming solar radiation and emitslonger wavelength terrestrial (thermal) radiation back into space [50]. Onaverage, the absorbed solar radiation is balanced by the outgoing terrestrialradiation emitted to space (see Figure 3-2). A portion of this terrestrial radia-tion, though, is absorbed by gases in the atmosphere. These gases, known asgreenhouse gases, have molecules that have the right size and shape to absorband retain heat. These gases include water vapor (H2O), carbon dioxide (CO2),methane (CH4), nitrous oxide (N2O), and, to a lesser extent, halocarbonsconsisting of hydrochlorofluorocarbons, perfluorocarbons, and sulfur hex-afluoride (SF6). The energy from this absorbed terrestrial radiation warmsthe Earth’s surface and atmosphere, creating what is known as the naturalgreenhouse effect, which makes the Earth inhabitable. Without the natu-ral heat-trapping properties of these atmospheric gases, the average surfacetemperature of the Earth would be about 60◦F lower.
Although the Earth’s atmosphere consists of mainly oxygen and nitro-gen (i.e., over 99%), neither plays a significant role in enhancing thegreenhouse effect because both are essentially transparent to terrestrialradiation [50]. The greenhouse gases comprise the remaining ∼1% of theatmosphere, of which over 97% is water vapor. Methane, carbon dioxide,
7 M
ILE
S2
5 M
ILE
S
ST
RA
TO
SP
HE
RE
THE GREENHOUSE EFFECT
EARTH
SUN
1
2
3
4
5
6
1 Solar radiation
2 Planet’s atmosphere contains greenhouse gases
3 Solar radiation passes through gases
4 Solar radiation warms the surface of the earth and heat rises from the surface
5 Some heat is able to pass through the gases
6 Some heat is absorbed and remains in the atmosphere, adding to the overall temperature
TR
OP
OS
PH
ER
E
FIGURE 3-2. The greenhouse effect. (Adapted from DOE [51] and Peabody HoldingCo. [52].)
The Effect of Coal Usage on Human Health and the Environment 115
nitrous oxide, and other gases comprise less than 3% of the greenhouse gases[52]. The composition of the greenhouse gases is [51]:
• Energy-related CO2—81%;• Methane (CH4)—9%;• Nitrous oxide (N2O)—6%;• Other CO2—2%;• Other gases—2%.
Carbon dioxide, methane, and nitrous oxide are continuously emitted toand removed from the atmosphere by natural processes on Earth. Anthro-pogenic activities, however, can cause additional quantities of these andother greenhouse gases to be emitted or sequestered, thereby changing theirglobal average atmospheric concentrations. Natural activities such as respi-ration by plants or animals and seasonal cycles of plant growth and decaygenerally do not alter average atmospheric greenhouse gas concentrationsover decadal time frames [50]. Climatic changes, which are long-term fluctu-ations in temperature, precipitation, wind, and other elements of the Earth’sclimate system, that result from anthropogenic activities can have positiveor negative feedback effects on these natural systems.
Overall, the most abundant and dominant greenhouse gas in the atmo-sphere is water vapor. Human activities, however, are not believed to directlyaffect the average global concentration of water vapor, although this issue iscurrently being debated [50,53]. In nature, carbon dioxide is cycled betweenvarious atmospheric, oceanic, land biotic, marine biotic, and mineral reser-voirs. Of all the greenhouse gases, human activity has the largest influenceon carbon dioxide, which is a product of the combustion of fossil fuels. Car-bon dioxide concentrations in the atmosphere increased from approximately280 ppmv in pre-industrial times to 367 ppmv in 1991 [50].
Methane is primarily produced through anaerobic decomposition oforganic matter in biological systems. Agricultural processes, such as wetlandrice cultivation, enteric fermentation in animals, and the decomposition ofanimal wastes, emit methane, as does the decomposition of municipal solidwastes [50]. Methane is also emitted during the production and distributionof natural gas and petroleum. Methane is released as a by-product of coalmining and, to a lesser extent, incomplete fossil fuel combustion.
Anthropogenic sources of nitrous oxide include agricultural soils, due,particularly, to the use of fertilizers; fossil fuel combustion, especially frommobile sources; nylon and nitric acid production; wastewater treatment;waste combustion; and biomass burning [50]. Halocarbons that containchlorine (e.g., chlorofluorocarbons, hydrofluorocarbons, methyl chloroform,and carbon tetrachloride) and bromine (e.g., halons, methyl bromide, andhydrobromofluorocarbons), perfluorocarbons, and sulfur hexafluoride (SF6)are manmade chemicals and not products of combustion. They are, however,powerful greenhouse gases.
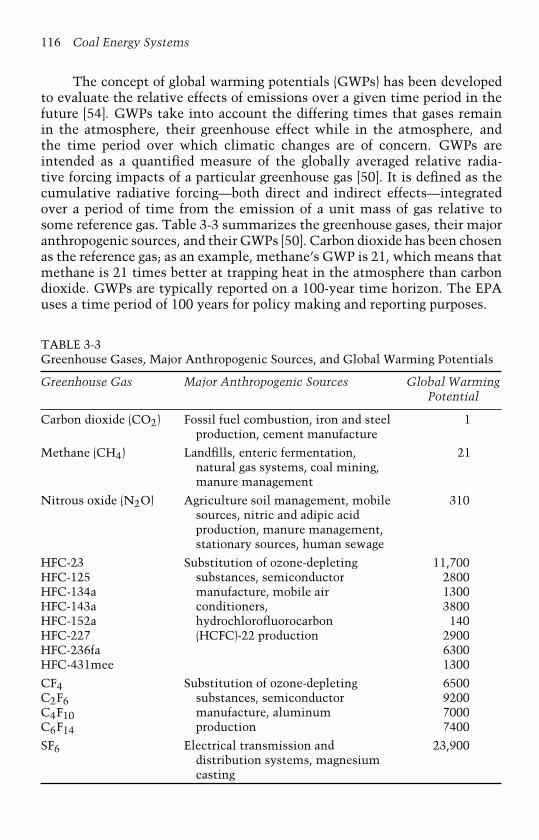
116 Coal Energy Systems
The concept of global warming potentials (GWPs) has been developedto evaluate the relative effects of emissions over a given time period in thefuture [54]. GWPs take into account the differing times that gases remainin the atmosphere, their greenhouse effect while in the atmosphere, andthe time period over which climatic changes are of concern. GWPs areintended as a quantified measure of the globally averaged relative radia-tive forcing impacts of a particular greenhouse gas [50]. It is defined as thecumulative radiative forcing—both direct and indirect effects—integratedover a period of time from the emission of a unit mass of gas relative tosome reference gas. Table 3-3 summarizes the greenhouse gases, their majoranthropogenic sources, and their GWPs [50]. Carbon dioxide has been chosenas the reference gas; as an example, methane’s GWP is 21, which means thatmethane is 21 times better at trapping heat in the atmosphere than carbondioxide. GWPs are typically reported on a 100-year time horizon. The EPAuses a time period of 100 years for policy making and reporting purposes.
TABLE 3-3Greenhouse Gases, Major Anthropogenic Sources, and Global Warming Potentials
Greenhouse Gas Major Anthropogenic Sources Global WarmingPotential
Carbon dioxide (CO2) Fossil fuel combustion, iron and steelproduction, cement manufacture
1
Methane (CH4) Landfills, enteric fermentation,natural gas systems, coal mining,manure management
21
Nitrous oxide (N2O) Agriculture soil management, mobilesources, nitric and adipic acidproduction, manure management,stationary sources, human sewage
310
HFC-23HFC-125HFC-134aHFC-143aHFC-152aHFC-227HFC-236faHFC-431mee
Substitution of ozone-depletingsubstances, semiconductormanufacture, mobile airconditioners,hydrochlorofluorocarbon(HCFC)-22 production
11,700280013003800140
290063001300
CF4C2F6C4F10C6F14
Substitution of ozone-depletingsubstances, semiconductormanufacture, aluminumproduction
6500920070007400
SF6 Electrical transmission anddistribution systems, magnesiumcasting
23,900

The Effect of Coal Usage on Human Health and the Environment 117
The greenhouse gas emissions of direct greenhouse gases in the U.S.inventory are reported in terms of equivalent emissions of carbon dioxide,using teragrams of carbon dioxide equivalents (Tg CO2 Eq.). The relationshipbetween gigagrams (Gg) of a gas and Tg CO2 Eq. can expressed as follows:
Tg CO2 Eq. = (Gg of gas) × (GWP) ×(
Tg1000 Gg
)(3-20)
Quantities of emissions are provided in Chapter 4.
Environmental EffectsMuch uncertainty surrounds global climate changes. The global climate isa massive and highly complex system with many interrelated subsystems.Evidence indicates that there have been times in Earth’s history when theconcentrations of greenhouse gases in the atmosphere have been higher andlower than today, but it is difficult to determine the causes and effectsof those situations, and the data from those time periods are limited andimprecise [53].
One important cause for uncertainty in the area of global science liesin feedback loops. Complex climate change models have been developed,but the various modelers consider different feedbacks to be more important,so markedly different predictions regarding the Earth’s climate are obtained[53]; however, many of the undisputed facts have not changed over the lastdecade. For example, based on samples of air trapped in arctic ice, scientistshave determined that, prior to the Industrial Revolution, the concentrationof carbon dioxide in the atmosphere had been stable at a level of around 280to 290 ppmv. When people started to burn fossil fuels, the concentration ofcarbon dioxide began to increase and is now at approximately 370 ppmv [53].This correlation indicates that increased concentrations of greenhouse gasesin the atmosphere have likely increased the amount of heat from the sunthat stays within the Earth’s ecosystem, thereby contributing to increasedglobal temperatures. The Goddard Institute for Space Studies has reportedthat the average temperature at the Earth’s surface has risen approximately2◦F from 1870 to 1998 [55]. Studies project that globally averaged surfacetemperatures will increase by 2.5 to 10.4◦F between 1990 and 2100 at currentrates of increase under a business-as-usual scenario [53].
Potential environmental impacts of global warming include effects onagriculture production, forests, water resources, coastal areas, species, andnatural areas [56,57]. Warmer temperatures can lead to more intense rain-fall and flooding in some areas (e.g., U.S. Pacific Northwest and Midwest),with more frequent drought-like conditions in other areas such as the west-ern United States. Predictions of the agricultural effects of climate changeremain uncertain, but models indicate potential changes in cereal grain pro-duction and irrigation demands in the United States. Models also predictthat rising temperatures could affect current land use such as the reduction
118 Coal Energy Systems
of coffee growing areas in countries such as Uganda. Predictions indicateforest areas could be affected. As temperatures increase, the forest composi-tion could change, with warmer climate varieties moving into traditionallycolder climate areas. Forest health and productivity could be impacted.
The effect of global warming on freshwater resources is uncertain. Somestudies indicate that global water conditions will worsen, while others sug-gest that climate change could have a net positive impact on global waterresources. Impacts on water supply, water quality, and competition for waterare predicted. Coastal areas are predicted to be subject to erosion of beachesand inundation of coastal lands, as well as increased costs to protect coastalcommunities. Current rates of sea-level rise are expected to increase 2 to 5times due to both thermal expansion of the oceans and the partial meltingof mountain glaciers and polar ice caps. Low-lying areas along the U.S. Gulfof Mexico and estuaries such as Chesapeake Bay are especially vulnerable.Bangladesh is the country most vulnerable to sea-level rise, while the NileDelta, Egypt’s only suitable agriculture area, would be flooded.
Changes in temperature and water availability could decimate non-intensively managed ecosystems, such as forests, rivers, and wetlands. Forexample, global warming could dry out the wetlands that support over 50% ofNorth American waterfowl. Arctic and northern latitudes are likely to expe-rience above-average warming and are especially vulnerable to its effects,including thinning of the arctic sea ice, and this disruption may affectfisheries, human structures built on permafrost, and northern ecosystems.
Health EffectsHuman health is also predicted to be impacted by global climate change [56].This includes increases in weather-related mortality, infectious diseases, andair-quality respiratory illnesses. Small increases in average temperatures canincrease the spread of diseases, such as malaria and dengue fever, and leadto a significant rise in the number of extreme heat waves. Elderly people areparticularly vulnerable to heat stress. Heat waves could also aggravate localair quality problems, which pose threats to young children and individualswith asthma.
References
1. Sengupta, M., Environmental Impacts of Mining: Monitoring, Restoration, andControl (Lewis Publishers, Boca Raton, FL, 1993).
2. National Mining Association, Most Requested Statistics: U.S. Coal Industry(National Mining Association, Washington, D.C., April 2003).
3. World Book Encyclopedia, Coal (World Book, Chicago, IL, 2001), Vol. 4,pp. 716–733.
4. Schobert, H. H., Coal: The Energy Source of the Past and Future (AmericanChemical Society, Washington, D.C., 1987).
The Effect of Coal Usage on Human Health and the Environment 119
5. Marcus, J. J (editor), Mining Environmental Handbook: Effects of Mining onthe Environment and American Environmental Controls on Mining (ImperialCollege Press, London, 1997).
6. Irving, W. and O. Tailakov, CH4 Emissions: Coal Mining and Handling,Good Practice Guidance and Uncertainty Management in National Green-house Gas Inventories, 1999, accessed from www.ipcc-nggip.iges.or.jp/public/gp/bgp/2_7_Coal_Mining_Handling.pdf, June 2003.
7. EPA, International Anthropogenic Methane Emissions in the United States(Office of Policy, Planning and Evaluation, U.S. Environmental ProtectionAgency, U.S. Government Printing Office, Washington, D.C., 1994).
8. EPA, Coalbed Methane Outreach Program (U.S. Environmental Protec-tion Agency, Washington, D.C.), www.epa.gov/coalbed/about.htm#section2(accessed March 3, 2003).
9. World Bank Group, Coal Mining and Production, Pollution Prevention, andAbatement Handbook, www.natural-resources.org.minerals/CD/docs/twb/PPAH/52.coal.pdf, pp. 282–285 (accessed July 1998).
10. USGS, Coal-Extraction: Environmental Prediction (USGS Fact Sheet FS-073-02, U.S. Geological Survey, U.S. Government Printing Office, Washington,D.C., August 2002).
11. PADEP, The Science of Acid Mine Drainage and Passive Treatment (Pennsyl-vania Department of Environmental Protection, Harrisburg), www.dep.state.pa.us/dep/deputate/minres/bamr/amd/science_of_amd.htm (accessed April 5,2002).
12. OSM, Factors Controlling Acid Mine Drainage Formation (U.S. Office ofSurface Mining, Washington, D.C.), www.osmre.gov/amdform.htm (accessedMarch 5, 2002).
13. Coalition for Affordable and Reliable Energy (CARE), www.careenergy.com,2003.
14. Mine Safety and Health Administration (MSHA), www.msha.gov, 2003.15. EIA, Coal Data: A Reference (Energy Information Administration, U.S. Depart-
ment of Energy, Washington, D.C., February 1995).16. ACF, Strict Regulations Govern Coal Mining (American Coal Founda-
tion, Washington, D.C.), www.ket.org/trips/Coal/AGSMM/agsmmregs.html,2001.
17. Jackson, L. J., Surface Coal Mines: Restoration and Rehabilitation (IEA CoalResearch, London, 1991).
18. OSM, Chronology of the Office of Surface Mining and the Surface Min-ing Law Implementation (U.S. Office of Surface Mining, Washington, D.C.),www.osmre.gov (accessed February 13, 2003).
19. OSM, Regulating Surface Coal Mining: Restoring Mining Landscapes (U.S.Office of Surface Mining), www.osmre.gov/news/101702.txt (accessed June2003).
20. Leonard, J. W (editor), Coal Preparation, Fourth ed. (The American Institute ofMining, Metallurgical, and Petroleum Engineers, New York, 1979).
21. National Research Council, Coal Waste Impoundments: Risks, Responses,and Alternatives (National Academy Press, Washington, D.C., 2002).

120 Coal Energy Systems
22. Falcone Miller, S., J. L. Morrison, and A. W. Scaroni, The Utilization of CoalPond Fines as Feedstock for Coal-Water Slurry Fuels, in Proc. of the 20th Inter-national Technical Conference on Coal Utilization & Fuel Systems (Coal andSlurry Technology Association, Washington, D.C., 1995), pp. 535–558.
23. Chadwick, M. J., N. H. Highton, and N. Lindman, Environmental Impacts ofCoal Mining and Utilization (Pergamon Press/The Beijer Institute, Elmsford,NY, 1987), pp. 73–80.
24. Kim, A. G., W. Aljoe, and S. Renninger, Wastes from the Combustion of Fos-sils Fuels: Research Perspective on the Regulatory Determination, in Proc. ofthe 16th International Conference on Fluidized Bed Combustion (Council ofIndustrial Boiler Owners, Washington, D.C., 2001).
25. Kalyoncu, R., Coal Combustion Products, in Proc. of the 19th Annual Inter-national Pittsburgh Coal Conference: Coal Energy and the Environment(University of Pittsburgh, 2002).
26. EPA, Report to Congress: Wastes from the Combustion of Fossil Fuels, Vol. 2,Methods, Findings, and Recommendations (U.S. Environmental ProtectionAgency, U.S. Government Printing Office, Washington, D.C., March 1999),chap. 3.
27. Davis, W. T. (editor), Air Pollution Engineering Manual, Second ed. (John Wiley& Sons, New York, 2000), p. 9.
28. Wark, K., C. F. Warner, and W. T. Davis, Air Pollution: Its Origin and Control,Third ed. (Addison-Wesley Longman, Menlo Park, CA, 1998).
29. EPA, Latest Findings on National Air Quality: 1997 Status and Trends(U.S. Environmental Protection Agency, Office of Air Quality Planning andStandards, Washington, D.C., 1998).
30. EPRI, Air Pollution and Health Effects Research at EPRI: The ARIES Program,Strategic Overview Fact Sheet (Electric Power Research Institute, Hillview,CA, December 2002).
31. Wall, T. F., Principles of Combustion Engineering for Boilers (Harcourt BraceJavanovich, London, 1987), pp. 197–294.
32. Singer, J. G. (editor), Combustion: Fossil Power Systems (Combustion Engi-neering, Windsor, CT, 1981).
33. Miller, J. A., and C. T. Bowman, Mechanism and Modeling of Nitrogen Chem-istry in Combustion, Progress Energy Combustion Science, Vol. 15, 1989,pp. 287–338.
34. Wood, S. C., Select the Right NOx Control Technology, Chemical EngineeringProgress, Vol. 90, No. 1, 1994, pp. 32–38.
35. EPA, Mercury Study Report to Congress (U.S. Environmental ProtectionAgency, Office of Air Quality Planning and Standards, U.S. GovernmentPrinting Office, Washington, D.C., December 1997).
36. Aljoe, W. W. and T. J. Grahame, The DOE-NETL Air Quality Research Program:Airborne Fine Particulate Matter (PM2.5), in Proc. of the Conference on AirQuality III: Mercury, Trace Elements, and Particulate Matter (University ofNorth Dakota, Grand Forks, 2002).
37. Miller, S. J., S. R. Ness, G. F. Weber, T. A. Erickson, D. J. Hassett, S. B.Hawthorne, K. A. Katrinak, and P. K. K. Louie, A Comprehensive Assessment

The Effect of Coal Usage on Human Health and the Environment 121
of Toxic Emissions from Coal-Fired Power Plants: Phase I Results fromthe U.S. Department of Energy Study Final Report, 1996, Contract No.DE-FC2I-93MC30097 (Subtask 2.3.3).
38. Brooks, A. W., Estimating Air Toxic Emissions from Coal and Oil Combus-tion Sources (Report No. EPA-450/2-89-001, U.S. Environmental ProtectionAgency, Research Triangle Park, NC, 1989).
39. Finkelman, R. B., W. Orem, V. Castranova, C. A. Tatu, H. E. Belkin, B. Zheng,H. E. Lerch, S. V. Maharaj, and A. L. Bates, Health Impacts of Coal and CoalUse: Possible Solution, International Journal of Coal Geology, Vol. 50, 2002,pp. 425–443.
40. Clarke, L. E. and L. L. Sloss, Trace Elements: Emissions from Coal Combustionand Gasification (IEA Coal Research, London, 1992).
41. Emsley, J., The Elements (Clarendon Press, Oxford, 1989).42. USGS, Mercury in U.S. Coal: Abundance, Distribution, and Modes of Occur-
rence (USGS Fact Sheet FS-095-01, U.S. Geological Survey, U.S. GovernmentPrinting Office, Washington, D.C., September 2001).
43. Swaine, D. J. and F. Goodarzi (editors), Environmental Aspects of Trace Ele-ments in Coal (Kluwer Academic Publishers, Dordrecht, The Netherlands,1995).
44. Finkelman, R. B., H. C. W. Skinner, G. S. Plumlee, and J. E. Bunnell, Med-ical Geology (Geosciences and Human Health series, American GeologicalInstitute, Alexandria, VA, 2001), pp. 20–23.
45. Feeley, T. J., J. Murphy, J. Hoffmann, and S. A. Renninger, A Review ofDOE/NETL’s Mercury Control Technology R&D Program for Coal-Fired PowerPlants (U.S. Department of Energy, Pittsburgh, PA, 2003).
46. CERHR, Mercury (Center for the Evaluation of Risks to Human Repro-duction, Research Triangle Park, NC) http://cerhr.niehs.nih.gov/genpub/topics/mercury2-ccae.html, May 16, 2002.
47. Aposhian, H. V. and M. M. Aposhian, Elemental, Mercuric, and methylmer-cury: Biological Interactions and Dilemmas, in Proc. of the Air Quality II:Mercury, Trace Elements, and Particulate Matter Conference (University ofNorth Dakota, Grand Forks, 2000).
48. National Research Council, Toxicological Effects of Methyl Mercury (NationalAcademy Press, Washington, D.C., 2000).
49. USGS, Radioactive Elements in Coal and Fly Ash: Abundance, Forms, andEnvironmental Significance (USGS Fact Sheet FS-163-97, U.S. GeologicalSurvey, U.S. Government Printing Office, Washington, D.C., 1997).
50. EPA, Greenhouse Gases and Global Warming Potential Values (U.S. Green-house Gas Inventory Program Office of Atmospheric Programs, U.S. Envi-ronmental Protection Agency, U.S. Government Printing Office, Washington,D.C., April 2002).
51. DOE, Flare for Fuel: Environmental Solutions (U.S. Department of Energy, U.S.Government Printing Office, Washington, D.C., Fall 2000).
52. Peabody Holding Co., Clearing the Air about the Greenhouse Effects(Peabody Holding Co., St. Louis, MO), www.peabodyenergy.com/index-ie.html(accessed November 1997).

122 Coal Energy Systems
53. DOE, Greenhouse Gases and Global Climate Change: Frequently AskedQuestions (U.S. Department of Energy, Washington, D.C.), www.netl.doe.gov/coalpower/sequestration/index.html (accessed June 27, 2003).
54. Smith, I. M., C. Nilsson, and D. M. B. Adams, Greenhouse Gases: Perspectiveson Coal (IEA Coal Research, London, 1994), p. 10.
55. Anon., Technology to Cool Down Global Warming, Chemical Engineering,Vol. 106, No. 1, January 1999.
56. NRDC, Global Warming: In Depth Testimony (National Resources DefenseCouncil, New York), www.nrdc.org/globalwarming/tdl0300.asp (accessedMarch 20, 2000).
57. Climateark, Potential Climate Changes Impact (National Energy TechnologyLaboratory, Fall 2000), www.climateark.org/vital/20.htm (accessed June 27,2003).
CHAPTER 4
Coal-Fired Emissionsand Legislative Actionin the United States
The use of coal has a long history of emitting a variety of pollutants intothe atmosphere and has contributed to several known health episodes in thepast. Regulations on coal usage date back to medieval times when nobilitybecame inconvenienced, but major incidents in the 1940s and 1950s in theUnited States and England that had severe impacts on human health werethe impetus for legislation in these two countries to protect the health andwelfare of the general public. In the United States, the major development oflegislative and regulatory acts occurred from 1955 to 1970, and by the mid-1970s the basis for national regulation of air pollution was well developed.The regulations are continually changing, as more information on the effectof emissions on health and the environment is obtained, new control tech-nologies are developed, and society demands a safe living environment. Theuse of coal for power generation is a highly regulated industry with more reg-ulations soon to be implemented. This chapter briefly discusses past healthepisodes, primarily in light of their role in the passage of regulations on theuse of coal. The emphasis of this chapter is on federal legislation and regula-tory trends in the United States. A history of legislative action in the UnitedStates as it pertains to coal-fired power plants is presented, and impend-ing legislation regarding emissions not currently regulated is also discussed.The types and quantities of emissions, with an emphasis on coal-fired powerplants, are presented, along with their trends over time as a consequence oflegislative action. A brief discussion of emissions and legislation from othercountries and how they compare to the United States is also provided.
Major Coal-Related Health Episodes
Air pollution is not a modern phenomenon, although legislative action tosuccessfully regulate emissions and protect human health is. This section
123
124 Coal Energy Systems
discusses the major health episodes caused or contributed to by the use ofcoal, especially those episodes that have raised public awareness of the illeffects of air pollution on health and have led to air pollution regulations,specifically with respect to the use of coal.
Pre-Industrial RevolutionDocumentation of air pollution begins as early as ancient Rome when thestatesman Seneca complained about the “stink, soot and heavy air” in thecity [1]. Coal usage increased in England during medieval times because coalbecame less expensive and wood became scarce, and air pollution problemsintensified, particularly black smoke and fumes. It became so bad that in1257 Queen Eleanor was driven from Nottingham Castle by the smoke andfumes rising from the city below [2]. In 1283 and 1288, there were complaintsabout air quality in London because coal, which was used by the varioussmithies and the general public for home heating, was now being used in limekilns. By 1285, London’s air was so polluted that King Edward I establishedthe world’s first air pollution commission, and 22 years later the king madeit illegal to burn coal [1]. This Royal Proclamation in 1307 forbade the use ofcoal in lime burners in parts of South London; however, this proclamationdid not work, and a later commission had instructions to punish offenderswith fines and ransoms for a first offense and to demolish their furnacesfor a second offense [2]. Eventually, economics (high-priced wood versuslow-priced coal) and a change in government policy (laws to save the fewremaining forests) won out over the populace’s comfort, and London was toremain polluted by coal fumes for another 600 years [2], leading the poetShelley to write in the early 1800s: “Hell must be much like London, asmoky and populous city” [1].
Post-Industrial RevolutionTwo major air pollution health episodes raised awareness of the effect ofpollution on human health and were instrumental in passage of the EnglishClean Air Act in the United Kingdom in 1956 and the Clean Air Act in theUnited States in 1970 (although federal air pollution control acts began tobe passed in 1955, as discussed later in this chapter) [3,4]. These episodesoccurred in Donora, Pennsylvania, in 1948 and in London, England, in1952 and illustrated the fact that people will largely ignore pollution untilit begins to kill in a dramatic way. In fact, local officials in Donora andLondon initially placed blame on weather inversions, frail health, and fluepidemics [3].
Donora, Pennsylvania, which is located south of Pittsburgh in theMonongahela Valley, was a town of approximately 26,000 people in the1940s and home to a steel mill and zinc works [3]. The inhabitants wereaccustomed to dreary days, dirty buildings, and barren ground where no

Coal-Fired Emissions and Legislative Action in the United States 125
vegetation would grow, but they ignored the effect that the steel and zincmills had on the population and environment as about two-thirds of theworkers were employed in the steel and zinc mills. This continued until the“killer smog” of October 1948. Nearly half of the town’s inhabitants weresick by the end of the second day of the thick smog, 20 people died in 3 days,50 more deaths than would be expected from other causes occurred in themonth following the episode, and many people experienced breathing diffi-culties for the rest of their lives [3]. It was discovered later that the cause formany of the fatalities was not sulfur dioxide from firing coal in the steel andzinc mills, as initially thought and often reported [5], but was fluoride poi-soning from the fluorspar used in the zinc mill [3]. Regardless of the cause,this episode brought increased public awareness of air pollution and helpedin the passage of air pollution laws.
A similar and even more severe episode occurred in London. Londonhas been renowned for centuries for its thick fog, the infamous London smog.Throughout the eighteenth century, London experienced about 20 foggy daysper year, but by the end of the nineteenth century, this had increased to60 days [1]. People were beginning to become aware of a connection betweenpollution and certain sicknesses, and bronchitis was initially known as the“British disease.” A severe pollution episode occurred in London in Decem-ber 1952 with substantial loss of life and was followed by a similar one inJanuary 1956 [4]. The more severe episode, which occurred in 1952, happenedat a time when London was economically depressed and still recovering fromWorld War II [3]. The government was selling its cleaner burning anthracitereserves to help pay its war debt while nearly all households were burningcheap, brown coal for heat. This situation was exacerbated in December 1952when a cool spell (and temperature inversion) settled over London. London’s8 million residents burned the brown coal for warmth and the week-longinversion kept the smoke at ground level. In 7 days, an estimated 2800 peopledied [3].
History of Legislative Action for Coal-FiredPower Plants
The major development of air pollution legislative and regulatory actsoccurred from 1955 to 1970; however, the early acts were narrow in scopeas the U.S. Congress was hesitant to grant the federal government a highdegree of control because air pollution problems were viewed as local orregional. This approach was found to be impractical as some states werehesitant to regulate industry and atmospheric transport of pollutants is notbounded by geographic lines. By the mid-1970s, the basis for national regula-tion of air pollution was developed and the actual regulations are continuallychanging. Regulations on coal-fired emissions essentially started in 1970with the passing of the Clean Air Act Amendments of 1970. There were a

126 Coal Energy Systems
few regulatory changes in the 1980s, but the Clean Air Act Amendments of1990 resulted in significant regulatory changes. In December 2003, the U.S.Environmental Protection Agency (EPA) proposed a rule to permanently capand reduce mercury emissions from power plants and is expected to pro-mulgate legislation by December 2004, with full compliance expected by2007 [6]. Currently, legislation is under consideration that would furtherreduce levels of sulfur dioxide and nitrogen oxides. Legislation for controllingcarbon dioxide is currently being debated.
Pre-1970 LegislationThe history of federally enacted air pollution legislation begins in 1955 withthe Air Pollution Control Act of 1955. The act was narrow in scope becauseof the federal government’s hesitation to encroach on states’ rights; however,it was the first step toward identifying air pollution sources and its effectsand laid the groundwork for the effective legislation and enforcement byregulatory agencies developed over the next 15 years. The act initiated thefollowing [4]:
• Research by the U.S. Public Health Service on the effects of airpollution;
• Provision for technical assistance to the states by the federalgovernment;
• Training of individuals in the area of air pollution;• Research on air pollution control.
The Air Pollution Control Act of 1955 was amended in 1960 and 1962(i.e., Air Pollution Control Act Amendments of 1960 and 1962) because ofworsening conditions in urban areas due to mobile sources. Through theseacts, Congress directed the Surgeon General to study the effect of motorvehicle exhausts on human health. A more formal process for the continualreview of the motor vehicle pollution problem was included in the CleanAir Act of 1963, which provided, for the first time, federal financial aid forair pollution research and technical assistance [4]. The act supported state,regional, and local programs for the control and abatement of air pollutionwhile reserving federal authority to intervene in interstate conflicts, therebypreserving the classical three-tier system of government. The act providedfor [4]:
• Acceleration in the research and training program;• Matching grants to state and local agencies for air pollution regula-
tory control programs;• Developing air quality criteria to be used as guides in setting air
quality standards and emissions standards;• Initiating efforts to control air pollution from all federal facilities;
Coal-Fired Emissions and Legislative Action in the United States 127
• Federal authority to abate interstate air pollution;• Encouraging efforts by automotive companies and the fuel industries
to prevent pollution.
The Clean Air Act of 1963 also provided for research authority to developstandards for sulfur removal from fuels, and a formal process for review-ing the status of the motor vehicle pollution problem. This, in turn, led tothe Motor Vehicle Air Pollution Control Act of 1965, which formally recog-nized the technical and economic feasibility of setting automotive emissionstandards. The act also gave the secretary of the Department of Health,Education, and Welfare (HEW) the authority to intervene in intrastate airpollution problems of “substantial significance.”
National Air Quality Control Act of 1967The first federal legislation to impact stationary combustion sources was theNational Air Quality Control Act of 1967. The act provided for a 2-year studyon the concept of national emissions standards for stationary sources and wasthe basis for the 1970 legislative action. The provisions of the National AirQuality Control Act of 1967 included [4]:
• Establishment of eight specific areas in the United States on the basisof common meteorology, topography, and climate;
• Designation of air quality control regions (AQCRs) within the UnitedStates where evaluations were to be conducted to determine thenature and extent of the air pollution problem;
• Development and issuance of air quality criteria (AQC) for spe-cific pollutants that have identifiable effects on human health andwelfare;
• Development and issuance of information on recommended airpollution control techniques, which would lead to recommendedtechnologies to achieve the levels of air quality suggested in the AQCreports;
• Requirement of a fixed time schedule for state and local agen-cies to establish air quality standards consistent with air qualitycriteria.
The states were allowed to set higher standards than recommended in theAQC reports; however, if a state did not act, the secretary of HEW hadthe authority to establish air quality standards for each air quality region.The states were given primary responsibility for action, but a very strongfederal fallback authority was provided. Unfortunately, the federal pro-gram was not implemented according to the required time schedule becausefederal surveillance of the overall program was understaffed and the processto set up the AQCRs proved to be too complex; consequently, both PresidentNixon and Congress proposed new legislation in 1970.
128 Coal Energy Systems
Clean Air Act Amendments of 1970The Clean Air Act Amendments of 1970 extended the geographical cover-age of the federal program aimed at the prevention, control, and abatementof air pollution from stationary and mobile sources. The act transferredadministrative functions assigned to the secretary of HEW to the newlycreated Environmental Protection Agency. The act provided for the firsttime national ambient air quality standards and national emission stan-dards for new stationary sources. It initiated the study of aircraft emissionsand imposed carbon monoxide, hydrocarbons, and nitrogen oxide emissionscontrol on automobiles.
The major goal of the act was the achievement of clean air through-out the United States by the middle of the decade. Two types of pollutantswere to be regulated: criteria air pollutants and hazardous air pollutants(HAPs). The criteria air pollutants were to be regulated to achieve attain-ment of National Ambient Air Quality Standards by establishing emissionstandards (developed by state and local agencies) for existing sources andnational emission standards for new sources through promulgation of NewSource Performance Standards. HAPs were to be regulated under NationalEmission Standards for Hazardous Air Pollutants. The major provisions ofthe act included [4]:
• The EPA was to establish National Ambient Air Quality Standards(NAAQSs), including primary standards for the protection of publichealth and secondary standards for the protection of public welfare;
• New Source Performance Standards (NSPSs) were to be required,with each state implementing and enforcing the standard of per-formance. Before a new stationary source could begin operation,state or federal inspectors were required to certify that the controlswould function, and the new stationary sources had to remain incompliance throughout the lifetime of the plant;
• National Emission Standards for Hazardous Air Pollutants(NESHAPs) were to be established and would apply to existing aswell as new plants;
• Funding was provided for fundamental air pollution studies, researchon health and welfare effects of air pollutants, research on cause andeffects of noise pollution, and research on fuels at stationary sources,including methods of cleaning fuels prior to combustion rather thanflue gas cleaning techniques, improved combustion techniques, andmethods for producing new or synthetic fuels with lower potentialfor creating polluted emissions;
• State and regional grant programs were authorized and matchinggrants established for implementing standards;
• The designation of AQCRs was to be completed;• Establishment of statewide plans to be implemented (i.e., state
implementation plans, or SIPs) and designed to achieve primary or
Coal-Fired Emissions and Legislative Action in the United States 129
public health standards within 3 years was required, and the overallplan had to be convincing as to its ability to meet and maintain thestandards;
• Industry was required to monitor and maintain emission records andto make these records available to EPA officials, and the EPA wasgiven the right of entry to examine records;
• Fines and criminal penalties were imposed for violation of imple-mentation plans, emissions standards, and performance standardsthat were stricter than those under the earlier law;
• New automobile emission standards were set;• Aircraft emission standards were to be developed by the EPA;• Citizen’s suits were permitted against those alleged to be in violation
of emission standards, including the United States, and suits couldbe brought against the EPA administrator if he or she failed to act incases where the law specified that action must be taken.
Air Quality Criteria and National AmbientAir Quality StandardsThe Air Quality Act of 1967 addressed the development and issuance of airquality criteria (AQC), and the need for such criteria was reaffirmed in the1970 amendments. AQC indicate qualitatively and quantitatively the rela-tionship between various levels of exposure to pollutants and the short- andlong-term effects on health and welfare [4]. AQC describe effects that canbe expected to occur when pollutant levels reach or exceed specific valuesover a given time period and delineate the effects from combinations of con-taminants as well as from individual pollutants. Economic and technicalconsiderations are not relevant to the establishment of AQC.
The development of AQC is essential in providing a quantitative basisfor air quality standards. Standards prescribe the pollutant levels that cannotbe legally exceeded during a specific time period in a specific geographicalregion. The Clean Air Act Amendments of 1970 required federal promulga-tion of national primary and secondary standards that are to be establishedequitably in terms of the social, political, technological, and economicaspects of the problem. Standards are subject to revision as aspects changeover time.
The purpose of the primary standards is immediate protection of thepublic health, including the health of sensitive populations such as peoplewith asthma, children, and the elderly. Primary standards are to be achievedregardless of cost and within a specified time limit. Secondary standards areintended to protect the public welfare from known or anticipated adverseeffects, including protection against decreased visibility, damage to ani-mals, crops, vegetation, and buildings. Both standards have to be consistentwith AQC, and, in addition, the standards have to prevent the continuingdeterioration of air quality in any portion of an air quality control region.
130 Coal Energy Systems
The Clean Air Act Amendments of 1970 defined the first six criteriapollutants as carbon monoxide, nitrogen dioxide, sulfur dioxide, total par-ticulate matter, hydrocarbons, and photochemical oxidants, and NAAQSswere established for these; subsequently, the list has been revised with thefollowing actions [4]:
• Lead was added to the list in 1976;• The photochemical oxidant standard was revised and restated as
ozone in 1979;• The hydrocarbon standard was withdrawn in 1983;• The total suspended particulate matter standard was revised in 1987
to include only particles with an aerodynamic particle size of <10 µmand referred to as the PM10 standard;
• The PM2.5 (i.e., particles with an aerodynamic particle size of<2. 5 µm) standard was added in 1997;
• In 1997, the EPA reviewed the air quality standard for ground-levelozone and established the primary and secondary 8-hour NAAQS forozone at 0.08 ppm and the primary and secondary 1-hour NAAQSfor ozone at 0.12 ppm.
The current list of NAAQSs is provided in Table 4-1 and includes carbonmonoxide, nitrogen dioxide, ozone, lead, PM10, PM2.5, and sulfur dioxide [7].
National Emissions StandardsEmissions standards place a limit on the amount or concentration of apollutant that may be emitted from a source. It is often necessary for cer-tain industries to be regulated by emission standards promulgated by thefederal or state government in order to maintain or improve ambient airquality within a region to comply with national or state air quality stan-dards. A number of factors must be considered when establishing emissionstandards [4]:
• The availability of technology appropriate for cleanup of a given typeof industry should be determined;
• Monitoring stations must be available to measure the actual indus-trial emissions for which control is considered, as well as theambient air quality so that the effectiveness of the standards canbe determined;
• Regulatory agencies must be organized to cope with the measure-ment and enforcement of the standards;
• The synergistic effects of various pollutants must be determined;• Models must be developed that reasonably predict the effects of
reducing various emissions on the ambient air quality;• Reasonable estimates of future emissions must be made based on the
growth or decline of industry and population within a region.
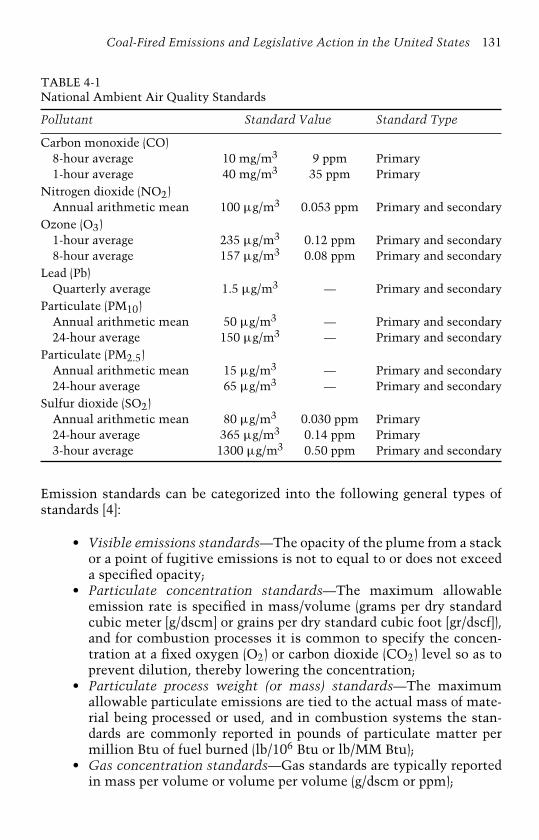
Coal-Fired Emissions and Legislative Action in the United States 131
TABLE 4-1National Ambient Air Quality Standards
Pollutant Standard Value Standard Type
Carbon monoxide (CO)8-hour average 10 mg/m3 9 ppm Primary1-hour average 40 mg/m3 35 ppm Primary
Nitrogen dioxide (NO2)Annual arithmetic mean 100 µg/m3 0.053 ppm Primary and secondary
Ozone (O3)1-hour average 235 µg/m3 0.12 ppm Primary and secondary8-hour average 157 µg/m3 0.08 ppm Primary and secondary
Lead (Pb)Quarterly average 1.5 µg/m3 — Primary and secondary
Particulate (PM10)Annual arithmetic mean 50 µg/m3 — Primary and secondary24-hour average 150 µg/m3 — Primary and secondary
Particulate (PM2.5)Annual arithmetic mean 15 µg/m3 — Primary and secondary24-hour average 65 µg/m3 — Primary and secondary
Sulfur dioxide (SO2)Annual arithmetic mean 80 µg/m3 0.030 ppm Primary24-hour average 365 µg/m3 0.14 ppm Primary3-hour average 1300 µg/m3 0.50 ppm Primary and secondary
Emission standards can be categorized into the following general types ofstandards [4]:
• Visible emissions standards—The opacity of the plume from a stackor a point of fugitive emissions is not to equal to or does not exceeda specified opacity;
• Particulate concentration standards—The maximum allowableemission rate is specified in mass/volume (grams per dry standardcubic meter [g/dscm] or grains per dry standard cubic foot [gr/dscf]),and for combustion processes it is common to specify the concen-tration at a fixed oxygen (O2) or carbon dioxide (CO2) level so as toprevent dilution, thereby lowering the concentration;
• Particulate process weight (or mass) standards—The maximumallowable particulate emissions are tied to the actual mass of mate-rial being processed or used, and in combustion systems the stan-dards are commonly reported in pounds of particulate matter permillion Btu of fuel burned (lb/106 Btu or lb/MM Btu);
• Gas concentration standards—Gas standards are typically reportedin mass per volume or volume per volume (g/dscm or ppm);
132 Coal Energy Systems
• Prohibition of emissions—Processes are banned outright;• Fuel regulations—Fuel standards may be specified for various fuel-
burning equipment such as limiting sulfur concentration in a fuel;• Zoning restrictions—Emissions may be limited by passing zoning
ordinances that dictate facilities that can be constructed;• Dispersion-based standards—These standards limit the allowable
emission of pollutants based on their contribution to the ambientair quality.
National emission or performance standards have been set for a numberof industries, including fossil fuel-fired electric utility steam-generatingunits. National standards are necessary for industries that are spread geo-graphically across the country and provide a basic commodity essentialfor the development of the country. Unfair economic advantages might begained if the standards were set by individual states, thus allowing a stateto relax the standards to attract industries. These national emissions stan-dards are referred to as New Source Performance Standards (NSPSs) and applyto construction of new sources as well as sources that undergo operationaland physical changes, which either increase emission rates or initiate newemissions from the plant [4].
40 CFR, Part 60, Subpart D On December 23, 1971, the first five finalstandards were published. Since December 23, 1971, the EPA administratorhas promulgated nearly 75 standards. The complete text for each NSPS isavailable in the Code of Federal Register at Title 40 (Protection of the Envi-ronment), Part 60 (Standards of Performance for New Stationary Sources),with steam electric plants found in Subpart D [8]. The 1971 regulationsaddressed coal usage in utility and industrial steam generation units, andthe regulations were amended for lignite on March 7, 1978. The maximumSO2 emissions allowable from electric utility steam-generating units of morethan 73 MW (megawatts) or 250 million (MM) Btu/hr of heat input and underconstruction or modification after August 17, 1971, was 1.2 lb SO2 per MMBtu for solid fuels. Particulate matter was limited to 0.10 lb/MM Btu heatinput, and opacity was not to exceed 20% for one 6-minute period per hour.NOx standards were 0.70 lb NOx per MM Btu heat input for solid fossilfuel or solid fossil fuel and wood residue (except for lignite); 0.60 lb NOxper MM Btu heat input for lignite or lignite and wood residue; and 0.80 lbNOx per MM Btu for lignite mined in North Dakota, South Dakota, or Mon-tana and burned in a cyclone-fired unit (various combustion technologies arediscussed in Chapter 5, Technologies for Coal Utilization).
40 CFR, Part 60, Subpart D(a) The original regulations were significantlyrevised as of February 6, 1980. The EPA promulgated new regulations for thecontrol of SO2, NOx , and particulate matter from steam-generating units ofmore than 73 MW or 250 MM Btu/hr of heat input (40 CFR, Part 60, Subpart

Coal-Fired Emissions and Legislative Action in the United States 133
D(a)) and under construction after September 18, 1978. For a coal-fired unit,the 1980 standard requires at least a 90% reduction of potential SO2 emis-sions and limits the rate to 1.2 lb SO2 per MM Btu heat input, or requires atleast a 70% reduction and limits the emission rate to 0.6 lb SO2 per MM Btuheat input. In addition, the standard specifies a unique maximum allowableemission rate and unique minimum reduction of potential emission basedon the sulfur content and heating value of the coal [9]. If the uncontrolledemission rate (UER) is determined, then the required efficiency is as follows:
UER of SO2 Required efficiency or maximum allowableefficiency rate
<2 lb SO2 per MM Btu 70%2–6 lb SO2 per MM Btu 0.6 lb SO2 per MM Btu; efficiency (%)
= [(UER − 0.6)/UER] × 100%6–12 lb SO2 per MM Btu 90%>12 lb SO2 per MM Btu 1.2 lb SO2 per MM Btu; efficiency (%)
= [(UER − 1.2)/UER] × 100%
The NOx standard varies according to fuel type and, with respect to coal, is0.50 lb NOx per MM Btu heat input from subbituminous coal, shale oil, orany solid, liquid, or gaseous fuel derived from coal; 0.80 lb NOx per MM Btuheat input from the combustion in a slag tap furnace of any fuel containingmore than 25%, by weight, lignite, which has been mined in North Dakota,South Dakota, or Montana; and 0.60 lb NOx per MM Btu heat input fromanthracite or bituminous coal. The NOx standard is based on a 30-day rollingaverage.
Particulate emissions are limited to 0.03 lb/MM Btu heat input. Inaddition, opacity is limited to 20% for a 6-minute average. The NOx stan-dards for Subparts D(a) and D(b) (see below for Subpart D(b)) were revised onSeptember 16, 1998 [10]. Only those electric utility steam generating unitsfor which construction, modification, or reconstruction is commenced afterJuly 9, 1997, would be affected by these revisions. The revisions changedthe existing standards for NOx emission limits to reflect the performanceof best-demonstrated technology. The revisions also changed the format ofthe revised NOx emission limit for new electric utility steam-generatingunits to an output-based format to promote energy efficiency and pollu-tion prevention. The NOx emission limit in Subpart D(a) is 1.6 lb NOxper megawatt-hour (MWh) gross energy output regardless of fuel type fornew utility boilers. For existing utility boilers that would become subjectto the standards due to a modification or reconstruction, the EPA revisedthe NOx limit to be consistent with the requirements for new units butexpressed the emission limits in an equivalent input-based format: 0.15 lbNOx per MM Btu. This provision was withdrawn by the EPA on August 7,2001, however, after industry groups filed petitions for review and a motionto vacate the standards as applied to modified boilers in the U.S. Court of

134 Coal Energy Systems
Appeals [11]. On September 21, 1999, the court issued an order granting thepetitioner’s motion and, as a result, owners and operators of electric utilityboilers on which modification is commenced after July 9, 1997, are requiredto comply with the applicable nitrogen oxides emission limits specified inthe pre-existing NSPS, which is 0.50 lb NOx per MM Btu.
40 CFR, Part 60, Subparts D(b) and D(c) Although the acid rain provisionsof the 1990 Clean Air Act Amendments (discussed further below) place addi-tional requirements on the electric utility industry, the NSPS, as revised in1980, is still applicable for new sources. Smaller sources have been addressedover time, including industrial/commercial/institutional steam generatorsconstructed after June 19, 1984, with heat inputs of 29 to 73 MW (40 CFR,Part 60, Subpart D(b)) and small industrial/commercial/institutional steam-generating units with 2.9 to 29 MW of heat input constructed after June 9,1989 (40 CFR, Part 60, Subpart D(c)). On November 25, 1986, standardsof performance for industrial/commercial/institutional steam-generationunits were promulgated [12]. Coal-fired facilities having heat input capac-ity between 29 and 73 MW (100 and 250 million Btu/hr) are subject tothe particulate matter and NOx standards under 40 CFR, Part 60, SubpartD(b). Particulate matter (PM) standards for coal are more complicated thanprevious regulations:
• 0.05 lb PM/MM Btu heat input if the facility combusts only coal orcombusts coal and other fuels and has an annual capacity factor forthe other fuels of 10% or less;
• 0.10 lb PM/MM Btu heat input if the facility combusts coal and otherfuels and has an annual capacity factor for the other fuels greater than10% and is subject to a federally-enforceable requirement limitingoperation of the affected facility to an annual capacity factor greaterthan 10% for fuels other than coal;
• 0.20 lb PM/MM Btu heat input if the affected facility combusts coalor coal and other fuels and has an annual capacity factor for coal orcoal and other fuels of 30% or less, has a maximum heat input capac-ity of 73 MW (250 million Btu/hr) or less, had a federally-enforceablerequirement limiting operation of the affected facility to an annualcapacity factor of 30% or less for coal or coal and other solid fuels,and construction of the facility commenced after June 19, 1984, andbefore November 25, 1986.
The NOx standards for coal-fired facilities identified in 1986 in SubpartD(b) are:
• 0.50 lb NOx (expressed as NO2) per MM Btu for mass-feedstokers;
• 0.60 lb NOx per MM Btu for spreader stoker and fluidized-bedcombustors;
Coal-Fired Emissions and Legislative Action in the United States 135
• 0.70 lb NOx per MM Btu for pulverized coal-fired units;• 0.60 lb NOx per MM Btu for lignite units except for lignite mined
in North Dakota, South Dakota, or Montana and combusted ina slag tap furnace for which the emissions limits are 0.8 lb NOxper MM Btu;
• 0.50 lb NOx per MM Btu for coal-derived synthetic fuels.
As previously mentioned, the NOx standard for Subpart D(b) wasrevised on September 16, 1998 [10]. Only those industrial steam-generatingunits for which construction, modification, or reconstruction is commencedafter July 9, 1997, would be affected by these revisions. For coal-fired SubpartD(b) units, the NOx emission limit promulgated was 0.20 lb/MM Btu heatinput; however, this provision was withdrawn on August 7, 2001, and own-ers and operators of industrial/commercial/institutional boilers on whichmodification is commenced after July 9, 1997, are required to comply withthe applicable nitrogen oxides emission limits specified in the pre-existingNSPS (i.e., 0.50 to 0.80 lb NOx per MM Btu, depending on fuel type andboiler configuration as listed above) [11].
On September 12, 1990, standards of performance for small indus-trial/commercial/institutional steam-generation units were promulgated(40 CFR, Part 60, Subpart D(c)) [13]. Under Subpart D(c), coal-fired facili-ties having heat input capacity between 2.9 and 29 MW (10 and 100 millionBtu/hr) are not subject to NOx standards nor are they subject to SO2 or par-ticulate matter emissions limits during periods of combustion research. Fornonresearch operations, SO2 standards include the following:
• When firing only coal, SO2 emissions are limited to no more than10% of the potential SO2 emissions rate (i.e., 90% reduction) andless than 1.2 lb SO2 per MM Btu heat input;
• If coal is combusted with other fuels, the affected facility is subjectto the 90% SO2 reduction requirement, and the emission limit isdetermined by the equation:
ESO2 = KaHa + KbHb + KcHc
Ha + Hb + Hc(4-1)
where:
ESO2 is the SO2 emission limit, expressed in lb/million Btu heatinput;
Ka is 1.2 lb/million Btu;Kb is 0.60 lb/million Btu;Kc is 0.50 lb/million Btu;Ha is the heat input from the combustion of coal, except coal
combusted in a facility that uses an emerging technology forSO2 control, in million Btu;
136 Coal Energy Systems
Hb is the heat input from the combustion of coal in a facility thatuses an emerging technology for SO2 control, in million Btu;
Hc is the heat input from the combustion of oil in million Btu.
• When firing only coal in a facility that uses an emerging technologyfor SO2 control, SO2 emissions are limited to no more than 50% ofthe potential SO2 emissions rate (i.e., 50% reduction) and less than0.60 lb SO2 per MM Btu heat input;
• If coal is combusted with other fuels, a 50% SO2 reduction isrequired, and the emission limit is determined using Equation (4-1);
• Percent reduction requirements are not applicable for affected facil-ities that have input capacity of 22 MW (75 million Btu/hr) or less;affected facilities that have an annual capacity for coal of 55% or less;affected facilities located in a noncontinental area; and affected facil-ities that combust coal in a duct burner as part of a combined cyclesystem where 30% or less of the heat entering the steam-generatingunit is from combustion of coal in the duct burner and 70% or moreof the heat entering the steam generating unit is from exhaust gasesentering the duct burner;
• Reduction of the potential SO2 emission rate through fuel pre-treatment is not credited toward the percent reduction requirementunless fuel pretreatment results in a 50% or greater reduction inthe potential SO2 emission rate and emissions from the pretreatedfuel (without either combustion or post-combustion SO2 control) areequal or less than 0.60 lb/MM Btu.
The particulate matter standards in Subpart D(c) state that a facilitythat combusts coal or mixtures of coal with other fuels and has a heat inputcapacity of 8.7 MW (30 million Btu/hr) or greater is subject to the followingemission limits:
• 0.05 lb PM per MM Btu heat input if the facility combusts only coal,or combusts coal with other fuels and has an annual capacity factorfor the other fuels of 10% or less;
• 0.10 lb PM per MM Btu heat input if the facility combusts coal withother fuels, has an annual capacity factor for the other fuels greaterthan 10%, and is subject to a federally enforceable requirement lim-iting operation of the facility to an annual capacity factor greaterthan 10% for fuels other than coal.
Emission Factors Once an NSPS has been established, it is necessary fornew sources constructed after a defined date to meet the standards. It is notpossible to sample new sources to determine required collection or removalefficiencies. In these cases, knowledge of the emission factors for the specificregulated pollutant from these sources is used to estimate the approximate

Coal-Fired Emissions and Legislative Action in the United States 137
level of control required to meet the NSPS. The EPA has published a docu-ment, Compilation of Air Pollutant Emission Factors (referred to as AP-42)since 1972. Supplements to AP-42 have been routinely published to add newemissions source categories and to update existing emission factors. Thisdocument is also provided on the EPA website at their CHIEF (Clearing-house for Inventories and Emissions Factors; www.epa.gov/ttn/chief/ap42)bulletin board.
The EPA routinely updates AP-42 in order to respond to new emis-sion factor needs of state and local air pollution control programs, industry,and the agency itself. The current emission factors for bituminous and sub-bituminous coal, lignite, and anthracite firing are provided in Appendix Aand are from Sections 1.1 (Bituminous and Subbituminous Coal Combus-tion), 1.2 (Anthracite Coal Combustion), and 1.7 (Lignite Combustion) ofAP-42, fifth ed., vol. I, suppls. A through G. The emission factors have beendeveloped for (not inclusive):
• Various fuel firing configurations;• Uncontrolled and controlled emissions;• Criteria gaseous pollutants (SOx , NOx , CO);• Filterable particulate matter and condensable particulate matter;• Trace elements;• Various types of polynuclear organic matter (POM), polynuclear
aromatic hydrocarbons (PAHs), and organic compounds;• Acid gases (HCl and HF);• Other gaseous pollutants such as CO2, N2O, and CH4;• Cumulative ash particle size distribution and size-specific emis-
sions.
Emissions factors and emissions inventories have long been funda-mental tools for air quality management. Emission estimates are importantfor developing emission control strategies, determining applicability of per-mitting and control programs, and ascertaining the effects of sources andappropriate mitigation strategies. Users include federal, state, and local agen-cies; consultants; and industry. Data from source-specific emission tests orcontinuous emission monitors are usually preferred for estimating a source’semissions because those data provide the best representation of the testedsource’s emissions; however, test data from individual sources are not alwaysavailable and they may not reflect the variability of actual emissions overtime. Consequently, emission factors are often the best or only methodavailable for estimating emissions.
The passage of the Clean Air Act Amendments of 1990 and the Emer-gency Planning and Community Right-To-Know Act of 1986 has increasedthe need for both criteria and hazardous air pollutant emission factorsand inventories. The Emission Factor and Inventory Group (EFIG) of theEPA’s Office of Air Quality Planning and Standards develops and maintains

138 Coal Energy Systems
emission-estimating tools. The AP-42 series is the principal means by whichthe EFIG can document its emission factors.
Emission factors may be appropriate to use in a number of situationssuch as source-specific emission estimates for area-wide inventories. Theseinventories have many purposes, including ambient dispersion modeling andanalysis, control strategy development, as screening sources for complianceinvestigations, and in some permitting applications. Emission factors inAP-42 are neither EPA-recommended emission limits—for example, bestavailable control technology (BACT) or lowest achievable emission rate(LAER)—nor standards (e.g., NSPSs or NESHAPs).
Figure 4-1 depicts various approaches to emission estimation in a hier-archy of requirements and levels of sophistication that need to be consideredwhen analyzing the tradeoffs between cost of the estimates and the qual-ity of the resulting estimates. More sophisticated and more costly emissiondetermination methods may be necessary where risks of either adverse envi-ronmental effects or adverse regulatory outcomes are high. Less expensiveestimation techniques such as emission factors and emission models maybe appropriate and satisfactory where risks of using a poor estimate are low.Note that the reliability of the AP-42 emission factors are rated from Athrough E, which is a general indication of the robustness of that factor.This rating is assigned based on the estimated reliability of the tests usedto develop the factor. In general, factors based on many observations, or on
CEM
Parametric Source Tests
Single Source Tests
Material Balance TN
Increasing Cost
Source Category Emissions Model
State/Industry Factors
Emission Factors (AP-42)
Engineering Judgment
Increasing Reliability of Estimate
ABCDE
FIGURE 4-1. Approach to emission estimation. (From AP-42, External CombustionSources, in Emission Factors, Fifth ed., Office of Air Quality Planning and Stan-dards and Office of Air and Radiation, U.S. Environmental Protection Agency, U.S.Government Printing Office, Washington, D.C., 1993 [latest revisions in 1998].)

Coal-Fired Emissions and Legislative Action in the United States 139
more widely accepted test procedures, are assigned higher rankings, with Abeing the best. The emission factors rating is provided with the emissionfactors contained in Appendix A.
National Emission Standards for HazardousAir PollutantsThe 1970 Clean Air Act Amendments also provided for national emissionstandards for hazardous air pollutants (NESHAPs). Only seven standardswere established between 1970 and 1990, as the NESHAPs were the sub-ject of numerous suits and court decisions regarding how to address emissionlimits on carcinogenic pollutants [4]. None of the original seven NESHAPs—asbestos, beryllium, mercury, vinyl chloride, benzene, radionuclides, andarsenic—specifically addressed coal-fired steam-generating units. The CleanAir Act Amendments of 1990 made major changes in the approach taken toaddress hazardous air pollutants (HAPs) with additional amendments beingadded as recently as May 30, 2003 [15].
Clean Air Act Amendments of 1977 and Preventionof Significant DeteriorationBy 1977, most areas of the country had still not attained the NAAQSs forat least one pollutant [4]. For those areas that had not attained a NAAQS(i.e., nonattainment areas), states were required to submit and have anapproved state implementation plan (SIP) revision by July 1, 1979, thatdemonstrated how attainment would be achieved by December 31, 1982.This requirement was a precondition for the construction or modification ofmajor emission sources in nonattainment areas after June 30, 1979. If a statecould not attain primary standards for carbon monoxide or photochemicaloxidants after implementation of all reasonably available measures, it wasrequired to submit a second SIP revision by December 31, 1982, that woulddemonstrate how attainment would be achieved by December 31, 1987.
Prevention of Significant DeteriorationThe concern over nonattainment areas and the controversy generated by theprovision in the 1970 Clean Air Act Amendments on standards preventingcontinuing deterioration of air quality led to a set of guidelines issued in 1974by the EPA to prevent the significant deterioration of air quality in areas thatwere cleaner than required by NAAQS (i.e., had attained the NAAQSs). Thiswas necessary because some interpreted the 1970 act to mean that a regioncould not backslide in air quality even though the current air quality may besuperior to the national standard. This interpretation would have stifled eco-nomic growth in a region (new industrial and commercial operations in theregion could not contribute zero pollution), and would have failed to forcesources in the region to decrease their contaminant emissions. This concern

140 Coal Energy Systems
led to the passage of regulations regarding the prevention of significant dete-rioration (PSD). The PSD regulations for attainment areas required that allof these areas be designated as Class I, II, or III, depending upon the degreeof deterioration to be allowed, and incremental limits were placed on theamount of increase in deterioration allowed. The classifications are [4]:
• Class I—Pristine areas, including international parks, national parks,and national wilderness areas in which very little deteriorationwould be allowed;
• Class II—Areas where moderate change would be allowed, but wherestringent air quality constraints are desirable;
• Class III—Areas where major growth and industrialization would beallowed.
Congress specified which of the areas must be protected by the moststringent Class I designation, designated all other areas within the UnitedStates as Class II areas, and provided the option for redesignation of ClassII areas to Class I or Class III areas by public referendum. Congress alsospecified the maximum allowable incremental increases in concentrationof sulfur dioxide and particulate matter and charged the EPA to determinecomparable increments for hydrocarbons, carbon monoxide, photochemicaloxidants, and nitrogen oxides. The PSD increments are listed in Table 4-2 [4].
A requirement was placed on major sources in the preconstruction PSDreview process that specified that each major new plant must install BACT,which was defined to be at least as stringent as NSPS, to limit its emissions.Major sources subject to PSD review are those with the potential to emit 100short tons or more per year of any regulated pollutant under the Clean AirAct Amendment of 1977 [4]. All sources emitting greater than 250 short tons
TABLE 4-2Prevention of Significant Deterioration (PSD) Increments
Pollutant Maximum Allowable Increase (mg per m3)Class I Class II Class III
Particulate matterPM10, annual arithmetic mean 4 17 34PM10, 24-hour maximum 8 30 60
Sulfur dioxideAnnual arithmetic mean 2 20 4024-hour maximum 5 91 1823-hour maximum 25 512 700
Nitrogen dioxideAnnual arithmetic mean 2.5 25 50

Coal-Fired Emissions and Legislative Action in the United States 141
per year are subject to PSD review. For non-NSPS sources, a BACT reviewdocument is prepared in the preconstruction review.
The 1974 Guidelines on PSD and the Clean Air Amendments of 1977established the protocol for new sources and proposed modifications to majorsources in attainment areas where they would be subjected to a new sourcereview and would have to meet certain PSD requirements. This reviewrequires that dispersion modeling be conducted of the proposed emissionsfrom the sources to ensure that the emissions from the proposed facilitywould not exceed the increments listed in Table 4-2 or cause an exceedanceof the NAAQS. In concept, sources are allowed to use some fraction of theincrement, as determined by the state or local agency and based on disper-sion modeling. The PSD increment can only be used to the extent that itdoes not cause the ambient concentration to exceed the NAAQS. Anotherimportant issue is the extent to which any single source would be allowed touse the available increment and the ramifications on long-term growth if asingle source was allowed to use it all. Some state and local agencies addressthis on a case-by-case basis, while others have taken the approach of allow-ing only a certain fraction of the increment, or the remaining increment, tobe used in a single PSD application [4].
Nonattainment AreasThere was concern that no industrial growth could occur in nonattainmentareas, as these areas are in violation of one or more NAAQSs and, becausePSD does not apply in these areas, no increments are available. This wasremedied on December 21, 1976, with the Offsets Policy Interpretive Rul-ing, which pertained to the preconstruction review requirements for all newor modified stationary sources of air pollution in nonattainmant areas [4].This ruling, also known as the emission offset policy, requires that threeconditions be met: (1) the source must meet the lowest achievable emis-sion rate (LAER), defined as being more stringent than BACT; (2) all existingsources owned by the applicant in the same region must be in compliance orunder an approved schedule to achieve compliance; and (3) the source mustprovide an offset or reduction of emissions from other sources greater thanthe proposed emissions that the source would contribute such that there isa net improvement in air quality.
The Clean Air Act Amendments of 1977 also provided for the banking ofoffsets. If the offsets achieved are considerably greater than the new source’semissions, a portion of this excess emission reduction (also known as emis-sion reduction credits) can be banked by the source for use in future growthor traded to another source, depending on each state’s offset/trading policy.
Clean Air Act Amendments of 1990In June 1989, President Bush proposed major revisions to the Clean Air Act.Both the House of Representatives and the Senate passed Clean Air bills by

142 Coal Energy Systems
large votes that contained the major components of the president’s proposals.After a joint conference committee met to work out the differences in thebills, Congress voted for the package recommended by the conferees, andPresident Bush signed the bill, the Clean Air Act Amendments of 1990 (1990CAAAs), on November 15, 1990. The 1990 CAAAs are the most substantiveregulations adopted since passage of the Clean Air Act Amendments of 1970.Specifically, the new law:
• Encourages the use of market-based principles and other innova-tive approaches, such as performance-based standards and emissionbanking and trading;
• Provides a framework from which alternative clean fuels will beused by setting standards in the fleet and a California pilot programthat can be met by the most cost-effective combination of fuels andtechnology;
• Promotes the use of clean low-sulfur coal and natural gas, as well asinnovative technologies to clean high-sulfur coal through the AcidRain Program;
• Reduces enough energy waste and creates enough of a market forclean fuels derived from grain and natural gas to cut dependency onoil imports by 1 million barrels per day;
• Promotes energy conservation through an Acid Rain Program thatgives utilities flexibility to obtain needed emission reductionsthrough programs that encourage customers to conserve energy.
The 1990 CAAAs contains eleven major divisions, referred to as Titles Ithrough XI, which either provided amendments to existing titles and sectionsof the Clean Air Act or provided new titles and sections. The titles for the1990 CAAAs are:
• Title I—Provisions for Attainment and Maintenance of NationalAmbient Air Quality Standards;
• Title II—Provisions Relating to Mobile Sources;• Title III—Air Toxics;• Title IV—Acid Deposition Control;• Title V—Permits;• Title VI—Stratospheric Ozone and Global Climate Protection;• Title VII—Provisions Relating to Enforcement;• Title VIII—Miscellaneous Provisions;• Title IX—Clean Air Research;• Title X—Disadvantaged Business Concerns;• Title XI—Clean Air Deployment Transition Assistance.
The titles that directly impact the use of coal, Titles I, III, IV, and V, arediscussed in the following sections. The concepts of NAAQSs, NSPSs, and
Coal-Fired Emissions and Legislative Action in the United States 143
PSD, as defined in Title I, remained virtually unchanged; however, majorchanges have occurred in regulations and approaches used to address nonat-tainment areas in Title I, hazardous air pollutants in Title III, acid rain inTitle IV, and permitting in Title V.
Title I: Provisions for Attainment and Maintenanceof National Ambient Air Quality StandardsAlthough the Clean Air Act Amendments of 1970 and 1977 brought aboutsignificant improvements in air quality, urban air pollution persisted, andmany cities failed attainment for ozone, carbon monoxide, and PM10. Ofthese, the most widespread pollution problem is ozone (i.e., smog). Onecomponent of smog, hydrocarbons, comes from automobile emissions,petroleum refineries, chemical plants, dry cleaners, gasoline stations, housepainting, and printing shops while another key component, nitrogen oxides,comes from the combustion of fossil fuels for transportation, utilities, andindustries [16].
The 1990 CAAAs created a new, balanced strategy for the nation toaddress urban smog. The new law gave states more time to meet the airquality standard but it also required states to make constant progress inreducing emissions. It required the federal government to reduce emissionsfrom cars, trucks, and buses; from consumer products such as hair spray andwindow-washing compounds; and from ships and barges during loading andunloading of petroleum products. The federal government must also developguidance that states the need to control stationary sources.
The 1990 CAAAs address the urban air pollution problems of ozone,carbon monoxide, and PM10. Specifically, they clarify how areas are desig-nated and redefine the terms of attainment. The 1990 CAAAs also allow theEPA to define the boundaries of nonattainment areas and establish provi-sions defining when and how the federal government can impose sanctionson areas of the country that have not met certain conditions.
For the pollutant ozone, the 1990 CAAAs establish nonattainment areaclassifications ranked according to the severity of the area’s air pollutionproblem. These classifications are marginal, moderate, serious, severe, andextreme and were designated based on the air quality of the nonattainmentarea during the period of 1987 to 1989. The EPA assigns each nonattainmentarea one of these categories, thus triggering varying requirements with whichthe area must comply in order to meet the ozone standard. Table 4-3 lists theozone design value, which determines the classification, attainment dead-lines, minimum size of a new or modified source that would be affected, andoffset requirements [4].
Nonattainment areas have to implement different control measuresdepending upon their classification. Nonattainment areas with worse airquality problems must implement greater control measures. For example,in areas classified as extreme, boilers with emission rates greater than

144 Coal Energy Systems
TABLE 4-3Classifications for Nonattainment Areas
Pollutant Classification Design Attainment Major Offset RatioValue (ppm) Deadline Sourcea for Sources
Ozone Marginal 0.121–0.138 11/15/1993 100 1.1–1Moderate 0.138–0.160 11/15/1996 100 1.15–1Serious 0.160–0.180 11/15/1999 50 1.2–1Severe 0.180–0.190 11/15/2005 25 1.3–1Severe 0.190–0.280 11/15/2007 25 1.3–1Extreme >0.280 11/15/2007 10 1.5–1
Carbon monoxide Moderate 9.1–16.4 12/31/1995 — NoneSerious >16.4 12/31/2000 50 None
aShort tons VOCs per year for ozone; short tons CO per year for carbon monoxide.
25 short tons per year are required to burn clean fuels or install advancedcontrol technologies.
The 1990 CAAAs also established similar programs for areas that donot meet federal health standards for carbon monoxide and PM10. Areasexceeding the standards for these pollutants are divided into moderateand serious classifications. The classifications for nonattainment areas forcarbon monoxide are shown in Table 4-3.
Areas not attaining required levels of PM10 at the time the 1990 CAAAswere passed were designated as moderate areas and given an attainmentdeadline of December 31, 1994 [4]. Nonattainment areas subsequent to pas-sage of the 1990 CAAAs are designated moderate and are given 6 years toachieve compliance. Major sources in moderate areas are those that emit 100short tons or more of particulate matter per year. Moderate areas require theadoption of reasonably available control measures (RACM).
Moderate areas that fail to reach attainment are redesignated as seriousareas and have 10 years from the date of designation as nonattainment toachieve attainment. For serious areas, major sources include those that emit70 short tons or more of particulate matter per year. Serious areas must alsoadopt best available control measures (BACMs).
Title III: Air ToxicsHazardous air pollutants, also known as toxic air pollutants or air tox-ics, are those pollutants that cause or may cause cancer or other serioushealth effects, such as reproductive effects or birth defects, or adverseenvironmental and ecological effects but are not specifically covered underanother portion of the Clean Air Act. Most air toxics originate from human-made sources, including mobile sources (e.g., cars, trucks, buses), station-ary sources (e.g., factories, refineries, power plants), and indoor sources(e.g., building materials and activities such as cleaning) [16]. The Clean

Coal-Fired Emissions and Legislative Action in the United States 145
Air Act Amendments of 1977 failed to result in substantial reductions ofthe emissions of these very threatening substances. Over the history ofthe air toxics program, only seven pollutants had been regulated. Title IIIestablished a list of 189 (later modified to 188) HAPs associated with approxi-mately 300 major source categories. The list of HAPs is provided in AppendixB [17]. Under Title III, a major source is defined as any new or existing sourcewith the potential to emit, after controls, 10 short tons or more per year ofany of the 188 HAPs or 25 short tons or more per year of any combinationof those pollutants. These sources may release air toxics from equipmentleaks, when materials are transferred from one location to another, or duringdischarge through emissions stacks or vents.
The EPA must then issue maximum achievable control technology(MACT) standards for each listed source category according to a prescribedschedule. These standards are based on the best demonstrated controltechnology or practices within the regulated industry, and the prescribedschedule dictated that the EPA must issue the standards for 40 source cate-gories within 2 years, 25% of the source categories within 5 years, 50% of thesource categories within 7 years, and 100% of the source categories within10 years of passage of the new law. Eight years after MACT is installed ona source, the EPA must examine the risk levels remaining at the regulatedfacilities and determine whether additional controls are necessary to reduceunacceptable residual risk [16].
The Bhopal, India, tragedy, where an accidental release of methyl iso-cyanate at a pesticide-manufacturing plant in 1984 killed approximately4000 people and injured more than 200,000, inspired the 1990 CAAAsrequirement that factories and other businesses develop plans to preventaccidental releases of highly toxic chemicals. In addition, the Act establishedthe Chemical Safety Board to investigate and report on accidental releasesof HAPs from industrial plants.
Title III did not directly regulate air toxics from power plants but didstate that regulation of air toxics from utility power plants would be based onscientific and engineering studies. Mercury is one pollutant that was iden-tified for study and will be discussed in more detail later in this chapter. Atpower plants, compounds in the vapor phase (e.g., polycyclic organic matter)and those combined with or attached to particulate matter (e.g., arsenic) aresubject to the Title III provisions [18].
Title IV: Acid Deposition ControlThe Acid Rain Program was established under Title IV of the 1990 CAAAs.The program required major reductions of sulfur dioxide (SO2) and nitrogenoxides (NOx ) emissions, the pollutants that cause acid rain. Using an inno-vative market-based or cap-and-trade approach to environmental protection,the program sets a permanent cap on the total amount of SO2 that may beemitted by electric power plants nationwide. The cap is set at about one-halfthe amount of SO2 emitted in 1980, and the trading component allows for

146 Coal Energy Systems
flexibility for individual fossil-fuel-fired combustion units to select their ownmethods of compliance. The program also sets NOx emission limitations forcertain coal-fired electric utility boilers, representing about a 27% reductionfrom 1990 levels [19].
Under the Acid Rain Program, each unit must continuously measureand record its emissions of SO2, NOx , and CO2, as well as volumetric flowand opacity [19]. In most cases, a continuous emissions monitoring (CEM)system must be used. Units report hourly emissions data to the EPA ona quarterly basis. These data are then recorded in the Emissions TrackingSystem, which serves as a repository of emission data for the utility industry.Emissions monitoring and reporting are critical to the program as they instillconfidence in allowance transactions by certifying the existence and quantityof the commodity being traded and provide assurance that NOx averagingplans are working. Monitoring also ensures, through accurate accounting,that the SO2 and NOx emissions reduction goals are met.
The SO2 Program Title IV of the 1990 CAAAs called for a two-step programto reduce SO2 emissions by 10 million short tons from 1980 levels and, whenfully implemented in 2000, placed a cap of approximately 8.9 million shorttons per year on SO2 emissions, forcing all generators that burn fossil fuelsafter 2000 to possess an emissions allowance for each ton of SO2 they emit.By January 1, 1995, the deadline for Phase I, half of the total SO2 reductionswere to have occurred by requiring 110 of the largest SO2-emitting powerplants (with 263 boilers or units) located in 21 eastern and Midwestern statesto cut their emissions to an annual average rate of 2.5 lb SO2 per million Btu.These stations, specifically identified in the 1990 CAAAs (see Appendix C),consisted of boilers with output greater than or equal to 100 MW and sulfuremissions of greater than 2.5 lb SO2 per million Btu. Plants deciding to reduceSO2 emissions by 90% were given until 1997 to meet the requirements. Bythe year 2000, the deadline for Phase II, virtually all power plants greaterthan 75 MW and discharging SO2 at a rate more than 1.2 lb/million Btu wererequired to reduce emissions to that level. In 2001, 2792 units were affectedby the SO2 provision of the Acid Rain Program [19].
The Phase I reductions were accomplished by issuing the utilities thatoperated these units emission allowances equivalent to what their annualemission would have been at these plants in the years 1985 to 1987 based onburning coal with emissions of 2.5 lb SO2 per million Btu. One allowance isequivalent to the emission of one short ton of SO2 per year. Utilities wereallowed the flexibility of determining which control strategies to be used onexisting plants as long as the total emissions from all plants listed in Phase Iand owned by the utility did not exceed the available allowances. The lawwas designed to let industry find the most cost-effective way to stay underthe cap. This differs in approach from previous air quality regulations, suchas the NSPSs and PSD, which are based on controlling emissions at theirsource and then monitoring to ensure compliance [20]. If a utility’s emissions

Coal-Fired Emissions and Legislative Action in the United States 147
exceeded the available allowances, they were subject to fines assessed at$2000/short ton of excess emissions with a requirement to offset the emis-sions in future years. Any emission reductions achieved that were in excessof those required could be banked by the utility for use at a later date ortraded or sold to another utility.
The SO2 component of the Acid Rain Program represents a dramaticdeparture from traditional regulatory approaches that establish source-specific emissions limitations; instead, the program uses an overall emis-sions cap for SO2 that ensures that emission reductions are achievedand maintained and provides for a trading system that facilitates lowest-cost emissions reductions. The program features tradable SO2 emissionsallowances, where one allowance is a limited authorization to emit 1 shortton of SO2. A fixed number of allowances is issued by the governmentand they may be bought, sold, or banked for future use by utilities, bro-kers, or anyone else interested in holding them. Existing units are allocatedallowances for each year; new units do not receive allowances and mustbuy them. New coal-fired boilers are subject to the NSPSs that remain ineffect (i.e., 70–90+% reduction), with the provision that they must acquireemission allowances to emit the residual SO2 that is not controlled [4]. Atthe end of the year, all participants in the program are obliged to surrenderto the EPA the number of allowances that correspond to their annual SO2emissions [19].
The NOx Program Title IV also required the EPA to develop a NOx reduc-tion program and set a goal of reducing NOx by 2 million short tons from1980 levels. As with the SO2 emission reduction requirements, the NOxprogram was implemented in two phases, beginning in 1996 and 2000 [21].The NOx program embodies many of the same principles of the SO2 trad-ing program in its design: a results orientation, flexibility in the method toachieve emission reductions, and program integrity achieved through mea-surement of the emissions. However, it does not cap NOx emissions as theSO2 program does nor does it utilize an allowance trading system, althoughNOx trading programs have been implemented, as discussed later in thischapter.
Emission limitations for the NOx boilers provide flexibility for utilitiesby focusing on the emission rate to be achieved, expressed in pounds of NOxper million Btu of heat input. Two options for compliance with the emissionlimitations are provided:
• Compliance with an individual emission rate for a boiler;• Averaging of emission rates over two or more units, that have the
same owner or operator to meet an overall emission rate limitation.
These options give utilities flexibility to meet the emission limitationsin the most cost-effective way and allow for the further development of
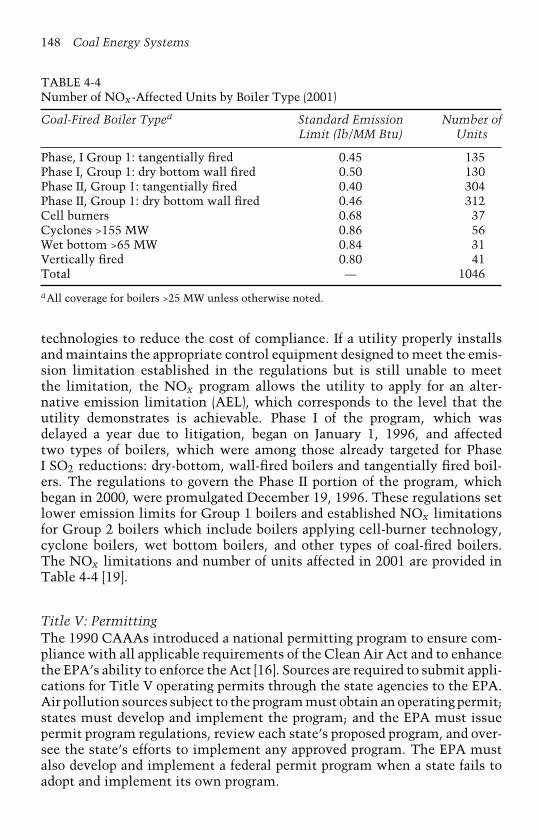
148 Coal Energy Systems
TABLE 4-4Number of NOx-Affected Units by Boiler Type (2001)
Coal-Fired Boiler Typea Standard Emission Number ofLimit (lb/MM Btu) Units
Phase, I Group 1: tangentially fired 0.45 135Phase I, Group 1: dry bottom wall fired 0.50 130Phase II, Group 1: tangentially fired 0.40 304Phase II, Group 1: dry bottom wall fired 0.46 312Cell burners 0.68 37Cyclones >155 MW 0.86 56Wet bottom >65 MW 0.84 31Vertically fired 0.80 41Total — 1046
aAll coverage for boilers >25 MW unless otherwise noted.
technologies to reduce the cost of compliance. If a utility properly installsand maintains the appropriate control equipment designed to meet the emis-sion limitation established in the regulations but is still unable to meetthe limitation, the NOx program allows the utility to apply for an alter-native emission limitation (AEL), which corresponds to the level that theutility demonstrates is achievable. Phase I of the program, which wasdelayed a year due to litigation, began on January 1, 1996, and affectedtwo types of boilers, which were among those already targeted for PhaseI SO2 reductions: dry-bottom, wall-fired boilers and tangentially fired boil-ers. The regulations to govern the Phase II portion of the program, whichbegan in 2000, were promulgated December 19, 1996. These regulations setlower emission limits for Group 1 boilers and established NOx limitationsfor Group 2 boilers which include boilers applying cell-burner technology,cyclone boilers, wet bottom boilers, and other types of coal-fired boilers.The NOx limitations and number of units affected in 2001 are provided inTable 4-4 [19].
Title V: PermittingThe 1990 CAAAs introduced a national permitting program to ensure com-pliance with all applicable requirements of the Clean Air Act and to enhancethe EPA’s ability to enforce the Act [16]. Sources are required to submit appli-cations for Title V operating permits through the state agencies to the EPA.Air pollution sources subject to the program must obtain an operating permit;states must develop and implement the program; and the EPA must issuepermit program regulations, review each state’s proposed program, and over-see the state’s efforts to implement any approved program. The EPA mustalso develop and implement a federal permit program when a state fails toadopt and implement its own program.
Coal-Fired Emissions and Legislative Action in the United States 149
The following sources are required to submit Title V permits:
• Major sources as determined under Title I—(1) ≥100 short tonsper year and listed pollutants, excluding CO; and (2) ≥10 to 100short tons year, or sources in nonattainment areas depending on theclassification of marginal to extreme;
• All NSPSs, PSD review sources, and NESHAPs sources;• Major sources as determined under Title III—(1) ≥10 short tons per
year any air toxic, and (2) ≥25 short tons per year multiple air toxics;• Sources under Title IV;• Sources emitting ≥100 short tons per year of ozone depleting
substances under Title VI;• Other sources required to have state or federal operating permits.
Additional NOx Regulations and Trading ProgramsMany urban areas do not meet the ozone standard and are classified asnonattainment areas. To address this, along with the fact that NOx canbe transported great distances, more restrictive requirements for NOx emis-sions from electric power generating plants and other large stationary boilersin 22 eastern states and the District of Columbia were established [22]. Therequirements set statewide NOx emissions budgets including budget com-ponents for the electric power industry and certain industrial sources. Statesare required to develop state implementation plans (SIPs) that include NOxemission limits for certain sources in order to achieve the required statewideemission budgets.
Title I of the 1990 CAAAs includes provisions designed to addressboth the continued nonattainment of the existing ozone NAAQSs and thetransport of air pollutants across state boundaries. These provisions allowdownwind states to petition for tighter controls on upwind states that con-tribute to their NAAQS nonattainment status. In general, Title I nitrogenoxide provisions with regard to ozone nonattainment regions:
• Require existing major stationary sources to apply reasonably avail-able control technology (RACT), which is the lowest emissionlimitation that a particular source is capable of meeting by appli-cation of control technology that is reasonably available consideringtechnological and economic feasibility;
• Require new or modified stationary sources to offset their emissionsand install controls representing the lowest achievable emission rate,which is the minimum emissions rate accepted by the EPA for majornew or modified sources in nonattainment areas;
• Require each state with an ozone nonattainment region to develop anSIP that may, in some cases, include reductions in stationary source
150 Coal Energy Systems
NOx emissions beyond those required by the RACT provisions ofTitle I.
Section 184 of the Clean Air Act delineated a multistate ozone trans-port region (OTR) in the northeast and requires specific additional nitrogenoxide and volatile organic compound controls for all areas in this region. Italso established the Ozone Transport Commission (OTC) for the purposeof assessing the degree of ozone transport in the OTR and recommend-ing strategies to mitigate the interstate transport of pollution. The OTRconsists of the states of Connecticut, Delaware, Maine, Maryland, Mas-sachusetts, New Hampshire, New Jersey, New York, Pennsylvania, RhodeIsland, Vermont, the northern counties of Virginia, and the District ofColumbia. The OTR states confirmed that they would implement RACT onmajor stationary sources of NOx (Phase I) and agreed to a phased approachfor additional controls, beyond RACT, for power plants (>25 MW) and otherlarge fuel combustion sources (industrial boilers with a rated capacity >250million Btu per hour input; Phases II and III). This agreement, known asthe OTC Memorandum of Understanding (MOU), was approved on Septem-ber 27, 1994, at which time all OTR states except for Virginia signed theMOU. The MOU establishes an emission trading system to reduce the costsof compliance with the control requirements under Phase II, which beganon May 1, 1999, and Phase III, which began on May 1, 2003. The OTCprogram capped summer-season (May 1 through September 30) NOx emis-sions at approximately 219,000 short tons in 1999 and 143,000 short tonsin 2003, which represents approximately 55 and 70% reductions in NOx ,respectively, from the 1990 baseline emission level of 490,000 short tons.While there are 13 affected regions (see Table 4-5), the actual reductionsduring the 1999 season reflect participation by only eight of the jurisdic-tions: Connecticut, Delaware, Massachusetts, New Hampshire, New Jersey,New York, Pennsylvania, and Rhode Island [23].
The EPA promulgated a rule on October 27, 1998, known as the NOxSIP call, to address long-range transport of ozone. The purpose of this ruleis to limit summer-season NOx emissions in 22 northeastern states and theDistrict of Columbia that EPA considers significant contributors to ozonenonattainment in downwind areas (see Table 4-5 for affected states). Thesestates were required to amend their SIPs through a procedure establishedin Section 110 of the Clean Air Act to further reduce NOx emissions bytaking advantage of newer, cleaner control strategies. The EPA finalized asummer-season state NOx budget and developed a state implemented andfederally enforced NOx trading program to provide for emissions trading bycertain electric and industrial stationary sources. Each affected state’s NOxbudget is based on a population-wide 0.15 lb/MM Btu NOx emission ratefor large electric generating stations and a 60% reduction from uncontrolledemissions for large electric generating units. This effort is projected to reduce

Coal-Fired
Em
issions
and
Legislative
Action
inth
eU
nited
States151
TABLE 4-5Summary of Nitrogen Oxide Reduction and Trading Programs
Ozone Transport NOx State Section 126 Federal Acid RainCommission (OTC) Implementation NOx Budget Trading ProgramNOx Budget Program Plan (SIP) Call Program
Affectedregions
District of Columbia and12 states: CT, DE, MA,ME, MD, NH, NJ, NY,PA, RI, VA, VT
District of Columbia and22 states: AL, CT, DE, GA,IL, IN, KY, MA, MD, MI,MO, NC, NJ, NY, OH, PA,RI, SC, TN, VA, WI, WV
District of Columbia and12 states: DE, IN, KY, MD,MI, NC, NJ, NY, OH, PA,VA, WV
Entire nation
Complianceperiod
May 1–September 30 ofeach year
May 1–September 30 ofeach year (in 2004 thecompliance period beganMay 31)
May 1–September 30 ofeach year
Annual
Initialcomplianceyear
1999 2004 (phase I) 2003 Phase I January 1, 1996Phase II January 1, 2000
Emissions cap 219,000 short tons in 1999;143,000 short tons in2003
— 289,983 short tons —
NOxreductions
246,000 short tons in 1999;322,000 short tons in2003
1.2 million short tons in 2007 800,000 short tons in 2007 340,000 short tons per yearin Phase I; 2.06 millionshort tons per year inPhase II
Baseline year 1990 1995 1995 1980
Baselineemissions
490,000 million short tonsNOx
— — —
Program owner OTC; allowances set byOTC, programadministered by the EPA
States and the EPA; stateshave the option ofparticipating in the tradingprogram and establishingunit allocations; programadministered by the EPA
EPA EPA
Source: Adapted from EPA [23].
152 Coal Energy Systems
summer-season NOx emissions by 1.2 million short tons in the affected22 states and the District of Columbia by 2007 [24].
In addition to promulgating the NOx SIP call, the EPA responded topetitions filed by eight northeastern states under Section 126 of the CleanAir Act. The petitions, known as the Section 126 petitions, request thatthe EPA make a finding that NOx emissions from certain major stationarysources significantly contribute to ozone nonattainment problems in thepetitioning states. The final Section 126 rule requires upwind states to takeaction to reduce emissions of NOx that contribute to nonattainment of ozonestandards in downwind states. The findings affect large electric generatingstations and both nonelectric generating boilers and turbines located in 12northeastern states and the District of Columbia (see Table 4-5 for affectedstates). Like the NOx SIP call, the EPA has finalized a federal NOx budgettrading program based on application of a population-wide emission rateof 0.15 lb NOx per MM Btu for large electric generating units and a 60%reduction from uncontrolled emissions for large nonelectric generating units.The final Section 126 actions are projected to reduce summer season NOxemissions by 800,000 short tons/year in the affected area [25].
New Source ReviewThe New Source Review (NSR) program is one of many programs createdby the Clean Air Act to reduce emissions of air pollutants, particularly“criteria” pollutants that are emitted from a wide variety of sources andhave an adverse impact on human health and the environment. The NSRprogram was established in parts C and D of Title I of the Clean Air Act toprotect public health and welfare, as well as national parks and wildernessareas, as new sources of air pollution are built and when existing sources aremodified in a way that significantly increases air pollutant emissions. Specif-ically, the purpose of the NSR is to ensure that when new sources are builtor existing sources undergo major modifications the air quality improves ifthe change occurs where the air currently does not meet federal air qualitystandards and air quality is not significantly degraded where the air currentlymeets federal standards [26].
The original intent of the NSR program was to ensure that major newfacilities that are sources of emissions or existing facilities that are modi-fied and result in increased emissions would install state-of-the-art controls.Subsequently, the EPA provided interpretive guidance that complicated thereview program and expanded it to include maintenance or improvement.While the determination of whether an activity is subject to the major NSRprogram is fairly straightforward for a newly constructed source, the deter-mination of what should be classified as a modification subject to a majorNSR presents a more difficult issue; consequently, installation of new tech-nology, greater energy efficiency, and improved environmental performanceat facilities were being inhibited. In addition, there was much controversy

Coal-Fired Emissions and Legislative Action in the United States 153
between industry and the EPA over what “triggers” applicability of themajor NSR program, which led to litigation between Wisconsin ElectricPower Company (WEPCO) and the EPA. In 1992, the EPA promulgated revi-sions to the applicability regulations, creating special rules for physical andoperational changes at electric utility steam-generating units.
On July 23, 1996, a number of changes were proposed to the existingmajor NSR requirements as part of a larger regulatory package [27]. This wasfollowed by a Notice of Availability published by the EPA in the FederalRegister on July 24, 1998, requesting comment on three of the proposedchanges. After public comment, on December 31, 2002, the EPA issued anNSR final rule to improve the NSR program and a proposed rule to providea regulatory definition of routine maintenance, repair, and replacement. Insummary, the final rule that became effective March 3, 2003:
• Reforms the emissions accounting system for determining when achange is triggered (now the trigger is based on actual emissions);
• Allows already-controlled “clean units” to make changes withouttriggering an NSR;
• Broadens the exclusion from an NSR for projects intended forpollution control;
• Sets new rules for establishing plant-wide applicability limits ofspecific pollutants under the program.
The EPA took action to improve the NSR program after performing acomprehensive review of the program and, in June 2002, issued a Reportto the President on NSR [26]. The report concluded that the program, asadministered and as it related to the energy sector, impeded or resulted inthe cancellation of projects that would maintain or improve the reliability,efficiency, or safety of existing power plants. The EPA issued the final ruleimprovements after the culmination of a 10-year process that included pilotstudies and the engagement of state and local governments, environmentalgroups, private sector representatives, academia, and concerned citizens inan open and far-reaching public rulemaking process. In addition, the nation’sgovernors and environmental commissioners, on a bipartisan basis, called forNSR reform.
The final rule implements the following major improvements to theNSR program [28]:
• Plantwide applicability limits (PALs)—To provide facilities withgreater flexibility to modernize their operations without increasingair pollution, facilities that agree to operate within strict site-wideemission caps referred to as PALs will be given the flexibility tomodify their operations without undergoing an NSR, as long asthe modifications do not cause emissions to violate their plant-wide cap;

154 Coal Energy Systems
• Pollution control and prevention projects—To maximize invest-ments in pollution prevention, companies that undertake certainspecified environmentally beneficial activities will be free to do soupon submission to their permitting authority of a notice, ratherthan having to wait for adjudication of a permit application. TheEPA is also creating a simplified process for approving other envi-ronmentally beneficial projects;
• Clean unit provision—To encourage the installation of state-of-the-art air pollution controls, the EPA will give plants that attain cleanunit status flexibility in the future if they continue to operate withinpermitted limits. This flexibility is an incentive for plants to volun-tarily install the best available pollution controls. Clean units musthave an NSR permit or other regulatory limit that requires the useof the best air pollution technologies;
• Emissions calculation test methodology—To provide facilities witha more accurate procedure for evaluating the effect of a projecton future emissions, the final regulations improve how a facilitycalculates whether a particular change will result in a significantemissions increase and thereby trigger NSR permitting require-ments.
The EPA’s proposed rule would make improvements to the routinemaintenance, repair, and replacement exclusion currently contained in theEPA regulations. These proposed improvements will be subject to a full andopen public rulemaking process. Since 1980, EPA regulations have excludedfrom NSR review all repairs and maintenance activities that are routine,but a complex analysis must be made to determine what activities meet thestandard. This has deterred companies from conducting repairs and replace-ments that are necessary for the safe, efficient, and reliable operation offacilities.
After the new NSR final and proposed rules were issued, certain envi-ronmental groups and state and local governments petitioned the EPA toreconsider specific aspects of the final NSR reform rule. The EPA announcedon July 25, 2003, that it would reconsider parts of the NSR final rule [29]. TheEPA’s notice was a response in part to the petitions and requests commenton six limited areas. The EPA will take action on the remaining issues raisedby the petitioners at a later date. The EPA has not yet acted on the remainingissues but plans to make a decision within the time period it takes to recon-sider the six items EPA has agreed to address. The EPA solicited commentson the following six areas [29]:
• The EPA report titled Supplemental Analysis of the EnvironmentalImpact of the 2002 Final NSR Improvement Rules, which con-cluded that the NSR improvement rule will likely result in greaterenvironmental benefits than the prior program;
Coal-Fired Emissions and Legislative Action in the United States 155
• The decision to allow certain sources of air emissions to maintainClean Unit status after an area is redesignated from attainment tononattainment for one of the six criteria air pollutants;
• The EPA’s inclusion of the reasonable possibility standard as itpertains to the need to maintain records and file certain reportswhich project actual emissions following a physical or operationalchange;
• The method for assessing air emissions from process units built afterthe 24-month baseline period used to establish PAL limits;
• The decision to allow a PAL to supersede existing emission lim-its established for NSR applicability purposes. Compliance with thePAL is then used to determine if NSR requirements apply in thefuture;
• The method of measuring emission increases when existing emis-sion units are replaced.
On October 27, 2003, the EPA published its final NSR EquipmentReplacement Rule [30]. This final version of the rule applies only to equip-ment replacement. It became effective December 26, 2003, and states willhave up to 3 years to revise their state implementation plans to reflectthese requirements. The regulation specifies that replacement componentsmust be functionally equivalent to existing components in that there are nochanges in the basic unit design or to pollutant emitting capacity. It alsosets a 20% limit on replacement cost for equipment. If these restrictions areexceeded, the replacement work is subject to the NSR process.
Impending Legislation and Pollutants underConsideration for RegulationDeveloping new or modifying current regulations of air pollutant emis-sions from coal-fired boilers is a continual process. This section summarizesimpending legislation and pollutants under consideration for regulationand complements the previous discussion of possible NSR revisions. Thefollowing are discussed in this section: impending legislation for fine par-ticulate matter and mercury emissions, the Clear Skies Act of 2002 andmulti-pollutant legislation under consideration, and global climate changesissues.
Fine Particulate MatterEpidemiological research over the past 10 years has revealed a consistent sta-tistical correlation between levels of airborne fine particulate matter (PM2.5)and adverse respiratory and cardiopulmonary effects in humans [31]. Thishas resulted in the EPA’s promulgation of NAAQSs that limit the allowablemass concentrations of PM2.5 (see earlier discussion of current NAAQSs).
156 Coal Energy Systems
Attainment of the PM2.5 NAAQSs requires an annual average mass concen-tration of less than 15 mg/m3 and a daily maximum concentration of lessthan 65 mg/m3. The EPA and the states are now in the process of identi-fying attainment and nonattainment areas of the PM2.5 NAAQSs. AmbientPM2.5 has also been found to contribute significantly to the impairment oflong-range visibility (regional haze) in many areas of the United States [32].The EPA issued a Regional Haze Rule in 1999 that established goals forreducing regional haze in areas of the United States where long-range visi-bility has been determined to have exceptional value (Class I areas) and hasoutlined methods for achieving these goals [32].
It is generally recognized that coal-fired power plants can be importantcontributors to ambient PM2.5 mass concentrations and regional haze; there-fore, it is very likely that the EPA and/or state and local air pollution controlagencies will require additional restrictions of coal power plant emissionsfrom 2005 to 2008 as they develop SIPs for achieving and/or maintainingcompliance with the PM2.5 NAAQSs and the Regional Haze Rule [33]. How-ever, specific requirements as to the types of pollutants to be reduced, andthe timing, magnitude, and locations of these emissions restrictions haveyet to be determined, although the process is underway to do this. The EPAprovided guidance to state and local air pollution control agencies and tribesfor designating areas for the purpose of implementing the PM2.5 NAAQSsand plans to issue the final designations on December 15, 2004 [34,35]. TheEPA’s timeline for their PM2.5 NAAQS implementation program is:
• September 2003—EPA issues proposed PM2.5 implementation rule;• February 15, 2004—State and tribal recommendations are due for
PM2.5 designations (recommendations can be based on 2002–2005data);
• July 2004—The EPA notifies states and tribes concerning any modi-fications to their recommendations;
• September 2004—The EPA issues final PM2.5 implementation rule;• December 15, 2004—The EPA issues final PM2.5 designations;• December 2007—State implementation plans are due for PM2.5
nonattainment areas (3 years after designation date);• December 2009–2014—PM2.5 standards must be attained by this date
(5 years after designation date; an extension of up to 5 years is possiblewith an adequate demonstration).
MercuryThe EPA prepared a Mercury Study Report, dated December 1997, whichthey submitted to Congress on February 24, 1998, as a requirement ofSection 112(n)(1)(B) of the 1990 CAAAs [36]. The report provided an assess-ment of the magnitude of U.S. mercury emissions by source, the healthand environmental implications of those emissions, and the availability and

Coal-Fired Emissions and Legislative Action in the United States 157
cost of control technologies. The report identified electric utilities as thelargest remaining source of mercury emissions in the air, as the EPA hasregulated mercury emissions from municipal waste combustors, medicalwaste incinerators, and hazardous waste combustion.
The EPA also submitted the Utility Hazardous Air Pollutant Report toCongress on February 24, 1998, in which the EPA examined 67 air toxicsemitted from 52 fossil fuel-fired power plants and concluded that mer-cury is the air toxic of greatest concern [37]. Although not conclusive, thereport finds evidence suggesting a link between utility emissions and themethylmercury found in soil, water, air, and fish from contaminated waters.The report identified the need for additional information on the amount ofmercury in U.S. coals and mercury emissions from coal-fired power plants.Specifically, such data identified by the EPA included additional data onthe quantity of mercury emitted from various types of generating units;the amount of mercury that is divalent versus elemental; and the effect ofpollution control devices, fuel type, and plant configuration on emissionsand speciation. To obtain these data, the EPA issued a three-part Informa-tion Collection Request (ICR) for calendar year 1999 [38]. Part I collectedinformation on the size and configuration of all coal-fired utility boilersgreater than 25 MW and their pollution control devices. Part II obtaineddata quarterly on the origin, quantity, and analysis of coal shipments deliv-ered to the generating units (which totaled more than 1100), including aminimum of three analyses per month for mercury and chlorine contents,together with any other available analyses such as ash and sulfur contentsand heating value. Part III required emission tests on 84 generating unitsselected at random from 36 categories representing different plant configu-rations and coal rank to measure total and speciated mercury concentrationsin the flue gas before and after the final air pollution control device upstreamof the stack.
On December 14, 2000, the EPA announced it would regulate mer-cury emissions from power plants [39]. On December 15, 2003, the EPAproposed a rule to permanently cap and reduce mercury emissions frompower plants [6]. The schedule requires a final rule by December 2004 andimplementation of controls by the end of 2007. The EPA is proposing twoalternatives for controlling emissions of mercury and will take commenton the alternatives before taking final action. The first alternative requiresutilities to install controls known as maximum achievable control technolo-gies (MACTs) under Section 112 of the Clean Air Act. If implemented, thisproposal will reduce nationwide emissions of mercury by 14 tons (29% reduc-tion of current levels) by the end of 2007. The second alternative establishesstandards of performance limiting mercury emissions from new and existingunits. This proposal, under Section 111 of the Clean Air Act, would createa market-based cap-and-trade program that, if implemented, would reducenationwide utility emissions in two phases. In the first phase, extending to2010, emissions would be reduced by taking advantage of co-benefit controls
158 Coal Energy Systems
(e.g., mercury reductions achieved by reducing SO2 and NOx emissions).When fully implemented in 2018, mercury emissions will be reduced by 33tons (69% reduction from current levels).
Multi-Pollutant LegislationFor the last 5 years, Congress has discussed and started proposing legislationfor more stringent control of power plant emissions, including SO2, NOx ,mercury, and CO2. Recent proposals include the Clear Skies Initiative, CleanPower Act, and Clean Air Planning Act. The Clear Skies Initiative was thefirst of several multi-pollutant bills proposed and would create a mandatoryprogram to reduce power plant emissions of SO2, NOx , and mercury by set-ting a national cap on each pollutant. Clear Skies was proposed in response toa growing need for an emission reduction plan that will protect human healthand the environment while providing regulatory certainty to the industry.The program was submitted as proposed legislation in July 2002. The pro-gram was reintroduced in the U.S. House of Representatives (H.R. 999) andthe U.S. Senate (S. 485) on February 27, 2003 [40].
The emission reductions from Clear Skies would help to alleviateair pollution-related health and environmental problems, including fineparticles, ozone, mercury, acid rain, nitrogen deposition, and visibilityimpairment [41]. Specifically, Clear Skies would: (1) reduce SO2 emissions by73%, from year 2000 emissions of 11 million short tons to a cap of 4.5 millionshort tons in 2010 and to a cap of 3 million short tons in 2018; (2) reduceNOx emissions by 67%, from year 2000 emissions of 5 million short tonsto a cap of 2.1 million short tons in 2008 and to a cap of 1.7 million shorttons in 2018; and (3) reduce mercury emissions, through a first-ever nationalcap on mercury emissions, by 69%, from 1999 emissions of 48 short tonsto a cap of 26 short tons in 2010 and to a cap of 15 short tons in 2018. Thereduction in emissions is illustrated in Figure 4-2.
Clear Skies, which is modeled on the cap-and-trade provisions of theAcid Rain Program of the 1990 CAAAs, would use an emission caps systemthat is predicted to [41]:
• Protect against diseases by reducing smog and fine particles, whichcontribute to respiratory and cardiovascular problems;
• Protect our wildlife, habitats, and ecosystem health by reducing acidrain, nitrogen, and mercury deposition;
• Deliver a rapid reduction in emissions with certain improvementsin air quality;
• Enable power generators to continue to provide affordable electric-ity while quickly and cost-effectively improving air quality and theenvironment;
• Encourage the use of new and cleaner pollution control technologiesthat would further reduce compliance costs.
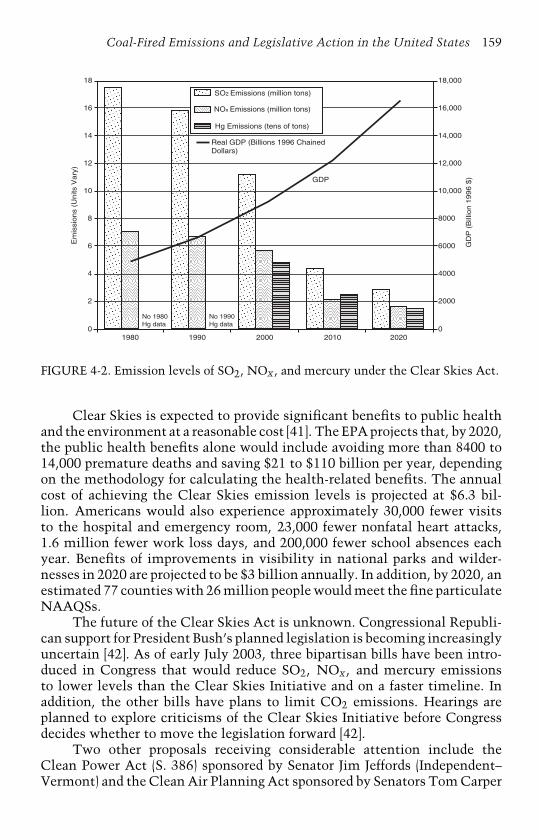
Coal-Fired Emissions and Legislative Action in the United States 159
Em
issi
on
s (U
nits
Va
ry)
GD
P (
Bill
ion
19
96
$)
Real GDP (Billions 1996 Chained Dollars)
18
16
14
12
10
8
6
4
2
0
18,000
16,000
14,000
12,000
10,000
8000
6000
4000
2000
01980 1990 2000 2010 2020
No 1980 Hg data
No 1990 Hg data
SO2 Emissions (million tons)
NOx Emissions (million tons)
Hg Emissions (tens of tons)
GDP
FIGURE 4-2. Emission levels of SO2, NOx , and mercury under the Clear Skies Act.
Clear Skies is expected to provide significant benefits to public healthand the environment at a reasonable cost [41]. The EPA projects that, by 2020,the public health benefits alone would include avoiding more than 8400 to14,000 premature deaths and saving $21 to $110 billion per year, dependingon the methodology for calculating the health-related benefits. The annualcost of achieving the Clear Skies emission levels is projected at $6.3 bil-lion. Americans would also experience approximately 30,000 fewer visitsto the hospital and emergency room, 23,000 fewer nonfatal heart attacks,1.6 million fewer work loss days, and 200,000 fewer school absences eachyear. Benefits of improvements in visibility in national parks and wilder-nesses in 2020 are projected to be $3 billion annually. In addition, by 2020, anestimated 77 counties with 26 million people would meet the fine particulateNAAQSs.
The future of the Clear Skies Act is unknown. Congressional Republi-can support for President Bush’s planned legislation is becoming increasinglyuncertain [42]. As of early July 2003, three bipartisan bills have been intro-duced in Congress that would reduce SO2, NOx , and mercury emissionsto lower levels than the Clear Skies Initiative and on a faster timeline. Inaddition, the other bills have plans to limit CO2 emissions. Hearings areplanned to explore criticisms of the Clear Skies Initiative before Congressdecides whether to move the legislation forward [42].
Two other proposals receiving considerable attention include theClean Power Act (S. 386) sponsored by Senator Jim Jeffords (Independent–Vermont) and the Clean Air Planning Act sponsored by Senators Tom Carper
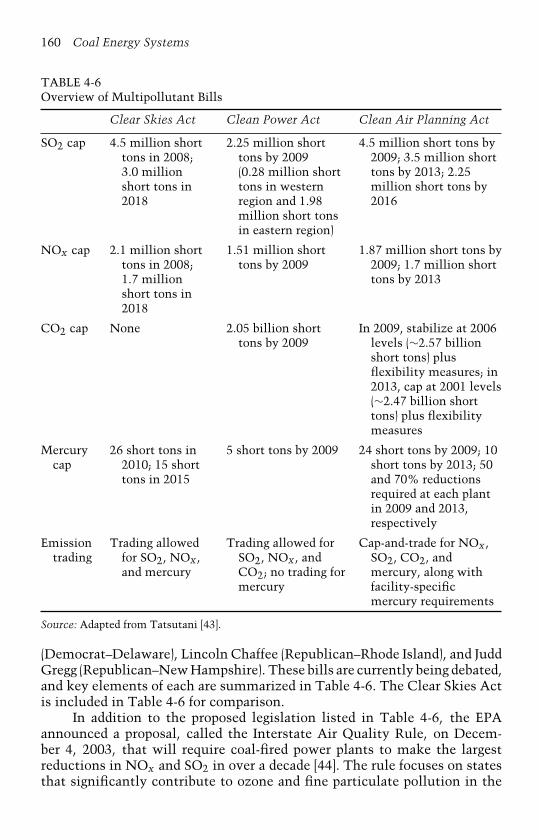
160 Coal Energy Systems
TABLE 4-6Overview of Multipollutant Bills
Clear Skies Act Clean Power Act Clean Air Planning Act
SO2 cap 4.5 million shorttons in 2008;3.0 millionshort tons in2018
2.25 million shorttons by 2009(0.28 million shorttons in westernregion and 1.98million short tonsin eastern region)
4.5 million short tons by2009; 3.5 million shorttons by 2013; 2.25million short tons by2016
NOx cap 2.1 million shorttons in 2008;1.7 millionshort tons in2018
1.51 million shorttons by 2009
1.87 million short tons by2009; 1.7 million shorttons by 2013
CO2 cap None 2.05 billion shorttons by 2009
In 2009, stabilize at 2006levels (∼2.57 billionshort tons) plusflexibility measures; in2013, cap at 2001 levels(∼2.47 billion shorttons) plus flexibilitymeasures
Mercurycap
26 short tons in2010; 15 shorttons in 2015
5 short tons by 2009 24 short tons by 2009; 10short tons by 2013; 50and 70% reductionsrequired at each plantin 2009 and 2013,respectively
Emissiontrading
Trading allowedfor SO2, NOx ,and mercury
Trading allowed forSO2, NOx , andCO2; no trading formercury
Cap-and-trade for NOx ,SO2, CO2, andmercury, along withfacility-specificmercury requirements
Source: Adapted from Tatsutani [43].
(Democrat–Delaware), Lincoln Chaffee (Republican–Rhode Island), and JuddGregg (Republican–New Hampshire). These bills are currently being debated,and key elements of each are summarized in Table 4-6. The Clear Skies Actis included in Table 4-6 for comparison.
In addition to the proposed legislation listed in Table 4-6, the EPAannounced a proposal, called the Interstate Air Quality Rule, on Decem-ber 4, 2003, that will require coal-fired power plants to make the largestreductions in NOx and SO2 in over a decade [44]. The rule focuses on statesthat significantly contribute to ozone and fine particulate pollution in the
Coal-Fired Emissions and Legislative Action in the United States 161
eastern United States. This rule will reduce power plant emissions in twophases. Sulfur dioxide emissions will drop by 3.7 million short tons by 2010(a reduction of ∼40% from current levels) and by another 2.3 million shorttons when the rules are fully implemented after 2015, resulting in a totalreduction of ∼70% from current levels. Nitrogen oxide emissions will becut by 1.4 million short tons by 2010 and by a total of 1.7 million short tonsby 2015, a reduction of ∼50% from current levels in the 30 states coveredunder the rule. In addition, emissions will be permanently capped and can-not increase. The EPA is taking public comment on the rule, and a final ruleis planned for 2005.
The future of these bills (Table 4-6) and the EPA’s recent proposals(mercury and interstate air quality rules) is uncertain; however, industryis expecting and readying itself for some form of multi-pollutant legisla-tion. Industry, the U.S. Department of Energy (DOE), and the Electric PowerResearch Institute are developing and commercializing a number of multi-pollutant control technologies to optimize removal efficiencies of variouspower plant emissions. These control technologies are discussed in Chapter 6(Emissions Control Strategies for Power Plants).
Global Climate ChangeSimilar to the multi-pollutant proposals discussed previously, global climatechange is on the agenda of the 108th Congress and the Bush Admin-istration [45–48]. Congress is considering several legislative initiatives,with key issues being considered that include better coordination of gov-ernment research, setting caps on greenhouse gas (GHG) emissions, andwhether reporting systems should be voluntary or mandatory. Climatechange debates are expected to occur in connection with stand-alone cli-mate change legislation, as well as during discussions of energy policy andthe Clear Skies Initiative [45]. Several proposed bills address climate changeresearch and data management, managing risks of climate change, reportingof GHG emissions, and stabilization of and caps on GHG emissions. Thisis a hotly debated topic, and industry expects some form of legislation to bepassed; however, it is not clear what the final form of legislation will con-tain or if it will be stand-alone legislation or combined with other legislationsuch as a modified Clear Skies Initiative.
The Bush Administration is also taking steps in addressing GHG emis-sions. On June 25, 2003, DOE Secretary Spencer Abraham and energyministers from around the world signed the first international frameworkfor research and development on the capture and storage of CO2 emissions.This initiative is called the Carbon Sequestration Leadership Forum andincludes the following participants: Australia, Brazil, Canada, China,Colombia, India, Italy, Japan, Mexico, Norway, Russian Federation, UnitedKingdom, United States, and the European Commission [46]. It was soon fol-lowed with the announcement on July 23, 2003, of the Bush Administration’s
162 Coal Energy Systems
unveiling of a long-term strategic plan to study global change [47,48].Presented by Commerce Secretary Don Evans and DOE Secretary SpencerAbraham, the 10-year plan sets five goals, including:
• Identify the natural variability in the Earth’s climate;• Understand the forces that cause global warming;• Reduce the uncertainties in climate forecasting;• Improve the understanding of sensitivity and adaptability of ecosys-
tems to climate change;• Develop more exact methods for calculating the risks of global
warming.
The Bush Administration also plans to spend $103 million performinga 2-year, high-priority research study to collect data relating to carbonpollution, aerosols, and the oceans.
Emissions Legislation in other Countries
A brief discussion of regulatory requirements for sulfur dioxide, nitrogenoxides, particulate matter, trace elements (specifically, mercury), and car-bon dioxide for many countries is presented in this section. The emissionsstandards of other countries are compared to those from the United States.
Sulfur DioxideThe United Nations Economic Commission for Europe’s (UNECE) Con-vention on Long-Range Transboundary Air Pollution (LRTAP) was the firstlegally binding instrument to address air pollution on a broad regional con-text [49]. The Convention was adopted in 1979, came into force in 1983, andnow has been ratified by 48 countries, as listed in Table 4-7 [49,50]. Under theconvention, the countries recognize the transboundary problems of air pol-lution and accept general responsibility to move toward a solution to theseproblems. Following the LRTAP Protocol, the SO2 Helsinki Protocol (the“30% Club”) was signed in 1985 and came into force in 1987 (see Table 4-7).Under this protocol, the signatories agreed to reduce their SO2 emissions by30% (based on 1980 values) by 1993 [49]. The Second Sulfur Protocol, theProtocol on Further Reductions of Sulfur Emissions, was signed in June 1994by 27 European countries, the European Community (EC), and Canada. Theprotocol came into force in August 1998. All signatories, which are listed inTable 4-7, were allocated targets for 2000, while some countries agreed toadditional targets for 2005 and 2010.
The UNECE Gothenburg Protocol to abate acidification, eutrophica-tion, and ground-level ozone was signed by 27 countries in December 1999.As of June 15, 2003, it had 31 signatures and 4 ratifications [50]. The protocol

Coal-Fired Emissions and Legislative Action in the United States 163
TABLE 4-7Signatories to the UNECE LRTAP and Subsequent SO2 Protocols
1979 LRTAP Convention 1985 First Sulfur Protocol 1994 Second Sulfur Protocol
Armenia (+)a — —Austria (+) Austria (+) Austria (+)Belarus (+) Belarus (+) —Belgium (+) Belgium (+) Belgium (+)Bosnia and
Herzegovina (Sc)b— —
Bulgaria (+) Bulgaria (+) BulgariaCanada (+) Canada (+) Canada (+)Croatia (Sc) — Croatia (+)Cyprus (Sc) — —Czech Republic (Sc) Czech Republic (Sc) Czech Republic (+)Denmark (+) Denmark (+) Denmark (+)Estonia (+) — —European Community (+) — European Community (+)Finland (+) Finland (+) Finland (+)France (+) France (+) France (+)Georgia (+) — —Germany (+) Germany (+) Germany (+)Greece (+) — Greece (+)Holy See — —Hungary (+) Hungary (+) HungaryIceland (+) — —Ireland (+) — Ireland (+)Italy (+) Italy (+) Italy (+)Kazakhstan (+) — —Kyrgyzstan (+) — —Latvia (+) — —Liechtenstein (+) Liechtenstein (+) Liechtenstein (+)Lithuania (+) — —Luxembourg (+) Luxembourg (+) Luxembourg (+)Malta (+) — —Monaco (+) — —Netherlands (+) Netherlands (+) Netherlands (+)Norway (+) Norway (+) Norway (+)Poland (+) — PolandPortugal (+) — —Republic of Moldova (+) — —Romania (+) — —Russian Federation (+) Russian Federation (+) Russian FederationSan Marino — —Slovakia (Sc) Slovakia (Sc) Slovakia (+)Slovenia (Sc) — Slovenia (+)Spain (+) — Spain (+)
(continued)
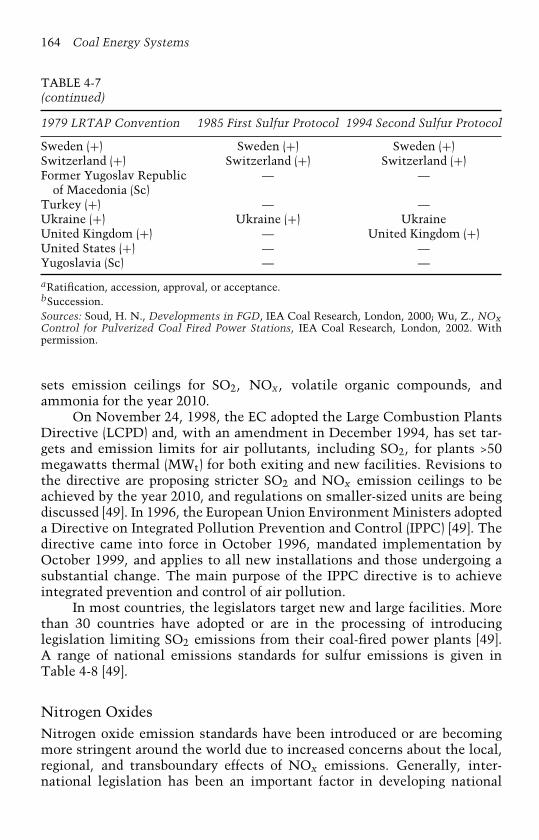
164 Coal Energy Systems
TABLE 4-7(continued)
1979 LRTAP Convention 1985 First Sulfur Protocol 1994 Second Sulfur Protocol
Sweden (+) Sweden (+) Sweden (+)Switzerland (+) Switzerland (+) Switzerland (+)Former Yugoslav Republic
of Macedonia (Sc)— —
Turkey (+) — —Ukraine (+) Ukraine (+) UkraineUnited Kingdom (+) — United Kingdom (+)United States (+) — —Yugoslavia (Sc) — —
aRatification, accession, approval, or acceptance.bSuccession.Sources: Soud, H. N., Developments in FGD, IEA Coal Research, London, 2000; Wu, Z., NOxControl for Pulverized Coal Fired Power Stations, IEA Coal Research, London, 2002. Withpermission.
sets emission ceilings for SO2, NOx , volatile organic compounds, andammonia for the year 2010.
On November 24, 1998, the EC adopted the Large Combustion PlantsDirective (LCPD) and, with an amendment in December 1994, has set tar-gets and emission limits for air pollutants, including SO2, for plants >50megawatts thermal (MWt) for both exiting and new facilities. Revisions tothe directive are proposing stricter SO2 and NOx emission ceilings to beachieved by the year 2010, and regulations on smaller-sized units are beingdiscussed [49]. In 1996, the European Union Environment Ministers adopteda Directive on Integrated Pollution Prevention and Control (IPPC) [49]. Thedirective came into force in October 1996, mandated implementation byOctober 1999, and applies to all new installations and those undergoing asubstantial change. The main purpose of the IPPC directive is to achieveintegrated prevention and control of air pollution.
In most countries, the legislators target new and large facilities. Morethan 30 countries have adopted or are in the processing of introducinglegislation limiting SO2 emissions from their coal-fired power plants [49].A range of national emissions standards for sulfur emissions is given inTable 4-8 [49].
Nitrogen OxidesNitrogen oxide emission standards have been introduced or are becomingmore stringent around the world due to increased concerns about the local,regional, and transboundary effects of NOx emissions. Generally, inter-national legislation has been an important factor in developing national

Coal-Fired Emissions and Legislative Action in the United States 165
regulations in many parts of the world. Recognition of the transboundaryeffect of air pollution has led to a number of international agreements [50].Those that pertain to NOx emissions include the UNECE LRTAP (discussedin the previous section), EC directives, and World Bank environmentalguidelines. In addition to the SO2 emissions discussed earlier, the UNECE
TABLE 4-8Range of National Emission Standards for Sulfur Emissions (mg SO2/m3)a
Country New Plants Existing Coal Sulfur Applicable PlantPlants Limit (%) Size for Coal
Sulfur Limit
Austriab 200–550 200–2000 ≤1 (Brown coal) Plants <10 MWtBelgiumb 250–2000 1700 ≤1 All plantsBulgaria 610–3335 1875–3500 — —Canadac 740 — — —China — — — —Hong Kong ∼200 — ≤1 >550 MWtMainland 1200–2000 Plant specific — —Croatia 400–2000d 2000d < 0. 7 g/MJ <50 MWtCzech Republic 500–2500 500–2500 — —Denmarkb 400–2000 —e 0.9 Industrial plantsEuropean Union 400–2000f —g — —Finlandb 380–620 620 ≤390 g/GJ Plants without FGDh
Franceb 400–2000 400–2000 — —Germanyb 400–2000 400–2000 <1 Plants <1 MWtGreeceb 400–2000 — — —Hungary 400–2000 — — —Indonesia 820 1635i — —Irelandb 400–2000 — — —Italyb 400–2000 — 1 All plantsJapan —j —j — —Korea, South 345 430-770 — —Luxembourgb 400–2000 — — —Netherlandsb 200–700 400 1.2 (industrial) Plants without FGDPhilippines 175–765 — <1 All existing plantsPoland 540–1755 675–2890 — —Portugalb 100–2000 — — —Romania 400–2000 — — —Slovakia 400–2000 500–2500 — —Slovenia 400–2000 2000 — —Spainb 400–2000 2400–9000 — —Swedenb 160–270 270–540 — —
(continued)
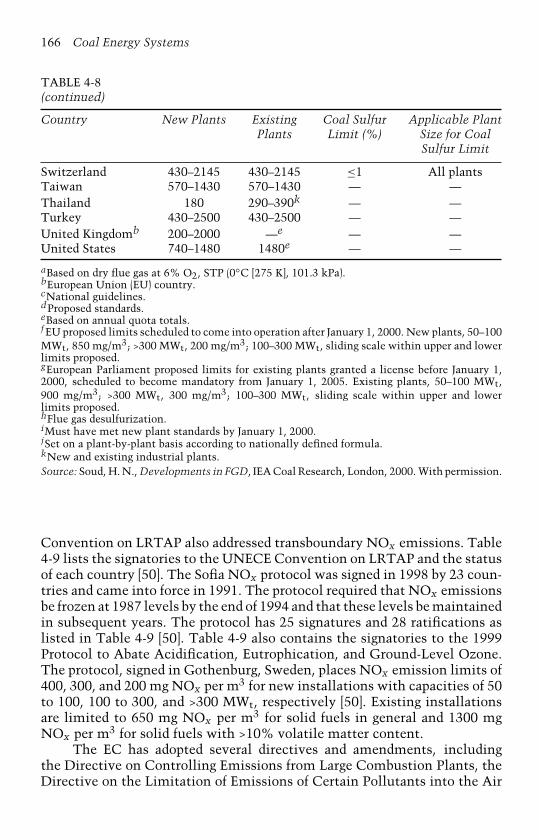
166 Coal Energy Systems
TABLE 4-8(continued)
Country New Plants Existing Coal Sulfur Applicable PlantPlants Limit (%) Size for Coal
Sulfur Limit
Switzerland 430–2145 430–2145 ≤1 All plantsTaiwan 570–1430 570–1430 — —Thailand 180 290–390k — —Turkey 430–2500 430–2500 — —United Kingdomb 200–2000 —e — —United States 740–1480 1480e — —
aBased on dry flue gas at 6% O2, STP (0◦C [275 K], 101.3 kPa).bEuropean Union (EU) country.cNational guidelines.dProposed standards.eBased on annual quota totals.f EU proposed limits scheduled to come into operation after January 1, 2000. New plants, 50–100MWt, 850 mg/m3; >300 MWt, 200 mg/m3; 100–300 MWt, sliding scale within upper and lowerlimits proposed.gEuropean Parliament proposed limits for existing plants granted a license before January 1,2000, scheduled to become mandatory from January 1, 2005. Existing plants, 50–100 MWt,900 mg/m3; >300 MWt, 300 mg/m3; 100–300 MWt, sliding scale within upper and lowerlimits proposed.hFlue gas desulfurization.iMust have met new plant standards by January 1, 2000.jSet on a plant-by-plant basis according to nationally defined formula.kNew and existing industrial plants.Source: Soud, H. N., Developments in FGD, IEA Coal Research, London, 2000. With permission.
Convention on LRTAP also addressed transboundary NOx emissions. Table4-9 lists the signatories to the UNECE Convention on LRTAP and the statusof each country [50]. The Sofia NOx protocol was signed in 1998 by 23 coun-tries and came into force in 1991. The protocol required that NOx emissionsbe frozen at 1987 levels by the end of 1994 and that these levels be maintainedin subsequent years. The protocol has 25 signatures and 28 ratifications aslisted in Table 4-9 [50]. Table 4-9 also contains the signatories to the 1999Protocol to Abate Acidification, Eutrophication, and Ground-Level Ozone.The protocol, signed in Gothenburg, Sweden, places NOx emission limits of400, 300, and 200 mg NOx per m3 for new installations with capacities of 50to 100, 100 to 300, and >300 MWt, respectively [50]. Existing installationsare limited to 650 mg NOx per m3 for solid fuels in general and 1300 mgNOx per m3 for solid fuels with >10% volatile matter content.
The EC has adopted several directives and amendments, includingthe Directive on Controlling Emissions from Large Combustion Plants, theDirective on the Limitation of Emissions of Certain Pollutants into the Air

Coal-Fired Emissions and Legislative Action in the United States 167
TABLE 4-9Signatories to the UNECE Convention on LRTAP and Subsequent NOx Protocols asof June 15, 2002
1979 LRTAP Convention 1988 Sofia Protocol 1999 Gothenburg Protocol
Armenia (Ac) Armenia —Austria (R) Austria (R) AustriaBelarus (R) Belarus (At) —Belgium (R) Belgium (R)* BelgiumBosnia and
Herzegovina (Sc)— —
Bulgaria (R) Bulgaria (R) BulgariaCanada (R) Canada (R) CanadaCroatia (Sc) Croatia —Cyprus (Ac) — —Czech Republic (Sc) Czech Republic (Sc) Czech RepublicDenmark (R) Denmark (At)* Denmark (Ap)Estonia (Ac) Estonia (At) —European Community (Ap) European Community (Ac) —Finland (R) Finland (R)* FinlandFrance (Ap) France (Ap)* FranceGeorgia (Ac) — —Germany (R) Germany (R)* GermanyGreece (R) Greece (R) GreeceHoly See — —Hungary (R) Hungary (Ap) HungaryIceland (R) — —Ireland (R) Ireland (R) IrelandItaly (R) Italy (R)* ItalyKazakhstan (Ac) — —Kyrgyzstan (Ac) — —Latvia (Ac) Latvia —Liechtenstein (R) Liechtenstein (R)* LiechtensteinLithuania (Ac) — —Luxembourg (R) Luxembourg (R) Luxembourg (R)Malta (Ac) — —Monaco (At) — —Netherlands (At) Netherlands (At)* —Norway (R) Norway (R)* Norway (R)Poland (R) Poland PolandPortugal (R) Portugal —Republic of Moldova (Ac) Republic of Moldova —Romania (R) Romania —Russian Federation (R) Russian Federation (At) —San Marino — —Slovakia (Sc) Slovakia (Sc) SlovakiaSlovenia (Sc) Slovenia —
(continued)

168 Coal Energy Systems
TABLE 4-9(continued)
1979 LRTAP Convention 1988 Sofia Protocol 1999 Gothenburg Protocol
Spain (R) Spain (R) SpainSweden (R) Sweden (R)* Sweden (R)Switzerland (R) Switzerland (R)* SwitzerlandThe Former Yugoslav
Republic ofMacedonia (Sc)
— —
Turkey (R) — —Ukraine (R) Ukraine (At) —United Kingdom (R) United Kingdom (R) United KingdomUnited States (At) United States (At) United StatesYugoslavia (Sc) — —
Note: R, ratification; Ac, accession; Ap, approval; At, acceptance; Sc, succession; *, committingto 30% reduction.Source: Wu, Z., NOx Control for Pulverized Coal Fired Power Stations, IEA Coal Research,London, 2002. With permission.
from Large Combustion Plants, and the Directive on National Emission Ceil-ings for Certain Atmospheric Pollutants [50]. NOx emission limits for solidfuel-fired boilers in the new EC directives are 600 and 500 mg NOx per m3
for existing installations with capacities of 50 to 500 and >500 MWt, respec-tively. These limits become stricter beginning January 1, 2016, for largerunits, with the limit decreasing to 200 mg NOx per m3 for units >500 MWt.Emission limits for new installations with capacities of 50 to 100, 100 to 300,and >300 MWt are, respectively, 400, 200 (300 for biomass-fired units), and200 mg NOx per m3. National ceilings for NOx emissions for 2010, underthe EC directive, are shown in Table 4-10 [50].
The World Bank has also developed environmental guidelines that areto be followed in all the projects it funds, thereby covering a host of develop-ing countries. The World Bank has determined that environmental standardsof developed countries may not be appropriate for developing countries oreconomies in transition; therefore, their guidelines are flexible and try tomaintain and improve environmental quality on an ongoing basis [50]. TheWorld Bank’s NOx standards are 750 mg NOx per m3 for all coal-fired powerplants except for those firing coal with less than 10% volatile matter content,where the NOx emission limit is 1300 mg NOx per m3.
National standards for NOx emissions from coal-fired power plantshave been adopted or are being introduced in more than 30 countries [50].They vary widely between countries and are often determined by takinginto account the technology available, type of plant (new or existing), sizeof plant, and boiler configuration. A comparison of emission standards forvarious countries is provided in Table 4-11 [51].

Coal-Fired Emissions and Legislative Action in the United States 169
TABLE 4-10National NOx Emission Ceilings for 2010
Country NOx Emissions (metric kiloton)1990a 2010
Austria 193 103Belgium 339 176Denmark 272 127Finland 300 170France 1865 810Germany 2706 1051Greece 326 344Ireland 118 65Italy 1935 990Luxembourg 23 11Netherlands 580 260Portugal 317 250Spain 1156 847Sweden 338 148United Kingdom 2756 1167
Total 13, 227 6519
aThe latest reported by each country to the LRTAP Convention.Source: Wu, Z., NOx Control for Pulverized Coal Fired PowerStations, IEA Coal Research, London, 2002. With permission.
Particulate MatterStandards for the control of particulate emissions were first introduced inthe early 1900s in Japan, the United States, and Western Europe [52]. Overthe decades, they have become increasingly more stringent and widespread,with recent emphasis being placed on the control of fine particulate matter.Similar to those for NOx and SO2 emissions, international agreements havebeen signed to reduce particulate emissions from coal-fired power plants. TheEC set limits for particulate emissions from coal-fired power plants in theLCPD. These set particulate emissions limits of 100 and 50 mg/m3 for newplants with capacities of 50 to 500 and ≥500 MWt, respectively [52]. Evenstricter limits are under review to conserve the environment and humanhealth. Increasingly more stringent national emission standards have beenadopted in Japan, North America, and Western Europe. The growing impor-tance of using coal in an environmentally acceptable manner for powergeneration as well as in the industrial and residential sectors has led to theintroduction of particulate emission standards in other countries as well.Currently, 30 countries have emissions standards for particulate emissionsfrom coal-fired power plants [52]. Examples of particulate emissions stan-dards in some of these counties are provided in Table 4-12 [51].

170 Coal Energy Systems
TABLE 4-11NOx Emission Standards Applicable to New and Existing Coal-FiredPower Plants of Thermal Capacity >300 MWt
Country NOx Emissions (mg/m3)a
New Plant Existing Plant
Austria 200 200–300Canadab 490–740 —European Community 650–1300 —Denmark 200–650 —Germany 200 200Italy 200–650 200–650Japan 410–515 410–515Korea, South 720 720Netherlands 200–400 650–1100Poland 405–460 610–1335Spain 650–1300 —United Kingdom 650–1300 —United Statesb 615–740 555–615
aStandards are given in mg/m3 corrected to standard conditions (6% O2, standardtemperature and pressure—0◦C (273 K), 101.3 kPa—on dry flue gas); when convert-ing from lb/million Btu to mg/m3, dry flue gas volume is assumed to be 350 m3/GJ(based on gross heat value). Note that ranges exist because emission standards mayvary according to plant type, size, location, construction/commissioning date,boiler configuration, and type of coal used.bFederal standards only; state standards may be more stringent.Source: McConville, A., An Overview of Air Pollution Emission Standardsfor Coal-Fired Plants Worldwide, Coal and Slurry Technology Association,Washington, D.C., 1997), pp. 1–12.
Trace Elements/MercuryConcern over environmental effects of trace elements emissions, specifi-cally cadmium, chromium, copper, mercury, nickel, lead, selenium, andzinc, from human activities has led to the introduction of legislation onemissions in many countries; however, this legislation sets limits for med-ical waste incinerators, municipal solid waste combustors, and hazardouswaste incinerators [53]. Trace element emissions from coal combustion arenot currently regulated. An overview of mercury regulations in the EuropeanUnion, Japan, and the United States reveals a variety of different approaches[54]. The 1998 United Nations Protocol on Heavy Metals set emissions lim-its for hazardous and municipal waste incinerators and directed signatoriesto the protocol to set limits for medical waste incinerators. The EuropeanUnion has approved the protocol, and the United States has accepted but notratified it. Separate from the United Nations protocol, the European Coun-cil issued a directive in 1996 ordering limit values and alert thresholds fora variety of air pollutants including mercury [54]. The directive resembles
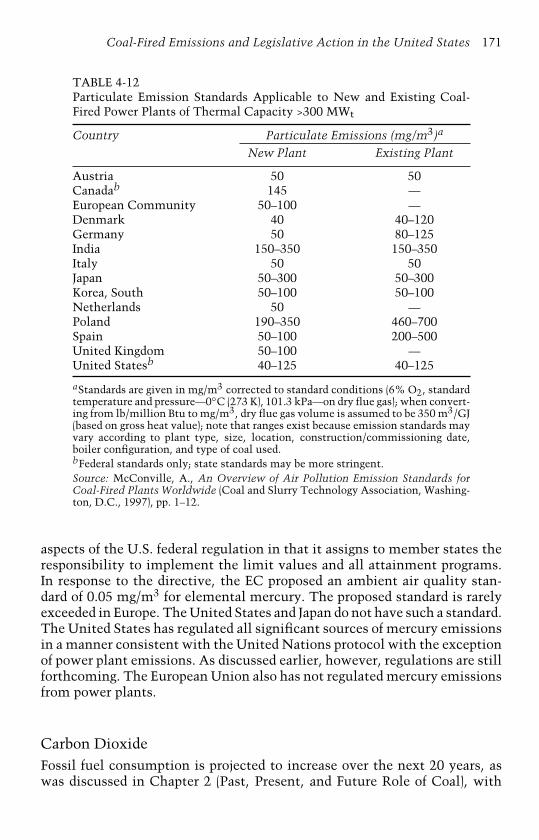
Coal-Fired Emissions and Legislative Action in the United States 171
TABLE 4-12Particulate Emission Standards Applicable to New and Existing Coal-Fired Power Plants of Thermal Capacity >300 MWt
Country Particulate Emissions (mg/m3)a
New Plant Existing Plant
Austria 50 50Canadab 145 —European Community 50–100 —Denmark 40 40–120Germany 50 80–125India 150–350 150–350Italy 50 50Japan 50–300 50–300Korea, South 50–100 50–100Netherlands 50 —Poland 190–350 460–700Spain 50–100 200–500United Kingdom 50–100 —United Statesb 40–125 40–125
aStandards are given in mg/m3 corrected to standard conditions (6% O2, standardtemperature and pressure—0◦C (273 K), 101.3 kPa—on dry flue gas); when convert-ing from lb/million Btu to mg/m3, dry flue gas volume is assumed to be 350 m3/GJ(based on gross heat value); note that ranges exist because emission standards mayvary according to plant type, size, location, construction/commissioning date,boiler configuration, and type of coal used.bFederal standards only; state standards may be more stringent.Source: McConville, A., An Overview of Air Pollution Emission Standards forCoal-Fired Plants Worldwide (Coal and Slurry Technology Association, Washing-ton, D.C., 1997), pp. 1–12.
aspects of the U.S. federal regulation in that it assigns to member states theresponsibility to implement the limit values and all attainment programs.In response to the directive, the EC proposed an ambient air quality stan-dard of 0.05 mg/m3 for elemental mercury. The proposed standard is rarelyexceeded in Europe. The United States and Japan do not have such a standard.The United States has regulated all significant sources of mercury emissionsin a manner consistent with the United Nations protocol with the exceptionof power plant emissions. As discussed earlier, however, regulations are stillforthcoming. The European Union also has not regulated mercury emissionsfrom power plants.
Carbon DioxideFossil fuel consumption is projected to increase over the next 20 years, aswas discussed in Chapter 2 (Past, Present, and Future Role of Coal), with
172 Coal Energy Systems
coal being the leading energy source in some countries, especially certaindeveloping countries; consequently, carbon dioxide (CO2) emissions areprojected to increase. The increase in CO2 emissions and concern aboutglobal warming have received international attention. The first major actionwas taken in New York on May 9, 1992, when the United Nations Frame-work Convention on Climate Change was adopted. The objective of theConvention is to achieve stabilization of greenhouse gas concentrations inthe atmosphere at a level that would prevent dangerous interference withthe climate system [55]. Stabilization must be achieved in such a time-frameas to ensure that food production is not threatened and to allow economicdevelopment to proceed in a sustainable manner. The Convention containsa legally binding framework that commits the world’s governments to vol-untary reductions of greenhouse gases or other actions such as enhancinggreenhouse gas sinks aimed at stabilizing atmospheric concentrations ofgreenhouse gases at 1990 levels by the year 2000 [56].
On June 12, 1992, at the Earth Summit in Rio de Janeiro, 154 nations,including the United States, signed the United Nations Framework Conven-tion on Climate Change. In October 1992, the United States became the firstindustrialized nation to ratify the treaty, which came into force on March21, 1994. The treaty was not legally binding and, because reducing emissionswould likely cause great economic damage, many nations were not expectedto meet the goal [57]. The Convention has become a cornerstone of globalclimate policy representing a compromise among a wide range of differentinterests among the member countries. The concept of a common goal butdifferent responsibilities provided for different roles for industrialized anddeveloping countries, notably in the obligations imposed on them in con-nection with climate protection policy [58]. This led to a grouping of themember states of the Convention into Annex I, Annex II, and non-Annex Icountries, the latter including developing countries with no commitmentsto reducing climate gases. Annex I countries agreed, among other issues,to adopt national policies and take corresponding measures on the mitiga-tion of climate change, periodically provide information on its policies andmeasures to mitigate climate change, and calculate emissions sources andremoval through sinks. The developed countries in Annex II agreed, alongwith additional provisions, to provide new and additional financial resourcesto meet the agreed full costs incurred by developing countries in complyingwith their obligations.
Representatives from around the world met again in December 1997 ata conference in Kyoto to sign a revised agreement. The Clinton Administra-tion negotiators agreed to legally binding, internationally enforceable limitson the emissions of greenhouse gases as a key tenet of the treaty. The pro-tocol called for a worldwide reduction of emissions of carbon-based gases byan average of 5.2% below 1990 levels by 2010. Different countries adopteddifferent targets. Those countries agreeing to reduce specified amounts ofclimate gases within a specified time period are listed as Annex B countries,
Coal-Fired Emissions and Legislative Action in the United States 173
which is a subcategory of the Annex I countries. For example, the EU com-mitted to a reduction of 8% in climate gases, the United States to 7%, andJapan to 6%, while Russia and the Ukraine agreed to stabilize at 1990 levels.Table 4-13 lists the Annex I, Annex II, and Annex B countries, along withthe specified amounts of climate gases agreed upon by the Annex B countries[58,59].
Conflicts with regard to the distribution of different obligations havebecome apparent since the Kyoto conference. In March 2001, the UnitedStates announced that it would not support the Kyoto Protocol [60]. TheUnited States insists that the rules pertaining to the Annex B countries(i.e., voluntary commitment to reducing climate gases) be extended to at leastthe major developing countries and made this a precondition to ratifying theKyoto Protocol.
In November 2001, the participating member countries of the UnitedNations Seventh Conference of Parties (COP-7) met in Marrakesh, Morocco,and reached final agreement for the procedures and institutions needed tomake the Kyoto Protocol fully operational [60]. On March 4, 2002, the EUvoted to ratify the protocol, committing its 15 member countries to reduc-tions in greenhouse gas emissions as specified in the accord. No agreementhas been reached among the EU member countries, however, with regardto the individual emission reductions that will be required. Some countriesfeel they have been given a disproportionate share of the EU’s total reduc-tion burden [60]. The Kyoto Protocol enters into force 90 days after it hasbeen ratified by at least 55 parties to the United Nations Framework Cli-mate Change Convention, including a representation of Annex I countriesaccounting for at least 55% of the total 1990 CO2 emissions from the AnnexI group. Although the United States had the largest share of Annex I emis-sions in 1990 at 35%, even without U.S. participation the Protocol couldenter into force for the other signatories [60].
Air Quality and Coal-Fired Emissions
The EPA evaluates the status and trends in the nation’s air quality on a yearlybasis and tracks air pollution by evaluating the air quality measured fromover 5200 ambient air monitors located at over 3000 sites across the nationthat are operated primarily by state, local, and tribal agencies [61]. In addi-tion, the EPA has tracked emissions from all sources for the last 30 years. Inthe most recent report (for the year 2002) on the latest findings on air qual-ity in the United States, the EPA stated that aggregate emissions of the sixprincipal (i.e., criteria) air pollutants tracked nationally have been reducedby 48% since 1970 [62]. During this same period, the U.S. gross domesticproduct increased 164%, energy consumption increased 42%, the populationincreased 38%, and vehicle miles traveled increased 155%. This reductionin emissions in criteria air pollutants between 1970 and 2002 is illustrated
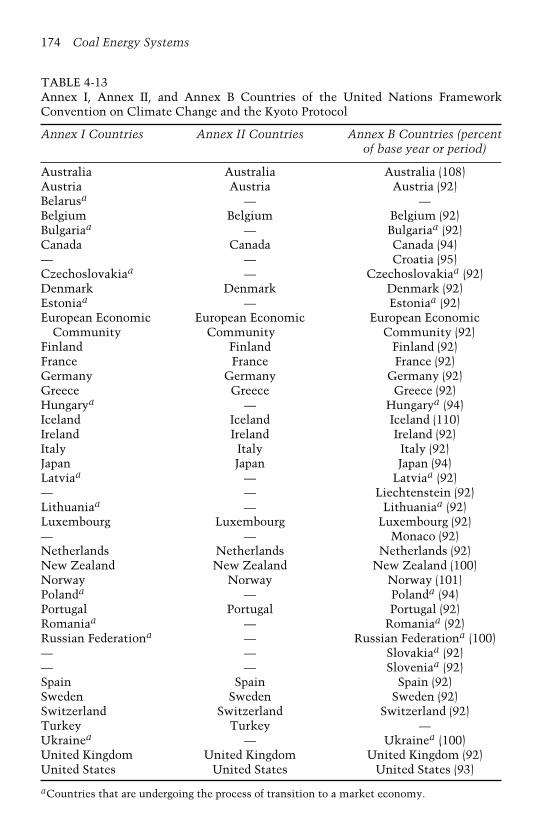
174 Coal Energy Systems
TABLE 4-13Annex I, Annex II, and Annex B Countries of the United Nations FrameworkConvention on Climate Change and the Kyoto Protocol
Annex I Countries Annex II Countries Annex B Countries (percentof base year or period)
Australia Australia Australia (108)Austria Austria Austria (92)Belarusa — —Belgium Belgium Belgium (92)Bulgariaa — Bulgariaa (92)Canada Canada Canada (94)— — Croatia (95)Czechoslovakiaa — Czechoslovakiaa (92)Denmark Denmark Denmark (92)Estoniaa — Estoniaa (92)European Economic European Economic European Economic
Community Community Community (92)Finland Finland Finland (92)France France France (92)Germany Germany Germany (92)Greece Greece Greece (92)Hungarya — Hungarya (94)Iceland Iceland Iceland (110)Ireland Ireland Ireland (92)Italy Italy Italy (92)Japan Japan Japan (94)Latviaa — Latviaa (92)— — Liechtenstein (92)Lithuaniaa — Lithuaniaa (92)Luxembourg Luxembourg Luxembourg (92)— — Monaco (92)Netherlands Netherlands Netherlands (92)New Zealand New Zealand New Zealand (100)Norway Norway Norway (101)Polanda — Polanda (94)Portugal Portugal Portugal (92)Romaniaa — Romaniaa (92)Russian Federationa — Russian Federationa (100)— — Slovakiaa (92)— — Sloveniaa (92)Spain Spain Spain (92)Sweden Sweden Sweden (92)Switzerland Switzerland Switzerland (92)Turkey Turkey —Ukrainea — Ukrainea (100)United Kingdom United Kingdom United Kingdom (92)United States United States United States (93)
aCountries that are undergoing the process of transition to a market economy.
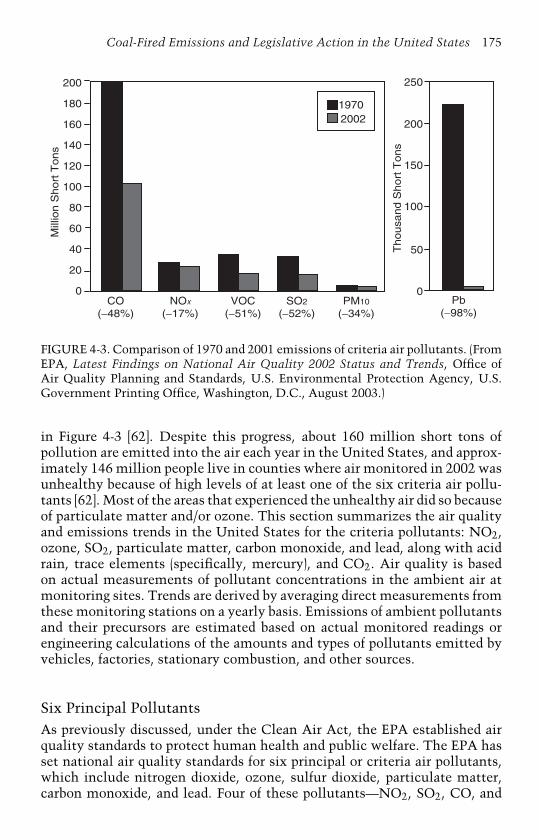
Coal-Fired Emissions and Legislative Action in the United States 175M
illio
n S
hort
Tons
Thousa
nd S
hort
Tons
2002
60
40
20
0 0
1970
200
180
160
140
120
100
80
CO (−48%)
NOx
(−17%)VOC
(−51%)SO2
(−52%)PM10
(−34%)Pb
(−98%)
50
100
150
200
250
FIGURE 4-3. Comparison of 1970 and 2001 emissions of criteria air pollutants. (FromEPA, Latest Findings on National Air Quality 2002 Status and Trends, Office ofAir Quality Planning and Standards, U.S. Environmental Protection Agency, U.S.Government Printing Office, Washington, D.C., August 2003.)
in Figure 4-3 [62]. Despite this progress, about 160 million short tons ofpollution are emitted into the air each year in the United States, and approx-imately 146 million people live in counties where air monitored in 2002 wasunhealthy because of high levels of at least one of the six criteria air pollu-tants [62]. Most of the areas that experienced the unhealthy air did so becauseof particulate matter and/or ozone. This section summarizes the air qualityand emissions trends in the United States for the criteria pollutants: NO2,ozone, SO2, particulate matter, carbon monoxide, and lead, along with acidrain, trace elements (specifically, mercury), and CO2. Air quality is basedon actual measurements of pollutant concentrations in the ambient air atmonitoring sites. Trends are derived by averaging direct measurements fromthese monitoring stations on a yearly basis. Emissions of ambient pollutantsand their precursors are estimated based on actual monitored readings orengineering calculations of the amounts and types of pollutants emitted byvehicles, factories, stationary combustion, and other sources.
Six Principal PollutantsAs previously discussed, under the Clean Air Act, the EPA established airquality standards to protect human health and public welfare. The EPA hasset national air quality standards for six principal or criteria air pollutants,which include nitrogen dioxide, ozone, sulfur dioxide, particulate matter,carbon monoxide, and lead. Four of these pollutants—NO2, SO2, CO, and

176 Coal Energy Systems
lead—result primarily from direct emissions from a variety of sources. Par-ticulate matter results from direct emissions but is also commonly formedwhen emissions of nitrogen oxides, sulfur oxides, ammonia, organic com-pounds, and other gases react in the atmosphere. Ozone is not directlyemitted but is formed when nitrogen oxides and volatile organic compoundsreact in the presence of sunlight.
Nitrogen Dioxide (NO2)Nitrogen oxides (NOx ), the term used to describe the sum of NO, NO2, andother oxides of nitrogen, contribute to the formation of ozone, particulatematter, haze, and acid rain. While the EPA traces national emissions ofNOx , the national monitoring network measures ambient concentrationsof NO2 for comparison to national air quality standards. The major sources ofanthropogenic NOx emissions are high-temperature combustion processes,such as those that occur in vehicles and power plants. Over the past 20 years,monitored levels of NO2 have decreased 21% [62]. All areas of the countrythat once violated the NAAQS for NO2 now meet the standard. Nationalemissions of NOx have declined by almost 15% over the past 20 years. Whileoverall NOx emissions are declining, emissions from some sources suchas nonroad engines have actually increased since 1983. Figures 4-4 and 4-5
0.06
0.05
0.04
0.03
0.02
0.01
0.00
90% of sites have concentrations below this line
125 Sites
NAAQS
10% of sites have concentrations below this line
83 84 85 86 87 88 89 90 91 92 93 94 95 96 97 98 99 00 01
1983–02: 21% decrease1993–02: 11% decrease
02
Average
Co
nce
ntr
atio
n, p
pm
FIGURE 4-4. NO2 air quality from 1983 to 2002. (From EPA, Latest Findings onNational Air Quality 2002 Status and Trends, Office of Air Quality Planning andStandards, U.S. Environmental Protection Agency, U.S. Government Printing Office,Washington, D.C., August 2003.)
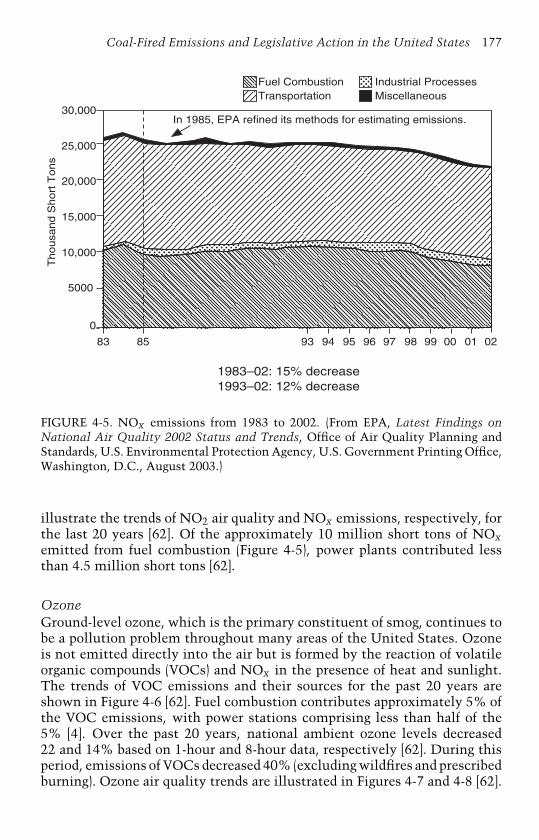
Coal-Fired Emissions and Legislative Action in the United States 177
30,000
25,000
20,000
15,000
10,000
5000
In 1985, EPA refined its methods for estimating emissions.
83 85 0293 94 95 96 97 98 99 00 01
0
Fuel CombustionTransportation
Industrial ProcessesMiscellaneous
1983–02: 15% decrease1993–02: 12% decrease
Th
ou
san
d S
ho
rt T
on
s
FIGURE 4-5. NOx emissions from 1983 to 2002. (From EPA, Latest Findings onNational Air Quality 2002 Status and Trends, Office of Air Quality Planning andStandards, U.S. Environmental Protection Agency, U.S. Government Printing Office,Washington, D.C., August 2003.)
illustrate the trends of NO2 air quality and NOx emissions, respectively, forthe last 20 years [62]. Of the approximately 10 million short tons of NOxemitted from fuel combustion (Figure 4-5), power plants contributed lessthan 4.5 million short tons [62].
OzoneGround-level ozone, which is the primary constituent of smog, continues tobe a pollution problem throughout many areas of the United States. Ozoneis not emitted directly into the air but is formed by the reaction of volatileorganic compounds (VOCs) and NOx in the presence of heat and sunlight.The trends of VOC emissions and their sources for the past 20 years areshown in Figure 4-6 [62]. Fuel combustion contributes approximately 5% ofthe VOC emissions, with power stations comprising less than half of the5% [4]. Over the past 20 years, national ambient ozone levels decreased22 and 14% based on 1-hour and 8-hour data, respectively [62]. During thisperiod, emissions of VOCs decreased 40% (excluding wildfires and prescribedburning). Ozone air quality trends are illustrated in Figures 4-7 and 4-8 [62].

30,000
25,000
20,000
15,000
10,000
5000
83 85 93 94 95 96 97
Th
ou
san
d S
ho
rt T
on
s
98 99 00 01
1983–02: 40% decrease1993–02: 25% decrease
0
Fuel CombustionTransportation
Industrial ProcessesMiscellaneous Fires
02
In 1985 and 1996, EPA refined its methodsfor estimating emissions.
Fire emissions not available for 2002.
FIGURE 4-6. VOC emissions from 1983 to 2002. (From EPA, Latest Findings onNational Air Quality 2002 Status and Trends, Office of Air Quality Planning andStandards, U.S. Environmental Protection Agency, U.S. Government Printing Office,Washington, D.C., August 2003.)
0.20
0.15
0.10
0.05
0.00
Average
90% of sites have concentrations below this line 370 Sites
10% of sites have concentrations below this line
0283 84 85 86 87 88 89 90 91 92 93 94 95 96 97 98 99 00 01
1983–02: 22% decrease1993–02: 2% decrease
NAAQS
Conce
ntr
atio
n, ppm
FIGURE 4-7. Ozone air quality from 1983 to 2002 based on 8-hour averages. (FromEPA, Latest Findings on National Air Quality 2002 Status and Trends, Office ofAir Quality Planning and Standards, U.S. Environmental Protection Agency, U.S.Government Printing Office, Washington, D.C., August 2003.)
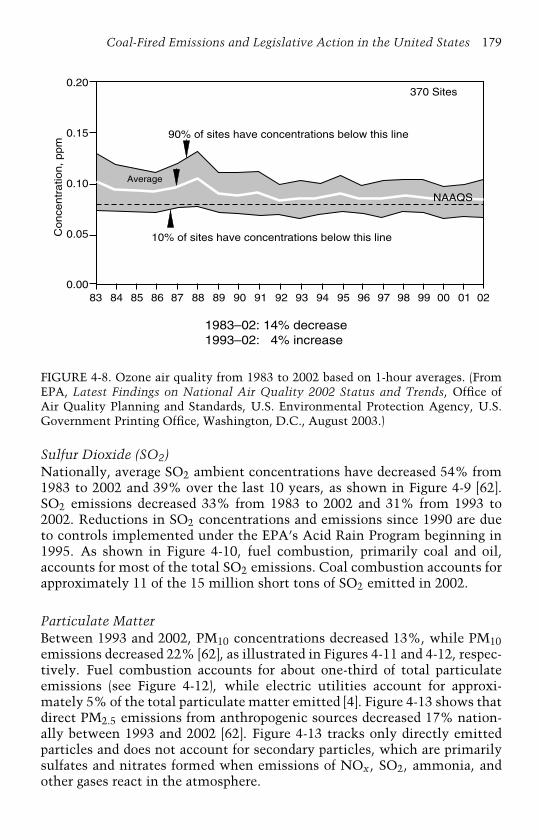
Coal-Fired Emissions and Legislative Action in the United States 179
0.20
0.15
0.10
0.05
0.00
Average
90% of sites have concentrations below this line
370 Sites
10% of sites have concentrations below this line
0283 84 85 86 87 88 89 90 91 92 93 94 95 96 97 98 99 00 01
1983–02: 14% decrease1993–02: 4% increase
NAAQS
Conce
ntr
atio
n, ppm
FIGURE 4-8. Ozone air quality from 1983 to 2002 based on 1-hour averages. (FromEPA, Latest Findings on National Air Quality 2002 Status and Trends, Office ofAir Quality Planning and Standards, U.S. Environmental Protection Agency, U.S.Government Printing Office, Washington, D.C., August 2003.)
Sulfur Dioxide (SO2)Nationally, average SO2 ambient concentrations have decreased 54% from1983 to 2002 and 39% over the last 10 years, as shown in Figure 4-9 [62].SO2 emissions decreased 33% from 1983 to 2002 and 31% from 1993 to2002. Reductions in SO2 concentrations and emissions since 1990 are dueto controls implemented under the EPA’s Acid Rain Program beginning in1995. As shown in Figure 4-10, fuel combustion, primarily coal and oil,accounts for most of the total SO2 emissions. Coal combustion accounts forapproximately 11 of the 15 million short tons of SO2 emitted in 2002.
Particulate MatterBetween 1993 and 2002, PM10 concentrations decreased 13%, while PM10emissions decreased 22% [62], as illustrated in Figures 4-11 and 4-12, respec-tively. Fuel combustion accounts for about one-third of total particulateemissions (see Figure 4-12), while electric utilities account for approxi-mately 5% of the total particulate matter emitted [4]. Figure 4-13 shows thatdirect PM2.5 emissions from anthropogenic sources decreased 17% nation-ally between 1993 and 2002 [62]. Figure 4-13 tracks only directly emittedparticles and does not account for secondary particles, which are primarilysulfates and nitrates formed when emissions of NOx , SO2, ammonia, andother gases react in the atmosphere.
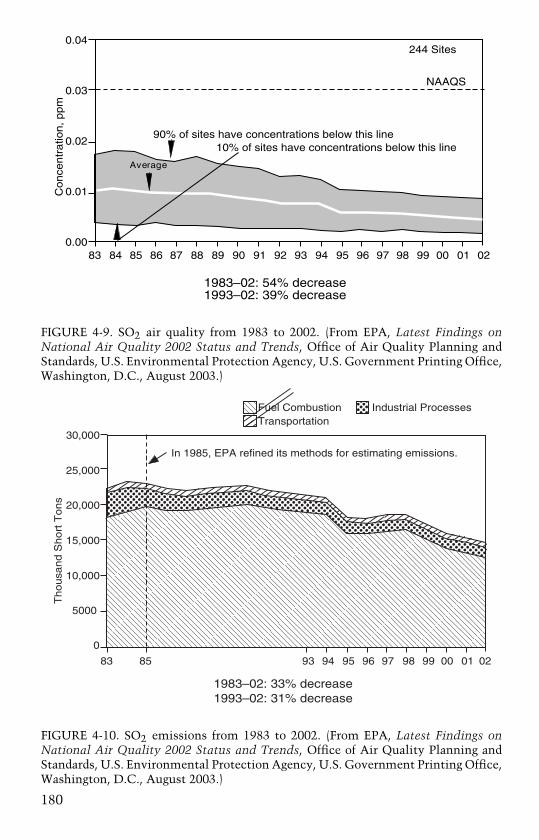
0.04
0.03
0.02
0.01
0.00
Average
90% of sites have concentrations below this line
244 Sites
10% of sites have concentrations below this line
0283 84 85 86 87 88 89 90 91 92 93 94 95 96 97 98 99 00 01
1983–02: 54% decrease1993–02: 39% decrease
NAAQS
Co
nce
ntr
atio
n,
pp
m
FIGURE 4-9. SO2 air quality from 1983 to 2002. (From EPA, Latest Findings onNational Air Quality 2002 Status and Trends, Office of Air Quality Planning andStandards, U.S. Environmental Protection Agency, U.S. Government Printing Office,Washington, D.C., August 2003.)
30,000
25,000
20,000
15,000
10,000
5000
In 1985, EPA refined its methods for estimating emissions.
83 85 0293 94 95 96 97 98 99 00 01
1983–02: 33% decrease1993–02: 31% decrease
0
Fuel CombustionTransportation
Industrial Processes
Thousa
nd S
hort
Tons
FIGURE 4-10. SO2 emissions from 1983 to 2002. (From EPA, Latest Findings onNational Air Quality 2002 Status and Trends, Office of Air Quality Planning andStandards, U.S. Environmental Protection Agency, U.S. Government Printing Office,Washington, D.C., August 2003.)
180

60
50
40
30
20
10
0
Average
90% of sites have concentrations below this line
804 Sites
10% of sites have concentrations below this line
93 94 95 96 97 98 99 00 01 02
1993–02: 13% decrease
NAAQS
Conce
ntr
atio
n, ppm
FIGURE 4-11. PM10 air quality from 1993 to 2002. (From EPA, Latest Findings onNational Air Quality 2002 Status and Trends, Office of Air Quality Planning andStandards, U.S. Environmental Protection Agency, U.S. Government Printing Office,Washington, D.C., August 2003.)
In 1996, EPA refined its methods for estimating emissions.
93 94 95 96 97 98 99 00 02
1993–02: 22% decrease
Fuel CombustionTransportation
Industrial Processes
4000
3000
2000
1000
001
Th
ou
san
d S
ho
rt T
on
s
FIGURE 4-12. PM10 emissions from 1993 to 2002. (From EPA, Latest Findings onNational Air Quality 2002 Status and Trends, Office of Air Quality Planning andStandards, U.S. Environmental Protection Agency, U.S. Government Printing Office,Washington, D.C., August 2003.)
181
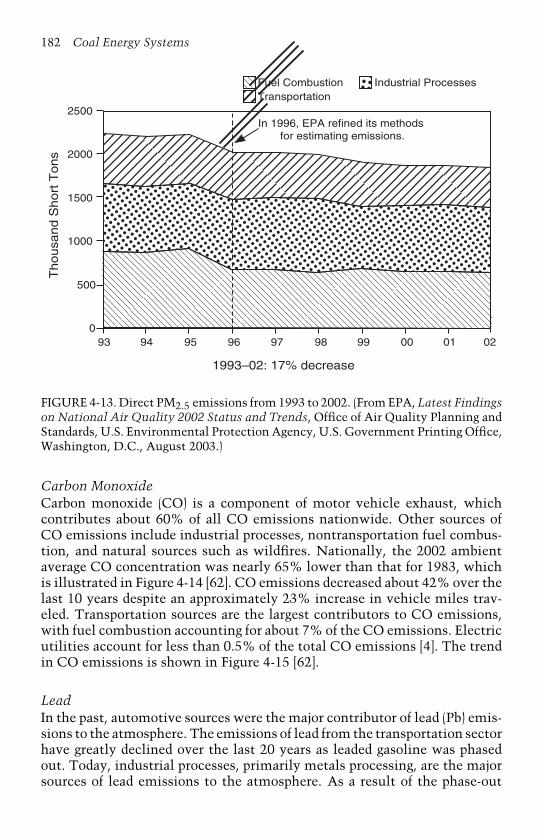
182 Coal Energy Systems
2500
2000
1500
1000
500
00293 94 95 96 97 98 99 00 01
1993–02: 17% decrease
Fuel CombustionTransportation
Industrial Processes
In 1996, EPA refined its methods for estimating emissions.
Thousa
nd S
hort
Tons
FIGURE 4-13. Direct PM2.5 emissions from 1993 to 2002. (From EPA, Latest Findingson National Air Quality 2002 Status and Trends, Office of Air Quality Planning andStandards, U.S. Environmental Protection Agency, U.S. Government Printing Office,Washington, D.C., August 2003.)
Carbon MonoxideCarbon monoxide (CO) is a component of motor vehicle exhaust, whichcontributes about 60% of all CO emissions nationwide. Other sources ofCO emissions include industrial processes, nontransportation fuel combus-tion, and natural sources such as wildfires. Nationally, the 2002 ambientaverage CO concentration was nearly 65% lower than that for 1983, whichis illustrated in Figure 4-14 [62]. CO emissions decreased about 42% over thelast 10 years despite an approximately 23% increase in vehicle miles trav-eled. Transportation sources are the largest contributors to CO emissions,with fuel combustion accounting for about 7% of the CO emissions. Electricutilities account for less than 0.5% of the total CO emissions [4]. The trendin CO emissions is shown in Figure 4-15 [62].
LeadIn the past, automotive sources were the major contributor of lead (Pb) emis-sions to the atmosphere. The emissions of lead from the transportation sectorhave greatly declined over the last 20 years as leaded gasoline was phasedout. Today, industrial processes, primarily metals processing, are the majorsources of lead emissions to the atmosphere. As a result of the phase-out
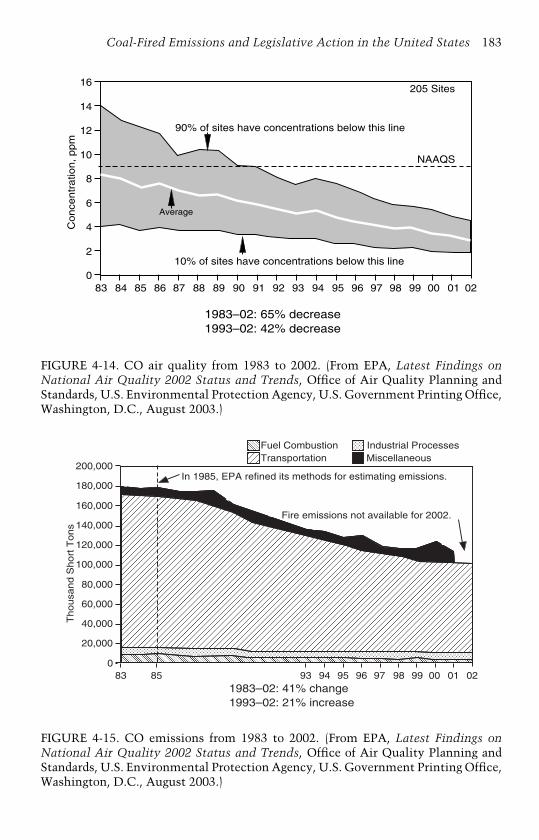
Coal-Fired Emissions and Legislative Action in the United States 183
16
14
12
10
8
6
4
2
0
Average
90% of sites have concentrations below this line
205 Sites
10% of sites have concentrations below this line
0283 84 85 86 87 88 89 90 91 92 93 94 95 96 97 98 99 00 01
1983–02: 65% decrease1993–02: 42% decrease
NAAQS
Co
nce
ntr
atio
n,
pp
m
FIGURE 4-14. CO air quality from 1983 to 2002. (From EPA, Latest Findings onNational Air Quality 2002 Status and Trends, Office of Air Quality Planning andStandards, U.S. Environmental Protection Agency, U.S. Government Printing Office,Washington, D.C., August 2003.)
200,000
180,000
160,000
140,000
120,000
100,000
80,000
60,000
40,000
20,000
0
In 1985, EPA refined its methods for estimating emissions.
83 85 0293 94 95 96 97 98 99 00 011983–02: 41% change 1993–02: 21% increase
Fuel CombustionTransportation
Industrial ProcessesMiscellaneous
Fire emissions not available for 2002.
Thousa
nd S
hort
Tons
FIGURE 4-15. CO emissions from 1983 to 2002. (From EPA, Latest Findings onNational Air Quality 2002 Status and Trends, Office of Air Quality Planning andStandards, U.S. Environmental Protection Agency, U.S. Government Printing Office,Washington, D.C., August 2003.)
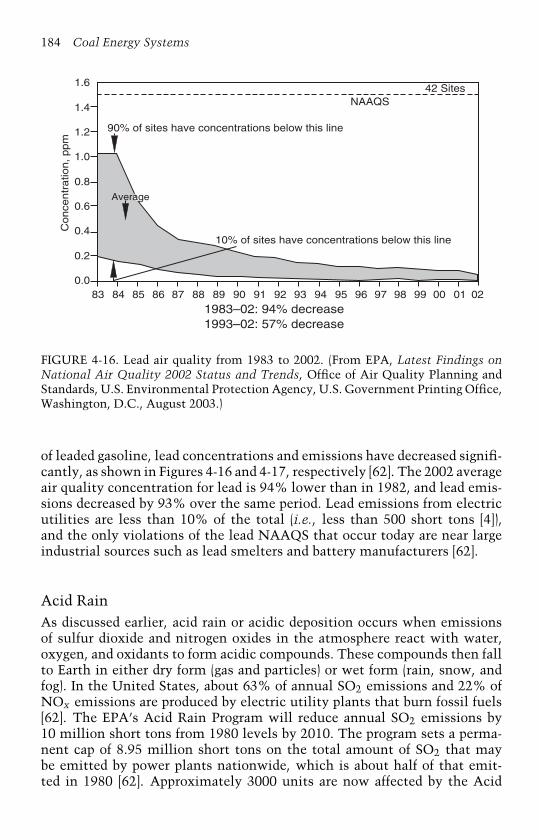
184 Coal Energy Systems
1.6
1.4
1.2
1.0
0.8
0.6
0.4
0.2
0.0
90% of sites have concentrations below this line
42 Sites
10% of sites have concentrations below this line
0283 84 85 86 87 88 89 90 91 92 93 94 95 96 97 98 99 00 01
1983–02: 94% decrease 1993–02: 57% decrease
NAAQS
Conce
ntr
atio
n, ppm
Average
FIGURE 4-16. Lead air quality from 1983 to 2002. (From EPA, Latest Findings onNational Air Quality 2002 Status and Trends, Office of Air Quality Planning andStandards, U.S. Environmental Protection Agency, U.S. Government Printing Office,Washington, D.C., August 2003.)
of leaded gasoline, lead concentrations and emissions have decreased signifi-cantly, as shown in Figures 4-16 and 4-17, respectively [62]. The 2002 averageair quality concentration for lead is 94% lower than in 1982, and lead emis-sions decreased by 93% over the same period. Lead emissions from electricutilities are less than 10% of the total (i.e., less than 500 short tons [4]),and the only violations of the lead NAAQS that occur today are near largeindustrial sources such as lead smelters and battery manufacturers [62].
Acid RainAs discussed earlier, acid rain or acidic deposition occurs when emissionsof sulfur dioxide and nitrogen oxides in the atmosphere react with water,oxygen, and oxidants to form acidic compounds. These compounds then fallto Earth in either dry form (gas and particles) or wet form (rain, snow, andfog). In the United States, about 63% of annual SO2 emissions and 22% ofNOx emissions are produced by electric utility plants that burn fossil fuels[62]. The EPA’s Acid Rain Program will reduce annual SO2 emissions by10 million short tons from 1980 levels by 2010. The program sets a perma-nent cap of 8.95 million short tons on the total amount of SO2 that maybe emitted by power plants nationwide, which is about half of that emit-ted in 1980 [62]. Approximately 3000 units are now affected by the Acid
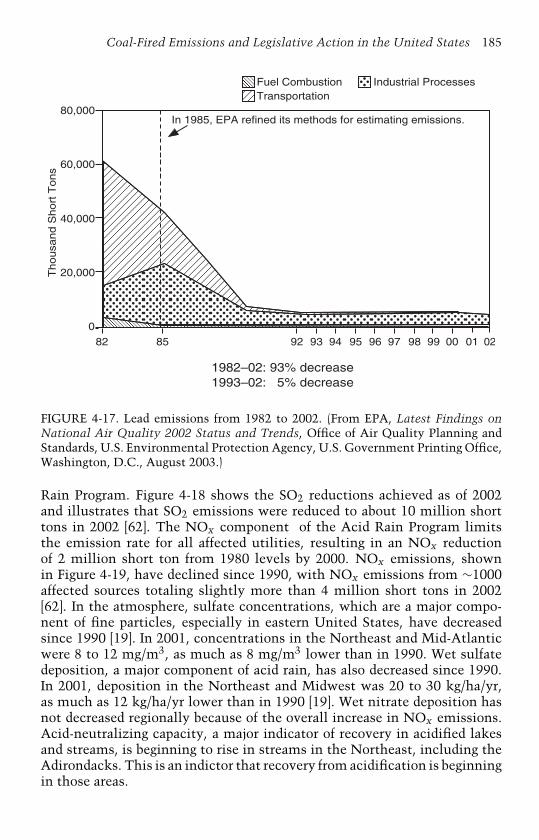
Coal-Fired Emissions and Legislative Action in the United States 185
80,000
60,000
40,000
20,000
0
In 1985, EPA refined its methods for estimating emissions.
82 85 92 93 94 95 96 97 98 99 00 01
1982–02: 93% decrease 1993–02: 5% decrease
Fuel CombustionTransportation
Industrial Processes
02
Th
ou
san
d S
ho
rt T
on
s
FIGURE 4-17. Lead emissions from 1982 to 2002. (From EPA, Latest Findings onNational Air Quality 2002 Status and Trends, Office of Air Quality Planning andStandards, U.S. Environmental Protection Agency, U.S. Government Printing Office,Washington, D.C., August 2003.)
Rain Program. Figure 4-18 shows the SO2 reductions achieved as of 2002and illustrates that SO2 emissions were reduced to about 10 million shorttons in 2002 [62]. The NOx component of the Acid Rain Program limitsthe emission rate for all affected utilities, resulting in an NOx reductionof 2 million short ton from 1980 levels by 2000. NOx emissions, shownin Figure 4-19, have declined since 1990, with NOx emissions from ∼1000affected sources totaling slightly more than 4 million short tons in 2002[62]. In the atmosphere, sulfate concentrations, which are a major compo-nent of fine particles, especially in eastern United States, have decreasedsince 1990 [19]. In 2001, concentrations in the Northeast and Mid-Atlanticwere 8 to 12 mg/m3, as much as 8 mg/m3 lower than in 1990. Wet sulfatedeposition, a major component of acid rain, has also decreased since 1990.In 2001, deposition in the Northeast and Midwest was 20 to 30 kg/ha/yr,as much as 12 kg/ha/yr lower than in 1990 [19]. Wet nitrate deposition hasnot decreased regionally because of the overall increase in NOx emissions.Acid-neutralizing capacity, a major indicator of recovery in acidified lakesand streams, is beginning to rise in streams in the Northeast, including theAdirondacks. This is an indictor that recovery from acidification is beginningin those areas.

186 Coal Energy Systems
17.30
7.906.79 7.03
6.57 7.07 7.517.81
13.1012.9812.5111.87
11.20
11.20
10.63
10.63
10.19
10.19
16.09 15.73
18
16
14
12
10
8
6
4
2
01980 1985 1990 1995 1996 1997 1998 1999 2000 2001
Phase I sources
Phase II sources
All sources
Allowances allocated for that year
2002
9.40 9.308.70
5.30 5.44 5.47 5.29 4.94
Em
issi
ons
(mill
ion tons)
FIGURE 4-18. SO2 emissions covered under the Acid Rain Program. (From EPA, Lat-est Findings on National Air Quality 2002 Status and Trends, Office of Air QualityPlanning and Standards, U.S. Environmental Protection Agency, U.S. GovernmentPrinting Office, Washington, D.C., August 2003.)
6.66
4.69
5.91
5.495.11
5.53 5.44 5.44 5.495.29
4.82
7
6
5
4
3
2
1
01990 1995 1996 1997 1998 1999 2000 2001
NOx Program affected sources
Title IV sources not affected for NOxProjected emissions without Title IV
8.1
4.10
2002
4.47
4.024.48E
mis
sions
(mill
ion tons)
6.046.09 5.97
FIGURE 4-19. NOx emissions covered under the Acid Rain Program. (From EPA, Lat-est Findings on National Air Quality 2002 Status and Trends, Office of Air QualityPlanning and Standards, U.S. Environmental Protection Agency, U.S. GovernmentPrinting Office, Washington, D.C., August 2003.)

Coal-Fired Emissions and Legislative Action in the United States 187
Hazardous Air PollutantsCurrently, emissions of hazardous air pollutants (HAPs) are not regulated bythe EPA, although mercury regulations will be implemented by 2007. Emis-sions of HAPs from coal-fired power plants have been estimated by the EPA,which performed a study (i.e., Study of Hazardous Air Pollutant Emissionsfrom Electric Utility Steam Generating Units) to determine the quantity ofhazardous air pollutants being emitted from fossil-fuel-fired power plants[37]. In this study, discussed earlier, HAP emissions tests data were gatheredfrom 52 utility units (i.e., boilers), including a range of coal-, oil-, and natural-gas-fired utility boilers. The emission tests data, along with facility specificinformation (e.g., boiler type, control devices, fuel usage) were used to esti-mate HAP emissions from all 684 utility plants in the United States. Theseutilities are fueled primarily by coal (59%), oil (12%), or natural gas (29%).Many plants have two or more units, and several plants burn more than onetype of fuel (e.g., contain both coal- and oil-fired units). In 1990, 426 plantsburned coal as one of their fuels, 137 plants burned oil, and 267 plants burnednatural gas. The overall summary of the study is presented in Table 4-14,
TABLE 4-14Nationwide Utility (Coal-Fired) Emissions for Thirteen Priority HAPsa
HAP Nationwide HAP Emission Estimates(short tons per year)b
1990 1994 2010
Arsenic 61 56 71Beryllium 7.1 7.9 8.2Cadmium 3.3 3.2 3.8Chromium 73 62 87Lead 75 62 87Manganese 164 168 219Mercury 46 51 60Nickel 58 52 69Hydrogen chloride 143,000 134,000 155,000Hydrogen fluoride 20,000 23,000 26,000Acrolein 25 27 34Dioxinsc 0.000097 0.00012 0.00020Formaldehyde 35 29 45
aRadionuclides are the one priority HAP not included on this table because radionuclide emis-sions are measured in different units (i.e., curies per year) and, therefore, would not provide arelevant comparison to the other HAPs shown.bThe emission estimates in this table are derived from model projections based on a limitedsample of specific boiler types and control scenarios; therefore, there are uncertainties in thesenumbers.cThese emission estimates were calculated using the toxic equivalency (TEQ) approach, whichis based on the summation of the emissions of each congener after adjusting for toxicity relativeto 2,3,7,8-tetrachlorodibenzo-p-dioxin (i.e., 2,3,7,8-TCDD).

188 Coal Energy Systems
TABLE 4-15Estimated Emissions for Nine Priority HAPs fromCharacteristic Utility Units (1994; short tons peryear)a
Fuel CoalUnit size (MWe): 325
Arsenic 0.0050Cadmium 0.0023Chromium 0.11Lead 0.021Mercury 0.05Hydrogen chloride 190Hydrogen fluoride 14Dioxinsb 0.00000013Nickelc NC
aThere are uncertainties in these numbers. Based on anuncertainty analysis, the EPA predicts that the emissionestimates are generally within a factor of roughly three ofactual emissions.bThese emission estimates were calculated using the toxicequivalency (TEQ) approach, which is based on the sum-mation of the emissions of each congener after adjustingfor toxicity relative to 2,3,7,8-tetrachlorodibenzo-p-dioxin(i.e., 2,3,7,8-TCDD).cNot calculated.
which lists nationwide utility emissions estimates for 13 priority HAPs [37].Table 4-15 contains estimated emissions for 9 priority HAPs from character-istic utility units. In summary, the Utility Hazardous Air Pollutant Reportto Congress analyzed 66 other air pollutants (other than mercury, whichis discussed in the next section) from 684 power plants that are 25 MW orlarger and burning coal, oil, or natural gas [37]. The report noted potentialhealth concerns about utility emissions of dioxin, arsenic, hydrogen chlo-ride, hydrogen fluoride, and nickel, although uncertainties exist about thehealth data and emissions for these pollutants.
MercuryThe best estimate of annual anthropogenic U.S. emissions of mercury from1994 to 1995 is 158 short tons [36]. Approximately 87% of these emissionswere from combustion sources, including waste and fossil fuel combustion,as illustrated in Figure 4-20 [63]. Contemporary anthropogenic emissions areonly one part of the mercury cycle. Releases from human activities today areadding to the mercury reservoirs that already exist in land, water, and air,both naturally and as a result of previous human activities. One estimateof the total annual global input to the atmosphere from all sources, includ-ing natural, anthropogenic, and oceanic emissions, is 5500 short tons [36].
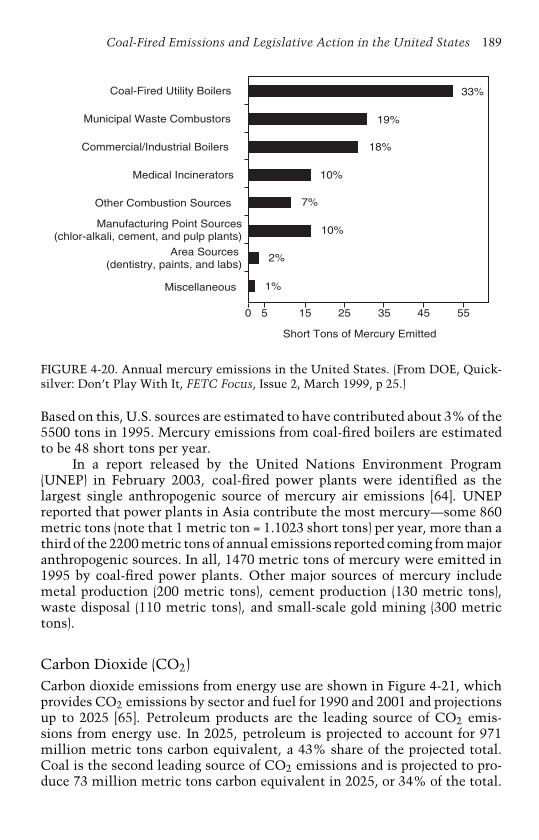
Coal-Fired Emissions and Legislative Action in the United States 189
33%
19%
18%
10%
7%
10%
2%
1%
5 15 25 35 45 550
Coal-Fired Utility Boilers
Municipal Waste Combustors
Commercial/Industrial Boilers
Medical Incinerators
Other Combustion Sources
Miscellaneous
Manufacturing Point Sources(chlor-alkali, cement, and pulp plants)
Area Sources (dentistry, paints, and labs)
Short Tons of Mercury Emitted
FIGURE 4-20. Annual mercury emissions in the United States. (From DOE, Quick-silver: Don’t Play With It, FETC Focus, Issue 2, March 1999, p 25.)
Based on this, U.S. sources are estimated to have contributed about 3% of the5500 tons in 1995. Mercury emissions from coal-fired boilers are estimatedto be 48 short tons per year.
In a report released by the United Nations Environment Program(UNEP) in February 2003, coal-fired power plants were identified as thelargest single anthropogenic source of mercury air emissions [64]. UNEPreported that power plants in Asia contribute the most mercury—some 860metric tons (note that 1 metric ton = 1.1023 short tons) per year, more than athird of the 2200 metric tons of annual emissions reported coming from majoranthropogenic sources. In all, 1470 metric tons of mercury were emitted in1995 by coal-fired power plants. Other major sources of mercury includemetal production (200 metric tons), cement production (130 metric tons),waste disposal (110 metric tons), and small-scale gold mining (300 metrictons).
Carbon Dioxide (CO2)Carbon dioxide emissions from energy use are shown in Figure 4-21, whichprovides CO2 emissions by sector and fuel for 1990 and 2001 and projectionsup to 2025 [65]. Petroleum products are the leading source of CO2 emis-sions from energy use. In 2025, petroleum is projected to account for 971million metric tons carbon equivalent, a 43% share of the projected total.Coal is the second leading source of CO2 emissions and is projected to pro-duce 73 million metric tons carbon equivalent in 2025, or 34% of the total.

190 Coal Energy Systems
Transportation Industrial
Commercial Residential
0
1990
1359
2237
Mill
ion M
etr
ic T
ons
Carb
on E
quiv
ale
nt
2001 2005 2015 2025
500
1000
1500
2000
2500
Coal
Petroleum
Natural gas
FIGURE 4-21. Current and projected carbon dioxide emissions by sector and fuel.(From EIA, Annual Energy Outlook 2003, Energy Information Administration, U.S.Department of Energy, Washington, D.C., January 2003.)
Natural gas
Petroleum
Coal
1990
492
612 617
741
860
0
Mill
ion M
etr
ic T
ons
Carb
on E
quiv
ale
nt
200
400
600
800
1000
2001 2005 2015 2025
FIGURE 4-22. Current and projected carbon dioxide emissions from the electricpower sector by fuel. (From EIA, Annual Energy Outlook 2003, Energy InformationAdministration, U.S. Department of Energy, Washington, D.C., January 2003.)

Coal-Fired Emissions and Legislative Action in the United States 191
In 2025, natural gas use is projected to produce a 23% share of the total CO2emissions with 512 million metric tons carbon equivalent.
The use of fossil fuels in the electric power industry accounted for 39%of total energy-related CO2 emissions in 2001, and the share is projected tobe 38% in 2025, as shown in Figure 4-22 [65]. Coal is projected to account for50% of the power industry’s electricity generation in 2025 and to produce81% of electricity-related CO2 emissions. In 2025, natural gas is projectedto account for 27% of electricity generation and 18% of electricity-relatedCO2 emissions.
References
1. Lomborg, B., The Skeptical Environmentalist: Measuring the Real State of theWorld (Cambridge University Press, Cambridge, U.K., 2001).
2. University of California at Davis, www-geology.ucdavis.edu/∼GEL115/115CH11coal.html (accessed May 2003).
3. Anon., Recognizing Pollution’s Hazard’s, Chemical and Engineering News,Vol. 81, No. 15, April 14, 2003, pp. 54–55.
4. Wark, K., C. F. Warner, and W. T. Davis, Air Pollution: Its Origin and Control,Third ed. (Addison-Wesley Longman, Menlo Park, CA, 1998).
5. Dunn, S., King Coal’s Weakening Grip on Power, World Watch, Septem-ber/October 1999, pp. 10–19.
6. EPA, EPA Proposes Options for Significantly Reducing Mercury Emissionsfrom Electric Utilities (U.S. Environmental Protection Agency, Washington,D.C.), www.epa.gov/mercury/ (accessed December 15, 2003).
7. EPA (United States Environmental Protection Agency), National AmbientAir Quality Standards (NAAQS) (U.S. Environmental Protection Agency,Washington, D.C.), www.epa.gov/air/criteria.html (accessed November 15,2002).
8. EPA, Subpart D(a)—Standards of Performance for Fossil Fuel-Fired SteamGenerators for Which Construction is Commenced After August 17, 1971,Federal Register, www.epa.gov/ttn/atw/combust/boiler/boilnsps.html#rule(December 23, 1971).
9. EPA, Standards of Performance for New Stationary Sources; Electric UtilitySteam Generating Units; Decision in Response to Petitions for Reconsidera-tion, Federal Register, Vol. 45, No. 26, February 6, 1980, pp. 8210–8213.
10. EPA, Revision of Standards of Performance for Nitrogen Oxide Emissionsfrom New Fossil Fuel-Fired Steam Generating Units; Revisions to ReportingRequirements for Standards of Performance for New Fossil Fuel-Fired SteamGenerating Units, Federal Register, Vol. 63, No. 179, September 16, 1998,pp. 49442–49454.
11. EPA, Fact Sheet: Revision of Standards of Performance for Nitrogen OxidesEmissions from Fossil Fuel-Fired Steam Generating Units (U.S. Environmen-tal Protection Agency, Washington, D.C.), www.epa.gov/ttn/oarpg, (accessedAugust 7, 2001).
192 Coal Energy Systems
12. EPA, Subpart D(b)—Standards of Performance for Industrial-Commercial-Institutional Steam Generating Units, Federal Register, www.epa.gov/ttn/atw/combust/boiler/boilnsps.html#rule (November 25, 1986).
13. EPA, Subpart D(c)—Standards of Performance for Small Industrial–Commercial–Institutional Steam Generating Units, Federal Register, www.epa.gov/ttn/atw/combust/boiler/boilnsps.html#rule (September 12, 1990).
14. AP-42, External Combustion Sources, in Emission Factors, Fifth ed. (Officeof Air Quality Planning and Standards and Office of Air and Radiation, U.S.Environmental Protection Agency, Washington, D.C., 1993 [revisions in 1998]).
15. Anon., EPA Finalizes NESHAP Amendments, Chemical Engineering Progress,Vol. 99, No. 7, July 2003, p. 18.
16. EPA, Overview: The Clean Air Act Amendments of 1990 (U.S. Environmen-tal Protection Agency, Washington, D.C.), www.epa.gov/oar/caa/overview.txt,(accessed November 15, 2002).
17. EPA, CAAA: Original List of Hazardous Air Pollutants (U.S. EnvironmentalProtection Agency, Washington, D.C.), www.epa.gov/ttn/atw/orig189.html,(accessed February 11 2002).
18. Makanski, J., Clean Air Act Amendments: The Engineering Response, Power,Vol. 135, No. 6, 1991, pp. 11–66.
19. EPA, EPA Acid Rain Program 2001 Progress Report (Office of Air and Radia-tion, U.S. Environmental Protection Agency, U.S. Government Printing Office,Washington, D.C., November 2002).
20. Leone, M., Cleaning the Air the Market-Based Way, Power, Vol. 129, No. 10,December 1990, pp. 9–10.
21. EPA, Acid Rain Program: Program Overview (U.S. Environmental Protec-tion Agency, Washington, D.C.), www.epa.gov/airmarkets/arp/index.html(accessed April 1999).
22. Smith, D. N., H. G. McIlvried, and A. N. Mann, Understanding NOx and HowIt Impacts Coal, Coal Age, Vol. 105, No. 11, November 2000, p. 35.
23. EPA, NOx Trading Programs, www.epa.gov/airmarkets/progregs/noxview.html,October 29, 2002.
24. EPA, The Regional Transport of Ozone (Office of Air Quality Planning andStandards, U.S. Environmental Protection Agency, U.S. Government PrintingOffice, Washington, D.C., September 1998).
25. D’Aquino, R., The NOx Market: Play It Like a Pro, Chemical EngineeringProgress, Vol. 99, No. 6, June 2003, p. 9.
26. EPA, New Source Review: Report to the President (U.S. EnvironmentalProtection Agency, Washington, D.C., June 2002).
27. EPA, Prevention of Significant Deterioration (PSD) and Nonattainment NewSource Review (NSR): Final Rule and Proposed Rule, Federal Register, Vol. 67,No. 251, December 31, 2002, pp. 80186–80289.
28. EPA, EPA Announces Improvements to New Source Review Program (U.S.Environmental Protection Agency, Washington, D.C.), www.epa.gov/air/nsr-review/press_release.html (accessed March 13, 2003).
29. EPA, New Source Review (U.S. Environmental Protection Agency, Washing-ton, D.C.), www.epa.gov/air/nsr-review/ (accessed July 25, 2003).
Coal-Fired Emissions and Legislative Action in the United States 193
30. Anon., EPA Finalizes New Source Review Rule, Chemical EngineeringProgress, Vol. 99, No. 12, December 2003, p. 24.
31. DOE, Atmospheric Aerosol Source–Receptor Relationships: The Role of Coal-Fired Power Plants—Project Facts (Office of Fossil Energy, National EnergyTechnology Laboratory, U.S. Department of Energy, Washington, D.C., January2003).
32. EPA, Fact Sheet: Final Regional Haze Regulations for Protection of Visibility inNational Parks and Wilderness Areas (U.S. Environmental Protection Agency,Washington, D.C.), www.epa.gov/oar/visibility/program.html (accessed June2, 1999).
33. Aljoe, W. W. and T. J. Grahame, The DOE-NETL Air Quality Research Program:Airborne Fine Particulate (PM2.5), in Proc. of the Conference on Air Quality III:Mercury, Trace Elements, and Particulate Matter (University of North Dakota,Grand Forks, 2002).
34. Anon., EPA Issues PM2.5 Guidance, Chemical Engineering Progress, Vol. 99,No. 5, May 2003, p. 24.
35. EPA, Designations for the Fine Particle National Ambient Air Qual-ity Standards (U.S. Environmental Protection Agency, Washington, D.C.),www.epa.gov/ttn/naaqs/pm/pm25_guide.html (accessed April 1, 2003).
36. EPA, Mercury Study Report to Congress (Office of Air Quality Planningand Standards and Office of Research and Development, U.S. Environmen-tal Protection Agency, U.S. Government Printing Office, Washington, D.C.,December 1997).
37. EPA, Study of Hazardous Air Pollutant Emissions from Electric Utility SteamGenerating Units—Final Report to Congress (Office of Air Quality Plan-ning and Standards, U.S. Environmental Protection Agency, U.S. GovernmentPrinting Office, Washington, D.C., February 1998).
38. EPA, EPA ICR No. 1858: Information Collection Request for Electric UtilitySteam Generating Unit Mercury Emissions Information Collection Effort(U.S. Environmental Protection Agency, Washington, D.C., 1999).
39. EPA, Regulatory Finding on the Emissions of Hazardous Air Pollutants FromElectric Utility Steam Generating Units, Federal Register, Vol. 65, No. 245,December 20, 2000, pp. 79825–79831.
40. EPA, Clear Skies (U.S. Environmental Protection Agency, Washington, D.C.),www.epa.gov/clearskies/ (accessed July 17, 2003).
41. EPA, Clear Skies Basic Information (U.S. Environmental Protection Agency,Washington, D.C.), www.epa.gov/clearskies/basic.html (accessed July 10,2003).
42. Anon., Bush Initiative Faces Skepticism in Congress, Chemical and Engineer-ing News, Vol. 81, No. 29, July 21, 2003, p. 5.
43. Tatsutani, M., Multi-Pollutant Proposals in the 108th Congress, paper pre-sented at the OTC Annual Meeting, Philadelphia, PA, June 22, 2003.
44. EPA, Interstate Air Quality Rule (U.S. Environmental Protection Agency,Washington, D.C.), www.epa.gov/interstateairquality/ (accessed December 4,2003).
194 Coal Energy Systems
45. Anon., Congress Considers Climate Change, Chemical Engineering Progress,Vol. 99, No. 6, June 2003, p. 23.
46. Anon., Global Initiative on CO2 Storage, Chemical and Engineering News,Vol. 81, No. 26, June 30, 2003, p. 19.
47. Anon., Climate-Change Plan Released, Chemical and Engineering News,Vol. 81, No. 30, July 28, 2003, p. 39.
48. Anon., White House Seeks More Data on Global Climate Change, Centre DailyTimes, July 24, 2003, p. A10.
49. Soud, H. N., Developments in FGC (IEA Coal Research, London, March 2000).50. Wu, Z., NOx Control for Pulverized Coal Fired Power Stations (IEA Coal
Research, London, December 2002).51. McConville, A., An Overview of Air Pollution Emission Standards for Coal-
Fired Plants Worldwide (Coal and Slurry Technology Association, Washington,D.C., 1997), pp. 1–12.
52. Soud, H. N., Developments in Particulate Control for Coal Combustion (IEACoal Research, London, April 1995).
53. Clarke, L. E. and L. L. Sloss, Trace Elements: Emissions from Coal Combustionand Gasification (IEA Coal Research, London, 1992).
54. Lutter, R. and E. Irwin, Mercury in the Environment: A Volatile Problem,Environment, Vol. 44, No. 9, November 2002, pp. 24–40.
55. United Nations, United Nations Framework Convention on Climate Change,1992.
56. EPA, States Guidance Document Policy Planning to Reduce GreenhouseGas Emissions, Second ed. (Office of Policy, Planning, and Evaluation, U.S.Environmental Protection Agency, Washington, D.C., May 1998).
57. Anon., Global Warming in Brief (Global Warming, Washington, D.C.),www.globalwarming.org/brochure.html (accessed November 2000).
58. Jackson, T. (editor), Mitigating Climate Change: Flexibility Mechanisms(Elsevier Science, Oxford, 2001), p. 17.
59. United Nations, Kyoto Protocol to the United Nations Framework Conventionon Climate Change, 1997.
60. EIA, International Energy Outlook 2002 (Energy Information Administration,U.S. Department of Energy, Washington, D.C., March 2002).
61. EPA, Latest Findings on National Air Quality 2001 Status and Trends (Officeof Air Quality Planning and Standards, U.S. Environmental Protection Agency,U.S. Government Printing Office, Washington, D.C., September 2002).
62. EPA, Latest Findings on National Air Quality 2002 Status and Trends (Officeof Air Quality Planning and Standards, U.S. Environmental Protection Agency,U.S. Government Printing Office, Washington, D.C., August 2003).
63. U.S. Department of Energy, Quicksilver, Don’t Play With It, FETC Focus, Issue2, March 1999, p 25.
64. Anon., Coal-Fired Plants Emit Most Mercury, Chemical and EngineeringNews, Vol. 81, No. 6, February 10, 2003, p. 20.
65. EIA, Annual Energy Outlook 2003 (Energy Information Administration, U.S.Department of Energy, Washington, D.C., January 2003).
CHAPTER 5
Technologies for CoalUtilization
Historically, coal use in the United States, from the 1800s to the mid-1900s,was primarily for iron and steel production, locomotives for transportation,and household heat. In addition, many chemicals, including medicines, dyes,flavorings, ammonia, and explosives, were produced from coal. With elec-trification of the United States beginning around 1950 and the feedstocksfor chemical production shifting from coal to oil, the primary applicationsfor coal use from 1950 to the present have been for electricity generationand the production of iron and steel. Coal is used in the industrial sector forproducing steam and to a lesser extent electricity, and some chemicals areproduced from coal. The technologies used for generating power, heat, coke,and chemicals will be discussed in this chapter and include combustion, car-bonization, gasification, and liquefaction, which have been referred to as thefour “grand processes” of coal utilization [1]. The emphasis of this chapteris on coal combustion, as this technology is the single largest user of coal.
Coal Combustion
Burning coal to generate heat is the most straightforward way of using coal.The heat that is generated from burning coal is used for warmth, cooking,and industrial processes. The use of coal for warmth, cooking, and metalworks has been around for thousands of years. While the Chinese are cred-ited with using coal as early as 1000 B.C. [2] and the first documented use ofcoal in Western civilization was by the Greek philosophers Pliny, Aristotle,and Theophrastus in the fourth century [3], coal was probably used by pre-historic man, as coal can be found at outcrops and often is easy to ignite. Asdiscussed in Chapter 2 (Past, Present, and Future Role of Coal), the use ofcoal increased substantially during the Industrial Revolution but decreasedwith the discovery of oil and its use as a home heating and transportationfuel. Today, the use of coal for direct residential heating and industrial pro-cesses represents a small percentage of total coal consumption. The primary
195

196 Coal Energy Systems
use of coal is for burning in boilers to generate electricity. The electrifica-tion of U.S. households in the 1950s along with the electrification of U.S.industry (i.e., electrometallurgical processes such as electric furnaces forsteel and aluminum manufacturing, electric motors, computerized controlof processes, and the widespread conversion from shaft power to electricalpower) have resulted in a large and ever-increasing demand for electricity.A brief history of key technological advances of boilers and combustionsystems is presented followed by discussions of steam fundamentals andhow they apply to boiler development, chemistry of coal combustion, thetypes of combustion systems, and the influence of coal properties on utilityboiler design, with an emphasis on coal ash properties.
Brief History of Boilers and Coal Combustion SystemsHarnessing steam power has been credited as being probably the most impor-tant technological advance to have contributed to the rise of industrialnations. Steam power was key to the Industrial Revolution and even today,after more than 100 years of development, boilers continue to dominate asa power source [4]. The first recorded use of a steam boiler dates back to 200B.C. when Hero of Alexandria, a Greek mathematician and scientist, is cred-ited with inventing a steam machine [5]. Hero’s steam machine, shown in anartist’s rendition in Figure 5-1, is simply a cauldron with a lid and a pipe forpassing steam from the cauldron to a ball on a pivot. As steam exits the ballfrom outlet pipes, the ball spins [5]. This concept for using steam power isnot practical, as it has an overall efficiency (i.e., conversion of heat in the fuelto power output taking into account heat losses, friction, and steam leakingfrom joints) as low as 1% as demonstrated from working reconstructions [5];however, it does demonstrate early recognition of steam as a power source.Unfortunately, Hero considered his invention a toy, and the failure of theGreeks and Romans to harness steam as a power source was without doubtone of the factors that prevented industrialization of their societies.
There is no record of practical steam application until the seventeenthcentury in England [6]. At this time, England required considerable fuel forspace heating and cooking, industrial and military growth demanded greateramounts of fuel, and the forests were being rapidly depleted. It became nec-essary to find another source of energy, and coal mining expanded greatly.As large-scale coal mining developed, mines became deeper and often wereflooded with water. England was desperately in need of a means to removethe water from the mines and, consequently, the first large-scale use of steamwas made by mining engineers for steam-driven pumps. The first commer-cially successful steam engine was invented by Thomas Savery in 1698 andwas developed for direct displacement of water [6]. This engine, however,was only moderately successful, as the height of water (i.e., head pressure)that could be pumped was limited by the pressure that the boiler and vesselscould withstand.

Technologies for Coal Utilization 197
Bung
Stand
FIGURE 5-1. Hero’s steam machine. (From Landels, J. G., Engineering in the AncientWorld, University of California Press, Berkeley, 1978. With permission.)
In 1711, Thomas Newcomen overcame Savery’s limitations by invent-ing a steam-driven pump using a piston and cylinder system and incorporat-ing Denis Papin’s 1690 invention of the safety valve. Papin invented a steamdigester for culinary purposes using a boiler under pressure and invented thevalve to avoid an explosion. Boiler-related accidents began to take a terribletoll on lives and equipment as boiler capacity was not keeping up with thedemand for power. Papin is also credited with inventing a boiler with aninternal firebox, the earliest record of such construction.
In the 1700s, developers of the steam engine noted that nearly half ofthe heat from the fire was lost because of short contact time between the hotgases and the boiler-heating surface. This concern for fuel efficiency led tothe development of a boiler separate from the steam engine. In an effort toovercome the poor efficiency, John Allen developed, in 1730, an internal fur-nace with a flue winding through the water like a coil in a still and introducedthe concept of forced draft by using bellows to force the gases through theflue [6]. During the latter half of the eighteenth century, James Watt mademany significant improvements to the early steam engine and, along withMatthew Boulton, introduced the first boiler. In 1785, Watt took out a num-ber of patents for variations in furnace construction. Richard Trevithickrealized that the major problem of early steam systems was the manufactureof the boiler. Around 1800, Trevithick built a 650-psig (pounds per square

198 Coal Energy Systems
Flue gas outlet
Steamoutlet
Water level Fire tubes
GrateBoiler shell
FIGURE 5-2. Typical firetube boiler design. (Source: Anon., Boilers and AuxiliaryEquipment, Power, Special Edition, June 1988.)
inch gauge) engine with a high-pressure boiler [6]. The boiler was constructedof cast iron instead of copper, which was the material used up to this time,and the use of cast iron allowed for operation of the high-pressure steamengine.
Early boiler designs consisted of a simple shell for the boiler, with afeed pipe and steam outlet mounted on a brick setting. Fuel was burned ona grate within the setting and the heat released was directed over the lowersurface before most of it went out the flue. Heating a single large vessel ofwater is inefficient, so it is necessary to bring more water into close contactwith the heat. One way to do this is to direct the hot combustion productsthrough tubes within the boiler shell, which increases the heating surfaceand helps distribute steam formation more uniformly through the water.This approach, with multiple flue pipes submersed in the water (i.e., fire-tube boiler), was in widespread use up to about 1870. The firetube boileris shown schematically in Figure 5-2. Firetube boilers, however, are lim-ited in capacity and pressure and could not fulfill the requirements, whichdeveloped later, for higher pressures and larger unit sizes. The developmentof watertube boiler designs for steam generation, shown schematically inFigure 5-3, allowed for larger units and higher pressures. Watertube designsfeature one or more relatively small drums with multiple tubes in which asteam/water mixture circulates. Heat flows from outside the tubes to themixture. This subdivision of pressure parts makes large capacities and highpressures possible.
The development of the watertube boiler began in 1766 when a patentwas granted to William Blakely that included a form of watertube design forthe steam generator [6]. The first successful user of the watertube boiler wasJames Rumsey, who patented several forms of watertube designs in 1788.This was followed by a watertube boiler invention by John Stevens (1805),
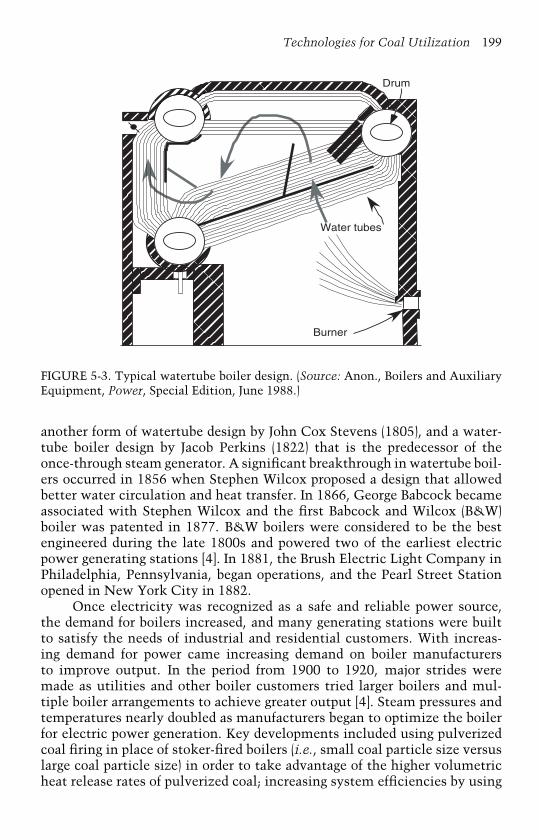
Technologies for Coal Utilization 199
Water tubes
Burner
Drum
FIGURE 5-3. Typical watertube boiler design. (Source: Anon., Boilers and AuxiliaryEquipment, Power, Special Edition, June 1988.)
another form of watertube design by John Cox Stevens (1805), and a water-tube boiler design by Jacob Perkins (1822) that is the predecessor of theonce-through steam generator. A significant breakthrough in watertube boil-ers occurred in 1856 when Stephen Wilcox proposed a design that allowedbetter water circulation and heat transfer. In 1866, George Babcock becameassociated with Stephen Wilcox and the first Babcock and Wilcox (B&W)boiler was patented in 1877. B&W boilers were considered to be the bestengineered during the late 1800s and powered two of the earliest electricpower generating stations [4]. In 1881, the Brush Electric Light Company inPhiladelphia, Pennsylvania, began operations, and the Pearl Street Stationopened in New York City in 1882.
Once electricity was recognized as a safe and reliable power source,the demand for boilers increased, and many generating stations were builtto satisfy the needs of industrial and residential customers. With increas-ing demand for power came increasing demand on boiler manufacturersto improve output. In the period from 1900 to 1920, major strides weremade as utilities and other boiler customers tried larger boilers and mul-tiple boiler arrangements to achieve greater output [4]. Steam pressures andtemperatures nearly doubled as manufacturers began to optimize the boilerfor electric power generation. Key developments included using pulverizedcoal firing in place of stoker-fired boilers (i.e., small coal particle size versuslarge coal particle size) in order to take advantage of the higher volumetricheat release rates of pulverized coal; increasing system efficiencies by using
200 Coal Energy Systems
superheaters (heat-exchange surface to increase the steam temperature—seebelow), economizers (heat exchange surface to preheat the boiler feedwater),and combustion air preheaters (heat-exchange surface to preheat the com-bustion air); and improving materials of construction, allowing for steamgenerators to achieve steam pressures in excess of 1200 psig [4]. The rela-tionship between system energy flows, superheated steam, and higher steamtemperatures and pressures is illustrated later in this chapter.
The incorporation of superheaters into boiler designs resulted in greatstrides in the quest to improve steam pressures and temperatures in boilersystems in the United States. Much credit for incorporating superheatersis due to Earnest Foster, who founded the Power Specialty Company alongwith Pell Foster, and convinced boiler owners to install superheaters afterhe visited Europe and found that the United States was several yearsbehind Europe in adopting superheated steam for power generation. Thedevelopment of superheaters, reheaters, economizers, and air preheatersplayed a significant role in improving overall system efficiency because theyutilized as much of the heat generated from burning the coal as possible.The separation of the steam from the water and the use of superheatersand reheaters allowed for higher boiler pressures and larger capacities.The implementation of pulverized coal firing over stoker firing, whichbecame widespread by the mid-1920s, produced increased boiler capacityand improved combustion and boiler efficiencies over stoker-fired boilers,which were commonplace up until that time.
Two well-known companies also got their start in the early 1900s:Combustion Engineering, now known as Alstom Power, and Riley Stoker,Inc., now known as DB Riley, Inc. [4]. These companies led the technicaldevelopment of fuel handling and the use of pulverized coal in the UnitedStates. Combustion Engineering was initially known for its stoker designs,including one for burning anthracite screenings and one for bituminous coal,but later expanded into a complete line of stokers. Similarly, Riley Stoker,known for producing large, multiple-retort underfeed stokers, expanded intoa complete line of stokers for boilers of all sizes. Because of limitations placedon boiler capacity by the size restriction of stokers, Combustion Engineer-ing developed coal pulverizing. This was a major technological improvementin steam generation. Traveling grate stokers had met their technical limitsof steam generation at ∼200,000 lb/hr, but by 1929 Combustion Engineer-ing had erected the first steam generator unit to produce steam at onemillion lb/hr (using pulverized coal-firing) at New York Edison’s East RiverStation [4].
In 1946, B&W introduced the cyclone furnace for use with slaggingcoals (i.e., coals that contain inorganic constituents that will form a liquidash at temperatures of ∼2600◦F or lower), which was the most significantadvance in coal firing since the introduction of pulverized coal firing [6].Cyclone furnaces provide the benefits obtained with pulverized coal firingbut have the advantages of utilizing slagging coals, reducing costs due to
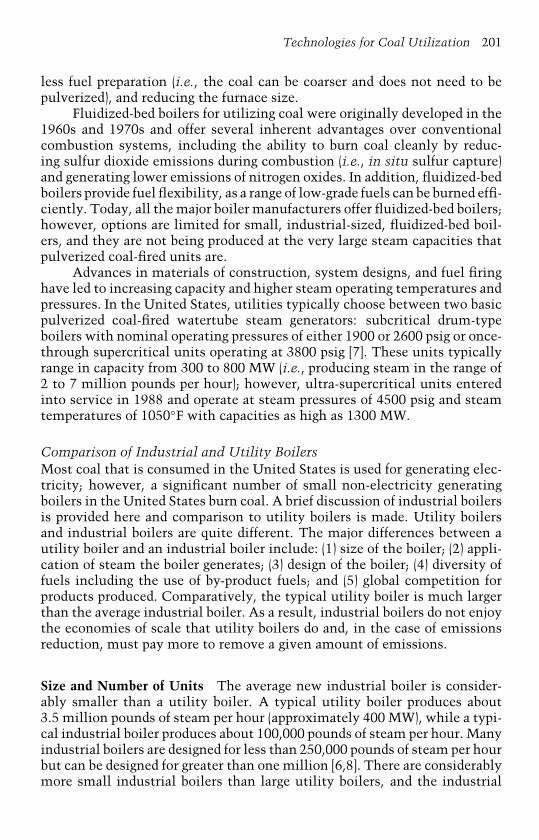
Technologies for Coal Utilization 201
less fuel preparation (i.e., the coal can be coarser and does not need to bepulverized), and reducing the furnace size.
Fluidized-bed boilers for utilizing coal were originally developed in the1960s and 1970s and offer several inherent advantages over conventionalcombustion systems, including the ability to burn coal cleanly by reduc-ing sulfur dioxide emissions during combustion (i.e., in situ sulfur capture)and generating lower emissions of nitrogen oxides. In addition, fluidized-bedboilers provide fuel flexibility, as a range of low-grade fuels can be burned effi-ciently. Today, all the major boiler manufacturers offer fluidized-bed boilers;however, options are limited for small, industrial-sized, fluidized-bed boil-ers, and they are not being produced at the very large steam capacities thatpulverized coal-fired units are.
Advances in materials of construction, system designs, and fuel firinghave led to increasing capacity and higher steam operating temperatures andpressures. In the United States, utilities typically choose between two basicpulverized coal-fired watertube steam generators: subcritical drum-typeboilers with nominal operating pressures of either 1900 or 2600 psig or once-through supercritical units operating at 3800 psig [7]. These units typicallyrange in capacity from 300 to 800 MW (i.e., producing steam in the range of2 to 7 million pounds per hour); however, ultra-supercritical units enteredinto service in 1988 and operate at steam pressures of 4500 psig and steamtemperatures of 1050◦F with capacities as high as 1300 MW.
Comparison of Industrial and Utility BoilersMost coal that is consumed in the United States is used for generating elec-tricity; however, a significant number of small non-electricity generatingboilers in the United States burn coal. A brief discussion of industrial boilersis provided here and comparison to utility boilers is made. Utility boilersand industrial boilers are quite different. The major differences between autility boiler and an industrial boiler include: (1) size of the boiler; (2) appli-cation of steam the boiler generates; (3) design of the boiler; (4) diversity offuels including the use of by-product fuels; and (5) global competition forproducts produced. Comparatively, the typical utility boiler is much largerthan the average industrial boiler. As a result, industrial boilers do not enjoythe economies of scale that utility boilers do and, in the case of emissionsreduction, must pay more to remove a given amount of emissions.
Size and Number of Units The average new industrial boiler is consider-ably smaller than a utility boiler. A typical utility boiler produces about3.5 million pounds of steam per hour (approximately 400 MW), while a typi-cal industrial boiler produces about 100,000 pounds of steam per hour. Manyindustrial boilers are designed for less than 250,000 pounds of steam per hourbut can be designed for greater than one million [6,8]. There are considerablymore small industrial boilers than large utility boilers, and the industrial

202 Coal Energy Systems
TABLE 5-1Distribution of Utility Boilers by Conventional Coal Combustion Technologies
Combustion Technology Number of Boilers Capacity (Megawatts equivalent)
Pulverized coal boilers 1068 294,035Stokers 94 1077Cyclones 89 25,727Total 1251 320,839
boilers are tailored to meet the needs and constraints of widely varying indus-trial processes. The Council of Industrial Boiler Owners (CIBO) reports thatthe industrial boiler and process heater population (total and not just coal-fired units) consists of 42,000 and 15,000 units, respectively, ranging in sizefrom 10,000 to 1,400,000 pounds of steam per hour with an average unitsize of 100,000 pounds of steam per hour [9]. In comparison, there are about4000 utility units, of which about 1250 boilers utilize conventional coalcombustion technology (see Table 5-1), with an additional 67 utility-scalefluidized-bed boilers [10]. This is further illustrated in Figure 5-4, whichshows the distribution of coal-fired boilers by capacity for conventional util-ity, conventional non-utility, fluidized-bed combustion (FBC) utility, andFBC non-utility boilers [10]. The Environmental Protection Agency (EPA)defines a non-utility boiler as a boiler whose primary product is not electric-ity but steam. Some of the non-utility boilers (both conventional and FBC)are cogeneration units in that they produce both steam and electricity.
1145
276
813
36
80
22
10 31 2
120
Conventional Non-UtilityConventional Utility
FBC Non-Utility
1200
1000
800
600
400
200
0
120
100
80
60
40
20
0
FBC Utility
>0−10 >10−50 >50−100 >100−250 >250−500 >500−1000 >1000
19
35
1 0 0 0 0 0 0 0
166 152
332
180249
Num
ber
of C
onve
ntio
nal B
oile
rs
Num
ber
of F
BC
Uni
ts
FIGURE 5-4. Distribution of coal-fired boilers by capacity (in MW). (Adapted fromEPA [10].)
Technologies for Coal Utilization 203
Application of Steam Industrial boilers are utilized in many different indus-tries for a wide variety of purposes and the main product is process steam.Industrial boiler operation can vary significantly between seasons, daily, andeven hourly depending on the steam demand. A utility boiler, however,generates steam for the sole purpose of powering turbines to produce elec-tricity. A typical utility boiler (i.e., a base-loaded unit) operates at a steadyrate close to maximum capacity because of a constant demand for steam.Load swings from utility boilers that operate to meet utility load swingsduring the day or for seasonal peak demands (i.e., peaking units) are morecontrolled than industrial boilers because they can balance their load overthe complete electric production and distribution grid; consequently, utilityboilers tend to have lower operating costs than industrial boilers that are sim-ilarly equipped. Utility units generally have a variety of backup alternativesfor unscheduled outages. Industry, however, rarely has a backup system forsteam generation because of the need to keep costs for steam production aslow as possible; hence, industrial boilers routinely operate with reliabilityfactors of around 98%.
Boiler Design Utility boilers are primarily field-erected units designed forhigh pressure and high temperature steam. Boiler designs, capacities, steampressures, and temperatures, among other parameters, vary with the fueland service conditions. An expanded discussion of the effect of coal type andcharacteristics on utility boiler design is provided later in this chapter. Aspreviously mentioned, there are primarily two basic watertube boiler designsthat are selected by utilities in the United States [7]: (1) subcritical drum-typeboilers designed for a nominal operating pressure of 1900 or 2600 psig steam,or (2) once-through supercritical units designed for 3800 psig steam. Thereare many design criteria for steam generators and their auxiliary components,but the important issues are efficiency, reliability/availability, and cost.While some stoker and cyclone boilers are in operation, newer designs areprimarily pulverized coal and fluidized-bed units. Industrial boilers and theirincorporated combustion systems exhibit much variability in their designsand construction including low- and high-pressure steam production, vari-ability in sizes, shop-assembled packaged boilers or field-erected units, andthe capability of burning a wide variety of fuels. Industrial boilers consist ofpackaged and field-erected units of various boiler types: watertube, firetube,stokers, fluidized-bed, pulverized-coal, and cyclone units. Packaged unitsare available in capacities up to about 600,000 pounds of steam per hour,but boilers larger than 250,000 pounds of steam per hour typically cannotbe shipped by rail, although they can be shipped by barge or ocean vessels[6]. The industrial boiler industry is influenced by several factors [7]: (1) theuser’s desire for fuel flexibility over the life of the unit; (2) the demandsfor ever-increasing emissions restrictions; (3) significant interest in burninglow-quality fuels; (4) wider application of cogeneration; (5) the desire to opti-mize existing equipment in terms of efficiency, performance, and service
204 Coal Energy Systems
life; and (6) the recognition that turndown (i.e., ability to operate efficientlyat reduced steam output/fuel firing rate) is as important over the boiler’slifetime as is maximum continuous rating.
Fuel Diversity and Global Product Competition Fuel diversity and globalproduct competition are primarily of interest to the industrial sector; there-fore, they are not discussed in detail here. While electricity is being soldthroughout the United States as a result of deregulation in many states,electricity is not a global product (excluding any power sales to Mexicoor Canada), whereas many industrial products must compete with inter-national markets. Fuel diversity does affect utilities but not to the extentit does industrial boilers. Coal is the lowest price energy feedstock avail-able and is used extensively in the power generation industry. Some fuelsare cofired with coal, such as petroleum coke, tires, and biomass materials;however, utility boilers firing coal tend to utilize only coal. This may changein the future if legislation is passed requiring power generators to produce apercentage of their electricity from renewable energy. Industrial boiler users,on the other hand, are interested in using a wider variety of fuels as they expe-rience more volatility in fuel availability and prices. Examples of industrialboiler fuels (not inclusive) include waste coals such as bituminous gob andanthracite culm, wood refuse, bagasse, digester (black) liquor, blast-furnacegas, petroleum coke, refining gas, carbon monoxide waste gas, peanut shells,palm fronds, rice husks, animal fats and proteins, and animal manure andlitter [6,9,11–13]. Further discussion of utilizing biomass in utility boilers isprovided in Chapter 8 (Coal’s Role in Providing U.S. Energy Security) as partof a discussion on the role of coal in providing national security by protectingthe U.S. food supply.
Basic Steam Fundamentals and Their Applicationto Boiler DevelopmentFigures 5-5 through 5-7 are used to explain the concept of superheated steamand how it results in achieving higher temperatures and pressures. Figure 5-5shows the general arrangement of a present-day watertube boiler, includingthe location of the superheaters, reheater, economizer, and air preheater. Thesteam generator energy flow depicted in Figure 5-6 shows how the variousheat exchange surfaces are integrated with each other and the steam tur-bine. Figure 5-7 illustrates the relationships among temperature, pressure,and enthalpy (i.e., heat content) of saturated and superheated steam. Heatingwater at any given pressure eventually will cause it to boil, and steam willbe released. The heat required to bring the water from 32◦F to the boilingpoint is the enthalpy, or heat content, of the liquid (measured in Btu/lb).When water boils, both it and the steam are at the same temperature, whichis called the saturation temperature. For each boiling pressure, there is only
Technologies for Coal Utilization 205
Waterwall Tubes
Downcomer
Windbox
Secondary Superheater
Furnace
Reheater
Primary Superheater
Air Preheater
Dust Collector/ ID Fan Inlet
FD Fan
Drum
Economizer
FIGURE 5-5. General arrangement of a watertube steam generator. (From Elliot, T. C.,Ed., Standard Handbook of Powerplant Engineering, McGraw-Hill, New York, 1989.With permission.)
one saturation temperature and vice versa. During the boiling process, tem-perature remains constant as more heat is added, which is being used tochange the water from the liquid to the vapor state. This heat is the enthalpyof evaporation and when added to the enthalpy of the saturated liquid givesthe enthalpy of the saturated steam, which is the total amount of heat addedto bring 32◦F water up to 100% steam [7]. The temperature of the steamand water will remain the same as long as the two are in contact. To raisethe temperature of the steam, it must be heated out of contact with water
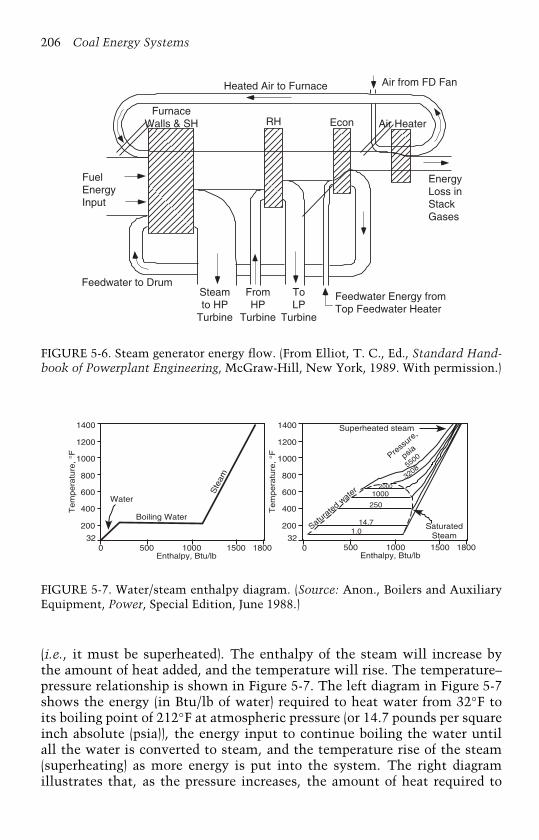
206 Coal Energy Systems
Heated Air to Furnace Air from FD Fan
Air HeaterEconRHFurnace
Walls & SH
FuelEnergyInput
EnergyLoss inStackGases
Feedwater to DrumSteamto HP
Turbine
FromHP
Turbine
ToLP
Turbine
Feedwater Energy from Top Feedwater Heater
FIGURE 5-6. Steam generator energy flow. (From Elliot, T. C., Ed., Standard Hand-book of Powerplant Engineering, McGraw-Hill, New York, 1989. With permission.)
1400
1200
1000
800
600
400
200
32
1400
1200
1000
800
600
400
200
320 500 1000 1500 1800
Enthalpy, Btu/lb500 1000 1500 1800
Enthalpy, Btu/lb0
Water
Boiling Water
Superheated steam
Saturated Steam
20001000
250
14.71.0
Te
mp
era
ture
, °F
Te
mp
era
ture
, °F
Ste
am
Saturated w
ater
Press
ure,
psia
5500
3208
FIGURE 5-7. Water/steam enthalpy diagram. (Source: Anon., Boilers and AuxiliaryEquipment, Power, Special Edition, June 1988.)
(i.e., it must be superheated). The enthalpy of the steam will increase bythe amount of heat added, and the temperature will rise. The temperature–pressure relationship is shown in Figure 5-7. The left diagram in Figure 5-7shows the energy (in Btu/lb of water) required to heat water from 32◦F toits boiling point of 212◦F at atmospheric pressure (or 14.7 pounds per squareinch absolute (psia)), the energy input to continue boiling the water untilall the water is converted to steam, and the temperature rise of the steam(superheating) as more energy is put into the system. The right diagramillustrates that, as the pressure increases, the amount of heat required to
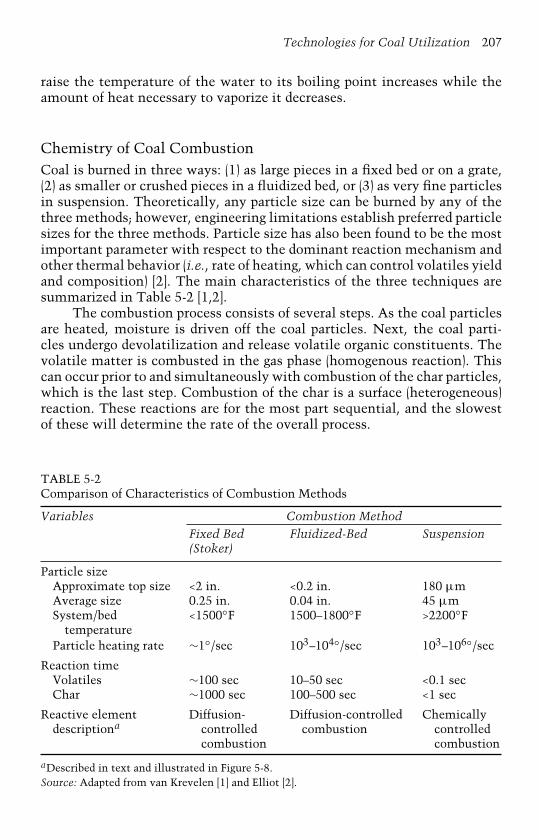
Technologies for Coal Utilization 207
raise the temperature of the water to its boiling point increases while theamount of heat necessary to vaporize it decreases.
Chemistry of Coal CombustionCoal is burned in three ways: (1) as large pieces in a fixed bed or on a grate,(2) as smaller or crushed pieces in a fluidized bed, or (3) as very fine particlesin suspension. Theoretically, any particle size can be burned by any of thethree methods; however, engineering limitations establish preferred particlesizes for the three methods. Particle size has also been found to be the mostimportant parameter with respect to the dominant reaction mechanism andother thermal behavior (i.e., rate of heating, which can control volatiles yieldand composition) [2]. The main characteristics of the three techniques aresummarized in Table 5-2 [1,2].
The combustion process consists of several steps. As the coal particlesare heated, moisture is driven off the coal particles. Next, the coal parti-cles undergo devolatilization and release volatile organic constituents. Thevolatile matter is combusted in the gas phase (homogenous reaction). Thiscan occur prior to and simultaneously with combustion of the char particles,which is the last step. Combustion of the char is a surface (heterogeneous)reaction. These reactions are for the most part sequential, and the slowestof these will determine the rate of the overall process.
TABLE 5-2Comparison of Characteristics of Combustion Methods
Variables Combustion MethodFixed Bed Fluidized-Bed Suspension(Stoker)
Particle sizeApproximate top size <2 in. <0.2 in. 180 µmAverage size 0.25 in. 0.04 in. 45 µmSystem/bed
temperature<1500◦F 1500–1800◦F >2200◦F
Particle heating rate ∼1◦/sec 103–104◦/sec 103–106◦/sec
Reaction timeVolatiles ∼100 sec 10–50 sec <0.1 secChar ∼1000 sec 100–500 sec <1 sec
Reactive elementdescriptiona
Diffusion-controlledcombustion
Diffusion-controlledcombustion
Chemicallycontrolledcombustion
aDescribed in text and illustrated in Figure 5-8.Source: Adapted from van Krevelen [1] and Elliot [2].
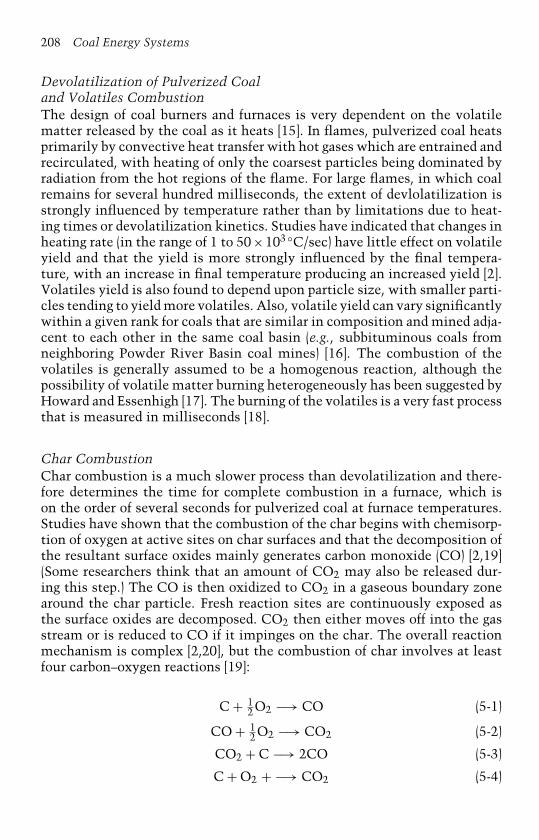
208 Coal Energy Systems
Devolatilization of Pulverized Coaland Volatiles CombustionThe design of coal burners and furnaces is very dependent on the volatilematter released by the coal as it heats [15]. In flames, pulverized coal heatsprimarily by convective heat transfer with hot gases which are entrained andrecirculated, with heating of only the coarsest particles being dominated byradiation from the hot regions of the flame. For large flames, in which coalremains for several hundred milliseconds, the extent of devlolatilization isstrongly influenced by temperature rather than by limitations due to heat-ing times or devolatilization kinetics. Studies have indicated that changes inheating rate (in the range of 1 to 50×103 ◦C/sec) have little effect on volatileyield and that the yield is more strongly influenced by the final tempera-ture, with an increase in final temperature producing an increased yield [2].Volatiles yield is also found to depend upon particle size, with smaller parti-cles tending to yield more volatiles. Also, volatile yield can vary significantlywithin a given rank for coals that are similar in composition and mined adja-cent to each other in the same coal basin (e.g., subbituminous coals fromneighboring Powder River Basin coal mines) [16]. The combustion of thevolatiles is generally assumed to be a homogenous reaction, although thepossibility of volatile matter burning heterogeneously has been suggested byHoward and Essenhigh [17]. The burning of the volatiles is a very fast processthat is measured in milliseconds [18].
Char CombustionChar combustion is a much slower process than devolatilization and there-fore determines the time for complete combustion in a furnace, which ison the order of several seconds for pulverized coal at furnace temperatures.Studies have shown that the combustion of the char begins with chemisorp-tion of oxygen at active sites on char surfaces and that the decomposition ofthe resultant surface oxides mainly generates carbon monoxide (CO) [2,19](Some researchers think that an amount of CO2 may also be released dur-ing this step.) The CO is then oxidized to CO2 in a gaseous boundary zonearound the char particle. Fresh reaction sites are continuously exposed asthe surface oxides are decomposed. CO2 then either moves off into the gasstream or is reduced to CO if it impinges on the char. The overall reactionmechanism is complex [2,20], but the combustion of char involves at leastfour carbon–oxygen reactions [19]:
C + 12O2 −→ CO (5-1)
CO + 12O2 −→ CO2 (5-2)
CO2 + C −→ 2CO (5-3)
C + O2 + −→ CO2 (5-4)
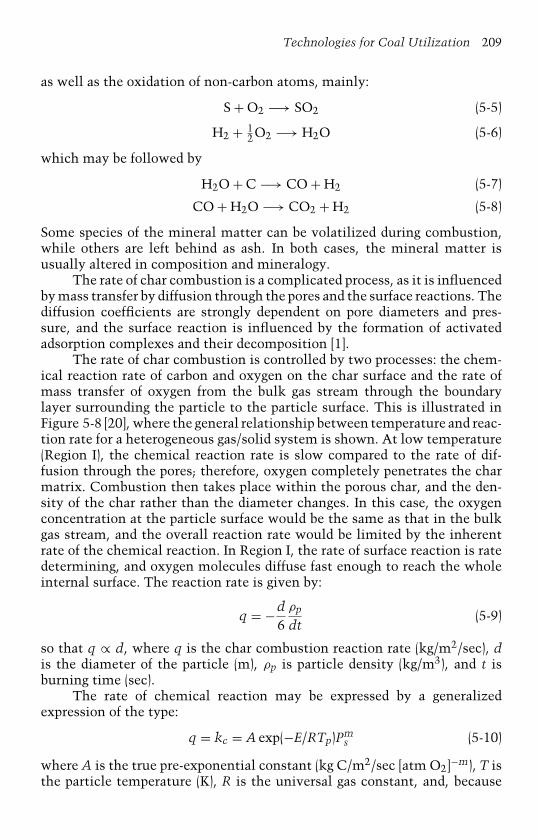
Technologies for Coal Utilization 209
as well as the oxidation of non-carbon atoms, mainly:
S + O2 −→ SO2 (5-5)
H2 + 12O2 −→ H2O (5-6)
which may be followed by
H2O + C −→ CO + H2 (5-7)
CO + H2O −→ CO2 + H2 (5-8)
Some species of the mineral matter can be volatilized during combustion,while others are left behind as ash. In both cases, the mineral matter isusually altered in composition and mineralogy.
The rate of char combustion is a complicated process, as it is influencedby mass transfer by diffusion through the pores and the surface reactions. Thediffusion coefficients are strongly dependent on pore diameters and pres-sure, and the surface reaction is influenced by the formation of activatedadsorption complexes and their decomposition [1].
The rate of char combustion is controlled by two processes: the chem-ical reaction rate of carbon and oxygen on the char surface and the rate ofmass transfer of oxygen from the bulk gas stream through the boundarylayer surrounding the particle to the particle surface. This is illustrated inFigure 5-8 [20], where the general relationship between temperature and reac-tion rate for a heterogeneous gas/solid system is shown. At low temperature(Region I), the chemical reaction rate is slow compared to the rate of dif-fusion through the pores; therefore, oxygen completely penetrates the charmatrix. Combustion then takes place within the porous char, and the den-sity of the char rather than the diameter changes. In this case, the oxygenconcentration at the particle surface would be the same as that in the bulkgas stream, and the overall reaction rate would be limited by the inherentrate of the chemical reaction. In Region I, the rate of surface reaction is ratedetermining, and oxygen molecules diffuse fast enough to reach the wholeinternal surface. The reaction rate is given by:
q = −d6
ρp
dt(5-9)
so that q ∝ d, where q is the char combustion reaction rate (kg/m2/sec), dis the diameter of the particle (m), ρp is particle density (kg/m3), and t isburning time (sec).
The rate of chemical reaction may be expressed by a generalizedexpression of the type:
q = kc = A exp(−E/RTp)Pms (5-10)
where A is the true pre-exponential constant (kg C/m2/sec [atm O2]−m), T isthe particle temperature (K), R is the universal gas constant, and, because
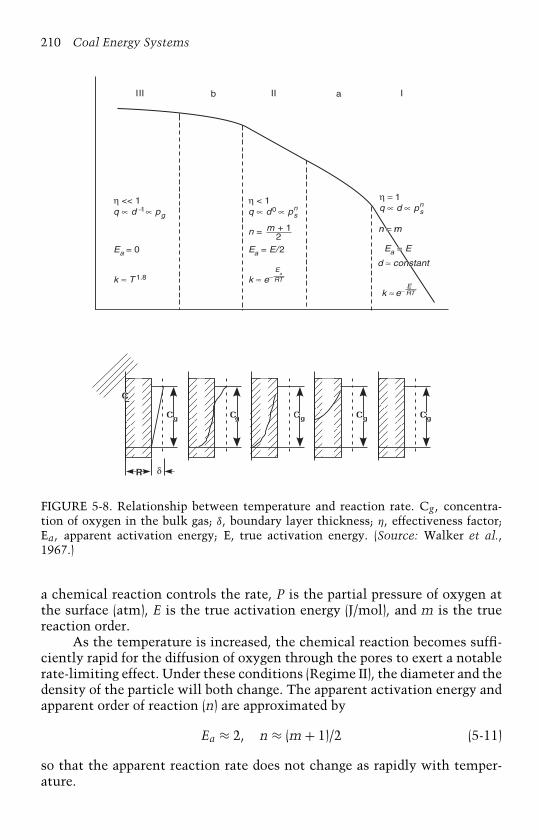
210 Coal Energy Systems
III II Ib a
η << 1q ∝ d −1∝ pg
Ea = 0
k ≈
δ
k ≈T 1.8
η η = 1q ∝ d ∝
< 1q ∝ d0 ∝ ps
n =
Ea = E/2
k ≈ e−
n
m + 12
Ea
RT
e−ERT
pn
n = mn = mn = mn = m
Ea = EEa = E=
d ≈ constantd ≈ constant
Ea E
s
FIGURE 5-8. Relationship between temperature and reaction rate. Cg, concentra-tion of oxygen in the bulk gas; δ, boundary layer thickness; η, effectiveness factor;Ea, apparent activation energy; E, true activation energy. (Source: Walker et al.,1967.)
a chemical reaction controls the rate, P is the partial pressure of oxygen atthe surface (atm), E is the true activation energy (J/mol), and m is the truereaction order.
As the temperature is increased, the chemical reaction becomes suffi-ciently rapid for the diffusion of oxygen through the pores to exert a notablerate-limiting effect. Under these conditions (Regime II), the diameter and thedensity of the particle will both change. The apparent activation energy andapparent order of reaction (n) are approximated by
Ea ≈ 2, n ≈ (m + 1)/2 (5-11)
so that the apparent reaction rate does not change as rapidly with temper-ature.
Technologies for Coal Utilization 211
A further increase in temperature eventually causes the chemical reac-tions to become so rapid that the oxygen is consumed as it reaches the outersurface of the particle. In this case (Regime III), the reaction is entirely con-trolled by the diffusion from the free stream to the particle, and only thediameter of the particle changes.
Field et al. [18] give an expression for the overall reaction rate coefficientk as:
k = 11/kd + 1/kc
(5-12)
where kd is the diffusional rate coefficient, and kc is the chemical ratecoefficient defined in Equation (5-2); the diffusional rate coefficient can bedefined as:
kd = 24φDdRTm
(5-13)
where φ is a mechanism factor that takes the value of 1 for reaction to CO2and 2 for reaction to CO; D is the diffusion coefficient (cm2/sec) of oxygenthrough the boundary layer at temperature Tm given by:
D = 3. 49x(
Tm
1600
)1.75
(5-14)
where x is the particle diameter (cm); R is the universal gas constant; andTm is the mean temperature (K) for the boundary layer taken as the averageof the surface temperature of the particle and the bulk gas temperature.
For the char sizes, porosities, internal surface areas, and temperaturestypical to pulverized coal-fired furnaces, the char combustion rate is influ-enced by the chemical reactivity of the char, the external diffusion rate ofoxygen from the bulk stream, and the internal diffusion of oxygen into theporous char matrix. Char ignition is likely to occur in Regime I or II whena large proportion of the internal surface is available for reaction. The finalburn out is likely to occur in Regimes II and III, when external diffusion mayhave a significant influence on the combustion rate of large particles. Thetime for the char to burn out is proportional to the square of the initial sizeof the char particles from the coarse end of the grind [15].
The processes controlling the rate of char combustion in fluidized-bed systems differ slightly from those for pulverized coal-fired systems. Influidized-bed combustion, particle sizes are larger, the processes by whichoxygen is brought to the coal surface differ because of the presence of thesurrounding bed particles, and the heat-transfer processes also differ fromthose in a pulverized coal-fired furnace [15].
All three regimes illustrated in Figure 5-8 are important in fluidized-bed combustion: Regime I, during ignition and for the smaller particles

212 Coal Energy Systems
burning in the bed and freeboard; Regime II, for medium-sized particles;and Regime III, for large particles in the bed. The surface reaction rate, q(mass of carbon oxidized per unit area of particle outer surface per second),for the region separating Regimes II and III, which are of special interest incoal combustion, is defined as:
q = Pg(1/kd + 1/kc
) = kPg (5-15)
where Pg is the oxygen partial pressure in the gas outside of the boundarylayer (kN/m2). The mass transfer coefficient for the oxygen diffusion to theparticles is:
hm = ShDd
(5-16)
where hm is the mass flux of oxygen per unit area of surface per unit of con-centration difference between that at the surface and that in the gas outsidethe boundary layer (m/sec), Sh is the Sherwood number (dimensionless), andD is the diffusion coefficient of oxygen through the gas mixture surroundingthe particle (m2/sec) [15].
Equation (5-15) can be used to derive the combustion rate q, in unitsof mass of carbon oxidized per unit time per unit area of particle outersurface:
q = kd(Pg − Ps
) + 12φShDdRTm
(Pg − Ps
)(5-17)
where D is evaluated at a mean temperature Tm (K) in the diffusion layer,Ps is the oxygen partial pressure at the particle surface (kN/m2), and theuniversal gas constant R has the units 8.31 J/mol K.
The chemical kinetic rate coefficient, kc, is expressed by an Arrhenius-type equation:
kc = Aa exp(−Ea/RTp
)(5-18)
where Aa is the apparent rate constant based on particle outer surface area(kg/m2s per kN/m2 of partial pressure of oxygen), and Ea is the apparentactivation energy for Regime II combustion (kJ kg/mol).
Coal Combustion SystemsThe manner in which coal is burned and the devices in which it is burned areprimarily determined by the desired unit size or capacity (i.e., required hourlysteam production or electricity generation) and coal type and quality. Thecombustion methods, fixed-bed (i.e., stokers), fluidized-bed, and suspensionfiring are discussed.

Technologies for Coal Utilization 213
(c)
(b)
(a)
Burning fuel
AshFuel flowAir flowIgnition planeGrate
Raw fuel
FIGURE 5-9. Patterns of feeding coal and combustion air to stokers: (a) overfeed;(b) underfeed; (c) crossfeed. (From Elliot, M. A., Ed., Chemistry of Coal Utilization,Secondary Suppl. Vol., John Wiley & Sons, New York, 1981. With permission.)
Fixed-Bed CombustionFixed-bed combustion covers a wide variety of applications, includingdomestic space heaters, underground gasification, and industrial stokers.It is the latter that are of interest for steam and power generation and arediscussed here. Stokers were used to burn coal as early as the 1700s [7,14].Stokers have evolved over the years from simple design to quite sophisticateddevices to burn a variety of fuels including coal. Stokers are generally dividedinto three general groups, depending on how the fuel reaches the grate (i.e.,surface that contains the coal and allows combustion air to be introducedinto the fuel bed) of the stoker for burning: underfeed, overfeed, and spreaderdesigns. Three patterns of feeding coal and combustion air have been devel-oped and are used singly or in combination in commercial equipment [2].These patterns, illustrated in Figure 5-9, are referred to as:
• Overfeed—The fuel is fed onto the top of the bed and flows downas it is consumed while combustion air flows up through successivelayers of ash, incandescent coke, and fresh coal;
• Underfeed—The flows of coal and combustion are parallel andusually upward;
• Crossfeed—The fuel moves horizontally and the combustion airmoves upward at right angles to the fuel.
214 Coal Energy Systems
TABLE 5-3Characteristics of Various Types of Stokers
Ability of the Unit to: Spreader Overfeed Underfeed
Increase load rapidly Excellent Fair FairMinimize carbon loss Fair Fair FairOvercome coal segregation Fair Poor PoorAccept a wide variety of coals Excellent, traveling grate; Poor Poor
Fair, vibrating grateBurn extremely fine coal Poor Poor PoorPermit smokeless
combustion at all loadsPoor Good Good
Minimize fly ash dischargeto stack
Poor Good Good
Maintain steam load underpoor operating conditions
Good Poor Poor
Minimize maintenance Good Good FairMinimize power
consumption (stoker andboiler auxiliaries)
Good Good Good
Handle ash and cinders easily Excellent Good Fair
Source: Power from Coal: Special Report, Power, February 1974. With permission.
Unfortunately, because there are many examples of commercial equip-ment with more than one pattern of combustion air and fuel feed, disagree-ment is sometimes found in the literature over which type predominates ina given stoker application, which also leads to differences in system clas-sification. For our discussion here, underfeed stokers include single- andmultiple-retort stokers; overfeed stokers include chain grate, traveling grate,and water-cooled vibrating grate stokers; and spreader stokers are classi-fied into several groups, depending on the type of grate selected: stationary,dumping, reciprocating, vibrating, traveling, or water-cooled vibrating grate.Some characteristics of the stokers and their fuel requirements and capaci-ties are given in Tables 5-3 through 5-5. Figure 5-10 illustrates the workingprinciples of the three groups of stokers [19].
Underfeed Stokers Underfeed stokers are used primarily for burning coalin small boilers serving relatively constant steam loads of less than30,000 lb/hr [7]. Coal is introduced beneath the active fuel bed and is movedfrom a storage hopper by means of a screw or ram into a retort. As coal isfed into the retort, the force of the incoming fuel causes the coal to rise inthe retort and spill over onto the fuel bed or grate surface on either side ofthe retort. No air is supplied in the retort proper; it comes through openings,called tuyeres, in the grate section adjoining the trough. Underfeed stokers
Technologies for Coal Utilization 215
TABLE 5-4Stoker Fuel Requirements
Stoker Coal Types Coal Sizes
Underfeed Bituminous coals oranthracite
Nut (2 × 3/4 in.) or prepared stoker(large—2 × 1/4 in.); smaller sizesacceptable if <50% − 1/4 in.
Overfeed All coal ranks Nut (2 × 3/4 in.) or prepared stoker (largeor intermediate—2 × 1/4 or 1 × 1/8in., respectively); <20% − 1/4 in.
Spreader All coal ranks Prepared stoker (small—3/4 × 1/16 in.);<30% − 1/4 in.
Source: Adapted from Berkowitz [19].
TABLE 5-5Capacities of Coal-Fired Stokers
Stoker Type Recommended Grate Steam GenerationHeat-Release Rates (1000 lb/hr)
(1000 × Btu/hr-ft2 of grate)
Underfeed stokersSingle retort (ram feed) 250–475 2–50Multiple retort 450–500 40–300Spreader stokers — <10–400
Stationary and 400–450 <50dumping grates
Reciprocating and 600–650 Reciprocating gate, up to 75;vibrating grates vibrating gate, up to 100
Traveling grate 650–750 Up to 400Overfeed stokers 400–425 10–300
Source: Adapted from Elliot [14].
are either of the single- or multiple-retort design, and water-cooled furnacesare preferred with underfeed stokers.
A relatively wide range of bituminous coals as well as anthracite canbe burned on single- or multiple-retort stokers but typical specifications callfor coal that is 3/4×1-1/4 in. with less than 50% of the fines passing througha 1/4-inch screen [14]. The free swelling index of the coal should be limitedto 5 with single-retort stokers equipped with stationary tuyeres, and up to7 on single-retort stokers with moving tuyeres as well as on multiple-retortstokers. It is normally recommended that the iron content in the ash be lessthan 20% as Fe2O3 with an ash fusion temperature above 2400◦F and below15% for coals having a lower ash fusion temperature.

Fuel
Air Ash Pan
Ash Pan
Ash Pan
Distributor Drive
Fuel Hopper
Fuel Hopper
GrateDrive
Air
Air
(a)
(b)
(c)
FIGURE 5-10. Working principles of mechanical stokers: (a) underfeed stoker;(b) overfeed stoker (traveling grate stoker); (c) spreader stoker. (From Berkowitz, N.,An Introduction to Coal Technology, Academic Press, New York, 1979. Withpermission.)
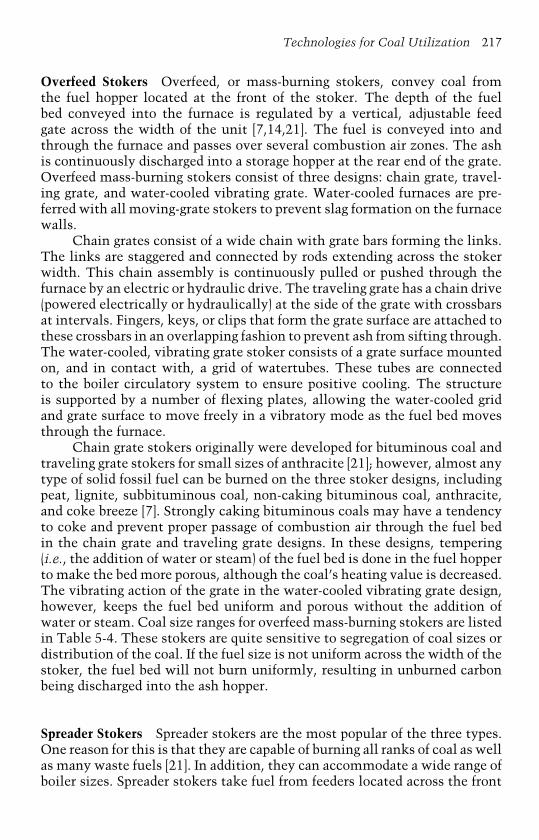
Technologies for Coal Utilization 217
Overfeed Stokers Overfeed, or mass-burning stokers, convey coal fromthe fuel hopper located at the front of the stoker. The depth of the fuelbed conveyed into the furnace is regulated by a vertical, adjustable feedgate across the width of the unit [7,14,21]. The fuel is conveyed into andthrough the furnace and passes over several combustion air zones. The ashis continuously discharged into a storage hopper at the rear end of the grate.Overfeed mass-burning stokers consist of three designs: chain grate, travel-ing grate, and water-cooled vibrating grate. Water-cooled furnaces are pre-ferred with all moving-grate stokers to prevent slag formation on the furnacewalls.
Chain grates consist of a wide chain with grate bars forming the links.The links are staggered and connected by rods extending across the stokerwidth. This chain assembly is continuously pulled or pushed through thefurnace by an electric or hydraulic drive. The traveling grate has a chain drive(powered electrically or hydraulically) at the side of the grate with crossbarsat intervals. Fingers, keys, or clips that form the grate surface are attached tothese crossbars in an overlapping fashion to prevent ash from sifting through.The water-cooled, vibrating grate stoker consists of a grate surface mountedon, and in contact with, a grid of watertubes. These tubes are connectedto the boiler circulatory system to ensure positive cooling. The structureis supported by a number of flexing plates, allowing the water-cooled gridand grate surface to move freely in a vibratory mode as the fuel bed movesthrough the furnace.
Chain grate stokers originally were developed for bituminous coal andtraveling grate stokers for small sizes of anthracite [21]; however, almost anytype of solid fossil fuel can be burned on the three stoker designs, includingpeat, lignite, subbituminous coal, non-caking bituminous coal, anthracite,and coke breeze [7]. Strongly caking bituminous coals may have a tendencyto coke and prevent proper passage of combustion air through the fuel bedin the chain grate and traveling grate designs. In these designs, tempering(i.e., the addition of water or steam) of the fuel bed is done in the fuel hopperto make the bed more porous, although the coal’s heating value is decreased.The vibrating action of the grate in the water-cooled vibrating grate design,however, keeps the fuel bed uniform and porous without the addition ofwater or steam. Coal size ranges for overfeed mass-burning stokers are listedin Table 5-4. These stokers are quite sensitive to segregation of coal sizes ordistribution of the coal. If the fuel size is not uniform across the width of thestoker, the fuel bed will not burn uniformly, resulting in unburned carbonbeing discharged into the ash hopper.
Spreader Stokers Spreader stokers are the most popular of the three types.One reason for this is that they are capable of burning all ranks of coal as wellas many waste fuels [21]. In addition, they can accommodate a wide range ofboiler sizes. Spreader stokers take fuel from feeders located across the front
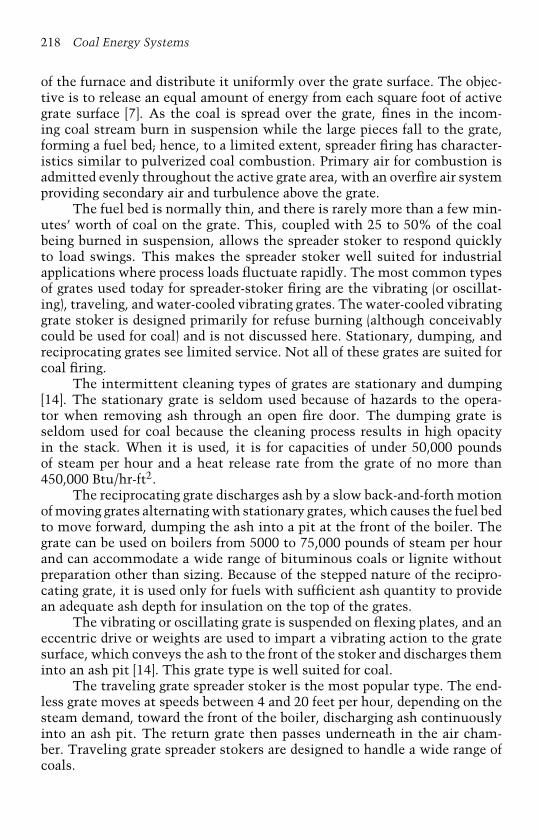
218 Coal Energy Systems
of the furnace and distribute it uniformly over the grate surface. The objec-tive is to release an equal amount of energy from each square foot of activegrate surface [7]. As the coal is spread over the grate, fines in the incom-ing coal stream burn in suspension while the large pieces fall to the grate,forming a fuel bed; hence, to a limited extent, spreader firing has character-istics similar to pulverized coal combustion. Primary air for combustion isadmitted evenly throughout the active grate area, with an overfire air systemproviding secondary air and turbulence above the grate.
The fuel bed is normally thin, and there is rarely more than a few min-utes’ worth of coal on the grate. This, coupled with 25 to 50% of the coalbeing burned in suspension, allows the spreader stoker to respond quicklyto load swings. This makes the spreader stoker well suited for industrialapplications where process loads fluctuate rapidly. The most common typesof grates used today for spreader-stoker firing are the vibrating (or oscillat-ing), traveling, and water-cooled vibrating grates. The water-cooled vibratinggrate stoker is designed primarily for refuse burning (although conceivablycould be used for coal) and is not discussed here. Stationary, dumping, andreciprocating grates see limited service. Not all of these grates are suited forcoal firing.
The intermittent cleaning types of grates are stationary and dumping[14]. The stationary grate is seldom used because of hazards to the opera-tor when removing ash through an open fire door. The dumping grate isseldom used for coal because the cleaning process results in high opacityin the stack. When it is used, it is for capacities of under 50,000 poundsof steam per hour and a heat release rate from the grate of no more than450,000 Btu/hr-ft2.
The reciprocating grate discharges ash by a slow back-and-forth motionof moving grates alternating with stationary grates, which causes the fuel bedto move forward, dumping the ash into a pit at the front of the boiler. Thegrate can be used on boilers from 5000 to 75,000 pounds of steam per hourand can accommodate a wide range of bituminous coals or lignite withoutpreparation other than sizing. Because of the stepped nature of the recipro-cating grate, it is used only for fuels with sufficient ash quantity to providean adequate ash depth for insulation on the top of the grates.
The vibrating or oscillating grate is suspended on flexing plates, and aneccentric drive or weights are used to impart a vibrating action to the gratesurface, which conveys the ash to the front of the stoker and discharges theminto an ash pit [14]. This grate type is well suited for coal.
The traveling grate spreader stoker is the most popular type. The end-less grate moves at speeds between 4 and 20 feet per hour, depending on thesteam demand, toward the front of the boiler, discharging ash continuouslyinto an ash pit. The return grate then passes underneath in the air cham-ber. Traveling grate spreader stokers are designed to handle a wide range ofcoals.

Technologies for Coal Utilization 219
Fluidized-Bed CombustionFluidized-bed combustion (FBC) is an emerging technology for the combus-tion of fossil and other fuels and is attractive because of several inherentadvantages it has over conventional combustion systems. These advantagesinclude fuel flexibility, low NOx emissions, and in situ control of SO2 emis-sions. The fluidized-bed concept was first used around 1940 in the chemicalindustry to promote catalytic reactions. In the 1950s, the pioneering work oncoal-fired fluidized-bed combustion was begun in Great Britain, particularlyby the National Coal Board and the Central Electricity Generating Board[2,22]. The U.S. Department of Interior’s Office of Coal Research, one ofthe predecessors of the current Department of Energy (DOE), began studyingthe fluidized-bed combustion concept in the early 1960s (and still contin-ues sponsoring research into advanced fluidized-bed combustion systems)because it recognized that the fluidized-bed boiler represented a potentiallylower cost, more effective, and cleaner way to burn coal [23]. Around 1990,atmospheric fluidized-bed combustion crossed the commercial thresholdand every major U.S. boiler manufacturer currently offers fluidized-bed boil-ers as a standard package. Fluidized-bed coal combustors have been calledthe “commercial success story of the last decade in the power generationbusiness” and are perhaps the most significant advance in coal-fired boilertechnology in a half century.
Fluidized-bed combustion technology is used in both the utility andnon-utility sectors and comprises approximately 1% of fossil fuel-fired capac-ity. Approximately half of the facilities using FBC technologies are utilitiesor independent power producers. Facilities in the food products and pulp andpaper industries, along with educational institutions, make up most of thenon-utility FBC facilities [10]. FBC technology accounts for a small propor-tion of capacity but the technology has increased dramatically over the last20 years [10]. In 1978, four plants in the United States had four FBC boilers;however, as of December 1996, 84 facilities had 123 FBC boilers, represent-ing 4951 MW of equivalent electrical generating capacity. Because of thefuel flexibility, efficiency, and emissions characteristics of the FBC boilers,this technology is predicted to increase in the future, and additional unitsare being installed, both commercial units and advanced concepts throughcofunded DOE programs (which are discussed in more detail in Chapter 7,Future Power Generation). Figure 5-11 shows the geographic distribution ofthe FBC facilities [10]. These facilities are distributed throughout the UnitedStates; however, Pennsylvania and California account for the largest num-bers of plants. Pennsylvania accounts for more than 20% of capacity andCalifornia more than 10%. Pennsylvania is a leader in utilizing coal wastes(anthracite culm and bituminous coal gob) in FBC boilers.
In a typical FBC, solid, liquid, or gaseous fuel (or fuels), an inert mate-rial such as sand or ash (referred to as bed material), and limestone arekept suspended through the action of combustion air distributed below the

220 Coal Energy Systems
1 (CT)
1 (DC)
1 (HI)
12
1
1
1
12
1
1
1
2
1
2
2
1
1
2
5
7 2
24
117
2
2
43
Percent of national FBC electrical generating capacity:
>4%
2-4%
<2%
FIGURE 5-11. Number of fluidized-bed combustion facilities by state. (From EPA,Report to Congress: Wastes from Combustion of Fossil Fuels, Vol. 2, Methods,Findings, and Recommendations, U.S. Environmental Protection Agency, U.S.Government Printing Office, Washington, D.C., March 1999, chap. 3.)
combustor floor [14]. The primary functions of the inert material are to dis-perse the incoming fuel particles throughout the bed, heat the fuel particlesquickly to the ignition temperature, act as a flywheel for the combustionprocess by storing a large amount of thermal energy, and provide sufficientresidence time for complete combustion. The FBC concept is attractivebecause it increases turbulence and permits lower combustion tempera-tures. Turbulence is promoted by fluidization making the entire mass ofsolids behave much like a liquid. Improved mixing (and hence enhanced heattransfer to the bed material) permits the generation of heat at a substantiallylower and more uniformly distributed temperature than occurs in conven-tional systems such as stoker-fired units or pulverized coal-fired boilers. Thebed temperature in an FBC boiler is typically 1450 to 1650◦F. This operatingtemperature range is well below that at which significant thermally-inducedNOx production occurs. Staged combustion can be applied to minimize fuel-bound NOx formation as well. With regard to SO2 emissions, the operatingtemperature range is where the reactions of SO2 with a suitable sorbent,commonly limestone, are thermodynamically and kinetically balanced [24].The percent capture for a given sorbent addition rate drops significantlyoutside the 1450 to 1650◦F range. An additional reason why the bed temper-ature must be kept above 1400◦F is that carbon utilization decreases withdecreasing temperature, thereby reducing combustion efficiency.
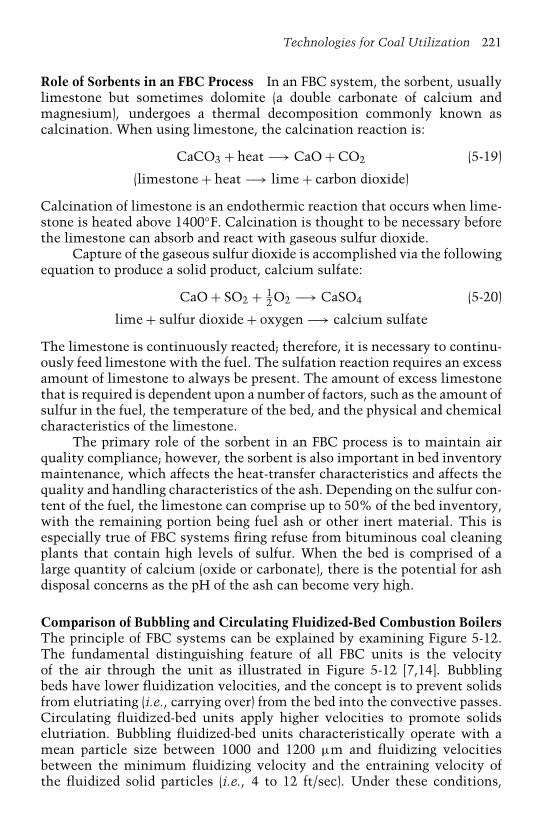
Technologies for Coal Utilization 221
Role of Sorbents in an FBC Process In an FBC system, the sorbent, usuallylimestone but sometimes dolomite (a double carbonate of calcium andmagnesium), undergoes a thermal decomposition commonly known ascalcination. When using limestone, the calcination reaction is:
CaCO3 + heat −→ CaO + CO2 (5-19)
(limestone + heat −→ lime + carbon dioxide)
Calcination of limestone is an endothermic reaction that occurs when lime-stone is heated above 1400◦F. Calcination is thought to be necessary beforethe limestone can absorb and react with gaseous sulfur dioxide.
Capture of the gaseous sulfur dioxide is accomplished via the followingequation to produce a solid product, calcium sulfate:
CaO + SO2 + 12O2 −→ CaSO4 (5-20)
lime + sulfur dioxide + oxygen −→ calcium sulfate
The limestone is continuously reacted; therefore, it is necessary to continu-ously feed limestone with the fuel. The sulfation reaction requires an excessamount of limestone to always be present. The amount of excess limestonethat is required is dependent upon a number of factors, such as the amount ofsulfur in the fuel, the temperature of the bed, and the physical and chemicalcharacteristics of the limestone.
The primary role of the sorbent in an FBC process is to maintain airquality compliance; however, the sorbent is also important in bed inventorymaintenance, which affects the heat-transfer characteristics and affects thequality and handling characteristics of the ash. Depending on the sulfur con-tent of the fuel, the limestone can comprise up to 50% of the bed inventory,with the remaining portion being fuel ash or other inert material. This isespecially true of FBC systems firing refuse from bituminous coal cleaningplants that contain high levels of sulfur. When the bed is comprised of alarge quantity of calcium (oxide or carbonate), there is the potential for ashdisposal concerns as the pH of the ash can become very high.
Comparison of Bubbling and Circulating Fluidized-Bed Combustion BoilersThe principle of FBC systems can be explained by examining Figure 5-12.The fundamental distinguishing feature of all FBC units is the velocityof the air through the unit as illustrated in Figure 5-12 [7,14]. Bubblingbeds have lower fluidization velocities, and the concept is to prevent solidsfrom elutriating (i.e., carrying over) from the bed into the convective passes.Circulating fluidized-bed units apply higher velocities to promote solidselutriation. Bubbling fluidized-bed units characteristically operate with amean particle size between 1000 and 1200 µm and fluidizing velocitiesbetween the minimum fluidizing velocity and the entraining velocity ofthe fluidized solid particles (i.e., 4 to 12 ft/sec). Under these conditions,
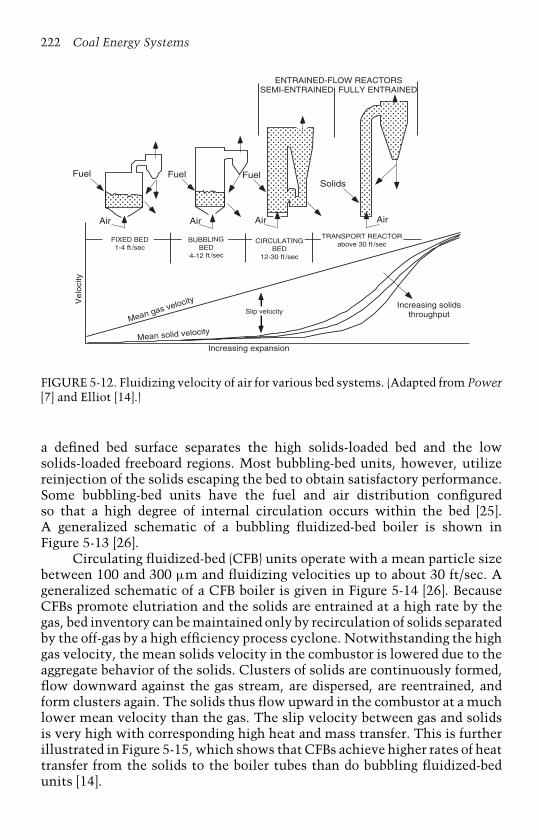
222 Coal Energy Systems
ENTRAINED-FLOW REACTORSSEMI-ENTRAINED FULLY ENTRAINED
Fuel
FIXED BED1-4 ft /sec
BUBBLINGBED
4-12 ft /sec
CIRCULATINGBED
12-30 ft /sec
TRANSPORT REACTORabove 30 ft /sec
Fuel FuelSolids
AirAirAirAir
Velo
city
Mean gas velocity
Mean solid velocity
Increasing expansion
Increasing solidsthroughputSlip velocity
FIGURE 5-12. Fluidizing velocity of air for various bed systems. (Adapted from Power[7] and Elliot [14].)
a defined bed surface separates the high solids-loaded bed and the lowsolids-loaded freeboard regions. Most bubbling-bed units, however, utilizereinjection of the solids escaping the bed to obtain satisfactory performance.Some bubbling-bed units have the fuel and air distribution configuredso that a high degree of internal circulation occurs within the bed [25].A generalized schematic of a bubbling fluidized-bed boiler is shown inFigure 5-13 [26].
Circulating fluidized-bed (CFB) units operate with a mean particle sizebetween 100 and 300 µm and fluidizing velocities up to about 30 ft/sec. Ageneralized schematic of a CFB boiler is given in Figure 5-14 [26]. BecauseCFBs promote elutriation and the solids are entrained at a high rate by thegas, bed inventory can be maintained only by recirculation of solids separatedby the off-gas by a high efficiency process cyclone. Notwithstanding the highgas velocity, the mean solids velocity in the combustor is lowered due to theaggregate behavior of the solids. Clusters of solids are continuously formed,flow downward against the gas stream, are dispersed, are reentrained, andform clusters again. The solids thus flow upward in the combustor at a muchlower mean velocity than the gas. The slip velocity between gas and solidsis very high with corresponding high heat and mass transfer. This is furtherillustrated in Figure 5-15, which shows that CFBs achieve higher rates of heattransfer from the solids to the boiler tubes than do bubbling fluidized-bedunits [14].
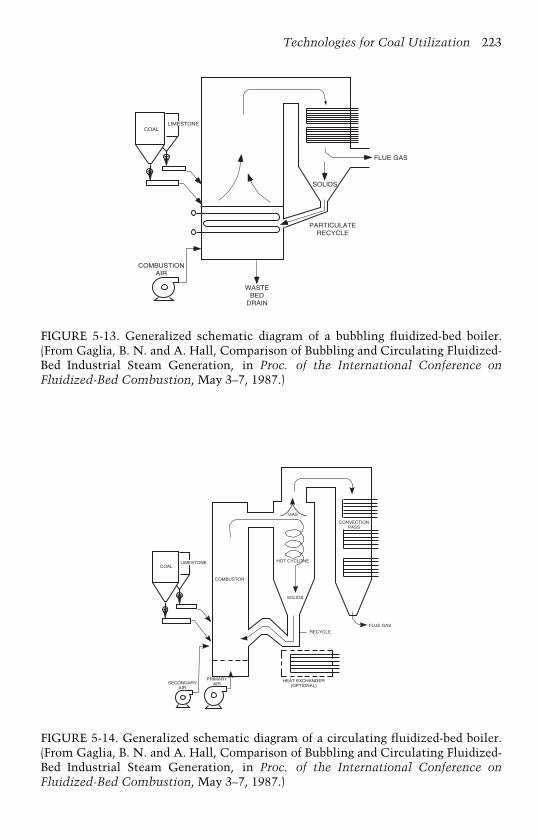
Technologies for Coal Utilization 223
COALLIMESTONE
FLUE GAS
SOLIDS
WASTEBED
DRAIN
COMBUSTIONAIR
PARTICULATERECYCLE
FIGURE 5-13. Generalized schematic diagram of a bubbling fluidized-bed boiler.(From Gaglia, B. N. and A. Hall, Comparison of Bubbling and Circulating Fluidized-Bed Industrial Steam Generation, in Proc. of the International Conference onFluidized-Bed Combustion, May 3–7, 1987.)
COALLIMESTONE
COMBUSTOR
SOLIDS
CONVECTIONPASS
FLUE GAS
HEAT EXCHANGER(OPTIONAL)
RECYCLE
GAS
HOT CYCLONE
SECONDARYAIR
PRIMARYAIR
FIGURE 5-14. Generalized schematic diagram of a circulating fluidized-bed boiler.(From Gaglia, B. N. and A. Hall, Comparison of Bubbling and Circulating Fluidized-Bed Industrial Steam Generation, in Proc. of the International Conference onFluidized-Bed Combustion, May 3–7, 1987.)

224 Coal Energy Systems
1650
1560
1470
1380
0 20 40 60 80 100 120
20% excess
air
Variable excess air
(up to 40%)One
sectionTwo
sectionsThree
sections
Steam flow, %MCR
70
60
50
40
30
20
10
0
0.1 0.5 1.0 5.0 10 50Solids in gas, lb/ft3
Bubbling beds
Circulating beds
Pulverized coal
He
at
tra
nsf
er
coe
ffic
ien
t, B
tu/h
-ft2
-FB
ed
te
mp
era
ture
, °F
FIGURE 5-15. Relationship between heat transfer and solids loading/bed density.(From Elliot, T. C., Ed., Standard Handbook of Powerplant Engineering, McGraw-Hill, New York, 1989. With permission.)
Circulating fluidized-beds include these major components: arefractory-lined combustor bottom section with fluidizing nozzles on thefloor above the windbox; an upper combustor section, usually with water-walls; a transition pipe, including a hot-solids separator and reentry down-comer; convective boiler section; and, in some designs, an external heatexchanger [14]. An external heat exchanger is a refractory-lined box contain-ing an air distribution grid and an immersed tube bundle designed to coolmaterial from the hot-solids separator and that is used to compensate for vari-ations in the heat absorption rate caused by changes in fuel properties andload conditions. The solids separators are refractory-lined cyclones that are

Technologies for Coal Utilization 225
used to keep the solids circulating. The solids reinjection device, called anL-valve, J-valve, loop seal, Fluoseal, or a sealpot, depending on the manu-facturer and configuration, provides a simple, nonmechanical hydraulicbarometric seal against the combustor shell.
Suspension FiringPulverized coal-firing is the method of choice for large industrial boilers(e.g., >250,000 pounds of steam per hour) and coal-fired electric utility gen-erators because pulverized coal-fired units can be constructed to very largesizes (i.e., up to ∼1300 MW or ∼9.5 million pounds of steam per hour), and,unlike stoker units where some designs have coal restrictions, they canaccommodate virtually any coal with proper design provisions. The coalsize distribution for pulverized coal-fired units is typically <2% by weightgreater than 50 mesh (300 µm) with 65 to 70% less than 200 mesh (74 µm)for lignites and subbituminous coals and 80 to 85% less than 200 mesh forbituminous coals [19]. After the coal is pulverized, it is pneumatically trans-ported to the burners using a portion of the combustion air, typically 10% ofthe total combustion air (the remaining combustion air is introduced at ornear the burner), in a manner that permits stable ignition, effective controlof flame shape and travel, and thorough and complete mixing of fuel and air.
Pulverized coal-fired units are typically classified into two types,depending on the furnace design for ash removal. In dry-bottom furnaces,the ash is removed from the system in dry form; in wet-bottom or slag-tapfurnaces, the ash is removed in molten form. Dry-bottom furnaces are themore common of the two types and are now almost the only type sold inthe United States. Dry-bottom furnaces are simpler to operate, more flexi-ble with respect to fuel properties, and more reliable than slag-tap furnaces[2]. Dry-bottom furnaces are larger (hence, more costly) than wet-bottomfurnaces since they must be sized to accommodate the ash where most ofit (>80%) remains entrained in the flue gas and must be removed by par-ticulate control devices at the back end of the system. Slag-tap units weredeveloped to reduce the amount of fine fly ash that had to be handled byproducing a heavier, granular ash and retaining most of the ash (up to 80%)in the furnace.
Dry-Bottom Firing The most frequently used dry-bottom furnace andburner configurations are shown in Figure 5-16 [2]. These arrangements coverfiring systems suitable for all ranks of coal and coal qualities, including highash or moisture content, low heating value, low ash fusion temperature,and high potential for ash deposition. Dry-bottom furnaces are designed toremove the ash as a solid; therefore, the rate of heat transfer and tempera-ture in the furnace must be controlled. The dry-bottom furnaces are designedsuch that the heat release rates are much lower than wet-bottom and cyclonefurnaces, and this, coupled with maintaining the furnace exit gas temper-ature below the ash fusion temperature, results in larger furnace designs.

226 Coal Energy Systems
(a) (b) (c) (d)
(e) (f)
FIGURE 5-16. Dry-bottom furnace and burner configurations: (a) horizontal (frontor rear); (b) opposed horizontal; (c) tangential (or corner firing); (d) opposed inclined;(e) single U-flame; (f) double U-flame. (From Elliot, M. A., Ed., Chemistry of CoalUtilization, Secondary Suppl. Vol., John Wiley & Sons, New York, 1981. Withpermission.)
Flame temperatures in the pulverized coal-fired units are typically around2750◦F. Heat is lost primarily by radiation in the furnace to the water-walls and superheater/reheater tubes suspended in the furnace, and thetemperature of the flue gas exiting the furnace is typically 1850◦F.
Horizontal and opposed horizontal furnaces (Figure 5-16a,b) are usuallyfired by circular burners spaced uniformly across the width of the furnaceon the front or rear wall or on both front and rear walls. Each burner hasits own flame envelope, and the firing system can be designed so that anindividual burner may be placed in service, adjusted, or removed from serviceindependently of the other burners. In front or rear wall firing, the burnersare arranged in such a way as to promote turbulence. In opposed firing, theburners in opposite walls of the furnace impinge their flames against eachother to increase turbulence [7].
In tangential and, to a lesser extent, opposed inclined furnaces(Figure 5-16c,d), the burner turbulence is replaced by the overall furnaceturbulence. In these furnaces, a single flame envelope promotes combustionstability and avoids the high flame temperatures that tend to favor NOx

Technologies for Coal Utilization 227
formation. In addition, the burners in the tangential furnace, where the fueland air are admitted at all four corners and at different levels of the furnaceand the burners, can be tilted upward or downward by 20◦ from the horizon-tal, thereby changing the temperature of the flue gas by as much as 150◦F [7].This allows for changing the combustion volume of the furnace to controlsuperheat and reheat temperatures.
Single and double U-flame furnaces (Figure 5-16e,f) are used for firingdifficult-to-ignite and slowly burning fuels such as anthracite and coke. Inthese designs, the fuel is fired downward, and radiation from the rising por-tion of the flames and from the burners in the opposite arch (in the doubleU-flame units) assists in maintaining a stable flame over a wide load range.
Wet-Bottom Firing Early wet-bottom furnaces (i.e., in the 1920s) weresimply open, single-stage furnaces with burners located close together andnear the furnace floor to achieve the high temperatures necessary for melt-ing the ash [2]. The furnace type used was usually one of those shown inFigure 5-16a–d, which was modified to accommodate the molten ash, and itsatisfactorily used favorable coals where limited turndown was required. Forcoal ash that is difficult to melt and when a larger turndown range is required,two-stage designs have been developed. Examples of two-stage, slag-tap firingare shown in Figure 5-17 [2]. The primary advantage of wet-bottom furnaces
FIGURE 5-17. Furnace and burner configurations for two-stage slag-tap firing. (FromElliot, M. A., Ed., Chemistry of Coal Utilization, Secondary Suppl. Vol., John Wiley& Sons, New York, 1981. With permission.)

228 Coal Energy Systems
is easier ash handling and disposal; however, the disadvantages of usingwet-bottom furnaces have led to its decline in the United States. These dis-advantages include lower boiler efficiency through sensible heat loss of theslag, less fuel flexibility, higher incidences of ash fouling and external cor-rosion of pressure parts, decreased average steam generator availability, andhigher levels of NOx emissions [2].
Cyclone Furnaces Cyclone-furnace firing, shown in Figure 5-18, is a form oftwo-stage, wet-bottom design although some do not classify it as suspensionfiring because a large portion of the fuel is burned on the surface of a movingslag layer [2]. In cyclone firing, one or more combustors are mounted onthe wall of the main furnace. Most cyclone furnaces in the United Statesare fired with coal crushed to about 1/4-inch top size while foreign practiceuses partially pulverized coal (e.g., 25% finer than 200 mesh [74 µm]). In thescreened-furnace type, the gases exiting the cyclone pass through a smallchamber and slag screen before entering the main furnace. This design hasbeen largely replaced by the open-furnace arrangements as larger units havebeen developed. The development of the horizontal cyclone furnace occurredrapidly in the United States in the mid-1940s, and B&W was the leader in thistechnology development. The interest in the cyclone furnace is due to theseveral good features that it has, including a very high rate of heat production
(a) (b) (c)
FIGURE 5-18. Horizontal cyclone furnace arrangements: (a) screened furnace; (b) one-wall open furnace; (c) opposed open furnace. (From Elliot, M. A., Ed., Chemistry ofCoal Utilization, Secondary Suppl. Vol., John Wiley & Sons, New York, 1981. Withpermission.)
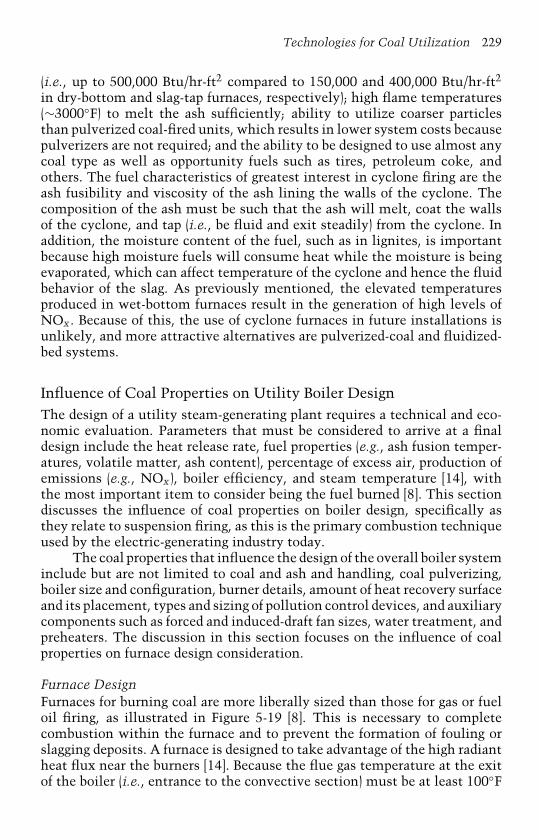
Technologies for Coal Utilization 229
(i.e., up to 500,000 Btu/hr-ft2 compared to 150,000 and 400,000 Btu/hr-ft2
in dry-bottom and slag-tap furnaces, respectively); high flame temperatures(∼3000◦F) to melt the ash sufficiently; ability to utilize coarser particlesthan pulverized coal-fired units, which results in lower system costs becausepulverizers are not required; and the ability to be designed to use almost anycoal type as well as opportunity fuels such as tires, petroleum coke, andothers. The fuel characteristics of greatest interest in cyclone firing are theash fusibility and viscosity of the ash lining the walls of the cyclone. Thecomposition of the ash must be such that the ash will melt, coat the wallsof the cyclone, and tap (i.e., be fluid and exit steadily) from the cyclone. Inaddition, the moisture content of the fuel, such as in lignites, is importantbecause high moisture fuels will consume heat while the moisture is beingevaporated, which can affect temperature of the cyclone and hence the fluidbehavior of the slag. As previously mentioned, the elevated temperaturesproduced in wet-bottom furnaces result in the generation of high levels ofNOx . Because of this, the use of cyclone furnaces in future installations isunlikely, and more attractive alternatives are pulverized-coal and fluidized-bed systems.
Influence of Coal Properties on Utility Boiler DesignThe design of a utility steam-generating plant requires a technical and eco-nomic evaluation. Parameters that must be considered to arrive at a finaldesign include the heat release rate, fuel properties (e.g., ash fusion temper-atures, volatile matter, ash content), percentage of excess air, production ofemissions (e.g., NOx ), boiler efficiency, and steam temperature [14], withthe most important item to consider being the fuel burned [8]. This sectiondiscusses the influence of coal properties on boiler design, specifically asthey relate to suspension firing, as this is the primary combustion techniqueused by the electric-generating industry today.
The coal properties that influence the design of the overall boiler systeminclude but are not limited to coal and ash and handling, coal pulverizing,boiler size and configuration, burner details, amount of heat recovery surfaceand its placement, types and sizing of pollution control devices, and auxiliarycomponents such as forced and induced-draft fan sizes, water treatment, andpreheaters. The discussion in this section focuses on the influence of coalproperties on furnace design consideration.
Furnace DesignFurnaces for burning coal are more liberally sized than those for gas or fueloil firing, as illustrated in Figure 5-19 [8]. This is necessary to completecombustion within the furnace and to prevent the formation of fouling orslagging deposits. A furnace is designed to take advantage of the high radiantheat flux near the burners [14]. Because the flue gas temperature at the exitof the boiler (i.e., entrance to the convective section) must be at least 100◦F
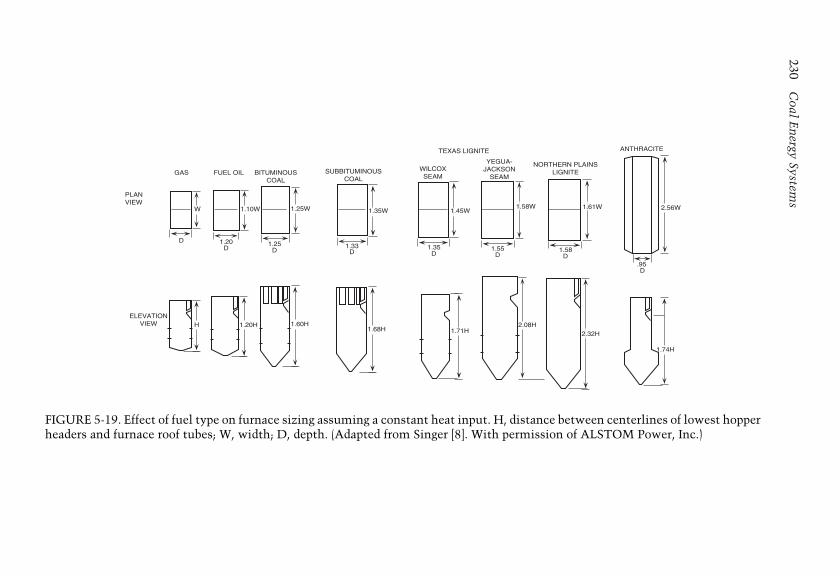
230C
oalE
nergy
Systems
1.58D
1.71H
WILCOXSEAM
YEGUA-JACKSON
SEAM
TEXAS LIGNITE
PLANVIEW
ELEVATIONVIEW
GAS FUEL OIL BITUMINOUSCOAL
SUBBITUMINOUSCOAL
NORTHERN PLAINSLIGNITE
ANTHRACITE
2.32H
1.74H
2.08H1.68H
1.60H1.20HH
1.35W1.25W1.10WW 1.61W 2.56W
D 1.20D
1.25D
1.33D
.95D
1.45W
1.35D
1.55D
1.58W
FIGURE 5-19. Effect of fuel type on furnace sizing assuming a constant heat input. H, distance between centerlines of lowest hopperheaders and furnace roof tubes; W, width; D, depth. (Adapted from Singer [8]. With permission of ALSTOM Power, Inc.)
Technologies for Coal Utilization 231
below the ash-softening temperature (which varies from ∼2000 to 2500◦F),the radiant heat-transfer surface in a coal-fired boiler must be increased by15% or more in order to achieve a steep reduction in temperature from theflame temperature of ∼2750◦F.
The convective section of the boiler is designed to extract the maximumamount of heat from the partially cooled flue gas exiting the boiler. The fluegas velocity should not exceed about 60 ft/sec in the convective section,when firing coal, to minimize erosion of the tubes from the fly ash [14].Sootblowers are required in coal-fired power plants to keep the heat-transfersurface clean.
The furnace size and shape must allow for adequate coal residence timewithin the furnace to achieve complete combustion. Sufficient heat must becontained in the flue gas exiting the boiler to enable efficient designs ofsuperheater, reheater, economizer, and air heater heat-transfer surfaces. Theflue gas exiting the stack must be low to minimize heat losses from thesystem but must be above the dew point of the acid gases so metal corrosionis not experienced.
In general, ignition stability in a pulverized coal-fired furnace variesdirectly with the ratio of volatile matter to fixed carbon [14]; hence, coalssuch as anthracite are typically fired in U-flame furnaces. Coals with highervolatile matter can be more easily burned in suspension, which allows fora lower furnace temperature but requires a larger furnace heat-release area.Also, coals with higher volatile matter tend to have lower ash fusion temper-atures (i.e., higher fouling and slagging tendencies), thereby requiring lowerfurnace temperatures [14].
Figure 5-19 illustrates the relationship between furnace exit gas tem-perature requirements and heat release rates for typical coals as compared tonatural gas and fuel oil. To avoid slagging problems, a lower heat release rateis required for a coal having a relatively low ash fusion temperature than fora coal having a higher ash fusion temperature. The furnace exit gas temper-ature is primarily a function of heat release rate, which is the available heatdivided by the equivalent water-cooled furnace surface [14].
Ash CharacteristicsCoal is a very heterogeneous substance, and the mineral matter distributedthroughout the coal exists in various forms, compositions, and associationsand cannot be simply represented by composition (i.e., elemental oxides) anda single set of melting temperatures (i.e., ash fusion temperatures). Empiri-cal indices have been developed using coal ash chemistry; however, they aresuccessfully used only part of the time and are not applicable to ranks of coalbeyond that for which they were developed. Some of these historical indicesthat are important when evaluating coal ash behavior, as they affect fur-nace slagging and fouling on both the furnace walls and convective surfaces(which vary among boiler manufacturers), include but are not limited to ash

232 Coal Energy Systems
fusibility temperatures, dolomite concentrations, total ash concentrationand composition, and base-to-acid, iron-to-calcium, and silica-to-aluminumratios [8,27,28]. These parameters indicate the slagging and fouling potentialof an ash. In addition, slag viscosity is an important parameter for cyclonefurnace operation.
Slag Viscosity The viscosity of the slag formed from the coal ash is animportant parameter for cyclone-fired furnaces. Slag will just flow on a hori-zontal surface at a viscosity of 250 poises [6]. The temperature at which thisviscosity occurs (T250) is used as the criterion to determine the suitability ofa coal for a cyclone furnace. The T250 can be either calculated from a chem-ical analysis of the coal ash or, more preferably, determined experimentallyusing a high-temperature viscometer, and a value of 2600◦F is consideredmaximum. Coals with a slag viscosity of 250 poises at 2600◦F or lower areconsidered candidates for cyclone furnaces provided the ash analysis doesnot indicate excessive formation of iron or iron pyrites [6]. The T250 index isused for all ranks of coal.
In dry-bottom furnaces, the formation of slag must be avoided so asnot to adversely affect the unit’s operation. A relationship between furnaceslagging and T250 has been developed [27]:
Slagging Rating T250
Low >2325◦FMedium 2550–2100◦FHigh 2275–2050◦FSevere <2200◦F
Slagging and Fouling Potential The potential for slagging (i.e., fused slagdeposits that form on furnace walls and other surfaces exposed to predom-inately radiant heat) is temperature and ash composition related. Slaggingpotential affects furnace sizing, arrangement of radiant and convective heat-ing surfaces, and the number of sootblowers required [28]. Fouling depositsform primarily in lower temperature regions of the furnace and convectivesection and affect the design and maintenance of superheaters, reheaters, fur-nace waterwalls, air heaters, and the number of sootblowers required. Thepotential for fouling is linked to the alkaline content of the ash, specificallythe active alkalis.
Ash fusibility has long been recognized as a tool for measuring the per-formance of coals related to slagging and deposit buildup. American Societyfor Testing Materials (ASTM) Standard D1857 specifies the experimental pro-cedure to use to determine the ash fusion temperatures. The test is based onthe gradual thermal deformation of a pyramid-shaped ash sample in either anoxidizing or reducing atmosphere. Four temperatures are obtained during thetest: (1) initial deformation temperature, which is the temperature at which

Technologies for Coal Utilization 233
the tip of the pyramid begins to show evidence of deformation; (2) softeningor fusion temperature, which is the temperature at which the ash samplehas fused and the height equals the width; (3) hemispherical temperature,which is the temperature at which the sample has fused into a hemispher-ical shape for which the height is equal to half of the width at the base;and (4) fluid temperature, which is the temperature at which the sample hasfused down into a nearly flat layer. The ash-softening temperature is relatedto the type and ease of deposit removal from heat-transfer surfaces. If ashparticles arrive at heat-absorbing surfaces at temperatures below their soft-ening temperature, they will not form a bonded structure, and ash removalis relatively easy. If the ash particles arrive at these surfaces after they havebeen subjected to temperatures above their softening temperature and havebecome plastic or liquid, the resulting deposit will be tightly bonded andmore difficult to remove [8]. Also, the temperature difference between theinitial deformation and fluid temperatures provides information on the typeof deposit to expect on furnace tube surfaces [8]. A small temperature differ-ence indicates a thin, running, tenacious, difficult-to-remove slag, whereaswider temperature differences indicate less-adhesive deposits.
Another measure of ash viscosity that is used to predict furnace slaggingis the temperature of critical viscosity (Tcv) [29]. This is the temperature atwhich the viscosity properties of the molten slag change on cooling fromthose of a Newtonian fluid to those of a Bingham plastic and is believed tobe the temperature at which solid phases start to crystallize from the melt.
Several slagging and fouling indices have been developed based on theash composition. Many of these indices have been developed for easternU.S.-type coals. These are characterized as high iron and low alkali andalkaline-earth content coals. The ash composition of such coals reflects aFe2O3 level exceeding the combined CaO, MgO, Na2O, and K2O percentage.In addition, sulfur percentages are higher than western United States coals.The acidic ash constituents (reported as weight percent on an oxide basis)SiO2, Al2O3, and TiO2 are generally considered to produce high-melting-temperature ashes. Temperatures will be lowered by the relative amounts ofbasic oxides, Fe2O3, CaO, MgO, Na2O, and K2O, available in the ash. Thebase (B)/acid (A) ratio defined as:
BA
= Fe2O3 + CaO + MgO + Na2O + K2OSiO2 + Al2O3 + TiO2
(5-21)
has been developed as an indictor to predict the relative performance of coalash in the furnace. This index can be used for all ranks of coal. A base/acidratio in the range of 0.4 to 0.7 reflects low-fusibility temperatures and ahigher slagging potential [8].
The base/acid ratio has also been used to define a slagging indexexpressed as RS = B/A×S, where S is the weight percent sulfur in the dry coal.
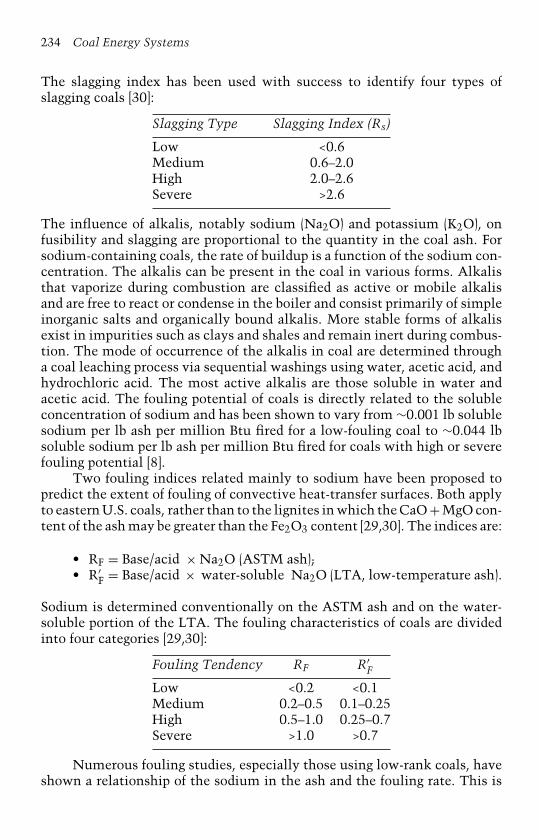
234 Coal Energy Systems
The slagging index has been used with success to identify four types ofslagging coals [30]:
Slagging Type Slagging Index (Rs)
Low <0.6Medium 0.6–2.0High 2.0–2.6Severe >2.6
The influence of alkalis, notably sodium (Na2O) and potassium (K2O), onfusibility and slagging are proportional to the quantity in the coal ash. Forsodium-containing coals, the rate of buildup is a function of the sodium con-centration. The alkalis can be present in the coal in various forms. Alkalisthat vaporize during combustion are classified as active or mobile alkalisand are free to react or condense in the boiler and consist primarily of simpleinorganic salts and organically bound alkalis. More stable forms of alkalisexist in impurities such as clays and shales and remain inert during combus-tion. The mode of occurrence of the alkalis in coal are determined througha coal leaching process via sequential washings using water, acetic acid, andhydrochloric acid. The most active alkalis are those soluble in water andacetic acid. The fouling potential of coals is directly related to the solubleconcentration of sodium and has been shown to vary from ∼0.001 lb solublesodium per lb ash per million Btu fired for a low-fouling coal to ∼0.044 lbsoluble sodium per lb ash per million Btu fired for coals with high or severefouling potential [8].
Two fouling indices related mainly to sodium have been proposed topredict the extent of fouling of convective heat-transfer surfaces. Both applyto eastern U.S. coals, rather than to the lignites in which the CaO + MgO con-tent of the ash may be greater than the Fe2O3 content [29,30]. The indices are:
• RF = Base/acid × Na2O (ASTM ash);• R′
F = Base/acid × water-soluble Na2O (LTA, low-temperature ash).
Sodium is determined conventionally on the ASTM ash and on the water-soluble portion of the LTA. The fouling characteristics of coals are dividedinto four categories [29,30]:
Fouling Tendency RF R′F
Low <0.2 <0.1Medium 0.2–0.5 0.1–0.25High 0.5–1.0 0.25–0.7Severe >1.0 >0.7
Numerous fouling studies, especially those using low-rank coals, haveshown a relationship of the sodium in the ash and the fouling rate. This is
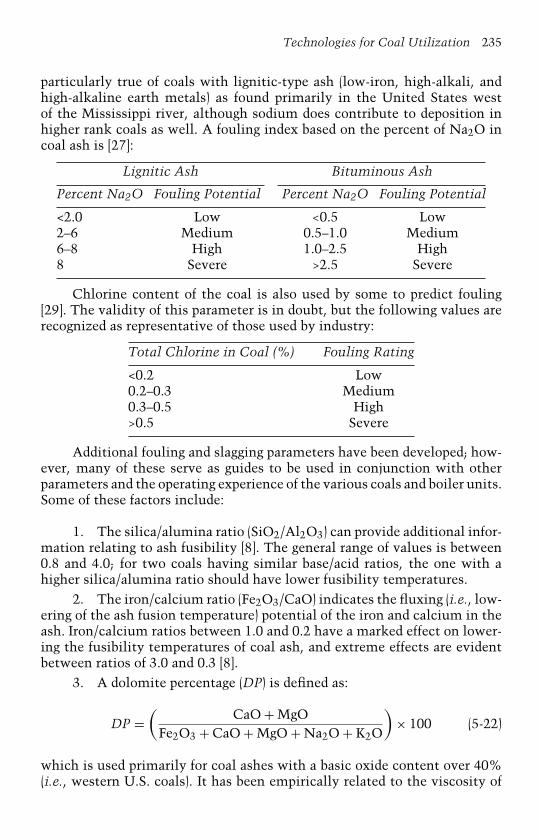
Technologies for Coal Utilization 235
particularly true of coals with lignitic-type ash (low-iron, high-alkali, andhigh-alkaline earth metals) as found primarily in the United States westof the Mississippi river, although sodium does contribute to deposition inhigher rank coals as well. A fouling index based on the percent of Na2O incoal ash is [27]:
Lignitic Ash Bituminous Ash
Percent Na2O Fouling Potential Percent Na2O Fouling Potential
<2.0 Low <0.5 Low2–6 Medium 0.5–1.0 Medium6–8 High 1.0–2.5 High8 Severe >2.5 Severe
Chlorine content of the coal is also used by some to predict fouling[29]. The validity of this parameter is in doubt, but the following values arerecognized as representative of those used by industry:
Total Chlorine in Coal (%) Fouling Rating
<0.2 Low0.2–0.3 Medium0.3–0.5 High>0.5 Severe
Additional fouling and slagging parameters have been developed; how-ever, many of these serve as guides to be used in conjunction with otherparameters and the operating experience of the various coals and boiler units.Some of these factors include:
1. The silica/alumina ratio (SiO2/Al2O3) can provide additional infor-mation relating to ash fusibility [8]. The general range of values is between0.8 and 4.0; for two coals having similar base/acid ratios, the one with ahigher silica/alumina ratio should have lower fusibility temperatures.
2. The iron/calcium ratio (Fe2O3/CaO) indicates the fluxing (i.e., low-ering of the ash fusion temperature) potential of the iron and calcium in theash. Iron/calcium ratios between 1.0 and 0.2 have a marked effect on lower-ing the fusibility temperatures of coal ash, and extreme effects are evidentbetween ratios of 3.0 and 0.3 [8].
3. A dolomite percentage (DP) is defined as:
DP =(
CaO + MgOFe2O3 + CaO + MgO + Na2O + K2O
)× 100 (5-22)
which is used primarily for coal ashes with a basic oxide content over 40%(i.e., western U.S. coals). It has been empirically related to the viscosity of
236 Coal Energy Systems
coal ash slags and, at a given basic concentration, a higher DP usually resultsin higher fusion temperatures and higher slag viscosities [8].
4. A silica percentage (SP) is defined as:
SP =(
SiO2
SiO2 + Equiv. Fe2O3 + CaO + MgO
)× 100 (5-23)
which has been empirically correlated with the viscosity of coal ash slags.As SP increases, the slag viscosity increases [8].
The development of a reliable coal-screening tool has long been a goalof the utility industry. The indices based on ASTM coal and ash analy-sis have provided useful information to boiler designers and operators butare not refined enough to be applied to all coals and all boilers. Also,because many of these indices were developed for bituminous coals, theyare poor indicators of performance when applied to low-rank coals; conse-quently, different analytical techniques are being applied and new indicesare continually being developed. Many of these new indices rely heavily oncomputer-controlled scanning electron microscopy coupled with coal andcoal ash analyses. The technique of automated or computer-controlled scan-ning electron microscopy has enabled the identification and sizing of coalmineral matter in situ and is also used to determine the inherent or extra-neous nature of the mineral matter in coal. The direct analysis of mineralmatter in coal, size determinations, and observation of the association ofmineral matter with coal particles are essential to determining the behav-ior of mineral matter during combustion of pulverized coal. Examples ofindices include wall slagging, convective pass fouling based on either sul-fates or silicates being the primary bonding component, cyclone slagging,and deposit strength [31]. Many of the indices developed by industry areproprietary.
As emphasized in this section, a major factor affecting furnace perfor-mance in large coal-fired utility boilers is the inorganic matter of the fuel.Most problems with the ash are associated with its effect on heat transferby thermally insulating furnace wall tubes and convective pass tube banks.Accumulation of ash deposits can decrease the heat transfer rate to the tubesurface, resulting in high flue gas temperatures.
Boiler manufacturers have developed their own empirical relationshipsto predict furnace performance and the effect of ash slagging and fouling.Also, testing coals in pilot-scale slagging and fouling combustors or boilersis routinely performed by boiler manufacturers, universities, and other testfacilities to assess deposition performance. Each boiler manufacturer hasits own criteria to allow for the effects of the ash characteristics; these arebased on sound engineering judgment and years of experience with boilersof similar size.
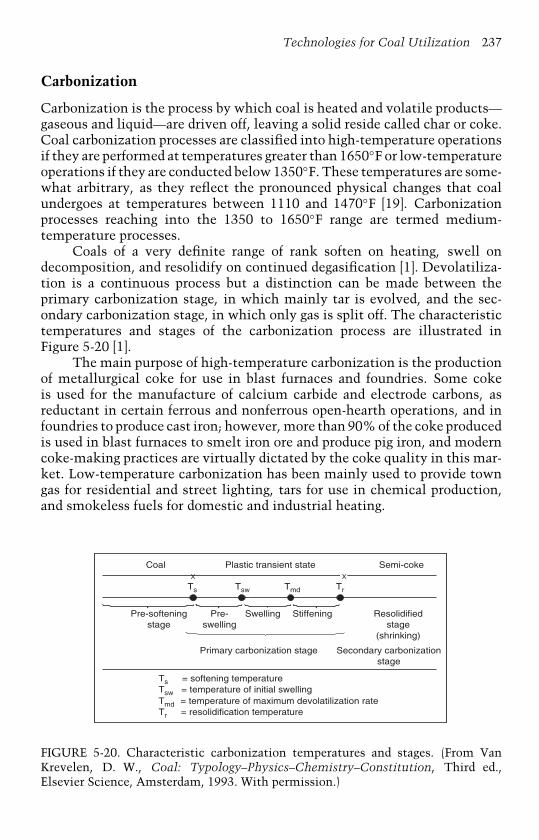
Technologies for Coal Utilization 237
Carbonization
Carbonization is the process by which coal is heated and volatile products—gaseous and liquid—are driven off, leaving a solid reside called char or coke.Coal carbonization processes are classified into high-temperature operationsif they are performed at temperatures greater than 1650◦F or low-temperatureoperations if they are conducted below 1350◦F. These temperatures are some-what arbitrary, as they reflect the pronounced physical changes that coalundergoes at temperatures between 1110 and 1470◦F [19]. Carbonizationprocesses reaching into the 1350 to 1650◦F range are termed medium-temperature processes.
Coals of a very definite range of rank soften on heating, swell ondecomposition, and resolidify on continued degasification [1]. Devolatiliza-tion is a continuous process but a distinction can be made between theprimary carbonization stage, in which mainly tar is evolved, and the sec-ondary carbonization stage, in which only gas is split off. The characteristictemperatures and stages of the carbonization process are illustrated inFigure 5-20 [1].
The main purpose of high-temperature carbonization is the productionof metallurgical coke for use in blast furnaces and foundries. Some cokeis used for the manufacture of calcium carbide and electrode carbons, asreductant in certain ferrous and nonferrous open-hearth operations, and infoundries to produce cast iron; however, more than 90% of the coke producedis used in blast furnaces to smelt iron ore and produce pig iron, and moderncoke-making practices are virtually dictated by the coke quality in this mar-ket. Low-temperature carbonization has been mainly used to provide towngas for residential and street lighting, tars for use in chemical production,and smokeless fuels for domestic and industrial heating.
X X
Coal Plastic transient state Semi-coke
Ts Tsw Tmd Tr
Pre-softeningstage
Pre-swelling
Swelling Stiffening Resolidifiedstage
(shrinking)
Primary carbonization stage Secondary carbonizationstage
Ts = softening temperatureTsw = temperature of initial swellingTmd = temperature of maximum devolatilization rateTr = resolidification temperature
FIGURE 5-20. Characteristic carbonization temperatures and stages. (From VanKrevelen, D. W., Coal: Typology–Physics–Chemistry–Constitution, Third ed.,Elsevier Science, Amsterdam, 1993. With permission.)

238 Coal Energy Systems
To put the use of coal used for carbonization into perspective with theelectrical power generation industry (i.e., using coal in combustion tech-nologies), of the ∼1065.8 million short tons of coal consumed in the UnitedStates in 2002, ∼22.5 million short tons (or ∼2%) was used in coke plants, ascompared to ∼975.9 million short tons (or ∼92%) consumed by the electricpower sector [32]. This section provides a brief history of high-temperaturecarbonization, specifically as it was developed for the iron and steel industry;reviews coking processes; discusses coal properties of interest for produc-ing coking coals and the uses of coke; and concludes with a review oflow-temperature carbonization.
Brief History of Carbonization (High-Temperature)The carbonization of coal has its historical roots in the iron and steel indus-try. The ironmaking processes developed around the Mediterranean Sea andspread northward through Europe [33]. The Phoenicians, Celts, and Romansall helped spread ironmaking technology, and the Romans brought one ofthe ironmaking techniques as far north as Great Britain. Originally, charcoalproduced from wood was the fuel used to melt the iron ore, and a tremen-dous amount of wood was needed for this industry. For example, one typeof furnace (the Stuckofen) used in fourteenth-century Germany could pro-duce 4000 lb of iron per day with a fuel rate of 250 lb of charcoal per 100 lbof iron produced [33]. This was an early version of the charcoal blast fur-nace, and these furnaces that developed in Continental Europe soon spreadto Great Britain. By 1615, there were 800 furnaces, forges, or iron mills inGreat Britain, 300 of them blast furnaces. The rate of growth in the num-ber of these furnaces was so great that, during the 1600s, parliament passedlaws to protect the remaining forests; consequently, many blast furnaceswere shut down, alternative fuels were sought, and England encouraged theproduction of iron in its North American colonies, which had abundant sup-plies of wood and iron ore. The first successful charcoal blast furnace in theNew World was constructed at Saugus, Massachusetts, outside of Boston,in 1645.
Due to the depletion of virgin forests in Great Britain to sustain thecharcoal iron, the iron masters were forced to look at alternative fuel sources.The alternative fuels included bituminous coal, anthracite, coke, and evenpeat [33]. The development of coke and anthracite ironmaking paralleledeach other and coexisted with charcoal production during the 1700s and1800s, while bituminous coal and peat never became major ironmaking fuels.The widespread use of coke in place of charcoal came about in the early 1700swhen Abraham Darby and his son showed that coke burned more cleanly andwith a hotter flame than coal [19]. Up until 1750, the only ironworks usingcoke on a regular basis were two furnaces operated by the Darby family [33];however, from 1750 to 1771 the use of coke spread, and 27 coke furnaceswere in production. The use of coke increased iron production because it was
Technologies for Coal Utilization 239
stronger than charcoal and could support the weight of more raw materials,thus furnace size was increased.
The use of coke then spread to Continental Europe: Creussot, France,in 1785; Gewitz, Silesia, in 1796; Seraing, Belgium, in 1826; Mulhiem,Germany, in 1849; Donete, Russia, in 1871; and Bilbao, Spain, in 1880 [33].In North America, the first attempt to use coke as the exclusive fuel wasin the Mary Ann furnace in Huntington, Pennsylvania, although coke wasmixed with other fuels as early as 1797 in U.S. blast furnaces.
The efficient use of coke and anthracite in producing iron was accel-erated by the use of steam-driven equipment, the invention of equipmentto preheat air from entering the blast furnace, and the design of the tuyeresand tuyere composition [33]. The evolution of both coke and anthracite iron-making progressed in the United States during the 1800s and, by 1856, 121anthracite furnaces were in operation in the United States. With coke beingthe strongest and most available fuel, the evolution of 100% coke furnacescontinued, with major steps being made in the Pittsburgh area between 1872and 1913. The Carnegie Steel Company and its predecessor firms developedtechnological process improvements at its Monongahela Valley ironmakingfurnaces that ultimately made it possible for the United States to take overworldwide leadership in iron production. This is not true today, however,as much of the steel production has shifted overseas, beginning in the 1960sand early 1970s.
Coking ProcessesEarly processes for the production of coke were similar to those employed forthe production of wood charcoal. Bituminous coal was built up into piles andignited in such a way that only the outside layers actually burned while thecentral portion was carbonized [2]. Piles, also called kilns, appeared for thefirst time in England in 1657 and spread from there to other European bitu-minous coal producing regions. Around 1850, half-open brick kilns (i.e., theSchaumburg kiln) were constructed from which circular mounds of coalemitted tar-containing volatilized gases directly into the atmosphere [2]. Thenext development was the closed beehive oven, which in its original form dis-charged the distillation and flue gases through a chimney at a greater height.Beehive ovens were used in England until the end of the 1800s; today, some ofthese ovens are still in operation in South Africa, South America, Australia,and the United States. The beehive oven is a simple domed brick structureinto which coal can be charged through an opening at the top and then lev-eled through a side door to form on a bed ∼2 feet thick [19]. Heat is suppliedby burning the volatile matter released from the coal, and carbonization pro-gresses from the top down through the charge. Approximately 5 to 6 shorttons of coal can be charged, and a period of 48 to 76 hours is required forcarbonization. Some beehive ovens are still in operation because of systemimprovements and the addition of waste heat boilers to recover heat from the

240 Coal Energy Systems
combustion products. Similarly, the heat required for coking in the pile andthe Schaumburg kiln is produced by partial combustion of the coal, whichresults in a substantial loss of material by combustion, with a coke yieldin these ovens (including the beehive oven) being at most 55% of the coal.Flame ovens, in which the coal was coked in chambers heated from the out-side, were developed in 1850 in Belgium and the Saar District in Germany [2].The high-heating-value, volatilized gases were burned in flues in the wallsof the ovens to produce coke yields of ∼75%, with coking times of 48 hours.
The first coke ovens that produced satisfactory blast furnace or foundrycoke as the main product, and tar, ammonia, and later benzene as by-products, were built around 1856 and were known as by-product recoveryovens [2]. Modifications to the design has continued but the basic design ofthese ovens, essentially the modern coke oven, was completed by the 1940s[1]. The horizontal slot-type coke (by-product recovery) oven, in which highertemperatures can be attained and better control over coke quality can be exer-cised, has superceded other designs and is used for coking bituminous coal[19]. Modern slot-type coke ovens are comprised of chambers 50 to 55 feetlong, 20 to 22 feet high, and ∼18 inches wide. A number of these chambers(from 20 to 100) alternating with similar cells that accommodate heatingflues serve as a battery. Coal, crushed to 80% minus 1/8 in. with a top sizeof 1 in., is loaded along the top of the ovens using a charging car on rails and isleveled by a retractable bar. Coking takes place in completely sealed ovens,and when carbonization is completed (after 15–20 hours) the oven doors areopened and a ram on one side pushes the red-hot coke into a quenching car oronto a quenching platform. Coke yield is about 75%. By-product gas and tarvapors are removed from the oven to collector mains for further processingor for use in the battery.
A block flow diagram of the recovery of by-products from a coke ovenis shown in Figure 5-21 [22]. From a ton of coal, a modern by-product cokeoven yields about 1500 lb of coke, 11,000 ft3 of gas, 8 to 10 gallons of lightoil, and 25 lb of chemicals, mostly ammonium compounds. The by-productgas and tar vapors leaving the coke oven undergo a separation process toremove the tars from the gas. The gas then is treated to recover ammonia,as ammonium sulfate or phosphate, while the tars are fractionated by distil-lation into three oil cuts, which are designated as light, middle (or tar acid),or heavy oil. The gas, mainly a mixture of hydrogen and methane, has aboutone-half the heating value of natural gas and is used on-site as fuel in the fluechambers in the coke ovens or in the furnaces used for heat-treating finishedsteel [22].
The light-oil cut (boiling point, <430◦F) from the distillation of thecoal tar consists primarily of benzene (45–72%), toluene (11–19%), xylenes(3–8%), styrene (1–1.5%), and indene (1–1.5%); it is either processed intogasoline and aviation fuels or fractionated to provide solvents and feedstocksfor chemical industries [19]. In either case, sulfur compounds, nitrogen bases,and undesirable unsaturates are removed. Middle oils are usually cut to
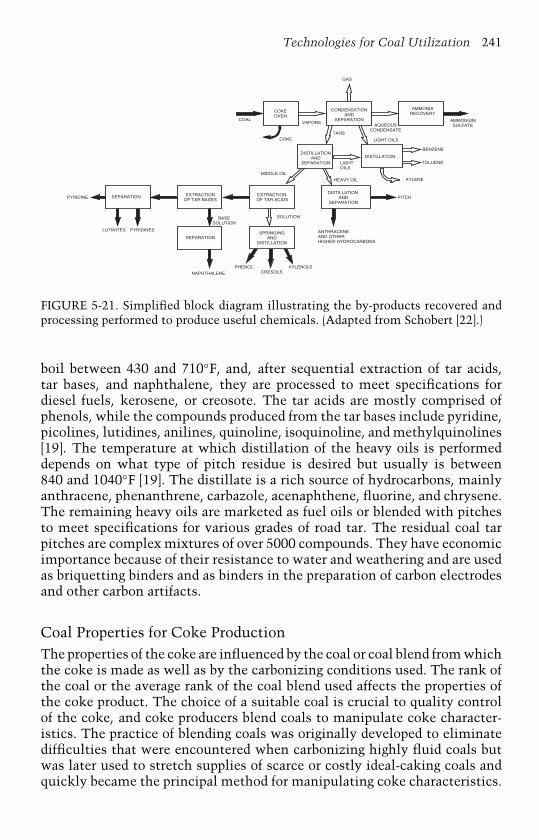
Technologies for Coal Utilization 241
GAS
COALVAPORS
COKETARS
AQUEOUSCONDENSATE
AMMONIUMSULFATE
LIGHT OILS
BENZENE
TOLUENE
XYLENE
PITCH
LIGHTOILS
HEAVY OIL
PYRIDINE
MIDDLE OIL
SOLUTIONBASESOLUTION
LUTINITES PYRIDINES
NAPHTHALENE
PHENOLCRESOLS
XYLENOLS
ANTHRACENEAND OTHER HIGHER HYDROCARBONS
CONDENSATIONAND
SEPARATION
COKEOVEN
AMMONIARECOVERY
DISTILLATION AND
SEPARATION
DISTILLATIONAND
SEPARATION
EXTRACTION OF TAR ACIDS
EXTRACTIONOF TAR BASES
SEPARATION
SEPARATIONSPRINGING
ANDDISTILLATION
DISTILLATION
FIGURE 5-21. Simplified block diagram illustrating the by-products recovered andprocessing performed to produce useful chemicals. (Adapted from Schobert [22].)
boil between 430 and 710◦F, and, after sequential extraction of tar acids,tar bases, and naphthalene, they are processed to meet specifications fordiesel fuels, kerosene, or creosote. The tar acids are mostly comprised ofphenols, while the compounds produced from the tar bases include pyridine,picolines, lutidines, anilines, quinoline, isoquinoline, and methylquinolines[19]. The temperature at which distillation of the heavy oils is performeddepends on what type of pitch residue is desired but usually is between840 and 1040◦F [19]. The distillate is a rich source of hydrocarbons, mainlyanthracene, phenanthrene, carbazole, acenaphthene, fluorine, and chrysene.The remaining heavy oils are marketed as fuel oils or blended with pitchesto meet specifications for various grades of road tar. The residual coal tarpitches are complex mixtures of over 5000 compounds. They have economicimportance because of their resistance to water and weathering and are usedas briquetting binders and as binders in the preparation of carbon electrodesand other carbon artifacts.
Coal Properties for Coke ProductionThe properties of the coke are influenced by the coal or coal blend from whichthe coke is made as well as by the carbonizing conditions used. The rank ofthe coal or the average rank of the coal blend used affects the properties ofthe coke product. The choice of a suitable coal is crucial to quality controlof the coke, and coke producers blend coals to manipulate coke character-istics. The practice of blending coals was originally developed to eliminatedifficulties that were encountered when carbonizing highly fluid coals butwas later used to stretch supplies of scarce or costly ideal-caking coals andquickly became the principal method for manipulating coke characteristics.
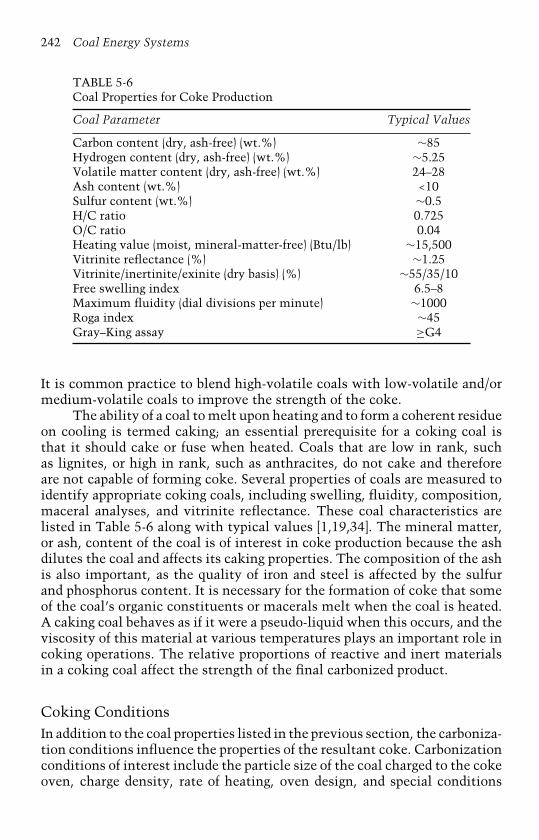
242 Coal Energy Systems
TABLE 5-6Coal Properties for Coke Production
Coal Parameter Typical Values
Carbon content (dry, ash-free) (wt.%) ∼85Hydrogen content (dry, ash-free) (wt.%) ∼5.25Volatile matter content (dry, ash-free) (wt.%) 24–28Ash content (wt.%) <10Sulfur content (wt.%) ∼0.5H/C ratio 0.725O/C ratio 0.04Heating value (moist, mineral-matter-free) (Btu/lb) ∼15,500Vitrinite reflectance (%) ∼1.25Vitrinite/inertinite/exinite (dry basis) (%) ∼55/35/10Free swelling index 6.5–8Maximum fluidity (dial divisions per minute) ∼1000Roga index ∼45Gray–King assay ≥G4
It is common practice to blend high-volatile coals with low-volatile and/ormedium-volatile coals to improve the strength of the coke.
The ability of a coal to melt upon heating and to form a coherent residueon cooling is termed caking; an essential prerequisite for a coking coal isthat it should cake or fuse when heated. Coals that are low in rank, suchas lignites, or high in rank, such as anthracites, do not cake and thereforeare not capable of forming coke. Several properties of coals are measured toidentify appropriate coking coals, including swelling, fluidity, composition,maceral analyses, and vitrinite reflectance. These coal characteristics arelisted in Table 5-6 along with typical values [1,19,34]. The mineral matter,or ash, content of the coal is of interest in coke production because the ashdilutes the coal and affects its caking properties. The composition of the ashis also important, as the quality of iron and steel is affected by the sulfurand phosphorus content. It is necessary for the formation of coke that someof the coal’s organic constituents or macerals melt when the coal is heated.A caking coal behaves as if it were a pseudo-liquid when this occurs, and theviscosity of this material at various temperatures plays an important role incoking operations. The relative proportions of reactive and inert materialsin a coking coal affect the strength of the final carbonized product.
Coking ConditionsIn addition to the coal properties listed in the previous section, the carboniza-tion conditions influence the properties of the resultant coke. Carbonizationconditions of interest include the particle size of the coal charged to the cokeoven, charge density, rate of heating, oven design, and special conditions
Technologies for Coal Utilization 243
such as preheating and partial briquetting. It is important to pulverize thecoals (measured as the quantity of coal passing a 1/8-in. screen, which istypically 80% but can vary from 50 to 100%) to reduce the inert particles ofthe coal as well as to reduce the size of coal particles that exhibit low flu-idities [2]. Higher levels of pulverization tend to make a more homogenousmixture of the reactive and inert components of the coals blended. The bulkdensity of the coal charged to the oven is also adjusted in order to producedenser or more homogenous cokes. In addition to varying the coal particlesize, this adjustment is accomplished by adding small amounts of water oroil to the blend.
There has been much effort to increase the productivity of coke ovensthrough improved oven design and operating practices. The rate of heatingthe coal charge has been shown to be important in coke yield and properties[2]. As coking rate is increased, the coke size, shatter index, and stabilitydecrease while the hardness factor increases. Coke size becomes more uni-form with increased heating rate. Faster coking rates and the resultant in situcrushing are advantages to the iron makers who crush coke to produce auniformly sized burden for the furnace [2]. Preheating high-oxygen coals ormarginally coking coals can substantially improve the quality of coke fromthese coals and reduce the required coking times [2]. Coking times for thesecoals can be reduced by 30 to 45%, while preheating strengthens the resultantcokes.
In an effort to reduce the cost of blast furnace coke and to extend therange of ranks and types of coals that can be incorporated into blast furnacecoke blends, formed coke processes have been developed. Formed coke pro-cesses involve carbonizing coal or a blend of coals (that may contain low-rankor highly volatile coals) that have been compressed into shaped briquettes.
Low-Temperature CarbonizationLow-temperature carbonization was originally developed to provide towngas for residential and street lighting and to manufacture a smokeless fuelfor domestic and industrial heating. The by-product tars were economicallyimportant and were often essential feedstocks for the chemical industry orwere refined to gasoline, heating oils, and lubricants [19]. Low-temperaturecarbonization evolved and was used extensively in industrialized Europeancountries but was eventually abandoned after 1945 as oil and natural gasbecame widely available. These early processes used fixed- and moving-bed technology, operated in batch or continuous mode, and consisted ofvertical or horizontal retorts with direct or indirect heating [1]. In the1970s, interest in low-temperature carbonization was resurrected after theoil crisis. Most of the techniques utilized now, however, are different andmainly consist of using fluidized-bed or entrained-flow pyrolyzers. Someof the low-temperature carbonization technologies are the FMC Coke,COED, U.S. Steel Coke, Occidental Pyrolysis, Lurgi-Ruhrgas, Coalite,
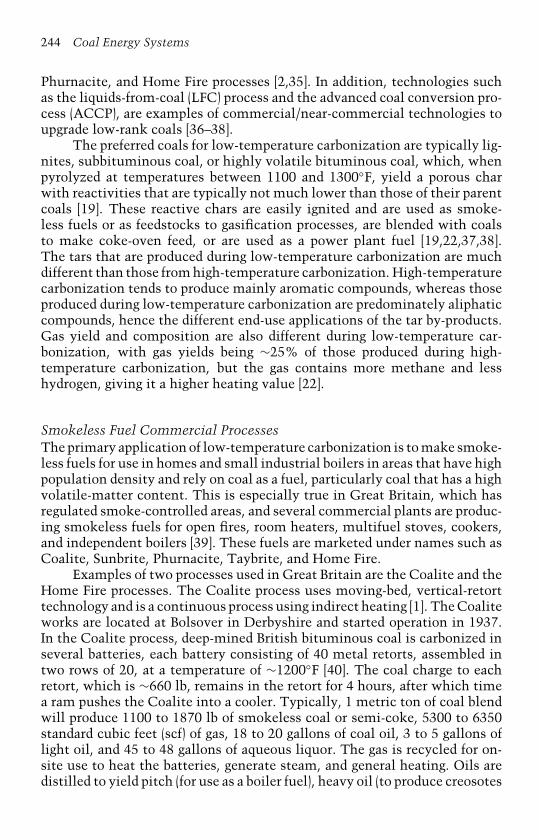
244 Coal Energy Systems
Phurnacite, and Home Fire processes [2,35]. In addition, technologies suchas the liquids-from-coal (LFC) process and the advanced coal conversion pro-cess (ACCP), are examples of commercial/near-commercial technologies toupgrade low-rank coals [36–38].
The preferred coals for low-temperature carbonization are typically lig-nites, subbituminous coal, or highly volatile bituminous coal, which, whenpyrolyzed at temperatures between 1100 and 1300◦F, yield a porous charwith reactivities that are typically not much lower than those of their parentcoals [19]. These reactive chars are easily ignited and are used as smoke-less fuels or as feedstocks to gasification processes, are blended with coalsto make coke-oven feed, or are used as a power plant fuel [19,22,37,38].The tars that are produced during low-temperature carbonization are muchdifferent than those from high-temperature carbonization. High-temperaturecarbonization tends to produce mainly aromatic compounds, whereas thoseproduced during low-temperature carbonization are predominately aliphaticcompounds, hence the different end-use applications of the tar by-products.Gas yield and composition are also different during low-temperature car-bonization, with gas yields being ∼25% of those produced during high-temperature carbonization, but the gas contains more methane and lesshydrogen, giving it a higher heating value [22].
Smokeless Fuel Commercial ProcessesThe primary application of low-temperature carbonization is to make smoke-less fuels for use in homes and small industrial boilers in areas that have highpopulation density and rely on coal as a fuel, particularly coal that has a highvolatile-matter content. This is especially true in Great Britain, which hasregulated smoke-controlled areas, and several commercial plants are produc-ing smokeless fuels for open fires, room heaters, multifuel stoves, cookers,and independent boilers [39]. These fuels are marketed under names such asCoalite, Sunbrite, Phurnacite, Taybrite, and Home Fire.
Examples of two processes used in Great Britain are the Coalite and theHome Fire processes. The Coalite process uses moving-bed, vertical-retorttechnology and is a continuous process using indirect heating [1]. The Coaliteworks are located at Bolsover in Derbyshire and started operation in 1937.In the Coalite process, deep-mined British bituminous coal is carbonized inseveral batteries, each battery consisting of 40 metal retorts, assembled intwo rows of 20, at a temperature of ∼1200◦F [40]. The coal charge to eachretort, which is ∼660 lb, remains in the retort for 4 hours, after which timea ram pushes the Coalite into a cooler. Typically, 1 metric ton of coal blendwill produce 1100 to 1870 lb of smokeless coal or semi-coke, 5300 to 6350standard cubic feet (scf) of gas, 18 to 20 gallons of coal oil, 3 to 5 gallons oflight oil, and 45 to 48 gallons of aqueous liquor. The gas is recycled for on-site use to heat the batteries, generate steam, and general heating. Oils aredistilled to yield pitch (for use as a boiler fuel), heavy oil (to produce creosotes

Technologies for Coal Utilization 245
and disinfectants), and middle and light oils (to produce phenols, cresols, andxylenols). The liquor contains dissolved chemicals—principally, ammonia,monohydric and dihydric phenols—and through extraction and fractionationa wide range of chemicals is produced, including catechol, resorcinol, andmethyl resorcinol. Coalite is the leading manufacturer of smokeless fuel inthe United Kingdom. The Home Fire process uses a blend of bituminouscoals and fluidized-bed technology. At the Home Fire plant, located nearCoventry, the coal is crushed to 1/4-in. particles, dried, and devolatilizedfor 20 minutes at 800◦F in a fluidized-bed reactor [22,35]. The hot char isextruded into hexagonal briquettes, cooled, and quenched.
Low-Rank Coal UpgradingThe U.S. Department of Energy (DOE) cofunded two programs through theirClean Coal Technology (CCT) program (which is discussed in detail in Chap-ter 7, Future Power Generation) in which low-rank coals were upgradedusing low-temperature pyrolysis/thermal upgrading technologies as part ofthe process. Western U.S. low-rank coals, primarily subbituminous coals andlignite, are generally low in sulfur, making them (specifically, the subbitumi-nous coals) attractive as power plant fuels in place of high-sulfur eastern U.S.coals; however, disadvantages of the low-rank coals are high moisture con-tent and low heating value. Consequently, two new processes—ENCOAL’sliquids-from-coal process and Rosebud SynCoal Partnership’s advanced coalconversion process—have been developed and successfully demonstrated,and are ready for commercialization.
The LFC technology uses a mild pyrolysis or mild gasification processto produce a low-sulfur, high-heating value fuel and a coal-derived liquid [36–38,41]. In the process, coal that has undergone some coal drying is fed into apyrolyzer that is operated near 1000◦F to remove any remaining moisture andrelease volatile gases. The solid fuel—process-derived fuel (PDF)—is used asa boiler fuel. The pyrolysis gas stream is sent through a cyclone to removeentrained particles and then cooled to condense the desired hydrocarbons—coal-derived liquids (CDLs)—and stop any secondary reactions. The CDLswere utilized at seven industrial fuel users and one steel mill blast fur-nace during the 5-year demonstration; however, studies were performedon upgrading the CDLs to produce cresylic acids, petroleum refinery feed-stock for producing transportation fuels, oxygenated liquids, and pitch.The process was demonstrated for approximately 5 years in a plant feeding1000 short tons coal per day located near the Buckskin Mine (Triton CoalCompany) in Gillette, Wyoming, and produced over 83,000 short tons of solidfuel product and 4.9 million gallons of liquid product. The process is con-sidered commercial and is actively being marketed in the United States (inthe Powder River Basin, Alaska’s Beluga field, and the lignite fields of NorthDakota and Texas) and abroad (in China, Indonesia, and Russia) [37,41,42];five detailed commercial feasibility studies have been completed [42].

246 Coal Energy Systems
A large-scale commercial plant has been designed, with participation fromMitsubishi Heavy Industries, to utilize 15,000 metric tons coal feed. Theplant, located near Gillette, Wyoming, has received the Industrial SitingPermit and an Air Quality Construction Permit, but is on hold due to lack offunding [42].
The ACCP process is an advanced thermal conversion process coupledwith physical cleaning techniques to upgrade high-moisture, low-rank coalsto produce a high-quality, low-sulfur fuel. In this process, coal is fed to avibratory fluidized-bed reactor to remove surface moisture. It then flows toa second vibratory reactor, where coal is heated to 600◦F to remove chemi-cally bound water, carboxyl groups, volatile sulfur compounds, and a smallamount of tar. In this process, the volatiles are not collected but are used in aprocess heater. The technology was demonstrated from 1993 to 2001 (longerthan the planned 5-year period) in a 45-short ton/hour facility located adja-cent to a unit train load-out facility at Western Energy Company’s Rosebudcoal mine near Colstrip, Montana, in which 2.8 million short tons of raw coalwere processed. Nearly 1.9 million short tons of SynCoal were produced andshipped to various customers, including cement and lime kilns and utilityboilers, and the product was used as a betonite additive in the foundry indus-try. Three different feedstocks were tested at the ACCP facility—two NorthDakota lignites and a subbituminous coal—and the products were fired ina utility boiler located in North Dakota and three utility boilers locatedin Montana [43]. The technology is being marketed and promoted world-wide, and a project was actively pursued for Minnkota’s Milton R. YoungPower Station, which had test fired SynCoal produced from one of the NorthDakota lignites; however, the project was suspended due to a lack of equityinvestors.
Gasification
Gasification is a process to upgrade a solid feedstock, which is difficult tohandle, by removing undesirable impurities and converting it into a gaseousform that can be purified and used directly as a fuel or further reacted to pro-duce other gaseous or liquid fuels, or chemicals. There are many reasons forthe interest in gasification as a process for utilizing coal. Liquid and gaseousfuels are easier to handle and use than coal, whether the fuel is used forheating, cooking, transportation, or power production. Shipping coal can bedifficult and labor intensive and can have negative environmental impacts.Impurities in coal can be more readily removed through gasification thanwhen utilized directly. Synthetic fuels burn more cleanly than coal, andfewer sulfur and nitrogen oxides are formed during combustion. Carbon cap-ture and sequestration is easier in a gasification system than in a combustionsystem, which is important with carbon dioxide being considered for regu-lation as a pollutant. Gasification of coal is especially attractive to nations

Technologies for Coal Utilization 247
that have coal reserves and lack reserves of oil and gas or are depleting them.And, finally, gasification of coal reduces the concerns of volatile swings inavailability and cost of gaseous or liquid fuels that are experienced withpetroleum or natural gas. Although the use of coal gasification is currentlyrather limited, this technology is poised to be the technology of the future forthe production of electricity, steam, chemicals, and fuels such as hydrogen.This is further expanded upon in Chapter 7 (Future Power Generation).
This section summarizes gasification as a technology for utilizing coal,beginning with a brief introduction of the history of gasification. This isfollowed by a discussion of gasification principles and a review of gasifiertypes, specifically those that are commercially available. The influence ofcoal properties on gasification is presented and the regional distribution ofgasifiers in the world is briefly discussed, followed by brief descriptionsof the main gasification technologies currently being used.
Brief History of Coal GasificationThe discovery of gases from coal, as verified by written records, dates backto the early 1600s. In 1609, a Belgian chemist, Jan van Helmont, observedthat gas was evolved from coal when it was heated [22]. At the end of the1600s, a clergyman from Yorkshire, England, John Clayton, experimentedwith collecting gas from coal. In 1792, William Murdock, a Scottish engineer,pioneered the commercial gasification of coal using the technique of heatingcoal in a retort in the absence of air to convert coal to gas and coke. The gasproduced in this manner (i.e., carbonization) has several names: coal gas,town gas, city gas, or illuminating gas. By 1798, gas-lighting systems werebeing installed in factories and mills in England; these applications werefollowed by their installation as street-lighting systems beginning in 1807.By 1816, most of London was lit by gas.
In 1816, the Baltimore Gas Company, the first coal gasification com-pany in the United States, was established. Gas lighting spread throughoutthe east coast: Boston in 1821, New York in 1823, and Philadelphia in 1841[22]. By the mid-1920s, about 20% of the gas supply in the United States wasbeing produced from coal [22]. Prior to World War II, at least 20,000 gasifierswere operating in the United States. In the 1940s, the increasing availabilityof low-cost natural gas led to its substitution for gases derived from coal andthe demise of the gasifiers. In the 1950s and 1960s, petroleum dominatedthe market, and no new gasification processes emerged; few coal gasifica-tion plants were installed in the United States [2]. It was not until the late1960s and early 1970s, when the United States began to experience naturalgas shortages and the oil embargo of the 1970s occurred, that the signifi-cance of coal reserves was recognized. This recognition led to a tremendoussurge in interest in coal utilization, primarily in the areas of gasification andliquefaction (i.e., production of coal to liquid products).
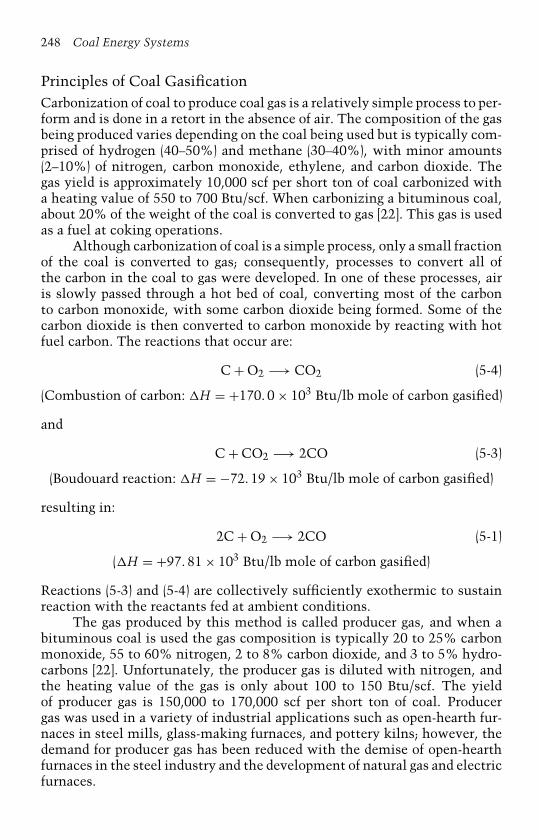
248 Coal Energy Systems
Principles of Coal GasificationCarbonization of coal to produce coal gas is a relatively simple process to per-form and is done in a retort in the absence of air. The composition of the gasbeing produced varies depending on the coal being used but is typically com-prised of hydrogen (40–50%) and methane (30–40%), with minor amounts(2–10%) of nitrogen, carbon monoxide, ethylene, and carbon dioxide. Thegas yield is approximately 10,000 scf per short ton of coal carbonized witha heating value of 550 to 700 Btu/scf. When carbonizing a bituminous coal,about 20% of the weight of the coal is converted to gas [22]. This gas is usedas a fuel at coking operations.
Although carbonization of coal is a simple process, only a small fractionof the coal is converted to gas; consequently, processes to convert all ofthe carbon in the coal to gas were developed. In one of these processes, airis slowly passed through a hot bed of coal, converting most of the carbonto carbon monoxide, with some carbon dioxide being formed. Some of thecarbon dioxide is then converted to carbon monoxide by reacting with hotfuel carbon. The reactions that occur are:
C + O2 −→ CO2 (5-4)
(Combustion of carbon: �H = +170. 0 × 103 Btu/lb mole of carbon gasified)
and
C + CO2 −→ 2CO (5-3)
(Boudouard reaction: �H = −72. 19 × 103 Btu/lb mole of carbon gasified)
resulting in:
2C + O2 −→ 2CO (5-1)
(�H = +97. 81 × 103 Btu/lb mole of carbon gasified)
Reactions (5-3) and (5-4) are collectively sufficiently exothermic to sustainreaction with the reactants fed at ambient conditions.
The gas produced by this method is called producer gas, and when abituminous coal is used the gas composition is typically 20 to 25% carbonmonoxide, 55 to 60% nitrogen, 2 to 8% carbon dioxide, and 3 to 5% hydro-carbons [22]. Unfortunately, the producer gas is diluted with nitrogen, andthe heating value of the gas is only about 100 to 150 Btu/scf. The yieldof producer gas is 150,000 to 170,000 scf per short ton of coal. Producergas was used in a variety of industrial applications such as open-hearth fur-naces in steel mills, glass-making furnaces, and pottery kilns; however, thedemand for producer gas has been reduced with the demise of open-hearthfurnaces in the steel industry and the development of natural gas and electricfurnaces.

Technologies for Coal Utilization 249
The temperatures developed in the fuel bed during Reactions (5-3) and(5-4) can be very high, and, when the ash in the bed is fusible, the endothermiccarbon–steam reaction must be imposed by adding steam to the air:
C+H2O−→CO+H2 (5-7)
(Carbon–steam reaction: �H =−58.35×10³ Btu/lb mole of carbon gasified)
This reaction moderates the temperature and yields hydrogen in the prod-uct gas. This mixture of carbon monoxide and hydrogen is also called watergas. The water gas process is cyclic and involves a gas-making period dur-ing which the fuel bed is blown with steam to produce carbon monoxideand hydrogen, followed by an air-blowing period during which the heat isgenerated in the fuel bed. A typical water gas contains 50% hydrogen, 40%carbon monoxide, and small amounts of carbon dioxide and nitrogen andhas a heating value of 300 Btu/scf. When a water-gas generator is beingblown with air to reheat the bed, producer gas is made from the reactionof the hot carbon with oxygen, yielding about 35,000 scf of water gas and80,000 scf of producer gas from one short ton of coal [22]. Water gas is a use-ful starting material for synthesizing chemicals or liquid fuels and is a goodsource of hydrogen. Treating the water gas with steam oxidizes the carbonmonoxide to carbon dioxide and increases the amount of hydrogen by theequation:
CO + H2O −→ CO2 + H2 (5-8)
(Water-gas shift reaction: �H = +3. 83 × 103 Btu/lb mole of carbon gasified)
The carbon dioxide can be removed from the product stream, leavingreasonably pure hydrogen.
Hydrogen can also be reacted with carbon at elevated pressures by thecarbon hydrogenation or hydrogasification reaction:
C + 2H2 −→ CH4 (5-24)
(�H = +39. 38 × 103 Btu/lb mole of carbon gasified)
and whenever the carbon source generates volatile matter, further quantitiesof methane will form by thermal cracking.
Gasifier TypesGasification processes are classified on the basis of the method used to bringthe coal into contact with the gasifying medium (air or oxygen). The threeprincipal commercial modes are fixed-bed, fluidized-bed, and entrained-flowsystems. Their principal features are illustrated in Figure 5-22 [2] and theirimportant characteristics are listed in Table 5-7 [44].
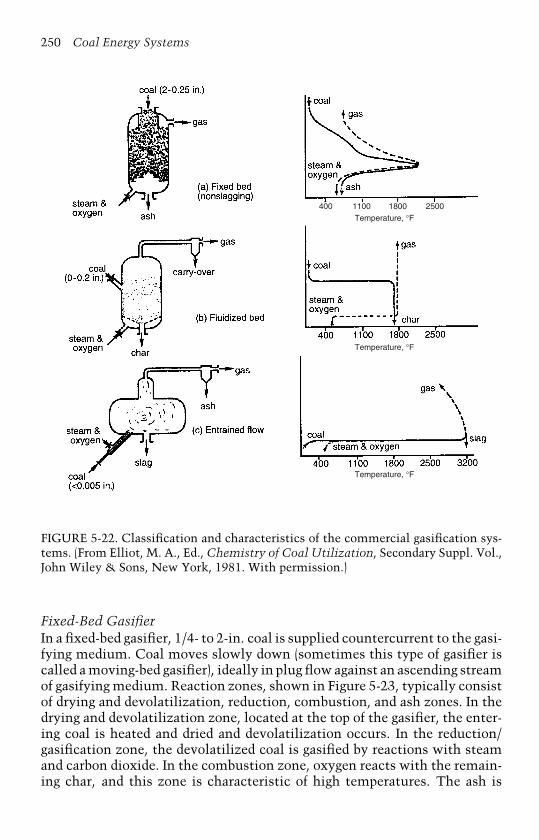
250 Coal Energy Systems
400 1100
Temperature, °F
Temperature, °F
Temperature, °F
1800 2500
FIGURE 5-22. Classification and characteristics of the commercial gasification sys-tems. (From Elliot, M. A., Ed., Chemistry of Coal Utilization, Secondary Suppl. Vol.,John Wiley & Sons, New York, 1981. With permission.)
Fixed-Bed GasifierIn a fixed-bed gasifier, 1/4- to 2-in. coal is supplied countercurrent to the gasi-fying medium. Coal moves slowly down (sometimes this type of gasifier iscalled a moving-bed gasifier), ideally in plug flow against an ascending streamof gasifying medium. Reaction zones, shown in Figure 5-23, typically consistof drying and devolatilization, reduction, combustion, and ash zones. In thedrying and devolatilization zone, located at the top of the gasifier, the enter-ing coal is heated and dried and devolatilization occurs. In the reduction/gasification zone, the devolatilized coal is gasified by reactions with steamand carbon dioxide. In the combustion zone, oxygen reacts with the remain-ing char, and this zone is characteristic of high temperatures. The ash is
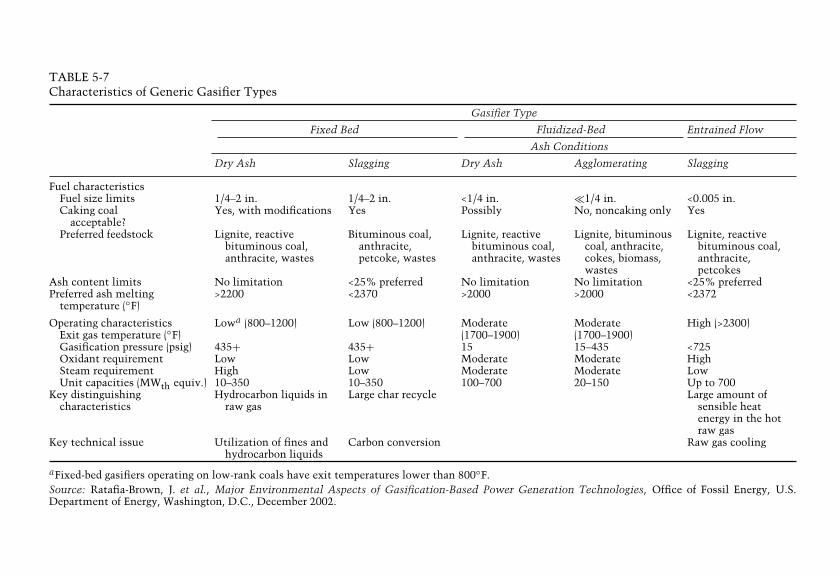
TABLE 5-7Characteristics of Generic Gasifier Types
Gasifier Type
Fixed Bed Fluidized-Bed Entrained Flow
Ash Conditions
Dry Ash Slagging Dry Ash Agglomerating Slagging
Fuel characteristicsFuel size limits 1/4–2 in. 1/4–2 in. <1/4 in. �1/4 in. <0.005 in.Caking coal
acceptable?Yes, with modifications Yes Possibly No, noncaking only Yes
Preferred feedstock Lignite, reactivebituminous coal,anthracite, wastes
Bituminous coal,anthracite,petcoke, wastes
Lignite, reactivebituminous coal,anthracite, wastes
Lignite, bituminouscoal, anthracite,cokes, biomass,wastes
Lignite, reactivebituminous coal,anthracite,petcokes
Ash content limits No limitation <25% preferred No limitation No limitation <25% preferredPreferred ash melting
temperature (◦F)>2200 <2370 >2000 >2000 <2372
Operating characteristicsExit gas temperature (◦F)
Lowa (800–1200) Low (800–1200) Moderate(1700–1900)
Moderate(1700–1900)
High (>2300)
Gasification pressure (psig) 435+ 435+ 15 15–435 <725Oxidant requirement Low Low Moderate Moderate HighSteam requirement High Low Moderate Moderate LowUnit capacities (MWth equiv.) 10–350 10–350 100–700 20–150 Up to 700
Key distinguishingcharacteristics
Hydrocarbon liquids inraw gas
Large char recycle Large amount ofsensible heatenergy in the hotraw gas
Key technical issue Utilization of fines andhydrocarbon liquids
Carbon conversion Raw gas cooling
aFixed-bed gasifiers operating on low-rank coals have exit temperatures lower than 800◦F.Source: Ratafia-Brown, J. et al., Major Environmental Aspects of Gasification-Based Power Generation Technologies, Office of Fossil Energy, U.S.Department of Energy, Washington, D.C., December 2002.

252 Coal Energy Systems
Coal
Productgas
Drying anddevolatilization zone
Reduction zone
Combustion zone
Ash zoneAsh zoneAsh zone
Ash
Steam& oxygen
FIGURE 5-23. Reaction zones in a fixed-bed gasifier. (From Elliot, M. A., Editor,Chemistry of Coal Utilization, Secondary Suppl. Vol., John Wiley & Sons, NewYork, 1981. With permission.)
removed from the bottom of the gasifier either in dry form if the temperaturein the gasifier is controlled with excess steam to maintain the temperaturebelow the ash fusion point or as liquid slag. Both the ash and the productgas leave at modest temperature as a result of heat exchange with the enter-ing gasifying medium and fuel, respectively. Fixed-bed gasifiers have thefollowing characteristics [44]:
• Low oxidant requirements;• Design modifications required for handling caking coal;• High cold-gas thermal efficiency when the heating value of the
hydrocarbon liquids is included;• Limited ability to handle fines.
Fluidized-Bed GasifierIn a fluidized-bed gasifier, coal crushed to less than 1/8 to 1/4 in. in sizeenters the side of the reactor and is kept suspended by the gasifying medium.Similar to a fluidized-bed combustor, mixing and heat transfer are rapid,resulting in uniform composition and temperature throughout the bed. Thetemperature is sustained below the ash fusion temperature, which avoidsclinker formation and possible slumping (i.e., de-fluidization of the bed).Some char particles are entrained in the product gas as it leaves the gasifier,

Technologies for Coal Utilization 253
but they are recovered and recycled back into the gasifier via a cyclone. Theash is discharged with the char, and the product gas and char temperaturesare high, with some heat transfer occurring with the incoming steam andrecycled gas. Fluidized-bed gasifiers have the following characteristics [44]:
• Acceptance of a wide range of solid feedstock (including solid waste,wood, and high ash content coals);
• Uniform temperature;• Moderate oxygen and steam requirements;• Extensive char recycling.
Entrained-Flow GasifierIn the entrained-flow gasifier, pulverized coal (<0.005 in.) is entrained withthe gasifying medium to react in co-current flow in a high-temperature flame.Residence time in this type of gasifier is very short. Entrained-flow gasifiersgenerally use oxygen as the oxidant and operate at high temperatures, wellabove ash-slagging conditions, to ensure high carbon conversion. The ashexits the system as a slag. The product gas and slag exit close to the reactiontemperature. Entrained-flow gasifiers have the following characteristics [44]:
• Ability to gasify all coals regardless of coal rank, caking character-istics, or amount of coal fines, although feedstocks with lower ashcontents are favored;
• Uniform temperatures;• Very short fuel residence times in the gasifier;• Very finely sized and homogenous solid fuel required;• Relatively large oxidant requirements;• Large amount of sensible heat in the raw gas;• High-temperature slagging operation;• Entrainment of some molten slag in the raw gas.
Influence of Coal Properties on GasificationCoal properties have a major influence on the process and gasifier design andinclude moisture; ash, volatile matter, and fixed carbon content; caking ten-dencies; reactivity; ash fusion characteristics; and particle size distribution.Some of these properties are listed in Table 5-7, and each is briefly discussedin the following sections.
MoistureFixed-bed gasifiers can accommodate moisture contents of up to 35%, pro-vided the ash content is not in excess of about 10% [2]. Predrying may beperformed if the moisture and ash contents are above these amounts.Entrained-flow or fluidized-bed gasifiers require the moisture content to
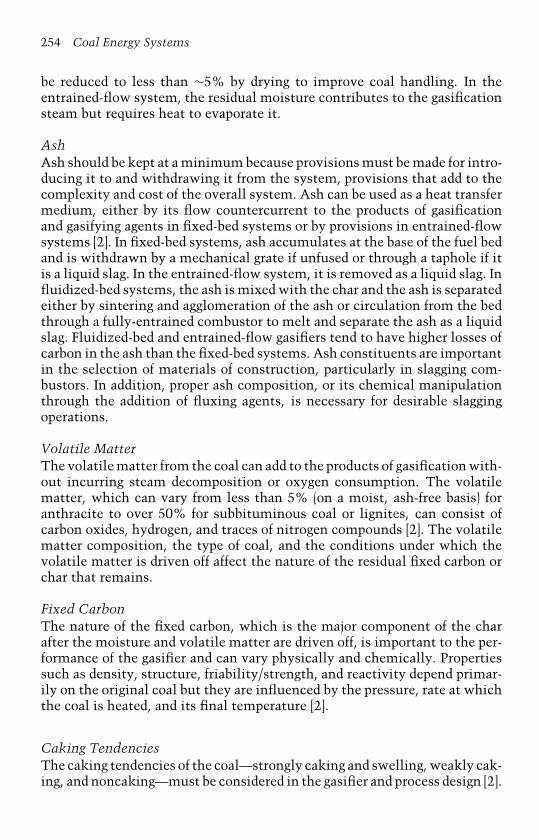
254 Coal Energy Systems
be reduced to less than ∼5% by drying to improve coal handling. In theentrained-flow system, the residual moisture contributes to the gasificationsteam but requires heat to evaporate it.
AshAsh should be kept at a minimum because provisions must be made for intro-ducing it to and withdrawing it from the system, provisions that add to thecomplexity and cost of the overall system. Ash can be used as a heat transfermedium, either by its flow countercurrent to the products of gasificationand gasifying agents in fixed-bed systems or by provisions in entrained-flowsystems [2]. In fixed-bed systems, ash accumulates at the base of the fuel bedand is withdrawn by a mechanical grate if unfused or through a taphole if itis a liquid slag. In the entrained-flow system, it is removed as a liquid slag. Influidized-bed systems, the ash is mixed with the char and the ash is separatedeither by sintering and agglomeration of the ash or circulation from the bedthrough a fully-entrained combustor to melt and separate the ash as a liquidslag. Fluidized-bed and entrained-flow gasifiers tend to have higher losses ofcarbon in the ash than the fixed-bed systems. Ash constituents are importantin the selection of materials of construction, particularly in slagging com-bustors. In addition, proper ash composition, or its chemical manipulationthrough the addition of fluxing agents, is necessary for desirable slaggingoperations.
Volatile MatterThe volatile matter from the coal can add to the products of gasification with-out incurring steam decomposition or oxygen consumption. The volatilematter, which can vary from less than 5% (on a moist, ash-free basis) foranthracite to over 50% for subbituminous coal or lignites, can consist ofcarbon oxides, hydrogen, and traces of nitrogen compounds [2]. The volatilematter composition, the type of coal, and the conditions under which thevolatile matter is driven off affect the nature of the residual fixed carbon orchar that remains.
Fixed CarbonThe nature of the fixed carbon, which is the major component of the charafter the moisture and volatile matter are driven off, is important to the per-formance of the gasifier and can vary physically and chemically. Propertiessuch as density, structure, friability/strength, and reactivity depend primar-ily on the original coal but they are influenced by the pressure, rate at whichthe coal is heated, and its final temperature [2].
Caking TendenciesThe caking tendencies of the coal—strongly caking and swelling, weakly cak-ing, and noncaking—must be considered in the gasifier and process design [2].
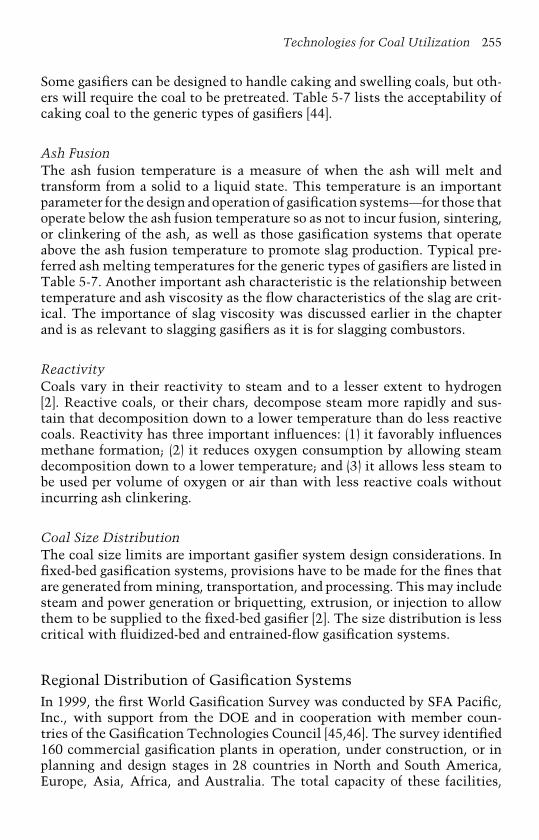
Technologies for Coal Utilization 255
Some gasifiers can be designed to handle caking and swelling coals, but oth-ers will require the coal to be pretreated. Table 5-7 lists the acceptability ofcaking coal to the generic types of gasifiers [44].
Ash FusionThe ash fusion temperature is a measure of when the ash will melt andtransform from a solid to a liquid state. This temperature is an importantparameter for the design and operation of gasification systems—for those thatoperate below the ash fusion temperature so as not to incur fusion, sintering,or clinkering of the ash, as well as those gasification systems that operateabove the ash fusion temperature to promote slag production. Typical pre-ferred ash melting temperatures for the generic types of gasifiers are listed inTable 5-7. Another important ash characteristic is the relationship betweentemperature and ash viscosity as the flow characteristics of the slag are crit-ical. The importance of slag viscosity was discussed earlier in the chapterand is as relevant to slagging gasifiers as it is for slagging combustors.
ReactivityCoals vary in their reactivity to steam and to a lesser extent to hydrogen[2]. Reactive coals, or their chars, decompose steam more rapidly and sus-tain that decomposition down to a lower temperature than do less reactivecoals. Reactivity has three important influences: (1) it favorably influencesmethane formation; (2) it reduces oxygen consumption by allowing steamdecomposition down to a lower temperature; and (3) it allows less steam tobe used per volume of oxygen or air than with less reactive coals withoutincurring ash clinkering.
Coal Size DistributionThe coal size limits are important gasifier system design considerations. Infixed-bed gasification systems, provisions have to be made for the fines thatare generated from mining, transportation, and processing. This may includesteam and power generation or briquetting, extrusion, or injection to allowthem to be supplied to the fixed-bed gasifier [2]. The size distribution is lesscritical with fluidized-bed and entrained-flow gasification systems.
Regional Distribution of Gasification SystemsIn 1999, the first World Gasification Survey was conducted by SFA Pacific,Inc., with support from the DOE and in cooperation with member coun-tries of the Gasification Technologies Council [45,46]. The survey identified160 commercial gasification plants in operation, under construction, or inplanning and design stages in 28 countries in North and South America,Europe, Asia, Africa, and Australia. The total capacity of these facilities,

256 Coal Energy Systems
20,000
18,000
16,000
14,000
12,000
10,000
8000
6000
4000
2000
Planned
Actual
WesternEurope
Asia &Australia
NorthAmerica
Africa &MiddleEast
Eastern Europe& FSU
Central & SouthAmerica
0
MW
th S
ynga
s
FIGURE 5-24. Distribution of gasification projects by geographic region. (From SFAPacific, Inc., and U.S. DOE, Gasification: Worldwide Use and Acceptance, Office ofFossil Energy, U.S. Department of Energy, Washington, D.C., January 2000.)
when in operation, will be more than 15,000 million scf (or 4500 billion Btu)of syngas per day. Figure 5-24 shows the distribution of gasifier projects bygeographic region. A summary of the survey that includes the number ofgasifiers, applications (chemicals, gaseous fuels, and power), and productionby country is provided in Appendix D [46].
Historically, syngas from gasification has been used primarily as feed-stock for the production of chemicals. In 1989, chemical productionaccounted for ∼50% of syngas use worldwide; however, this figure is chang-ing as more power generation projects are being constructed and planned[46]. For new capacity added between 1990 and 1999, the power-to-chemicalsyngas volume ratio was ∼1.4:1. The post-2000 ratio is 3:1 in favor of powergeneration, and by 2005 power production is projected to be nearly that ofchemical production—approximately 5300 million scf per day. Fuels andgases are projected to be approximately 2800 and 1400 million scf per day,respectively. The distribution of gasification applications is illustrated inFigure 5-25 on a megawatt thermal (MWth) syngas basis.
Coal and petroleum-based materials provide the majority of feedstocksfor world gasification capacity, which is projected to rise to about 90% of thetotal capacity. In 1999, coal and petroleum feedstocks accounted for 4900and 3200 scf per day synfuel production, respectively, which is projectedto increase to approximately 6700 scf per day synfuel production for eachfeedstock type by 2005 [46]. This is illustrated in Figure 5-26 on an MWthsyngas basis [45].
Commercial Gasification SystemsGasification of abundant U.S. coal provides an alternative to coal-firedcombustion systems as it is more efficient and environmentally friendly.

Technologies for Coal Utilization 257
MW
th S
ynga
s25,000
20,000
15,000
10,000
5000
0
Planned
Actual
Chemicals Power F-T Liquids Gaseous Fuels Unknown
FIGURE 5-25. Distribution of gasification applications. (From SFA Pacific, Inc., andU.S. DOE, Gasification: Worldwide Use and Acceptance, Office of Fossil Energy,U.S. Department of Energy, Washington, D.C., January 2000.)
30,000
25,000
20,000
15,000
10,000
5000
0
Planned
Actual
Coal Petroleum Gas Petcoke Biomass
MW
th S
yngas
FIGURE 5-26. Gasification by primary feedstocks. (From SFA Pacific, Inc., and U.S.DOE, Gasification: Worldwide Use and Acceptance, Office of Fossil Energy, U.S.Department of Energy, Washington, D.C., January 2000.)
Coal gasification is a well-proven technology that began with the produc-tion of coal gas for towns and progressed to the production of fuels, suchas oil and synthetic natural gas (SNG), chemicals, and more recently, tolarge-scale integrated gasification combined cycle (IGCC) power generation.Currently, the number of operating IGCC power plants is small; however,as listed in Appendix D, several power projects are under construction or inthe planning and design stages, and gasification technology is the center offuture U.S. energy complexes that are under development and discussed indetail in Chapter 7 (Future Power Generation). This section briefly discussesthe gasification technologies used in commercial applications. A descriptionof an IGCC power plant and details of the IGCC power plants in operationand proposed for the future are given in Chapter 7.

258 Coal Energy Systems
25,000
20,000
15,000
10,000
5000
0
Planned
Actual
Texaco Shell Lurgi-DryAsh
BGLSlagger
KrupUhde
Koppers
Destec Othersand Not
Yet Chosen
MW
th S
ynga
s
FIGURE 5-27. Gasification by technology. (From SFA Pacific, Inc., and U.S.DOE, Gasification: Worldwide Use and Acceptance, Office of Fossil Energy, U.S.Department of Energy, Washington, D.C., January 2000.)
The commercially well-proven ChevronTexaco, Shell, and Lurgi dry-ash gasification technologies represent a major portion of the worldwidegasification capacity, as illustrated in Figure 5-27 [45]. In addition, thesethree technologies represent 27 of the 30 largest commercial projects in theworld (see Table 5-8) [45]. ChevronTexaco is the leading licensor of gasifica-tion technology based on total capacity, followed by Lurgi dry-ash and Shelltechnologies. There appears to be little interest in new Lurgi dry-ash gasi-fiers, which is probably due to limitations regarding the feedstock, such asthe use of petroleum coke, and the extensive waste liquid clean-up require-ments. These limitations do not exist for the ChevronTexaco and Shelltechnologies.
Fixed-Bed GasifiersFixed-bed gasifiers differ in exit gas conditions and in special design con-figurations. There are two main commercial fixed-bed gasifier technologies.The Lurgi dry-ash gasifier was originally developed in the 1930s and hasbeen used extensively for town gas production and in South Africa by Sasol(South African Coal Oil and Gas Corporation) for chemicals from coal. In fact,of the chemicals produced worldwide from syngas, Sasol produces nearly athird of them and uses Lurgi gasifiers to do so. Also, Lurgi gasifiers are usedin Dakota Gasification’s Great Plains Synfuels Plant located near Beulah,North Dakota, which is the only facility in the United States that manu-factures a high-Btu synthetic natural gas from lignite; 17,000 short tons oflignite are processed daily to produce 148 million scf per day of SNG alongwith by-product chemicals. In the dry-ash Lurgi gasifier, the temperatureat the bottom of the bed is kept below the ash fusion point so that the ashis removed as a solid. In the 1970s, Lurgi and the British Gas Corporation
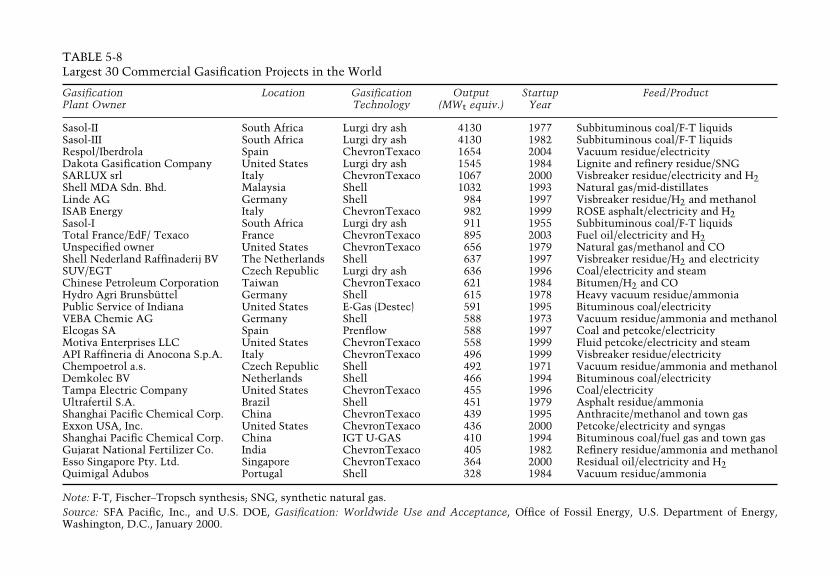
TABLE 5-8Largest 30 Commercial Gasification Projects in the World
Gasification Location Gasification Output Startup Feed/ProductPlant Owner Technology (MWt equiv.) Year
Sasol-II South Africa Lurgi dry ash 4130 1977 Subbituminous coal/F-T liquidsSasol-III South Africa Lurgi dry ash 4130 1982 Subbituminous coal/F-T liquidsRespol/Iberdrola Spain ChevronTexaco 1654 2004 Vacuum residue/electricityDakota Gasification Company United States Lurgi dry ash 1545 1984 Lignite and refinery residue/SNGSARLUX srl Italy ChevronTexaco 1067 2000 Visbreaker residue/electricity and H2Shell MDA Sdn. Bhd. Malaysia Shell 1032 1993 Natural gas/mid-distillatesLinde AG Germany Shell 984 1997 Visbreaker residue/H2 and methanolISAB Energy Italy ChevronTexaco 982 1999 ROSE asphalt/electricity and H2Sasol-I South Africa Lurgi dry ash 911 1955 Subbituminous coal/F-T liquidsTotal France/EdF/ Texaco France ChevronTexaco 895 2003 Fuel oil/electricity and H2Unspecified owner United States ChevronTexaco 656 1979 Natural gas/methanol and COShell Nederland Raffinaderij BV The Netherlands Shell 637 1997 Visbreaker residue/H2 and electricitySUV/EGT Czech Republic Lurgi dry ash 636 1996 Coal/electricity and steamChinese Petroleum Corporation Taiwan ChevronTexaco 621 1984 Bitumen/H2 and COHydro Agri Brunsbüttel Germany Shell 615 1978 Heavy vacuum residue/ammoniaPublic Service of Indiana United States E-Gas (Destec) 591 1995 Bituminous coal/electricityVEBA Chemie AG Germany Shell 588 1973 Vacuum residue/ammonia and methanolElcogas SA Spain Prenflow 588 1997 Coal and petcoke/electricityMotiva Enterprises LLC United States ChevronTexaco 558 1999 Fluid petcoke/electricity and steamAPI Raffineria di Anocona S.p.A. Italy ChevronTexaco 496 1999 Visbreaker residue/electricityChempoetrol a.s. Czech Republic Shell 492 1971 Vacuum residue/ammonia and methanolDemkolec BV Netherlands Shell 466 1994 Bituminous coal/electricityTampa Electric Company United States ChevronTexaco 455 1996 Coal/electricityUltrafertil S.A. Brazil Shell 451 1979 Asphalt residue/ammoniaShanghai Pacific Chemical Corp. China ChevronTexaco 439 1995 Anthracite/methanol and town gasExxon USA, Inc. United States ChevronTexaco 436 2000 Petcoke/electricity and syngasShanghai Pacific Chemical Corp. China IGT U-GAS 410 1994 Bituminous coal/fuel gas and town gasGujarat National Fertilizer Co. India ChevronTexaco 405 1982 Refinery residue/ammonia and methanolEsso Singapore Pty. Ltd. Singapore ChevronTexaco 364 2000 Residual oil/electricity and H2Quimigal Adubos Portugal Shell 328 1984 Vacuum residue/ammonia
Note: F-T, Fischer–Tropsch synthesis; SNG, synthetic natural gas.Source: SFA Pacific, Inc., and U.S. DOE, Gasification: Worldwide Use and Acceptance, Office of Fossil Energy, U.S. Department of Energy,Washington, D.C., January 2000.

260 Coal Energy Systems
developed a slagging version of the gasifier, referred to as the BGL gasifier,in which the temperature at the bottom of the gasifier is sufficient for theash to melt.
Lurgi Gasifier The most successful fixed-bed gasifier is the Lurgi gasifier,which was developed in Germany during the 1930s as a means to producetown gas. The first commercial plant was built in 1936. It was initiallyused for lignites, but process developments in the 1950s allowed for the useof bituminous coals as well. The Lurgi gasification process has been usedextensively worldwide.
The Lurgi dry-ash gasifier, shown schematically in Figure 5-28, is apressurized gasifier typically operating at 30 to 35 atm. Sized coal enters thetop of the gasifier through a lock hopper and moves down through the bed.Steam and oxygen enter at the bottom and react with the coal as the gasesmove up the bed. Ash is removed at the bottom of the gasifier by a rotatinggrate and lock hopper and is kept in a dry state through the injection of steam
Distributor Drive
Coal Lock
Grate Drive
Steam and Oxygen
Ash Lock
Water Jacket
Tar and Water
Gas Scrubber
Product Gas
WaterSteam
Recycle Tars
Grate
Distributor
FIGURE 5-28. Schematic diagram of a modern Lurgi dry-ash gasifier. (FromBerkowitz, N., An Introduction to Coal Technology, Academic Press, New York,1979. With permission.)
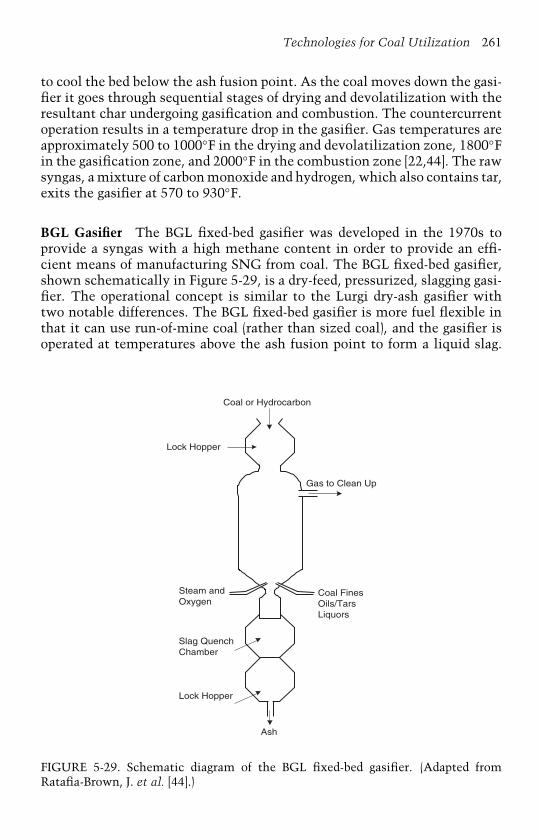
Technologies for Coal Utilization 261
to cool the bed below the ash fusion point. As the coal moves down the gasi-fier it goes through sequential stages of drying and devolatilization with theresultant char undergoing gasification and combustion. The countercurrentoperation results in a temperature drop in the gasifier. Gas temperatures areapproximately 500 to 1000◦F in the drying and devolatilization zone, 1800◦Fin the gasification zone, and 2000◦F in the combustion zone [22,44]. The rawsyngas, a mixture of carbon monoxide and hydrogen, which also contains tar,exits the gasifier at 570 to 930◦F.
BGL Gasifier The BGL fixed-bed gasifier was developed in the 1970s toprovide a syngas with a high methane content in order to provide an effi-cient means of manufacturing SNG from coal. The BGL fixed-bed gasifier,shown schematically in Figure 5-29, is a dry-feed, pressurized, slagging gasi-fier. The operational concept is similar to the Lurgi dry-ash gasifier withtwo notable differences. The BGL fixed-bed gasifier is more fuel flexible inthat it can use run-of-mine coal (rather than sized coal), and the gasifier isoperated at temperatures above the ash fusion point to form a liquid slag.
Coal or Hydrocarbon
Gas to Clean Up
Lock Hopper
Steam andOxygen
Slag QuenchChamber
Coal FinesOils/TarsLiquors
Lock Hopper
Ash
FIGURE 5-29. Schematic diagram of the BGL fixed-bed gasifier. (Adapted fromRatafia-Brown, J. et al. [44].)
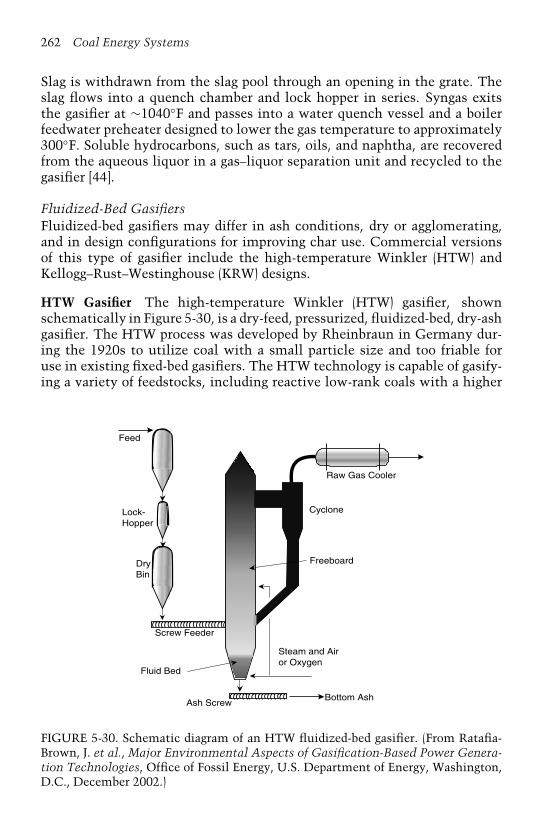
262 Coal Energy Systems
Slag is withdrawn from the slag pool through an opening in the grate. Theslag flows into a quench chamber and lock hopper in series. Syngas exitsthe gasifier at ∼1040◦F and passes into a water quench vessel and a boilerfeedwater preheater designed to lower the gas temperature to approximately300◦F. Soluble hydrocarbons, such as tars, oils, and naphtha, are recoveredfrom the aqueous liquor in a gas–liquor separation unit and recycled to thegasifier [44].
Fluidized-Bed GasifiersFluidized-bed gasifiers may differ in ash conditions, dry or agglomerating,and in design configurations for improving char use. Commercial versionsof this type of gasifier include the high-temperature Winkler (HTW) andKellogg–Rust–Westinghouse (KRW) designs.
HTW Gasifier The high-temperature Winkler (HTW) gasifier, shownschematically in Figure 5-30, is a dry-feed, pressurized, fluidized-bed, dry-ashgasifier. The HTW process was developed by Rheinbraun in Germany dur-ing the 1920s to utilize coal with a small particle size and too friable foruse in existing fixed-bed gasifiers. The HTW technology is capable of gasify-ing a variety of feedstocks, including reactive low-rank coals with a higher
Feed
Lock-Hopper
Raw Gas Cooler
Cyclone
FreeboardDryBin
Steam and Airor Oxygen
Screw Feeder
Fluid Bed
Ash ScrewBottom Ash
FIGURE 5-30. Schematic diagram of an HTW fluidized-bed gasifier. (From Ratafia-Brown, J. et al., Major Environmental Aspects of Gasification-Based Power Genera-tion Technologies, Office of Fossil Energy, U.S. Department of Energy, Washington,D.C., December 2002.)
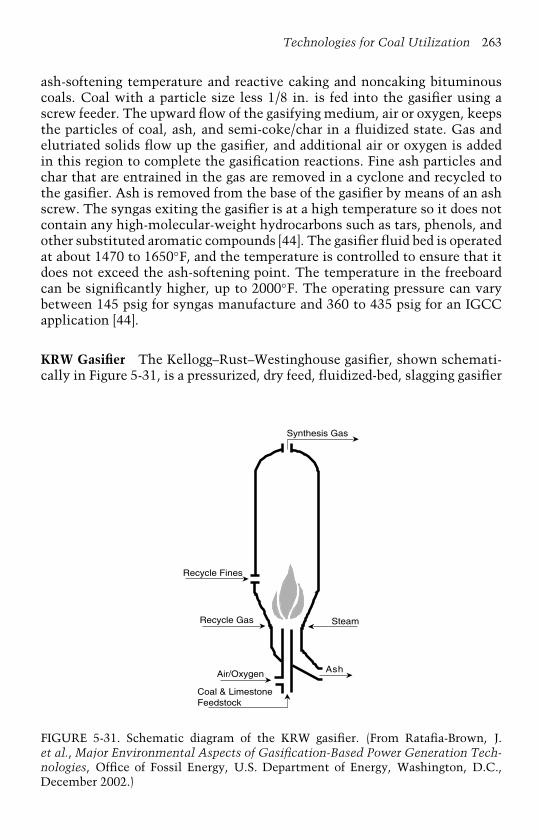
Technologies for Coal Utilization 263
ash-softening temperature and reactive caking and noncaking bituminouscoals. Coal with a particle size less 1/8 in. is fed into the gasifier using ascrew feeder. The upward flow of the gasifying medium, air or oxygen, keepsthe particles of coal, ash, and semi-coke/char in a fluidized state. Gas andelutriated solids flow up the gasifier, and additional air or oxygen is addedin this region to complete the gasification reactions. Fine ash particles andchar that are entrained in the gas are removed in a cyclone and recycled tothe gasifier. Ash is removed from the base of the gasifier by means of an ashscrew. The syngas exiting the gasifier is at a high temperature so it does notcontain any high-molecular-weight hydrocarbons such as tars, phenols, andother substituted aromatic compounds [44]. The gasifier fluid bed is operatedat about 1470 to 1650◦F, and the temperature is controlled to ensure that itdoes not exceed the ash-softening point. The temperature in the freeboardcan be significantly higher, up to 2000◦F. The operating pressure can varybetween 145 psig for syngas manufacture and 360 to 435 psig for an IGCCapplication [44].
KRW Gasifier The Kellogg–Rust–Westinghouse gasifier, shown schemati-cally in Figure 5-31, is a pressurized, dry feed, fluidized-bed, slagging gasifier
Synthesis Gas
Recycle Fines
Recycle Gas
Air/Oxygen
Coal & LimestoneFeedstock
Ash
Steam
FIGURE 5-31. Schematic diagram of the KRW gasifier. (From Ratafia-Brown, J.et al., Major Environmental Aspects of Gasification-Based Power Generation Tech-nologies, Office of Fossil Energy, U.S. Department of Energy, Washington, D.C.,December 2002.)

264 Coal Energy Systems
developed by the M.W. Kellogg Company. The KRW gasifier is capable ofgasifying all types of coals, including high-sulfur, high-ash, low-rank, andhigh-swelling coals. Coal and limestone, crushed to less than 1/4 in., are fedinto the bottom of the gasifier, and air or oxygen enters through concentric,high-velocity jets [44]. This process ensures thorough mixing of the fuel andair or oxygen. The coal immediately releases its volatile matter upon enter-ing the gasifier, and it oxidizes rapidly to produce the heat for the gasificationreactions. An internal recirculation zone is established, with the coal/charmoving down the sides of the gasifier and back into the central jet. Steam thatis introduced with the air or oxygen and through jets in the side of the gasifierreacts with the char to form the syngas. Fine ash particles that are carried outof the bed are captured in a high-efficiency cyclone and reinjected into thegasifier. The internal recycling of the larger char particles results in the charbecoming enriched in ash, and the low-melting components of the ash causethe ash particles to agglomerate. As the ash particles become larger, theybegin to migrate toward the bottom of the gasifier where they are removedalong with spent sorbent (i.e., limestone that has reacted with sulfur to formcalcium sulfide (CaS)) and some unreacted char. The ash, char, and spentsorbent flow into a fluidized-bed sulfator, where the char and calcium sul-fide are oxidized. The calcium sulfide forms calcium sulfate, CaSO4, whichis chemically stable and can be disposed of in a landfill.
Entrained-Flow GasifiersDifferences among entrained-flow gasifiers include the coal feed systems(coal–water slurry or dry coal), internal designs to handle the very hotreaction mixture, and heat-recovery configurations. Entrained-flow gasifiershave been selected for nearly all the coal-based IGCCs currently in operationor under construction [44]. The major commercial entrained-flow gasifiersinclude the ChevronTexaco, Shell, Prenflo, and E-Gas gasifiers. Of these, theChevronTexaco gasifier and the Shell gasifier technologies are in use in over100 units worldwide [44].
ChevronTexaco Gasifier The ChevronTexaco gasifier, shown schemati-cally in Figure 5-32, is a single-stage, down-fired, entrained-flow gasifier [44].A fuel–water slurry (e.g., 60–70% coal) and 95% pure oxygen are fed to thepressurized gasifier. The coal and oxygen react exothermally at a temperatureranging from 2200 to 2700◦F and a pressure greater than 20 atm to producesyngas and molten ash. Operation at the high pressures eliminates the pro-duction of hydrocarbon gases and liquids in the syngas. The hot gases arecooled using either a radiant syngas cooler located inside the gasifier to pro-duce high pressure steam or an exit gas quench. Slag drops into the water poolat the bottom of the gasifier, is quenched and separated from the blackwater,and is removed through a lockhopper. The ChevronTexaco technology hasoperated commercially for over 40 years with feedstocks such as natural gas,

Technologies for Coal Utilization 265
Coal Slurry
Oxygen
Feed Water
Steam
Synthesis Gas
Slag
Water
FIGURE 5-32. Schematic diagram of the ChevronTexaco gasifier. (From Ratafia-Brown, J. et al., Major Environmental Aspects of Gasification-Based Power Genera-tion Technologies, Office of Fossil Energy, U.S. Department of Energy, Washington,D.C., December 2002.)
heavy oil, coal, and petroleum coke. Currently, 60 commercial plants arein operation, with 12 using coke and coal, 28 using oil, and 20 using a gasfeedstock [44].
Shell Gasifier The Shell gasifier, the successor to the Koppers–Totzekprocess and then the Shell–Koppers process, is shown schematically inFigure 5-33 and is a dry-feed, pressurized, entrained-flow, slagging gasifierthat can operate on a wide variety of feedstocks. Pulverized coal is pres-surized in lock hoppers and fed to the gasifier by dense-phase conveyingwith transport gas, which can be nitrogen or syngas [44]. Preheated oxygenis mixed with steam and used as a temperature moderator prior to feedingto the fuel injector. Temperatures and pressures in the gasifier are 2700 to2900◦F and 350 to 650 psig, respectively. A syngas is produced that containsmainly hydrogen and carbon monoxide with little carbon dioxide. Elevatedtemperatures eliminate the production of hydrocarbon gases and liquids inthe product gas. The high temperature converts the ash into molten slag,which runs down the refractory walls into a water bath, where it is quenchedand the ash/water slurry is removed through a lock hopper. The raw gas leav-ing the gasifier at 2500 to 3000◦F contains a small quantity of char and abouthalf of the molten ash. The hot gas is partially cooled to temperatures below
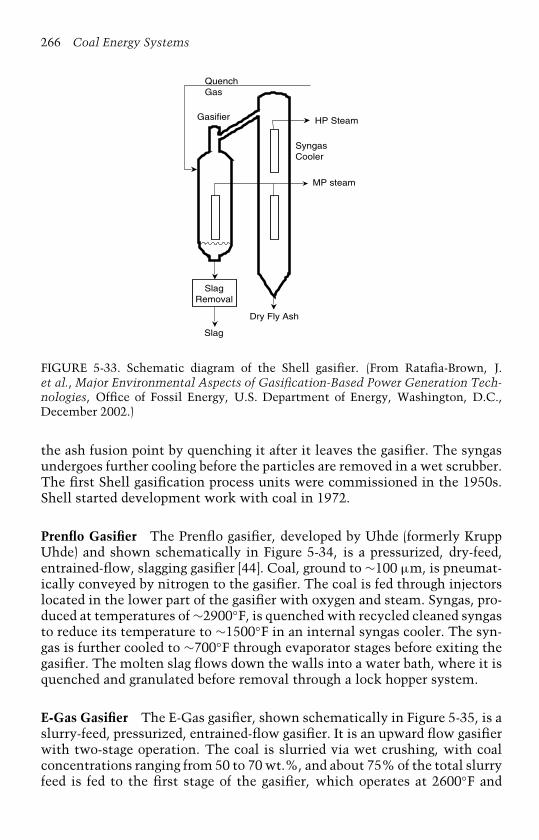
266 Coal Energy Systems
QuenchGas
Gasifier HP Steam
SyngasCooler
MP steam
SlagRemoval
Slag
Dry Fly Ash
FIGURE 5-33. Schematic diagram of the Shell gasifier. (From Ratafia-Brown, J.et al., Major Environmental Aspects of Gasification-Based Power Generation Tech-nologies, Office of Fossil Energy, U.S. Department of Energy, Washington, D.C.,December 2002.)
the ash fusion point by quenching it after it leaves the gasifier. The syngasundergoes further cooling before the particles are removed in a wet scrubber.The first Shell gasification process units were commissioned in the 1950s.Shell started development work with coal in 1972.
Prenflo Gasifier The Prenflo gasifier, developed by Uhde (formerly KruppUhde) and shown schematically in Figure 5-34, is a pressurized, dry-feed,entrained-flow, slagging gasifier [44]. Coal, ground to ∼100 µm, is pneumat-ically conveyed by nitrogen to the gasifier. The coal is fed through injectorslocated in the lower part of the gasifier with oxygen and steam. Syngas, pro-duced at temperatures of ∼2900◦F, is quenched with recycled cleaned syngasto reduce its temperature to ∼1500◦F in an internal syngas cooler. The syn-gas is further cooled to ∼700◦F through evaporator stages before exiting thegasifier. The molten slag flows down the walls into a water bath, where it isquenched and granulated before removal through a lock hopper system.
E-Gas Gasifier The E-Gas gasifier, shown schematically in Figure 5-35, is aslurry-feed, pressurized, entrained-flow gasifier. It is an upward flow gasifierwith two-stage operation. The coal is slurried via wet crushing, with coalconcentrations ranging from 50 to 70 wt.%, and about 75% of the total slurryfeed is fed to the first stage of the gasifier, which operates at 2600◦F and
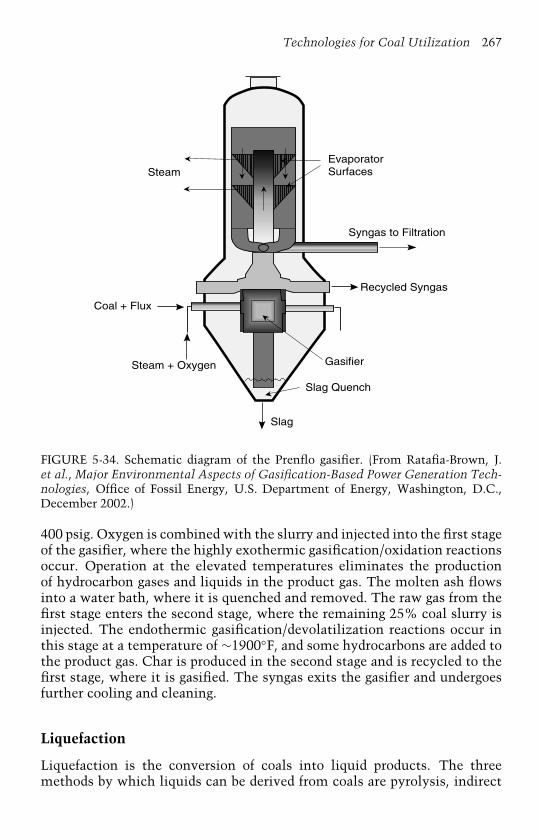
Technologies for Coal Utilization 267
SteamEvaporatorSurfaces
Syngas to Filtration
Gasifier
Slag Quench
Slag
Steam + Oxygen
Coal + Flux
Recycled Syngas
FIGURE 5-34. Schematic diagram of the Prenflo gasifier. (From Ratafia-Brown, J.et al., Major Environmental Aspects of Gasification-Based Power Generation Tech-nologies, Office of Fossil Energy, U.S. Department of Energy, Washington, D.C.,December 2002.)
400 psig. Oxygen is combined with the slurry and injected into the first stageof the gasifier, where the highly exothermic gasification/oxidation reactionsoccur. Operation at the elevated temperatures eliminates the productionof hydrocarbon gases and liquids in the product gas. The molten ash flowsinto a water bath, where it is quenched and removed. The raw gas from thefirst stage enters the second stage, where the remaining 25% coal slurry isinjected. The endothermic gasification/devolatilization reactions occur inthis stage at a temperature of ∼1900◦F, and some hydrocarbons are added tothe product gas. Char is produced in the second stage and is recycled to thefirst stage, where it is gasified. The syngas exits the gasifier and undergoesfurther cooling and cleaning.
Liquefaction
Liquefaction is the conversion of coals into liquid products. The threemethods by which liquids can be derived from coals are pyrolysis, indirect
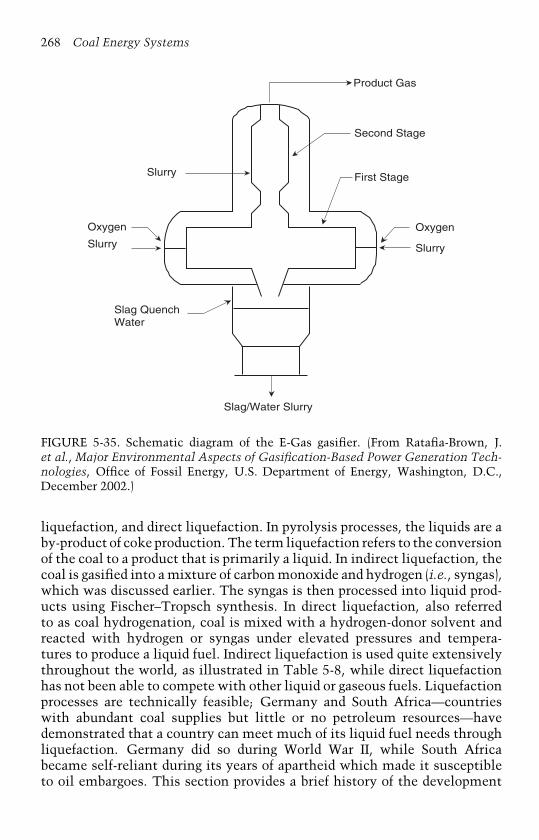
268 Coal Energy Systems
Slag/Water Slurry
Slag QuenchWater
Oxygen
Slurry
Slurry
Slurry
Oxygen
First Stage
Second Stage
Product Gas
FIGURE 5-35. Schematic diagram of the E-Gas gasifier. (From Ratafia-Brown, J.et al., Major Environmental Aspects of Gasification-Based Power Generation Tech-nologies, Office of Fossil Energy, U.S. Department of Energy, Washington, D.C.,December 2002.)
liquefaction, and direct liquefaction. In pyrolysis processes, the liquids are aby-product of coke production. The term liquefaction refers to the conversionof the coal to a product that is primarily a liquid. In indirect liquefaction, thecoal is gasified into a mixture of carbon monoxide and hydrogen (i.e., syngas),which was discussed earlier. The syngas is then processed into liquid prod-ucts using Fischer–Tropsch synthesis. In direct liquefaction, also referredto as coal hydrogenation, coal is mixed with a hydrogen-donor solvent andreacted with hydrogen or syngas under elevated pressures and tempera-tures to produce a liquid fuel. Indirect liquefaction is used quite extensivelythroughout the world, as illustrated in Table 5-8, while direct liquefactionhas not been able to compete with other liquid or gaseous fuels. Liquefactionprocesses are technically feasible; Germany and South Africa—countrieswith abundant coal supplies but little or no petroleum resources—havedemonstrated that a country can meet much of its liquid fuel needs throughliquefaction. Germany did so during World War II, while South Africabecame self-reliant during its years of apartheid which made it susceptibleto oil embargoes. This section provides a brief history of the development
Technologies for Coal Utilization 269
of liquefaction, followed by a discussion of liquefaction, mainly indirect liq-uefaction. As previously discussed in this chapter and in Chapter 7 (FuturePower Generation), gasification integrated with chemicals and fuels produc-tion is the technology anticipated to be utilized for future power complexes.Direct liquefaction is a much-researched technology with proven processesoperated at the pilot and demonstration scale; however, it is not a widelyaccepted commercial technology, although facilities are under constructionin China. Thus, a brief review of key direct liquefaction processes will bepresented here but direct liquefaction will not be discussed in great detail.
The Beginning of the Synthetic Fuel IndustryCoal was hydrogenated in the laboratory by Berthelot as early as 1869 [47].The reaction was carried out with hydriodic acid at 520◦F for 24 hours, and a67% yield of oil containing aromatics and naphthenes was obtained. Majoradvances were made by the Germans in the early 1900s. Germany, a coun-try with abundant coal reserves but virtually no petroleum deposits, wasbecoming increasingly dependent on gasoline and diesel engines. To ensurethat Germany would never lack a plentiful supply of liquid fuels, Germanscientists and engineers invented and developed two processes that enabledthem to produce synthetic petroleum from their coal supplies and to estab-lish the world’s first technologically successful synthetic liquid fuel industry[48]. In 1911, Friedrich Bergius obtained oil by hydrogenating coal without acatalyst under hydrogen pressure at 570 to 660◦F. In 1913, he applied for thefirst patent on coal hydrogenation, and in 1931 he was awarded the NobelPrize in Chemistry [19,47]. Bergius also observed that coal paste could beinjected readily into a vessel under pressure. The role of catalysts in thehydrogenation of coal was not realized until later.
At the end of 1925, I.G. Farben, a chemical company, hydrogenated coalusing a molybdenum oxide catalyst. The presence of the catalyst allowed thehydrogenation of coal in the presence of excess hydrogen at low pressure andat temperatures of 750 to 840◦F. In the following year, I.G. Farben conductedthe liquefaction process in two steps because high-molecular-weight materi-als in the intermediate hydrogenation product fouled the catalyst. Coal wasmixed with the catalyst and hydrogenated in the liquid phase to middle oil,which was further hydrogenated to gasoline in vapor phase over a fixed bedof catalyst [47].
About 10 years after Bergius began his work, Franz Fischer and HansTropsch at the Kaiser–Wilhelm Institute for Coal Research in Mülheim,invented a second process for the synthesis of liquid fuel from coal [48]. By themid-1930s, I.G. Farben and other chemical companies such as Ruhrchemiehad started to industrialize synthetic liquid fuel production, resulting inthe construction of 12 coal hydrogenation and 9 Fischer–Tropsch plants bythe time World War II ended. The processes were complementary in thatcoal hydrogenation produced high-quality aviation and motor gasoline, while

270 Coal Energy Systems
Fischer–Tropsch syntheses produced diesel and lubricating oil, waxes, andsome lower quality motor gasoline [48].
Germany’s successful synthetic fuel industry continued to growthrough the 1930s, and from 1939 to 1945 it produced 18 million metric tonsof liquids from coal and tar, and another three million metric tons of liquidsfrom Fischer–Tropsch synthesis [48]. Neither coal-to-oil process could pro-duce a synthetic liquid fuel at a cost competitive with natural petroleum;however, they persevered because they provided the only path Germanycould follow in its search for petroleum independence.
Similarly, South Africa, fearing boycott as a result of their racial poli-cies, decided to proceed with a synthetic fuels plant in 1951, although thisprocess would produce liquid fuels that were more expensive than petroleumrefined products. The South Africans selected Fischer–Tropsch technologybecause the Germans had successfully used it and because direct liquefac-tion had not been used on a scale that was as large as the South Africanswere planning [22]. This led to the creation of Sasol and government subsi-dies that exist even today [49]. However, now that Sasol has the equipmentin place, crude oil is readily available, and apartheid has been abolished,political and economic considerations have forced the South African gov-ernment to phase out the subsidy for transportation fuels. Sasol anticipatedlosing its subsidies and has gradually shifted its emphasis from producingonly transportation fuels to deriving a significant fraction of its profits fromthe sale of chemicals and petrochemical feedstocks [49]. Plants were con-structed in South Africa in three stages: 1955, 1982, and 1992 (see Table 5-8)and are discussed later in this chapter. All three of these plants are currentlyoperating.
In the United States, interest in converting coal to liquid products hasbeen cyclic and affected by the cost and availability of petroleum. In thebeginning of the industrial revolution, coal was the major source of energy inthe United States and continued to dominate the U.S. energy supply for thenext 100 years. Petroleum, however, quickly became the preferred energysource after its discovery in Pennsylvania in 1859 and rapid commercialproduction in the early 1900s. By the early 1920s, worries that oil sup-plies were becoming depleted along with an expanding automobile industryresulted in a short-lived interest in coal liquefaction; when oil was discov-ered in Texas in the mid-1920s, further interest in coal liquefaction ceased.After World War II, consumption of petroleum and natural gas in the UnitedStates exceeded that of coal, the United States experienced petroleum short-ages, and coal liquefaction was again considered as an alternative. A sizeableresearch effort resulted, but discovery of massive petroleum reserves in theMiddle East in the mid-1940s once again made coal liquefaction an uneco-nomical alternative. In 1972, the U.S. petroleum production began to declineand unrest developed in the Middle East. The limited availability of domesticsupplies of natural gas and crude oil and the desire to reduce the coun-try’s dependence on foreign sources of energy led to significant liquefaction

Technologies for Coal Utilization 271
research by the federal government, private industry, and universities. Themajor processes are discussed below.
Indirect Liquefaction: Fischer–Tropsch SynthesisFischer–Tropsch synthesis is the conversion of carbon monoxide and hydro-gen to liquid hydrocarbons and related oxygenated compounds over variouslypromoted group-VII catalysts and is defined by the reaction:
CO + 2H2 → (−CH2−) + H2O (5-25)
Fischer–Tropsch synthesis can, in principle, provide almost all hydrocarbonsconventionally obtained from petroleum. The actual product mix dependson the temperature, pressure, CO/H2 ratio, and catalysts used, and there areseveral variants of the process. Table 5-9 illustrates how the product compo-sition can be influenced [19], and Table 5-10 lists some technical informationon three industrial processes [1].
Medium-pressure synthesis, conducted at 430 to 640◦F and 5 to 50 atmover iron catalysts, yields mainly gasoline, diesel oils, and heavier paraffins[19]. The proportion of gasoline in the product mix increases, and gasolinequality improves as the hydrogen-to-carbon monoxide ratio in the feed gasis increased, and the overall product composition is influenced by the typeof reactor: fixed catalyst beds or a fluid-bed reactor. High-pressure synthesis,conducted at 210 to 300◦F and 50 to 1000 atm over ruthenium catalysts,furnishes mainly straight-chain paraffin waxes with molecular weights upto 105,000 and melting ranges up to 270 to 273◦F; however, the formationof lower-molecular-weight hydrocarbons can be increased by increasing theproportion of hydrogen in the feed gas, raising the reaction temperature, anddecreasing the pressure.
TABLE 5-9Influence of Operating Parameters on the Composition of the Product of Medium-Pressure Fischer–Tropsch Synthesis
Increase in: Mean Molecular Yielda
Weight of Products Oxygenated OlefinsProducts
Pressure + + −Temperature − − +CO conversion + − −Flow rate − + +Gas recycle ratio − + +H2:CO ratio − − −a+, Increasing; −, decreasing.Source: Berkowitz, N., An Introduction to Coal Technology, Academic Press, New York, 1979.With permission.

TABLE 5-10Technical Information on Three Industrial Fischer–Tropsch Processes
Process Cobalt F-T (Normal/Medium Pressure) ARGEa (Sasol I) Syntholb (Sasol I and II)
Reactor Fixed bed Fixed bed EntrainedStages 2–3 1 1Pressure (atm.c) 1–12 23–25 24–28Temperature (◦F) 380 430–480 610–640Catalyst Co Fe (Cu)d Fused FePromotor MgO, ThO2 K2O K2OFlow rate (h−1) 100 500–700 Not availableRecycle ratio 0 2.5 2.0–2.4CO conversion 90–95 73 77–85Yield (wt.%)
C1–C2 Not available 7 20C3–C4 7 14 (of which 45% are olefins) 23 (of which 87% are olefins)C5–C12 30 24.8 (of which 50% are olefins) 39 (of which 70% are olefins)C13–C20 10 14.7 (of which 40% are olefins) 5 (of which 60% are olefins)C20+ 11 36.2 (of which 15% are olefins) 5
Oxygen composition Not available 4 8Alcohols/ketones Not available 2.3 7.8Acids Not available Not available 1.0
aARGE: Arbeitsgermeinschaft Ruhrchemie-Lurgi.bCirculating entrained-flow reactor.c1 standard atmosphere = 14.7 psia (pounds per square inch absolute).d (Cu) = about 5% copper.Source: Van Krevelen, D. W., Coal: Typology–Physics–Chemistry–Constitution, Third edition, Elsevier Science, Amsterdam, 1993. Withpermission.

Technologies for Coal Utilization 273
Iso-synthesis is a reaction that converts carbon monoxide and hydrogento branched-chain hydrocarbons and is usually conducted at 750 to 930◦F and100 to 1000 atm over thoria or K2CO3-promoted thoria–alumina catalystsand yields predominately low-molecular-weight (C4 and C5) isoparaffins [19].Iso-synthesis at temperatures much above 750◦F promotes coproduction ofaromatics, while oxygenated compounds are formed at temperatures below750◦F. The synthol process is used for the production of oxygenated com-pounds. In this process, the feed gas is reacted at 750 to 840◦F and ∼140 atmover an alkalized iron catalyst [19]. Synol synthesis involves the interactionof carbon monoxide and hydrogen at 355 to 390◦F and 5 to 50 atm in thepresence of highly reduced ammonia catalysts to produce a product with40 to 50% oxygenated straight-chain compounds. Oxyl synthesis is carriedout at 355 to 390◦F and 20 to 50 atm over a precipitated iron catalyst to pro-duce a product with over 30% oxygenated straight-chain compounds. Theoxo-synthesis process is used for producing aldehydes and occurs with thereaction between an olefin and syngas at 210 to 390◦F and 100 to 500 atmover cobalt carbonyl catalysts. The oxo-synthesis process has become themost common industrial method for producing C3 to C16 aldehydes.
Direct LiquefactionDirect liquefaction was developed in the 1930s by Bergius and collaboratorsand involved reacting pulverized coal or coal/oil slurries with gaseous hydro-gen at high pressures and temperatures. It was used extensively in Germanyduring World War II and in the former Soviet Union and Czechoslovakia forseveral years after the war. Plants were also constructed in Japan and GreatBritain but on a much smaller scale. These plants were either destroyed dur-ing the war or shut down shortly after because they were not economical tooperate. Direct liquefaction research and development continued after thewar and increased significantly after the oil crisis in the 1970s. Direct lique-faction research funding essentially ended in the mid- to latter 1980s. Thefunding for the research came from a host of agencies, companies, and states,and examples of funding sources include (but the list is obviously not inclu-sive): the DOE and its predecessors, the Office of Coal Research (OCR) andEnergy Research and Development Administration (ERDA); Electric PowerResearch Institute (EPRI); Edison Electric Institute (EEI); oil companies, suchas Amoco, Ashland, Conoco, Mobil, Exxon, Phillips, and Gulf; major util-ities, such as Southern Services, Inc.; other companies such as the GreatNorthern Railroad; and major coal-producing states such as Kentucky. Withthe exception of the coal-to-liquids plants that Hydrocarbon Technologies,Inc. (HTI) is currently constructing in China, development of direct liquefac-tion technologies has achieved only demonstration-scale status, primarilydue to the availability of lower priced petroleum-refined fuels. This sec-tion will introduce some of the main processes that have been developed.From a chemical standpoint, coal has a lower hydrogen-to-carbon (H/C)
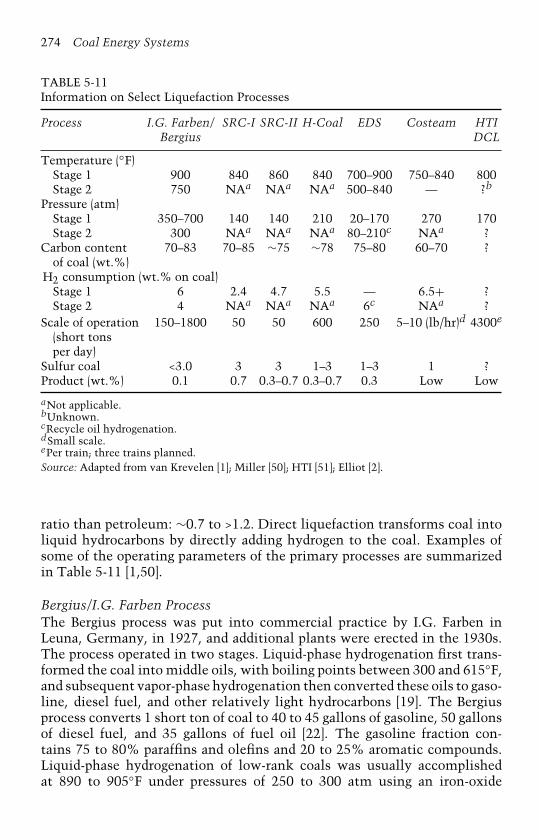
274 Coal Energy Systems
TABLE 5-11Information on Select Liquefaction Processes
Process I.G. Farben/ SRC-I SRC-II H-Coal EDS Costeam HTIBergius DCL
Temperature (◦F)Stage 1 900 840 860 840 700–900 750–840 800Stage 2 750 NAa NAa NAa 500–840 — ?b
Pressure (atm)Stage 1 350–700 140 140 210 20–170 270 170Stage 2 300 NAa NAa NAa 80–210c NAa ?
Carbon content 70–83 70–85 ∼75 ∼78 75–80 60–70 ?of coal (wt.%)
H2 consumption (wt.% on coal)Stage 1 6 2.4 4.7 5.5 — 6.5+ ?Stage 2 4 NAa NAa NAa 6c NAa ?
Scale of operation 150–1800 50 50 600 250 5–10 (lb/hr)d 4300e
(short tonsper day)
Sulfur coal <3.0 3 3 1–3 1–3 1 ?Product (wt.%) 0.1 0.7 0.3–0.7 0.3–0.7 0.3 Low Low
aNot applicable.bUnknown.cRecycle oil hydrogenation.dSmall scale.ePer train; three trains planned.Source: Adapted from van Krevelen [1]; Miller [50]; HTI [51]; Elliot [2].
ratio than petroleum: ∼0.7 to >1.2. Direct liquefaction transforms coal intoliquid hydrocarbons by directly adding hydrogen to the coal. Examples ofsome of the operating parameters of the primary processes are summarizedin Table 5-11 [1,50].
Bergius/I.G. Farben ProcessThe Bergius process was put into commercial practice by I.G. Farben inLeuna, Germany, in 1927, and additional plants were erected in the 1930s.The process operated in two stages. Liquid-phase hydrogenation first trans-formed the coal into middle oils, with boiling points between 300 and 615◦F,and subsequent vapor-phase hydrogenation then converted these oils to gaso-line, diesel fuel, and other relatively light hydrocarbons [19]. The Bergiusprocess converts 1 short ton of coal to 40 to 45 gallons of gasoline, 50 gallonsof diesel fuel, and 35 gallons of fuel oil [22]. The gasoline fraction con-tains 75 to 80% paraffins and olefins and 20 to 25% aromatic compounds.Liquid-phase hydrogenation of low-rank coals was usually accomplishedat 890 to 905◦F under pressures of 250 to 300 atm using an iron-oxide

Technologies for Coal Utilization 275
hydrogenation catalyst. For liquid-phase hydrogenation of bituminous coals,temperatures were similar, but pressures were in the range of 350 to 700 atm.
Solvent Refining ProcessesThe solvent-refined coal (SRC) process is considered the least complex ofthe various process schemes. Hydrogenation of the coal in the SRC processoccurs at elevated temperatures and pressures in the presence of hydrogen.Catalysts other than the minerals contained in the coal are not used [2].
SRC-I Process In the SRC-I process, ground and dried coal is fed to the reac-tor as a slurry. The transport liquid, or process solvent, is a distillate fractionrecovered from the coal hydrogenation product and serves as the hydrogendonor. The coal slurry and hydrogen are introduced into a dissolver at 840◦Fand 1500 psig. The process produces a low-ash (∼0.1%), low-sulfur (∼0.3%),solid fuel with a heating value of ∼16,000 Btu/lb. The SRC-I fuel was envi-sioned as a boiler fuel to replace natural gas and fuel oil. Testing of thisprocess started with Gulf Oil in the 1960s. Much of the developmental workon this process was performed at Wilsonville, Alabama, in a 6 short ton/dayplant with funding from the EEI, Southern Services, the DOE, and the EPRI.A 50 short ton/day plant was built at Fort Lewis, Washington, and testingwas performed by Gulf Oil.
SRC-II Process The SRC-I process was modified to eliminate a number ofprocessing steps and to produce an all-distillate, low-sulfur fuel oil from coalrather than a solid fuel. In the SRC-II process, pulverized and dried coal ismixed with recycled slurry solvent from the process. The slurry mixture ispumped to reaction pressure (∼140 atm), preheated to about 700 to 750◦F, andfed into the dissolver, which is operated at 820 to 870◦F [2]. The dissolvereffluent is separated into vapor- and liquid-phase fractions. The overheadvapor stream undergoes several stages of cooling and separations, and thecondensed liquid is distilled to produce naphtha and a middle distillate oil,which are converted to gasoline and diesel fuel, respectively. The gaseousproducts are purified to remove hydrogen sulfide and carbon dioxide, and thehydrogen-rich gas is then recycled to the reactor with make-up hydrogen.The liquid-phase product acts as the solvent for the SRC-II process. SRC-IItesting was performed at the Tacoma, Washington, pilot-plant by Gulf Oil.Funding for this work was provided by the DOE.
Costeam Process The costeam process, investigated at the PittsburghEnergy Research Center (DOE) and the University of North Dakota/GrandForks Energy Research Center was intended to produce low-sulfur liquidproducts from lignites and subbituminous coals. This process uses crudesyngas containing about 50 to 60% carbon monoxide and 30 to 50% hydro-gen, rather than pure hydrogen. The high moisture content of the low-rank
276 Coal Energy Systems
coals provides the water that is converted to steam. Ground coal is slur-ried with recycled product oil from the process. The slurried coal is pumpedto unit pressure (4000 psig), mixed with syngas, heated to 750 to 840◦F,and maintained at conditions for periods of 1 to 2 hours to liquefy the coal.Severe operating conditions are required for the dissolution of the lignite.These operating conditions were a drawback for the process, as long residencetimes and high pressures are costly and present major engineering problems.This process, although a potential candidate for liquefying low-rank coals,was only tested in small-scale equipment. It is included in this discussionbecause it was considered a potential process for utilizing low-rank coals.
Catalytic ProcessesThe most important process of this group is the H-Coal process, developedby Hydrocarbon Research, Inc. (HRI) as an outgrowth of previous work onthe hydrogenation of petroleum fractions. The development of this processwas sponsored by the ERDA and a large group of oil companies [1].
H-Coal Process In the H-coal process, pulverized coal is slurried with recy-cled oil and, along with hydrogen, fed to an ebullated-bed reactor, a featurethat distinguishes this process from others. Reactor conditions are normallyin the range of 825 to 875◦F and 2500 to 3500 psig. The reactor contains abed of catalytic particles, cobalt molybdate on alumina oxide. The productsfrom the reactor include hydrocarbon gases, light and heavy distillate oils,and bottoms slurry. Variations of the processing scheme can produce fuel oil,naphtha, synthetic crude, ammonia, and fuel gas. Further processing can pro-duce gasoline and jet fuel. HRI operated several small-scale reactors in theirTrenton, New Jersey, test facility, and a pilot plant producing 800 short tonscoal per day was constructed in Cattletsburg, Kentucky.
In 1995, when it became an employee-owned company, HRI changedits name to Hydrocarbon Technologies, Inc. (HTI). HTI has modified its pro-cess, now known as HTI’s direct coal liquefaction (DCL) process and shownschematically in Figure 5-36, and it has gone from a single- to double-stagereactor system [51]. In the HTI DCL process, pulverized coal is dissolvedin recycled, coal-derived, heavy-process liquid at about 2500 psig and 800◦Fwhile hydrogen is added. Most of the coal structure is broken down in thefirst-stage reactor. Liquefaction is completed in the second-stage reactor, ata slightly higher temperature and lower pressure. A proprietary GelCat cat-alyst is dispersed in the slurry for both stages. The process produces dieselfuel and gasoline. HTI has entered into an agreement with Shenhua GroupCorporation, Ltd., for a direct coal liquefaction plant to be constructed inthe People’s Republic of China [52]. The plant will be located approximately80 miles south of Baotou, at Majata, Inner Mongolia in China. The plantwill have an ultimate capacity of 50,000 barrels per day of ultra-clean, low-sulfur, diesel fuel and gasoline produced from Chinese coal. The plant is
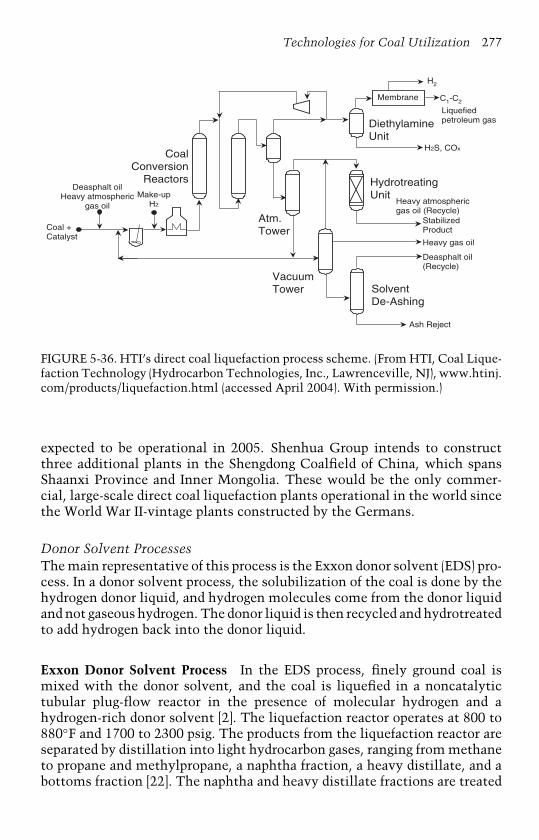
Technologies for Coal Utilization 277
CoalConversion
Reactors
Coal +Catalyst
Deasphalt oilHeavy atmospheric
gas oilMake-up
H2
Atm.Tower
VacuumTower Solvent
De-Ashing
Ash Reject
HydrotreatingUnit
DiethylamineUnit
H2S, COx
H2
C1-C2Membrane
Heavy atmosphericgas oil (Recycle)
StabilizedProduct
Heavy gas oil
Deasphalt oil(Recycle)
Liquefiedpetroleum gas
FIGURE 5-36. HTI’s direct coal liquefaction process scheme. (From HTI, Coal Lique-faction Technology (Hydrocarbon Technologies, Inc., Lawrenceville, NJ), www.htinj.com/products/liquefaction.html (accessed April 2004). With permission.)
expected to be operational in 2005. Shenhua Group intends to constructthree additional plants in the Shengdong Coalfield of China, which spansShaanxi Province and Inner Mongolia. These would be the only commer-cial, large-scale direct coal liquefaction plants operational in the world sincethe World War II-vintage plants constructed by the Germans.
Donor Solvent ProcessesThe main representative of this process is the Exxon donor solvent (EDS) pro-cess. In a donor solvent process, the solubilization of the coal is done by thehydrogen donor liquid, and hydrogen molecules come from the donor liquidand not gaseous hydrogen. The donor liquid is then recycled and hydrotreatedto add hydrogen back into the donor liquid.
Exxon Donor Solvent Process In the EDS process, finely ground coal ismixed with the donor solvent, and the coal is liquefied in a noncatalytictubular plug-flow reactor in the presence of molecular hydrogen and ahydrogen-rich donor solvent [2]. The liquefaction reactor operates at 800 to880◦F and 1700 to 2300 psig. The products from the liquefaction reactor areseparated by distillation into light hydrocarbon gases, ranging from methaneto propane and methylpropane, a naphtha fraction, a heavy distillate, and abottoms fraction [22]. The naphtha and heavy distillate fractions are treated
278 Coal Energy Systems
by conventional petroleum-refining technology. About 85% of the naphthais recovered as gasoline, and about 50% of the heavy distillate is recoveredas a mixture of benzene, toluene, and xylenes. Further processing of theheavy distillate produces fractions comparable to jet fuel and heating fuel[22]. A portion of the heavy distillate is hydrotreated and recycled to slurrythe coal. In addition, the bottoms are either coked in a fluid coking plantor recycled to the liquefaction reactor. Recycling to the liquefaction unitresults in a dramatic increase in the conversion of the coal to liquid products.In addition to small-scale test reactors, Exxon, the DOE, the EPRI, and aninternational group of industrial sponsors installed a pilot plant in Baytown,Texas, that produces 250 short tons coal per day. This was the minimum sizeneeded for confident scale-up of the critical process and mechanical featuresof the EDS process.
Concluding StatementsSeveral direct liquefaction processes were introduced in this chapter.Although these have been some of the most important and, in most cases,the most successful processes, it must be noted that many processes havebeen conceived and researched. Due to economics, however, none has beenable to compete with available liquid and gaseous fuels, especially in indus-trialized countries. The work of the Germans in the 1930s and 1940s and thefacilities planned for China illustrate that large-scale, direct coal liquefac-tion commercial plants are technically feasible. They can be constructed andoperated when necessary if dictated by political mandates, whether duringa period of isolation in wartime or due to a decision to be self-sufficient anduse indigenous resources.
References
1. Van Krevelen, D. W., Coal: Typology–Physics–Chemistry–Constitution, 3rded. (Elsevier Science, Amsterdam, 1993).
2. Elliot, M. A. (editor), Chemistry of Coal Utilization, Secondary Suppl. Vol.(John Wiley & Sons, New York, 1981).
3. Moore, E. S., Coal: Its Properties, Analysis, Classification, Geology, Extrac-tion, Uses, and Distribution (John Wiley & Sons, New York, 1922),p. 124.
4. Kuehn, S. E., Power for the Industrial Age: A Brief History of Boilers, PowerEngineering, Vol. 100, No. 2, February 1996, pp. 5–19.
5. Landels, J. G., Engineering in the Ancient World (University of CaliforniaPress, Berkley, 1978).
6. B&W, Coal: Its Generation and Use, 39th ed. (The Babcock & Wilcox Com-pany, New York, 1978).
7. Anon., Boilers and Auxiliary Equipment, Power, Special Edition, June 1988.
Technologies for Coal Utilization 279
8. Singer, J. G. (editor), Combustion: Fossil Power Systems (Combustion Engi-neering, Inc., Windsor, CT, 1981).
9. CIBO, Industrial Combustion Boiler and Process Heater MACT SummarySheet (Council of Industrial Boiler Owners, Burke, VA, July 3, 2002).
10. EPA, Report to Congress: Wastes from Combustion of Fossil Fuels, Vol. 2,Methods, Findings, and Recommendations (U.S. Environmental ProtectionAgency, U.S. Government Printing Office, Washington, D.C., March 1999),chap. 3.
11. Miller, B. G., S. Falcone Miller, and A. W. Scaroni, Utilizing AgriculturalBy-Products in Industrial Boilers: Penn State’s Experience and Coal’s Rolein Providing Security for our Nation’s Food Supply, paper presented at theNineteenth Annual International Pittsburgh Coal Conference (University ofPittsburgh, September 23–27, 2002).
12. Miller, B. G., S. Falcone Miller, R. E. Cooper, N. Raskin, and J. J. Battista,A Feasibility Study for Cofiring Agricultural and Other Wastes with Coal atPenn State University, paper presented at the Nineteenth Annual Interna-tional Pittsburgh Coal Conference (University of Pittsburgh, September 23–27,2002).
13. Miller, B. G. and S. Falcone Miller, Utilizing Biomass in Industrial Boilers:The Role of Biomass and Industrial Boilers in Providing Energy/NationalSecurity, in Proc. of the First CIBO Industrial Renewable Energy and BiomassConference (Washington, D.C., April 7–9, 2003).
14. Elliot, T. C. (editor), Standard Handbook of Powerplant Engineering(McGraw-Hill, New York, 1989).
15. Lawn, C. J. (editor), Principles of Combustion Engineering for Boilers (Aca-demic Press, London, England, 1987).
16. Tillman, D. A., B. G. Miller, D. K. Johnson, and D. J. Clifford, Structure,Reactivity, and Nitrogen Evolution Characteristics of a Suite of Coals andSolid Fuels, in Proc. of the 29th International Technical Conference on CoalUtilization and Fuel Systems (Coal Technology Association, Gaithersburg,MD, 2004).
17. Howard, J. B., and R. H. Essenhigh, Simultaneous Gas Phase Volatiles Com-bustion, in Proc. of the 11th Int. Symp. on Combustion (The CombustionInstitute, Pittsburgh, PA, 1967), pp. 399–408.
18. Field, M. A., D. W. Gill, B. B. Morgan, and P. G. W. Hawksley, Combustionof Pulverized Coal, The British Coal Utilisation Research Association, Cheney& Sons Ltd, Leatherhead, England, 1967.
19. Berkowitz, N., An Introduction to Coal Technology (Academic Press, NewYork, 1979).
20. Walker, P. L., F. Rusinko, and L. G. Austin, Gas Reactions of Carbon,Advances in Catalysis and Related Subjects, Vol. XI (Academic Press, NewYork), 1959.
21. Anon., Power from Coal: Special Report, Power, February 1974.22. Schobert, H. H., Coal: The Energy Source of the Past and Future (American
Chemical Society, Washington, D.C., 1987).
280 Coal Energy Systems
23. DOE, Fluidized-Bed Combustion: An R&D Success Story (U.S. Department ofEnergy, Washington, D.C.), www.fossil.energy.gov/programs/powersystems/combustion/fluidizedbed_success.shtml (accessed September 17, 2003).
24. Tang, J. T. and F. Engstrom, Technical Assessment on the Ahlstrom PyroflowCirculating and Conventional Bubbling Fluidized-Bed Combustion Systems,in Proc. of the International Conference on Fluidized-Bed Combustion, p. 37(May 3–7, 1987).
25. Virr, M. J., The Development of a Modular System To Burn Farm AnimalWaste To Generate Heat and Power, in Proc. of the Seventeenth Annual Inter-national Pittsburgh Coal Conference (University of Pittsburgh, September11–14, 2000).
26. Gaglia, B. N. and A. Hall, Comparison of Bubbling and Circulating Fluidized-Bed Industrial Steam Generation, in Proc. of the International Conference onFluidized-Bed Combustion, p. 18 (May 3–7, 1987).
27. Bryers, R. W., Fireside Behavior of Minerals in Coal, paper presented at theSymposium on Slagging and Fouling in Steam Generators (January 31, 1987),63 pp.
28. Kumar, K. S., R. E. Sommerland, and P. L. Feldman, Know the Impacts fromSwitching Coals for CAAA Compliance, Power, Vol. 135, No. 5, May 1991,pp. 31–38.
29. Winegartner, E. C., Coal Fouling and Slagging Parameters, Research Depart-ment (American Society of Mechanical Engineers, New York, 1974), 34 pp.
30. Attig, R. C. and A. F. Duzy, Coal Ash Deposition Studies and Application toBoiler Design, in Proc. of the American Power Conference, Vol. 31 (1969),pp. 290–300.
31. Bonson, S., MI Introduces New Indices to Assist Prediction of AshDeposition, Microbeam, Vol. 14, Winter 2003, pp. 1–3.
32. EIA, Quarterly Coal Report January–March 2003 (Energy Information Admin-istration, U.S. Department of Energy, Washington, D.C., June 2003).
33. Wakelin, D. H. (editor), The Making, Shaping and Treating of Steel, 11th ed.,Ironmaking Vol. (The AISE Steel Foundation, Pittsburgh, PA, 1999).
34. Ward, C. R. (editor), Coal Geology and Coal Technology (Blackwell Scientific,Melbourne, 1984).
35. U.K. Coal, Section 270: Coking and Carbonisation Plant (United KingdomCoal), http://open.voa.gov.uk/Instructions/chapters/Rating/vol15/sect270/s270.htm (accessed September 26, 2003).
36. DOE, Clean Coal Technology: Upgrading Low-Rank Coals, Technical ReportNo. 10 (Office of Fossil Energy, U.S. Department of Energy, Washington, D.C.,August 1997).
37. ENCOAL, ENCOAL Mild Coal Gasification Project: ENCOAL Project FinalReport, prepared for U.S. Department of Energy, No. DE-FC21-90MC27339(ENCOAL Corp., Gillette, WY, September 1997).
38. DOE, Clean Coal Technology Demonstration Program: Program Update 2001as of September 2001 (Office of Fossil Energy, U.S. Department of Energy,Washington, D.C., July 2002).
Technologies for Coal Utilization 281
39. Coal Merchants, Listing of Economy Fuels, www.coalmerchantsfederation.co.uk/Authorised%20Fuels.htm, accessed September 26, 2003.
40. Coalite Smokeless Fuels, The Process (Coalite, Chesterfield, U.K.), www.coalite.co.uk/page4.html (accessed September 26, 2003).
41. Frederick, J. P. and B. A. Knottnerus, Role of the Liquids From Coal Processin the World Energy Picture, paper presented at the Fifth Annual Clean CoalTechnology Conference, Tampa, Florida (January 8, 1997).
42. DOE, ENCOAL Mild Coal Gasification Project: Project Fact Sheet (U.S.Department of Energy, Washington, D.C.), www.lanl.gov/projects/cctc/ fact-sheets/encol/encoaldemo.html (last modified January 13, 2003).
43. DOE, Advanced Coal Conversion Process Demonstration: Project Fact Sheet(U.S. Department of Energy, Washington, D.C.), www.lanl.gov/projects/cctc/factsheets/rsbud/adcconvdemo.html (last modified December 2, 2002).
44. Ratafia-Brown, J., L. Manfredo, J. Hoffman, and M. Ramezan, Major Environ-mental Aspects of Gasification-Based Power Generation Technologies (Officeof Fossil Energy, Washington, D.C., December 2002).
45. SFA Pacific, Inc., and DOE, Gasification: Worldwide Use and Acceptance(Office of Fossil Energy, U.S. Department of Energy, Washington, D.C., January2000).
46. Gasification Technologies Council, Gasification: A Growing, World-wide Industry (Gasification Technologies Council), Arlington, Virginia,www.gasification.org/ (accessed October 2, 2003).
47. Wu, W. R. K. and H. H. Storch, Hydrogenation of Coal and Tar, U.S. Bureauof Mines Bulletin, No. 633, 1968, pp. 1–10.
48. Stranges, A. N., Germany’s Synthetic Fuel Industry 1927–1945, Energia,Vol. 12, No. 5, 2001, p. 2.
49. Davis, B., Fischer-Tropsch Synthesis: The CAER Perspective, Energia, Vol. 8,No. 3, 1997, p. 1.
50. Miller B. G., Autoclave Studies of Lignite Liquefaction (M.S. Thesis, Univer-sity of North Dakota, 1982).
51. HTI, Coal Liquefaction Technology (Hydrocarbon Technologies, Inc.,Lawrenceville, NJ), www.htinj.com/products/liquefaction.html (accessedApril 2004).
52. HTI, Headwater’s HTI Subsidiary Signs License Agreement with Shen-hua Group—China’s Largest Coal Company (Hydrocarbon Technologies,Inc., Lawrenceville, NJ), www.htinj.com/news/061802shenhualicagmnt.html(accessed June 2002).

This page intentionally left blank
CHAPTER 6
Emissions ControlStrategies for PowerPlants
For more than the last quarter century, power plant operators in the UnitedStates have been installing new pollution-control technologies to meet ever-tightening regulatory standards for clean air. The Clean Air Act of 1970(details of which can be found in Chapter 4, where the history of legislativeaction in the United States is discussed) established national standards tolimit levels of air pollutants such as sulfur dioxide, nitrogen oxides, carbonmonoxide, ozone, lead, and particulate matter. The act and its amendmentsin 1977 resulted in the development and installation of particulate matterand sulfur dioxide control technologies for coal-fired boilers. Particulate con-trol devices, specifically electrostatic precipitators (ESPs) and fabric filterbaghouses, began to be installed on power plants, and efforts to developnew control technology, including flue gas desulfurization units, commonlycalled scrubbers, to remove sulfur from flue gas led to the installation ofsuch units on many power generation facilities. In addition, technologies toreduce nitrogen oxides began to be developed.
The 1990 Clean Air Act Amendments contained major revisions tothe Clean Air Act and required further reductions in power plant emis-sions, especially sulfur- and nitrogen-containing pollutants that contributeto acid rain. Some of the resulting sulfur dioxide control strategies thatwere implemented include switching to low-sulfur fuels, installation offlue gas desulfurization units, and the development of a new market-basedcap-and-trade system that requires power plants to either reduce their emis-sions or acquire allowances from other companies to achieve compliance.To meet the more stringent nitrogen oxide standards from the 1990 CleanAir Act Amendments, several technologies, specifically low-NOx burn-ers, selective catalytic and noncatalytic reduction, cofiring, and reburninghave been developed with varying levels of their implementation occurring.With impending legislation (e.g., Clear Skies Act, Multipollutant Control,
283

284 Coal Energy Systems
fine particulate control) additional NOx control is anticipated and is beingplanned for by the power generating industry.
This chapter begins by summarizing the progress that has been madeover the last ∼30 years in reducing emissions from coal-fired power plants.Commercial control strategies for pollutants that are currently regulated,such as sulfur dioxide, nitrogen oxides, and particulate matter, are discussed.Control technologies that are under development for reducing mercury emis-sions, where regulations will be promulgated in 2004 and full complianceexpected by 2007, are also discussed. A summary of control options underdevelopment for carbon dioxide removal is provided. The chapter concludeswith a discussion of multi-pollutant control technologies.
Currently Regulated Emissions
The pollutants of primary interest and currently regulated in the powergeneration industry include sulfur dioxide, nitrogen oxides, and particulatematter. Although pollutants such as carbon monoxide and volatile organiccompounds (which lead to the production of ozone when reacted with nitro-gen oxides) are important and are tracked nationally, no specific controltechnologies exist for these pollutants as they are formed from incompletecombustion in the boiler. Power plants are minor contributors to nation-wide carbon monoxide emissions. Similarly, power plants are insignificantcontributors to nationwide hydrocarbon emissions. Carbon monoxide andhydrocarbon emissions are discussed in Chapter 4 (Coal-Fired Emissions andLegislative Action in the United States).
Emissions of sulfur dioxide, nitrogen oxides, and particulate matterin the United States have been dramatically reduced over the last ∼30 yearsdue to legislative mandate and technological advances achieved through fed-eral, state, and industrial efforts. This decline is illustrated in Figures 6-1and 6-2, which show the decreases in overall as well as individual emissionsdespite increases in the use of coal for power generation. The steady decreasein emission rates is clearly shown in Figure 6-1, where the emission rates(given on a per billion kWh basis) are reported in 5-year increments [1]. Thedecrease in the emission rates of these three pollutants is also shown inFigure 6-2, along with projected near-term emission rates [2]. The emissionrates in Figure 6-2 are compared with the coal use for power generation forthe same time periods and illustrate how pollutant emissions per unit ofcoal burned have decreased significantly while at the same time coal use hasincreased. The technologies that are being used to achieve these reductionsare discussed in the following sections.
Sulfur Dioxide (SO2)Sulfur dioxide is one of the most abundant air pollutants emitted in theUnited States, totaling about 16 million short tons in 2002. Of the total

Emissions Control Strategies for Power Plants 285
35
30
25
20
15
10
5
0
PM10
SO2
NOx
1970 1975 1980 1985 1990 1995 2000
Year
Em
issi
on R
ate
s(T
housa
nds
of sh
ort
tons
per
bill
ion k
Wh)
FIGURE 6-1. Emission rates of sulfur dioxide, nitrogen oxides, and particulate matterfrom coal-fired power plants for the period 1970 to the present. (From DOE, NationalEnergy Technology Laboratory Accomplishments FY 2002, Office of Fossil Energy,U.S. Department of Energy, Washington, D.C., August 2003.)
5
4
3
2
1
0
20
16
12
8
4
0SO2 NOx PM
1970 1997 2005 (projected)
Average rate of pollutant emissionsfrom U.S. coal-fired power plants
Coal use for powergeneration in the U.S.
4.4
1.4
0.81.1
0.580.35 0.5
0.03
7.2
18.8
22.1
Pol
luta
nt E
mis
sion
s(lb
/mill
ion
Btu
coa
l bur
ned)
Qua
drill
ion
Btu
/yr
FIGURE 6-2. Past, present, and future emission rates of sulfur dioxide, nitrogenoxides, and particulate matter from coal-fired power plants. (From DOE, NationalEnergy Technology Laboratory Accomplishments FY 2002, Office of Fossil Energy,U.S. Department of Energy, Washington, D.C., August 2003.)
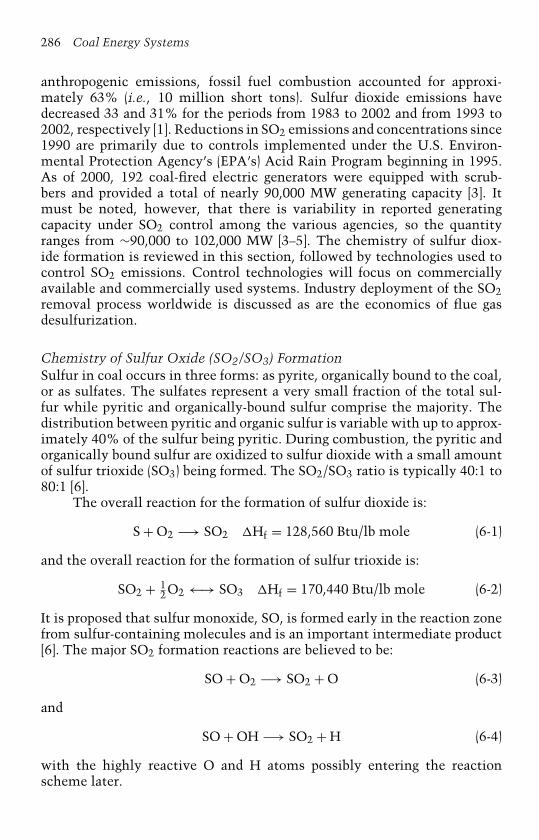
286 Coal Energy Systems
anthropogenic emissions, fossil fuel combustion accounted for approxi-mately 63% (i.e., 10 million short tons). Sulfur dioxide emissions havedecreased 33 and 31% for the periods from 1983 to 2002 and from 1993 to2002, respectively [1]. Reductions in SO2 emissions and concentrations since1990 are primarily due to controls implemented under the U.S. Environ-mental Protection Agency’s (EPA’s) Acid Rain Program beginning in 1995.As of 2000, 192 coal-fired electric generators were equipped with scrub-bers and provided a total of nearly 90,000 MW generating capacity [3]. Itmust be noted, however, that there is variability in reported generatingcapacity under SO2 control among the various agencies, so the quantityranges from ∼90,000 to 102,000 MW [3–5]. The chemistry of sulfur diox-ide formation is reviewed in this section, followed by technologies used tocontrol SO2 emissions. Control technologies will focus on commerciallyavailable and commercially used systems. Industry deployment of the SO2removal process worldwide is discussed as are the economics of flue gasdesulfurization.
Chemistry of Sulfur Oxide (SO2/SO3) FormationSulfur in coal occurs in three forms: as pyrite, organically bound to the coal,or as sulfates. The sulfates represent a very small fraction of the total sul-fur while pyritic and organically-bound sulfur comprise the majority. Thedistribution between pyritic and organic sulfur is variable with up to approx-imately 40% of the sulfur being pyritic. During combustion, the pyritic andorganically bound sulfur are oxidized to sulfur dioxide with a small amountof sulfur trioxide (SO3) being formed. The SO2/SO3 ratio is typically 40:1 to80:1 [6].
The overall reaction for the formation of sulfur dioxide is:
S + O2 −→ SO2 �Hf = 128,560 Btu/lb mole (6-1)
and the overall reaction for the formation of sulfur trioxide is:
SO2 + 12O2 ←→ SO3 �Hf = 170,440 Btu/lb mole (6-2)
It is proposed that sulfur monoxide, SO, is formed early in the reaction zonefrom sulfur-containing molecules and is an important intermediate product[6]. The major SO2 formation reactions are believed to be:
SO + O2 −→ SO2 + O (6-3)
and
SO + OH −→ SO2 + H (6-4)
with the highly reactive O and H atoms possibly entering the reactionscheme later.
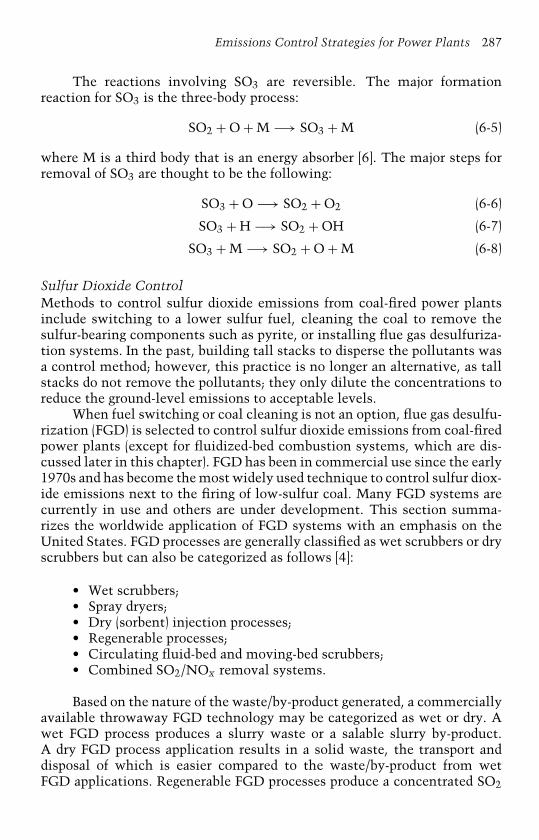
Emissions Control Strategies for Power Plants 287
The reactions involving SO3 are reversible. The major formationreaction for SO3 is the three-body process:
SO2 + O + M −→ SO3 + M (6-5)
where M is a third body that is an energy absorber [6]. The major steps forremoval of SO3 are thought to be the following:
SO3 + O −→ SO2 + O2 (6-6)
SO3 + H −→ SO2 + OH (6-7)
SO3 + M −→ SO2 + O + M (6-8)
Sulfur Dioxide ControlMethods to control sulfur dioxide emissions from coal-fired power plantsinclude switching to a lower sulfur fuel, cleaning the coal to remove thesulfur-bearing components such as pyrite, or installing flue gas desulfuriza-tion systems. In the past, building tall stacks to disperse the pollutants wasa control method; however, this practice is no longer an alternative, as tallstacks do not remove the pollutants; they only dilute the concentrations toreduce the ground-level emissions to acceptable levels.
When fuel switching or coal cleaning is not an option, flue gas desulfu-rization (FGD) is selected to control sulfur dioxide emissions from coal-firedpower plants (except for fluidized-bed combustion systems, which are dis-cussed later in this chapter). FGD has been in commercial use since the early1970s and has become the most widely used technique to control sulfur diox-ide emissions next to the firing of low-sulfur coal. Many FGD systems arecurrently in use and others are under development. This section summa-rizes the worldwide application of FGD systems with an emphasis on theUnited States. FGD processes are generally classified as wet scrubbers or dryscrubbers but can also be categorized as follows [4]:
• Wet scrubbers;• Spray dryers;• Dry (sorbent) injection processes;• Regenerable processes;• Circulating fluid-bed and moving-bed scrubbers;• Combined SO2/NOx removal systems.
Based on the nature of the waste/by-product generated, a commerciallyavailable throwaway FGD technology may be categorized as wet or dry. Awet FGD process produces a slurry waste or a salable slurry by-product.A dry FGD process application results in a solid waste, the transport anddisposal of which is easier compared to the waste/by-product from wetFGD applications. Regenerable FGD processes produce a concentrated SO2
288 Coal Energy Systems
by-product, usually sulfuric acid or elemental sulfur. The recent focus onmercury removal in FGD systems is discussed later in this chapter.
Worldwide Deployment of FGD Systems Post-combustion control of sul-fur dioxide emissions from pulverized coal combustion began in the early1970s in the United States and Japan. Western Europe followed in the 1980s.In the 1990s, the application of FGD became more widespread, and coun-tries in Central and Eastern Europe and Asia, for example, have installedFGD systems. Table 6-1 lists various control technologies and the amountof electricity generation that is being controlled in countries throughout theworld [4]. According to Soud [4], as of 1999, 680 FGD systems were installedin 27 countries, and 140 systems are currently under construction or plannedin nine countries.
Worldwide, approximately 30,000 MW of generating capacity were con-trolled in 1980 compared to no controlled capacity in 1970. Controlledgenerating capacity subsequently increased to ∼130,000 MW in 1990 and∼230,000 MW in 2000. In the United States, controlled capacity rose fromzero in 1970 to 25,000 MW in 1980, to ∼75,000 MW in 1990, and to ∼100,000MW in 2000. FGD systems were installed (as of 1999) to control sulfur diox-ide emissions from over 229,000 MW of generating capacity worldwide. Ofthese systems, ∼87% consisted of wet FGD technology and 11% dry FGDtechnology, with the balance consisting of regenerable technology [5]. Ofthe worldwide capacity controlled with FGD technology, ∼44% is in theUnited States alone, as shown in Table 6-2. In the United States, ∼100,000MW of capacity were equipped with FGD technology in 1999. Of these FGDsystems, approximately 83, 14, and 3% consisted of wet FGD, dry FGD,and regenerable technology, respectively. Worldwide, out of the 668 unitsequipped with FGD in 1999, 522 were equipped with wet FGD, 124 with dryFGD, and 22 with regenerable FGD.
Of the U.S. wet FGD technology population today, 69% are limestoneprocesses [5]. Abroad, limestone processes comprise as much as 93% of thetotal wet FGD technology installed. Of the worldwide capacity equippedwith dry FGD technology, 74% use spray drying processes. This compareswith 80% for spray drying processes in the United States. A summary ofthe FGD systems in the United States, by process, is given in Table 6-3for 1989 (actual capacity) and 2010 (projected capacity). The three primaryprocesses are throwaway-product systems, including the two wet scrubbingsystems using limestone and lime where a synthetic gypsum (CaSO4) is pro-duced. A lack of commercial markets for the gypsum results in this materialbeing disposed of rather than utilized. Characteristics of these processes areprovided in the next section. A variety of FGD processes exist, and the selec-tion of a system is dependent upon site-specific consideration, economics,and other criteria. Elliot [8] provides a ranking of various FGD processesused in the United States in Tables 6-4 and 6-5 where cost, performance,
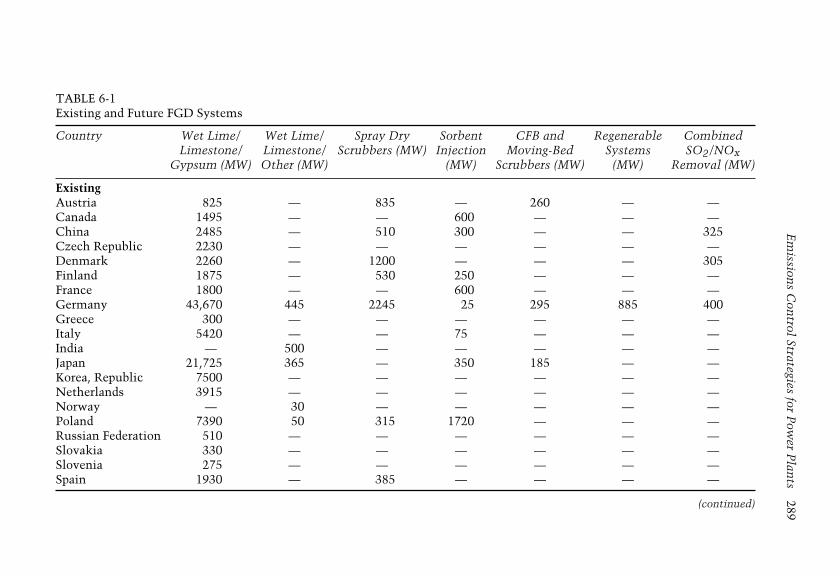
Em
issions
Con
trolStrategies
forP
ower
Plan
ts289
TABLE 6-1Existing and Future FGD Systems
Country Wet Lime/ Wet Lime/ Spray Dry Sorbent CFB and Regenerable CombinedLimestone/ Limestone/ Scrubbers (MW) Injection Moving-Bed Systems SO2/NOx
Gypsum (MW) Other (MW) (MW) Scrubbers (MW) (MW) Removal (MW)
ExistingAustria 825 — 835 — 260 — —Canada 1495 — — 600 — — —China 2485 — 510 300 — — 325Czech Republic 2230 — — — — — —Denmark 2260 — 1200 — — — 305Finland 1875 — 530 250 — — —France 1800 — — 600 — — —Germany 43,670 445 2245 25 295 885 400Greece 300 — — — — — —Italy 5420 — — 75 — — —India — 500 — — — — —Japan 21,725 365 — 350 185 — —Korea, Republic 7500 — — — — — —Netherlands 3915 — — — — — —Norway — 30 — — — — —Poland 7390 50 315 1720 — — —Russian Federation 510 — — — — — —Slovakia 330 — — — — — —Slovenia 275 — — — — — —Spain 1930 — 385 — — — —
(continued)

290C
oalE
nergy
Systems
TABLE 6-1(continued)
Country Wet Lime/ Wet Lime/ Spray Dry Sorbent CFB and Regenerable CombinedLimestone/ Limestone/ Scrubbers (MW) Injection Moving-Bed Systems SO2/NOx
Gypsum (MW) Other (MW) (MW) Scrubbers (MW) (MW) Removal (MW)
Sweden — — 360 130 — — —Taiwan 7100 — — — — — —Thailand 2100 300 — — — — —Turkey 3355 — — — — — —Ukraine 150 — — — — — —United Kingdom 5960 — — — — — —United States 21,680 62,475 12,000 970 80 2870 1845
FutureChina 720 — — 200 — — —Denmark 480 — — — — — —Germany 5035 — — — — — —Israel 1100 — — — — — —Japan 8300 — — — — — —Korea, Republic 2000 — — — — — —Sri Lanka — 300 — — — — —Turkey 470 — — — — — —United States 801 1780 300 520 — — —
Source: From Soud, H. N., Developments in FGD, IEA Coal Research, London, 2000. With permission.
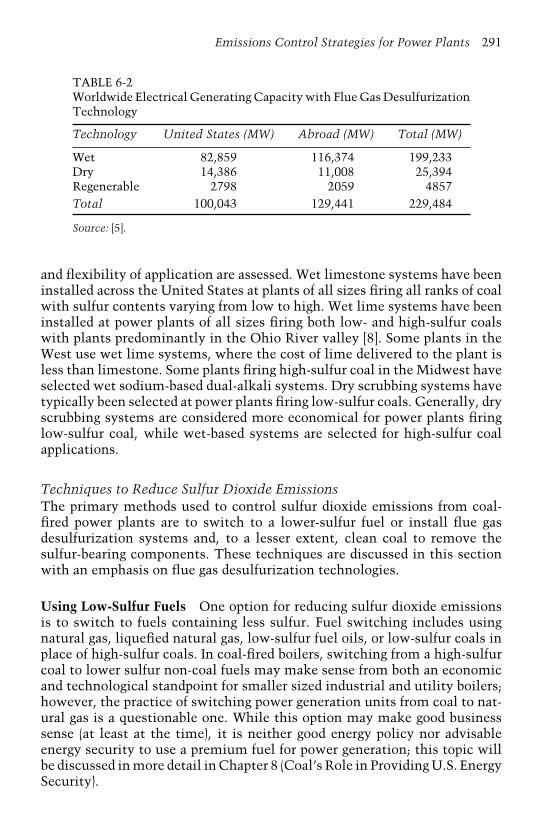
Emissions Control Strategies for Power Plants 291
TABLE 6-2Worldwide Electrical Generating Capacity with Flue Gas DesulfurizationTechnology
Technology United States (MW) Abroad (MW) Total (MW)
Wet 82,859 116,374 199,233Dry 14,386 11,008 25,394Regenerable 2798 2059 4857Total 100,043 129,441 229,484
Source: [5].
and flexibility of application are assessed. Wet limestone systems have beeninstalled across the United States at plants of all sizes firing all ranks of coalwith sulfur contents varying from low to high. Wet lime systems have beeninstalled at power plants of all sizes firing both low- and high-sulfur coalswith plants predominantly in the Ohio River valley [8]. Some plants in theWest use wet lime systems, where the cost of lime delivered to the plant isless than limestone. Some plants firing high-sulfur coal in the Midwest haveselected wet sodium-based dual-alkali systems. Dry scrubbing systems havetypically been selected at power plants firing low-sulfur coals. Generally, dryscrubbing systems are considered more economical for power plants firinglow-sulfur coal, while wet-based systems are selected for high-sulfur coalapplications.
Techniques to Reduce Sulfur Dioxide EmissionsThe primary methods used to control sulfur dioxide emissions from coal-fired power plants are to switch to a lower-sulfur fuel or install flue gasdesulfurization systems and, to a lesser extent, clean coal to remove thesulfur-bearing components. These techniques are discussed in this sectionwith an emphasis on flue gas desulfurization technologies.
Using Low-Sulfur Fuels One option for reducing sulfur dioxide emissionsis to switch to fuels containing less sulfur. Fuel switching includes usingnatural gas, liquefied natural gas, low-sulfur fuel oils, or low-sulfur coals inplace of high-sulfur coals. In coal-fired boilers, switching from a high-sulfurcoal to lower sulfur non-coal fuels may make sense from both an economicand technological standpoint for smaller sized industrial and utility boilers;however, the practice of switching power generation units from coal to nat-ural gas is a questionable one. While this option may make good businesssense (at least at the time), it is neither good energy policy nor advisableenergy security to use a premium fuel for power generation; this topic willbe discussed in more detail in Chapter 8 (Coal’s Role in Providing U.S. EnergySecurity).
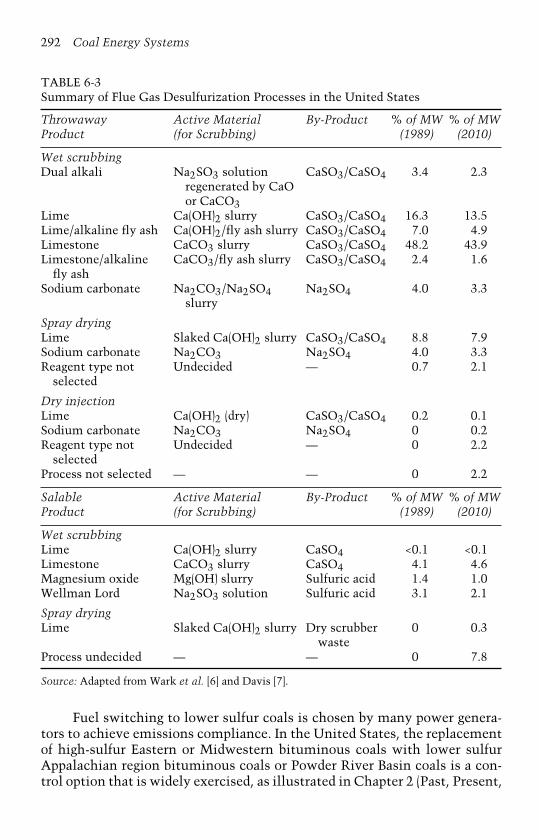
292 Coal Energy Systems
TABLE 6-3Summary of Flue Gas Desulfurization Processes in the United States
Throwaway Active Material By-Product % of MW % of MWProduct (for Scrubbing) (1989) (2010)
Wet scrubbingDual alkali Na2SO3 solution
regenerated by CaOor CaCO3
CaSO3/CaSO4 3.4 2.3
Lime Ca(OH)2 slurry CaSO3/CaSO4 16.3 13.5Lime/alkaline fly ash Ca(OH)2/fly ash slurry CaSO3/CaSO4 7.0 4.9Limestone CaCO3 slurry CaSO3/CaSO4 48.2 43.9Limestone/alkaline
fly ashCaCO3/fly ash slurry CaSO3/CaSO4 2.4 1.6
Sodium carbonate Na2CO3/Na2SO4slurry
Na2SO4 4.0 3.3
Spray dryingLime Slaked Ca(OH)2 slurry CaSO3/CaSO4 8.8 7.9Sodium carbonate Na2CO3 Na2SO4 4.0 3.3Reagent type not
selectedUndecided — 0.7 2.1
Dry injectionLime Ca(OH)2 (dry) CaSO3/CaSO4 0.2 0.1Sodium carbonate Na2CO3 Na2SO4 0 0.2Reagent type not
selectedUndecided — 0 2.2
Process not selected — — 0 2.2
Salable Active Material By-Product % of MW % of MWProduct (for Scrubbing) (1989) (2010)
Wet scrubbingLime Ca(OH)2 slurry CaSO4 <0.1 <0.1Limestone CaCO3 slurry CaSO4 4.1 4.6Magnesium oxide Mg(OH) slurry Sulfuric acid 1.4 1.0Wellman Lord Na2SO3 solution Sulfuric acid 3.1 2.1
Spray dryingLime Slaked Ca(OH)2 slurry Dry scrubber
waste0 0.3
Process undecided — — 0 7.8
Source: Adapted from Wark et al. [6] and Davis [7].
Fuel switching to lower sulfur coals is chosen by many power genera-tors to achieve emissions compliance. In the United States, the replacementof high-sulfur Eastern or Midwestern bituminous coals with lower sulfurAppalachian region bituminous coals or Powder River Basin coals is a con-trol option that is widely exercised, as illustrated in Chapter 2 (Past, Present,

Emissions Control Strategies for Power Plants 293
TABLE 6-4Assessment Relative to Cost and Performance
FGD Process CriterionOperating Capital SO2 Reliability Commercial
Cost Cost Removal Use
LimestoneNatural oxidation M M M M HForced oxidation M M M M HMgO-lime M M H H HHigh-calcium lime M M M M M
Dual-alkaliLime M M H H MLimestone L M H — —Dry scrubbing H M L H HDry injection M L L — —Wellman–Lord H H H M MRegenerable MgO M H H M L
Note: H, high; M, medium; L, low.Source: Elliot, T. C., Ed., Standard Handbook of Powerplant Engineering, McGraw-Hill,New York, 1989. With permission.
TABLE 6-5Assessment with Respect to Flexibility of Application
FGD Process CriterionHigh Low Retrofit Waste SO2/NOxSulfur Sulfur Ease Management Removal
LimestoneNatural oxidation H H M L LForced oxidation H M M L LMgO-lime H L M L MHigh-calcium lime H M M L L
Dual-alkaliLime H L M L MLimestone H L M L LDry scrubbing M H M M MDry injection L H H L LWellman–Lord H L L M MRegenerable MgO H M M H M
Note: H, high; M, medium; L, low.Source: Elliot, T. C., Ed., Standard Handbook of Powerplant Engineering, McGraw-Hill,New York, 1989. With permission.

294 Coal Energy Systems
TABLE 6-6Estimated Recoverable Coal Reserves in the United States by Sulfur Range and MajorCoal-Producing Region (as of January 1, 1997)
Sulfur Content Categories (Pounds of Sulfur per Million Btu)Low Sulfur Medium Sulfur High Sulfur Total
(≤0.60) (0.61–1.67) (≥1.68)Coal- Million Percent Million Percent Million Percent Million PercentProducing Short of Short of Short of Short ofRegion Tons Total Tons Total Tons Total Tons Total
Appalachia 11,675 11.6 20,337 24.0 23,283 25.9 55,295 20.1Interior 769 0.8 10,041 11.8 57,966 64.4 68,776 25.0Western 87,775 87.6 54,529 64.2 8768 9.7 151,072 54.9Total 100,219 — 84,907 — 90,017 — 275,143 —
Source: U.S. Energy Information Administration, U.S. Coal Reserves: 1997 Update, U.S.Department of Energy, Office of Coal, Nuclear, Electric and Alternate Fuels, U.S. GovernmentPrinting Office, Washington, D.C., February 1999.
and Future Role of Coal), where coal production by region is discussed. Theoption of using lower sulfur coal has resulted in a large increase in westerncoal production and use. Table 6-6 illustrates the distribution of sulfur inU.S. coals by region [9].
The relationship between sulfur content in the coal and pounds of sul-fur per million Btu is provided in Table 6-7 for comparison. This listing,developed by the U.S. Department of Energy’s (DOE’s) Energy InformationAdministration (EIA), is used for approximate correlations with New SourcePerformance Standards (NSPS) and 1990 Clean Air Act Amendments criteria.With the exception of the low-sulfur coal, which meets NSPS require-ments, the medium- and high-sulfur coals require control strategies. Thisincludes emission reduction technologies or offsets through sulfur dioxideallowances.
TABLE 6-7Comparison of Sulfur Content in Coal with Pounds of Sulfur per Million Btu
Approximate Range of Coal Sulfur Content (%)Qualitative Pounds of Sulfur High-Grade High-GradeRating per Million Btu Bituminous Coal Lignite
Low sulfur ≤0.4 to 0.6 ≤0.5 to 0.8 ≤0.3 to 0.5Medium sulfur 0.61 to 1.67 0.8 to 2.2 0.5 to 1.3High sulfur 1.68 to >2.50 2.2 to >3.3 1.3 to >1.9
Source: U.S. Energy Information Administration, U.S. Coal Reserves: 1997 Update, U.S.Department of Energy, Office of Coal, Nuclear, Electric and Alternate Fuels, U.S. GovernmentPrinting Office, Washington, D.C., February 1999.

Emissions Control Strategies for Power Plants 295
Low-sulfur coals are also imported to the United States, specifically tocoastal areas such as Florida or the Eastern seaboard. Similar to the replace-ment of high-sulfur coals with non-coal fuels in power generation units, thispractice of importing lower sulfur coals to the United States for sulfur diox-ide compliance also needs to be questioned from the standpoint of energysecurity.
Coal Cleaning Coal preparation, or beneficiation, is a series of operationsthat remove mineral matter (i.e., ash) from coal. Preparation relies on dif-ferent mechanical operations (not discussed in detail here) to perform theseparation, such as size reduction, size classification, cleaning, dewateringand drying, waste disposal, and pollution control. Coal preparation processes,which are physical processes, are designed mainly to provide ash removal,energy enhancement, and product standardization [8]. Sulfur reduction isachieved because the ash material removed contains pyritic sulfur. Coalcleaning is used for moderate sulfur dioxide emissions control, as physicalcoal cleaning is not effective in removing organically bound sulfur. Chemi-cal coal cleaning processes are being developed to remove the organic sulfur;however, these are not used on a commercial scale. An added benefit of coalcleaning is that several trace elements, including antimony, arsenic, cobalt,mercury, and selenium, are generally associated with pyritic sulfur in rawcoal and they, too, are reduced through the cleaning process. As the inertmaterial is removed, the volatile matter content, fixed carbon content, andheating value increase, thereby producing a higher quality coal. The mois-ture content, a result of residual water from the cleaning process, can alsoincrease, which lowers the heating value, but this reduction is usually min-imal and has little impact on coal quality. Coal cleaning does add additionalcost to the coal price; however, among the several benefits of reducing theash content are lower sulfur content; less ash to be disposed of; lower trans-portation costs, as more carbon and less ash is transported (coal cleaning isusually done at the mine and not the power plant); and increases in powerplant peaking capacity, rated capacity, and availability [10]. Developing cir-cumstances are making coal cleaning more economical and a potential sulfurcontrol technology and include [8]:
• Higher coal prices and transportation costs;• Diminishing coal quality because of less selective mining tech-
niques;• The need to increase availability and capacity factors at existing
boilers;• More stringent air quality standards;• Lower costs for improving fuel quality versus investing in extra
pollution control equipment.
Wet Flue Gas Desulfurization Wet scrubbers are the most common FGDmethod currently in use (or under development); they include a variety of

296 Coal Energy Systems
processes and involve the use of many sorbents and are manufactured bya large number of companies. The sorbents used by wet scrubbers includecalcium-, magnesium-, potassium-, or sodium-based sorbents, ammonia, orseawater. Currently, no commercial potassium-based scrubbers are in use,and only a limited number of ammonia or seawater systems are in use orbeing demonstrated. The calcium-based scrubbers are by far the most pop-ular, and this technology is discussed in this section along with the use ofsodium- and magnesium-based sorbents.
Limestone- and Lime-Based Scrubbers Wet scrubbing with limestoneor lime is the most popular commercial FGD system. The inherent simplic-ity, the availability of an inexpensive sorbent (limestone), production of ausable by-product (gypsum), reliability, availability, and the high removalefficiencies obtained (which can be as high as 99%) are the main reasons forthe popularity of this system. Capital costs are typically higher than othertechnologies, such as sorbent injection systems; however, the technology isknown for its low operating costs as the sorbent is widely available and thesystem is cost effective.
In a limestone/lime wet scrubber, the flue gas is scrubbed with a 5 to15% (by weight) slurry of calcium sulfite/sulfate salts along with calciumhydroxide (Ca(OH2)) or limestone (CaCO3). Calcium hydroxide is formed byslaking lime (CaO) in water according to the reaction:
CaO(s) + H2O(l) −→ Ca(OH)2(s) + heat (6-9)
In the limestone and lime wet scrubbers, the slurry containing the sulfite/sulfate salts and the newly added limestone or calcium hydroxide is pumpedto a spray tower absorber and sprayed into it. The sulfur dioxide is absorbedinto the droplets of slurry and a series of reactions occur in the slurry. Thereactions between the calcium and the absorbed sulfur dioxide create thecompounds calcium sulfite hemihydrate (CaCO3 · 1
2H2O) and calcium sulfatedihydrate (CaSO4 · 2H2O). Both of these compounds have low solubility inwater and precipitate from the solution. This enhances the absorption ofsulfur dioxide and further dissolution of the limestone or hydrated lime.
The reactions occurring in the scrubbers are complex. The simplifiedoverall reaction for a limestone scrubber is:
SO2(g) + CaCO3(s) + 12H2O(l) −→ CaSO3 · 1
2H2O(s) + CO2(g) (6-10)
and the reaction for a lime scrubber is:
SO2(g) + Ca(OH)2(s) + H2O(l) −→ CaSO3 · 12H2O(s) + 3
2H2O(l) (6-11)
The calcium sulfite hemihydrate can be converted to the calcium sulfatedihydrate with the addition of oxygen by the reaction:
CaSO3 · 12H2O(s) + 3
2H2O(l) + 12O2(g) ←→ CaSO4 · 2H2O(s) (6-12)
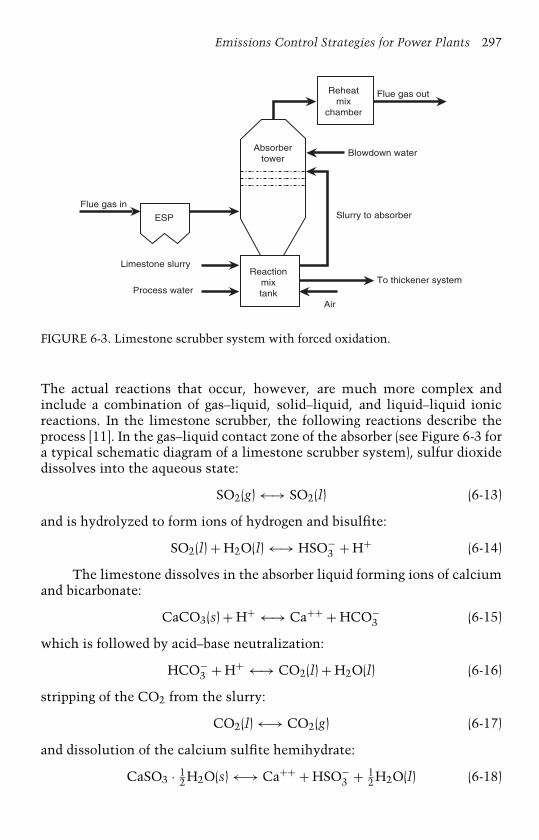
Emissions Control Strategies for Power Plants 297
Flue gas out
Blowdown water
Slurry to absorber
To thickener system
Air
Process water
Limestone slurry
Flue gas in
ESP
Reactionmixtank
Absorbertower
Reheatmix
chamber
FIGURE 6-3. Limestone scrubber system with forced oxidation.
The actual reactions that occur, however, are much more complex andinclude a combination of gas–liquid, solid–liquid, and liquid–liquid ionicreactions. In the limestone scrubber, the following reactions describe theprocess [11]. In the gas–liquid contact zone of the absorber (see Figure 6-3 fora typical schematic diagram of a limestone scrubber system), sulfur dioxidedissolves into the aqueous state:
SO2(g) ←→ SO2(l) (6-13)
and is hydrolyzed to form ions of hydrogen and bisulfite:
SO2(l) + H2O(l) ←→ HSO−3 + H+ (6-14)
The limestone dissolves in the absorber liquid forming ions of calciumand bicarbonate:
CaCO3(s) + H+ ←→ Ca++ + HCO−3 (6-15)
which is followed by acid–base neutralization:
HCO−3 + H+ ←→ CO2(l) + H2O(l) (6-16)
stripping of the CO2 from the slurry:
CO2(l) ←→ CO2(g) (6-17)
and dissolution of the calcium sulfite hemihydrate:
CaSO3 · 12H2O(s) ←→ Ca++ + HSO−
3 + 12H2O(l) (6-18)

298 Coal Energy Systems
In the reaction tank of a scrubber system, the solid limestone is dissolved intothe aqueous state (Reaction (6-15)), acid-base neutralization occurs (Reaction(6-16)), the CO2 is stripped out (Reaction (6-17)), and the calcium sulfitehemihydrate is precipitated by the reaction:
Ca++ + HSO−3 + 1
2H2O(l) ←→ CaSO3 · 12H2O(s) + H+ (6-19)
The dissolution of the calcium sulfite in the gas–liquid contact zone in theabsorber is necessary in order to minimize scaling of the calcium sulfitehemihydrate in the absorber [6]. The equilibrium pH for calcium sulfite is∼6.3 at a CO2 partial pressure of 0.12 atm, which is the typical concentrationof CO2 in flue gas. Typically, the pH is maintained below this level to keepthe calcium sulfite hemihydrate from dissolving (i.e., keep Reaction (6-18)from proceeding to the right). The slurry returning from the absorber to thereaction tank can have a pH as low as 3.5, which is increased to 5.2 to 6.2 bythe addition of freshly prepared limestone slurry to the tank [6]. The pH in thereaction tank must be maintained at a pH that is less than the equilibriumpH of calcium carbonate in water, which is 7.8 at 77◦F.
The reaction equations for the lime scrubber are similar to those forthe limestone scrubber, with the exception that the following reactions aresubstituted for Reactions (6-15) and (6-16), respectively [11]:
Ca(OH)2(s) + H+ ←→ CaOH+ + H2O(l) (6-20)
CaOH+ + H+ ←→ Ca++ + H2O(l) (6-21)
Limestone with Forced Oxidation (LSFO) Limestone scrubbing withforced oxidation (LSFO) is one of the most popular systems in the commer-cial market. A limestone slurry is used in an open spray tower with in situoxidation to remove SO2 and form a gypsum sludge. The major advantagesof this process, relative to a conventional limestone FGD system (where theproduct is calcium sulfite rather than calcium sulfate (gypsum)), are easierdewatering of the sludge, more economical disposal of the scrubber productsolids, and decreased scaling on the tower walls. LSFO is capable of greaterthan 90% SO2 removal [12].
In the LSFO system, the hot flue gas exits the particulate control device,usually an ESP, and enters a spray tower where it comes into contact witha sprayed dilute limestone slurry. The SO2 in the flue gas reacts with thelimestone in the slurry via the reactions listed earlier to form the calciumsulfite hemihydrate. Compressed air is bubbled through the slurry, whichcauses this sulfite to be naturally oxidized and hydrated to form calciumsulfate dihydrate. The calcium sulfate can be first dewatered using a thick-ener or hydrocyclones then further dewatered using a rotary drum filter. Thegypsum is then transported to a landfill for disposal. The formation of thecalcium sulfate crystals in a recirculation tank slurry also helps to reducethe chance of scaling.
Emissions Control Strategies for Power Plants 299
The absorbing reagent, limestone, is normally fed to the open spraytower in an aqueous slurry at a molar feed rate of 1.1 mol of CaCO3 permol of SO2 removed. This process is capable of removing more than 90%of the SO2 present in the inlet flue gas. The advantages of LSFO systemsinclude [12]:
• The scaling potential is lower on lower internal surfaces due tothe presence of gypsum seed crystals and reduced calcium sulfatesaturation levels; this in turn provides greater reliability of thesystem;
• The gypsum product is filtered more easily than the calcium sulfite(CaSO3) produced with conventional limestone systems;
• The chemical oxygen demand is lower in the final disposed product;• The final product can be safely and easily disposed of in a landfill;• The forced oxidation allows greater limestone utilization than in
conventional systems;• Costs of the raw material (limestone) used as an absorbent are
lower;• LSFO is an easier retrofit than natural oxidation systems because the
process uses smaller dewatering equipment.
A disadvantage of this system is the high energy demand due to the relativelyhigher liquid-to-gas ratio necessary to achieve the required SO2 removalefficiencies.
Limestone with Forced Oxidation Producing a Wallboard GypsumBy-Product In the limestone/wallboard (LS/WB) gypsum FGD process, alimestone slurry is used in an open spray tower to remove SO2 from theflue gas. The flue gas enters the spray tower where the SO2 reacts with theCaCO3 in the slurry to form calcium sulfite. The calcium sulfite is thenoxidized to calcium sulfate in the absorber recirculation tank. The calciumsulfate produced with this process is of a higher quality so that it may beused in wallboard manufacture.
There are a few differences with this process in order to achieve a higherquality gypsum. The LS/WB system uses horizontal belt filters to producea drier product and provides sufficient cake washing to remove residualchlorides. Because the by-product is a higher quality, the use of the prod-uct handling system is replaced with by-product conveying and temporarystorage equipment. Sulfuric acid addition is used in systems with an exter-nal oxidation tank. The acid is used to control the pH of the slurry andneutralizes unreacted CaCO3.
The limestone feed rate in this process is 1.05 mol CaCO3 per mol ofSO2 removed, which is slightly lower than the feed rate for the LSFO system[12]. Other advantages of this process are that the disposal area is kept to aminimum because most of the by-product is reusable. The gypsum can be

300 Coal Energy Systems
sold to cement plants and agricultural users. Also, SO2 removal is slightlyenhanced because of the high sulfite-to-sulfate conversion.
There are some disadvantages to this process. Few full-scale operatingsystems actually produce quality gypsum in the United States. To producequality gypsum, specific process control and tight operator attention areconstantly needed to ensure that chemical impurities do not lead to off-specification gypsum. Another disadvantage is the inability to use coolingtower blowdown as system make-up water due to chloride limits in thegypsum by-product.
Limestone with Inhibited Oxidation In the limestone with inhibited oxi-dation process, the hot flue gas exits the particulate control device andenters an open spray tower, where it comes into contact with a dilute CaCO3slurry. This slurry contains thiosulfate (Na2S2O3), which inhibits naturaloxidation of the calcium sulfite. The calcium sulfite is formed from the reac-tion with SO2 in the flue gas and the CaCO3 slurry. The slurry absorbs theSO2, then drains down to a recirculation tank below the tower. By inhibit-ing natural oxidation of the sulfite, gypsum scaling on process equipment isreduced along with gypsum relative saturation, which is reduced below 1.0.Thiosulfate is either added directly as Na2S2O3 to the feed tank or is gener-ated in situ by the addition of emulsified sulfur. In some cases, thiosulfate hasthe ability to increase the dissolution of the calcium carbonate and enlargethe size of the sulfite crystals to improve solids dewatering [12]. This processis capable of removing more than 90% of the SO2 in the flue gas. The calciumsulfite slurry product is thickened, stabilized with fly ash and lime, and thensent to a landfill. The calcium carbonate feed rate is 1.10 mol Ca per molof SO2 removed. The effectiveness of thiosulfate is site specific because theamount of thiosulfate required to inhibit oxidation strongly depends on thechemistry and operating conditions of each FGD system. Variables such assaturation temperature, dissolved magnesium, chlorides, flue gas inlet SO2and O2 concentrations, and slurry pH affect the thiosulfate effectiveness [12].
Thiosulfate has been shown to increase limestone utilization whenadded to the system. This occurs because the thiosulfate reduces the gyp-sum relative saturation level, which in turn reduces the level of calciumdissolved in the liquor. The dissolution rate is increased by lowering the cal-cium concentration in the slurry. Thiosulfate also improves the dewateringcharacteristics of the sulfite product. By preventing the high concentrationsof sulfate, the thiosulfate allows the calcium sulfite to form larger, singlecrystals. This increases the settling velocity of the crystals and improves thefiltering characteristics, which results in a higher solid content of dewateredproduct.
There are a few disadvantages of the process. The thiosulfate/sulfurreagent requires additional process equipment and storage facilities. Also,the reagent can cause corrosion of many stainless steels under scrubber con-ditions. Another disadvantage is that the thiosulfate is fairly temperature
Emissions Control Strategies for Power Plants 301
dependent, thus requiring the system to operate within a particular temper-ature range.Magnesium-Enhanced Lime In the magnesium-enhanced lime (MagLime)process, the hot flue gas exits the particulate control device and enters a spraytower, where it comes into contact with a magnesium sulfite/lime slurry.Magnesium lime, such as thiosorbic lime (which contains 4–8% MgO), is fedto the open spray tower in an aqueous slurry at a molar feed rate of 1.1 molCaO per mol of SO2 removed. The SO2 is absorbed by the reaction withmagnesium sulfite, forming magnesium bisulfite. This occurs through thefollowing reactions [12]:
SO2(g) + H2O(l) −→ H2SO3(aq) −→ H+ + HSO−3 (6-22)
H+ + MgSO3(s) −→ HSO−3 + Mg++ (6-23)
The magnesium sulfite absorbs the H+ ion and increases the HSO−3 concen-
tration in Reaction (6-23). This allows the scrubber liquor to absorb moreof the SO2. The absorbed SO2 reacts with hydrated lime to form solid-phase calcium sulfite. The magnesium sulfite is reformed by the followingreactions:
Ca(OH)2(s) + 2HSO−3 + Mg++ −→ Ca++SO−−
3 + 2H2O(l) + MgSO3(s)(6-24)
Ca++SO−−3 + 1
2H2O −→ CaSO3 · 12H2O(s) (6-25)
Inside the absorber, some magnesium sulfite present in the solution isoxidized to sulfate. This sulfite reacts with the lime to form calcium sul-fate solids. Calcium sulfite and sulfate solids are the main products of theMagLime process. The calcium sulfite sludge is dewatered using thickenerand vacuum filter systems then fixated using fly ash and lime prior to disposalin a lined landfill. The magnesium remains dissolved in the liquid phase.
Some advantages of the MagLime process compared to the LSFO processinclude [12]:
• High SO2 removal efficiency at low liquid-to-gas ratios;• Lower gas-side pressure drop due to lower liquid-to-gas ratios;• Reduced potential for scaling, which improves reliability of the
system;• Lower power consumption due to a lower slurry recycle rate;• Lower capital investment due to smaller reagent handling equipment
and no oxidation air compressor;• Reduction in freshwater use because the process water may be
recycled for the mist eliminator wash.
The three major disadvantages of the process are the expense of the limereagent compared to the limestone, the use of fresh water for lime slaking,
302 Coal Energy Systems
and the difficult dewatering characteristics of the calcium sulfite/sulfatesludge. The sulfite can be oxidized to produce gypsum, but this requiresextensive equipment and process control.
Limestone with Dibasic Acid The dibasic acid enhanced limestone processis very similar to the LSFO process. The hot flue gas exits the particulatecontrol device and enters a spray tower, where it comes into contact with adiluted limestone slurry. The SO2 in the flue gas reacts with the limestoneand water to form hydrated calcium sulfite:
SO2(g) + CaCO3(s) + 12H2O(l) −→ CaSO3 · 1
2H2O(s) + CO2(g) (6-10)
This equation is rate limited by the absorption of SO2 into the scrubbingliquor:
SO2(l) + H2O(l) ←→ HSO−3 + H+ (6-14)
The dissolved SO2 ions then react with the calcium ions to form calciumsulfite. The hydrogen ions in solution are partly responsible for reformingthe SO2.
After absorbing the SO2, the slurry drains from the tower to a recircula-tion tank. Here, the calcium sulfite is oxidized to calcium sulfate dihydrateusing oxygen:
CaSO3 · 12H2O(s) + 3
2H2O(l) + 12O2(g) ←→ CaSO4 · 2H2O(s) (6-12)
Dibasic acid acts as a buffer by absorbing free hydrogen ions formed byReaction (6-14), which shifts the reaction to the right to form more sul-fite ions, thus removing more SO2. Alkaline limestone is added to replacethe buffering capabilities of the acid; therefore, there is no net consumptionof the dibasic acid during SO2 absorption. The limestone dissolution rateis increased by increasing the SO2 removal efficiency at a low slurry pH.This results in a lower reagent consumption due to an increase in calciumcarbonate availability in the recirculation tank.
The dibasic acid process offers some advantages compared to the LSFOprocess [12]:
• Increased SO2 removal efficiency;• Reduced liquid-to-gas ratio and the potential to decrease the reagent
feed rate, which lowers capital and operating costs for the limestonegrinding equipment, slurry handling, and landfill requirements;
• Reduced scaling because of the low pH and reduced gypsum relativesaturation levels;
• Increased system reliability by reducing the maintenance require-ments and increasing the flexibility of the system.

Emissions Control Strategies for Power Plants 303
Disadvantages of the process include:
• More process capital is needed for the dibasic acid feed equipment;• There is the potential for corrosion and erosion due to the low system
pH;• Odorous by-products are produced by the dibasic acid degradation;
although the SO2 absorption reactions do not consume the dibasicacid, the acid does degrade by carboxylic oxidation into many shortchain molecules, one of which is valeric acid, which has a mustyodor;
• Control problems may be caused by foaming in the recirculation andoxidation tanks due to the presence of the dibasic acid.
Sodium-Based Scrubbers Wet sodium-based systems have been incommercial operation since the 1970s. These systems can achieve high SO2removal efficiencies while burning coals with medium to high sulfur con-tent. A disadvantage of these systems, however, is the production of a wastesludge that requires disposal.
Lime Dual Alkali In the lime dual alkali process, the hot flue gas exitsthe particulate control device and enters an open spray tower where the gascomes into contact with a sodium sulfite (Na2SO3) solution that is sprayedinto the tower [12]. An initial charge of sodium carbonate (Na2CO3) reactsdirectly with the SO2 to form sodium sulfite and CO2. The sulfite then reactswith more SO2 and water to form sodium bisulfite (NaHSO3). Some of thesodium sulfite is oxidized by excess oxygen in the flue gas to form sodiumsulfate (Na2SO4). This does not react with SO2 and cannot be reformed bythe addition of lime to form calcium sulfate. The above process is describedby the following reactions:
Na2CO3(s) + SO2(g) −→ Na2SO3(s) + CO2(g) (6-26)
Na2SO3(s) + SO2(g) + H2O(l) −→ 2NaHSO3(s) (6-27)
Na2SO3(s) + 12O2(g) −→ Na2SO4(s) (6-28)
along with the minor reaction:
2NaOH(aq) + SO2(g) −→ Na2SO3(s) + H2O(l) (6-29)
The calcium sulfites and sulfates are reformed in a separate regenerationtank and are formed by mixing the soluble sodium salts (bisulfate and sul-fate) with slaked lime. The calcium sulfites and sulfates precipitate from thesolution in the regeneration tank. The scrubber liquor then has a pH of 6 to7 and consists of sodium sulfite, sodium bisulfite, sodium sulfate, sodiumhydroxide, sodium carbonate, and sodium bicarbonate [12].
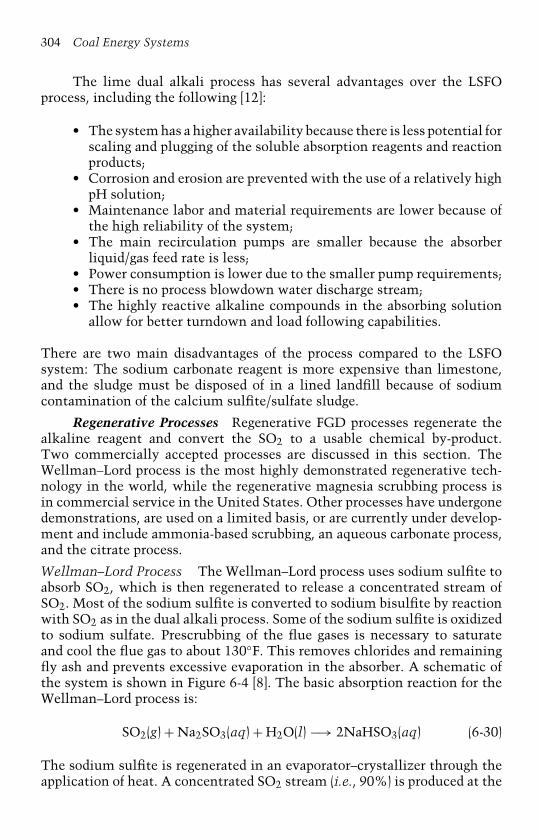
304 Coal Energy Systems
The lime dual alkali process has several advantages over the LSFOprocess, including the following [12]:
• The system has a higher availability because there is less potential forscaling and plugging of the soluble absorption reagents and reactionproducts;
• Corrosion and erosion are prevented with the use of a relatively highpH solution;
• Maintenance labor and material requirements are lower because ofthe high reliability of the system;
• The main recirculation pumps are smaller because the absorberliquid/gas feed rate is less;
• Power consumption is lower due to the smaller pump requirements;• There is no process blowdown water discharge stream;• The highly reactive alkaline compounds in the absorbing solution
allow for better turndown and load following capabilities.
There are two main disadvantages of the process compared to the LSFOsystem: The sodium carbonate reagent is more expensive than limestone,and the sludge must be disposed of in a lined landfill because of sodiumcontamination of the calcium sulfite/sulfate sludge.
Regenerative Processes Regenerative FGD processes regenerate thealkaline reagent and convert the SO2 to a usable chemical by-product.Two commercially accepted processes are discussed in this section. TheWellman–Lord process is the most highly demonstrated regenerative tech-nology in the world, while the regenerative magnesia scrubbing process isin commercial service in the United States. Other processes have undergonedemonstrations, are used on a limited basis, or are currently under develop-ment and include ammonia-based scrubbing, an aqueous carbonate process,and the citrate process.
Wellman–Lord Process The Wellman–Lord process uses sodium sulfite toabsorb SO2, which is then regenerated to release a concentrated stream ofSO2. Most of the sodium sulfite is converted to sodium bisulfite by reactionwith SO2 as in the dual alkali process. Some of the sodium sulfite is oxidizedto sodium sulfate. Prescrubbing of the flue gases is necessary to saturateand cool the flue gas to about 130◦F. This removes chlorides and remainingfly ash and prevents excessive evaporation in the absorber. A schematic ofthe system is shown in Figure 6-4 [8]. The basic absorption reaction for theWellman–Lord process is:
SO2(g) + Na2SO3(aq) + H2O(l) −→ 2NaHSO3(aq) (6-30)
The sodium sulfite is regenerated in an evaporator–crystallizer through theapplication of heat. A concentrated SO2 stream (i.e., 90%) is produced at the

Emissions Control Strategies for Power Plants 305
Venturi Prescrubber
Reheat
To StackFlue-GasBlower
Absorber
MakeupWater
RichSolutionStorage
To Ash Pond
Glycol
Chiller
Centrifuge
DryerPurge Sulfate Solids
Vent ScrubberFeedCooler
Dissolving Tank
Steam
SodiumMakeup
Evaporator/Crystallizers CondensateStrippers
Steam
SO3
FIGURE 6-4. Wellman–Lord process. (From Elliot, T. C., Ed., Standard Handbook ofPowerplant Engineering, McGraw-Hill, New York, 1989. With permission.)
same time. The overall regeneration reaction is:
2NaHSO3(aq) + heat −→ Na2SO3(s) + H2O(l) + SO2(conc.) (6-31)
The concentrated SO2 stream that is produced may be compressed, liquefied,and oxidized to produce sulfuric acid or reduced to elemental sulfur. A smallportion of collected SO2 oxidizes to the sulfate form and is converted in acrystallizer to sodium sulfate solids that are marketed as salt cakes [8].
The advantages of this process include minimal solid waste produc-tion, low alkaline reagent consumption, and the use of a slurry rather than asolution, which prevents scaling and allows the production of a marketableby-product. Disadvantages of the process are the high energy consumptionand high maintenance due to the complexity of the process, as well as thelarge area required for the system. Another disadvantage is that a purgestream of about 15% of the scrubbing solution is required to prevent build-upof the sodium sulfate. Thiosulfate must be purged from the regeneratedsodium sulfite.
Regenerative Magnesia Scrubbing In the magnesium oxide process, MgOin the slurry is used in a manner similar to the use of limestone or lime inthe lime scrubbing process. The primary difference between the processes isthat the magnesium oxide process is regenerative, whereas lime scrubbingis generally a throwaway process.
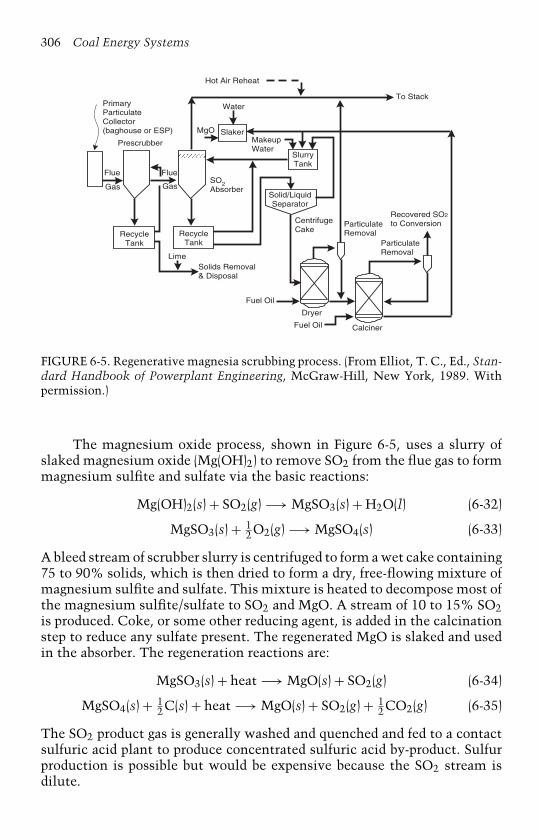
306 Coal Energy Systems
Primary Particulate Collector (baghouse or ESP)
Prescrubber
Flue
Gas
Flue
Gas
Hot Air Reheat
To StackWater
MgO SlakerMakeup Water
SO2
Absorber
Recycle Tank
Recycle Tank
LimeSolids Removal & Disposal
Fuel Oil
Slurry Tank
Solid/Liquid Separator
Centrifuge Cake
Particulate Removal
Recovered SO2
to Conversion
Particulate Removal
Calciner
Dryer
Fuel Oil
FIGURE 6-5. Regenerative magnesia scrubbing process. (From Elliot, T. C., Ed., Stan-dard Handbook of Powerplant Engineering, McGraw-Hill, New York, 1989. Withpermission.)
The magnesium oxide process, shown in Figure 6-5, uses a slurry ofslaked magnesium oxide (Mg(OH)2) to remove SO2 from the flue gas to formmagnesium sulfite and sulfate via the basic reactions:
Mg(OH)2(s) + SO2(g) −→ MgSO3(s) + H2O(l) (6-32)
MgSO3(s) + 12O2(g) −→ MgSO4(s) (6-33)
A bleed stream of scrubber slurry is centrifuged to form a wet cake containing75 to 90% solids, which is then dried to form a dry, free-flowing mixture ofmagnesium sulfite and sulfate. This mixture is heated to decompose most ofthe magnesium sulfite/sulfate to SO2 and MgO. A stream of 10 to 15% SO2is produced. Coke, or some other reducing agent, is added in the calcinationstep to reduce any sulfate present. The regenerated MgO is slaked and usedin the absorber. The regeneration reactions are:
MgSO3(s) + heat −→ MgO(s) + SO2(g) (6-34)
MgSO4(s) + 12C(s) + heat −→ MgO(s) + SO2(g) + 1
2CO2(g) (6-35)
The SO2 product gas is generally washed and quenched and fed to a contactsulfuric acid plant to produce concentrated sulfuric acid by-product. Sulfurproduction is possible but would be expensive because the SO2 stream isdilute.

Emissions Control Strategies for Power Plants 307
Advantages of this process include high SO2 removal efficiencies (upto 99%), minimum impact of fluctuations in inlet SO2 levels on removalefficiency, low chemical scaling potential, the capability to regenerate thesulfate (which simplifies waste management), and more favorable economicscompared to other available regenerative processes [8]. The main disadvan-tages of the process are its complexity and the need for a contact sulfuricacid plant to produce a salable by-product.
Dry Flue Gas Desulfurization Technology Dry FGD technology includeslime or limestone spray drying; dry sorbent injection, including furnace,economizer, duct, and hybrid methods; and circulating fluidized-bed scrub-bers. These processes are characterized with dry waste products that aregenerally easier to dispose of than waste products from wet scrubbers. Alldry FGD processes are throwaway types.
Spray Dry Scrubbers Spray dry scrubbers are the second most widelyused method for controlling SO2 emissions in utility coal-fired power plants.Prior to 1980, the removal of SO2 by absorption was usually performed usingwet scrubbers. Wet scrubbing requires considerable equipment, so alterna-tives to wet scrubbing have been developed, including spray dry scrubbers.Lime (CaO) is usually the sorbent used in the spray drying process, buthydrated lime (Ca(OH)2) is also used. This technology is also known as semi-dry flue gas desulfurization and is generally used for sources that burn low-to medium-sulfur coal. In the United States, this process has been used inboth retrofit applications and new installations on units burning low-sulfurcoal [5,6].
In this process, the hot flue gas exits the boiler air heater andenters a reactor vessel. A slurry consisting of lime and recycled solids isatomized/sprayed into the absorber. The slurry is formed by the reaction:
CaO(s) + H2O(l) −→ Ca(OH)2(s) + heat (6-9)
The SO2 in the flue gas is absorbed into the slurry and reacts with the limeand fly ash alkali to form calcium salts:
Ca(OH)2(s) + SO2(g) −→ CaSO3 · 12H2O(s) + 1
2H2O(v) (6-36)
Ca(OH)2(s) + SO3(g) + H2O(v) −→ CaSO4 · 2H2O(s) (6-37)
Hydrogen chloride (HCl) present in the flue gas is also absorbed into the slurryand reacts with the slaked lime. The water that enters with the slurry isevaporated, which lowers the temperature and raises the moisture content ofthe scrubbed gas. The scrubbed gas then passes through a particulate controldevice downstream of the spray drier. Some of the collected reaction product,which contains some unreacted lime, and fly ash is recycled to the slurry feedsystem while the rest is sent to a landfill for disposal. Factors affecting the

308 Coal Energy Systems
absorption chemistry include the flue gas temperature, SO2 concentrationin the flue gas, and the size of the atomized slurry droplets. The residencetime in the reactor vessel is typically about 10 to 12 seconds.
The lime spray dryer process offers a few advantages over the LSFO pro-cess [12]. Only a small alkaline stream of scrubbing slurry must be pumpedinto the spray dryer. This stream contacts the gas entering the dryer insteadof the walls of the system. This prevents corrosion of the walls and pipes inthe absorber system. The pH of the slurry and dry solids is high, allowingfor the use of mild steel materials rather than expensive alloys. The productfrom the spray dryer is a dry solid that is handled by conventional dry fly ashparticulate removal and handling systems, which eliminates the need fordewatering solids handling equipment and reduces associated maintenanceand operating requirements. Overall power requirements are decreasedbecause less pumping power is required. The gas exiting the absorber isnot saturated and does not require reheating, thereby reducing capital costsand steam consumption. Chloride concentration increases the SO2 removalefficiencies (whereas, in wet scrubbers, increasing chloride concentrationdecreases efficiency), which allows the use of cooling tower blowdown forslurry dilution after completing the slaking of the lime reagent. The absorp-tion system is less complex, so operating, laboratory, and maintenancemanpower requirements are lower than those required for a wet scrubbingsystem.
There are some disadvantages of the lime spray dryer compared to theLSFO system, and these, along with the advantages, must be evaluated forspecific applications [12]. A major product of the lime spray dryer processis calcium sulfite, as only 25% or less oxidizes to calcium sulfate. Thesolids handling equipment for the particulate removal device has to have agreater capacity than conventional fly ash removal applications. Fresh wateris required in the lime slaking process, which can represent approximatelyhalf of the system’s water requirement. This differs from wet scrubbers,where cooling tower water can be used for limestone grinding circuits andmost other makeup water applications. The lime spray dryer process requiresa higher reagent feed ratio than the conventional systems to achieve highremoval efficiencies. Approximately 1.5 mol CaO per mol of SO2 removedare needed for 90% removal efficiency. Lime is also more expensive thanlimestone; therefore, the operating costs are increased. These costs can bereduced if higher coal chloride levels and/or calcium chloride spiking areused because chlorides improve removal efficiency and reduce reagent con-sumption. A higher inlet flue gas temperature is needed when a higher sulfurcoal is used, which in turn reduces the overall boiler efficiency.
Combining spray dry scrubbing with other FGD systems such as fur-nace or duct sorbent injection and particulate control technology such asa pulse-jet baghouse allows the use of limestone as the sorbent instead ofthe more costly lime [4]. Sulfur dioxide removal efficiencies can exceed 99%with such a combination.
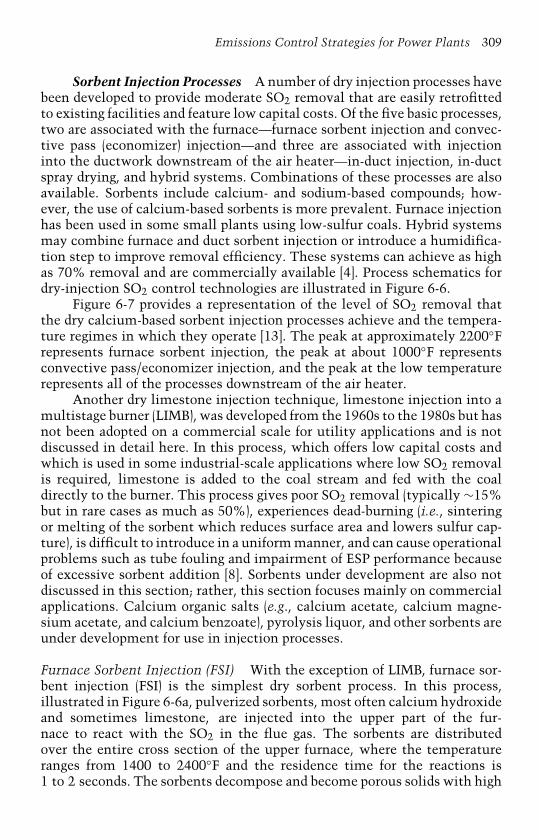
Emissions Control Strategies for Power Plants 309
Sorbent Injection Processes A number of dry injection processes havebeen developed to provide moderate SO2 removal that are easily retrofittedto existing facilities and feature low capital costs. Of the five basic processes,two are associated with the furnace—furnace sorbent injection and convec-tive pass (economizer) injection—and three are associated with injectioninto the ductwork downstream of the air heater—in-duct injection, in-ductspray drying, and hybrid systems. Combinations of these processes are alsoavailable. Sorbents include calcium- and sodium-based compounds; how-ever, the use of calcium-based sorbents is more prevalent. Furnace injectionhas been used in some small plants using low-sulfur coals. Hybrid systemsmay combine furnace and duct sorbent injection or introduce a humidifica-tion step to improve removal efficiency. These systems can achieve as highas 70% removal and are commercially available [4]. Process schematics fordry-injection SO2 control technologies are illustrated in Figure 6-6.
Figure 6-7 provides a representation of the level of SO2 removal thatthe dry calcium-based sorbent injection processes achieve and the tempera-ture regimes in which they operate [13]. The peak at approximately 2200◦Frepresents furnace sorbent injection, the peak at about 1000◦F representsconvective pass/economizer injection, and the peak at the low temperaturerepresents all of the processes downstream of the air heater.
Another dry limestone injection technique, limestone injection into amultistage burner (LIMB), was developed from the 1960s to the 1980s but hasnot been adopted on a commercial scale for utility applications and is notdiscussed in detail here. In this process, which offers low capital costs andwhich is used in some industrial-scale applications where low SO2 removalis required, limestone is added to the coal stream and fed with the coaldirectly to the burner. This process gives poor SO2 removal (typically ∼15%but in rare cases as much as 50%), experiences dead-burning (i.e., sinteringor melting of the sorbent which reduces surface area and lowers sulfur cap-ture), is difficult to introduce in a uniform manner, and can cause operationalproblems such as tube fouling and impairment of ESP performance becauseof excessive sorbent addition [8]. Sorbents under development are also notdiscussed in this section; rather, this section focuses mainly on commercialapplications. Calcium organic salts (e.g., calcium acetate, calcium magne-sium acetate, and calcium benzoate), pyrolysis liquor, and other sorbents areunder development for use in injection processes.
Furnace Sorbent Injection (FSI) With the exception of LIMB, furnace sor-bent injection (FSI) is the simplest dry sorbent process. In this process,illustrated in Figure 6-6a, pulverized sorbents, most often calcium hydroxideand sometimes limestone, are injected into the upper part of the fur-nace to react with the SO2 in the flue gas. The sorbents are distributedover the entire cross section of the upper furnace, where the temperatureranges from 1400 to 2400◦F and the residence time for the reactions is1 to 2 seconds. The sorbents decompose and become porous solids with high

Sorbent
Boiler
AirHeater
Water
ParticulateCollection
Device
CleanedFlue Gas
Stack
Disposal
RequiredOptional
Recycle
Sorbent
Boiler
AirHeater
Water
ParticulateCollection
Device
CleanedFlue Gas
Stack
Disposal
RequiredOptional
Recycle
Additive
1,000˚F
Boiler
AirHeater
Water
ParticulateCollection
Device
CleanedFlue Gas
Stack
Disposal
RequiredOptional
Recycle
300˚F
Additive(Sodium)
DrySorbentInjection
Pretreatment
Boiler
AirHeater Particulate
CollectionDevice Stack
Disposal
RequiredOptional
RecycleAdditive Lime SlurryPreparation
Lime Slaking
Water
CleanedFlue Gas
Boiler
AirHeater Particulate
CollectionDevice
CleanedFlue Gas
Stack
Disposal
RequiredOptional
Recycle
Heat Recovery
Water Alkali
New
Regeneration
Disposal
(a)
(b)
(c)
(d)
(e)
FIGURE 6-6. Simplified process schematics for dry-injection SO2 control technolo-gies. (Adapted from Rhudy et al. [13].)
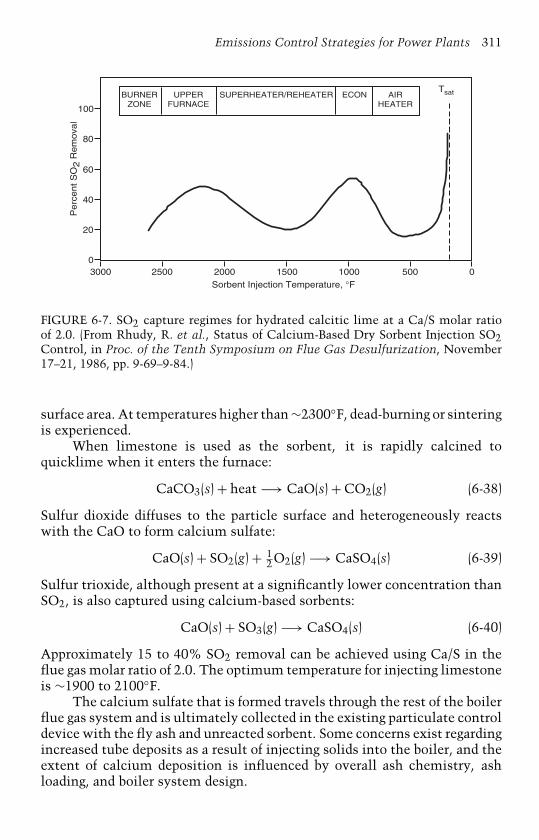
Emissions Control Strategies for Power Plants 311
BURNERZONE
UPPERFURNACE
SUPERHEATER/REHEATER ECON AIRHEATER
Tsat
Sorbent Injection Temperature, °F
100
80
60
40
20
03000 2500 2000 1500 1000 500 0
Perc
ent S
O2 R
em
ova
l
FIGURE 6-7. SO2 capture regimes for hydrated calcitic lime at a Ca/S molar ratioof 2.0. (From Rhudy, R. et al., Status of Calcium-Based Dry Sorbent Injection SO2Control, in Proc. of the Tenth Symposium on Flue Gas Desulfurization, November17–21, 1986, pp. 9-69–9-84.)
surface area. At temperatures higher than ∼2300◦F, dead-burning or sinteringis experienced.
When limestone is used as the sorbent, it is rapidly calcined toquicklime when it enters the furnace:
CaCO3(s) + heat −→ CaO(s) + CO2(g) (6-38)
Sulfur dioxide diffuses to the particle surface and heterogeneously reactswith the CaO to form calcium sulfate:
CaO(s) + SO2(g) + 12O2(g) −→ CaSO4(s) (6-39)
Sulfur trioxide, although present at a significantly lower concentration thanSO2, is also captured using calcium-based sorbents:
CaO(s) + SO3(g) −→ CaSO4(s) (6-40)
Approximately 15 to 40% SO2 removal can be achieved using Ca/S in theflue gas molar ratio of 2.0. The optimum temperature for injecting limestoneis ∼1900 to 2100◦F.
The calcium sulfate that is formed travels through the rest of the boilerflue gas system and is ultimately collected in the existing particulate controldevice with the fly ash and unreacted sorbent. Some concerns exist regardingincreased tube deposits as a result of injecting solids into the boiler, and theextent of calcium deposition is influenced by overall ash chemistry, ashloading, and boiler system design.
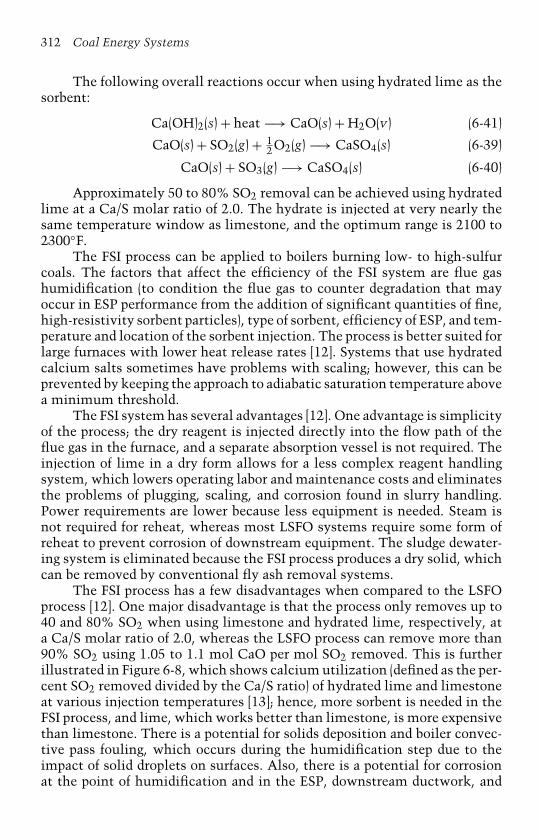
312 Coal Energy Systems
The following overall reactions occur when using hydrated lime as thesorbent:
Ca(OH)2(s) + heat −→ CaO(s) + H2O(v) (6-41)
CaO(s) + SO2(g) + 12O2(g) −→ CaSO4(s) (6-39)
CaO(s) + SO3(g) −→ CaSO4(s) (6-40)
Approximately 50 to 80% SO2 removal can be achieved using hydratedlime at a Ca/S molar ratio of 2.0. The hydrate is injected at very nearly thesame temperature window as limestone, and the optimum range is 2100 to2300◦F.
The FSI process can be applied to boilers burning low- to high-sulfurcoals. The factors that affect the efficiency of the FSI system are flue gashumidification (to condition the flue gas to counter degradation that mayoccur in ESP performance from the addition of significant quantities of fine,high-resistivity sorbent particles), type of sorbent, efficiency of ESP, and tem-perature and location of the sorbent injection. The process is better suited forlarge furnaces with lower heat release rates [12]. Systems that use hydratedcalcium salts sometimes have problems with scaling; however, this can beprevented by keeping the approach to adiabatic saturation temperature abovea minimum threshold.
The FSI system has several advantages [12]. One advantage is simplicityof the process; the dry reagent is injected directly into the flow path of theflue gas in the furnace, and a separate absorption vessel is not required. Theinjection of lime in a dry form allows for a less complex reagent handlingsystem, which lowers operating labor and maintenance costs and eliminatesthe problems of plugging, scaling, and corrosion found in slurry handling.Power requirements are lower because less equipment is needed. Steam isnot required for reheat, whereas most LSFO systems require some form ofreheat to prevent corrosion of downstream equipment. The sludge dewater-ing system is eliminated because the FSI process produces a dry solid, whichcan be removed by conventional fly ash removal systems.
The FSI process has a few disadvantages when compared to the LSFOprocess [12]. One major disadvantage is that the process only removes up to40 and 80% SO2 when using limestone and hydrated lime, respectively, ata Ca/S molar ratio of 2.0, whereas the LSFO process can remove more than90% SO2 using 1.05 to 1.1 mol CaO per mol SO2 removed. This is furtherillustrated in Figure 6-8, which shows calcium utilization (defined as the per-cent SO2 removed divided by the Ca/S ratio) of hydrated lime and limestoneat various injection temperatures [13]; hence, more sorbent is needed in theFSI process, and lime, which works better than limestone, is more expensivethan limestone. There is a potential for solids deposition and boiler convec-tive pass fouling, which occurs during the humidification step due to theimpact of solid droplets on surfaces. Also, there is a potential for corrosionat the point of humidification and in the ESP, downstream ductwork, and
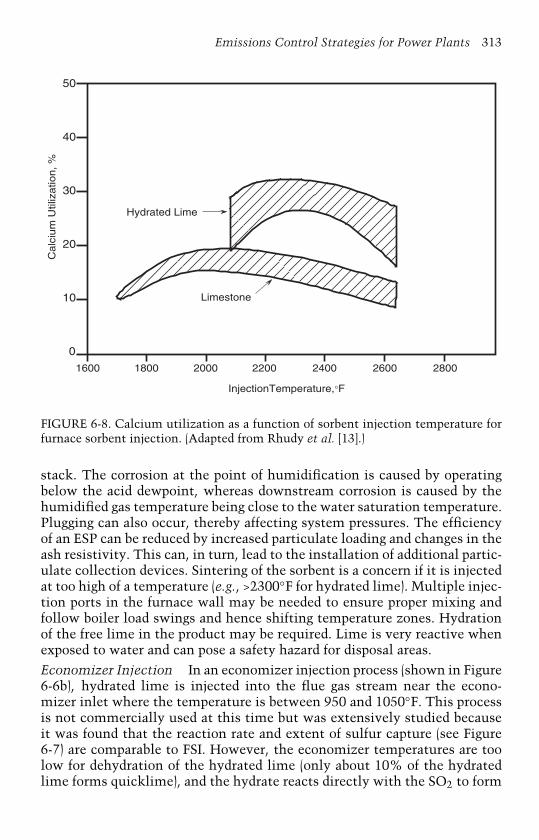
Emissions Control Strategies for Power Plants 313
50
40
30
20
10
0
1600 1800 2000 2200 2400 2600 2800
InjectionTemperature,°F
Hydrated Lime
Limestone
Ca
lciu
m U
tiliz
atio
n,
%
FIGURE 6-8. Calcium utilization as a function of sorbent injection temperature forfurnace sorbent injection. (Adapted from Rhudy et al. [13].)
stack. The corrosion at the point of humidification is caused by operatingbelow the acid dewpoint, whereas downstream corrosion is caused by thehumidified gas temperature being close to the water saturation temperature.Plugging can also occur, thereby affecting system pressures. The efficiencyof an ESP can be reduced by increased particulate loading and changes in theash resistivity. This can, in turn, lead to the installation of additional partic-ulate collection devices. Sintering of the sorbent is a concern if it is injectedat too high of a temperature (e.g., >2300◦F for hydrated lime). Multiple injec-tion ports in the furnace wall may be needed to ensure proper mixing andfollow boiler load swings and hence shifting temperature zones. Hydrationof the free lime in the product may be required. Lime is very reactive whenexposed to water and can pose a safety hazard for disposal areas.
Economizer Injection In an economizer injection process (shown in Figure6-6b), hydrated lime is injected into the flue gas stream near the econo-mizer inlet where the temperature is between 950 and 1050◦F. This processis not commercially used at this time but was extensively studied becauseit was found that the reaction rate and extent of sulfur capture (see Figure6-7) are comparable to FSI. However, the economizer temperatures are toolow for dehydration of the hydrated lime (only about 10% of the hydratedlime forms quicklime), and the hydrate reacts directly with the SO2 to form
314 Coal Energy Systems
calcium sulfite:
Ca(OH)2(s) + SO2(g) −→ CaSO3(s) + H2O(v) (6-42)
This process is best suited for older units in need of a retrofit process and canbe used for low- to high-sulfur coals. The advantages and disadvantages ofthis system are similar to the FSI process (but will not be discussed in detailhere as this process is not currently being used in the power industry) withthe notable exception that no reactive CaO is contained in the waste.
Duct Sorbent Injection: Duct Spray Drying Spray dry scrubbers are thesecond most widely used method for controlling SO2 emissions in utilitycoal-fired power plants. Lime is usually the sorbent used in this technology,but sodium carbonate is also used, specifically in the western United States.Spray dryer FGD systems have been installed on over 12,000 MW of totalFGD capacity, as shown in Table 6-1, as well as numerous industrial boilers.
The first commercial dry scrubbing system on a coal-fired boiler inthe United States was installed in mid-1981 at the Coyote station (jointlyowned by Montana–Dakota Utilities, Northern Municipal Power Agency,Northwestern Public Service Company, and Ottertail Power Company) nearBeulah, North Dakota. The 425 MW unit burns lignite from a mine-mouthplant and initially used soda ash (Na2CO3) as the sulfur removal reagent. Thespray dryer was modified about 10 years later, and the unit currently useslime as the reagent. The second dry scrubbing system on a coal-fired utilityboiler was installed on two 440 MW units; it became operational in 1982and 1983 at the Basin Electric Power Cooperative’s Antelope Valley station,also located near Beulah, North Dakota. These units fire minemouth ligniteand use a slaked lime slurry to remove SO2 in the spray dryer.
A slaked-lime slurry is sprayed directly into the ductwork to removeSO2 (see Figure 6-6c). The reaction products and fly ash are captured down-stream in the particulate removal device. A portion of these solids is recycledand reinjected with the fresh sorbent. Dry spray drying (DSD) is a relativelysimple retrofit process capable of 50% SO2 removal at a Ca/S ratio of 1.5.The concept is the same as conventional spray drying except that the existingductwork provides the residence time for drying instead of a reaction vessel.The main difference is that the residence time in the duct is much shorter(i.e., 1–2 sec, compared to 10–12 sec in a spray drying vessel).
The slaked lime is produced by hydrating raw lime to form calciumhydroxide. This slaked lime is atomized and absorbs the SO2 in the fluegas. The SO2 reacts with the slurry droplets as they dry to form equimolaramounts of calcium sulfite and calcium sulfate. The water in the lime slurryimproves SO2 absorption by humidifying the gas. The reaction products,unreacted sorbent, and fly ash are collected in the particulate control devicelocated downstream. Some of the unreacted sorbent may react with a portionof the CO2 in the flue gas to form calcium carbonate. Also, a little more SO2
Emissions Control Strategies for Power Plants 315
removal is achieved in the particulate control device. The reactions occurringin the process are:
CaO(s) + H2O(l) −→ Ca(OH)2(s) + heat (6-9)
Ca(OH)2(s) + SO2(g) −→ CaSO3 · 12H2O(s) + 1
2H2O(v) (6-36)
Ca(OH)2(s) + SO2(g) + 12O2(g) + H2O(v) −→ CaSO4 · 2H2O(s) (6-43)
Ca(OH)2(s) + CO2(g) −→ CaCO3(s) + H2O(v) (6-44)
There are two different methods for atomizing the slurry. One methodis the use of rotary atomizers, with the ductwork providing the short gasresidence time of 1 to 2 seconds. When using this atomizer, the ductworkmust be sufficiently long to allow for drying of the slurry droplets. Theremust also be no obstructions in the duct. The second method for atomizingthe slurry is the use of dual-fluid atomizers, where compressed air and waterare used to atomize the slurry. This process is referred to as the confinedzone dispersion (CZD) process. The dual-fluid atomizer has been shown tobe more controllable due to the adjustable water flow rate. This atomizeris also relatively inexpensive and has a long and reliable operating life withlittle maintenance. The spray is confined in the duct, which allows bettermixing with the flue gas rather than impinging on the walls.
The DSD process has several advantages compared to wet processes.The DSD process is less complex because the reagent is injected directlyinto the flow path of the flue gas, and a separate absorption vessel is notneeded. Less equipment is needed so power requirements are lower. Thewaste from this process does not contain reactive lime, as the FSI processdoes, and therefore does not require special handling.
Some of the problems encountered by the DSD system are also commonto other dry processes. A main disadvantage of the system includes limitedSO2 removal efficiency (i.e., ∼50%) and low calcium utilization comparedto wet processes. Quicklime is more expensive than limestone. If an ESPis used, there is the potential for reduced efficiency due to changes in flyash resistivity and the increased dust loading in the flue gas. Additionalcollection devices may be needed as well as humidification to improve ESPcollection efficiency. There must be sufficient length (i.e., residence time ofthe ductwork) to ensure complete droplet vaporization prior to the particu-late collection device. This is necessary for good sulfur capture and to avoidplugging and deposition, which in turn results in an increased pressure dropthat the induced draft fans must overcome.
Duct Sorbent Injection: Dry Sorbent Injection Dry sorbent injection (DSI),also referred to as in-duct dry injection, is illustrated in Figure 6-6d. Hydratedlime is the sorbent typically used in this process, especially for powergeneration facilities; however, sodium-based sorbents have been testedextensively, including full-scale utility demonstrations, and are used in

316 Coal Energy Systems
industrial systems such as municipal and medical waste incinerators foracid gas control.
When hydrated lime is used in this process, it is injected eitherupstream or downstream of a flue gas humidification zone. In this zone,the flue gas is humidified to within 20◦F of the adiabiatic saturation temper-ature by injecting water into the duct downstream of the air preheater [12].The SO2 in the flue gas reacts with the calcium hydroxide to form calciumsulfate and calcium sulfite:
Ca(OH)2(s) + SO2(g) + 12O2(g) + H2O(v) −→ CaSO4 · 2H2O(s) (6-43)
Ca(OH)2(s) + SO2(g) −→ CaSO3 · 12H2O(s) + 1
2H2O(v) (6-36)
The water droplets are vaporized before they strike the surface of the wallor enter the particulate control device. The unused sorbent, products, andfly ash are all collected in the particulate control device. About half of thecollected material is shipped to a landfill, while the other half is recycled forinjection with the fresh sorbent into the ducts [12].
The DSI system offers many of the same advantages and disadvantagesthat other dry systems offer [12]. The process is less complex (i.e., no slurryrecycle and handling, no dewatering system, fewer pumps, and no reactorvessel) than a wet system, specifically LSFO. The humidification water andhydrated lime are injected directly into the existing flue gas path. No separateSO2 absorption vessel is necessary. The handling of the reagent is simplerthan in wet systems. DSI systems have less equipment to install so operatingand maintenance costs are reduced. The waste product is free of reactive limeso no special handling is required.
Some of the problems encountered by the DSI system and its disadvan-tages, as compared to the LSFO system, are common to other dry processes.Sulfur dioxide removal efficiencies are lower (as is calcium utilization) thanwet systems and range from 30 to 70% for a Ca/S ratio of 2.0. Quicklime ismore expensive than limestone. When an ESP is used for particulate control,there is the potential for reduced efficiency due to increased fly ash resistiv-ity and dust loading in the flue gas. Additional collection devices may berequired. A sufficient length of ductwork is necessary to ensure a residencetime of 1 to 2 seconds in a straight, unrestricted path. Plugging of the duct canoccur if the residence time is insufficient for droplet vaporization, leading toincreased system pressure drop.
In the dry sodium desulfurization process, a variety of sodium-containing crystalline compounds may be injected directly into the flue gas.The main compounds of interest include [14]:
• Sodium carbonate (Na2CO3), a refined product of ∼98% purity;• Sodium bicarbonate (NaHCO3), a refined product of ∼98% purity;• Nacholite (NaHCO3), a natural material of ∼76% purity containing
high levels of insolubles;
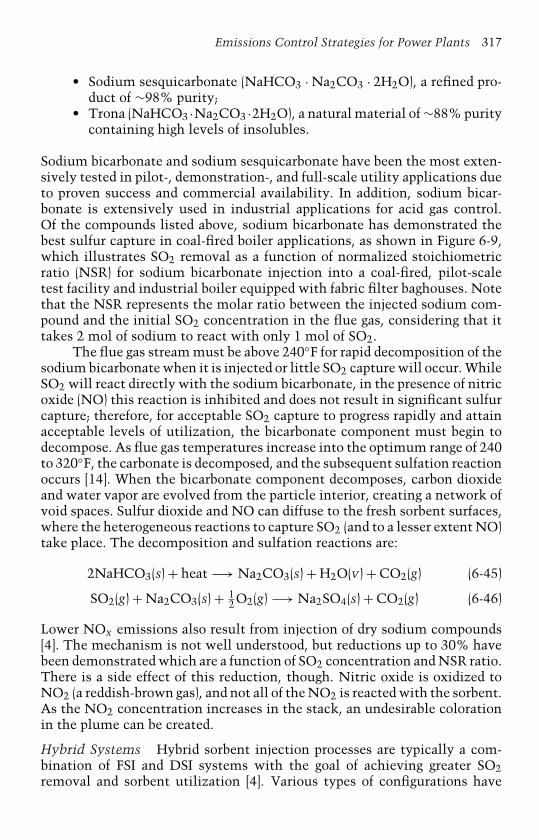
Emissions Control Strategies for Power Plants 317
• Sodium sesquicarbonate (NaHCO3 · Na2CO3 · 2H2O), a refined pro-duct of ∼98% purity;
• Trona (NaHCO3 ·Na2CO3 ·2H2O), a natural material of ∼88% puritycontaining high levels of insolubles.
Sodium bicarbonate and sodium sesquicarbonate have been the most exten-sively tested in pilot-, demonstration-, and full-scale utility applications dueto proven success and commercial availability. In addition, sodium bicar-bonate is extensively used in industrial applications for acid gas control.Of the compounds listed above, sodium bicarbonate has demonstrated thebest sulfur capture in coal-fired boiler applications, as shown in Figure 6-9,which illustrates SO2 removal as a function of normalized stoichiometricratio (NSR) for sodium bicarbonate injection into a coal-fired, pilot-scaletest facility and industrial boiler equipped with fabric filter baghouses. Notethat the NSR represents the molar ratio between the injected sodium com-pound and the initial SO2 concentration in the flue gas, considering that ittakes 2 mol of sodium to react with only 1 mol of SO2.
The flue gas stream must be above 240◦F for rapid decomposition of thesodium bicarbonate when it is injected or little SO2 capture will occur. WhileSO2 will react directly with the sodium bicarbonate, in the presence of nitricoxide (NO) this reaction is inhibited and does not result in significant sulfurcapture; therefore, for acceptable SO2 capture to progress rapidly and attainacceptable levels of utilization, the bicarbonate component must begin todecompose. As flue gas temperatures increase into the optimum range of 240to 320◦F, the carbonate is decomposed, and the subsequent sulfation reactionoccurs [14]. When the bicarbonate component decomposes, carbon dioxideand water vapor are evolved from the particle interior, creating a network ofvoid spaces. Sulfur dioxide and NO can diffuse to the fresh sorbent surfaces,where the heterogeneous reactions to capture SO2 (and to a lesser extent NO)take place. The decomposition and sulfation reactions are:
2NaHCO3(s) + heat −→ Na2CO3(s) + H2O(v) + CO2(g) (6-45)
SO2(g) + Na2CO3(s) + 12O2(g) −→ Na2SO4(s) + CO2(g) (6-46)
Lower NOx emissions also result from injection of dry sodium compounds[4]. The mechanism is not well understood, but reductions up to 30% havebeen demonstrated which are a function of SO2 concentration and NSR ratio.There is a side effect of this reduction, though. Nitric oxide is oxidized toNO2 (a reddish-brown gas), and not all of the NO2 is reacted with the sorbent.As the NO2 concentration increases in the stack, an undesirable colorationin the plume can be created.
Hybrid Systems Hybrid sorbent injection processes are typically a com-bination of FSI and DSI systems with the goal of achieving greater SO2removal and sorbent utilization [4]. Various types of configurations have

318 Coal Energy Systems
I.D. Code MMD,µm SymbolBA7 BA6 BA5 BA2 BA1 BA3 BA4 PSU
9 9
27 32 46 75 89 35
BA7 BA6 BA5 BA2 BA1 BA3 BA4 PSU
100
90
80
70
60
50
40
30
20
10
0
SO
2 R
emo
val,
%
0 0.25 0.5 0.75 1 1.25 1.5 1.75 2 2.25 2.5 2.75 3 3.25 3.5
Theo
retic
al M
axim
um
NSR
FIGURE 6-9. Comparison of SO2 removal as a function of NSR and particle sizewhen using sodium bicarbonate. Tests identified by the BA code were performed in acoal-fired, pilot-scale facility, and the tests coded PSU were performed in a coal-fired,industrial boiler system. Both facilities were equipped with fabric filter baghouses.The Penn State tests were performed with a flue gas temperature of ∼380◦F, and thepilot-scale tests were performed at ∼300◦F. All tests were performed with sorbentfrom the same vendor. (From Bland, V. V. and C. E. Martin, Full-Scale Demon-stration of Additives for NO2 Reduction with Dry Sodium Desulfurization, EPRIGS-6852, Electric Power Research Institute, Palo Alto, CA, June 1990; Miller, B. G.et al., The Development of Coal-Based Technologies for Department of DefenseFacilities: Phase II Final Report, DE-FC22-92PC92162, prepared for the U.S. Depart-ment of Energy, Federal Energy Technology Center, Pittsburgh, PA, July 31, 2000,784 pages.)
been tested including injecting secondary sorbents, such as sodium com-pounds, into the ductwork or humidifying the flue gas in a specially designedvessel. Humidification reactivates the unreacted CaO and can increase theSO2 removal efficiency. Advantages of hybrid processes include high SO2removal, low capital and operating costs, less required space (thus lendingitself to easy retrofit), easy operation and maintenance, and no wastewatertreatment [4].
In some hybrid systems, a new baghouse is installed downstreamof an existing particulate removal device (generally an ESP). The existing
Emissions Control Strategies for Power Plants 319
ESP continues to remove the ash, which can be either sold or disposed.Sulfur dioxide removal is accomplished in a manner similar to in-ductinjection, with the sorbent injection occurring upstream of the newbaghouse [13].
The potential advantages of this system include the potential for toxicsubstances control because a baghouse is the last control device (this is fur-ther discussed later in the section on mercury), easier waste disposal, thepotential for sorbent regeneration, separate ash and product streams, andmore efficient recycle without ash present [13]. The major issue is the highcapital cost of adding a baghouse, although the concept of adding one with ahigh air-to-cloth ratio (3–5 actual cubic feet per minute (acfm)/ft2) can min-imize this cost. Hybrid systems are discussed in more detail later in thischapter.
Circulating Fluidized-Bed Scrubbers Circulating fluidized-bed (CFB)scrubbers are the least commonly used commercial option, and few or nosystems are planned in the future (see Table 6-1). CFB scrubbers includedry and semi-dry systems [4]. Commercial application of the dry CFB sys-tem is the more widespread of the two processes, and it can achieve SO2removal efficiencies of 93 to 97% at a Ca/S molar ratio of 1.2 to 1.5. Inthis system, hydrated lime is injected directly into a CFB reactor along withwater to obtain operation close to the adiabatic saturation temperature. Themain features of this process include simplicity and reliability, with provenhigh availability; mild steel construction, which does not require a lining;no moving parts or slurry nozzles; handling of only dry solids; water injec-tion independent of reagent feed; moderate space requirements; and greaterflexibility to handle varying SO2 and SO3 concentrations [4]. The CFB scrub-ber uses hydrated lime rather than the less expensive limestone commonlyused in wet FGD technology processes. Additionally, due to a higher partic-ulate matter concentration downstream of the scrubber, improvements tothe particulate removal device, specifically an ESP, may be needed to meetthe required particulate emission levels.
Fluidized-Bed CombustionFluidized-bed combustion is not an SO2 control technology per se; however,this combustion technology does offer the capability to control SO2 emis-sions during the combustion process rather than after combustion whereFGD systems need to be installed. Fluidized-bed combustion and the roleof sorbents in controlling SO2 are discussed in Chapter 5 (Technologies forCoal Utilization). The sorbents used in a fluidized-bed combustor are usu-ally limestones, but sometimes dolomites (a double carbonate of calciumand magnesium) are used. The calcination and sulfation chemistries are alsodiscussed in Chapter 5.

320 Coal Energy Systems
Economics of Flue Gas DesulfurizationThe costs of an FGD system are site specific and include capital and operatingcosts. The capital costs of an FGD system depend on many factors, including[16]:
• Market conditions;• Geographical location;• Preparatory site work required;• Volume of flue gas to be scrubbed;• Concentration of SO2 in the flue gas;• Extent of SO2 removal required;• Quality of the products produced;• Process and waste water treatment;• The need for flue gas reheat;• The degree of reliability and redundancy required;• Life of the system.
The capital costs of wet FGD systems have been declining in the UnitedStates over the last 30 years. The prototype FGD systems of the 1970s cost$400/kW and experienced many problems [17]. With standardization, betterchemistry, and improved materials, the cost of FGD systems in the 1980sdropped to $275/kW. Additional developments, such as reduced redundancy,fewer modules, increased competition from foreign vendors, and the use ofwell-engineered packages, has dropped capital costs to about $100/kW today.
Operating costs are divided into variable and fixed costs [16]. Variablecosts include the costs of the sorbents/reagents, costs associated with dis-posal or utilization of the by-products, and steam, power, and water costs.Fixed costs include costs of operating labor, maintenance, and administra-tion. The operating and maintenance costs of an FGD system can be signifi-cant. According to Soud [4], operating and maintenance costs for the varioussubsystems in a pulverized coal-fired power generating facility with state-of-the-art environmental protection are 78% for the boiler/turbine/generator,10% for the FGD system, 6% for a selective catalytic reduction system, 4%for wastewater treatment, and 2% for an ESP.
In the following sections, the costs associated with different FGD sys-tems are briefly discussed. It must be noted, however, that it is difficult tocompare costs (whether capital or operating) between systems because costshave many site-specific factors, are dependent on the age of the system, areinfluenced by economies of scale, and are higher for retrofit applications thannew installations.
Wet Processes In a compilation of costs for various processes, Wu [16]reported that the capital and operating costs (for new installations) for alimestone wet FGD process are approximately $100/kW and $100/kWh,respectively, while the capital and operating costs are approximately $50/kW

Emissions Control Strategies for Power Plants 321
High Sulfur
Medium Sulfur
Low Sulfur
3000
2500
2000
1500
1000
500
0
Wet Scrubber Systems
LimestoneForced
Oxidation
LimestoneNatural
Oxidation
Magnesium-Lime Wet Lime
Tot
al O
pera
ting
Cos
ts (
$/kW
h)
FIGURE 6-10. Operating costs for wet lime/limestone FGD systems with differentsulfur content coals.
and $125/kWh, respectively, for magnesium-based systems and $50/kW and$200/kWh, respectively, for sodium-based scrubbers. The variability in oper-ating costs, though, is evident in data reported by Blythe et al. [18] andsummarized in Figure 6-10, which shows the total operating costs for var-ious systems for low-, medium-, and high-sulfur coals. Similarly, capitalcosts for recent LSFO retrofits can vary from $180 to $348/kW [16].
Spray Dry Processes The spray dry process generally has lower capital costsbut higher and more expensive sorbent use (typically lime) than wet pro-cesses. This process is used primarily for small- to medium-sized plantsfiring low- to medium-sulfur coals and is preferable for retrofits [16]. Forexample, Blythe et al. [18] reported total operating costs for lime spray dryprocesses of $836/kWh compared to $695/kWh for LSFO systems (see Figure6-10) for low-sulfur coal applications.
Sorbent Injection Processes The sorbent injection process, with a moderateSO2 removal efficiency, has a relatively low capital cost. The capital costsfor furnace sorbent injection are approximately $70 to $120/kW [16].
322 Coal Energy Systems
Circulating Fluidized-Bed Processes The circulating fluidized-bed pro-cesses have relatively low capital costs, similar to those for the spray dryprocess. The process also has low to moderate fixed operating costs, but thevariable operating costs are relatively high [16].
Regenerative Processes Regenerative processes generally have high capitalcosts and power consumption [16]. The net variable operating costs are mod-erate because the processes produce salable by-products; however, the fixedoperating costs are substantially higher than other processes.
Nitrogen Oxides (NOx )Approximately 10 million short tons of NOx were emitted from fuel com-bustion in 2002, with power plants contributing less than 4.5 million shorttons [19,20]. All sources affected by the EPA’s Acid Rain Program NOxrequirements reduced their combined NOx emissions by 27% over theperiod 1990 to 2002 [20]. These reductions have been achieved while theamount of fuel burned to produce electricity, as measured by heat input,increased 28% since 1990. In 2002, more than 1000 units complied withemission rate limits. NOx formation mechanisms are reviewed in this sec-tion, followed by technologies used to control NOx emissions. Similar to thediscussion on SO2 control technologies, NOx control technologies will focuson commercially available, commercially used systems, with the focus onpulverized coal-fired boiler systems.
NOx Formation MechanismsNOx formation from coal combustion was introduced in Chapter 3 (TheEffect of Coal Use on Human Health and the Environment), and the dis-cussion is expanded in this section. NOx formation during pulverized coalcombustion is also discussed, as this is the most widely used process forpower generation. The majority of nitrogen oxides emitted from power plantsare in the form of nitric oxide (NO), with only a small fraction as nitro-gen dioxide (NO2) and nitrous oxide (N2O). Collectively, these oxides arereferred to as NOx . NO originates from the coal-bound nitrogen and nitro-gen in the air used in the combustion process and is produced through threemechanisms: thermal NO, prompt NO, and fuel NO. Fuel-bound nitrogenaccounts for 75 to 95% of the total NO generated, while thermal and promptNO account for the balance, with prompt NO being no more than 5% of thetotal NO [21].
The factors that influence NOx emissions in pulverized coal-fired boil-ers can be generally categorized as boiler design, boiler operation, and coalproperties [21]; however, NOx formation is complex, and many parametersinfluence its production [21,22]. Boiler design factors include boiler type,capacity, burner type, number and capacity of the burners, burner zone
Emissions Control Strategies for Power Plants 323
heat release, residence times, and presence of overfire air ports. Similarly,boiler operation factors include load, mills in operation, excess air level,burner tilt, and burner operation. Coal properties that influence NOx pro-duction include the release of volatiles and nitrogen partitioning, ratio ofcombustibles-to-volatile matter, heating value, rank, and nitrogen content.
Thermal NO Thermal NO formation involves the high-temperature(> 2370◦F) reaction of oxygen and nitrogen from the combustion air [21]. Theprincipal reaction governing the formation of NO is the reaction of oxygenatoms formed from the dissociation of O2 with nitrogen. These reactions,referred to as the Zeldovich mechanism, are:
N2 + O • ←→ NO + N • (6-47)
N • + O2 ←→ NO + O • (6-48)
These reactions are sensitive to temperature, local stoichiometry, and resi-dence time. High temperature is required for the dissociation of oxygen andto overcome the high activation energy for breaking the triple bond of thenitrogen molecule. These reactions dominate in fuel-lean, high-temperatureconditions. Under fuel-rich conditions, hydroxyl and hydrogen radical con-centrations are increased which initiates oxidation of the nitrogen radicals,so at least one additional step should be included in this mechanism:
N • + OH • ←→ NO + H • (6-49)
Reactions (6-47) through (6-49) are usually referred to as the extended Zel-dovich mechanism. In addition, the following reactions can occur in fuel-richconditions [21]:
H • + N2 ←→ N2H (6-50)
N2H + O • ←→ NO + NH • (6-51)
Thermal NO is of greater significance in the post-flame region than withinthe flame; consequently, several technologies have been developed for reduc-ing thermal NO by lowering the peak temperature in the flame, minimizingthe residence time in the region of the highest temperature, and controllingthe excess air levels.
Prompt NO Prompt NO is the fixation of atmospheric (molecular) nitrogenby hydrocarbon fragments in the reducing atmosphere in the flame zone [21].The proposed mechanism is:
CH • + N2 ←→ HCN + N • (6-52)
HCN + O • ←→ NH • + CO (6-53)
NH • + O • ←→ NO • + H • (6-54)

324 Coal Energy Systems
The main reaction product of hydrocarbon radicals with N2 is HCN, and theamount of NO formed is governed by the reactions of the nitrogen atoms withavailable radical species. In fuel-rich environments, therefore, the formationof N2 is favored due to the reduced concentrations of hydroxyl and oxygenradical concentrations [21].
Fuel NO Nitrogen in the coal, which typically ranges from 0.5 to 2.0 wt.%,occurs mainly as organically-bound heteroatoms in aromatic rings or clusters[21]. Pyrrolic (5-membered ring) nitrogen is the most abundant form and con-tributes 50 to 60% of the total nitrogen. Pyridinic (6-membered ring) nitrogencomprises about 20 to 40% of the total nitrogen. The remaining 0 to 20%nitrogen is thought to be in amine or quaternary nitrogen form. Coal nitrogenis first released during volatilization in the coal flame as an element in aro-matic compounds referred to as tar. The tar undergoes pyrolysis to convertmost of the nitrogen to HCN as well as some NH3 and NH. Some nitrogen isexpelled from the char as HCN and occasionally NH3; however, this occursat a much slower rate than evolution from the volatiles. The partitioning ofnitrogen between volatiles and char is important in NOx formation.
Nitric oxide formation proceeds along two paths [21]. The nitrogen fromthe char reacts with oxygen to form NO. The NH3 and NH released from thevolatile matter and, to a lesser extent, the coal reacts with oxygen atoms toform NO. HCN is converted to NO via a pathway of hydrogen abstraction toform ammonia species and subsequently NO. Volatile nitrogen species canalso be converted to nitrogen atoms through a series of fuel-rich pyrolysisreactions. Also, reactions between NO and volatile nitrogen species andcarbon particles can result in the formation of nitrogen molecules:
C + NO ←→ 12N2 + CO (6-55)
CH • + NO ←→ HCN + O • (6-56)
In a fuel-rich environment, the main product of the reaction of NO withhydrocarbon radicals is HCN, which is then converted to N2 in an oxygen-deficient environment. This is the basis for reburning, discussed later in thischapter, where a secondary hydrocarbon fuel is injected into combustionproducts containing NO.
Approximately 15 to 40% of the fuel nitrogen is converted to NO, andthe formation of NO is influenced by stoichiometry, flame temperature,coal nitrogen content, and coal volatile matter content [21]. Approximately25% of the char nitrogen is converted to NO. The reason for the fuel NOdominance (i.e., 75–95% of total NOx production) is because the N–H andN–C bonds, common in fuel-bound nitrogen, are weaker than the triple bondin molecular nitrogen, which must be dissociated to produce thermal NO.
Nitrogen Dioxide and Nitrous Oxide Small amounts of nitrogen dioxide(NO2) and nitrous oxide (N2O) are formed during coal combustion, but they

Emissions Control Strategies for Power Plants 325
comprise less than 5% of the total NOx production. The oxygen levels aretoo low and the residence times are too short in high-temperature coal flamesfor much of the NO to be oxidized to NO2. Nitrous oxide, however, can beformed in the early part of fuel-lean flames by gas-phase reactions [21]:
O • + N2 ←→ N2O (6-57)
NH • + NO ←→ N2O + H • (6-58)
NCO • + NO ←→ N2O + CO (6-59)
NOx Control in Pulverized Coal CombustionTechnologies for control of NOx emissions from pulverized coal-fired powerplants can be divided into two groups: (1) combustion modifications wherethe NOx production is reduced during the combustion process, and (2) fluegas treatment, which removes the NOx from flue gas following its forma-tion. Sometimes the practice of injecting reducing agents to reduce NOxto molecular nitrogen (N2) is classified separately; however, in this sectionit is included as a flue gas treatment. Table 6-8 lists various NOx controltechnologies with a summary of their attributes [23]. The abatement or emis-sion control principles for these various control methods include reducingpeak flame temperatures, reducing the residence time at peak flame tempera-tures, chemically reducing NOx , oxidizing NOx with subsequent absorption,removing nitrogen, using a sorbent, or a combination of these methods.
Reducing combustion temperature is accomplished by operating atnon-stoichiometric conditions to dilute the available heat with an excessof fuel, air, flue gas, or steam [23]. The combustion temperature is reducedby using fuel-rich mixtures to limit the availability of oxygen, using fuel-lean mixtures to dilute energy input, injecting cooled oxygen-depleted fluegas into the combustion air to dilute energy, injecting cooled flue gas withthe fuel, or injecting water or steam.
Reducing residence times at high combustion temperatures is accom-plished by restricting the flame to a short region to prevent the nitrogen frombecoming ionized. Fuel, steam, more combustion air, or recirculating fluegas is then injected immediately after this region. Chemically reducing NOxremoves oxygen from the nitrogen oxides. This is accomplished by reducingthe valence level of nitrogen to zero after the valence has become higher. Oxi-dizing NOx intentionally raises the valence of the nitrogen ion to allow waterto absorb to it. This is accomplished by using a catalyst, injecting hydrogenperoxide, creating ozone within the air flow, or injecting ozone into theair flow. Removing nitrogen from combustion is accomplished by removingnitrogen as a reactant either by using low nitrogen content fuels or usingoxygen instead of air. The ability to vary coal nitrogen contents, however,is limited. Treatment of flue gas by injection sorbents such as ammonia,limestone, aluminum oxide, or carbon can remove NOx and other pollu-tants. This type of treatment has been applied in the combustion chamber,

326C
oalE
nergy
Systems
TABLE 6-8NOx Control Technologies
Technique Description Advantages Disadvantages Impacts Applicability
Less excess air (LEA) Reduces oxygenavailability
Easy modification Low NOx reduction High CO; flamelength; flamestability
All fuels
Off stoichiometric Staged combustion Low cost; no capitalcost for BOOS
Flame length; fancapacity; headerpressure
All fuels; multipleburners required forBOOS
a. Burners out ofservice (BOOS)
a. Higher air flow forCO reduction
b. Overfire air (OFA) b. High capital cost
Low NOx burner Internal stagedcombustion
Low operating cost;compatible withFGR
Moderately highcapital cost
Flame length; fancapacity; turndowncapability
All fuels
Flue gas recirculation(FGR)
<30% Flue gasrecirculated withair, decreasingtemperature
High NOx reductionpotential for lownitrogen fuels
Moderately highcapital andoperating costs;affects heat transferand systempressures
Fan capacity; furnacepressure; burnerpressure drop;turndown stability
All fuels
Water/steam injection Reduces flametemperature
Moderate capital cost;NOx reductionsimilar to FGR
Efficiency penalty; fanpower higher
Flame stability;efficiency penalty
All fuels
Reduced air preheat Air not preheated,reduces flametemperature
High NOx reductionpotential
Significant efficiencyloss (1%/40◦F)
Fan capacity;efficiency penalty
All fuels
(continued)
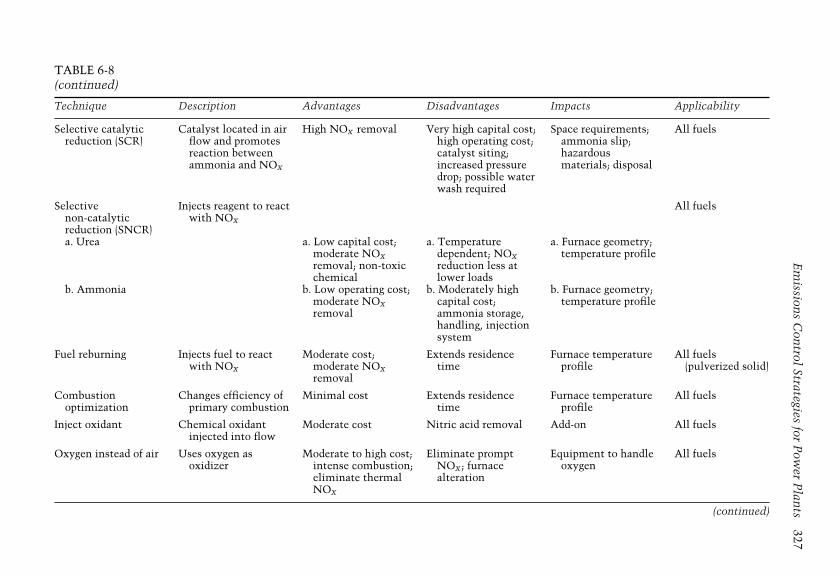
Em
issions
Con
trolStrategies
forP
ower
Plan
ts327
TABLE 6-8(continued)
Technique Description Advantages Disadvantages Impacts Applicability
Selective catalyticreduction (SCR)
Catalyst located in airflow and promotesreaction betweenammonia and NOx
High NOx removal Very high capital cost;high operating cost;catalyst siting;increased pressuredrop; possible waterwash required
Space requirements;ammonia slip;hazardousmaterials; disposal
All fuels
Selectivenon-catalyticreduction (SNCR)
Injects reagent to reactwith NOx
All fuels
a. Urea a. Low capital cost;moderate NOxremoval; non-toxicchemical
a. Temperaturedependent; NOxreduction less atlower loads
a. Furnace geometry;temperature profile
b. Ammonia b. Low operating cost;moderate NOxremoval
b. Moderately highcapital cost;ammonia storage,handling, injectionsystem
b. Furnace geometry;temperature profile
Fuel reburning Injects fuel to reactwith NOx
Moderate cost;moderate NOxremoval
Extends residencetime
Furnace temperatureprofile
All fuels(pulverized solid)
Combustionoptimization
Changes efficiency ofprimary combustion
Minimal cost Extends residencetime
Furnace temperatureprofile
All fuels
Inject oxidant Chemical oxidantinjected into flow
Moderate cost Nitric acid removal Add-on All fuels
Oxygen instead of air Uses oxygen asoxidizer
Moderate to high cost;intense combustion;eliminate thermalNOx
Eliminate promptNOx ; furnacealteration
Equipment to handleoxygen
All fuels
(continued)

328C
oalE
nergy
Systems
TABLE 6-8(continued)
Technique Description Advantages Disadvantages Impacts Applicability
Ultra-low nitrogenfuel
Uses low-nitrogen fuel Eliminates fuel NOx ;no capital cost
Possible rise inoperating cost
Minimal change All ultra-lownitrogen fuels
Sorbent injection(combustion; ductto baghouse; duct toESP)
Uses a chemical toabsorb NOx or anadsorber to captureor reduce it
Can control otherpollutants as well asNOx ; moderateoperating cost
Cost of sorbent; spacefor the sorbentstorage and handling
Add-on All fuels
Air staging Admits air inseparated stages
Reduces peakcombustiontemperature
Extends combustionto a longer residencetime at lowertemperature
Add ducts anddampers to controlair; furnacemodification
All fuels
Fuel staging Admits fuel inseparated stages
Reduces peakcombustiontemperature
Extends combustionto a longer residencetime at lowertemperature
Adds fuel injectors toother locations;furnacemodification
All fuels
Source: EPA, Technical Bulletin, Nitrogen Oxides (NOx): Why and How They Are Controlled, Office of Air Quality Planning and Standards,U.S. Environmental Protection Agency, U.S. Government Printing Office, Washington, D.C., November 1999.
Emissions Control Strategies for Power Plants 329
flue gas, and particulate control device. Many of these methods can be com-bined to achieve a lower NOx concentration than can be achieved alone byany one method. In some cases, technologies that are used to control otherpollutants, such as SO2, can also reduce NOx .
Combustion Modifications Primary NOx control technologies involvemodifying the combustion process. Several technologies have been devel-oped and applied commercially and include:
• Low-NOx burners;• Furnace air staging;• Flue gas recirculation;• Fuel staging (i.e., reburn);• Process optimization.
Options to control NOx during combustion and their effects are differentfor new and existing boilers. For new boilers, combustion modifications areeasily made during construction, whereas for existing boilers viable alterna-tives are more limited. Modifications can be complicated, and unforeseenproblems may arise. When combustion modifications are made, it is impor-tant to avoid adverse impacts on boiler operation and the formation of otherpollutants such as N2O or CO. Issues pertaining to low-NOx operationinclude:
• Safe operation (e.g., stable ignition over the desired load range);• Reliable operation to prevent corrosion, erosion, deposition, and
uniform heating of the tubes;• Complete combustion to limit formation of other pollutants such as
CO, polyorganic matter, or N2O;• Minimal adverse impact on the flue gas cleaning equipment;• Low maintenance costs.
Combustion modification technologies redistribute the fuel and air to slowmixing, reduce the availability of oxygen in the critical NOx formationzones, and decrease the amount of fuel burned at peak flame temperatures.In addition, reburning chemically destroys the NOx formed by hydrocarbonradicals during the combustion process. The commercially applied technolo-gies are discussed in detail in the following sections. One technology listedin Table 6-8, low excess air (LEA), is the simplest of the combustion controlstrategies but is not discussed in detail here because it has achieved only lim-ited success in coal-fired applications (i.e., 1–15%). In this technique, excessair levels are reduced until there are adverse impacts on CO formation andflame length and stability. Similarly, a technique known as burners out ofservice (BOOS) has met with limited success with coal and is not discussedin detail. In this technique, the fuel flow to the selected burner is stopped
330 Coal Energy Systems
but airflow is maintained to create staged combustion in the furnace. Theremaining burners operate fuel rich, which limits oxygen availability, lowerspeak flame temperatures, and reduces NOx formation. The unreacted prod-ucts combine with air from the burners out of service to complete burnoutbefore exiting the furnace.
Low-NOx Burners Prior to concerns being raised regarding NOx emis-sions in the early 1970s, coal burners were designed to provide highlyturbulent mixing and combustion at peak flame temperatures to ensurehigh combustion efficiency, a condition that is ideal for NOx formation [24].In 1971, industry began developing low-NOx burners for coal-fired boilerswith the promulgation of New Source Performance Standards (NSPSs). Bythe mid-1970s, low-NOx burners were being demonstrated, and commercialoperation started in the late 1970s [25]. They have undergone considerableimprovements in design spurred by the 1990 Clean Air Act AmendmentsTitle IV, Phase II acid rain regulations and Title I ozone regulations [26,27].The technology is well proven for NOx control in both wall- and tangentially-fired boilers and is commercially available; a significant number of them areinstalled worldwide.
Low-NOx burners work under the principle of staging the combus-tion air within the burner to reduce NOx formation. Rapid devolatilizationof the coal particles occurs near the burner in a fuel-rich, oxygen-starvedenvironment to produce NO. NOx formation is suppressed because oxygenmolecules are not available to react with the nitrogen released from thecoal and present in the air, and the flame temperature is reduced. Hydro-carbon radicals that are generated under the sub-stoichiometric conditionsthen reduce the NO that is formed to N2. The air required to completethe burnout of the coal is added after the primary combustion zone wherethe temperature is sufficiently low so that additional NOx formation isminimized.
Larger and more branched flames are produced by staging the air [21].This flame structure limits coal and air mixing during the initial devolatiliza-tion stage while maximizing the release of volatiles from the coal. The morevolatile nitrogen that is released with the volatiles and the longer the resi-dence time in the fuel-rich zone, the lower the amount of fuel NO that isproduced. An oxygen-rich layer is produced around the flame that aids incarbon burnout. An example of this concept is shown in Figure 6-11, whichis a schematic of a low-NOx burner (i.e., Ahlstom Power’s Radially Strat-ified Fuel Core burner) that illustrates a typical flowfield emanating fromit [28]. A photograph of the burner, which is a 20 million Btu/hr prototypeused for developmental work at Penn State prior to its commercializationand worldwide deployment, is shown in Figure 6-12, which depicts the vari-ous dampers and air scoops for channeling and controlling the quantity anddegree of swirl of the various air streams [29].
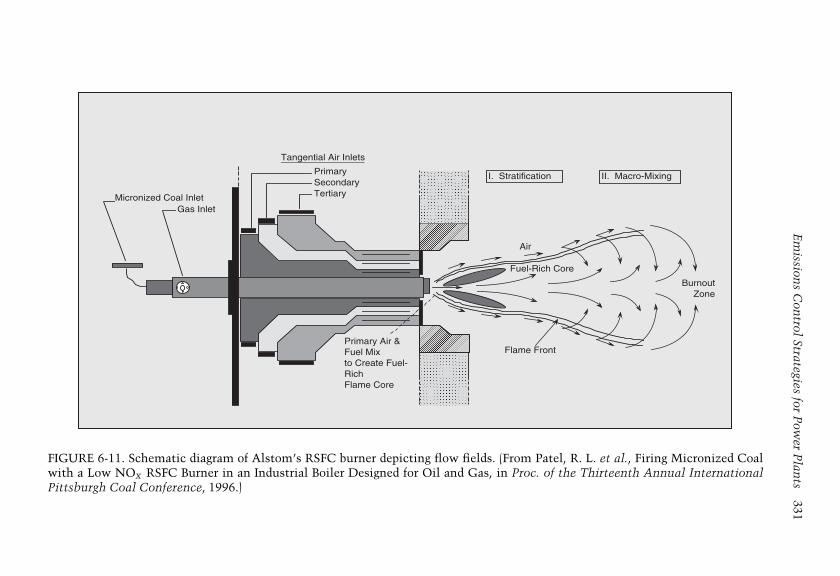
Em
issions
Con
trolStrategies
forP
ower
Plan
ts331
Flame Front
Air
Fuel-Rich Core
Micronized Coal InletGas Inlet
Tangential Air Inlets
PrimarySecondaryTertiary
I. Stratification II. Macro-Mixing
Primary Air & Fuel Mix to Create Fuel- Rich Flame Core
Burnout Zone
FIGURE 6-11. Schematic diagram of Alstom’s RSFC burner depicting flow fields. (From Patel, R. L. et al., Firing Micronized Coalwith a Low NOx RSFC Burner in an Industrial Boiler Designed for Oil and Gas, in Proc. of the Thirteenth Annual InternationalPittsburgh Coal Conference, 1996.)
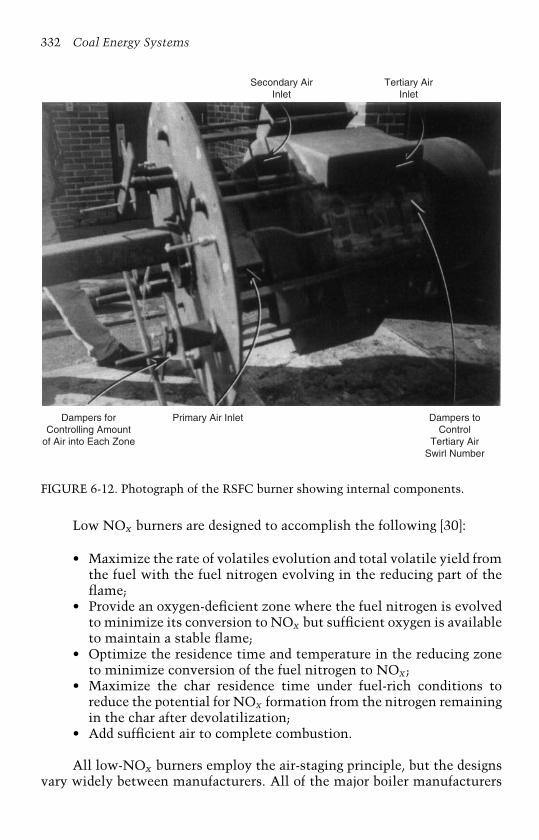
332 Coal Energy Systems
Dampers forControlling Amount
of Air into Each Zone
Dampers toControl
Tertiary AirSwirl Number
Primary Air Inlet
Secondary AirInlet
Tertiary AirInlet
FIGURE 6-12. Photograph of the RSFC burner showing internal components.
Low NOx burners are designed to accomplish the following [30]:
• Maximize the rate of volatiles evolution and total volatile yield fromthe fuel with the fuel nitrogen evolving in the reducing part of theflame;
• Provide an oxygen-deficient zone where the fuel nitrogen is evolvedto minimize its conversion to NOx but sufficient oxygen is availableto maintain a stable flame;
• Optimize the residence time and temperature in the reducing zoneto minimize conversion of the fuel nitrogen to NOx ;
• Maximize the char residence time under fuel-rich conditions toreduce the potential for NOx formation from the nitrogen remainingin the char after devolatilization;
• Add sufficient air to complete combustion.
All low-NOx burners employ the air-staging principle, but the designsvary widely between manufacturers. All of the major boiler manufacturers
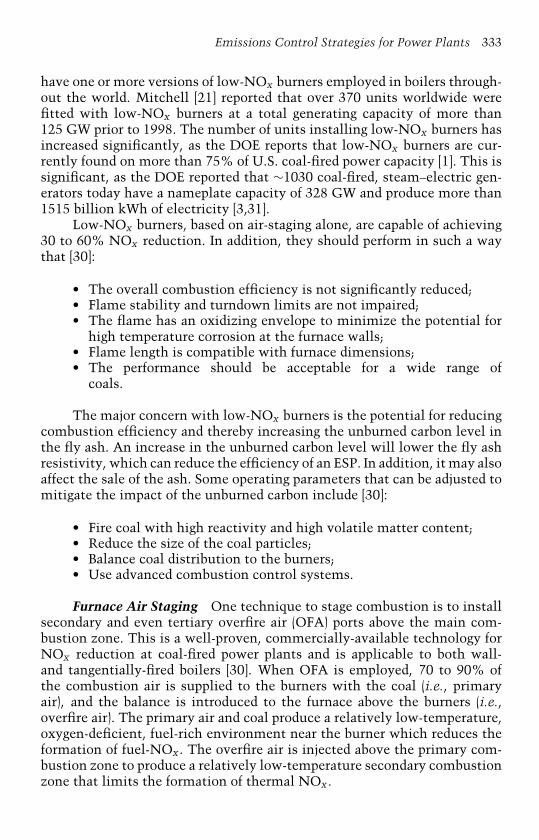
Emissions Control Strategies for Power Plants 333
have one or more versions of low-NOx burners employed in boilers through-out the world. Mitchell [21] reported that over 370 units worldwide werefitted with low-NOx burners at a total generating capacity of more than125 GW prior to 1998. The number of units installing low-NOx burners hasincreased significantly, as the DOE reports that low-NOx burners are cur-rently found on more than 75% of U.S. coal-fired power capacity [1]. This issignificant, as the DOE reported that ∼1030 coal-fired, steam–electric gen-erators today have a nameplate capacity of 328 GW and produce more than1515 billion kWh of electricity [3,31].
Low-NOx burners, based on air-staging alone, are capable of achieving30 to 60% NOx reduction. In addition, they should perform in such a waythat [30]:
• The overall combustion efficiency is not significantly reduced;• Flame stability and turndown limits are not impaired;• The flame has an oxidizing envelope to minimize the potential for
high temperature corrosion at the furnace walls;• Flame length is compatible with furnace dimensions;• The performance should be acceptable for a wide range of
coals.
The major concern with low-NOx burners is the potential for reducingcombustion efficiency and thereby increasing the unburned carbon level inthe fly ash. An increase in the unburned carbon level will lower the fly ashresistivity, which can reduce the efficiency of an ESP. In addition, it may alsoaffect the sale of the ash. Some operating parameters that can be adjusted tomitigate the impact of the unburned carbon include [30]:
• Fire coal with high reactivity and high volatile matter content;• Reduce the size of the coal particles;• Balance coal distribution to the burners;• Use advanced combustion control systems.
Furnace Air Staging One technique to stage combustion is to installsecondary and even tertiary overfire air (OFA) ports above the main com-bustion zone. This is a well-proven, commercially-available technology forNOx reduction at coal-fired power plants and is applicable to both wall-and tangentially-fired boilers [30]. When OFA is employed, 70 to 90% ofthe combustion air is supplied to the burners with the coal (i.e., primaryair), and the balance is introduced to the furnace above the burners (i.e.,overfire air). The primary air and coal produce a relatively low-temperature,oxygen-deficient, fuel-rich environment near the burner which reduces theformation of fuel-NOx . The overfire air is injected above the primary com-bustion zone to produce a relatively low-temperature secondary combustionzone that limits the formation of thermal NOx .
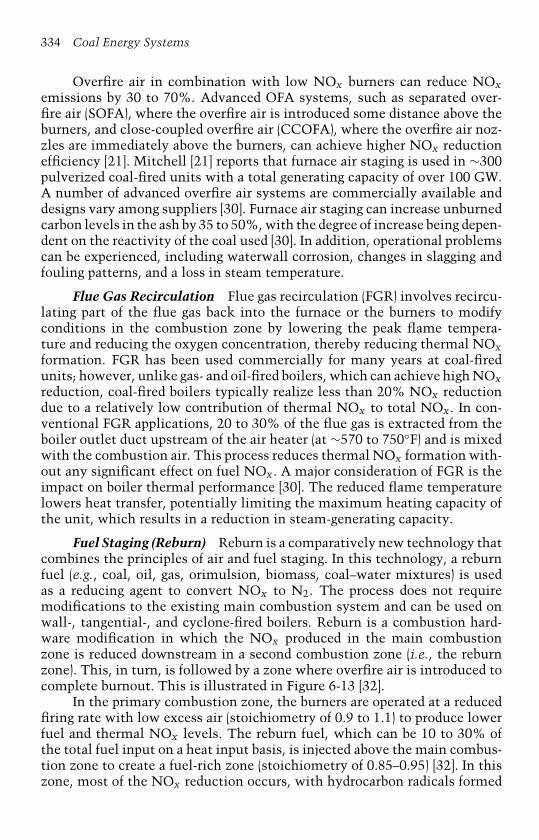
334 Coal Energy Systems
Overfire air in combination with low NOx burners can reduce NOxemissions by 30 to 70%. Advanced OFA systems, such as separated over-fire air (SOFA), where the overfire air is introduced some distance above theburners, and close-coupled overfire air (CCOFA), where the overfire air noz-zles are immediately above the burners, can achieve higher NOx reductionefficiency [21]. Mitchell [21] reports that furnace air staging is used in ∼300pulverized coal-fired units with a total generating capacity of over 100 GW.A number of advanced overfire air systems are commercially available anddesigns vary among suppliers [30]. Furnace air staging can increase unburnedcarbon levels in the ash by 35 to 50%, with the degree of increase being depen-dent on the reactivity of the coal used [30]. In addition, operational problemscan be experienced, including waterwall corrosion, changes in slagging andfouling patterns, and a loss in steam temperature.
Flue Gas Recirculation Flue gas recirculation (FGR) involves recircu-lating part of the flue gas back into the furnace or the burners to modifyconditions in the combustion zone by lowering the peak flame tempera-ture and reducing the oxygen concentration, thereby reducing thermal NOxformation. FGR has been used commercially for many years at coal-firedunits; however, unlike gas- and oil-fired boilers, which can achieve high NOxreduction, coal-fired boilers typically realize less than 20% NOx reductiondue to a relatively low contribution of thermal NOx to total NOx . In con-ventional FGR applications, 20 to 30% of the flue gas is extracted from theboiler outlet duct upstream of the air heater (at ∼570 to 750◦F) and is mixedwith the combustion air. This process reduces thermal NOx formation with-out any significant effect on fuel NOx . A major consideration of FGR is theimpact on boiler thermal performance [30]. The reduced flame temperaturelowers heat transfer, potentially limiting the maximum heating capacity ofthe unit, which results in a reduction in steam-generating capacity.
Fuel Staging (Reburn) Reburn is a comparatively new technology thatcombines the principles of air and fuel staging. In this technology, a reburnfuel (e.g., coal, oil, gas, orimulsion, biomass, coal–water mixtures) is usedas a reducing agent to convert NOx to N2. The process does not requiremodifications to the existing main combustion system and can be used onwall-, tangential-, and cyclone-fired boilers. Reburn is a combustion hard-ware modification in which the NOx produced in the main combustionzone is reduced downstream in a second combustion zone (i.e., the reburnzone). This, in turn, is followed by a zone where overfire air is introduced tocomplete burnout. This is illustrated in Figure 6-13 [32].
In the primary combustion zone, the burners are operated at a reducedfiring rate with low excess air (stoichiometry of 0.9 to 1.1) to produce lowerfuel and thermal NOx levels. The reburn fuel, which can be 10 to 30% ofthe total fuel input on a heat input basis, is injected above the main combus-tion zone to create a fuel-rich zone (stoichiometry of 0.85–0.95) [32]. In thiszone, most of the NOx reduction occurs, with hydrocarbon radicals formed
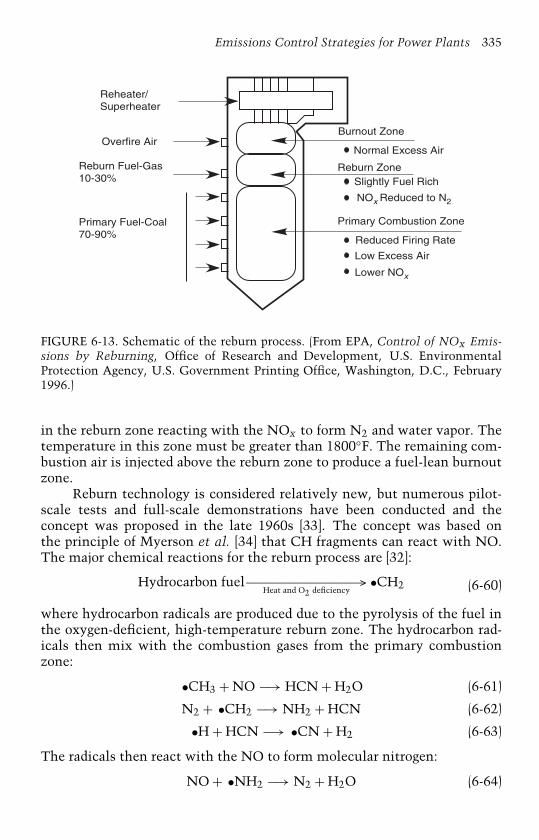
Emissions Control Strategies for Power Plants 335
Reheater/Superheater
Overfire Air
Reburn Fuel-Gas10-30%
Primary Fuel-Coal70-90%
Burnout Zone
Normal Excess Air
Reburn ZoneSlightly Fuel Rich
NOx Reduced to N2
Primary Combustion Zone
Reduced Firing Rate
Low Excess Air
Lower NOx
FIGURE 6-13. Schematic of the reburn process. (From EPA, Control of NOx Emis-sions by Reburning, Office of Research and Development, U.S. EnvironmentalProtection Agency, U.S. Government Printing Office, Washington, D.C., February1996.)
in the reburn zone reacting with the NOx to form N2 and water vapor. Thetemperature in this zone must be greater than 1800◦F. The remaining com-bustion air is injected above the reburn zone to produce a fuel-lean burnoutzone.
Reburn technology is considered relatively new, but numerous pilot-scale tests and full-scale demonstrations have been conducted and theconcept was proposed in the late 1960s [33]. The concept was based onthe principle of Myerson et al. [34] that CH fragments can react with NO.The major chemical reactions for the reburn process are [32]:
Hydrocarbon fuel—————————> •CH2Heat and O2 deficiency (6-60)
where hydrocarbon radicals are produced due to the pyrolysis of the fuel inthe oxygen-deficient, high-temperature reburn zone. The hydrocarbon rad-icals then mix with the combustion gases from the primary combustionzone:
•CH3 + NO −→ HCN + H2O (6-61)
N2 + •CH2 −→ NH2 + HCN (6-62)
•H + HCN −→ •CN + H2 (6-63)
The radicals then react with the NO to form molecular nitrogen:
NO + •NH2 −→ N2 + H2O (6-64)

336 Coal Energy Systems
NO + •CN −→ N2 + CO (6-65)
2NO + 2CO −→ N2 + 2CO2 (6-66)
An oxygen-deficient atmosphere is critical for Reactions (6-61) through(6-63) to occur. If oxygen levels are high, the NOx reduction reactions willnot occur, and the following will predominate:
CN + O2 −→ CO + NO (6-67)
NH2 + O2 −→ H2O + NO (6-68)
To complete the combustion process, air is introduced above the reburnzone. Some NOx is formed from conversion of HCN and ammonia com-pounds; however, the net effect is to significantly reduce the total quantityof NOx emitted from the boiler. The reactions with HCN and ammonia are:
HCN + 54O2 −→ NO + CO + 1
2H2O (6-69)
NH3 + 54O2 −→ NO + 3
2H2O (6-70)
HCN + 34O2 −→ 1
2N2 + CO + 12H2O (6-71)
NH3 + 34O2 −→ 1
2N2 + 32H2O (6-72)
Reburn offers the advantages of being able to operate over a wide rangeof NOx reduction values using a variety of reburn fuels. A reburn system canbe varied from relatively low levels of reduction (25 to 30%) using an overfireair system without any reburn fuel to higher levels of reduction (∼70%) whenreburn fuel is added [21,30]. This allows for fine-tuning to meet emissionslimits.
Concerns regarding the use of reburn technology are similar to thosefor other combustion modification processes. This includes concerns aboutincomplete combustion (i.e., CO and hydrocarbon production and unburnedcarbon in the fly ash), changes in slagging and fouling characteristics, dif-ferent ash characteristics and fly ash loadings, corrosion of boiler tubesin reducing atmospheres, higher fan power consumption, and pulverizerconstraints (if pulverized coal is used as the reburn fuel).
Cofiring Cofiring is the practice of firing a supplementary fuel, suchas coal-water slurry fuel (CWSF) or biomass, with a primary fuel (i.e., coal)in the same burner or separately but into the main combustion zone. Thistechnology was originally developed to utilize opportunity fuels; however,various levels of NOx reduction were achieved and provide an option forNOx reduction without investing in a post-combustion system when theemissions are near the regulatory requirements. This technique is not cur-rently used as a commercial means for NOx reduction; however, it is brieflydiscussed in this section because several demonstrations of this technologyhave been conducted, with a few still ongoing. In addition, it is consid-ered a viable option for NOx trimming especially if used in conjunction
Emissions Control Strategies for Power Plants 337
with legislation that mandates a percentage of electricity be generated fromrenewable/sustainable sources. Such legislation has been seriously discussedin the United States and has been included in congressional bills althoughthey have not yet passed.
The CWSF technology was originally developed as a fuel oil replace-ment and underwent considerable research and development from the late1970s to the late 1980s. During the late 1980s and early 1990s, coal suppli-ers and coal-fired utilities began to evaluate the production of CWSF usingbituminous coal fines from coal cleaning circuits in an effort to reduce dewa-tering/drying costs and/or to recover and utilize low-cost impounded coalfines [35,36]. This marked a philosophical change in the driving force behindutilizing CWSF in the United States as well as the CWSF characteristicsof these two fuel types, as cofire CWSFs are quite different from fuel oil-replacement CWSFs: Cofire CWSFs have a low solids content (50%) andno additive package to wet the coal, provide stability, and modify rheol-ogy, whereas fuel oil-replacement CWSFs have a high solids content (∼70%)and an expensive additive package. Extensive testing performed by severalcompanies and universities culminated in waste impoundment character-izations and several utility demonstrations in pulverized coal-fired boilers(both wall- and tangentially-fired units) and cyclone-fired boilers. Fundingfor these demonstrations was provided by industry, the DOE, the ElectricPower Research Institute (EPRI), and state agencies. Penn State provided fuelsupport in all but one of these demonstrations, as summarized in a CWSFpreparation and operation manual prepared by Morrison et al. [37], where theCWSFs were being developed to provide coal preparation plants a means forutilizing difficult-to-dewater fines, cleaning up waste coal impoundments toreduce coal mine liability, and supplying utilities with a low-cost fuel thatalso serves as a low-cost NOx reduction technology. NOx reductions wereachieved that varied from ∼11% in cyclone-fired boilers [38] to ∼30% inwall-fired boilers [39,40] to ∼35% in tangentially-fired boilers [41]. Severalmechanisms were responsible for the NOx reduction, including lower flametemperature from the addition of the water, staged combustion from cofiringin low-NOx burners, and the CWSF acting as a reburn fuel when injected inupper level burners.
Biomass cofiring has been demonstrated and deployed at a number ofpower plants in the United States and Western Europe using a variety of mate-rials, including sawdust, urban wood waste, switchgrass, straw, and othersimilar materials [42]. Biomass fuels have been cofired with all ranks of coal:bituminous and subbituminous coals and lignites. The benefits of biomasscofiring include reduced NOx , fossil CO2, SO2, and mercury emissions.
Cofiring biomass, particularly sawdust and urban wood waste butalso switchgrass to a lesser extent, in large-scale pulverized coal-fired andcyclone-fired units has been demonstrated at several utilities with sevencommercial installations in the United States [43,44]. Many of the demon-strations were conducted to achieve NOx reductions, which can vary
338 Coal Energy Systems
significantly but can be as high as ∼35%. Tillman [42] noted that thedominant mechanism for NOx reduction is to support deeper staging of com-bustion when staging has not been particularly extensive. When biomasscan introduce or accentuate staging by early release of volatile matter, thenNOx reduction can be significant [42,45]. A secondary mechanism for NOxreduction is the influence of cofiring on furnace exit gas temperature (FEGT).Data indicate that cofiring has minimal impact on flame temperatures butcan have a pronounced impact on FEGT, thereby reducing NOx emissions.A third influence is the reduction in fuel nitrogen content when a low-nitrogen fuel such as sawdust is used.
Process Optimization Several software packages have been developedor are under development that apply optimization procedures to the dis-tributed control system of the boiler to provide tighter control of plantoperation parameters [30]. The combustion process is optimized, resultingin lower NOx emissions and improved boiler efficiency while maintainingsafe, reliable, and consistent unit operation. Also, combustion optimizationapproaches have been developed where advanced computational and exper-imental approaches are used to make design and operational modificationsto the process equipment and boiler as a whole [46].
The main software packages are the ULTRAMAX Method, GenericNOx Control Intelligent System (GNOCIS/GNOCIS Plus), Boiler OP, Quick-Study, and Smart Burn [30,46]. The use of these packages has resulted inNOx reductions of 10 to 40%, reduced unburned carbon levels by 25 to50%, increased boiler efficiencies by 1 to 3%, and increased heat rates by0.5 to 5%.
Flue Gas Treatment Flue gas treatment technologies are post-combustionprocesses to convert NOx to molecular nitrogen or nitrates. The two pri-mary strategies that have been developed for post-combustion control and arecommercially available are selective catalytic reduction (SCR) and selectivenon-catalytic reduction (SNCR). Additional concepts are under develop-ment, including combining SCR and SNCR technologies (known as hybridSCR/SNCR) and rich reagent injection; however, these are not extensivelyused at this time. Of these technologies, SCR is being identified by utilitiesas the strategy to meet stringent NOx requirements. These technologies arediscussed in the following sections, with an emphasis on SCR.
Selective Catalytic Reduction Selective catalytic reduction of NOxusing ammonia (NH3) as the reducing gas was patented in the United Statesby Englehard Corporation in 1957 [47]. This technology can achieve NOxreductions in excess of 90% and is widely used in commercial applica-tions in Western Europe and Japan, which have stringent NOx regulations,and is becoming the post-combustion technology of choice in the UnitedStates. Stringent NOx regulations in Western Europe essentially mandate
Emissions Control Strategies for Power Plants 339
the installation of SCR, and approximately 40 GW of generating capacity arefitted with secondary NOx reduction systems, the majority of which utilizeSCR with only a few boilers using the SNCR process [48]. Similarly, SCRtechnology was introduced into commercial service in Japan in 1980 andhas been applied to more than 23 GW of coal-fired generating capacity in61 plants. U.S. utilities initially deployed SCR for coal-fired units for newand retrofit applications in 1991 and 1993, respectively [49]. SCR units havebeen installed on ∼26 GW of generating capacity in the United States, but bythe year 2007 more than 200 SCR installations with overall capacity greaterthan 100 GW are anticipated to be in place to meet NOx targets mandatedby the SIP-Call [48,49].
The SCR process uses a catalyst at approximately 570 to 750◦F to facil-itate a heterogeneous reaction between NOx and an injected reagent, vapor-ized ammonia, to produce nitrogen and water vapor. Ammonia chemisorbsonto the active sites on the catalyst. The NOx in the flue gas reacts withthe adsorbed ammonia to produce nitrogen and water vapor. The principalreactions are [50]:
4NO + 4NH3 + O2 −→ 4N2 + 6H2O (6-73)
2NO2 + 4NH3 + O2 −→ 3N2 + 6H2O (6-74)
A small fraction of the sulfur dioxide is oxidized to sulfur trioxideover the SCR catalyst. In addition, side reactions may produce the unde-sirable by-products ammonium sulfate ((NH4)2SO4) and ammonium bisul-fate (NH4HSO4), which can cause plugging and corrosion of downstreamequipment. These side reactions are [47]:
SO2 + 12O2 −→ SO3 (6-2)
2NH3 + SO3 + H2O −→ (NH4)2 SO4 (6-75)
NH3 + SO3 + H2O −→ NH4HSO4 (6-76)
The three SCR system configurations for coal-fired boilers are high-dust, low-dust, and tail-end, which are shown schematically in Figure 6-14[50]. In a high-dust configuration, the SCR reactor is placed upstream of theparticulate removal device between the economizer and the air preheater.This configuration (also referred to as hot-side, high-dust) is the most com-monly used, particularly with dry-bottom boilers [30], and is the principletype planned for U.S. installations [48]. In this configuration, the catalystis exposed to the fly ash and chemical compounds present in the flue gasthat have the potential to degrade the catalyst by ash erosion and chemicalreactions (i.e., poisoning); however, these can be addressed by proper designas evidenced by the extensive use of this configuration.
In a low-dust installation, the SCR reactor is located downstream of theparticulate removal device. This configuration (also referred to as hot-side,low-dust) reduces the degradation of the catalyst by fly ash erosion; however,
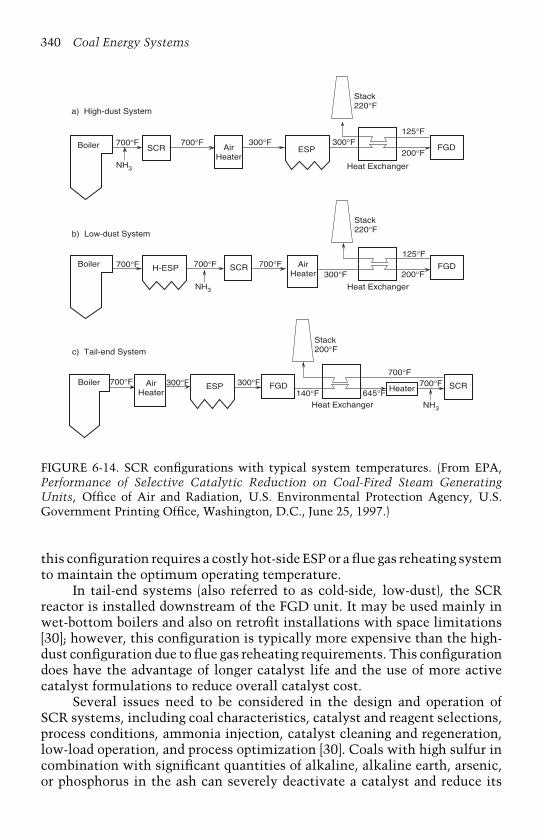
340 Coal Energy Systems
FGDBoiler
Heat Exchanger
H-ESP SCR
Stack220°F
SCRBoiler
Heat Exchanger
ESP FGD Heater
Stack200°F
Boiler SCR AirHeater
AirHeater
AirHeater
ESP
Heat Exchanger
FGD700°F
NH3
700°F 300°F 300°F200°F
125°F
Stack220°F
700°F 700°F
NH3
700°F300°F
125°F
200°F
700°F 300°F 300°F140°F 645°F
700°F700°F
NH3
a) High-dust System
b) Low-dust System
c) Tail-end System
FIGURE 6-14. SCR configurations with typical system temperatures. (From EPA,Performance of Selective Catalytic Reduction on Coal-Fired Steam GeneratingUnits, Office of Air and Radiation, U.S. Environmental Protection Agency, U.S.Government Printing Office, Washington, D.C., June 25, 1997.)
this configuration requires a costly hot-side ESP or a flue gas reheating systemto maintain the optimum operating temperature.
In tail-end systems (also referred to as cold-side, low-dust), the SCRreactor is installed downstream of the FGD unit. It may be used mainly inwet-bottom boilers and also on retrofit installations with space limitations[30]; however, this configuration is typically more expensive than the high-dust configuration due to flue gas reheating requirements. This configurationdoes have the advantage of longer catalyst life and the use of more activecatalyst formulations to reduce overall catalyst cost.
Several issues need to be considered in the design and operation ofSCR systems, including coal characteristics, catalyst and reagent selections,process conditions, ammonia injection, catalyst cleaning and regeneration,low-load operation, and process optimization [30]. Coals with high sulfur incombination with significant quantities of alkaline, alkaline earth, arsenic,or phosphorus in the ash can severely deactivate a catalyst and reduce its

Emissions Control Strategies for Power Plants 341
service life. In addition, the SO3 can react with residual ammonia, resultingin ammonium sulfate deposition in the air preheater and loss of performance.
The two leading geometries of SCR catalysts are honeycomb and plate[47]. The honeycomb form usually is an extruded ceramic, with the catalysteither incorporated throughout the structure (homogenous) or coated on thesubstrate. In the plate geometry, the support material is generally coatedwith catalyst. The catalyst commonly consists of a vanadium pentoxideactive material on a titanium dioxide substrate.
For optimum SCR performance, the reagent must be well mixed withthe flue gas and in direct proportion to the amount of NOx reaching thecatalyst. Anhydrous ammonia has been commonly used as the reagent,accounting for over 90% of current-world SCR applications [30]. It dominatesplanned installations in the United States, although numerous aqueous sys-tems will be installed. Urea-based processes are being developed to addressutilizing anhydrous ammonia, which is a hazardous and toxic chemical.When urea CO(NH2)2 is used, it produces ammonia, which is the activereducing agent, by the following reactions:
NH2–CO − NH2 −→ NH3 + HNCO (6-77)
HNCO + H2O −→ NH3 + CO2 (6-78)
During the operation of the SCR, the catalyst is deactivated by fly ashplugging, catalyst poisoning, and/or the formation of binding layers. Themost common method of catalyst cleaning has been the installation of steamsootblowers, although acoustic cleaners have been successfully tested. Oncethe catalyst has been severely deactivated, it is conventional practice to addadditional catalyst or replace it; however, several regeneration techniqueshave evolved over the last few years, providing extended service life for cata-lysts [30]. Low-load boiler operation can be problematic with SCR operation,specifically with high-sulfur coals. There is a minimum temperature belowwhich the SCR should not be operated; therefore, system modifications,such as economizer bypass, to raise the SCR temperature during low-loadoperation may be required [30].
Selective Non-Catalytic Reduction Selective non-catalytic reductionis a proven, commercially-available technology that has been applied since1974; over 300 systems are installed worldwide on various combustionsources, including utility applications [30]. The SNCR process involvesinjecting nitrogen-containing chemicals into the upper furnace or convec-tive pass of a boiler within a specific temperature window without the useof an expensive catalyst. Various chemicals can be used that selectively reactwith NO in the presence of oxygen to form molecular nitrogen and water,but the two most common are ammonia and urea. Other chemicals thathave been tested in research include amines, amides, amine salts, and cya-nuric acid. In recent years, urea-based reagents such as dry urea, molten urea,or urea solution have been increasingly used, replacing ammonia at many
342 Coal Energy Systems
plants because anhydrous ammonia is the most toxic and requires stricttransportation, storage, and handling procedures [30]. The main reactionswhen using ammonia or urea are, respectively:
4NO + 4NH3 + O2 −→ 4N2 + 6H2O (6-73)
4NO + 2CO (NH2)2 + O2 −→ 4N2 + 2CO2 + 4H2O (6-79)
A critical issue is finding an injection location with the proper temper-ature window for all operating conditions and boiler loads. The chemicalsthen need to be adequately mixed with the flue gases to ensure maximumNOx reduction without producing too much ammonia. Ammonia slip froman SNCR can affect downstream equipment by forming ammonium sulfates.
The temperature window varies for most of the reducing chemicalsused but generally is between 1650 and 2100◦F. Ammonia can be formedbelow the temperature window, and the reducing chemicals can actuallyform more NOx above the temperature window. Ammonia has a loweroperating temperature than urea: 1560 to 1920◦F vs. 1830 to 2100◦F, respec-tively. Enhancers such as hydrogen, carbon monoxide, hydrogen peroxide(H2O2), ethane (C2H6), light alkanes, and alcohols have been used in combi-nation with urea to reduce the temperature window [51]. Several processesuse proprietary additives with urea in order to reduce NOx emissions [52].
The efficiency of reagent utilization is significantly less with SNCRthan with SCR. In commercial SNCR systems, the utilization is typicallybetween 20 and 60%; consequently, usually three to four times as muchreagent is required with SNCR to achieve NOx reductions similar to thoseof SCR. SNCR processes typically achieve 20 to 50% NOx reduction withstoichiometric ratios of 1.0 to 2.0.
The major operational impacts of SNCR include air preheater foul-ing, ash contamination, N2O emissions, and minor increases in heat rate.A major plant impact of SNCR is on the air preheater, where residual ammo-nia reacts with the SO3 in the flue gas to form ammonium sulfate andbisulfate (see Reactions (6-2), (6-75), (6-76)), causing plugging and down-stream corrosion. High levels of ammonia slip can contaminate the fly ashand reduce its sale or disposal. Significant quantities of N2O can be formedwhen the reagent is injected into areas of the boiler that are below the SNCRoptimum operating temperature range. Urea injection tends to produce ahigher level of N2O compared to ammonia. The unit heat rate is increasedslightly due to the latent heat losses from vaporization of injected liquidsand/or increased power requirements for high-energy injection systems. Theoverall efficiency and power losses normally range from 0.3 to 0.8% [30].
Hybrid SNCR/SCR Selective catalytic reduction generally representsa relatively high capital requirement, whereas selective non-catalytic reduc-tion has a high reagent cost. A hybrid SNCR/SCR system balances these costsover the life cycle for a specific NOx reduction level, provides improvements
Emissions Control Strategies for Power Plants 343
in reagent utilization, and increases overall NOx reduction [30]. However,experience with these hybrid systems is limited, as full-scale power plantoperation to date has only been in demonstrations. They are discussed herebecause they have demonstrated NOx reductions as high as 60 to 70%.
In a hybrid SNCR/SCR system, the SNCR operates at lower tempera-tures than stand-alone SNCRs, resulting in greater NOx reduction but alsohigher ammonia slip. The residual ammonia feeds a smaller-sized SCR reac-tor, which removes the ammonia slip and decreases NOx emissions further.The SCR component may achieve only 10 to 30% NOx reduction, withreagent utilization being as high as 60 to 80% [30]. Hybrid SNCR/SCRsystems can be installed in various configurations, including [30]:
• SNCR with conventional reactor-housed SCR;• SNCR with in-duct SCR, which uses catalysts in existing or expan-
ded flue gas ductwork;• SNCR with catalyzed air preheater, where catalytically active heat
transfer elements are used;• SNCR with a combination of in-duct SCR and catalyzed air heater.
Rich Reagent Injection Cyclone burners, with their turbulent andhigh-temperature environment, are conducive for NOx production. Methodsthat cost less than installing SCRs to reduce NOx production in cyclone-firedboilers have been tested, such as CWSF or biomass cofiring, while othersare under development. One such process currently under development isthe rich reagent injection (RRI) process, which involves injection of aminereagents in the fuel-rich zone above the main combustion zone at temper-atures of 2370 to 3100◦F. NOx in the flue gas is converted to molecularnitrogen, and reductions of 30% have been achieved. The capital costs foran RRI system are consistent with those of SNCR; however, the operatingcosts are expected to be 2 to 3 times that of SNCR due to increased reagentusage.
NOx Control in Fluidized-Bed CombustionThe fluidized-bed combustion (FBC) process described in Chapter 5 (Tech-nologies for Coal Utilization) inherently produces lower NOx emissions dueto its lower operating temperature (i.e., bed temperature of ∼1600◦F). Also,the bed is a reducing region where available oxygen is consumed by carbon,thereby reducing ionization of nitrogen. Additional combustion modifica-tions or flue gas treatment for NOx control, discussed previously in thischapter, can also be employed. Techniques currently used for FBC includereducing the peak temperature by flue gas recirculation (FGR), natural gasreburning (NGR), overfire air (OFA), fuel reburning, low excess air (LEA),and reduced air preheat [23]. Post-combustion control is also used, includ-ing SCR and SNCR, which achieve 35 to 90% NOx reductions. Also, low

344 Coal Energy Systems
nitrogen fuel can be used (e.g., sawdust), thereby reducing the amount of fuelnitrogen available. Injecting sorbents into the combustion chamber or in theducts can reduce NOx by 60 to 90% [23].
NOx Control in Stoker-Fired BoilersControl of NOx in stokers (specifically, traveling-grate and spreader stok-ers) include abatement methods to reduce the peak temperature, to reducethe residence time at peak temperature, and to chemically reduce the NOx ,in addition to using low-nitrogen fuels and injecting a sorbent [23]. Intraveling-grate stokers, the peak temperature can be reduced by FGR, NGR,combustion optimization, OFA, LEA, water or steam injection, and reducedair preheat, thereby achieving 35 to 50% NOx reduction. Air or fuel staging,which reduces the residence time at peak temperature, can achieve 50 to 70%NOx reduction, while using SCR, SNCR, or fuel reburning technologies canachieve 55 to 80% NOx reduction. Sorbent injection, which can achieve 60to 90% NOx reduction, and the use of fuels with low nitrogen content aretechnologies also employed. NOx technologies used for spreader stokers aresimilar to traveling-grate stokers but achieve slightly different results. FGR,natural gas reburning, low-NOx burners, combustion optimization, OFA,LEA, water or steam injection, and reduced air preheat temperature are con-trol options to reduce peak temperatures that can achieve 50 to 65% NOxreductions. Air or fuel staging or steam injection, which reduces the resi-dence time at peak temperature, can achieve 50 to 65% NOx reductions,while using SCR, SNCR, or fuel reburning technologies achieves 35 to 80%NOx reductions. Additional NOx reduction technologies include sorbentinjection, which can achieve 60 to 90% reductions, and using lower nitrogenfuels.
Economics of NOx Reduction/RemovalThe costs for NOx reduction/removal techniques are site and performancespecific, thus making it difficult to compare generalized system costs. Thesetechniques depend on several factors, including degree of retrofit difficulty,unit size, uncontrolled NOx levels, and required NOx reduction [30]. Thissection summarizes costs for the various systems using published data.
Low-NOx Burners Wu [30] reported that the capital costs for a low-NOxburner are in the range of $650 to $8300/MM Btu. The operating costs canrange from $340 to $1500/MM Btu. The levelized costs can vary from $240to $4300/short ton of NOx removed, with the average cost being closer tothe lower end of the range [53].
Furnace Air Staging The costs for furnace air staging are similar to thosefor low-NOx burners [30]. The capital costs range from ∼$8 to $23/kW, and
Emissions Control Strategies for Power Plants 345
the levelized costs range from $110 to $210/short ton of NOx removed. Iffurnace air staging is combined with low-NOx burners, the capital costscan increase to $15 to $30/kW, while the levelized costs remain relativelyunchanged. Retrofits of furnace air staging in tangentially-fired boilers aregenerally more expensive than those in wall-fired boilers: $11 to $23/kW and$5 to $11/kW, respectively.
Flue Gas Recirculation The capital costs for conventional flue gas recircula-tion is similar to that for low-NOx burners and overfire air: $8 to $35/kW [53];however, capital costs of induced FGR, a design derivative of conventionalforced flue gas desulfurization, have been reduced to $1 to $3/kW.
Fuel Staging (Reburn) The capital costs for reburn technology depend onthe size of the unit, ease of retrofit, control system upgrade requirements,and, for natural gas reburn, availability of natural gas at the plant [30]. Theretrofit costs are typically about $15 to $20/kW for natural gas, coal, or oilreburn, excluding the cost of any natural gas pipeline. The operating costsfor a reburn retrofit are mainly due to the differential cost of the reburnfuel over the main fuel. For coal reburn, this cost is zero, but reburn fuelssuch as natural gas or oil are usually more expensive than the main fuel.This differential, however, can be offset by reductions in SO2 emissions,ash remediation and disposal, and pulverizer power. The levelized cost forreburn is ∼$110 to $210/short ton of NOx removed [16].
Cofiring Cofiring of CWSF is not commercially used at this time. Biomasscofiring, on the other hand, is currently being demonstrated at several plantsand commercial operations are being performed at seven utilities. The capitalcosts for biomass cofiring range from $175 to $250/kW [43].
Process Optimization The total turnkey installation cost for an advancedcombustion control system ranges from $150,000 to $500,000 [30]. It is pos-sible to achieve moderate cost reductions on a per-unit basis for similar unitsat the same power plant site. The size of the unit typically has little impacton the cost of a system.
Selective Catalytic Reduction (SCR) The capital costs for an SCR systemdepend on the level of NOx removal and other site-specific conditions, suchas inlet NOx concentration, unit size, and ease of retrofit and range from $80to $160/kW [54]. The capital costs of an SCR system include [30]:
• Catalyst and reactor system;• Flow control skid and valving system;• Ammonia injection grid;
346 Coal Energy Systems
• Ammonia storage;• Piping;• Ducts, expansion joints, and dampers;• Fan upgrades/booster fans;• Air preheater changes;• Foundations, structural steel, and electricals;• Installation.
The operating costs can vary from $1500 to $5800/MM Btu, and thelevelized cost can range from $1800 to $10,900/MM Btu [30]. The operatingcosts include [30]:
• Ammonia usage;• Pressure drop changes;• Excess air change;• Unburned carbon change;• Ash disposal;• Catalyst replacement;• Vaporization/injection energy requirements;• Other auxiliary power usage.
Selective Non-Catalytic Reduction Selective non-catalytic reduction is lesscapital intensive than SCR. The cost of an SNCR retrofit is $10 to $20/kW,whereas incorporating SNCR into a new boiler typically costs $5 to $10/kW[30]. The difference is due to the costs associated with modifying the existingboiler to install the reagent injection ports. The operating costs associatedwith the reagent, auxiliary power, and potential adverse plant impacts are ofthe order of $1 to $2 mills/kWh. The levelized costs average ∼$1000/shortton of NOx removed. A new, single-level approach to SNCR—SNCR trim—offers 20 to 30% NOx reduction at about half the cost of conventional SNCRand is being tested by the EPRI [55]. SCNR trim has low operating costs,equivalent to only about $850/short ton of NOx removed.
Other Flue Gas Treatment Processes Limited data are available for hybridSNCR/SCR systems as they are still in the demonstration phase. A levelizedcost estimate for a 500 MW boiler with 50% NOx reduction is ∼$5800/shortton of NOx removed [30]. Similarly, cost data on the rich reagent injectionprocess, which is under development, are not available.
Hybrid Flue Gas Treatment and Combustion Modifications A combina-tion of flue gas treatment with combustion modification is increasinglybeing used. This technology provides higher overall NOx reductions andcan be more cost effective than stand-alone technology for the same levelof NOx control [30]. The costs of SCR can be reduced when it is used incombination with combustion modifications such as low-NOx burners and
Emissions Control Strategies for Power Plants 347
overfire air [30]. Capital costs are lowered because combustion modificationslower the inlet NOx concentration, which reduces the catalyst volume, sup-port systems, and installation cost of SCR. In addition, operating costs arelower due to reductions in catalyst replacement and reagent consumption.SNCR can be combined with low-NOx burners or gas reburn. SNCR andgas reburn have comparable economics at the same level of NOx reduc-tion; however, combining the two technologies considerably lowers costswhile achieving a slightly higher NOx reduction. An example of annualcosts, reported by Wu [30], are ∼$1140, $1120, and $730 per short tonNOx removed, respectively, for urea SNCR, gas reburn, and urea SNCR/gasreburn.
Particulate MatterParticulate matter (PM) emissions from coal-fired electric utility boilers inthe United States have decreased significantly since implementation of the1970 Clean Air Act Amendments. In 2001, ∼23 million short tons of partic-ulate matter, reported as PM10 (i.e., particles with an aerodynamic diameter≤10 µm), were emitted from inventoried point and area sources, of which∼190,000 short tons (or ∼1.6% of the total) were emitted by coal-fired electricutility boilers [56]. This is a substantial decrease from a total of ∼1.7 mil-lion short tons of PM10 being emitted from coal-fired power plants in 1970,especially as coal consumption for electricity generation has increased morethan 150% over this period, and the reduction is due to the application ofparticulate control technologies. Similarly, in 2001, annual emissions of par-ticulates smaller than 2.5 µm (i.e., PM2.5), which is a subset of PM10, were100,000 short tons, or less than 0.8% of the total primary PM2.5 emittedfrom all sources.
The application of control technologies to combustion sources is illus-trated in Figures 6-1 and 6-2, which show the improvements in emissionsrates from coal-fired power plants since 1970 as well as near-term projectedemissions rates. As of 2000, 1020 coal-fired electric generators were equippedwith particulate collectors and represented a total of more than 321,000 MWgenerating capacity [3].
Several particulate control technologies are available for coal-firedpower plants, including electrostatic precipitators, fabric filters (baghouses),wet particulate scrubbers, mechanical collectors (cyclones), and hot-gas par-ticulate filtration [57]. Of these, ESPs and fabric filters are currently thetechnologies of choice as they can meet current and pending legislation PMlevels. While cleaning large volumes of flue gas, they achieve very high col-lection efficiencies and can remove fine particles. When operating properly,ESPs and baghouses can achieve overall collection efficiencies of 99.9% ofprimary particulates (over 99% control of PM10 and 95% control of PM2.5),thereby achieving the 1978 New Source Performance Standards requiredlimit of 0.03 lb PM per million Btu [58]. The primary particulate matter
348 Coal Energy Systems
collection devices used in the power generation industry—ESPs and fabricfilters (baghouses)—are discussed in this section. In addition, hybrid systemsunder development that combine ESPs and fabric filters in a single, overallsystem are presented.
Electrostatic PrecipitatorsParticulate and aerosol collection by electrostatic precipitation is basedon the mutual attraction between particles of one electrical charge and acollection electrode of opposite polarity. This concept was pioneered byF. G. Cottrell in 1910 [6]. The advantages of this technology include the abil-ity to handle large gas volumes (ESPs have been built for volumetric flowrates up to 4,000,000 ft3/min), achieve high collection efficiencies (whichvary from 99 to 99.9%), maintain low pressure drops (0.1–0.5 inH2O), col-lect fine particles (0.5–200 µm), and operate at high gas temperatures (up to1200◦F). In addition, the energy expended in separating particles from thegas stream acts solely on the particles and not on the gas stream.
Electrostatic precipitators have been utilized to control particulateemissions from coal-fired boilers used for steam generation for about 60years [7]. Initially, all ESPs were installed downstream of the air preheatersat temperatures of 270 to 350◦F and are referred to as cold-side ESPs. ESPsinstalled upstream of air preheaters, where temperatures range from 600 to750◦F, are referred to as hot-side ESPs and use low-sulfur fuels with lowerfly ash resistivity. In the early 1970s, ESPs were the preferred choice forhigh-efficiency particulate control devices [7]. Nearly 90% of U.S. coal-basedelectric utilities use ESPs to collect fine particles [59].
Operating Principles Several basic geometries are used in the design ofESPs, but the common design used in the power-generation industry is theplate-and-wire configuration. In this design (shown in Figure 6-15), the ESPconsists of a large hopper-bottomed box containing rows of plates formingpassages through which the flue gas flows. Centrally located in each pas-sage are electrodes energized with high-voltage (45–70 kV), negative-polarity,direct current (dc) provided by a transformer–rectifier set [8]. Examples ofvarious designs of rigid discharge electrodes are shown in Figure 6-16 [8].The discharge electrode most commonly used in the United States is theweighted-wire electrode, while the rigid-frame electrode is commonly usedin Europe [8]. The flow is usually horizontal, and the passageways are typi-cally 8 to 10 inches wide. The height of a plate varies from 18 to 40 feet, andthe length varies from 25 to 30 feet. The ESP is designed to reduce the flowof flue gas from 50 to 60 ft/sec to less than 10 ft/sec as it enters the ESP sothe particles can be effectively collected.
The electrodes discharge electrons into the flue gas stream, ionizingthe gas molecules. These gas molecules, with electrons attached, formnegative ions. The gas is heavily ionized in the vicinity of the electrodes,

Emissions Control Strategies for Power Plants 349
T-R Controls
Four PointSupport System
Inlet FlowDistribution Devices
RigidDischarge Frame
Collecting Curtain Rappers
DischargeElectrodeRappers
Collecting Curtain
FIGURE 6-15. Electrostatic precipitator. (From B&W, Electrostatic Precipitator Prod-uct Sheet PS151 2M A 12/82, Babcok & Wilcox Co., Barberton, OH, December1982.)
resulting in a visible blue corona effect. The fine particles are then chargedthrough collisions with the negatively charged gas ions, resulting in the par-ticles becoming negatively charged. Under the large electrostatic force, thenegatively charged ash particles migrate out of the gas stream toward thegrounded plates, where they collect and form an ash layer. These plates areperiodically cleaned by a rapping system to release the layer into the ashhoppers as an agglomerated mass.
The speed at which the migration of the ash particles takes place isknown as the migration or drift velocity. It depends upon the electrical forceon the charged particle as well as the drag force developed as the particleattempts to move perpendicular to the main gas flow toward the collectingelectrode [6]. The drift velocity, w, is defined as:
w = 2. 95 × 10−12pEcEpdp
µgKC (6-80)
where w is in meters per second, p is the dielectric constant for the particles(which typically lies between 1.50 and 2.40), Ec is the strength of the charg-ing field (V/m), Ep is the collecting field strength (V/m), dp is the particlediameter (µm), KC is the Cunningham correction factor for particles with adiameter less than roughly 5 µm (dimensionless), and µg is the gas viscosity(kg/m/sec).
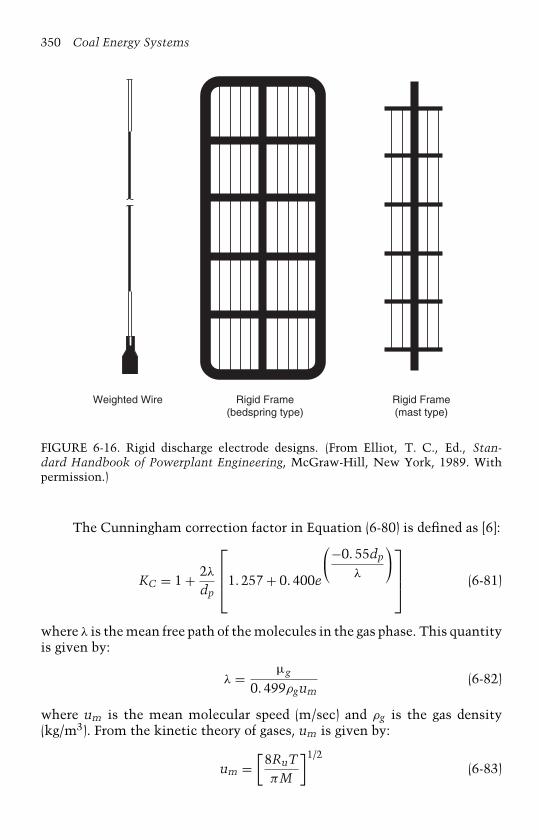
350 Coal Energy Systems
Weighted Wire Rigid Frame(bedspring type)
Rigid Frame(mast type)
FIGURE 6-16. Rigid discharge electrode designs. (From Elliot, T. C., Ed., Stan-dard Handbook of Powerplant Engineering, McGraw-Hill, New York, 1989. Withpermission.)
The Cunningham correction factor in Equation (6-80) is defined as [6]:
KC = 1 + 2λ
dp
1. 257 + 0. 400e
−0. 55dp
λ
(6-81)
where λ is the mean free path of the molecules in the gas phase. This quantityis given by:
λ = µg
0. 499ρgum(6-82)
where um is the mean molecular speed (m/sec) and ρg is the gas density(kg/m3). From the kinetic theory of gases, um is given by:
um =[
8RuTπM
]1/2
(6-83)

Emissions Control Strategies for Power Plants 351
where M is the molecular weight of the gas, T is temperature (K), and Ru isthe universal gas constant (8. 31 × 103 m2/sec2/mol K).
The drift velocity is used to determine collection efficiency using theDeutsch–Anderson equation:
η = 1 − e(− wA
Q
)(6-84)
where w is the drift velocity, A is the area of collection electrodes, and Qis the volumetric flow rate. The units of w, A, and Q must be consistentbecause the factor wA/Q is dimensionless.
The ratio A/Q is often referred to as the specific collection area (SCA)and is the most fundamental ESP size descriptor [8]. Collection efficiencyincreases as SCA and w increase. The value of w increases rapidly as thevoltage applied to the emitting voltage is increased; however, the voltagecannot be increased above that level at which an electric short circuit, orarc, is formed between the electrode and ground.
Factors that Affect ESP Performance Several factors affect ESP perfor-mance; of these, fly ash resistivity is the most important.
Fly Ash Resistivity Fly ash resistivity plays a key role in dust-layerbreakdown and the ESP performance. Resistivity is dependent on the fluegas temperature and chemistry and on the chemical composition of the ashitself. Electrostatic precipitation is most effective in collecting dust in theresistivity range of 104 to 1010 ohm-cm [6]. In general, resistivities above1011 ohm-cm are considered to be a problem because the maximum oper-ating field strength is limited by the fly ash resistivity. Back corona, themigration of positive ions generated in the fly ash layer toward the emittingelectrodes, which neutralizes the negatively charged particles, will resultif the ash resistivity is greater than 1012 ohm-cm. If the fly ash resistivityis below 2 × 10¹⁰ ohm-cm, it is not considered to be a problem because themaximum operating field strength is limited by factors other than resistivity.
Examples of low- and high-resistivity fly ashes are shown in Figure 6-17,where resistivity is plotted as a function of temperature for two U.S. lignitesamples from North Dakota and two subbituminous samples from the Pow-der River Basin [61]. The differences in fly ash resistivity are due to variationsin ash composition. The low-resistivity fly ashes were produced from coalsthat contained higher levels of sodium in the coal ash. Higher sodium lev-els result in lower resistivity. Similarly, higher concentrations of iron lowerresistivity. Higher levels of calcium and magnesium have the opposite effecton resistivity. This is illustrated in Figure 6-18, where the fly ash resistivi-ties of two Texas lignites are shown along with the fly ash resistivities fromthe same two coals when injecting limestone for SO2 control [62]. The addi-tion of calcium through sorbent injection resulted in increasing the fly ashresistivities.
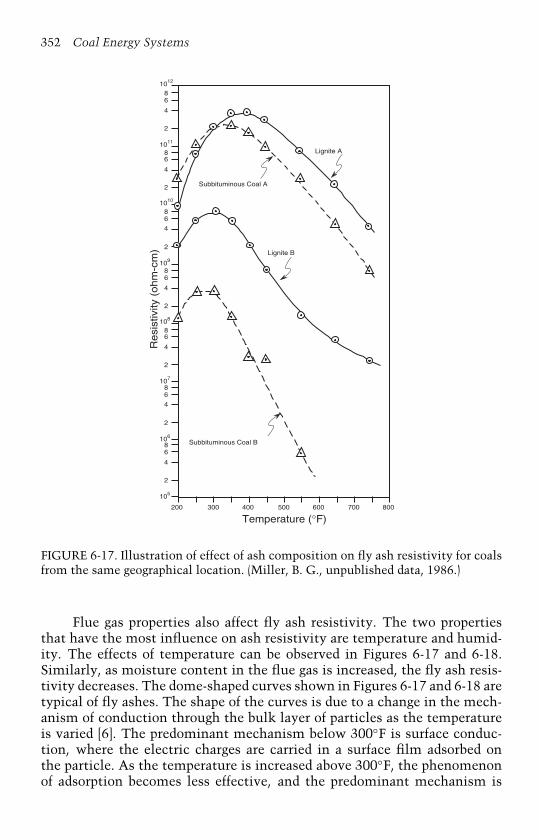
352 Coal Energy Systems
86
4
2
107
Temperature (°F)
1012
86
4
2
1011
1010
109
108
86
4
2
86
4
2
86
4
2
200 300 400 500 600 700 800
86
4
2
106
86
4
2
105
Lignite A
Subbituminous Coal A
Lignite B
Subbituminous Coal B
Resi
stiv
ity (
ohm
-cm
)
FIGURE 6-17. Illustration of effect of ash composition on fly ash resistivity for coalsfrom the same geographical location. (Miller, B. G., unpublished data, 1986.)
Flue gas properties also affect fly ash resistivity. The two propertiesthat have the most influence on ash resistivity are temperature and humid-ity. The effects of temperature can be observed in Figures 6-17 and 6-18.Similarly, as moisture content in the flue gas is increased, the fly ash resis-tivity decreases. The dome-shaped curves shown in Figures 6-17 and 6-18 aretypical of fly ashes. The shape of the curves is due to a change in the mech-anism of conduction through the bulk layer of particles as the temperatureis varied [6]. The predominant mechanism below 300◦F is surface conduc-tion, where the electric charges are carried in a surface film adsorbed onthe particle. As the temperature is increased above 300◦F, the phenomenonof adsorption becomes less effective, and the predominant mechanism is

Emissions Control Strategies for Power Plants 353
Temperature (°F)
1013
86
4
2
1012
1011
1010
109
86
4
2
86
4
2
86
4
2
86
4
2
200 300 400 500 600 700 800
108
PTC-B-264 PTC-B-271 8-hr limestone
injection
PTC-A-265 limestone injection
PTC-A-263
Res
istiv
ity (
ohm
-cm
)
FIGURE 6-18. The effect of limestone addition on fly ash resistivity. (FromMiller, B. G. et al., Sulfur Capture by Limestone Injection During Combustionof Pulverized Panola County Texas Lignite, in Proc. of the Gulf Coast LigniteConference, 1984.)
volume or intrinsic conduction. Volume conduction involves passage of anelectric charge through the particles.
Other Factors The three primary mechanical deficiencies in operat-ing units are gas sneakage, fly ash re-entrainment, and flue gas distribution[8]. Flue gas sneakage (i.e., flue gas that is bypassing the effective region ofthe ESP) increases the outlet dust loading. Re-entrainment occurs when indi-vidual dust particles are not collected in the hoppers but are caught up in thegas stream, thus increasing dust loading in the ESP and resulting in higheroutlet dust loadings. Nonuniform flue gas distribution throughout the entirecross section of the ESP decreases the collection ability of the unit.
Many additional factors can affect the performance of an ESP, includ-ing the quality and type of fuel. Changes in coal and ash composition,grindability, and the burner/boiler system are important. Fly ash resistivityincreases with decreasing sulfur content, an issue that must be consideredwhen switching to lower sulfur coals. Moisture content and ash compositionaffect resistivity, as discussed earlier. Changes in coal grindability can affectpulverizer performance by altering particle size distribution, which in turncan impact combustion performance and ESP performance. Modifications tothe boiler system can affect temperatures or combustion performance andthereby impact ESP performance.

354 Coal Energy Systems
Methods to Enhance ESP Performance Difficulties in collecting high-resistivity fly ash and fine particulates have led to very large units being spec-ified, unacceptable increases in ESP power consumption, and, in extremecases, the use of fabric filters in lieu of ESPs [8]. As a result, conceptshave been developed to overcome the technical limitations and maintaincompetitiveness with fabric filters, including [8]:
• Pulse energization, where a high-voltage pulse is superimposed onthe base voltage to enhance ESP performance during operation underhigh-resistivity conditions;
• Intermittent energization, where the voltage to the ESP is turnedoff during selected periods to provide a longer period between eachenergization cycle and reduce the potential for back corona;
• Wide plate spacing, which reduces capital and maintenance costs andallows for thicker discharge electrodes and increased current density.
Another approach to achieving electrical resistivities in the desiredrange is the addition of conditioning agents to the flue gas stream. Thistechnique is applied commercially to both hot-side and cold-side ESPs. Con-ditioning modifies the electrical resistivity of the fly ash and/or its physicalcharacteristic by changing the surface electrical conductivity of the dustlayer deposited on the collecting plates, increasing the space charge on the gasbetween the electrodes, and/or increasing dust cohesiveness to enlarge par-ticles and reduce rapping re-entrainment losses [8]. Over 200 utility boilersare equipped with some form of conditioning in the United States [8].
The most common conditioning agents are sulfur trioxide (SO3), ammo-nia (NH3), and compounds related to them, as well as sodium compounds.Sulfur trioxide is most widely applied for cold-side ESPs, while sodium com-pounds are used for hot-side ESPs [8]. Although results vary between coal andsystem, the injection of 10 to 20 ppm of SO3 can reduce the resistivity to avalue that will permit good collection efficiencies. In select cases, SO3 injec-tion of 30 to 40 ppm has resulted in reductions of fly ash resistivity of 2 to 3orders of magnitude (e.g., from 1011 to ∼108 ohm-cm) [6]. Disadvantagesof SO3 injection systems include the possibility of plume color degrada-tion. Disadvantages of sodium compounds include potential problems withincreased deposition and interference from certain fuel constituents, whichaffect the economics of the injection [8]. Combined SO3–NH3 conditioningis used in which the SO3 adjusts the resistivity downward and the NH3 mod-ifies the space-charge effect, improves agglomeration, and reduces rappingre-entrainment losses [8].
Wet ESPs Dry ESPs, which have been discussed up to this point, have beensuccessfully used for many years in utility applications for coarse and fineparticulate removal. Dry ESPs can achieve a 99+% collection efficiency forparticles 1 to 10 µm in size; however, dry ESPs cannot remove toxic gases
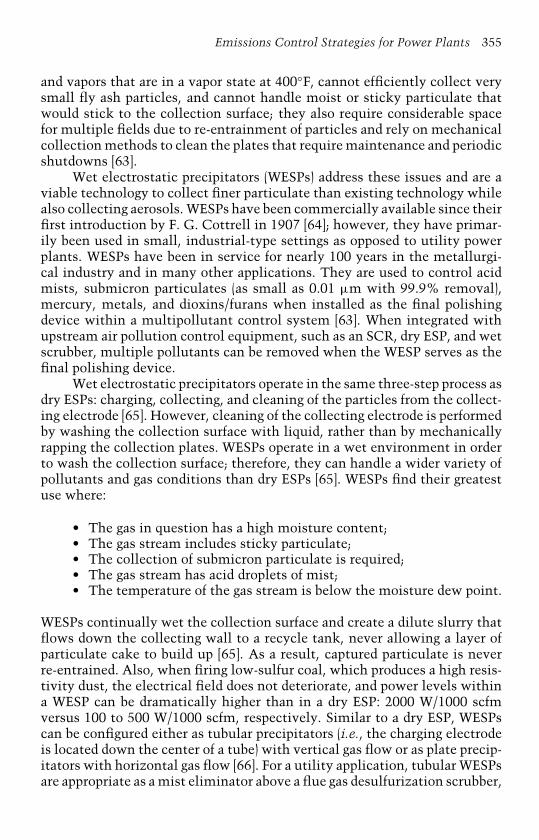
Emissions Control Strategies for Power Plants 355
and vapors that are in a vapor state at 400◦F, cannot efficiently collect verysmall fly ash particles, and cannot handle moist or sticky particulate thatwould stick to the collection surface; they also require considerable spacefor multiple fields due to re-entrainment of particles and rely on mechanicalcollection methods to clean the plates that require maintenance and periodicshutdowns [63].
Wet electrostatic precipitators (WESPs) address these issues and are aviable technology to collect finer particulate than existing technology whilealso collecting aerosols. WESPs have been commercially available since theirfirst introduction by F. G. Cottrell in 1907 [64]; however, they have primar-ily been used in small, industrial-type settings as opposed to utility powerplants. WESPs have been in service for nearly 100 years in the metallurgi-cal industry and in many other applications. They are used to control acidmists, submicron particulates (as small as 0.01 µm with 99.9% removal),mercury, metals, and dioxins/furans when installed as the final polishingdevice within a multipollutant control system [63]. When integrated withupstream air pollution control equipment, such as an SCR, dry ESP, and wetscrubber, multiple pollutants can be removed when the WESP serves as thefinal polishing device.
Wet electrostatic precipitators operate in the same three-step process asdry ESPs: charging, collecting, and cleaning of the particles from the collect-ing electrode [65]. However, cleaning of the collecting electrode is performedby washing the collection surface with liquid, rather than by mechanicallyrapping the collection plates. WESPs operate in a wet environment in orderto wash the collection surface; therefore, they can handle a wider variety ofpollutants and gas conditions than dry ESPs [65]. WESPs find their greatestuse where:
• The gas in question has a high moisture content;• The gas stream includes sticky particulate;• The collection of submicron particulate is required;• The gas stream has acid droplets of mist;• The temperature of the gas stream is below the moisture dew point.
WESPs continually wet the collection surface and create a dilute slurry thatflows down the collecting wall to a recycle tank, never allowing a layer ofparticulate cake to build up [65]. As a result, captured particulate is neverre-entrained. Also, when firing low-sulfur coal, which produces a high resis-tivity dust, the electrical field does not deteriorate, and power levels withina WESP can be dramatically higher than in a dry ESP: 2000 W/1000 scfmversus 100 to 500 W/1000 scfm, respectively. Similar to a dry ESP, WESPscan be configured either as tubular precipitators (i.e., the charging electrodeis located down the center of a tube) with vertical gas flow or as plate precip-itators with horizontal gas flow [66]. For a utility application, tubular WESPsare appropriate as a mist eliminator above a flue gas desulfurization scrubber,
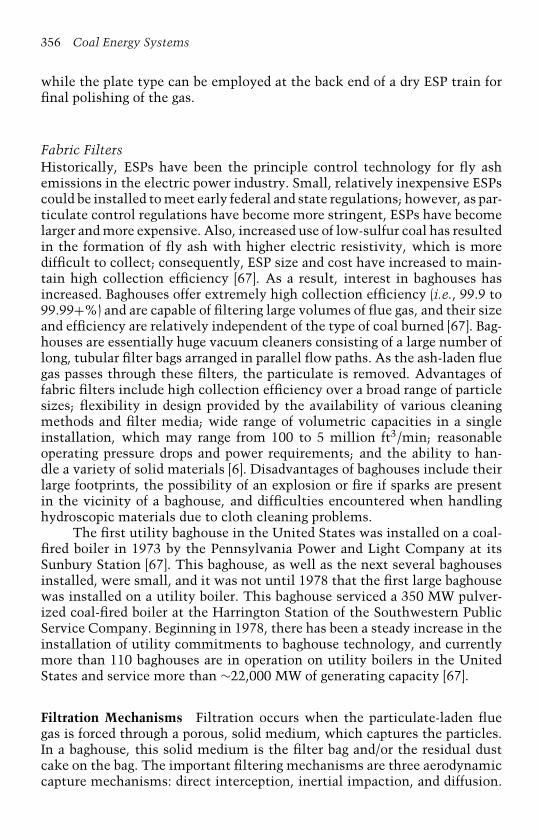
356 Coal Energy Systems
while the plate type can be employed at the back end of a dry ESP train forfinal polishing of the gas.
Fabric FiltersHistorically, ESPs have been the principle control technology for fly ashemissions in the electric power industry. Small, relatively inexpensive ESPscould be installed to meet early federal and state regulations; however, as par-ticulate control regulations have become more stringent, ESPs have becomelarger and more expensive. Also, increased use of low-sulfur coal has resultedin the formation of fly ash with higher electric resistivity, which is moredifficult to collect; consequently, ESP size and cost have increased to main-tain high collection efficiency [67]. As a result, interest in baghouses hasincreased. Baghouses offer extremely high collection efficiency (i.e., 99.9 to99.99+%) and are capable of filtering large volumes of flue gas, and their sizeand efficiency are relatively independent of the type of coal burned [67]. Bag-houses are essentially huge vacuum cleaners consisting of a large number oflong, tubular filter bags arranged in parallel flow paths. As the ash-laden fluegas passes through these filters, the particulate is removed. Advantages offabric filters include high collection efficiency over a broad range of particlesizes; flexibility in design provided by the availability of various cleaningmethods and filter media; wide range of volumetric capacities in a singleinstallation, which may range from 100 to 5 million ft3/min; reasonableoperating pressure drops and power requirements; and the ability to han-dle a variety of solid materials [6]. Disadvantages of baghouses include theirlarge footprints, the possibility of an explosion or fire if sparks are presentin the vicinity of a baghouse, and difficulties encountered when handlinghydroscopic materials due to cloth cleaning problems.
The first utility baghouse in the United States was installed on a coal-fired boiler in 1973 by the Pennsylvania Power and Light Company at itsSunbury Station [67]. This baghouse, as well as the next several baghousesinstalled, were small, and it was not until 1978 that the first large baghousewas installed on a utility boiler. This baghouse serviced a 350 MW pulver-ized coal-fired boiler at the Harrington Station of the Southwestern PublicService Company. Beginning in 1978, there has been a steady increase in theinstallation of utility commitments to baghouse technology, and currentlymore than 110 baghouses are in operation on utility boilers in the UnitedStates and service more than ∼22,000 MW of generating capacity [67].
Filtration Mechanisms Filtration occurs when the particulate-laden fluegas is forced through a porous, solid medium, which captures the particles.In a baghouse, this solid medium is the filter bag and/or the residual dustcake on the bag. The important filtering mechanisms are three aerodynamiccapture mechanisms: direct interception, inertial impaction, and diffusion.
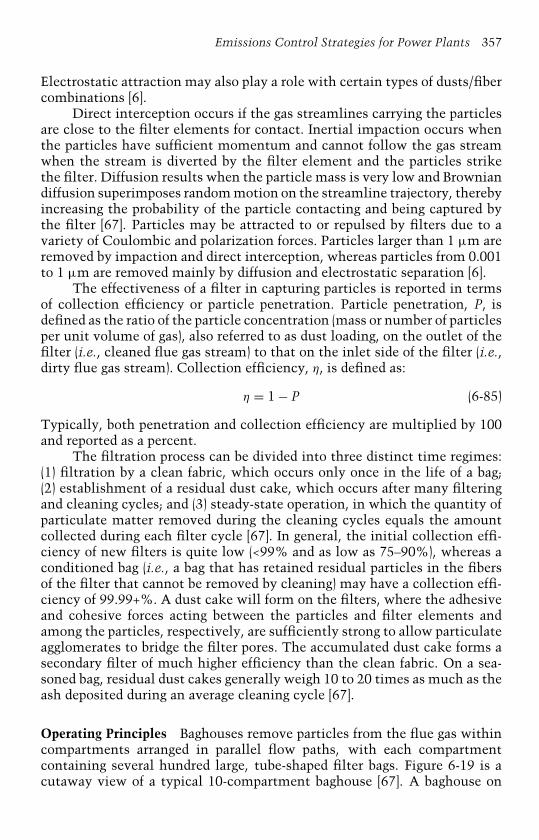
Emissions Control Strategies for Power Plants 357
Electrostatic attraction may also play a role with certain types of dusts/fibercombinations [6].
Direct interception occurs if the gas streamlines carrying the particlesare close to the filter elements for contact. Inertial impaction occurs whenthe particles have sufficient momentum and cannot follow the gas streamwhen the stream is diverted by the filter element and the particles strikethe filter. Diffusion results when the particle mass is very low and Browniandiffusion superimposes random motion on the streamline trajectory, therebyincreasing the probability of the particle contacting and being captured bythe filter [67]. Particles may be attracted to or repulsed by filters due to avariety of Coulombic and polarization forces. Particles larger than 1 µm areremoved by impaction and direct interception, whereas particles from 0.001to 1 µm are removed mainly by diffusion and electrostatic separation [6].
The effectiveness of a filter in capturing particles is reported in termsof collection efficiency or particle penetration. Particle penetration, P, isdefined as the ratio of the particle concentration (mass or number of particlesper unit volume of gas), also referred to as dust loading, on the outlet of thefilter (i.e., cleaned flue gas stream) to that on the inlet side of the filter (i.e.,dirty flue gas stream). Collection efficiency, η, is defined as:
η = 1 − P (6-85)
Typically, both penetration and collection efficiency are multiplied by 100and reported as a percent.
The filtration process can be divided into three distinct time regimes:(1) filtration by a clean fabric, which occurs only once in the life of a bag;(2) establishment of a residual dust cake, which occurs after many filteringand cleaning cycles; and (3) steady-state operation, in which the quantity ofparticulate matter removed during the cleaning cycles equals the amountcollected during each filter cycle [67]. In general, the initial collection effi-ciency of new filters is quite low (<99% and as low as 75–90%), whereas aconditioned bag (i.e., a bag that has retained residual particles in the fibersof the filter that cannot be removed by cleaning) may have a collection effi-ciency of 99.99+%. A dust cake will form on the filters, where the adhesiveand cohesive forces acting between the particles and filter elements andamong the particles, respectively, are sufficiently strong to allow particulateagglomerates to bridge the filter pores. The accumulated dust cake forms asecondary filter of much higher efficiency than the clean fabric. On a sea-soned bag, residual dust cakes generally weigh 10 to 20 times as much as theash deposited during an average cleaning cycle [67].
Operating Principles Baghouses remove particles from the flue gas withincompartments arranged in parallel flow paths, with each compartmentcontaining several hundred large, tube-shaped filter bags. Figure 6-19 is acutaway view of a typical 10-compartment baghouse [67]. A baghouse on
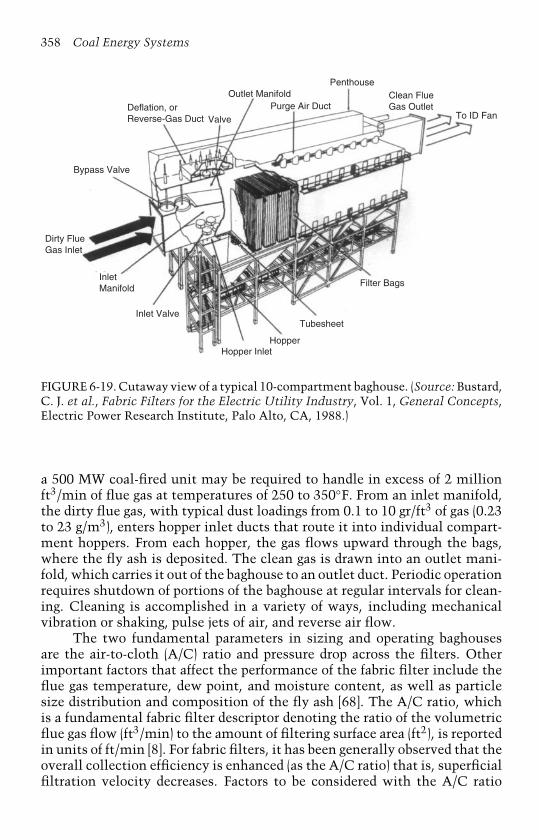
358 Coal Energy Systems
Hopper InletHopper
Tubesheet
Filter Bags
To ID Fan
Clean FlueGas Outlet
PenthouseOutlet Manifold
Valve
Dirty FlueGas Inlet
InletManifold
Inlet Valve
Purge Air DuctDeflation, orReverse-Gas Duct
Bypass Valve
FIGURE 6-19. Cutaway view of a typical 10-compartment baghouse. (Source: Bustard,C. J. et al., Fabric Filters for the Electric Utility Industry, Vol. 1, General Concepts,Electric Power Research Institute, Palo Alto, CA, 1988.)
a 500 MW coal-fired unit may be required to handle in excess of 2 millionft3/min of flue gas at temperatures of 250 to 350◦F. From an inlet manifold,the dirty flue gas, with typical dust loadings from 0.1 to 10 gr/ft3 of gas (0.23to 23 g/m3), enters hopper inlet ducts that route it into individual compart-ment hoppers. From each hopper, the gas flows upward through the bags,where the fly ash is deposited. The clean gas is drawn into an outlet mani-fold, which carries it out of the baghouse to an outlet duct. Periodic operationrequires shutdown of portions of the baghouse at regular intervals for clean-ing. Cleaning is accomplished in a variety of ways, including mechanicalvibration or shaking, pulse jets of air, and reverse air flow.
The two fundamental parameters in sizing and operating baghousesare the air-to-cloth (A/C) ratio and pressure drop across the filters. Otherimportant factors that affect the performance of the fabric filter include theflue gas temperature, dew point, and moisture content, as well as particlesize distribution and composition of the fly ash [68]. The A/C ratio, whichis a fundamental fabric filter descriptor denoting the ratio of the volumetricflue gas flow (ft3/min) to the amount of filtering surface area (ft2), is reportedin units of ft/min [8]. For fabric filters, it has been generally observed that theoverall collection efficiency is enhanced (as the A/C ratio) that is, superficialfiltration velocity decreases. Factors to be considered with the A/C ratio
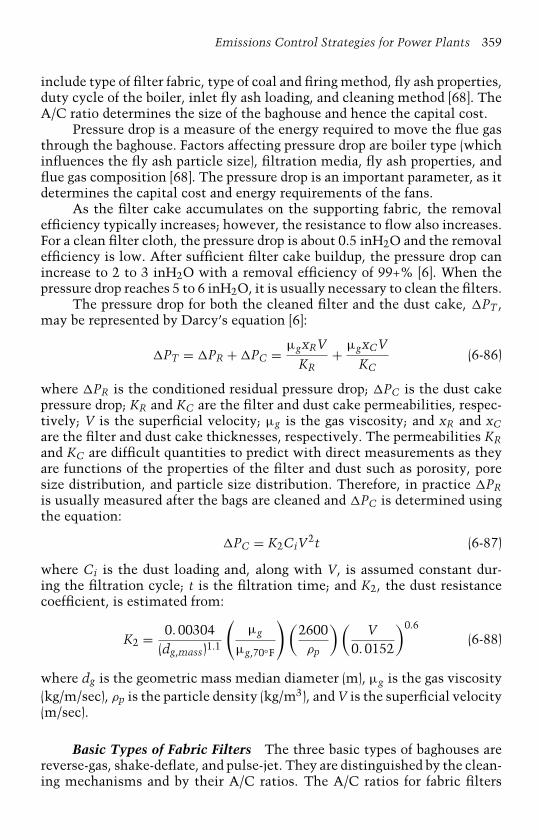
Emissions Control Strategies for Power Plants 359
include type of filter fabric, type of coal and firing method, fly ash properties,duty cycle of the boiler, inlet fly ash loading, and cleaning method [68]. TheA/C ratio determines the size of the baghouse and hence the capital cost.
Pressure drop is a measure of the energy required to move the flue gasthrough the baghouse. Factors affecting pressure drop are boiler type (whichinfluences the fly ash particle size), filtration media, fly ash properties, andflue gas composition [68]. The pressure drop is an important parameter, as itdetermines the capital cost and energy requirements of the fans.
As the filter cake accumulates on the supporting fabric, the removalefficiency typically increases; however, the resistance to flow also increases.For a clean filter cloth, the pressure drop is about 0.5 inH2O and the removalefficiency is low. After sufficient filter cake buildup, the pressure drop canincrease to 2 to 3 inH2O with a removal efficiency of 99+% [6]. When thepressure drop reaches 5 to 6 inH2O, it is usually necessary to clean the filters.
The pressure drop for both the cleaned filter and the dust cake, �PT ,may be represented by Darcy’s equation [6]:
�PT = �PR + �PC = µgxRV
KR+ µgxCV
KC(6-86)
where �PR is the conditioned residual pressure drop; �PC is the dust cakepressure drop; KR and KC are the filter and dust cake permeabilities, respec-tively; V is the superficial velocity; µg is the gas viscosity; and xR and xCare the filter and dust cake thicknesses, respectively. The permeabilities KRand KC are difficult quantities to predict with direct measurements as theyare functions of the properties of the filter and dust such as porosity, poresize distribution, and particle size distribution. Therefore, in practice �PRis usually measured after the bags are cleaned and �PC is determined usingthe equation:
�PC = K2CiV2t (6-87)
where Ci is the dust loading and, along with V, is assumed constant dur-ing the filtration cycle; t is the filtration time; and K2, the dust resistancecoefficient, is estimated from:
K2 = 0. 00304(dg,mass)1.1
(µg
µg,70◦F
) (2600ρp
) (V
0. 0152
)0.6
(6-88)
where dg is the geometric mass median diameter (m), µg is the gas viscosity(kg/m/sec), ρp is the particle density (kg/m3), and V is the superficial velocity(m/sec).
Basic Types of Fabric Filters The three basic types of baghouses arereverse-gas, shake-deflate, and pulse-jet. They are distinguished by the clean-ing mechanisms and by their A/C ratios. The A/C ratios for fabric filters
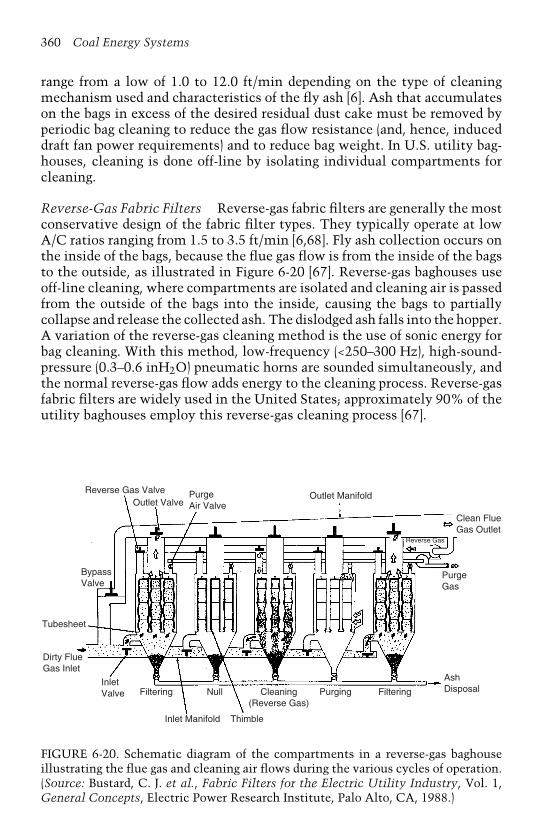
360 Coal Energy Systems
range from a low of 1.0 to 12.0 ft/min depending on the type of cleaningmechanism used and characteristics of the fly ash [6]. Ash that accumulateson the bags in excess of the desired residual dust cake must be removed byperiodic bag cleaning to reduce the gas flow resistance (and, hence, induceddraft fan power requirements) and to reduce bag weight. In U.S. utility bag-houses, cleaning is done off-line by isolating individual compartments forcleaning.
Reverse-Gas Fabric Filters Reverse-gas fabric filters are generally the mostconservative design of the fabric filter types. They typically operate at lowA/C ratios ranging from 1.5 to 3.5 ft/min [6,68]. Fly ash collection occurs onthe inside of the bags, because the flue gas flow is from the inside of the bagsto the outside, as illustrated in Figure 6-20 [67]. Reverse-gas baghouses useoff-line cleaning, where compartments are isolated and cleaning air is passedfrom the outside of the bags into the inside, causing the bags to partiallycollapse and release the collected ash. The dislodged ash falls into the hopper.A variation of the reverse-gas cleaning method is the use of sonic energy forbag cleaning. With this method, low-frequency (<250–300 Hz), high-sound-pressure (0.3–0.6 inH2O) pneumatic horns are sounded simultaneously, andthe normal reverse-gas flow adds energy to the cleaning process. Reverse-gasfabric filters are widely used in the United States; approximately 90% of theutility baghouses employ this reverse-gas cleaning process [67].
Reverse Gas ValveOutlet Valve
PurgeAir Valve
Outlet Manifold
Clean FlueGas Outlet
PurgeGas
AshDisposalFilteringPurgingCleaning
(Reverse Gas)NullFiltering
Inlet Manifold Thimble
InletValve
Dirty FlueGas Inlet
Tubesheet
BypassValve
Reverse Gas
FIGURE 6-20. Schematic diagram of the compartments in a reverse-gas baghouseillustrating the flue gas and cleaning air flows during the various cycles of operation.(Source: Bustard, C. J. et al., Fabric Filters for the Electric Utility Industry, Vol. 1,General Concepts, Electric Power Research Institute, Palo Alto, CA, 1988.)
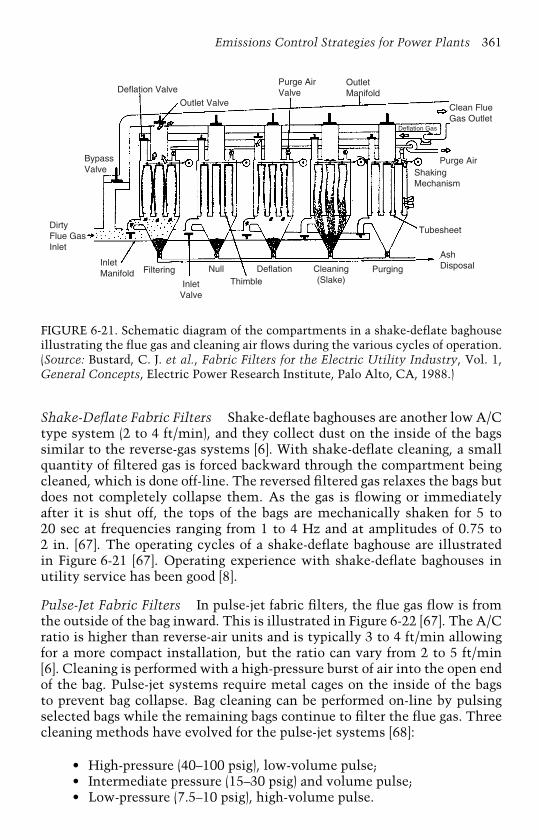
Emissions Control Strategies for Power Plants 361
Deflation Valve
Outlet Valve
Purge AirValve
OutletManifold
Deflation Gas
Clean FlueGas Outlet
Purge AirShakingMechanism
Tubesheet
AshDisposalPurgingDeflation
ThimbleNull
InletValve
FilteringInletManifold
DirtyFlue GasInlet
BypassValve
Cleaning(Slake)
FIGURE 6-21. Schematic diagram of the compartments in a shake-deflate baghouseillustrating the flue gas and cleaning air flows during the various cycles of operation.(Source: Bustard, C. J. et al., Fabric Filters for the Electric Utility Industry, Vol. 1,General Concepts, Electric Power Research Institute, Palo Alto, CA, 1988.)
Shake-Deflate Fabric Filters Shake-deflate baghouses are another low A/Ctype system (2 to 4 ft/min), and they collect dust on the inside of the bagssimilar to the reverse-gas systems [6]. With shake-deflate cleaning, a smallquantity of filtered gas is forced backward through the compartment beingcleaned, which is done off-line. The reversed filtered gas relaxes the bags butdoes not completely collapse them. As the gas is flowing or immediatelyafter it is shut off, the tops of the bags are mechanically shaken for 5 to20 sec at frequencies ranging from 1 to 4 Hz and at amplitudes of 0.75 to2 in. [67]. The operating cycles of a shake-deflate baghouse are illustratedin Figure 6-21 [67]. Operating experience with shake-deflate baghouses inutility service has been good [8].
Pulse-Jet Fabric Filters In pulse-jet fabric filters, the flue gas flow is fromthe outside of the bag inward. This is illustrated in Figure 6-22 [67]. The A/Cratio is higher than reverse-air units and is typically 3 to 4 ft/min allowingfor a more compact installation, but the ratio can vary from 2 to 5 ft/min[6]. Cleaning is performed with a high-pressure burst of air into the open endof the bag. Pulse-jet systems require metal cages on the inside of the bagsto prevent bag collapse. Bag cleaning can be performed on-line by pulsingselected bags while the remaining bags continue to filter the flue gas. Threecleaning methods have evolved for the pulse-jet systems [68]:
• High-pressure (40–100 psig), low-volume pulse;• Intermediate pressure (15–30 psig) and volume pulse;• Low-pressure (7.5–10 psig), high-volume pulse.

362 Coal Energy Systems
Outlet Valve
CellPlate
BypassValve
DirtyFlue GasInlet
Inlet Manifold
FilteringCage
Purging
InletValve
Pulse-JetCleaning
Filtering
AshDisposal
Compressed AirManifold
Pulse-JetAir Supply
Clean FlueGas Outlet
Compressoror Blower
OutletManifold
FIGURE 6-22. Schematic diagram of the compartments in a pulse-jet baghouse illus-trating the flue gas and cleaning air flows during the various cycles of operation.(Source: Bustard, C. J. et al., Fabric Filters for the Electric Utility Industry, Vol. 1,General Concepts, Electric Power Research Institute, Palo Alto, CA, 1988.)
The first method is used mainly in the United States, while the lattertwo methods are used primarily in larger boilers in Australia, Canada, andWestern Europe [68].
Pulse-jet cleaning results in lower resistance to gas flow than the othertwo baghouse types, thus allowing smaller baghouses to filter the same vol-ume of flue gas. Despite this, pulse-jet cleaning is not the preferred choicein the United States for utility boilers because of concerns that the more rig-orous cleaning method results in lower particulate collection efficiency andshorter bag life. Pulse-jet baghouses are used in the United States, as well asJapan, for industrial boilers [68]. In Canada and Europe, pulse-jet systems areused in industrial plants and some large-sized utility plants. Much work hasbeen done on improving fabrics for the filters, and the pulse-jet technologyis becoming more attractive to utilities.
Fabric Filter Characteristics Fabric filters are made from woven, felted,and knitted materials with filter weights that generally range from as low as5 oz/yd2 to as high as 25 oz/yd2 [6]. Filtration media are selected dependingon the type of baghouse, their efficiency in capturing particles, system oper-ating temperature, physical and chemical nature of the fly ash and flue gas,durability for a long bag life, and the cost of the fabric. Tables 6-9 and 6-10provide some general data of the most commonly used fabrics and the criteriato select them, respectively [57]. Currently, there is a tendency toward using
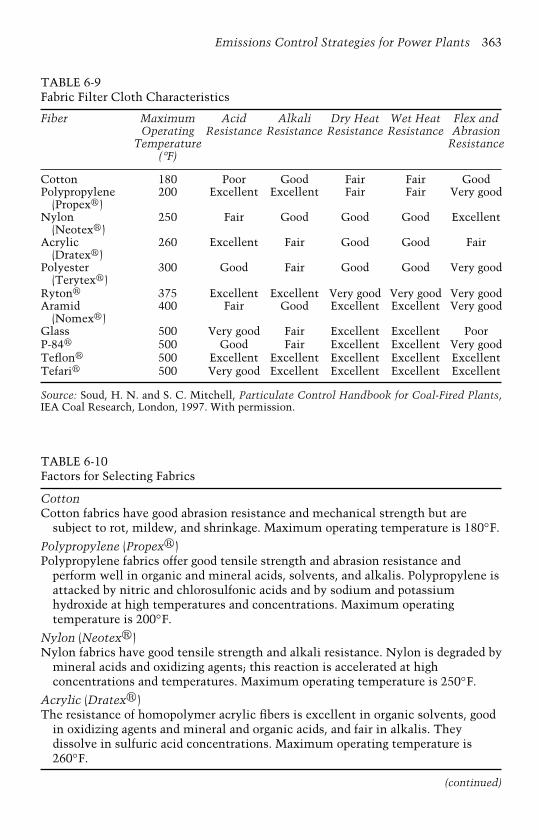
Emissions Control Strategies for Power Plants 363
TABLE 6-9Fabric Filter Cloth Characteristics
Fiber Maximum Acid Alkali Dry Heat Wet Heat Flex andOperating Resistance Resistance Resistance Resistance Abrasion
Temperature Resistance(∞F)
Cotton 180 Poor Good Fair Fair GoodPolypropylene
(Propex�)200 Excellent Excellent Fair Fair Very good
Nylon(Neotex�)
250 Fair Good Good Good Excellent
Acrylic(Dratex�)
260 Excellent Fair Good Good Fair
Polyester(Terytex�)
300 Good Fair Good Good Very good
Ryton� 375 Excellent Excellent Very good Very good Very goodAramid
(Nomex�)400 Fair Good Excellent Excellent Very good
Glass 500 Very good Fair Excellent Excellent PoorP-84� 500 Good Fair Excellent Excellent Very goodTeflon� 500 Excellent Excellent Excellent Excellent ExcellentTefari� 500 Very good Excellent Excellent Excellent Excellent
Source: Soud, H. N. and S. C. Mitchell, Particulate Control Handbook for Coal-Fired Plants,IEA Coal Research, London, 1997. With permission.
TABLE 6-10Factors for Selecting Fabrics
CottonCotton fabrics have good abrasion resistance and mechanical strength but are
subject to rot, mildew, and shrinkage. Maximum operating temperature is 180◦F.
Polypropylene (Propex�)Polypropylene fabrics offer good tensile strength and abrasion resistance and
perform well in organic and mineral acids, solvents, and alkalis. Polypropylene isattacked by nitric and chlorosulfonic acids and by sodium and potassiumhydroxide at high temperatures and concentrations. Maximum operatingtemperature is 200◦F.
Nylon (Neotex�)Nylon fabrics have good tensile strength and alkali resistance. Nylon is degraded by
mineral acids and oxidizing agents; this reaction is accelerated at highconcentrations and temperatures. Maximum operating temperature is 250◦F.
Acrylic (Dratex�)The resistance of homopolymer acrylic fibers is excellent in organic solvents, good
in oxidizing agents and mineral and organic acids, and fair in alkalis. Theydissolve in sulfuric acid concentrations. Maximum operating temperature is260◦F.
(continued)
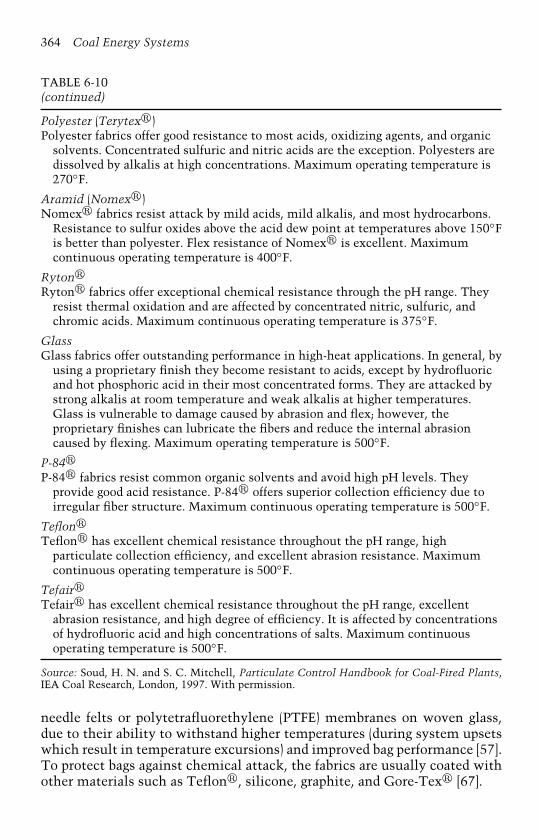
364 Coal Energy Systems
TABLE 6-10(continued)
Polyester (Terytex�)Polyester fabrics offer good resistance to most acids, oxidizing agents, and organic
solvents. Concentrated sulfuric and nitric acids are the exception. Polyesters aredissolved by alkalis at high concentrations. Maximum operating temperature is270◦F.
Aramid (Nomex�)Nomex� fabrics resist attack by mild acids, mild alkalis, and most hydrocarbons.
Resistance to sulfur oxides above the acid dew point at temperatures above 150◦Fis better than polyester. Flex resistance of Nomex� is excellent. Maximumcontinuous operating temperature is 400◦F.
Ryton�Ryton� fabrics offer exceptional chemical resistance through the pH range. They
resist thermal oxidation and are affected by concentrated nitric, sulfuric, andchromic acids. Maximum continuous operating temperature is 375◦F.
GlassGlass fabrics offer outstanding performance in high-heat applications. In general, by
using a proprietary finish they become resistant to acids, except by hydrofluoricand hot phosphoric acid in their most concentrated forms. They are attacked bystrong alkalis at room temperature and weak alkalis at higher temperatures.Glass is vulnerable to damage caused by abrasion and flex; however, theproprietary finishes can lubricate the fibers and reduce the internal abrasioncaused by flexing. Maximum operating temperature is 500◦F.
P-84�P-84� fabrics resist common organic solvents and avoid high pH levels. They
provide good acid resistance. P-84� offers superior collection efficiency due toirregular fiber structure. Maximum continuous operating temperature is 500◦F.
Teflon�Teflon� has excellent chemical resistance throughout the pH range, high
particulate collection efficiency, and excellent abrasion resistance. Maximumcontinuous operating temperature is 500◦F.
Tefair�Tefair� has excellent chemical resistance throughout the pH range, excellent
abrasion resistance, and high degree of efficiency. It is affected by concentrationsof hydrofluoric acid and high concentrations of salts. Maximum continuousoperating temperature is 500◦F.
Source: Soud, H. N. and S. C. Mitchell, Particulate Control Handbook for Coal-Fired Plants,IEA Coal Research, London, 1997. With permission.
needle felts or polytetrafluorethylene (PTFE) membranes on woven glass,due to their ability to withstand higher temperatures (during system upsetswhich result in temperature excursions) and improved bag performance [57].To protect bags against chemical attack, the fabrics are usually coated withother materials such as Teflon�, silicone, graphite, and Gore-Tex� [67].

Emissions Control Strategies for Power Plants 365
Bags generally fall into two size categories: 30 to 36 ft in length by 1 ftin diameter or 20 to 22 ft in length by 8 in. in diameter [67]. Bag fabricsare constructed using combinations of texturized and untexturized yarns.Texturized yarns contain many broken filaments and are used to create fabricsurfaces with properties suitable for retaining residual dust cakes to yieldhigh collection efficiencies without excessive pressure drops. Smooth yarnsare made of continuous, unbroken filaments and are stronger than texturizedyarns.
Factors that Affect Baghouse Performance Key factors in proper baghousedesign and operation are flue gas flow and properties, fly ash characteris-tics, and coal composition [8]. The baghouse must minimize pressure drop,maintain appropriate temperature and velocity profiles, and distribute theash-laden flue gas evenly to the individual compartments and bags.
Particle size distribution of the fly ash and loading of the flue gasvaries with type of combustion system [57]. Stoker-fired units produce ashwith high carbon content, moderate loading, and large particle size distribu-tion (compared to other combustion systems). Pulverized coal-fired systemsproduce ash with low carbon content, high loading, and fine particle sizedistribution. Cyclone-fired units produce ash with low carbon content, mod-erate loadings, and very fine particle size distribution. Fluidized-bed systemsgenerally produce ash with high carbon content, high loading, and fineparticle size distribution [8].
The sulfur content of the coal has been correlated to fabric filter opera-tion. The cohesiveness of ash produced from high-sulfur coals is greater thanfrom Western low-sulfur coals [8]. Also, maintaining the baghouse abovethe acid dew point is critical in high-sulfur coal applications. The fly ashproperties are important because they affect the adhesion and cohesion char-acteristics of the dust cake which, in turn, affect the properties of the residualdust cake, collection efficiency, and cleanability of the bags.
Methods to Enhance Filter Performance The most recognized method toenhance fabric filter performance is the application of sonic energy, whichwas discussed previously. Virtually all reverse-gas baghouses have includedsonic horns [8]. Gas conditioning has been explored for improving filter per-formance, although this technique is not performed commercially [8]. Lowconcentrations of ammonia and/or sulfur trioxide have been added in testprograms to control fine particulate emissions and reduce pressure drop whenfiring low-rank fuels.
Hybrid SystemsAlthough the discussions of technologies in this chapter have mainly focusedon commercial systems, this section briefly discusses two concepts that areunder development for improving particulate capture. They are considered

366 Coal Energy Systems
here because these technologies are expected to become commercial in thevery near future, especially as particulate emissions become more stringent.Hybrid systems have been under development for over 10 years, as utilitiesare required to meet increasingly tighter emissions regulations for particu-late matter as well as sulfur dioxide. Fly ash resistivity and dust loadingsare affected by switching to low sulfur coals or injecting sorbents for sul-fur dioxide control, which in turn can reduce ESP efficiency. The desire toreduce fine particulate emissions is also leading to innovative technologies.Two such systems, the compact hybrid particulate collector (COHPAC) andthe advanced hybrid particulate collector (AHPC) have been developed toaddress these issues.
Compact Hybrid Particulate Collector The COHPAC, developed by theEPRI, involves the installation of a pulse-jet baghouse downstream of theESP or retrofitted into the last field of an ESP [69,70]. Because the pulse-jetcollector is operating as a polisher for achieving lower particulate emissions,the low dust loading to the baghouse allows the filter to be operated at higherA/C ratios (8 to 20 ft/min) without increasing the pressure drop. This systemallows for the ability to retrofit existing units and achieve high efficienciesat relatively low cost. The COHPAC technology has been demonstratedat the utility scale, including full-scale operation at Alabama Power’s E.C.Gaston Station (272 MW) and TU Electric’s Big Brown Plants (two units,each 575 MW) [69,71]. Results from COHPAC operation have been positive.For example, at E.C. Gaston Station, the COHPAC has been operated withboth on-line cleaning and long filter bags (i.e., 23 feet) at filtration rates of8.5 ft/min while providing low outlet emissions levels (<0.01 lb/MM Btu)and reduced pressure drops, even with occasional high inlet dust loadings.COHPAC is a promising technology for polishing particulate emissions andis expected to help utilities meet the more stringent particulate emissionsstandards.
Advanced Hybrid Particulate Collector Another hybrid system underdevelopment is the advanced hybrid particulate collector (AHPC). Thistechnology, developed by the University of North Dakota Energy and Envi-ronmental Research Center (EERC) and being demonstrated by EERC, DOE,W. L. Gore & Associates, and Otter Tail Power Company, is unique because,instead of placing the ESP and fabric filter in series, the filter bags are placeddirectly between ESP collection plates [72]. A schematic diagram of theAHPC is shown in Figure 6-23 [73]. The collection plates are perforated with45% open area to allow dust to reach the bags; however, because the par-ticles become charged before they pass through the plates, over 90% of theparticulate mass is collected on the plates before it ever reaches the bags[74]. The low dust loading to the bags allows them to be operated at a highfiltration velocity (i.e., smaller device as 65 to 75% fewer bags are needed)

Emissions Control Strategies for Power Plants 367
PerforatedPlate Grid
Outside SolidCollection Plate
Inlet
FilterBags
DischargeElectrode
FIGURE 6-23. Schematic diagram of the Advanced Hybrid Particulate Collector.(From DOE, Advanced Hybrid Particulate Collector Fact Sheet, Office of FossilEnergy, U.S. Department of Energy, Washington, D.C., 2001.)
and to be cleaned without the normal concern for dust re-entrainment [75].When pulses of air are used to clean the filter bag, the dislodged particlesare injected into the ESP fields where they have another opportunity to becollected on the plates. Because these bags will not need to be cleaned asoften as in typical baghouse operation, they are expected to have excellentperformance over a long operating life, thereby leading to lower operatingcosts.
Particulate capture efficiencies of greater than 99.99% have beenachieved in a 2.5 MW slipstream demonstration [76]. The AHPC technologyis expected to increase fine particulate (PM2.5) collection efficiency by one ortwo orders of magnitude (i.e., 99.99 to 99.999%) [76]. A 450 MW demonstra-tion is currently being conducted in the Big Stone cyclone-fired power plant,operated by Otter Tail Power Company and co-owned by Montana-DakotaUtilities, Northwestern Public Service, and Otter Tail Power Company, andburning coal from Wyoming’s Powder River Basin.
Economics of Particulate Matter ControlAs with other pollution control technology costs, the costs for particulatecontrol systems are site specific and vary from country to country. They areinfluenced by the required emission limit and type of coal. This section sum-marizes the costs for ESPs, fabric filters, and hybrid systems using publisheddata.
Electrostatic Precipitators The capital costs for a new ESP are between $40and $60 kW, with the higher costs being associated with higher collectionefficiencies [16]. Because most coal-fired power plants are already fitted with
368 Coal Energy Systems
ESPs, much of the published data relate to costs for upgrading existing ESPs.ESP rebuilds are less costly today due to greater market competition, theemergence of new construction techniques, and the use of wide plate spac-ing requiring less collecting plates. Wide plate spacing is one of the mosteconomic and effective approaches to replacing internals. The cost benefitsresult from the need for fewer internal elements and materials, erection sav-ings due to reuse of part of the original casing, and weight-savings effectson the existing support structures and foundations [16]. Costs for upgradingESPs have been estimated at about $12/kW per field for a 500 MW unit, withthe increased operating costs estimated to be $100,000 per year [16].
Flue gas conditioning has proved to be more cost effective than addingnew fields. With difficult-to-collect fly ashes, conditioning allows operationwithout adding new fields. The reduction in ESP size with conditioning alsolowers the operating costs because fewer fields and hoppers are used, thusdecreasing the number of heaters and consequently the power consumptionrequired [16]. A native SO3 conditioning system for a 500 MW power plantrequires a capital cost of $4.50/kW. Adding an anhydrous ammonia condi-tioning system to an existing SO3 system would cost about $1/kW for a50 MW unit, with the operating costs increasing by $50,000/year [16].
Staehle et al. [64] performed an economic analysis for using WESPs forSO3 control at three different levels of control: 50, 80, and 95%. The capitalcosts for the three levels of control were $10, $15, and $20/kW, respectively.The total operating costs, based on 8000 hours of operation per year, were$120,000, $160,000, and $200,000 per year, respectively.
Fabric Filters Fabric filters are reported to cost between $50 and $70/kW[16]. Reverse-gas baghouses have higher capital and operating costs thanpulse-jet baghouses because reverse-gas baghouses operate at a lower A/Cratio. Fabric filters are generally more expensive than ESPs for collectionefficiencies up to 99.5%; however, baghouses become more cost effectivefor higher collection efficiencies. In addition, high resistivity fly ashes needto be upgraded to achieve high collection efficiencies, and baghouses haveeconomic advantages over ESPs for fly ash resistivity greater than 1013 to1014 ohm-cm. Operating costs for baghouses are also higher than ESPs dueto bag replacement and auxiliary power requirements.
Hybrid Systems A cost analysis that was performed for a COHPAC thatuses a pulse-jet bag filter following an ESP estimated that the capital costshave varied from $57 to $70/kW and operating costs from $320,000 to$570,000 per year, both depending on the unit size [16]. The analysis was per-formed for upgrading ESPs at a few coal-fired units ranging in size from 150 to300 MW. Less information is available for the AHPC because it is in the earlystages of commercialization. According to Gebert et al. [72], retrofit or ESPconversion jobs have been quoted in North America and Europe comparing

Emissions Control Strategies for Power Plants 369
the AHPC to a COHPAC design; in those cases where the ESP was old andrequired significant upgrades for the hybrid filter system to function well,the AHPC had the economic advantage. For example, the 450 MW Big Stonepower plant conversion has a project cost for the overall filter system of$25/kW. Gebert et al. [72] anticipate that these costs will decline further asmore systems are built and the design is further refined and optimized.
Pollutants with Pending Compliance Regulation
As discussed in Chapter 4 (Coal-Fired Emissions and Legislative Action in theUnited States), controls for mercury emissions will be in place by the end of2007. A rule was proposed in December 2003 that will be finalized by Decem-ber 2004, with initial compliance required by the end of 2007. In antici-pation of the regulation, which has been expected by the industry since 1999when the EPA initiated the mercury Information Collection Request (ICR;see Chapter 4 for a discussion of the ICR), a number of companies, govern-ment agencies, and institutions have been working on developing mercurycontrol technologies while others have been working on developing moni-toring instruments. This section discusses some of the leading options formercury control. This section is not inclusive, as many technologies arebeing investigated at the bench- and pilot-scale; however, it does discussseveral of the options closest to commercialization.
MercuryMercury exists in trace amounts in fossil fuels, vegetation, crustal material,and waste products [77]. Mercury vapor can be released to the atmospherethrough combustion or natural processes where it can drift for a year ormore, spreading over the globe. It has been estimated that 5500 short tons ofmercury were emitted globally in 1995 from both natural and anthropogenicsources, with coal-fired power plants in the United States contributing about48 short tons, or <1% of the total [77]. The complexity of the mercury con-trol issue is illustrated in a simple example from the DOE: If the HoustonAstrodome were filled with ping-pong balls representing the quantity of fluegas emitted from coal-fired power plants in the United States each year,30,000,000,000 ping-pong balls would be required. Mercury emissions wouldbe represented by 30 colored ping-pong balls, and the challenge by industryis to remove 21 of the 30 colored balls (for 70% compliance) from amongthe 30,000,000,000 balls. Technologies under development or being demon-strated that involve the removal of mercury from flue gas include sorbentinjection, particulate collection systems, catalysts, or chemical additives topromote the oxidation of elemental mercury and facilitate its capture in par-ticulate and sulfur dioxide control systems, as well as fixed structures in fluegas ducts that adsorb mercury.
370 Coal Energy Systems
Mercury in U.S. CoalOver 40,000 fuel samples were analyzed as part of the ICR, and a summaryof the ICR coal data, by point of origin for six regions and correspondingcoal rank, is provided in Table 6-11 [78]. Appalachian bituminous coal andWestern subbituminous coal accounted for ∼75% of U.S. coal productionin 1999 and over 80% of the mercury entering coal-fired power plants. Thecomposition of these coals is quite different, which can affect their mercuryemissions. Appalachian coals typically have high mercury, chlorine, andsulfur contents and low calcium content, resulting in a high percentage ofoxidized mercury (i.e., Hg2+); in contrast, Western subbituminous coals typ-ically have low concentrations of mercury, chlorine, and sulfur contents andhigh calcium content, resulting in a high percentage of elemental mercury(i.e., Hg◦).
Emissions from Existing Control Technologies fromCoal-Fired Power PlantsEstimates for mercury emissions from coal-fired power plants with variouscontrol technologies, based on the 1999 ICR data, are given in Table 6-12 [78].These data show that mercury emissions were estimated to be ∼49 short tonsin 1999. This estimate is based on 84 units tested in the third phase of theICR (out of more than 1100 units in the United States); a question of biashas been raised based on the number of samples from Eastern versus West-ern coal-fired boilers, so the various estimates of mercury emissions rangefrom 40 to 52 short tons/year [78]. The ICR data indicate that the speciationof mercury exiting the stack of the boilers is primarily gas-phase oxidized(43%) or elemental (54%) mercury, with some particulate-bound (3%) mer-cury present [77]. Table 6-12 provides information on the influence of variousexisting air pollution control devices (APCDs) on mercury removal; how-ever, mercury capture across the APCDs can vary significantly based on coalproperties, fly ash properties (including unburned carbon), specific APCDconfigurations, and other factors [77]. Mercury removals across cold-sideESPs averaged 27%, compared to 4% for hot-side ESPs [78]. Removals forfabric filters were higher, averaging 58% due to additional gas–solid contacttime for oxidation. Both wet and dry FGD systems removed 80 to 90% ofthe gaseous oxidized mercury, but elemental mercury was not affected. Highmercury removals (i.e., 86%) in fluidized-bed combustors with fabric filterswere attributed to mercury capture on high carbon content fly ash.
Pavlish et al. [78] provide an in-depth review of mercury emissions fromexisting control technologies, but the differences by coal rank are among themost significant findings of the ICR; specifically, units burning subbitumi-nous coal and lignite frequently demonstrate worse mercury capture. Forexample, removal across a cold-side ESP averaged 35% for bituminous coalcompared to 10% for low-rank coal. This is further illustrated in Figure 6-24,which shows the range of removal efficiencies across cold-side ESPs for
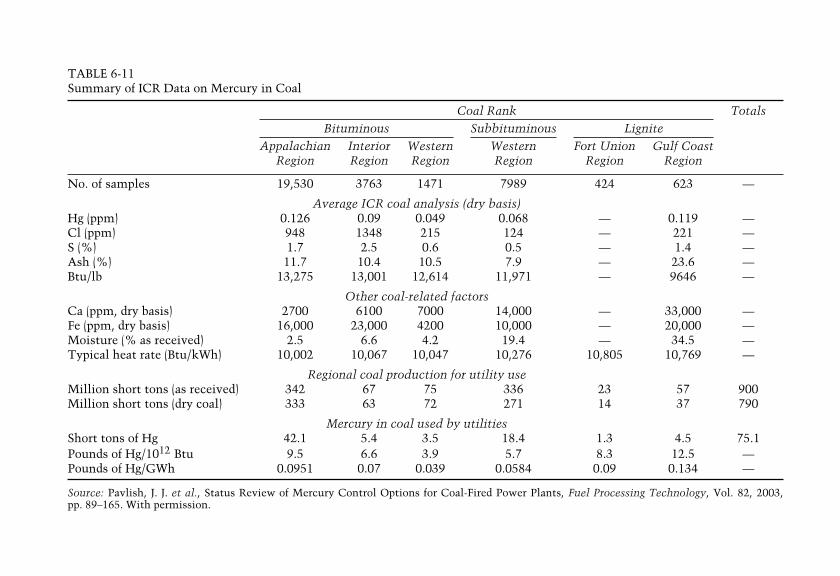
TABLE 6-11Summary of ICR Data on Mercury in Coal
Coal Rank TotalsBituminous Subbituminous Lignite
Appalachian Interior Western Western Fort Union Gulf CoastRegion Region Region Region Region Region
No. of samples 19,530 3763 1471 7989 424 623 —
Average ICR coal analysis (dry basis)Hg (ppm) 0.126 0.09 0.049 0.068 — 0.119 —Cl (ppm) 948 1348 215 124 — 221 —S (%) 1.7 2.5 0.6 0.5 — 1.4 —Ash (%) 11.7 10.4 10.5 7.9 — 23.6 —Btu/lb 13,275 13,001 12,614 11,971 — 9646 —
Other coal-related factorsCa (ppm, dry basis) 2700 6100 7000 14,000 — 33,000 —Fe (ppm, dry basis) 16,000 23,000 4200 10,000 — 20,000 —Moisture (% as received) 2.5 6.6 4.2 19.4 — 34.5 —Typical heat rate (Btu/kWh) 10,002 10,067 10,047 10,276 10,805 10,769 —
Regional coal production for utility useMillion short tons (as received) 342 67 75 336 23 57 900Million short tons (dry coal) 333 63 72 271 14 37 790
Mercury in coal used by utilitiesShort tons of Hg 42.1 5.4 3.5 18.4 1.3 4.5 75.1Pounds of Hg/1012 Btu 9.5 6.6 3.9 5.7 8.3 12.5 —Pounds of Hg/GWh 0.0951 0.07 0.039 0.0584 0.09 0.134 —
Source: Pavlish, J. J. et al., Status Review of Mercury Control Options for Coal-Fired Power Plants, Fuel Processing Technology, Vol. 82, 2003,pp. 89–165. With permission.
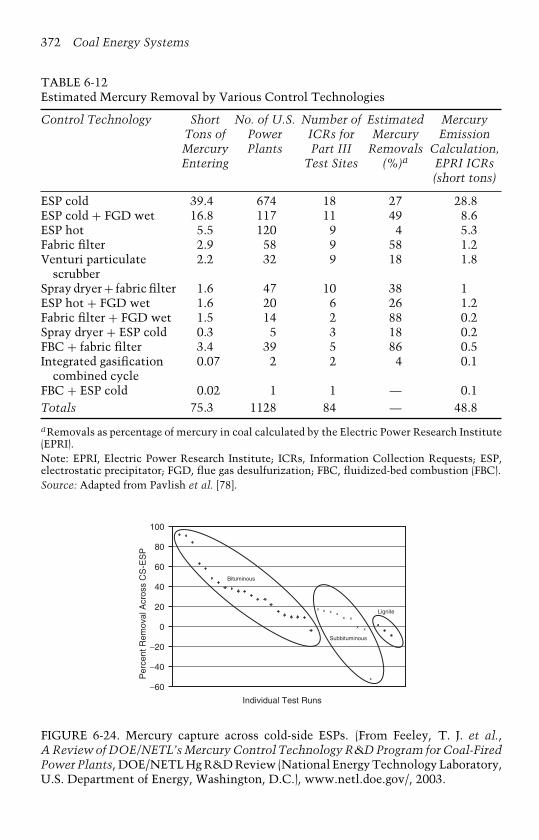
372 Coal Energy Systems
TABLE 6-12Estimated Mercury Removal by Various Control Technologies
Control Technology Short No. of U.S. Number of Estimated MercuryTons of Power ICRs for Mercury EmissionMercury Plants Part III Removals Calculation,Entering Test Sites (%)a EPRI ICRs
(short tons)
ESP cold 39.4 674 18 27 28.8ESP cold + FGD wet 16.8 117 11 49 8.6ESP hot 5.5 120 9 4 5.3Fabric filter 2.9 58 9 58 1.2Venturi particulate
scrubber2.2 32 9 18 1.8
Spray dryer + fabric filter 1.6 47 10 38 1ESP hot + FGD wet 1.6 20 6 26 1.2Fabric filter + FGD wet 1.5 14 2 88 0.2Spray dryer + ESP cold 0.3 5 3 18 0.2FBC + fabric filter 3.4 39 5 86 0.5Integrated gasification
combined cycle0.07 2 2 4 0.1
FBC + ESP cold 0.02 1 1 — 0.1Totals 75.3 1128 84 — 48.8
aRemovals as percentage of mercury in coal calculated by the Electric Power Research Institute(EPRI).Note: EPRI, Electric Power Research Institute; ICRs, Information Collection Requests; ESP,electrostatic precipitator; FGD, flue gas desulfurization; FBC, fluidized-bed combustion (FBC).Source: Adapted from Pavlish et al. [78].
100
80
60
40
20
0
−20
−40
−60
Bituminous
Subbituminous
Lignite
Individual Test Runs
x x x xx x
x x
xPer
cent
Rem
oval
Acr
oss
CS
-ES
P
FIGURE 6-24. Mercury capture across cold-side ESPs. (From Feeley, T. J. et al.,A Review of DOE/NETL’s Mercury Control Technology R&D Program for Coal-FiredPower Plants, DOE/NETL Hg R&D Review (National Energy Technology Laboratory,U.S. Department of Energy, Washington, D.C.), www.netl.doe.gov/, 2003.
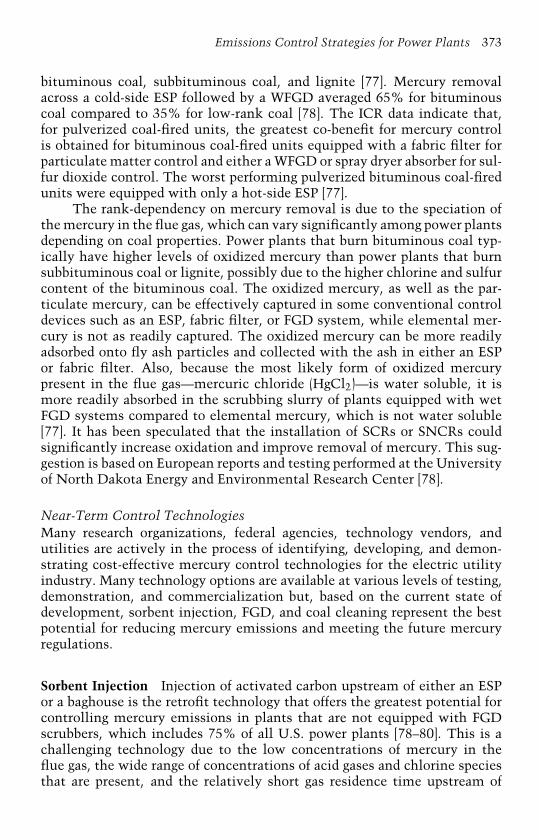
Emissions Control Strategies for Power Plants 373
bituminous coal, subbituminous coal, and lignite [77]. Mercury removalacross a cold-side ESP followed by a WFGD averaged 65% for bituminouscoal compared to 35% for low-rank coal [78]. The ICR data indicate that,for pulverized coal-fired units, the greatest co-benefit for mercury controlis obtained for bituminous coal-fired units equipped with a fabric filter forparticulate matter control and either a WFGD or spray dryer absorber for sul-fur dioxide control. The worst performing pulverized bituminous coal-firedunits were equipped with only a hot-side ESP [77].
The rank-dependency on mercury removal is due to the speciation ofthe mercury in the flue gas, which can vary significantly among power plantsdepending on coal properties. Power plants that burn bituminous coal typ-ically have higher levels of oxidized mercury than power plants that burnsubbituminous coal or lignite, possibly due to the higher chlorine and sulfurcontent of the bituminous coal. The oxidized mercury, as well as the par-ticulate mercury, can be effectively captured in some conventional controldevices such as an ESP, fabric filter, or FGD system, while elemental mer-cury is not as readily captured. The oxidized mercury can be more readilyadsorbed onto fly ash particles and collected with the ash in either an ESPor fabric filter. Also, because the most likely form of oxidized mercurypresent in the flue gas—mercuric chloride (HgCl2)—is water soluble, it ismore readily absorbed in the scrubbing slurry of plants equipped with wetFGD systems compared to elemental mercury, which is not water soluble[77]. It has been speculated that the installation of SCRs or SNCRs couldsignificantly increase oxidation and improve removal of mercury. This sug-gestion is based on European reports and testing performed at the Universityof North Dakota Energy and Environmental Research Center [78].
Near-Term Control TechnologiesMany research organizations, federal agencies, technology vendors, andutilities are actively in the process of identifying, developing, and demon-strating cost-effective mercury control technologies for the electric utilityindustry. Many technology options are available at various levels of testing,demonstration, and commercialization but, based on the current state ofdevelopment, sorbent injection, FGD, and coal cleaning represent the bestpotential for reducing mercury emissions and meeting the future mercuryregulations.
Sorbent Injection Injection of activated carbon upstream of either an ESPor a baghouse is the retrofit technology that offers the greatest potential forcontrolling mercury emissions in plants that are not equipped with FGDscrubbers, which includes 75% of all U.S. power plants [78–80]. This is achallenging technology due to the low concentrations of mercury in theflue gas, the wide range of concentrations of acid gases and chlorine speciesthat are present, and the relatively short gas residence time upstream of
374 Coal Energy Systems
the particulate control device. Contact time, though, can be increased byusing fabric filters. In addition, carbon injection upstream of a COHPACfabric filter offers one of the most efficient and cost-effective approachesfor reducing mercury emissions from coal-fired boilers. This combination ofactivated-carbon injection and COHPAC represents EPRI’s patented TOXE-CON process and has the additional benefit of minimizing the impact on flyash and its subsequent reuse because most of the fly ash is removed upstreamby the ESP [81].
Wet Flue Gas Desulfurization Wet FGD systems are currently installed onabout 25% of the electric-power-generating capacity in the United States.Although the primary function of wet scrubbers is to reduce sulfur dioxideemissions, bench- to large-scale testing has indicated that oxidized mer-cury (80–95%) can also be effectively captured in wet scrubbers. They arenot effective, though, in capturing elemental mercury, and there is evi-dence that a portion of the oxidized mercury can be reduced to elementalmercury within the wet FGD system and emitted from the stack [77]. Bitu-minous coal, which typically has high concentrations of oxidized mercury,has the potential for achieving high overall mercury reduction. Low-rankcoals also exhibit high capture of the oxidized mercury but because theconcentration of oxidized mercury is low, they have low overall mercuryreduction. Techniques to oxidize the vapor-phase elemental mercury priorto the wet scrubber are being aggressively studied. Also, methods to pre-vent the reduction of oxidized mercury to elemental mercury are also beinginvestigated.
Coal Cleaning Coal cleaning is an option for removing mercury from thecoal prior to utilization. Of the over 1 billion short tons of coal mined eachyear in the United States, about 600 to 650 million short tons are processedto some degree [82]. Coal cleaning removes pyritic sulfur and ash. Mercurytends to have a strong inorganic association (i.e., it is associated with thepyrite), especially for Eastern bituminous coals, but mercury removal effi-ciencies reported for physical coal cleaning vary considerably. Physical coalcleaning is effective in reducing the concentration of many trace elements,especially if they are present in the coal in relatively high concentrations.The degree of reduction achieved is coal specific, relating in part to the degreeof mineral association of the specific trace element and the degree of liber-ation of the trace element-bearing mineral. High levels of mercury removal(up to ∼80%) have been demonstrated with advanced cleaning techniquessuch as column flotation and selective agglomeration [83], while conven-tional cleaning methods, such as heavy media cyclone, combined water-onlycyclone/spiral concentrators, and froth flotation, have been shown to removeup to 62% of the mercury [84]. In both the conventional and advancedcleaning techniques, the results varied widely and were coal dependent.

Emissions Control Strategies for Power Plants 375
TABLE 6-13Estimates of Current and Projected Annualized Operating Cost for Mercury Emis-sions Control Technology
Coal ExistingControls
RetrofitControl
Current Cost(million$/kWh)
Projected Cost(million)$/kWhType S (% )
Bit 3 ESP cold + FGD PAC 0.727–1.197 0.436–0.718Bit 3 Fabric filter + FGD PAC 0.305–0.502 0.183–0.301Bit 3 ESP hot + FGD PAC + PFF 1.501–NA 0.901–NABit 0.6 ESP cold SC + PAC 1.017–1.793 0.610–1.076Bit 0.6 Fabric filter SC + PAC 0.427–0.753 0.256–0.452Bit 0.6 ESP hot SC + PAC + PFF 1.817–3.783 1.090–2.270Subbit 0.5 ESP cold SC + PAC 1.150–1.915 0.690–1.149Subbit 0.5 Fabric filter SC + PAC 0.423–1.120 0.254–0.672Subbit 0.5 ESP hot SC + PAC + PFF 1.419–2.723 0.851–1.634
Note: Bit, bituminous coal; Subbit, subbituminous coal; ESP, electrostatic precipitator; PAC,powdered activated carbon; PFF, polishing fabric filter; SC, spray cooling; NA, not available.Source: [85].
Cost Estimates to Control Mercury EmissionsCost estimates for mercury compliance are currently very approximate andvary from $5000 to $70,000 per pound of mercury removed, from 0.03 to0.8¢/kWh, and from $1.7 to $7 billion annually for the total national cost,depending on technical advances [78]. A breakdown of costs by various tech-nology options is provided in Table 6-13 [85]. The costs of cleaning Easternbituminous coals for mercury removal range from no additional cost (forcoals already washed for sulfur removal) to a cost of $33,000 per pound of mer-cury removed [86]. The costs for cleaning Powder River Basin subbituminouscoals are higher and approach $58,000 per pound of mercury removed [78];however, mercury reductions from washing methods currently being appliedare already built into the ICR mercury data for delivered coal; consequently,to realize a benefit from coal cleaning, higher levels of coal cleaning must beemployed. Advanced cleaning methods can remove additional mercury, butthey are generally not economical.
Potential Future Regulated Emissions
As discussed in Chapter 4, the increased CO2 concentration in the atmo-sphere from fossil fuel combustion is causing concerns for global warming.The capture and sequestration of CO2 from stationary combustion sourcesis considered an important option for the control of CO2 emissions. Cur-rently, however, there are no cost-effective technologies for coal-fired powerplants available. It is estimated that the costs for capture and separa-tion of CO2 from flue gas comprises ∼75% of the total costs of ocean or
376 Coal Energy Systems
geologic sequestration. Consequently, DOE has a carbon sequestration pro-gram that is aggressively exploring technologies for CO2 capture, as wellas the subsequent CO2 sequestration. The Carbon Sequestration Program,established in 1998, directly implements President Bush’s Global ClimateChange Initiative (announced on February 14, 2002), which has the goalof 18% reduction in greenhouse gas intensity of the United States by 2012[87]. By 2018, the goal is to develop to the point of commercial deployment,systems for direct capture and sequestration of greenhouse gas and criteriapollutant emissions from fossil fuel conversion processes that result in near-zero emissions. This section contains a brief overview of the technologiesbeing investigated for CO2 capture and sequestration in anticipation of futureCO2 emissions legislation. The status and types of technologies under devel-opment are continually updated by the DOE on their Carbon SequestrationProgram website (www.netl.doe.gov/coalpower/sequestration).
Carbon DioxideFor a given energy content, coal, being primarily carbon, produces the mostCO2; oil produces less and natural gas, which derives a significant amountof its energy content from the hydrogen component of methane, producesthe least. The EPA has published the following CO2 emissions factors forfossil fuel combustion: 207 lb/MM Btu for coal, 168 lb/MM Btu for oil, and117 lb/MM Btu for natural gas [88]. Also, lower rank coals, such as ligniteand low-sulfur subbituminous coal, which is commonly used to replace high-sulfur bituminous coal, produce more carbon dioxide per unit of heat than thehigher rank bituminous coal; consequently, average yearly emissions of CO2from electric utilities in the United States have been steadily increasing—from 206.7 to 208.2 lb of CO2 per MM Btu from 1980 to 1997—due toswitching from high-rank to low-rank coals [88].
Switching from a high-carbon fuel to a low-carbon fuel, such as fromcoal to natural gas, for electricity generation would greatly reduce CO2 emis-sions; however, this strategy is dependent upon abundant, affordable naturalgas. It is apparent that the United States does not have such a supply, asnatural gas availability and affordability have been extremely volatile, asevidenced by each fall/winter since 1999. Switching the U.S. electricity-generating capacity from coal to natural gas is not sound energy policy;hence, options for capturing and sequestering CO2 from coal-fired generatorsare being developed and are reviewed in the following sections.
Improving energy efficiency is considered a third method to reduce CO2emissions. A measure of efficiency of electricity generation is the heat rate,or the Btu consumed per kilowatt-hour (kWh) generated. A generating plantoperating at 33% efficiency would have a heat rate of 10,400 Btu/kWh. TheU.S. electric power industry has been on a trend toward increased efficiencysince 1949, but that trend has been very slight in the past two decades [88].Improving power plant efficiency is a major goal of not only the DOE but
Emissions Control Strategies for Power Plants 377
also industry, a topic that is discussed in more detail in Chapter 7 (FuturePower Generation).
CO2 CaptureIn general, CO2 can be separated, recovered, and purified from concentratedCO2 sources by chemical and physical methods such as absorption, adsorp-tion, or membrane separation. These separation and purification steps canproduce pure CO2 from power plant flue gas but they add considerable costto the CO2 conversion or sequestration system. Industrially, separationof CO2 is usually performed utilizing the amine absorption process withmonoethanol amine (MEA) [89]. The main reaction responsible for CO2chemical interaction with amine (i.e., chemical adsorption) is believed tobe the carbamate formation:
CO2 + 2R2NH ←→ R2NH+2 + R2NCOO− (6-89)
where R is an alkyl group. The Fluor Daniel Econamine FG CO2 Recoveryprocess that was developed by Dow Chemical is a widely used commer-cial process that uses an amine solution, containing a proprietary additive,to remove CO2 economically from low-pressure, oxygen-containing gasstreams similar to flue gas [90]. Some large-scale designs have been devel-oped for CO2 recovery from flue gas for use in CO2-enhanced oil recovery[91]. Activated carbons and carbon molecular sieves are readily availablecommercially, and many studies have been conducted on CO2 adsorptionusing such materials as well as other adsorbents such as zeolites, pillardclays, and metal oxides [15].
The DOE, through its Carbon Sequestration Program, is performingcost-shared CO2 capture research and development covering a wide rangeof technology areas, including amine adsorbents, carbon adsorbents, mem-branes, sodium and other metal-based sorbents, electrochemical pumps,hydrates, and mineral carbonation [92]. The objective is to dramaticallylower the capital cost and energy penalty associated with capturing diluteconcentrations of CO2 from large point sources such as power plants.Approximately one-third of the U.S. carbon emissions come from powerplants.
A strong synergistic link exists between improved efficiency of fos-sil fuel conversion systems and carbon capture; the cost of capture perunit of product is less for a more efficient process. For example, heat andpressure integration between CO2 capture and the other fossil fuel conver-sion systems can reduce parasitic steam and CO2 recompression load [92].Also, integrating CO2 capture with SO2/SO3, NOx , and mercury controlcan reduce or eliminate the need for scrubbers and other emissions controlsystems.
Advanced fuel conversion technologies such as gasification, oxygen(versus air) combustion, electrochemical cells, advanced steam reforming,
378 Coal Energy Systems
and chemical looping produce a CO2-rich exhaust stream that is readyfor transport, storage, and utilization. Advanced fuel technologies are dis-cussed in detail in Chapter 7. The CO2 capture technologies that arebeing pursued by the DOE are categorized as pre-combustion decarboniza-tion, oxygen-fired combustion, post-combustion capture, and advancedconversion processes [92].
Pre-Combustion Decarbonization Currently, 10 oxygen-fired gasifiers arein operation in the United States. Syngas from an oxygen-fired gasifier canbe shifted to provide a stream of primarily H2 and CO2 at 400 to 800 psig.Regenerable glycol solvents can capture CO2 and be regenerated to producepure CO2 at 15 to 25 psig. Supporting projects include [92]: (1) developinga high-temperature CO2-selective membrane that will be suited to inte-grated gasification combined-cycle (IGCC) power generation systems andwill enhance the efficiency of the water–gas shift reaction while recover-ing CO2 for sequestration; (2) developing a process that captures CO2 bycombining it with water at low temperature and high pressure, therebyforming CO2/water hydrates (ice-like macromolecular structures of CO2and water); (3) manufacturing a thermally-optimized membrane with bet-ter separation capabilities than current polymer members, with a focus onseparation of CO2, methane, and nitrogen gases in the range of 210 to 750◦F;and (4) developing engineering evaluations of technologies for the capture,use, and disposal of CO2 emphasizing IGCC power systems that produceboth merchant hydrogen and electricity but also investigating CO2 retrofitoptions for pulverized coal-fired boilers.
Oxygen-Fired Combustion Using oxygen instead of air during the combus-tion process produces a flue gas that is 90% pure CO2 and is already atlow pressure (10–15 psig); however, oxygen combustion requires three timesmore oxygen per kilowatt-hour of electricity generation than gasification.Currently, no oxygen-fired pulverized coal power plants are in commer-cial operation in the United States. Projects supporting this technologyarea include [92]: (1) designing a novel oxy-fuel boiler that incorporates amembrane to separate oxygen from the air, which is then used for com-bustion; (2) building on international work in advanced combustion inmixtures of oxygen and recycled flue gas; and (3) conducting tests of oxygen-enhanced combustion with the objective of lowering the cost of retrofitsystems.
Post-Combustion Capture Flue gas from the 300 GW of U.S. pulverizedcoal-fired boiler capacity contains 12 to 18% CO2. Currently, amine scrub-bing with CO2 compression to 1200 psig costs approximately $2000/kW andreduces the net power plant output by 12.5% [92]. Post-combustion capturesupporting projects include [92]: (1) developing a CO2 separation technology

Emissions Control Strategies for Power Plants 379
that uses a regenerable sodium-based sorbent to capture CO2 from flue gas;(2) developing cost-effective electrochemical devices for the separation (elec-trochemical pump) and detection (sensors) of CO2; (3) developing integratedcollaborative technologies to prove the feasibility of advanced CO2 sepa-ration and capture; (4) developing amine-enriched adsorbents prepared bychemical treatment of high surface area oxide materials with various aminecompounds; (5) developing simultaneous removal of CO2 and SO2 by ammo-nia solution to recover the CO2 by converting ammonium carbonate toammonium bicarbonate solution and recycle ammonia; (6) predicting theperformance of absorption/stripping of CO2 with aqueous K2CO3; (7) devel-oping an integrated modeling framework for evaluating alternative carbonsequestration technologies; (8) modifying the design of a tubular solid oxidefuel cell (SOFC) module to incorporate an afterburner stack of tubular oxy-gen transport membranes, thus oxidizing SOFC-depleted fuel in the anodeexhaust to CO2 that can then be easily separated; (9) developing viabletechnological solutions to safe and economic capture and storage of CO2underground; and (10) developing sorbents for CO2 separation and removalvia pressure (PSA) and/or temperature swing adsorption (TSA).
Work is also being performed on CO2 capture that is outside of theDOE’s Carbon Sequestration Program. One example is the development of ahigh-capacity, highly selective CO2 adsorbent based on a novel “molecularbasket” concept consisting of a mesoporous molecular sieve (MCM-41) andan immobilized branched-chain polymer (sterically branched polyethyen-imine) with CO2-capturing sites [93,94]. This adsorbent has progressed fromthe bench scale to pilot testing and, similar to the other projects summa-rized here, is undergoing further research and development to determine itscommercial feasibility.
Advanced Conversion Currently, only a limited number of promising ideashave emerged in this area, none of which is at the commercial or demon-stration phase. A supporting program in the DOE’s Carbon SequestrationProgram is the development of a method to use gasified coal or natural gasto reduce a metal oxide sorbent, thereby producing steam and high-pressureCO2 [92].
CO2 SequestrationAlthough sequestration is not considered a power plant emissions controltechnology, it is discussed in this chapter because sequestration is vital tothe overall power plant system in that options for disposal or use of thecaptured CO2 are necessary. Sequestration encompasses all forms of carbonstorage, including storage in terrestrial ecosystems, geologic formations, andperhaps oceans. Through the development of optimized field practices andtechnologies, the DOE’s Carbon Sequestration Program seeks to quantifyand improve the storage capacity of all potential reserves [92].
380 Coal Energy Systems
Geologic Sequestration There are several types of geologic formations inwhich CO2 can be stored, including depleting oil reservoirs, depleting gasreservoirs, unmineable coal seams, saline formations, shale formations withhigh organic content, and others. Many power plants are located near geo-logic formations that are amenable to CO2 storage. DOE supporting projectsinclude the following goals [92]:
• Assess the feasibility of co-optimization of CO2 sequestration andenhanced oil and gas recovery from oil reservoirs; currently, about32 million short tons of CO2 per year are injected into depleting oilreservoirs in the United States as part of enhanced oil operations,10% of which is from anthropogenic sources. Current practices arenot directed at optimizing CO2 storage, and a typical storage rate is2000 scf CO2 per barrel of oil recovered;
• Acquire technical information for assessing the effects of CO2–CH4–N2 mixing;
• Perform a demonstration of 4 million scf CO2 per day using exist-ing recovery technology to evaluate the viability of storing CO2in deep unmineable coal seams in the San Juan Basin in northwestNew Mexico/Southwestern Colorado;
• Demonstrate a coal bed methane production technology (i.e., slanthole) to drain natural gas from unmineable coal seams and injectCO2 in the wells;
• Quantify the CO2 storage potential of the Black Warrior coalbedmethane region in Alabama;
• Investigate the ability of coal to enhance coalbed methane produc-tion while sequestering CO2 by adsorption on the surface of variousUnited States coals;
• Study deep saline formation in the Colorado Plateau and RockyMountain region to determine volume, fate, and transport of storedCO2;
• Evaluate factors that affect chemical reactions that convert CO2 toa stable solid in underground saline formations;
• Explore the use of hydraulic fracturing to improve the permeabilityof saline formations, thereby lowering the cost of CO2 injection;
• Develop analytical tools to investigate the solution kinetics of CO2brines at temperatures and pressures appropriate for deep aquiferCO2 sequestration;
• Develop and apply the criteria for characterizing optimal salinereservoirs for very-long-term sequestration of CO2;
• Investigate the concept that Devonian shales, like coal, could serveas geologic sinks for CO2;
• Investigate the technical and economic viability of sequestrationof CO2 from point sources in Texas low-rank coals, as well as thepotential for enhanced coalbed gas recovery.
Emissions Control Strategies for Power Plants 381
Terrestrial Sequestration The United States has vast agricultural and for-est resources, and policymakers have looked to terrestrial sequestration asan option for reducing net greenhouse gas emissions. Currently, terrestrialuptake of CO2 offsets approximately one-third of global anthropogenic CO2emissions. The uptake from domestic terrestrial ecosystems is expected todecrease 13% over the next 20 years as Northeast forests mature. Oppor-tunities for enhanced terrestrial uptake include 1.5 million acres of landdamaged by past mining practices, 32 million acres of Conservation ResourceProtection (CRP) farmland, and 120 million acres of pastureland [92]. DOEsupporting projects have the following goals [92]:
• Restore sustainable forests on Appalachian mined lands by demon-strating terrestrial sequestration for wood products, renewableenergy, carbon storage, and other ecosystem services on three 30-to 40-hectare sites in West Virginia and Virginia;
• Enhance terrestrial carbon sinks through reclamation and reforesta-tion of abandoned mine lands in the Appalachian region;
• Use low compaction reclamation techniques to facilitate reforesta-tion using three 150- to 200-acre demonstrations;
• Determine the best way to increase carbon sequestration potential ofland previously disturbed by mining, highway construction, or poorland management practices;
• Demonstrate and assess the life-cycle costs of integrating electric-ity production with enhanced terrestrial carbon sequestration atcoal-mine spoil land at Tennessee Valley Authority’s 2558 MWbituminous coal-burning Paradise Station;
• Explore terrestrial sequestration opportunities in degraded and range-land in Southwestern United States.
Ocean Sequestration Oceans absorb, release, and store large amounts ofCO2 from the atmosphere. The two approaches to enhancing oceanic car-bon sequestration both take advantage of the ocean’s natural processes [92].One approach is to enhance the productivity of the ocean biological sys-tems through fertilization or other means. Another approach is to injectCO2 into the deep ocean. Compared to terrestrial ecosystems and geologicformations, the concept of ocean sequestration is in a much earlier stageof development. Experimental results and observed surges in phytoplank-ton growth after dust clouds pass over certain ocean regions indicate thatincreasing the concentration of iron and other macronutrients in certainocean waters can greatly increase the growth of phytoplankton and thusCO2 uptake [92]. Ocean fertilization remains highly controversial becauseof uncertainty surrounding other changes it may cause. The DOE is notsupporting any research projects in this area, although opportunities existin establishing the scientific knowledge base needed to understand, assess,and optimize ocean fertilization; develop effective macronutrient seeding

382 Coal Energy Systems
methodologies; and assess long-term CO2 fate and flux. Although no pilotor commercial applications of ocean injection have been performed, small-scale experiments have been conducted and the DOE is supporting projectsin their Carbon Sequestration Program, which include [92]:
• Collaborating in an international effort to understand two-phaseCO2 plumes;
• Providing logistical and technical support to the international col-laboration;
• Studying the feasibility of large-scale CO2 ocean sequestration;• Synthesizing CO2/water hydrates to study their physical properties;• Studying deep-ocean liquid CO2/water/calcium carbonate storage.
Multipollutant Control
The concept of controlling or removing more than one pollutant using a sin-gle control device has been of interest to the coal-fired industry for manyyears. Initially, technologies to simultaneously control NOx and SO2, par-ticulate matter and NOx , or all three pollutants were developed and testedat various scales in the DOE’s Clean Coal Technology program beginningin the late 1980s (see Chapter 7 for details of this program). Simultane-ous NOx and SO2 control was demonstrated using the SNOXTM, SNRBTM,and integrated dry NOx/SO2 emissions control systems [95]. Each of thesedemonstration projects involved a unique combination of control technolo-gies to achieve reduction of NOx and SO2 emissions. The SNOXTM processuses an SCR, catalytic SO2 converter (to SO3), and a wet-gas sulfuric acidtower for removing 93 to 94% and 95% of the NOx and SO2, respectively.The SNRBTM process combines the removal of SO2, NOx , and particulates inone unit, a high-temperature baghouse (fitted with a catalyst in the bag cagesfor NOx reduction) located between the economizer and the combustion airpreheater with a calcium- or sodium-based sorbent injected for SO2 control.It achieved 80%, 50 to 95%, and 99+% control of SO2, NOx , and partic-ulate matter, respectively. The integrated dry NOx/SO2 emissions controlsystem is comprised of low-NOx burners, overfire air, SNCR, and duct sor-bent injection and has achieved up to 80 and 70% reductions in NOx andSO2, respectively. These three technologies are potentially applicable to fluegas cleaning for all types of conventional coal-fired units, including stoker,cyclone, and pulverized coal-fired boilers. Capital costs for these three sys-tems are estimated at $305, $253, and $190/kW, respectively, for the SNOX,SNRB, and integrated dry NOx/SO2 emissions control systems. The operat-ing costs are estimated at $12.1 mills/kWh for the SNRB process, and theSNOX process generates a $6.1 mills/kWh credit [95]. No data are availablefor the integrated process.
Similarly, technologies to simultaneously remove NOx and particu-late matter have also been developed and tested. These technologies, which
Emissions Control Strategies for Power Plants 383
consisted of coating substrates such as ceramic membrane filters with SCRcatalysts, were initially being developed for high-pressure, high-temperatureatmospheres found in gasification systems. This work was applied underconventional pulverized coal-fired conditions to investigate simultaneousNOx and particulate removal [15,94,96]. The technology removed NOx andparticulate matter (at PM removal efficiencies greater than high-efficiencyP-84 polyimide bags) and had the added benefit of removing a significantamount of mercury, as 79% of the mercury was removed across a 6000-acfmceramic membrane filter system [96]. However, unacceptable pressure dropsacross the ceramic filters have not been resolved (i.e., fine particles embed-ded into the ceramic substrate), thus hindering the commercialization of thisprocess [97].
The interest in multipollutant control, or integrated emissions control,has intensified in the United States over the last several years primarily dueto impending multipollutant legislation such as the Clear Skies Act. Thepollutants of interest include SO2, NOx , mercury, SO3, and fine particu-late matter. The list of multipollutant technologies is long and continuesto grow; however, very few of the integrated emissions control technolo-gies have advanced to the point where reliable cost data are available,although several are beginning to generate this information through pilot-and demonstration-scale testing [98]. Similarly, Canada is evaluating multi-pollutant control for reducing SOx , NOx , particulate, and mercury emissionslevels comparable to those of a natural gas combined-cycle plant withSCR [99].
Several promising technologies are currently being tested, and a few ofthose are reviewed here. Several of these evaluations are cofunded by variousDOE programs, state agencies, and industry. Note that several of the tech-nologies discussed in previous sections are also considered multipollutantcontrol options.
ECO ProcessPowerspan Corporation has developed an integrated air pollution controltechnology that achieves major reductions in emissions of NOx (90%), SO2(98%), fine particulate matter (95%), and mercury (80–90%) from coal-firedpower plants; it has been tested in a 1-MW slipstream [100]. The patentedtechnology, Electro-Catalytic Oxidation (ECO), also reduces emissions ofair toxic compounds such as arsenic and lead as well as acid gases such ashydrochloric acid (HCl).
In commercial operation, the ECO process is to be installed down-stream of a power plant’s existing ESP or baghouse [100]. It treats the fluegas in three steps to achieve multipollutant removal. In the first processstep, a barrier discharge reactor oxidizes gaseous pollutants to higher oxides(i.e., nitric oxide to nitrogen dioxide, a portion of the sulfur dioxide to sulfuricacid, and mercury to mercuric oxide). Following the barrier discharge reactor

384 Coal Energy Systems
is the ammonia scrubber, which removes unconverted sulfur dioxide andnitrogen dioxide produced in the barrier discharge. A WESP follows the scrub-ber and it, along with the scrubber, captures acid aerosols produced by thedischarge reactor, fine particulate matter, and oxidized mercury. The WESPalso captures aerosols generated in the ammonia scrubber. Liquid effluentfrom the ammonia scrubber contains dissolved sulfate and nitrate salts, alongwith mercury and captured particulate matter. It is sent to a by-productrecovery system, which includes filtration to remove ash and activated car-bon adsorption for mercury removal. The treated by-product stream, free ofmercury and ash, can be processed to form ammonia sulfate/nitrate fertil-izer. Powerspan’s capital cost estimate is ∼$200/kW, including balance ofplant modifications [100]. The levelized operating and maintenance costs areestimated to be $2.0 to $2.5 mills/kWh.
Airborne ProcessAirborne Pollution Control, in cooperation with LG&E Energy Corporation,The Babcock & Wilcox Company, and USFilter HPD Systems, has devel-oped an emerging multipollutant, post-combustion control system [101].The technology combines the use of dry sodium bicarbonate injection cou-pled with enhanced wet sodium carbonate scrubbing to provide SOx , NOx ,mercury, and other heavy metal reductions. Although sodium bicarbonatescrubbing is well known as an effective flue gas cleanup process, commercialapplication has been prevented by the high cost of sodium bicarbonate, thelimited economic value of the scrubber product (i.e., sodium sulfate), and theeconomic and environmental issues associated with sodium sulfate disposal[98]. Airborne Pollution Control has developed a recycling process that willregenerate sodium sulfate back into sodium bicarbonate and a sulfate-basedfertilizer product that may eliminate the financial and disposal barriers.Testing has reached the 5-MW level.
LoTOx ProcessBritish Oxygen Corporation’s low-temperature oxidation process, LoTOx,was originally developed for NOx control but has shown multipollutantreduction capabilities, as well [98]. The LoTOx process injects ozone intothe flue gas at temperatures below 300◦F to react with NO and NO2 to formsoluble higher oxides that can be removed with a wet scrubber. NOx reduc-tion efficiencies greater than 90% have been achieved and, because the ozonealso oxidizes elemental mercury to soluble oxide species, mercury removal isalso possible, with reductions greater than 90% achieved in laboratory tests.Capital costs for LoTOx are estimated at $289/kW [98]. Levelized operatingand maintenance costs are estimated at $12.96 mills/kWh.

Emissions Control Strategies for Power Plants 385
Mobotec SystemsMobotec USA, Inc., is exploring furnace sorbent injection using limestoneor trona in combination with rotary opposed fire air (ROFA) and ROTAMIX(a second-generation SNCR and sorbent injection process) for SO2 and mer-cury removal. Mixing in the ROFA and ROTAMIX systems creates optimalconditions for achieving multipollutant reduction by providing ample turbu-lence and residence time within a specific temperature window [98]. Testswith trona and limestone have achieved reductions in SO2 of 69 and 64%,respectively; SO3, 90 and 90%; HCl, 0 and 75%; mercury, 89 and 67%; NOx ,4 and 11%; and particulate matter, 18 and 80% [102].
OthersCombining sorbent injection for mercury control with other technologies forNOx and/or SOx removal represents another multipollutant control option[98]. Many companies are exploring sorbent and chemical injection tech-niques that can remove mercury at reasonable costs, including SorbentTechnologies Corporation, ADA-Environmental Solutions, URS Corpora-tion, EPRI, and Alstom Power; universities such as the University of NorthDakota Energy and Environmental Research Center and Penn State Univer-sity; and federal agencies such as the DOE’s National Energy TechnologyLaboratory.
References
1. DOE, National Energy Technology Laboratory Accomplishments FY 2002(Office of Fossil Energy, U.S. Department of Energy, Washington, D.C.,August 2003).
2. DOE, Clean Coal Technology—Environmental Benefits of Clean Coal Tech-nologies, Topical Report No. 18 (U.S. Department of Energy, U.S. Govern-ment Printing Office, Washington, D.C., April 2001).
3. U.S. Energy Information Administration, Electric Power Annual 2000, Vol.II (Office of Coal, Nuclear, Electric, and Alternate Fuels, U.S. Departmentof Energy, U.S. Government Printing Office, Washington, D.C., November2002).
4. Soud, H. N., Developments in FGD (IEA Coal Research, London, 2000).5. Srivastava, R. K., C. Singer, and W. Jozewicz, SO2 Scrubbing Technologies:
A Review, in Proc. of the AWMA 2000 Annual Conference and Exhibition(Air and Waste Management Association, Pittsburgh, PA, 2000).
6. Wark, K., C. F. Warner, and W. T. Davis, Air Pollution: Its Origin and Control,Third ed. (Addison-Wesley Longman, Menlo Park, CA, 1998).
7. Davis, W. T. (editor), Air Pollution Engineering Manual, Second ed. (JohnWiley & Sons, New York, 2000).

386 Coal Energy Systems
8. Elliot, T. C. (editor), Standard Handbook of Powerplant Engineering(McGraw-Hill, New York, 1989).
9. U.S. Energy Information Agency, U.S. Coal Reserves: 1997 Update (U.S.Department of Energy, Office of Coal, Nuclear, Electric and Alternate Fuels,U.S. Government Printing Office, Washington, D.C., February 1999).
10. Harrison, C. D., Fuel Options to Mitigate Emissions Reduction Costs, in Proc.of the 28th International Technical Conference on Coal Utilization and FuelSystems (Coal & Slurry Technology Association, Washington, D.C., 2003).
11. Stultz, S. C. and J. B. Kitto (editors), Steam: Its Generation and Use, 40th ed.(Babcock & Wilcox Co., Barberton, OH, 1992).
12. Radcliffe, P. T., Economic Evaluation of Flue Gas Desulfurization Systems(Electric Power Research Institute, Palo Alto, CA, 1991).
13. Rhudy, R., M. McElroy, and G. Offen, Status of Calcium-Based Dry Sor-bent Injection SO2 Control, in Proc. of the Tenth Symposium on Flue GasDesulfurization, November 17–21, 1986, pp. 9-69–9-84.
14. Bland, V. V. and C. E. Martin, Full-Scale Demonstration of Additives for NO2Reduction with Dry Sodium Desulfurization, EPRI GS-6852 (Electric PowerResearch Institute, Palo Alto, CA, June 1990).
15. Miller, B. G., A. L. Boehman, P. Hatcher, H. Knicker, A. Krishnan et al.,The Development of Coal-Based Technologies for Department of DefenseFacilities: Phase II Final Report, DE-FC22-92PC92162, prepared for the U.S.Department of Energy Federal Energy Technology Center, Pittsburgh, PA,July 31, 2000, 784 pages.
16. Wu, Z. Air Pollution Control Costs for Coal-Fired Power Stations (IEA CoalResearch, London, 2001).
17. Smith, D. J., Cost of SO2 Scrubbers Down to $100/kW, Power Engineering,September 2001, pp. 63–68.
18. Blythe G., B. Horton, and R. Rhudy, EPRI FGD Operating and MaintenanceCost Survey, in Proc. of the EPRI–DOE–EPA Combined Utility Air PollutionControl Symposium: The MEGA Symposium, Vol. I, SO2 Controls, 1999,pp. 1-21–1-34.
19. EPA, EPA Acid Rain Program: 2001 Progress Report (Office of Air and Radi-ation, U.S. Environmental Protection Agency, U.S. Government PrintingOffice, Washington, D.C., November 2002).
20. EPA, Latest Findings on National Air Quality: 2002 Status and Trends (Officeof Air Quality Planning and Standards, U.S. Environmental Protection Agency,U.S. Government Printing Office, Washington, D.C., August 2003).
21. Mitchell, S. C., NOx in Pulverized Coal Combustion (IEA Coal Research,London, 1998).
22. Davidson, R. M., How Coal Properties Influence Emissions (IEA CoalResearch, London, 2000).
23. EPA, Technical Bulletin, Nitrogen Oxides (NOx): Why and How They AreControlled (Office of Air Quality Planning and Standards, U.S. Environmen-tal Protection Agency, U.S. Government Printing Office, Washington, D.C.,November 1999).
Emissions Control Strategies for Power Plants 387
24. Lawn, C. J. (editor), Principles of Combustion Engineering for Boilers(Academic Press, London, 1987).
25. Tsiou, C., H. Lin, S. Laux, and J. Grusha, Operating Results from FosterWheeler’s New Vortex Series Low-NOx Burners, in Proc. of Power Gen 2000,2000.
26. Steitz, T. H. and R. W. Cole, Field Experience in Over 30,000 MW of Wall-FiredLow NOx Installations, in Proc. of Power Gen 1996, 1996.
27. Steitz, T. H., J. Grusha, and R. Cole, Wall-Fired Low NOx Burner Evolutionfor Global NOx Compliance, in Proc. of the 23rd International TechnicalConference on Coal Utilization and Fuel Systems (Coal & Slurry TechnologyAssociation, Washington, D.C., 1998).
28. Patel, R. L., D. E. Thornock, R. W. Borio, B. G. Miller, and A. W. Scaroni,Firing Micronized Coal with a Low NOx RSFC Burner in an Industrial BoilerDesigned for Oil and Gas, in Proc. of the Thirteenth Annual InternationalPittsburgh Coal Conference, 1996.
29. Borio, R. W., R. L. Patel, D. E. Thornock, B. G. Miller, A. W. Scaroni, andJ. G. McGowan, Task 5—Final Report: One Thousand Hour DemonstrationTest in the Penn State Boiler, DE-AC22-91PC91160, prepared for the U.S.Department of Energy, Federal Energy Technology Center, Pittsburgh, PA,March 1998.
30. Wu, Z., NOx Control for Pulverized Coal Fired Power Stations (IEA CoalResearch, London, 2002).
31. U.S. Energy Information Administration, Net Generation by Energy Source:Electric Utilities, 1990 through July 2003 (U.S. Energy Information Agency,U.S. Department of Energy, Washington, D.C.), www.eia.doe.gov/cneaf/electricity/epm (released November 2003).
32. EPA, Control of NOx Emissions by Reburning (Office of Research and Devel-opment, U.S. Environmental Protection Agency, U.S. Government PrintingOffice, Washington, D.C., February 1996).
33. Wendt, J. O. L., C. V. Sternling, and M. A. Matovich, Reduction of SulfurTrioxide and Nitrogen Oxides by Secondary Fuel Injection, in Proc. of the14th Symposium (International) on Combustion (Combustion Institute,Pittsburgh, PA, 1973), pp. 897–904.
34. Myerson, A. L., F. R. Taylor, and B. G. Faunce, Ignition Limits and Productsof the Multistage Flames of Propane–Nitrogen Dioxide Mixtures, in Proc. ofthe 6th Symposium (International) on Combustion (Combustion Institute,Pittsburgh, PA, 1957), pp. 154–163.
35. Stoesssner, R. D. and E. Zawadzki, Coal Water Slurry Dual Firing Project forHomer City Station: Phase I Test Results, in Proc. of the 16th InternationalTechnical Conference on Coal Utilization and Fuel Systems (Coal & SlurryTechnology Association, Washington, D.C., 1991), pp. 599–608.
36. Falcone Miller, S., B. G. Miller, A. W. Scaroni, S. A. Britton, D. Clark,W. P. Kinneman, S. V. Pisupate, R. Poe, R. Wasco, and R. T. Wincek, Coal-Water Slurry Fuel Combustion Program (Pennsylvania Electric Company,Erie, PA, 1993), 98 pp.
388 Coal Energy Systems
37. Morrison, J. L., B. G. Miller, and A. W. Scaroni, Determining Coal Slurry-ability: A UCIG/Penn State Initiative, WO3852-06 (Electric Power ResearchInstitute, Palo Alto, CA, January 1998).
38. Ashworth, R. A. and T. M. Sommer, Economical Use of Coal Water SlurryFuels Produced from Impounded Coal Fines, in Proc. of Effects of Coal Qualityon Power Plants (Electric Power Research Institute, Palo, Alto, CA, 1997).
39. Falcone Miller, S., J. L. Morrison, and A. W. Scaroni, The Effect of CofiringCoal-Water Slurry Fuel Formulated from Waste Coal Fines with PulverizedCoal on NOx Emissions, in Proc. of the 21st International Technical Con-ference on Coal Utilization and Fuel Systems (Coal & Slurry TechnologyAssociation, Washington, D.C., 1996).
40. Miller, B. G., S. Falcone Miller, J. L. Morrison, and A. W. Scaroni, CofiringCoal-Water Slurry Fuel with Pulverized Coal as a NOx Reduction Strategy,in Proc. of the 14th International Pittsburgh Coal Conference, 1997.
41. Battista, J. J., personal communication, 1997.42. Tillman, D. A., NOx Reduction Achieved Through Biomass Cofiring, in Proc.
of the 20th Annual International Pittsburgh Coal Conference, September2003.
43. Tillman, D A., personal communication, November 2003.44. Tillman, D. A. and N. S. Harding, Fuels of Opportunity: Characteristics and
Uses in Combustion Systems (Elsevier, London, 2004).45. Tillman, D. A., B. G. Miller, and D. Johnson, Analyzing Opportunity Fuels
for Firing in Coal-Fired Boilers, in Proc. of the 20th Annual InternationalPittsburgh Coal Conference, September 2003.
46. Vasquez, E. R., H. Gadalla, K. McQuistan, F. Iman, and R. E. Sears, NOxControl in Coal-Fired Cyclone Boilers Using SmartBurn Combustion Tech-nology, in Proc. of the EPRI–DOE–EPA Combined Power Plant Air PollutionControl: The MEGA Symposium, 2003.
47. DOE, Clean Coal Technology—Control of Nitrogen Oxide Emissions: Selec-tive Catalytic Reduction (SCR), Topical Report No. 9 (U.S. Department ofEnergy, U.S. Government Printing Office, Washington, D.C., July 1997).
48. McIlvaine, R. W., H. Weiler, and W. Ellison, SCR Operating Experience ofGerman Powerplant Owners as Applied to Challenging U.S. High-Sulfur Ser-vice, in Proc. of the EPRI–DOE–EPA Combined Power Plant Air PollutionControl: The MEGA Symposium, 2003.
49. Cichanowicz, J. E., L. L. Smith, L. J. Muzio, and J. Marchetti, 100 GW of SCR:Installation Status and Implications of Operating Performance on Compli-ance Strategies, in Proc. of the EPRI–DOE–EPA Combined Power Plant AirPollution Control: The MEGA Symposium, 2003.
50. EPA, Performance of Selective Catalytic Reduction on Coal-Fired Steam Gen-erating Units (Office of Air and Radiation, U.S. Environmental ProtectionAgency, U.S. Government Printing Office, Washington, D.C., June 25, 1997).
51. Lodder, P. and J. B. Lefers, Effect of Natural Gas, C2H6, and CO on theHomogenous Gas Phase Reduction of NOx by NH3, Chemical EngineeringJournal, Vol. 30, No. 3, 1985, p. 161.
Emissions Control Strategies for Power Plants 389
52. Ciarlante, V. and M. A. Zoccola, Conectiv Energy Successfully Using SNCRfor NOx Control, Power Engineering, Vol. 105, No. 6, June 2001, pp. 61–62.
53. Frederick, N., R. K. Agrawai, and S. C. Wood, NOx Control on a Budget:Induced Flue Gas Recirculation, Power Engineering, Vol. 107, No. 7, July2003, pp. 28–32.
54. Hoskins, B., Uniqueness of SCR Retrofits Translates into Broad Cost Varia-tions, Power Engineering, Vol. 107, No. 5, May 2003, pp. 25–30.
55. EPRI, EPRI 2002 Annual Report (Electric Power Research Institute, Palo Alto,CA, 2003), pp. 11–12.
56. EPA, National Emission Inventory (NEI) Air Pollution Emission Trends,Updated August 2000: Average Annual Emissions, All Criteria Pollu-tants Years Including 1997–2001 (U.S. Environmental Protection Agency,Washington, D.C.), www.epa.gov/ttn/chief/trends/ (last updated September4, 2003).
57. Soud, H. N. and S. C. Mitchell, Particulate Control Handbook for Coal-FiredPlants (IEA Coal Research, London, 1997).
58. DOE, Description—PM Emissions Control (U.S. Department of Energy, Wash-ington, D.C.), www.netl.doe.gov/coalpower/environment/pm/description.html (last updated December 2, 2003).
59. DOE, Controlling Air Toxics with Electrostatic Precipitators Fact Sheet(Office of Fossil Energy, U.S. Department of Energy, Washington, D.C., 1997).
60. B&W, Electrostatic Precipitator Product Sheet, PS151 2M A 12/82 (Babcok &Wilcox Co., Barberton, OH, December 1982).
61. Miller, B. G., unpublished data, 1986.62. Miller, B. G., S. J. Miller, G. P. Lamb, and J. A. Luppens, Sulfur Capture by
Limestone Injection During Combustion of Pulverized Panola County TexasLignite, in Proc. of Gulf Coast Lignite Conference, 1984.
63. Buckley, W. and I. Ray, Application of Wet Electrostatic Precipitation Tech-nology in the Utility Industry for PM2.5 Control, in Proc. of the EPRI–DOE–EPA Combined Power Plant Air Pollution Control: The MEGA Symposium,2003.
64. Staehle, R. C., R. J. Triscori, G. Ross, K. S. Kumar, and E. Pasternak, ThePast, Present and Future of Wet Electrostatic Precipitators in Power PlantApplications, in Proc. of the EPRI–DOE–EPA Combined Power Plant AirPollution Control: The MEGA Symposium, 2003.
65. Altman, R., G. Offen, W. Buckley, and I. Ray, Wet Electrostatic Precip-itation Demonstrating Promise for Fine Particulate Control, Part I, PowerEngineering, Vol. 105, No. 1, January 2001, pp. 37–39.
66. Altman, R., W. Buckley, and I. Ray, Wet Electrostatic Precipitation Demon-strating Promise for Fine Particulate Control, Part II, Power Engineering,Vol. 105, No. 2, February 2001, pp. 42–44.
67. Bustard, C. J., K. M. Cushing, D. H. Pontius, W. B. Smith, and R. C. Carr, Fab-ric Filters for the Electric Utility Industry, Vol. 1, General Concepts (ElectricPower Research Institute, Palo Alto, CA, 1988).
68. Soud, H. N., Developments in Particulate Control for Coal Combustion (IEACoal Research, London, 1995).
390 Coal Energy Systems
69. Miller, R. L., W. A. Harrison, D. B. Prater, and R. L. Chang, Alabama PowerCompany E.C. Gaston 272 MW Electric Steam Plant—Unit No. 3 EnhancedCOHPAC I Installation, in Proc. of the EPRI–DOE–EPA Combined Utility AirPollution Control Symposium: The MEGA Symposium, Vol. III, Particulatesand Air Toxics, 1997.
70. Proc. of the EPRI–DOE–EPA Combined Utility Air Pollution Control Sym-posium: The MEGA Symposium, Vol. III, Particulates and Air Toxics,1997.
71. Cushing, K. M., W. A. Harrison, and R. L. Chang, Performance Response ofCOHPAC I Baghouse During Operation with Normal and Artificial Changesin Inlet Fly Ash Concentration and During Injection of Sorbents for Control ofAir Toxics, in Proc. of the EPRI–DOE–EPA Combined Utility Air PollutionControl Symposium: The MEGA Symposium, Vol. III, Particulates and AirToxics, 1997.
72. Gebert, R., C. Rinschler, D. Davis, U. Leibacher, P. Studer, W. Eckert, W.Swanson, J. Endrizzi, T. Hrdlicka, S. J. Miller, M. L. Jones, Y. Zhuang, andM. Collings, Commercialization of the Advanced Hybrid Filter Technology,in Proc. of the Conference on Air Quality III: Mercury, Trace Elements, andParticulate Matter (University of North Dakota, Grand Forks, 2002).
73. DOE, Advanced Hybrid Particulate Collector Fact Sheet (Office of FossilEnergy, U.S. Department of Energy, Washington, D.C., June 2001).
74. DOE, Control Technology Advanced Hybrid Particulate Collector (U.S.Department of Energy, Washington, D.C.), www.netl.doe.gov/coalpower/environment/pm/con_tech/hybrid.html (last updated December 2, 2003).
75. Blankinship, S., Hybrid Filter Technology Weds ESPs with Bag Filters, PowerEngineering, Vol. 106, No. 2, February 2002, p 9.
76. DOE, Demonstration of a Full-Scale Retrofit of the Advanced Hybrid Par-ticulate Collector (AHPC) Collector Fact Sheet (Office of Fossil Energy, U.S.Department of Energy, Washington, D.C., February 2003).
77. Feeley, T. J., J. Murphy, J. Hoffman, and S. A. Renninger, A Reviewof DOE/NETL’s Mercury Control Technology R&D Program for Coal-Fired Power Plants, DOE/NETL Hg R&D Review (National EnergyTechnology Laboratory, U.S. Department of Energy, Washington, D.C.),www.netl.doe.gov/ (April 2003).
78. Pavlish, J. J., E. A. Sondreal, M. D. Mann, E. S. Olson, K. C. Galbreath, D.L. Laudal, and S. A. Benson, Status Review of Mercury Control Options forCoal-Fired Power Plants, Fuel Processing Technology, Vol. 82, 2003, pp. 89–165.
79. Sjostrom, S., J. Bustard, and R. Chang, Mercury Removal Trends and Optionsfor Coal-Fired Power Plants with Full-Scale ESPs and Fabric Filters, inProc. of the Nineteenth Annual International Pittsburgh Coal Conference,2002.
80. Starns, T., J. Bustard, M. Durham, C. Martin, R. Schlager, S. Sjostrom, C. Lind-sey, B. Donnelly, R. Afonso, R. Chang, and S. Renninger, Results of ActivatedCarbon Injection Upstream of Electrostatic Precipitators for Mercury Control,
Emissions Control Strategies for Power Plants 391
in Proc. of the EPRI–DOE–EPA Combined Power Plant Air Pollution Control:The MEGA Symposium, 2003.
81. Bustard, C. J., M. Durham, C. Lindsey, T. Starns, C. Martin et al., Resultsof Activated Carbon Injection for Mercury Control Upstream of a COHPACFabric, in Proc. of the EPRI–DOE–EPA Combined Power Plant Air PollutionControl: The MEGA Symposium, 2003.
82. National Research Council, Coal Waste Impoundments: Risks, Responses,and Alternatives (National Academy Press, Washington, D.C., 2002).
83. Jha, M. C., F. J. Smit, G. L. Shields, and N. Moro, Engineering Develop-ment of Advanced Physical Fine Coal Cleaning for Premium Fuel Applica-tions: Project Final Report, DOE Contract No. DE-AC22-92PC92208 (U.S.Department of Energy, Washington, D.C., September 1997).
84. Akers, D. J. and C. E. Raleigh, The Mechanism of Trace Element RemovalDuring Coal Cleaning, Coal Preparation, Vol. 19, No. 3, 1998, pp. 257–269.
85. Kilgroe, J. D. and R. K. Srivastava, Technical Memorandum: Control of Mer-cury Emissions from Coal-Fired Electric Utility Boilers (U.S. EnvironmentalProtection Agency, Washington, D.C., September 2000).
86. Akers, D. J. and B. Toole-O’Neil, Coal Cleaning for HAP Control: Cost andPerformance, in Proc. of the 23rd International Technical Conference onCoal Utilization and Fuel Systems (Coal & Slurry Technology Association,Washington, D.C., 1998).
87. DOE, Carbon Sequestration Technology Roadmap and Program Plan(National Energy Technology Laboratory, U.S. Department of Energy, Wash-ington, D.C., March 12, 2003).
88. Los Alamos, The Products of Coal: Electricity and Carbon Dioxide (CleanCoal Compendium, Los Alamos National Laboratory, Los Alamos, NM),www.lanl.gov/projects/cctc/climate/Coal_CO2.html (last modified, Decem-ber 17, 1999).
89. Chakma, A., CO2 Capture Processes: Opportunities for Improved EnergyEfficiencies, Energy Conversion and Management, Vol. 38, 1997, pp. S51–S56.
90. Sander, M. T. and C. L. Mariz, The Fluor Daniel Econamine FG Process: PastExperience and Present-Day Focus, Energy Conversion and Management, Vol.33, 1995, pp. 813–818.
91. Mariz, C. L., Carbon Dioxide Recovery: Large Scale Design Trends, Journalof Canadian Petroleum Technology, Vol. 37, No. 7, 1998, pp. 42–47.
92. DOE, Carbon Sequestration: Why Sequestration? (National Energy Tech-nology Laboratory, U.S. Department of Energy, Washington, D.C.),www.netl.doe.gov/coalpower/sequestration (last updated July 25, 2003).
93. Song, C. X. Xu, J. M. Andresen, B. G. Miller, and A. W. Scaroni, Novel “Molec-ular Basket” Adsorbent for CO2 Capture, in Proc. of the Seventh InternationalConference on Carbon Dioxide Utilization (October 2003).
94. Miller, B. G., S. Falcone Miller, S. V. Pisupati, C. Song, R. S. Wasco et al.,The Development of Coal-Based Technologies for Department of DefenseFacilities: Phase III Final Report, DE-FC22-92PC92162, prepared for the U.S.Department of Energy Federal Energy Technology Center, Pittsburgh, PA,January 31, 2004, 600 pages.
392 Coal Energy Systems
95. DOE, Clean Coal Technology—Technologies for the Combined Control ofSulfur Dioxide and Nitrogen Oxides Emissions from Coal-Fired Boilers, Top-ical Report No. 13. (U.S. Department of Energy, U.S. Government PrintingOffice, Washington, D.C., May 1999).
96. Miller, B. G., S. Falcone Miller, R. T. Wincek, and A. W. Scaroni, A Demon-stration of Fine Particulate and Mercury Removal in a Coal-Fired IndustrialBoiler Using Ceramic Membrane Filters and Conventional Fabric Filters, inProc. of the EPRI–DOE–EPA Combined Utility Air Pollutant Symposium:The Mega Symposium, 1999.
97. Miller, B. G., S. Falcone Miller, R. T. Wincek, and A. W. Scaroni, A Prelimi-nary Evaluation of Ceramic Filters Including the Use of Nondestructive X-RayComputerized Tomography, in Proc. of the 26th International TechnicalConference on Coal Utilization and Fuel Systems, 2001.
98. Schimmoller, B. K., Lack of Environmental Certainty Renews Emphasis onLow-Cost Emissions Control, Power Engineering, Vol. 107, No. 9, September2003, pp. 32–38.
99. Cameron, D. H., C. E. Martin, W. A. Campbell, and R. A. Stobbs, The Futureof Multi-Pollutant Control for Coal-Fired Boilers: A Canadian Perspective, inProc. of the EPRI–DOE–EPA Combined Power Plant Air Pollution Control:The MEGA Symposium, 2003.
100. McLarnon, C. R. and D. Steen, Combined SO2, NOx , PM, and Hg Removalfrom Coal Fired Boilers, in Proc. of the EPRI–DOE–EPA Combined PowerPlant Air Pollution Control: The MEGA Symposium, 2003.
101. Mortson, M. E. and F. C. Owens II, Multi Pollutant Control with the AirborneProcess, in Proc. of the EPRI–DOE–EPA Combined Power Plant Air PollutionControl: The MEGA Symposium, 2003.
102. Haddad, E., J. Ralson, G. Green, and S. Castagnero, Full-Scale Evaluation ofa Multi-Pollutant Reduction Technology: SO2, Hg, and NOx , in Proc. of theEPRI–DOE–EPA Combined Power Plant Air Pollution Control: The MEGASymposium, 2003.
CHAPTER 7
Future PowerGeneration (Near-ZeroEmissions DuringElectricity Generation)
President George W. Bush has pledged that the United States will be a leaderin the long-term effort to achieve energy security [1]. To do this, a balancedand diversified portfolio of energy resources is required, which includes fos-sil, nuclear, and renewable energy sources. Clean coal is recognized as acrucial element in the United States’ overall policy, as recently evidencedby President Bush’s commitment to a 10-year, $2 billion clean coal researchinitiative (which is discussed later in this chapter). Coal is a popular fuelchoice because worldwide reserves could last two to three centuries, it iswidely dispersed throughout the world, and it is among the most economicof energy resources. However, coal is among the most environmentally prob-lematic of all energy resources, and much effort has gone into addressingthis over the last two decades, with the U.S. Department of Energy (DOE)spearheading the development of clean coal technologies.
In the foreseeable future, the energy needed to sustain economic growthin the United States (as well as most countries of the world, for that matter)will continue to come largely from fossil fuels, with coal playing a lead-ing role. In supplying this energy need, however, the United States mustaddress growing global and regional environmental concerns and energyprices [2]. Maintaining low-cost electricity while demand grows and envi-ronmental pressures increase requires new technologies. These technologiesmust allow the United States to use its indigenous resources wisely, cleanly,and efficiently.
The existing fleet of coal-fired power plants in the United States isfaced with increasingly stringent environmental regulations, of which airemissions are the primary focus. The Clean Air Act, particularly the 1990amendments (see Chapter 4, Coal-Fired Emissions and Legislative Action
393
394 Coal Energy Systems
in the United States), addresses the environmental performance of coal-based power systems specifically targeting emissions of sulfur dioxide,nitrogen oxides, hazardous air pollutants (including mercury), and fine par-ticulate matter. Carbon dioxide is also of concern because of its potential tocontribute to global climate change.
As discussed in Chapters 4 and 6 (Emissions Control Strategies forPower Plants), much progress has been made in reducing emissions fromcoal-fired power plants; however, with more stringent regulations antici-pated in the near future, as well as the DOE’s goal to develop near-zeroemissions coal-fired power plants, major research and development activi-ties are necessary to develop advanced coal power-generation technologies,with full-scale demonstrations a key to realizing the benefits of these pro-grams [3]. This chapter discusses programs that have been implementedby the United States over the last 20 years to develop new technologies,which are also being exported or utilized by other countries. The various pro-grams, under the umbrella of the DOE’s Coal Power Program, address near-and long-range needs and include developing cost-effective environmentalcontrol technologies to comply with current and emerging regulations anddeveloping technologies for near-zero emissions power and clean fuels plantswith carbon dioxide management capability, respectively [3]. The DOE pro-grams discussed in this chapter include the Clean Coal Technology (CCT)Demonstration Program, Power Plant Improvement Initiative (PPII), CleanCoal Power Initiative (CCPI), Vision 21, and FutureGen.
The Clean Coal Technology Program is providing a portfolio of tech-nologies that will ensure that the U.S. recoverable coal reserves of 274 billionshort tons can continue to supply the country’s energy needs economicallyand in an environmentally sound manner. Under the Clean Coal TechnologyProgram, cost-effective environmental control devices were developed forexisting power plants. In addition, a new generation of technologies that canproduce electricity and other commodities as well as provide the efficienciesand environmental performance responsive to global climate change con-cerns were developed [4]. The PPII projects focus on technologies enablingexisting coal-fired power plants to meet increasingly stringent environmen-tal regulations at the lowest possible cost [5]. The CCPI Program is aninnovative technology demonstration program that fosters more efficientclean coal technologies for use in existing and new power generation facili-ties [6]. Vision 21 is the DOE’s initiative to effectively remove environmentalconcerns associated with the use of fossil fuels for producing electricity andtransportation fuels through better technology; the design basis is sched-uled to be completed by 2015 with plant deployment by 2020 [5]. The DOEis particularly interested in coal-based energy plants. A specific integratedco-production plant program is FutureGen. FutureGen is an integrated car-bon dioxide capture and sequestration and hydrogen research initiative todesign, build, and operate a nearly emission-free, coal-fired electric powerand hydrogen production plant [7].
Future Power Generation 395
Clean Coal Technology Demonstration Program
Nearly 20 years ago it was recognized that, given the need to respond toenvironmental objectives, new technologies would be necessary if coal wasto continue as a viable source of secure energy [2]. In 1985, the CleanCoal Technology Demonstration Program was initiated with the objectiveto demonstrate a new generation of advanced coal utilization technologies.This investment in technology forms a solid foundation for addressing globaland regional environmental concerns while providing low-cost energy thatcan compete in a deregulated electric power marketplace.
Clean Coal Technology Program EvolutionDuring the 1970s and early 1980s, many of the government-sponsored tech-nology demonstrations focused on synthetic fuels production technology.The Synthetic Fuels Corporation (SFC) was established under the EnergySecurity Act of 1980 to reduce U.S. vulnerability to disruptions of crude oilimports [4]. The purpose of the SFC was accomplished by encouraging theprivate sector to build and operate synthetic fuel production facilities thatused abundant domestic energy resources, specifically coal and oil shale.The strategy was for the SFC to be primarily a financier of pioneer commer-cial and near-commercial scale facilities [4]. By 1985, the market drivers forsynthetic fuels dissolved as oil prices declined, world oil prices stabilized,and a short-term buffer was provided by the Strategic Petroleum Reserve.Congress responded to the decline of private-sector interest in the productionof synthetic fuels and abolished the SFC in 1986.
The CCT Program was initiated in October 1984 through Public Law98-473, Joint Resolution Making Continuing Appropriations for Fiscal Year1985 and Other Purposes [4]. The United States moved from an energy policybased on synthetic fuels production to a more balanced policy. This policyestablished that the United States have an adequate supply of energy main-tained at a reasonable cost and consistent with environmental, health, andsafety objectives. Energy stability, security, and strength were the founda-tions for this policy. Coal was recognized as an essential element in thisenergy policy for the foreseeable future because the following existed [4]:
• Well-understood coal resource base;• Available technology and skilled labor base to safely and economi-
cally extract, transport, and use coal;• Existing multibillion-dollar infrastructure to gather, transport, and
deliver coal to serve the domestic and international marketplace;• Secure and abundant energy resource within the country’s borders
which is relatively invulnerable to disruptions because the coal pro-duction is dispersed and flexible, the delivery network is vast, andthe stockpiling capability is great;
396 Coal Energy Systems
• Potential for export opportunities of U.S.-developed, coal-based tech-nologies due to coal being the fuel of necessity in many lesserdeveloped economies.
Congress recognized that the continued viability of coal as an energyresource was dependent on the demonstration and commercial application ofa new generation of advanced coal-based technologies with improved opera-tional, economic, and environmental performance; consequently, the CCTProgram was established [4]. The DOE issued the first solicitations (CCT-I) in1986 for clean coal technology projects and selected a broad range of projectsin four major product markets: environmental control devices, advancedelectric power generation, coal processing for clean fuels, and industrialapplications. In February 1988, the second solicitation (CCT-II) was issuedand provided for the demonstration of technologies that were capable ofachieving significant reductions in SO2, NOx , or both, from existing powerplants that were to be more cost effective than current technologies and capa-ble of commercial deployment in the 1990s. The emphasis of the solicitationwas on SO2 and NOx , precursors of acid rain, as a major presidential initia-tive was launched to address acid rain. The DOE issued a third solicitation(CCT-III) in May 1989 with essentially the same objective as the second butwhich also encouraged technologies that would produce clean fuels fromrun-of-mine coal. The next two solicitations recognized emerging energyand environmental issues, such as global climate change and capping of SO2emissions, and focused on seeking highly efficient, economically compet-itive, and low-emissions technologies. Specifically, the fourth solicitation(CCT-IV), released in January 1991, had as its objective the demonstra-tion of energy-efficient, economically competitive technologies capable ofretrofitting, repowering, or replacing existing facilities while achievingsignificant reductions in SO2 and NOx emissions. The fifth solicitation(CCT-V) was released in July 1992 to provide for demonstration projectsthat significantly advanced the efficiency and environmental performanceof technologies applicable to new or existing facilities.
CCT Program Funding and CostsThe five CCT Program solicitations resulted in the demonstration of 38projects as of 2003. Several additional projects were started; however, fora variety of reasons (primarily financial), these projects were terminated.In fact, two advanced power generation projects (i.e., City of Lakeland,Department of Water & City Utilities projects; summarized in the next sec-tion as part of the portfolio of 38 projects) were active for approximatelya decade but were terminated in the summer of 2003 due to financialissues. Of the 38 projects, in addition to the two recently terminated,31 demonstration projects have been completed, two are in operation, one isin construction, and two are in design [8,9]. The 38 projects have resulted in

Future Power Generation 397
a combined commitment by the federal government and the private sectorof $5.2 billion. The DOE’s cost-share for these projects is ∼$1.7 billion, or∼34% of the total [4]. The project participants (i.e., non-federal governmentparticipants) are providing the remaining $3.4 billion, or 66%, of the total.Table 7-1 summarizes the costs, cost-sharing, and application categories ofthe CCT projects.
CCT Program ProjectsThe CCT Program projects provide a portfolio of technologies that willenable coal to continue to provide low-cost, secure energy vital to the U.S.economy while satisfying energy and environmental goals. The projectsare spread across the country in 18 states, as shown in Figure 7-1 [4].Table 7-2 lists each project, non-federal government participant, location ofthe project, solicitation under which the projects were awarded, and status of
TABLE 7-1CCT Project Costs and Cost-Sharing (in Thousands of Dollars)
TotalProjectCosts
Percent Cost-Share Dollars Cost-Share Percent(%) DOE Participant DOE Participant
SubprogramCCT-I 844,363 16 236,640 604,723 28 72CCT-II 318,577 6 139,229 179,348 44 56CCT-III 1,325,329 26 576,918 748,411 44 56CCT-IV 950,429 18 439,063 511,366 46 54CCT-V 1,765,009 34 360,982 1,404,027 20 80Total 5,203,707 100 1,775,832 3,447,875 34 66
Application categoryAdvanced
Electric PowerGeneration
2,864,284 55 1,118,865 1,745,419 39 61
EnvironmentalControlDevices
620,110 12 252,866 367,244 41 59
Coal Processingfor Clean Fuels
431,810 8 192,029 239,781 44 56
IndustrialApplications
1,287,503 25 192,072 1,095,431 15 85
Total 5,203,707 100 1,755,832 3,447,875 34 66
Source: DOE, Clean Coal Technology Demonstration Program: Program Update 2001 Includ-ing Power Plant Improvement Initiative Projects, Office of Fossil Energy, U.S. Department ofEnergy, Washington, D.C., July 2002.
398 Coal Energy Systems
FIGURE 7-1. Location of the CCT program projects. (From DOE, Clean CoalTechnology Demonstration Program: Program Update 2001 Including Power PlantImprovement Initiative Projects, Office of Fossil Energy, U.S. Department of Energy,Washington, D.C., July 2002.)
TABLE 7-2CCT Program Demonstration Projects
Project Participant Solicitation/Status
Environmental Control DevicesSO2 Control Technologies
10 MW demonstration of gassuspension absorption
AirPol, Inc. CCT-III/completed03/94
Confined zone dispersion flue gasdesulfurization (FGD)demonstration
Bechtel Corp. CCT-III/completed06/93
LIFAC sorbent injectiondesulfurization demonstrationproject
LIFAC-North America CCT-III/completed06/94
Advanced flue gas desulfurization(FGD) demonstration project
Pure Air on theLake, LP
CCT-II/completed06/95
Demonstration of innovativeapplications of technology forthe CT-121 flue gasdesulfurization (FGD) process
Southern CompanyServices, Inc.
CCT-II/completed12/94
NOxControl TechnologiesDemonstration of advanced
combustion techniques for awall-fired boiler
Southern CompanyServices, Inc.
CCT-II/completed04/03
(continued)

Future Power Generation 399
TABLE 7-2(continued)
Project Participant Solicitation/Status
Demonstration of coal reburningfor cyclone boiler NOx control
Babcock & Wilcox Co. CCT-II/completed12/92
Full-scale demonstration oflow-NOx cell burner retrofit
Babcock & Wilcox Co. CCT-III/completed04/93
Evaluation of gas reburning andlow-NOx burners on a wall-firedboiler
Energy andEnvironmentalResearchCorporation
CCT-III/completed01/95
Micronized coal reburningdemonstration for NOxcontrol
New York StateElectric & Gas Corp.
CCT-IV/completed04/99
Demonstration of selectivecatalytic reduction technologyfor the control of NOx emissionsfrom high-sulfur, coal-firedboilers
Southern CompanyServices, Inc.
CCT-II/completed07/95
180-MW demonstration ofadvanced tangentially firedcombustion techniques for thereduction of NOx emissionsfrom coal-fired boilers
Southern CompanyServices, Inc.
CCT-II/completed12/92
Combined SO2/NOx Control TechnologiesSNOXtm flue gas cleaning
demonstration projectABB Environmental
SystemsCCT-II/completed
12/94LIMB demonstration project
extension and cool-sidedemonstration
Babcock & Wilcox Co. CCT-I/completed08/91
SOx-NOx-Rox-Boxtm flue gascleanup demonstration project
Babcock & Wilcox Co. CCT-II/completed05/93
Enhancing the use of coals by gasreburning and sorbent injection
Energy andEnvironmentalResearchCorporation
CCT-I/completed10/94
Milliken clean coal technologydemonstration project
New York StateElectric & Gas Corp.
CCT-IV/completed06/98
Integrated dry NOx/SO2 emissionscontrol system
Public Service ofColorado
CCT-III/completed12/96
Advanced Electric Power Generation
Fluidized-Bed CombustionMcIntosh unit 4A pressurized
circulating fluidized-bed (PCFB)demonstration project
City of Lakeland,Lakeland Electric
CCT-III/terminated2003
(continued)

400 Coal Energy Systems
TABLE 7-2(continued)
Project Participant Solicitation/Status
McIntosh unit 4B toppedpressurized circulatingfluidized-bed (PCFB)demonstration project
City of Lakeland,Lakeland Electric
CCT-IV/terminated2003
JEA large-scale circulatingfluidized-bed (CFB) combustiondemonstration project
JEA CCT-I/operating
Tidd pressurized fluidized-bedcombustion (PFBC)demonstration project
The Ohio Power Co. CCT-I/completed03/95
Nucla circulating fluidized-bed(CFB) demonstration project
Tri-State Generationand TransmissionAssociation, Inc.
CCT-I/completed01/91
Integrated Gasification Combined CycleKentucky Pioneer Energy
integrated gasification combinedcycle (IGCC) demonstrationproject
Kentucky PioneerEnergy, LLC
CCT-V/underconstruction
Tampa Electric integratedgasification combined cycle(IGCC) project
Tampa ElectricCompany
CCT-III/completed10/01
Piñon Pine integrated gasificationcombined cycle (IGCC) powerproject
Sierra Pacific PowerCo.
CCT-IV/completed01/01
Wabash River coal gasificationrepowering project
Wabash River CoalGasificationRepowering ProjectJoint Venture
CCT-IV/completed12/99
Advanced Combustion/Heat EnginesClean coal diesel demonstration TIAX (formerly Arthur
D. Little, Inc.)CCT-V/under
constructionHealy clean coal project Alaska Industrial
Development andExport Authority
CCT-III/completed12/99
Coal Processing for Clean FuelsCommercial-scale demonstration
of the liquid-phase methanol(LPMEOHtm) process
Air Products LiquidPhase ConversionCompany, LP
CCT-III/completed12/02
Development of the Coal QualityExperttm
ABB CombustionEngineering, Inc.;CQ, Inc.
CCT-I/completed12/95
ENCOAL® mild coal gasificationproject
ENCOAL Corp. CCT-III/completed07/97
(continued)

Future Power Generation 401
TABLE 7-2(continued)
Project Participant Solicitation/Status
Advanced coal conversion processdevelopment
Western SynCoal, LLC CCT-I/completed01/01
Industrial ApplicationsClean Power from Integrated
Coal/Ore Reduction(CPICORtm)
CPICORtm
ManagementCompany, LLC
CCT-V/design
Blast furnace granular-coalinjection system demonstrationproject
Bethlehem Steel Corp. CCT-III/completed11/98
Advanced cyclone combustor withinternal sulfur, nitrogen, and ashcontrol
Coal Tech Corp. CCT-I/completed05/90
Cement kiln flue gas recoveryscrubber
Passamaquoddy Tribe CCT-II/completed09/93
Pulse combustor designqualification test
ThermoChem, Inc. CCT-IV/completed09/01
Source: Data from DOE [4,9].
the project. The participants listed in Table 7-2 are the primary non-federalgovernment companies, although each project had several supporting teammembers [4]. The projects are listed in Table 7-2 by four basic market sectors.A synopsis of the projects is provided in the following text, with an emphasison emissions achievements.
Environmental Control DevicesThe initial thrust of the CCT Program addressed acid rain, and 18 projectshave been completed involving SO2 and NOx control for coal-fired boil-ers. The technologies demonstrated provide a suite of cost-effective controloptions for the full range of boiler types. The projects included seven NOxemission control systems installed on more than 1750 MW of utility gen-erating capacity, five SO2 emission control systems installed on ∼770 MW,and six combined SO2/NOx emission control systems installed on more than665 MW of capacity [4].
SO2 Control Technologies The CCT Program successfully demonstratedtwo sorbent injection systems, one spray dryer system, and two advancedflue gas desulfurization (AFGD) systems. Sulfur dioxide reductions vary-ing from 50 to 90+% were demonstrated. AirPol, Inc., demonstrated thatFLS milfo, Inc.’s gas suspension absorption system was an economic optionfor achieving Phase II 1990 Clean Air Act Amendments SO2 compliance
402 Coal Energy Systems
in coal-fired boilers using high-sulfur coal [10]. The demonstration wasperformed using a vertical, single-nozzle reactor (i.e., spray dryer) with inte-grated sorbent particulate recycle in a 10 MW equivalent slipstream of fluegas from a Tennessee Valley Authority (West Paducah, Kentucky) 175 MWwall-fired boiler. Sulfur dioxide reductions of 60 to 90% were obtained firing2.7 to 3.5% sulfur coal [4].
Bechtel Corporation demonstrated SO2 removal capabilities of in-ductconfined zone dispersion (CZD)/flue gas desulfurization (FGD) technology—specifically, to define the optimum process operating parameters and todetermine the operability, reliability, and cost-effectiveness of CZD/FGDduring long-term testing and its impact on downstream operations and emis-sions [11]. The demonstration was performed using half of the flue gas fromthe Pennsylvania Electric Company Seward Station 147 MW tangentiallyfired boiler. Sulfur dioxide reductions of 50% were achieved firing 1.5 to2.5% sulfur coal [4].
LIFAC-North America (a joint venture partnership between TampellaPower Corporation and ICF Kaiser Engineers, Inc.) demonstrated the LIFACsorbent injection process, with furnace sorbent injection and sulfur captureoccurring in a vertical activation reactor [12]. The LIFAC process was shownto be easily retrofitted to power plants with space limitations and burninghigh-sulfur coals. The 60 MW demonstration was performed on the Rich-mond (Indiana) Power & Light Whitewater Valley Station and achieved 70%SO2 removal firing 2.0 to 2.9% sulfur coal [4].
Pure Air on the Lake, L.P. (a subsidiary of Pure Air, which is a gen-eral partnership between Air Products and Chemicals, Inc., and MitsubishiHeavy Industries America, Inc.) demonstrated Pure Air’s AFGD processto reduce SO2 emissions by 95% or more at approximately one-half thecost of conventional scrubbing technology, to significantly reduce spacerequirements, and to create no new waste streams [13]. A single SO2absorber that was built for Baily (Indiana) Generating Station Unit Nos. 7and 8 (i.e., 528 MW) achieved 95% SO2 capture firing 2.3 to 4.7% sulfurcoal [4].
Southern Company Services, Inc., demonstrated Chiyoda Corpora-tion’s Chiyoda Thoroughbred-121 AFGD process for combined particulateand SO2 capture with high reliability [14]. Testing performed at the GeorgiaPower Company Plant Yates, Unit No. 1 (100 MW), achieved over 90% SO2removal efficiency at SO2 inlet concentrations of 1000 to 3000 ppm with>97% limestone utilization, 97.7 to 99.3% particulate removal, >95% HCland HF capture, 80 to 98% capture of most metals, <50% capture of mercuryand cadmium, and <70% capture of selenium [4].
NOx Control Technologies Under the CCT Program, seven NOx con-trol technologies were assessed encompassing low-NOx burners (LNBs),advanced overfire air (AOFA), reburning, selective catalytic reduction (SCR),selective non-catalytic reduction (SNCR), and combinations of them.

Future Power Generation 403
NOx reductions varying from 37 to 80% were demonstrated. SouthernCompany Services, Inc., performed a demonstration using Foster Wheeler’sLNB with AOFA and the Electric Power Research Institute’s (EPRI’s) GenericNOx Control Intelligent System (GNOCIS) computer software to achieve50% NOx reduction; to determine the contributions of AOFA and LNB toNOx reduction and the parameters for optimal LNB/AOFA performance; andto assess the long-term effects of LNB, AOFA, combined LNB/AOFA, and theGNOCIS advanced digital controls on NOx reduction, boiler performance,and auxiliary components [9,15]. The demonstration was performed on theGeorgia Power Plant Hammond, Unit No. 4, which is a 500 MW wall-firedboiler, and achieved 68% NOx reduction with fly ash loss-on-ignition (LOI)increasing from a baseline of 7 to 8–10% [4].
The Babcock & Wilcox Company (B&W) demonstrated the technicaland economic feasibility of their coal reburning system to achieve greaterthan 50% NOx reduction with no serious impact on cyclone combustor oper-ation, boiler performance, or other emission streams [16]. The demonstrationwas performed on the Wisconsin Power and Light Company 100 MW NelsonDewey Station, Unit No. 2, and achieved 52 to 62% NOx reduction with30% heat input from the coal [4]. B&W also demonstrated the cost-effectivereduction of NOx from a large, base-loaded, coal-fired utility boiler withtheir Low-NOx Cell Burner (LNCB
�) system to achieve at least 50% NOx
reduction without degradation of boiler performance at less cost than thatof conventional low-NOx burners [17]. The demonstration was performedon the Dayton (Ohio) Power and Light Company 605 MW J.M. Stuart Plant,Unit No. 4, and achieved 48 to 58% NOx reduction, experienced average COemissions of 28 to 55 ppm, increased fly ash production without affecting theelectrostatic precipitator (ESP) performance, and increased unburned carbon(UBC) losses by ∼28% [4].
The Energy and Environmental Research Corporation (EERC), cur-rently GE Energy and Environmental Research, performed a demonstrationto attain up to a 70% decrease in NOx emissions from an existing wall-firedutility boiler firing low-sulfur coal using both natural gas reburning (GR) andLNBs, as well as to assess the impact of GR-LNB technology on boiler per-formance [18]. The demonstration was performed on a 172 MW wall-firedboiler (Public Service Company of Colorado Cherokee Station, Unit No. 3).It achieved 37 to 65% NOx reduction, with 13 to 18% of the heat inputcoming from the natural gas; reduced SO2 and particulate loadings by thepercentage heat input by natural gas reburning; and resulted in acceptablecarbon-in-ash and CO levels with GR/LNB operation [4].
New York State Electric & Gas Corporation (NYSEG) demonstratedmicronized coal reburning with the objective to achieve at least 50% NOxreduction on a cyclone burner and 25 to 35% NOx reduction on a tan-gentially fired boiler [19]. Demonstrations were performed on the NYSEGMilliken Station (Lansing, New York) Unit No. 1, which is a 148 MWtangentially-fired boiler, and Eastman Kodak Company’s Kodak Park
404 Coal Energy Systems
(Rochester, New York) Power Plant Unit No. 1, which is a 60 MW cycloneboiler. Nitrogen oxide reductions of 59 and 28% were achieved in thecyclone- and tangentially fired units, respectively. The micronized coal con-sisted of 17 and 14% of heat input, respectively. LOI was maintained at <5%at Milliken Station but increased from baseline levels of 10–15 to 40–50%at Kodak Park [4].
Southern Company Services, Inc., evaluated the performance of eightSCR catalysts with different shapes and chemical compositions when appliedto operating conditions found in U.S. pulverized coal-fired utility boilersfiring U.S. high-sulfur coal under various operating conditions, while achiev-ing as much as 80% NOx removal [20]. In this demonstration project, theSCR facility consisted of three 2.5 MW equivalent SCR reactors suppliedby separate flue gas streams and six 0.20 MW equivalent reactors for atotal of 8.7 MW equivalent using flue gas from the Gulf Power CompanyPlant Crist (Pensacola, Florida), Unit No. 4. The reactors were sized to pro-duce data that will allow the SCR process to be scaled up to commercialsize. Nitrogen oxide reductions of over 80% were achieved at an ammo-nia slip well under the 5 ppm level deemed acceptable for commercialoperation [4].
Southern Company Services, Inc., also demonstrated short- and long-term NOx reduction capabilities of ABB Combustion Engineering Inc.’s (nowAlstom Power, Inc.) Low-NOx Concentric Firing System (LNCFSTM) atvarious combinations of OFA and coal nozzle positioning [21]. The demon-stration was performed on Gulf Power Company’s 180 MW tangentially firedPlant Lansing Smith (Lynn Haven, Florida), Unit No. 2. Reductions in NOxof 37 to 45% were achieved [4].
Combined SO2/NOx Control Technologies Six combined SO2/NOx con-trol technologies were assessed under the CCT Program. These technologiesused various combinations of technologies and demonstrated NOx and SO2reductions of 40–94 and 50–95%, respectively. ABB Environmental Systemsdemonstrated Haldor Topsoe’s SNOXTM catalytic advanced flue gas cleanupsystem at an electric power plant using U.S. high-sulfur coals with the objec-tive to remove 95% of the SO2 and more than 90% of the NOx from the fluegas, as well as produce a salable by-product of concentrated sulfuric acid[22]. In the SNOXTM process, particulate is removed using a high-efficiencybaghouse, NOx is reduced in a catalytic reactor using ammonia, and SO2 isoxidized to SO3 in a second catalytic reactor and subsequently hydrolyzed toconcentrated sulfuric acid. Testing performed in a 35 MW equivalent slip-stream from the Ohio Edison Niles (Ohio) Station, Unit No. 2 (108 MW)achieved SO2 reductions in excess of 95% and NOx reductions averaging94%, produced a sulfuric acid that exceeded federal specifications for a ClassI acid, eliminated CO and hydrocarbon emissions due to the presence of theSO2 catalyst, and exhibited high capture efficiency of most air toxics (exceptfor mercury) in the high-efficiency baghouse [4].

Future Power Generation 405
B&W demonstrated that their limestone injection multistage burner(LIMB) process can achieve up to 50% NOx and SO2 reductions and thatConsolidated Coal Company’s Coolside duct injection of lime sorbents canachieve removal of up to 70% SO2 [23]. The testing was performed atthe Ohio Edison 105 MW Edgewater Station (Lorain, Ohio), Unit No. 4.The LIMB process reduces SO2 by injecting dry sorbent into the boilerabove the burners—in this case, B&W’s DRB-XCL� low-NOx burners; SO2removal efficiencies varying from 45 to 60% with lime-based products and22 to 40% with limestone were achieved, while nitrogen oxide reductions of40 to 50% were obtained. The Coolside process, which is a humidified ductinjection process, achieved 70% SO2 reduction [4].
B&W also demonstrated their SOx-NOx-Rox BoxTM (SNRBTM) pro-cess with the objective of achieving greater than 70% SO2 removal and90% or higher reduction in NOx emissions while maintaining particulateemissions below 0.03 lb/MM Btu [24]. The SNRBTM process combines theremoval of SO2, NOx , and particulates in one unit: a high-temperature bag-house. Sulfur dioxide is removed using sorbent injection, NOx is reducedby injecting ammonia in the presence of an SCR catalyst inside the bags,and particulate is removed using high-temperature fiber filter bags. Thetesting was performed in a 5 MW equivalent slipstream from Ohio EdisonCompany’s 156 MW R.E. Burger Plant (Dilles Bottom, Ohio), Unit No. 5, andSO2 and NOx reductions of 80–90 and 90%, respectively, were achieved.In addition, air toxic removal efficiency was comparable to that of theESP at the plant, except that HCl and HF were reduced by 95 and 84%,respectively [4].
Energy and Environmental Research Corporation performed a demon-stration in which natural gas reburning was combined with in-furnace sor-bent injection with the objective of reducing NOx by 60% and SO2 by at least50% in two different boiler configurations—tangentially and cyclone-firedunits—while burning high-sulfur Midwestern coal [25]. Testing was per-formed on the Illinois Power Company 71 MW Hennepin Plant, Unit No. 1(tangentially fired boiler), and on the City Water, Light and Power (Spring-field, Illinois) 40 MW Lakeside Station, Unit No. 7 (cyclone-fired boiler).Nitrogen oxide reductions averaged 67 and 66%, respectively, for the tan-gentially and cyclone-fired boilers, while SO2 reductions averaged 53 and58%, respectively [4].
New York State Electric & Gas Corporation performed a demon-stration using Saarberg-Hölter-Umwelttechnik (S-H-U), GmbH’s formicacid-enhanced, wet limestone scrubber technology; ABB Combustion Engi-neering’s LNCFSTM process; Stebbins Engineering and Manufacturing’ssplit-module absorber; ABB Air Preheater’s heat-pipe air preheater; andNYSEG’s plant emissions optimization advisor (PEOA) with the objec-tive of achieving high-sulfur capture efficiency and NOx and particulatecontrol at minimum power requirements, zero wastewater discharge, andthe production of by-products instead of wastes from the scrubber [26].
406 Coal Energy Systems
The flue gas from NYSEG’s Milliken Station (Lansing, New York),Unit Nos. 1 and 2 (300 MW), was used in the project, and sulfur dioxideremovals of 98 and 95% were demonstrated with and without formic acid,respectively, and 39% NOx reduction was achieved [4].
Public Service Company of Colorado demonstrated the integration offive technologies—B&W’s DRB-XCL� low-NOx burners with OFA, in-ductsorbent injection, flue gas humidification, and furnace (urea) injection—with the objective of achieving 70% reduction in NOx and SO2 emissionsand, more specifically, to assess the integration of a down-fired low-NOxburner with in-furnace urea injection and dry sorbent in-duct injectionwith humidification for SO2 removal [27]. Testing performed on the Pub-lic Service Company of Colorado Arapahoe Station (Denver, Colorado), 100MW Unit No. 4, demonstrated 70% SO2 removal and 62 to 80% NOxreduction [4].
Advanced Electric Power Generation TechnologyThe CCT Program provides a range of advanced electric power generationoptions for both repowering and new power generation in response to theneed for load growth as well as environmental concerns. The emphasis of thisprogram category included technologies that could effectively repower agingpower plants faced with the need to both control emissions and respond togrowing power demands. Repowering is an important option because exist-ing power generation sites have significant value and warrant investmentbecause the infrastructure is in place and siting new plants represents a majorundertaking.
These advanced systems offer greater than 20% reductions in green-house gas emissions; SO2, NOx , and particulate emissions far belowNew Source Performance Standards (NSPSs); and salable solid and liquidby-products [4]. Over 1800 MW of capacity are represented by 11 projects,including five fluidized-bed combustion systems (two completed, one ongo-ing, and two terminated in June 2003 after completing designs), fourintegrated gasification combined cycle systems (three completed and oneongoing), and two advanced combustion/heat engine systems (one com-pleted and one delayed). The advanced electric power generation technologyprojects selected under the CCT Program are characterized by high ther-mal efficiency, very low pollutant emissions, reduced CO2 emissions, fewsolid waste problems, and enhanced economics. Five generic advanced elec-tric power generation technologies are demonstrated in the CCT Program:fluidized-bed combustion, integrated gasification combined cycle, integratedgasification fuel cell, coal-fired diesel, and slagging combustion.
Fluidized-Bed Combustion City of Lakeland (Florida), Lakeland Electricwas selected by the DOE for two CCT Program projects in 1989 and1993; however, in 2003 these projects were terminated due to economic

Future Power Generation 407
issues [9,28]. The first project, a pressurized circulating fluidized-bed (PCFB)project, was to demonstrate Foster Wheeler Corporation’s PCFB technol-ogy coupled with Siemens Westinghouse’s ceramic candle-type, hot-gascleanup system and power generation technologies, which were to representa cost-effective, high-efficiency, low-emissions means of adding generatingcapacity at greenfield sites or in repowering applications [4]. The secondproject, to be performed on the same boiler, was to demonstrate toppedPCFB technology in a fully commercial power generation setting, therebyadvancing the technology for future plants that will operate at higher gasturbine inlet temperatures and will be expected to achieve cycle efficienciesin excess of 45%.
JEA (formerly Jacksonville (Florida) Electric Authority) is demonstrat-ing atmospheric circulating fluidized-bed (ACFB) combustion at a scale largerthan previously operated. The objective of the project is to demonstrateACFB combustion at 297.5 MW, which represents a scale up from previouslyconstructed facilities; to verify expectations of the technology’s economic,environmental, and technical performance; to provide potential users withthe data necessary for evaluating a large-scale ACFB combustion as a com-mercial alternative; to accomplish greater than 90% SO2 removal; and toreduce NOx emissions by 60% when compared with conventional technol-ogy [4]. The CFB boiler has operated at full load and achieved rated outputand the demonstration test program has begun, but no published results areavailable [29].
The Ohio Power Company performed a pressurized fluidized-bed (bub-bling) combustion (PFBC) demonstration to verify expectations of PFBCeconomic, environmental, and technical performance in a combined-cyclerepowering application at utility scale; to accomplish greater than 90% SO2removal; and to achieve an NOx emission level of 0.3 lb/MM Btu at full load[30]. The demonstration was performed at the Ohio Power Company 70 MWTidd Plant (Brilliant, Ohio), Unit No. 1, and was the first large-scale opera-tional demonstration of PFBC in the United States. Sulfur dioxide removalefficiency of 90 to 95% was achieved at full load with calcium-to-sulfur(Ca/S) ratios of 1:1.4 and 1:5, respectively [4]. NOx emissions were 0.15 to0.33 lb/MM Btu, CO emissions were less than 0.01 lb/MM Btu, and partic-ulate emissions were less than 0.02 lb/MM Btu. Operationally, the PFBCboiler demonstrated commercial readiness.
Tri-State Generation and Transmission Association, Inc., demon-strated the feasibility of ACFB technology at the utility scale and evaluatedthe economic, environmental, and operational performance at that scale [31].Three small, coal-fired stoker boilers at the Nucla Station (Nucla, Colorado)were replaced with a new 110 MW atmospheric CFB boiler. Environmen-tally, SO2 capture efficiencies of 70 and 95% were achieved at Ca/S ratios of1.5 and 4.0, respectively; NOx emissions averaged 0.18 lb/MM Btu; CO emis-sions ranged from 70 to 140 ppm; particulate emissions ranged from 0.0072to 0.0125 lb/MM Btu (or 99.9% removal efficiency); and solid waste was

408 Coal Energy Systems
essentially benign and showed potential as an agricultural solid amendment,soil/roadbed stabilizer, or landfill cap [4].
Integrated Gasification Combined Cycle The integrated gasification com-bined cycle (IGCC) process has four basic steps: (1) fuel gas is generated froma gasifier; (2) either the fuel gas is passed directly to a hot-gas cleanup sys-tem to remove particulates, sulfur, and nitrogen compounds or the gas is firstcooled to produce steam and then cleaned conventionally; (3) the clean fuelgas is combusted in a gas turbine generator to produce electricity; and (4) theresidual heat in the hot exhaust from the gas turbine generator is recoveredin a heat-recovery steam generator, and the steam is used to produce addi-tional electricity in a steam turbine generator. IGCC systems are amongthe cleanest and most efficient of the emerging clean coal technologies [4].Sulfur, nitrogen compounds, and particulate matter are removed before thefuel is combusted (i.e., before combustion air is added), resulting in a muchlower volume of gas to be treated in a post-combustion scrubber. With hot-gas cleanup, IGGC systems have the potential for efficiencies of over 50%.An example of an IGCC system is shown in Figure 7-2 [32].
In a coal gasifier, the sulfur in the coal is released in the form of hydrogensulfide (H2S) rather than SO2 as in a combustion process. Several commercialprocesses are capable of removing H2S; more than 99% of the H2S can beremoved from the gas, making it as clean as natural gas. Energy conversionin fuels cells is more efficient than traditional energy conversion devices andcan be as high as 60%. A typical fuel cell system using coal as a fuel includesa coal gasifier with a gas cleanup system, a fuel cell that uses the coal gasto generate electricity (direct current) and heat, an inverter to convert directcurrent to alternating current, and a heat recovery system that can be usedto produce additional electric power in a bottoming steam cycle [4].
Fuel cells do not rely on combustion; instead, an electrochemical reac-tion generates electricity. Electrochemical reactions release the chemicalenergy that bonds atoms together—in this case, the atoms of hydrogenand oxygen [33]. The fuel cell is extremely clean and highly efficient. Ina clean coal technology application, the fuel cell is fueled either by hydro-gen extracted from the coal gas or a mixture of synthesis gas (low-Btu gasconsisting of CO and H2). In a coal gasification/fuel cell application, coalgas is supplied to the anode, and air and CO2 are supplied to the cathode toproduce electricity and heat. The principal waste product from the fuel cellis water.
Fuel cells are often categorized by the material used to separate the elec-trodes, which is termed the electrolyte. The most mature fuel cell conceptis the phosphoric acid fuel cell [33]. Other concepts include the molten car-bonate fuel cell (MCFC), which uses a hot mixture of lithium and potassiumcarbonate as the electrolyte, and the solid oxide fuel cell, which uses a hardceramic material instead of a liquid electrolyte. The MCFC is integratedwith one of the Clean Coal Technology IGCC projects described below.
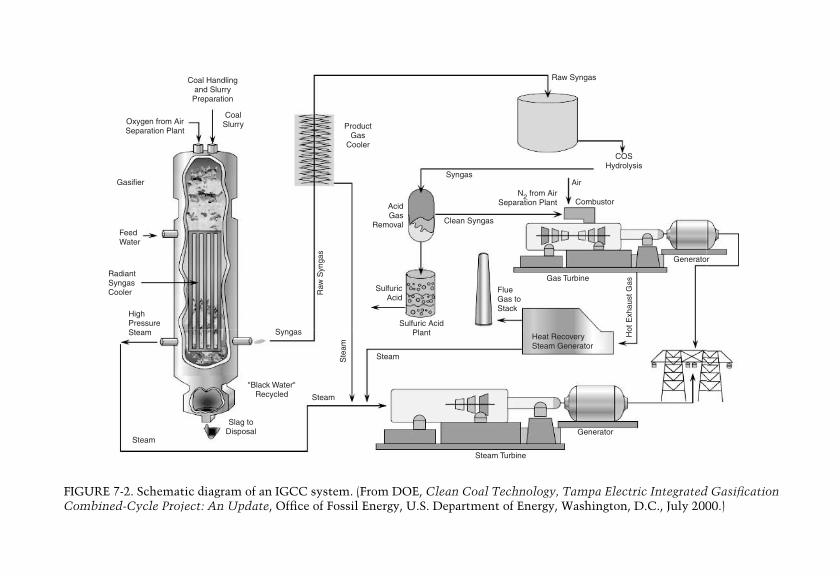
Coal Handlingand Slurry
Preparation
Oxygen from AirSeparation Plant
CoalSlurry
Gasifier
FeedWater
RadiantSyngasCooler
HighPressureSteam
Steam
Slag toDisposal
"Black Water"Recycled Steam
Steam
Syngas
SulfuricAcid
AcidGas
Removal
ProductGas
Cooler
Syngas
Gas Turbine
Generator
Air
Combustor
COSHydrolysis
Raw Syngas
Hot
Exh
aust
Gas
FlueGas toStack
Heat RecoverySteam Generator
Generator
Steam Turbine
Clean Syngas
N2 from AirSeparation Plant
Sulfuric AcidPlant
Raw
Syn
gas
Ste
am
FIGURE 7-2. Schematic diagram of an IGCC system. (From DOE, Clean Coal Technology, Tampa Electric Integrated GasificationCombined-Cycle Project: An Update, Office of Fossil Energy, U.S. Department of Energy, Washington, D.C., July 2000.)

410 Coal Energy Systems
Electrical Current
Hydrogen In Oxygen In
H2 O2
Water andHeat Out
CarbonDioxide In
AnodeElectrode
Cathode
CO2
H2O
CO3−2
e- e-
e-
e-
e-
e-
e-
e-
e-
e-
CO2
CO2
CO2 O2
FIGURE 7-3. Schematic diagram of a molten carbonate fuel cell. (From DOE,Energy Efficiency and Renewable Energy—Hydrogen, Fuel Cells, and Infra-structure Technologies Program, U.S. Department of Energy, Washington, D.C.,www.eere.energy.gov/hydrogenandfuelcells/fuelcells/types.html#mcfc. Last updatedJanuary 27, 2003.)
The MCFC evolved from work in the 1960s aimed at producing a fuelcell which would operate directly on coal [34]. While direct operation oncoal seems less likely today, operation on coal-derived fuel gases is bothtechnically and economically viable. The MCFC, shown schematically inFigure 7-3, uses a molten carbonate salt mixture as its electrolyte. The com-position of the electrolyte varies but usually consists of lithium carbonateand potassium carbonate. At an operating temperature of about 1200◦F, thesalt mixture is liquid and a good ionic conductor. The MCFC reactions thatoccur are [34]:
Anode reactions: H2 + CO2−3 −→ H2O + CO2 + 2e− (7-1)
CO + CO2−3 −→ 2CO2 + 2e− (7-2)
Cathode reaction: O2 + 2CO2 + 4e− −→ 2CO2−3 (7-3)
The anode process involves a reaction between hydrogen and carbon monox-ide and the carbonate ions from the electrolyte which produces water andcarbon dioxide and releases electrons to the anode [34]. The cathode processcombines oxygen and carbon dioxide from the oxidant stream with electronsfrom the cathode to produce carbonate ions that enter the electrolyte. Theuse of carbon dioxide in the oxidant stream requires a system for collectingcarbon dioxide from the anode exhaust and mixing it with the cathode feedstream. Of the four IGCC projects, three have completed operations and one
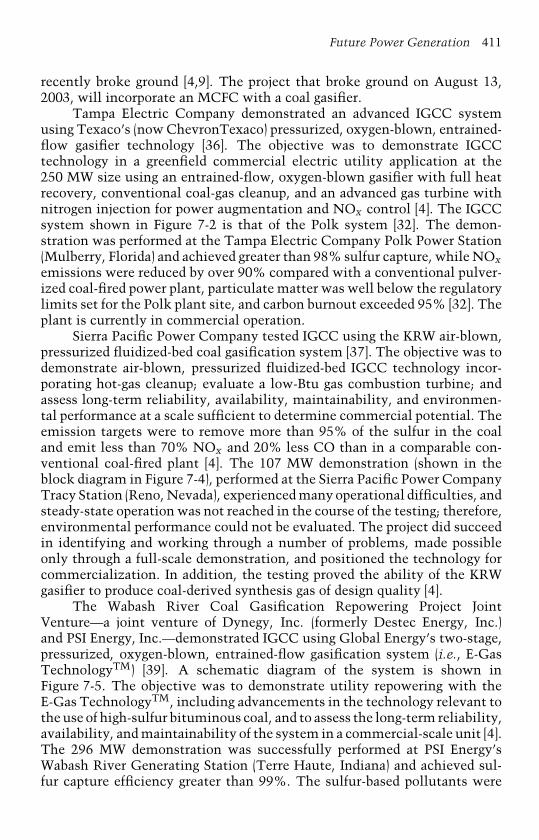
Future Power Generation 411
recently broke ground [4,9]. The project that broke ground on August 13,2003, will incorporate an MCFC with a coal gasifier.
Tampa Electric Company demonstrated an advanced IGCC systemusing Texaco’s (now ChevronTexaco) pressurized, oxygen-blown, entrained-flow gasifier technology [36]. The objective was to demonstrate IGCCtechnology in a greenfield commercial electric utility application at the250 MW size using an entrained-flow, oxygen-blown gasifier with full heatrecovery, conventional coal-gas cleanup, and an advanced gas turbine withnitrogen injection for power augmentation and NOx control [4]. The IGCCsystem shown in Figure 7-2 is that of the Polk system [32]. The demon-stration was performed at the Tampa Electric Company Polk Power Station(Mulberry, Florida) and achieved greater than 98% sulfur capture, while NOxemissions were reduced by over 90% compared with a conventional pulver-ized coal-fired power plant, particulate matter was well below the regulatorylimits set for the Polk plant site, and carbon burnout exceeded 95% [32]. Theplant is currently in commercial operation.
Sierra Pacific Power Company tested IGCC using the KRW air-blown,pressurized fluidized-bed coal gasification system [37]. The objective was todemonstrate air-blown, pressurized fluidized-bed IGCC technology incor-porating hot-gas cleanup; evaluate a low-Btu gas combustion turbine; andassess long-term reliability, availability, maintainability, and environmen-tal performance at a scale sufficient to determine commercial potential. Theemission targets were to remove more than 95% of the sulfur in the coaland emit less than 70% NOx and 20% less CO than in a comparable con-ventional coal-fired plant [4]. The 107 MW demonstration (shown in theblock diagram in Figure 7-4), performed at the Sierra Pacific Power CompanyTracy Station (Reno, Nevada), experienced many operational difficulties, andsteady-state operation was not reached in the course of the testing; therefore,environmental performance could not be evaluated. The project did succeedin identifying and working through a number of problems, made possibleonly through a full-scale demonstration, and positioned the technology forcommercialization. In addition, the testing proved the ability of the KRWgasifier to produce coal-derived synthesis gas of design quality [4].
The Wabash River Coal Gasification Repowering Project JointVenture—a joint venture of Dynegy, Inc. (formerly Destec Energy, Inc.)and PSI Energy, Inc.—demonstrated IGCC using Global Energy’s two-stage,pressurized, oxygen-blown, entrained-flow gasification system (i.e., E-GasTechnologyTM) [39]. A schematic diagram of the system is shown inFigure 7-5. The objective was to demonstrate utility repowering with theE-Gas TechnologyTM, including advancements in the technology relevant tothe use of high-sulfur bituminous coal, and to assess the long-term reliability,availability, and maintainability of the system in a commercial-scale unit [4].The 296 MW demonstration was successfully performed at PSI Energy’sWabash River Generating Station (Terre Haute, Indiana) and achieved sul-fur capture efficiency greater than 99%. The sulfur-based pollutants were

412C
oalE
nergy
Systems
Air Air
Coal and Limestone
Steam
Steam
1800°F 1000°F 1000°F
Hot Flue Gas
FlueGas
Stack46 MWe
61 MWe
Air1000°FCleanFuel Gas
StackAir
Flue Gas
Steam
Fines
RegenerationOff-GasSteam
Ash, Char,Spent Sorbent Flue
Gas
Air
RawFuelGas
Limestone Solid Waste Construction Material,Agricultural Use or Landfill
Coal and Limestone
Preparation
KRWGasifier/
Desulfurizer
BoostAir
Compressor
GasCooling
HeatRecovery
SteamGenerator
SteamTurbine
Generator
HotExternal
Desulfurizerand SorbentRegeneration
Gas Turbine
Generator
Hot ParticulateRemoval
FinesCombustor
Sulfator
Auxiliaries-7MW
100 MWe
FIGURE 7-4. Block diagram of the Piñon Pine IGCC system. (From DOE, Clean Coal Technology: The Piñon Pine Power Project,Technical Report No. 6, Office of Fossil Energy, U.S. Department of Energy, Washington, D.C., December 1996.)
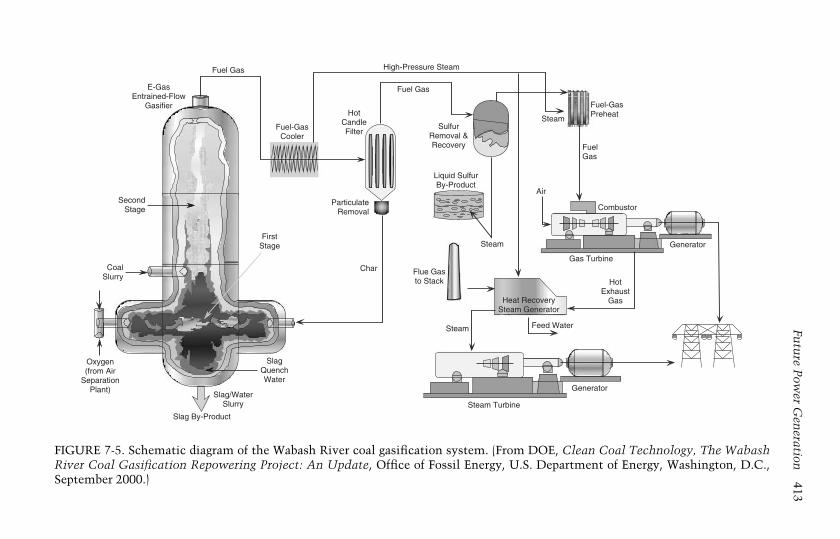
Futu
reP
ower
Gen
eration413
Oxygen(from Air
SeparationPlant)
Slag By-Product
SlagQuenchWater
Slag/WaterSlurry
CoalSlurry
SecondStage
E-GasEntrained-Flow
Gasifier
Fuel Gas
Fuel Gas
High-Pressure Steam
Fuel-GasCooler
HotCandleFilter
ParticulateRemoval
FirstStage
Char Flue Gasto Stack
Steam
Steam Turbine
Gas Turbine
Generator
Generator
Air
Steam
Combustor
Liquid SulfurBy-Product
SulfurRemoval &Recovery
Steam
FuelGas
Fuel-GasPreheat
Feed Water
Heat RecoverySteam Generator
HotExhaust
Gas
FIGURE 7-5. Schematic diagram of the Wabash River coal gasification system. (From DOE, Clean Coal Technology, The WabashRiver Coal Gasification Repowering Project: An Update, Office of Fossil Energy, U.S. Department of Energy, Washington, D.C.,September 2000.)

414 Coal Energy Systems
Combustor
Air
Coal and Pelletized RDF
British Gas Lurgi Coal
Gasifier (4)
Oxygen Plant O2
N2 to Combustor
Grate
Steam and
OxygenSlag
Tars, Oils,
Particulates
Fuel Gas
Steam
Tars, Oils,
Particulates
Product Gas
Cooler
Conventional Gas
Cleanup
Gas-Polishing and
MoisturizationGas Slipstream
2.0 MW Fuel Cell
Generator
Gas Turbine (2)
Hot Gas
Exhaust GasHeat Recovery
Steam GeneratorSteam
Stack
Generator
Steam Turbine
Sulfur Recovery
Sulfur By-Product
Steam
Gas Liquor
Separator
Aqueous Effluent
To Disposal
FIGURE 7-6. Schematic diagram of the Kentucky Pioneer Energy IGCC demonstra-tion project (with MCFC slipstream shown). (From DOE, Clean Coal TechnologyDemonstration Program: Program Update 2001 Including Power Plant ImprovementInitiative Projects, Office of Fossil Energy, U.S. Department of Energy, Washington,D.C., July 2002.)
converted into 99.99% pure sulfur, NOx emissions were 0.15 lb/MM Btu(thus meeting 2003 target emission limits for ozone non-attainment areas),particulate emissions were below detectable limits, CO emissions averaged0.05 lb/MM Btu, and coal ash was converted to a low-carbon vitreous slagvalued as an aggregate in construction or as grit for abrasives and roofingmetals [4]. The plant is currently in commercial operation.
Kentucky Pioneer Energy, LLC, was awarded a CCT Program project todemonstrate and assess the reliability, availability, and maintainability of autility-scale IGCC system using a high-sulfur bituminous coal and refuse-derived fuel blend in oxygen-blown, fixed-bed, BGL slagging gasifiers, andthe operability of an MCFC fueled by coal gas [4]. The IGCC system, shownin Figure 7-6, is located at the East Kentucky Power Cooperative Smith site(Trapp, Kentucky), and its capacity is 580 MW. The MCFC portion of theproject, which is a slipstream of fuel gas fed to the gas turbine (and rated at2.0 MW), has been moved to the Wabash River site [9]. The IGCC system tobe demonstrated in this project is suitable for both repowering applicationsand new power plants. Permitting for the IGCC system is still under way.The fuel cell portion of the project broke ground in August 2003 [9].
Advanced Combustion/Heat Engines Two projects are demonstratingadvanced combustion/heat engine technology. One project has been com-pleted, and the other is delayed. Alaska Industrial Development and Export

Future Power Generation 415
Authority demonstrated TRW’s clean coal combustion system integratedwith B&W’s spray dryer absorber (SDA) with sorbent recycle [41]. Thedemonstration was performed adjacent to Healy Unit No. 1. The objec-tive was to demonstrate an innovative new power plant design featuringintegration of an advanced combustor coupled with both high- and low-temperature emissions control processes. Emissions were controlled usingTRW’s advanced entrained/slagging combustors through staged fuel and airinjection for NOx control and limestone injection for SO2 control. AdditionalSO2 control was accomplished using B&W’s activated recycle SDA. Carbonburnout goals of greater than 99% were achieved and emissions were suc-cessfully controlled: NOx emissions averaged 0.245 lb/MM Btu, SO2 removalefficiencies in excess of 90% were achieved with typical emissions of 0.038lb/MM Btu, particulate matter emissions were 0.0047 lb/MM Btu, and COemissions were less than 130 ppm at 3.0% O2 [4].
TIAX (formerly Arthur D. Little, Inc.) is demonstrating a coal-fireddiesel engine operation with the objective to prove the design, operability,and durability of the coal diesel engine during 4000 hours of operation andto test a coal slurry in the diesel [4]. A Fairbanks Morse 18-cyclinder, heavy-duty engine (6.4 MW) modified to operate on Alaskan subbituminous coalmade into a low-rank coal-water fuel is expected to have very low NOx andSO2 emission levels (50–70% below current NSPSs). In addition, the demon-stration plant, located at the University of Alaska (Fairbanks), is expectedto achieve 41% efficiency, with future plant designs expected to reach 48%efficiency, which will result in a 25% reduction in CO2 emissions comparedwith conventional coal-fired plants. Testing has been delayed due to TIAX’sreorganization [9].
Coal Processing for Clean Fuels TechnologyThe CCT Program also addresses approaches to converting raw run-of-minecoals to high-energy density, low-sulfur products. Four projects completed inthe category of coal processing for clean fuels represent a diversified portfo-lio and include two projects that produced high-energy density solid fuels(see discussion in Chapter 5, Technologies for Coal Utilization), one ofwhich also produced a liquid product equivalent to No. 6 fuel oil; one projectthat demonstrated a new methanol production process; and one project thatcomplemented the process demonstrations by providing an expert computermodel that enables a utility to assess the environmental, operational, andcost impact of utilizing coals not previously burned at a facility, includingupgraded coal and coal blends [4].
ENCOAL Corporation demonstrated SGI International’s Liquids-From-Coal (LFC�) process at Triton Coal Company’s Buckskin Mine (located nearGillette, Wyoming) [42]. The project objective was to demonstrate the inte-grated operation of a number of novel processing steps to produce two higherheating value fuel forms with lower sulfur contents from mild gasification of
416 Coal Energy Systems
low-sulfur subbituminous coal and to provide sufficient products for poten-tial end users to conduct burn tests. The process, described in Chapter 5,produces a Process-Derived Fuel (PDF�) and Coal-Derived Liquid (CDL�).The LFC� process consistently produced 250 short tons/day of PDF� and250 barrels/day of CDL� from 500 short tons of run-of-mine coal per day. ThePDF� contains 0.26% sulfur with a heat content of 11,100 Btu/lb (comparedwith 0.45% sulfur and 8300 Btu/lb for the feed coal) [4]. The CDL� contains0.6% sulfur and has a heating value of 140,000 Btu/gallon (compared with0.8% sulfur and 150,000 Btu/gallon for No. 6 fuel oil) [4].
Western SynCoal LLC (formerly Rosebud SynCoal Partnership, a sub-sidiary of Montana Power Company’s Energy Supply Division) demonstratedtheir advanced coal conversion process (ACCP) of upgrading low-rank sub-bituminous coal and lignite [43]. The process, described in Chapter 5, wasperformed to demonstrate the potential of ACCP to produce a stable coalproduct having a moisture content as low as 1%, sulfur content as low as0.3%, and heating value up to 12,000 Btu/lb [4]. The ACCP project processedover 2.8 million short tons of raw coal at Colstrip, Montana, to producenearly 1.9 million short tons of SynCoal� products that were shipped toutility and industrial users. Lower emissions of SO2 and NOx were reportedin addition to increased power plant output due to the higher grade of fuelburned.
Air Products Liquid Phase Conversion Company, LP (a limited part-nership between Air Products and Chemicals, Inc., the general partner, andEastman Chemical Company), demonstrated Air Products and Chemicals’liquid-phase methanol process [44]. The objective was to demonstrate, on acommercial scale, the production of methanol from coal-derived synthesisgas using the LPMEOHTM process; to determine the suitability of methanolproduced during this demonstration for use as a chemical feedstock or as alow SO2- and NOx-emitting alternative fuel in stationary and transportationapplications; and to demonstrate, if practical, the production of dimethylether (DME) as a mixed co-product with methanol [4]. The LPMEOHTM pro-cess, illustrated in Figure 7-7, was successfully operated for 69 months, andthe demonstration ended in December 2002 [45]. Over the entire operatingperiod, the demonstration facility (located at Kingsport, Tennessee) operatedat an on-stream availability of 97.5% and produced nearly 104 million gallonsof methanol, all of which was accepted by Eastman Chemical Company foruse in downstream chemical processes. The facility is currently being oper-ated in a commercial mode by Eastman Chemical Company [45]. The processwas developed to enhance IGCC power generation by producing a clean-burning, storable liquid fuel from clean coal-derived gas. Methanol containsno sulfur and has exceptionally low NOx characteristics when burned.
The final project in this category was the development of CQ, Inc.’s(Homer City, Pennsylvania) EPRI Coal Quality ExpertTM (CQETM) computersoftware [47]. The objective of the project was to provide the utility industrywith a PC software program it could use to confidently and inexpensively

Futu
reP
ower
Gen
eration417
H2 Feed gas Recycle Syngas Purge Gas
Balanced Feed Gas
CO Feed Gas
Guard Bed
Compressor
Economizer
Cyclone
LPMEOHTM
Reactor
Nitrogen
Syngas
Oil Return
Slurry Additionand Withdrawal
SteamDrum
OilSeparator
CondensersUnreacted Syngas
MethanolSeparator
MethanolDistillation
Section Refined Methanol
DayStorage
To Vent Scrubber
Refined Methanol
Crude Methanol
Condensate Return
Steam Import/Export
Boiler Feed Water
Fresh CatalystOil Feed
Hot Oil
CatalystReduction
Vessel
Spent Catalystto Reclaiming
To Fuel
FIGURE 7-7. LPMEOHTM demonstration unit process flow diagram. (From DOE, Clean Coal Technology: Commercial-ScaleDemonstration of the Liquid Phase Methanol (LPMEOHTM) Process, Technical Report No. 11, Office of Fossil Energy, U.S.Department of Energy, Washington, D.C., April 1999.)
418 Coal Energy Systems
evaluate the potential for coal cleaning, blending, and switching options toreduce emissions while producing the lowest cost electricity [4]. Specifi-cally, the project was intended to (1) enhance the existing Coal QualityInformation Systems (CQISTM) database and Coal Quality Impact Model(CQIMTM) to allow assessment of the effects of coal cleaning on specificboiler costs and performance; and (2) develop and validate CQETM, a modelthat allows accurate and detailed prediction of coal quality impacts ontotal power plant operating cost and performance. The model that wasdeveloped evaluates the impacts of coal quality, capital improvements, oper-ational changes, and environmental compliance alternatives on power plantemissions, performance, and production costs [4].
Industrial Applications TechnologyProjects were also undertaken to address pollution problems associated withusing coal in the industrial sector. Five projects encompass substitutionof coal for 40% of the coke in iron making (completed), integration ofa direct iron-making process with the production of electricity (ongoing),reduction of cement kiln emissions and solid-waste generation (completed),demonstration of an industrial-scale slagging combustor (completed), anddemonstration of a pulse combustor system (completed). Although electric-ity can be produced at the industrial scale, these projects are not discussedin this chapter as they have limited or no applicability in power generationand, except for the Blast Furnace Granular-Coal Injection System Demon-stration Project [48] and Passamaquoddy Technology Recovery ScrubberTM,have not been considered commercial successes in that no domestic or inter-national sales have been made of the demonstrated technologies nor are theyin continued operation at the demonstration site [49].
CCT Program AccomplishmentsOver the past 15 to 20 years, the Clean Coal Technology DemonstrationProgram has successfully demonstrated technologies that [50]:
• Increase efficiency and reduce emissions from coal-fired power plantsand industrial facilities;
• Expand the number of options, such as fluidized-bed boilers andgasifiers, available for the clean use of coal;
• Produce coal-based fuels that burn cleaner and help reduce emis-sions.
Many of the technologies that have been demonstrated under this Pro-gram are now in commercial use. Table 7-3 lists the 38 projects discussed inthe previous section and those projects considered commercial successes todate are noted. Commercial success is considered if domestic or international
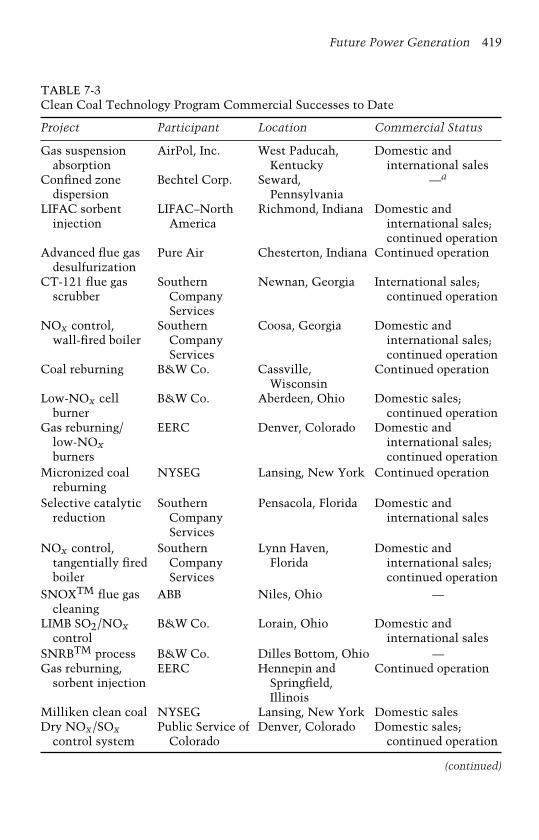
Future Power Generation 419
TABLE 7-3Clean Coal Technology Program Commercial Successes to Date
Project Participant Location Commercial Status
Gas suspensionabsorption
AirPol, Inc. West Paducah,Kentucky
Domestic andinternational sales
Confined zonedispersion
Bechtel Corp. Seward,Pennsylvania
—a
LIFAC sorbentinjection
LIFAC–NorthAmerica
Richmond, Indiana Domestic andinternational sales;continued operation
Advanced flue gasdesulfurization
Pure Air Chesterton, Indiana Continued operation
CT-121 flue gasscrubber
SouthernCompanyServices
Newnan, Georgia International sales;continued operation
NOx control,wall-fired boiler
SouthernCompanyServices
Coosa, Georgia Domestic andinternational sales;continued operation
Coal reburning B&W Co. Cassville,Wisconsin
Continued operation
Low-NOx cellburner
B&W Co. Aberdeen, Ohio Domestic sales;continued operation
Gas reburning/low-NOxburners
EERC Denver, Colorado Domestic andinternational sales;continued operation
Micronized coalreburning
NYSEG Lansing, New York Continued operation
Selective catalyticreduction
SouthernCompanyServices
Pensacola, Florida Domestic andinternational sales
NOx control,tangentially firedboiler
SouthernCompanyServices
Lynn Haven,Florida
Domestic andinternational sales;continued operation
SNOXTM flue gascleaning
ABB Niles, Ohio —
LIMB SO2/NOxcontrol
B&W Co. Lorain, Ohio Domestic andinternational sales
SNRBTM process B&W Co. Dilles Bottom, Ohio —Gas reburning,
sorbent injectionEERC Hennepin and
Springfield,Illinois
Continued operation
Milliken clean coal NYSEG Lansing, New York Domestic salesDry NOx/SOx
control systemPublic Service of
ColoradoDenver, Colorado Domestic sales;
continued operation
(continued)
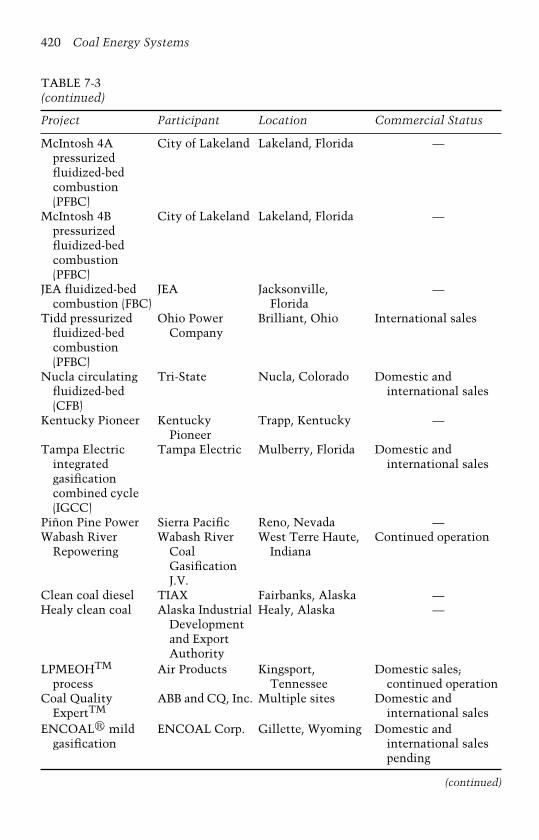
420 Coal Energy Systems
TABLE 7-3(continued)
Project Participant Location Commercial Status
McIntosh 4Apressurizedfluidized-bedcombustion(PFBC)
City of Lakeland Lakeland, Florida —
McIntosh 4Bpressurizedfluidized-bedcombustion(PFBC)
City of Lakeland Lakeland, Florida —
JEA fluidized-bedcombustion (FBC)
JEA Jacksonville,Florida
—
Tidd pressurizedfluidized-bedcombustion(PFBC)
Ohio PowerCompany
Brilliant, Ohio International sales
Nucla circulatingfluidized-bed(CFB)
Tri-State Nucla, Colorado Domestic andinternational sales
Kentucky Pioneer KentuckyPioneer
Trapp, Kentucky —
Tampa Electricintegratedgasificationcombined cycle(IGCC)
Tampa Electric Mulberry, Florida Domestic andinternational sales
Piñon Pine Power Sierra Pacific Reno, Nevada —Wabash River
RepoweringWabash River
CoalGasificationJ.V.
West Terre Haute,Indiana
Continued operation
Clean coal diesel TIAX Fairbanks, Alaska —Healy clean coal Alaska Industrial
Developmentand ExportAuthority
Healy, Alaska —
LPMEOHTM
processAir Products Kingsport,
TennesseeDomestic sales;
continued operationCoal Quality
ExpertTMABB and CQ, Inc. Multiple sites Domestic and
international salesENCOAL� mild
gasificationENCOAL Corp. Gillette, Wyoming Domestic and
international salespending
(continued)
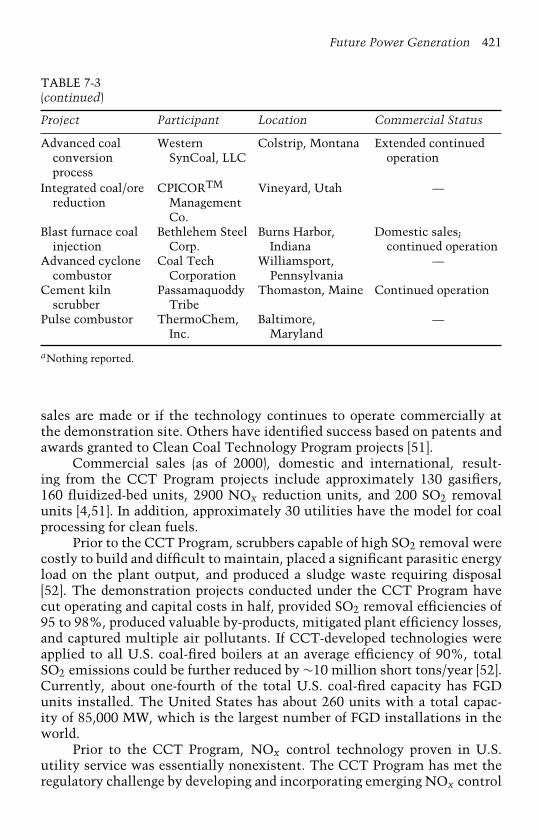
Future Power Generation 421
TABLE 7-3(continued)
Project Participant Location Commercial Status
Advanced coalconversionprocess
WesternSynCoal, LLC
Colstrip, Montana Extended continuedoperation
Integrated coal/orereduction
CPICORTM
ManagementCo.
Vineyard, Utah —
Blast furnace coalinjection
Bethlehem SteelCorp.
Burns Harbor,Indiana
Domestic sales;continued operation
Advanced cyclonecombustor
Coal TechCorporation
Williamsport,Pennsylvania
—
Cement kilnscrubber
PassamaquoddyTribe
Thomaston, Maine Continued operation
Pulse combustor ThermoChem,Inc.
Baltimore,Maryland
—
aNothing reported.
sales are made or if the technology continues to operate commercially atthe demonstration site. Others have identified success based on patents andawards granted to Clean Coal Technology Program projects [51].
Commercial sales (as of 2000), domestic and international, result-ing from the CCT Program projects include approximately 130 gasifiers,160 fluidized-bed units, 2900 NOx reduction units, and 200 SO2 removalunits [4,51]. In addition, approximately 30 utilities have the model for coalprocessing for clean fuels.
Prior to the CCT Program, scrubbers capable of high SO2 removal werecostly to build and difficult to maintain, placed a significant parasitic energyload on the plant output, and produced a sludge waste requiring disposal[52]. The demonstration projects conducted under the CCT Program havecut operating and capital costs in half, provided SO2 removal efficiencies of95 to 98%, produced valuable by-products, mitigated plant efficiency losses,and captured multiple air pollutants. If CCT-developed technologies wereapplied to all U.S. coal-fired boilers at an average efficiency of 90%, totalSO2 emissions could be further reduced by ∼10 million short tons/year [52].Currently, about one-fourth of the total U.S. coal-fired capacity has FGDunits installed. The United States has about 260 units with a total capac-ity of 85,000 MW, which is the largest number of FGD installations in theworld.
Prior to the CCT Program, NOx control technology proven in U.S.utility service was essentially nonexistent. The CCT Program has met theregulatory challenge by developing and incorporating emerging NOx control

422 Coal Energy Systems
technologies into a portfolio of cost-effective compliance options for the fullrange of boiler types being used commercially [52]. Products of the CCTProgram for NOx control include:
• Low-NOx burners, overfire air, and reburning systems that modifythe combustion process to limit NOx formation;
• Post-combustion control options using SCR and SNCR;• Artificial-intelligence-based control systems that effectively han-
dle numerous dynamic parameters to optimize operational andenvironmental performance of boilers.
As a result, over three-fourths of U.S. coal-fired power plants haveinstalled low-NOx burners. Reburning and artificial intelligence systemshave made significant market penetration as well. All sites that developedthese NOx control technologies have retained them for commercial use.In addition, several commercial installations of SCR and, to some extent,SNCR have been installed with many planned for installation in the nearfuture.
The CCT Program has provided the foundation for power in the twenty-first century through successful demonstration of FBC and IGCC projectson a commercial scale. These technologies are inherently clean, producingnegligible emissions of SO2, NOx , and particulate matter. The IGCC demon-stration projects have achieved excellent environmental performance, withemissions as low as 0.02 lb SO2 per MM Btu and 0.08 lb NOx per MM Btu.In addition, the higher thermal efficiency processes result in significantreductions in CO2 emissions.
Power Plant Improvement Initiative (PPII)
The success of the CCT Program serves as a model for other cooperativegovernment/industry programs aimed at introducing new technologies intothe commercial marketplace. Two follow-up programs have been developedthat build on the successes of the CCT Program: the Power Plant Improve-ment Initiative (PPII) and the Clean Coal Power Initiative (CCPI). The PPII,established by the Department of the Interior and Related Agencies Appro-priations for Fiscal Year 2001 (Public Law 106-291), is a cost-shared program,patterned after the CCT Program and directed toward improved reliabilityand environmental performance of the nation’s existing coal-burning powerplants [29]. Authorized by the U.S. Congress in 2001, the PPII originallyinvolved eight projects; two projects withdrew after being selected, four arein progress, and two are under negotiation. The four projects that are underway have a total cost of more than $41 million, of which the private sector iscontributing nearly $24 million, exceeding the 50% private sector cost sharemandated by Congress.

Future Power Generation 423
PPII ProjectsThe PPII projects focus on technologies enabling coal-fired power plants tomeet increasingly stringent environmental regulations at the lowest possiblecost. With many plants threatened with shutdowns because of environ-mental concerns, more effective and lower cost emission controls can keepgenerators operating while improving the quality of the nation’s air and water[5]. A brief description of the ongoing projects and their objectives is providedhere.
Sunflower Electric Power Company, with GE Energy and Environmen-tal Research (formerly Energy and Environmental Research Corporation),will be demonstrating a unique combination of high-tech combustion mod-ifications and sophisticated control systems with the goal of reducing NOxemissions to 0.15 to 0.22 lb/MM Btu [53]. The project will be performedon Holcomb Station (Garden City, Kansas), a 360 MW, pulverized coal-fired boiler firing subbituminous coal. The reduction in NOx emissionswill be accomplished by modifying existing low-NOx burners, separatingthe overfire air, installing fuel flow measurement transducers, balancing thecombustion air, and using neural network controls.
Otter Tail Power Company, with Montana Dakota Utilities, North-Western Public Service, W.L. Gore & Associates, Inc., and the University ofNorth Dakota Energy and Environmental Research Center, will be demon-strating, in a full-scale application, a hybrid technology that increases theparticulate matter capture in coal plants up to 99.99% by integrating fabricfiltration and electrostatic precipitation [54]. The advanced hybrid particu-late collector (AHPC), discussed in Chapter 6, combines the best features ofan electrostatic precipitator (ESP) and a baghouse in the same housing, pro-viding major synergism between the two methods to overcome the problemof excessive fine particulate emissions that escape collection in an ESP andthe re-entrainment of dust in a baghouse. The demonstration is being per-formed on Big Stone Power Plant’s (Big Stone City, South Dakota) 450 MWcyclone-fired boiler and is a scale-up from a 2.5 MW slipstream test programthat was performed at the plant.
Tampa Electric Company and Pegasus Technology, Inc., will be demon-strating control of boiler fouling on Big Bend Power Station’s (ApolloBeach, Florida) 445 MW unit using a neural-network soot-blowing system inconjunction with advanced controls and instruments [55]. Ash and slag depo-sition compromise plant efficiency by impeding heat transfer to the workingfluid, leading to higher fuel consumption and higher emissions. The processoptimization is targeted to reduce total NOx generation by 30% or more,improve heat rate by 2%, and reduce particulate matter emissions by 5%.As compared to competing technologies, this system could be an extremelycost-effective technology that has the ability to be readily adapted to virtuallyany pulverized coal-fired boiler.
In the fourth PPII project that is under way, Universal AggregatesLLC (a joint venture between CONSOL Energy, Inc., and SynAggs, Inc.)

424 Coal Energy Systems
will design, build, and operate an aggregate manufacturing plant that con-verts 115,000 short tons/year of spray dryer by-products into 150,000 shorttons/year of lightweight masonry blocks or lightweight concrete [56]. Only∼18% of flue gas desulfurization residue in the United States is recycled,with the remainder landfilled. This process will reduce plant disposal costsand the environmental drawbacks of landfilling by producing a salable by-product. The demonstration will be located by the Birchwood Power Facilityin King George County, Virginia.
The two projects under negotiation with the DOE also pertain to emis-sions reduction. In one project, CONSOL Energy, Inc., is proposing todemonstrate a multipollutant control system that can cost-effectively reduceNOx , SO2, acid gases (i.e., hydrochloric and hydrofluoric acids), and mercuryfrom smaller coal-fired power plants using single-bed, in-duct SCR combinedwith low-NOx combustion technology [57]. In the second project, proposedby TIAX, a hybrid system composed of lower cost components from threeestablished NOx reduction systems (i.e., fuel-lean gas reburn, SNCR, andSCR) will be developed and demonstrated to reduce NOx emissions to 0.15lb/MM Btu at lower costs than conventional SCR [58].
Benefits of the PPIIThe PPII, a precursor to CCPI, is designed to establish commercial-scaledemonstrations of coal technologies to ensure energy supply reliability [3].The PPII is poised to make near-term contributions to air quality improve-ments and focuses on technology that can be commercialized over the nextfew years.
Clean Coal Power Initiative (CCPI)
The second follow-on program to the CCT Program is the Clean Coal PowerInitiative (CCPI), which was initiated by President Bush in 2002 and is aninnovative technology demonstration program that fosters more efficientclean coal technologies for use in existing and new power generation facil-ities in the United States [6]. Candidate technologies are demonstrated at asignificant scale to ensure proof-of-operation prior to widespread commer-cialization. Technologies emerging from this program will help to meet thepresident’s new environmental objectives for the United States, as detailedin the Clear Skies Initiative, Global Climate Change Initiative, and Future-Gen, and to advance pollution control and coal utilization, both in theUnited States and abroad. Early demonstrations emphasize technologiesthat are applicable to existing power plants and include construction ofnew plants. Later demonstrations will include systems comprising advancedturbines, membranes, fuel cells, gasification technologies, and hydrogenproduction [6]. CCPI is a multiyear program funded at a total federal cost
Future Power Generation 425
of up to $2 billion, with the private sector cost-share being at least 50%.CCPI responds to President Bush’s commitment to clean coal technologydevelopment as part of his National Energy Policy [59]. Priorities coveredby the National Energy Policy include increasing the country’s domesticenergy supply, protecting its environment, ensuring a comprehensive energydelivery system, and enhancing national energy security [3].
The Clean Coal Power Initiative will be conducted over four solici-tations (Rounds 1 through 4). Round 1 proposals were submitted in 2002,with eight projects selected in January 2003 out of 36 proposals submitted(although one project has subsequently withdrawn). The projects selectedare comprised of power generation, co-production, multipollutant emissionscontrol, advanced control systems, and by-product utilization. Negotiationsare under way, and the projects total $1.23 billion, of which the DOE is pro-viding $286 million or 23% of the total [60]. Round 2 planning activities areunder way; the solicitation is to be released in 2004 and project selectionsare planned for 2005. The emphasis of the second solicitation will be onefficiency improvements and advanced multipollutant (including mercury)controls for Clear Skies technologies. Round 3 (tentative award date 2007)will emphasize co-production, membranes, fuel cells, and energy systemswith efficiencies greater than 50%. Near-zero emissions, hydrogen produc-tion and transportation, sequestration, and efficiencies greater than 55%(Vision 21 modules) will be emphasized in Round 4 (tentative award date2009).
Program ImportanceThe strength and security of the U.S. economy are closely linked to the avail-ability, reliability, and cost of electric power. Economic growth is linkedto reliable and affordable electric power. Electricity requirements for theUnited States are steadily increasing, and coal will play a significant rolein satisfying U.S. energy needs. CCPI will help meet these energy electric-ity demands by demonstrating new generation technologies [6]. CCPI willalso enable effective use of existing facilities and prepare for their retire-ment by demonstrating technological improvements in efficiency; advancedlow-cost, high-performance emissions control technologies; and reliabilityat new and existing plants. CCPI is closely aligned with research, develop-ment, and demonstration activities being performed under the DOE’s Coaland Power Systems core research and development programs that are work-ing toward ultra-clean fossil-fuel-based energy systems in the twenty-firstcentury [2,3]. CCPI technologies will address existing and new regulatoryrequirements and complement the goals of the FutureGen Project, whichis an initiative to create the world’s first coal-based, zero-emission elec-tricity and hydrogen plant (see later discussion). CCPI will help the UnitedStates achieve improved power plant performance and near-zero emissionsand is integral to achieving new plant performance targets identified in the
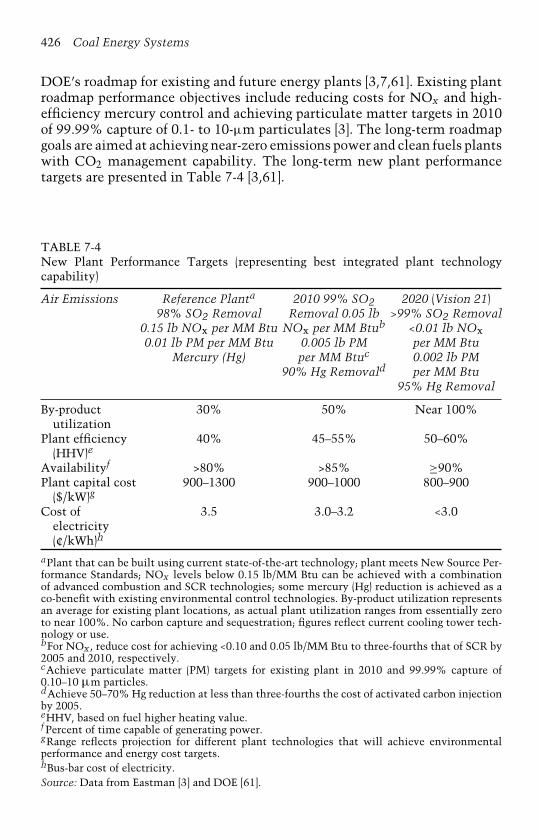
426 Coal Energy Systems
DOE’s roadmap for existing and future energy plants [3,7,61]. Existing plantroadmap performance objectives include reducing costs for NOx and high-efficiency mercury control and achieving particulate matter targets in 2010of 99.99% capture of 0.1- to 10-µm particulates [3]. The long-term roadmapgoals are aimed at achieving near-zero emissions power and clean fuels plantswith CO2 management capability. The long-term new plant performancetargets are presented in Table 7-4 [3,61].
TABLE 7-4New Plant Performance Targets (representing best integrated plant technologycapability)
Air Emissions Reference Planta 2010 99% SO2 2020 (Vision 21)98% SO2 Removal Removal 0.05 lb >99% SO2 Removal
0.15 lb NOx per MM Btu NOx per MM Btub <0.01 lb NOx0.01 lb PM per MM Btu 0.005 lb PM per MM Btu
Mercury (Hg) per MM Btuc 0.002 lb PM90% Hg Removald per MM Btu
95% Hg Removal
By-productutilization
30% 50% Near 100%
Plant efficiency(HHV)e
40% 45–55% 50–60%
Availabilityf >80% >85% ≥90%Plant capital cost
($/kW)g900–1300 900–1000 800–900
Cost ofelectricity(¢/kWh)h
3.5 3.0–3.2 <3.0
aPlant that can be built using current state-of-the-art technology; plant meets New Source Per-formance Standards; NOx levels below 0.15 lb/MM Btu can be achieved with a combinationof advanced combustion and SCR technologies; some mercury (Hg) reduction is achieved as aco-benefit with existing environmental control technologies. By-product utilization representsan average for existing plant locations, as actual plant utilization ranges from essentially zeroto near 100%. No carbon capture and sequestration; figures reflect current cooling tower tech-nology or use.bFor NOx , reduce cost for achieving <0.10 and 0.05 lb/MM Btu to three-fourths that of SCR by2005 and 2010, respectively.cAchieve particulate matter (PM) targets for existing plant in 2010 and 99.99% capture of0.10–10 µm particles.dAchieve 50–70% Hg reduction at less than three-fourths the cost of activated carbon injectionby 2005.eHHV, based on fuel higher heating value.f Percent of time capable of generating power.gRange reflects projection for different plant technologies that will achieve environmentalperformance and energy cost targets.hBus-bar cost of electricity.Source: Data from Eastman [3] and DOE [61].
Future Power Generation 427
Round 1 CCPI ProjectsEarly demonstrations of CCPI will emphasize advanced technologies thatare applicable to existing power plants but will also include construction ofnew, advanced, clean coal power plants. Figure 7-8 shows the locations ofthe seven projects selected and the amount of funding, both DOE and privatesector, for each project. Two of the projects are directed at new ways tocomply with the Clear Skies Initiative, which calls for dramatic reductions inair pollutants from power plants over the next 15 years [60]. Three projects areexpected to contribute to the Climate Change Initiative to reduce greenhousegases. The final two projects will use abundant waste materials that resultedfrom earlier coal mining activities while reducing air pollution through coalgasification and multipollutant control systems. Brief descriptions of thetechnologies being demonstrated in each project are provided here.
New Technologies for Clear Skies InitiativeWisconsin Electric Power Company will design, install, operate, and eval-uate the TOXECON process as an integrated emissions control system formercury, particulate matter, SO2, and NOx [3,62]. A TOXECON unit, shownschematically in Figure 7-9 [3], will be installed on the combined flue gas ofWisconsin Electric Power Company’s Presque Isle Power Plant Units 7, 8,and 9 for a total of 270 MW. TOXECON represents an option for greaterthan 80% mercury control for coal-fired power plants, may be the primarymercury control option for western coals, and may be the only choice forunits with hot-side ESPs [62]. The TOXECON configuration allows for sep-arate treatment or disposal of the fly ash collected in the primary particulatecontrol device. Powdered activated carbon will be injected for mercury con-trol, and sodium-based additives will be injected for reducing SO2 and NOxemissions.
Colorado Springs Utilities (CSU) and Foster Wheeler are demonstratingan advanced coal-fired power plant that will have unprecedented low emis-sions levels using advanced low-cost emission control systems [3,62]. Fullyintegrated, multilayered emission controls are being combined with CFBcombustion to produce what is expected to be the cleanest coal-fired unitin the world while maintaining cost competitiveness and high unit reliabil-ity. Control of NOx will be performed using an advanced staged-combustionprocess coupled with an advanced SNCR system. Sulfur dioxide removal of96 to 98% is expected using a three-stage approach, and an integrated tracemetal control system will remove up to 90% of the mercury, lead, and othermetals, as well as virtually all acid gases. The demonstration will be per-formed at full scale using a 150 MW unit at the CSU Ray D. Nixon PowerPlant located near Colorado Springs.
New Technologies to Meet Climate Change GoalsGreat River Energy will demonstrate a process for reducing the moisturecontent of lignite, thereby increasing the value of high-moisture fuels in
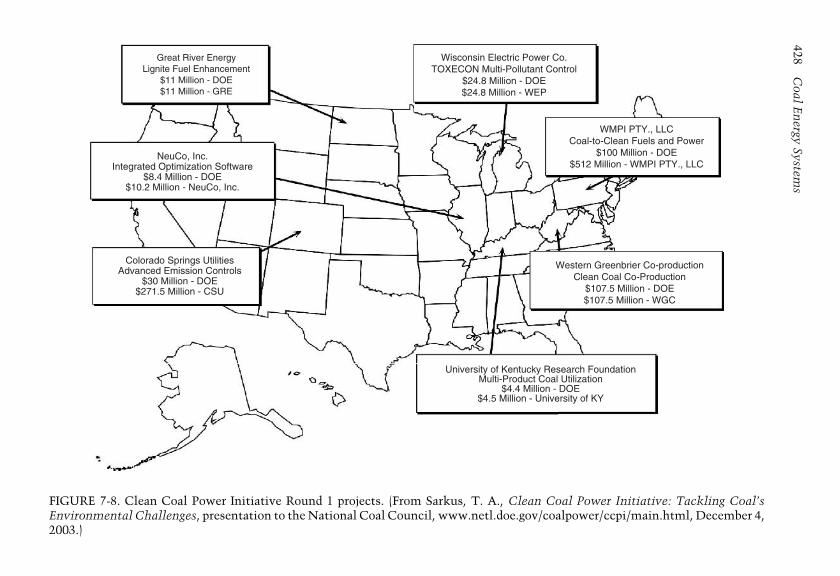
428C
oalE
nergy
Systems
Great River EnergyLignite Fuel Enhancement
$11 Million - DOE$11 Million - GRE
Wisconsin Electric Power Co.TOXECON Multi-Pollutant Control
$24.8 Million - DOE$24.8 Million - WEP
WMPI PTY., LLCCoal-to-Clean Fuels and Power
$100 Million - DOE$512 Million - WMPI PTY., LLC
Western Greenbrier Co-productionClean Coal Co-Production
$107.5 Million - DOE$107.5 Million - WGC
University of Kentucky Research FoundationMulti-Product Coal Utilization
$4.4 Million - DOE$4.5 Million - University of KY
Colorado Springs UtilitiesAdvanced Emission Controls
$30 Million - DOE$271.5 Million - CSU
NeuCo, Inc.Integrated Optimization Software
$8.4 Million - DOE$10.2 Million - NeuCo, Inc.
FIGURE 7-8. Clean Coal Power Initiative Round 1 projects. (From Sarkus, T. A., Clean Coal Power Initiative: Tackling Coal’sEnvironmental Challenges, presentation to the National Coal Council, www.netl.doe.gov/coalpower/ccpi/main.html, December 4,2003.)

Future Power Generation 429
Coal
Coal-FiredBoiler
PrimaryParticulateCollector
HESP
AirPreheater
SorbentInjection
TOXECON
Stack
FIGURE 7-9. TOXECON configuration for mercury control in a coal-fired boiler.(From Eastman, M. L., Clean Coal Power Initiative, presented at the Clean CoalPower Conference, www.netl.doe.gov/coalpower/ccpi/program_info.html, Novem-ber 18, 2003.)
electrical generation plants; increasing the net generating capacity of unitsthat burn high-moisture coal; increasing the energy supply of units that burnhigh-moisture coal; increasing the cost-effectiveness of the country’s electri-cal generation industry; improving the environment by reducing emissionsfrom coal-fired power plants; and increasing the value of the country’s lignitereserves [3,62]. The demonstration will be performed at Great River Energy’sCoal Creek Station (i.e., two 546 MW pulverized coal-fired units located atUnderwood, North Dakota) and will use waste heat in two fluidized-bed dri-ers to reduce the lignite moisture content by 10 percentage points, which istypically about 40%.
NeuCo, Inc. (Boston, Massachusetts) will design, develop, and demon-strate integrated on-line optimization systems at Dynegy Midwest Genera-tion’s Baldwin Energy Complex (three 600 MW coal-fired units) located inBaldwin, Illinois [3,62]. The modules will address sootblowing, SCR opera-tions, overall unit thermal performance, and plant-wide profit optimizationby reducing NOx , increasing fuel efficiency, and increasing reliability. Theincreases in fuel efficiency (i.e., heat rate production) will provide commen-surate reductions in greenhouse gases, mercury, and particulate matter. Thetechnology platform, consisting of neural networks, algorithms, and fuzzylogic techniques, will be used to comprehensively apply optimization tech-niques to a variety of systems within coal power plants using existing controltechnologies and then will link these systems to each other.
The University of Kentucky Research Foundation of Lexington, Ken-tucky, in partnership with LG&E Energy Corporation of Louisville, Ken-tucky, will design, construct, and demonstrate an advanced coal ashbeneficiation processing plant at the LG&E 2200 MW Ghent Power Plantin Ghent, Kentucky [3,62]. The process, based on hydraulic classificationand froth flotation technology, separates the UBC from power plant ash
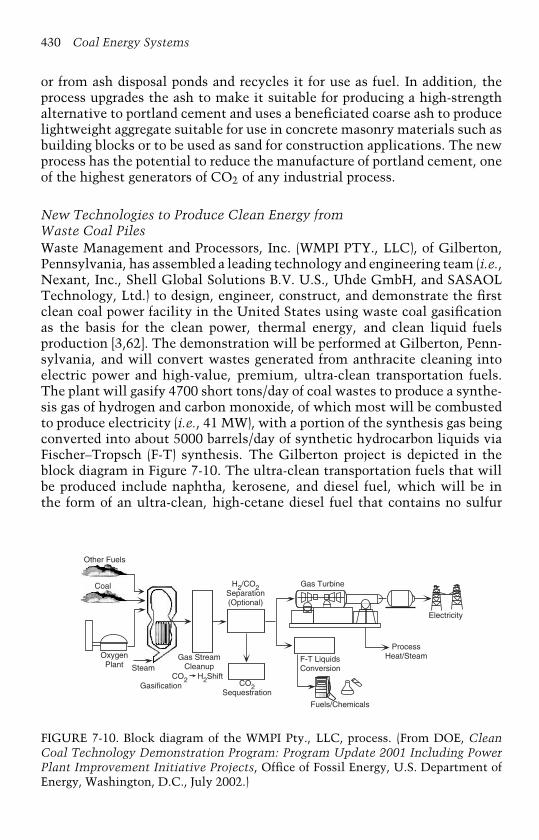
430 Coal Energy Systems
or from ash disposal ponds and recycles it for use as fuel. In addition, theprocess upgrades the ash to make it suitable for producing a high-strengthalternative to portland cement and uses a beneficiated coarse ash to producelightweight aggregate suitable for use in concrete masonry materials such asbuilding blocks or to be used as sand for construction applications. The newprocess has the potential to reduce the manufacture of portland cement, oneof the highest generators of CO2 of any industrial process.
New Technologies to Produce Clean Energy fromWaste Coal PilesWaste Management and Processors, Inc. (WMPI PTY., LLC), of Gilberton,Pennsylvania, has assembled a leading technology and engineering team (i.e.,Nexant, Inc., Shell Global Solutions B.V. U.S., Uhde GmbH, and SASAOLTechnology, Ltd.) to design, engineer, construct, and demonstrate the firstclean coal power facility in the United States using waste coal gasificationas the basis for the clean power, thermal energy, and clean liquid fuelsproduction [3,62]. The demonstration will be performed at Gilberton, Penn-sylvania, and will convert wastes generated from anthracite cleaning intoelectric power and high-value, premium, ultra-clean transportation fuels.The plant will gasify 4700 short tons/day of coal wastes to produce a synthe-sis gas of hydrogen and carbon monoxide, of which most will be combustedto produce electricity (i.e., 41 MW), with a portion of the synthesis gas beingconverted into about 5000 barrels/day of synthetic hydrocarbon liquids viaFischer–Tropsch (F-T) synthesis. The Gilberton project is depicted in theblock diagram in Figure 7-10. The ultra-clean transportation fuels that willbe produced include naphtha, kerosene, and diesel fuel, which will be inthe form of an ultra-clean, high-cetane diesel fuel that contains no sulfur
Gas Turbine
Electricity
Process Heat/SteamF-T Liquids
Conversion
Fuels/Chemicals
H2/CO2 Separation (Optional)
CO2 Sequestration
Gas Stream Cleanup
Gasification
Steam
Oxygen Plant
Other Fuels
Coal
CO2 H2Shift
FIGURE 7-10. Block diagram of the WMPI Pty., LLC, process. (From DOE, CleanCoal Technology Demonstration Program: Program Update 2001 Including PowerPlant Improvement Initiative Projects, Office of Fossil Energy, U.S. Department ofEnergy, Washington, D.C., July 2002.)
Future Power Generation 431
or aromatic hydrocarbons. The F-T naphtha formed during the F-T synthe-sis can be upgraded to clean-burning reformulated gasoline. F-T naphthais also an excellent feedstock for steam cracking or olefin production oran on-board reforming feed for fuel-cell-powered vehicles. The low-smoke-point kerosene is a niche-market jet fuel. Approximately 1300 and 3800barrels/day, respectively, of F-T naphtha and ultra-clean diesel and jet fuelwill be produced.
Western Greenbrier Co-Generation, LLC (a public service entityformed to serve the interests of three municipalities in West Virginia—Rainelle, Rupert, and Quinwood), will demonstrate an 85 MW, clean coal,co-production process in Rainelle, West Virginia [3,62]. The power plant willbe an innovative Alstom Power, Inc., CFB boiler system utilizing bituminouscoal waste and integrated with an advanced, multipollutant control systemfor SOx , NOx , particulate matter, and mercury. An integrated co-productionfacility will manufacture structural bricks using ash from the boiler andwood waste from an adjacent industrial process.
CCPI BenefitsThe Clean Coal Power Initiative bridges the gap between the CCT Programand PPII and implementation of Vision 21 systems, ensuring ongoing devel-opment of advanced systems for power production emerging from the DOE’score fossil-fuel research programs. Successful completion of the CCPI Pro-gram will introduce technologies to the U.S. marketplace that can achievecompliance with emerging air regulations and National Energy Policy (NEP)priorities. CCPI provides an important platform to implement the NEPrecommendation to increase investment in clean coal technology [3]. Theprogram will also help to ensure that upcoming regulations are science andengineering based and exploit emerging technologies developed under CCPI.CCPI will mitigate costs and reduce the technical and environmental risksassociated with advanced technology development and will serve as a prov-ing ground in the United States to speed technologies to market both athome and abroad, thereby ensuring the realization of early environmentalbenefits [3].
The CCPI Program benefits are expected to be substantial whencompared to the investment costs. Unless advanced technologies achievewidespread commercial use, which must occur through demonstrations, theprojected benefits will not be achieved. Benefits expected from the programinclude [6]:
• Reduced fuel costs due to higher plant efficiencies;• Lower capital costs for construction of new plants and repowered
facilities;• Lower capital and operating costs for existing plants;

432 Coal Energy Systems
• Reduced costs of environmental compliance;• Avoided environmental costs (e.g., health, infrastructure, agricul-
ture);• Enhanced industrial competitiveness leading to increased domestic
and international sales;• Additional jobs.
Vision 21
The DOE is providing the foundation needed to build a future generationof fossil energy-based power systems capable of meeting the energy andenvironmental demands of the twenty-first century. This initiative—Vision21—is the DOE’s approach for developing the technology needed for ultra-clean twenty-first-century energy plants. The overall goal of Vision 21 is toeffectively remove, at competitive costs, all of the environmental concernsassociated with the use of fossil fuels for producing electricity and transporta-tion fuels [63]. Achieving this goal will require an intensive, long-range (i.e.,15–20 years) research and development effort that emphasizes innovationand commercialization of revolutionary technologies. First-generation sys-tems emerging from the CCT Program, PPII, and CCPI are providing or willprovide the basis for Vision 21, including: (1) a knowledge base from whichto launch commercial systems that will experience increasingly improvedcost and performance over time through design refinement, and (2) platformson which to test new components that will result in improvements in costand performance.
Vision 21 is based on three premises: The United States will rely onfossil fuels for a major share of its energy needs well into the twenty-firstcentury; a diverse mix of energy resources, including coal, gas, oil, biomass,and other renewables, as well as nuclear, must be used for strategic andsecurity reasons, rather than using a limited subset of these resources;and research and development directed at resolving energy and environ-mental issues can find affordable ways to make energy conversion systemsmeet ever stricter environmental standards [63]. Vision 21 plants will effec-tively remove environmental constraints as an issue in the use of fossilfuels; emissions of traditional pollutants, including smog- and acid-rainingspecies, will be near zero; and the greenhouse gases (carbon dioxide) willbe reduced 40 to 50% by efficiency improvements and reduced to zero ifcombined with sequestration. In addition, Vision 21 plants will addresswater use, by-product utilization, sustainability (i.e., no future legacies),timely deployment of new technology, and affordable, competitive systemswith other energy options. The Vision 21 energy plant performance tar-gets are listed in Table 7-5 [63,64], and the technology concept is shown inFigure 7-11 [65].
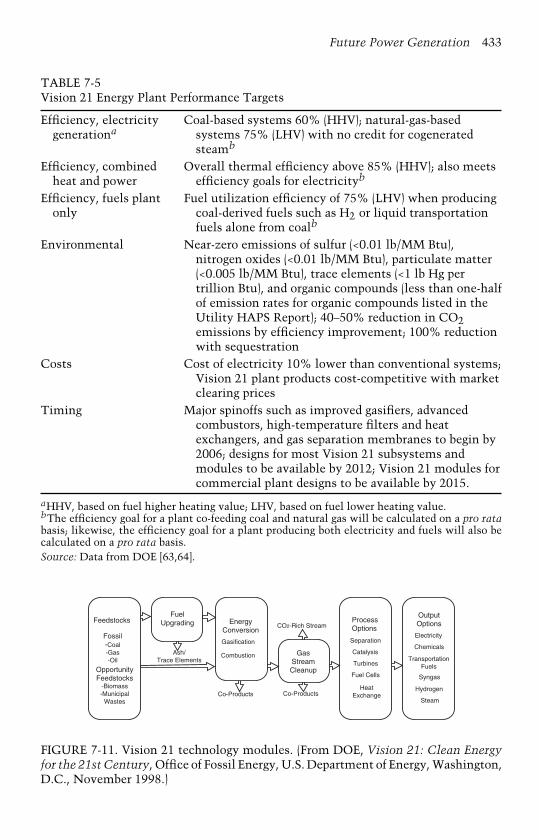
Future Power Generation 433
TABLE 7-5Vision 21 Energy Plant Performance Targets
Efficiency, electricitygenerationa
Coal-based systems 60% (HHV); natural-gas-basedsystems 75% (LHV) with no credit for cogeneratedsteamb
Efficiency, combinedheat and power
Overall thermal efficiency above 85% (HHV); also meetsefficiency goals for electricityb
Efficiency, fuels plantonly
Fuel utilization efficiency of 75% (LHV) when producingcoal-derived fuels such as H2 or liquid transportationfuels alone from coalb
Environmental Near-zero emissions of sulfur (<0.01 lb/MM Btu),nitrogen oxides (<0.01 lb/MM Btu), particulate matter(<0.005 lb/MM Btu), trace elements (<1 lb Hg pertrillion Btu), and organic compounds (less than one-halfof emission rates for organic compounds listed in theUtility HAPS Report); 40–50% reduction in CO2emissions by efficiency improvement; 100% reductionwith sequestration
Costs Cost of electricity 10% lower than conventional systems;Vision 21 plant products cost-competitive with marketclearing prices
Timing Major spinoffs such as improved gasifiers, advancedcombustors, high-temperature filters and heatexchangers, and gas separation membranes to begin by2006; designs for most Vision 21 subsystems andmodules to be available by 2012; Vision 21 modules forcommercial plant designs to be available by 2015.
aHHV, based on fuel higher heating value; LHV, based on fuel lower heating value.bThe efficiency goal for a plant co-feeding coal and natural gas will be calculated on a pro ratabasis; likewise, the efficiency goal for a plant producing both electricity and fuels will also becalculated on a pro rata basis.Source: Data from DOE [63,64].
Feedstocks
Fossil-Coal-Gas-Oil
OpportunityFeedstocks
-Biomass-Municipal
Wastes
FuelUpgrading
Ash/Trace Elements
ProcessOptions
OutputOptionsCO2-Rich Stream
Co-ProductsCo-Products
Separation
Catalysis
Turbines
Fuel Cells
HeatExchange
Electricity
Chemicals
TransportationFuels
Syngas
Hydrogen
Steam
GasStreamCleanup
EnergyConversion
Gasification
Combustion
FIGURE 7-11. Vision 21 technology modules. (From DOE, Vision 21: Clean Energyfor the 21st Century, Office of Fossil Energy, U.S. Department of Energy, Washington,D.C., November 1998.)
434 Coal Energy Systems
Vision 21 TechnologiesVision 21 energy plants will utilize a modular design philosophy and willcomprise technology modules selected and configured to produce the desiredproducts from the feedstocks, which would include fossil fuels combinedwith opportunity feedstocks, such as biomass, when appropriate. The config-uration of the complete plant, feedstocks, products, environmental controls,and plant size will be site specific and determined by prevailing marketand economic conditions. The technology modules will be based on keytechnologies including:
• Combustion and high-temperature heat exchange;• Gasification;• Gas purification;• Gas separation;• Turbines;• Fuel cells;• Synthesis gas conversion;• Environmental control;• Materials;• Controls and sensors;• Computational modeling and virtual simulation;• Systems analysis and systems integration.
Vision 21 focuses on developing the critical technologies that will beneeded to design and build Vision 21 energy plants. These technologies aredivided into five program elements: systems analysis, systems integration,enabling technologies, supporting technologies, and plant designs [63,66].
Systems analysis will be used to develop various system configurationsthat satisfy the program objectives, define the performance targets for indi-vidual subsystems, and identify supporting technology needs. Sub-elementsinclude market analysis, process definition, process evaluation, subsystemperformance requirements, economic analysis, and subsystem data analysisand model development [66].
Enabling technologies, such as gasification and advanced combustion,form the building blocks of the energy plants. Some enabling technologiesare already under development; some are being demonstrated in the CCT,PPII, and CCPI programs; and others require major improvements to existingtechnologies. Sub-elements include gas separation, high-temperature heatexchangers, fuel-flexible gasification, gas stream purification, advanced com-bustion systems, fuel-flexible turbines, fuel cells, and advanced fuels andchemical development [66].
Supporting technologies are cross-cutting technologies that are neces-sary for multiple subsystems and components and are important for otherapplications as well. Program sub-elements include materials, advanced
Future Power Generation 435
computational modeling and development of virtual demonstration capa-bility, advanced controls and sensors, environmental control technology,and advanced manufacturing and modularization [66].
Systems integration in the energy plants will use “smart” systems inte-gration techniques to combine high-performance subsystems into very cleanand efficient low-cost plants. Sub-elements include systems engineering,dynamic response and control, and industrial ecology.
Plant designs are the major product of the Vision 21 Program. Sub-elements include designs for components and subsystems, prototype plants,and commercial plants. In addition, a virtual demonstration capability willbe developed [66].
Significant activity is under way to address these program elements,such as in-house research projects performed by the DOE; demonstra-tions being conducted through the CCT, PPII, and CCPI programs; andresearch and development projects funded by the DOE through numeroussolicitations specifically targeted for the Vision 21 Program.
Vision 21 BenefitsMany benefits will be realized by Vision 21 successes. Environmental bar-riers to fossil fuel use will be removed, including advances in control ofsmog- and acid-rain-forming pollutants and particulate and hazardous airpollutants, capture and sequestration of carbon dioxide, and minimizationand utilization of solid wastes. Affordable energy costs will be maintainedby using a wide range of low-cost fossil fuel options. Useful co-products,including transportation fuels, will be produced in the energy plant that willreduce reliance on imported oil, stabilize oil prices, and improve the U.S.balance of trade. The United States will continue its leadership role in cleanenergy technology by promoting export of fossil energy and environmentaltechnology, equipment, and sales.
FutureGen
On February 27, 2003, President Bush announced plans for the United Statesto build a prototype of the fossil fuel power plant of the future: Future-Gen. In a statement released by the president, he stated: “Today I ampleased to announce that the United States will sponsor a $1 billion, 10-yeardemonstration project to create the world’s first coal-based zero-emissionselectricity and hydrogen power plant. This project will be undertaken withinternational partners and power and advanced technology providers to dra-matically reduce air pollution and capture and store emissions of greenhousegases. We will work together on this important effort to meet the world’sgrowing energy needs, while protecting the health of our people and envi-ronment” [67]. FutureGen is a cost-shared venture with private-sector and

436 Coal Energy Systems
Prepare site; install gasifier/gas cleanup system/combined cycle power plant/air separation unit; shake down/ start up
Project Definition Partnership development; site selection (including CO2 storage); NEPA; preliminary engineering cost estimate
Engineering & Procurement
Plant Construction
Sequestration Design/Construction
Plant Operation
Estimate of Project Component Cost ($ million)
Detailed design; environmental permitting; long-lead-time procurement items
Complete reservoir evaluation; drill injection walls; design/construct plant interface; design/construct transportation system; design/install monitoring and verification systems
Operate plant; monitor reservoir; introduce advanced technologies
Project Definition $20Engineering & Procurement $60Plant Construction $380Sequestration Design/Construction $320Plant Operation $220Total $1000
1 2 3 4 5 6 7 8 9 10
Year
FIGURE 7-12. FutureGen project timelines, components, and estimated costs. (FromDOE, FutureGen—A Sequestration and Hydrogen Research Initiative Fact Sheet,Office of Fossil Energy, U.S. Department of Energy, Washington, D.C., February2003.)
international partners that will combine electricity and hydrogen productionwith the virtual total elimination of harmful emissions, including green-house gases, through sequestration [64,68]. The FutureGen plant will serveas the test bed for demonstrating the best technologies the world has to offer.
The power industry will be asked to organize a consortium to managethe project and share in the project costs. Current plans call for the plant to bebuilt over the next five years and operated for at least five years beyond that[64]. A generic timeline showing the approximate period of performances forthe five project components is provided in Figure 7-12 [69]. Figure 7-12 alsolists the broad activities to be performed as well as the estimated costs foreach project component.
Nearly every aspect of the prototype plant will employ cutting-edgetechnology. Rather than using traditional coal combustion technology, theplant will be based on coal gasification technology, with a hydrogen-richgas being produced. The hydrogen could then be combusted in a turbine,used in fuel cells to produce clean electricity, or fed to a refinery to upgradepetroleum products [64]. In the future, the plant could become a modelhydrogen-production facility to supply a fleet of hydrogen-powered vehicles.
Future Power Generation 437
Pollutants such as SO2 and NOx will be cleaned from the coal gasesand converted to usable by-products such as fertilizers and soil enhancers[64]. Mercury pollutants will be removed, and CO2 will be captured andsequestered in deep underground geologic formations. Candidate reservoirsinclude depleted oil and gas reservoirs, unmineable coal seams, deep salineaquifers, and basalt formations [69]. The reservoirs will be intensivelymonitored to verify the permanence of the CO2 storage.
The prototype plant will be sized to generate approximately 275 MWof electricity, i.e., equivalent to an average mid-size, coal-fired power plant[64]. The plant would be a stepping stone toward a future coal-fueled powerplant that not only would be emissions free but would also operate atunprecedented fuel efficiencies.
The goals of the project include [69]:
• Design, construct, and operate a nominal 275 MW (net equivalentoutput) prototype plant that produces electricity and hydrogen withnear-zero emissions. The size of the plant is dictated by the need forproducing commercially relevant data, including the requirementfor producing one million metric tons per year of CO2 to adequatelyvalidate the integrated operation of the gasification plant and thereceiving geologic formation;
• Sequester at least 90% of the CO2 emissions from the plant with thefuture potential to capture and sequester nearly 100%;
• Prove the effectiveness, safety, and permanence of CO2 sequestra-tion;
• Establish standardized technologies and protocols for CO2 measur-ing, monitoring, and verification;
• Validate the engineering, economic, and environmental viability ofadvanced coal-based, near-zero emission technologies that by 2020will (1) produce electricity with less than a 10% increase in costcompared to non-sequestered systems, and (2) produce hydrogen at$4.00/MM Btu (wholesale), which is equivalent to $0.48/gallon ofgasoline, or $0.22/gallon less than the current wholesale price ofgasoline.
Benefits of the DOE’s Clean Coal PowerProgram/Demonstrations
The DOE’s coal-based research programs and associated demonstrations offermany benefits. Demonstrations are necessary for advancing technologies andachieving widespread commercial use. The federal government’s support ofthe Clean Coal Power Program, the DOE’s leadership role in performing theprogram and demonstrations, and industry’s participation in the programand demonstrations are crucial to bringing these technologies to market and
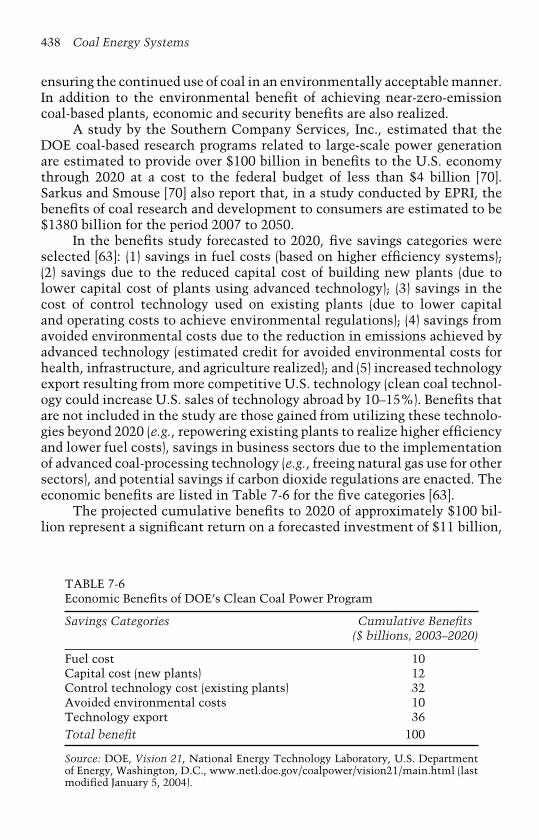
438 Coal Energy Systems
ensuring the continued use of coal in an environmentally acceptable manner.In addition to the environmental benefit of achieving near-zero-emissioncoal-based plants, economic and security benefits are also realized.
A study by the Southern Company Services, Inc., estimated that theDOE coal-based research programs related to large-scale power generationare estimated to provide over $100 billion in benefits to the U.S. economythrough 2020 at a cost to the federal budget of less than $4 billion [70].Sarkus and Smouse [70] also report that, in a study conducted by EPRI, thebenefits of coal research and development to consumers are estimated to be$1380 billion for the period 2007 to 2050.
In the benefits study forecasted to 2020, five savings categories wereselected [63]: (1) savings in fuel costs (based on higher efficiency systems);(2) savings due to the reduced capital cost of building new plants (due tolower capital cost of plants using advanced technology); (3) savings in thecost of control technology used on existing plants (due to lower capitaland operating costs to achieve environmental regulations); (4) savings fromavoided environmental costs due to the reduction in emissions achieved byadvanced technology (estimated credit for avoided environmental costs forhealth, infrastructure, and agriculture realized); and (5) increased technologyexport resulting from more competitive U.S. technology (clean coal technol-ogy could increase U.S. sales of technology abroad by 10–15%). Benefits thatare not included in the study are those gained from utilizing these technolo-gies beyond 2020 (e.g., repowering existing plants to realize higher efficiencyand lower fuel costs), savings in business sectors due to the implementationof advanced coal-processing technology (e.g., freeing natural gas use for othersectors), and potential savings if carbon dioxide regulations are enacted. Theeconomic benefits are listed in Table 7-6 for the five categories [63].
The projected cumulative benefits to 2020 of approximately $100 bil-lion represent a significant return on a forecasted investment of $11 billion,
TABLE 7-6Economic Benefits of DOE’s Clean Coal Power Program
Savings Categories Cumulative Benefits($ billions, 2003–2020)
Fuel cost 10Capital cost (new plants) 12Control technology cost (existing plants) 32Avoided environmental costs 10Technology export 36Total benefit 100
Source: DOE, Vision 21, National Energy Technology Laboratory, U.S. Departmentof Energy, Washington, D.C., www.netl.doe.gov/coalpower/vision21/main.html (lastmodified January 5, 2004).
Future Power Generation 439
of which about $4 billion will come from the federal government [63]. Forperspective, the end-use price of electricity in the United States is greaterthan $230 billion/year, and fuel cost estimates for U.S. coal-fired power gen-eration range from $25 to $30 billion/year. The capital cost savings reflectsavings of $100 and $200/kW for new plants built in 2010 and 2020, respec-tively. The savings in control technology include savings resulting fromincreased by-product utilization. Avoided environmental costs consideredonly SO2 (at $200/ton SO2) and NOx (at $800/ton NOx ) emissions. The esti-mate for increased exports is based on current estimates for power-generatingmachinery and equipment (i.e., $30–$35 billion/year) and for increased mar-ket penetration for clean coal technology primarily in developing countries.Other benefits include increased jobs from technology export, estimated tobe 75,000 new jobs per year in 2010, increasing to 200,000 per year in 2020.
References
1. Abraham, S., Remarks to the Clean Coal and Power Conference (Novem-ber 17, 2003), www.fossil.energy.gov/news/speeches/03/03_sec_cleancoal_111703.html.
2. DOE, Coal & Power Systems Strategic and Multi-Year Program Plans (Officeof Fossil Energy, U.S. Department of Energy, Washington, D.C., February2001).
3. Eastman, M. L., Clean Coal Power Initiative, presented at the CleanCoal Power Conference (November 18, 2003), www.netl.doe.gov/coalpower/ccpi/program_info.html.
4. DOE, Clean Coal Technology Demonstration Program: Program Update2001 Including Power Plant Improvement Initiative Projects (Office of FossilEnergy, U.S. Department of Energy, Washington, D.C., July 2002).
5. DOE, Power Plant Improvement Initiative (PPII) (National Energy Tech-nology Laboratory, U.S. Department of Energy, Washington, D.C.),www.netl.doe.gov/coalpower/ccpi/ppii_projects.html (last modified January5, 2004).
6. DOE, Clean Coal Technology Demonstrations Program Facts: Clean CoalPower Initiative (CCPI) (Office of Fossil Energy, U.S. Department of Energy,Washington, D.C., July 2003).
7. DOE, Clean Coal Technology Roadmap: “CURC/EPRI/DOE ConsensusRoadmap” (National Energy Technology Laboratory, U.S. Department ofEnergy, Washington, D.C.), www.netl.doe.gov/coalpower/ccpi/main.html(last modified January 6, 2004).
8. DOE, Clean Coal Technology Compendium CCT Program (U.S. Depart-ment of Energy, Washington, D.C.), www.lanl.gov/projects/cctc/programs/program.html (last modified January 22, 2003).
9. DOE, Clean Coal Today, DOE/FE-0215P-54 (Office of Fossil Energy, U.S.Department of Energy, Washington, D.C., Issue No. 54, Summer 2003).

440 Coal Energy Systems
10. Hsu, F. E., 10 MW Demonstration of Gas Suspension Absorption Final ProjectPerformance and Economics Report, DE-F22-90PC90542, June 1995.
11. Bechtel Corp., Confined Zone Dispersion Project: Final Technical Report,DE-FC22-90PC90546, June 1994.
12. LIFAC North America, LIFAC Demonstration at Richmond Power and LightWhitewater Valley Unit No. 2—Project Performance and Economics: FinalReport, DE-FC22-9090548, April 1988.
13. Pure Air on the Lake, LP, Advanced Flue Gas Desulfurization (AFGD)Demonstration Project: Final Technical Report, DE-FC22-90PC89660, April1996.
14. Southern Company Services, Inc., Demonstration of Innovative Applicationsof Technology for Cost Reductions to the CT-121 FGD Process: Final Report,DE-FC22-90PC89650, January 1997.
15. Southern Company Services, Inc., Demonstration of Advanced Combus-tion NOx Control Techniques for a Wall-Fired Boiler: Project PerformanceSummary, DE-FC22-90PC89651, January 2001.
16. Babcock & Wilcox Co., Demonstration of Coal Reburning for CycloneBoiler NOx Control: Final Project Report, DE-FC22-90PC89659, February1994.
17. Babcock & Wilcox Co., Full-Scale Demonstration of Low-NOx CellTM BurnerRetrofit: Final Report, DE-FC22-90PC90545, July 1994.
18. Energy and Environmental Research Corporation (EERC), Evaluation of GasReburning and Low-NOx Burners on a Wall-Fired Boiler: Final Report, DE-FC91-PC90547, July 1998.
19. CONSOL, Inc., Milliken Clean Coal Technology Demonstration Project:Final Report, DE-FC22-93PC92642, October 1999.
20. Southern Company Services, Inc., Demonstration of Selective CatalyticReduction (SCR) Technology for the Control of Nitrogen Oxide (NOx)Emissions from High-Sulfur Coal-Fired Boilers: Final Report, DE-FC22-90PC89652, October 1996.
21. Energy Technologies Enterprises Corp., 180 MW Demonstration of AdvancedTangentially Fired Combustion Techniques for the Reduction of Nitro-gen Oxide (NOx) Emissions from Coal-Fired Boilers, DE-FC22-90PC89653,December 1993.
22. Asea Brown Boveri Environmental Systems, SNOX Demonstration Project,Project Performance and Economics: Final Report, DE-FC22-90PC89655, July1996.
23. Goots, T. R., M. J. DePero, and P. S. Nolan, LIMB Demonstration ProjectExtension and Coolside Demonstration, DE-FC22-87PC79798, November1992.
24. Babcock & Wilcox Co., SOx-NOx-Rox BoxTM Flue Gas Cleanup Demonstra-tion Project Performance Summary, DE-FC22-90PC89656, June 1999.
25. Energy and Environmental Research Corp., Enhancing the Use of Coalsby Gas Reburning—Sorbent Injection Final Report, DE-FC22-87PC79796,February 1997.

Future Power Generation 441
26. New York State Electric & Gas Corp., Milliken Clean Coal TechnologyDemonstration Project, Project Performance and Economics: Final Report,DE-FC22-93PC92642, April 1999.
27. Hunt, T. and T. J. Hanley, Integrated Dry NOx/SO2Emissions ControlSystem: Final Report, DE-FC22-91PC90550, November 1997.
28. Raskin, N., Foster Wheeler Power Group, Inc., personal communication,January 8, 2004.
29. DOE, Clean Coal Technology: The JEA Large-Scale CFB Combustion Demon-stration Project, Technical Report No. 22 (Office of Fossil Energy, U.S.Department of Energy, Washington, D.C., March 2003).
30. Ohio Power Company, Tidd PFBC Demonstration Project: Final Report, DE-FC21-87MC24132, August 1995.
31. Colorado-Ute Electric Association, Inc., NUCLA Circulating AtmosphericFluidized-Bed Demonstration Project: Final Report, DE-FC21-89MC25137,October 1991.
32. DOE, Clean Coal Technology: Tampa Electric Integrated GasificationCombined-Cycle Project—An Update (Office of Fossil Energy, U.S. Depart-ment of Energy, Washington, D.C., July 2000).
33. DOE, Clean Coal Technology: The New Coal Era (Office of Fossil Energy,U.S. Department of Energy, Washington, D.C., June 1990).
34. DOD, Fuel Cell Information Guide: Molten Carbonate Fuel Cells (EngineerResearch and Development Center, U.S. Corps of Engineers, U.S. Depart-ment of Defense, Washington, D.C.), www.dodfuelcell.com/molten.html(last updated January 6, 2004).
35. DOE, Hydrogen, Fuel Cells, and Infrastructure Technologies Program(Energy Efficiency and Renewable Energy, U.S. Department of Energy,Washington, D.C.), www.eere.energy.gov/hydrogenandfuelcells/fuelcells/types.html#mcfc (last updated January 27, 2003).
36. Hornick, M. J. and J. E. McDaniel, Tampa Electric Polk Power Station Inte-grated Gasification Combined Cycle Project, DE-FC21-91MC27363, August2002.
37. Cargill, P., G. DeJonghe, T. Howsley, B. Lawson, L. Leighton, andM. Woodward, Piñon Pine IGCC Project: Final Technical Report, DE-FC21-92MC29309, January 2001.
38. DOE, Clean Coal Technology: The Piñon Pine Power Project, Techni-cal Report No. 6. (Office of Fossil Energy, U.S. Department of Energy,Washington, D.C., December 1996).
39. Wabash River Energy, Ltd., Wabash River Coal Gasification RepoweringProject: Final Technical Report, DE-FC21-91MC29310, August 2000.
40. DOE, Clean Coal Technology: The Wabash River Coal Gasification Repower-ing Project—An Update (Office of Fossil Energy, U.S. Department of Energy,Washington, D.C., September 2000).
41. Alaska Industrial Development and Export Authority, Healy Clean CoalProject: Project Performance and Economics Final Report, DE-FC22-91PC90544, April 2001.

442 Coal Energy Systems
42. ENCOAL, ENCOAL Mild Gasification Project, DE-FC21-90MC27339,September 1997.
43. DOE, Clean Coal Technology Compendium CCT Program (U.S. Departmentof Energy, Washington, D.C.), www.lanl.gov/projects/cctc/factsheets/rsbud/adcconvdemo.html (last modified December 2, 2002).
44. Heydorn, E. C., B. W. Diamond, and R. D. Lilly, Commercial-Scale Demon-stration of the Liquid Phase Methanol (LPMEOHTM) Process: Final Report,DE-FC22-92PC90543, June 2003.
45. DOE, Clean Coal Today, DOE/FE-0215P-53 (Office of Fossil Energy, U.S.Department of Energy, Washington, D.C., Issue No. 53, Spring 2003).
46. DOE, Clean Coal Technology: Commercial-Scale Demonstration of the Liq-uid Phase Methanol (LPMEOHTM) Process, Technical Report No. 11. (Officeof Fossil Energy, U.S. Department of Energy, Washington, D.C., April 1999).
47. CQ, Inc., Development of a Coal Quality Expert, DE-FC22-90PC89663, June20, 1998.
48. Bethlehem Steel Corp., Blast Furnace Granular Coal Injection System, DE-FC21-MC27362, October 1999.
49. NMA, Clean Coal Technology: Current Progress, Future Promise (NationalMining Association, Washington, D.C.), www.nma.org (last updated March2003).
50. DOE, Institutional Plan FY2003–2007 (Office of Fossil Energy, U.S. Depart-ment of Energy, National Energy Technology Laboratory, Washington, D.C.,October 2002).
51. Energetics, Inc., Clean Coal Technology Commercial Successes, draft reportfor the U.S. DOE (Office of Fossil Energy, U.S. Department of Energy,Washington, D.C.), January 2000.
52. DOE, Clean Coal Technology: Environmental Benefits of Clean Coal Tech-nology, Technical Report No. 18. (Office of Fossil Energy, U.S. Departmentof Energy, Washington, D.C., April 2001).
53. DOE, Integration of Low-NOx Burners with an Optimization Plan for BoilerCombustion, Power Plant Improvement Initiative Project Fact Sheet (LosAlamos National Laboratory, U.S. Department of Energy, Washington, D.C.),www.lanl.gov/projects/ppii/factsheets/sunflower/sunflower_demo.html (lastmodified May 1, 2003).
54. DOE, Demonstration of a Full-Scale Retrofit of the Advanced Hybrid Partic-ulate Collector Technology, Power Plant Improvement Initiative Project FactSheet (Los Alamos National Laboratory, U.S. Department of Energy, Wash-ington, D.C.), www.lanl.gov/projects/ppii/factsheets/otter/otter_demo.html(last modified February 20, 2003).
55. DOE, Big Bend Power Station: Neural Network-Sootblower Optimiza-tion, Power Plant Improvement Initiative Project Fact Sheet (Los AlamosNational Laboratory, U.S. Department of Energy, Washington, D.C.),www.lanl.gov/projects/ppii/factsheets/neural/neural_demo.html (last modi-fied October 31, 2002).
56. DOE, Commercial Demonstration of the Manufactured Aggregate Pro-cessing Technology Utilizing Spray Dry Ash, Power Plant Improvement
Future Power Generation 443
Initiative Project Fact Sheet (Los Alamos National Laboratory, U.S. Depart-ment of Energy, Washington, D.C.), www.lanl.gov/projects/ppii/factsheets/aggregate/aggregate_demo.html (last modified February 27, 2003).
57. DOE, Greenidge Multi-Pollutant Control Project, Power Plant ImprovementInitiative Project Fact Sheet (Los Alamos National Laboratory, U.S. Depart-ment of Energy, Washington, D.C.), www.lanl.gov/projects/ppii/factsheets/greenidge/greenidge_demo.html (last modified October 23, 2002).
58. DOE, Development of Hybrid FLGR/SNCR/SCR Advanced NOx ControlTechnology, Power Plant Improvement Initiative Project Fact Sheet (LosAlamos National Laboratory, U.S. Department of Energy, Washington, D.C.),www.lanl.gov/projects/ppii/factsheets/advnox/advnox_demo.html (last mod-ified October 23, 2002).
59. NEPD Group, National Energy Policy (National Energy Policy Development,U.S. Government Printing Office, Washington, D.C., May 2001).
60. Sarkus, T. A., Clean Coal Power Initiative: Tackling Coal’s Environmen-tal Challenges, presentation to the National Coal Council (National EnergyTechnology Laboratory, U.S. Department of Energy, Washington, D.C.),www.netl.doe.gov/coalpower/ccpi/main.html (accessed December 4, 2003).
61. DOE, Clean Coal Technology Roadmap: “CURC/EPRI/DOE Con-sensus Roadmap” Background Information (National Energy Tech-nology Laboratory, U.S. Department of Energy, Washington, D.C.),www.netl.doe.gov/coalpower/ccpi/main.html (accessed January 6, 2004).
62. DOE, Techline: Secretary of Energy Announces First Projects to MeetPresident’s Commitment to New Clean Coal Technologies (NationalEnergy Technology Laboratory, U.S. Department of Energy, Washing-ton, D.C.), www.netl.doe.gov/publications/press/2003/tl_ccpi_2003sel.html(accessed January 15, 2003).
63. DOE, Vision 21 (National Energy Technology Laboratory, U.S. Depart-ment of Energy, Washington, D.C.), www.netl.doe.gov/coalpower/vision21/main.html (last modified January 5, 2004).
64. DOE, Clean Coal Technology Demonstration Program: Program Update2003—Includes Clean Coal Technology Demonstration Program, PowerPlant Improvement Initiative, and Clean Coal Power Initiative Projects(Office of Fossil Energy, U.S. Department of Energy, Washington, D.C.,December 2003).
65. DOE, Vision 21: Clean Energy for the 21st Century (Office of Fossil Energy,U.S. Department of Energy, Washington, D.C., November 1998).
66. DOE, Vision 21 Program Plan: Clean Energy for the 21st Century (Officeof Fossil Energy, U.S. Department of Energy, Washington, D.C., April1999).
67. The White House, Statement by the President, www.whitehouse.gov/news/releases/2003/02/20030227-11.html, February 27, 2003.
68. DOE, A Prospectus for Participation by Foreign Governments in FutureGen(Office of Fossil Energy, U.S. Department of Energy, Washington, D.C., June20, 2003).

444 Coal Energy Systems
69. DOE, FutureGen: A Sequestration and Hydrogen Research Initiative FactSheet (Office of Fossil Energy, U.S. Department of Energy, Washington, D.C.,February 2003).
70. Sarkus, T. A. and S. M. Smouse, Implementing the U.S. Departmentof Energy’s Power Plant Improvement and Clean Coal Power Initiatives:Coal-Tech 2002: Mine Mouth Power Plant (Los Alamos National Labora-tory, U.S. Department of Energy, Washington, D.C., August 21, 2002),www.lanl.gov/projects/ppii/news/whatsnew.html.

CHAPTER 8
Coal’s Role in ProvidingUnited States EnergySecurity
America’s economic engine is fueled primarily by fossil fuels, a trend thatis expected to continue for several decades. Coal, oil, and natural gas sup-plied 85% of the nation’s total energy, 69% of its electricity, and nearlyall of its transportation fuels in 2002 [1]. The contribution of fossil fuelsto the U.S. energy supply is expected to increase; the U.S. Departmentof Energy (DOE) forecasts that fossil fuels will be supplying 90% of thenation’s energy by 2020 because of projected growth in natural gas consump-tion. Of the ∼97 quadrillion Btu of energy consumed in the United Statesin 2002, 23% (22.18 quadrillion Btu) was attributed to coal, while naturalgas, petroleum, nuclear power, and renewable energy consumption was 24,39, 8, and 6%, respectively [1]. The important role of fossil fuels, in gen-eral, and coal, in particular, in the U.S. energy picture is further illustratedin Figure 8-1, which depicts the contribution of coal to the various end-use sectors—transportation, residential, commercial, and industrial—alongwith the energy consumed to generate electricity. As discussed in Chapter 2(Present, Past, and Future Role of Coal), coal is primarily used in the genera-tion of electric power, and the contributions from coal as well as the variousother energy sources for producing electricity are factored into the individualend-use sector graphs shown in Figure 8-1.
America’s economic strength was established largely due to abundantand inexpensive energy. U.S. consumers benefit from some of the lowestelectricity rates of any free-market economy, and coal has been a major con-tributor to the surge in electrification of the country; however, increasingelectricity rates and natural gas prices are affecting most Americans. Thevolatility in natural gas prices and availability is becoming more trouble-some as evidenced by the frequent episodes of low availability and highprice. Rising crude oil prices are reflected in increased gasoline and heatingoil prices, which create an economic strain on consumers. Conflicts in the
445
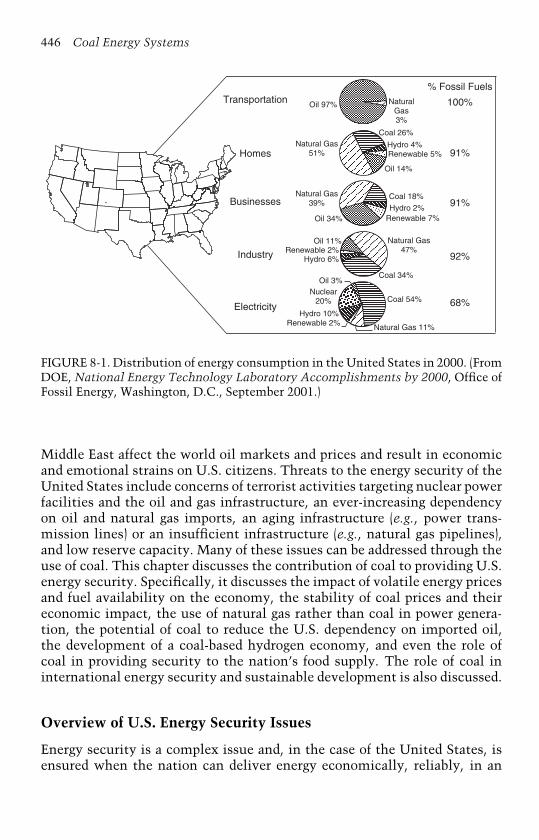
446 Coal Energy Systems
Transportation
Homes
Businesses
Industry
Electricity
% Fossil Fuels
100%
91%
91%
92%
68%
Oil 97%
Natural Gas51%
Natural Gas39%
Oil 34%
Oil 11%Renewable 2%
Hydro 6%
Oil 3%Nuclear
20%
Hydro 10%Renewable 2%
NaturalGas3%
Coal 26%
Hydro 4%Renewable 5%
Oil 14%
Coal 18%
Hydro 2%Renewable 7%
Natural Gas47%
Coal 34%
Coal 54%
Natural Gas 11%
FIGURE 8-1. Distribution of energy consumption in the United States in 2000. (FromDOE, National Energy Technology Laboratory Accomplishments by 2000, Office ofFossil Energy, Washington, D.C., September 2001.)
Middle East affect the world oil markets and prices and result in economicand emotional strains on U.S. citizens. Threats to the energy security of theUnited States include concerns of terrorist activities targeting nuclear powerfacilities and the oil and gas infrastructure, an ever-increasing dependencyon oil and natural gas imports, an aging infrastructure (e.g., power trans-mission lines) or an insufficient infrastructure (e.g., natural gas pipelines),and low reserve capacity. Many of these issues can be addressed through theuse of coal. This chapter discusses the contribution of coal to providing U.S.energy security. Specifically, it discusses the impact of volatile energy pricesand fuel availability on the economy, the stability of coal prices and theireconomic impact, the use of natural gas rather than coal in power genera-tion, the potential of coal to reduce the U.S. dependency on imported oil,the development of a coal-based hydrogen economy, and even the role ofcoal in providing security to the nation’s food supply. The role of coal ininternational energy security and sustainable development is also discussed.
Overview of U.S. Energy Security Issues
Energy security is a complex issue and, in the case of the United States, isensured when the nation can deliver energy economically, reliably, in an
Coal’s Role in Providing United States Energy Security 447
environmentally sound way, and safely in quantities sufficient to supportthe growing economy and defense needs [3]. This will require policies thatsupport expansion of the energy supply and delivery infrastructure (with suf-ficient storage and generating reserves), diversity of fuels, and redundancy ofinfrastructure to meet the demands of economic growth. The United Stateswill need increased contributions toward energy security from all availablesources over the long term, including conservation, traditional sources ofenergy, renewable resources, and new energy sources, such as hydrogen. Inorder to enhance energy security, the United States must [3]:
• Encourage conservation and energy efficiency;• Maintain diverse energy supplies while enhancing domestic produc-
tion and delivery;• Maximize economic efficiency;• Accelerate research and development to create and deploy advanced
energy technologies;• Develop and implement effective contingency and emergency plans;• Develop policies based on sound science and realistic economic,
national security, and environmental needs in order to make deci-sions that are timely, consistent, and coordinated with energysecurity, economic, and environmental objectives.
U.S. energy security is closely linked to global energy markets andtrends, North American energy resources, and energy production, transporta-tion, and storage systems, as well as changing patterns of consumption [3].One energy source of particular concern is petroleum; in 2002, more than60% of the oil consumed in the United States was imported [1]. World oildemand is projected to increase by nearly 44 million barrels per day by 2020;∼60% of the increased demand will be in developing countries, and 60% ofthe total demand will be in the transportation sector. Approximately 63% ofthe oil will be supplied by the Organization of Petroleum Exporting Coun-tries (OPEC), and 44% will come from the Persian Gulf region [3,4]. Thesetrends have enormous implications for U.S. energy security, as global compe-tition and potential disruptions to the United States will impact availabilityand cost to consumers.
Energy patterns in the United States are projected to shift dramati-cally by 2020 and also have energy security implications [3,5]. Total U.S.energy consumption is projected to increase from 97 quadrillion Btu in2001 to ∼127 quadrillion Btu in 2020. Petroleum is expected to remainthe dominant fuel in U.S. markets, maintaining about a 40% market share,with domestic production remaining constant and the United States rely-ing heavily on imported oil. The transportation sector, in which 96% of theenergy is supplied by oil, is expected to grow more rapidly than any othersector, increasing from about 13 million barrels per day (bbl/day) in 2001

448 Coal Energy Systems
to ∼19 million bbl/day in 2020. Natural gas consumption is projected toincrease from 23 trillion cubic feet in 2001 to 34 trillion cubic feet in 2020,primarily as a result of rapid growth in demand for electricity generation.Domestic natural gas production and imports from Canada are projected toincrease from 19 and 3.5 trillion cubic feet, respectively, in 2001 to 28.5and 5.5 trillion cubic feet, respectively, in 2020. The market share of renew-able energy is projected to remain constant, increasing from 5 quadrillionBtu in 2001 to 8.9 quadrillion Btu in 2020. Coal consumption is projectedto increase from ∼1 billion short tons in 2002 to ∼1.4 billion short tons in2020, with about 90% of the total coal demand being used for electricity gen-eration. Total U.S. electricity demand is projected to increase at an averageannual rate of 1.8% through 2020.
The energy security implications of imported oil and the use of naturalgas in the power generation industry are discussed later in this chapter. Theavailability and price of natural gas, especially if it is used in large quanti-ties in the power industry, and the use of natural gas as a feedstock in thechemical/fertilizer industry, for residential heating, and in the transporta-tion sector are discussed here, as is the application of reforming natural gasto produce hydrogen.
The U.S. energy infrastructure is the keystone of the American wayof life. It is the foundation for all other critical infrastructures, includinginformation and telecommunications, postal service and shipping, publichealth, and agriculture [6]. Ensuring the safety, security, and reliability of theenergy infrastructure is vital to homeland security and economic prosperity.
National Energy Plan and Coal Utilization
The U.S. government, aware of its growing demand for energy, is trying tomake rational decisions to avoid any energy shortfalls. These shortfalls resultin high prices at the gasoline pumps, high home heating bills due to high nat-ural gas and fuel oil prices, rolling blackouts during periods of cold weatherwhen natural-gas-fired power plants cannot obtain sufficient quantities ofgas, and blackouts due to an aging electricity distribution infrastructure, toname a few. In the next 20 years, U.S. overall energy consumption is expectedto increase by more than 30%; oil demand, 33%; natural gas consumption,62%; and electricity demand, 45%, due at least in part to the growth ininformation technology [7].
President Bush’s National Energy Policy makes 105 specific recom-mendations, including 42 on promoting conservation and protecting theenvironment, 35 on diversifying energy supply and modernizing antiquatedinfrastructure, and 25 on enhancing national energy security [8,9]. Energysecurity affects all nations, and President Bush has pledged that the UnitedStates will be a leader in the long-term effort to achieve that goal [10]. Thepolicies needed for energy security differ among nations but the basics are

Coal’s Role in Providing United States Energy Security 449
the same and are identified as core themes in the U.S. National Energy Policy[7,10]:
• Energy conservation must be increased;• A balanced and diversified portfolio of energy resources is required;• Protection of the environment is necessary as growth in domestic
energy production and consumption is increased;• Technology innovations are essential to achieve energy security
goals;• Global alliances and markets must be strengthened.
Energy Conservation/EfficiencyGood energy policy begins with the efficient use of energy. If the energyintensity (i.e., amount of energy required to generate a dollar of gross domes-tic product, or GDP) of the U.S. economy remains constant, the energydemand in 2020 will increase to 175 quadrillion Btu [7]. The energy plan andcurrent policies are projected to improve energy efficiency, and the demandcan be lowered to ∼127 quadrillion Btu in 2020. This will require employ-ing cutting-edge technology. The national energy plan focuses on developingfuel-efficient vehicles, higher efficiency appliance standards, and combinedheat and power technologies, and on establishing efficiency-base tax credits.Energy efficiency is an important part of the national energy plan but can-not by itself close the gap between projected energy demand and projecteddomestic energy production.
Diversity of Fuel SourcesThe national energy plan calls for a balanced and diversified portfolio ofenergy resources, which includes coal, oil, natural gas, nuclear power, andrenewable and alternative energy sources such as biomass, solar, wind,geothermal, and hydropower. The national energy plan recognizes that it willlikely take decades for renewable and alternative resources to make majorcontributions to our energy mix. At the same time, electricity demand in theUnited States is forecast to rise 45% by 2020 [7], which translates into addingthe equivalent of 1300 to 1900 new power plants (i.e., 60–90 new plants peryear) to the existing 5000 power plants in service. If current policies andpractices remain unchanged, most of those plants, possibly more than 90%,will be fired by natural gas [7]. This is especially disturbing because thecurrent oil and gas delivery system is experiencing increased stress, and bot-tlenecks are developing. It is the consensus of the natural gas industry thatthe United States will need an additional 38,000 miles of major transmis-sion pipelines and 263,000 miles of smaller distribution lines by 2015 tobring the necessary natural gas to homes and businesses [7]. Energy securitydictates a more balanced approach to new power generation; consequently,one measure of the National Energy Plan established the 10-year, $2 billion
450 Coal Energy Systems
Clean Coal Power Initiative Program (discussed in Chapter 7, Future PowerGeneration) to develop improved clean coal power technologies.
Environmental ProtectionThe National Energy Policy recognizes the need to conserve and improve thequality of the environment by reducing emissions from energy productionand consumption [10]. Environmental progress can be made without compro-mising the expansion of the U.S. economy, especially through developmentof better technology and establishment of greater regulatory certainty relat-ing to coal electricity generation by implementing clear policies, easilyapplied to business decisions [7,8]. Specific proposals for coal call for manda-tory reduction for emissions of sulfur dioxide, nitrogen oxides, and mercuryfrom electricity generation. In addition, the National Energy Policy rec-ommends streamlining the permitting process for power plant siting andallowing utilities to modify plants without fear of new litigation [8].
Technological InnovationsIt is understood that scientific breakthroughs and technological innovationsare essential to achieving the energy security goals of the United States,improving the use of energy resources, and developing future energy sys-tems [10]. Clean coal is a crucial element in the overall energy policy, andthe Clean Coal Power Initiative identified in the energy plan will assist indeveloping future energy systems such as Vision 21 energy plants.
Global Alliances and MarketsThe national energy plan recognizes the need to strengthen global alliancesand markets. The United States is committed to international cooperationto strengthen energy trade relationships, accelerate scientific/technologicalprogress, and spread the benefits of energy and environmental advancesthroughout the world [10]. Developments in clean coal technology areespecially important for marketing to the world.
The Role of Coal in the National Energy PlanThe Clean Coal Power Initiative is a major commitment by the United Statesto further develop clean coal power technologies. This is crucial, as theelectric industry is expected to increase significantly by 2020 and naturalgas is the fuel currently identified to meet much of that growth if circum-stances do not change. In addition, environmental constraints are tighteningwith respect to the use of current coal-based plants and technology [7].The National Energy Policy recognizes that there are several positive issuesregarding the use of coal. Coal is an abundant and inexpensive resource.
Coal’s Role in Providing United States Energy Security 451
Coal is the most abundant fuel source in the United States; the recoverablereserves of ∼250 million short tons represent a 200- to 300-year supply at cur-rent rates of consumption. The abundance of coal helps to keep coal priceslow and stable. The average delivered cost of coal in 2003 to U.S. powerplants was about $1.25/million Btu compared to $5.80/million Btu for nat-ural gas, although natural gas prices have a history of volatile price swings[11]. In 2002, the average cost of coal at the burner tip was about $13/MWh,while the average cost of natural gas was $37/MWh [11]. Coal-based indus-tries employ many more workers than any other energy source [8]. Coal isan indigenous resource that is not subject to unreliable weather conditions,price volatility, or disruptions from foreign suppliers. Reliance on a singlesource such as natural gas can lead to constraints on supply or significantprice increases. Technology developed by the partnership of industry andthe government has lessened the environmental impact of coal technologies[7]. Coal can be burned cleanly using clean coal technology, and the morerapidly clean coal technology can be retrofitted onto older power plants thecleaner the air will become [8]. Also, future systems under development willimprove system efficiencies and reduce emissions even further.
Energy and the Economy
Energy prices have a significant impact on the U.S. economy, as evidenced bythe oil embargoes and the recent rising energy prices (i.e., for natural gas andoil). Prior to the oil embargo of 1973/1974, total energy expenditures com-prised 8% of the U.S. GDP; the share of petroleum expenditures was slightlyless than 5%, and natural gas expenditures accounted for 1% [12]. The priceshocks of the 1970s and early 1980s resulted in these rising dramatically to14, 8, and 2%, respectively, by 1981. For the next two decades, the shareshave decreased consistently to approximately pre-embargo levels; however,these shares are now beginning to increase again starting in the late 1990sdue to higher natural gas and petroleum prices.
High energy prices result in increased inflation. Viewed from a long-term perspective, inflation, as measured by the rate of change in theconsumer price index (CPI), tracks movements in the world oil price [12].Oil and other energy prices constitute a portion of the actual CPI but alsoimpact other (downstream) commodity prices that will have a lagged effecton the CPI inflation. Since the 1970s, observable and dramatic changes inGDP growth have occurred as the world oil price has undergone dramaticchange [12]. The price shocks of 1973/1974, the late 1970s/early 1980s, andthe early 1990s were all followed by recessions, and higher energy prices in2003 contributed to the downturn in the U.S. economy.
The strength and security of the U.S. economy are closely linked tothe availability, reliability, and cost of electric power. Since 1970, real GDPin the United States and electricity generation have been clearly linked, as

452 Coal Energy Systems
240
220
200
180
160
140
120
100
801970 1975 1980 1985 1990 1995 2000
Year
Real GDP
Electricity Generation
Total Energy ConsumptionIn
de
x: 1
97
3 =
10
0
FIGURE 8-2. Economic growth and energy security are linked to electricity consump-tion. (From Eastman, M. L., Clean Coal Power Initiative, presented at the Clean CoalPower Conference, www.netl.doe/gov/coalpower/ccpi/program_info.html, Novem-ber 18, 2003.)
illustrated in Figure 8-2 [13]. Because economic growth is linked to reliableand affordable electric power, continued use of domestic coal resources willplay a significant role in satisfying the energy needs of the United States.This is likely to continue through the middle of the twenty-first century andbeyond [13].
The lowest cost electrical generation plants are coal fired. In 2001, 20of the 25 lowest cost steam-generating plants in the United States werefueled by coal [14]. Figure 8-3 shows that most states with low-cost elec-tricity receive a large amount of their generation from coal, with the notedexception of the three Pacific Northwest states that have ample hydroelec-tric resources [15]. Conversely, states with the highest cost of electricitygenerate less than 30% of their electricity from coal. The five states withthe lowest electricity costs all generate more than 94% of their electricityfrom coal (i.e., Indiana, Kentucky, West Virginia, Wyoming, and Utah).
The trend of lower cost electricity from coal generation will continue tobe more evident over the next 5 years [15]. For example, the three states withthe lowest energy costs in 2000 were Washington, Oregon, and Idaho becauseof their hydroelectric power generation capabilities [15]; however, accordingto Williams [15], they have fully utilized their hydroelectric capabilities andnow rely on the regional spot market, which is driven by natural gas forincremental power, and none of these three states is among the 10 loweststates for electricity prices in 2002. The abundance of coal results in low coalprices and keeps coal prices stable, both in long-term contracts and the spotmarket. States that rely on coal for most of their generation are insulatedfrom wholesale power price spikes that have followed the volatility of the
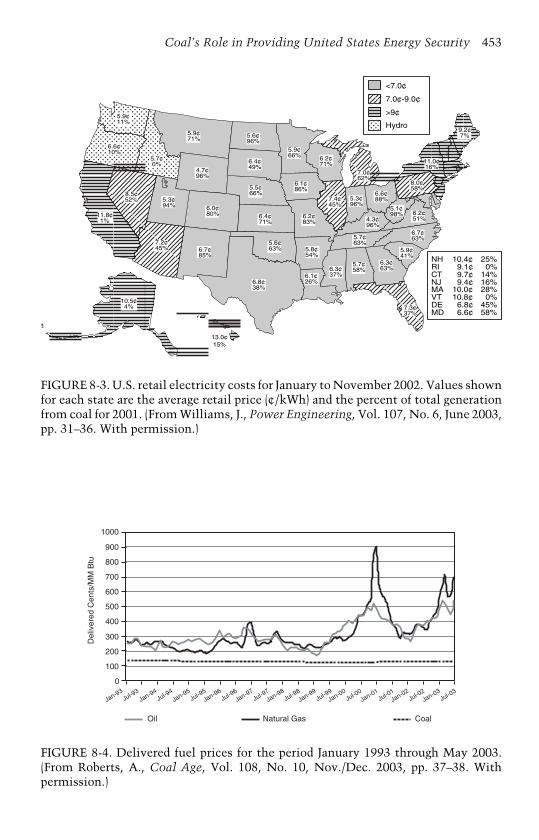
Coal’s Role in Providing United States Energy Security 453
<7.0¢
7.0¢-9.0¢
>9¢
Hydro
25%0%
14%16%28%
0%45%58%
10.4¢9.1¢9.7¢9.4¢
10.0¢10.8¢
6.8¢6.6¢
NHRICTNJMAVTDEMD
13.0¢15%
10.5¢4%
5.1¢98%
5.9¢11%
6.6¢10%
11.8¢1%
8.5¢52%
7.2¢45%
5.7¢0%
5.9¢71% 5.6¢
96%
4.7¢96%
5.3¢94% 6.0¢
80%
6.7¢85%
6.4¢49%
5.5¢66%
6.4¢71%
5.6¢63%
6.8¢38%
5.9¢66%
6.1¢86%
6.2¢83%
5.8¢54%
6.1¢26%
6.2¢71%
7.4¢45%
7.0¢62%
5.3¢96%
6.6¢88%
8.0¢58%
6.2¢51%4.3¢
96%
5.7¢63%
6.3¢37%
5.7¢58%
6.3¢63%
7.3¢37%
6.7¢63%
5.9¢41%
11.0¢16%
9.2¢7%
FIGURE 8-3. U.S. retail electricity costs for January to November 2002. Values shownfor each state are the average retail price (¢/kWh) and the percent of total generationfrom coal for 2001. (From Williams, J., Power Engineering, Vol. 107, No. 6, June 2003,pp. 31–36. With permission.)
1000
900
800
700
600
500
400
300
200
100
0
Oil Natural Gas Coal
Jan-93Jul-9
3Jan-94
Jul-94
Jan-95Jul-9
5Jan-96
Jul-96Jan-97
Jul-97Jan-98
Jul-98Jan-99
Jul-99Jan-00
Jul-00Jan-01
Jul-01Jan-02
Jul-02Jan-03
Jul-03
Del
iver
ed C
ents
/MM
Btu
FIGURE 8-4. Delivered fuel prices for the period January 1993 through May 2003.(From Roberts, A., Coal Age, Vol. 108, No. 10, Nov./Dec. 2003, pp. 37–38. Withpermission.)

454 Coal Energy Systems
natural gas market. Figure 8-4 shows delivered fuel prices for coal, naturalgas, and fuel oil for the period from January 1993 through May 2003 [11].
Natural Gas Use in Power Generation
Natural gas is a premium fossil fuel that is easily transported, can be used inmany applications, often is the least expensive option from a capital invest-ment viewpoint, and burns with low levels of emissions. Of the fossil fuels,natural gas releases the lowest quantity of carbon dioxide per million Btuof energy consumed. For these reasons, natural gas has become a popularchoice among the residential, commercial, industrial, and electricity genera-tion sectors and is also becoming increasingly popular in compressed naturalgas vehicles.
With this popularity have come serious supply and demand issues. In2002, approximately 24 quadrillion Btu of natural gas were consumed inthe United States [1]. Of this, approximately 36, 25, 23, and 16% wereconsumed by the industrial, electric power, residential, and commercialsectors, respectively. Natural gas consumption is projected to increase to∼35 quadrillion Btu, with electric power generation being responsible formuch of the increase. This is a concern, because supply is currently notkeeping pace with demand as natural gas imports are increasing, prices arevolatile, and shortages are occurring during periods of extreme weather.
Natural gas prices are increasing as demand exceeds supply, with elec-tric power generation causing much of the current market strain. Over thepast 4 years, new gas-fired plants generating about 200,000 MW have beenbuilt, significantly increasing demand for natural gas and affecting naturalgas prices [16]. The supply of natural gas is limited, not only by produc-tion but also by distribution. The infrastructure to deliver natural gas isnot expected to keep pace with demand [17]. Economic concerns, regulatoryhurdles, and capital budget constraints are inhibiting proper development ofthe delivery infrastructure.
The natural gas crisis impacts all sectors that utilize gas; however, thecrisis becomes especially newsworthy when residential and industrial usersare severely impacted. In the recent past (i.e., beginning with the winterof 2000/2001), natural gas price spikes and their impact on the residentialand industrial sectors have received much attention, including interest frompoliticians. Natural gas prices have been rising for the past 5 years, begin-ning in January 1999, with spikes being observed during three of the lastfour winters (i.e., winters of 2000/2001, 2002/2003, and 2003/2004). Win-ter heating bills tracked by the Energy Information Administration (EIA)showed that the average price of natural gas for residential consumers was$9.53, $7.38, and $8.39 per 1000 cubic feet for the winters of 2000/2001,2001/2002, and 2002/2003, respectively [18]. The EIA estimated the averagenatural gas price during the winter of 2003/2004 to be $9.57 per 1000 cubicfeet [18]. The cold weather that hit the northeast United States in January2004 resulted in warnings to the public to conserve energy and to prepare for
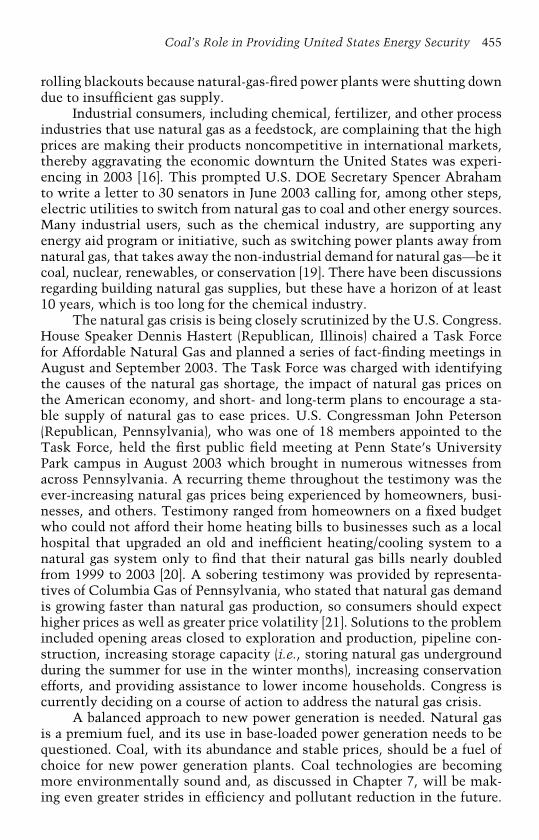
Coal’s Role in Providing United States Energy Security 455
rolling blackouts because natural-gas-fired power plants were shutting downdue to insufficient gas supply.
Industrial consumers, including chemical, fertilizer, and other processindustries that use natural gas as a feedstock, are complaining that the highprices are making their products noncompetitive in international markets,thereby aggravating the economic downturn the United States was experi-encing in 2003 [16]. This prompted U.S. DOE Secretary Spencer Abrahamto write a letter to 30 senators in June 2003 calling for, among other steps,electric utilities to switch from natural gas to coal and other energy sources.Many industrial users, such as the chemical industry, are supporting anyenergy aid program or initiative, such as switching power plants away fromnatural gas, that takes away the non-industrial demand for natural gas—be itcoal, nuclear, renewables, or conservation [19]. There have been discussionsregarding building natural gas supplies, but these have a horizon of at least10 years, which is too long for the chemical industry.
The natural gas crisis is being closely scrutinized by the U.S. Congress.House Speaker Dennis Hastert (Republican, Illinois) chaired a Task Forcefor Affordable Natural Gas and planned a series of fact-finding meetings inAugust and September 2003. The Task Force was charged with identifyingthe causes of the natural gas shortage, the impact of natural gas prices onthe American economy, and short- and long-term plans to encourage a sta-ble supply of natural gas to ease prices. U.S. Congressman John Peterson(Republican, Pennsylvania), who was one of 18 members appointed to theTask Force, held the first public field meeting at Penn State’s UniversityPark campus in August 2003 which brought in numerous witnesses fromacross Pennsylvania. A recurring theme throughout the testimony was theever-increasing natural gas prices being experienced by homeowners, busi-nesses, and others. Testimony ranged from homeowners on a fixed budgetwho could not afford their home heating bills to businesses such as a localhospital that upgraded an old and inefficient heating/cooling system to anatural gas system only to find that their natural gas bills nearly doubledfrom 1999 to 2003 [20]. A sobering testimony was provided by representa-tives of Columbia Gas of Pennsylvania, who stated that natural gas demandis growing faster than natural gas production, so consumers should expecthigher prices as well as greater price volatility [21]. Solutions to the problemincluded opening areas closed to exploration and production, pipeline con-struction, increasing storage capacity (i.e., storing natural gas undergroundduring the summer for use in the winter months), increasing conservationefforts, and providing assistance to lower income households. Congress iscurrently deciding on a course of action to address the natural gas crisis.
A balanced approach to new power generation is needed. Natural gasis a premium fuel, and its use in base-loaded power generation needs to bequestioned. Coal, with its abundance and stable prices, should be a fuel ofchoice for new power generation plants. Coal technologies are becomingmore environmentally sound and, as discussed in Chapter 7, will be mak-ing even greater strides in efficiency and pollutant reduction in the future.
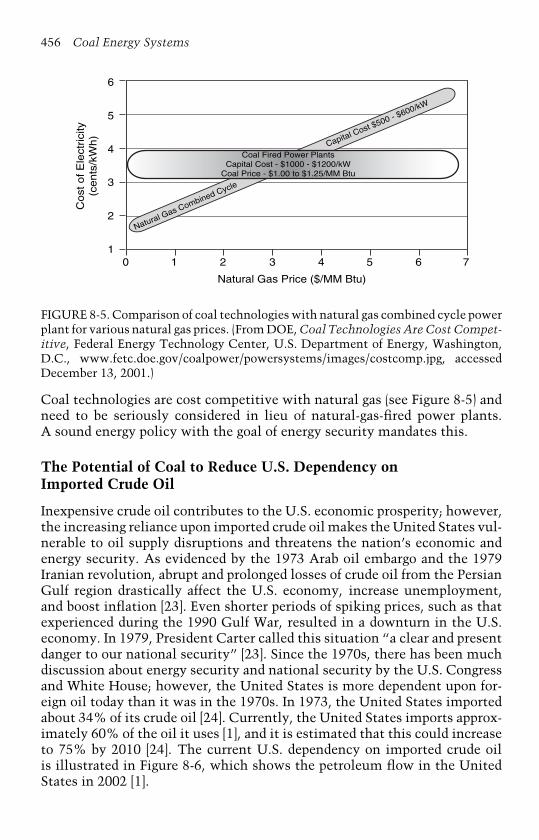
456 Coal Energy Systems
6
5
4
3
2
10 1 2 3 4 5 6 7
Natural Gas Price ($/MM Btu)
Natural Gas Combined Cycle
Capital Cost $500 - $600/kW
Co
st o
f E
lect
rici
ty(c
en
ts/k
Wh
)
Coal Fired Power PlantsCapital Cost - $1000 - $1200/kW
Coal Price - $1.00 to $1.25/MM Btu
FIGURE 8-5. Comparison of coal technologies with natural gas combined cycle powerplant for various natural gas prices. (From DOE, Coal Technologies Are Cost Compet-itive, Federal Energy Technology Center, U.S. Department of Energy, Washington,D.C., www.fetc.doe.gov/coalpower/powersystems/images/costcomp.jpg, accessedDecember 13, 2001.)
Coal technologies are cost competitive with natural gas (see Figure 8-5) andneed to be seriously considered in lieu of natural-gas-fired power plants.A sound energy policy with the goal of energy security mandates this.
The Potential of Coal to Reduce U.S. Dependency onImported Crude Oil
Inexpensive crude oil contributes to the U.S. economic prosperity; however,the increasing reliance upon imported crude oil makes the United States vul-nerable to oil supply disruptions and threatens the nation’s economic andenergy security. As evidenced by the 1973 Arab oil embargo and the 1979Iranian revolution, abrupt and prolonged losses of crude oil from the PersianGulf region drastically affect the U.S. economy, increase unemployment,and boost inflation [23]. Even shorter periods of spiking prices, such as thatexperienced during the 1990 Gulf War, resulted in a downturn in the U.S.economy. In 1979, President Carter called this situation “a clear and presentdanger to our national security” [23]. Since the 1970s, there has been muchdiscussion about energy security and national security by the U.S. Congressand White House; however, the United States is more dependent upon for-eign oil today than it was in the 1970s. In 1973, the United States importedabout 34% of its crude oil [24]. Currently, the United States imports approx-imately 60% of the oil it uses [1], and it is estimated that this could increaseto 75% by 2010 [24]. The current U.S. dependency on imported crude oilis illustrated in Figure 8-6, which shows the petroleum flow in the UnitedStates in 2002 [1].

Crude Oil Exports
0.01
Other Liquids Refinery Input
0.93 Imports 0.77
Domestic 0.11 Reprocessed 0.05
Refined Products Imports
1.54
Refined Products Exports
0.97Other Liquids
for Reprocessing 0.05
Residential 0.88
Industrial 4.93
Transportation 13.08
Petroleum Consumption
19.66
Motor Gasoline
8.84
Distillate Fuel Oil
3.77
2.16Liquefied
Petroleum Gases
Residual Fuel Oil
Jet Fuel 1.61
0.66
Other 2.62
Crude Oil Imports
9.05
Crude Oil Production
5.82
Crude Oil Supply 14.86
Crude Oil Refinery
Input 14.93
Refinery Input 16.30
Refinery Output 17.25
Unaccounted for Crude Oil
and Crude Oil Stock Change
0.07 NGPL Refinery
Input 0.44
Processing Gain 0.96
NGPL Direct Use
1.44 Fuel Ethanol and Motor Gasoline
Blending Components 0.31
Refined Product Stock Change
0.14
Electric Power 0.40
Commercial 0.37
FIGURE 8-6. Petroleum flow in the United States in 2002 in million barrels per day. (From EIA, Annual Energy Review 2002, EnergyInformation Administration, U.S. Department of Energy, Washington, D.C., October 2003.)
458 Coal Energy Systems
The solution to achieving energy security in the United States doesnot involve isolationism or switching to importing crude oil only from non–Persian Gulf countries, even if either of these options could be realized.Taylor [25] points out that being energy independent, with respect to oilconsumption, does not insulate oneself from a global crisis. The oil pricespike of 1979 affected Great Britain, where all of the oil Great Britain con-sumed came from the North Sea, as much as it affected Japan, a country thatimported all of its oil. The reason for this is the market for crude oil is global,not regional.
The United States is increasingly dependent on foreign crude oil and isvery vulnerable to an oil supply disruption. Currently, four major producersprovide over one-third of the U.S. oil supply: Canada, Mexico, Venezuela, andthe Persian Gulf region (Bahrain, Iran, Iraq, Kuwait, Qatar, Saudi Arabia, andthe United Arab Emirates) [26]; therefore, reducing the quantity of importedcrude oil consumed in the United States is of utmost importance and is acrucial step to attain energy and economic security.
While the price of crude oil may be influenced by global events, thegoal of reducing the total amount of imported crude oil should be pursued.Approximately two-thirds of the petroleum consumed in the United Statesis in the transportation sector, with another 25% being consumed in theindustrial sector. Reducing the reliance of the transportation sector on oilis clearly a key to improving energy security. Options to lessen the depen-dency on imported crude oil include improving vehicle fuel efficiency anddiversifying the feedstocks to produce transportation fuels, transportationfuel additives, and liquid fuels/feedstocks to the industrial sector. Feed-stock diversification can be achieved by using biomass and coal. Utilizingbiomass for producing biofuels and additives is important and should be pur-sued; however, coal can provide the greatest and quickest impact in reducingdependence on imported crude oil due to the vast coal resources and proventechnological capability to produce liquid fuels from coal. Technologies existto convert coal to liquid products, as discussed in Chapter 5 (Technologiesfor Coal Utilization) and Chapter 7 (Future Power Generation), with activi-ties under way to further improve these processes. Gasification followed byFischer–Tropsch synthesis is the leading processing candidate for producingthe liquid fuels. The importance of coal to produce a variety of products,including transportation fuels, is evidenced by the direction of the DOE’sresearch and development programs addressing future plants that producepower, fuels, and chemicals.
The Resurgence of Coal in Electric Power Generation
Fuel diversity for power generation is necessary for energy security, which isrecognized by both industry and lawmakers. Tom Ridge, Secretary of the U.S.Department of Homeland Security, was a supporter of energy security while
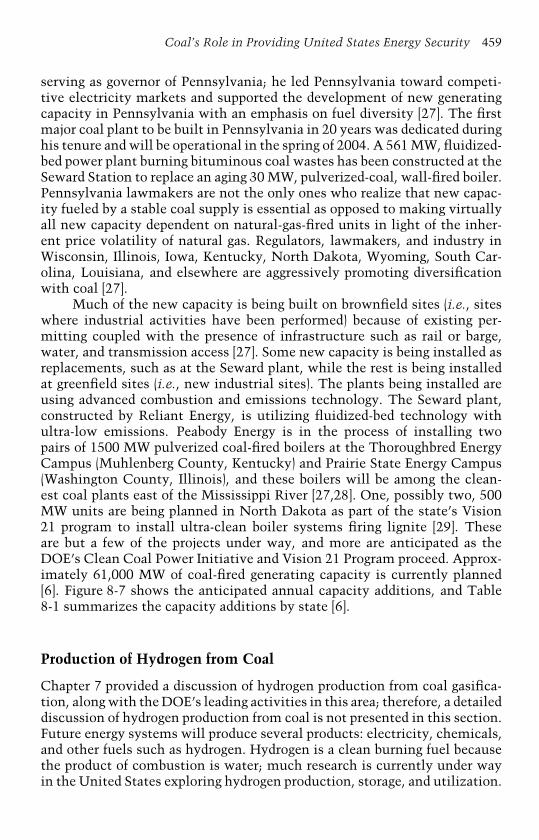
Coal’s Role in Providing United States Energy Security 459
serving as governor of Pennsylvania; he led Pennsylvania toward competi-tive electricity markets and supported the development of new generatingcapacity in Pennsylvania with an emphasis on fuel diversity [27]. The firstmajor coal plant to be built in Pennsylvania in 20 years was dedicated duringhis tenure and will be operational in the spring of 2004. A 561 MW, fluidized-bed power plant burning bituminous coal wastes has been constructed at theSeward Station to replace an aging 30 MW, pulverized-coal, wall-fired boiler.Pennsylvania lawmakers are not the only ones who realize that new capac-ity fueled by a stable coal supply is essential as opposed to making virtuallyall new capacity dependent on natural-gas-fired units in light of the inher-ent price volatility of natural gas. Regulators, lawmakers, and industry inWisconsin, Illinois, Iowa, Kentucky, North Dakota, Wyoming, South Car-olina, Louisiana, and elsewhere are aggressively promoting diversificationwith coal [27].
Much of the new capacity is being built on brownfield sites (i.e., siteswhere industrial activities have been performed) because of existing per-mitting coupled with the presence of infrastructure such as rail or barge,water, and transmission access [27]. Some new capacity is being installed asreplacements, such as at the Seward plant, while the rest is being installedat greenfield sites (i.e., new industrial sites). The plants being installed areusing advanced combustion and emissions technology. The Seward plant,constructed by Reliant Energy, is utilizing fluidized-bed technology withultra-low emissions. Peabody Energy is in the process of installing twopairs of 1500 MW pulverized coal-fired boilers at the Thoroughbred EnergyCampus (Muhlenberg County, Kentucky) and Prairie State Energy Campus(Washington County, Illinois), and these boilers will be among the clean-est coal plants east of the Mississippi River [27,28]. One, possibly two, 500MW units are being planned in North Dakota as part of the state’s Vision21 program to install ultra-clean boiler systems firing lignite [29]. Theseare but a few of the projects under way, and more are anticipated as theDOE’s Clean Coal Power Initiative and Vision 21 Program proceed. Approx-imately 61,000 MW of coal-fired generating capacity is currently planned[6]. Figure 8-7 shows the anticipated annual capacity additions, and Table8-1 summarizes the capacity additions by state [6].
Production of Hydrogen from Coal
Chapter 7 provided a discussion of hydrogen production from coal gasifica-tion, along with the DOE’s leading activities in this area; therefore, a detaileddiscussion of hydrogen production from coal is not presented in this section.Future energy systems will produce several products: electricity, chemicals,and other fuels such as hydrogen. Hydrogen is a clean burning fuel becausethe product of combustion is water; much research is currently under wayin the United States exploring hydrogen production, storage, and utilization.
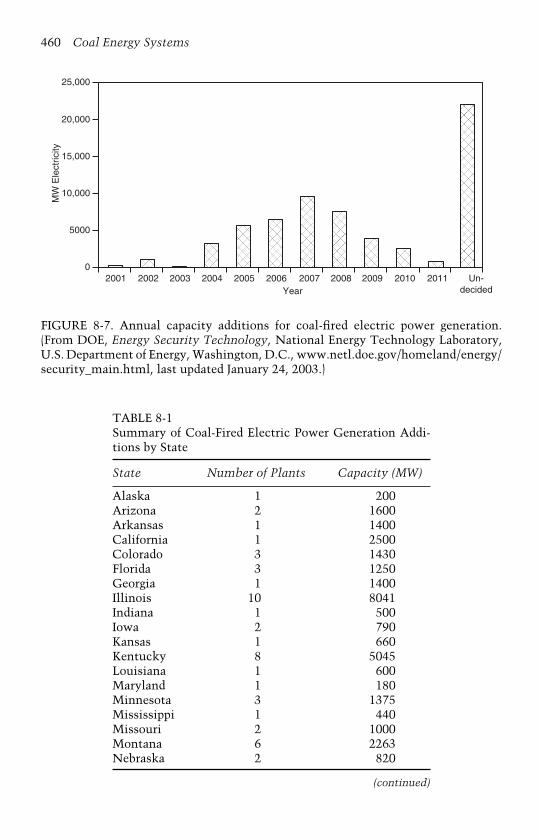
460 Coal Energy Systems
25,000
20,000
15,000
10,000
5000
02001 2002 2003 2004 2005 2006 2007 2008 2009 2010 2011 Un-
decidedYear
MW
Ele
ctric
ity
FIGURE 8-7. Annual capacity additions for coal-fired electric power generation.(From DOE, Energy Security Technology, National Energy Technology Laboratory,U.S. Department of Energy, Washington, D.C., www.netl.doe.gov/homeland/energy/security_main.html, last updated January 24, 2003.)
TABLE 8-1Summary of Coal-Fired Electric Power Generation Addi-tions by State
State Number of Plants Capacity (MW)
Alaska 1 200Arizona 2 1600Arkansas 1 1400California 1 2500Colorado 3 1430Florida 3 1250Georgia 1 1400Illinois 10 8041Indiana 1 500Iowa 2 790Kansas 1 660Kentucky 8 5045Louisiana 1 600Maryland 1 180Minnesota 3 1375Mississippi 1 440Missouri 2 1000Montana 6 2263Nebraska 2 820
(continued)
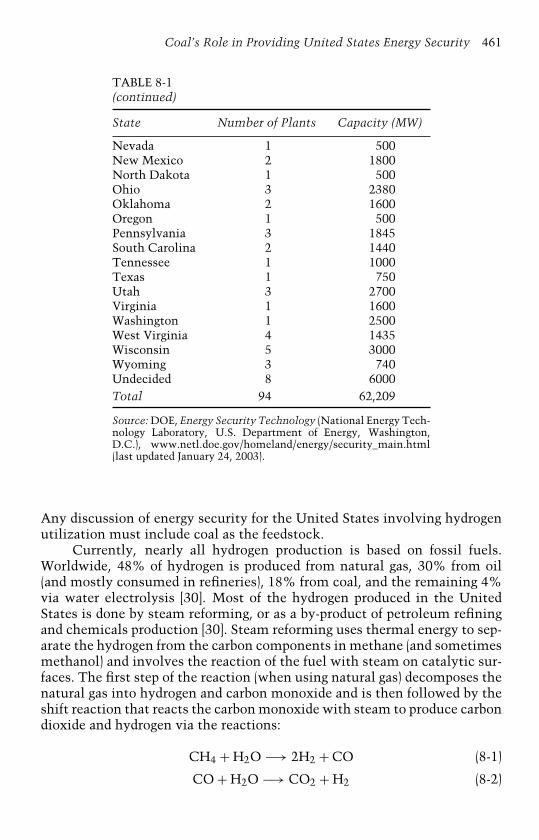
Coal’s Role in Providing United States Energy Security 461
TABLE 8-1(continued)
State Number of Plants Capacity (MW)
Nevada 1 500New Mexico 2 1800North Dakota 1 500Ohio 3 2380Oklahoma 2 1600Oregon 1 500Pennsylvania 3 1845South Carolina 2 1440Tennessee 1 1000Texas 1 750Utah 3 2700Virginia 1 1600Washington 1 2500West Virginia 4 1435Wisconsin 5 3000Wyoming 3 740Undecided 8 6000Total 94 62,209
Source: DOE, Energy Security Technology (National Energy Tech-nology Laboratory, U.S. Department of Energy, Washington,D.C.), www.netl.doe.gov/homeland/energy/security_main.html(last updated January 24, 2003).
Any discussion of energy security for the United States involving hydrogenutilization must include coal as the feedstock.
Currently, nearly all hydrogen production is based on fossil fuels.Worldwide, 48% of hydrogen is produced from natural gas, 30% from oil(and mostly consumed in refineries), 18% from coal, and the remaining 4%via water electrolysis [30]. Most of the hydrogen produced in the UnitedStates is done by steam reforming, or as a by-product of petroleum refiningand chemicals production [30]. Steam reforming uses thermal energy to sep-arate the hydrogen from the carbon components in methane (and sometimesmethanol) and involves the reaction of the fuel with steam on catalytic sur-faces. The first step of the reaction (when using natural gas) decomposes thenatural gas into hydrogen and carbon monoxide and is then followed by theshift reaction that reacts the carbon monoxide with steam to produce carbondioxide and hydrogen via the reactions:
CH4 + H2O −→ 2H2 + CO (8-1)
CO + H2O −→ CO2 + H2 (8-2)
462 Coal Energy Systems
The use of natural gas to produce hydrogen does not make any sense. Naturalgas is a premium fuel for the residential and industrial sectors and possiblywill have an increased role in the transportation sector in compressed naturalgas mass-transit systems. Depending upon natural gas for hydrogen produc-tion has many of the same negative consequences to the economy as doesusing natural gas for power generation.
Hydrogen has many uses, including as a feedstock to fuel cells, as afuel for power generation, and as a transportation fuel; however, much workneeds to be done before most of these applications will become commercial,some of which will take two or three decades. In short, the reality of a fullhydrogen economy is many years in the future. During the development ofthese hydrogen technologies, the DOE is aggressively pursuing “clean” tech-nologies for hydrogen production using coal. This option provides the mostenergy and economic security to the United States because of the abundanceand price of coal.
The Role of Coal in Providing Security to theU.S. Food Supply
When discussing U.S. energy/national security, one issue that has been raisedover the last few years is the role of coal in providing security to the U.S.food supply. There has been concern among some individuals in the U.S. ren-dering industry and certain government agencies about ensuring a safe foodsupply from both natural and humanmade threats (i.e., terrorism, diseaseoutbreaks). The diseases of most concern include hoof-and-mouth disease,bovine spongiform encephalopathy (BSE, or “mad cow” disease), and chronicwasting disease (CWD) [31–36]. These concerns stem from the incident ofBSE and hoof-and-mouth disease widely reported in Europe, the outbreaks ofCWD in the United States (such as the 2004 incident in Wisconsin) [34,35],the first reports of BSE in North America which occurred in Canada, thedetection of BSE in the United States in December 2003 [37], and the 2004threat of acts of terrorism against the United States. Penn State has beenworking with various rendering companies, trade organizations, and govern-ment agencies for several years to evaluate the potential of using animal fats,proteins, and carcasses as boiler fuels [38–40].
It was noted in 2001 that BSE, which is a major health concern inEurope, had a very low risk potential for occurring in the United States,as determined by a landmark study by Harvard University [41]. The studydid identify a potential pathway for the spread of BSE in the animal chainthrough deadstock (i.e., dead and downer animals) on farms and ranches.This issue was being addressed by specific handling practices in the ren-dering industry and through regulatory options [31–33,36]. Interestingly, itwas a paralyzed cow, a downer, that was detected in the U.S. food chainas having BSE that set off the scare that resulted in many changes in the
Coal’s Role in Providing United States Energy Security 463
rendering/packing industry, negatively affected the export market (resultingin layoffs of meat packing workers), and resulted in a downturn in the beefindustry economy [36,42,43]. New regulations anticipated in Spring 2004are expected to increase the amount of specified risk material from about1.5 lb/beef carcass (brain and spinal cord) to 100 lb/carcass, forcing theindustry to explore various disposal options [36].
One issue with regard to a major disease outbreak is how to dispose ofa large number of carcasses in a short period of time, which will be neces-sary to limit proliferation of the disease. A recent example, although on amuch smaller scale, was the need to identify disposal options for deer in Wis-consin infected with CWD in 2002 [34,35]. Approximately 10,000 to 25,000deer in a 360-square-mile area were targeted to be killed to stop the spreadof CWD [34]; however, identifying options for disposing of the carcasseswas a major problem. Options identified included landfilling, rendering, andincineration/digestion [34]. Rendering was an option in this case becausethere were facilities that had the capability to process this quantity of mate-rial (each deer weighs 120 to 140 lb). There was a concern, though, about thewastewater that would be produced during the rendering. Preliminary testswere performed in which a few deer carcasses were disposed of at a foundry,and apparently the tests were successful (although the number of carcassesdisposed of was small and no stack testing was performed to measure emis-sions). The decision was made to incinerate the carcasses [44]. This was anexample where the number of carcasses (and total weight) could be handledwith existing methods and infrastructure; however, an important concern ishow to dispose of a large herd of cattle in an emergency situation and whatoptions would be available. With proper planning and foresight, both utilityand industrial boilers can be used to handle such an emergency. Doing sowill involve a partnership of the packing/rendering industry, the federal gov-ernment, and boiler owner/operators. The federal government’s role wouldinclude emergency oversight and funding for modifying boilers (prior to theemergency) and handling/disposing of carcasses during the emergency.
The types of boilers that can be used in an emergency include boilerscurrently designed for liquid fuels as well as existing fluidized-bed boilers. Itis understood that, should there be an outbreak of a highly contagious diseasesuch as hoof-and-mouth disease, the herd is to be quarantined with severerestrictions on movement into and out of the infected area. The renderingindustry can move a mobile system into this area via rail, and rendered fatscan be utilized in the boiler, thus supplying steam to the rendering processas well as providing rendered fats, which have a heating value nearly as highas number 6 fuel oil (i.e., ∼18,000 Btu/lb), to other boilers in the immediatearea. However, the number of carcasses that can be processed per day in thismanner is limited, and other options should be explored, including cofiringthe carcasses with coal in a fluidized-bed system or firing the carcasses ina boiler designed specifically for this feedstock. In the case of a hoof-and-mouth outbreak, the boiler would need to be nearby. For other cases, such as
464 Coal Energy Systems
outbreaks of CWD, avian influenza (AI), or the identification of BSE cases, itwill be easier to transport the animals or birds to the boilers and the numberof candidate boilers would be larger.
In one example of planning for a national emergency, targeted fluidized-bed boilers throughout the country could be modified with emergencyhandling systems (although one hopes that they will never have to be used)that will take an entire carcass, grind it (as is currently done in the render-ing industry), and feed the “chunked” cow directly into the fluidized-bedboiler. The chunked cow, with a heating value of about 4000 Btu/lb [36],can easily be cofired with coal and can even be a stand-alone fuel in a boilerdesigned for this feedstock. The first step in identifying candidate boilerswill be to overlay maps of locations of fluidized-bed and other appropriateutility and industrial boilers with rendering and packing facilities as well asmajor herd concentrations (which tend to correspond to meat packing facil-ities). As an example, Figure 5-11 in Chapter 5 provides a map of the UnitedStates showing the locations of coal-fired, fluidized-bed boilers that could beutilized.
The rendering industry is currently interested in installing industrial-sized, coal-fired, fluidized-bed boilers to dispose of deadstock, and prelim-inary inquiries have been made of boiler vendors. The rendering industryis interested in this because it has the potential to solve the problem of dis-posal of deadstock, which can be 100,000 to 200,000 carcasses per year, whileproducing steam to meet their processing needs [45].
Similarly, an outbreak of AI in Virginia in 2002 was handled by dis-posing of approximately 16,000 tons of dead birds in landfills at a cost of$2.5 million [46]; however, Brglez [46] has shown that the birds could havebeen rendered into meal and utilized as a fuel at a nearby cement plant ata savings of $1 million to the industry. The concept of using animal mealto displace 10 to 15% of the coal (on a heat input basis) in cement kilns iscurrently being practiced in France and Italy [46]. Utilization of these typesof materials as a cofire fuel with coal, instead of landfilling them, shouldbecome standard practice. This has three benefits: reduced disposal costs forthe food industry, reduced fuel costs to the boiler operator, and enhancednational security to the U.S. food supply.
Coal’s Role in International Energy Security andSustainable Development
In order to preserve the option for utilizing coal in the future and to ensurethat coal usage is performed in an environmentally acceptable manner, theElectric Power Research Institute (EPRI) undertook the Global Coal Initia-tive (GCI) in 2000 [47,48]. This initiative builds on and supplements DOEinitiatives and worldwide coal combustion advances that are aimed at main-taining the strategic value of coal as a power-generating fuel worldwide.
Coal’s Role in Providing United States Energy Security 465
The GCI involves a consortium of participants worldwide—coal suppliers,coal users, equipment manufacturers, and industry/government consortia—that are incorporating a long-term focus on development options for resolvingcarbon-energy conflicts and enabling the sustainable, competitive use ofcoal at near-zero emissions by 2020. The long-term viability of coal as aworldwide generating fuel depends on finding ways to further reduce or eveneliminate the environmental impact of coal, including CO2 emissions. TheGCI is engaged in projects that focus on near-term operational movementsand longer term coal-retention solutions [48]. The projects will help sustaina diversity of generating fuel resources as a hedge against price fluctuations,enhance the value of existing coal-fired power plants, and provide optionsfor using coal in new plants [48].
One activity under the GCI is a new valuation framework to weighprivate and public investment in advanced coal technologies to show thevalue to society of developing superior coal technologies to maintain fueldiversity [47]. Results suggest that the coal research and development in theUnited States will produce approximately $1.4 trillion in net benefits to U.S.consumers by 2050.
The essential six elements of the GCI, endorsed by the various fac-tions of the global coal community, are (1) ultra-supercritical plant designs;(2) low-volatile coal combustion; (3) the value of real options for coal; (4)CO2 control options; (5) advanced coal gasification, fluidized-bed, and othercoal options; and (6) lignite and low-rank coal plant improvements [47,48].Through ultra-supercritical plant designs, the initiative is evaluating anddeveloping materials for advanced steam cycles in order to enhance effi-ciency and reduce emissions of pollutants and CO2 from next-generationplants. The GCI is providing innovative solutions to operating problemswith low-volatile coals, which are prevalent in China, India, South Africa,and Australia, to reduce fuel costs, maintain satisfactory performance dur-ing cycling and at low loads, and maintain NOx emissions and unburnedcarbon levels at desired levels. Real options models are being developed andassessments performed so power producers can more effectively utilize coalas an option in their future asset base. Technological approaches and costs todesign, procure equipment, construct, and operate power plants that separateand sequester CO2 will be evaluated. Advanced approaches for utilizing coalwill be developed and evaluated, including gasification, advanced fluidized-bed combustion, and hydrogen and chemical co-production, an effort thatsupports the DOE’s various programs discussed in Chapter 7. The GCI is alsodeveloping solutions to fuel processing and boiler slagging in power plantsthat burn high-moisture lignite. There are vast lignite fields in the Dako-tas, the Texas–Mississippi basin, Germany and Central Europe, Australia,China, and India; however, challenging issues related to the high moisturecontent need to be resolved.
The GCI complements the United Nations initiative to address coal andsustainable development [49]. Although coal and sustainable development

466 Coal Energy Systems
may be contradictory terms to some, this was not the message that camefrom the World Summit on Sustainable Development held in Johannesburg,South Africa, in August/September 2002, where it was agreed that not onlyis coal compatible with sustainable development, but it is also essential[49]. Sustainable development was defined as “development that meets theneeds of the present generation without undermining the capacity of futuregenerations to meet their needs.”
At the summit, the World Bank noted that improved energy servicescan enhance indoor air quality and reduce health hazards (by switching fromtraditional biomass and fossil fuels for cooking and heating), increase income(by reducing the time in collecting traditional biomass and implementingsmall-scale manufacturing and service activities), bring environmental ben-efits (by stopping deforestation and its subsequent soil degradation), andprovide educational opportunities (by providing lighting or other services ofdirect educational relevance) [49]. At the summit, it was estimated that 1.6billion people in developing countries have no access to electricity, while2.4 billion rely on primitive biomass for cooking and heating and that, in30 years, there would still be 1.4 billion people without electricity and 2.6billion people still relying on traditional biomass. It was these challengesthat the summit addressed and a plan of implementation was developed.One aspect of the plan asks governments to diversify energy supply bydeveloping advanced, cleaner, more efficient, affordable, and cost-effectiveenergy technologies, including fossil fuel technologies, and to transfer thesetechnologies to developing countries.
At the summit, it was clear that coal has been, and must continue to be,a major contributor of sustainable development because coal can be foundin most nations of the world [49]. On a global scale, coal accounts for ∼25%of world primary energy consumption and fuels 35% of the world electricitygeneration, ∼5 billion short tons/year are consumed, the international coaltrade consists of ∼600 million short tons/year, there are more than 200 yearsof reserves at current rates of consumption, coal is a “conflict-free” energysource, and there is a diversity of reserves and production. Coal must beused efficiently and cleanly, and it was recognized at the summit that coaltechnologies continue to improve and effective options are now availablefor countries of all levels of economic development with respect to emis-sions reduction. Coal continues to be the foundation for economic and socialdevelopment of the world’s largest economies in both the developed anddeveloping world. Coal is a major component in securing an improved qual-ity of life for billions of people worldwide who gain access to it through theenergy services they need for daily life, industrial development, and socialadvancement. A sustainable energy policy can be achieved by encouragingelectrification, establishing sound environmental regulations, safeguardingenergy supplies through diversification, and continuing to support advancedcoal technologies.
Coal’s Role in Providing United States Energy Security 467
Concluding Statements
Consumers in the United States are feeling the impact of volatile foreign oilsupplies with high prices at the gas pumps and through increased costs forgoods and services that use oil and related fuels in their production processes.Volatile natural gas prices are also negatively impacting consumers. Theseissues are challenging U.S. policymakers to implement an energy policythat ensures greater independence from foreign energy interests and therebygreater energy security for the United States. Low-cost and abundant coal isa domestic resource of great strategic value.
Coal is the most abundant energy resource in the United States andfuels as much electricity generation as all other sources combined. TheUnited States has more coal reserves than all of the oil reserves in the world.The energy value in Montana’s coal reserves, for instance, are greater thanthe oil reserves in Saudi Arabia, Kuwait, Iran, and Iraq combined [14].
Coal’s strategic value as a fuel source is due to its role in increas-ing economic growth and development and providing energy security atthe local, national, and international levels [50]. The usage of coal pro-vides jobs, supports infrastructure through taxes, supports economic growthand electrification, encourages productivity through electric technologies,provides a reliable energy source, is resistant to energy shocks, and stabi-lizes power prices. Coal-fired power plants provide system security throughinfrastructure reliability, which prevents sudden disruptions because [50]:
• There are many diverse sources of coal, thus the supply of coal is lessvulnerable to disruption;
• Coal-fired plants have better storage capability near the powergeneration site because they are less vulnerable to transportationdisruption;
• Coal has a more certain availability during peak demand;• Coal-fired power plants are less vulnerable to outages because they
are a mature, reliable technology;• Coal-fired power plants are less vulnerable to terrorism compared to
nuclear power plants, natural gas pipelines, or liquefied natural gasfacilities.
Energy security in the United States cannot be overemphasized, andits importance is clearly evident in the National Energy Policy as well asin the DOE’s Coal Power Program. One of the DOE’s strategic goals isto protect national and economic security by promoting a diverse supplyof reliable, affordable, and environmentally sound energy [51]. This goalis accomplished by developing technologies that foster a diverse supply ofaffordable and environmentally sound energy, improving energy efficiency,providing for reliable delivery of energy, exploring advanced technologies

468 Coal Energy Systems
that make fundamental changes in energy options, and guarding againstenergy emergencies. Benefits of the Coal Power Program include reducingdependence on imported oil, which can be achieved by co-production ofpower and environmentally attractive fuels such as Fischer–Tropsch liquidsand hydrogen. Additional benefits include maintaining diversity of energyresource options to avoid over-reliance on natural gas for power generation,encouraging economical use of natural gas in other sectors, and reducingenergy price volatility and supply uncertainty. The Coal Power Programalso retains domestic manufacturing capabilities and U.S. energy technologyleadership to enhance economic growth and security. Technologies devel-oped through the DOE’s Coal Power Program can also be used to ensure asafe food source for the United States.
The energy security and sustainability of the United States depend onsufficient energy supplies to support U.S. and global economic growth, andcoal is a major contributor to this security. Coal-fired electricity generationwill enable and stimulate economic growth and social welfare. Diversifyingenergy production, through the use of coal in power generation and pro-duction of chemicals and hydrogen, provides the United States with energysecurity. Economic growth and energy security will enable cost-effectiveenvironmental controls and continued energy affordability.
References
1. EIA, Annual Energy Review 2002 (Energy Information Administration, U.S.Department of Energy, Washington, D.C., October 2003).
2. DOE, National Energy Technology Laboratory Accomplishments FY2000(Office of Fossil Energy, Washington, D.C., September 2001).
3. USEA, National Energy Security Post 9/11 (U.S. Energy Association, Washing-ton, D.C., June 2002).
4. EIA, International Energy Outlook 2002 (Energy Information Administration,U.S. Department of Energy, Washington, D.C., March 2002).
5. EIA, Annual Energy Outlook 2003 (Energy Information Administration, U.S.Department of Energy, Washington, D.C., January 2003).
6. DOE, Energy Security Technology (National Energy Technology Laboratory,U.S. Department of Energy), www.netl.doe.gov/homeland/energy/security_main.html (last updated January 24, 2003).
7. Kripowicz, R. S., Remarks to the Clean Coal Power Initiative Planning Work-shop (National Energy Technology Laboratory, U.S. Department of Energy,Washington, D.C., September 28, 2001), www.netl.doe.gov/coalpower/ccpi/main.html.
8. Caylor, B., Coal’s Role in the National Energy Plan, Energia, Vol. 13, No. 3,2001, p. 5.
9. NEPD Group, National Energy Policy (National Energy Policy Development,U.S. Government Printing Office, Washington, D.C., May 2001).

Coal’s Role in Providing United States Energy Security 469
10. Abraham, S., Remarks to the Clean Coal and Power Conference (Office of FossilEnergy, U.S. Department of Energy, Washington, D.C., November 17, 2003),www.fossil.energy.gov/news/speeches/03/03_sec_cleancoal_111703.html.
11. Roberts, A., Four Common Sense Reasons to Burn Coal, and One More, CoalAge, Vol. 108, No. 10, Nov./Dec. 2003, pp. 37–38.
12. EIA, Energy Price Impacts on the U.S. Economy (Energy Information Admin-istration, U.S. Department of Energy, Washington, D.C., April 2001),www.eia.doe.gov/oiaf/economy/energy_price.html.
13. Eastman, M. L., Clean Coal Power Initiative, presented at the Clean CoalPower Conference (National Energy Technology Laboratory, U.S. Depart-ment of Energy, Washington, D.C., November 18, 2003), www.netl.doe/gov/coalpower/ccpi/program_info.html.
14. Svec, V., Again a Crisis with a Solution: Energy in America and Coal-BasedGeneration (American Coal Council, Phoenix, AZ, 2003), pp. 15–19.
15. Williams, J., Transmission Upgrades: Key to Low-Cost Power and GreaterUse of Coal-Fired Generation, Power Engineering, Vol. 107, No. 6, June 2003,pp. 31–36.
16. Smock, B., Natural Gas Crisis Revisited, Power Engineering, Vol., 107, No. 8,Aug. 2003, p. 5.
17. Silverstein, K., Pipeline Pressures on the Rise, Energy Industry Issues Newslet-ter, December 10, 2003, www.utilipoint.com.
18. EIA, Short-Term Energy Outlook: January 2004 (Energy Information Admin-istration, U.S. Department of Energy, Washington, D.C.), www.eia.doe.gov/emeu/steo/pub/contents.html#electric (last modified January 7, 2004).
19. Johnson, J., Congress Tackles Energy Bill Again, Chemical & EngineeringNews, Vol. 82, No. 3, Jan. 19, 2004, pp. 68–60.
20. McAleer, A. G., Testimony of A. Gordon McAleer (U.S. House Task Force forNatural Gas Affordability Public Hearing, State College, PA, August 8, 2003).
21. Murphy, T. J., Testimony of Terrence J. Murphy (U.S. House Task Force forNatural Gas Affordability Public Hearing, State College, PA, August 8, 2003).
22. DOE, Coal Technologies are Cost Competitive (Federal Energy TechnologyCenter, U.S. Department of Energy, Washington, D.C.), www.fetc.doe.gov/coalpower/powersystems/images/costcomp.jpg (accessed December 13, 2001).
23. Coon, C., Strengthening National Security Through Energy Security (TheHeritage Foundation, Washington, D.C., April 2002), www.heritge.org/Research/EnergyandEnvironment/WM94.cfm.
24. NRE, Energy Security (National Renewable Energy Laboratory, U.S. Depart-ment of Energy, Washington, D.C.), www.nrel.gov/clean_energy/security.html(accessed January 18, 2004).
25. Taylor, J., Don’t Worry About Energy Security (Cato Institute, Washington,D.C., October 18, 2001), www.cato.org/cgi-bin/scripts/printtech.cgi/dailys/10-18-01.html.
26. DOE, Biofuels and U.S. Energy Security (Office of Energy Efficiencyand Renewable Energy, U.S. Department of Energy, Washington, D.C.),www.ott.doe.gov/biofuels/energy_security.html (last updated December 12,2003).

470 Coal Energy Systems
27. Anon., Homeland Security: U.S. Brownfield, Power Engineering, Vol. 106,No. 6, June 2002, pp. 28–34.
28. Anon., Peabody’s Englehardt Says Two 1500-MW Coal-Burning Power PlantsWill Be Built, Coal Age, Vol. 108, No. 8, Sept. 2003, p. 16.
29. Lignite Energy Council, www.lignitevision21.com (accessed February 2, 2004).30. EERE, Hydrogen (Office of Energy Efficiency and Renewable Energy, U.S.
Department of Energy, Washington, D.C., February 5, 2003), www.eere.energy.gov/hydrogenandfuelcells/hydrogen/production/html.
31. Mullane, D. K., Taylor By-Products, Inc., personal communications, 2002.32. Detwiler, L., Animal and Plant Health Inspection Service, U.S. Department of
Agriculture, personal communications, 2002.33. Adams, J., Animal Health & Farm Services, National Milk Producers Federa-
tion, personal communication, March 2002.34. Orlander, D., National Renders Association Contract Veterinarian, personal
communication, May 5, 2002.35. Anon., Deer Disease Raises Concerns About Venison, Centre Daily Times,
June 2, 2002.36. Harlan, D., Taylor-Excel Food Solutions Company, personal communication,
March 2004.37. C&EN, Mad Cow Disease Outbreak, Chemical & Engineering News, Vol. 82,
No. 1, Jan. 5, 2004, p. 11.38. Miller, B. G., D. A. Clark, M. A. Hill, J. Larsen, T. Clemens, and T. Wehr, A
Demonstration of Pig Lard as an Industrial Boiler Fuel, in Proc. of the 24thInternational Conference on Coal Utilization and Fuel Systems (Coal & SlurryTechnology Association, Washington, D.C., March 1999), pp. 743–754.
39. Miller, B. G., S. Falcone Miller, and A. W. Scaroni, Utilizing AgriculturalBy-Products in Industrial Boilers: Penn State’s Experience and Coal’s Role inProviding Security for Our Nation’s Food Supply, in Proc. of the NineteenthAnnual International Pittsburgh Coal Conference (University of Pittsburgh,Pittsburgh, PA, September 2002).
40. Miller, B. G. and S. Falcone Miller, Utilizing Biomass in Industrial Boilers:The Role of Biomass and Industrial Boilers in Providing Energy/National Secu-rity, in Proc. of the First CIBO Industrial Renewable Energy and BiomassConference (Council of Industrial Boiler Owners, Burke, VA, April 7–9, 2003).
41. USDA, Evaluation of the Potential for Bovine Spongiform Encephalopa-thy in the United States (Animal and Plant Health Inspection Service,U.S. Department of Agriculture, Washington, D.C., November 2001),www.aphis.usda.gov/oa/bse/.
42. Anon., Mad Cow Fears Leading to Layoffs, Centre Daily Times, January 24,2004.
43. Anon., ‘Mad Cow’ Scare Could Cost Pennsylvania Millions, Penn State Livewebsite, http://live.psu.edu/story/5261, January 15, 2004.
44. Orlander, D., National Renders Association Contract Veterinarian, personalcommunication, March 13, 2003.
45. McMurtry, W. R., Darling International, personal communications, 2004.
Coal’s Role in Providing United States Energy Security 471
46. Brglez, B. Major, U.S. Army Veterinary Corps, personal communication,February 14, 2003.
47. Armor, T., Coal-Fired Power Plants: Increasingly Lean and Green, PowerEngineering, Vol. 105, No. 9, September 2001, pp. 40–43.
48. Anon., Bush Energy Policy Resonates with Global Coal Initiative, EPRI Journal,Vol. 26, No. 1, Summer 2001, pp. 21–23.
49. World Coal Institute, Coal and Sustainable Development: The World Summiton Sustainable Development and Its Implications, prepared for the UnitedNations Economic and Social Council Committee on Sustainable Energy,www.wci-coal.com, October 16, 2002.
50. Bruno, W. A., Coal’s Role in International Energy Security and SustainableDevelopment, in Proc. of the 2003 Conference on Unburned Carbon on UtilityFly Ash, October 28, 2003.
51. DOE, Clean Coal Technology Roadmap: “CURC/EPRI/DOE ConsensusRoadmap” Background Information (National Energy Technology Laboratory,U.S. Department of Energy, Washington, D.C., January 6, 2004), www.netl.doe.gov/coalpower/ccpi/main.html.

This page intentionally left blank
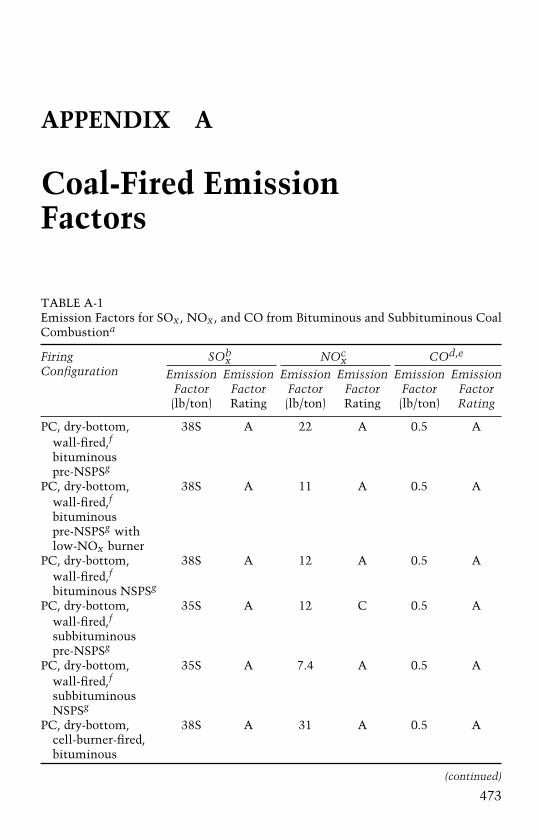
APPENDIX A
Coal-Fired EmissionFactors
TABLE A-1Emission Factors for SOx , NOx , and CO from Bituminous and Subbituminous CoalCombustiona
FiringConfiguration
SObx NOc
x COd,e
Emission Emission Emission Emission Emission EmissionFactor Factor Factor Factor Factor Factor(lb/ton) Rating (lb/ton) Rating (lb/ton) Rating
PC, dry-bottom,wall-fired,f
bituminouspre-NSPSg
38S A 22 A 0.5 A
PC, dry-bottom,wall-fired,f
bituminouspre-NSPSg withlow-NOx burner
38S A 11 A 0.5 A
PC, dry-bottom,wall-fired,f
bituminous NSPSg
38S A 12 A 0.5 A
PC, dry-bottom,wall-fired,f
subbituminouspre-NSPSg
35S A 12 C 0.5 A
PC, dry-bottom,wall-fired,f
subbituminousNSPSg
35S A 7.4 A 0.5 A
PC, dry-bottom,cell-burner-fired,bituminous
38S A 31 A 0.5 A
(continued)
473

474 Coal Energy Systems
TABLE A-1(continued)
FiringConfiguration
SObx NOc
x COd,e
Emission Emission Emission Emission Emission EmissionFactor Factor Factor Factor Factor Factor(lb/ton) Rating (lb/ton) Rating (lb/ton) Rating
PC, dry-bottom,cell-burner-fired,subbituminous
35S A 14 E 0.5 A
PC, dry-bottom,tangentially fired,bituminous,pre-NSPSg
38S A 15 A 0.5 A
PC, dry-bottom,tangentially fired,bituminous,pre-NSPSg withlow-NOx burner
38S A 9.7 A 0.5 A
PC, dry-bottom,tangentially fired,bituminous,NSPSg
38S — 10 A 0.5 A
PC, dry-bottom,tangentially fired,subbituminous,pre-NSPSg
35S A 8.4 A 0.5 A
PC, dry-bottom,tangentially fired,subbituminous,pre-NSPSg
35S A 7.2 A 0.5 A
PC, wet bottom,wall-fired,f
bituminous,pre-NSPSg
38S A 31 D 0.5 A
PC, wet bottom,tangentially fired,bituminous,NSPSg
38S A 14 E 0.5 A
PC, wet bottom,wall-fired,subbituminous
35S A 24 E 0.5 A
Cyclone furnace,bituminous
38S A 33 A 0.5 A
Cyclone furnace,subbituminous
35S A 17 C 0.5 A
(continued)
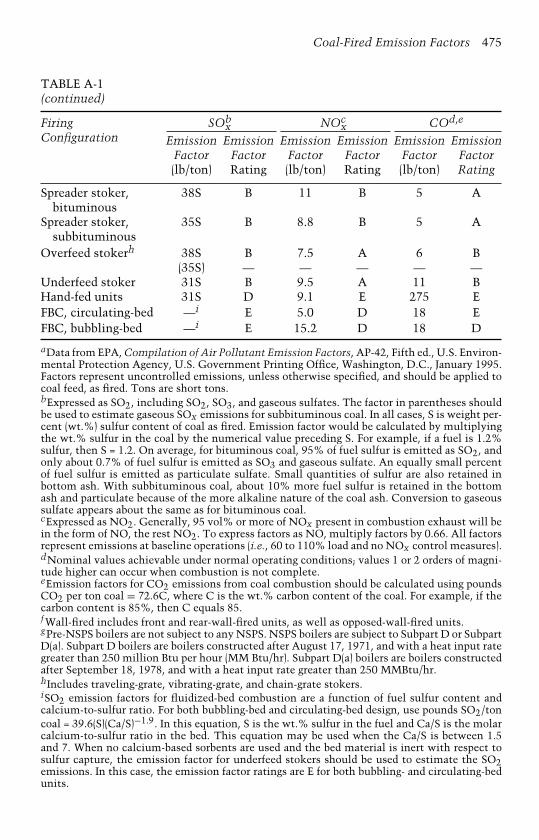
Coal-Fired Emission Factors 475
TABLE A-1(continued)
FiringConfiguration
SObx NOc
x COd,e
Emission Emission Emission Emission Emission EmissionFactor Factor Factor Factor Factor Factor(lb/ton) Rating (lb/ton) Rating (lb/ton) Rating
Spreader stoker,bituminous
38S B 11 B 5 A
Spreader stoker,subbituminous
35S B 8.8 B 5 A
Overfeed stokerh 38S B 7.5 A 6 B(35S) — — — — —
Underfeed stoker 31S B 9.5 A 11 BHand-fed units 31S D 9.1 E 275 EFBC, circulating-bed —i E 5.0 D 18 EFBC, bubbling-bed —i E 15.2 D 18 D
aData from EPA, Compilation of Air Pollutant Emission Factors, AP-42, Fifth ed., U.S. Environ-mental Protection Agency, U.S. Government Printing Office, Washington, D.C., January 1995.Factors represent uncontrolled emissions, unless otherwise specified, and should be applied tocoal feed, as fired. Tons are short tons.bExpressed as SO2, including SO2, SO3, and gaseous sulfates. The factor in parentheses shouldbe used to estimate gaseous SOx emissions for subbituminous coal. In all cases, S is weight per-cent (wt.%) sulfur content of coal as fired. Emission factor would be calculated by multiplyingthe wt.% sulfur in the coal by the numerical value preceding S. For example, if a fuel is 1.2%sulfur, then S = 1.2. On average, for bituminous coal, 95% of fuel sulfur is emitted as SO2, andonly about 0.7% of fuel sulfur is emitted as SO3 and gaseous sulfate. An equally small percentof fuel sulfur is emitted as particulate sulfate. Small quantities of sulfur are also retained inbottom ash. With subbituminous coal, about 10% more fuel sulfur is retained in the bottomash and particulate because of the more alkaline nature of the coal ash. Conversion to gaseoussulfate appears about the same as for bituminous coal.cExpressed as NO2. Generally, 95 vol% or more of NOx present in combustion exhaust will bein the form of NO, the rest NO2. To express factors as NO, multiply factors by 0.66. All factorsrepresent emissions at baseline operations (i.e., 60 to 110% load and no NOx control measures).dNominal values achievable under normal operating conditions; values 1 or 2 orders of magni-tude higher can occur when combustion is not complete.eEmission factors for CO2 emissions from coal combustion should be calculated using poundsCO2 per ton coal = 72.6C, where C is the wt.% carbon content of the coal. For example, if thecarbon content is 85%, then C equals 85.f Wall-fired includes front and rear-wall-fired units, as well as opposed-wall-fired units.gPre-NSPS boilers are not subject to any NSPS. NSPS boilers are subject to Subpart D or SubpartD(a). Subpart D boilers are boilers constructed after August 17, 1971, and with a heat input rategreater than 250 million Btu per hour (MM Btu/hr). Subpart D(a) boilers are boilers constructedafter September 18, 1978, and with a heat input rate greater than 250 MMBtu/hr.hIncludes traveling-grate, vibrating-grate, and chain-grate stokers.iSO2 emission factors for fluidized-bed combustion are a function of fuel sulfur content andcalcium-to-sulfur ratio. For both bubbling-bed and circulating-bed design, use pounds SO2/toncoal = 39.6(S)(Ca/S)−1.9. In this equation, S is the wt.% sulfur in the fuel and Ca/S is the molarcalcium-to-sulfur ratio in the bed. This equation may be used when the Ca/S is between 1.5and 7. When no calcium-based sorbents are used and the bed material is inert with respect tosulfur capture, the emission factor for underfeed stokers should be used to estimate the SO2emissions. In this case, the emission factor ratings are E for both bubbling- and circulating-bedunits.
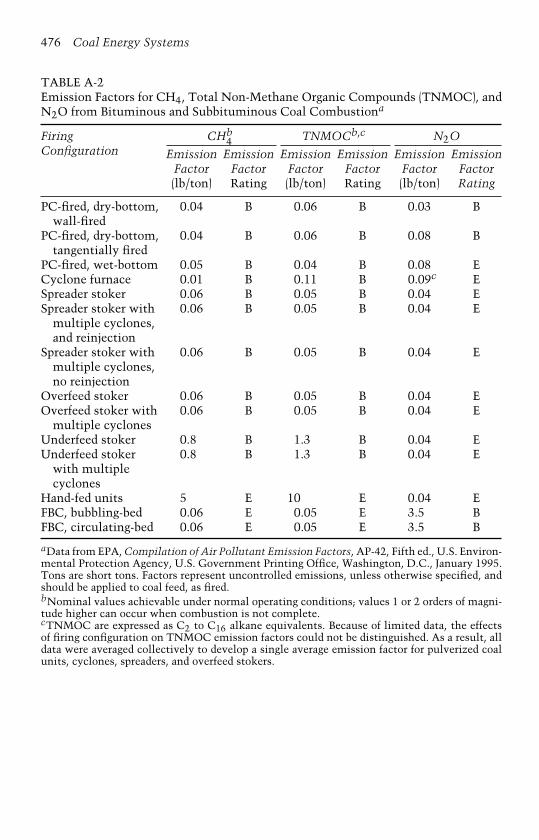
476 Coal Energy Systems
TABLE A-2Emission Factors for CH4, Total Non-Methane Organic Compounds (TNMOC), andN2O from Bituminous and Subbituminous Coal Combustiona
FiringConfiguration
CHb4 TNMOCb,c N2O
Emission Emission Emission Emission Emission EmissionFactor Factor Factor Factor Factor Factor(lb/ton) Rating (lb/ton) Rating (lb/ton) Rating
PC-fired, dry-bottom,wall-fired
0.04 B 0.06 B 0.03 B
PC-fired, dry-bottom,tangentially fired
0.04 B 0.06 B 0.08 B
PC-fired, wet-bottom 0.05 B 0.04 B 0.08 ECyclone furnace 0.01 B 0.11 B 0.09c ESpreader stoker 0.06 B 0.05 B 0.04 ESpreader stoker with
multiple cyclones,and reinjection
0.06 B 0.05 B 0.04 E
Spreader stoker withmultiple cyclones,no reinjection
0.06 B 0.05 B 0.04 E
Overfeed stoker 0.06 B 0.05 B 0.04 EOverfeed stoker with
multiple cyclones0.06 B 0.05 B 0.04 E
Underfeed stoker 0.8 B 1.3 B 0.04 EUnderfeed stoker
with multiplecyclones
0.8 B 1.3 B 0.04 E
Hand-fed units 5 E 10 E 0.04 EFBC, bubbling-bed 0.06 E 0.05 E 3.5 BFBC, circulating-bed 0.06 E 0.05 E 3.5 B
aData from EPA, Compilation of Air Pollutant Emission Factors, AP-42, Fifth ed., U.S. Environ-mental Protection Agency, U.S. Government Printing Office, Washington, D.C., January 1995.Tons are short tons. Factors represent uncontrolled emissions, unless otherwise specified, andshould be applied to coal feed, as fired.bNominal values achievable under normal operating conditions; values 1 or 2 orders of magni-tude higher can occur when combustion is not complete.cTNMOC are expressed as C2 to C16 alkane equivalents. Because of limited data, the effectsof firing configuration on TNMOC emission factors could not be distinguished. As a result, alldata were averaged collectively to develop a single average emission factor for pulverized coalunits, cyclones, spreaders, and overfeed stokers.

Coal-Fired Emission Factors 477
TABLE A-3Uncontrolled Emission Factors for PM and PM10 from Bituminous and Subbitumi-nous Coal Combustiona
FiringConfiguration
Filterable PMb Filterable PM10Emission Emission Emission Emission
Factor Factor Factor Factor(lb/ton) Rating (lb/ton) Rating
PC-fired, dry-bottom, wall-fired 10A A 2.3A EPC-fired, dry-bottom, tangentially
fired10A B 2.3Ac E
PC-fired, wet-bottom 7Ad D 2.6A ECyclone furnace 2Ad E 0.26A ESpreader stoker 66e B 13.2 ESpreader stoker with multiple
cyclones, and reinjection17 B 12.4 E
Spreader stoker with multiplecyclones, no reinjection
12 A 7.8 E
Overfeed stokerf 16g C 6.0 EOverfeed stoker with multiple
cyclonesf9 C 5.0 E
Underfeed stoker 15h D 6.2 EUnderfeed stoker with multiple
cyclones11 D 6.2h E
Hand-fed units 15 E 6.2i EFBC, bubbling-bed — j E — j EFBC, circulating-bed — j E — j E
aData from EPA, Compilation of Air Pollutant Emission Factors, AP-42, Fifth ed., U.S. Environ-mental Protection Agency, U.S. Government Printing Office, Washington, D.C., January 1995.Factors represents uncontrolled emissions, unless otherwise specified, and should be applied tocoal feed, as fired. Tons are short tons.bBased on EPA Method 5 (front half catch). Where particulate is expressed in terms of coal ashcontent, the A factor is determined by multiplying weight percent (wt.%) ash content of coal(as fired) by the numerical value preceding the A. For example, if coal with 8% ash is fired in aPC-fired, dry-bottom unit, the particulate matter emission factor would be 10 × 8, or 80 lb/ton.cNo data found; emission factor for PC-fired, dry-bottom boilers used.dUncontrolled particulate emissions, when no fly ash reinjection is employed. When controldevice is installed, and collected fly ash is reinjected to boiler, particulate from boiler reachingcontrol equipment can increase up to a factor of 2.eAccounts for fly ash settling in an economizer, air heater, or breaching upstream of controldevice or stack. (Particulate directly at boiler outlet typically will be twice this level). Factorshould be applied even when fly ash is reinjected to boiler form air heater or economizer dusthoppers.f Includes traveling-grate, vibrating-grate, and chain-grate stokers.gAccounts for fly ash settling in breaching or stack base. Particulate loadings directly at boileroutlet typically can be 50% higher.hAccounts for fly ash settling in breaching downstream of boiler outlet.iNo data found; emission factor for underfeed stoker was used.jNo data found; emission factor for spreader stoker with multiple cyclones and reinjection wasused.

478C
oalE
nergy
Systems
TABLE A-4Condensable Particulate Matter Emission Factors for Bituminous and Subbituminous Coal Combustiona
Firing
ConfigurationbControlsc CPM-TOTd,e CPM-IORd,e CPM-ORGd,e
Emission Emission Emission Emission Emission EmissionFactor Factor Factor Factor Factor Factor
(lb/MM Btu) Rating (lb/MM Btu) Rating (lb/MM Btu) Rating
All pulverizedcoal-fired boilers
All PM controls(without FGDcontrols)
0.1S–0.03f B 80% of CPM-TOTemission factore
E 20% of CMP-TOTemission factore
E
All pulverizedcoal-fired boilers
All PM controlscombined withFGD controls
0.02 E ND — ND E
Spreader stoker,traveling-grateoverfeed stoker,underfeed stoker
All PM controls oruncontrolled
0.04 C 80% of CPM-TOTemission factore
E 20% CPM-TOTemission factore
E
aData from EPA, Compilation of Air Pollutant Emission Factors, AP-42, Fifth ed., U.S. Environmental Protection Agency, U.S. Government PrintingOffice, Washington, D.C., January 1995. All condensable PM is assumed to be less than 1.0 µm in diameter.bNo data are available for cyclone boilers or for atmospheric fluidized-bed combustion (AFBC) boilers. For cyclone boilers, use the factors providedfor pulverized coal-fired boilers and applicable control devices. For AFBC boilers, use the factors provided for pulverized coal-fired boilers with PMand FGD controls.cPM, particulate matter; FGD, flue gas desulfurization.dCPM-TOT, total condensable particulate matter; CPM-IOR, inorganic condensable particulate matter; CPM-ORG, organic condensable particulatematter; ND, no data.eFactors should be multiplied by fuel rate on a heat input basis (MM Btu), as fired. To convert to lb/ton of bituminous coal, multiply by 26 MMBtu/ton. To convert to lb/ton of subbituminous coal, multiply by 20 MM Btu/ton.f S = coal sulfur percent by weight, as fired. For example, if the sulfur percent is 1.04, then S = 1. 04. If the coal sulfur percent is 0.4 or less, use adefault emission factor of 0.01 lb/MM Btu rather than the emission equation.
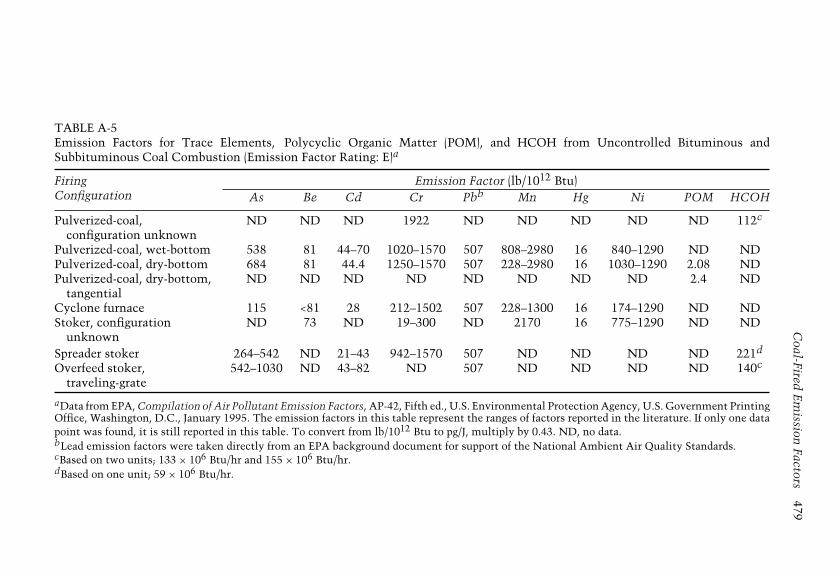
Coal-Fired
Em
issionFactors
479
TABLE A-5Emission Factors for Trace Elements, Polycyclic Organic Matter (POM), and HCOH from Uncontrolled Bituminous andSubbituminous Coal Combustion (Emission Factor Rating: E)a
FiringConfiguration
Emission Factor (lb/1012 Btu)As Be Cd Cr Pbb Mn Hg Ni POM HCOH
Pulverized-coal,configuration unknown
ND ND ND 1922 ND ND ND ND ND 112c
Pulverized-coal, wet-bottom 538 81 44–70 1020–1570 507 808–2980 16 840–1290 ND NDPulverized-coal, dry-bottom 684 81 44.4 1250–1570 507 228–2980 16 1030–1290 2.08 NDPulverized-coal, dry-bottom,
tangentialND ND ND ND ND ND ND ND 2.4 ND
Cyclone furnace 115 <81 28 212–1502 507 228–1300 16 174–1290 ND NDStoker, configuration
unknownND 73 ND 19–300 ND 2170 16 775–1290 ND ND
Spreader stoker 264–542 ND 21–43 942–1570 507 ND ND ND ND 221d
Overfeed stoker,traveling-grate
542–1030 ND 43–82 ND 507 ND ND ND ND 140c
aData from EPA, Compilation of Air Pollutant Emission Factors, AP-42, Fifth ed., U.S. Environmental Protection Agency, U.S. Government PrintingOffice, Washington, D.C., January 1995. The emission factors in this table represent the ranges of factors reported in the literature. If only one datapoint was found, it is still reported in this table. To convert from lb/1012 Btu to pg/J, multiply by 0.43. ND, no data.bLead emission factors were taken directly from an EPA background document for support of the National Ambient Air Quality Standards.cBased on two units; 133 × 106 Btu/hr and 155 × 106 Btu/hr.dBased on one unit; 59 × 106 Btu/hr.
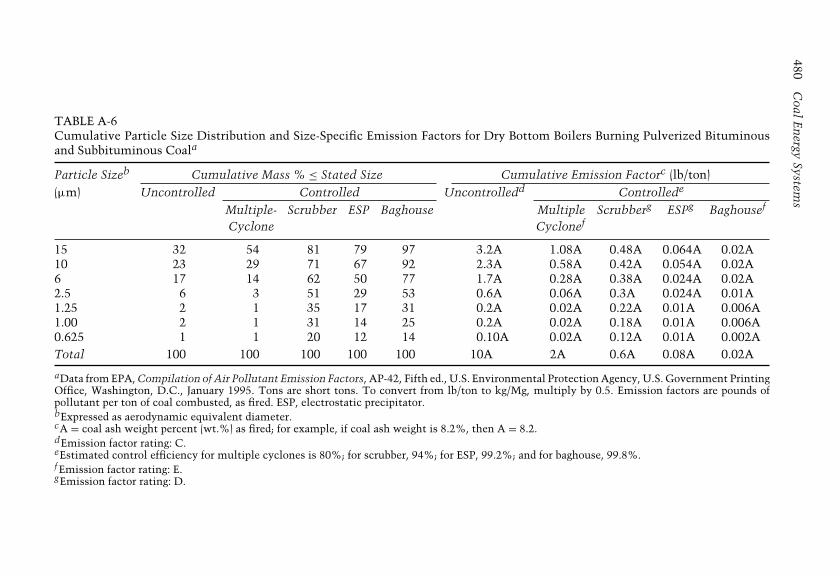
480C
oalE
nergy
Systems
TABLE A-6Cumulative Particle Size Distribution and Size-Specific Emission Factors for Dry Bottom Boilers Burning Pulverized Bituminousand Subbituminous Coala
Particle Sizeb Cumulative Mass % ≤ Stated Size Cumulative Emission Factorc (lb/ton)(µm) Uncontrolled Controlled Uncontrolledd Controllede
Multiple- Scrubber ESP Baghouse Multiple Scrubberg ESPg Baghousef
Cyclone Cyclonef
15 32 54 81 79 97 3.2A 1.08A 0.48A 0.064A 0.02A10 23 29 71 67 92 2.3A 0.58A 0.42A 0.054A 0.02A6 17 14 62 50 77 1.7A 0.28A 0.38A 0.024A 0.02A2.5 6 3 51 29 53 0.6A 0.06A 0.3A 0.024A 0.01A1.25 2 1 35 17 31 0.2A 0.02A 0.22A 0.01A 0.006A1.00 2 1 31 14 25 0.2A 0.02A 0.18A 0.01A 0.006A0.625 1 1 20 12 14 0.10A 0.02A 0.12A 0.01A 0.002ATotal 100 100 100 100 100 10A 2A 0.6A 0.08A 0.02A
aData from EPA, Compilation of Air Pollutant Emission Factors, AP-42, Fifth ed., U.S. Environmental Protection Agency, U.S. Government PrintingOffice, Washington, D.C., January 1995. Tons are short tons. To convert from lb/ton to kg/Mg, multiply by 0.5. Emission factors are pounds ofpollutant per ton of coal combusted, as fired. ESP, electrostatic precipitator.bExpressed as aerodynamic equivalent diameter.cA = coal ash weight percent (wt.%) as fired; for example, if coal ash weight is 8.2%, then A = 8.2.dEmission factor rating: C.eEstimated control efficiency for multiple cyclones is 80%; for scrubber, 94%; for ESP, 99.2%; and for baghouse, 99.8%.f Emission factor rating: E.gEmission factor rating: D.

TABLE A-7Cumulative Particle Size Distribution and Size-Specific Emission Factors for Wet-Bottom Boilers Burning Pulverized Bituminous Coal (Emission Factor Rating: E)a
Particle
Sizeb
(µm)
Cumulative Mass % ≤ Stated Size Cumulative Emission Factorc (lb/ton)Uncontrolled Controlled Uncontrolled Controlledd
Multiple- ESP Multiple- ESPCyclone Cyclone
15 40 99 83 2.8A 1.38A 0.046A10 37 93 75 2.6A 1.3A 0.042A6 33 84 63 2.32A 1.18A 0.036A2.5 21 61 40 1.48A 0.86A 0.022A1.25 6 31 17 0.42A 0.44A 0.01A1.00 4 19 8 0.28A 0.26A 0.004A0.625 2 —e —e 0.14A —e —e
Total 100 100 100 7.0A 1.4A 0.056A
aData from EPA, Compilation of Air Pollutant Emission Factors, AP-42, Fifth ed., U.S. Envi-ronmental Protection Agency, U.S. Government Printing Office, Washington, D.C., January1995. Tons are short tons. To convert from lb/ton to kg/Mg, multiply by 0.5. Emission factorsare pounds of pollutant per ton of coal combusted as fired. ESP, electrostatic precipitator.bExpressed as aerodynamic equivalent diameter.cA = coal ash weight percent (wt.%), as fired; for example, if coal ash weight is 2.4%, thenA = 2.4.dEstimated control efficiency for multiple cyclones is 94%; for ESPs, 99.2%.eInsufficient data.
TABLE A-8Cumulative Size Distribution and Size-Specific Emission Factors for Cyclone Fur-naces Burning Bituminous Coal (Emission Factor Rating: E)a
Particle Cumulative Mass % ≤ Stated Size Cumulative Emission Factorc (lb/ton)Sizeb Uncontrolled Controlled Uncontrolled Controlledd
(µm) Multiple- ESP Multiple- ESPCyclone Cyclone
15 33 95 90 0.66A 0.114A 0.013A10 13 94 68 0.26A 0.112A 0.011A6 8 93 56 0.16A 0.112A 0.009A2.5 5.5 92 36 0.11Ac 0.11A 0.006A1.25 5 85 22 0.10Ae 0.10A 0.04A1.00 5 82 17 0.10Ae 0.10A 0.004A0.625 0 — f — f 0 — f — f
Total 100 100 100 2A 0.12A 0.016A
aData from EPA, Compilation of Air Pollutant Emission Factors, AP-42, Fifth ed., U.S. Envi-ronmental Protection Agency, U.S. Government Printing Office, Washington, D.C., January1995. Tons are short tons. To convert from lb/ton to kg/Mg, multiply by 0.5. Emission factorsare pounds of pollutant per ton of coal combusted as fired. ESP, electrostatic precipitator.bExpressed as aerodynamic equivalent diameter.cA = coal ash weight percent (wt.%), as fired; for example, if coal ash weight is 2.4%,then A = 2.4.dEstimated control efficiency for multiple cyclones is 94%; for ESPs, 99.2%.eThese values are estimates based on data from a controlled source.f Insufficient data.

482 Coal Energy Systems
TABLE A-9Cumulative Particle Size Distribution and Size-Specific Emission Factors for Over-feed Stokers Burning Bituminous Coala
Particle Cumulative Mass % ≤ Stated Size Cumulative Emission Factor(lb/ton)Sizeb Uncontrolled Multiple- Multiple-Cyclone(µm) Cyclone Uncontrolled Controlledc
Controlled Emission Emission Emission EmissionFactor Factor Factor Factor
Rating Rating
15 49 60 7.8 C 5.4 E10 37 55 6.0 C 5.0 E6 24 49 3.8 C 4.4 E2.5 14 43 2.2 C 3.8 E1.25 13 39 2.0 C 3.6 E1.00 12 39 2.0 C 3.6 E0.625 —d 16 —d C 1.4 ETotal 100 100 16.0 C 9.0 E
aData from EPA, Compilation of Air Pollutant Emission Factors, AP-42, Fifth ed., U.S. Envi-ronmental Protection Agency, U.S. Government Printing Office, Washington, D.C., January1995. Tons are short tons. To convert from lb/ton to kg/Mg, multiply by 0.5. Emission factorsare pounds of pollutant per ton of coal combusted as fired. ESP, electrostatic precipitator.bExpressed as aerodynamic equivalent diameter.cEstimated control efficiency for multiple cyclones is 80%.dInsufficient data.
TABLE A-10Cumulative Particle Size Distribution and Size-Specific Emission Factors for Under-feed Stokers Burning Bituminous Coal (Emission Factor Rating: C)a
Particle Sizeb Cumulative Mass % ≤ Uncontrolled Cumulative(µm) Stated Size Emission Factorc (lb/ton)
15 50 7.610 41 6.26 32 4.82.5 25 3.81.25 22 3.41.00 21 3.20.625 18 2.7Total 100 15.0
aData from EPA, Compilation of Air Pollutant Emission Factors, AP-42, Fifth ed., U.S. Envi-ronmental Protection Agency, U.S. Government Printing Office, Washington, D.C., January1995. Tons are short tons. To convert from lb/ton to kg/Mg, multiply by 0.5. Emission factorsare pounds of pollutant per ton of coal combusted, as fired.bExpressed as aerodynamic equivalent diameter.cMay also be used for uncontrolled hand-fired units.

Coal-Fired
Em
issionFactors
483
TABLE A-11Cumulative Particle Size Distribution and Size-Specific Emission Factors for Spreader Stokers Burning Bituminous Coala
Particle Cumulative Mass % ≤ Stated Size Cumulative Emission Factor (lb/ton)Sizeb Controlled Controlled(µm) Uncontrolled Multiple- Multiple- ESP Baghouse Uncontrollede Multiple- Multiple- ESP Baghousee,g
Cyclonec Cycloned Cyclonee,f Cycloned,e
15 28 86 74 97 72 18.5 14.6 8.8 0.46 0.08610 20 73 65 90 60 13.2 12 7.8 0.44 0.0726 14 51 52 82 46 9.2 8.6 6.2 0.40 0.0562.5 7 8 27 61 26 4.6 1.4 3.2 0.30 0.0321.25 5 2 16 46 18 3.3 0.4 2.0 0.22 0.0221.00 5 2 14 41 15 3.3 0.4 1.6 0.20 0.0180.625 4 1 9 Ch 7 2.6 0.2 1.0 Ch 0.006Total 100 100 100 100 100 66.0 17.0 12.0 0.48 0.12
aData from EPA, Compilation of Air Pollutant Emission Factors, AP-42, Fifth ed., U.S. Environmental Protection Agency, U.S. Government PrintingOffice, Washington, D.C., January 1995. Tons are short tons. To convert from lb/ton to kg/Mg, multiply by 0.5. Emissions are pounds of pollutantper ton of coal combusted, as fired. ESP, electrostatic precipitator.bExpressed as aerodynamic equivalent diameter.cWith flyash reinjection.dWithout flyash reinjection.eEmission factor rating: C.f Emission factor rating: E.gEstimated control efficiency for ESP is 99.22%; for baghouse, 99.8%.hInsufficient data.
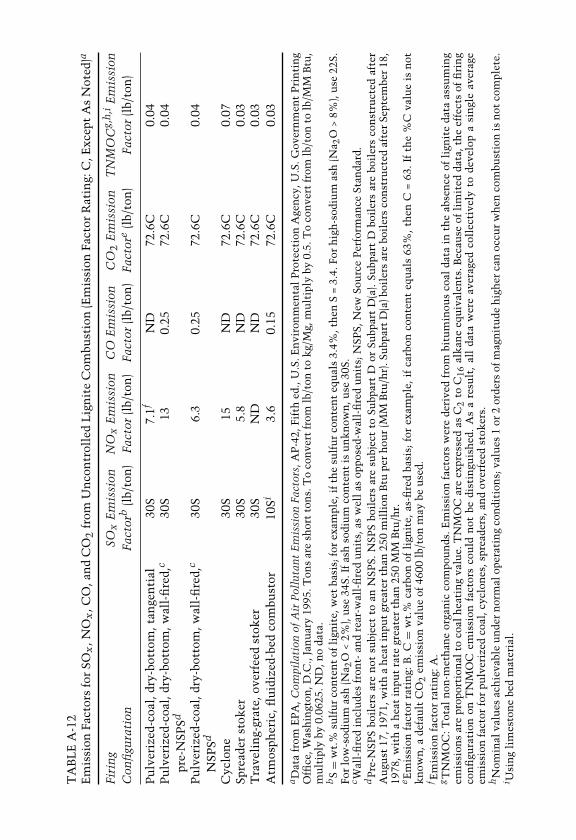
TA
BL
EA
-12
Em
issi
onFa
ctor
sfo
rSO
x, N
Ox
,CO
,an
dC
O2
from
Un
con
trol
led
Lig
nit
eC
ombu
stio
n(E
mis
sion
Fact
orR
atin
g:C
,Exc
ept
As
Not
ed)a
Firi
ng
SOx
Em
issi
onN
Ox
Em
issi
onC
OE
mis
sion
CO
2E
mis
sion
TN
MO
Cg,
h,i
Em
issi
onC
onfi
gura
tion
Fact
orb
(lb/
ton
)Fa
ctor
(lb/
ton
)Fa
ctor
(lb/
ton
)Fa
ctor
e(l
b/to
n)
Fact
or(l
b/to
n)
Pu
lver
ized
-coa
l,dr
y-bo
ttom
,tan
gen
tial
30S
7.1f
ND
72.6
C0.
04P
ulv
eriz
ed-c
oal,
dry-
bott
om,w
all-
fire
d,c
pre-
NSP
Sd30
S13
0.25
72.6
C0.
04
Pu
lver
ized
-coa
l,dr
y-bo
ttom
,wal
l-fi
red,
c
NSP
Sd30
S6.
30.
2572
.6C
0.04
Cyc
lon
e30
S15
ND
72.6
C0.
07Sp
read
erst
oker
30S
5.8
ND
72.6
C0.
03T
rave
lin
g-gr
ate,
over
feed
stok
er30
SN
DN
D72
.6C
0.03
Atm
osph
eric
,flu
idiz
ed-b
edco
mbu
stor
10Si
3.6
0.15
72.6
C0.
03
aD
ata
from
EP
A,C
ompi
lati
onof
Air
Pol
luta
nt
Em
issi
onFa
ctor
s,A
P-4
2,Fi
fth
ed.,
U.S
.En
viro
nm
enta
lP
rote
ctio
nA
gen
cy, U
.S.G
over
nm
ent
Pri
nti
ng
Offi
ce,W
ash
ingt
on,D
.C.,
Jan
uar
y19
95.T
ons
are
shor
tto
ns.
To
con
vert
from
lb/t
onto
kg/
Mg,
mu
ltip
lyby
0.5.
To
con
vert
from
lb/t
onto
lb/M
MB
tu,
mu
ltip
lyby
0.06
25.N
D,n
oda
ta.
bS
=w
t.%
sulf
ur
con
ten
tof
lign
ite,
wet
basi
s;fo
rex
ampl
e,if
the
sulf
ur
con
ten
teq
ual
s3.
4%,t
hen
S=
3.4.
For
hig
h-s
odiu
mas
h(N
a 2O
>8%
),u
se22
S.Fo
rlo
w-s
odiu
mas
h(N
a 2O
<2%
),u
se34
S.If
ash
sodi
um
con
ten
tis
un
kn
own
,use
30S.
c Wal
l-fi
red
incl
ude
sfr
ont-
and
rear
-wal
l-fi
red
un
its,
asw
ell
asop
pose
d-w
all-
fire
du
nit
s;N
SPS,
New
Sou
rce
Per
form
ance
Stan
dard
.d
Pre
-NSP
Sbo
iler
sar
en
otsu
bjec
tto
anN
SPS.
NSP
Sbo
iler
sar
esu
bjec
tto
Subp
art
Dor
Subp
art
D(a
).Su
bpar
tD
boil
ers
are
boil
ers
con
stru
cted
afte
rA
ugu
st17
,197
1,w
ith
ah
eat
inpu
tgr
eate
rth
an25
0m
illi
onB
tupe
rh
our
(MM
Btu
/hr)
.Su
bpar
tD
(a)b
oile
rsar
ebo
iler
sco
nst
ruct
edaf
ter
Sept
embe
r18
,19
78,w
ith
ah
eat
inpu
tra
tegr
eate
rth
an25
0M
MB
tu/h
r.e E
mis
sion
fact
orra
tin
g:B
.C=
wt.
%ca
rbon
ofli
gnit
e,as
-fire
dba
sis;
for
exam
ple,
ifca
rbon
con
ten
teq
ual
s63
%,t
hen
C=
63.I
fth
e%
Cva
lue
isn
otk
now
n,a
defa
ult
CO
2em
issi
onva
lue
of46
00lb
/ton
may
beu
sed.
f Em
issi
onfa
ctor
rati
ng:
A.
gT
NM
OC
:Tot
aln
on-m
eth
ane
orga
nic
com
pou
nds
.Em
issi
onfa
ctor
sw
ere
deri
ved
from
bitu
min
ous
coal
data
inth
eab
sen
ceof
lign
ite
data
assu
min
gem
issi
ons
are
prop
orti
onal
toco
alh
eati
ng
valu
e.T
NM
OC
are
expr
esse
das
C2
toC
16al
kan
eeq
uiv
alen
ts.B
ecau
seof
lim
ited
data
,th
eef
fect
sof
firi
ng
con
figu
rati
onon
TN
MO
Cem
issi
onfa
ctor
sco
uld
not
bedi
stin
guis
hed
.A
sa
resu
lt,
all
data
wer
eav
erag
edco
llec
tive
lyto
deve
lop
asi
ngl
eav
erag
eem
issi
onfa
ctor
for
pulv
eriz
edco
al,c
yclo
nes
,spr
eade
rs,a
nd
over
feed
stok
ers.
hN
omin
alva
lues
ach
ieva
ble
un
der
nor
mal
oper
atin
gco
ndi
tion
s;va
lues
1or
2or
ders
ofm
agn
itu
deh
igh
erca
noc
cur
wh
enco
mbu
stio
nis
not
com
plet
e.i U
sin
gli
mes
ton
ebe
dm
ater
ial.
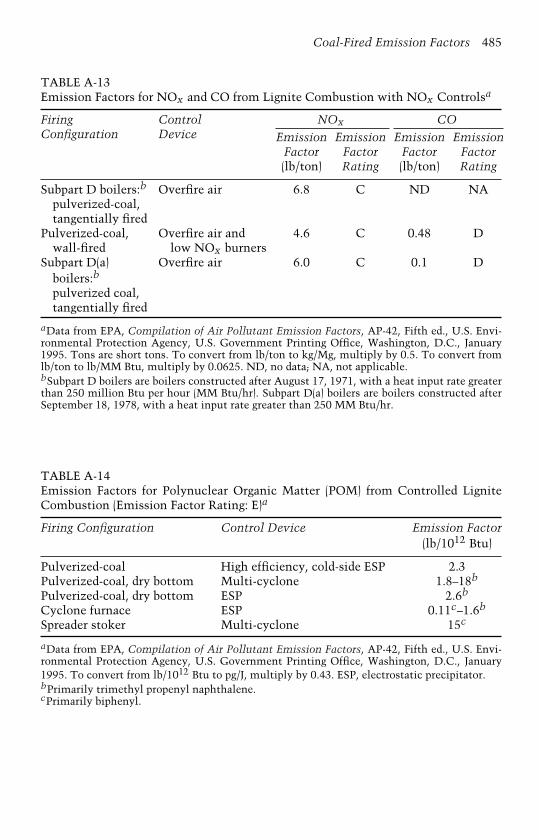
Coal-Fired Emission Factors 485
TABLE A-13Emission Factors for NOx and CO from Lignite Combustion with NOx Controlsa
FiringConfiguration
ControlDevice
NOx COEmission Emission Emission Emission
Factor Factor Factor Factor(lb/ton) Rating (lb/ton) Rating
Subpart D boilers:b
pulverized-coal,tangentially fired
Overfire air 6.8 C ND NA
Pulverized-coal,wall-fired
Overfire air andlow NOx burners
4.6 C 0.48 D
Subpart D(a)boilers:b
pulverized coal,tangentially fired
Overfire air 6.0 C 0.1 D
aData from EPA, Compilation of Air Pollutant Emission Factors, AP-42, Fifth ed., U.S. Envi-ronmental Protection Agency, U.S. Government Printing Office, Washington, D.C., January1995. Tons are short tons. To convert from lb/ton to kg/Mg, multiply by 0.5. To convert fromlb/ton to lb/MM Btu, multiply by 0.0625. ND, no data; NA, not applicable.bSubpart D boilers are boilers constructed after August 17, 1971, with a heat input rate greaterthan 250 million Btu per hour (MM Btu/hr). Subpart D(a) boilers are boilers constructed afterSeptember 18, 1978, with a heat input rate greater than 250 MM Btu/hr.
TABLE A-14Emission Factors for Polynuclear Organic Matter (POM) from Controlled LigniteCombustion (Emission Factor Rating: E)a
Firing Configuration Control Device Emission Factor(lb/1012 Btu)
Pulverized-coal High efficiency, cold-side ESP 2.3Pulverized-coal, dry bottom Multi-cyclone 1.8–18b
Pulverized-coal, dry bottom ESP 2.6b
Cyclone furnace ESP 0.11c–1.6b
Spreader stoker Multi-cyclone 15c
aData from EPA, Compilation of Air Pollutant Emission Factors, AP-42, Fifth ed., U.S. Envi-ronmental Protection Agency, U.S. Government Printing Office, Washington, D.C., January1995. To convert from lb/1012 Btu to pg/J, multiply by 0.43. ESP, electrostatic precipitator.bPrimarily trimethyl propenyl naphthalene.cPrimarily biphenyl.

486 Coal Energy Systems
TABLE A-15Emission Factors for Filterable PM and N2O from Uncontrolled Lignite Combustion(Emission Factor Rating: E, Except As Noted)a
Firing Configuration Filterable PM Emission N2O Emission Factorc
Factorb (lb/ton) (lb/ton)
Pulverized-coal, dry-bottom,tangentially fired
6.5A ND
Pulverized-coal, dry-bottom,wall-fired
5.1A ND
Cyclone 6.7Ac NDSpreader stoker 8.0A NDOther stoker 3.4A NDAtmospheric fluidized-bed
combustorND 2.5
aData from EPA, Compilation of Air Pollutant Emission Factors, AP-42, Fifth ed., U.S. Envi-ronmental Protection Agency, U.S. Government Printing Office, Washington, D.C., January1995. Tons are short tons. To convert from lb/ton to kg/Mg, multiply by 0.5. To convert fromlb/ton to lb/MM Btu, multiply by 0.0625. ND, no data.bA = wt.% ash content of lignite, wet basis; for example, if the ash content is 5%, then A = 5.cEmission factor rating: C.
TABLE A-16Emission Factors for Filterable Particulate Matter (PM) Emissions from ControlledLignite Combustion (Emission Factor Rating: C, Except As Noted)a
Firing Configuration Control Device Filterable PM EmissionFactor (lb/ton)
Subpart D boilersb Baghouse wet scrubber 0.08A0.05ASubpart D(a) boilersb Wet scrubber 0.01AAtmospheric fluidized-bed
combustorcESP 0.07A
aData from EPA, Compilation of Air Pollutant Emission Factors, AP-42, Fifth ed., U.S. Envi-ronmental Protection Agency, U.S. Government Printing Office, Washington, D.C., January1995. Tons are short tons. A = wt.% ash content of lignite, wet basis; for example, if ligniteis 2.3% ash, then A = 2.3. To convert from lb/ton to kg/Mg, multiply by 0.5. To convert fromlb/ton to lb/MM Btu, multiply by 0.0625. ESP, electrostatic precipitator.bSubpart D boilers are boilers constructed before August 17, 1971, with a heat input rate greaterthan 250 million Btu per hour (MM Btu/hr). Subpart D(a) boilers are boilers constructed afterSeptember 18, 1978, with a heat input rate greater than 250 MM Btu/hr.cEmission factor rating: D.

Coal-Fired
Em
issionFactors
487
TABLE A-17Condensable Particulate Matter (PM) Emission Factors for Lignite Combustiona
Firing
ConfigurationbControlsc CPM-TOTd,e CPM-IORd,e CPM-ORGd,e
lb/MM Btu Rating lb/MM Btu Rating lb/MM Btu Rating
All pulverizedcoal-fired boilers
All PM controls(without FGDcontrols)
0.1S–0.03f C 80% of CPM-TOTemission factore
E 20% of CPM-TOTemission factore
E
All pulverizedcoal-fired boilers
All PM controlscombined withFGD control
0.02f E ND — ND —
Traveling-grateoverfeed stoker,spreader stoker
All PM controls oruncontrolled
0.04 D 80% of CPM-TOTemission factor
E 20% of CPM-TOTemission factor
E
aData from EPA, Compilation of Air Pollutant Emission Factors, AP-42, Fifth ed., U.S. Environmental Protection Agency, U.S. Government PrintingOffice, Washington, D.C., January 1995. All condensable PM is assumed to be less than 1.0 µm in diameter.bNo data are available for cyclone boilers; for cyclone boilers, use the factors provided for pulverized-coal-fired boilers and applicable controls.cFGD, flue gas desulfurization.dCPM-TOT, total condensable particulate matter; CPM-IOR, inorganic condensable particulate matter; CPM-ORG, organic condensable particulatematter; ND, no data.eFactors should be multiplied by fuel rate on a heat input basis (MM Btu), as fired. To convert to lb/short ton of lignite, multiply by 16 MM Btu/shortton.f S = wt.% coal sulfur, as fired; for example, if the sulfur percent is 1.04, then S = 1.04. If the coal sulfur percent is 0.4 or less, use a default emissionfactor of 0.01 lb/MM Btu rather than the emission equation.
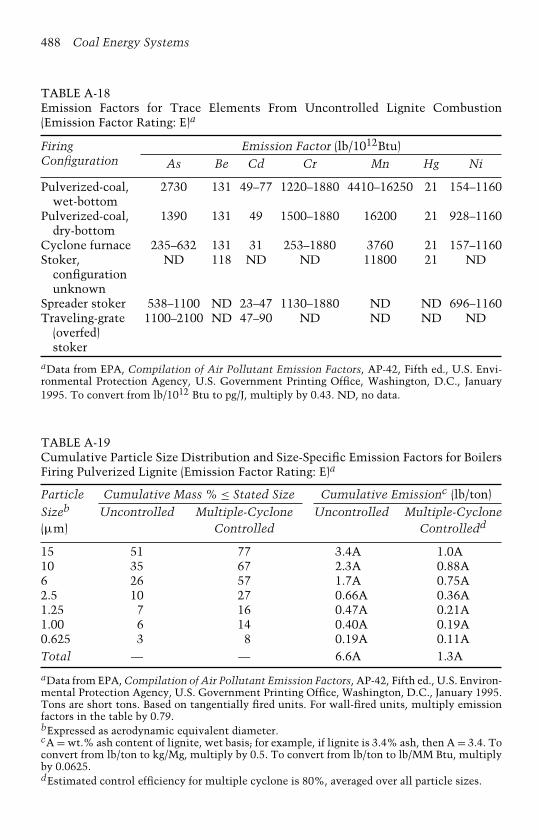
488 Coal Energy Systems
TABLE A-18Emission Factors for Trace Elements From Uncontrolled Lignite Combustion(Emission Factor Rating: E)a
FiringConfiguration
Emission Factor (lb/1012Btu)As Be Cd Cr Mn Hg Ni
Pulverized-coal,wet-bottom
2730 131 49–77 1220–1880 4410–16250 21 154–1160
Pulverized-coal,dry-bottom
1390 131 49 1500–1880 16200 21 928–1160
Cyclone furnace 235–632 131 31 253–1880 3760 21 157–1160Stoker,
configurationunknown
ND 118 ND ND 11800 21 ND
Spreader stoker 538–1100 ND 23–47 1130–1880 ND ND 696–1160Traveling-grate
(overfed)stoker
1100–2100 ND 47–90 ND ND ND ND
aData from EPA, Compilation of Air Pollutant Emission Factors, AP-42, Fifth ed., U.S. Envi-ronmental Protection Agency, U.S. Government Printing Office, Washington, D.C., January1995. To convert from lb/1012 Btu to pg/J, multiply by 0.43. ND, no data.
TABLE A-19Cumulative Particle Size Distribution and Size-Specific Emission Factors for BoilersFiring Pulverized Lignite (Emission Factor Rating: E)a
Particle Cumulative Mass % ≤ Stated Size Cumulative Emissionc (lb/ton)Sizeb Uncontrolled Multiple-Cyclone Uncontrolled Multiple-Cyclone(µm) Controlled Controlledd
15 51 77 3.4A 1.0A10 35 67 2.3A 0.88A6 26 57 1.7A 0.75A2.5 10 27 0.66A 0.36A1.25 7 16 0.47A 0.21A1.00 6 14 0.40A 0.19A0.625 3 8 0.19A 0.11ATotal — — 6.6A 1.3A
aData from EPA, Compilation of Air Pollutant Emission Factors, AP-42, Fifth ed., U.S. Environ-mental Protection Agency, U.S. Government Printing Office, Washington, D.C., January 1995.Tons are short tons. Based on tangentially fired units. For wall-fired units, multiply emissionfactors in the table by 0.79.bExpressed as aerodynamic equivalent diameter.cA = wt.% ash content of lignite, wet basis; for example, if lignite is 3.4% ash, then A = 3.4. Toconvert from lb/ton to kg/Mg, multiply by 0.5. To convert from lb/ton to lb/MM Btu, multiplyby 0.0625.dEstimated control efficiency for multiple cyclone is 80%, averaged over all particle sizes.

Coal-Fired Emission Factors 489
TABLE A-20Cumulative Particle Size Distribution and Size-Specific Emission Factors for Lignite-Fired Spreader Stokers (Emission factor rating: E)a
Particle Cumulative Mass % ≤ Stated Size Cumulative Emissionc (lb/ton)Sizeb Uncontrolled Multiple-Cyclone Uncontrolled Multiple-Cyclone(µm) Controlled Controlledd
15 28 55 2.2A 0.88A10 20 41 1.6A 0.66A6 14 31 1.1A 0.50A2.5 7 26 0.56A 0.42A1.25 5 23 0.40A 0.37A1.00 5 22 0.40A 0.35A0.625 4 —e 0.33A —e
Total 8.0A 1.6A
aData from EPA, Compilation of Air Pollutant Emission Factors, AP-42, Fifth ed., U.S. Envi-ronmental Protection Agency, U.S. Government Printing Office, Washington, D.C., January1995. Tons are short tons.bExpressed as aerodynamic equivalent diameter.cA = wt.% ash content of lignite, wet basis; for example, if lignite is 5% ash, then A = 5. Toconvert from lb/ton to kg/Mg, multiply by 0.5. To convert from lb/ton to lb/MM Btu, multiplyby 0.0625.dEstimated control efficiency for multiple cyclone is 80%.eInsufficient data.
TABLE A-21Default CO2 Emission Factors for U.S. Coals (Emission Factor Rating: C)a
Coal Type Average %Cb Conversion Factorc Emission Factord
(lb/ton coal)
Subbituminous 66.3 72.6 4810High-volatile bituminous 75.9 72.6 5510Medium-volatile bituminous 83.2 72.6 6040Low-volatile bituminous 86.1 72.6 6250
aData from EPA, Compilation of Air Pollutant Emission Factors, AP-42, Fifth ed., U.S.Environmental Protection Agency, U.S. Government Printing Office, Washington, D.C.,January 1995. Tons are short tons. This table should be used only when an ultimate analysisis not available. If the ultimate analysis is available, CO2 emissions should be calculated bymultiplying the percent carbon (%C) by 72.6. This resultant factor would receive a qualityrating of B.bBased on average carbon contents for each coal type (dry basis) based on extensive samplingof U.S. coals.cBased on the following equation:
44 ton CO212 ton C
× 0. 99 × 2000lb CO2
ton CO2× 1
100%= 72. 6
lb CO2ton %C
where 44 = molecular weight of CO2, 12 = molecular weight of carbon, and 0.99 = fraction offuel oxidized during combustion.dTo convert from lb/ton to kg/Mg, multiply by 0.5.
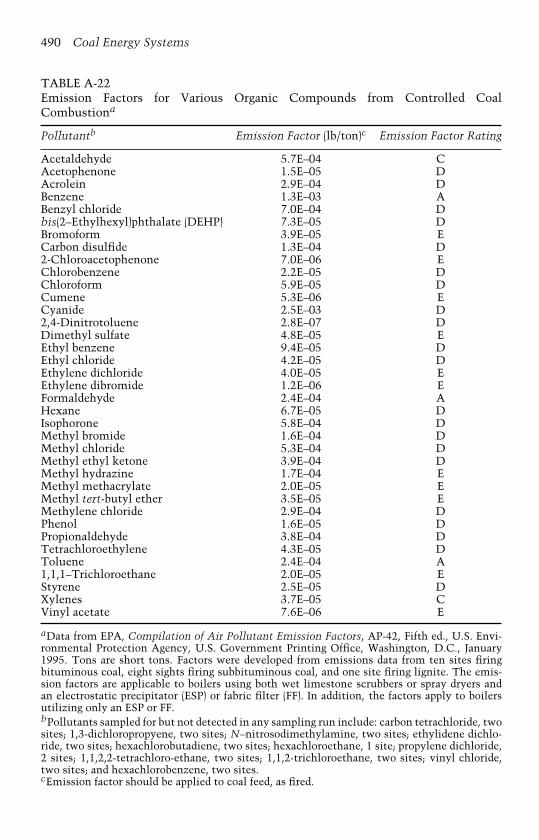
490 Coal Energy Systems
TABLE A-22Emission Factors for Various Organic Compounds from Controlled CoalCombustiona
Pollutantb Emission Factor (lb/ton)c Emission Factor Rating
Acetaldehyde 5.7E–04 CAcetophenone 1.5E–05 DAcrolein 2.9E–04 DBenzene 1.3E–03 ABenzyl chloride 7.0E–04 Dbis(2–Ethylhexyl)phthalate (DEHP) 7.3E–05 DBromoform 3.9E–05 ECarbon disulfide 1.3E–04 D2-Chloroacetophenone 7.0E–06 EChlorobenzene 2.2E–05 DChloroform 5.9E–05 DCumene 5.3E–06 ECyanide 2.5E–03 D2,4-Dinitrotoluene 2.8E–07 DDimethyl sulfate 4.8E–05 EEthyl benzene 9.4E–05 DEthyl chloride 4.2E–05 DEthylene dichloride 4.0E–05 EEthylene dibromide 1.2E–06 EFormaldehyde 2.4E–04 AHexane 6.7E–05 DIsophorone 5.8E–04 DMethyl bromide 1.6E–04 DMethyl chloride 5.3E–04 DMethyl ethyl ketone 3.9E–04 DMethyl hydrazine 1.7E–04 EMethyl methacrylate 2.0E–05 EMethyl tert-butyl ether 3.5E–05 EMethylene chloride 2.9E–04 DPhenol 1.6E–05 DPropionaldehyde 3.8E–04 DTetrachloroethylene 4.3E–05 DToluene 2.4E–04 A1,1,1–Trichloroethane 2.0E–05 EStyrene 2.5E–05 DXylenes 3.7E–05 CVinyl acetate 7.6E–06 E
aData from EPA, Compilation of Air Pollutant Emission Factors, AP-42, Fifth ed., U.S. Envi-ronmental Protection Agency, U.S. Government Printing Office, Washington, D.C., January1995. Tons are short tons. Factors were developed from emissions data from ten sites firingbituminous coal, eight sights firing subbituminous coal, and one site firing lignite. The emis-sion factors are applicable to boilers using both wet limestone scrubbers or spray dryers andan electrostatic precipitator (ESP) or fabric filter (FF). In addition, the factors apply to boilersutilizing only an ESP or FF.bPollutants sampled for but not detected in any sampling run include: carbon tetrachloride, twosites; 1,3-dichloropropyene, two sites; N–nitrosodimethylamine, two sites; ethylidene dichlo-ride, two sites; hexachlorobutadiene, two sites; hexachloroethane, 1 site; propylene dichloride,2 sites; 1,1,2,2-tetrachloro-ethane, two sites; 1,1,2-trichloroethane, two sites; vinyl chloride,two sites; and hexachlorobenzene, two sites.cEmission factor should be applied to coal feed, as fired.

TABLE A-23Emission Factors for Polynuclear Aromatic Hydrocarbons (PAH) from ControlledCoal Combustiona
Pollutant Emission Factorb (lb/ton) Emission Factor Rating
Biphenyl 1.7E-06 DAcenaphthene 5.1E-07 BAcenaphthylene 2.5E-07 BAnthracene 2.1E-07 BBenzo(a)anthracene 8.0E–08 BBenzo(a)pyrene 3.8E–08 DBenzo(b, j, k)fluoranthene 1.1E–07 BBenzo(g, h, i)perylene 2.7E–08 DChrysene 1.0E–07 CFluoranthene 7.1E–07 BFluorene 9.1E–07 BIndeno(1,2,3-c, d)pyrene 6.1E–08 CNaphthalene 1.3E–05 CPhenanthrene 2.7E–06 BPyrene 3.3E–07 B5-Methyl chrysene 2.2E–08 D
aData from EPA, Compilation of Air Pollutant Emission Factors, AP-42, Fifth ed., U.S. Environ-mental Protection Agency, U.S. Government Printing Office, Washington, D.C., January 1995.Tons are short tons. Factors were developed from emissions data from six sites firing bitumi-nous coal, four sights firing subbituminous coal, and one site firing lignite. Factors apply toboilers utilizing both wet limestone scrubbers or spray dryers and an electrostatic precipitator(ESP) or fabric filter (FF). The factors apply to boilers utilizing only an ESP or FF.bEmission factor should be applied to coal feed, as fired. To convert from lb/ton to lb/MM Btu,multiply by 0.0625. To convert from lb/ton to kg/Mg, multiply by 0.5. Emissions are pounds ofpollutant per ton of coal combusted.
TABLE A-24Emission Factors for Hydrogen Chloride (HCl) and Hydrogen Fluoride (HF) from CoalCombustion (Emission Factor Rating: B)a
Firing Configuration HCl Emission Factor HF Emission Factor(lb/ton) (lb/ton)
PC-fired 1.2 0.15PC-fired, tangential 1.2 0.15Cyclone furnace 1.2 0.15Traveling-grate (overfeed stoker) 1.2 0.15Spreader stoker 1.2 0.15Fluidized-bed combustion, 1.2 0.15
circulating-bed
aData from EPA, Compilation of Air Pollutant Emission Factors, AP-42, Fifth ed., U.S. Envi-ronmental Protection Agency, U.S. Government Printing Office, Washington, D.C., January1995. Tons are short tons. The emission factors were developed from bituminous coal, subbi-tuminous coal, and lignite emissions data. To convert from lb/ton to kg/Mg, multiply by 0.5.To convert from lb/ton to lb/MM Btu, multiply by 0.0625. The factors apply to both controlledand uncontrolled sources.
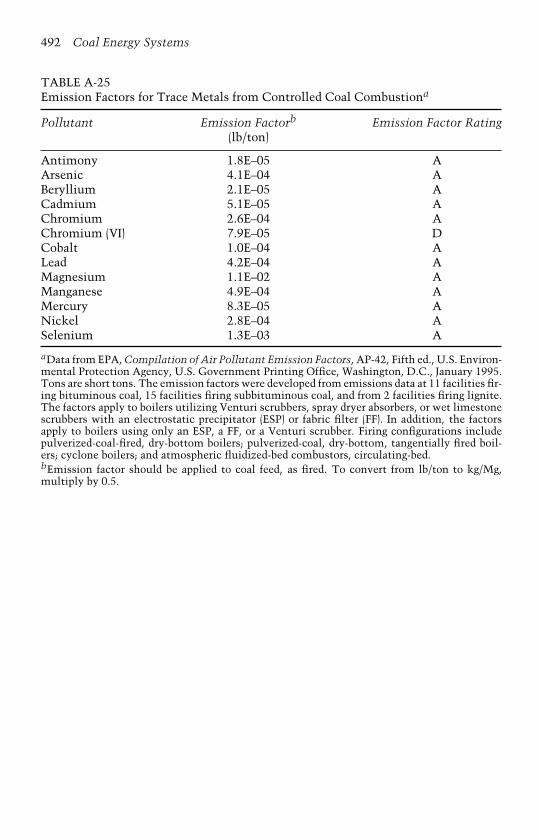
492 Coal Energy Systems
TABLE A-25Emission Factors for Trace Metals from Controlled Coal Combustiona
Pollutant Emission Factorb Emission Factor Rating(lb/ton)
Antimony 1.8E–05 AArsenic 4.1E–04 ABeryllium 2.1E–05 ACadmium 5.1E–05 AChromium 2.6E–04 AChromium (VI) 7.9E–05 DCobalt 1.0E–04 ALead 4.2E–04 AMagnesium 1.1E–02 AManganese 4.9E–04 AMercury 8.3E–05 ANickel 2.8E–04 ASelenium 1.3E–03 A
aData from EPA, Compilation of Air Pollutant Emission Factors, AP-42, Fifth ed., U.S. Environ-mental Protection Agency, U.S. Government Printing Office, Washington, D.C., January 1995.Tons are short tons. The emission factors were developed from emissions data at 11 facilities fir-ing bituminous coal, 15 facilities firing subbituminous coal, and from 2 facilities firing lignite.The factors apply to boilers utilizing Venturi scrubbers, spray dryer absorbers, or wet limestonescrubbers with an electrostatic precipitator (ESP) or fabric filter (FF). In addition, the factorsapply to boilers using only an ESP, a FF, or a Venturi scrubber. Firing configurations includepulverized-coal-fired, dry-bottom boilers; pulverized-coal, dry-bottom, tangentially fired boil-ers; cyclone boilers; and atmospheric fluidized-bed combustors, circulating-bed.bEmission factor should be applied to coal feed, as fired. To convert from lb/ton to kg/Mg,multiply by 0.5.

Coal-Fired Emission Factors 493
TABLE A-26Emission Factor Equations for Trace Elements from CoalCombustiona (Emission Factor Equation Rating: A)b
Pollutant Emission Equation(lb/1012Btu)c
Antimony 0.92 [(C/A)PM]0.63
Arsenic 3.1 [(C/A)PM]0.85
Beryllium 1.2 [(C/A)PM]1.1
Cadmium 3.3 [(C/A)PM]0.5
Chromium 3.7 [(C/A)PM]0.58
Cobalt 1.7 [(C/A)PM]0.69
Lead 3.4 [(C/A)PM]0.80
Manganese 3.8 [(C/A)PM]0.60
Nickel 4.4 [(C/A)PM]0.48
aData from EPA, Compilation of Air Pollutant Emission Factors,AP-42, Fifth ed., U.S. Environmental Protection Agency, U.S.Government Printing Office, Washington, D.C., January 1995.The equations were developed from emissions data from bitu-minous coal combustion, subbituminous coal combustion, andlignite combustion. The equations may be used to generate factorsfor both controlled and uncontrolled boilers. The emission fac-tor equations are applicable to all typical firing configurations forelectric generation (utility), industrial, and commercial/industrialboilers for bituminous coal, subbituminous coal, and lignite.bAP-42 criteria for rating emission factors were used to rate theequations.cThe factors produced by the equations should be applied toheat input. To convert from lb/1012 Btu to kg/J, multiply by4. 31 × 10−16. C = concentration of metal in the coal (parts permillion by weight [ppmwt]). A = weight fraction of ash in thecoal; for example, 10% ash is 0.1 ash fraction. PM = site-specificemission factor for total particulate matter (lb/106 Btu).
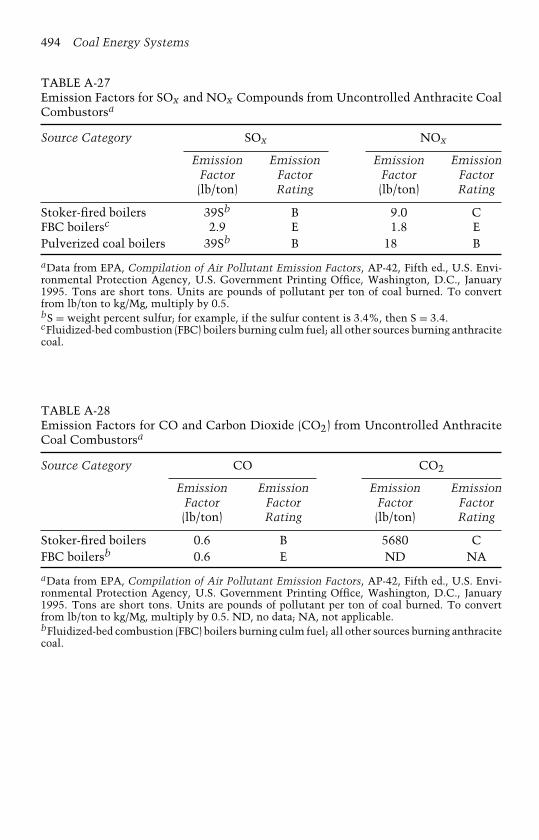
494 Coal Energy Systems
TABLE A-27Emission Factors for SOx and NOx Compounds from Uncontrolled Anthracite CoalCombustorsa
Source Category SOx NOx
Emission Emission Emission EmissionFactor Factor Factor Factor(lb/ton) Rating (lb/ton) Rating
Stoker-fired boilers 39Sb B 9.0 CFBC boilersc 2.9 E 1.8 EPulverized coal boilers 39Sb B 18 B
aData from EPA, Compilation of Air Pollutant Emission Factors, AP-42, Fifth ed., U.S. Envi-ronmental Protection Agency, U.S. Government Printing Office, Washington, D.C., January1995. Tons are short tons. Units are pounds of pollutant per ton of coal burned. To convertfrom lb/ton to kg/Mg, multiply by 0.5.bS = weight percent sulfur; for example, if the sulfur content is 3.4%, then S = 3.4.cFluidized-bed combustion (FBC) boilers burning culm fuel; all other sources burning anthracitecoal.
TABLE A-28Emission Factors for CO and Carbon Dioxide (CO2) from Uncontrolled AnthraciteCoal Combustorsa
Source Category CO CO2
Emission Emission Emission EmissionFactor Factor Factor Factor(lb/ton) Rating (lb/ton) Rating
Stoker-fired boilers 0.6 B 5680 CFBC boilersb 0.6 E ND NA
aData from EPA, Compilation of Air Pollutant Emission Factors, AP-42, Fifth ed., U.S. Envi-ronmental Protection Agency, U.S. Government Printing Office, Washington, D.C., January1995. Tons are short tons. Units are pounds of pollutant per ton of coal burned. To convertfrom lb/ton to kg/Mg, multiply by 0.5. ND, no data; NA, not applicable.bFluidized-bed combustion (FBC) boilers burning culm fuel; all other sources burning anthracitecoal.
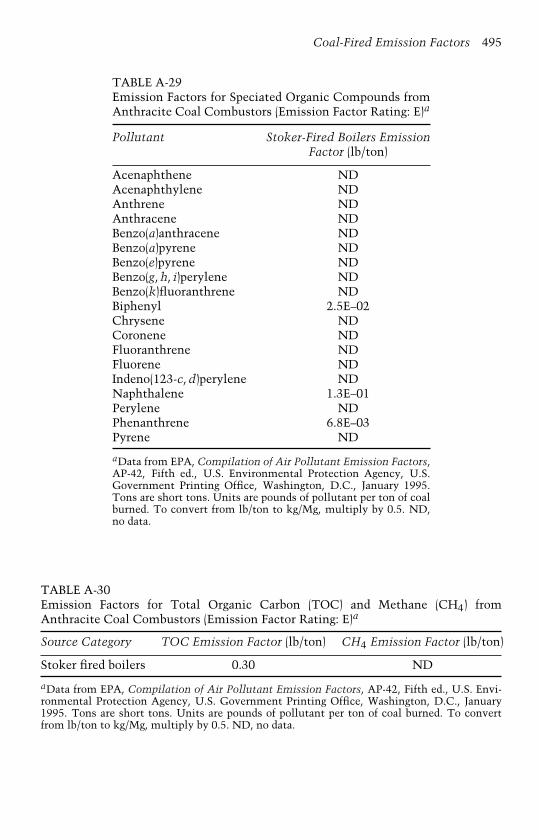
Coal-Fired Emission Factors 495
TABLE A-29Emission Factors for Speciated Organic Compounds fromAnthracite Coal Combustors (Emission Factor Rating: E)a
Pollutant Stoker-Fired Boilers EmissionFactor (lb/ton)
Acenaphthene NDAcenaphthylene NDAnthrene NDAnthracene NDBenzo(a)anthracene NDBenzo(a)pyrene NDBenzo(e)pyrene NDBenzo(g, h, i)perylene NDBenzo(k)fluoranthrene NDBiphenyl 2.5E–02Chrysene NDCoronene NDFluoranthrene NDFluorene NDIndeno(123-c, d)perylene NDNaphthalene 1.3E–01Perylene NDPhenanthrene 6.8E–03Pyrene ND
aData from EPA, Compilation of Air Pollutant Emission Factors,AP-42, Fifth ed., U.S. Environmental Protection Agency, U.S.Government Printing Office, Washington, D.C., January 1995.Tons are short tons. Units are pounds of pollutant per ton of coalburned. To convert from lb/ton to kg/Mg, multiply by 0.5. ND,no data.
TABLE A-30Emission Factors for Total Organic Carbon (TOC) and Methane (CH4) fromAnthracite Coal Combustors (Emission Factor Rating: E)a
Source Category TOC Emission Factor (lb/ton) CH4 Emission Factor (lb/ton)
Stoker fired boilers 0.30 ND
aData from EPA, Compilation of Air Pollutant Emission Factors, AP-42, Fifth ed., U.S. Envi-ronmental Protection Agency, U.S. Government Printing Office, Washington, D.C., January1995. Tons are short tons. Units are pounds of pollutant per ton of coal burned. To convertfrom lb/ton to kg/Mg, multiply by 0.5. ND, no data.

496 Coal Energy Systems
TABLE A-31Emission Factors for Speciated Metals from Anthracite Coal Combustion in Stoker-Fired Boilers (Emission Factor Rating: E)a
Pollutant Emission Factor Range (lb/ton) Average Emission Factor (lb/ton)
Arsenic BDL to 2.4E–04 1.9E–04Antimony BDL BDLBeryllium 3.0E–05 to 5.4E–04 3.1E–04Cadmium 4.5E–05 to 1.1E–04 7.1E–05Chromium 5.9E–03 to 4.9E–02 2.8E–02Manganese 9.8E–04 to 5.3E–03 3.6E–03Mercury 8.7E–05 to 1.7E–04 1.3E–04Nickel 7.8E–03 to 3.5E–02 2.6E–02Selenium 4.7E–04 to 2.1E–03 1.3E–03
aData from EPA, Compilation of Air Pollutant Emission Factors, AP-42, Fifth ed., U.S. Envi-ronmental Protection Agency, U.S. Government Printing Office, Washington, D.C., January1995. Tons are short tons. Units are pounds of pollutant per ton of coal burned. To convertfrom lb/ton to kg/Mg, multiply by 0.5. BDL, below detection limit.
TABLE A-32Emission Factors for Particulate Matter (PM) and Lead (Pb) from UncontrolledAnthracite Coal Combustorsa
SourceCategory
Filterable PM Condensable PM Pb
Emission Emission Emission Emission Emission EmissionFactor Factor Factor Factor Factor Factor(lb/ton) Rating (lb/ton) Rating (lb/ton) Rating
Stoker-fired 0.8Ab C 0.08Ab C 8.9E–03 Eboilers
Hand-fired 10 B ND NA ND NAunits
aData from EPA, Compilation of Air Pollutant Emission Factors, AP-42, Fifth ed., U.S. Envi-ronmental Protection Agency, U.S. Government Printing Office, Washington, D.C., January1995. Tons are short tons. Units are pounds of pollutant per ton of coal burned. To convertfrom lb/ton to kg/Mg, multiply by 0.5. ND, no data; NA, not applicable.bA = ash content of fuel (wt.%); for example, if the ash content is 5%, then A = 5.
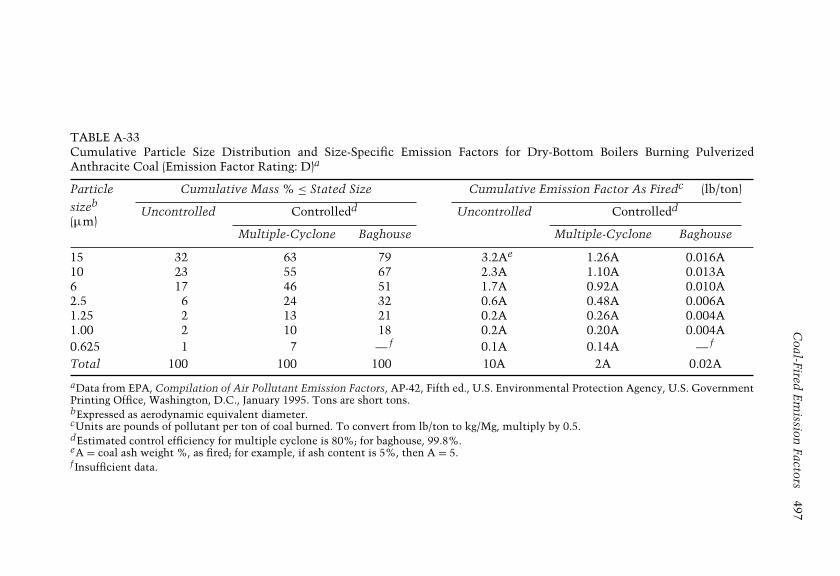
Coal-Fired
Em
issionFactors
497
TABLE A-33Cumulative Particle Size Distribution and Size-Specific Emission Factors for Dry-Bottom Boilers Burning PulverizedAnthracite Coal (Emission Factor Rating: D)a
Particle
sizeb
(µm)
Cumulative Mass % ≤ Stated Size Cumulative Emission Factor As Firedc (lb/ton)
Uncontrolled Controlledd Uncontrolled Controlledd
Multiple-Cyclone Baghouse Multiple-Cyclone Baghouse
15 32 63 79 3.2Ae 1.26A 0.016A10 23 55 67 2.3A 1.10A 0.013A6 17 46 51 1.7A 0.92A 0.010A2.5 6 24 32 0.6A 0.48A 0.006A1.25 2 13 21 0.2A 0.26A 0.004A1.00 2 10 18 0.2A 0.20A 0.004A0.625 1 7 — f 0.1A 0.14A — f
Total 100 100 100 10A 2A 0.02A
aData from EPA, Compilation of Air Pollutant Emission Factors, AP-42, Fifth ed., U.S. Environmental Protection Agency, U.S. GovernmentPrinting Office, Washington, D.C., January 1995. Tons are short tons.bExpressed as aerodynamic equivalent diameter.cUnits are pounds of pollutant per ton of coal burned. To convert from lb/ton to kg/Mg, multiply by 0.5.dEstimated control efficiency for multiple cyclone is 80%; for baghouse, 99.8%.eA = coal ash weight %, as fired; for example, if ash content is 5%, then A = 5.f Insufficient data.

This page intentionally left blank

APPENDIX B
Original List of HazardousAir Pollutants
CAS Number Chemical Name
75070 Acetaldehyde60355 Acetamide75058 Acetonitrile98862 Acetophenone53963 2-Acetylaminofluorene107028 Acrolein79061 Acrylamide79107 Acrylic acid107131 Acrylonitrile107051 Allyl chloride92671 4-Aminobiphenyl62533 Aniline90040 o-Anisidine1332214 Asbestos71432 Benzene (including benzene from gasoline)92875 Benzidine98077 Benzotrichloride100447 Benzyl chloride92524 Biphenyl117817 bis(2-Ethylhexyl)phthalate (DEHP)542881 bis(Chloromethyl)ether75252 Bromoform106990 1,3-Butadiene156627 Calcium cyanamide105602 Caprolactama
133062 Captan63252 Carbaryl75150 Carbon disulfide56235 Carbon tetrachloride463581 Carbonyl sulfide120809 Catechol
(continued)
499

500 Coal Energy Systems
(continued)CAS Number Chemical Name
133904 Chloramben57749 Chlordane7782505 Chlorine79118 Chloroacetic acid532274 2-Chloroacetophenone108907 Chlorobenzene510156 Chlorobenzilate67663 Chloroform107302 Chloromethyl methyl ether126998 Chloropene1319773 Cresols/cresylic acid (isomers and mixture)95487 o-Cresol108394 m-Cresol106445 p-Cresol98828 Cumene94757 2,4-D, salts and esters3547044 DDE334883 Diazomethane132649 Dibenzofurans96128 1,2-Dibromo-3-chloropropane84742 Dibutylphthalate106467 1,4-Dichlorobenzene(p)91941 3,3-Dichlorobenzidene111444 Dichloroethyl ether (bis(2-chloroethyl)ether)542756 1,3-Dichloropropene62737 Dichlorvos111422 Diethanolamine121697 N,N-Diethylaniline (N,N-dimethylaniline)64675 Diethyl sulfate119904 3,3-Dimethoxybenzidine60117 Dimethylaminoazobenzene119937 3,3′-Dimethylbenzidine79447 Dimethyl carbamoyl chloride68122 Dimethylformamide57147 1,1-Dimethyl hydrazine131113 Dimethyl phthalate77781 Dimethyl sulfate534521 4,6-Dinitro-o-cresol and salts51285 2,4-Dinitrophenol121142 2,4-Dinitrotoluene123911 1,4-Dioxane (1,4-diethyleneoxide)122667 1,2-Diphenylhydrazine106898 Epichlorohydrin (l-chloro-2,3-epoxypropane)106887 1,2-Epoxybutane140885 Ethyl acrylate100414 Ethyl benzene
(continued)
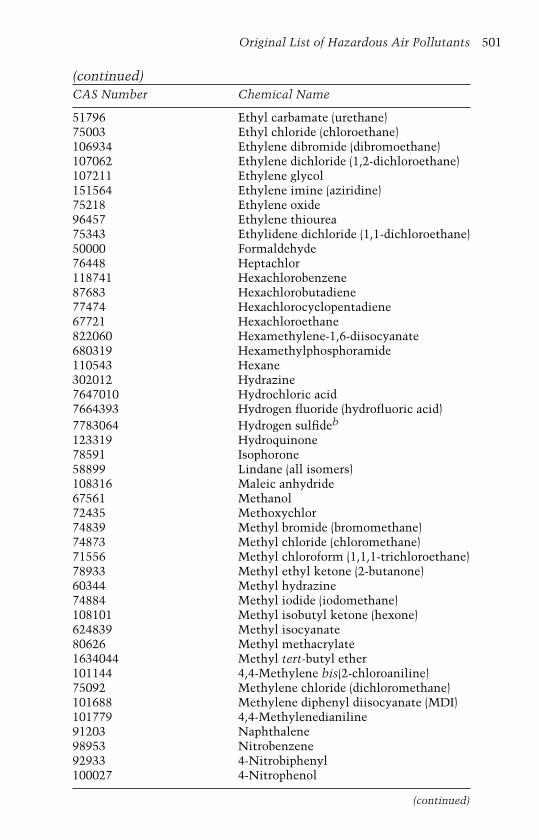
Original List of Hazardous Air Pollutants 501
(continued)CAS Number Chemical Name
51796 Ethyl carbamate (urethane)75003 Ethyl chloride (chloroethane)106934 Ethylene dibromide (dibromoethane)107062 Ethylene dichloride (1,2-dichloroethane)107211 Ethylene glycol151564 Ethylene imine (aziridine)75218 Ethylene oxide96457 Ethylene thiourea75343 Ethylidene dichloride (1,1-dichloroethane)50000 Formaldehyde76448 Heptachlor118741 Hexachlorobenzene87683 Hexachlorobutadiene77474 Hexachlorocyclopentadiene67721 Hexachloroethane822060 Hexamethylene-1,6-diisocyanate680319 Hexamethylphosphoramide110543 Hexane302012 Hydrazine7647010 Hydrochloric acid7664393 Hydrogen fluoride (hydrofluoric acid)7783064 Hydrogen sulfideb
123319 Hydroquinone78591 Isophorone58899 Lindane (all isomers)108316 Maleic anhydride67561 Methanol72435 Methoxychlor74839 Methyl bromide (bromomethane)74873 Methyl chloride (chloromethane)71556 Methyl chloroform (1,1,1-trichloroethane)78933 Methyl ethyl ketone (2-butanone)60344 Methyl hydrazine74884 Methyl iodide (iodomethane)108101 Methyl isobutyl ketone (hexone)624839 Methyl isocyanate80626 Methyl methacrylate1634044 Methyl tert-butyl ether101144 4,4-Methylene bis(2-chloroaniline)75092 Methylene chloride (dichloromethane)101688 Methylene diphenyl diisocyanate (MDI)101779 4,4-Methylenedianiline91203 Naphthalene98953 Nitrobenzene92933 4-Nitrobiphenyl100027 4-Nitrophenol
(continued)

502 Coal Energy Systems
(continued)CAS Number Chemical Name
79469 2-Nitropropane684935 N-Nitroso-N-methylurea62759 N-Nitrosodimethylamine59892 N-Nitrosomorpholine56382 Parathion82688 Pentachloronitrobenzene (quintobenzene)87865 Pentachlorophenol108952 Phenol106503 p-Phenylenediamine75445 Phosgene7803512 Phosphine7723140 Phosphorus85449 Phthalic anhydride1336363 Polychlorinated biphenyls (Aroclor�)1120714 1,3-Propane sultone57578 β-Propiolactone123386 Propionaldehyde114261 Propoxur (Baygon�)78875 Propylene dichloride (1,2-dichloropropane)75569 Propylene oxide75558 1,2-Propylenimine (2-methyl aziridine)91225 Quinoline106514 Quinone100425 Styrene96093 Styrene oxide1746016 2,3,7,8-Tetrachlorodibenzo-p-dioxin79345 1,1,2,2-Tetrachloroethane127184 Tetrachloroethylene (perchloroethylene)7550450 Titanium tetrachloride108883 Toluene95807 2,4-Toluene diamine584849 2,4-Toluene diisocyanate95534 o-Toluidine8001352 Toxaphene (chlorinated camphene)120821 1,2,4-Trichlorobenzene79005 1,1,2-Trichloroethane79016 Trichloroethylene95954 2,4,5-Trichlorophenol88062 2,4,6-Trichlorophenol121448 Triethylamine1582098 Trifluralin540841 2,2,4-Trimethylpentane108054 Vinyl acetate593602 Vinyl bromide75014 Vinyl chloride
(continued)

Original List of Hazardous Air Pollutants 503
(continued)CAS Number Chemical Name
75354 Vinylidene chloride (1,1-dichloroethylene)1330207 Xylenes (isomers and mixture)95476 o-Xylenes108383 m-Xylenes106423 p-Xylenes0 Antimony compounds0 Arsenic compounds (inorganic, including arsine)0 Beryllium compounds0 Cadmium compounds0 Chromium compounds0 Cobalt compounds0 Coke oven emissions0 Cyanide compoundsc
0 Glycol ethersd
0 Lead compounds0 Manganese compounds0 Mercury compounds0 Fine mineral fiberse
0 Nickel compounds0 Polycylic organic matterf
0 Radionuclides (including radon)g
0 Selenium compounds
aCaprolactam was delisted on June 18, 1996.bHydrogen sulfide was inadvertently added to the Section 112(b) list of HAPs through a clericalerror. A joint resolution was passed by Congress and approved by the President on December 4,1991, to remove hydrogen sulfide from Section 112(b). Hydrogen sulfide is included in Section112(r) and is subject to accidental release provisions.cX′CN where X = H′or any other group where a formal dissociation may occur—for example,KCN or Ca(CN)2.dIncludes mono- and diethers of ethylene glycol—diethylene glycol and triethylene glycol R–(OCH2CH2)n–OR′ where n = 1, 2, or 3; R = alkyl or aryl groups; R′ = R, H, or groups that, whenremoved, yield glycol ethers with the structure R–(OCH2CH)n–OH. Polymers are excluded fromthe glycol category.eIncludes mineral fiber emissions from facilities manufacturing or processing glass, rock, orslag fibers (or other mineral-derived fibers) of average diameter 1 µm or less.f Includes organic compounds with more than one benzene ring and which have a boiling pointgreater than or equal to 100◦C.gA type of atom that spontaneously undergoes radioactive decay.Note: For all of the listings that contain the word “compounds” and for glycol ethers, thefollowing applies: Unless otherwise specified, these listings are defined as including any uniquechemical substance that contains the named chemical (i.e., antimony, arsenic, etc.) as part ofthe infrastructure of that chemical.

This page intentionally left blank
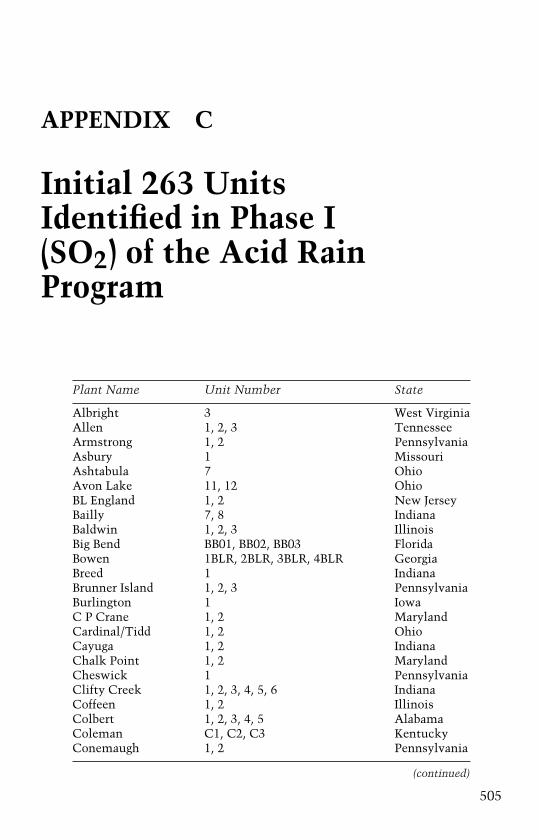
APPENDIX C
Initial 263 UnitsIdentified in Phase I(SO2) of the Acid RainProgram
Plant Name Unit Number State
Albright 3 West VirginiaAllen 1, 2, 3 TennesseeArmstrong 1, 2 PennsylvaniaAsbury 1 MissouriAshtabula 7 OhioAvon Lake 11, 12 OhioBL England 1, 2 New JerseyBailly 7, 8 IndianaBaldwin 1, 2, 3 IllinoisBig Bend BB01, BB02, BB03 FloridaBowen 1BLR, 2BLR, 3BLR, 4BLR GeorgiaBreed 1 IndianaBrunner Island 1, 2, 3 PennsylvaniaBurlington 1 IowaC P Crane 1, 2 MarylandCardinal/Tidd 1, 2 OhioCayuga 1, 2 IndianaChalk Point 1, 2 MarylandCheswick 1 PennsylvaniaClifty Creek 1, 2, 3, 4, 5, 6 IndianaCoffeen 1, 2 IllinoisColbert 1, 2, 3, 4, 5 AlabamaColeman C1, C2, C3 KentuckyConemaugh 1, 2 Pennsylvania
(continued)
505
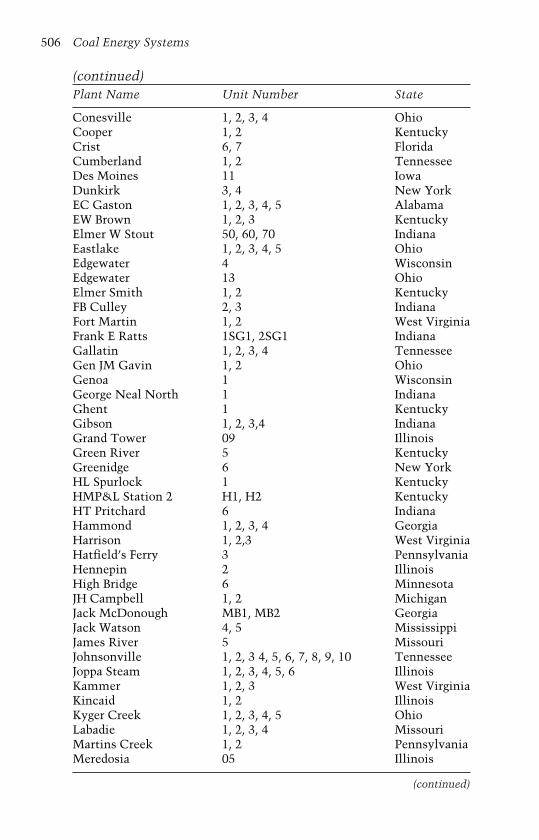
506 Coal Energy Systems
(continued)Plant Name Unit Number State
Conesville 1, 2, 3, 4 OhioCooper 1, 2 KentuckyCrist 6, 7 FloridaCumberland 1, 2 TennesseeDes Moines 11 IowaDunkirk 3, 4 New YorkEC Gaston 1, 2, 3, 4, 5 AlabamaEW Brown 1, 2, 3 KentuckyElmer W Stout 50, 60, 70 IndianaEastlake 1, 2, 3, 4, 5 OhioEdgewater 4 WisconsinEdgewater 13 OhioElmer Smith 1, 2 KentuckyFB Culley 2, 3 IndianaFort Martin 1, 2 West VirginiaFrank E Ratts 1SG1, 2SG1 IndianaGallatin 1, 2, 3, 4 TennesseeGen JM Gavin 1, 2 OhioGenoa 1 WisconsinGeorge Neal North 1 IndianaGhent 1 KentuckyGibson 1, 2, 3,4 IndianaGrand Tower 09 IllinoisGreen River 5 KentuckyGreenidge 6 New YorkHL Spurlock 1 KentuckyHMP&L Station 2 H1, H2 KentuckyHT Pritchard 6 IndianaHammond 1, 2, 3, 4 GeorgiaHarrison 1, 2,3 West VirginiaHatfield’s Ferry 3 PennsylvaniaHennepin 2 IllinoisHigh Bridge 6 MinnesotaJH Campbell 1, 2 MichiganJack McDonough MB1, MB2 GeorgiaJack Watson 4, 5 MississippiJames River 5 MissouriJohnsonville 1, 2, 3 4, 5, 6, 7, 8, 9, 10 TennesseeJoppa Steam 1, 2, 3, 4, 5, 6 IllinoisKammer 1, 2, 3 West VirginiaKincaid 1, 2 IllinoisKyger Creek 1, 2, 3, 4, 5 OhioLabadie 1, 2, 3, 4 MissouriMartins Creek 1, 2 PennsylvaniaMeredosia 05 Illinois
(continued)
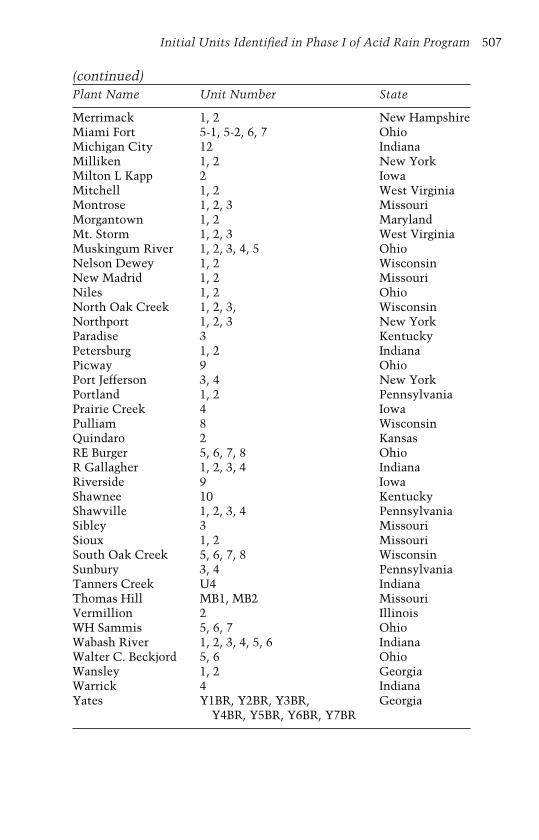
Initial Units Identified in Phase I of Acid Rain Program 507
(continued)Plant Name Unit Number State
Merrimack 1, 2 New HampshireMiami Fort 5-1, 5-2, 6, 7 OhioMichigan City 12 IndianaMilliken 1, 2 New YorkMilton L Kapp 2 IowaMitchell 1, 2 West VirginiaMontrose 1, 2, 3 MissouriMorgantown 1, 2 MarylandMt. Storm 1, 2, 3 West VirginiaMuskingum River 1, 2, 3, 4, 5 OhioNelson Dewey 1, 2 WisconsinNew Madrid 1, 2 MissouriNiles 1, 2 OhioNorth Oak Creek 1, 2, 3, WisconsinNorthport 1, 2, 3 New YorkParadise 3 KentuckyPetersburg 1, 2 IndianaPicway 9 OhioPort Jefferson 3, 4 New YorkPortland 1, 2 PennsylvaniaPrairie Creek 4 IowaPulliam 8 WisconsinQuindaro 2 KansasRE Burger 5, 6, 7, 8 OhioR Gallagher 1, 2, 3, 4 IndianaRiverside 9 IowaShawnee 10 KentuckyShawville 1, 2, 3, 4 PennsylvaniaSibley 3 MissouriSioux 1, 2 MissouriSouth Oak Creek 5, 6, 7, 8 WisconsinSunbury 3, 4 PennsylvaniaTanners Creek U4 IndianaThomas Hill MB1, MB2 MissouriVermillion 2 IllinoisWH Sammis 5, 6, 7 OhioWabash River 1, 2, 3, 4, 5, 6 IndianaWalter C. Beckjord 5, 6 OhioWansley 1, 2 GeorgiaWarrick 4 IndianaYates Y1BR, Y2BR, Y3BR, Georgia
Y4BR, Y5BR, Y6BR, Y7BR

This page intentionally left blank
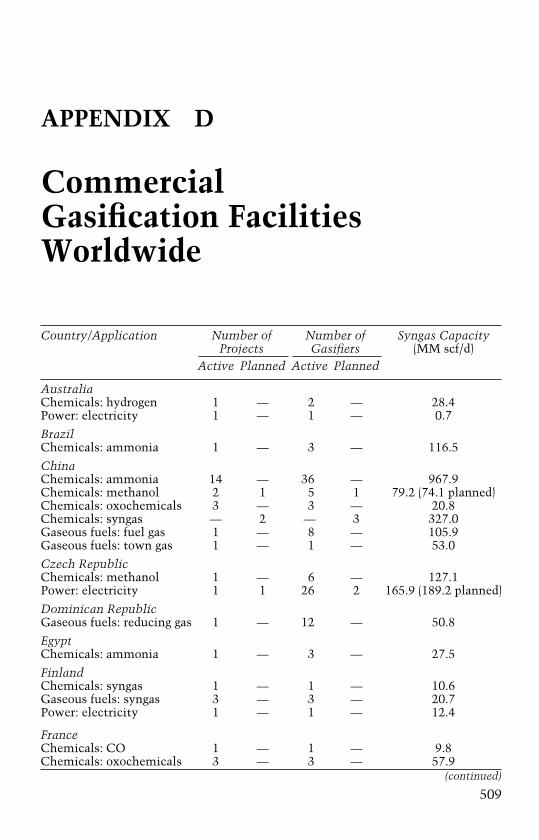
APPENDIX D
CommercialGasification FacilitiesWorldwide
Country/Application Number of Number of Syngas CapacityProjects Gasifiers (MM scf/d)
Active Planned Active Planned
AustraliaChemicals: hydrogen 1 — 2 — 28.4Power: electricity 1 — 1 — 0.7
BrazilChemicals: ammonia 1 — 3 — 116.5
ChinaChemicals: ammonia 14 — 36 — 967.9Chemicals: methanol 2 1 5 1 79.2 (74.1 planned)Chemicals: oxochemicals 3 — 3 — 20.8Chemicals: syngas — 2 — 3 327.0Gaseous fuels: fuel gas 1 — 8 — 105.9Gaseous fuels: town gas 1 — 1 — 53.0
Czech RepublicChemicals: methanol 1 — 6 — 127.1Power: electricity 1 1 26 2 165.9 (189.2 planned)
Dominican RepublicGaseous fuels: reducing gas 1 — 12 — 50.8
EgyptChemicals: ammonia 1 — 3 — 27.5
FinlandChemicals: syngas 1 — 1 — 10.6Gaseous fuels: syngas 3 — 3 — 20.7Power: electricity 1 — 1 — 12.4
FranceChemicals: CO 1 — 1 — 9.8Chemicals: oxochemicals 3 — 3 — 57.9
(continued)
509
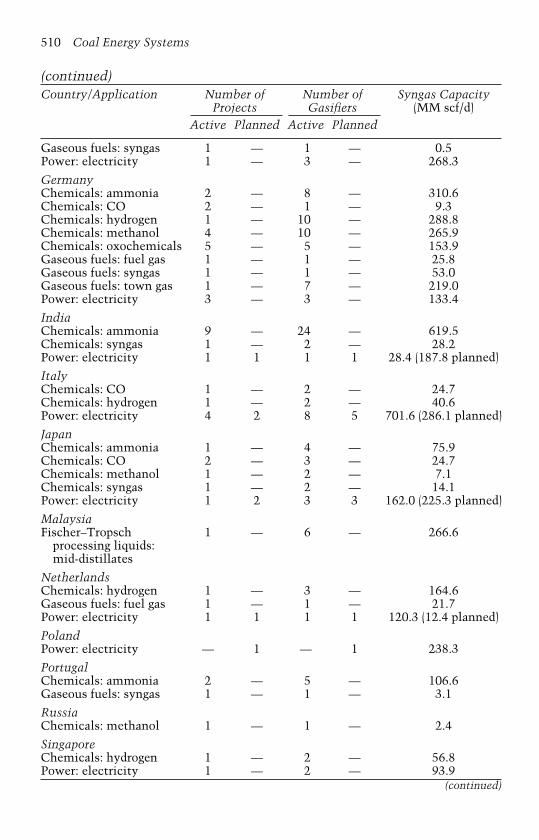
510 Coal Energy Systems
(continued)Country/Application Number of Number of Syngas Capacity
Projects Gasifiers (MM scf/d)Active Planned Active Planned
Gaseous fuels: syngas 1 — 1 — 0.5Power: electricity 1 — 3 — 268.3
GermanyChemicals: ammonia 2 — 8 — 310.6Chemicals: CO 2 — 1 — 9.3Chemicals: hydrogen 1 — 10 — 288.8Chemicals: methanol 4 — 10 — 265.9Chemicals: oxochemicals 5 — 5 — 153.9Gaseous fuels: fuel gas 1 — 1 — 25.8Gaseous fuels: syngas 1 — 1 — 53.0Gaseous fuels: town gas 1 — 7 — 219.0Power: electricity 3 — 3 — 133.4
IndiaChemicals: ammonia 9 — 24 — 619.5Chemicals: syngas 1 — 2 — 28.2Power: electricity 1 1 1 1 28.4 (187.8 planned)
ItalyChemicals: CO 1 — 2 — 24.7Chemicals: hydrogen 1 — 2 — 40.6Power: electricity 4 2 8 5 701.6 (286.1 planned)
JapanChemicals: ammonia 1 — 4 — 75.9Chemicals: CO 2 — 3 — 24.7Chemicals: methanol 1 — 2 — 7.1Chemicals: syngas 1 — 2 — 14.1Power: electricity 1 2 3 3 162.0 (225.3 planned)
MalaysiaFischer–Tropsch 1 — 6 — 266.6
processing liquids:mid-distillates
NetherlandsChemicals: hydrogen 1 — 3 — 164.6Gaseous fuels: fuel gas 1 — 1 — 21.7Power: electricity 1 1 1 1 120.3 (12.4 planned)
PolandPower: electricity — 1 — 1 238.3
PortugalChemicals: ammonia 2 — 5 — 106.6Gaseous fuels: syngas 1 — 1 — 3.1
RussiaChemicals: methanol 1 — 1 — 2.4
SingaporeChemicals: hydrogen 1 — 2 — 56.8Power: electricity 1 — 2 — 93.9
(continued)

Commercial Gasification Facilities Worldwide 511
(continued)Country/Application Number of Number of Syngas Capacity
Projects Gasifiers (MM scf/d)Active Planned Active Planned
South AfricaChemicals: ammonia 1 — 6 — 75.9Fischer–Tropsch 3 — 99 — 2580.4
processing liquids
South KoreaChemicals: ammonia 1 — 1 — 17.7Chemicals: CO 1 — 1 — 21.2Chemicals: oxochemicals 1 — 1 — 13.6
SpainChemicals: ammonia 1 — 1 — 1.5Chemicals: CO 1 — 1 — 5.7Power: electricity 2 — 3 — 578.9
SwedenChemicals: oxochemicals 1 — 1 — 7.1Gaseous fuels: syngas 1 — 1 — 5.6Power: electricity 1 — 1 — 2.8
TaiwanChemicals: hydrogen 1 — 2 — 75.6
UkraineGaseous fuels: syngas — 1 — 1 114.7
United KingdomChemicals: acetyls 1 — 1 — 32.2Chemicals: oxochemicals 1 — 3 — 21.2Gaseous fuels: syngas 1 — 1 — 7.8Power: electricity 2 2 2 2 68.2 (199.2 planned)
United StatesChemicals: acetic 1 — 1 — 56.5
anhydrideChemicals: ammonia 1 — 1 — 75.6Chemicals: hydrogen 4 — 7 — 271.8Chemicals: methanol 1 — 2 — 169.4Chemicals: 7 — 13 — 182.9
oxochemicalsChemicals: syngas — 1 — 2 74.1Gaseous fuels: synthetic 1 — 12 — 490.7
natural gasGaseous fuels: syngas 1 — 2 — 1.6Power: electricity 7 4 10 4 546.6 (890.2 planned)
Unspecified Asiancountry
Chemicals — 1 — 2 258.2
Unspecified Europeancountry
Chemicals: ammonia — 1 — 2 258.2Power: electricity — 1 — 2 258.2
(continued)

512 Coal Energy Systems
(continued)Country/Application Number of Number of Syngas Capacity
Projects Gasifiers (MM scf/d)Active Planned Active Planned
Yugoslavia, FormerChemicals: ammonia 1 — 1 — 4.2Chemicals: methanol 1 — 1 — 54.4
ZambiaChemicals: ammonia 1 — 2 — 31.0Note: Syngas capacity is reported as million standard cubic feet per day.Source: Adapted from Gasification Technologies Council, Gasification: A Growing, World-wide Industry (Gasification Technologies Council, Arlington, VA), www.gasification.org.story(accessed October 2, 2003).
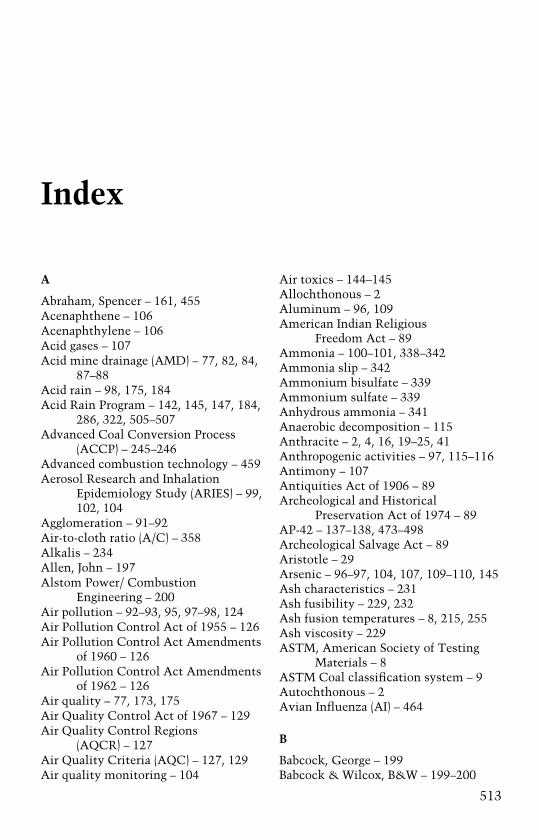
Index
A
Abraham, Spencer – 161, 455Acenaphthene – 106Acenaphthylene – 106Acid gases – 107Acid mine drainage (AMD) – 77, 82, 84,
87–88Acid rain – 98, 175, 184Acid Rain Program – 142, 145, 147, 184,
286, 322, 505–507Advanced Coal Conversion Process
(ACCP) – 245–246Advanced combustion technology – 459Aerosol Research and Inhalation
Epidemiology Study (ARIES) – 99,102, 104
Agglomeration – 91–92Air-to-cloth ratio (A/C) – 358Alkalis – 234Allen, John – 197Alstom Power/ Combustion
Engineering – 200Air pollution – 92–93, 95, 97–98, 124Air Pollution Control Act of 1955 – 126Air Pollution Control Act Amendments
of 1960 – 126Air Pollution Control Act Amendments
of 1962 – 126Air quality – 77, 173, 175Air Quality Control Act of 1967 – 129Air Quality Control Regions
(AQCR) – 127Air Quality Criteria (AQC) – 127, 129Air quality monitoring – 104
Air toxics – 144–145Allochthonous – 2Aluminum – 96, 109American Indian Religious
Freedom Act – 89Ammonia – 100–101, 338–342Ammonia slip – 342Ammonium bisulfate – 339Ammonium sulfate – 339Anhydrous ammonia – 341Anaerobic decomposition – 115Anthracite – 2, 4, 16, 19–25, 41Anthropogenic activities – 97, 115–116Antimony – 107Antiquities Act of 1906 – 89Archeological and Historical
Preservation Act of 1974 – 89AP-42 – 137–138, 473–498Archeological Salvage Act – 89Aristotle – 29Arsenic – 96–97, 104, 107, 109–110, 145Ash characteristics – 231Ash fusibility – 229, 232Ash fusion temperatures – 8, 215, 255Ash viscosity – 229ASTM, American Society of Testing
Materials – 8ASTM Coal classification system – 9Autochthonous – 2Avian Influenza (AI) – 464
B
Babcock, George – 199Babcock & Wilcox, B&W – 199–200
513

514 Index
Bakeries – 32Bald Eagle Protection Act of 1969 – 89Barium – 96, 107Beehive ovens – 239–240Bergius, Friedrich – 269, 273Berthelot – 269Benz[a]anthracene – 106Benzo[b]fluoranthene – 106Benzo[ghi]perylene – 106Benzo[a]pyrene – 106Beryllium – 96, 107, 110Best available control technology
(BACT) – 138, 140–141Bituminous coal – 2, 4, 9, 16, 19–26, 41,
47–48Bhopal, India – 145Blacksmiths – 31Blackwater – 93Blakely, William – 198Blast furnace – 32, 34, 237, 239Blue corona effect – 349Boiler design – 229Boiler types:
Bubbling-bed – 221–222Cell-burner – 148Chain grate – 217Circulating fluidized-bed – 221–222Cyclone – 103, 105, 148, 199, 200,
203, 365Firetube – 198Fluidized bed – 201, 203, 219, 319,
343, 365, 464Industrial – 201, 203–204, 225Mass burning – 217Overfeed – 213, 217Packaged – 203Pulverized coal – 103, 105, 148,
199–200, 203, 225, 322Spreader – 213, 217Stokers – 103, 105, 199, 200, 203, 214,
344, 365Subcritical – 201Supercritical – 201Tangentially-fired – 226Traveling – 217–218Ultra-supercritical – 201Underfeed – 213–214Utility – 201, 203–204Wall-fired – 148
Water-cooled, traveling grate – 217Watertube – 198
Boron – 107, 110Bovine Spongiform Encephalopathy
(BSE) – 462Bottom ash – 95–96, 107–108Boudard reaction – 248Boulton, Matthew – 32, 197Breweries – 32Bronze Age – 30Brown coal – 21–22, 24Buffalo Creek, West Virginia – 94Bunson, R.W. – 33Bush, George W. President – 72, 74, 141,
159, 393, 424, 435, 448By-product recovery oven – 240
C
Cadmium – 96, 107, 109–110, 170Calcium – 96, 109Calcium hydroxide – 296Calcium sulfate – 299, 303, 311Calcium sulfate dihydrate – 296, 298Calcium sulfite – 95, 299, 303Calcium sulfite hemihydrate – 296, 298Carbon dioxide – 81–82, 97, 103,
114–117, 394Carbon dioxide (CO2) capture – 337Carbon dioxide capture/control
technologies:Advanced conversion processes – 378Amine absorption – 377CO2 adsorption – 377Fluor Daniel Econamine FG CO2
Recovery process – 377Fuel switching – 376Oxygen-fired combustion – 378Post-combustion capture – 378Pre-combustion de-carbonization –
378Carbon dioxide sequestration:
Geologic – 379–380Oceans – 379, 381Terrestrial – 379, 381
Carbonic acid – 98Carboniferous Period – 2, 19, 21–25Carbonization – 4, 33, 237–238, 241,
248

Index 515
Carbonization, types:High-temperature – 237–238, 244Low-temperature - 237, 243–244
Carbon Sequestration LeadershipForum – 161
Carbon Sequestration Program –376–377, 379
Carbon tetrachloride – 115Cardiovascular disease – 99, 110Carnegie Steel Company – 239Carter, J.E. Jr., President – 73, 456Cap-and-trade programs – 145, 158Catalysts – 341Central Electricity Generating
Board – 21940 CFR Part 60, Subpart D – 13240 CFR Part 60, Subpart Da – 13240 CFR Part 60, Subpart Db – 13440 CFR Part 60, Subpart Dc – 134–135Charcoal – 30–32Chemical treatment system – 84Cheney, R., Vice President – 73Child labor – 78Chlorine – 107, 115Chlorofluorocarbons – 115Chromium – 96, 107, 109, 170Chronic lung disease – 99Chronic Wasting Disease (CWD) –
462–463Chrysene – 106City gas – 247Clayton, John – 247Clean Air Act – 89Clean Air Act of 1963 – 126–127Clean Air Act Amendments of 1970 –
124–125, 128, 130Clean Air Act Amendments of 1977 –
139–141, 144Clean Air Act Amendments of 1990 –
106–107, 126, 134, 137, 139,142–143, 149
Clean Air Planning Act – 155Clean coal – 450Clean Coal Power Initiative (CCPI) –
422, 424–425, 431, 450Clean Coal Power Initiative Projects:
Advanced coal beneficiationprocessing – 427
Clean coal power – 430
Co-production – 431Fuel processing – 427Multipollutant control - 427On-line optimization systems – 427TOXECON – 427
Clean Coal Technology DemonstrationProgram (CCT) – 74, 245, 382,394–397, 418
Clean Coal Technology DemonstrationProgram Projects:
ACFB technology – 407Advanced coal conversion process
(ACCP) – 416Advanced combustion/heat engine
technology – 414Advanced electric power
generation – 406Alstom Power LNCFSTM – 404B&W coal reburning – 403B&W LNCB� – 403Blast Furnace Granular-Coal Injection
System Demonstration – 418Chiyoda Thoroughbred-121 AFGD
process – 402Clean coal combustion system – 414Coal-fired diesel engine – 415Coal processing - 415Coal Quality ExpertTM – 416Combined SO2/NOx Control
Technologies – 404Confined-zone dispersion (CZD)
FGD – 402EERC GR/LNB – 403FLS milfo, Inc.’s Gas Suspension
Absorption system – 401Fluidized-bed combustion – 406, 421Foster Wheeler’s LNB and
OFA/EPRI’s GNOCIS) – 403Fuel cell – 408IGCC – 408, 410–411, 414Industrial applications – 418LFC� Process – 415LIFAC sorbent injection process – 402LIMB – 405LMPEOHTM – 416Micronized coal reburning – 403Molten carbonate fuel cell – 408Multipollutant control – 405–406NGR/FSI – 405

516 Index
Clean Coal Technology DemonstrationProgram Projects: (continued)
NOx emissions control – 401–402Passamaquoddy Technology Recovery
ScrubberTM – 418PFBC technology – 407PCFB technology – 406Pure Air’s AFGD process – 402SCR catalysts – 404SNOXTM – 404SNRBTM – 405SO2 emissions control – 401Solid oxide fuel cell – 408
Clean Power Act – 115Clean Water Act – 89Clear Skies Act of 2002 – 155, 158, 161,
383, 424, 427Climatic changes – 115Coal – 21–22, 35, 54, 57, 63, 66, 68, 451Coal analyses:
Calorific determination – 5Heating value – 5–6, 8Proximate – 5Ultimate – 5
Coal analysis bases:As received – 5Dry – 5Dry, ash-free – 5Dry, mineral-matter free – 4–6Moist, ash-free – 6Moist, mineral matter-free - 6
Coal Basins:Appalachian – 19, 292Bowen – 24Central German – 25Dneiper – 22Dontesk – 21–22Ekibastuz – 22Gippsland – 24Great Karoo – 25Illinois – 19Jharia – 23Kansk-Achinsk – 21–22Karaganda – 22Kuznetsk – 21–22Lower Silesian – 22Lublin – 22Lusatian – 25Pechora – 21
Powder River – 20Raniganj – 23Rhineland – 25Ruhr – 25Saar – 25Sidney – 24Upper Silesian – 22
Coal beneficiation – 77Coal cleaning – 91, 287, 295Coal coking – 8Coal combustion – 8Coal combustion by-products
(CCB) – 77, 95–96Coal combustion products
(CCP) – 95Coal consumption – 8, 48–50, 60,
63–69, 71Coal deposits – 1, 12, 41Coal grade – 2, 8, 10Coal exports – 50, 65, 67–68, 72Coal gas – 32, 34, 247Coal imports – 50Coal maturation – 6Coal mineralogy – 8Coal mining – 78–80, 84, 89, 94, 115Coal Power Program – 394, 437, 467Coal preparation – 8, 90–91, 94Coal production – 34, 41, 43–44, 46–47,
65–66, 68, 72, 86Coal properties (gasification):
ash – 254fixed carbon – 254moisture – 253reactivity – 255volatile matter – 254
Coal Provinces:Alaskan – 19–20Anhui – 23Eastern - 17, 19Guizhou – 23Gulf – 17, 20Henan – 23Heilongjiang – 23Inner Mongolia – 23Interior – 17, 19Jiangxi – 23Northern Great Plains – 19–21Pacific Coast – 19–20Rocky Mountain – 19–20

Index 517
Shaanxi - 23Shandong – 23Shanxi – 23
Coal quality – 91Coal rank – 2, 6, 12, 19, 21, 80Coal refuse – 93–94Coal regions:
Appalachian – 19, 41, 292Central (Appalachian Basin) – 19Eastern (Interior Province) – 19Fort Union (Northern Great Plains
Province) – 20Interior – 46Mississippi (Gulf Province) – 20Southern (Appalachian Basin) – 19Texas (Gulf Province) – 20Western – 47Western (Interior Province) – 19
Coal reserves – 1, 12–14, 17, 20–26Coal resources – 12–13Coal seam – 1, 3, 41, 80Coal slurry – 95Coal transportation – 95Coal type – 1Coalbed methane (CBM) – 81Coalbeds – 41Coalfields:
Appalachian – 82Green River – 20Hanna – 20Hanna Fork – 20Neyveli – 23
Coalification – 2–4, 8Coal mine methane (CMM) – 81–82Cobalt – 96, 107, 109Codification – 8, 10Coke – 8, 22–25, 32–33, 64, 72,
254, 306Coke production – 34, 241Combustion – 33, 91, 97, 195,
208–209, 211Committee on Coal Waste
Impoundments – 94Conditioning agents – 354Confined Zone Dispersion
(CZD) – 315Continuous emissions monitors
(CEMs) – 146Concentrating tables – 92
Conservation – 447Consumer Price Index (CPI) – 451Copper – 96, 109–110, 170Copper casting – 30Corrosion – 98Cretaceous Period – 21, 26Criteria air pollutants – 106, 109, 128,
152, 173, 175Critical viscosity – 233Crude oil – 35, 39, 54Crude oil imports – 35Culm bank recovery – 86Cunningham correction factor – 350Cyclones – 92
D
Darby, Abraham – 32, 238Darcy’s equation – 359DB Riley Inc./ Riley Stoker Inc. – 200Degasification systems – 81Dense medium separation – 91Deutsch-Anderson equation – 351Diagentic – 2, 8Dibasic acid – 302Dibenz[ah]anthracene – 106Dinitrogen pentoxide – 100Direct impaction – 356Direct interception – 357Directive on Controlling Emissions
from Large Combustion Plants –166
Directive on Integrated PollutionPrevention and Control – 164
Directive on National EmissionCeilings for Certain AtmosphericPollutants – 168
Directive on the Limitation ofEmissions of Certain Pollutantsinto the Air from LargeCombustion Plants -166
Direct liquefaction – 267, 273Dolomite – 221, 319Donora, Pennsylvania – 124Dredging – 86Drift velocity – 349, 351Dust – 78–79, 85, 88, 91Dust cake – 357Dust loading – 357
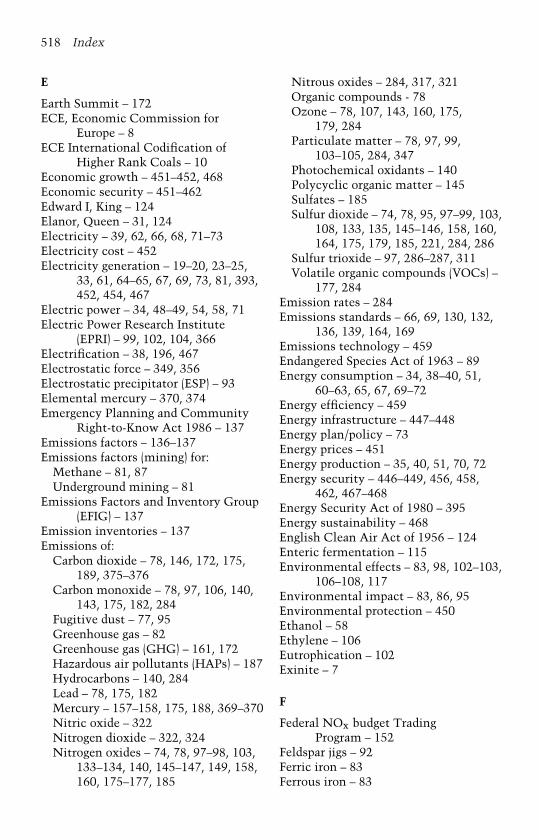
518 Index
E
Earth Summit – 172ECE, Economic Commission for
Europe – 8ECE International Codification of
Higher Rank Coals – 10Economic growth – 451–452, 468Economic security – 451–462Edward I, King – 124Elanor, Queen – 31, 124Electricity – 39, 62, 66, 68, 71–73Electricity cost – 452Electricity generation – 19–20, 23–25,
33, 61, 64–65, 67, 69, 73, 81, 393,452, 454, 467
Electric power – 34, 48–49, 54, 58, 71Electric Power Research Institute
(EPRI) – 99, 102, 104, 366Electrification – 38, 196, 467Electrostatic force – 349, 356Electrostatic precipitator (ESP) – 93Elemental mercury – 370, 374Emergency Planning and Community
Right-to-Know Act 1986 – 137Emissions factors – 136–137Emissions factors (mining) for:
Methane – 81, 87Underground mining – 81
Emissions Factors and Inventory Group(EFIG) – 137
Emission inventories – 137Emissions of:
Carbon dioxide – 78, 146, 172, 175,189, 375–376
Carbon monoxide – 78, 97, 106, 140,143, 175, 182, 284
Fugitive dust – 77, 95Greenhouse gas – 82Greenhouse gas (GHG) – 161, 172Hazardous air pollutants (HAPs) – 187Hydrocarbons – 140, 284Lead – 78, 175, 182Mercury – 157–158, 175, 188, 369–370Nitric oxide – 322Nitrogen dioxide – 322, 324Nitrogen oxides – 74, 78, 97–98, 103,
133–134, 140, 145–147, 149, 158,160, 175–177, 185
Nitrous oxides – 284, 317, 321Organic compounds - 78Ozone – 78, 107, 143, 160, 175,
179, 284Particulate matter – 78, 97, 99,
103–105, 284, 347Photochemical oxidants – 140Polycyclic organic matter – 145Sulfates – 185Sulfur dioxide – 74, 78, 95, 97–99, 103,
108, 133, 135, 145–146, 158, 160,164, 175, 179, 185, 221, 284, 286
Sulfur trioxide – 97, 286–287, 311Volatile organic compounds (VOCs) –
177, 284Emission rates – 284Emissions standards – 66, 69, 130, 132,
136, 139, 164, 169Emissions technology – 459Endangered Species Act of 1963 – 89Energy consumption – 34, 38–40, 51,
60–63, 65, 67, 69–72Energy efficiency – 459Energy infrastructure – 447–448Energy plan/policy – 73Energy prices – 451Energy production – 35, 40, 51, 70, 72Energy security – 446–449, 456, 458,
462, 467–468Energy Security Act of 1980 – 395Energy sustainability – 468English Clean Air Act of 1956 – 124Enteric fermentation – 115Environmental effects – 83, 98, 102–103,
106–108, 117Environmental impact – 83, 86, 95Environmental protection – 450Ethanol – 58Ethylene – 106Eutrophication – 102Exinite – 7
F
Federal NOx budget TradingProgram – 152
Feldspar jigs – 92Ferric iron – 83Ferrous iron – 83
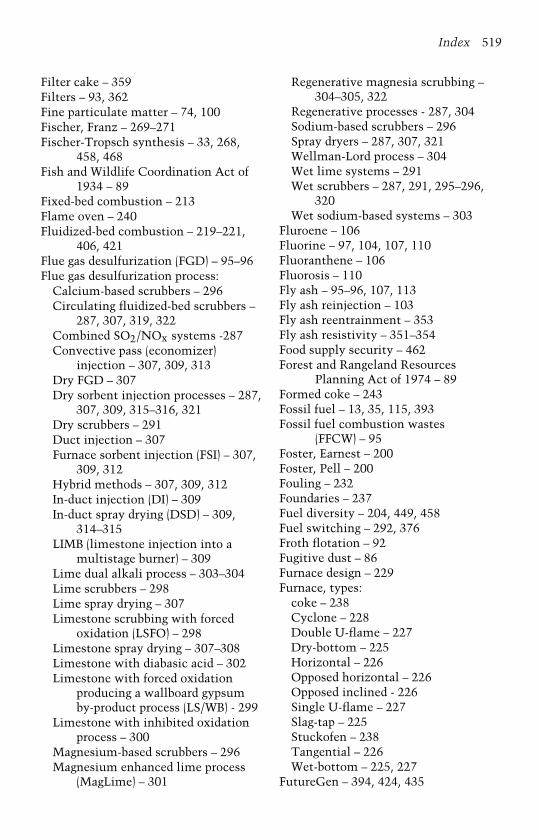
Index 519
Filter cake – 359Filters – 93, 362Fine particulate matter – 74, 100Fischer, Franz – 269–271Fischer-Tropsch synthesis – 33, 268,
458, 468Fish and Wildlife Coordination Act of
1934 – 89Fixed-bed combustion – 213Flame oven – 240Fluidized-bed combustion – 219–221,
406, 421Flue gas desulfurization (FGD) – 95–96Flue gas desulfurization process:
Calcium-based scrubbers – 296Circulating fluidized-bed scrubbers –
287, 307, 319, 322Combined SO2/NOx systems -287Convective pass (economizer)
injection – 307, 309, 313Dry FGD – 307Dry sorbent injection processes – 287,
307, 309, 315–316, 321Dry scrubbers – 291Duct injection – 307Furnace sorbent injection (FSI) – 307,
309, 312Hybrid methods – 307, 309, 312In-duct injection (DI) – 309In-duct spray drying (DSD) – 309,
314–315LIMB (limestone injection into a
multistage burner) – 309Lime dual alkali process – 303–304Lime scrubbers – 298Lime spray drying – 307Limestone scrubbing with forced
oxidation (LSFO) – 298Limestone spray drying – 307–308Limestone with diabasic acid – 302Limestone with forced oxidation
producing a wallboard gypsumby-product process (LS/WB) - 299
Limestone with inhibited oxidationprocess – 300
Magnesium-based scrubbers – 296Magnesium enhanced lime process
(MagLime) – 301
Regenerative magnesia scrubbing –304–305, 322
Regenerative processes - 287, 304Sodium-based scrubbers – 296Spray dryers – 287, 307, 321Wellman-Lord process – 304Wet lime systems – 291Wet scrubbers – 287, 291, 295–296,
320Wet sodium-based systems – 303
Fluroene – 106Fluorine – 97, 104, 107, 110Fluoranthene – 106Fluorosis – 110Fly ash – 95–96, 107, 113Fly ash reinjection – 103Fly ash reentrainment – 353Fly ash resistivity – 351–354Food supply security – 462Forest and Rangeland Resources
Planning Act of 1974 – 89Formed coke – 243Fossil fuel – 13, 35, 115, 393Fossil fuel combustion wastes
(FFCW) – 95Foster, Earnest – 200Foster, Pell – 200Fouling – 232Foundaries – 237Fuel diversity – 204, 449, 458Fuel switching – 292, 376Froth flotation – 92Fugitive dust – 86Furnace design – 229Furnace, types:
coke – 238Cyclone – 228Double U-flame – 227Dry-bottom – 225Horizontal – 226Opposed horizontal – 226Opposed inclined - 226Single U-flame – 227Slag-tap – 225Stuckofen – 238Tangential – 226Wet-bottom – 225, 227
FutureGen – 394, 424, 435

520 Index
G
Gas conditioning – 365Gasification – 33, 69, 91, 246–247,
421, 458Gasification facilities – 509–511Gasification processes:
BGL – 261ChevronTexaco – 258, 264E-Gas – 264, 266Entrained-flow – 249, 253–254,
264–266Fixed-bed – 249–250, 254–255, 258Fluidized-bed – 249, 252–254, 262–263High-Temperature Winkler – 262Kellogg-Rust-Westinghouse (KRW) –
262–263Koppers-Totzek – 265Lurgi – 258–260Prenflo – 264, 266Shell – 258, 264–265
Gas ionization – 348Gas sneakage – 353Gelification – 4Geochemical – 3Geologic Period – 2, 3Geothermal – 34, 54, 58Global alliances – 450Global climate change – 117–118, 161Global Climate Change Initiative – 378,
424, 427Global Coal Initiative (GCI) – 464–465Global energy markets – 447Global warming – 117–118Global warming potential (GWP) – 116Goddard Institute for Space Studies –
117Great Plains Synfuels Plant – 258Greeks – 30, 196Greenhouse effect – 114Greenhouse gases – 114–117Gross domestic product (GDP) – 449,
451Groundwater – 77–78, 82, 84, 87, 110Gypsum – 95, 296, 299
H
Hadrian’s Wall – 30Halocarbons – 114–115
Halons – 115Hard coal – 3, 22–25, 68Hazardous air pollutants – 128, 144,
499–503Health effects – 78, 84, 89, 99–100, 102,
106, 110, 118Heavy oil – 240Helmont, Jan van – 247Herbaceous plants – 4Hero of Alexandria – 196Heterogeneous reaction – 207Homogenous reaction – 207–208Historic Preservation Act of 1966 – 89Hoof-and-mouth disease – 463Horizontal slot-type coke oven – 240Human health – 77, 96, 104Humic substances – 3Hydrated calcium sulfite – 302Hydrated lime – 307, 312, 315, 319Hydraulic separation – 91–92Hydroelectric – 34, 50, 54, 58, 68–69, 71Hydrogen – 74, 447, 462, 468Hydrogenation – 33Hydrogen chloride – 307Hydrogen cyanide – 101Hydrogen economy – 69, 74Hydrogen production – 69, 394, 425, 459Hydrogen storage – 459Hydrogen utilization – 459Hydrolysis – 83Hydrobromofluorocarbons – 115Hydrochlorofluorocarbons – 114Hydrofluorocarbons – 115Hydrorotators – 92
I
I.G. Farben – 269Illuminating gas – 247Indirect liquefaction – 267–268, 271Industrial Revolution – 195Information Collection Request (ICR) –
157Interstate Air Quality Rule – 160Impoundment – 77, 91, 93–95Indeno[1, 2.3-cd]pyrene – 106Indirect liquefaction – 33Industrial boilers – 66Industrial Revolution – 31–32, 39, 117
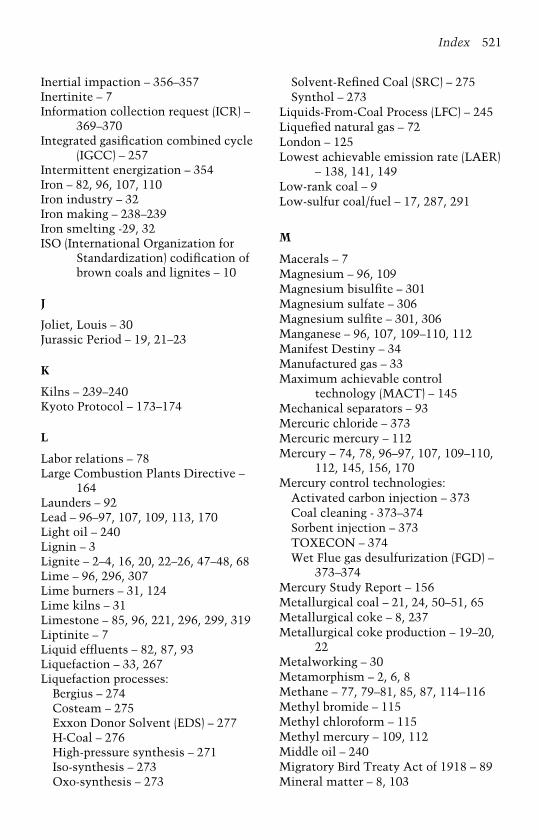
Index 521
Inertial impaction – 356–357Inertinite – 7Information collection request (ICR) –
369–370Integrated gasification combined cycle
(IGCC) – 257Intermittent energization – 354Iron – 82, 96, 107, 110Iron industry – 32Iron making – 238–239Iron smelting -29, 32ISO (International Organization for
Standardization) codification ofbrown coals and lignites – 10
J
Joliet, Louis – 30Jurassic Period – 19, 21–23
K
Kilns – 239–240Kyoto Protocol – 173–174
L
Labor relations – 78Large Combustion Plants Directive –
164Launders – 92Lead – 96–97, 107, 109, 113, 170Light oil – 240Lignin – 3Lignite – 2–4, 16, 20, 22–26, 47–48, 68Lime – 96, 296, 307Lime burners – 31, 124Lime kilns – 31Limestone – 85, 96, 221, 296, 299, 319Liptinite – 7Liquid effluents – 82, 87, 93Liquefaction – 33, 267Liquefaction processes:
Bergius – 274Costeam – 275Exxon Donor Solvent (EDS) – 277H-Coal – 276High-pressure synthesis – 271Iso-synthesis – 273Oxo-synthesis – 273
Solvent-Refined Coal (SRC) – 275Synthol – 273
Liquids-From-Coal Process (LFC) – 245Liquefied natural gas – 72London – 125Lowest achievable emission rate (LAER)
– 138, 141, 149Low-rank coal – 9Low-sulfur coal/fuel – 17, 287, 291
M
Macerals – 7Magnesium – 96, 109Magnesium bisulfite – 301Magnesium sulfate – 306Magnesium sulfite – 301, 306Manganese – 96, 107, 109–110, 112Manifest Destiny – 34Manufactured gas – 33Maximum achievable control
technology (MACT) – 145Mechanical separators – 93Mercuric chloride – 373Mercuric mercury – 112Mercury – 74, 78, 96–97, 107, 109–110,
112, 145, 156, 170Mercury control technologies:
Activated carbon injection – 373Coal cleaning - 373–374Sorbent injection – 373TOXECON – 374Wet Flue gas desulfurization (FGD) –
373–374Mercury Study Report – 156Metallurgical coal – 21, 24, 50–51, 65Metallurgical coke – 8, 237Metallurgical coke production – 19–20,
22Metalworking – 30Metamorphism – 2, 6, 8Methane – 77, 79–81, 85, 87, 114–116Methyl bromide – 115Methyl chloroform – 115Methyl mercury – 109, 112Middle oil – 240Migratory Bird Treaty Act of 1918 – 89Mineral matter – 8, 103
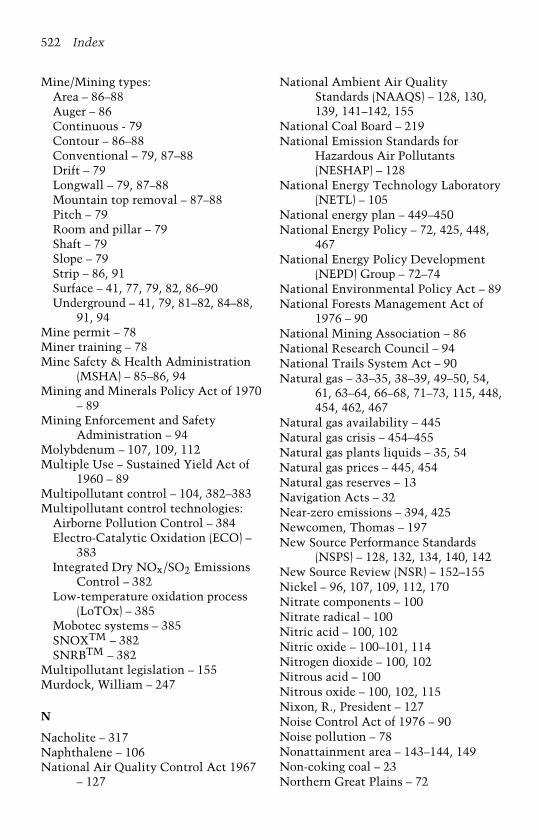
522 Index
Mine/Mining types:Area – 86–88Auger – 86Continuous - 79Contour – 86–88Conventional – 79, 87–88Drift – 79Longwall – 79, 87–88Mountain top removal – 87–88Pitch – 79Room and pillar – 79Shaft – 79Slope – 79Strip – 86, 91Surface – 41, 77, 79, 82, 86–90Underground – 41, 79, 81–82, 84–88,
91, 94Mine permit – 78Miner training – 78Mine Safety & Health Administration
(MSHA) – 85–86, 94Mining and Minerals Policy Act of 1970
– 89Mining Enforcement and Safety
Administration – 94Molybdenum – 107, 109, 112Multiple Use – Sustained Yield Act of
1960 – 89Multipollutant control – 104, 382–383Multipollutant control technologies:
Airborne Pollution Control – 384Electro-Catalytic Oxidation (ECO) –
383Integrated Dry NOx/SO2 Emissions
Control – 382Low-temperature oxidation process
(LoTOx) – 385Mobotec systems – 385SNOXTM – 382SNRBTM – 382
Multipollutant legislation – 155Murdock, William – 247
N
Nacholite – 317Naphthalene – 106National Air Quality Control Act 1967
– 127
National Ambient Air QualityStandards (NAAQS) – 128, 130,139, 141–142, 155
National Coal Board – 219National Emission Standards for
Hazardous Air Pollutants(NESHAP) – 128
National Energy Technology Laboratory(NETL) – 105
National energy plan – 449–450National Energy Policy – 72, 425, 448,
467National Energy Policy Development
(NEPD) Group – 72–74National Environmental Policy Act – 89National Forests Management Act of
1976 – 90National Mining Association – 86National Research Council – 94National Trails System Act – 90Natural gas – 33–35, 38–39, 49–50, 54,
61, 63–64, 66–68, 71–73, 115, 448,454, 462, 467
Natural gas availability – 445Natural gas crisis – 454–455Natural gas plants liquids – 35, 54Natural gas prices – 445, 454Natural gas reserves – 13Navigation Acts – 32Near-zero emissions – 394, 425Newcomen, Thomas – 197New Source Performance Standards
(NSPS) – 128, 132, 134, 140, 142New Source Review (NSR) – 152–155Nickel – 96, 107, 109, 112, 170Nitrate components – 100Nitrate radical – 100Nitric acid – 100, 102Nitric oxide – 100–101, 114Nitrogen dioxide – 100, 102Nitrous acid – 100Nitrous oxide – 100, 102, 115Nixon, R., President – 127Noise Control Act of 1976 – 90Noise pollution – 78Nonattainment area – 143–144, 149Non-coking coal – 23Northern Great Plains – 72
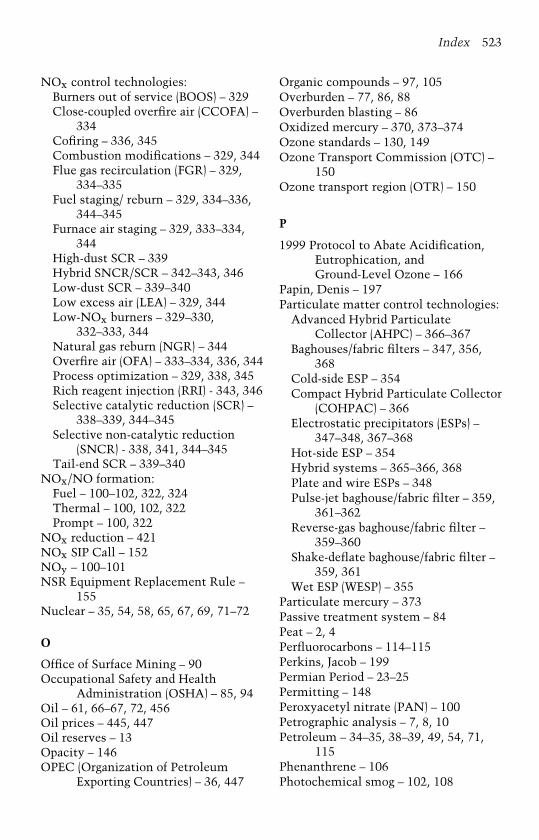
Index 523
NOx control technologies:Burners out of service (BOOS) – 329Close-coupled overfire air (CCOFA) –
334Cofiring – 336, 345Combustion modifications – 329, 344Flue gas recirculation (FGR) – 329,
334–335Fuel staging/ reburn – 329, 334–336,
344–345Furnace air staging – 329, 333–334,
344High-dust SCR – 339Hybrid SNCR/SCR – 342–343, 346Low-dust SCR – 339–340Low excess air (LEA) – 329, 344Low-NOx burners – 329–330,
332–333, 344Natural gas reburn (NGR) – 344Overfire air (OFA) – 333–334, 336, 344Process optimization – 329, 338, 345Rich reagent injection (RRI) - 343, 346Selective catalytic reduction (SCR) –
338–339, 344–345Selective non-catalytic reduction
(SNCR) - 338, 341, 344–345Tail-end SCR – 339–340
NOx/NO formation:Fuel – 100–102, 322, 324Thermal – 100, 102, 322Prompt – 100, 322
NOx reduction – 421NOx SIP Call – 152NOy – 100–101NSR Equipment Replacement Rule –
155Nuclear – 35, 54, 58, 65, 67, 69, 71–72
O
Office of Surface Mining – 90Occupational Safety and Health
Administration (OSHA) – 85, 94Oil – 61, 66–67, 72, 456Oil prices – 445, 447Oil reserves – 13Opacity – 146OPEC (Organization of Petroleum
Exporting Countries) – 36, 447
Organic compounds – 97, 105Overburden – 77, 86, 88Overburden blasting – 86Oxidized mercury – 370, 373–374Ozone standards – 130, 149Ozone Transport Commission (OTC) –
150Ozone transport region (OTR) – 150
P
1999 Protocol to Abate Acidification,Eutrophication, andGround-Level Ozone – 166
Papin, Denis – 197Particulate matter control technologies:
Advanced Hybrid ParticulateCollector (AHPC) – 366–367
Baghouses/fabric filters – 347, 356,368
Cold-side ESP – 354Compact Hybrid Particulate Collector
(COHPAC) – 366Electrostatic precipitators (ESPs) –
347–348, 367–368Hot-side ESP – 354Hybrid systems – 365–366, 368Plate and wire ESPs – 348Pulse-jet baghouse/fabric filter – 359,
361–362Reverse-gas baghouse/fabric filter –
359–360Shake-deflate baghouse/fabric filter –
359, 361Wet ESP (WESP) – 355
Particulate mercury – 373Passive treatment system – 84Peat – 2, 4Perfluorocarbons – 114–115Perkins, Jacob – 199Permian Period – 23–25Permitting – 148Peroxyacetyl nitrate (PAN) – 100Petrographic analysis – 7, 8, 10Petroleum – 34–35, 38–39, 49, 54, 71,
115Phenanthrene – 106Photochemical smog – 102, 108
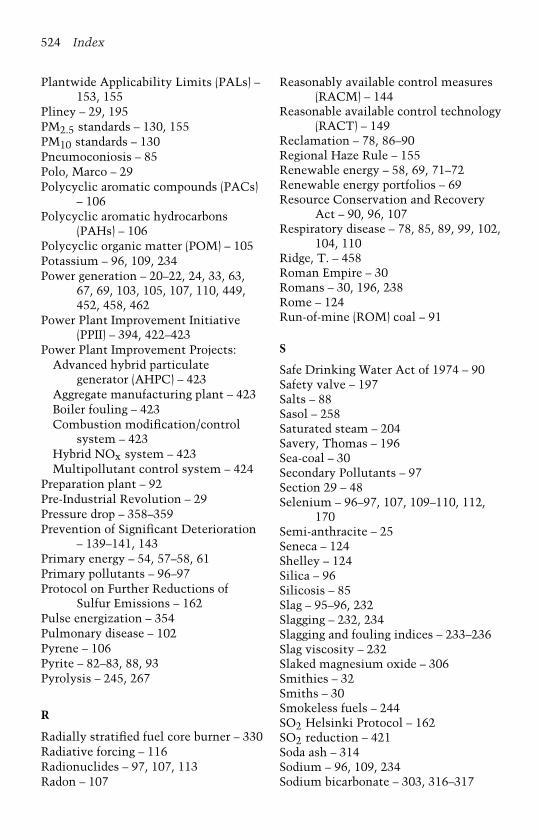
524 Index
Plantwide Applicability Limits (PALs) –153, 155
Pliney – 29, 195PM2.5 standards – 130, 155PM10 standards – 130Pneumoconiosis – 85Polo, Marco – 29Polycyclic aromatic compounds (PACs)
– 106Polycyclic aromatic hydrocarbons
(PAHs) – 106Polycyclic organic matter (POM) – 105Potassium – 96, 109, 234Power generation – 20–22, 24, 33, 63,
67, 69, 103, 105, 107, 110, 449,452, 458, 462
Power Plant Improvement Initiative(PPII) – 394, 422–423
Power Plant Improvement Projects:Advanced hybrid particulate
generator (AHPC) – 423Aggregate manufacturing plant – 423Boiler fouling – 423Combustion modification/control
system – 423Hybrid NOx system – 423Multipollutant control system – 424
Preparation plant – 92Pre-Industrial Revolution – 29Pressure drop – 358–359Prevention of Significant Deterioration
– 139–141, 143Primary energy – 54, 57–58, 61Primary pollutants – 96–97Protocol on Further Reductions of
Sulfur Emissions – 162Pulse energization – 354Pulmonary disease – 102Pyrene – 106Pyrite – 82–83, 88, 93Pyrolysis – 245, 267
R
Radially stratified fuel core burner – 330Radiative forcing – 116Radionuclides – 97, 107, 113Radon – 107
Reasonably available control measures(RACM) – 144
Reasonable available control technology(RACT) – 149
Reclamation – 78, 86–90Regional Haze Rule – 155Renewable energy – 58, 69, 71–72Renewable energy portfolios – 69Resource Conservation and Recovery
Act – 90, 96, 107Respiratory disease – 78, 85, 89, 99, 102,
104, 110Ridge, T. – 458Roman Empire – 30Romans – 30, 196, 238Rome – 124Run-of-mine (ROM) coal – 91
S
Safe Drinking Water Act of 1974 – 90Safety valve – 197Salts – 88Sasol – 258Saturated steam – 204Savery, Thomas – 196Sea-coal – 30Secondary Pollutants – 97Section 29 – 48Selenium – 96–97, 107, 109–110, 112,
170Semi-anthracite – 25Seneca – 124Shelley – 124Silica – 96Silicosis – 85Slag – 95–96, 232Slagging – 232, 234Slagging and fouling indices – 233–236Slag viscosity – 232Slaked magnesium oxide – 306Smithies – 32Smiths – 30Smokeless fuels – 244SO2 Helsinki Protocol – 162SO2 reduction – 421Soda ash – 314Sodium – 96, 109, 234Sodium bicarbonate – 303, 316–317

Index 525
Sodium bisulfite – 303Sodium carbonate – 303, 306Sodium hydroxide – 303Sodium sesquicarbonate – 317Sodium sulfate -303Sodium sulfite – 303–304Sofia NOx Protocol – 166Soil and Water Resources Conservation
Act of 1977 – 90Sorbent – 221Specific collection area (SCA) – 351State Implementation Plan (SIP) – 139,
149–150Steam – 97Steam coal – 22, 24–25, 50, 71Steam-driven pump – 197Steam engine – 32, 196–197Steam production – 19–20, 22Steel industry – 67–68Steel production – 64Stevens, John – 199Stevens, John Cox – 199Stone coals – 113Strategic Petroleum Reserve – 395Study of Hazardous Air Pollutant
Emissions from Electric UtilitySteam Generating Units – 187
Solar – 34, 54, 58Subbituminous coal – 2, 4, 16, 20–22,
26, 48Subsidence – 78–80, 84Sugar refineries – 32Sulfate components – 97, 100Sulfur – 17, 286Sulfur dioxide emissions allowances –
147Sulfur emissions regulations – 17Sulfur hexafluoride – 114–115Sulfuric acid – 98, 305–306Superheated steam – 204Surface Mining Control and
Reclamation Act (SMRCA) – 89,94, 97
Surface water – 78, 87Sustainable energy policy – 466Synfuel plant – 48Syngas – 256, 258Synthetic coal – 48
Synthetic Fuels Corporation(SFC) – 395
Synthetic liquid fuels – 48Synthetic natural gas (SNG) – 257–258
T
Tanneries – 32Tectonic – 2Tertiary Period – 19, 21–26Thallium – 112Theophrastus -29, 195Thermal coal – 24Thermal dryers – 92Thermal upgrading – 245Thermoplastic – 8Thiosulfate – 300Thorium – 107, 113Town gas – 247Toxic elements – 96, 107Trace elements – 8, 97, 108, 110, 175Trevithick, Richard – 197Trona – 317Tropsch, Hans – 269
U
1998 United Nations Protocol on HeavyMetals – 170
Unburned carbon – 333UNECE Gothenburg Protocol – 162United Nations Economic Commission
for Europe’s (UNECE)Convention on Long RangeTransboundary Air Pollution(LRTAP) – 162, 165
United Nations Environment Report –189
United Nations Framework Conventionon Climate Change – 172–173
United States Department of Energy –95, 219
United Sates Department of Interior,Office of Coal Research – 219
United States Environmental ProtectionAgency (EPA) – 95, 100, 116, 128
Uranium – 107, 113Urea – 341Utility Hazardous Air Pollutant Report
to Congress – 157, 188
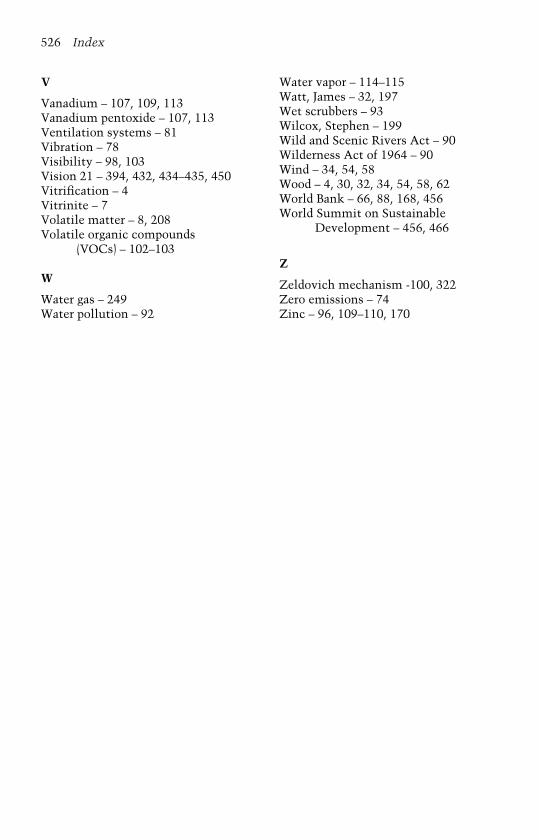
526 Index
V
Vanadium – 107, 109, 113Vanadium pentoxide – 107, 113Ventilation systems – 81Vibration – 78Visibility – 98, 103Vision 21 – 394, 432, 434–435, 450Vitrification – 4Vitrinite – 7Volatile matter – 8, 208Volatile organic compounds
(VOCs) – 102–103
W
Water gas – 249Water pollution – 92
Water vapor – 114–115Watt, James – 32, 197Wet scrubbers – 93Wilcox, Stephen – 199Wild and Scenic Rivers Act – 90Wilderness Act of 1964 – 90Wind – 34, 54, 58Wood – 4, 30, 32, 34, 54, 58, 62World Bank – 66, 88, 168, 456World Summit on Sustainable
Development – 456, 466
Z
Zeldovich mechanism -100, 322Zero emissions – 74Zinc – 96, 109–110, 170
Related Documents