CO 2 Utilization Roadmap November 16 th , 2016 David Sandalow, Columbia University Dr. Issam Dairanieh, CO 2 Sciences

Welcome message from author
This document is posted to help you gain knowledge. Please leave a comment to let me know what you think about it! Share it to your friends and learn new things together.
Transcript
CO2 Utilization Roadmap!
November 16th, 2016!
David Sandalow, Columbia University!Dr. Issam Dairanieh, CO2 Sciences!

ICEF Innovation Roadmap Project!
GOALS!!
• To use the ICEF platform to help promote the development and deployment of clean energy technologies!
!!
• To promote global awareness of the ICEF conference!
!

ICEF Innovation Roadmap Project2016 Activities
!!
New York Roadmapping Workshop (April)!!
Carbon Dioxide Utilization Roadmap!!
Zero Energy Buildings Roadmap!
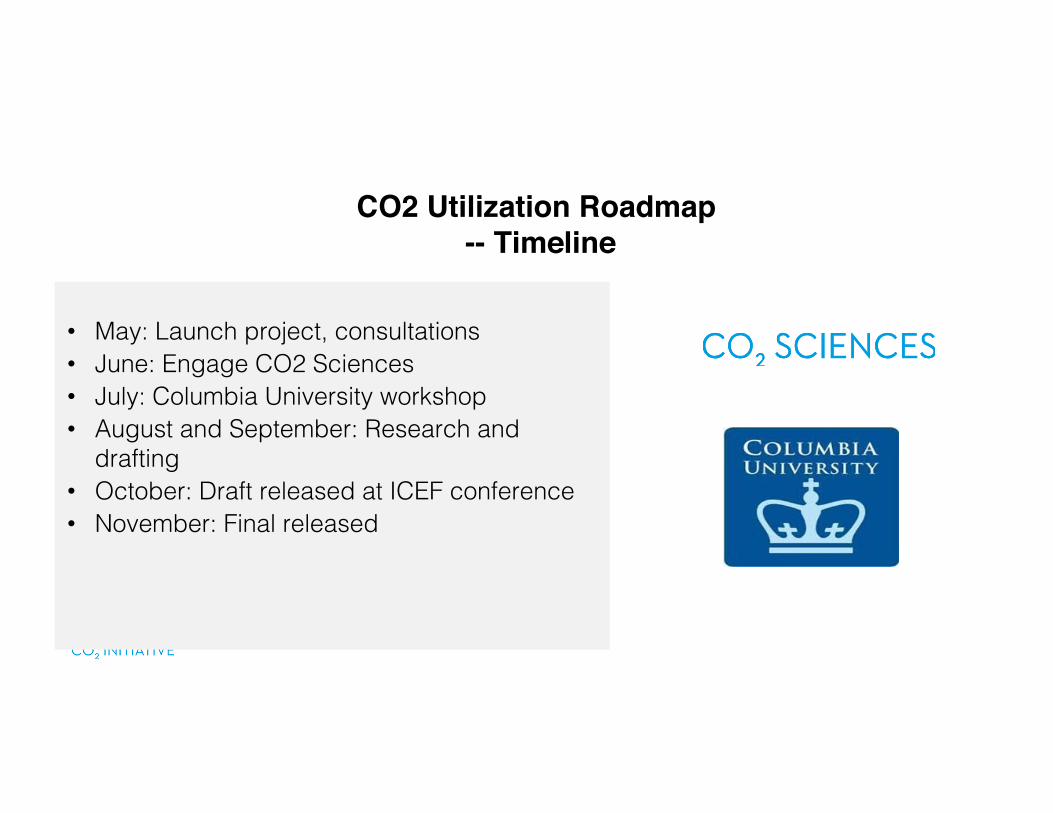
CO2 Utilization Roadmap -- Timeline
!• May: Launch project, consultations!• June: Engage CO2 Sciences!• July: Columbia University workshop!• August and September: Research and
drafting!• October: Draft released at ICEF conference!• November: Final released !
!!

The Challenge
400 PPM
275 PPM
Source: Global Carbon Project, 2015 Carbon Budget!
Rapidly increasing global CO2 emissions!
Annual CO2 emissions:!35.9 gigatons
Annual Increase:!1.9%
CO2 stays in the atmosphere for
hundreds of years

Capture and Storage
Long-term sequestration!
Necessary but costly
Addressing the challenge creates an opportunityCO2-based products are one part of the climate solution!
AdaptationManaging impacts of
climate change!
Increasingly necessary
DecarbonizationEnergy efficiency!Clean renewable
energy!
Progress, but not fast enough
M I T I G A T I O N ! M I T I G A T I O N !
Capture and Use
Creating valuable!CO2-based
products!
Market-driven solution
M I T I G A T I O N !A D A P T A T I O N !

IPCC envisages the need for large-scale deployment of net-negative CO2 emissions technologies by mid-century to meet stringent climate mitigation goals…These CO2 r e m o v a l t e c h n o l o g i e s complement low or zero-carbon energy technologies.!
The importance of carbon negative technology
January 2016
“
”To prevent global temperature increase above 2 degrees Celsius, we must deploy technologies that remove carbon dioxide. Scenarios that exclude CO2-based products can’t deliver this targeted amount.

Methodology for the Developing of the Roadmap
Part 1: Technology Landscaping!
Part 2: Preliminary Market Assessment!
Part 3: Accelerating Deployment!
• Prioritization: Top four market sectors
• Market assessment assumptions & methodology
• Timelines for Market Penetration
• Sub-sector Market Assessment
• Integrating parts 1 & 2
• Barriers, risks and risk mitigation
• The roadmap: Accelerating Deployment: technology, policy and market levers
• The roadmap: ’Interventions’ financial and environmental impacts
8!
• CO2U technologies pathways
• CO2U technologies database
• Six major market sectors
• Sub-sector Technology Assessment
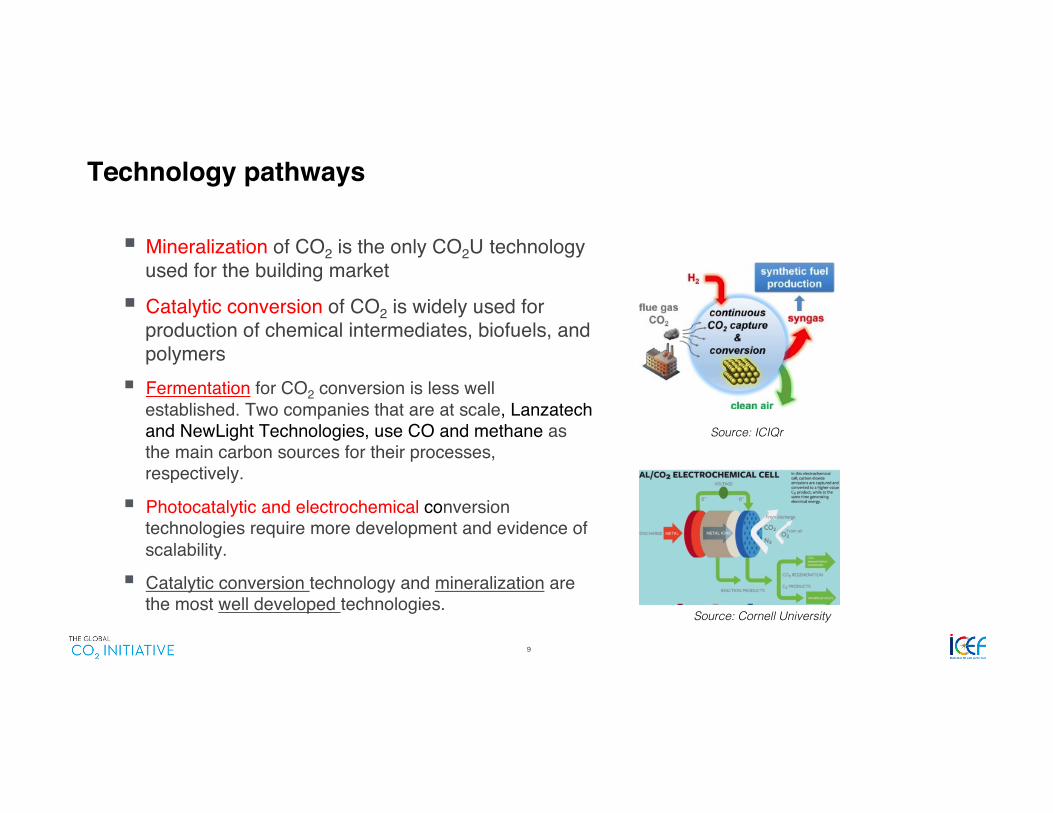
Technology pathways
§ Mineralization of CO2 is the only CO2U technology used for the building market
§ Catalytic conversion of CO2 is widely used for production of chemical intermediates, biofuels, and polymers
§ Fermentation for CO2 conversion is less well established. Two companies that are at scale, Lanzatech and NewLight Technologies, use CO and methane as the main carbon sources for their processes, respectively.
§ Photocatalytic and electrochemical conversion technologies require more development and evidence of scalability.
§ Catalytic conversion technology and mineralization are the most well developed technologies.
Source: ICIQr!
Source: Cornell University!
9!

Technology readiness of different pathways
Fermentation!
Photosynthetic!
Thermo-catalytic!
Electrochemical!
Photocatalytic!
Stage of Development (TRL)!1 5 9
Mineralization!
3 7 10!
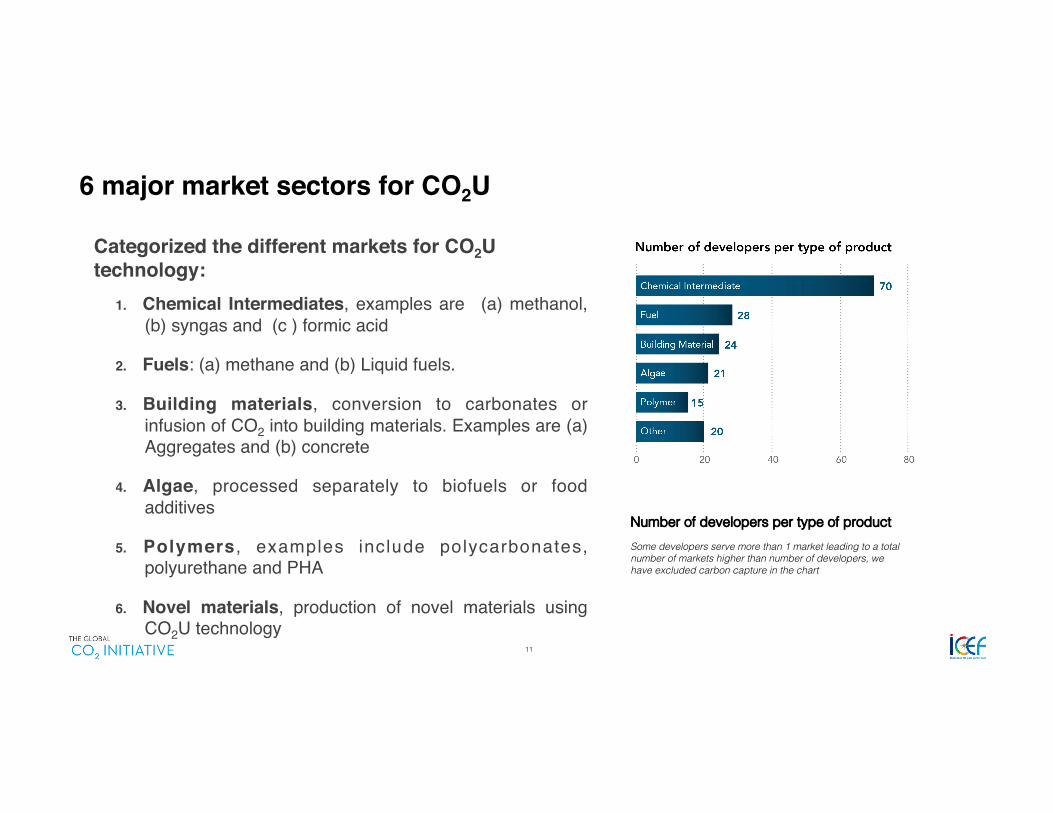
6 major market sectors for CO2U
Categorized the different markets for CO2U technology:
1. Chemical Intermediates, examples are (a) methanol, (b) syngas and (c ) formic acid
2. Fuels: (a) methane and (b) Liquid fuels.
3. Building materials, conversion to carbonates or infusion of CO2 into building materials. Examples are (a) Aggregates and (b) concrete
4. Algae, processed separately to biofuels or food additives
5. Polymers , examples include polycarbonates, polyurethane and PHA
6. Novel materials, production of novel materials using CO2U technology
11!
Number of developers per type of product!Some developers serve more than 1 market leading to a total number of markets higher than number of developers, we have excluded carbon capture in the chart!!

Top 4 markets in terms of environmental impact and commercial opportunity
12!
Stage of development!
Addressable market size!
Number of developers!
Potential for !CO2 mitigation!
Building materials
Chemical intermediates
Fuels
Polymers
Algae!
Novel materials!
High (>25% of developers is near commercialization, the addressable market is a mature market, number of developers >50, prolonged abatement of CO2)!
Medium (<25% of developers is near commercialization, the addressable market is a developing market, number of developers between 10 and 50, mitigation of CO2 by replacing conventional feedstock)!
Low (no developers are !near commercialization, the addressable market is unclear, number of developers below 10, CO2 mitigation is minimal)!
Building materials
Chemical intermediates
Fuels
Polymers
1!
2!
3!
4!
Market Assessment: Prioritization!

Methodology for assessing addressable market size for CO2U
Estimation market size in 2015!
CAGR of total market to 2030!
Market penetration rate of CO2U products!
Captured market size !
§ Analysis of in-house knowledge and secondary information from annual reports, market reports, and publications.§ Triangulation and vetting of numbers from different sources
§ Analysis of in-house knowledge and secondary information from annual reports, market reports, and publications.§ Analysis of drivers and constraints
§ Estimation of market penetration based on 3 scenarios. Every scenario has different timelines for mitigating barriers and driving market penetration.
§ Estimation of the captured market size based on the overall market size in 2015, CAGR of the total incumbent market and market penetration for the three scenarios.
13!

Curing of concrete by CO2 will pick up without additional incentives, but can be accelerated by 5 years
§ The total concrete market is expected to grow to approximately 40 G metric tons by 2030 with a CAGR between 3 and 4%
Concrete curing by using CO2 offers immediate
investment opportunities with a potential for high ROI,
while also delivering on CO2 abatement !
0!
2!
4!
6!
8!
10!
12!
14!
16!
18!
2015! 2020! 2025! 2030!
Con
cret
e pr
oduc
tion
(B to
nnes
/ yea
r) ! Pessimistic! Optimistic!
Best case!
Market Size Estimate Example!
14!
Accelerating Deployment
§ The technology landscaping and market assessment sections have presented a detailed picture of the potential and challenges of a number of CO2 based products.
§ Some market sub-sectors are ready for commercialization today; most require ‘intervention’ to accelerate deployment of CO2U technologies. Examples include§ Cement, polymers and aggregates that can be commercially viable in the near term
§ Fuels and Chemicals that require significant support before getting to commercial viability
§ Overall, there remain challenges (risks and barriers to commercialization) that need to be addressed.
§ Depending on the effort put forth to address specific challenges be it on the technology, market or policy fronts, the implementation ( commercial introduction) of such products can be significantly impacted.
15!

Technology§ A lack of coherent funding strategies exists from governments on CO2U
technology.§ High cost: need to improve technology of CO2 reduction and electrolysis to
form H2 .
16!
0!0.5!
1!1.5!
2!2.5!
3!3.5!
4!4.5!
5!Policy!
Technology!Market!
Building materials!
Chemical intermediates!
Fuels!
Polymers!
Market§ A barrier is the lack of access to facilities to scale up CO2U
technologies.§ CO2U has to compete with conventional feedstock and bio-based
feedstocks. These options are often lower in cost.§ Another barrier is the lack of access to feedstocks. This is the case
for hydrogen, CO2, and renewable energy.§ Process integration of renewable energy, feedstock and conversion
process is not cost-competitivePolicy§ There is a lack of long-term policy framework. Need to explore both incentives and credits as well as a carbon
price.§ Governments need to fund R&D research
Accelerating Deployment!Overview of barriers to be mitigated and their relevance to the four markets!
0!0.5!
1!1.5!
2!2.5!
3!3.5!
4!4.5!
5!Policy!
Technology!Market!
Building materials!
Chemical intermediates!
Fuels!
Polymers!

Conclusions$10B–$60B
$1B–$5B
$0.3B–$4B
$0.1B–$0.6B
$0.1B–$0.2B
$50B–$200B
$4.5B–$60B
$6B–$30B
$0.4B–$2.5B
$0.2B–$5B
$150B–$400B
$10B–$250B
$15B–$150B
$2B–$25B
$1B–$12B
Potential Annual Revenue (dollars)
Strategic actions implemented Without strategic actions
Methanol
Fuels
Aggregates
Polymers
Concrete
2020 2025 2030
The ‘Intervention’ translates to a significant business opportunity
$10B–$60B
$1B–$5B
$0.3B–$4B
$0.1B–$0.6B
$0.1B–$0.2B
$50B–$200B
$4.5B–$60B
$6B–$30B
$0.4B–$2.5B
$0.2B–$5B
$150B–$400B
$10B–$250B
$15B–$150B
$2B–$25B
$1B–$12B
Potential Annual Revenue (dollars)
Strategic actions implemented Without strategic actions
Methanol
Fuels
Aggregates
Polymers
Concrete
2020 2025 2030
17!

Conclusions
Methanol
Fuels
Aggregates
Polymers
Concrete
2020 2025 2030
0.04B–0.2B
0.01B–0.03B
0.01B–0.1B
0.00002B–0.00005B
0.0001B–0.001B
0.2B–0.7B
0.03B–0.5B
0.1B–0.7B
0.00004B–0.0002B
0.0008B–0.02B
0.6B–1.4B
0.07B–2.1B
0.3B–3.6B
0.0001B–0.002B
0.005B–0.05B
Strategic actions implemented Without strategic actions
Potential Reduction
in CO2 Emissions (tons)
And the intervention will create a significant environmental impact
Methanol
Fuels
Aggregates
Polymers
Concrete
2020 2025 2030
0.04B–0.2B
0.01B–0.03B
0.01B–0.1B
0.00002B–0.00005B
0.0001B–0.001B
0.2B–0.7B
0.03B–0.5B
0.1B–0.7B
0.00004B–0.0002B
0.0008B–0.02B
0.6B–1.4B
0.07B–2.1B
0.3B–3.6B
0.0001B–0.002B
0.005B–0.05B
Strategic actions implemented Without strategic actions
Potential Reduction
in CO2 Emissions (tons)
18!

Conclusions§ Global warming due to carbon dioxide emissions is one of the grand challenges of our time. Carbon Dioxide
Utilization (CO2U) technologies have the potential to significantly lower CO2 emissions.§ This study analyzed the current state of CO2U technology:
§ Almost 180 technology developers were analyzed to assess technology feasibility and readiness.§ Four major market opportunities in fuel, building materials, chemical intermediates and polymers were
selected.§ The study also presented a market assessment detailing potential for creating 8 different products over
different time periods.§ The study estimated the market size for selected CO2-based products for two scenarios
§ Without strategic actions§ With strategic actions implemented
§ The conclusions are§ CO2U must be considered a critical component of the solution set addressing the climate change issue.§ There are products that are competitive todays; others can benefit from market, technology and policy
levers.§ CO2U can reduce CO2 emissions by 15%§ CO2U can create a market opportunity greater than $800 billion per year.
19!

Conclusions§ Based on the cumulative analysis, a roadmap that depicts specific strategic actions that can be taken and their expected impact on accelerating implementation of CO2U technologies was created.
§ We conclude that the following strategic actions will help grow the CO2U market size ( for a handful of CO2 based products) over $800B by 2030
§ Technology: § Fund research to improve catalysis for CO2 reduction§ Fund research to improve electrolysis to produce H2§ Market: § Ensure supply of CO2 through creating significant CO2 pipeline network.§ Funding for collaborations between research institutes, start-ups, governments and corporations for process integration of CO2 conversion, H2 generation, and carbon capture§ Policy: § Fund basic R &D§ Individual countries and sub-national jurisdictions increasingly implement carbon price.§ Increase mandates for renewable products and fuels.§ Incentivize reduction of CO2 emissions by fuel, chemical and building materials producers
Market!
Technology!Policy!
20!

Recommendations
To accelerate implementation of CO2U technologies: 5 key strategic actions!
• Increase cost of polluting competition: Individual countries and sub-national jurisdictions increasingly implement carbon price and increase mandates for renewable products and fuels and/or incentivize reduction of CO2 emissions by fuel, chemical, materials and building materials producers
• Decrease cost of utilization of CO2: Fund research to improve catalysis for CO2 reduction and to improve electrolysis to produce H2
• Scaling up production: Funding made available to set up collaborations between research institutes, start-ups, governments and corporations for process integration of CO2 conversion, H2 generation, and carbon capture
• Steady supply of CO2: Governments should incentivize development of a CO2 infrastructure to anticipate growth in CO2 demand
• Maximize high potential of long shots: Fund applied research on long-shot technologies and applications that have high CO2 abatement potential
21!
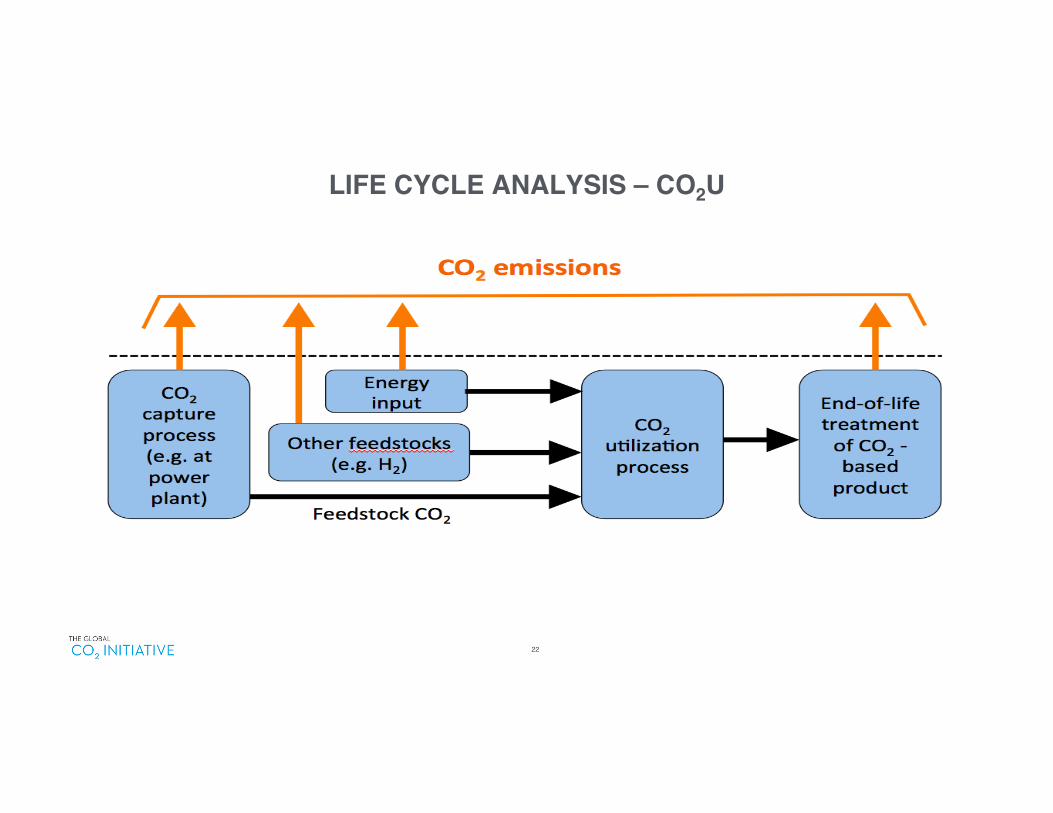
LIFE CYCLE ANALYSIS – CO2U
22!

POLICY OPTIONS – CO2U
23!
!
• GOVERNMENT FUNDING OF R&D!
• CARBON PRICING!
• TAX AND OTHER INCENTIVES!
• MANDATE!
• GOVERNMENT PROCUREMENT!
• GOVERNMENT SUPPORT FOR TESTING, CERTIFICATION AND LCA!
Related Documents


