CO 2 , N 2 and Ar Adsorption on Zeolites By Aslı ERTAN A Dissertation Submitted to the Graduate School in Partial Fulfillment of the Requirements for the Degree of MASTER OF SCIENCE Department: Chemical Engineering Major: Chemical Engineering İzmir Institute of Technology İzmir, Turkey February, 2004

Welcome message from author
This document is posted to help you gain knowledge. Please leave a comment to let me know what you think about it! Share it to your friends and learn new things together.
Transcript
CO2, N2 and Ar Adsorption on Zeolites
By
Aslı ERTAN
A Dissertation Submitted to the
Graduate School in Partial Fulfillment of the
Requirements for the Degree of
MASTER OF SCIENCE
Department: Chemical Engineering
Major: Chemical Engineering
İzmir Institute of Technology İzmir, Turkey
February, 2004

We approve the thesis of Aslı ERTAN
Date of Signature
.................................................. 10.02.2004
Asst. Prof. S. Fehime ÖZKAN
Supervisor
Department of Chemical Engineering
.................................................. 10.02.2004
Prof. Dr. A. Semra ÜLKÜ
Co-Supervisor
Department of Chemical Engineering
.................................................. 10.02.2004
Prof. Dr. Devrim BALKÖSE
Department of Chemical Engineering
.................................................. 10.02.2004
Prof. Dr. Gönül GÜNDÜZ
Department of Chemical Engineering
.................................................. 10.02.2004
Asst. Prof. Aysun SOFUOĞLU
Department of Chemical Engineering
.................................................. 10.02.2004
Prof. Dr. Devrim BALKÖSE
Head of Department

ACKNOWLEDGEMENTS
I would like to express my intimate gratitude to my advisor, Asst. Prof. Fehime
Özkan, for her guidance and support throughout this project. I am also grateful to Prof.
Dr. Semra Ülkü and Prof. Dr. Devrim Balköse for their valuable suggestions. I also
would like to give my special thanks to Asst. Prof. Erol Şeker for his valuable
recommendations during the study.
I would like to thank all of the experts in the Chemical Engineering Department
of İzmir Institute of Technology, laboratory technicians and especially to the experts
Nesrin Tatlıdil, Burcu Alp and Özlem Çağlar for their contributions to the volumetric
and calorimetric studies presented in this study.
I would like to acknowledge deeply to my roommates, Öniz Birsoy, Emre
Kuduğ, Belgin Tunçel and also Hilal Güleç for their friendships, supports and
encouragements.
My special thanks also go to my family and finally to my fiancé Özge Can for
their support, patience and understanding.
vi

ABSTRACT
In this study, CO2 and N2 adsorption on synthetic zeolites namely, 5A and 13X,
and acid treated natural zeolites was investigated by using volumetric adsorption device,
ASAP 2010. The natural zeolites and its acid treated forms with HCl (1M, 3M and 5M),
HNO3 (2 M), and H3PO4 (1.1 M) solutions at 60 oC for 6 or 3 hours were used as
adsorbent. The effect of the acid treatment and temperature on the adsorption properties
of the zeolites for the CO2 and N2 gases at 5 and 25 oC was studied. Langmuir, Sips,
Vrial and Dubinin-Astakhov model equations were applied to the adsorption data in
order to determine the affinity and the heterogeneity of the adsorbents.
Calorimetric properties of the zeolites were also studied using CO2, N2 and Ar
gases through a Tian-Calvet calorimeter, Setaram C80 at 25 oC. Isosteric heat of
adsorption of the gases adsorbed on the adsorbents under investigation was determined
at 5 oC and 25 oC using Clasius- Clapeyron equation. These results were compared with
the heat of adsorptions obtained from the calorimetric studies directly.
The zeolite treated with 1.1 M H3PO4, P1 has the highest adsorption capacity
(2.24 mmol/g and 0.67 mmol/g) for CO2 and N2 while the natural zeolite has only 2.08
mmol/g and 0.51 mmol/g respectively at 5 oC. Synthetic zeolites 13X and 5A have
higher CO2 (6.82 mmol/g and 5.46 mmol/g respectively) and N2 adsorption capacities
(0.31mmol/g and 0.91 mmol/g respectively) than natural zeolites at 5 oC. Langmuir b
parameter called the affinity constant decreased as adsorption temperature increased for
CO2 and N2 adsorption. The Sips model t parameter characterizing the system
heterogeneity is higher for CO2 adsorption than N2 adsorption and decreases with
increasing temperature. This indicates that the CO2 molecules give more specific
interactions than N2 molecules. The pure component selectivities of CO2 over N2
calculated from Langmuir equation, are the highest for NCW zeolite as 408 at 25 oC.
This value follows by P1 zeolite which is 151 at the same temperature.
The highest differential heat of adsorption value (80.29 kJ/mol) at zero coverage
for CO2 also belongs to P1 sample. The heterogeneity parameters of the model
equations applied also indicated that P1 sample is more heterogeneous when compared
to other acid treated natural zeolites. Finally as expected, for both N2 and CO2 as
temperature increased from 5 to 25 oC, the adsorbed amounts decreased when fresh
samples were used at each run in the experiments. The temperature difference had a
greater effect on N2 adsorption rather than CO2.
vii
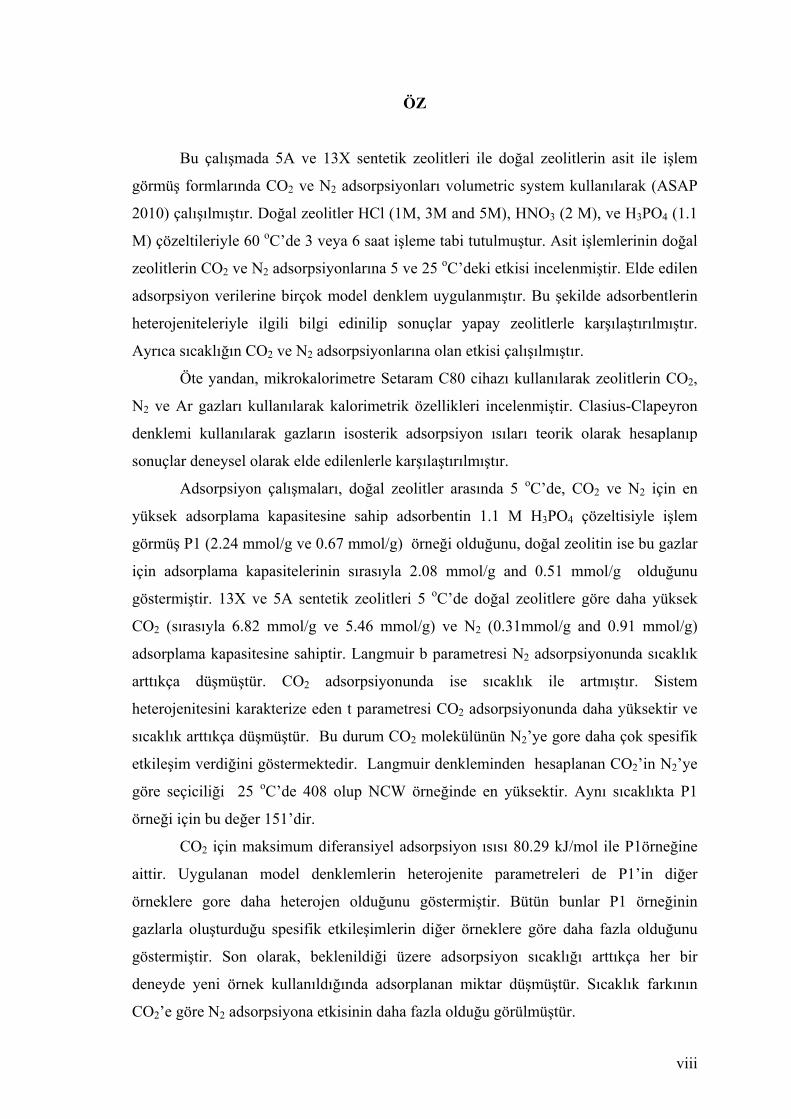
ÖZ
Bu çalışmada 5A ve 13X sentetik zeolitleri ile doğal zeolitlerin asit ile işlem
görmüş formlarında CO2 ve N2 adsorpsiyonları volumetric system kullanılarak (ASAP
2010) çalışılmıştır. Doğal zeolitler HCl (1M, 3M and 5M), HNO3 (2 M), ve H3PO4 (1.1
M) çözeltileriyle 60 oC’de 3 veya 6 saat işleme tabi tutulmuştur. Asit işlemlerinin doğal
zeolitlerin CO2 ve N2 adsorpsiyonlarına 5 ve 25 oC’deki etkisi incelenmiştir. Elde edilen
adsorpsiyon verilerine birçok model denklem uygulanmıştır. Bu şekilde adsorbentlerin
heterojeniteleriyle ilgili bilgi edinilip sonuçlar yapay zeolitlerle karşılaştırılmıştır.
Ayrıca sıcaklığın CO2 ve N2 adsorpsiyonlarına olan etkisi çalışılmıştır.
Öte yandan, mikrokalorimetre Setaram C80 cihazı kullanılarak zeolitlerin CO2,
N2 ve Ar gazları kullanılarak kalorimetrik özellikleri incelenmiştir. Clasius-Clapeyron
denklemi kullanılarak gazların isosterik adsorpsiyon ısıları teorik olarak hesaplanıp
sonuçlar deneysel olarak elde edilenlerle karşılaştırılmıştır.
Adsorpsiyon çalışmaları, doğal zeolitler arasında 5 oC’de, CO2 ve N2 için en
yüksek adsorplama kapasitesine sahip adsorbentin 1.1 M H3PO4 çözeltisiyle işlem
görmüş P1 (2.24 mmol/g ve 0.67 mmol/g) örneği olduğunu, doğal zeolitin ise bu gazlar
için adsorplama kapasitelerinin sırasıyla 2.08 mmol/g and 0.51 mmol/g olduğunu
göstermiştir. 13X ve 5A sentetik zeolitleri 5 oC’de doğal zeolitlere göre daha yüksek
CO2 (sırasıyla 6.82 mmol/g ve 5.46 mmol/g) ve N2 (0.31mmol/g and 0.91 mmol/g)
adsorplama kapasitesine sahiptir. Langmuir b parametresi N2 adsorpsiyonunda sıcaklık
arttıkça düşmüştür. CO2 adsorpsiyonunda ise sıcaklık ile artmıştır. Sistem
heterojenitesini karakterize eden t parametresi CO2 adsorpsiyonunda daha yüksektir ve
sıcaklık arttıkça düşmüştür. Bu durum CO2 molekülünün N2’ye gore daha çok spesifik
etkileşim verdiğini göstermektedir. Langmuir denkleminden hesaplanan CO2’in N2’ye
göre seçiciliği 25 oC’de 408 olup NCW örneğinde en yüksektir. Aynı sıcaklıkta P1
örneği için bu değer 151’dir.
CO2 için maksimum diferansiyel adsorpsiyon ısısı 80.29 kJ/mol ile P1örneğine
aittir. Uygulanan model denklemlerin heterojenite parametreleri de P1’in diğer
örneklere gore daha heterojen olduğunu göstermiştir. Bütün bunlar P1 örneğinin
gazlarla oluşturduğu spesifik etkileşimlerin diğer örneklere göre daha fazla olduğunu
göstermiştir. Son olarak, beklenildiği üzere adsorpsiyon sıcaklığı arttıkça her bir
deneyde yeni örnek kullanıldığında adsorplanan miktar düşmüştür. Sıcaklık farkının
CO2’e göre N2 adsorpsiyona etkisinin daha fazla olduğu görülmüştür.
viii

TABLE OF CONTENTS
Page
LIST OF FIGURES............................................................................................... xi
LIST OF TABLES................................................................................................ xiii
CHAPTER 1. INTRODUCTION.......................................................................... 1
CHAPTER 2. ZEOLITES...................................................................................... 3
2.1. Definition............................................................................................ 3
2.2. Structure............................................................................................... 4
2.3. Clinoptilolite-rich Natural Zeolite Tuff......................................... ... 5
2.4. Synthetic Zeolites................................................................................ 9
2.5. Uses and Applications ................................................................... 10
CHAPTER 3. ADSORPTION................................................................................ 12
3.1. Definition.............................................................................................. 12
3.2. Adsorbents............................................................................................ 12
3.3. Properties of the Adsorbate Gases Used in this Study......................... 14
3.3.1. Carbondioxide........................................................................ 14
3.3.2. Nitrogen................................................................................. . 14
3.3.3. Argon.................................................................................... .. 15
3.4. Pure Gas Adsorption Isotherms......................................................... .... 15
3.4.1. Langmuir Model....................... ........................................ ..... 16
3.4.2. Dubinin Model................................................................. ....... 17
3.4.3. Emprical Isotherm Equations......................................... ........ 19
3.4.4. Henry’s Law..................................................................... ....... 20
CHAPTER 4. GAS SEPARATION................................................................. ......... 22
4.1. Factors Affecting Separation................................................................ . 22
ix

4.1.1. Adsorbent-adsorbate Interactions................................................. 22
4.1.2. Surface Structure of the Adsorbent.............................................. 23
4.1.3. Heat of Adsorption........................................................................ 25
4.2. Selectivity............................................................................................... 26
4.3. Selectivity Control................................................................................... 27
4.4. Ideal Adsorbed Solution Theory (IAST)................................................ 28
4.4.1. Solution Strategy …………………………………………………...30
CHAPTER 5. EXPERIMENTAL.............................................................................. . 33
5.1 Materials................................................................................................... 33
5.2 Methods.................................................................................................... 36
5.2.1. Adsorption Studies............................................................................. 36
5.2.2. Calorimetric Studies........................................................................... 37
CHAPTER 6. RESULTS AND DISCUSSION.......................................................... 40
6.1. Adsorption Studies…………………………………………………. 40
6.1.1. Adsorption Isotherms..................................................................... 40
6.1.2. Adsorption Capacities of the Zeolites for CO2 and N2 Adsorption 44
6.1.3. Model Equations………………………………………………… 47
6.1.4. Evaluation of the Energy Distributions………………………… 55
6.2. Calorimetric Studies................................................................................ 60
6.2.1. Calorimetric Peaks of CO2, N2 and Ar on Zeolites......................... 61
6.3 Determination of the Isosteric Heat of Adsorption……………………… 70
CONCLUSION.......................................................................................................... 74
REFERENCES........................................................................................................... 76
APPENDIX………………………………………………………………………… 79
x
LIST OF FIGURES Page
Figure 2.1 Secondary Building Units (SBU's) in zeolites. The corner of the polyhedra represent tetrahedral atoms.......................................... 4
Figure 2.2 The c-axis projection of the structure of clinoptilolite, showing the cation positions in the structure............................................. 6
Figure 2.3 Schematic diagram of clinoptilolite structure ……...................... 8
Figure 2.4 Center occupied by Si+4 or Al+3 atom with four O atoms at the corners........................................................................................... 8
Figure 2.5 Tetrahedron-primary building unit…………………................... 8
Figure 2.6 Structure of Zeolite A................................................................. 9
Figure 2.7 Structure of X and Y synthetic zeolites ………………............... 10
Figure 3.1. The six main types of gas physisorption isotherms….................. 15
Figure 5.1 X-ray diffraction patterns of the washed natural zeolite (NCW).. 35
Figure 5.2 SEM Micrographs of the zeolites…………………….................. 35
Figure 5.3 Photograph of the Microcalorimetry System …………………... 39
Figure 6.1 CO2 Adsorption Isotherms on the used and fresh Adsorbents
at 5 oC (●); 25 oC (○).................................................................... 42
Figure 6.2
N2 Adsorption Isotherms on the zeolites at
5 oC (●); 25 oC (○)…………………………………………….. 43
Figure 6.3
CO2 Adsorption Isotherms on the zeolites at 5 oC (●); 25 oC (○). Points: experimental data, lines: Langmuir Model, dashed lines: Sips Model………………………………………………..
51
Figure 6.4 N2 Adsorption Isotherms on the zeolites at 5 oC (●); 25 oC (○).
Points: experimental data, lines: Langmuir Model, dashed lines: Sips Model………………………………………………………
52
Figure 6.5 Change of Selectivity Ratios with Si/Al at 25oC.......................... 54
Figure 6.6 Adsorption Potential Distributions for CO2 Adsorption
at 5 oC (●); 25 oC (○)……………………………………………. 56
Figure 6.7 Adsorption Potential Distributions for N2 Adsorption at 5 oC (●); 25 oC (○)…………………………………………………………. 57
Figure 6.8 Adsorption Potential Distributions for (A) CO2, (B) N2 Adsorptions at 25 oC.................................................................... 58
Figure 6.9 Characterisitic Energies of the Zeolites for N2 at 250C............... 59
Figure 6.10 Characterisitic Energies of the Zeolites for N2 at 50C………… 59
xi

Figure 6.11
A set of calorimetric peaks obtained for CO2, N2 and Ar adsorptions on the zeolites (C1-6h: 300 mbar dose intervals, others 50 and 300 mbar dose intervals…………………………...
62
Figure 6.12
Differential Heat of Adsorption of CO2 on zeolites ……………. 63
Figure 6.13 Differential Heat of Adsorption of N2 on Zeolites…………….. 66
Figure 6.14 Differential Heat of Adsorption of Ar on Zeolites……………… 68
xii
LIST OF TABLES Page
Table 2.1. Channel Characteristics and Cation Sites in Clinoptilolite………........... 6
Table 3.1. Properties of some adsorbate gases………………………………......... 13
Table 4.1. Previous Studies involving IAS Theory……………………………….. 32
Table 5.1. Adsorbents used in the study…………………………………………… 33
Table 5.2. Adsorption characteristics of the adsorbents studied…………………... 34
Table 6.1. Maximum adsorption capacities of zeolites at 50C and 250C for CO2
Adsorption…………………………………………………………….. 44
Table 6.2. Maximum adsorption capacities of zeolites at 50C and 250C for N2
Adsorption…………………………………………………………….
45
Table 6.3. Previous Studies of N2 and CO2 Adsorption on Zeolites ……………. 46 Table 6.4. Langmuir Parameters of the Zeolites at 50C and 250C for CO2 …….. 47
Table 6.5. Langmuir Parameters of the samples at 5oC and 25oC for N2
Adsorption……………………………………………………………. 48
Table 6.6. Sips Parameters of the Zeolites at 5oC and 25oC for CO2
Adsorption…………………………………………………………..... 49
Table 6.7. Sips Parameters of the Zeolites at 50C and 250C for N2 Adsorption..... 50
Table 6.8. Henry’s Constants for the CO2 and N2 Adsorption at 5°C and 25°C
53
Table 6.9. Selectivity Ratios of CO2 over N2 for the Adsorbents at 5°C and
25°C…………………………………………………………………... 54
Table 6.10. Comparison of the heat of adsorption values of the zeolites at zero
coverage ……………………………………………………………… 69
Table 6.11. Heat of adsorption values of CO2 and N2 on zeolites…………………
72
xiii

CHAPTER 1
INTRODUCTION
Separation is based on the selective adsorption of one or more components of
a feed gas mixture on to a solid adsorbent in order to produce a gas stream which is
enriched in the less strongly adsorbed components, followed by desorption of the
adsorbed components in order to clean the adsorbent for re-use.
The separation and purification of gas mixtures by adsorption has found
numerous commercial applications in the chemical, petrochemical, environmental,
medical and electronic gas industries. These applications can be divided broadly into
the following two categories; (a) the removal of trace or dilute impurities from a
gaseous mixture and (b) the bulk separation of gaseous mixtures. In bulk separation
more than 10 % by weight from a gas stream is adsorbed while in purification process
less than 10 % by weight of a gas stream is adsorbed. Included among the many
possible commercial applications of natural zeolites are gas purification, drying and
bulk separations. The adsorption properties of clinoptilolite and its ion-exchange
derivatives have been investigated for many applications such as natural gas
purification and drying (removal of CO2, H2S, N2 and H2O), air separation (both O2
and N2 production), flue gas cleanup (SO2 removal), and in coal gasification (NH3
removal).
Clinoptilolite is a member of the heulandite group of natural zeolites and it is
the most abundant natural zeolite however remains largely uncommercialized for gas
separation processes due to variation in the purity and composition of the various
mineral deposits. Besides, low cost, ready availability, and versatility of synthetic
zeolites has inhibited the commercialization of natural zeolites.
In literature different methods are stated for purification purposes of natural
zeolites. The most common one is to wash the natural zeolite with deionized water.
Another method is to settle down the heavy impurities due to density difference using
s-tetrabromoethane and acetone mixture (Roberts, 1995). Impurities can be also
removed by heating the natural zeolite in distilled water then dispersing in methyl
iodide (Ackley et al., 1991). Purification process due to acid treatment also increases
the adsorption capacity because it increases the surface area of clinoptilolite and also
the Si/Al ratio due to dealumination. Consequently, electric field on the surface
1

decreases due to removal of polar cations from the surface. This also increases the
hydrophobicity of the surface (Yang, 1987).
In this work, the heats of adsorption and adsorption isotherms of CO2, N2 and
Ar gases on natural zeolites treated with different acid concentrations and on
synthetic zeolites of 13X and 5A were investigated.
From the adsorption data the interaction parameters were determined using
some model equations in order to investigate the change in the energetic
heterogeneity of the zeolites due to dealumination.
Besides, by making use of data obtained from volumetric studies at 5 and
250C, isosteric heat of adsorptions were calculated theoretically and compared with
the data obtained experimentally from calorimetric studies.
2

CHAPTER 2
ZEOLITES
2.1 Definition
Zeolites form a family of minerals, which have been known since 18th
century, but they remained a curiosity for scientists and collectors until 60 years ago,
when their unique physicochemical properties attracted the attention of many
researchers.
Zeolites are porous crystalline aluminosilicates. The zeolite framework
consists of an assemblage of SiO4 and AlO4 tetrahedra, joined together in various
regular arrangements through shared oxygen atoms to form an open crystal lattice
containing pores of molecular dimensions into which molecules can penetrate.
There are more than 50 different available types of aluminosilicate zeolites
with pore openings ranging from less than 5 Å to larger than 10 Å (Webster et al.,
1999). These porous, crystalline, hydrated aluminosilicates of alkali and alkaline
earth cations possess a three dimensional structure. The negative charge created by
the substitution of an AlO4 tetrahedron for a SiO4 tetrahedron is balanced by
exchangeable cations (e.g., Na+, K+, Ca2+, Mg2+), which are located in large structural
channels and cavities throughout the structure. These cations play a very important
role in determining the adsorption and gas-separation properties of zeolites. These
properties depend heavily on the size, charge density, and distribution of cations in
the porous structure. These natural minerals are found with a Si/Al ratio ranging
between 3 and 5 (Zhao et al.,1998).
Synthetic zeolites are manufactured on a large scale for industrial use, but natural
zeolites have not yet found extensive application as commercial molecular sieves,
even though a few, particularly clinoptilolite are abundant in volcanogenic
sedimentary rocks. Of the more than 40 natural zeolites species known today,
clinoptilolite is the most abundant in soils and sediments (Armenta et al., 2001).
3

2.2. Structure
Like most silicates the zeolites are based on TO4 tetrahedra, where T is an
aluminium or silicon atom. The vast 3-dimensional networks are a result of all four
corners for the tetrahedra being shared, producing low density microporous materials.
Zeolite structures can be thought to exist of finite or infinite (chains, layers etc..)
component units.
The finite units which have been found to occur are shown in the figure below
Figure 2.1: Secondary Building Units (SBU's) in zeolites. The corner of the polyhedra
represent tetrahedral atoms.
4

2.3 Clinoptilolite-rich Natural Zeolite
Clinoptilolite is the most common natural zeolite found mainly in sedimentary
rocks of volcanic origin. Such deposits aroused strong commercial interest because
clinoptilolite tuffs are often rather pure and can be mined with simple techniques.
Approximately 25 years ago 300.000 tons of zeolitic tuff was mined per year. In
1997, 3.6 million tons of natural zeolites (mainly clinoptilolite and chabazite) were
worldwide produced. Demand for natural zeolites has increased rapidly over the past
decade, particularly in agricultural applications. Growth rates as high as 10% per year
are forecasted (Galarnau et al., 2001).
Commercially available natural zeolites are usually of the clinoptilolite variety
which are known chemically as hydrated sodium calcium aluminosilicates.
Clinoptilolite’s unique crystalline structure and extraordinary properties are present,
regardless of the particle size. This structure never breaks down under extreme
pressures, requires temperatures that melt glass to break down and it cannot be
chemically changed except under extremely caustic or acid conditions. Degradation
over time is impossible without one of the above conditions being present
( Woldegabriel et al., 1992).
Clinoptilolite is a member of the heulandite group of natural zeolites and has
a similar structure with the zeolite heulandite. The general formula for natural zeolites
is:
(Li, Na, K)a (Mg, Ca, Sr, Ba)d [Al(a+2d)Sin-(a+2d)O2n].mH2O.
The unit cell is monoclinic C-centered and is usually characterized on the basis of 72
Oxygen atoms (n = 36) and m = 24 water molecules with Na+, K+, Ca2+, and Mg2+ as
the most common charge balancing cations.
This 2-D microporous channel system was first characterized for heulandite.
Channels A (10-member ring) and B (8-member ring) are parallel to each other and
the c-axis of the unit cell, while the C channel (8-member ring) lies along the a-axis
intersecting both the A and B channels as shown in Figure 2.3. (Ackley et al., 1992).
Small hydrated cations (Na+, K+, Ca2+, Mg2+) can easily enter the channels of
clinoptilolite and compete for the major exchangeable-cation sites designated as
M(1), M(2), M(3), and M(4). The major cations are located and distributed as
follows;
5

M(1) is located in channel A, where Na>Ca, M(2) is located in channel B, where
Ca>Na, M(3) is located in channel C, where there is only K and M(4) is located in
channel A, where there is only Mg. These properties of clinoptilolite are presented in
table 2.1. The cation positions in the clinoptilolite structure are shown in Figure 2.2.
Table 2.1: Channel Characteristics and Cation Sites in Clinoptilolite
Channel tetrahedral ring
size/channel axis
cation site major cations Approximate
channel
dimensions,nm×nm
A 10/c M(1) Na, Ca 0.72×0.44
B 8/c M(2) Ca, Na 0.47×0.41
C 8/a M(3) K 0.55×0.40
A 10/c M(4) Mg 0.72×0.44
Figure 2.2: The c-axis projection of the structure of clinoptilolite, showing the cation positions in the structure.
6

The composition of the heulandite-clinoptilolite series is characterized by
remarkable changes in the Si/Al ratio as well as in the composition of exchangable
cations. Numerous statistical treatments of published chemical analyses have revealed
clear correlations; as a rule, low silica members are enriched with calcium and often
contain Ba and Sr, whereas high silica species are enriched with potassium, sodium
and magnesium. In literature, high silica clinoptilolite is called simply clinoptilolite,
whereas low silica varieties are known as Ca-clinoptilolite. Such a classification is
closely associated with optical, thermal and other properties of the zeolites.
7

Figure 2.3: Schematic diagram of clinoptilolite structure
Figure 2.4: Center occupied by Si+4 or Al+3 atom with four O atoms at the corners
Figure 2.5: Tetrahedron-primary building unit
8

2.4 Synthetic Zeolites
Zeolite A
The simplest synthetic zeolite is the zeolite A with a molecular ratio of one
silica to one alumina to one sodium cation. The zeolite A synthesis produces precisely
duplicated sodalite units which have 47% open space, ion exchangeable sodium,
water of hydration and electronically charged pores. These properties lead to the
various uses of natural and synthetic zeolites.
The aluminosilicate framework of zeolite A can be described in terms of two
types of polyhedra; one is a simple cubic arrangement of eight tetrahedra and the
other is the truncated octahedron of 24 tetrahedra or β-cage. The aluminosilicate
framework of zeolite A is generated by placing the cubic D4R units (Al4Si4O16) in the
centers of the edges of a cube of edge 12.3A. This arrangement produces truncated
octahedral units centered at the corners of the cube. Each corner of the cube is
occupied by a truncated octahedron (β-cage) enclosing a cavity with a free diameter
of 6.6 A. The center of the unit cell is a large cavity, referred to as the α-cage, occupy
the apices of a truncated cuboctahedron.
Figure 2.6: Structure of Zeolite A
The unit cell of zeolite A contains 24 tetrahedra, 12 AlO4 and 12 SiO4. When
fully hydrated, there are 27 water molecules. The electrostatic valance rule requires
an alternation of the AlO4 and SiO4 tetrahedra, because the Si/Al ratio is 1:1.
Normally, zeolite A is synthesized in the Na-form. Other cationic forms are easily
prepared by ion exchange in aqueous solution (Breck, 1973).
9

Zeolite X and Y
The faujasite-type zeolites all have the same framework structure as indicated
in Figure 2.7. The general composition of the unit cell of faujasite is
(Na2,Ca,Mg)29[Al58Si134O384].240H2O. The SBU’s are double six rings and the FD is
12.7 nm-3. The unit cell contains eight cavities, each of diameter ≈13 A. The three
dimensional channels which run parallel to [110], have 12 ring windows with free
apertures of about 7.4 A. The difference between zeolites X and Y is in their Si/Al
ratios which are 1-1.5 and 1.5-3, respectively (Sing et. al., 1999).
Figure 2.7: Structure of X and Y synthetic zeolites
2.5 Uses and Applications
The family of zeolites containing the heulandite is the most abundant zeolites
found in nature. Zeolites are classified into groups according to common features of
the aluminosilicate framework structures. The properties which are structure related
are;
• High degree of hydration and the behaviour of zeolitic water
• Cation exchange properties
• Uniform molecular-sized channels in the dehydrated crystals
• Adsorption of gases and vapors
• Catalytic properties
• Stability of the crystal structure of many zeolites when dehydrated
The framework structures of the zeolites are composed of assemblages of
tetrahedra in building units which range from simple 4-rings to large polyhedra
(Breck, 1973). Due to its superior structure properties clinoptilolite has many
industrial applications. It’s been been applied to gas and radioactive wastewater
10

cleaning, gas separation, and gas drying and also to separate O2 from air. It’s noted
that natural zeolites, primarily chabazite and clinoptilolite have been used to purify
natural gas contaminated with large amounts of CO2, H2S and H2O (Armenta et al.,
2001).
The discovery of natural zeolites 40 years ago as large, widespread, mineable,
near-monomineralic deposits in tuffaceous sedimentary rocks in the western United
States and other countries opened another chapter in the book of useful industrial
minerals whose exciting surface and structural properties have been exploited in
industrial, agricultural, environmental, and biological technology. Like talc,
diatomite, wollastonite, chrysotile, vermiculite, and bentonite, zeolite minerals
possess attractive adsorption, cation-exchange, dehydration–rehydration, and
catalysis properties, which contribute directly to their use in pozzolanic cement; as
lightweight aggregates; in the drying of acid-gases; in the separation of oxygen from
air; in the removal of NH3 from drinking water and municipal wastewater; in the
extraction of Cs and Sr from nuclear wastes and the mitigation of radioactive fallout;
as dietary supplements to improve animal production; as soil amendments to improve
cation-exchange capacities (CEC) and water sorption capacities; as soilless zeoponic
substrate for greenhouses and space missions; in the deodorization of animal litter,
barns, ash trays, refrigerators, and athletic footwear; in the removal of ammoniacal
nitrogen from saline hemodialysis solutions; and as bactericides, insecticides, and
antacids for people and animals. This multitude of uses of natural zeolites has
prompted ewspapers in Cuba, where large deposits have been discovered, to refer to
zeolites as the magic rock. Included among the many possible commercial
applications of natural zeolites are gas purification, drying and bulk separations
(Ackley et al., 1992).
Due to possessing of different useful properties of natural zeolites, they have very
important uses also in pollution control, the handling and storage of nuclear wastes,
agriculture, and biotechnology. Natural zeolites are also involved by mineral
scientists for greater involvement in the surface, colloidal, and biochemical
investigations that are needed in the future development of zeolite applications
(Mumpton, 1999).
11
CHAPTER 3
ADSORPTION
3.1 Definition
Adsorption occurs whenever a solid surface is exposed to a gas or liquid and it
is defined as the enrichment of material or increase in the density of the fluid in the
vicinity of the interface. The term adsorption may also be used to denote the process
in which adsorptive molecules are transferred to, and accumulate in, the interfacial
layer. Its counterpart desorption, denotes the converse process in which the amount
adsorbed decreases. Based on the nature of the bonding between the adsorbate
molecule and the solid surface, adsorption can be categorized as either physical
adsorption, which doesn’t involve chemical bonding or chemisorption which involves
chemical bonding.
Adsorption is of great importance. The unique advantage of adsorption over
other separation methods is the higher selectivity that can be achieved by adsorbents.
In addition, adsorption phenomena play a vital role in many solid state reactions and
biological mechanisms.
There are many industrial applications of adsorption. The most significant
commercial adsorption-related applications in industry are the purification of acid
natural gas streams, gas drying, ammonia removal from gases, air separation and
deodorization (Ruthven D.M., 1984).
3.2 Adsorbents
In the adsorption process, adsorbent is an additional component, which plays
the crucial role. It is the solid material on which adsorption occurs. Commercially
useful adsorbents can be classified by the nature of their structure (amorphous or
crystalline), by the sizes of their pores (micropores, mesopores, and macropores), by
the nature of their surfaces (polar, nonpolar or intermediate), or by their chemical
composition. All of these characteristics are important in the selection of the best
adsorbent for any particular application (Ruthven D.M., 1984).
Some adsorbents are used on large scale as dessicants, catalysts or catalyst
supports while others are used for the separation of gases, the purification of liquids,
pollution control or for respiratory protection. There are different adsorbents being
12
used in industry such as Active Carbon, silica gel, silicalites, activated clays,
synthetic zeolites, natural zeolites (Clinoptilolite, Erionite, Mordenite), 4A, 5A, 13X
molecular sieves, activated aluminas.
For an adsorption process to be developed on a commercial scale requires the
availability of a suitable adsorbent in tonnage quantities at economic cost. This led to
the fundamental research in adsorption consequently to the development of new
adsorbents. The earlier adsorption processes used either activated carbon or silica gel
adsorbents but the potential of adsorption as a separation process was greatly
enhanced by the development of molecular sieve adsorbents such as natural and
synthetic zeolites.
In this study, clinoptilolite from Gördes region, which is a natural zeolite as
well as 5A and 13X synthetic zeolites were used as the adsorbents. The properties of
these materials are extremely important in order to predict the results, which will be
obtained throughout the experiments. In table 3.1., the properties of the adsorbate
gases used in adsorption processes for the comparison purposes are presented.
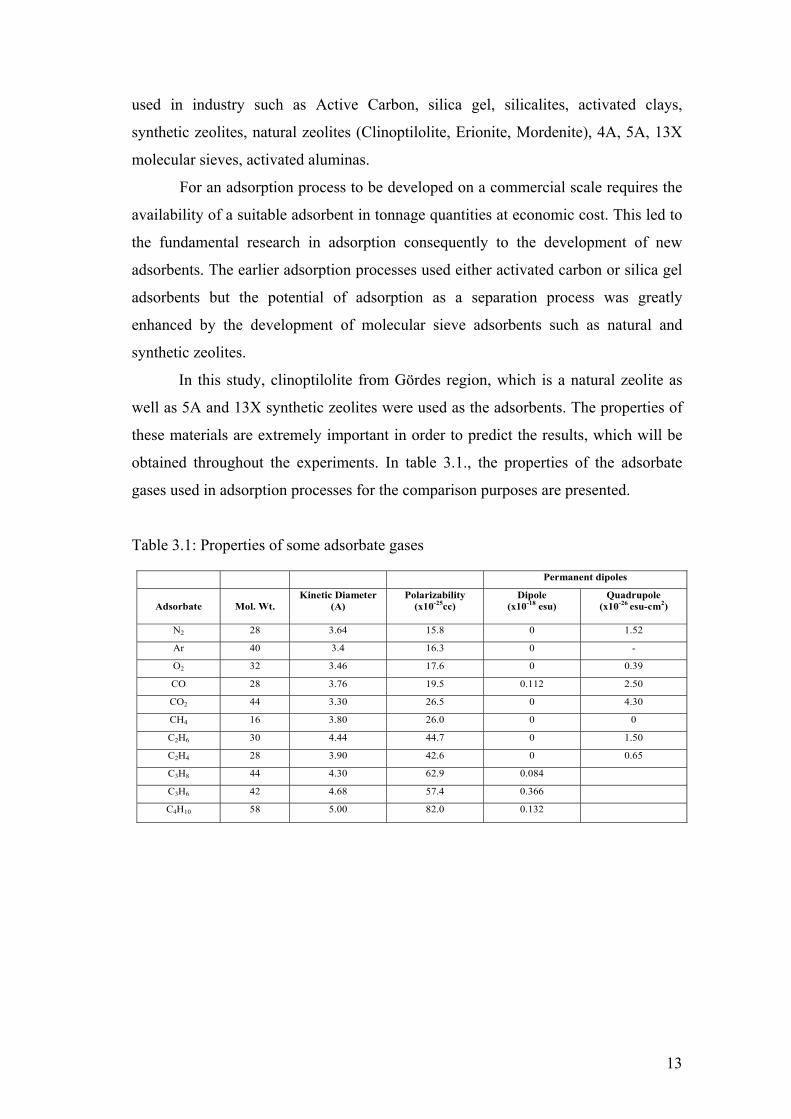
Table 3.1: Properties of some adsorbate gases
Permanent dipoles
Adsorbate
Mol. Wt.
Kinetic Diameter (A)
Polarizability (x10-25cc)
Dipole (x10-18 esu)
Quadrupole (x10-26 esu-cm2)
N2 28 3.64 15.8 0 1.52
Ar 40 3.4 16.3 0 -
O2 32 3.46 17.6 0 0.39
CO 28 3.76 19.5 0.112 2.50
CO2 44 3.30 26.5 0 4.30
CH4 16 3.80 26.0 0 0
C2H6 30 4.44 44.7 0 1.50
C2H4 28 3.90 42.6 0 0.65
C3H8 44 4.30 62.9 0.084
C3H6 42 4.68 57.4 0.366
C4H10 58 5.00 82.0 0.132
13

3.3 Properties of the Adsorbate Gases Used in this Study
Adsorbates used in this study are CO2, N2 , Ar and their properties are given in
Table 3.1.
3.3.1. Carbondioxide
• It has high quadrupole moment meaning that its adsorption isotherm is very
sensitive to the presence of polar groups or ions in the surface of the solid
• CO2 cannot be recommended for routine determinations of specific surface. It’s
hard to desorp CO2 since it is too small, besides possibility of chemisorption is a
complicating factor. On the other hand, it should be particularly suitable for the
study of the polarity of surfaces in systems where chemisorption can be excluded
from consideration.
• Sensitivity to surface polarity causes wide variation in molecular cross-sectional
area values for CO2
• CO2 adsorption at subatmospheric pressures is a useful complementary technique
for the characterization of very narrow micropores and that at higher pressures the
adsorption of CO2 is similar to N2.
• For carbondioxide two effects are shown: (1) a high initial adsorption heat
characteristic of the quadrupole interaction followed by (2) a minimum and a
maximum with increased loading. The increase in isosteric heat is due to
interaction between the adsorbate molecules.
3.3.2. Nitrogen
• N2 molecule is diatomic and it is a non-spherical molecule.
• Quadrupole moment of this molecule leads to localized adsorption on polar sites
and provides a well defined monolayer on most surfaces.
• The adsorption behaviour of N2 on ion exchanged zeolites correlates with the
cation distribution, because the interaction between the quadrupole moment of
nitrogen and the electrostatic field of the cations plays an important role in
adsorption.
• For evaluation of both the surface area and the pore size distribution of a solid
from a single isotherm, nitrogen is the most suitable adsorptive. The use of other
14
adsorptives is not recommended except for the study of the structure of the surface
or as molecular probes for evaluation of micropore size.
3.3.3. Argon
• It’s chemically inert
• Its molecule is symmetrical and monoatomic.
• Although the polarizabilities of Argon and nitrogen are remarkably similar, their
electronic structures are quite different.
• Argon is a possible alternative adsorptive for surface area determination (Sing et
al., 1999.).
3.4 Pure Gas Adsorption Isotherms
Adsorption isotherm is the relationship between the amount of gas adsorbed
and pressure or relative pressure at constant temperature. A useful indication of the
mechanisms of surface coverage and/or pore filling can be obtained by visual
inspection of an isotherm. The overall shape of an isotherm is governed by the nature
of the gas-solid system, the pore structure of the adsorbent and the operational
temperature.
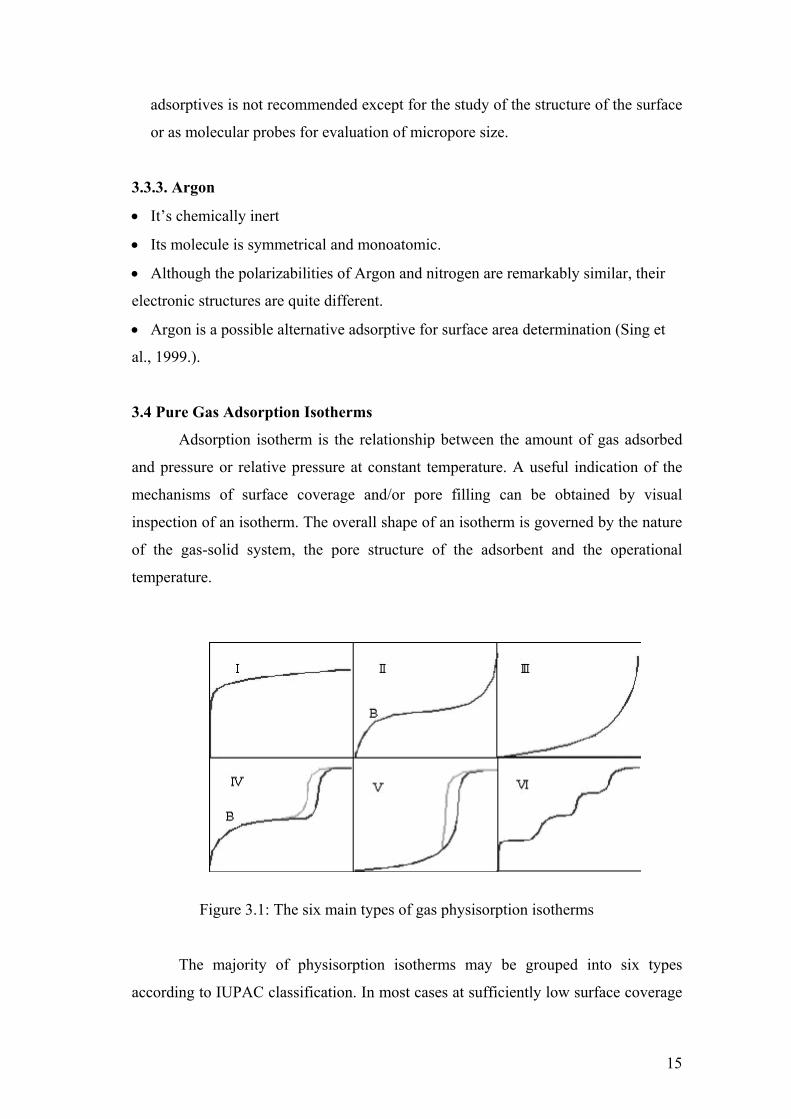
Figure 3.1: The six main types of gas physisorption isotherms
The majority of physisorption isotherms may be grouped into six types
according to IUPAC classification. In most cases at sufficiently low surface coverage
15
the isotherm reduces to a linear form, which is often referred to as Henry’s Law
Region.
The main feature of a Type I isotherm is the long plateau, which is indicative
of a relatively small amount of multilayer adsorption on the open surface. Micropore
filling may take place either in pores of molecular dimensions at very low p/p° or in
wider micropores over a range of higher p/p°.
A type II isotherm is normally associated with monolayer-multilayer
adsorption on an open and stable external surface of a powder, which may be non-
porous, macroporous or even to a limited extent microporous.
Type III isotherms are confined to a few systems in which the overall
adsorbent-adsorbate interactions are weak in comparison with relatively strong
adsorbate-adsorbate interactions. Isotherms of this kind are not common.
Characteristic features of the type IV isotherm are its hysteresis loop, which is
associated with capillary condensation taking place in mesopores, and the limiting
uptake over a range of high p/p°.
The type V isotherm is uncommon; it is related to the type III isotherm in that
the adsorbent-adsorbate interaction is weak but is obtained with certain porous
adsorbents.
The type VI isotherm, in which the sharpness of the steps depends on the
system and the temperature, represents stepwise multilayer adsorption on a uniform
non-porous surface. Among the best examples of type VI isotherms are those
obtained with argon or krypton on graphitized carbon blacks at liquid nitrogen
temperature.
There are some models which help characterizing the adsorbent to see if the
adsorbent has the desired properties for a certain application. The interaction
parameters of these models indicate the extent of heterogeneity of the adsorbent being
investigated. In this study, the interaction parameters of the acid treated natural
zeolites have been determined by using the models stated in this chapter.
3.4.1. Langmuir Model
The simplest theoretical model for monolayer adsorption is due to the
Langmuir model. The basic assumptions on which the model is based on are as
follows;
1. Molecules are adsorbed at a fixed number of well-defined localized sites.
16
2. Each site can hold one adsorbate molecule.
3. All sites are energetically equal.
4. There is no interaction between molecules adsorbed on neighbouring sites.
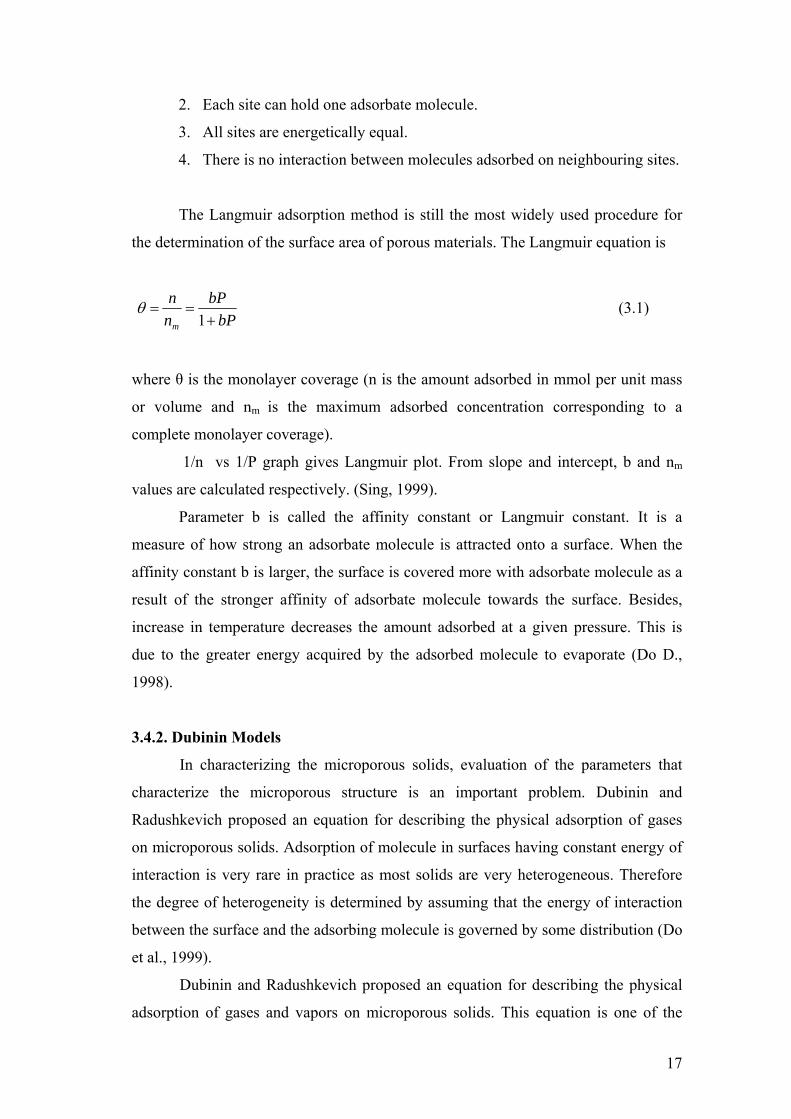
The Langmuir adsorption method is still the most widely used procedure for
the determination of the surface area of porous materials. The Langmuir equation is
bP
bPnn
m +==
1θ (3.1)
where θ is the monolayer coverage (n is the amount adsorbed in mmol per unit mass
or volume and nm is the maximum adsorbed concentration corresponding to a
complete monolayer coverage).
1/n vs 1/P graph gives Langmuir plot. From slope and intercept, b and nm
values are calculated respectively. (Sing, 1999).
Parameter b is called the affinity constant or Langmuir constant. It is a
measure of how strong an adsorbate molecule is attracted onto a surface. When the
affinity constant b is larger, the surface is covered more with adsorbate molecule as a
result of the stronger affinity of adsorbate molecule towards the surface. Besides,
increase in temperature decreases the amount adsorbed at a given pressure. This is
due to the greater energy acquired by the adsorbed molecule to evaporate (Do D.,
1998).
3.4.2. Dubinin Models
In characterizing the microporous solids, evaluation of the parameters that
characterize the microporous structure is an important problem. Dubinin and
Radushkevich proposed an equation for describing the physical adsorption of gases
on microporous solids. Adsorption of molecule in surfaces having constant energy of
interaction is very rare in practice as most solids are very heterogeneous. Therefore
the degree of heterogeneity is determined by assuming that the energy of interaction
between the surface and the adsorbing molecule is governed by some distribution (Do
et al., 1999).
Dubinin and Radushkevich proposed an equation for describing the physical
adsorption of gases and vapors on microporous solids. This equation is one of the
17

most popular isotherm equations in adsorption theory, and has been widely used to
describe the experimental data of adsorption of gases on microporous adsorbents.
Several workers postulated that the DR equation applies only to solids with a uniform
structure of micropores (Gil et al., 1996).
Dubinin Radushkevitch is expressed as;
θ =V/V0= exp[-(B(T/β)n logn(P0 /P)] (3.2)
where θ is the relative adsorption, which is defined as the ratio of the amount
adsorbed in the micropores (V) to the maximum micropore adsorption capacity (V0).
In this equation B is termed the structural constant and β is termed the convergence
coefficient of the characteristic curves (Gil et al., 1996).
Various possible equations have been proposed for adsorbents with a
nonhomogeneous micropore structure. One of them is Dubinin Astakhov equation.
This equation has been used to describe the energetic heterogeneity of the solids. DA
expression can be applied to the description of the adsorption on structurally
heterogeneous solids
Dubinin Astokhov equation is expressed as;
θ =V/V0= exp[-(A/E) n ] (3.3)
In this equation E denotes characteristic energy and A is the adsorption
potential. In these equations the term n has been referred to as a “heterogeneity
factor” and it has been suggested that it is related in some way to the heterogeneity of
the surface (Nick et al., 1996). Dubinin Astakhov expression can be applied to the
description of the adsorption on structurally heterogeneous solids while For this
equation the exponent n is usually taken as 2 while for Dubinin Astakhov equation n
is generally taken 3 for microporous adsorbents (Gil et al. 1996).
18

3.4.3. Emprical Isotherm Equations
Many different equations have been applied to physisorption isotherms on
microporous adsorbents. The first and best known emprical equation was proposed by
Freundlich in the form
mkpn /1= (3.4)
where k and m are constants (m>1). According to Freundlich equation the plot of ln
[n] against ln [p] should be linear. In general, adsorbents give isotherms which obey
the Freundlich equation in the middle range of pressure, but the agreement is usually
poor at high pressures and low temperatures. These limitations are due to the fact that
the Freundlich isotherm does not give a limiting value of n as ∞→p
Another emprical variant is Toth equation,
( ) mmm pbpnn /1/
+= (3.5)
which also contains three adjustable parameters (nm, b and m) but has the
advantage that it appears to give the correct limits for both and 0→p ∞→p .
Therefore Toth equation gives a more extensive range of fit when applied to type I
isotherms (Do, 1999).
Another model applied to represent the experimental data is the Sips model.
( )
( ) t
t
bP
bPnn
m1
1
1+= (3.6)
The difference between this equation and the Langmuir equation is the
additional parameter “t”. If this parameter is unity, Sips equation is reduced to
Langmuir equation which can be applied for ideal surfaces. Hence the parameter t
could be regarded as the parameter characterizing the system heterogeneity. The
system heterogeneity could be result of the solid or the adsorbate or a combination of
19

both. The parameter t is usually greater than unity, and therefore the larger is this
parameter the more heterogeneous is the system.
Virial Model provides a general method of analyzing the low coverage region
of an adsorption isotherm and its application is not restricted to particular
mechanisms or systems.
( )2321exp nCnCCnp ++= (3.7)
where the coefficients (C1, C2, C3) are characteristic constants for a given gas-solid
system and temperature. The linear form of the equation is:
...ln 2321 +++=⎟
⎠⎞
⎜⎝⎛ nKnKK
Pn (3.8)
Thus the intercept of the virial plot of ln (n/p) versus n, it is possible to obtain
Henry’s constant, kH, since
)/(lim0
pnkpH →
= (3.9)
Therefore, K1 is directly related to kH and to the gas-solid interaction (Sing K.,
1999).
Henry’s constants determined from the Virial plot of ln (p/n) vs n are also
presented and they indicate the the interaction parameter of the gas molecule with the
adsorbent surface . It is stated in literature that at low surface coverage, adsorption
isotherm of a pure gas on a homogeneous adsorbent reduces to Henry’s Law and is a
function of pressure in the very low pressure (Cao et al., 2001).
3.4.4. Henry’s Law
The simplest interpretation of the behavior of the adsorbed phase is to suppose
that, at very low surface excess concentration, the adsorbate molecules are
independent of each other. By assuming that the dilute adsorbed phase behaves as a
two-dimensional ideal gas, regardless of the nature of the adsorption, the final
Henry’s equation can be expressed as;
20
pkn h= (3.10)
where n is used to represent the specific surface excess amount and is generally
known as the Henry’s Law constant. Thus, at sufficiently high temperatures and
sufficiently low pressures, n, should vary linearly with the equilibrium gas pressure.
(Sing,1999).
hk
By making use of the pure gas data obtained from experimental studies and
the single gas models appropriate for these data which have been stated in this
chapter, mixed gas data can be predicted. Correlations for mixed-gas adsorption are
important to the design of adsorptive gas separation processes. They should be
capable of predicting the equilibrium amount adsorbed from pure gas isotherms for
each constituent in the mixture, within given ranges of operating temperature and
total pressure.
The measurement of mixed gas adsorption is not very difficult but it is rather
long. With the additional measurement of equilibrium gas phase composition, nearly
all experimental techniques used for measuring single gas isotherms can be used for
mixed gas adsorption. For example the Langmuir isotherm for single gas adsorption
can readily be extended to an n-component mixture, and the surface coverage of
species i for an n-component mixture is given as: θi = BiPi/1+ΣBjPj where j is from 1
to n.
Several studies have been published which proposes methods for predicting
multicomponent adsorption equilibria utilizing parameters from an emprical isotherm
equation such as the Langmuir, Freundlich equations, etc. that characterize single
component adsorption equilibria and comparisons with other methods such as IAST,
Polanyi Dubinin theory. The prediction of multicomponent adsorption equilibria from
single component data is one of the most challenging and important problems in
adsorption.
Ideal adsorbed solution theory (IAST) is being used extensively o predict
binary gas mixture systems by making use of the single gas adsorption data. IAST is a
very popular and thermodynamically consistent predictive method. IAST uses an
isotherm equation such as Langmuir, to represent the single component isotherms
(Yang, 1987).
21

CHAPTER 4
GAS SEPARATION
4.1. Factors Affecting Separation
There are several factors affecting separation of the gas mixtures. Those
factors have to be taken into consideration when dealing with the adsorption
processes.
4.1.1. Adsorbent and Adsorbate Interactions
The total potential energy of adsorption interaction may be subdivided into
parts representing contributions of the different types of interactions between
adsorbed molecules and adsorbents. The total energy φtotal is the sum of contributions
resulting from dispersion energy φD, close-range repulsion φR, polarization energy φP
field-dipole interaction φF-µ, field gradient-quadrupole interaction φδ F-Q, and
adsorbate-adsorbate interactions, denoted self potential φSP;
φ total = φD + φR + φP + φ F-µ + φδ F-Q +φ SP (4.1)
The φD and φR terms always contribute, regardless of the specific electric
charge distributions in the adsorbate molecules, which is why they are called
nonspecific. The third nonspecific φP term also always contributes whether or not the
adsorbate molecules have permanent dipoles or quadrupoles; however for adsorbent
surfaces which are relatively nonpolar, the polarization energy φP is small.
The φ F-µ + φδ F-Q terms are specific contributions, which are significant when
adsorbate molecules possess permanent dipole and quadrupole moments. In the
absence of these moments, these terms are zero, as is true also if the adsorbent surface
has no electric fields, a completely nonpolar adsorbent.
Finally, the φSP is the contribution resulting from interactions between
adsorbate molecules. At low coverages of the adsorbent by adsorbate molecules, this
contribution approaches zero, and at high coverage it often causes a noticeable
increase in the heat of adsorption.
22

These contributions to the potential energy of adsorption are present even if
the adsorbed molecules are nonpolar and even if the adsorbent structure contains no
strong electrostatic field. The contribution φP is due to the polarization of the
molecules by electric fields on the adsorbent surface such as electric fields between
positively charged cations and the negatively charged framework of a zeolite
adsorbent. The attractive interaction between the induced dipole and the electric field
is called the polarization contribution (Ruthven, 1984).
4.1.2. Surface structure of the adsorbent
In the crystalline adsorbents such as zeolites and microporous aluminum
phosphates, the dimensions of the micropores are determined by the crystal
framework and there is therefore virtually no distribution of pore size. The crystals of
these materials are generally quite small (1-5 µm) and they are aggregated with a
suitable binder and formed into macroporous particles having dimensions large
enough to pack directly into an adsorber vessel. Such materials therefore have a well
defined bimodal pore size distribution with the intracrystalline micropores linked
together through a network of macropores having a diameter of the same order as the
crystal size (Ruthven, 1984).
Surface structure of natural zeolites is usually heterogeneous which means that it
consists of a finite number of different kinds of adsorption sites and due to
heterogeneity of the surface of natural zeolites, there occur different gas selectivities
on different parts of the surface, which cause deviations in model predictions
(Karacan et al., 1999).
Dealumination
Zeolites can be dealuminated using different procedures such as extraction
with EDTA, high temperature steaming, reaction with SiCl4, or substitution with
(NH4)2 SiF6. These procedures can be followed by acid leaching to remove the
nonframework aluminum (Solinas et al., 1998). Acid washing of small pore natural
zeolites may remove impurities that block the pores, progressively eliminate cations
and finally dealuminate the structure as the strength and duration of the treatment
increases. In clinoptilolite, acid treatment can increase both porosity and adsorption
capacity, improve adsorption of acid gases and extend adsorbent life (Ackley, 2002).
23

Hydrophilic and Hydrophobic Surfaces
The key physical property of every adsorbent is the surface hydrophobicity
(Sakut M., 1998). Adsorbents which have a polar surface and therefore adsorb highly
polar molecules such as H2O are called hydophilic. In contrast, on a nonpolar surface
where there is no electrostatic interaction usually adsorb nonpolar molecules and
water is held only very weakly on the surface of the adsorbent which are termed
hydrophobic (Ruthven, Adsorption, Gas separation). In zeolitic adsorbent
hydrophobicity can be varied by changing the Silicon to Aluminum ratio. For
example the surface of zeolites usually exhibits polar and nonpolar adsorption
behavior depending on the degree of dealumination. Highly dealuminated zeolites
preferably adsorb nonpolar compounds from mixtures of adsorptives with different
polarities (Sakut et al., 1998). Adsorption systems include a large variety of polar
and nonpolar adsorbates of different molecular sizes that are adsorbed on various
microporous homogeneous and heterogeneous adsorbents of practical interest (Rao,
1999).
Cationic density (Si/Al ratio) of the adsorbent
Different cationic forms of a given zeolite may lead to significant differences
in the selective adsorption of a given gas, due to both the location and size of the
interchangeable cations which affect the local electrostatic field, and polarization of
the adsorbates. The relative adsorption capacities of natural zeolites over the entire
equilibrium pressure range are related to two factors which are;
- the number of cations available per unit mass of the dehydrated zeolites (cationic
density)
- the limiting volume of the micropore (Hernandez et al., 1998).
When the Si/Al ratio is increased which means that when the zeolite is
dealuminated, the electrostatic field on the surface is decreased (Tsutsumi et al.,
1992). With progressive dealumination the electrostatic field inside the zeolite cages
decreases and the surface becomes more hydrophobic. Therefore the strong polar
attraction energies between the surface and molecule are reduced and weaker
dispersion forces become dominant. On the other hand, on the aluminum rich zeolite
the nature of the interactions between surface and adsorptive are always polar what
24
results in a steep slope of the isotherm at low partial pressures. Also with decreasing
aluminum content the surface hydrophobicity increases and the adsorption
equilibrium becomes more ideal and the zeolite surface becomes more homogeneous,
so that real molecule-surface interactions are reduced (Sakuth et al., 1998).
4.1.3. Heat of adsorption
The surface properties of a solid are of primary importance in governing the
energetics of the adsorption, reaction and desorption steps, which represent the core
of a catalytic process. These properties can be conveniently investigated by studying
the adsorption of suitably chosen probe molecules on the solid. Adsorption occurs at
the interface between a fluid phase and a solid. The process is originated by the
presence on the surface of coordinately unsaturated species able to interact with
molecules from the gas phase, whose concentration at the interface results increased
in comparison with that in the bulk gas phase. According to the relationship:
∆ GAds = ∆ HAds – T ∆SAds (4.2)
where adsorption is generally exothermic, ∆H<0, as it occurs spontaneously (∆G<0)
and leads to a more ordered state (∆S<0).
The heat evolved is called the heat of adsorption and can be determined in two
ways: either by calculating the isosteric heats from adsorption isotherms, measured at
two different temperatures, or by measuring the heat of adsorption directly with the
aid of a calorimeter maintained at a chosen temperature (Auroux, 1997). Heat of
adsorption is related to the energy of bonds formed and thus represents a measure of
the strength of the interaction. In order to detect energetic heterogeneity of the
surface, small doses of probe molecules have to be admitted successively on the solid,
in order to saturate the active sites progressively. Recently, microcalorimetry has
gained importance as one of the most reliable methods for the study of gas-solid
interactions. Most commonly used are heat flow microcalorimeters of the Tian-Calvet
type (Solinas et al., 1998).
25
4.2. Selectivity
Selectivity is the relative adsorption of components which is expressed as;
Selectivity1,2 = (x/y)1/(x/y)2 (4.3)
It is the ratio of the mole fractions in the pore divided by the mole fractions in
the bulk. Selectivity in a physical adsorption system may depend on differences in
either equilibrium or kinetics, but the great majority of adsorption separation
processes depend on equilibrium based selectivity.
When selectivity values are greater than 1, it is much easier for the gases to be
separated. Therefore the adsorbents should be chosen appropriately so that
seperations become easier (Clarkson et al., 1999).
For a given adsorbent, the relative strength of adsorption of different
adsorbate molecules depends on the relative magnitudes of the polarizability α,
dipole moment µ, and quadrupole moment Q of each. Often, just the consideration of
the values of α, µ and Q allows accurate qualitative predictions to be made of the
relative strengths of adsorption of given molecules on an adsorbent or of the best
adsorbent type (polar or nonpolar) for a particular separation. For example, the
strength of the electric field F and the field gradient of the highly polar cationic
zeolites is strong. For this reason, nitrogen is more strongly adsorbed than is oxygen
on such adsorbents, primarily because of the stronger quadrupole of N2 compared to
O2. In contrast, nonpolar activated carbon adsorbents lack strong electric fields and
field gradients. Such adsorbents adsorb O2 slightly more strongly than N2, because of
the slightly higher polarizability of O2. Relative selectivities on nonpolar adsorbents
often parallel to the relative volatilities of the same compounds. Compounds with
higher boiling points are more strongly adsorbed. In this case the higher boiling O2 is
more strongly adsorbed than is N2.
For a given adsorbate molecule, the relative strength of adsorption on different
adsorbents depends largely on the relative polarizability and electric field strengths of
adsorbent surfaces. For example water molecules, with relatively low polarizability
but a strong dipole and moderately strong quadrupole moment, are strongly adsorbed
by polar adsorbents (eg. cationic zeolites), but only weakly adsorbed by nonpolar
adsorbents (Ruthven D.M., 1984).
26
Besides, the size, dipole and/or quadrupole moments and polarizability of
molecules often point to the most appropriate mechanism for the separation in polar
zeolites, i.e. equilibrium, kinetic and steric. Equilibrium and kinetic separations are
based upon the differences in capacity and diffusion rates, respectively, while steric
separation results from the exclusion of one or more of the gases in the mixture from
the zeolite pores (Ackley, 2002).
4.3. Selectivity Control
In zeolites, the specificity or selectivity shown toward particular adsorbate
molecules may be modified by methods which alter energy of interaction terms. This
can be done by adjusting the balance between electrostatic and Van der Waals forces.
Structural differences resulting from Si/Al ratio or from the method of
dehydration and cation exchange can be utilized to exclude molecules from the
zeolite framework, hinder diffusion, alter pore volume and change the adsorbate
equilibrium capacity. The cation type, size, charge density, location and the extent to
which it is exposed to the adsorbate molecules have a strong effect upon both
adsorption capacity and selectivity. Clearly, modifications and the resulting induced
structural/chemical changes greatly extend the gas separation potential of natural
zeolites (Ackley, 2002).
The chemical nature of the surface and pore size can be changed by using the
below stated methods:
• Preloading: By introducing small amounts of a polar adsorbate (such as water),
which selectively locates on the most energetic sites and is adsorbed strongly
enough that it may not be displaced by another less selective adsorbate molecule.
• Cation exchange: Affects the local electric field as well as adsorbate polarization.
• Decationization: Complete removal of the cations from the zeolite framework
alters the local electric fields and field gradients and consequently reduces any
interaction with a molecule with a permanent electric moment.
• Purification: By the removal of impurities from the adsorbent, the pores and the
surface area of the natural zeolite are enlarged, hence this indeed does effect the
selectivity (Breck, 1973).
27

4.4. Ideal Adsorbed Solution Theory (IAST)
IAST (Myers and Prausnitz, 1965) is an important method for the prediction
of multicomponent gas adsorption, where the adsorbed phase is treated as ideal
(Mathias et al., 1996). The IAS theory is a very popular and thermodynamically
consistent predictive method.
It’s necessary at the outset to have a specific system to which the IAST
equations apply. This poses an immediate problem because the interfacial region is ill
defined. This difficulty is circumvented by a trick devised by J. Willard Gibbs. The
gas phase does not extend unchanged all the way to the solid surface. In the
neighborhood of the solid, the gas phase properties change, but they do not change
abruptly. There is a region of change, and although the gradients in the properties
with distance from the surface may be large, they are not infinite. Therefore the extent
of the interfacial region nor the exact distance into the gas phase that the solid makes
its influence felt cannot be known. Therefore the real situation is replaced with a
hypothetical one which is the gas phase persists unchanged up to the solid surface.
Besides, the adsorbed phase is treated as a two dimensional phase with its own
thermodynamic properties (Ness et al., 1969).
After Gibbs visualized the adsorbed phase as a two-dimensional film of
condensed molecules on a solid surface, two dimensional, intensive variables
(spreading pressure π and surface area A) have been introduced (Sakuth et.al., 1998).
The spreading pressure may be pictured as the force acting between adsorbate
molecules parallel to the surface. While there is no direct technique available for the
measurement of the spreading pressure, it can be calculated from the change of other
measurable properties (Talu et al., 1987). This idea allows applying the general
concepts of phase equilibrium thermodynamics to adsorption equilibria (Sakuth et al.,
1998).
When one uses the equilibrium criterion that the chemical potential in the
adsorbed phase is equal to the chemical potential in the gas phase, the equation for
mixed gas adsorption equilibrium at constant temperature is given by;
io
ii xPPy γπ )(= (4.4)
28

where γ is the activity coefficient, yi the mole fraction of component i in the gas phase
and the mole fraction of the same component in the adsorbed phase. P is the total
gas pressure and is the equilibrium gas phase pressure corresponding to the
solution temperature and solution spreading pressure for the adsorption of pure
component i. In the case of ideal solution, the activity coefficient is equal to unity for
all values of temperature (T), spreading pressure (π) and adsorbed phase mole
fraction of component i (x
ix
)(0 πiP
i) . In this case equation (1) reduces to
io
ii xPPy )(π= (4.5)
The theory assumes that the adsorbed phase is an ideal solution of the
adsorbed components and the reduced spreading pressure (π*) of all the components
in the mixture in their standard states is equal to the reduced spreading pressure of the
adorbed mixture (π*). Thus,
π1*= π2
*= π3*= π4
*=……. = πn*= π*. (4.6)
The reduced spreading pressure of each component is computed from Gibb’s
adsorption isotherm as follows;
∫==∗0
0
iP
ii
iii dP
Pn
RTππ (4.7)
Where is the partial pressure of the single component i in its standard
state. is the adsorption isotherm, which in the present case is the Langmuir
equation.
0iP
( )ii Pn
The total adsorbed amount of the gas is calculated from as follows: Tn ix
∑=
=N
i i
i
T nx
n 10
1 (4.8)
29

where is the amount adsorbed in the standard state calculated from an isotherm at
the pressure . The actual amount of each component is, therefore,
0in
0iP
iTi xnn = (4.9)
The above six equations provide the necessary framewok for IAS mixed
adsorbate predictions. The solution strategy is facilitated by first obtaining as an
analytical function of .
0iP
*π
4.4.1. Solution Strategy
Step
# Action
1 1a. First the input parameters are supplied: the parameters for the single component isotherm, the total gaseous pressure and the mole fractions in the gas phase
2 2a. the reduced spreading pressure as the molar average of the following integral is estimated
∑ ∫=
==N
J
P
jj
µjjg dP
PC
yTRAz1 0
/π
Total pressure is used as the upper limit of the integral 2b. The RHS of the above equation can be evaluated because all variables (y,P, and the single component isotherm equations) are known. If the pure component isotherm can be approximated by a Langmuir equation, then the initial estimate of the spreading pressure can be taken as:
⎟⎠
⎞⎜⎝
⎛+= ∑
=
M
iiis PbCz
11lnµ
where can be taken as the average of the maximum adsorbed concentration of all species.
sCµ
3 3a. Knowing the estimated reduced spreading pressure from step 2, pure component pressure that gives that reduced pressure using the below equation is evaluated.
0jP
30

∫ ∫∫ ====02
01
01
0 02
2
2
01
1
1 ....P P
NN
NP
y
N
dPP
CdP
PC
dPP
CTR
A µµµπ
then the amount adsorbed is evaluated for the single component from the single component isotherm at that hypothetical 0
jP
3b. Next ( ))(kzF and ( )( )kzF ′ are calculated from the below equations
( ))(kzF = ( )( )∑=
−N
jk
j
j
zPPy
10 1
( ))(kzF = ( )[ ]( )
( ) ( )[ ]zz
N
j jj
j
zz
N
j
j
j
j
CzPPy
dzzdP
zP
Py
k ==
== ⎥
⎥⎦
⎤
⎢⎢⎣
⎡−=
⎥⎥⎦
⎤
⎢⎢⎣
⎡− ∑∑
100
1
0
20µ
and thence the reduced spreading pressure for the next iteration step can be calculated from the below equation.
( ) ( )( )( )( )( )k
kk
zFzFkzz′
−=+1
4 Step 3 is continued until the method converges.
Ideal adsorbed solution theory is being used by many authors in order to
predict binary gas adsorption of gases from pure gas adsorption data and these are
given in Table 4.1.
31

Table 4.1: Previous Studies Involving IAS Theory
Author and date Gas pair
Adsorbent
Predictive model
Selectivity
Alan L. Myers et al (1973)
N2/O2 CO2/O2 CO2/N2
5A and 10X molecular
sieves
IAST
CO2 over O2 CO2 over N2
Orrin K.Crosser et al (1980)
CO2/ C3H8 CO2 /C3H6
5A molecular sieves
IAST
CO2 over C3H8 CO2 over C3H6
John T. Nolan et al (1981)
O2/CO N2/CO
10X molecular sieves
Orhan Talu et al (1986)
CO2/H2S. C3H8/CO2 C3H8/H2S
H-Mordenite
SPD IAST RAST
Robert W Triebe et al 1995
CO/N2
Turkish Clinoptilolite
IAST VSM
Extended Langmuir
CO over N2
Paul M. Mathias et al (1996)
N2/O2
5A molecular sieves
IAST HIAST
N2 over O2
Orhan Talu et la (1996)
N2/O2
5A zeolite IAST N2 over O2
M.Sakuth et al (1998)
Toluene/1-propanol
Y-zeolite IAST PRAST
Toluene
C.Özgen Karacan et al(1999)
CO2 /CH4
Coal IAST CO2 over CH4
C.R.Clarkson et al (1999)
CO2/ CH4
Coal IAST CO2 over CH4
P.Kluson et al (2000)
CH4/N2
Graphitic adsorbents
IAST CH4 over N2
Salil U. Rege et al (2001) CO2/H2O
NaX γ-alumina
Doong Yang IAST RAST
CO2 over H2O
Shizhang Quiao et al (2002)
C2H6/C3H8
Ajax activated carbon
MPSD-IAST MPSD-
Ext.Lang
As can be seen from Table 4.1, many scientists have been used IAST in order
to predict binary gas adsorption.
32

CHAPTER 5
EXPERIMENTAL
5.1. Materials
In this study, the materials used as adsorbents were acid treated clinoptilolite-
rich natural zeolite tuff and synthetic zeolites of 5A and 13X. The natural zeolite tuff
obtained from Gördes-Fındıcak (Manisa, Turkey) region in 3 m depth from the
surface was crushed and sieved to the particle size range of 850-2000µm. Then it was
washed with distilled water for 2 hours at 600C to remove the soluble salts. From
XRD patterns shown in Figures 5.1 and 5.2 it was determined that the major phase of
the washed zeolite (NCW) was clinoptilolite-heulandite with impurities such as
quartz and cristoballite. The clinoptilolite-rich heulandite-clinoptilolite zeolites were
treated with HCl, HNO3 and H2SO4 to prepare the adsorbents. According to the
chemical composition of the washed zeolite measured by using ICP is as follows; for
wt % of oxides of Al2O3, SiO2, MgO, Na2O, K2O, CaO, Fe2O3 and H2O are 14.1,
64.2, 1.8, 1.7, 5.3, 1.0, 1.8 and 10.3 respectively.
The code of the adsorbents and their treatment time and temperature are
presented in Table 5.1.
Table 5.1: Adsorbents used in the study
Zeolite Code Definition Treatment Time and Temperature
NCW Natural zeolite tuff washed with distilled water 2 hours at 600C
C1-6h Treated with 1 M HCl Solution 3 hours at 600C
C3-3h Treated with 3 M HCl Solution 3 hours at 600C
C5-6h Treated with 5 M HCl Solution 6 hours at 600C
P1 Treated with 1.1 M H3PO4 Solution 6 hours at 600C
N2 Treated with 2 M HNO3 Solution 6 hours at 600C
5A Synthetic zeolite-Aldrich (Lot # 04224HA) No treatment was applied
13X Synthetic zeolite-Aldrich (Lot # 04603BR) No treatment was applied
33
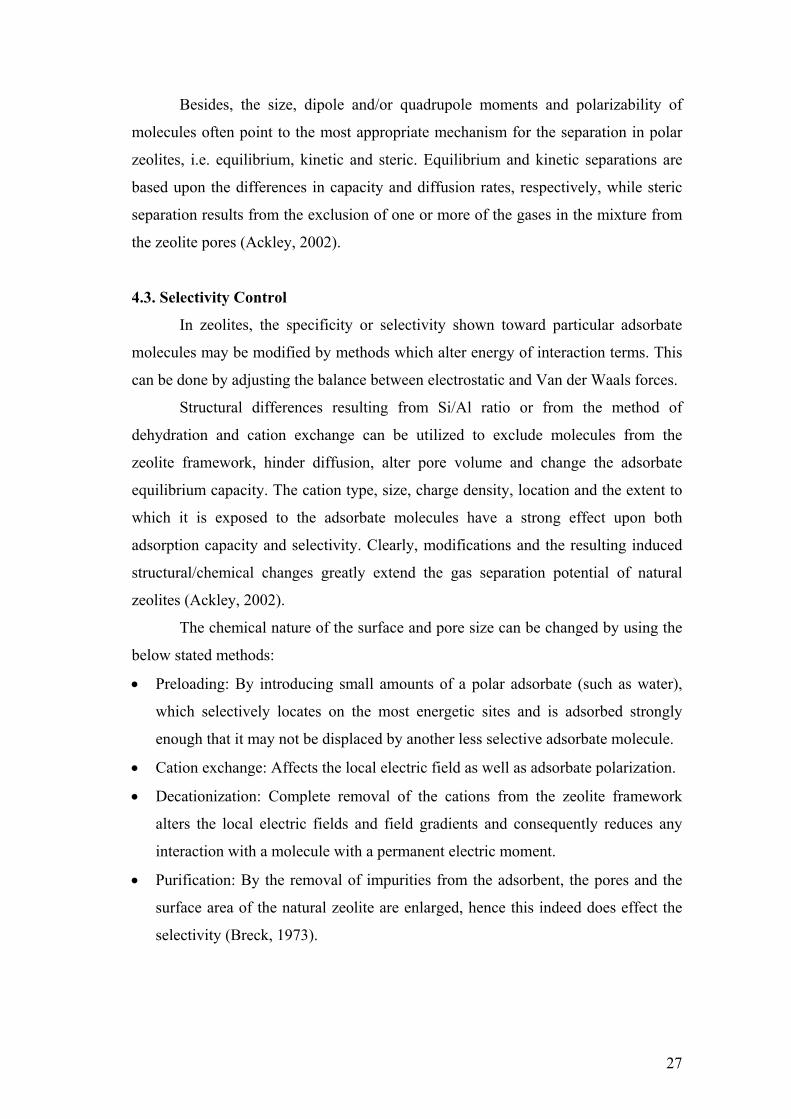
Adsorption characteristics of the zeolites were obtained by using the N2
adsorption at 77 K. The results are given in Table 5.2.
Table 5.2: Adsorption characteristics of the some of the adsorbents studied at 77K
(Becer, 2003)
NCW C1-6h C5-6h C3-3h N2 P1
Vmica 0.005 0.029 0.063 0.056 0.068 0.04
Aexta 3.08 6.2 25.8 17.2 22.5 6.5
nb 1.00 1.60 1.61 2.26 2.63 1.88
Eb 11.05 19.31 21.63 20.98 25.42 25.23
Vlim/Vmaxc 0.77 0.9 0.87 0.89 0.86 0.86
rd 11.3 6.7 6.3 6.5 6.0 5.8
Si/Al 4.04 5.25 8.4 6.08 6.18 5.01
a Vmic, micropore volume (cm³/g) and Aext, external surface area (m²/g) calculated from t-plot
b Vlim, limiting micropore volume (cm³/g), n, exponential constant, E, characteristic energy
(kJ/mol) calculated from Dubinin-Astakhov (P/P0 =0,0001-0,1)
c Vmax, maximum amount adsorbed at relative pressure P/P0 of 0,89
d rd, Hovarth-Kowazoe median pore diameter
As can be seen from Table 5.2, the Si/Al ratio was increased by the acid
treatment. As a result of the acid treatment, not only the aluminum but also the
charge-balancing cations were removed from the zeolite tuff. The removal of the
aluminum and the cations decreased the energetic heterogeneity of the adsorbents
(increasing “n” value). Besides, wide pore size distribution with low pore size
diameter was obtained. In fact, the micropore structure of the zeolites was improved
due to the increase of the accessible volume for N2 and the external surface area, Aext.
34

0
50
100
150
200
250
300
350
400
5 10 15 20 25 30 35 4
2 Theta
NCW
0
cristoballite
Quartz
Quartz
Figure 5.1. X-ray diffraction patterns of the washed natural zeolite (NCW)
C3-3h P1 NCW
5A zeolites 13X zeolites
Figure 5.2. SEM Micrographs of the zeolites
35

The SEM micrographs (Figure 5.2) clearly show that there are impurities
present on the washed natural zeolite. The impurities are also detected by XRD
analysis (Figure 5.1) and it was determined that impurities in the natural zeolite tuff
were quartz and cristoballite.
When the SEM micrographs of 5A and 13X are compared, on a 10µm scale,
the crystal size of 5A zeolites which are about 3.5 µm are greater than that of 13X
zeolites which are approximately 2 µm (Figure 5.2).
Adsorbates
There are several parameters affecting the adsorption phenomenon, hence
being reflected on the heat of adsorption in microcalorimetry studies. In fact, the size
and the strength of the probe molecule and the temperature at which the adsorption
takes place are important parameters and have to be carefully considered when
performing adsorption studies.
In this study, CO2, N2 and Ar adsorbates were used. These molecules were
chosen because they cover a fairly good range of molecular weights, molar volumes
and polarizabilities. The properties of the adsorbate gases used in this study namely,
CO2, N2 and Ar were given in Table 3.1. Also, the adsorption of these molecules
provides a powerful tool for characterizing zeolites, by probing the cations and
providing information on their nature and accessibility.
5.2. Methods
The adsorption isotherms of CO2, N2 and Ar gases on the acid treated natural
and synthetic zeolites have been obtained through volumetric adsorption device.
Furthermore, in order to be able to detect the surface heterogeneity of the adsorbents
and the interaction taking place among the adsorbent-adsorbate gas pair, calorimetric
studies were performed. Heat of adsorption values of CO2, N2 and Ar gases on the
stated adsorbents were investigated. 5.2.1. Adsorption Studies
The Micromeritics (ASAP 2010) volumetric adsorption device was used to
perform the adsorption experiments for N2, Ar and CO2 gases at 5°C and 25°C. In
order to be able to keep the adsorption temperature constant, circulating water bath
was used and all the tubing was covered with polymeric isolation material. Prior to
36
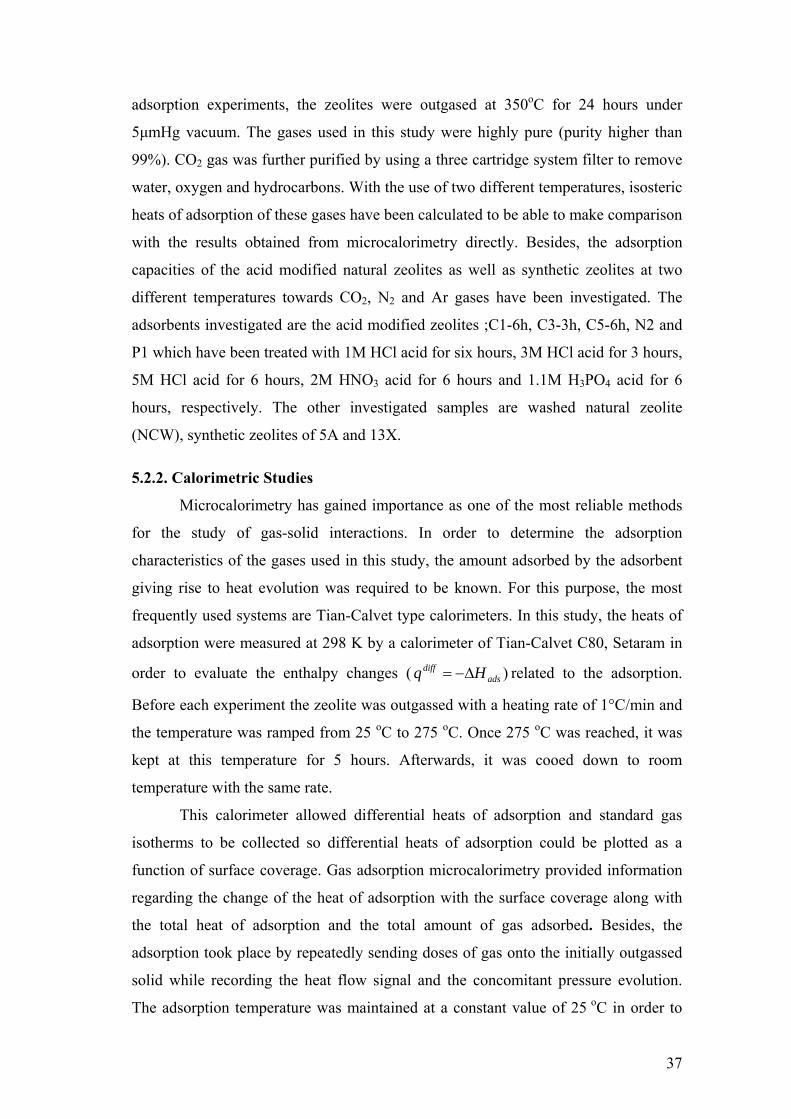
adsorption experiments, the zeolites were outgased at 350oC for 24 hours under
5µmHg vacuum. The gases used in this study were highly pure (purity higher than
99%). CO2 gas was further purified by using a three cartridge system filter to remove
water, oxygen and hydrocarbons. With the use of two different temperatures, isosteric
heats of adsorption of these gases have been calculated to be able to make comparison
with the results obtained from microcalorimetry directly. Besides, the adsorption
capacities of the acid modified natural zeolites as well as synthetic zeolites at two
different temperatures towards CO2, N2 and Ar gases have been investigated. The
adsorbents investigated are the acid modified zeolites ;C1-6h, C3-3h, C5-6h, N2 and
P1 which have been treated with 1M HCl acid for six hours, 3M HCl acid for 3 hours,
5M HCl acid for 6 hours, 2M HNO3 acid for 6 hours and 1.1M H3PO4 acid for 6
hours, respectively. The other investigated samples are washed natural zeolite
(NCW), synthetic zeolites of 5A and 13X. 5.2.2. Calorimetric Studies
Microcalorimetry has gained importance as one of the most reliable methods
for the study of gas-solid interactions. In order to determine the adsorption
characteristics of the gases used in this study, the amount adsorbed by the adsorbent
giving rise to heat evolution was required to be known. For this purpose, the most
frequently used systems are Tian-Calvet type calorimeters. In this study, the heats of
adsorption were measured at 298 K by a calorimeter of Tian-Calvet C80, Setaram in
order to evaluate the enthalpy changes ( related to the adsorption.
Before each experiment the zeolite was outgassed with a heating rate of 1°C/min and
the temperature was ramped from 25
)adsdiff Hq ∆−=
oC to 275 oC. Once 275 oC was reached, it was
kept at this temperature for 5 hours. Afterwards, it was cooed down to room
temperature with the same rate.
This calorimeter allowed differential heats of adsorption and standard gas
isotherms to be collected so differential heats of adsorption could be plotted as a
function of surface coverage. Gas adsorption microcalorimetry provided information
regarding the change of the heat of adsorption with the surface coverage along with
the total heat of adsorption and the total amount of gas adsorbed. Besides, the
adsorption took place by repeatedly sending doses of gas onto the initially outgassed
solid while recording the heat flow signal and the concomitant pressure evolution.
The adsorption temperature was maintained at a constant value of 25 oC in order to
37

limit physisorption. The experiments were carried out isothermally by admitting
stepwise increasing doses of the adsorbate gas to the zeolite previously evacuated.
The initial dose sent to the system was 50 mbar. Since the initial doses were small
enough, the heat obtained could be considered as a differential heat of adsorption. At
each dose, the equilibrium pressure was added to the sending increamental dose (50
mbar). Afterwards, the dose amount was increased to 300 mbar and the procedure
was repeated until no further pressure drop was observed. The heat evolved by each
dose was measured and the corresponding amount adsorbed was obtained by the
pressure drop in the known volume of the apparatus. This was determined in previous
calibration by allowing a known amount of gas to expand from the measure section
into the vessels section formerly evacuated. For each dose, thermal equilibrium was
attained before the pressure pi, the adsorbed amount δnads and the integral heat
evolved δQint were measured. The adsorption experiments were concluded when a
relatively high pressure was reached without the significant evolution of heat and the
adsorbed amount became negligible.
In order to determine the differential heat of adsorption from the data obtained
by microcalorimetry, the measured enthalpy was divided by the quantity of adsorbed
molecules for each dose. The heat was determined by integrating the calorimetric
data, and the quantity of adsorbed molecules was calculated using the collected
pressure data. Amounts adsorbed were expressed as mmol/g of zeolite outgassed at
275 oC.
The calorimetric data were reported here as differential heats, qdiff =
δQint/δnads. Hence the differential heat of adsorption is defined as the enthalpy change
in going from the gas phase to the adsorbed phase.
Microcalorimetry employs two cells namely reference cell which is empty and
the zeolite cell which contains the zeolite to be tested.
A step-wise procedure was followed in this study. In Figure 5.3, the
components of the microcalorimetry system are shown which are; the pressure
control panel, electric shalter, microcalorimetry and CS32 device required
transferring data. At the inset, a small picture of the pressure control panel is shown
with the valves numbered from 1 to 4 from left to right respectively. The valve just
above the pressure control panel is named as valve 5.
38
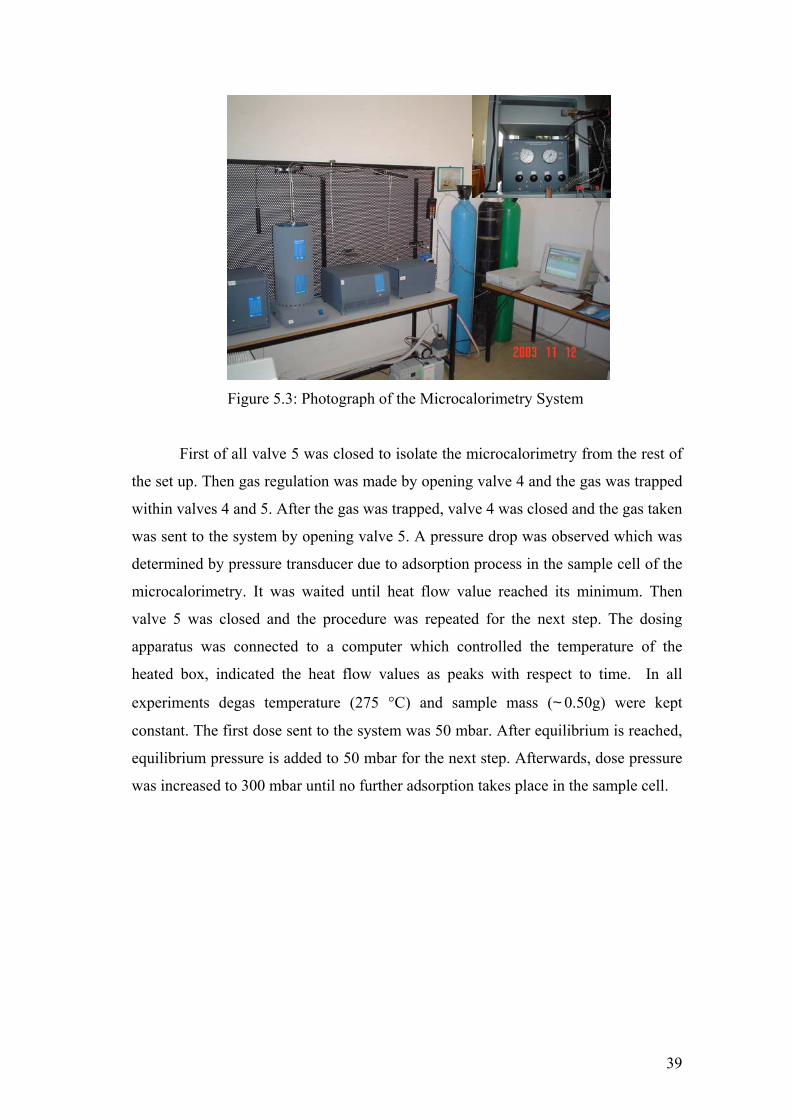
Figure 5.3: Photograph of the Microcalorimetry System
First of all valve 5 was closed to isolate the microcalorimetry from the rest of
the set up. Then gas regulation was made by opening valve 4 and the gas was trapped
within valves 4 and 5. After the gas was trapped, valve 4 was closed and the gas taken
was sent to the system by opening valve 5. A pressure drop was observed which was
determined by pressure transducer due to adsorption process in the sample cell of the
microcalorimetry. It was waited until heat flow value reached its minimum. Then
valve 5 was closed and the procedure was repeated for the next step. The dosing
apparatus was connected to a computer which controlled the temperature of the
heated box, indicated the heat flow values as peaks with respect to time. In all
experiments degas temperature (275 °C) and sample mass (~0.50g) were kept
constant. The first dose sent to the system was 50 mbar. After equilibrium is reached,
equilibrium pressure is added to 50 mbar for the next step. Afterwards, dose pressure
was increased to 300 mbar until no further adsorption takes place in the sample cell.
39
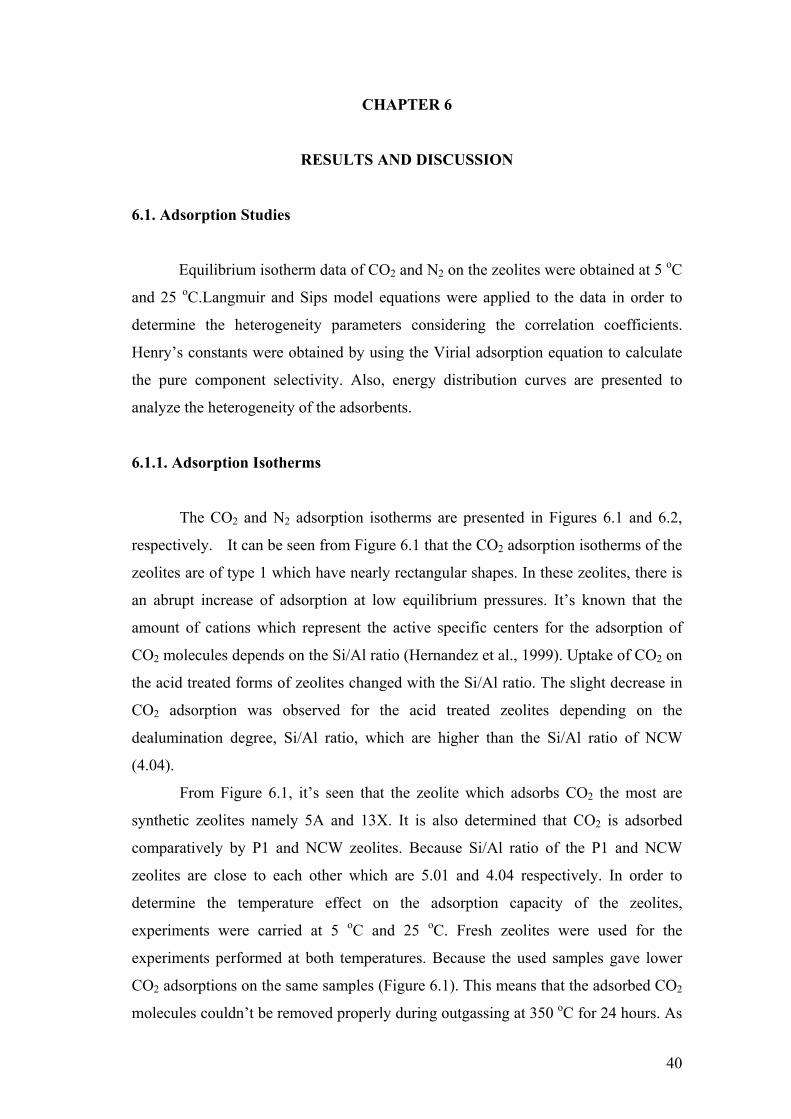
CHAPTER 6
RESULTS AND DISCUSSION
6.1. Adsorption Studies
Equilibrium isotherm data of CO2 and N2 on the zeolites were obtained at 5 oC
and 25 oC.Langmuir and Sips model equations were applied to the data in order to
determine the heterogeneity parameters considering the correlation coefficients.
Henry’s constants were obtained by using the Virial adsorption equation to calculate
the pure component selectivity. Also, energy distribution curves are presented to
analyze the heterogeneity of the adsorbents.
6.1.1. Adsorption Isotherms
The CO2 and N2 adsorption isotherms are presented in Figures 6.1 and 6.2,
respectively. It can be seen from Figure 6.1 that the CO2 adsorption isotherms of the
zeolites are of type 1 which have nearly rectangular shapes. In these zeolites, there is
an abrupt increase of adsorption at low equilibrium pressures. It’s known that the
amount of cations which represent the active specific centers for the adsorption of
CO2 molecules depends on the Si/Al ratio (Hernandez et al., 1999). Uptake of CO2 on
the acid treated forms of zeolites changed with the Si/Al ratio. The slight decrease in
CO2 adsorption was observed for the acid treated zeolites depending on the
dealumination degree, Si/Al ratio, which are higher than the Si/Al ratio of NCW
(4.04).
From Figure 6.1, it’s seen that the zeolite which adsorbs CO2 the most are
synthetic zeolites namely 5A and 13X. It is also determined that CO2 is adsorbed
comparatively by P1 and NCW zeolites. Because Si/Al ratio of the P1 and NCW
zeolites are close to each other which are 5.01 and 4.04 respectively. In order to
determine the temperature effect on the adsorption capacity of the zeolites,
experiments were carried at 5 oC and 25 oC. Fresh zeolites were used for the
experiments performed at both temperatures. Because the used samples gave lower
CO2 adsorptions on the same samples (Figure 6.1). This means that the adsorbed CO2
molecules couldn’t be removed properly during outgassing at 350 oC for 24 hours. As
40
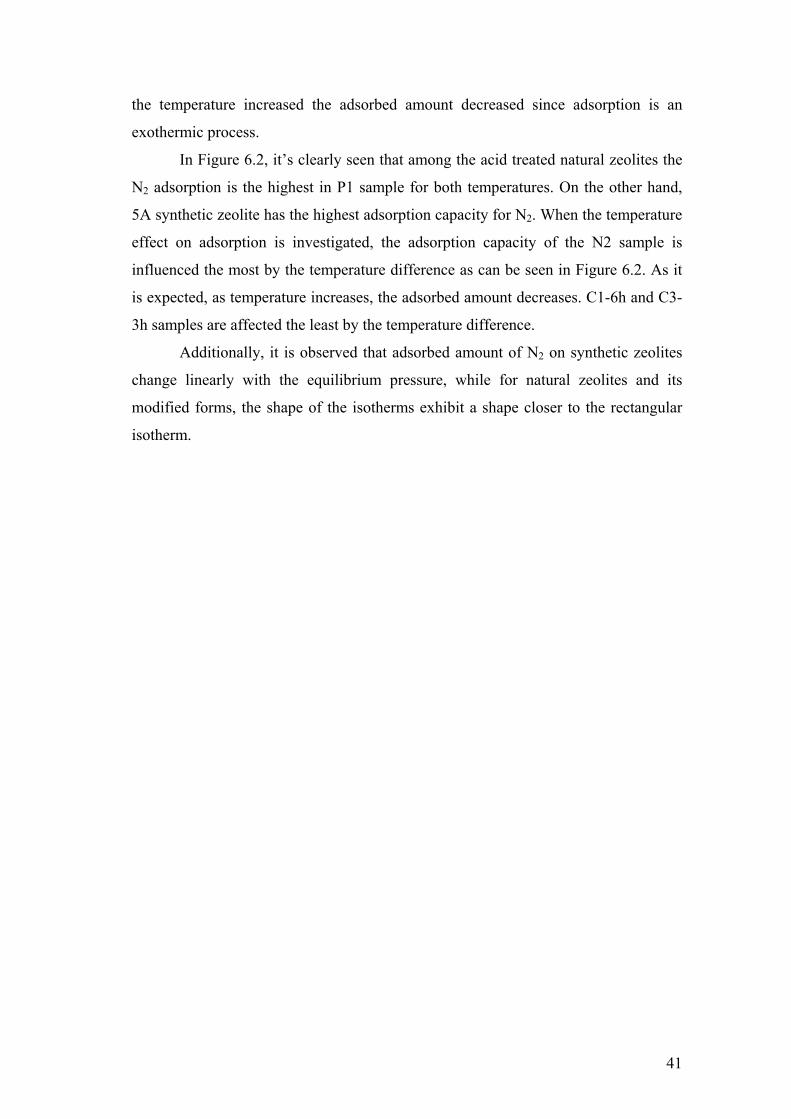
the temperature increased the adsorbed amount decreased since adsorption is an
exothermic process.
In Figure 6.2, it’s clearly seen that among the acid treated natural zeolites the
N2 adsorption is the highest in P1 sample for both temperatures. On the other hand,
5A synthetic zeolite has the highest adsorption capacity for N2. When the temperature
effect on adsorption is investigated, the adsorption capacity of the N2 sample is
influenced the most by the temperature difference as can be seen in Figure 6.2. As it
is expected, as temperature increases, the adsorbed amount decreases. C1-6h and C3-
3h samples are affected the least by the temperature difference.
Additionally, it is observed that adsorbed amount of N2 on synthetic zeolites
change linearly with the equilibrium pressure, while for natural zeolites and its
modified forms, the shape of the isotherms exhibit a shape closer to the rectangular
isotherm.
41

C3-3h (Si/Al: 6.08)
00.20.40.60.8
11.21.41.61.8
2
0 20 40 60 80 100Pressure [kPa]
Amou
nt A
dsor
bed
[mm
ol/g
]NCW (Si/Al: 4.04)
0
1
2
3
0 20 40 60 80 100
Pressure [kpa]
Am
ount
Ads
orbe
d [m
mol
/g]
P1 (Si/Al: 5.01)
0
1
2
3
0 20 40 60 80
Pressure [kPa]
Amou
nt A
dsor
bed
[mm
ol/g
100
]
C5-6h (Si/Al: 8.4)
0
1
2
3
0 20 40 60 80 100
Pressure [kPa]
Am
ount
Ads
orbe
d [m
mol
/g]
5A (Si/Al: 0.98)
0
1
2
3
4
5
6
0 20 40 60 80 100
Pressure [kPa]
Am
ount
Ads
orbe
d [m
mol
/g]
13X (Si/Al: 1.35)
0
0.05
0.1
0.15
0.2
0.25
0.3
0.35
0.4
0 20 40 60 80 100Pressure [kpa]
Am
ount
Ads
orbe
d [m
mol
/g]
Figure 6.1: CO2 Adsorption Isotherms on the used and fresh Adsorbents
at 5 oC (●); 25 oC (○) (♦); used sample at 5 oC.
42

C1-6h (Si/Al: 5.25)
0
0.1
0.2
0.3
0.4
0 20 40 60 80Pressure [kpa]
Am
ount
Ads
orbe
d [m
mol
/g]
C3-3h (Si/Al: 6.08)
0
0.1
0.2
0.3
0.4
0 20 40 60 80 100
Pressure [kpa]
Am
ount
Ads
orbe
d [m
mol
/g]C5-6h (Si/Al: 8.4)
0
0.1
0.2
0.3
0.4
0 20 40 60 80 1Pressure [kpa]
Am
ount
Ads
orbe
d [m
mol
/g]
00
100
NCW (Si/Al: 4.04)
00.10.20.30.40.50.60.7
0 20 40 60 80 10
Pressure [kPa]
Amou
nt A
dsor
bed
[mm
ol/g
]
0
N2 (Si/Al: 6.18)
0
0.2
0.4
0.6
0.8
1
0 20 40 60 80 100 120
Pressure [kPa]
Am
ount
Ads
orbe
d [m
mol
/g]
P1(Si/Al: 5.01)
0
0.2
0.4
0.6
0.8
1
0 20 40 60 80 100 120
Pressure [kPa]
Am
ount
Ads
orbe
d [m
mol
/g]
5A (Si/Al: 0.98)
0
0.2
0.4
0.6
0.8
1
0 20 40 60 80 100Pressure [kpa]
Am
ount
Ads
orbe
d [m
mol
/g]
Figure 6.2: N2 Adsorption Isotherms on the zeolites at 5 oC (●); 25 oC (○).
43

6.1.2. Adsorption Capacities of the Zeolites for CO2 and N2 Adsorption
From the CO2 and N2 adsorption data, the maximum adsorption capacities of
zeolites were obtained and presented in Tables 6.1 and 6.2.
Table 6.1: Maximum adsorption capacities of zeolites for CO2 Adsorption
Zeolites Temperature [oC] Pressure [kpa] Maximum Adsorbed Amount [mmol/g]
5A 5 25
91
5.46 5.48
13X 5 25 91 -
6.82
NCW 5 25
91
2.084 2.05
C3-3h 5 25 93 1.79
1.66
C5-6h 5 25 91 1.658
1.44
P1 5 25 93 2.24
1.95
In CO2 adsorption, the highest adsorption capacity belongs to synthetic
zeolites. This can be explained due to lower Si/Al ratios of these zeolites. Among the
natural zeolites, NCW has the highest adsorption capacity. It’s not treated with acid
and therefore has the lowest Si/Al ratio. Consequently, the lower the Si/Al ratio, the
higher the specific interactions are. Due to higher specific interactions between the
CO2 and zeolite the adsorbed CO2 by the zeolite resulted in high value. The
adsorption capacity of the NCW and P1 samples are similar to each other due to
being closer Si/Al ratios which are 4.04 and 5.01 for NCW and P1, respectively.
44

Table 6.2: Maximum adsorption capacities of zeolites for N2 Adsorption
Zeolites Temperature [oC] Pressure [kpa] Maximum Adsorbed Amount [mmol/g]
5A 5 25 81 0.91
0,58
13X 5 25 91 -
0.31
C1-6h 5 25 93 0.13
0.07
C3-3h 5 25 93 0.26
0,23
C5-6h 5 25 91 0.31
0.16
P1-6h 5 25 93 0.67
0.31
N2-6h 5 25 91 0.54
0.19
NCW 5 25 91 0.59
0.51
N2 adsorption capacities of the zeolites at both temperatures are compared in
Table 6.2. The capacities were determined at about 90 kPa. 5A zeolite gives the
highest adsorption capacity while C1-6h zeolite has the lowest adsorption capacity.
However, the orders are changed with respect to temperature which are as follows;
5A > P1 > N2> 13X~C5-6h > C3-3h > C1-6h at 5 oC and 5A > 13X > P1 > C2-3h >
N2 > C5-6h > C1-6h at 25 oC. From the order, it can be concluded that 5A synthetic
zeolite has the highest adsorption capacity and among the acid modified natural
zeolites P1 zeolite has the highest adsorption capacity. P1 also has the highest
monolayer capacity among the acid modified natural zeolites. It is expected that as
the specific interactions with the gas molecules are high, more molecules are
adsorbed by the P1 sample.
45

Table 6.3: Previous Studies of N2 and CO2 Adsorption on Zeolites
Zeolites Amount adsorbed
(mmol/g) Pressrure (kPa) Adsorbate T(oC) Author
clinoptilolite 0.59 101.3 N2 22 clinoptilolite 2.5 20.26 CO2 22
Rege S.U. et.al., 2000
clinoptilolite 1.83 20 CO2 25 This study clinoptilolite 0.65 91.2 N2 27 Ackley M.W. et al.,1991 Clinoptilolite 0.32 27 N2 27 Clinoptilolite 1.7 27 CO2 17
Hernandez et al., 1999
clinoptilolite 0.4 100 N2 30 Triebe R.W.et al.,1995 13X 0.44 101.3 N2 22 13X 6 35.5 CO2 22
Rege S.U. et.al., 2000
13X 6 80 CO2 31.4 Ustinov E.et al., 1999 13X 6.82 90 CO2 25 This study 13X 0.48 101.3 N2 22 Jayaraman A.et.al.,2002 5A 0.6 100 N2 23 Talu O. et al., 1996 5A 0.58 90 N2 25 This study 5A 0.27 90 N2 20 Warmuzinski et al., 1999 5A 2.548 80 CO2 30 Pakseresht S.et al.,2002 5A 5.48 90 CO2 25 This study
The adsorption capacities of the zeolites for CO2 and N2 used in this study are
compared to the literature data in Table 6.3. The CO2 adsorption on natural zeolite at
20 kPa is determined as about 1.83 mmol/g at 25 oC in this study while Rege S. U. et
al. (2000), found this value as 2.5 mmol/g at 22 oC. The reason for the small
difference between the adsorbed amounts may be due to the temperature increase.
Hernandez et al (1999) found the lowest adsorbed amount of CO2, 1.7 mmol/g, at a
lower temperature (17 oC) because of the impurities that the clinoptilolite has.
Furthermore, in the studies performed by Ustinov et al. (1999), the amount of CO2
adsorbed on 13X at 30 oC was determined as 6 mmol/g at about 80 kpa which is close
to the value obtained in this study which is 6.82 mmol/g at 25 oC. When the adsorbed
amount of 5A is compared with the literature data, the adsorbed amounts of CO2 and
N2 on 5A in this study at 25 oC are greater than the adsorbed amount in the studies of
Pakseresht S.et al. (2002) and Warmuzinski K. et al. (1999). They have found that 5A
zeolite adsorbs 2.548 mmol/g of CO2 and 0.27 mmol/g of N2 at 30 oC and 20 oC
respectively while in this study, at around 90 kpa, the adsorbed amount of CO2 and
46

N2 are 5.48 and 0.58 mmol/g respectively. Talu et al. (1996) also reported that N2
adsorbed amount on 5A at 23 oC was 0.6 mmol/g and in this study it was found as
0.58 mmol/g at 25 oC.
6.1.3. Model Equations
Different model equations were applied to the adsorption data obtained from
volumetric studies in order to get information regarding the heterogeneity of the
adsorbent surfaces. The models applied to the data are Sips, Dubinin Astakhov,
Langmuir equations and also Henry’s constants from Virial plot are presented. By
making use of the data obtained from the heterogeneity parameters of the applied
equations, interpretation of the results is made.
Langmuir Model Equation
Langmuir model is applied to adsorption data for CO2 and N2 at 5 oC and 25 oC. The Langmuir parameters of the zeolites for CO2 and N2 are given in Tables 6.4
and 6.5, respectively.
Table 6.4: Langmuir Parameters of Some Zeolites for CO2 Adsorption
Adsorption Temperature
( oC ) NCW C3-3h C5-6h P1 5A 13X
b 5.09 0.33 1.15 0.72 1.98 - nm[mmol/g] 1.68 1.65 1.46 2.18 5.19 - 5 oC Correlation Coeff. [%] 96.55 98.17 95.83 99.39 99.59 -
b 6.64 0.20 0.56 2.44 0.76 0.41 nm[mmol/g] 1.84 1.62 1.32 1.74 5.36 6.46 25 oC Correlation Coeff. [%] 96.53 98.39 97.27 96.54 99.83 98.77
Parameter b in Langmuir Model is called the affinity constant. It is a measure
of how strong an adsorbate molecule is attracted onto a surface. When the affinity
constant b is larger, adsorbate-adsorbent pair is more heterogeneous. The highest b
parameter for CO2 adsorption is obtained for NCW sample, and P1 sample follows
the NCW at both temperatures. This is expected because Si/Al ratios and the X-ray
diffraction patterns of these two zeolites are close and, therefore yield similar affinity
towards CO2. The SEM micrographs of P1 and NCW also show that the zeolites still
47
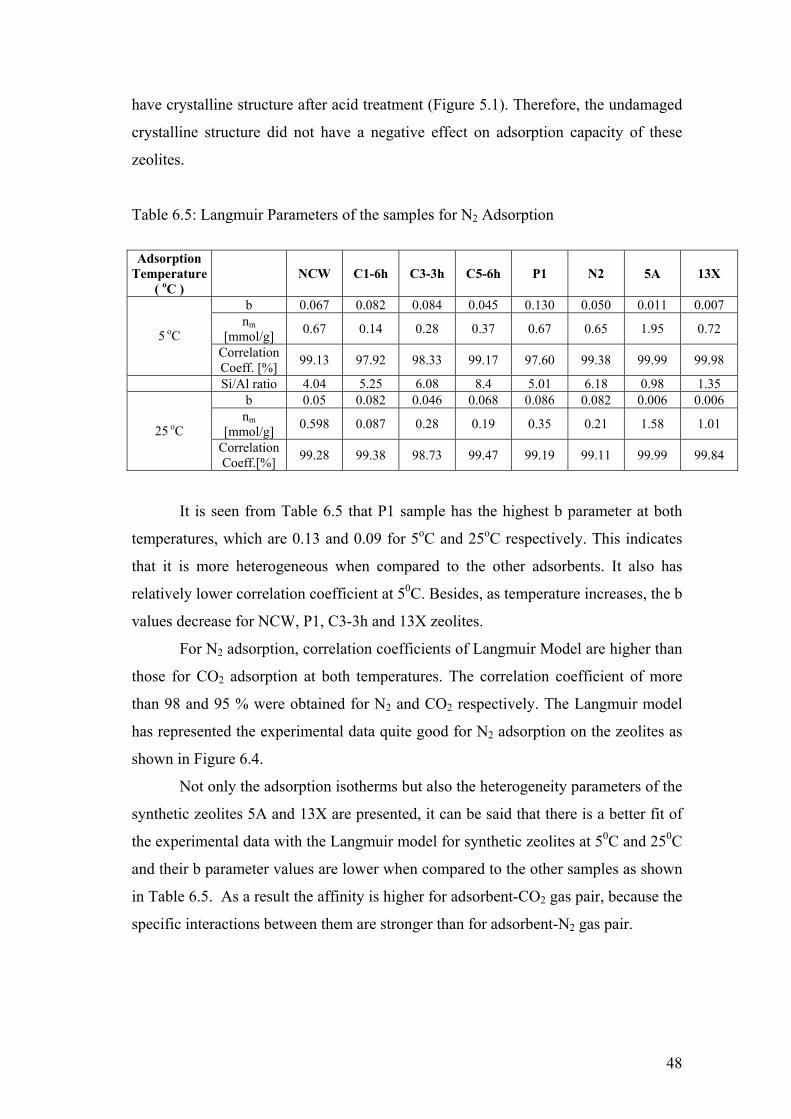
have crystalline structure after acid treatment (Figure 5.1). Therefore, the undamaged
crystalline structure did not have a negative effect on adsorption capacity of these
zeolites.
Table 6.5: Langmuir Parameters of the samples for N2 Adsorption
Adsorption Temperature
( oC ) NCW C1-6h C3-3h C5-6h P1 N2 5A 13X
b 0.067 0.082 0.084 0.045 0.130 0.050 0.011 0.007 nm
[mmol/g] 0.67 0.14 0.28 0.37 0.67 0.65 1.95 0.72 5 oC Correlation Coeff. [%] 99.13 97.92 98.33 99.17 97.60 99.38 99.99 99.98
Si/Al ratio 4.04 5.25 6.08 8.4 5.01 6.18 0.98 1.35 b 0.05 0.082 0.046 0.068 0.086 0.082 0.006 0.006
nm [mmol/g] 0.598 0.087 0.28 0.19 0.35 0.21 1.58 1.01 25 oC
Correlation Coeff.[%] 99.28 99.38 98.73 99.47 99.19 99.11 99.99 99.84
It is seen from Table 6.5 that P1 sample has the highest b parameter at both
temperatures, which are 0.13 and 0.09 for 5oC and 25oC respectively. This indicates
that it is more heterogeneous when compared to the other adsorbents. It also has
relatively lower correlation coefficient at 50C. Besides, as temperature increases, the b
values decrease for NCW, P1, C3-3h and 13X zeolites.
For N2 adsorption, correlation coefficients of Langmuir Model are higher than
those for CO2 adsorption at both temperatures. The correlation coefficient of more
than 98 and 95 % were obtained for N2 and CO2 respectively. The Langmuir model
has represented the experimental data quite good for N2 adsorption on the zeolites as
shown in Figure 6.4.
Not only the adsorption isotherms but also the heterogeneity parameters of the
synthetic zeolites 5A and 13X are presented, it can be said that there is a better fit of
the experimental data with the Langmuir model for synthetic zeolites at 50C and 250C
and their b parameter values are lower when compared to the other samples as shown
in Table 6.5. As a result the affinity is higher for adsorbent-CO2 gas pair, because the
specific interactions between them are stronger than for adsorbent-N2 gas pair.
48

Sips Model Equation
Another model applied to represent the experimental data is the Sips model.
The experimental adsorption isotherms and the corresponding Sips Model are
presented in Figures 6.3 and 6.4.
The correlation coefficients of the Sips Model are generally higher than 99 %.
Their corresponding adsorption isotherms and the deviation of the model isotherms
from the experimental data are shown in Figures 6.3 and 6.4.
The parameter t of the Sips Model characterizes the system heterogeneity and
the larger is this parameter the more heterogeneous is the system. According to Table
6.6, P1 has the highest t value indicating that CO2-P1 pair is more heterogeneous
when compared to other adsorbent-gas pairs.
t parameters are lower for the synthetic zeolites so their b values in Sips and
Langmuir models are close to each other.
Table 6.6: Sips Parameters of the Zeolites for CO2 Adsorption
Adsorption Temperature (oC) C3-3h C5-6h P1 NCW 5A 13X correlation coefficient[%] 99.99 99.99 99.99 99.92 99.89 -
nm (mmole/g) 3.22 2.64 5.37 2.03 5.40 - b (kpa-1) 0.019 0.050 0.001 2.25 1.67 -
5 oC
t (-) 2.48 3.07 6.52 2.41 1.29 - correlation coefficient[%] 99.97 99.99 99.69 99.85 99.96 99.97
nm (mmole/g) 1.04 2.38 2.4 2.30 5.60 9.65 b (kpa-1) 0.0007 0.042 0.50 1.77 0.62 0.067
25 oC
t (-) 2.19 2.63 2.9 2.58 1.23 2.02
In a study performed by Pakseresth et al in 2002, the Langmuir and Sips
Models were applied to the experimental data obtained from volumetric apparatus for
CO2 on 5A zeolite at 30 oC and they determined the nm value of the Langmuir Model
as 3.92 mmol/g and the t parameter of the Sips Model as 1.79 at these conditions. In
this study for CO2 adsorption on 5A at 25 oC these parameters were determined for nm
and b as 5.36 mmol/g and 1.23 respectively.
In the study performed by Hernandez et al. in 1999, the t parameter of the Sips
Model applied to the CO2 adsorption data of clinoptilolite at 27 oC was determined as
1.13 while in this study its determined as 2.58 for NCW at 25 oC .
49

Table 6.7: Sips Parameters of the Zeolites for N2 Adsorption
Adsorption Temperature (oC) NCW C1-6h C3-3h C5-6h P1 N2 5A 13X correlation coefficient[%] 99.99 99.93 99.87 99.87 99.97 99.82 99.99 99.86
nm (mmole/g) 8.21 5.17 1.25 8.05 3.56 8.33 2.26 9.13 b (kpa-1) 4.9E-5 5.3E-7 5.7E-4 2.07E-5 1.5E-4 3.6E-5 8.13E-3 1.5E-4
5 oC
t (-) 2.22 2.76 2.33 1.99 2.94 2.19 1.05 1.25 correlation coefficient[%] 99.99 99.43 99.98 98.36 99.95 99.81 99.99 99.86
nm (mmole/g) 1.40 0.097 0.98 3.21 0.43 0.26 1.62 1.58 b (kpa-1) 0.0038 0.065 8.9E-4 1.67E-6 0.0498 4.6E-2 6.23E-3 2.74E-3
25 oC
t (-) 1.92 1.017 2.17 3.02 1.55 1.47 1.0 1.10
Adsorption isotherms of N2 and CO2 also show that, the consistency of the
Sips Model with the experimental data are better than in Langmuir Model (Figures
6.3 and 6.4). In Table 6.7, it’s determined that P1 has the highest heterogeneity for
gases at 5 oC since it has the highest t values which are 3.18 and 2.94 kPa-1 for CO2
and N2 respectively. When the t values are compared at both temperatures, it can be
determined that at 5 oC, gas-adsorbent system is more heterogeneous since the t
values are generally greater at 5 oC. Besides, CO2-adsorbent system heterogeneity is
greater than N2- adsorbent system since the t values are greater in CO2 adsorption. In
case of N2 adsorption on synthetic zeolites for both temperatures the t values are
nearly 1, which indicate that synthetic zeolite-N2 gas systems are more
homogeneous. In this case, the correlated b values from Langmuir and Sips models
are in good agreement with each other.
50

P1 (Si/Al: 5.01)
0
0.5
1
1.5
2
2.5
0 20 40 60 80 100
Pressure [kpa]
Am
ount
Ads
orbe
d [m
mol
/g]
C3-3h (Si/Al: 6.08)
0
0.5
1
1.5
2
0 20 40 60 80 100
Pressure [kPa]
Amou
nt A
dsor
bed
[mm
ol/g
]
5A (Si/Al: 0.98)
0
1
2
3
4
5
6
7
0 50 100
Pressure [kPa]
Am
ount
Ads
orbe
d [m
mol
/g]
13X (Si/Al: 1.35)
012345678
0 20 40 60 80 10
Pressure [kPa]
Amou
nt A
dsor
bed
[mm
ol/g
]
0
NCW (Si/Al: 4.04)
0
0.5
1
1.5
2
2.5
0 20 40 60 80 100
Pressure [kPa]
Am
ount
Ads
orbe
d [m
mol
/g]
C5-6h (Si/Al: 8.4)
0
0.5
1
1.5
2
0 20 40 60 80 100
Pressure [kpa]
Amou
nt A
dsor
bed
[mm
ol/g
]
Figure 6.3: CO2 Adsorption Isotherms on the zeolites at 5 oC (●); 25 oC (○).
Points: experimental data, lines: Langmuir Model, dashed lines: Sips Model
51

NCW (Si/Al: 4.04)
0
0.2
0.4
0.6
0 20 40 60 80 100Pressure [kPa]
Am
ount
Ads
orbe
d [m
mol
/g]
0
0.05
0.1
0.15
0 20 40 60 80 100Pressure [kPa]
Amou
nt A
dsor
bed
[mm
ol/g
]
C1-6h (Si/Al:
C5-6h (Si/Al: 8.4)
0
0.1
0.2
0.3
0.4
0 20 40 60 80 100
Pressure [kPa]
Amou
nt A
dsor
bed
[mm
ol/g
]
C3-3h (Si/Al: 6.08)
0
0.1
0.2
0.3
0 20 40 60 80 100
Pressure [kPa]
Am
ount
Ads
orbe
d [m
mol
/g]
P1(Si/Al: 5.01)
0
0.2
0.4
0.6
0.8
0 20 40 60 80 100
Pressure [kPa]
N2 (Si/Al: 6.18)
0
0.2
0.4
0.6
0 20 40 60 80 100
Pressure [kPa]
Amou
nt A
dsor
bed
[mm
ol/g
]
5A (Si/Al: 0.98)
0
0.2
0.4
0.6
0.8
1
0 20 40 60 80 100
Pressure [kpa]
Figure 6.4: N2 Adsorption Isotherms on the zeolites at 5 oC (●); 25 oC (○).
Points: experimental data, lines: Langmuir Model, dashed lines: Sips Model
52
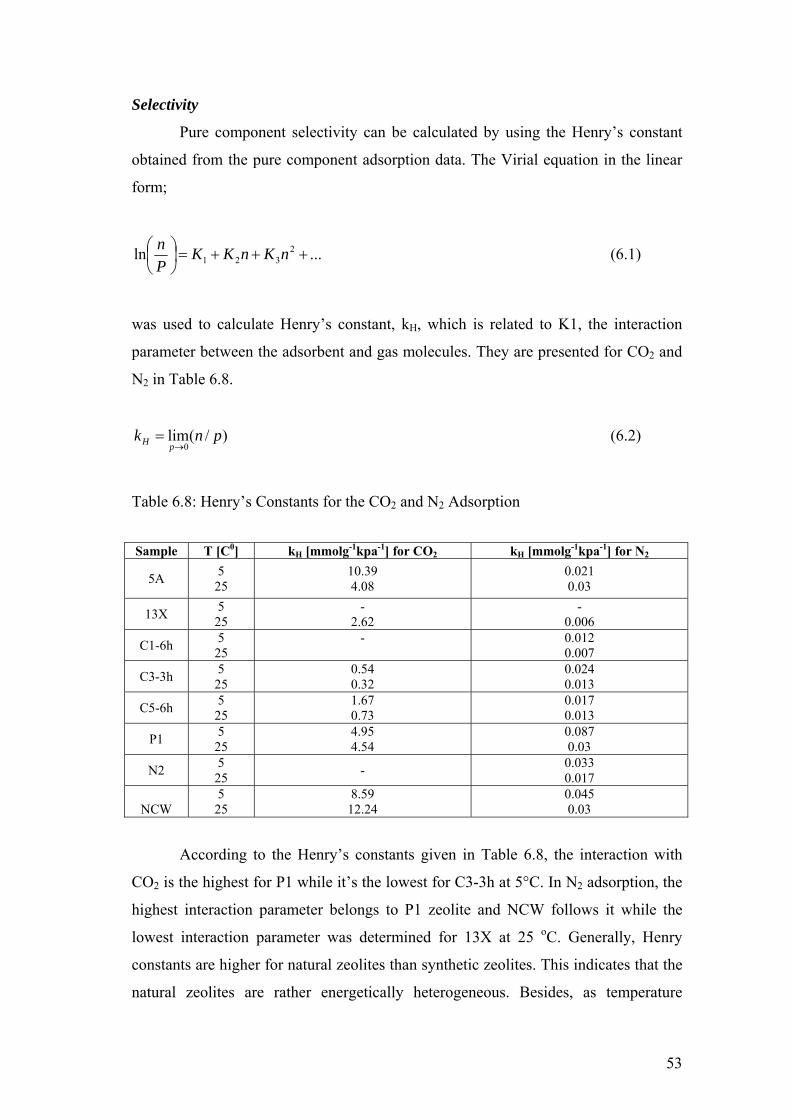
Selectivity
Pure component selectivity can be calculated by using the Henry’s constant
obtained from the pure component adsorption data. The Virial equation in the linear
form;
...ln 2321 +++=⎟
⎠⎞
⎜⎝⎛ nKnKK
Pn (6.1)
was used to calculate Henry’s constant, kH, which is related to K1, the interaction
parameter between the adsorbent and gas molecules. They are presented for CO2 and
N2 in Table 6.8.
)/(lim0
pnkpH →
= (6.2)
Table 6.8: Henry’s Constants for the CO2 and N2 Adsorption
Sample T [C0] kH [mmolg-1kpa-1] for CO2 kH [mmolg-1kpa-1] for N2
5A 5 25
10.39 4.08
0.021 0.03
13X 5 25
- 2.62
- 0.006
C1-6h 5 25
-
0.012 0.007
C3-3h 5 25
0.54 0.32
0.024 0.013
C5-6h 5 25
1.67 0.73
0.017 0.013
P1 5 25
4.95 4.54
0.087 0.03
N2 5 25 - 0.033
0.017
NCW 5
25 8.59
12.24 0.045 0.03
According to the Henry’s constants given in Table 6.8, the interaction with
CO2 is the highest for P1 while it’s the lowest for C3-3h at 5°C. In N2 adsorption, the
highest interaction parameter belongs to P1 zeolite and NCW follows it while the
lowest interaction parameter was determined for 13X at 25 oC. Generally, Henry
constants are higher for natural zeolites than synthetic zeolites. This indicates that the
natural zeolites are rather energetically heterogeneous. Besides, as temperature
53

increases from 5 °C to 25 °C Henry’s constants generally decrease which indicate that
the interactions decrease as temperature increases.
Table 6.9: Selectivity Ratios of CO2 over N2 for the Adsorbents
Sample T [C0] Pure Component Selectivity Ratios (CO2/N2)
Si/Al Ratio
5A 5 25
494 136
0.98
13X 5 25
- 451
1.35
C3-3h 5 25
22.5 24.6
6.08
C5-6h 5 25
98.2 56.2
8.4
P1 5 25
56.9 151.3
5.01
NCW 5 25
191 408
4.04
0
2
4
6
8
10
12
14
0 2 4 6 8 10Si/Al Ratio
Hen
ry's
Con
stan
t
0
50
100
150
200
250
300
350
400
450
Pure
Com
pone
nt A
dsor
ptio
n Se
lect
ivity
Rat
ios
Henry 's constant - Carbondioxide
Henry 's constant - Nitrogen
Pure Component Adsorption Selectiv ities
Figure 6.5: Change of Henry’s Constants and Selectivity Ratios with Si/Al at 25 oC
Pure component selectivity ratios of CO2 over N2 are shown in Table 6.9.
According to that, generally when the Si/Al ratio is around 4, the selectivity of CO2
over N2 is the greatest. Furthermore, Si/Al ratio has a significant effect on the change
of Henry’s constants for CO2 due to the quadrupole moments of CO2 gas however
Henry constants for N2 were not affected much by the change of Si/Al ratio.
54

6.1.4. Evaluation of the Energy Distributions
Rozwadowski et al. (1989) have reported that heterogeneity of the
microporous adsorbents is connected closely with the distribution of adsorption
potential in micropores. These distributions characterize the energetic heterogeneity
of microporous solids and can be related to microporous structure (Gil et al., 1996).
In this study, equation 6.3 has been used for the construction of energy distributions
by taking the Dubinin Astakhov Equation as the basis.
))/(exp()/()/(/)( 100
nnn AkkAnWdAdWdAdWAX ββθ −=−=−= − (6.3)
where A is the energy of adsorption in Dubinin Astakhov Equation, k and β are the
structural parameters correlated with the micropore dimensions.
The potential energy distribution diagrams obtained from equation 6.3 are
presented in Figures 6.6 and 6.7 for CO2 and N2 respectively.
55

C3-3h (Si/Al: 6.08)
2.5
3
3.5]
0
0.5
1
1.5
2
0 5 10 15 20 25
A [kj/mol]
X(A
) [m
ol.c
m3 /k
j.gC5-6h (Si/Al: 8.4)
1
1.2
1.4
]
0
0.2
0.4
0.6
0.8
0 5 10 15 20 25
A [kj/mol]
X(A
) [m
ol.c
m3 /k
j.g
5A (Si/Al: 0.98)
0
1
2
3
4
5
6
7
8
9
0 5 10 15 20 25
A [kj/mol]
X(A
) [m
ol.c
m3 /k
j.g]
NCW (Si/Al: 4.04)
0
0.5
1
1.5
2
2.5
3
0 5 10 15 20 25 30
A [kj/mol]
X(A)
[mol
.cm
3/kj
.g]
P1 (Si/Al: 5.01)
0
0.5
1
1.5
2
2.5
0 5 10 15 20 25 30A [kj/mol]
X(A
) [m
ol.c
m3/
kj.g
]
Figure 6.6: Adsorption Potential Distributions for CO2 Adsorption at 5 oC (●); 25 oC (○).
56
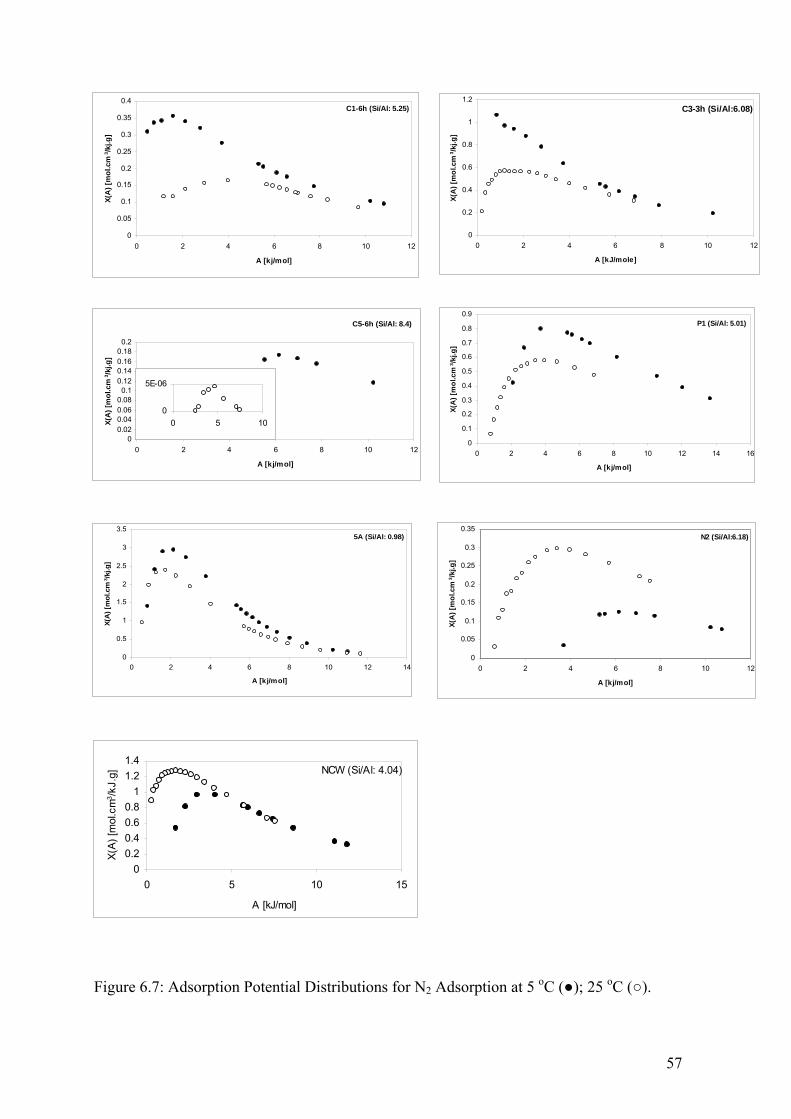
5A (Si/Al: 0.98)
0
0.5
1
1.5
2
2.5
3
3.5
0 2 4 6 8 10 12 14
A [kj/mol]
X(A
) [m
ol.c
m3 /k
j.g]
C5-6h (Si/Al: 8.4)
00.020.040.060.080.1
0.120.140.160.180.2
0 2 4 6 8 10 12
A [kj/mol]
X(A
) [m
ol.c
m3 /k
j.g]
0
5E-06
0 5 10
C1-6h (Si/Al: 5.25)
0.3
0.35
0.4g]
0
0.05
0.1
0.15
0.2
0.25
0 2 4 6 8 10 12
A [kj/mol]
X(A
) [m
ol.c
m3 /k
j.
N2 (Si/Al:6.18)
0
0.05
0.1
0.15
0.2
0.25
0.3
0.35
0 2 4 6 8 10 1
A [kj/mol]
X(A
) [m
ol.c
m3 /k
j.g]
2
C3-3h (Si/Al:6.08)1
1.2
12
j.g]
0
0.2
0.4
0.6
0.8
0 2 4 6 8 10
A [kJ/mole]
X(A
) [m
ol.c
m3 /k
P1 (Si/Al: 5.01)
0
0.1
0.2
0.3
0.4
0.5
0.6
0.7
0.8
0.9
0 2 4 6 8 10 12 14 16
A [kj/mol]
X(A
) [m
ol.c
m3 /k
j.g]
NCW (Si/Al: 4.04)
00.20.40.60.8
11.21.4
0 5 10 15
A [kJ/mol]
X(A)
[mol
.cm
3 /kJ.
g]
Figure 6.7: Adsorption Potential Distributions for N2 Adsorption at 5 oC (●); 25 oC (○).
57
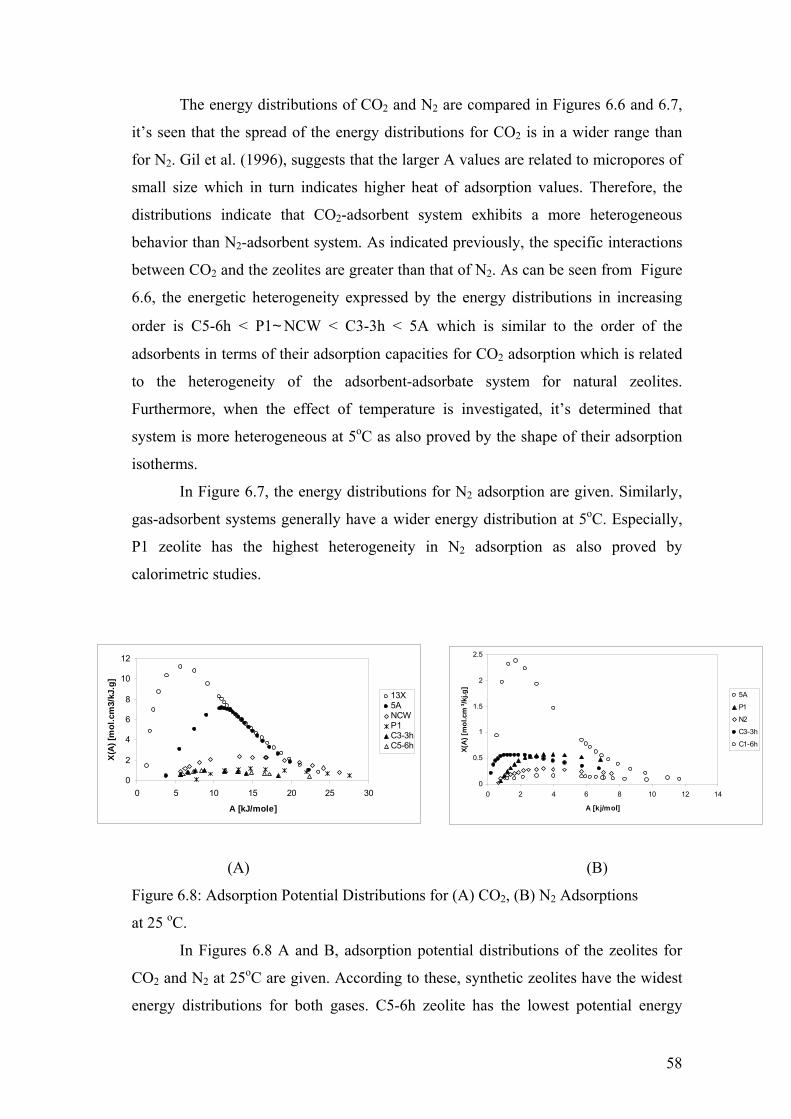
The energy distributions of CO2 and N2 are compared in Figures 6.6 and 6.7,
it’s seen that the spread of the energy distributions for CO2 is in a wider range than
for N2. Gil et al. (1996), suggests that the larger A values are related to micropores of
small size which in turn indicates higher heat of adsorption values. Therefore, the
distributions indicate that CO2-adsorbent system exhibits a more heterogeneous
behavior than N2-adsorbent system. As indicated previously, the specific interactions
between CO2 and the zeolites are greater than that of N2. As can be seen from Figure
6.6, the energetic heterogeneity expressed by the energy distributions in increasing
order is C5-6h < P1~NCW < C3-3h < 5A which is similar to the order of the
adsorbents in terms of their adsorption capacities for CO2 adsorption which is related
to the heterogeneity of the adsorbent-adsorbate system for natural zeolites.
Furthermore, when the effect of temperature is investigated, it’s determined that
system is more heterogeneous at 5oC as also proved by the shape of their adsorption
isotherms.
In Figure 6.7, the energy distributions for N2 adsorption are given. Similarly,
gas-adsorbent systems generally have a wider energy distribution at 5oC. Especially,
P1 zeolite has the highest heterogeneity in N2 adsorption as also proved by
calorimetric studies.
0
2
4
6
8
10
12
0 5 10 15 20 25 30
A [kJ/mole]
X(A
) [m
ol.c
m3/
kJ.g
]
13X5ANCWP1C3-3hC5-6h
0
0.5
1
1.5
2
2.5
0 2 4 6 8 10 12 14
A [kj/mol]
X(A
) [m
ol.c
m3 /k
j.g]
5A
P1
N2
C3-3h
C1-6h
(A) (B)
Figure 6.8: Adsorption Potential Distributions for (A) CO2, (B) N2 Adsorptions
at 25 oC.
In Figures 6.8 A and B, adsorption potential distributions of the zeolites for
CO2 and N2 at 25oC are given. According to these, synthetic zeolites have the widest
energy distributions for both gases. C5-6h zeolite has the lowest potential energy
58

values for CO2 while for N2 C1 has the lowest among the other zeolites. Calorimetric
results also support that the synthetic zeolites have higher heat of adsorption values
and hence more heterogeneous while C1-6h and and C5-6h have lower heat of
adsorption values due to their higher Si/Al ratio.
0
0.5
1
1.5
2
2.5
3
0 10000000 20000000 30000000 40000000 50000000 60000000A²
ln W
C1C3C55A13XN2P1
Figure 6.9: Characterisitic Energies of the Zeolites for N2 at 250C
As can be seen from Figure 6.9, the lowest characteristic energy belongs to
C1-6h zeolite while the highest one belongs to P1 zeolite among the acid treated
natural zeolites. The order of the characteristic energies is consistent with the
microcalorimetric data in which 5A zeolite has the highest heat of adsorption value
which is about 103 kJ/mole while C1-6h has the lowest heat of adsorption which is
about 38 kJ/mole.
0
0.5
1
1.5
2
2.5
3
3.5
0 50000000 100000000 150000000 200000000
A2
ln W
P15AC3C5N2
Figure 6.10: Characterisitic Energies of the Zeolites for N2 at 5 oC
59
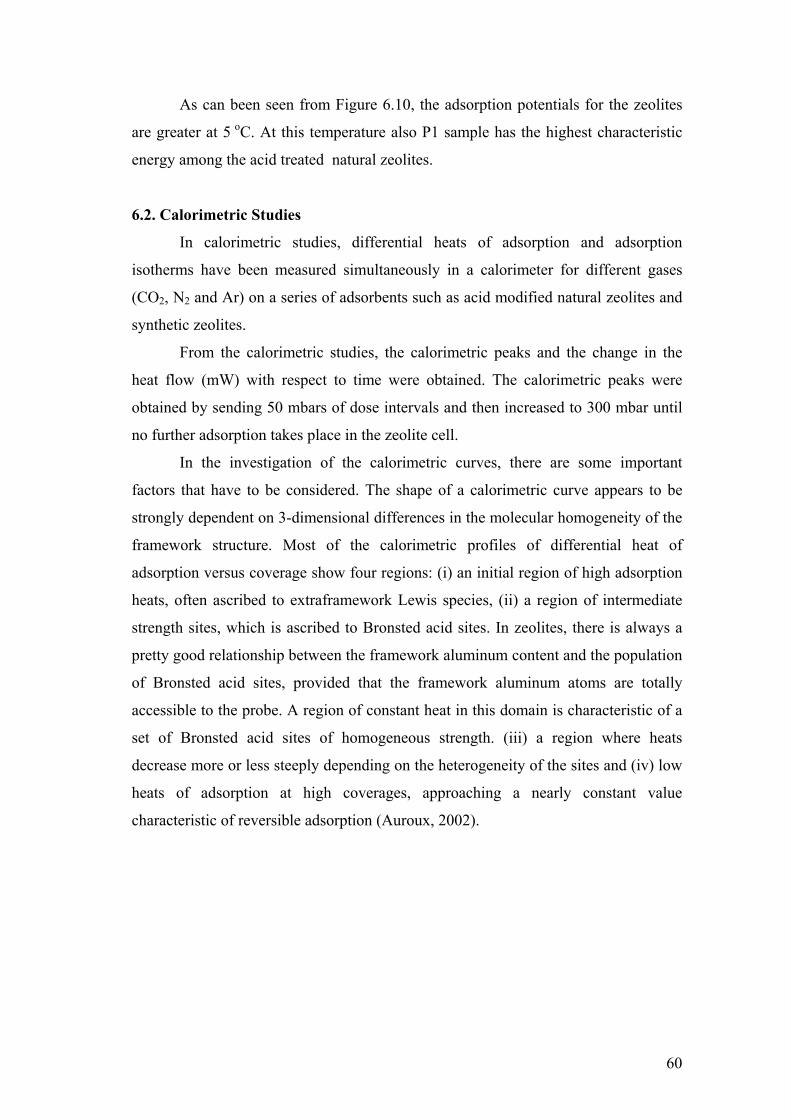
As can been seen from Figure 6.10, the adsorption potentials for the zeolites
are greater at 5 oC. At this temperature also P1 sample has the highest characteristic
energy among the acid treated natural zeolites.
6.2. Calorimetric Studies
In calorimetric studies, differential heats of adsorption and adsorption
isotherms have been measured simultaneously in a calorimeter for different gases
(CO2, N2 and Ar) on a series of adsorbents such as acid modified natural zeolites and
synthetic zeolites.
From the calorimetric studies, the calorimetric peaks and the change in the
heat flow (mW) with respect to time were obtained. The calorimetric peaks were
obtained by sending 50 mbars of dose intervals and then increased to 300 mbar until
no further adsorption takes place in the zeolite cell.
In the investigation of the calorimetric curves, there are some important
factors that have to be considered. The shape of a calorimetric curve appears to be
strongly dependent on 3-dimensional differences in the molecular homogeneity of the
framework structure. Most of the calorimetric profiles of differential heat of
adsorption versus coverage show four regions: (i) an initial region of high adsorption
heats, often ascribed to extraframework Lewis species, (ii) a region of intermediate
strength sites, which is ascribed to Bronsted acid sites. In zeolites, there is always a
pretty good relationship between the framework aluminum content and the population
of Bronsted acid sites, provided that the framework aluminum atoms are totally
accessible to the probe. A region of constant heat in this domain is characteristic of a
set of Bronsted acid sites of homogeneous strength. (iii) a region where heats
decrease more or less steeply depending on the heterogeneity of the sites and (iv) low
heats of adsorption at high coverages, approaching a nearly constant value
characteristic of reversible adsorption (Auroux, 2002).
60

6.2.1. Calorimetric Peaks of CO2, N2 and Ar on Zeolites
0
HeatFlow/mW
-5.0
-2.5
0.0
2.5
5.0
7.5
10.0
12.5
15.0
17.5
20.0
CO2-50+300 mbar
CO2-300 continuedAr
Figure:30/12/2003 Mass (mg):501.6
Cell: High pressure stainless steelAtmosphere:AirExperiment:Dogalzeolit-CO2-ads-2Procedure:cp (Zone 2)C80
Exo
ExoExo
HeatFlow/mW
10
12
CO2
04/09/2003 Mass (mg): 570Atmosphere: AirSample C1-6h: CO2, N2 25°C
C8o
N2
0Exo
0 500
HeatFlow/mW
0.0 0.5 1.0 1.5 2.0 2.5 3.0 3.5 4.0 4.5 5.0 5.5 6.0 6.5
27/10/200C80
Exo
Exo
0 5000
HeatFlow/mW
-2.5
0.0
2.5
5.0
7.5
10.0
12.5
15.0
17.5
Figure:04/12/2003
ExpeProceC80
Exo
ExoExooo
NCW
Time/s5000 10000 15000 20000 25000 30000 35000
N2
2500
0
2
4
6
8
Time/s0 10000 15000 20000 25000 30000 35000
CO2
3 Mass (mg):508.7Atmosphere: AirSample: C3-3h
N2
Ar
0 2500 5000
HeatFlow/mW
0.0
0.5
1.0
1.5
2.0
2.5
3.0
3.5
4.0
4.5
5.0
5.5
6.0
6.5
7.0
7.5
25/09/2003Sample: P
C80Exo
Exo
Time/s10000 15000 20000 25000 30000 35000
CO2-50+300 mbar-1
CO2-continued-2
Mass (mg):518.5Cell: High pressure stainless steelAtmosphere:Airriment:zeolite5A-CO2-ads-1
dure:cp (Zone 2)
1
CO2-continued-3
N2Ar
5000 15000
HeatFlow/mW
0
2
4
6
8
10
12
Figure:09/12/2003
Experiment:zeolitProcedure:cp (ZoC80
Exo
ExoExoooxo
C1-6h
Time/s7500 12500 17500 22500
CO2
Mass (mg): 525.3 25C Atmosphere: Air 1
N2
Ar
C3-3h
PTime/s7500 10000 12500 15000 17500 20000
CO2-50+300 mbar- 1
CO2-300 continued-2CO2-300 continued-3
Mass (mg):555.2Cell: High pressure stainless steelAtmosphere:Aire13X-CO2-ads-1
ne 2)
5A
13XTime/s25000 35000 45000
CO2-continued-4N2Ar
61
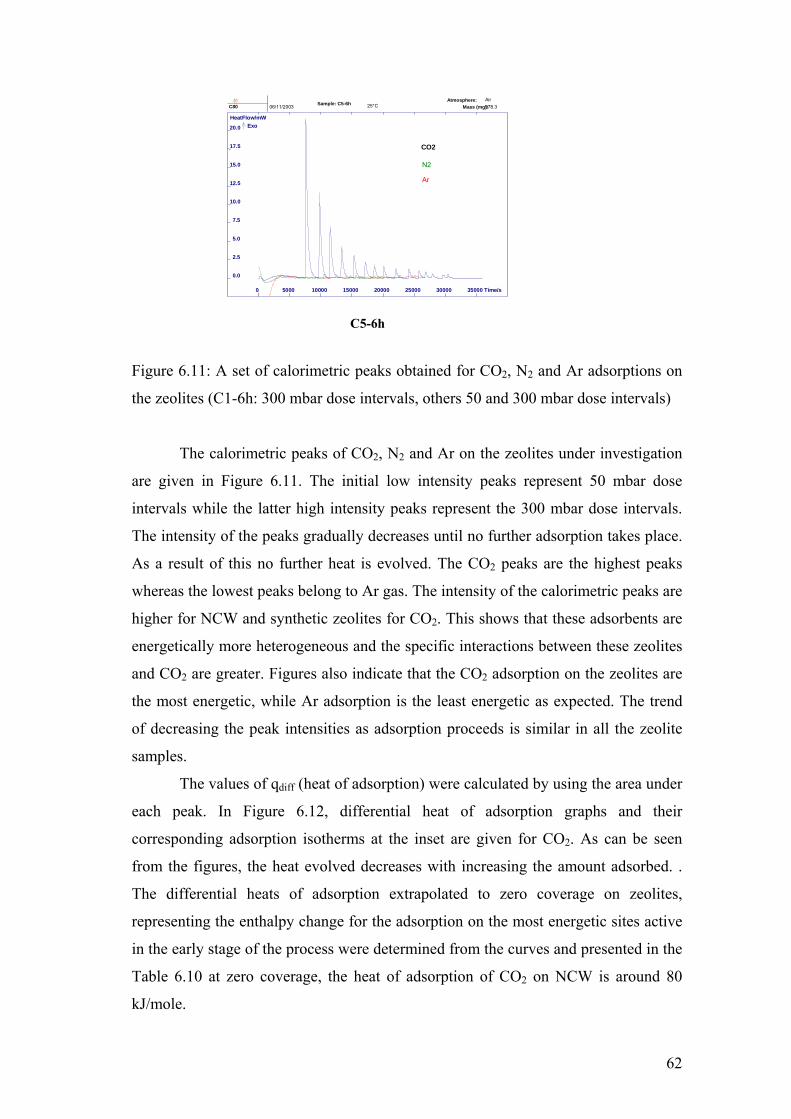
Time/s0 5000 10000 15000 20000 25000 30000 35000
HeatFlow/mW
0.0
2.5
5.0
7.5
10.0
12.5
15.0
17.5
20.0
CO2
N2
Ar
06/11/2003 Mass (mg):578.3Atmosphere: Air
Sample: C5-6h 25°CC80
Exo
Figure 6.11: A set of calorimetri
the zeolites (C1-6h: 300 mbar do
The calorimetric peaks of
are given in Figure 6.11. The i
intervals while the latter high in
The intensity of the peaks gradua
As a result of this no further he
whereas the lowest peaks belong
higher for NCW and synthetic ze
energetically more heterogeneou
and CO2 are greater. Figures also
the most energetic, while Ar ads
of decreasing the peak intensitie
samples.
The values of qdiff (heat o
each peak. In Figure 6.12, d
corresponding adsorption isother
from the figures, the heat evolve
The differential heats of adsor
representing the enthalpy change
in the early stage of the process w
Table 6.10 at zero coverage, the
kJ/mole.
C5-6h
c peaks obtained for CO2, N2 and Ar adsorptions on
se intervals, others 50 and 300 mbar dose intervals)
CO2, N2 and Ar on the zeolites under investigation
nitial low intensity peaks represent 50 mbar dose
tensity peaks represent the 300 mbar dose intervals.
lly decreases until no further adsorption takes place.
at is evolved. The CO2 peaks are the highest peaks
to Ar gas. The intensity of the calorimetric peaks are
olites for CO2. This shows that these adsorbents are
s and the specific interactions between these zeolites
indicate that the CO2 adsorption on the zeolites are
orption is the least energetic as expected. The trend
s as adsorption proceeds is similar in all the zeolite
f adsorption) were calculated by using the area under
ifferential heat of adsorption graphs and their
ms at the inset are given for CO2. As can be seen
d decreases with increasing the amount adsorbed. .
ption extrapolated to zero coverage on zeolites,
for the adsorption on the most energetic sites active
ere determined from the curves and presented in the
heat of adsorption of CO2 on NCW is around 80
62

0
5
0 1 2 3 4 5 6
Amount Adsorbed [mmol/g]
10
15
20
25
30
35
40
Hea
t of A
dsor
ptio
n [k
j/mol
]
00,5
11,5
22,5
33,5
44,5
55,5
66,5
0 200 400 600 800 1000
Pressure [mbar]
Am
ount
Ads
orbe
d [m
mol
/gr]
0
10
20
30
40
50
60
0 2 4 6 8 10 12 14 16 18
Amount Adsorbed [mmol/g]
Hea
t of A
dsor
ptio
n [k
j/mol
]
0
2
4
6
8
10
12
14
16
18
0 200 400 600 800 1000
Pressure [mbar]
Amou
nt A
dsor
bed
[mm
ol/g
]
010
0 1 2 3 4
2030405060708090
mount Adsorbed [mmol/g]
Hea
t of A
dsor
ptio
n [k
J/m
ol]
A
0
1
2
3
4
0 200 400 600 800
Pressure [mbar]
Am
ount
Ads
orbe
d [m
mol
/g]
0
10
20
30
40
0 2 4 6 8
Amount Adsorbed [mmol/g]
Hea
t of A
dsor
ptio
n [m
mol
/g]
0
2
4
6
8
0 200 400 600 800 1000
pressure [mbar]
amou
nt a
dsor
bed
[mm
ol/g
]
0
20
40
60
80
100
0 1 2 3 4
Amount Adsorbed [mmol/g]
Pres
sure
[mba
r]
00.5
11.5
22.5
3
0 200 400 600 800
Pressure [mbar]
Amou
nt A
dsor
bed
[mm
ol/g
]
0
20
40
60
80
100
120
0 2 4 6 8 10
Amount Adsorbed [mmol/g]
Hea
t of A
dsor
ptio
n [k
J/m
ol]
0
2
4
6
8
10
0 200 400 600 800 1000
Pressure [mbar]
Amou
nt A
dsor
bed
[mm
ol/g
]
0
20
40
60
80
0 2 4 6 8
Amount Adsorbed [mmol/g]
Hea
t of A
dsor
ptio
n [k
J/m
ol]
0
1
2
3
4
5
6
7
0 200 400 600 800 1000
Pressure [mbar]
Am
ount
Ads
orbe
d [m
mol/
g]
13X
5A P1
C3-3h C5-6h
C1-6h NCW
Figure 6.12: Differential Heat of Adsorption of CO2 on Zeolites
63
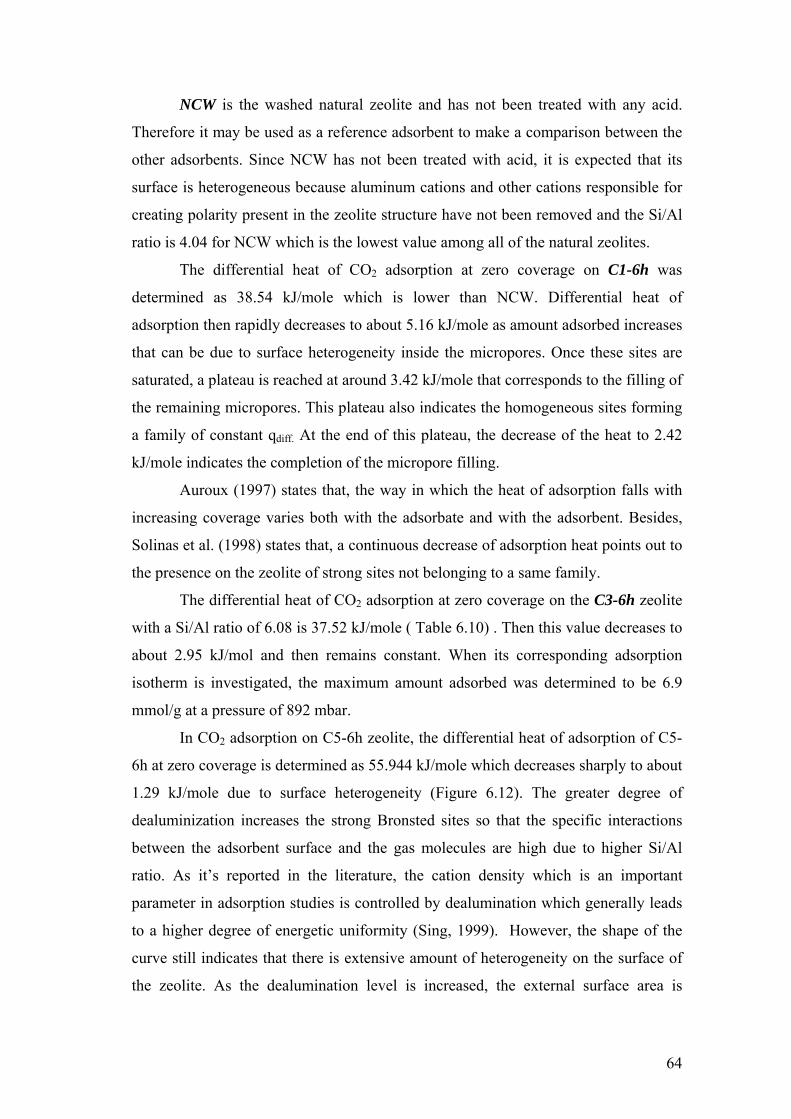
NCW is the washed natural zeolite and has not been treated with any acid.
Therefore it may be used as a reference adsorbent to make a comparison between the
other adsorbents. Since NCW has not been treated with acid, it is expected that its
surface is heterogeneous because aluminum cations and other cations responsible for
creating polarity present in the zeolite structure have not been removed and the Si/Al
ratio is 4.04 for NCW which is the lowest value among all of the natural zeolites.
The differential heat of CO2 adsorption at zero coverage on C1-6h was
determined as 38.54 kJ/mole which is lower than NCW. Differential heat of
adsorption then rapidly decreases to about 5.16 kJ/mole as amount adsorbed increases
that can be due to surface heterogeneity inside the micropores. Once these sites are
saturated, a plateau is reached at around 3.42 kJ/mole that corresponds to the filling of
the remaining micropores. This plateau also indicates the homogeneous sites forming
a family of constant qdiff. At the end of this plateau, the decrease of the heat to 2.42
kJ/mole indicates the completion of the micropore filling.
Auroux (1997) states that, the way in which the heat of adsorption falls with
increasing coverage varies both with the adsorbate and with the adsorbent. Besides,
Solinas et al. (1998) states that, a continuous decrease of adsorption heat points out to
the presence on the zeolite of strong sites not belonging to a same family.
The differential heat of CO2 adsorption at zero coverage on the C3-6h zeolite
with a Si/Al ratio of 6.08 is 37.52 kJ/mole ( Table 6.10) . Then this value decreases to
about 2.95 kJ/mol and then remains constant. When its corresponding adsorption
isotherm is investigated, the maximum amount adsorbed was determined to be 6.9
mmol/g at a pressure of 892 mbar.
In CO2 adsorption on C5-6h zeolite, the differential heat of adsorption of C5-
6h at zero coverage is determined as 55.944 kJ/mole which decreases sharply to about
1.29 kJ/mole due to surface heterogeneity (Figure 6.12). The greater degree of
dealuminization increases the strong Bronsted sites so that the specific interactions
between the adsorbent surface and the gas molecules are high due to higher Si/Al
ratio. As it’s reported in the literature, the cation density which is an important
parameter in adsorption studies is controlled by dealumination which generally leads
to a higher degree of energetic uniformity (Sing, 1999). However, the shape of the
curve still indicates that there is extensive amount of heterogeneity on the surface of
the zeolite. As the dealumination level is increased, the external surface area is
64

increased accordingly. Therefore, the adsorption capacity of the C5-6h zeolite is
determined to be 16.34 mmol/g at a pressure of 937.5 mbar.
As in the HCl treated and NCW zeolites, the heat of CO2 adsorption on the
zeolite treated with H3PO4 decreases with increase in the amount adsorbed. The Si/Al,
the degree of dealumination is the lowest for P1 zeolite among the acid treated
zeolites which is 5.01 and therefore the specific interaction between the CO2 gas and
the adsorbent surface is the greatest. The heat of adsorption of CO2 on P1 at zero
coverage is determined as 79.5 kJ/mole (Table 6.10). This high value of adsorption
heat can indicate that strong interactions may result from the low Si/Al ratio and the
phosphorous present on the surface of the zeolite with the CO2 gas having a high
quadrupole moment. The cations present in the P1 zeolite is determined by SEM-
EDX analysis and according to that 0.293 wt % of phosphorous is present on the
zeolite.
Differential heat of adsorption of CO2 on 5A at zero coverage is determined as
83.08 kJ/mole which is the highest heat of adsorption among the adsorbents. The heat
of adsorption curve makes a minimum at about 14.16 kJ/mole then increases to about
53 kJ/mole due to adsorbate-adsorbate interactions.
The heat of adsorption of CO2 on 13X at zero coverage is around 72.75
kJ/mole. As a synthetic zeolite, 13X has high specific interactions with the CO2 as in
5A zeolite due to its lower Si/Al ratio. Furthermore, the fluctuations in the heat of
adsorption curves of 13X and 5A are due to adsorbate-adsorbate interactions.
65
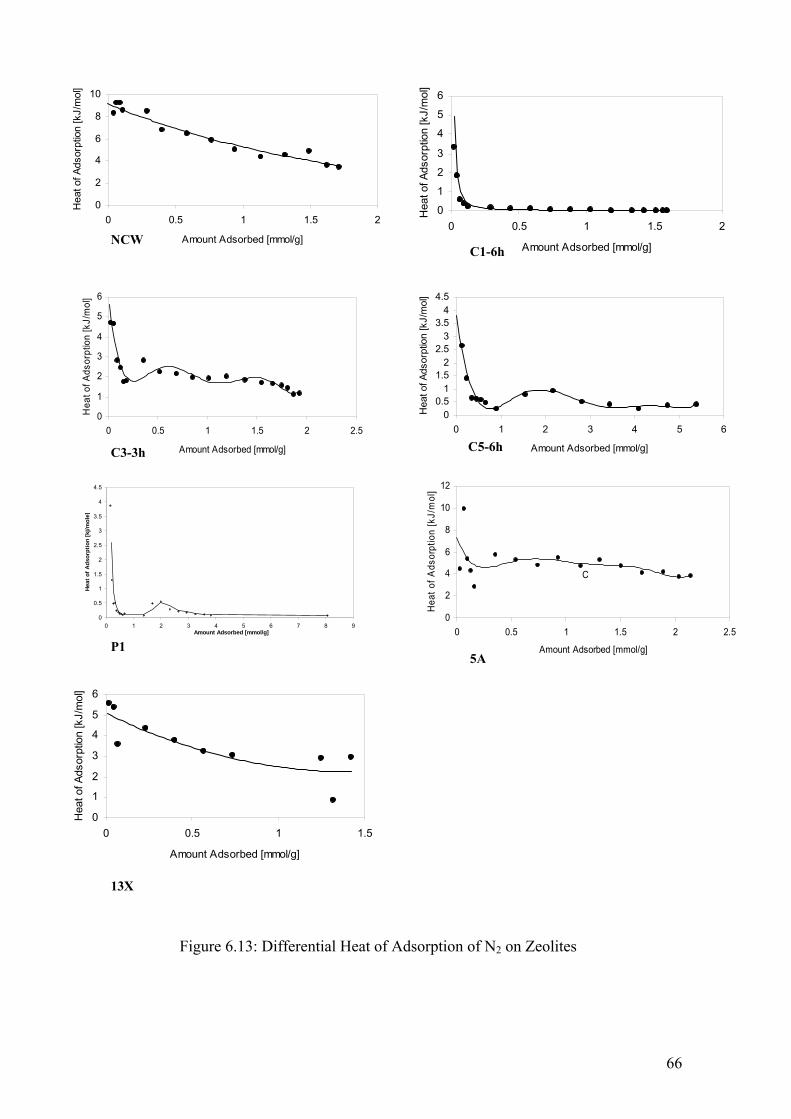
0
0.5
1
1.5
2
2.5
3
3.5
4
4.5
Hea
t of A
dsor
ptio
n [k
j/mol
e]
0
1
2
3
4
5
6
Hea
t of A
dsor
ptio
n [k
J/m
ol]
0
2
4
6
8
10
0 0.5 1 1.5 2
Amount Adsorbed [mmol/g]
Hea
t of A
dsor
ptio
n [k
J/m
ol]
0
1
2
3
4
5
6
0 0.5 1 1.5 2
Hea
t of A
dsor
ptio
n [k
J/m
ol]
5
6
J/m
ol]
0
1
2
3
4
Hea
t of A
dsor
ptio
n [k
NCW
0 1 2 3 4 5 6 7 8 9Amount Adsorbed [mmol/g]
0 0.5 1 1.5 2 2.5
Amount Adsorbed [mmol/g]
Amount Adsorbed [mmol/g]
00.5
11.5
22.5
33.5
44.5
0H
eat o
f Ads
orpt
ion
[kJ/
mol
]
0
2
4
6
8
10
12
0
Hea
t of A
dsor
ptio
n [k
J/m
ol]
1
0 0.5 1 1.5
Amount Adsorbed [mmol/g]
Figure 6.13: Differential Heat of Adsorption
C1-6h
1 2 3 4 5 6
Amount Adsorbed [mmol/g]h
C3-3h C5-60.5 1 1.5 2 2.5
Amount Adsorbed [mmol/g]
C
P
5A13X
of N2 on Zeolites
66
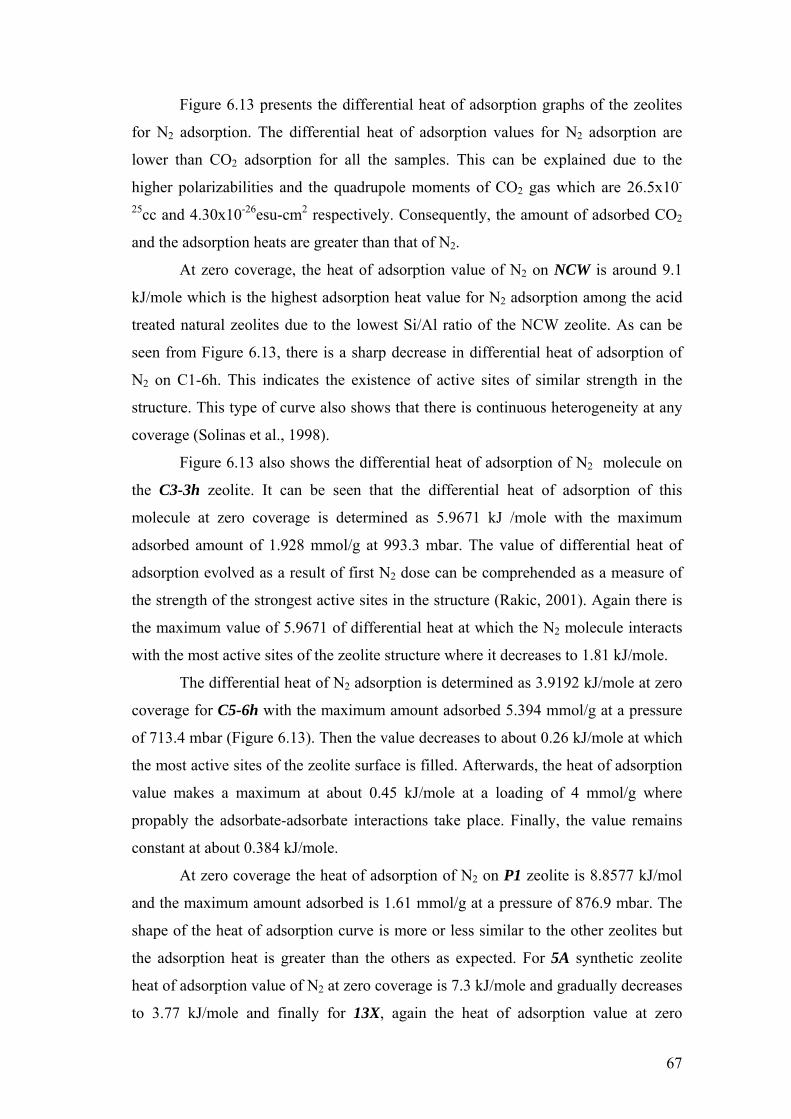
Figure 6.13 presents the differential heat of adsorption graphs of the zeolites
for N2 adsorption. The differential heat of adsorption values for N2 adsorption are
lower than CO2 adsorption for all the samples. This can be explained due to the
higher polarizabilities and the quadrupole moments of CO2 gas which are 26.5x10-
25cc and 4.30x10⁻²⁶esu-cm2 respectively. Consequently, the amount of adsorbed CO2
and the adsorption heats are greater than that of N2.
At zero coverage, the heat of adsorption value of N2 on NCW is around 9.1
kJ/mole which is the highest adsorption heat value for N2 adsorption among the acid
treated natural zeolites due to the lowest Si/Al ratio of the NCW zeolite. As can be
seen from Figure 6.13, there is a sharp decrease in differential heat of adsorption of
N2 on C1-6h. This indicates the existence of active sites of similar strength in the
structure. This type of curve also shows that there is continuous heterogeneity at any
coverage (Solinas et al., 1998).
Figure 6.13 also shows the differential heat of adsorption of N2 molecule on
the C3-3h zeolite. It can be seen that the differential heat of adsorption of this
molecule at zero coverage is determined as 5.9671 kJ /mole with the maximum
adsorbed amount of 1.928 mmol/g at 993.3 mbar. The value of differential heat of
adsorption evolved as a result of first N2 dose can be comprehended as a measure of
the strength of the strongest active sites in the structure (Rakic, 2001). Again there is
the maximum value of 5.9671 of differential heat at which the N2 molecule interacts
with the most active sites of the zeolite structure where it decreases to 1.81 kJ/mole.
The differential heat of N2 adsorption is determined as 3.9192 kJ/mole at zero
coverage for C5-6h with the maximum amount adsorbed 5.394 mmol/g at a pressure
of 713.4 mbar (Figure 6.13). Then the value decreases to about 0.26 kJ/mole at which
the most active sites of the zeolite surface is filled. Afterwards, the heat of adsorption
value makes a maximum at about 0.45 kJ/mole at a loading of 4 mmol/g where
propably the adsorbate-adsorbate interactions take place. Finally, the value remains
constant at about 0.384 kJ/mole.
At zero coverage the heat of adsorption of N2 on P1 zeolite is 8.8577 kJ/mol
and the maximum amount adsorbed is 1.61 mmol/g at a pressure of 876.9 mbar. The
shape of the heat of adsorption curve is more or less similar to the other zeolites but
the adsorption heat is greater than the others as expected. For 5A synthetic zeolite
heat of adsorption value of N2 at zero coverage is 7.3 kJ/mole and gradually decreases
to 3.77 kJ/mole and finally for 13X, again the heat of adsorption value at zero
67
coverage of N2 on 13X is much lower than that of CO2 which is 5.20 kJ/mol. The
curve has a decreasing trend and then reaches a plateau at around 3 kJ/mole.
The fluctuation of the heat of adsorption values with coverage is a clear
indication that there are active sites of different strength on the surface and as surface
coverage increases, after completion of monolayer coverage, adsorbate- adsorbate
interactions take place.
C3-3h NCW
C5-6h
P1
0
1
2
3
4
5
6
7
0 0.5 1 1.5 2 2.5
Amount Adsorbed [mmol/g]
Hea
t of A
dsor
ptio
n [k
J/m
ol]
0
0 . 5
1
1 . 5
2
2 . 5
3
3 . 5
0 1 2 3 4A m o u n t A d s o r b e d [ m m o l / g ]
Hea
t of a
dsor
ptio
n [k
J/m
ol]
00.5
11.5
22.5
33.5
44.5
0 1 2 3 4 5 6
Amount Adsorbed [mmol/g]
Hea
t of A
dsor
ptio
n [k
J/m
ol]
0
1
2
3
4
5
6
0 0.5 1 1.5
Amount Adsorbed [mmol/g]
Hea
t of A
dsor
ptio
n [k
J/m
ol]
0
2
4
6
8
10
12
0 1 2 3 4
Amount Adsorbed [mmol/g]
Hea
t of A
dsor
ptio
n [k
J/m
ol]
0
0.5
1
1.5
2
2.5
0 0.5 1 1.5 2
Amount Adsorbed [mmol/g]
Hea
t of A
dsor
ptio
n [k
J/m
ol]
P1C5-6h
C3-3h NCW
5A
13X
Figure 6.14: Differential Heat of Adsorption of Ar on Zeolites
68

As can be seen from Figure 6.14 the heat of adsorption values at zero
coverage for all the zeolites are lower than for N2 and CO2. The main reason for that
can be explained as Ar gas doesn’t have a quadrupole moment and hence interaction
of Ar with the zeolites is not specific for the Lewis or the Bronsted acidic sites, but
involves only a nonspecific interaction dominated by dispersive forces. The highest
zero coverage heat of asdsorption belongs to 5A zeolite which also exhibits the
highest interaction for CO2.
Table 6.10: Comparison of the heat of adsorption values of the zeolites at zero
coverage
*Untreated natural zeolite
Heat of ads at zero loading [kJ/mol]
Zeolites Si/Al
CO2 N2 Ar
Reference
NCW 4.04 80.39 9.10 3.96 This study
NZ* 10.72 Ackley and Yang, 1991
C1-6h 5.25 38.54 1.83 - This study C3-3h 6.08 37.52 6.38 6.03 This study C5-6h 8.4 55.99 3.92 1.39 This study
P1 5.01 79.5 8.86 4.40 This study 5A 0.98 83.08 7.31 9.86 This study
13X 1.35 72.75 5.20 1.90 This study 13X 1.23 49.1 19.9 12.7 Dunne et.al,1996
The heat of adsorption values of the zeolites under investigation at zero coverage are
compared in Table 6.10. It can be concluded that in all the adsorbents, adsorption
heats of CO2 gas is the highest due to polarizabilities and the quadrupole moments of
the CO2 gas. For Ar gas it is the lowest since it’s weakly adsorbed by the adsorbents.
The highest adsorption heat value among the acid treated natural zeolites belongs to
P1 zeolite for CO2 which is due to its lowest Si/Al ratio. When taking into
consideration the heat of adsorption values of CO2 on the adsorbents, the heat of
adsorption values in decreasing order are approximately; 5A > P1 > ~ NCW > 13X >
C5 > C1 which are approximately consistent with the results obtained from
adsorption studies. The reason for having similar adsorption heats for P1 and NCW is
due to the proximity in their Si/Al ratios which are 5.01 and 4.04 for P1 and NCW
respectively. Naturally the heat of adsorption values should decrease in the order of
increasing Si/Al ratio since, according to the degree of dealumination, the surface of
69

the adsorbent becomes more homogeneous due to the reduction of the specific
interactions between the adsorbent surface and the adsorbate gas. However, heat of
adsorption value of zeolite C5-6h is greater than that of C1-6h and C3-3h. The reason
for this can be explained in such a way that although the specific interactions are
reduced as the degree of dealuminization increases, the acidic strength of the strong
Bronsted sites increases with the dealumination level (Aurox A., 2002) ;hence
producing more active sites. Therefore, the heat of adsorption of C5-6h zeolite is
greater than that of C1-6h and C3-3h zeolites. Another important parameter to be
considered is the cation size in which the gas molecules interact with during
adsorption. In fact, interactions decrease with increasing cation size (Savitz et al.,
2000). Auroux (1997) reported that, zeolites with large pores display lower
adsorption heats than medium or small pore size zeolites. Their number of acid sites
per unit cell is also lower. Therefore, gas molecules may interact with smaller
exchangeable cations of the adsorbent; hence, exhibiting lower adsorption heat
values. When the pore diameters of the zeolites are investigated (Table 5.3), it is seen
that P1 zeolite with smaller pore diameters has higher heat of adsorption observed for
P1 zeolite while in C5-6h zeolite with an apperent median pore diameter of 6.3 Å,
lower heat of adsorption value is determined. This indicates that as pore size
increases, heat of adsorption value decreases.
On the other hand, 5A synthetic zeolite which is untreated has the highest heat
of adsorption value which may be due to the Si/Al ratio that it possesses. Also, the
interactions with the probe molecules are specific and very strong.
Washed natural zeolite (NCW) has a high heat of adsorption value because
natural zeolites are usually heterogeneous materials when not treated with any
method.
When Table 6.10 is investigated, it can be said that in most of the adsorbents,
CO2 gas has the highest heat of adsorption value at zero coverage while Ar has the
lowest due to properties of the gas molecules.
6.3. Determination of the Isosteric heat of Adsorption
The isosteric heat of adsorption of a gas is a key variable for the design of
adsorptive gas separation processes. For pure gas adsorption the heat is defined by;
70

q° = -[δH°/δnm]T (6.4)
where q° is the isosteric heat of adsorption of a pure gas at an adsorbate loading of nm
and temperature T. H° is the specific enthalpy and nm is the specific amount adsorbed
(Siperstein et al., 2000). The corresponding gas-phase pressure is P.
The definition of q° given by above equation has recently been used to design
calorimetric experiments for the direct measurement of isosteric heats as a function of
nm at constant T (Cao et al., 2001).
The above equation is equivalent to:
q° = -R [δlnP/δ(1/T)]nm (6.5)
Plots of ln P as a function of reciprocal absolute temperature at constant
loading are called adsorption isosteres.
The isosteric heat of adsorption of CO2 and N2 on the zeolite samples are
determined by constructing the plots of ln (P) vs ln 1/T.
71

Table 6.11. Heat of Adsorption values of CO2 and N2 on the zeolites
CO2 N2
C1-6h n
[mmol/g] - - - - 0.028 0.03 0.054 0.076
qo
[kJ/mol] - - - - 55.4 54.2 35.7 48.7
C3-3h n
[mmol/g] 0.35 0.87 1.5 1.65 0.1 0.16 0.21 0.23
qo
[kJ/mol] 10.6 12 14 14 12.2 14.2 17.8 19
C5-6h n
[mmol/g] 0.13 0.87 1 1.4 0.07 0.09 0.11 0.16
qo
[kJ/mol] 9.7 7.5 3.5 3.6 8.7 9.1 8.4 11.1
5A n
[mmol/g] 0.14 0.82 2.35 5.47 0.02 0.08 0.17 0.58
qo
[kJ/mol] 30.2 34.5 32.3 0.004 19.1 27.3 27.2 27.9
P1 n
[mmol/g] 1.64 1.74 1.83 1.92 0.14 0.24 0.29 0.31
qo
[kJ/mol] 69.88 60.86 55.21 47 20 19.2 18.9 20.8
N2 n
[mmol/g] - - - - 0.07 0.13 0.15 0.18
qo
[kJ/mol] - - - - 13.1 16.2 16.5 18.6
NCW n
[mmol/g] 1.64 1.83 1.93 2.04 0.22 0.35 0.42 0.5
qo
[kJ/mol] 31.1 23.1 23.03 14 2.87 3.45 4.17 4.39
Table 6.11 presents the heat of adsorption values calculated theoretically at
different n values for CO2 and N2 adsorption. Table 6.11 shows that for N2
adsorption, isosteric heats calculated theoretically by Clasius-Clapeyron equation are
fluctuated with increasing n values for C1-6h and C5-6h zeolites which indicate that
these adsorbents are comparatively homogeneous. Because, isosteric heat of
adsorption is independent of n for an energetically homogeneous adsorbent. On the
other hand, at increasing n values, isosteric heats of C3, N2 and 5A samples for N2
adsorption increase which shows that the lateral interactions between the adsorbed
molecules are strong. However, for CO2 adsorption, as n increases isosteric heat
72

decreases which indicates that 5A zeolite is energetically heterogeneous for CO2
adsorption. The same trend is also valid for C5-6h sample and it shows heterogeneity
for CO2. Besides for CO2 adsorption, there is a decreasing trend in isosteric heats as
adsorbate loading increases, which shows that samples are strongly heterogeneous
and this was also supported by the interaction parameters of the Langmuir and Sips
Models.
The adsorption capacities of the zeolites for N2 are by a great extent consistent
with the microcalorimetric data. Because, 5A and P1 samples have the highest
adsorption capacities and they have fairly high heat of adsorption which are 7.31 and
8.86 kJ/mole respectively while C1 has the lowest heat of adsorption value of 1.83
kj/mole and thus supports the result that C1 has the lowest adsorption capacity. As the
specific interactions between the adsorbent and N2 gas are increased, the gas
molecules are more adsorbed by the adsorbents therefore as the heat of adsorption
increased the adsorbed amount of the gas molecules increased.
Besides, the monolayer adsorption capacities for N2 determined by Langmuir
and Sips Models are consistent with the experimental data. The highest monolayer
capacity calculated by these models at both temperatures belongs to 5A zeolite and
the lowest one to C1 sample which is also consistent with the experimental results in
microcalorimetry.
As a result, the comparison of the experimental results and theoretical results
yield that for N2, P1 zeolite has the highest heterogeneity among the acid treated
natural zeolites. Besides, 5A zeolite has the highest heterogeneity for CO2 due to the
specific interactions. C5-6h and C1-6h zeolites are comparatively homogeneous due
to their higher Si/Al ratio. However, the heat of adsorption values calculated
theoretically for CO2 are lower than the values obtained experimentally. Auroux
states that (1997), in the case of zeolitic systems, the values of adsorption heats
obtained experimentally and theoretically differ quite considerably. Differences can
be attributed to the fact that in calculating isosteric heats of adsorption using the
Clasius-Clapeyron equation, it is difficult to evaluate accurately a derivative from an
experimental curve. Direct calorimetric measurements are free from such deviations
and provide more reliable data.
73

CONCLUSION
Clinoptiloite-rich natural zeolitic tuff from Gördes, Fındıcak region (Manisa,
Turkey) treated with HCl, HNO3 and 1.1 M H3PO4 acid solutions and synthetic
zeolites namely 5A and 13X have been investigated through volumetric and
calorimetric studies by using adsorption of CO2, N2 and Ar gases. In volumetric
studies, the adsorption isotherms of these gases on the zeolites were obtained at 5oC
and 25 oC. Model equations such as Langmuir, Sips, Dubinin Astakhov were applied
to the adsorption data in order to get information regarding the heterogeneity of the
acid treated natural zeolites and the results were compared with the untreated natural
zeolite and commercial synthetic zeolites. Besides, potential energy distributions of
the adsorbent-adsorbate systems were analyzed because the heterogeneity of the
microporous adsorbents is connected closely with the distribution of adsorption
potential in micropores. These distributions characterize the energetic heterogeneity
of microporous solids.
Adsorption studies showed that the amount adsorbed increased with
decreasing adsorption temperature for both gases. Among the acid treated natural
zeolites, the zeolites treated with 1.1 M H3PO4, P1 has the highest adsorption capacity
(2.24 mmol/g and 0.67 mmol/g) for CO2 and N2 while the natural zeolites has only
2.08 mmol/g and 0.51 mmol/g respectively at 5oC. Synthetic zeolites 13X and 5A
have higher CO2 (6.82 mmol/g and 5.46 mmol/g respectively) and N2 amount
(0.31mmol/g and 0.91 mmol/g) adsorbed at 5 oC. In N2 adsorption, Langmuir b
parameter called the affinity constant decreased as adsorption temperature increased.
Another model applied to the experimental data is the Sips adsorption model
equation. The Sips model t parameter characterizing the system heterogeneity is
higher for CO2 adsorption than N2 adsorption and decreases with increasing
temperature. This indicates that the CO2 molecules give the more specific interactions
than N2 molecule. The Langmuir equation was applied to the data for calculation of
the Henry’s constant. The pure component selectivity of CO2 over N2 are the highest
for NCW zeolite and P1 sample follows it which are 408 and 151 at 25oC
respectively. The selectivity is the highest when Si/Al ratio is around 4. Unlike Henry
constants for N2, Henry constants for CO2 were determined to be effected
significantly by the change of the Si/Al ratio due to strong specific interactions
between the quadrupole moment of CO2 and the adsorbents.
74

The results obtained calorimetrically were generally consistent with the
adsorption data. According to this, P1 was determined to have the highest heat of
adsorption at zero coverage among the acid treated natural zeolites (while washed
natural zeolite (NCW) has a close adsorption heat with the P1 sample which were
approximately 80.29 and 80.39 kJ/mole. Besides, 5A zeolite has the highest heat of
adsorption at zero coverage which indicates that it’s the most heterogeneous among
the zeolites. These results are consistent with the ones obtained from adsorption
studies. Finally, by using the Clasius-Clapeyron Equation isosteric heat of adsorption
values for the zeolites were calculated theoretically in order to compare with the ones
obtained from microcalorimetry experimentally. These results also indicated that 5A
and P1 samples are heterogeneous. However, adsorption heats obtained
experimentally are greater than the ones obtained theoretically. Differences can be
attributed to the fact that in calculating isosteric heats of adsorption using the Clasius-
Clapeyron equation, it is difficult to evaluate accurately a derivative from an
experimental curve. Direct calorimetric measurements are free from such deviations
and provide more reliable data.
75

REFERENCES 1. Ackley M.W., Giese R.F., Yang R.T., “Clinoptilolite: Untapped potential for
kinetic gas separations,” Zeolites, 12 (1992) 780-788
2. Ackley M.W., Yang R.T., “Adsorption characteristics of high-exchange
clinoptilolites,” Ind. Eng. Chem. Res., 30 (1991) 2523-2530
3. Armenta G.A., Jimenez L.D., “Characterization of the porous structure of two
naturally occuring materials through N2-adsorption (77K) and gas
chromatographic methods, Colloid and Surfaces, 176 (2001) 245-252
4. Armenta G.A., Ramirez G.H., Loyola E.F., Castaneda A.U., Gonzalez R.S.,
Munoz C.T., Lopez A.J., Castellon E.R., “Adsorption kinetics of CO2, O2, N2 and
CH4 in cation-exchanged clinoptilolite,” J. Phys. Chem B, 105 (2001) 1313-1319
5. Auroux A., “Acidity characterization by microcalorimetry and relationship with
reactivity,” Topics in Catalysis, 4 (1997) 71-89
6. Auroux A., “Microcalorimetry methods to study the acidity and reactivity of
zeolites, pillared clays and mesoporous materials,” Topics in Catalysis, 19 (2002)
205-213
7. Becer M., (2003), Ms Thesis, Izmir Institute of Technology, Turkey
8. Bolis V., Broyer M., Barbaglia A., Busco C., Foddanu G.M., Ugliengo P., “Van
der Waals interactions on the acidic centres localized in zeolites nanocavities: a
calorimetric and computer modeling study”, Journal of Molecular Catalysis A:
Chemical, 204-205 (2003) 561-569
9. Clarkson C.R., Bustin R.M., “ Binary gas adsorption/desorption isotherms effect
of moisture and coal composition upon carbon dioxide selectivity over methane,”
International Journal of Coal Geology, 42, (2000), 241-271
10. Çakıcıoğlu F., Ülkü S., “Adsorption characteristics of Lead-, Barium- and
hydrogen rich clinoptilolite mineral”, Adsorption Science and Technology,
21(2003), 309-317
11. Demirci A., (1996), Ms Thesis, Ege University, Turkey
12. Do D.D., Adsorption Analysis: Equilibria and Kinetics, (Imperial College Press,
1998)
13. Dunne J.A., Sircar S., Gorte R.J., Myers A.L., “Calorimetric heats of adsorption
and adsorption isotherms.2. O2, N2, Ar, CO2, CH4, C2H6 and SF6 on NaX, H-
ZSM-5, and Na-ZSM-5, “Langmuir, 12 (1996) 5896-5904
76
14. Gil A., Grange P., “Application of the Dubinin-Radushkevich and Dubinin-
Astakhov Equations in the characterization of the microporous solids,” Colloids
and Surfaces, 113, (1996), 39-50
15. Guil J.M., Garcia J. E., Paniego A.R., Menayo J.M., “Gas/surface titration
microcalorimetry. Energetics of oxygen adsorption on supported iridium
catalysts,” Topics in catalysis, 19 (2002) 313-321
16. Guil J.M., Melon J.A., Carvalho M.B., Carvalho M.B., Pires J., “Adsorption
microcalorimetry of probe molecules of different size to characterize the
microporosity of pillared clays,” 51 (2002) 145-154
17. Huesca R.H., Diaz L., Armenta G.A., “Adsorption equilibria and kinetics of CO2,
CH4 and N2 in natural zeolites,” Separation Purification Technology, 15 (1999)
163-173
18. Jayaraman A., Yang R.T., “Adsorption of nitrogen, oxygen and argon on Na-CeX
zeolites,” Adsorption, 8 (2002) 271-278
19. Karacan Ö.C., Okandan E., “Assessment of energetic heterogeneity of coals for
gas adsorption and its effect on mixture predictions for coalbed methane studies,”
Fuel, 79 (2000) 1963-1974
20. Kluson P., Scaife S., Quirke N., “The design of microporous graphitic adsorbents
for selective separation of gases,” Separation Purification Technology, 20 (2000)
15-24
21. Mathias M.P. Kumar R., Moyer D.J., Schork M.J., Srinivasan S.R., Talu O.,
“Correlation of multicomponent gas adsorption by the dual-site Langmuir model.
Application to nitrogen/oxygen adsorptions. on 5A zeolite,” Ind. Eng. Chem. Res
35 (1996) 2477-2483
22. Pakseresth S., Kazemeini M., Akbarnejad M.M., “Equilibrium isotherms for CO,
CO2, CH4 and C2H4 on the 5A molecular sieve by a simple volumetric apparatus,”
Separation and Purification Technology, 28 (2002) 53-60
23. Rakic V., Dondur V., Hercigonja V., “Thermal effects of the interactions of carbo
monoxide with zeolites,” Thermochimica Acta, 379 (2001) 77-84
24. Rakic V., Dondur V., Mioc U., Jovanovic D., “Microcalorimetry in the
identification and characterization of the most reactive active sites of
heterogeneous catalysts,” Topics in Catalysis, 19 (2002) 241-247
25. Rege S.U., Yang R.T., Buzanowski M.A., “Sorbents for air prepurification in air
separation,” Chemical Engineering Science, 55 (2000) 4827-4838
77

26. Rozwadowski M., Wojsz R., Wisniewski K.E., Kornatowski J., “Description of
adsorption equilibrium on type A zeolites with use of the Polanyi-Dubinin
potential theory,” Zeolites, 9 (1989) 503-508
27. Ruthven D.M., Principles of Adsorption Processes (John Wiley and Sons, 1984)
28. Sakuth M., Meyer J., Gmehling J., “Measurement and prediction of binary
adsorption equilibria of vapors on dealuminated Y-zeolites (DAY),” Chemical
Engineering and Processing, 37, (1998) 267-277
29. Savitz S., Myers A.L., Gorte R.J., “A calorimetric investigation of CO, N2, and O2
in alkali-exchanged MFI,” Microporous and Mesoporous Materials, 37 (2000)
33-40
30. Rouquerol F., Rouquerol J., Sing K., Adsorption by powders and porous solids
(Academic Press, 1999)
31. Sircar S., “Applications of Gas Separation by Adsorption for the Future,”
Adsorption Science and Technology, 2001
32. Sircar S., Rao M.B., “Effect of adsorbate size on adsorption of gas mixtures on
homogeneous adsorbents,” AIChe Journal, 45 (1999) 2657-2661
33. Solinas V., Ferino I., “Microcalorimetric characterisation of acid-basic catalysis,”
Catalysis Today, 41 (1998) 179-189
34. Talu O., Li J., Kumar R., Mathias M.P., Moyer D.J., Schork M.J., “Measurement
and analysis of oxygen/nitrogen/5A-zeolite adsorption equilibria for air,” Gas
Separation Purification, 10, (1996), 149-159
35. Talu O., Zwiebel I., “Multicomponent adsorption equilibria of nonideal
mixtures,” AIChe Journal, 32 (1986) 1263-1276
36. Triebe R.W., Tezel F.H., “Adsorption of nitrogen and carbon monoxide on
clinoptilolite: Detrmination and prediction of pure and binary isotherms,” The
Canadian Journal of Chemical Engineering, 73 (1995) 717-724
37. Ustinov E.A., “Multicomponent equilibrium adsorption on heterogeneous
adsorbents,” Adsorption 6 (2000) 195-204
38. Webster C.E., Drago R.S., “The multiple equilibrium analysis quantitative
prediction of single and multi-component adsorption isotherms on carbonaceous
and zeolitic solids,” Microporous and mesoporous materials, 33 (1999) 291-306
78

APPENDIX
P1 (Si/Al: 5.01)
0
1
2
3
4
5
0.0033 0.0034 0.0035 0.0036 0.0037
1/T [1/K]
ln (P
)
n= 1.92n= 1.83
n= 1.74
n= 1.64
NCW (Si/Al: 4.04)
0
1
2
3
4
5
0.0033 0.0034 0.0035 0.0036 0.00371/T [1/K]
ln (P
)
n= 2.04
n= 1.93n= 1.83
n= 1.64
C5-6h (Si/Al: 8.4)
-7
-5
-3
-1
1
3
5
0.0033 0.0034 0.0035 0.0036 0.0037
1/T[1/K]
ln(P
) n=0.87
n=0.13
n=1n=1.4
C3-3h (Si/Al: 6.08)
-2
-10
1
2
34
5
0.0033 0.0034 0.0035 0.0036 0.00371/T [1/K]
ln (P
)n=1.65
n=1.5
n=0.87
n=0.35
5A (Si/Al: 0.98)
-6-4
-202
46
0.0033 0.0034 0.0035 0.0036 0.0037
n=5.47
n=2.35n=0.82
n=0.14
Figure 1: Isosteres for adsorption of CO2 at 5 oC and 25 oC
79

C3-3h (Si/Al:6.08)
1.5
2
2.5
3
3.5
4
4.5
5
0.0033 0.00335 0.0034 0.00345 0.0035 0.00355 0.0036 0.00365
1/T [1/K]
ln(P
)
n=0.23
n=0.21
n=0.155
n=0.1
C5-6h (Si/Al: 8.4)
1
1.5
2
2.5
3
3.5
4
4.5
0.0033 0.00335 0.0034 0.00345 0.0035 0.00355 0.0036 0.00365
1/T [1/K]
ln(P
) n=0.11
n=0.09
n=0.07
0.16
N2 (Si/Al: 6.18)
0
0.51
1.5
22.5
3
3.54
4.5
0.0033 0.00335 0.0034 0.00345 0.0035 0.00355 0.0036 0.00365
1/T [1/K]
ln(P
)
n=0.18n=0.15
n=0.173
n=0.07
5A (Si/Al: 0.98)
0
1
2
3
4
5
0.0033 0.0034 0.0035 0.0036 0.0037
1/T [1/K]
ln(P
)
n=0.58
n=0.17
n=0.08
n=0.02
C1-6h (Si/Al: 5.25)
-0.5
0
0.5
1
1.5
2
2.5
3
3.5
4
4.5
5
0.0033 0.00335 0.0034 0.00345 0.0035 0.00355 0.0036 0.003651/T [1/K]
ln(P
)
n=0.076
n=0.054
n=0.03
n=0.028
NCW (Si/Al: 4.01)
0
1
2
3
4
5
0.0033 0.0034 0.0035 0.0036 0.00371/T [1/K]
ln (P
)
n=0.5n=0.42
n=0.35
n=0.22
P1 (Si/Al: 5.01)
-1
0
12
3
4
5
0.0033 0.0034 0.0035 0.0036 0.0037
1/T [1/K]
ln(P
)
n=0.31
n=0.24
n=0.29n=0.14
Figure 2: Isosteres for adsorption of N2 at 5 oC and 25 oC
80
Related Documents