Journal of Analytical and Applied Pyrolysis 108 (2014) 203–211 Contents lists available at ScienceDirect Journal of Analytical and Applied Pyrolysis journal h om epage: www.elsevier.com/locate/jaap Co-pyrolysis reaction rates and activation energies of West Virginia coal and cherry pit blends Pablo Yangali a , Ana M. Celaya a , Jillian L. Goldfarb b,∗ a Department of Chemical Engineering, University of New Hampshire, 33 Academic Way, Durham, NH 03824, United States b Department of Mechanical Engineering and Division of Materials Science & Engineering, Boston University, 15 St. Mary’s Street, Brookline, MA 02446, United States a r t i c l e i n f o Article history: Received 2 December 2013 Accepted 27 April 2014 Available online 5 May 2014 Keywords: Biomass–coal blends Co-pyrolysis Activation energy Derivative thermogravimetry a b s t r a c t Bringing our society to a carbon-neutral, clean-energy future is an evolutionary process that must com- bine technological advances with available infrastructure. By co-firing biomass in existing coal-fired power plants, we can utilize standing equipment to increase the share of renewables in energy gener- ation portfolios. This study investigates the pyrolysis behavior of blends of sweet cherry pit stones and a West Virginia coal using thermogravimetric analysis at a heating rate of 100 K/min under nitrogen to determine mass loss rates and global activation energies as a function of blend composition. Derivative thermogravimetric curves show two distinct peaks for the fuel blends at temperatures corresponding to peaks for the pure cherry pits and coal. The peak mass loss rates for blends are higher than predicted using an additive scheme at the lower temperature peak and lower than predicted at the higher tem- perature peak. Global activation energies determined using a first order Arrhenius equation were higher than predicted by a linear addition scheme at lower temperatures, and lower than predicted at higher temperatures, suggesting that the incorporation of the cherry pit biomass may promote devolatilization of the coal at lower temperatures. © 2014 Elsevier B.V. All rights reserved. 1. Introduction To increase the share of renewables in their energy portfo- lios and reduce their pollutant emissions, coal-fired power plants worldwide are co-firing biomass in varying proportions with coal [1]. This is especially useful when it comes to abating SO x emis- sions that result from burning the highly sulfurous coals mined in the United States. In West Virginia, where coal mining is a driving factor of the state’s economy, over 93% of the electricity generated comes from coal [2]. While this statistic is likely to remain high for the foreseeable future, one way to increase the use of biomass for energy generation in the immediate time frame is as a blended feedstock in coal-fired boilers. In this study, we look at the pyrolytic behavior of blends of a commercial West Virginia coal and sweet cherry pits using thermogravimetric analysis. During the thermochemical conversion of coal and biomass, devolatilization can account for the majority of the solids’ weight loss, depending on the organic constituents of the fuel [3,4]. The evolution of gaseous products and tars, and the formation of ∗ Corresponding author. Tel.: +1 617 353 3883. E-mail addresses: [email protected], [email protected] (J.L. Goldfarb). carbonaceous chars during pyrolysis, result from the depolymer- ization, vaporization and cross-linking of the solid fuel matrix. While both coal and biomass undergo pyrolysis as an initial (and often rate-limiting) step to eventual combustion, the rates and temperatures at which the reactions occur can be significantly dif- ferent [5,6]. Moreover, when two solid fuels are blended, debate exists over whether or not the thermal devolatilization of the blend occurs as the independent summation of the reactions of both fuels, or if reaction synergies exist that promote the devolatilization of the solid having the more condensed structure (in this case, coal) because of reactions occurring in the more volatile component [7]. Some conclude that the rates and activation energies of pyrolysis of coal–biomass blends are the linear addition of each component’s independent behavior, that is, that no interactions exist between the biomass and coal [8,9]. Others find evidence for synergistic reac- tions between the solids, negating a simple linear addition model for activation energies to predict blend behavior. This evidence comes in the form of non-additive natures of the kinetic param- eters such as activation energies, and also the products formed upon of co-pyrolysis. Some groups find that the yields of specific volatile products are not proportional to the yields experienced upon pyrolysis of components separately [10–15]. The mechanisms underlying this behavior are unclear; Aboyade et al. [16] provide http://dx.doi.org/10.1016/j.jaap.2014.04.015 0165-2370/© 2014 Elsevier B.V. All rights reserved.

Welcome message from author
This document is posted to help you gain knowledge. Please leave a comment to let me know what you think about it! Share it to your friends and learn new things together.
Transcript
Cc
Pa
b
U
a
ARAA
KBCAD
1
lw[stfcfffbc
dle
h0
Journal of Analytical and Applied Pyrolysis 108 (2014) 203–211
Contents lists available at ScienceDirect
Journal of Analytical and Applied Pyrolysis
journa l h om epage: www.elsev ier .com/ locate / jaap
o-pyrolysis reaction rates and activation energies of West Virginiaoal and cherry pit blends
ablo Yangali a, Ana M. Celayaa, Jillian L. Goldfarbb,∗
Department of Chemical Engineering, University of New Hampshire, 33 Academic Way, Durham, NH 03824, United StatesDepartment of Mechanical Engineering and Division of Materials Science & Engineering, Boston University, 15 St. Mary’s Street, Brookline, MA 02446,nited States
r t i c l e i n f o
rticle history:eceived 2 December 2013ccepted 27 April 2014vailable online 5 May 2014
eywords:iomass–coal blendso-pyrolysisctivation energy
a b s t r a c t
Bringing our society to a carbon-neutral, clean-energy future is an evolutionary process that must com-bine technological advances with available infrastructure. By co-firing biomass in existing coal-firedpower plants, we can utilize standing equipment to increase the share of renewables in energy gener-ation portfolios. This study investigates the pyrolysis behavior of blends of sweet cherry pit stones anda West Virginia coal using thermogravimetric analysis at a heating rate of 100 K/min under nitrogen todetermine mass loss rates and global activation energies as a function of blend composition. Derivativethermogravimetric curves show two distinct peaks for the fuel blends at temperatures corresponding topeaks for the pure cherry pits and coal. The peak mass loss rates for blends are higher than predicted
erivative thermogravimetry using an additive scheme at the lower temperature peak and lower than predicted at the higher tem-perature peak. Global activation energies determined using a first order Arrhenius equation were higherthan predicted by a linear addition scheme at lower temperatures, and lower than predicted at highertemperatures, suggesting that the incorporation of the cherry pit biomass may promote devolatilizationof the coal at lower temperatures.
© 2014 Elsevier B.V. All rights reserved.
. Introduction
To increase the share of renewables in their energy portfo-ios and reduce their pollutant emissions, coal-fired power plants
orldwide are co-firing biomass in varying proportions with coal1]. This is especially useful when it comes to abating SOx emis-ions that result from burning the highly sulfurous coals mined inhe United States. In West Virginia, where coal mining is a drivingactor of the state’s economy, over 93% of the electricity generatedomes from coal [2]. While this statistic is likely to remain highor the foreseeable future, one way to increase the use of biomassor energy generation in the immediate time frame is as a blendedeedstock in coal-fired boilers. In this study, we look at the pyrolyticehavior of blends of a commercial West Virginia coal and sweetherry pits using thermogravimetric analysis.
During the thermochemical conversion of coal and biomass,
evolatilization can account for the majority of the solids’ weightoss, depending on the organic constituents of the fuel [3,4]. Thevolution of gaseous products and tars, and the formation of
∗ Corresponding author. Tel.: +1 617 353 3883.E-mail addresses: [email protected], [email protected] (J.L. Goldfarb).
ttp://dx.doi.org/10.1016/j.jaap.2014.04.015165-2370/© 2014 Elsevier B.V. All rights reserved.
carbonaceous chars during pyrolysis, result from the depolymer-ization, vaporization and cross-linking of the solid fuel matrix.While both coal and biomass undergo pyrolysis as an initial (andoften rate-limiting) step to eventual combustion, the rates andtemperatures at which the reactions occur can be significantly dif-ferent [5,6]. Moreover, when two solid fuels are blended, debateexists over whether or not the thermal devolatilization of the blendoccurs as the independent summation of the reactions of both fuels,or if reaction synergies exist that promote the devolatilization ofthe solid having the more condensed structure (in this case, coal)because of reactions occurring in the more volatile component [7].Some conclude that the rates and activation energies of pyrolysisof coal–biomass blends are the linear addition of each component’sindependent behavior, that is, that no interactions exist betweenthe biomass and coal [8,9]. Others find evidence for synergistic reac-tions between the solids, negating a simple linear addition modelfor activation energies to predict blend behavior. This evidencecomes in the form of non-additive natures of the kinetic param-eters such as activation energies, and also the products formed
upon of co-pyrolysis. Some groups find that the yields of specificvolatile products are not proportional to the yields experiencedupon pyrolysis of components separately [10–15]. The mechanismsunderlying this behavior are unclear; Aboyade et al. [16] provide
2 and Applied Pyrolysis 108 (2014) 203–211
atrir
doratb––pp1lptWhw[rsviVtptpcet
2
2
vUrt(rst(mUo
stclcaehtt
Table 1Proximate and ultimate analyses of West Virginia coal and cherry pits.
WV coala Cherry pitsb
Proximate analysis, wt% dryVolatile matter 38.74 81.00Fixed carbon 53.40 16.30Ash 7.86 2.70
WV coala Cherry pitsc
Ultimate analysis, wt% dryCarbon 75.71 53.41Hydrogen 5.33 7.04Nitrogen 1.42 0.30Sulfur 3.33 0.30Oxygen 6.25 38.05Moisture 6.30 6.00
Higher heating value, kJ/kg3.27E+04 2.29E+04
a Provided by PSNH from coal supplier.b As measured in our laboratory by TGA in air up to 610 ◦C (volatiles) and 950 ◦C
04 P. Yangali et al. / Journal of Analytical
n excellent summary of potential explanations from throughouthe literature, ranging from the promotion of demethoxylationeactions by inorganic matter in biomass to the larger H/C ration biomass preventing repolymerization and cross linking of free-adicals necessary for char condensation reactions.
Though biomasses examined across the literature demonstrateifferent thermal decomposition profiles owing to the specificrganic constituents present, the pyrolysis of biomass generallyequires global activation energies within similar ranges. Whennalyzed using the reaction rate constant method (first order reac-ion assumption of the Arrhenius equation) many lignocellulosiciomasses exhibit two or three distinct devolatilization regimes
abrupt transitions at temperatures specific to a given biomass with each region having its own activation energy. For exam-le, the pyrolysis of waste paper biomass at 20 ◦C/min shows threerimary decomposition regimes with activation energies between07–164, 198–232, and 30–48 kJ/mol for each region [17]. Simi-
arly, our laboratory found three decomposition regimes for theyrolysis of cabbage palm biomass ranging from 64–115, 67–152o 19–25 kJ/mol at heating rates ranging from 25 to 100 ◦C/min [4].
hat is especially interesting is that similar activation energiesave been found for the pyrolysis of coal–biomass blends, thoughith activation energies increasing as the amount of coal increases
18,19]. Though blending biomass with coal is fiscally and envi-onmentally advantageous, and industrially efficient (in co-firingcenarios biomass can increase flame stability due to its higherolatile content [20]), a general consensus on the kinetic behav-or of coal–biomass blends has yet to be formed in the literature.arious schemes are proposed to predict the thermal behavior of
he blending of biomasses and coal, including parallel reactions andarallel–series reactions (i.e. [21,22]) and simple linear combina-ions of the individual components behavior (i.e. [5,6]). Here werobe if such a simple summation of the individual behavior of aoal and biomass accurately predicts such a mixture’s behavior, andxplore the implications of deviations from an additive scheme inerms of potential reaction synergies.
. Materials and methods
.1. Preparation of coal–biomass blends
A West Virginia high-volatile bituminous coal (WV) was pro-ided by Public Service of New Hampshire (PSNH), a Northeasttilities Company, as part of a shipment received by PSNH Mer-
imack Station. Proximate and ultimate analyses as performed byhe supplier are given in Table 1. Sweet cherry (Prunus avium) pitsCP) were collected after the fruit was consumed, washed to removeesidual fruit and oven-dried at 110 ◦C to remove moisture beforetorage (to prevent molding). According to the U.S. Cherry Indus-ry Administrative Board, the total 2013 production of U.S. cherriessweet and tart) was over 130 million metric tons [23]. Approxi-
ately 25% of sweet cherries and 99% of tart cherries grown in the.S. are used for processing and as such there are large quantitiesf fruit stones available as waste by-products [24].
The coal and biomass were separately mechanically ground andieved to a particle size of 125–250 �m; van de Velden et al. showedhat mass transfer limitations occur in the pyrolysis of large parti-les because of temperature gradients within the particle [25]. Ouraboratory previously demonstrated no apparent effect of parti-le size (between 125–250 �m, 250–300 �m, and 300–500 �m) onctivation energy of palm biomass up to 100 ◦C/min [4]. González
t al. showed that the particle size, up to 1.6 mm, of cherry pit stonesad relatively no influence on mass loss rates, suggesting that up tohis size, heat and mass transfer limitations were not relevant andhe pyrolysis was kinetically limited [26]. Approximately 10 grams(fixed carbon/ash).c As measured by Petrov et al. [42].
of each blend (i.e. 90:10, 70:30, 50:50 etc. WV:CP by mass) weremade by measuring the required mass of each fuel to the 0.1 mg ona Shimadzu semi-microbalance into a glass vial and agitating witha Scilogex vortex mixer.
2.2. Thermogravimetric analysis
Each fuel and blend sample was pyrolyzed at least twice (athird sample was used if results differed by more than 5%) using aMettler Toledo TGA/DSC1. Briefly, approximately 5 mg of each sam-ple/blend was loaded into a 70 �L alumina crucible and pyrolyzedin high purity nitrogen gas with a total flow (reactive + protectivegas) of approximately 50 mL/min The samples were heated from25 ◦C to 100 ◦C at 50 ◦C/min, and held for 30 min to remove anyresidual moisture. The samples were then heated to 900 ◦C at100 ◦C/min and held for sufficient time such that a steady massplateau was reached to insure all material devolatilized. An accu-rate final mass is required to describe the kinetic parameters.
Much of the pyrolysis literature focuses on slow heating rates(1–10 ◦C/min); this does not model the rapid combustion processesin industrial boilers; unfortunately, a TGA cannot be operated atheating rates upwards of 1000 ◦C/min to mimic this process. Assuch, in this study we employ a fast rate of 100 ◦C/min to insurereproducibility and expand the literature on the pyrolysis kineticsof coal, biomass and their blends.
To analyze the peak mass loss rate(s), and temperature(s) atwhich pyrolysis occurs, we use derivative thermogravimetric (DTG)curves. First, we determine the extent of conversion, x, as a functionof: initial mass (m0), mass at any time t (mt), and the final mass (mf).
x(t) = m0 − mt
m0 − mf(1)
The maximum rate of decomposition is obtained by plottingdx/dt versus T (absolute temperature), occurring as a peak wherethe slope equals zero.
Using the reaction rate constant method, widely applied todetermine the activation energy and pre-exponential factor ofbiomass, coal, and coal–biomass blends, we determine the rate ofreacted material with respect to time via:
dx(t)dt
= k(1 − x(t)) (2)
P. Yangali et al. / Journal of Analytical and Applied Pyrolysis 108 (2014) 203–211 205
value
tt
T
s
k
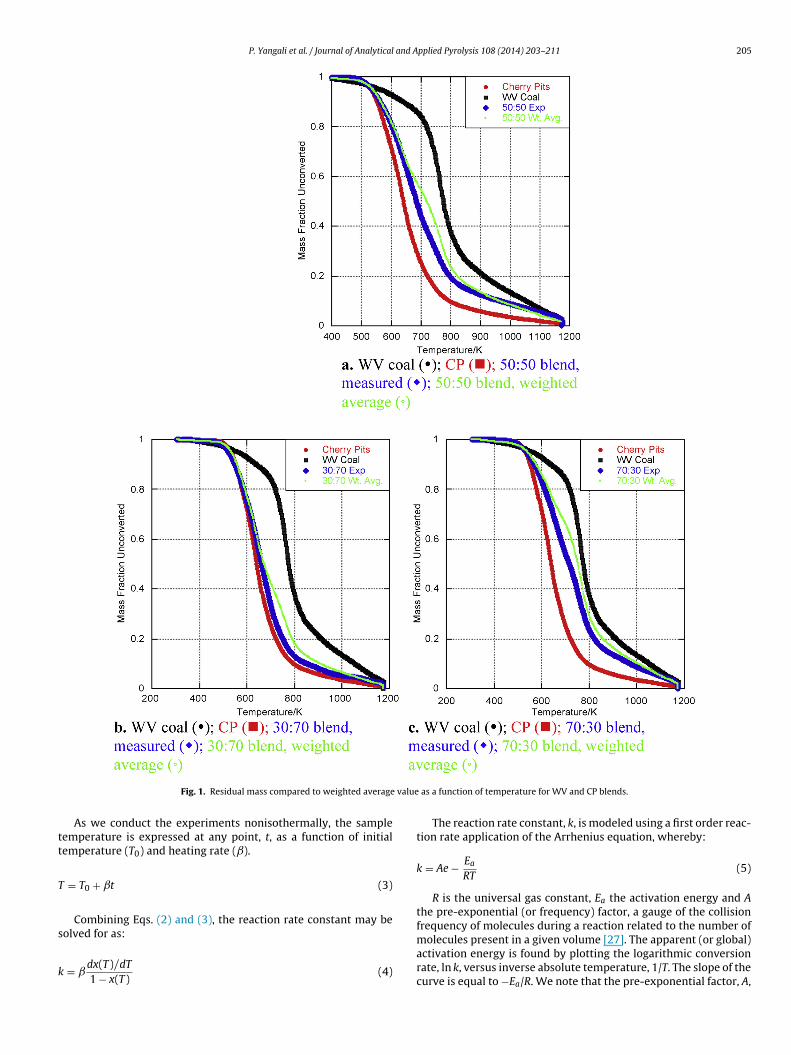
Fig. 1. Residual mass compared to weighted average
As we conduct the experiments nonisothermally, the sampleemperature is expressed at any point, t, as a function of initialemperature (T0) and heating rate (ˇ).
= T0 + ˇt (3)
Combining Eqs. (2) and (3), the reaction rate constant may be
olved for as:= ˇdx(T)/dT
1 − x(T)(4)
as a function of temperature for WV and CP blends.
The reaction rate constant, k, is modeled using a first order reac-tion rate application of the Arrhenius equation, whereby:
k = Ae − Ea
RT(5)
R is the universal gas constant, Ea the activation energy and Athe pre-exponential (or frequency) factor, a gauge of the collisionfrequency of molecules during a reaction related to the number of
molecules present in a given volume [27]. The apparent (or global)activation energy is found by plotting the logarithmic conversionrate, ln k, versus inverse absolute temperature, 1/T. The slope of thecurve is equal to −Ea/R. We note that the pre-exponential factor, A,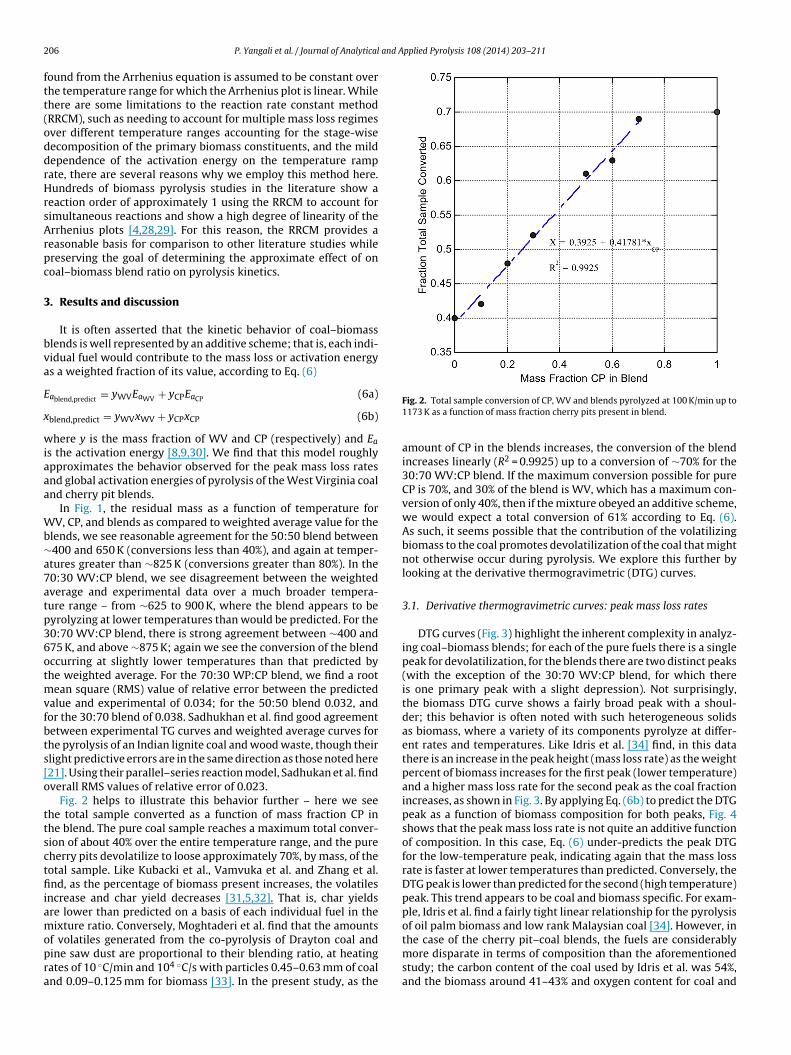
2 and Applied Pyrolysis 108 (2014) 203–211
ftt(oddrHrsArpc
3
bva
E
x
wiaaa
Wb∼a7atp36otmvfbts[o
ttsctfiiamopra
06 P. Yangali et al. / Journal of Analytical
ound from the Arrhenius equation is assumed to be constant overhe temperature range for which the Arrhenius plot is linear. Whilehere are some limitations to the reaction rate constant methodRRCM), such as needing to account for multiple mass loss regimesver different temperature ranges accounting for the stage-wiseecomposition of the primary biomass constituents, and the mildependence of the activation energy on the temperature rampate, there are several reasons why we employ this method here.undreds of biomass pyrolysis studies in the literature show a
eaction order of approximately 1 using the RRCM to account forimultaneous reactions and show a high degree of linearity of therrhenius plots [4,28,29]. For this reason, the RRCM provides aeasonable basis for comparison to other literature studies whilereserving the goal of determining the approximate effect of onoal–biomass blend ratio on pyrolysis kinetics.
. Results and discussion
It is often asserted that the kinetic behavior of coal–biomasslends is well represented by an additive scheme; that is, each indi-idual fuel would contribute to the mass loss or activation energys a weighted fraction of its value, according to Eq. (6)
ablend,predict = yWVEaWV + yCPEaCP (6a)
blend,predict = yWVxWV + yCPxCP (6b)
here y is the mass fraction of WV and CP (respectively) and Ea
s the activation energy [8,9,30]. We find that this model roughlypproximates the behavior observed for the peak mass loss ratesnd global activation energies of pyrolysis of the West Virginia coalnd cherry pit blends.
In Fig. 1, the residual mass as a function of temperature forV, CP, and blends as compared to weighted average value for the
lends, we see reasonable agreement for the 50:50 blend between400 and 650 K (conversions less than 40%), and again at temper-tures greater than ∼825 K (conversions greater than 80%). In the0:30 WV:CP blend, we see disagreement between the weightedverage and experimental data over a much broader tempera-ure range – from ∼625 to 900 K, where the blend appears to beyrolyzing at lower temperatures than would be predicted. For the0:70 WV:CP blend, there is strong agreement between ∼400 and75 K, and above ∼875 K; again we see the conversion of the blendccurring at slightly lower temperatures than that predicted byhe weighted average. For the 70:30 WP:CP blend, we find a root
ean square (RMS) value of relative error between the predictedalue and experimental of 0.034; for the 50:50 blend 0.032, andor the 30:70 blend of 0.038. Sadhukhan et al. find good agreementetween experimental TG curves and weighted average curves forhe pyrolysis of an Indian lignite coal and wood waste, though theirlight predictive errors are in the same direction as those noted here21]. Using their parallel–series reaction model, Sadhukan et al. findverall RMS values of relative error of 0.023.
Fig. 2 helps to illustrate this behavior further – here we seehe total sample converted as a function of mass fraction CP inhe blend. The pure coal sample reaches a maximum total conver-ion of about 40% over the entire temperature range, and the pureherry pits devolatilize to loose approximately 70%, by mass, of theotal sample. Like Kubacki et al., Vamvuka et al. and Zhang et al.nd, as the percentage of biomass present increases, the volatiles
ncrease and char yield decreases [31,5,32]. That is, char yieldsre lower than predicted on a basis of each individual fuel in theixture ratio. Conversely, Moghtaderi et al. find that the amounts
f volatiles generated from the co-pyrolysis of Drayton coal andine saw dust are proportional to their blending ratio, at heatingates of 10 ◦C/min and 104 ◦C/s with particles 0.45–0.63 mm of coalnd 0.09–0.125 mm for biomass [33]. In the present study, as the
Fig. 2. Total sample conversion of CP, WV and blends pyrolyzed at 100 K/min up to1173 K as a function of mass fraction cherry pits present in blend.
amount of CP in the blends increases, the conversion of the blendincreases linearly (R2 = 0.9925) up to a conversion of ∼70% for the30:70 WV:CP blend. If the maximum conversion possible for pureCP is 70%, and 30% of the blend is WV, which has a maximum con-version of only 40%, then if the mixture obeyed an additive scheme,we would expect a total conversion of 61% according to Eq. (6).As such, it seems possible that the contribution of the volatilizingbiomass to the coal promotes devolatilization of the coal that mightnot otherwise occur during pyrolysis. We explore this further bylooking at the derivative thermogravimetric (DTG) curves.
3.1. Derivative thermogravimetric curves: peak mass loss rates
DTG curves (Fig. 3) highlight the inherent complexity in analyz-ing coal–biomass blends; for each of the pure fuels there is a singlepeak for devolatilization, for the blends there are two distinct peaks(with the exception of the 30:70 WV:CP blend, for which thereis one primary peak with a slight depression). Not surprisingly,the biomass DTG curve shows a fairly broad peak with a shoul-der; this behavior is often noted with such heterogeneous solidsas biomass, where a variety of its components pyrolyze at differ-ent rates and temperatures. Like Idris et al. [34] find, in this datathere is an increase in the peak height (mass loss rate) as the weightpercent of biomass increases for the first peak (lower temperature)and a higher mass loss rate for the second peak as the coal fractionincreases, as shown in Fig. 3. By applying Eq. (6b) to predict the DTGpeak as a function of biomass composition for both peaks, Fig. 4shows that the peak mass loss rate is not quite an additive functionof composition. In this case, Eq. (6) under-predicts the peak DTGfor the low-temperature peak, indicating again that the mass lossrate is faster at lower temperatures than predicted. Conversely, theDTG peak is lower than predicted for the second (high temperature)peak. This trend appears to be coal and biomass specific. For exam-ple, Idris et al. find a fairly tight linear relationship for the pyrolysisof oil palm biomass and low rank Malaysian coal [34]. However, in
the case of the cherry pit–coal blends, the fuels are considerablymore disparate in terms of composition than the aforementionedstudy; the carbon content of the coal used by Idris et al. was 54%,and the biomass around 41–43% and oxygen content for coal and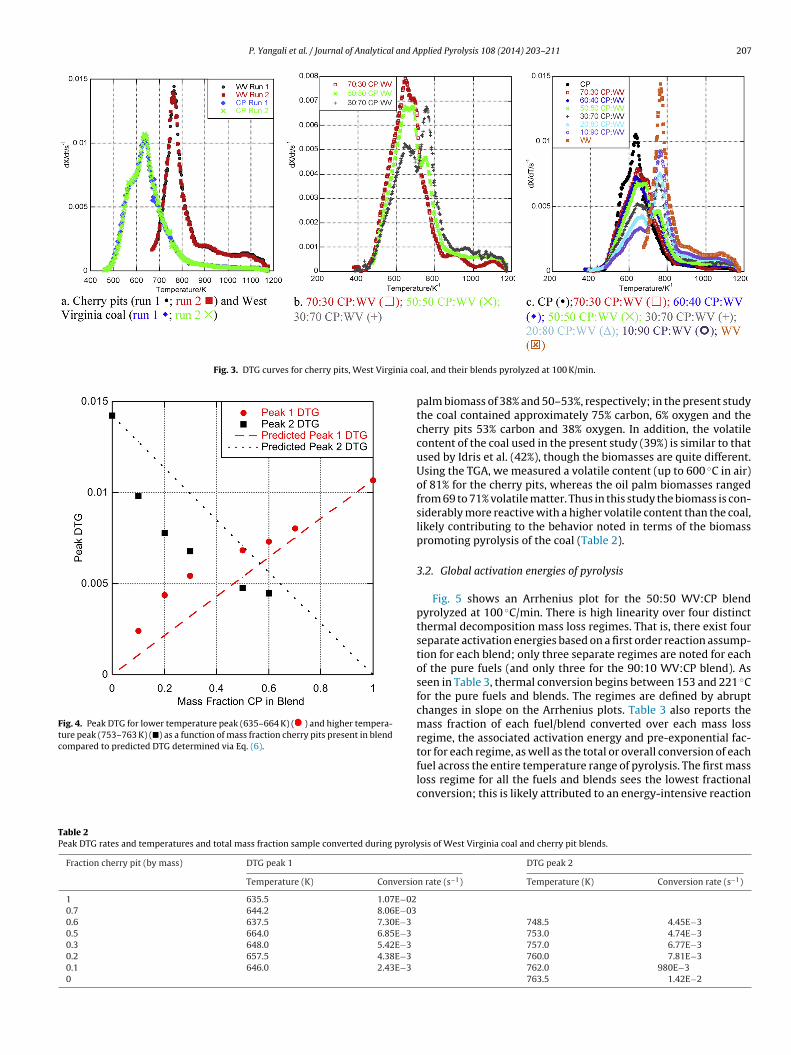
P. Yangali et al. / Journal of Analytical and Applied Pyrolysis 108 (2014) 203–211 207
Fig. 3. DTG curves for cherry pits, West Virginia co
Fig. 4. Peak DTG for lower temperature peak (635–664 K) ( ) and higher tempera-ture peak (753–763 K) (�) as a function of mass fraction cherry pits present in blendcompared to predicted DTG determined via Eq. (6).
Table 2Peak DTG rates and temperatures and total mass fraction sample converted during pyroly
Fraction cherry pit (by mass) DTG peak 1
Temperature (K) Conversio
1 635.5 1.07E−020.7 644.2 8.06E−030.6 637.5 7.30E−3
0.5 664.0 6.85E−3
0.3 648.0 5.42E−3
0.2 657.5 4.38E−3
0.1 646.0 2.43E−3
0
al, and their blends pyrolyzed at 100 K/min.
palm biomass of 38% and 50–53%, respectively; in the present studythe coal contained approximately 75% carbon, 6% oxygen and thecherry pits 53% carbon and 38% oxygen. In addition, the volatilecontent of the coal used in the present study (39%) is similar to thatused by Idris et al. (42%), though the biomasses are quite different.Using the TGA, we measured a volatile content (up to 600 ◦C in air)of 81% for the cherry pits, whereas the oil palm biomasses rangedfrom 69 to 71% volatile matter. Thus in this study the biomass is con-siderably more reactive with a higher volatile content than the coal,likely contributing to the behavior noted in terms of the biomasspromoting pyrolysis of the coal (Table 2).
3.2. Global activation energies of pyrolysis
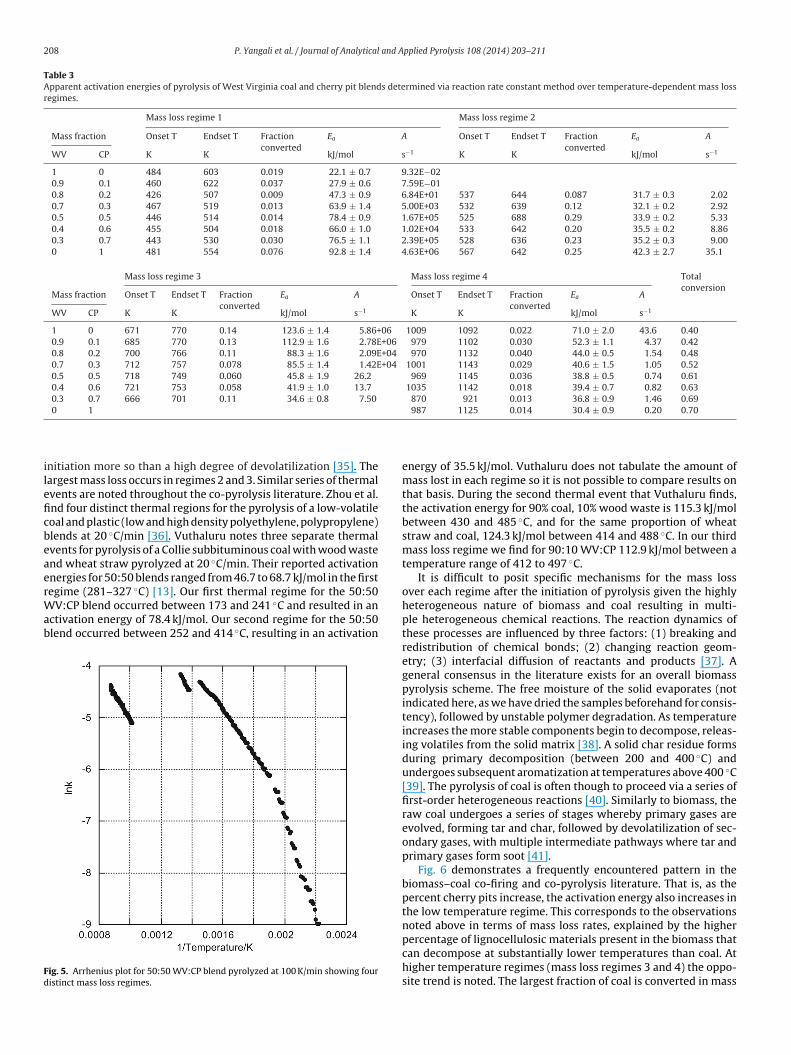
Fig. 5 shows an Arrhenius plot for the 50:50 WV:CP blendpyrolyzed at 100 ◦C/min. There is high linearity over four distinctthermal decomposition mass loss regimes. That is, there exist fourseparate activation energies based on a first order reaction assump-tion for each blend; only three separate regimes are noted for eachof the pure fuels (and only three for the 90:10 WV:CP blend). Asseen in Table 3, thermal conversion begins between 153 and 221 ◦Cfor the pure fuels and blends. The regimes are defined by abruptchanges in slope on the Arrhenius plots. Table 3 also reports themass fraction of each fuel/blend converted over each mass lossregime, the associated activation energy and pre-exponential fac-
tor for each regime, as well as the total or overall conversion of eachfuel across the entire temperature range of pyrolysis. The first massloss regime for all the fuels and blends sees the lowest fractionalconversion; this is likely attributed to an energy-intensive reactionsis of West Virginia coal and cherry pit blends.
DTG peak 2
n rate (s−1) Temperature (K) Conversion rate (s−1)
748.5 4.45E−3753.0 4.74E−3757.0 6.77E−3760.0 7.81E−3762.0 980E−3763.5 1.42E−2
208 P. Yangali et al. / Journal of Analytical and Applied Pyrolysis 108 (2014) 203–211
Table 3Apparent activation energies of pyrolysis of West Virginia coal and cherry pit blends determined via reaction rate constant method over temperature-dependent mass lossregimes.
Mass loss regime 1 Mass loss regime 2
Mass fraction Onset T Endset T Fractionconverted
Ea A Onset T Endset T Fractionconverted
Ea A
WV CP K K kJ/mol s−1 K K kJ/mol s−1
1 0 484 603 0.019 22.1 ± 0.7 9.32E−020.9 0.1 460 622 0.037 27.9 ± 0.6 7.59E−010.8 0.2 426 507 0.009 47.3 ± 0.9 6.84E+01 537 644 0.087 31.7 ± 0.3 2.020.7 0.3 467 519 0.013 63.9 ± 1.4 5.00E+03 532 639 0.12 32.1 ± 0.2 2.920.5 0.5 446 514 0.014 78.4 ± 0.9 1.67E+05 525 688 0.29 33.9 ± 0.2 5.330.4 0.6 455 504 0.018 66.0 ± 1.0 1.02E+04 533 642 0.20 35.5 ± 0.2 8.860.3 0.7 443 530 0.030 76.5 ± 1.1 2.39E+05 528 636 0.23 35.2 ± 0.3 9.000 1 481 554 0.076 92.8 ± 1.4 4.63E+06 567 642 0.25 42.3 ± 2.7 35.1
Mass loss regime 3 Mass loss regime 4 Totalconversion
Mass fraction Onset T Endset T Fractionconverted
Ea A Onset T Endset T Fractionconverted
Ea A
WV CP K K kJ/mol s−1 K K kJ/mol s−1
1 0 671 770 0.14 123.6 ± 1.4 5.86+06 1009 1092 0.022 71.0 ± 2.0 43.6 0.400.9 0.1 685 770 0.13 112.9 ± 1.6 2.78E+06 979 1102 0.030 52.3 ± 1.1 4.37 0.420.8 0.2 700 766 0.11 88.3 ± 1.6 2.09E+04 970 1132 0.040 44.0 ± 0.5 1.54 0.480.7 0.3 712 757 0.078 85.5 ± 1.4 1.42E+04 1001 1143 0.029 40.6 ± 1.5 1.05 0.520.5 0.5 718 749 0.060 45.8 ± 1.9 26.2 969 1145 0.036 38.8 ± 0.5 0.74 0.610.4 0.6 721 753 0.058 41.9 ± 1.0 13.7 1035 1142 0.018 39.4 ± 0.7 0.82 0.630.3 0.7 666 701 0.11 34.6 ± 0.8 7.50 870 921 0.013 36.8 ± 0.9 1.46 0.69
ileficbeaerWab
Fd
0 1
nitiation more so than a high degree of devolatilization [35]. Theargest mass loss occurs in regimes 2 and 3. Similar series of thermalvents are noted throughout the co-pyrolysis literature. Zhou et al.nd four distinct thermal regions for the pyrolysis of a low-volatileoal and plastic (low and high density polyethylene, polypropylene)lends at 20 ◦C/min [36]. Vuthaluru notes three separate thermalvents for pyrolysis of a Collie subbituminous coal with wood wastend wheat straw pyrolyzed at 20 ◦C/min. Their reported activationnergies for 50:50 blends ranged from 46.7 to 68.7 kJ/mol in the first
egime (281–327 ◦C) [13]. Our first thermal regime for the 50:50V:CP blend occurred between 173 and 241 ◦C and resulted in anctivation energy of 78.4 kJ/mol. Our second regime for the 50:50lend occurred between 252 and 414 ◦C, resulting in an activation
ig. 5. Arrhenius plot for 50:50 WV:CP blend pyrolyzed at 100 K/min showing fouristinct mass loss regimes.
987 1125 0.014 30.4 ± 0.9 0.20 0.70
energy of 35.5 kJ/mol. Vuthaluru does not tabulate the amount ofmass lost in each regime so it is not possible to compare results onthat basis. During the second thermal event that Vuthaluru finds,the activation energy for 90% coal, 10% wood waste is 115.3 kJ/molbetween 430 and 485 ◦C, and for the same proportion of wheatstraw and coal, 124.3 kJ/mol between 414 and 488 ◦C. In our thirdmass loss regime we find for 90:10 WV:CP 112.9 kJ/mol between atemperature range of 412 to 497 ◦C.
It is difficult to posit specific mechanisms for the mass lossover each regime after the initiation of pyrolysis given the highlyheterogeneous nature of biomass and coal resulting in multi-ple heterogeneous chemical reactions. The reaction dynamics ofthese processes are influenced by three factors: (1) breaking andredistribution of chemical bonds; (2) changing reaction geom-etry; (3) interfacial diffusion of reactants and products [37]. Ageneral consensus in the literature exists for an overall biomasspyrolysis scheme. The free moisture of the solid evaporates (notindicated here, as we have dried the samples beforehand for consis-tency), followed by unstable polymer degradation. As temperatureincreases the more stable components begin to decompose, releas-ing volatiles from the solid matrix [38]. A solid char residue formsduring primary decomposition (between 200 and 400 ◦C) andundergoes subsequent aromatization at temperatures above 400 ◦C[39]. The pyrolysis of coal is often though to proceed via a series offirst-order heterogeneous reactions [40]. Similarly to biomass, theraw coal undergoes a series of stages whereby primary gases areevolved, forming tar and char, followed by devolatilization of sec-ondary gases, with multiple intermediate pathways where tar andprimary gases form soot [41].
Fig. 6 demonstrates a frequently encountered pattern in thebiomass–coal co-firing and co-pyrolysis literature. That is, as thepercent cherry pits increase, the activation energy also increases inthe low temperature regime. This corresponds to the observationsnoted above in terms of mass loss rates, explained by the higher
percentage of lignocellulosic materials present in the biomass thatcan decompose at substantially lower temperatures than coal. Athigher temperature regimes (mass loss regimes 3 and 4) the oppo-site trend is noted. The largest fraction of coal is converted in mass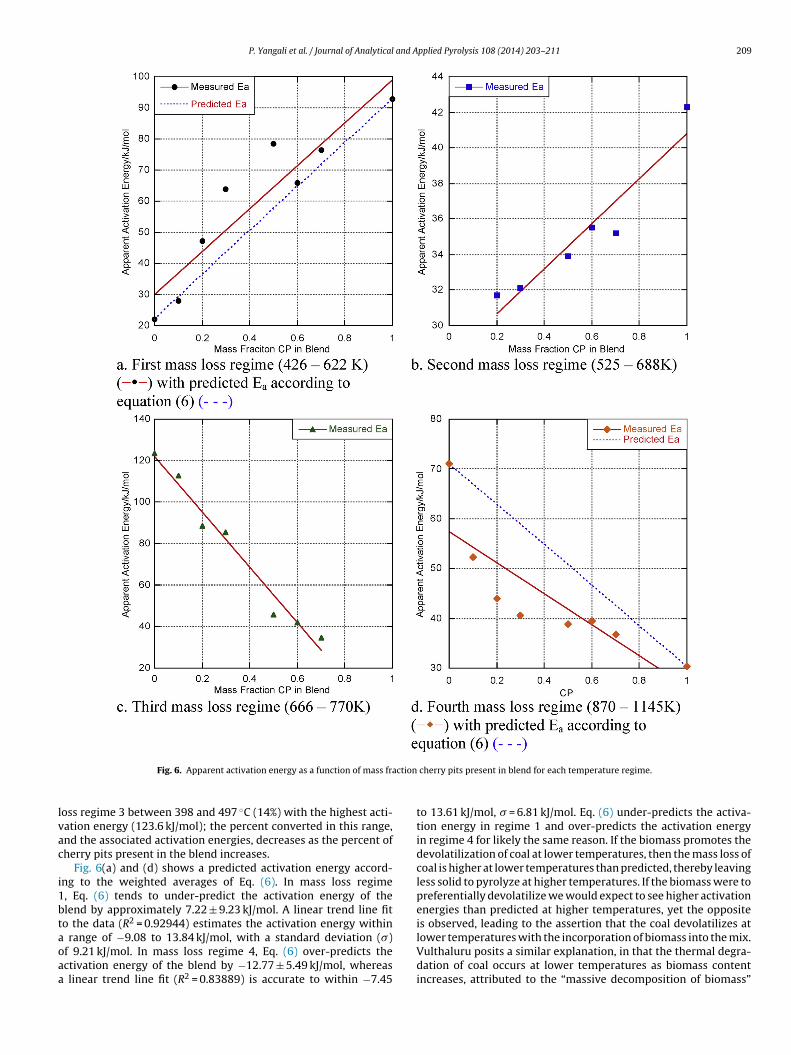
P. Yangali et al. / Journal of Analytical and Applied Pyrolysis 108 (2014) 203–211 209
ction
lvac
i1btaoaa
Fig. 6. Apparent activation energy as a function of mass fra
oss regime 3 between 398 and 497 ◦C (14%) with the highest acti-ation energy (123.6 kJ/mol); the percent converted in this range,nd the associated activation energies, decreases as the percent ofherry pits present in the blend increases.
Fig. 6(a) and (d) shows a predicted activation energy accord-ng to the weighted averages of Eq. (6). In mass loss regime, Eq. (6) tends to under-predict the activation energy of thelend by approximately 7.22 ± 9.23 kJ/mol. A linear trend line fito the data (R2 = 0.92944) estimates the activation energy within
range of −9.08 to 13.84 kJ/mol, with a standard deviation (�)f 9.21 kJ/mol. In mass loss regime 4, Eq. (6) over-predicts thectivation energy of the blend by −12.77 ± 5.49 kJ/mol, whereas
linear trend line fit (R2 = 0.83889) is accurate to within −7.45
cherry pits present in blend for each temperature regime.
to 13.61 kJ/mol, � = 6.81 kJ/mol. Eq. (6) under-predicts the activa-tion energy in regime 1 and over-predicts the activation energyin regime 4 for likely the same reason. If the biomass promotes thedevolatilization of coal at lower temperatures, then the mass loss ofcoal is higher at lower temperatures than predicted, thereby leavingless solid to pyrolyze at higher temperatures. If the biomass were topreferentially devolatilize we would expect to see higher activationenergies than predicted at higher temperatures, yet the oppositeis observed, leading to the assertion that the coal devolatilizes at
lower temperatures with the incorporation of biomass into the mix.Vulthaluru posits a similar explanation, in that the thermal degra-dation of coal occurs at lower temperatures as biomass contentincreases, attributed to the “massive decomposition of biomass”
2 and A
[ssVeua
3lrvmraVfbttDttbcos
3
acpgaeettfl
4
oytpatofetotesplubt
[
[
[
[
[
[
[
[
10 P. Yangali et al. / Journal of Analytical
19]. The author suggests that the TGA data show a linear relation-hip between char yield and biomass present, suggesting a lack ofynergistic effects. However, there among the blend ratios tested,ulthaluru finds that 20:80 blends of coal:biomass show the low-st activation energies, and therefore we suggest that it would benlikely that a linear relationship exists between activation energynd blend ratio, indicating potential synergistic effects.
We cannot offer a similar prediction for mass loss regimes 2 and (figures (b) and (c)) as there is not observed mass loss over simi-
ar temperatures for regime 2 for coal, and likewise for biomass inegime 3. It is noted, though, that the relationship between acti-ation energies for the coal and blends in the second and thirdass loss regimes are fairly linear (R2 = 0.95183 and R2 = 0.98633,
espectively) and increases with increasing biomass in regime 2nd decreases with increasing biomass in regime 3. Interestingly,amvuka et al. find that such an additive scheme offers a “satis-
actory prediction” of the behavior of mixtures of lignite coal andiomasses such as forest residue and olive kernels. However, whilehey present activation energies for each individual component,hey do not tabulate such kinetic values for the blends, thoughTG curves of blends appear to agree well with the additive predic-
ive scheme [5]. Kubacki et al. summarize such behavior succinctlyhrough the investigation of co-pyrolysis of coal and wheat strawlends [31], in that decomposition steps between fuel and blendomponents may be clearly delineated, non-additive behavior isften noted in the kinetics of biomass–coal co-pyrolysis, and ispecific to a given biomass and coal.
.3. Summary
The literature abounds with assertions of both synergistic anddditive behavior of the kinetics of the pyrolytic conversion ofoal–biomass blends. Through the data presented here on cherryit and West Virginia coal blends, we find global activation ener-ies to be functions of the blend compositions, though not perfectlydditive in nature, suggesting some level of reaction synergism. Thenergy required to initiate pyrolysis (regime 1) is fairly depend-nt on the percentage of biomass present, though it appears ashough the biomass may encourage pyrolysis of the coal at loweremperatures. Examination of derivative thermogravimetric curvesurthers this conclusion; higher rates of reaction are observed atower temperatures, and vice versa.
. Conclusions
The present work investigates the pyrolysis behavior of blendsf cherry pits and West Virginia coal using thermogravimetric anal-sis under nitrogen gas at heating rate of 100 K/min. Derivativehermogravimetric curves of the blends suggest that the rates ofyrolysis are an amalgam of the behavior of the pure fuels, thoughre not purely additive in nature. DTG curves of the blends showwo peaks corresponding to the biomass and coal, though the heightf these peaks are not directly proportional to the amount of eachuel present. That is, the rate of devolatilization is higher thanxpected at lower temperatures, and lower than expected at higheremperatures if one assumes an additive scenario. Using a firstrder reaction Arrhenius plot, it is observed that the global activa-ion energies echo this idea. At lower temperatures, the activationnergies are higher than that predicted by an additive reactioncheme, suggesting a higher amount of coal is devolatilizing thanredicted at lower temperatures. At higher temperatures, the mass
oss rates found through the DTG curves are lower than predictedsing an additive scheme. On its own, this suggests that either theiomass preferentially devolatilized at lower temperatures, or thathe coal did as such. Given that the apparent activation energies
[
[
pplied Pyrolysis 108 (2014) 203–211
at high temperatures are also lower than predicted, it does notseem likely that that the biomass preferentially devolatilized, asthis would lead to higher activation energies than predicted giventhe lower Ea of pure biomass compared to pure coal. As such, itappears that though simple “back-of-the-envelope” calculationsto predict pyrolysis behavior of coal–biomass blends as a func-tion of composition are likely to under-predict or over-predict theenergy required to initiate pyrolysis, depending on the temperatureregime, and should be applied with caution. The findings supportthe idea that co-firing coal and biomass may indeed increase theefficiency of industrial boilers. Co-firing is known to decrease SOx
and net CO2 emissions, and to stabilize flame temperature. The datagathered herein suggest that incorporating biomass such as cherrypits may well promote the pyrolysis of coal, which would lead to alarger volatile profile and likely a better overall conversion duringcombustion.
Acknowledgements
The authors thank Richard Despins of Public Service of NewHampshire for providing the coal sample. This material is basedupon work supported by the National Science Foundation underGrant No. NSF CBET-1127774.
References
[1] M. Sami, K. Annamalai, M. Wooldridge, Co-firing of coal and biomass fuelblends, Prog. Energy Combust. Sci. 27 (2001) 171–214.
[2] U.S. Energy Information Administration (US EIA), Net Generation and FuelConsumption for Power Plants Consuming Coal and Biomass, 2010, ReleasedAugust 2010. Available at: http://www.eia.gov/cneaf/solar.renewables/page/rea data/table9.html (accessed 7.09.13).
[3] M.A. Serio, D.G. Hamblen, J.R. Markham, P.R. Solomon, Kinetics of volatile prod-uct evolution in coal pyrolysis: experiment and theory, Energy Fuels 1 (1987)138–152.
[4] L. Buessing, J.L. Goldfarb, Energy along I-95: pyrolysis kinetics of Floridian cab-bage palm (Sabal palmetto), J. Anal. Appl. Pyrol. 96 (2012) 78–85.
[5] D. Vamvuka, E. Kakaras, P. Grammelis, Pyrolysis characteristics and kinetics ofbiomass residuals mixtures with lignite, Fuel 82 (2003) 1949–1960.
[6] D. Vamvuka, N. Pasadakis, E. Kastanaki, Kinetic modeling of coal/agriculturalby-product blends, Energy Fuels 17 (2003) 549–558.
[7] J.M. Heikkinen, J.C. Hordijk, W. de Jong, H. Splithoff, Thermogravimetry as a toolto classify waste components to be used for energy generation, J. Anal. Appl.Pyrol. 71 (2004) 883–900.
[8] E. Kastanaki, D. Vamvuka, P. Grammelis, E. Kakaras, Thermogravimetric studiesof the behavior of lignite-biomass blends during devolatilization, Fuel Process.Technol. 77–78 (77) (2002) 159–160.
[9] T. Sonobe, N. Worasuwannarak, Kinetic analyses of biomass pyrolysis using thedistributed activation energy model, Fuel 87 (2008) 414–421.
10] S. Krerkkaiwan, C. Fushimi, A. Tsutsumi, P. Kuchonthara, Synergistic effect dur-ing co-pyrolysis/gasification of biomass and sub-bituminous coal, Fuel Process.Technol. 115 (2013) 11–18.
11] H. Haykiri-Acma, S. Yaman, Synergy in devolatilization characteristics of ligniteand hazelnut shell during co-pyrolysis, Fuel 86 (2007) 373–380.
12] C.A. Ulloa, A.L. Gordon, X.A. García, Thermogravimetric study of interactions inthe pyrolysis of blends of coal with radiata pine sawdust, Fuel Process. Technol.90 (2009) 583–590.
13] J. Aboyade, M. Gorgens, E.L. Carrier, J.H. Meyer, Knoetze, Thermogravimet-ric.study of the devolatilization characteristics and kinetics of coal blends withcorn and sugarcane residues, Fuel Process. Technol. 106 (2013) 310–320.
14] T. Sonobe, N. Worasuwannarak, S. Pipatmanomai, Synergies in co-pyrolysis ofThai lignite and corncob, Fuel Process. Technol. 89 (2008) 1371–1378.
15] D.K. Park, S.D. Kim, S.H. Lee, J.G. Lee, Co-pyrolysis characteristics of sawdustand coal blend in TGA and a fixed bed reactor, Bioresour. Technol. 101 (2010)6151–6156.
16] A.O. Aboyade, M. Carrier, E.L. Meyer, J.H. Knoetze, J.F. Görgens, Model fittingkinetic analysis and characterization of the devolatilization of coal blends withcorn and sugarcane residues, Thermochim. Acta 530 (2012) 95–106.
17] P. Grammelis, P. Basinas, A. Malliopoulou, G. Sakellaropoulos, Pyrolysis kinet-ics and combustion characteristics of waste recovered fuels, Fuel 88 (2009)195–205.
18] J.M. Jones, M. Kubacki, K. Kubica, A.B. Ross, A. Williams, Devolatilisationcharacteristics of coal and biomass blends, J. Anal. Appl. Pyrol. 74 (2005)502–511.
19] H.B. Vuthaluru, Thermal behaviour of coal/biomass blends during co-pyrolysis,Fuel Process. Technol. 85 (2003) 141–155.
and A
[
[
[
[
[
[
[
[
[
[
[
[
[
[
[
[
[
[
[
[
[
[
P. Yangali et al. / Journal of Analytical
20] C. Wang, F. Wang, Q. Yang, R. Liang, Thermogravimetric studies of the behav-ior of wheat straw with added coal during combustion, Biomass Bioenergy 33(2009) 50.
21] A.K. Sadhukhan, P. Gupta, T. Goyal, R.K. Saha, Modelling of pyrolysis ofcoal–biomass blends using thermogravimetric analysis, Bioresour. Technol. 99(2008) 8022–8026.
22] C.A. Koufopanos, N. Papayannakos, Modeling of the pyrolysis of biomass par-ticles: studies on the kinetics thermal and heat transfer effects, Can. J. Chem.Eng. 69 (1991) 907–915.
23] Cherry Industry Administrative Board, Weekly Raw Product Report: Week 8 –2013, 2013, http://www.cherryboard.org/Week82013.pdf (accessed 17.11.13).
24] Agricultural Marketing Resource Center (AgMRC), Cherries, 2013, http://www.agmrc.org/commodities products/fruits/cherries/ (accessed 17.11.13).
25] M. Van de Velden, J. Baeyens, A. Brems, R. Dewil, Fundamentals, kinetics andendothermicity of the biomass pyrolysis reaction, Renew. Energy 35 (2010)232–242.
26] J.F. González, J.M. Encinar, J.L. Canito, E. Sabio, M. Chacón, Pyrolysis of cherrystones: energy uses of the different fractions and kinetic study, J. Anal. Appl.Pyrol. 67 (2003) 165–190.
27] S.Y. Yorulmaz, A.T. Atimtay, Investigation of combustion kinetics of treated anduntreated waste wood samples with thermogravimetric analysis, Fuel Process.Technol. 90 (2009) 939–946.
28] C. Branca, Di Blasi, Kinetics of the isothermal degradation of wood in the tem-perature range 528–708 K, J. Anal. Appl. Pyrol. 67 (2003) 207–219.
29] P. Parasuraman, R. Singh, T. Bolton, S. Omori, R. Francis, Estimation of hard-
wood lignin concentrations by UV spectroscopy and chlorine demethylation,BioResources 2 (2007) 459–471.30] E. Biagini, F. Barontini, L. Tognotti, Devolatilization of biomass compo-nents studied by TG/FTIR technique, Ind. Eng. Chem. Res. 45 (2006)4486–4493.
[
pplied Pyrolysis 108 (2014) 203–211 211
31] M.L. Kubacki, A.B. Ross, J.M. Jones, A. Williams, Small-scale co-utilisation of coaland biomass, Fuel 101 (2012) 84–89.
32] L. Zhang, S. Xu, W. Zhao, S. Liu, Co-pyrolysis of biomass and coal in a free fallreactor, Fuel 86 (2007) 353–359.
33] B. Moghtaderi, C. Meesri, T.F. Wall, Pyrolytic characteristics of blended coal andwoody biomass, Fuel 83 (2004) 745–750.
34] S.S. Idris, N.A. Rahman, K. Ismail, A.B. Alias, X.A. Rashid, M.J. Aris, Investigationon thermochemical behavior of low rank Malaysian coal, oil palm biomass andtheir blends during pyrolysis via thermogravimetric analysis (TGA), Bioresour.Technol. 101 (2010) 4584–4592.
35] M.J. Antal Jr., G. Varhegyi, Cellulose pyrolysis kinetics: the current state ofknowledge, Ind. Eng. Chem. Res. 34 (1995) 703–717.
36] L. Zhou, T. Luo, Q. Huang, Co-pyrolysis characteristics and kinetics of coal andplastic blends, Energy Convers. Manage. 50 (2009) 705–710.
37] A.K. Galwey, M.E. Brown, Kinetic background to thermal analysis and calorime-try, in: Handbook of Thermal Analysis and Calorimetry, Vol. 1: Principles andPractice, 1st ed., Elsevier Science, The Netherlands, 1998, pp. 147–224.
38] D.F. Arseneau, Competitive reactions in the thermal decomposition of cellulose,Can. J. Chem. Eng. 49 (1971) 632–638.
39] T. Fisher, M. Hajaligol, B. Waymack, D. Kellogg, Pyrolysis behavior and kineticsof biomass derived materials, J. Anal. Appl. Pyrol. 62 (2002) 331–349.
40] H. Jüntgen, Review of the kinetics of pyrolysis and hydropyrolysis in relationto the chemical constitution of coal, Fuel 63 (1984) 731–737.
41] H.A.G. Chermin, D.W. van Krevelen, Chemical structure and properties of coalIXII. A mathematical model of coal pyrolysis, Fuel 36 (1957) 85–104.
42] N. Petrov, T. Budinova, M. Razvigorova, V. Minkova, Preparation of activatedcarbon from cherry stones, apricot stones and grape seeds for removal of metalions from water, in: Proceedings of the 2nd Olle Lindström Symp. on RenewableEnergy-Bioenergy, 1999, https://www.ecn.nl/phyllis2/Biomass/View/1670(accessed 18.11.13).
Related Documents


