Environ Resource Econ (2007) 38:573–593 DOI 10.1007/s10640-007-9090-y Co-ordinated environmental regulation: controlling non-point nitrate pollution while maintaining river flows Ashar Aftab · Nick Hanley · Athanasios Kampas Received: 27 March 2006 / Accepted: 9 February 2007 / Published online: 27 March 2007 © Springer Science+Business Media B.V. 2007 Abstract Environmental policy often addresses multiple targets, yet much economic analysis of pollution control is based on a single-target objective. In this paper, we pres- ent an analysis of policies to control non-point source nitrate pollution in the presence of minimum river flow restrictions. A non-linear bio-physical economic optimisation model of an intensively cultivated Scottish agricultural catchment was constructed. The presence of minimum river flow controls in the catchment was found to reduce nitrogen pollution. However, by themselves, river flow controls were found not to be a cost effective means to reduce non-point pollution. We quantify the improved social welfare from coordinating the environmental regulation of river flows and pol- lution, and determine the conditions under which such coordination is beneficial. The paper also investigates whether the benefits of such coordination can be sus- tained under wetter (winter) weather conditions implied by current climate change predictions. Keywords Coordinated regulation · Environmental taxation · Integrated catchment management · Non-point pollution · River flows · Transaction costs · Water framework directive · Water pollution A. Aftab (B ) Department of Economics and Finance, University of Durham, 23/26 Old Elvet, Durham DH1 3HY, UK e-mail: [email protected] N. Hanley Department of Economics, University of Stirling, Stirling Scotland, UK A. Kampas Department of Agricultural Economics and Development, Agricultural University of Athens, Athens, Greece

Welcome message from author
This document is posted to help you gain knowledge. Please leave a comment to let me know what you think about it! Share it to your friends and learn new things together.
Transcript

Environ Resource Econ (2007) 38:573–593DOI 10.1007/s10640-007-9090-y
Co-ordinated environmental regulation: controllingnon-point nitrate pollution while maintaining river flows
Ashar Aftab · Nick Hanley · Athanasios Kampas
Received: 27 March 2006 / Accepted: 9 February 2007 / Published online: 27 March 2007© Springer Science+Business Media B.V. 2007
Abstract Environmental policy often addresses multiple targets, yet much economicanalysis of pollution control is based on a single-target objective. In this paper, we pres-ent an analysis of policies to control non-point source nitrate pollution in the presenceof minimum river flow restrictions. A non-linear bio-physical economic optimisationmodel of an intensively cultivated Scottish agricultural catchment was constructed.The presence of minimum river flow controls in the catchment was found to reducenitrogen pollution. However, by themselves, river flow controls were found not tobe a cost effective means to reduce non-point pollution. We quantify the improvedsocial welfare from coordinating the environmental regulation of river flows and pol-lution, and determine the conditions under which such coordination is beneficial.The paper also investigates whether the benefits of such coordination can be sus-tained under wetter (winter) weather conditions implied by current climate changepredictions.
Keywords Coordinated regulation · Environmental taxation ·Integrated catchment management · Non-point pollution · River flows ·Transaction costs · Water framework directive · Water pollution
A. Aftab (B)Department of Economics and Finance, University of Durham, 23/26 Old Elvet,Durham DH1 3HY, UKe-mail: [email protected]
N. HanleyDepartment of Economics, University of Stirling, Stirling Scotland, UK
A. KampasDepartment of Agricultural Economics and Development, Agricultural University of Athens,Athens, Greece
574 A. Aftab et al.
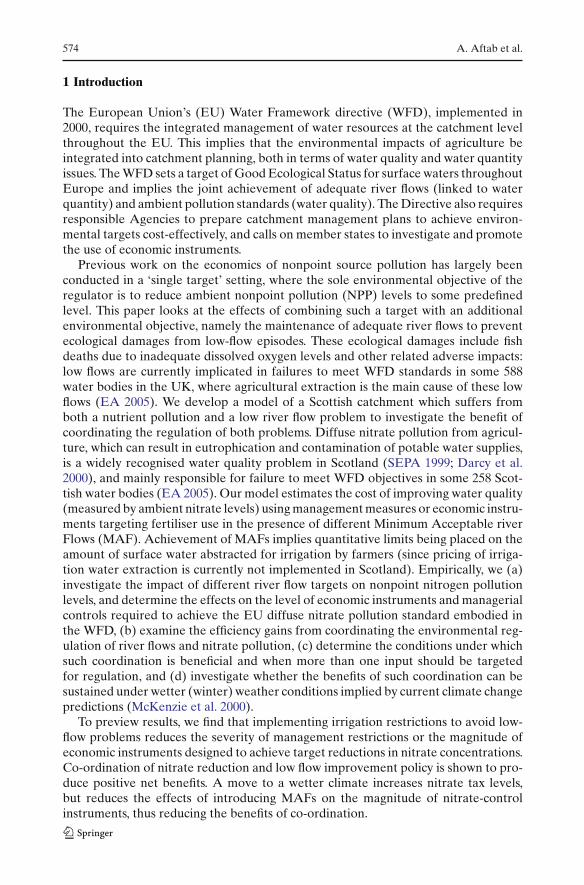
1 Introduction
The European Union’s (EU) Water Framework directive (WFD), implemented in2000, requires the integrated management of water resources at the catchment levelthroughout the EU. This implies that the environmental impacts of agriculture beintegrated into catchment planning, both in terms of water quality and water quantityissues. The WFD sets a target of Good Ecological Status for surface waters throughoutEurope and implies the joint achievement of adequate river flows (linked to waterquantity) and ambient pollution standards (water quality). The Directive also requiresresponsible Agencies to prepare catchment management plans to achieve environ-mental targets cost-effectively, and calls on member states to investigate and promotethe use of economic instruments.
Previous work on the economics of nonpoint source pollution has largely beenconducted in a ‘single target’ setting, where the sole environmental objective of theregulator is to reduce ambient nonpoint pollution (NPP) levels to some predefinedlevel. This paper looks at the effects of combining such a target with an additionalenvironmental objective, namely the maintenance of adequate river flows to preventecological damages from low-flow episodes. These ecological damages include fishdeaths due to inadequate dissolved oxygen levels and other related adverse impacts:low flows are currently implicated in failures to meet WFD standards in some 588water bodies in the UK, where agricultural extraction is the main cause of these lowflows (EA 2005). We develop a model of a Scottish catchment which suffers fromboth a nutrient pollution and a low river flow problem to investigate the benefit ofcoordinating the regulation of both problems. Diffuse nitrate pollution from agricul-ture, which can result in eutrophication and contamination of potable water supplies,is a widely recognised water quality problem in Scotland (SEPA 1999; Darcy et al.2000), and mainly responsible for failure to meet WFD objectives in some 258 Scot-tish water bodies (EA 2005). Our model estimates the cost of improving water quality(measured by ambient nitrate levels) using management measures or economic instru-ments targeting fertiliser use in the presence of different Minimum Acceptable riverFlows (MAF). Achievement of MAFs implies quantitative limits being placed on theamount of surface water abstracted for irrigation by farmers (since pricing of irriga-tion water extraction is currently not implemented in Scotland). Empirically, we (a)investigate the impact of different river flow targets on nonpoint nitrogen pollutionlevels, and determine the effects on the level of economic instruments and managerialcontrols required to achieve the EU diffuse nitrate pollution standard embodied inthe WFD, (b) examine the efficiency gains from coordinating the environmental reg-ulation of river flows and nitrate pollution, (c) determine the conditions under whichsuch coordination is beneficial and when more than one input should be targetedfor regulation, and (d) investigate whether the benefits of such coordination can besustained under wetter (winter) weather conditions implied by current climate changepredictions (McKenzie et al. 2000).
To preview results, we find that implementing irrigation restrictions to avoid low-flow problems reduces the severity of management restrictions or the magnitude ofeconomic instruments designed to achieve target reductions in nitrate concentrations.Co-ordination of nitrate reduction and low flow improvement policy is shown to pro-duce positive net benefits. A move to a wetter climate increases nitrate tax levels,but reduces the effects of introducing MAFs on the magnitude of nitrate-controlinstruments, thus reducing the benefits of co-ordination.

Co-ordinated environmental regulation 575
In what follows, Sect. 2 reviews previous work in this area, whilst Sects. 3 and 4 setout the model construction and the policy options to be simulated. Section 5 containsresults, and conclusions are drawn in Sect. 6.
2 Previous work
There is an abundance of literature on the economics of nonpoint pollution control(Dosi and Tomasi 1994; Xepapadeas 1997; Shortle and Horan 2001), and some investi-gating the use of irrigation controls to control NPP (Stevens 1988; Caswell et al. 1990;Dinar and Letey 1991; Weinberg et al. 1993; Brooker and Young 1994; Helfand 1995;Albiac et al. 2001). However, there is no study to our knowledge which empiricallyinvestigates the effect of imposing minimum river flow requirements on the controlof surface water nitrate pollution in a way which allows the benefits of co-ordinationto be estimated.
Pertinent dynamic modelling by Dinar et al. (1993, 1998) investigates the multipletargeting of water quantity and quality (salinity) percolating to groundwater in aCalifornian aquifer. Although they allow farmers to irrigate using both surface andground irrigation, they are only concerned with water quality and quantity in ground-water. Other relevant work includes that of Larson et al. (1996) who found irrigationflows to be the best input to regulate nonpoint source nitrogen pollution from lettuceproduction in California. Other papers by Helfand report similar findings (Helfand1995; Helfand and House 1995). The important difference between these papers andthe research reported here is that Larson et al. consider a single environmental target(ambient nitrate levels), and compare an input tax on irrigation water with taxes onnitrate input. In contrast, this study examines the impacts of having two environmen-tal targets (river water nitrate levels and flows) on policy choice. A study by Stevensof cotton production in California determined the equivalence of taxing nitrogen andirrigation water under certain assumptions (nitrate emissions represented nitrogenleaching) but found their fiscal implications to differ (Stevens 1988). Another Califor-nia study, this time of selenium in agricultural drainage waters, investigated the use ofwater markets to achieve pollution reduction (Weinberg et al. 1993). Weinberg et al.concluded that although policy instruments aimed at water markets did not achieve aleast-cost solution to the pollution problem, they did have merit as practical alterna-tives to policies such as estimated emission taxes which are economically efficient intheory but hard to implement in practice. Finally, an empirical study in Spain (Albiacet al. 2001) concludes that in terms of farmer costs, pricing irrigation water is the mostexpensive means to control nitrogen pollution .
It may be noted that in all of the above studies, restriction on water usage did notresult from the need to maintain MAFs for ecological reasons. Our contribution tothis literature is thus in moving from a single environmental objective to twin targetsof nitrate control and minimum flow maintenance. We integrate MAF restrictionsdirectly in an economic optimisation model of land use, which allows us to simulatethe effect of coordinating policies to control nonpoint nitrate pollution and achieveminimum flows in a river jointly. Such coordination is important in the light of theWFD’s requirement for ‘integrated catchment management’. We also comment on theissue of which input to target in order to achieve a cost effective control of nonpointnitrate pollution alone, in the spirit of Larson et al. (1996).

576 A. Aftab et al.
3 Modelling methodology
Much policy analysis relies on the use of “arbitrary” standards for environmentalquality, set through the political process (Hanley et al. 2006). Examples of such stan-dards include the WFD general target of good ecological status, and more specificupper limits for nitrates in water of 50 mg NO−
3/l (or 11.3 mg N/l) contained within the
EU Nitrates Directive. A challenge facing regulators is to implement the WFD cost-effectively, given the need to meet specific minimum river flows, and the requirementunder Article 9 to ensure water users (here, farmers) pay the social costs of water use.
Our model simulates production activities in the 4,347 farmed hectares of the WestPeffer catchment in East Lothian, Scotland. This catchment was chosen since it suffersfrom both a nitrate problem and a low summer flow problem, Both of which are attrib-uted to agricultural activities in the catchment. Potatoes are the main irrigated crop inthe catchment and up to 65% of the potato crop in East Lothian is currently irrigated.The West Peffer catchment is presently subject to extraction controls (Fox 1999), dueto the damaging effects of uncontrolled surface water extraction on river ecology,wildlife populations, recreational use and amenity values during periods of low flow(Willis and Garrod 1995, 1999). In practice, the rule operated by the regulator is tostop extractions through licence suspension when river flow falls to the 95th percentileMAF (Minimum Acceptable Flow) at specific gauging points (Crabtree et al. 2000).1
The model has four major arable crops (winter wheat, spring barley, winter oil-seed rape, main crop potatoes) besides livestock farming (dairy cows, suckler cows,intensive beef, and sheep) and the associated grazing grass/silage production. Overlaying a G.I.S. mapping of the catchment boundary onto soil survey digitised mapsyielded the three prevalent soil textures in the catchment (sandy, loamy, and silty)and their distribution. Spatial heterogeneity is therefore accounted for by the inclu-sion of different soil textures and multiple outputs (crops and livestock) which resultin different production and nitrate leaching (Wu 1999). A schematic diagram of themodel is included as Appendix 1.
Crops were combined in two 4–5 year rotations, i.e. (a) spring barley, winter wheat,spring barley followed by potatoes on predominantly sandy soils and, (b) winter wheat,winter wheat, spring barley, followed by winter oilseed rape on loamy and silty soils.After consultation with the Agriculture Development and Advisory Service (ADAS),since estimating nitrate loss when leys are ploughed out is difficult and inaccurate2
we assumed that all grass grown in the model is on permanent pastures (in fact, mostgrass in the catchment falls into this category). Catchment agronomic practices andparameters, crop rotations and the existing baseline scenario were deduced from theliterature and catchment level farm survey3 data. Transfer payment schemes and sub-sidy incentives for both livestock and arable cultivation as they applied in 1997 werealso included in the model (SOAEFD 1997a, b).
The farmer’s decision on how much nitrogen to apply is based on crop productionfunctions for each crop on the three soil types in the catchment, and the market priceof the crops and production costs. The model was calibrated to the 1997/98 price level.
1 The 95th percentile flow defines a flow exceeded naturally on 95% of days in a ‘average’ year(1989–1998 period) during which no extraction took place.2 Personal communication from Eunice Lord (ADAS modeller of NITCAT).3 By law a minimum requirement of five holdings of any activity per catchment must exist beforedisclosure, therefore not all the required data was made available. This meant approximating certainlivestock values such as the stocking rate which was assumed to be 2.2 glu/ha.

Co-ordinated environmental regulation 577
Crop nitrogen production functions for each crop/soil combination were estimatedusing ADAS data (Chambers and Johnson 1990), while grazing and silage grass pro-duction was determined from Scottish Agricultural College data (SAC 1996, 1997).Separate potato nitrogen production functions under different river flow regimesand weather conditions were approximated (Crabtree et al. 2000), since irrigationcontributes both to potato yield and quality (Haverkort and Mackerron 2000).
The model assumes that all farm yard manure and slurry from livestock is appliedto grassland crops (both temporary silage and permanent grazing) up to levels rec-ommended in the Farm Management Handbook, and subject to the “good practice”guidelines of when and how manure can be spread over the year (SAC 1996). Inall cases, this leads to an excess demand for nitrogen which is then met by inor-ganic N purchases. Estimates of the nitrogen content of different farm animal wasteswere approximated (SAC 1992). Depending on the most profitable land allocationto each crop/soil type and ensuing nitrogen application (including farm manure fromlivestock) the model uses leaching functions to estimate the daily average leachingfor each week in a year based on the actual rainfall pattern of three ‘stylised’ yearsrepresenting a dry, mean and wet year during the 1989–1998 period. These leachingfunctions were obtained by regressing the results of numerous runs of the NITCATmodel (Lord 1992), for each crop/soil combination within a reasonable range of nitro-gen fertiliser applications. The IRRIGUIDE model (Bailey and Spackman 1996) wasused to give crop-dependent weekly values of evapo-transpiration over winter; whileelution was modelled using the SLIMMER algorithm (Anthony et al. 1996). Grass-land leaching was estimated using NCYCLE (Scholefield et al. 1991; Lockyer et al.1995). Our model assumes that nitrogen leachate is transported via drains to theriver instantaneously where it mixes with the river water. Thus the model allows dailyapproximations of nitrogen NPP levels in the river over a year.
Hydrological modelling involved estimating naturalised river flow using the DIYmodel (Dunn 1998) and determining the amount of water available for potato irri-gation before river flows fell to the 90th, 95th and 98th percentile flow,4 relative to asituation with no river flow restriction. The timing of this available water was inputtedinto a potato growth model developed by Cambridge University (Crabtree et al. 2000)to give potato crop quantity and quality.5 Besides the option of not irrigating potatoesat all, the modelling process allowed for two irrigation regimes termed optimum andrestricted. Of the two, optimum irrigation resulted in the better quality potato cropwith significantly less incidence of disease and premium market price. Thus the potatoand irrigation modelling yielded the total acreage of potato crops allowed under opti-mal and restricted irrigation for each river flow restriction under the three differentweather scenarios. These upper bounds on acreage acted as constraints in the eco-nomic model reflecting the scarcity of irrigation water due to the desire to maintainminimum ecologically-acceptable river flows.
4 The 90th percentile flow imposes the greatest restriction on irrigation extraction while 98th percen-tile the least (i.e. the greatest river flow).5 For details on the potato growth model, naturalised flow estimation, reservoir storage, boreholecapacity, irrigation dates, extraction points, application of flow related bans and other assumptionssee Crabtree, et al.

578 A. Aftab et al.
4 Economic modelling of policy options
A non-linear optimisation model was written using the General Algebraic Model-ling System (GAMS) (Brooke et al. 1998) and solved using the CONOPT II solver(Stolbjerg-Drud 1993).6 The entire catchment is modelled as one economic decisionmaker who is presumed to maximise profits. The regulator’s objective is to minimisethe difference between the unrestricted catchment profit ��κ and the catchmentprofit under different pollution control policies.
The regulator’s objective is:
Minimise ��κ −∑
c
∑
s
(pcQcs − wnncslcs
) +∑
i
∑
j
h�κij ρj +∑
b
abpb
−wn
(∑
i
η�κi λ�κi −∑
t
∑
s
µtsglts
)− C + T (1)
where� is the prevailing weather condition (dry, mean, or wet) and κ is the catchmentriver flow restriction (no flow restriction or 98, 95 and 900/00 flow restriction) enforcedby the regulator.��κ for each�κ combination is the outcome of an unrestricted runof the model without any regulation of river flows or non-point nitrate pollution. Thuswhen considering a particular regulatory policy it remains constant and independentof the optimisation problem. The catchment profit in the objective function is definedas the return to the producer’s management and allocation of resources over the costof total catchment nitrogen consumption { ∑
c∑
s wnncslcs (arable crops), wn ∑i ηiλi
(potatoes), wn ∑t∑
s µtsglts (silage and grazing grass)} and all other secondary costsof farming C. Further terms in (1) are pc the market price of arable crop c, ρj themarket price of potato quality j, and pb is the market return from one grazing live-stock unit (GLU) of livestock type b. wn refers to the cost of nitrogen fertiliser, ncsand lcs is the nitrogen applied and land allocated to arable crop c(excluding potatoesand grassland) con soil type s. glts and µts refer respectively to land and nitrogenallocated to grassland type t (grazing and cutting). λ� r
fi and η� rfi refer to land allocated
and nitrogen applied to the potato crop under irrigation regime i(optimal, restrictedor un-irrigated) resulting in potato yield h�κfij differentiated by quality j. T refers toall transfer payments, positive for input and emission taxes and negative for subsidesrelated to setaside or stocking density reductions, where relevant. Such transfer pay-ments are not included in estimates of abatement costs (Kampas and Whit 2004).Overall Eq. 1 estimates the social cost of regulation under different regulatory poli-cies and weather conditions. Appendix 2 gives a concise mathematical formulation ofthe model. Overall the model’s calculated baseline outcome was very similar to thereported land use data in 1996–1997, with the percentage deviation between reporteddata and baseline being −6.37% for arable, −4.63% for grassland and −1.64% forset-aside land.7
Depending on the most profitable crop, soil, acreage and nitrogen input allocationsthe model calculated the total emissions generated and the volume of water trans-porting them to the river, for different weather scenarios and river flow restrictions.The results for ‘mean’ and ‘wet’ weather are reported here: the ‘dry’ weather year did
6 The results were confirmed by using the MINOS 5 solver which yielded similar results withinreasonable bounds.7 Limited livestock statistics were disclosed due to confidentiality issues.

Co-ordinated environmental regulation 579
not breach the nitrate standard and is thus not mentioned again. The ‘wet weather’year is assumed to represent a possible future situation, given current predictions ofclimate change for Scotland (McKenzie et al. 2000).
4.1 Policy options simulated
A set of policy options were simulated to reduce the baseline number of weeks ina year the river exceeded the EU nitrate standard from 14 weeks to two targetswhere the standard is breached in either 8 or 6 weeks in a year. We deliberatelychose not to model a “zero breach of target” option since, for a diffuse pollutant sub-ject to stochastic processes, this is unrealistic, and does not accord with how targetsfor such pollutants are actually set. For example, the EU Bathing Waters Direc-tive does not require all samples taken to be within the Guideline and Mandatorystandards, but simply a sizeable majority (80%) of samples, whilst samples takenin exceptionally wet weather can be disregarded. Another way of putting this is tosay that achieving a zero weeks violation target would be prohibitively costly. Thechoice of policy options related to existing themes in the literature, and to optionswhich seem likely to form part of actual policy in Scotland over the next 10 years.They were: (a) emission taxation (Johnson et al. 1991), (b) nitrogen input taxation(Kampas and White 2002), (c) emission quotas (Moxey and White 1994), (d) nitro-gen input quotas (Wu et al. 1995), (e) managerial restrictions on stocking densityand, (f) restrictions on the area of set-aside (land retirement). Set-aside land, ifcorrectly managed, can be used to reduce NPP (Burt and Haycock 1993; Ribaudoet al. 1994) while conferring secondary environmental benefits as well (Robinsonand Lind 1999) (which were not quantified and thus excluded from the analysis).Set-aside achieves pollution mitigation by removing land from agricultural produc-tion (that is, set aside affects the extensive margin). Nitrate run-off and leachingfrom setaside land is known to be lower than that from cropped land or man-aged grassland, whilst fertilizer applications to set-aside are likely to be minimalor zero, Stocking density reductions decrease the intensity of land use (i.e. affectsthe intensive margin) by either reducing the number of livestock in production orre-allocating land from arable crops to grassland (which can be less polluting), orboth.
All of the above policies were simulated by undertaking iterative runs of themodel for each �κ combination. For example the catchment emission quota wasincrementally decreased until the target compliance with the environmental standardwas achieved. The managerial control options were imposed in a similar manner,i.e. a gradual increase in catchment setaside and decrease in stocking density, untilthe number of days the river nitrate concentration exceeded the EU standard wasacceptable.
5 Results
5.1 Impact of MAF requirements on nitrate pollution control policies
The impact of a nitrogen input tax (imposed on artificial fertiliser only, not on manure)was simulated by running the model iteratively with increasing nitrogen costs underfour different minimum river flow targets, based on mean weather conditions over

580 A. Aftab et al.
0
50
100
150
200
250
300
350
400
450
14 13 12 11 10 9 8 7 6 5 4
weeks exceeding standard
perc
enta
ge in
crea
se in
pric
e of
nitr
ogen
95%ile flow restriction 98%ile flow restriction
90%ile flow restriction no flow restriction
Fig. 1 Input taxation. Note: The baseline market price of nitrogen fertiliser was £ 0.42
1989–1998. Figure 1 shows the percentage increase in the price of nitrogen (by way ofan input tax) required to reduce the number of weeks in the year which exceed thestandard under three different river flow standards, where the 90th percentile is thestrictest target. Tougher water quality standards (lower values on the x-axis) requirehigher N taxes, ceteris paribus. It is evident that with irrigation restrictions in place therequired rate of nitrogen taxation is less than without any river flow controls. Gen-erally, the more stringent the surface water extraction control, the lower the N taxrequired to achieve the N standard. In other words there is complimentary interactionbetween N taxes and river flow maintenance. Secondly, as the regulator tightens therequirement to meet the water quality standard, the difference in taxation requiredwith and without the river flow restrictions increases. By restricting irrigation throughriver flow controls, the regulatory authority lowers the profit per hectare, promptinga shift in land allocation from optimal to restricted irrigation, which then reducesthe incentive to apply as much nitrogen to the potato acreage. This, in consequence,reduces the tax rate needed to achieve a given water quality standard.
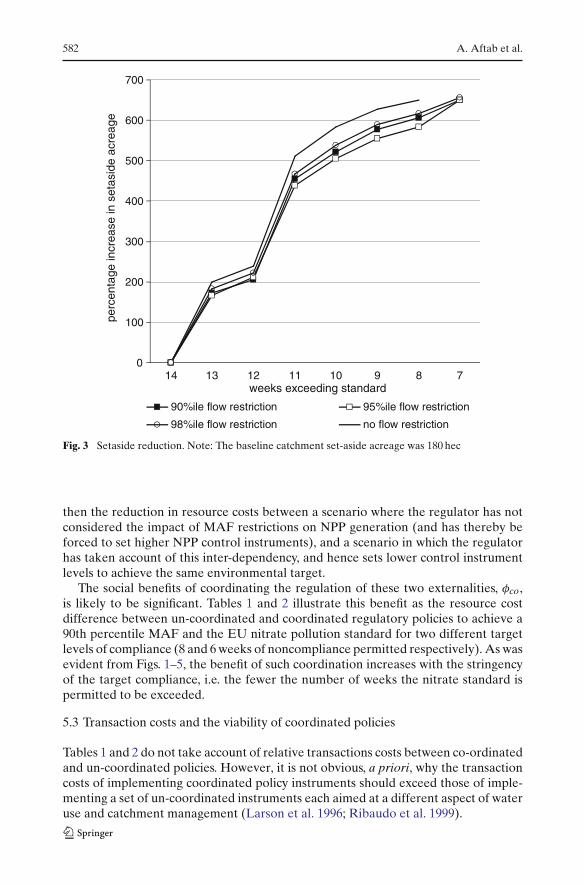
Four other measures to reduce nitrogen NPP were considered. These were stockingdensity reduction (Fig. 2), a set-aside8 restriction (Fig. 3), a differentiated input quota(Fig. 4) and an estimated emission tax (Fig. 5). The results are consistent with thosefor input taxation in that the maintenance of river flow controls reduces the need toimpose as strict a policy to control nitrogen NPP when compared to the absence of any
8 It is assumed that set-aside land is not rotational. Rotational set-aside exacerbates diffuse nitrogenleaching.

Co-ordinated environmental regulation 581
0
10
20
30
40
50
60
70
80
14 13 12 11 10 9 8 7 6
weeks exceeding standard
perc
enta
ge r
educ
tion
in s
tock
ing
dens
ity (
glu/
ha)
90%ile flow restriction 95%ile flow restriction
98%ile flow restriction no flow restriction
Fig. 2 Stocking density reduction. Note: The baseline stocking density was 2.0 glu/ha
irrigation limits. Under all regulatory regimes the distinction between the presenceand absence of a river flow restriction is clear with the exception of stocking densityreductions, where the difference is marginal.
However, the ranking amongst the four river flow restrictions is not consistent.Irrespective of the pollution control policy, one would expect the tightest river flowrestriction (90th percentile) to result in the most NPP control followed by 95th andthen 98th percentile river flow restriction. The results are not entirely consistent inthis regard due to certain rotational and livestock restrictions in the model. It seemsthat within the feasible region there are land, nitrogen and crop/soil allocations underthe 95th and 98th percentile river flow restrictions which result in marginally less NPPthan under the 90th percentile restriction. This is not an error; rather it highlights themodel’s nonlinearity.
5.2 Benefits of coordinating MAF and nitrogen control policies
Coordinated policy should consider the impact of MAF restrictions (irrigation con-trols to achieve a minimum percentile river flow) on the generation of nonpointnitrate pollution, and then set nonpoint pollution control policy accordingly. Indeed,such ‘integrated’ catchment management is a guiding principle behind the prepa-ration of River Basin Management Plans under the Water Framework Directive.Co-ordination is likely to reduce the social cost of NPP regulation, since uncoordi-nated policy requires higher control instrument levels. The co-ordination benefit is
582 A. Aftab et al.
0
100
200
300
400
500
600
700
14 13 12 11 10 9 8 7weeks exceeding standard
perc
enta
ge in
crea
se in
set
asid
e ac
reag
e
90%ile flow restriction 95%ile flow restriction
98%ile flow restriction no flow restriction
Fig. 3 Setaside reduction. Note: The baseline catchment set-aside acreage was 180 hec
then the reduction in resource costs between a scenario where the regulator has notconsidered the impact of MAF restrictions on NPP generation (and has thereby beforced to set higher NPP control instruments), and a scenario in which the regulatorhas taken account of this inter-dependency, and hence sets lower control instrumentlevels to achieve the same environmental target.
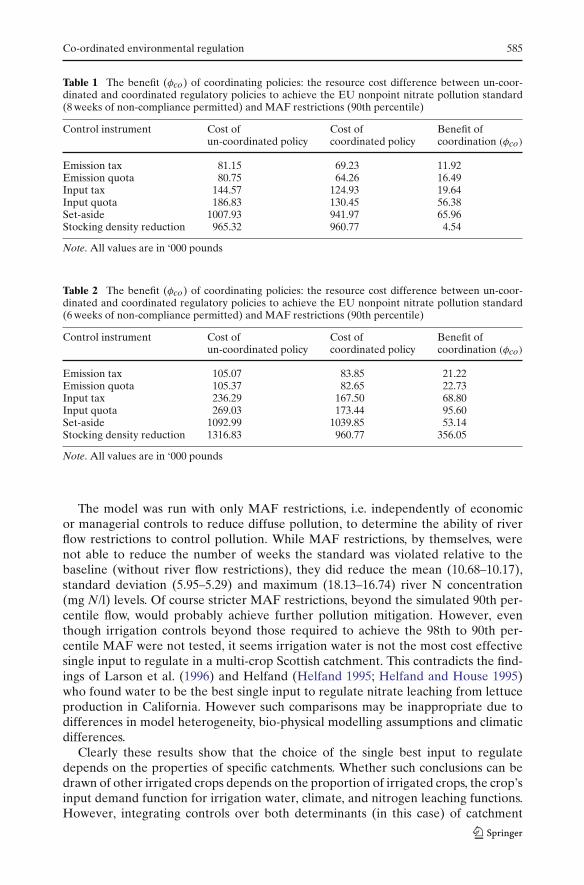
The social benefits of coordinating the regulation of these two externalities, φco,is likely to be significant. Tables 1 and 2 illustrate this benefit as the resource costdifference between un-coordinated and coordinated regulatory policies to achieve a90th percentile MAF and the EU nitrate pollution standard for two different targetlevels of compliance (8 and 6 weeks of noncompliance permitted respectively). As wasevident from Figs. 1–5, the benefit of such coordination increases with the stringencyof the target compliance, i.e. the fewer the number of weeks the nitrate standard ispermitted to be exceeded.
5.3 Transaction costs and the viability of coordinated policies
Tables 1 and 2 do not take account of relative transactions costs between co-ordinatedand un-coordinated policies. However, it is not obvious, a priori, why the transactioncosts of implementing coordinated policy instruments should exceed those of imple-menting a set of un-coordinated instruments each aimed at a different aspect of wateruse and catchment management (Larson et al. 1996; Ribaudo et al. 1999).

Co-ordinated environmental regulation 583
0
5
10
15
20
25
30
35
40
45
50
55
60
14 13 12 11 10 9 8 7 6 5 4weeks exceeding standard
perc
enta
ge r
educ
tion
in c
atch
men
t nitr
ogen
use
90%ile flow restriction 95%ile flow restriction98%ile flow restriction no flow restriction
Fig. 4 Nitrogen input quota. Note: The baseline catchment consumption of artificial nitrogen fertiliserwas 709,455 kg
Input based, first-best solutions to control NPP requires each input to be taxedaccording to its marginal social damage, however in practice this may not be feasibledue to prohibitive transaction costs (information and implementation) associated withdesigning and enforcing such a complicated policy (Larson et al. 1996; Ribaudo et al.1999). Hence some authors have advocated the second-best cost effective regulationof a single input only (Larson et al. 1996). The transaction costs of implementing anirrigation water tax in conjunction with a complete set of controls on other inputsgenerating pollution (first best solution), νf are likely to be higher than that of coor-dinating MAF restrictions (which will be imposed in any case, for ecological reasons)and a nitrate NPP control policy, νco. Thus in terms of nonpoint source pollutioncontrol if νf > νco and νco < φco, and it is likely that both conditions will be satisfied,then coordination results in improved social welfare.
5.4 Choice of regulatory policy
Interestingly, from Tables 1 and 2, on the basis of resource cost alone, a perfectlydifferentiated emissions quota is the most efficient nonpoint nitrate pollution controlinstrument, incurring a slightly lower aggregate abatement cost in the co-ordinatedsetting than the next cheapest policy, an emissions tax. Set aside and stocking densityreductions are the least cost-effective instruments. However, this result may not holdif the transaction costs of gathering information, implementing and enforcing a policyare factored in (Shortle and Dunn 1986; Shortle and Abler 1994; Weersink et al. 1998).
584 A. Aftab et al.
0
1
2
3
4
5
6
7
8
9
14 13 12 11 10 9 8 7 6 5 4
weeks over standard
emis
sion
taxr
ate
(£/k
g)
no flow restriction 95%ile flow restriction98%ile flow restriction 90%ile flow restriction
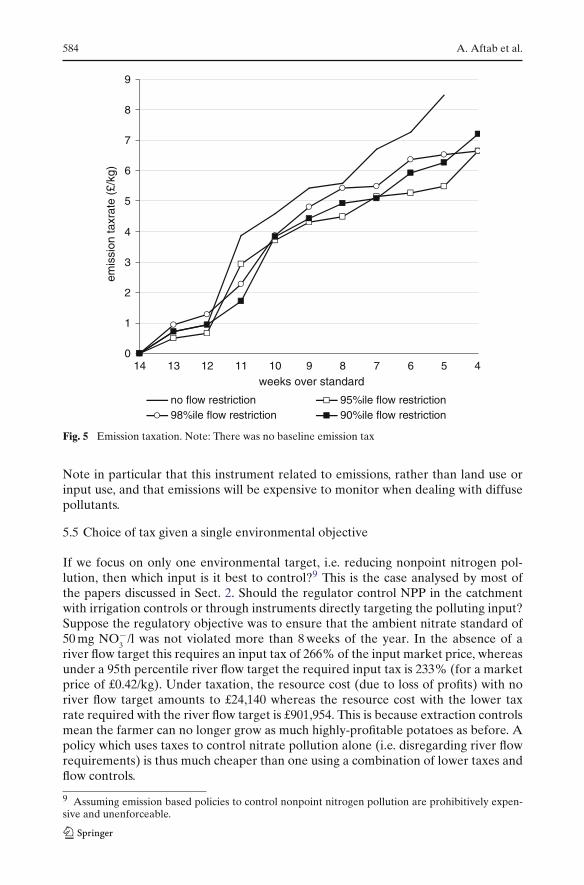
Fig. 5 Emission taxation. Note: There was no baseline emission tax
Note in particular that this instrument related to emissions, rather than land use orinput use, and that emissions will be expensive to monitor when dealing with diffusepollutants.
5.5 Choice of tax given a single environmental objective
If we focus on only one environmental target, i.e. reducing nonpoint nitrogen pol-lution, then which input is it best to control?9 This is the case analysed by most ofthe papers discussed in Sect. 2. Should the regulator control NPP in the catchmentwith irrigation controls or through instruments directly targeting the polluting input?Suppose the regulatory objective was to ensure that the ambient nitrate standard of50 mg NO−
3/l was not violated more than 8 weeks of the year. In the absence of a
river flow target this requires an input tax of 266% of the input market price, whereasunder a 95th percentile river flow target the required input tax is 233% (for a marketprice of £0.42/kg). Under taxation, the resource cost (due to loss of profits) with noriver flow target amounts to £24,140 whereas the resource cost with the lower taxrate required with the river flow target is £901,954. This is because extraction controlsmean the farmer can no longer grow as much highly-profitable potatoes as before. Apolicy which uses taxes to control nitrate pollution alone (i.e. disregarding river flowrequirements) is thus much cheaper than one using a combination of lower taxes andflow controls.
9 Assuming emission based policies to control nonpoint nitrogen pollution are prohibitively expen-sive and unenforceable.
Co-ordinated environmental regulation 585
Table 1 The benefit (φco) of coordinating policies: the resource cost difference between un-coor-dinated and coordinated regulatory policies to achieve the EU nonpoint nitrate pollution standard(8 weeks of non-compliance permitted) and MAF restrictions (90th percentile)
Control instrument Cost of Cost of Benefit ofun-coordinated policy coordinated policy coordination (φco)
Emission tax 81.15 69.23 11.92Emission quota 80.75 64.26 16.49Input tax 144.57 124.93 19.64Input quota 186.83 130.45 56.38Set-aside 1007.93 941.97 65.96Stocking density reduction 965.32 960.77 4.54
Note. All values are in ‘000 pounds
Table 2 The benefit (φco) of coordinating policies: the resource cost difference between un-coor-dinated and coordinated regulatory policies to achieve the EU nonpoint nitrate pollution standard(6 weeks of non-compliance permitted) and MAF restrictions (90th percentile)
Control instrument Cost of Cost of Benefit ofun-coordinated policy coordinated policy coordination (φco)
Emission tax 105.07 83.85 21.22Emission quota 105.37 82.65 22.73Input tax 236.29 167.50 68.80Input quota 269.03 173.44 95.60Set-aside 1092.99 1039.85 53.14Stocking density reduction 1316.83 960.77 356.05
Note. All values are in ‘000 pounds
The model was run with only MAF restrictions, i.e. independently of economicor managerial controls to reduce diffuse pollution, to determine the ability of riverflow restrictions to control pollution. While MAF restrictions, by themselves, werenot able to reduce the number of weeks the standard was violated relative to thebaseline (without river flow restrictions), they did reduce the mean (10.68–10.17),standard deviation (5.95–5.29) and maximum (18.13–16.74) river N concentration(mg N/l) levels. Of course stricter MAF restrictions, beyond the simulated 90th per-centile flow, would probably achieve further pollution mitigation. However, eventhough irrigation controls beyond those required to achieve the 98th to 90th per-centile MAF were not tested, it seems irrigation water is not the most cost effectivesingle input to regulate in a multi-crop Scottish catchment. This contradicts the find-ings of Larson et al. (1996) and Helfand (Helfand 1995; Helfand and House 1995)who found water to be the best single input to regulate nitrate leaching from lettuceproduction in California. However such comparisons may be inappropriate due todifferences in model heterogeneity, bio-physical modelling assumptions and climaticdifferences.
Clearly these results show that the choice of the single best input to regulatedepends on the properties of specific catchments. Whether such conclusions can bedrawn of other irrigated crops depends on the proportion of irrigated crops, the crop’sinput demand function for irrigation water, climate, and nitrogen leaching functions.However, integrating controls over both determinants (in this case) of catchment

586 A. Aftab et al.
0
100
200
300
400
500
600
700
800
900
1000
1100
1200
1300
1400
18 17 16 15 14 13 12 11 10 9 8 7weeks exceeding the standard
perc
enta
ge in
crea
se in
pric
e of
nitr
ogen
wet weather 98,95,90%ile and no flow restriction
mean weather 90%ile flow restriction
Fig. 6 Wet year and mean year input taxation. Note: The baseline market price of nitrogen fertiliserwas £ 0.42
water quality will always be preferable once multiple, rather than single, environmen-tal targets must be achieved.
5.6 Results for a wetter climate
Predictions from UKCIP (McKenzie et al. 2000) indicate that Scotland’s climate willbecome wetter due to enhanced global warming over the period to 2080. To investi-gate the implications of such climate change, the same policy simulations were carriedout under a ‘wet’ year weather scenario (we accept that this is merely illustrative ofpossible future weather conditions). Here, the difference in nitrogen NPP betweenany of the three river flow restriction and the absence of any flow restriction was insig-nificant under wetter weather conditions (Fig. 6). It is plausible that irrespective ofthe river flow regime and irrigation type (optimal, restricted or unirrigated), leachingrates would be fairly similar due to the higher volume of sub-soil drainage caused byhigher rainfall in this changed climate. Thus, when rainfall is more plentiful, minimumflow targets will not affect nitrogen input levels or the acreage of land irrigated. As acorollary, the presence of river flow targets has a much lower impact on the shadowprice of pollution control. It should be noted however that the required nitrogeninstrument levels are higher under wet weather conditions than under mean condi-tions (Fig. 6), since more rainfall translates into higher leaching rates. Therefore, itmay be that future farmers will face higher nitrate NPP control costs, and the benefitsof coordinated regulation may also diminish.
Co-ordinated environmental regulation 587
6 Conclusion
This study has looked at the joint management of two agricultural externalities, nitro-gen NNP in rivers and low river flows due to surface water extraction for irrigation.Overall we found that the presence of minimum river flow requirements contributedtowards pollution mitigation and thus should be considered in the design of nitrogencontrol policies. However, as a means to control diffuse nitrogen pollution alone, riverflow controls were not in themselves cost effective. Furthermore, minimum river flowrestrictions did not influence optimal control instrument levels under wetter weatherconditions, although such conditions have a direct upwards impact on required nitratetaxes in a “single target” world.
These results are of policy relevance in the context of requirements for integratedwater catchment management under the EU Water Framework Directive. We showthe benefits of co-ordinating actions across inter-connected environmental problems:such co-ordination is an important aspect of the River Basin Management Plans cur-rently being developed as part of implementing the Directive in order to achieveGood Ecological Status in EU water bodies. We also demonstrate how taking intoaccount secondary environmental objectives changes the necessary level of economicinstruments needed to achieve a primary target. However, more work is needed toinvestigate whether these results are consistent across catchments of different size,differing dependences on irrigation and different land use patterns. Groundwaterresources are also impacted by nitrate pollution and extraction, yet were not includedin our framework. Integrating targets for other NPPs such a phosphate would berelevant in many cases.
In this paper it was assumed that MAF restrictions were enforced and nitrate pol-lution control policies designed around them. The research did not investigate theimpact of nitrate pollution control policies on setting MAF restrictions as the useof nitrate pollution controls to regulate MAF is intuitively inefficient and infeasible.Additionally, the transaction costs of control policies were not included, because real-istic estimates are unavailable at present. Nor does the analysis consider the trans-action/implementation costs of imposing and monitoring percentile bans on riverextractions, which may be higher than those of enforcing input taxation. Again, thisomission is due to a lack of data.
Finally, this study relied on modelling future weather based on current wet weatherconditions, since daily estimates of future precipitation are unavailable at the present.More accurate modelling of nonpoint pollution using better approximations of futurewet weather under climate change would be valuable. Finally, a direct incorporationof uncertainty over weather patterns could be attempted, rather than relying on thesensitivity analysis we report here.
Acknowledgements This research was funded by the Economic and Social Research Council, andby the Macaulay Land Use Research Institute (UK). Thanks to Dr. Allan Lilly and Dr. Sara Dunn ofMacaulay Land Use Research Institute (UK) and Eunice Lord of ADAS (UK). We also thank twoanonymous referees for their comments on an earlier version of the paper.

588 A. Aftab et al.
Appendix 1: Catchment model
Agricultural Census(IACS Data) Land Use
Crop/soil Combinations
Nitrate Losses+ Subsurface Water Flow
Crop Yield
Producer Response
Estimate
Economic ModelAnalysis of NPS Nitrogen
Pollution Control Policies under different River Flow Restrictions
and Weather Scenarios(GAMS)
Model
Potato Growth+ Irrigation
Model
Arable Model (NITCAT)
GrasslandModel
(NCYCLE)
G.I.S.Catchment Boundary Soil Survey Data
Resource Constraints
Crop Production FunctionRiver Flow
Model (DIY)
Data
Appendix 2: A concise mathematical representation of the model regulatory objective
Minimise ��κ −∑
c
∑
s
(pcQcs − wnncslcs
) +∑
i
∑
j
h�κij ρj +∑
b
abpb
−wn
(∑
i
η�κi λ�κi −∑
t
∑
s
µtsglts
)− C + T (1)
Co-ordinated environmental regulation 589
Subject to:Secondary expenses:
C =∑
c
∑
j
Lcυcτ −∑
b
∑
m
abfbm −∑
t
∑
u
Gtztu −∑
i
∑
x
λ�κi q�κix (2)
Crop production:
ycs = γ 0cs + γ 1
cs
(γ 2
cs
)ncs + γ 3csncs (3)
Total output:
Qcs = ycslcs (4)
Grass production:
gts = β0ts + β1
ts +(β2
ts
)µts +(β3
ts
)µts (5)
Grass requirement constraint:∑
b
abGtb =∑
s
(gtsglts) (6)
Livestock N (kg/ha):
σ =∑
b ab�b∑t∑
s glts(7)
Total grassland N (kg/ha):
µts = σ + ots (8)
Total grassland nitrogen use:∑
t
∑
s
µtsglts (9)
Livestock stocking density rate:
d =∑
b ab∑t∑
s glts(10)
Stocking density constraint:
d ≤ �d (11)
Potato production:
ϕ�κi = ε�κ0i + ε�κ1i + (ε�κ2i
)η�κi + ε�κ3i η�κi (12)
Potato quality/irrigation:
h�κij = H(ϕ�κi , λ�κi
)(13)
Potato irrigation constraints:
λi ≤ �λ�κi (14)

590 A. Aftab et al.
Bounds on land allocation:
Gt =∑
s
glts ≤ �Gt, Lc =∑
s
lcs ≤ �Lc (15)
Land use constraints:∑
t
glts +∑
c
lcs + u∑
i
λ�κi ≤ Ts (16)
Crop rotational constraints:∑
t
ltsrts +∑
c
lcsrcs + ψ∑
i
λ�κi ri ≤ 0 (17)
Crop nitrate load (kg/ha):
e�cs = δ�0cs + δ�1cs (ncs) δ�2cs (18)
Livestock nitrate load (kg/ha):
v�ts = θ�0ts + θ�1ts (µts) θ�2ts (19)
Potato Nitrate load (kg/ha):
x�κi = ξ�κ0i + ξ�κ1i (ηi) ξ�κ2i (20)
Overall River concentration (mg/l):
w℘�κ =∑c
∑s
wecsw��cs lcs + ∑
t
∑s
wvtsw��ts glts + ∑
i
wx�κi
w��κi λ�κi
wR + ∑c
∑s
wℵcslcs + ∑t
∑s
wλ̄tsglts + ∑i
wh̄�κi λ�κi(21)
Environmental Quality Constraint:
w℘�κ ≤ � (22)
The regulator’s objective is to minimise the difference between the unrestrictedcatchment profit��κ and the catchment profit under different pollution control pol-icies. Where � is the prevailing weather condition (dry, mean, or wet) and k is thecatchment river flow restriction (no flow restriction or 98,95 and 90%ile flow restric-tion) enforced by the regulator. ��κ for each �κ combination is the outcome ofan unrestricted run of the model without any regulation. Thus when considering aparticular regulatory policy it remains constant and independent of the optimisationproblem. The catchment profit in the objective function is defined as the return tothe producer’s management and allocation of resources over the cost of total catch-ment nitrogen consumption {∑c
∑s wnncslcs (arable crops), wn ∑
i ηiλi (potatoes),wn ∑
t∑
s µtsglts (silage and grazing grass)} and all other secondary costs of farmingC. Where pc is the market price of arable crop c, pj the market price of potato qualityj, and pb is the market return from one grazing livestock unit (GLU) of livestock typeb.wn refers to the cost of nitrogen fertiliser, ncs and lcs is the nitrogen applied andland allocated to arable crop c (excluding potatoes and grassland) c on soil type s · gltsand µts refer respectively to land and nitrogen allocated to grassland type t (grazingand cutting). λ�κfi and η�κfi refer to land allocated and nitrogen applied to the potatocrop under irrigation regime i (optimal, restricted or un-irrigated) resulting in potatoyield h�κfij differentiated by quality j. T refers to all transfer payments (positive for

Co-ordinated environmental regulation 591
input and emission taxes and negative for subsides to induce compliance with setasideor stocking density reduction) made to induce compliance with the environmentalstandard. Such transfer payments do not comprise abatement costs because they donot contribute to economic welfare or effect the economy as a whole. Overall Eq. 1estimates the social cost of regulation under different regulatory policies and weatherconditions.
Secondary expenses C (Eq. 2) refer to all other catchment production costs exclud-ing that of nitrogen fertiliser application: fbm = (kb1, . . . kbm) is a vector of m costsper unit of livestock type (b) associated with feeding and other animal husbandryexpenses, ztu = (χt1 . . . χtu) is a vector of u per hectare costs of grassland manage-ment, υcτ = (νc1 . . . νcτ ) is a vector of t per hectare costs associated with the productionof each arable crop type and q�ix = (ω�i1 , . . . ω�ix ) is a vector of xcosts per hectare asso-ciated with potato farming including irrigation costs under each weather condition.
The crop production function equation set (Eq. 3) yields the output (kg/ha) foreach crop soil combination (the source of heterogeneity in the catchment) and isbased on estimated coefficients γ 0
cs, γ1cs, γ
2cs, γ
3cs. The grassland yield for both silage and
grazing grass on all soil types is given by the Eq. 5, where β0ts,β
1ts,β
2ts,β
3ts are estimated
coefficients. Equation 6 ensures that the actual grazing grass and silage productionmeets the requirements of livestock numbers ab. If Eq. 11 is satisfied then livestockqualifies for certain grants and subsides which are accounted for in pb. Equation 15 isa constraint on the allocation of land, and ensures that the model allocation is similarto the actual situation on the ground. Most of these constraints were not binding.Equation 16 ensures the land allocation to any soil type does not exceed the actualacreage of each soil type. Equation 17 is a representation of the two representativerotational constraints in the catchment. As the model only allows potato allocationon sandy soils, ψ = 0 for silty and loamy soils and 1 for sandy.
Equation 12 is a set of equations for every weather (� ) and river flow restric-tion (κ) giving the potato yield per hectare under every irrigation regime i (optimal,restricted, and un-irrigated) for nitrogen application ηi. Where ε�0i , ε�1i , ε�2i , ε�3i are esti-mated coefficients for the potato production function. Equation 13, converts potatocrop yield into quality categories j (scabbed and scab free), given the available irriga-tion water under each weather condition. Equation 14, limits the allocation of land toevery irrigation category based on the available irrigation water.
Equation 18 estimates the total nitrogen load (per ha) Ecs for a total nitrogenapplication of ncs (per ha) based on the weather estimated coefficients δ�0cs, δ
�1cs, δ
�2cs.
Whereas Equation 19 and Equation 20 provide the annual load per ha from Live-stock/grassland (Vts) and potato (Xi) based on the weather estimated coefficientsθ�0ts, θ
�1ts, θ
�2ts and ξ�0i , ξ�1i , ξ�2i , respectively. It is assumed that the nitrogen from animal
waste allowed by MAFF regulation is applied to grassland. �b is a vector of the esti-mated annual N content of one GLU of each livestock type. Therefore Eq. 7 providesthe per ha availability of nitrogen from animal waste to grassland, which along withthe artificial N fertiliser ots provides the total Nitrogen application to grassland µtsper ha (Eq. 8). The annual loads from Eq. 18, 19, and 20 were converted into theaverage daily load for every week of a weather condition based on computations ofNITCAT which gave three vectors. w�cs = (1α�cs , . . . ,w α�cs ) is a proportionality vectorof the average daily arable crop load for each week (w), w��ts = (1∞�
ts , . . . ,w ∞�ts )
a proportionality vector of the average daily grassland/livestock crop load for eachweek, and w��κi = (1ϑ�κi , . . . ,w ϑ�κi ) a proportionality vector of the average dailypotato crop load from each irrigation regime for each week.
592 A. Aftab et al.
Likewise the estimated daily average drainage (rainwater / rain + irrigation water)from each catchment activity (wℵ�cs arable crops, wλ̄�ts grassland, wh̄�κi potatoes) forevery week under all three weather conditions was calculated from the nitrate leachingmodel runs. Equation 21 gives the overall river concentration from farming activitiesat the mouth of the river assuming instantaneous mixing. wR is a rough approximationof daily river base flow for ever week under each weather and river flow restriction.Unit conversions have been ignored in Eq. 21. Equation 22 is the environmentalconstraint relating to river nitrate pollution, where � is the standard.
As the model was run for every weather condition and river flow control, thepotato/irrigation variables, yield/leaching equations, and constraints varied accord-ingly. Similarly when a regulatory policy was considered corresponding adjustmentsto the constraints and constants were made.
References
Albiac JM, Karaj SU, Martinez YM (2001) Water quality protection through irrigation management.working paper Unidad de Economia Agraria
Anthony S, Quinn P, Lord EI (1996) Catchment scale modelling of nitrate leaching (Modelling inapplied biology: spatial aspects). Aspects Appl Biol 46:23–32
Bailey RJ, Spackman E (1996) A model for estimating soil moisture changes as an aid to irriga-tion scheduling and crop water-use studies: II. Field tests of the Model. Soil Use Manage 12:129–133
Brooke A, Kendrick D, Meeraus A, Raman R (1998) GAMS Washington DC, GAMS DevelopmentCorporation
Brooker JF, Young RA (1994) Modelling intrastate and interstate markets for Colorado River waterresources. J Environ Econ Manage 26:66–87
Burt T, Haycock N (1993) Controlling losses of nitrate by changing land use. In: Burt T, HeathwaiteA, Trudgill S (eds) Nitrate: processes, patterns and management. Chichester, Wiley & Sons
Caswell M, Lichtenberg E, Zilberman D (1990) The effects of pricing policies on water conservationand drainage. Am J Agric Econ 72:883–890
Chambers B, Johnson P (1990) Effect of fertliser applications on crop yield. ADAS, Wolverhampton,p 25
Crabtree JR, Chalmers N, Stalham M, Dunn S (2000) Evaluating the economic impact of irrigationcontrols. Aberdeen, MLURI (SEERAD commissioned report)
Darcy BJ, Ellis JB, Ferrier RC, Jenkins A, Dils R (2000) Diffuse pollution impacts: the environmentaland economic impacts of diffuse pollution in the U.K. CIWEM Publications, U.K.
Dinar A, Letey J (1991) Agricultural water marketing, allocative efficiency and drainage reduction. JEnviron Econ Manage 20(3):210–223
Dinar A, Loehman ET, Marcel PA, Moore RM, Richard EH, Stephen AH (1993) Regional modelingand economic incentives to control drainage pollution. In: Russel SC, Shogren JF (eds) Theory,modeling and experience in the management of nonpoint-source pollution. Kluwer AcademicPublishers, Dordrecht p 345
Dinar A, Xepapadeas A (1998) Regulating water quantity and quality in irrigated agriculture. JEnviron Manage 54:273–289
Dosi C, Tomasi T (eds) (1994) Nonpoint source pollution regulation: issues and analysis. KluwerAcademic Publishers, Dordrecht
Dunn S (1998) Development of an application of a distributed catchment scale Hydrological modelfor the Ythan, NE Scotland. Hydrol Process 12:401–416
EA (2005) Assessing risks to the water environment: river Basin Characterisation Results 2005.Environment Agency, Bristol (UK)
Fox I (1999) Abstraction and abstraction control in scotland Stirling, SEPAHanley N, Shogren J, White B (2006) Environmental economics in theory and practice. 2nd ed. Oxford,
Palgrave MacMillanHaverkort AJ, Mackerron DKL (eds) (2000) Management of nitrogen and water in potato production.
Wageningen Pers, Netherlands
Co-ordinated environmental regulation 593
Helfand G (1995) Alternative pollution standards for regulating nonpoint-source pollution. J EnvironManage 45:231–241
Helfand G, House B (1995) Regulating nonpoint-source pollution under heterogeneous conditions.Am J Agric Econ 77:1024–1032
Johnson S, Adams R, Perry G (1991) The on-farm costs of reducing groundwater pollution. Am JAgric Econ 73:1063–1073
Kampas A, White B (2002) Emission versus input taxes for diffuse nitrate pollution control in thepresence of transaction costs. J Environ Planning Manage 45(1):129–140
Kampas A, White B (2004) Administrative costs and instrument choice for stochastic non-point sourcepollutants. Environ Resour Econ 27(2):109–133
Larson DM, Helfand GE, House BW (1996) Second-best tax policies to reduce nonpoint sourcepollution. Am J Agric Econ 78(4):1108–1117
Lockyer D, Scholefield D, Dawson B (1995) N-CYCLE. MERTAL Courseware, AberdeenLord E (1992) Modelling of nitrate leaching: nitrate sensitive areas. Asp Appl Biol 30:19–28McKenzie H, Gawith M, Brown M, Connell R, Downing TE (eds) (2000) Climate change: assessing
the impacts - identifying responses. The first three years of the UK Climate Impacts Programme.UKCIP Technical Report. UKCIP and DETR, Oxford
Moxey A, White B (1994) Efficient compliance with agricultural nitrate pollution standards. J AgricEcon 45:27–37
Ribaudo M, Horan R, Smith M (1999) Economics of water quality protection from nonpoint sources:theory and practice. Department of Agriculture, Resource Economics Division, Washington, DC,U.S.
Ribaudo M, Osborn C, Konyar K (1994) Land retirement as a tool for reducing agricultural nonpointsource pollution. Land economics 70:77–87
Robinson GM, Lind M (1999) Set-aside and environment: a case study in Southern England. Tijdschriftvoor Economische en Sociale Geografie 90(3):296–311
SAC (1992) Fertiliser allowances for manures and slurries. Technical Note: Fertiliser Series 14. Edin-burgh, Scottish Agricultural College
SAC (1996) Recommendations for grazing and conservation. Technical Notes: Fertiliser Series No 4.Edinburgh
SAC (1997) Farm management handbook 1997/98. Scottish Agricultural College, EdinburghScholefield D, Lockyer D, Whitehead D, Tyson K (1991) A model to predict transformations and
losses of nitrogen in UK pastures grazed by beef cattle. Plant Soil 132:165–177SEPA (1999) Improving Scotland’s water environment. SEPA State of the Environment Report. The
Scottish Environment Protection Agency, EdinburghShortle JS, Abler D, (1994). Incentives for nonpoint pollution control. In: Dosi C, Tomasi T, (eds) Non-
point source pollution regulation: issues and analysis. Kluwer Academic Publishers, DordrechtShortle JS, Dunn J (1986) The relative efficiency of agricultural source water pollution control policies.
Am J Agric Econ 68:668–677Shortle JS, Horan R (2001) The economics of nonpont pollution control. J Econ Surveys 15(3):255–289SOAEFD (1997a) Arable areas payment scheme. Scottish Executive, EdinburghSOAEFD (1997b) Scottish agriculture: a guide to grants and services. Scottish executive, EdinburghStevens B (1988) Fiscal implications of effluent charges and input taxes. J Environ Econo Manage
15:285–296Stolbjerg-Drud A (1993) ‘GAMS/CONOPT’. GAMS (The Solver Manuals). GAMS Development
Corporation, Washington DC, p 55Weersink A, Livernois J, Shrogren JF, Shortle JS (1998) Economic instruments and environmental
policy in agriculture. Can Public Policy 24(3):309–327Weinberg M, Kling CL, Wilen JE (1993) Water markets and water quality. Am J Agric Econ 75(278–
291)Willis KG, Garrod GD (1995) The benefits of alleviating low flows in rivers. Water Resour Develop
11:243–260Willis KG, Garrod GD (1999) Angling and recreation values of low-flow alleviation in rivers. J Environ
Manage 57:71–83Wu J (1999) Input substitution and pollution control under uncertainty and firm heterogeneity. J
Public Econ Policy 2(2):273–288Wu J, Teague M, Mapp H, Bernardo D (1995) An empirical analysis of the relative efficiency of policy
instruments to reduce nitrate water pollution in the U.S. southern high plains. Can J Agric Econ43:403–420
Xepapadeas A (1997) Advanced principles in environmental policy. Edward Elgar, Cheltenham
Related Documents