CNO FINANCIAL GROUP, INC. FORM 8-K (Current report filing) Filed 04/24/12 for the Period Ending 04/24/12 Address 11825 N PENNSYLVANIA ST CARMEL, IN 46032 Telephone 3178176100 CIK 0001224608 Symbol CNO SIC Code 6321 - Accident and Health Insurance Industry Insurance (Life) Sector Financial Fiscal Year 12/31 http://www.edgar-online.com © Copyright 2015, EDGAR Online, Inc. All Rights Reserved. Distribution and use of this document restricted under EDGAR Online, Inc. Terms of Use.

Welcome message from author
This document is posted to help you gain knowledge. Please leave a comment to let me know what you think about it! Share it to your friends and learn new things together.
Transcript
CNO FINANCIAL GROUP, INC.
FORM 8-K(Current report filing)
Filed 04/24/12 for the Period Ending 04/24/12
Address 11825 N PENNSYLVANIA ST
CARMEL, IN 46032Telephone 3178176100
CIK 0001224608Symbol CNO
SIC Code 6321 - Accident and Health InsuranceIndustry Insurance (Life)
Sector FinancialFiscal Year 12/31
http://www.edgar-online.com© Copyright 2015, EDGAR Online, Inc. All Rights Reserved.
Distribution and use of this document restricted under EDGAR Online, Inc. Terms of Use.

UNITED STATES SECURITIES AND EXCHANGE COMMISSION
WASHINGTON, D.C. 20549
FORM 8-K
CURRENT REPORT PURSUANT TO SECTION 13 OR 15(d) OF THE
SECURITIES EXCHANGE ACT OF 1934
Date of Report (Date of earliest event reported): April 24, 2012
CNO Financial Group, Inc. (Exact Name of Registrant as Specified in Charter)
11825 North Pennsylvania Street Carmel, Indiana 46032
(Address of Principal Executive Offices) (Zip Code)
(317) 817-6100 (Registrant's telephone number, including area code)
Check the appropriate box below if the Form 8-K filing is intended to simultaneously satisfy the filing obligation of the registrant under any of the following provisions:
1
Delaware 001-31792 75-3108137 (State or Other
Jurisdiction of Incorporation) (Commission File Number) (I.R.S. Employer
Identification No.)
o Written communications pursuant to Rule 425 under the Securities Act (17 CFR 230.425)
o Soliciting material pursuant to Rule 14a-12 under the Exchange Act (17 CFR 240.14a-12)
o Pre-commencement communications pursuant to Rule 14d-2(b) under the Exchange Act (17 CFR 240.14d-2(b))
o Pre-commencement communications pursuant to Rule 13e-4(c) under the Exchange Act (17 CFR 240.13e-4(c))
On April 24, 2012, CNO Financial Group, Inc. (the “Company”) issued: (i) a presentation including historical information reflecting the retrospective adoption of the ASU
2010-26 DAC accounting change (also known as EITF Issue No. 09-G), a copy of which is attached hereto as Exhibit 99.1 and is incorporated herein by reference; and (ii) its quarterly financial supplement for the fourth quarter of 2011, as restated to reflect the adoption of ASU 2010-26, a copy of which is attached hereto as Exhibit 99.2 and is incorporated herein by reference.
The information contained in this Current Report on Form 8-K (including Exhibits 99.1 and 99.2) is being furnished and shall not be deemed “filed” for purposes of Section 18 of the Securities and Exchange Act of 1934, as amended (the “Exchange Act”), or otherwise subject to the liabilities of that Section. The information contained in this Current Report on Form 8-K shall not be incorporated by reference into any registration statement or other document pursuant to the Securities Act of 1933, as amended, or the Exchange Act, except as shall be expressly set forth by specific reference in any such filing.
The following materials are furnished as exhibits to this Current Report on Form 8-K:
2
Item 7.01. Regulation FD Disclosure.
Item 9.01(d). Financial Statements and Exhibits.
99.1 DAC Accounting Change - Impact of Implementing ASU 2010-26 on 2011 and Prior Periods.
99.2 Quarterly Financial Supplement - 4Q2011 as Restated to Reflect the Adoption of ASU 2010-26.
SIGNATURES
Pursuant to the requirements of the Securities Exchange Act of 1934, the Registrant has duly caused this report to be signed on its behalf by the undersigned hereunto duly authorized.
3
CNO Financial Group, Inc.
Date: April 24, 2012
By: /s/ John R. Kline
John R. Kline
Senior Vice President and
Chief Accounting Officer
DAC Accou nting C hang e Impact of Imp lemen tin g ASU 2010- 26 on 2 011 an d Prio r Perio ds Apr il 25 , 20 12 Exh ibit 9 9.1

CNO Financial Grou p 2 Fo rward -Look in g Statemen ts Caution ary Statemen t R egard in g Fo rward -Look in g Statemen ts . Ou r s tatements , trend an aly ses an d other inf ormation co ntained in these materials relative to markets f or CNO Fin ancial’s pro ducts an d trends in CNO Finan cial ’s oper atio ns o r f inancial r esu lts , as well as other s tatem ents, contain fo rward -lo okin g statements within the meaning o f the f ederal secu rities laws an d the Pr iv ate Securities Litigation R ef orm Act o f 199 5. For war d -lo okin g statements ty pically ar e iden tif ied b y the use of terms su ch as “an ticip ate, ” “believ e,” “ plan,” “estimate,” “ ex pect,” “project,” “ in ten d,” “ may,” “will,” “ wo uld,” “ co ntemplate,” “ possib le,” “ attemp t,” “ seek,” “ sho uld,” “ co uld,” “ goal,” “ tar get,” “ on track,” “ co mfor table with,” “ optimistic” an d similar word s, alth oug h so me forward -lo okin g statements ar e exp ressed dif ferently. Yo u sh ould co ns id er statements th at con tain th ese words carefully becau se they describe ou r ex pectations, p lan s, strategies an d goals and ou r b elief s con cer ning fu ture bu siness con ditions, o ur results of o perations, f in ancial p os itio n, and o ur bu sin ess o utlook o r they state other ‘‘forward - lo okin g’’ in form atio n based o n curr ently availab le inf ormation . Assum ptions and other imp ortant factors th at co uld cause o ur actual r esu lts to d iffer materially from tho se anticipated in our fo rward -lo okin g statements in clu de, amo ng oth er th in gs: ( i) ch anges in o r sustained low interest rates cau sing a red uctio n in investment in come, th e mar gins o f our fix ed annu ity an d lif e insur an ce b us inesses, and sales of, and demand for , ou r prod ucts ; (ii) gen er al econ omic, m ar ket an d po litical co ndition s, in clu ding th e per form ance an d fluctuation s of the finan cial mark ets which may affect the v alue of our inv estments as well as o ur ability to r aise capital or ref in ance existin g in debtedn ess and the cost o f d oing so; (iii) th e u ltimate outco me o f lawsuits filed against us and o ther legal an d regu lato ry pro ceeding s to wh ich we are subject; ( iv ) our ability to make chang es to certain non - guaran teed elemen ts of ou r life insuran ce p rod ucts; (v) o ur ability to o btain adequ ate and timely rate increases on o ur health pro ducts , includ ing ou r lo ng -ter m care bu sin ess; (v i) th e r eceip t o f an y requ ir ed regu lator y appr ovals f or divid en d and surp lus deb enture interest p ayments from o ur insurance subs idiaries ; (v ii) mo rtality , mor bidity, th e in cr eased cost and usage of health care ser vices, pers istency , the adequ acy of ou r p revio us reserve estimates an d other facto rs which may aff ect the pro fitability o f our insuran ce p rod ucts; (viii) chang es in ou r assumption s related to deferr ed acquis itio n costs or the present value of fu tu re prof its ; (ix) the recover ability o f our d ef erred tax assets and th e eff ect of p otential ownership chang es and tax rate chang es on th eir v alue; (x ) our assu mption that the pos itions we take on ou r tax r etu rn filing s, in clu ding o ur po sition that our 7 .0 % con vertible senio r debentu res du e 2 016 will not be treated as sto ck f or pu rpo ses o f Section 3 82 of the In ter nal R evenu e C od e o f 1 986 , as amen ded, and will no t trig ger an ownership ch an ge, will not be su ccessfully challeng ed by the Intern al R evenu e Service; (xi) chan ges in accou nting prin cip les and the interp retatio n th ereof (in clu ding ch anges in p rinciples r elated to accou nting for d eferred acquisition costs); ( xii) o ur ability to continu e to satis fy the finan cial ratio and b alan ce req uiremen ts and other co venan ts of ou r debt agreemen ts ; ( xiii) o ur ability to achieve anticip ated expense redu ctio ns an d lev els of op eratio nal efficiencies includ ing impro vemen ts in claims ad judication and co ntinued au tomation and r atio nalization o f oper atin g sy stems, (x iv ) perfo rmance and v alu atio n of ou r in vestments, includin g th e imp act o f r ealized losses (includ ing other -th an -temp orar y im pairment charg es); (x v) our ab ility to identify p rod ucts and mar kets in which we can co mpete ef fectiv ely against com petito rs with greater mark et share, higher r ating s, greater finan cial resour ces and s tron ger bran d recogn itio n; ( xvi) our ability to g enerate suf ficient liqu idity to m eet ou r debt ser vice o bligations and oth er cash needs; (xv ii) ou r ability to main tain eff ectiv e con trols over finan cial repo rting; (xv iii) o ur ability to co ntinue to recru it and retain pr odu ctiv e ag en ts and dis tribu tio n partner s and customer respo nse to new pr odu cts , d is tribu tio n chann els and mark etin g initiatives; ( xix) ou r ability to ach iev e ev entual upg rades o f th e f in ancial s treng th ratin gs o f CNO Finan cial and o ur insurance comp any subs idiaries as well as the impact o f our r atin gs on o ur bu sin ess, ou r ability to access capital an d th e co st of capital; ( xx) the risk factors or uncer tain ties lis ted from time to time in our f iling s with th e Secur ities an d Exchan ge Com miss ion; (xx i) r egulator y chang es or actions, inclu ding tho se relating to regu lation o f the financial af fairs o f o ur insuran ce co mpanies, such as the pay ment of divid ends an d su rplu s deben ture interest to us, reg ulation of the sale, und erwriting and pr icin g of pr odu cts , an d health car e r egulation affecting h ealth in su rance pro ducts ; and ( xxii) chan ges in the Fed eral in come tax laws an d regu lation s which may aff ect or eliminate th e r elative tax adv an tages o f som e of o ur pr odu cts or affect the value of ou r d eferred tax assets . Other factor s and assumptio ns no t id en tified abov e are also r elev ant to th e fo rward -lo okin g statements , and if they p rove inco rrect, cou ld also cause actu al results to diff er mater ially fr om those projected. A ll for war d -lookin g statements ar e exp ressly qu alif ied in their entirety b y th e f orego ing caution ary statements . Our f orward -lo okin g statements speak o nly as of the date made. We assume no ob lig atio n to upd ate or to p ublicly anno unce the results of any r evisio ns to any o f th e f orward - loo king s tatem ents to reflect actual results , futu re ev ents o r d evelop ments, chang es in assump tions o r chang es in other factor s affecting the fo rward -lo okin g statements .

CNO Financial Grou p 3 No n -GAAP Measures This p resentation co ntains th e fo llo win g finan cial measu res that diff er f rom the comp arable measu res un der Generally Accepted Acco un tin g Prin cip les (GAAP) : op erating earnin gs measures; boo k value, ex clu ding accu mulated other comp rehen sive inco me ( lo ss) per share; operating r etu rn measures; an d earning s befo re net realized inv estmen t gain s (losses) and co rpo rate interest an d taxes. While manag em ent b eliev es these measur es are usef ul to en hance un derstanding an d comp ar ability o f our fin ancial results , these n on -GAAP measur es sh ould n ot be co ns idered substitutes fo r the mo st directly comp arable GAAP m easur es. Ad ditional info rmation con cer ning n on -GAAP m easur es is includ ed in o ur per io dic filin gs with the Secu rities and Exch ange Co mmiss ion that are available in the “Investors – SEC Filings ” section of C NO’ s website, www.CNOinc.com.

CNO Financial Grou p 4
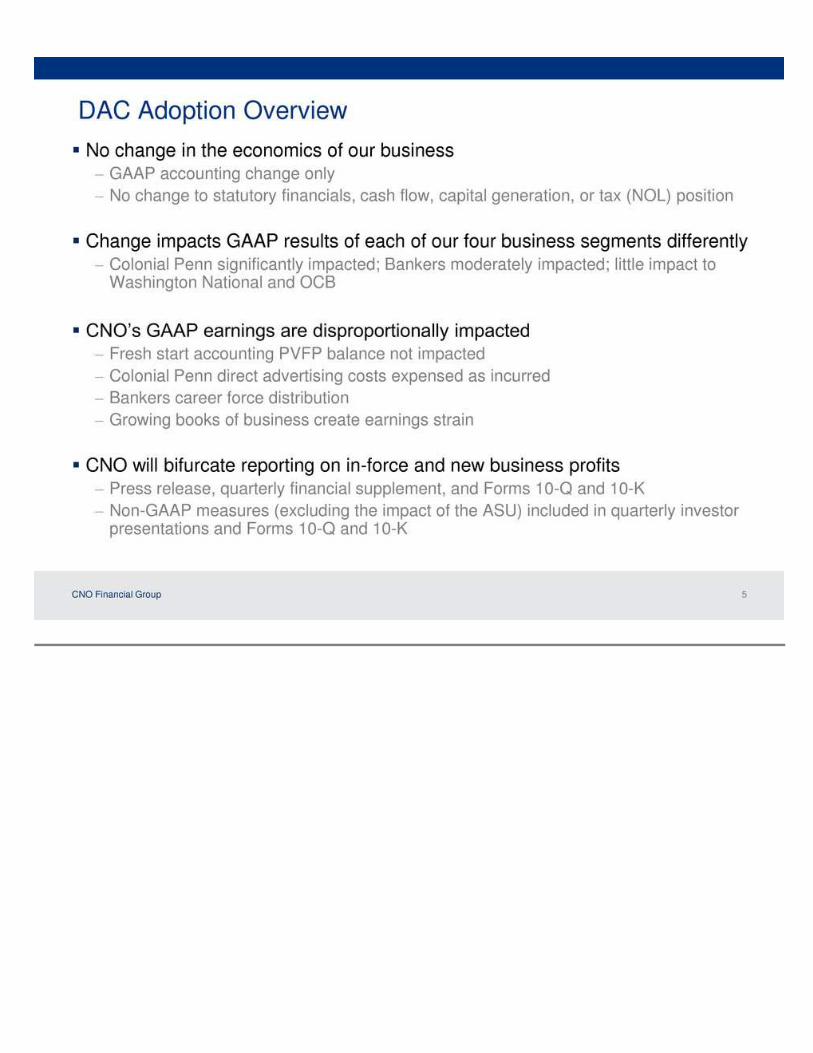
CNO Financial Grou p 5 DAC Ad option Over view � No ch ange in the eco no mics of ou r bus iness – GAAP acco unting ch ange on ly – No ch ange to statuto ry financials , cash flow, capital generation , or tax (NOL) po sition � Chan ge im pacts GAAP results of each of o ur fou r bus iness segments d ifferen tly – Colon ial Penn s ignificantly impacted ; B an kers moder ately imp acted ; little impact to Wash ingto n Nation al and OC B � CNO ’s GAAP earning s are disprop ortion ally imp acted – Fresh s tar t accou nting PVFP balance not impacted – Colon ial Penn d ir ect adv ertising co sts ex pensed as incu rred – Bank ers career fo rce d istribu tio n – Gr owing bo oks of bus iness create earning s s tr ain � CNO will b ifurcate repo rtin g on in -force and n ew bu siness p rofits – Press r elease, qu arterly finan cial su pp lemen t, and For ms 10 -Q and 1 0 -K – No n-GAAP m easur es (exclu ding the impact of the ASU) includ ed in q uarterly inv estor p resen tatio ns an d Fo rms 1 0 -Q and 1 0- K
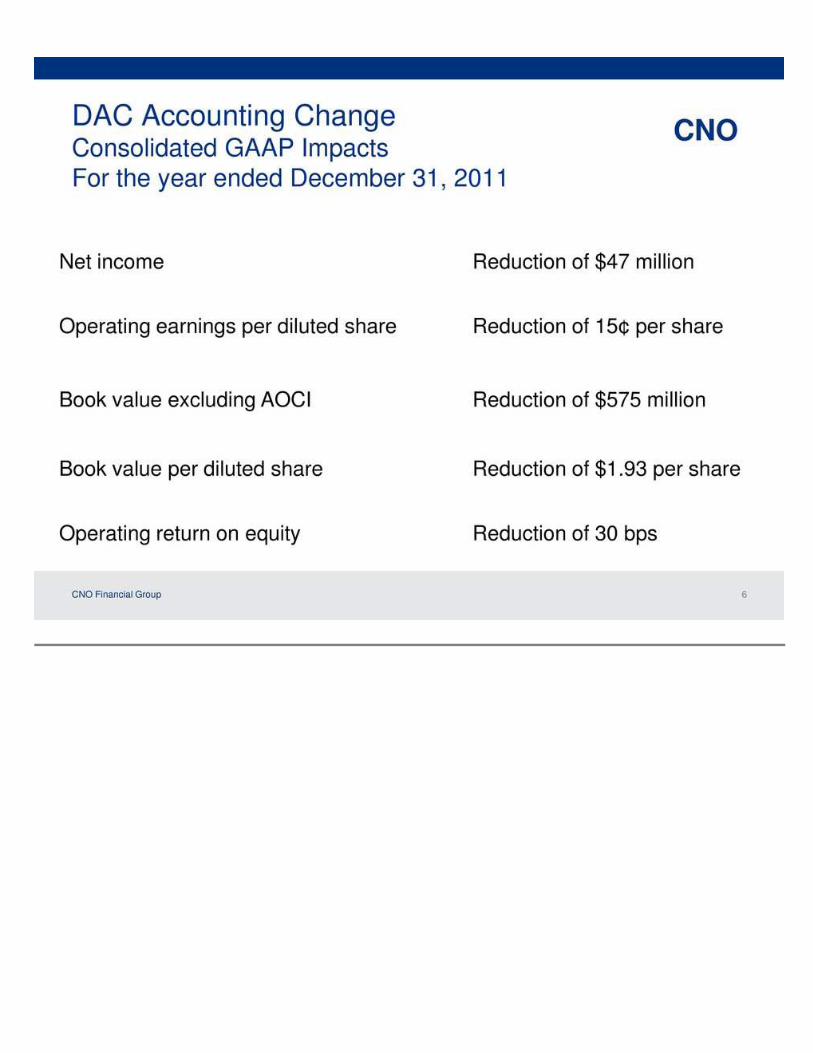
CNO Financial Grou p 6 DAC Accou nting C hang e C onsolidated GAAP Imp acts Fo r the y ear ended December 3 1, 2 011 C NO Net in come Redu ctio n of $4 7 millio n Op erating earnin gs p er d ilu ted sh ar e R eduction o f 15 ¢ per sh are B oo k value excludin g AOC I Redu ctio n of $5 75 million Bo ok valu e p er d ilu ted sh ar e R eduction o f $1.93 p er shar e Oper atin g return o n equity Red uction of 3 0 bps
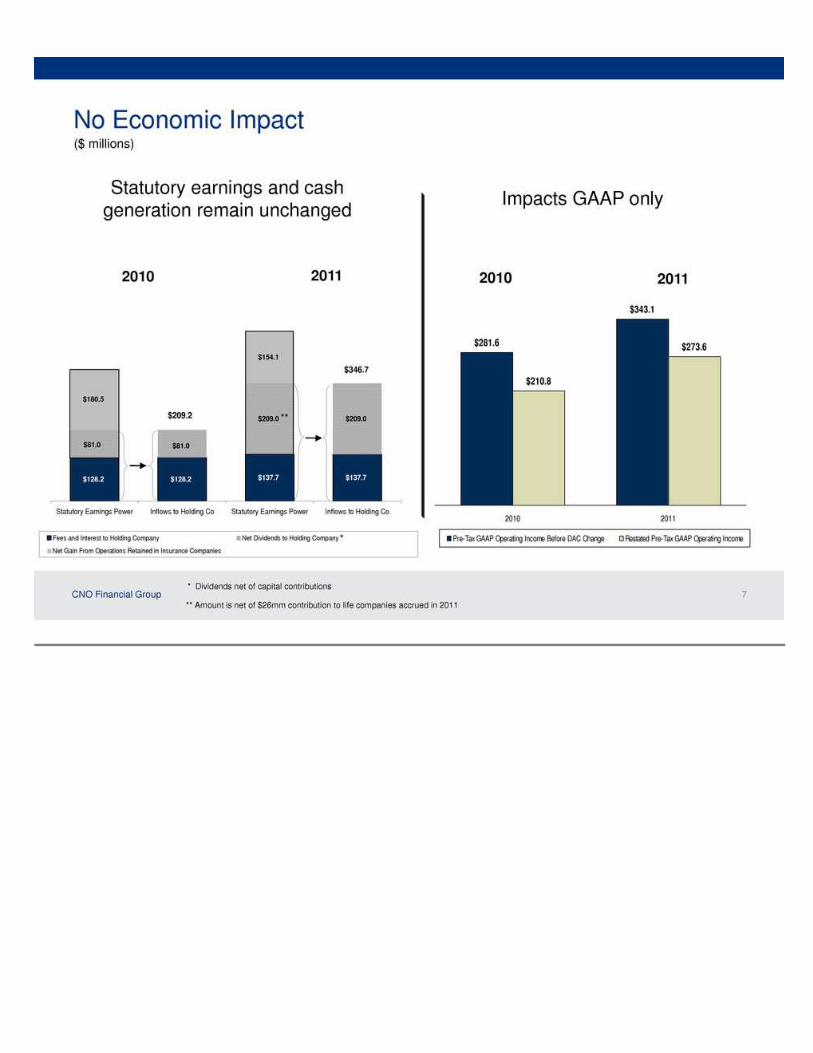
CNO Financial Grou p 7 $12 8.2 $13 7.7 $20 9.0 $18 0.5 $15 4.1 $12 8.2 $13 7.7 $20 9.0 $8 1.0 $81 .0 $ 346 .7 $ 209 .2 Statutory E ar ning s Power Inflo ws to Ho lding C o Statutor y Earning s Power Inf lo ws to Holding C o Fees and In ter est to Ho lding C ompan y Net Dividen ds to Holdin g Comp any Net Gain From Oper ation s R etain ed in Insurance Co mpan ies No E co no mic Imp act ($ m illion s) Statutory earn ings and cash g eneration rem ain u nchan ged Imp acts GAAP only * ** * D iv id ends net o f capital con tribution s ** Amo unt is net of $2 6mm con tr ibution to life compan ies accrued in 20 11 20 10 20 11 $2 81.6 $3 43 .1 $ 210 .8 $ 273 .6 2 010 2 011 Pre -Tax GAAP Op eratin g Inco me B efor e DAC Ch ange R estated Pr e-Tax GAAP Op eratin g Inco me 2 010 2 011
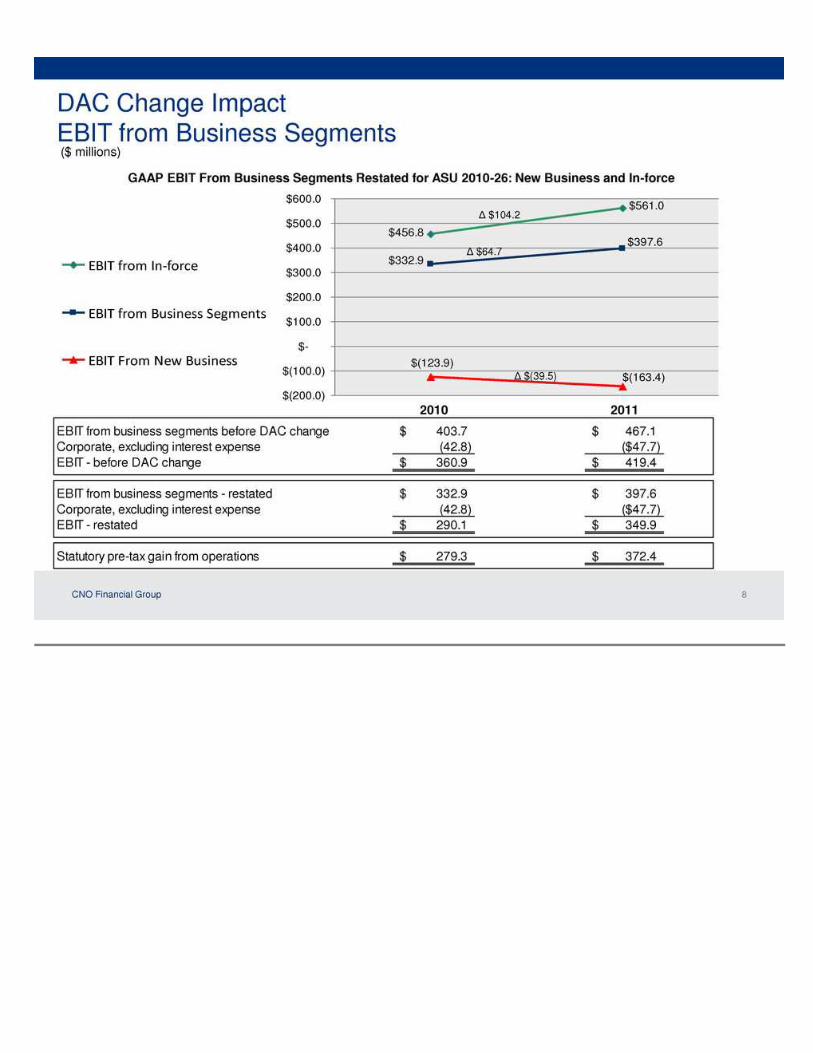
CNO Financial Grou p 8 $(12 3.9) $4 56.8 $5 61.0 $3 32.9 $3 97 .6 $ (163 .4 ) $(2 00.0) $ (100 .0 ) $ - $ 100 .0 $ 200 .0 $ 300 .0 $ 400 .0 $ 500 .0 $ 600 .0 EB IT fro m I n- force EBIT f rom Bu sin ess Segm ents EBI T Fro m New Bu siness DAC C hange Imp act EB IT fro m B usiness Seg ments ( $ million s) GAAP EB IT Fr om Bu siness Segmen ts Restated f or ASU 20 10-26: New Bu sin ess an d In - force 20 10 20 11 EBI T f rom bu siness segmen ts befo re DAC ch ange 40 3.7$ 46 7.1$ Co rpo rate, exclud ing interest ex p n e (4 2.8) ($ 47.7) EB IT - b ef ore DAC chang e 3 60.9$ 4 19.4$ EB IT fro m b us iness seg ments - restated 332 .9 $ 397 .6 $ Cor por ate, excludin g interest exp ense (4 2.8) ($ 47.7) EB IT - restated 290 .1 $ 349 .9 $ Statuto ry pre -tax g ain f rom op erations 279 .3 $ 372 .4 $ ∆ $ 104 .2 ∆ $( 39.5) ∆ $ 64.7

CNO Financial Grou p 9 DAC C hang e I mpact CNO C onsolidated ($ m illion s) B efore DAC Ch an ge Total In -force New B usin ess New ann ualized p remiums 375 .1 $ 375 .1 $ -$ 375 .1 $ Insuran ce p olicy in come 2,690 .5 $ 2,690 .5$ 2,34 7.2$ 34 3.3$ In vestmen t / other inco me 1 ,3 56.7 1,35 6.7 1,314 .1 4 2.6 Ben efits & chang es in reser ves (2 ,6 64.6) ( 2,664 .6 ) ( 2,429 .6 ) (23 5.0) Exp enses (no n -acq uis ition ) (47 1.0) (47 1.0) (4 03.9) (6 7.1) Earnin gs b efore amor tization & acqu isition exp enses 91 1.6 911 .6 8 27.8 83 .8 Amo rtizatio n (444 .5 ) (30 6.0) (26 6.1) (3 9.9) Non -deferrab le acqu isition exp enses - (2 08.0) ( 0.7) (20 7.3) EBI T f rom bu sin ess segmen ts 467 .1 397 .6 5 61.0$ (1 63.4) $ Co rpor ate, exclud in g corp orate in terest exp ense (4 7.7) (47 .7 ) EBIT 4 19.4$ 349.9$ 6 .4 % 6.1% R estated fo r ASU 201 0-26 Operating R OE Year End ed Decemb er 31, 201 1
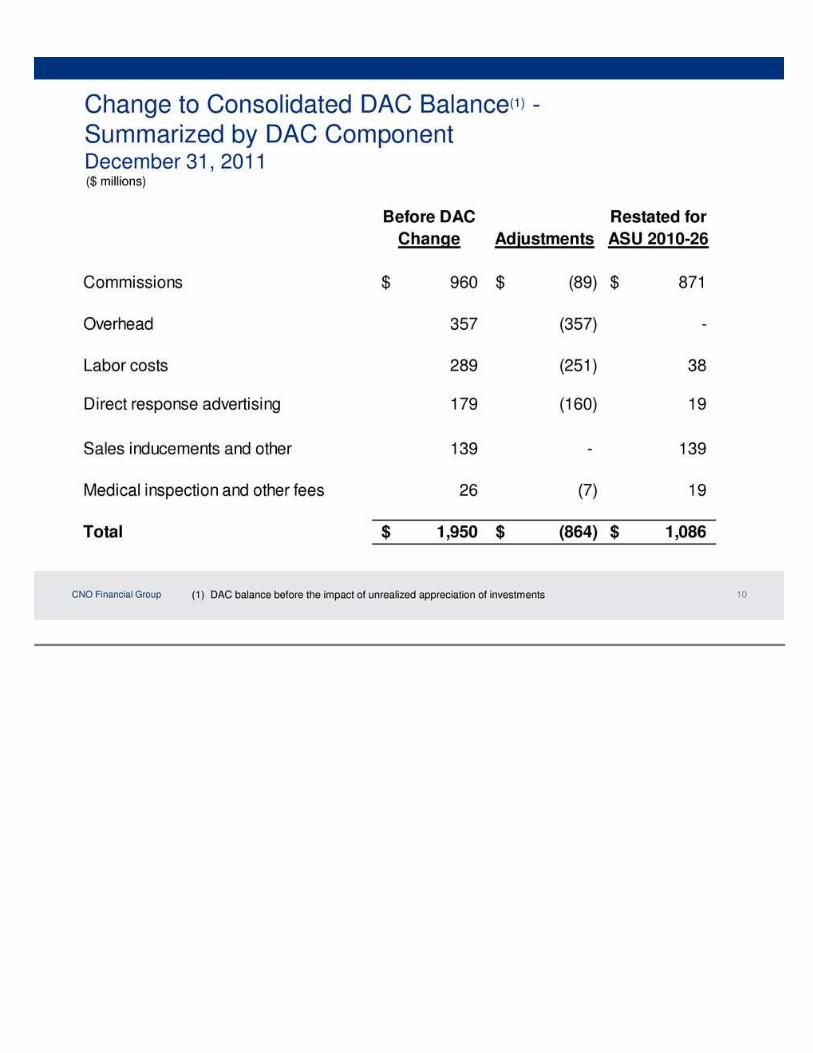
CNO Financial Grou p 10 Ch ange to Co nsolidated DAC Balance(1 ) - Summar ized b y DAC Com pon en t Decemb er 3 1, 2 011 ( $ millio ns) B efor e DAC Ch ange Adjustments Restated fo r ASU 201 0 -26 Co mmiss ions 960 $ (89 )$ 87 1$ Overh ead 357 ( 357 ) - Lab or costs 289 ( 251 ) 38 Direct r espo nse ad vertis in g 179 ( 160 ) 19 Sales in du cem ents and o th er 139 - 1 39 Medical in sp ection an d other fees 26 (7 ) 1 9 Total 1 ,9 50 $ (864 )$ 1,08 6$ (1 ) DAC b alan ce b efore the impact of un realized ap preciation of inv estmen ts
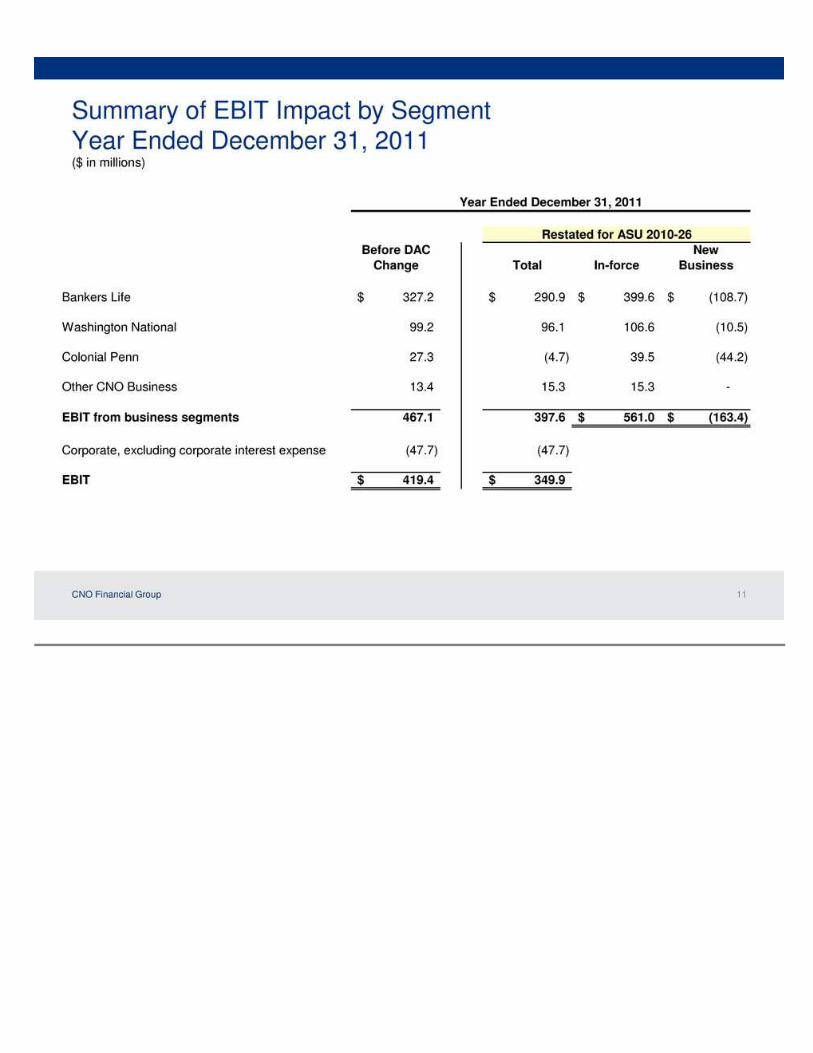
CNO Financial Grou p 11 Summary o f EBIT Imp act b y Seg ment Year En ded December 31 , 20 11 ($ in millions) Befo re DAC C han ge T otal In - force New B usin ess Bank ers Life 32 7.2$ 29 0.9$ 39 9.6$ (1 08.7) $ Wash ington Nation al 99 .2 9 6.1 10 6.6 (10.5) C olon ial Penn 27 .3 ( 4.7) 39 .5 (4 4.2) Other CNO Business 13 .4 1 5.3 15 .3 - EBIT fro m bus iness seg ments 4 67.1 39 7.6 561 .0 $ (163.4)$ C orp orate, ex clu ding co rpor ate interest ex pense (47 .7 ) ( 47.7) EB IT 419 .4 $ 349 .9 $ Year E nded December 3 1, 2 011 R estated for ASU 2 010 - 26

CNO Financial Grou p 12 Addition al D isclo sur es � Bifur cate results between in -force and n ew bu siness – Bifur catio n resu lts in greater clar ity ar oun d value driver s – New bus iness results imp acted b y rate o f sales, mix of bu sin ess, and d istribu tio n channel – Bifur cated r esults in clu ded in press r elease, q uarterly finan cial supp lemen t, investor pr esen tation , and For ms 10 - Q and 1 0-K � No n-GAAP r esu lts sho win g the im pact o f adop tio n – Illu strate earnin gs withou t the impact of ASU 20 10 -26 – Includ ed in q uarterly earn in gs s lides, and Forms 10 -Q and 1 0 -K � Nav ig atin g the quarter ly f in ancial sup plement
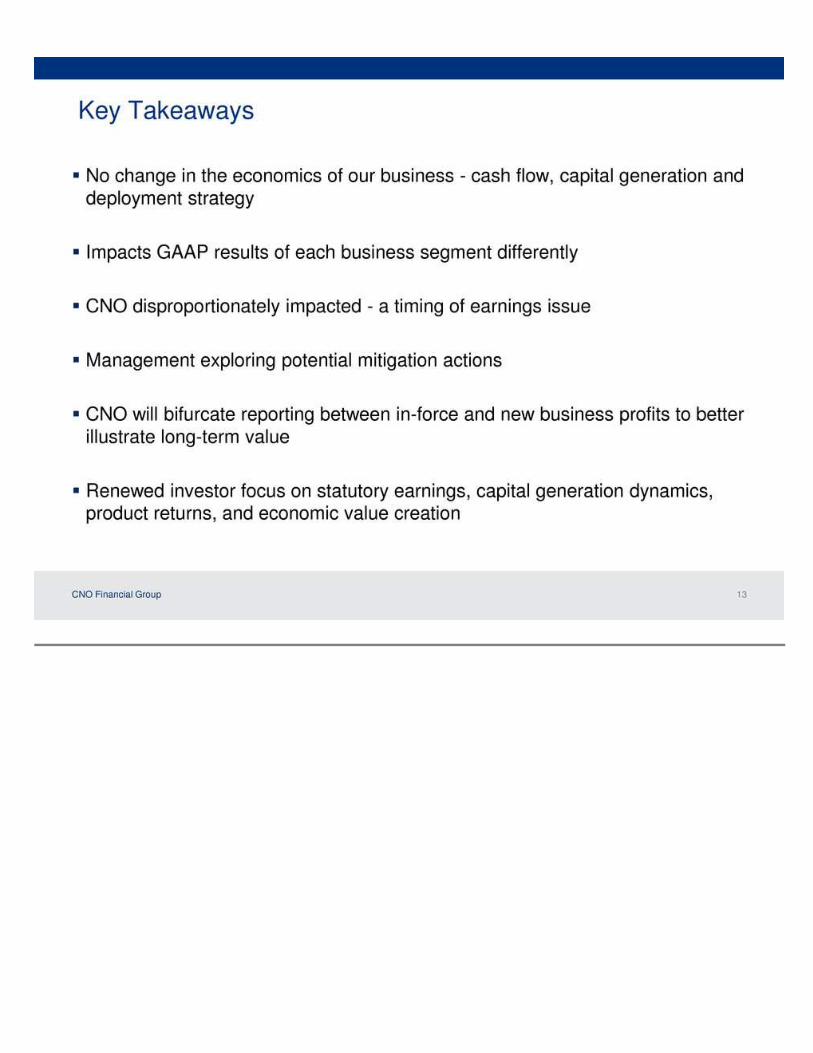
CNO Financial Grou p 13 Key Takeaways � No ch ange in the eco no mics of ou r bus iness - cash flow, capital gen eration and d ep loymen t s trategy � Impacts GAAP results o f each b us in ess seg ment differen tly � CNO d ispr opo rtionately impacted - a timing of ear nings issue � Man agement exp lo ring p otential mitigation actions � CNO will b ifurcate repo rtin g between in-force and n ew bu siness p rofits to b etter illus tr ate lon g -ter m v alu e � Renewed inv estor fo cus o n statutor y earning s, capital gen eration dy namics, pro duct return s, and econ omic value creatio n
Qu estion s and Answers
Ap pend ix
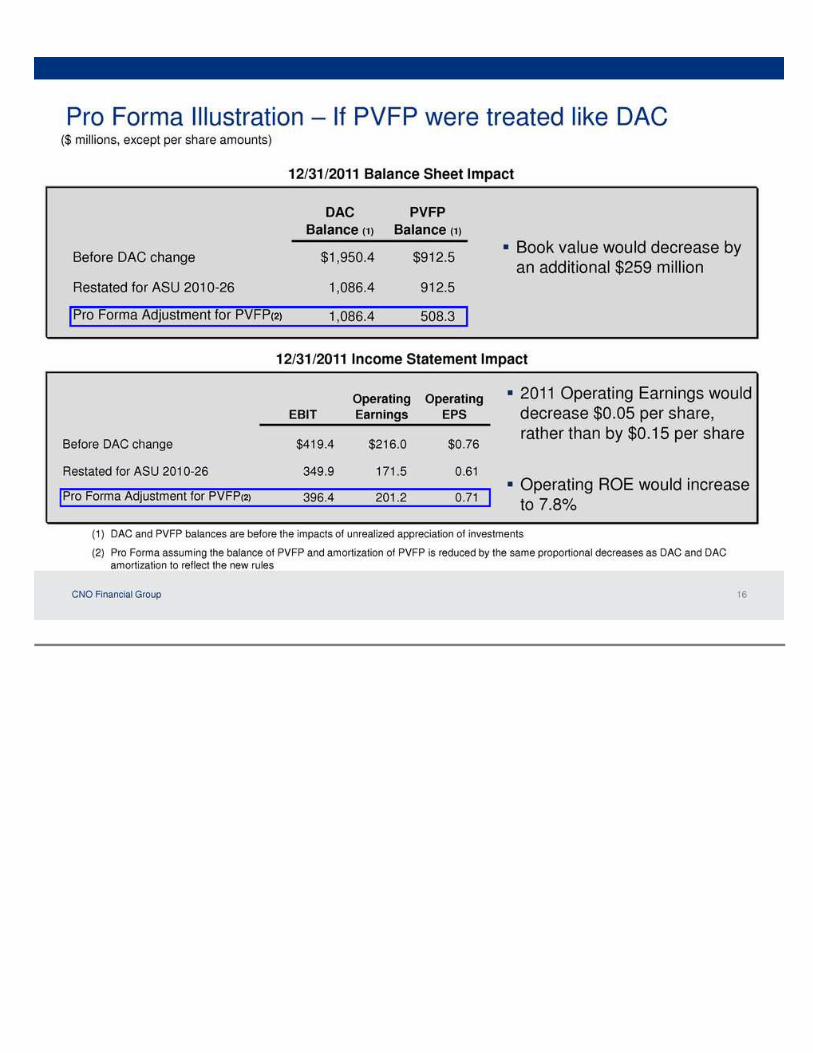
CNO Financial Grou p 16 Pro Forma Illus tratio n – If PVFP were treated lik e DAC (1 ) DAC an d PVFP b alances are befo re th e imp acts of un realized ap preciation of inv estmen ts (2) Pro For ma assu ming the balance of PVFP and amo rtization o f PVFP is r educed b y th e same pro por tio nal d ecreases as DAC and DAC amortization to reflect th e n ew ru les ($ millions, ex cep t per shar e amo unts) � Boo k value would decr ease by an add itio nal $ 259 m illion � 201 1 Op erating Earnin gs wou ld decrease $ 0.05 per share, rather than by $ 0.15 per share 12 /31/20 11 B alan ce Sheet Impact 12 /3 1/20 11 In co me Statement Imp act DAC Balance (1) PVFP Balan ce (1 ) Befo re DAC ch ange $1,9 50.4 $9 12.5 Restated for ASU 20 10 -26 1,08 6.4 912 .5 Pro For ma Adju stment fo r PVFP( 2) 1,08 6.4 508 .3 EB IT Operating Earn ings Op erating EPS B efore DAC chang e $ 419 .4 $ 216 .0 $ 0.76 R estated for ASU 2 010 - 26 34 9.9 171 .5 0 .6 1 Pr o Fo rma Ad justm ent f or PVFP(2) 3 96.4 20 1.2 0.71� Op erating ROE would incr ease to 7.8%

CNO Financial Grou p 17 Bef ore DAC Chan ge Total I n- force New B usin ess New ann ualized p remiums 245 .9 $ 245 .9 $ -$ 245 .9 $ Insuran ce p olicy in come 1,612 .4 $ 1,612 .4 $ 1,35 8.9$ 25 3.5$ Inv estmen t / other inco me 7 80.1 78 0.1 737 .5 4 2.6 Ben ef its & changes in reser ves (1 ,5 70.1) ( 1,570 .1 ) ( 1,378 .0 ) (19 2.1) Exp en ses (no n-acq uis ition ) (18 6.6) (18 6.6) (1 48.9) (3 7.7) Earn ings b efore amor tization & acqu isition exp enses 63 5.8 635 .8 5 69.5 66 .3 Amo rtizatio n (308 .6 ) (20 6.3) (16 9.9) (3 6.4) Non -deferrab le acqu isition exp enses - (138 .6 ) - (138 .6 ) EB IT 32 7.2$ 29 0.9$ 39 9.6$ (1 08.7) $ 12.2% 1 3.9% Operating R etu rn on A llocated Cap ital Year En ded December 3 1, 2 011 R estated for ASU 2 010 -26 DAC Chan ge Impact – Bank ers Life ($ millions)

CNO Financial Grou p 18 DAC Chan ge Impact – Wash ington Nation al ($ millions) Bef ore DAC Chan ge Total I n-force New B usin ess New ann ualized p remiums 77.8$ 77.8$ -$ 77.8$ In su rance po licy inco me 5 85.1$ 5 85.1$ 5 30 .7 $ 54.4$ In vestment / oth er in come 190 .5 1 90.5 19 0.5 - Benefits & ch anges in r eserv es (46 4.5) (4 64.5) (4 42.0) ( 22.5) Ex penses (n on -acq uis ition ) (15 5.4) (15 5.4) (1 30.5) (2 4.9) Earn in gs b efore amor tization & acqu isition exp enses 15 5.7 155 .7 1 48.7 7.0 Amor tization (5 6.5) (4 4.9) (42 .1 ) (2.8) Non -deferrable acqu isition exp enses - (14.7) - ( 14.7) EB IT 99.2$ 9 6.1$ 10 6.6$ (1 0.5)$ 8 .4 % 9.1% R estated fo r ASU 201 0-26 Year E nded December 3 1, 2 011 Oper atin g Return o n A llo cated C apital

CNO Financial Grou p 19 DAC Chan ge Impact – Colon ial Penn ($ m illion s) B efore DAC Ch an ge Total In -force New B usin ess New ann ualized p remiums 51.4$ 5 1.4$ -$ 51.4$ In su rance po licy inco me 2 03.0$ 2 03.0$ 1 67 .6$ 35.4$ In vestment / oth er in come 42.0 42 .0 4 2.0 - Benefits & ch anges in r eserv es (15 0.1) (1 50.1) (1 29.7) ( 20.4) Ex penses (n on -acq uis ition ) (30 .6 ) ( 30.6) ( 26.1) (4 .5 ) Earning s bef ore amortization & acquisitio n expen ses 64.3 64 .3 5 3.8 10.5 Amor tization (3 7.0) (1 5.0) (14 .3 ) (0.7) Non -deferrab le acqu isition exp enses - (54.0) - ( 54.0) EB IT 27.3$ ( 4.7)$ 39 .5 $ (44 .2 )$ 8.5% -5.9% Year Ended Decemb er 3 1, 201 1 Op erating Retur n on A llocated Capital Restated fo r ASU 201 0 -26
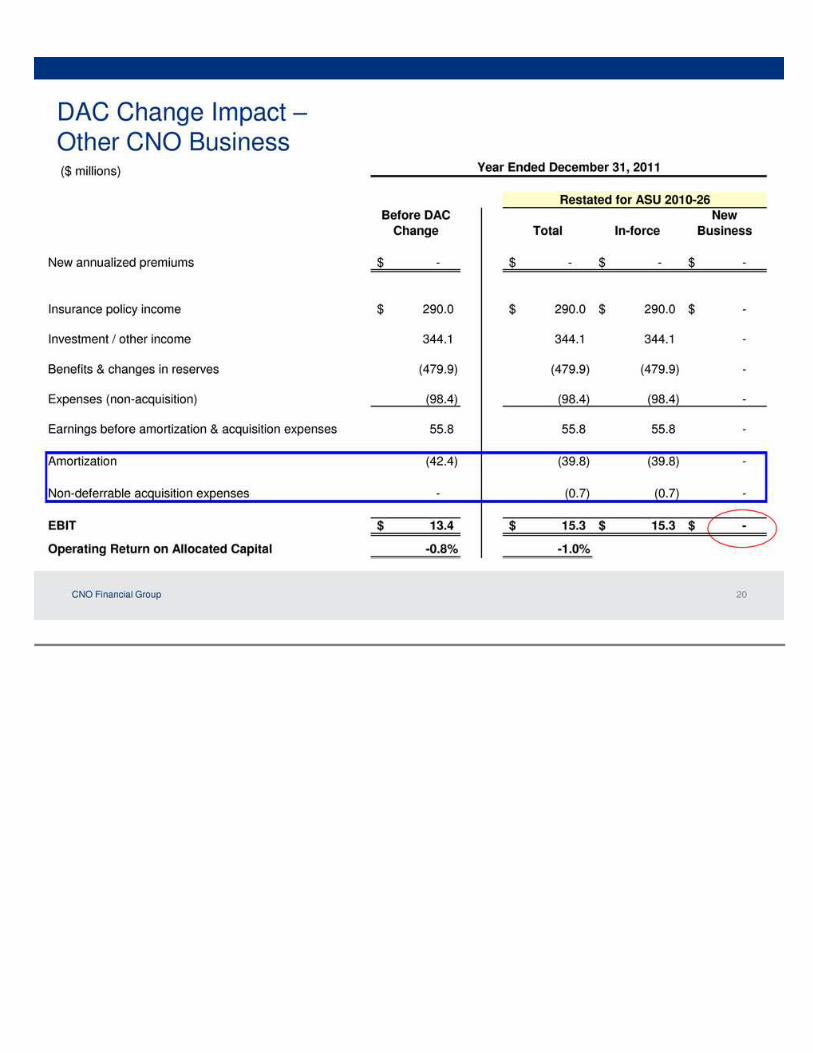
CNO Financial Grou p 20 DAC Chan ge Impact – Oth er C NO B usin ess ($ millio ns) Befo re DAC C hang e To tal In -force New B usin ess New ann ualized p remiums -$ -$ - $ -$ Insuran ce po licy in come 290 .0 $ 290 .0 $ 290 .0 $ -$ Investment / o th er income 34 4.1 344 .1 3 44.1 - B enefits & chan ges in reserves (479 .9 ) (47 9.9) (47 9.9) - Ex penses (n on -acq uis ition ) (98 .4 ) ( 98.4) ( 98.4) - Earn ings befor e amo rtizatio n & acq uis ition ex penses 5 5.8 55.8 55 .8 - Amor tization ( 42.4) (3 9.8) (3 9.8) - Non -deferrab le acqu isition exp enses - (0 .7 ) (0.7) - EB IT 13.4$ 1 5.3$ 15 .3 $ -$ - 0.8% - 1.0%Op eratin g Retur n on A llo cated Capital R estated fo r ASU 201 0-26 Year E nded December 3 1, 2 011


Exhibit 99.2
Page 1
Quarterly Financial Supplement -
4Q2011 as Restated to Reflect the Adoption of ASU 2010-26
April 24, 2012

Page 2
Table of Contents Page
Consolidated balance sheet 3
Consolidated statement of operations 4
Operating results 5
Computation of weighted average shares outstanding 6
EBIT from Business Segments Summarized by In-Force and New Business 7
Analyses of income before taxes and selected data:
Bankers Life 8-10
Washington National 11-13
Colonial Penn 14-15
Other CNO Business 16-18
Corporate Operations 19
Premiums collected on insurance products:
Bankers Life 20
Washington National 21
Colonial Penn 22
Other CNO Business 23
New annualized premiums 24
Statutory information 25
Notes 26

Page 3
CNO Financial Group, Inc.
Consolidated balance sheet (in millions) Mar-10 Jun-10 Sep-10 Dec-10 Mar-11 Jun-11 Sep-11 Dec-11
Assets
Investments:
Fixed maturities, available for sale, at fair value $ 18,813.8 $ 19,935.7 $ 21,007.5 $ 20,633.9 $ 20,852.2 $ 21,622.9 $ 23,016.7 $ 23,516.0 Equity securities at fair value 31.1 31.0 41.1 68.1 105.4 129.6 164.3 175.1 Mortgage loans 1,936.6 1,948.1 1,825.6 1,761.2 1,751.3 1,752.8 1,648.2 1,602.8 Policy loans 294.0 292.9 290.9 284.4 281.6 279.5 279.6 279.7 Trading securities 332.0 360.7 389.7 372.6 403.1 83.5 81.8 91.6 Investments held by variable interest entities 511.7 478.4 454.8 420.9 401.6 414.0 453.5 496.3 Securities lending collateral 147.4 77.6 — — — — — — Other invested assets 236.3 167.2 189.5 240.9 272.1 252.2 190.9 202.8
Total investments 22,302.9 23,291.6 24,199.1 23,782.0 24,067.3 24,534.5 25,835.0 26,364.3
Cash and cash equivalents - unrestricted 321.1 323.7 548.8 571.9 424.6 580.2 461.9 436.0 Cash and cash equivalents held by variable interest entities 24.3 13.5 18.3 26.8 27.1 25.3 19.7 74.4 Accrued investment income 334.0 323.1 345.3 327.8 336.7 314.3 301.2 288.7 Present value of future profits 1,133.2 1,077.3 1,028.3 1,008.6 970.1 936.5 714.2 697.7 Deferred acquisition costs 1,048.5 974.3 899.1 999.6 989.3 975.5 749.6 724.8 Reinsurance receivables 3,444.1 3,357.2 3,315.7 3,256.3 3,219.0 3,172.5 3,131.3 3,091.1 Income tax assets, net 1,301.9 1,043.6 806.6 1,127.0 1,090.4 998.4 948.8 891.3 Assets held in separate accounts 17.0 15.6 16.7 17.5 18.1 17.4 15.4 15.0 Other assets 367.6 320.0 323.2 277.4 413.0 323.6 289.6 292.2
Total assets $ 30,294.6 $ 30,739.9 $ 31,501.1 $ 31,394.9 $ 31,555.6 $ 31,878.2 $ 32,466.7 $ 32,875.5
Liabilities
Liabilities for insurance products:
Interest-sensitive products $ 13,217.7 $ 13,177.8 $ 13,217.6 $ 13,194.7 $ 13,161.3 $ 13,152.8 $ 13,168.2 $ 13,165.5 Traditional products 10,137.6 10,199.7 10,253.0 10,307.6 10,357.9 10,424.4 10,444.8 10,482.7 Claims payable and other policyholder funds 969.4 946.0 939.4 968.7 979.0 978.0 985.5 1,034.3 Liabilities related to separate accounts 17.0 15.6 16.7 17.5 18.1 17.4 15.4 15.0 Other liabilities 593.6 693.3 843.2 505.3 651.8 712.2 585.2 556.3 Investment borrowings 454.5 454.2 653.9 1,204.1 1,203.8 1,305.3 1,509.1 1,676.5 Borrowings related to variable interest entities 495.4 449.7 425.0 386.9 354.4 317.3 405.6 519.9 Securities lending payable 152.4 82.0 — — — — — — Notes payable - direct corporate obligations 1,037.2 1,029.4 1,029.8 998.5 949.8 934.5 871.2 857.9
Total liabilities 27,074.8 27,047.7 27,378.6 27,583.3 27,676.1 27,841.9 27,985.0 28,308.1
Shareholders' equity
Common stock 2.5 2.5 2.5 2.5 2.5 2.5 2.4 2.4 Additional paid-in capital 4,411.0 4,418.8 4,421.6 4,424.2 4,426.1 4,414.3 4,379.4 4,361.9 Accumulated deficit (1,088.6 ) (1,068.5 ) (1,029.9 ) (867.8 ) (822.4 ) (776.0 ) (596.5 ) (532.1 )
Total shareholders' equity before accumulated other comprehensive income (loss) 3,324.9 3,352.8 3,394.2 3,558.9 3,606.2 3,640.8 3,785.3 3,832.2
Accumulated other comprehensive income (loss) (105.1 ) 339.4 728.3 252.7 273.3 395.5 696.4 735.2
Total shareholders' equity 3,219.8 3,692.2 4,122.5 3,811.6 3,879.5 4,036.3 4,481.7 4,567.4
Total liabilities and shareholders' equity $ 30,294.6 $ 30,739.9 $ 31,501.1 $ 31,394.9 $ 31,555.6 $ 31,878.2 $ 32,466.7 $ 32,875.5
1Q10 2Q10 3Q10 4Q10 1Q11 2Q11 3Q11 4Q11
Book value per share at period-end (1) (2) $ 13.25 $ 13.36 $ 13.52 $ 14.17 $ 14.34 $ 14.60 $ 15.56 $ 15.88 Book value per share assuming conversion of convertible securities (1) (3) $ 12.00 $ 11.85 $ 12.00 $ 12.51 $ 12.62 $ 12.79 $ 13.60 $ 13.87
Page 4
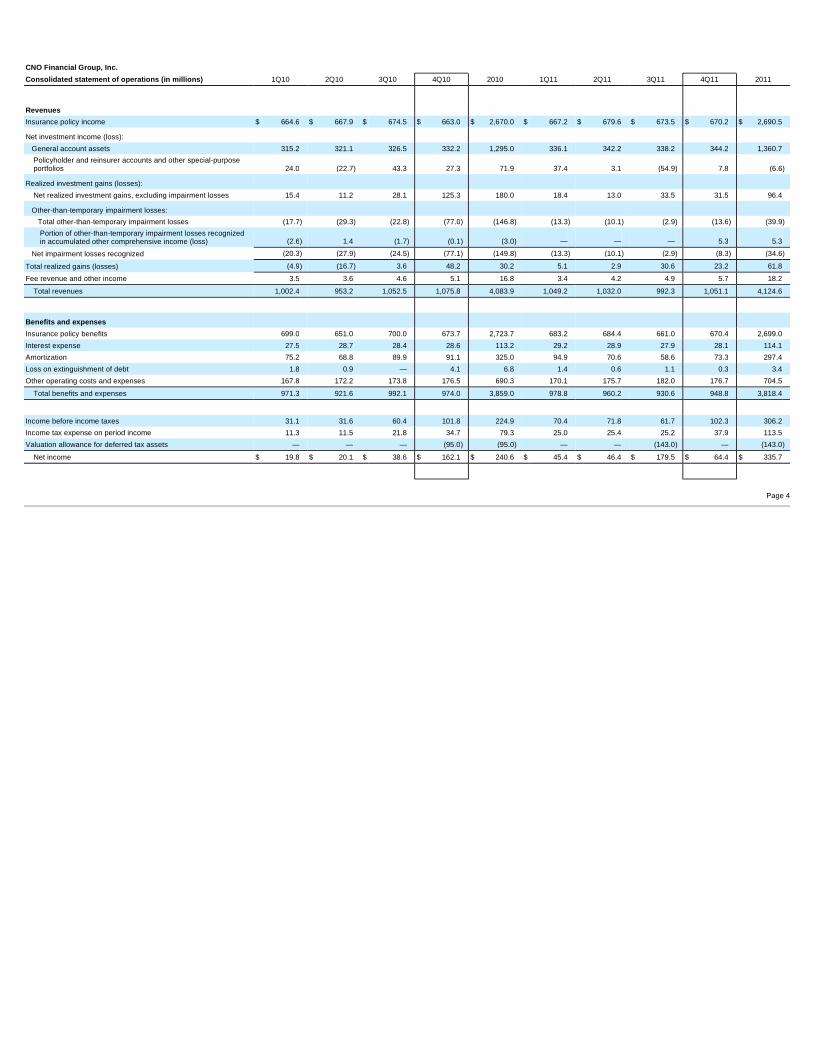
CNO Financial Group, Inc. Consolidated statement of operations (in millions) 1Q10 2Q10 3Q10 4Q10 2010 1Q11 2Q11 3Q11 4Q11 2011
Revenues Insurance policy income $ 664.6 $ 667.9 $ 674.5 $ 663.0 $ 2,670.0 $ 667.2 $ 679.6 $ 673.5 $ 670.2 $ 2,690.5 Net investment income (loss): General account assets 315.2 321.1 326.5 332.2 1,295.0 336.1 342.2 338.2 344.2 1,360.7
Policyholder and reinsurer accounts and other special-purpose portfolios 24.0 (22.7 ) 43.3 27.3 71.9 37.4 3.1 (54.9 ) 7.8 (6.6 )
Realized investment gains (losses): Net realized investment gains, excluding impairment losses 15.4 11.2 28.1 125.3 180.0 18.4 13.0 33.5 31.5 96.4
Other-than-temporary impairment losses: Total other-than-temporary impairment losses (17.7 ) (29.3 ) (22.8 ) (77.0 ) (146.8 ) (13.3 ) (10.1 ) (2.9 ) (13.6 ) (39.9 )
Portion of other-than-temporary impairment losses recognized in accumulated other comprehensive income (loss) (2.6 ) 1.4 (1.7 ) (0.1 ) (3.0 ) — — — 5.3 5.3
Net impairment losses recognized (20.3 ) (27.9 ) (24.5 ) (77.1 ) (149.8 ) (13.3 ) (10.1 ) (2.9 ) (8.3 ) (34.6 )
Total realized gains (losses) (4.9 ) (16.7 ) 3.6 48.2 30.2 5.1 2.9 30.6 23.2 61.8 Fee revenue and other income 3.5 3.6 4.6 5.1 16.8 3.4 4.2 4.9 5.7 18.2
Total revenues 1,002.4 953.2 1,052.5 1,075.8 4,083.9 1,049.2 1,032.0 992.3 1,051.1 4,124.6
Benefits and expenses Insurance policy benefits 699.0 651.0 700.0 673.7 2,723.7 683.2 684.4 661.0 670.4 2,699.0 Interest expense 27.5 28.7 28.4 28.6 113.2 29.2 28.9 27.9 28.1 114.1 Amortization 75.2 68.8 89.9 91.1 325.0 94.9 70.6 58.6 73.3 297.4 Loss on extinguishment of debt 1.8 0.9 — 4.1 6.8 1.4 0.6 1.1 0.3 3.4 Other operating costs and expenses 167.8 172.2 173.8 176.5 690.3 170.1 175.7 182.0 176.7 704.5
Total benefits and expenses 971.3 921.6 992.1 974.0 3,859.0 978.8 960.2 930.6 948.8 3,818.4 Income before income taxes 31.1 31.6 60.4 101.8 224.9 70.4 71.8 61.7 102.3 306.2 Income tax expense on period income 11.3 11.5 21.8 34.7 79.3 25.0 25.4 25.2 37.9 113.5 Valuation allowance for deferred tax assets — — — (95.0 ) (95.0 ) — — (143.0 ) — (143.0 )
Net income $ 19.8 $ 20.1 $ 38.6 $ 162.1 $ 240.6 $ 45.4 $ 46.4 $ 179.5 $ 64.4 $ 335.7
Page 5
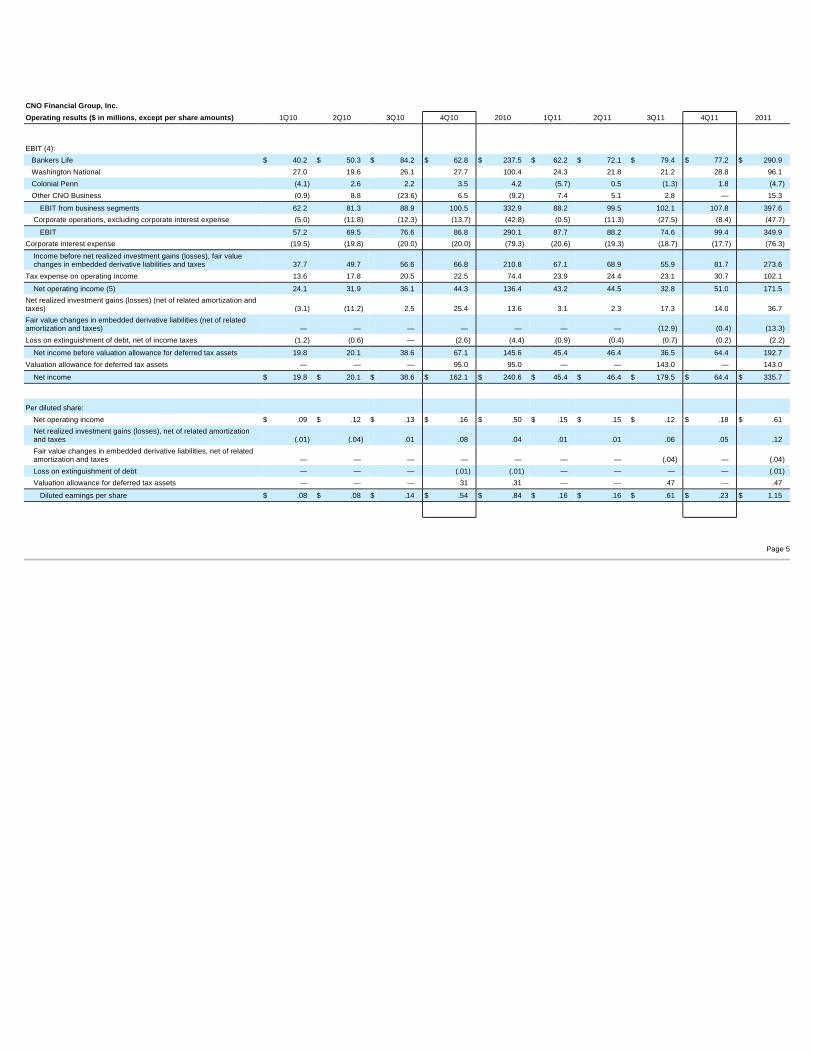
CNO Financial Group, Inc. Operating results ($ in millions, except per share amounts) 1Q10 2Q10 3Q10 4Q10 2010 1Q11 2Q11 3Q11 4Q11 2011
EBIT (4): Bankers Life $ 40.2 $ 50.3 $ 84.2 $ 62.8 $ 237.5 $ 62.2 $ 72.1 $ 79.4 $ 77.2 $ 290.9 Washington National 27.0 19.6 26.1 27.7 100.4 24.3 21.8 21.2 28.8 96.1 Colonial Penn (4.1 ) 2.6 2.2 3.5 4.2 (5.7 ) 0.5 (1.3 ) 1.8 (4.7 )
Other CNO Business (0.9 ) 8.8 (23.6 ) 6.5 (9.2 ) 7.4 5.1 2.8 — 15.3 EBIT from business segments 62.2 81.3 88.9 100.5 332.9 88.2 99.5 102.1 107.8 397.6
Corporate operations, excluding corporate interest expense (5.0 ) (11.8 ) (12.3 ) (13.7 ) (42.8 ) (0.5 ) (11.3 ) (27.5 ) (8.4 ) (47.7 )
EBIT 57.2 69.5 76.6 86.8 290.1 87.7 88.2 74.6 99.4 349.9 Corporate interest expense (19.5 ) (19.8 ) (20.0 ) (20.0 ) (79.3 ) (20.6 ) (19.3 ) (18.7 ) (17.7 ) (76.3 )
Income before net realized investment gains (losses), fair value changes in embedded derivative liabilities and taxes 37.7 49.7 56.6 66.8 210.8 67.1 68.9 55.9 81.7 273.6
Tax expense on operating income 13.6 17.8 20.5 22.5 74.4 23.9 24.4 23.1 30.7 102.1 Net operating income (5) 24.1 31.9 36.1 44.3 136.4 43.2 44.5 32.8 51.0 171.5
Net realized investment gains (losses) (net of related amortization and taxes) (3.1 ) (11.2 ) 2.5 25.4 13.6 3.1 2.3 17.3 14.0 36.7 Fair value changes in embedded derivative liabilities (net of related amortization and taxes) — — — — — — — (12.9 ) (0.4 ) (13.3 )
Loss on extinguishment of debt, net of income taxes (1.2 ) (0.6 ) — (2.6 ) (4.4 ) (0.9 ) (0.4 ) (0.7 ) (0.2 ) (2.2 )
Net income before valuation allowance for deferred tax assets 19.8 20.1 38.6 67.1 145.6 45.4 46.4 36.5 64.4 192.7 Valuation allowance for deferred tax assets — — — 95.0 95.0 — — 143.0 — 143.0
Net income $ 19.8 $ 20.1 $ 38.6 $ 162.1 $ 240.6 $ 45.4 $ 46.4 $ 179.5 $ 64.4 $ 335.7
Per diluted share: Net operating income $ .09 $ .12 $ .13 $ .16 $ .50 $ .15 $ .15 $ .12 $ .18 $ .61 Net realized investment gains (losses), net of related amortization and taxes (.01 ) (.04 ) .01 .08 .04 .01 .01 .06 .05 .12 Fair value changes in embedded derivative liabilities, net of related amortization and taxes — — — — — — — (.04 ) — (.04 )
Loss on extinguishment of debt — — — (.01 ) (.01 ) — — — — (.01 )
Valuation allowance for deferred tax assets — — — .31 .31 — — .47 — .47 Diluted earnings per share $ .08 $ .08 $ .14 $ .54 $ .84 $ .16 $ .16 $ .61 $ .23 $ 1.15

Page 6
CNO Financial Group, Inc. Computation of weighted average shares outstanding 1Q10 2Q10 3Q10 4Q10 2010 1Q11 2Q11 3Q11 4Q11 2011
(000s)
Basic Shares outstanding, beginning of period 250,786.2 250,929.8 251,044.7 251,046.4 250,786.2 251,084.2 251,404.9 249,415.2 243,247.3 251,084.2 Weighted average shares issued during the period:
Shares repurchased — — — — — — (590.3 ) (2,511.6 ) (720.5 ) (3,700.7 )
Shares issued under stock option and restricted stock plans 2.3 67.8 0.1 18.2 240.0 52.6 118.5 61.8 268.6 694.4 Shares withheld for the payment of taxes owed on the vesting of restricted stock (0.7 ) (3.4 ) — (0.5 ) (53.5 ) (16.3 ) — (0.3 ) (6.2 ) (125.9 )
Weighted average basic shares outstanding during the period 250,787.8 250,994.2 251,044.8 251,064.1 250,972.7 251,120.5 250,933.1 246,965.1 242,789.2 247,952.0 Basic shares outstanding, end of period 250,929.8 251,044.7 251,046.4 251,084.2 251,084.2 251,404.9 249,415.2 243,247.3 241,304.5 241,304.5
Diluted Weighted average basic shares outstanding 250,787.8 250,994.2 251,044.8 251,064.1 250,972.7 251,120.5 250,933.1 246,965.1 242,789.2 247,952.0 Common stock equivalent shares related to: Convertible debentures 39,532.4 49,793.3 53,363.6 53,366.9 49,014.1 53,366.9 53,366.9 53,366.9 53,366.9 53,366.9 Stock option and restricted stock plans 1,760.3 1,860.6 1,631.2 2,231.1 1,870.8 2,748.3 3,035.8 2,352.9 1,914.6 2,512.9 Warrants — — — — — 262.4 712.4 22.9 — 249.4 Weighted average diluted shares outstanding during the period 292,080.5 302,648.1 306,039.6 306,662.1 301,857.6 307,498.1 308,048.2 302,707.8 298,070.7 304,081.2 Diluted shares outstanding, end of period 296,498.0 306,268.9 306,044.5 306,682.1 306,682.1 307,782.4 306,530.3 298,990.0 296,586.0 296,586.0
Page 7
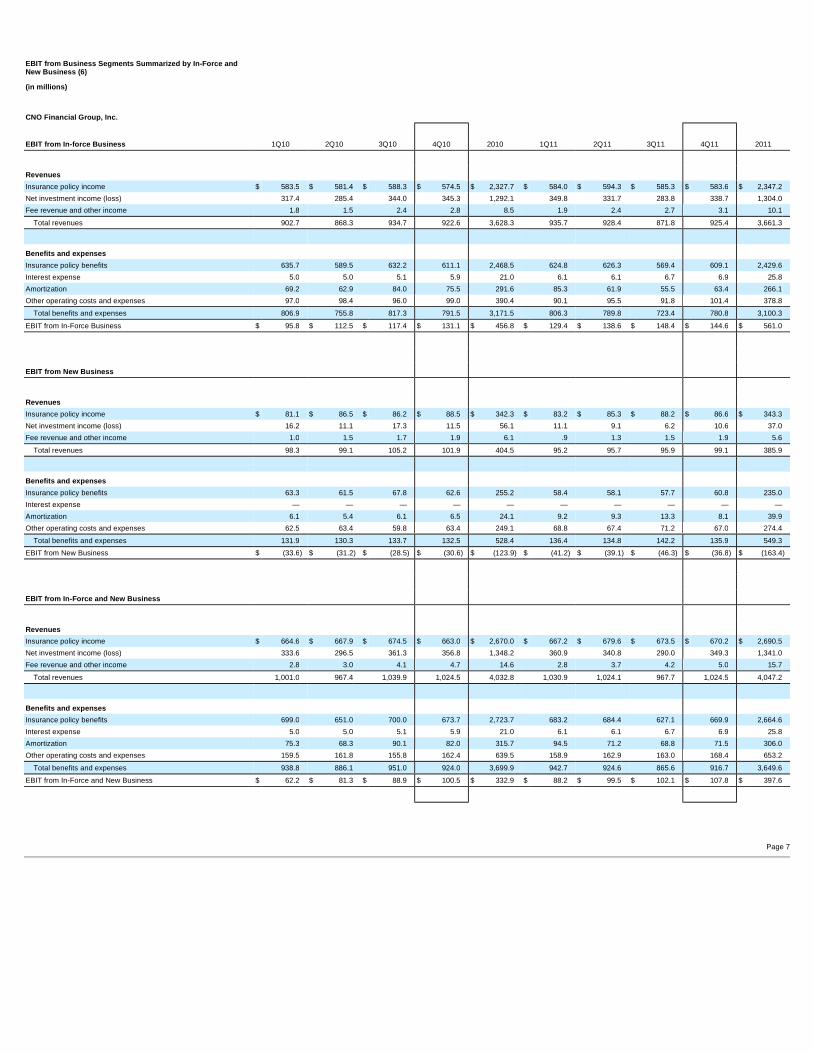
EBIT from Business Segments Summarized by In-Force and New Business (6)
(in millions)
CNO Financial Group, Inc.
EBIT from In-force Business 1Q10 2Q10 3Q10 4Q10 2010 1Q11 2Q11 3Q11 4Q11 2011
Revenues Insurance policy income $ 583.5 $ 581.4 $ 588.3 $ 574.5 $ 2,327.7 $ 584.0 $ 594.3 $ 585.3 $ 583.6 $ 2,347.2 Net investment income (loss) 317.4 285.4 344.0 345.3 1,292.1 349.8 331.7 283.8 338.7 1,304.0 Fee revenue and other income 1.8 1.5 2.4 2.8 8.5 1.9 2.4 2.7 3.1 10.1
Total revenues 902.7 868.3 934.7 922.6 3,628.3 935.7 928.4 871.8 925.4 3,661.3
Benefits and expenses Insurance policy benefits 635.7 589.5 632.2 611.1 2,468.5 624.8 626.3 569.4 609.1 2,429.6 Interest expense 5.0 5.0 5.1 5.9 21.0 6.1 6.1 6.7 6.9 25.8 Amortization 69.2 62.9 84.0 75.5 291.6 85.3 61.9 55.5 63.4 266.1 Other operating costs and expenses 97.0 98.4 96.0 99.0 390.4 90.1 95.5 91.8 101.4 378.8
Total benefits and expenses 806.9 755.8 817.3 791.5 3,171.5 806.3 789.8 723.4 780.8 3,100.3 EBIT from In-Force Business $ 95.8 $ 112.5 $ 117.4 $ 131.1 $ 456.8 $ 129.4 $ 138.6 $ 148.4 $ 144.6 $ 561.0
EBIT from New Business
Revenues Insurance policy income $ 81.1 $ 86.5 $ 86.2 $ 88.5 $ 342.3 $ 83.2 $ 85.3 $ 88.2 $ 86.6 $ 343.3 Net investment income (loss) 16.2 11.1 17.3 11.5 56.1 11.1 9.1 6.2 10.6 37.0 Fee revenue and other income 1.0 1.5 1.7 1.9 6.1 .9 1.3 1.5 1.9 5.6
Total revenues 98.3 99.1 105.2 101.9 404.5 95.2 95.7 95.9 99.1 385.9
Benefits and expenses Insurance policy benefits 63.3 61.5 67.8 62.6 255.2 58.4 58.1 57.7 60.8 235.0 Interest expense — — — — — — — — — — Amortization 6.1 5.4 6.1 6.5 24.1 9.2 9.3 13.3 8.1 39.9 Other operating costs and expenses 62.5 63.4 59.8 63.4 249.1 68.8 67.4 71.2 67.0 274.4
Total benefits and expenses 131.9 130.3 133.7 132.5 528.4 136.4 134.8 142.2 135.9 549.3 EBIT from New Business $ (33.6 ) $ (31.2 ) $ (28.5 ) $ (30.6 ) $ (123.9 ) $ (41.2 ) $ (39.1 ) $ (46.3 ) $ (36.8 ) $ (163.4 )
EBIT from In-Force and New Business
Revenues Insurance policy income $ 664.6 $ 667.9 $ 674.5 $ 663.0 $ 2,670.0 $ 667.2 $ 679.6 $ 673.5 $ 670.2 $ 2,690.5 Net investment income (loss) 333.6 296.5 361.3 356.8 1,348.2 360.9 340.8 290.0 349.3 1,341.0 Fee revenue and other income 2.8 3.0 4.1 4.7 14.6 2.8 3.7 4.2 5.0 15.7
Total revenues 1,001.0 967.4 1,039.9 1,024.5 4,032.8 1,030.9 1,024.1 967.7 1,024.5 4,047.2
Benefits and expenses Insurance policy benefits 699.0 651.0 700.0 673.7 2,723.7 683.2 684.4 627.1 669.9 2,664.6 Interest expense 5.0 5.0 5.1 5.9 21.0 6.1 6.1 6.7 6.9 25.8 Amortization 75.3 68.3 90.1 82.0 315.7 94.5 71.2 68.8 71.5 306.0 Other operating costs and expenses 159.5 161.8 155.8 162.4 639.5 158.9 162.9 163.0 168.4 653.2
Total benefits and expenses 938.8 886.1 951.0 924.0 3,699.9 942.7 924.6 865.6 916.7 3,649.6 EBIT from In-Force and New Business $ 62.2 $ 81.3 $ 88.9 $ 100.5 $ 332.9 $ 88.2 $ 99.5 $ 102.1 $ 107.8 $ 397.6

Page 8
CNO Financial Group, Inc.
Bankers Life Analysis of income before taxes (in millions) 1Q10 2Q10 3Q10 4Q10 2010 1Q11 2Q11 3Q11 4Q11 2011
Insurance policy income $ 396.2 $ 400.7 $ 405.1 $ 394.2 $ 1,596.2 $ 400.0 $ 409.6 $ 404.6 $ 398.2 $ 1,612.4 Net investment income (loss): General account invested assets 172.2 177.0 182.4 187.7 719.3 191.3 196.5 194.3 198.2 780.3 Fixed index products 12.1 (15.3 ) 21.9 13.9 32.6 18.3 0.4 (36.3 ) 3.6 (14.0 )
Other special-purpose portfolios 1.6 (1.2 ) 4.2 2.4 7.0 — — — — — Net realized investment gains (losses) (3.0 ) (10.3 ) 18.3 57.1 62.1 6.6 (1.8 ) 26.5 16.6 47.9 Fee revenue and other income 2.3 2.7 3.6 4.2 12.8 2.3 3.3 3.6 4.6 13.8 Total revenues 581.4 553.6 635.5 659.5 2,430.0 618.5 608.0 592.7 621.2 2,440.4 Insurance policy benefits 350.6 344.2 341.8 339.9 1,376.5 337.6 351.3 333.6 339.2 1,361.7 Insurance policy benefits - fair value changes in embedded derivative liabilities — — — — — — — 30.7 0.5 31.2 Amounts added to policyholder account balances:
Annuity products and interest-sensitive life products other than fixed index products 43.8 44.1 43.3 44.1 175.3 40.8 40.5 40.0 39.9 161.2 Fixed index products 22.1 (5.6 ) 17.0 22.0 55.5 26.4 17.1 (13.0 ) 16.7 47.2
Amortization related to operations 48.7 50.8 55.6 52.8 207.9 68.5 46.9 44.1 46.8 206.3 Amortization related to net realized investment gains (losses) 0.5 (0.5 ) 1.1 6.9 8.0 0.8 (0.3 ) 3.0 1.7 5.2 Amortization related to fair value changes in embedded derivative liabilities — — — — — — — (11.5 ) 0.1 (11.4 )
Interest expense on investment borrowings — — — 1.0 1.0 1.2 1.1 1.2 1.3 4.8 Other operating costs and expenses 79.0 80.1 75.3 79.8 314.2 75.2 80.8 80.9 83.5 320.4 Total benefits and expenses 544.7 513.1 534.1 546.5 2,138.4 550.5 537.4 509.0 529.7 2,126.6 Income before income taxes $ 36.7 $ 40.5 $ 101.4 $ 113.0 $ 291.6 $ 68.0 $ 70.6 $ 83.7 $ 91.5 $ 313.8
Health underwriting margins (in millions) 1Q10 2Q10 3Q10 4Q10 2010 1Q11 2Q11 3Q11 4Q11 2011
Medicare supplement: Earned premium $ 178.8 $ 178.5 $ 178.2 $ 177.4 $ 712.9 $ 181.0 $ 179.5 $ 179.2 $ 178.6 $ 718.3 Benefit ratio 72.8 % 70.7 % 69.5 % 70.7 % 70.9 % 67.2 % 69.8 % 68.4 % 70.5 % 69.0 %
Underwriting margin (earned premium less policy benefits) $ 48.6 $ 52.3 $ 54.4 $ 52.0 $ 207.3 $ 59.3 $ 54.2 $ 56.7 $ 52.7 $ 222.9
PDP: Earned premium $ 18.0 $ 19.7 $ 19.3 $ 10.8 $ 67.8 $ 14.4 $ 16.7 $ 12.9 $ 10.5 $ 54.5 Benefit ratio 88.7 % 89.8 % 64.4 % 60.7 % 77.7 % 89.5 % 88.6 % 76.1 % 72.6 % 82.8 %
Underwriting margin (earned premium less policy benefits) $ 2.0 $ 2.0 $ 6.9 $ 4.2 $ 15.1 $ 1.5 $ 1.9 $ 3.1 $ 2.9 $ 9.4
PFFS: Earned premium $ (0.1 ) $ (0.3 ) $ (0.4 ) $ 0.2 $ (0.6 ) $ — $ 3.6 $ — $ — $ 3.6 Benefit ratio N/A N/A N/A N/A N/A N/A N/A N/A N/A N/A
Underwriting margin (earned premium less policy benefits) $ 5.0 $ 4.0 $ 6.5 $ 2.0 $ 17.5 $ 0.7 $ 3.7 $ 0.5 $ 0.3 $ 5.2
Long-term care: Earned premium $ 149.1 $ 144.6 $ 146.8 $ 145.4 $ 585.9 $ 144.4 $ 143.4 $ 142.0 $ 141.1 $ 570.9 Benefit ratio before interest income on reserves 114.4 % 113.0 % 114.2 % 113.3 % 113.7 % 113.4 % 115.0 % 109.7 % 112.1 % 112.6 %
Interest-adjusted benefit ratio 75.2 % 71.9 % 73.2 % 71.5 % 73.0 % 70.8 % 71.6 % 65.5 % 67.3 % 68.8 %
Underwriting margin (earned premium plus interest income on reserves less policy benefits) $ 36.9 $ 40.6 $ 39.4 $ 41.5 $ 158.4 $ 42.2 $ 40.7 $ 49.1 $ 46.1 $ 178.1
Page 9
CNO Financial Group, Inc.
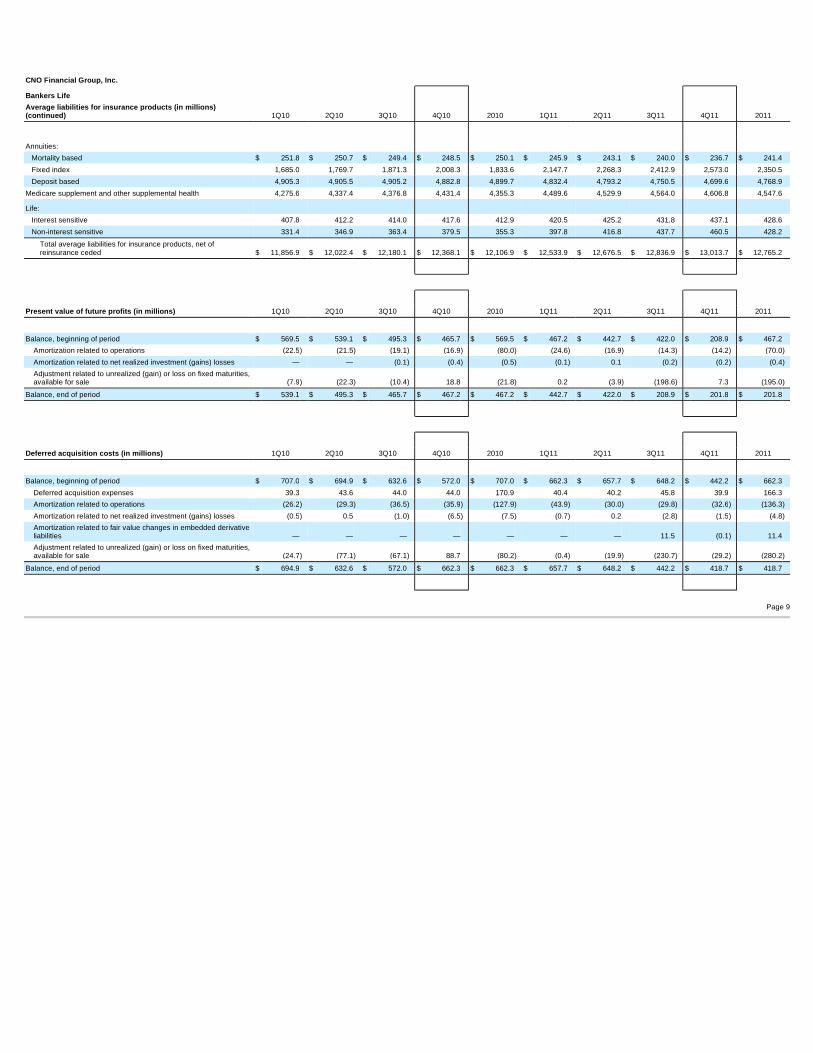
Bankers Life Average liabilities for insurance products (in mill ions) (continued) 1Q10 2Q10 3Q10 4Q10 2010 1Q11 2Q11 3Q11 4Q11 2011
Annuities: Mortality based $ 251.8 $ 250.7 $ 249.4 $ 248.5 $ 250.1 $ 245.9 $ 243.1 $ 240.0 $ 236.7 $ 241.4 Fixed index 1,685.0 1,769.7 1,871.3 2,008.3 1,833.6 2,147.7 2,268.3 2,412.9 2,573.0 2,350.5 Deposit based 4,905.3 4,905.5 4,905.2 4,882.8 4,899.7 4,832.4 4,793.2 4,750.5 4,699.6 4,768.9 Medicare supplement and other supplemental health 4,275.6 4,337.4 4,376.8 4,431.4 4,355.3 4,489.6 4,529.9 4,564.0 4,606.8 4,547.6 Life: Interest sensitive 407.8 412.2 414.0 417.6 412.9 420.5 425.2 431.8 437.1 428.6 Non-interest sensitive 331.4 346.9 363.4 379.5 355.3 397.8 416.8 437.7 460.5 428.2
Total average liabilities for insurance products, net of reinsurance ceded $ 11,856.9 $ 12,022.4 $ 12,180.1 $ 12,368.1 $ 12,106.9 $ 12,533.9 $ 12,676.5 $ 12,836.9 $ 13,013.7 $ 12,765.2
Present value of future profits (in millions) 1Q10 2Q10 3Q10 4Q10 2010 1Q11 2Q11 3Q11 4Q11 2011
Balance, beginning of period $ 569.5 $ 539.1 $ 495.3 $ 465.7 $ 569.5 $ 467.2 $ 442.7 $ 422.0 $ 208.9 $ 467.2
Amortization related to operations (22.5 ) (21.5 ) (19.1 ) (16.9 ) (80.0 ) (24.6 ) (16.9 ) (14.3 ) (14.2 ) (70.0 )
Amortization related to net realized investment (gains) losses — — (0.1 ) (0.4 ) (0.5 ) (0.1 ) 0.1 (0.2 ) (0.2 ) (0.4 )
Adjustment related to unrealized (gain) or loss on fixed maturities, available for sale (7.9 ) (22.3 ) (10.4 ) 18.8 (21.8 ) 0.2 (3.9 ) (198.6 ) 7.3 (195.0 )
Balance, end of period $ 539.1 $ 495.3 $ 465.7 $ 467.2 $ 467.2 $ 442.7 $ 422.0 $ 208.9 $ 201.8 $ 201.8
Deferred acquisition costs (in millions) 1Q10 2Q10 3Q10 4Q10 2010 1Q11 2Q11 3Q11 4Q11 2011
Balance, beginning of period $ 707.0 $ 694.9 $ 632.6 $ 572.0 $ 707.0 $ 662.3 $ 657.7 $ 648.2 $ 442.2 $ 662.3
Deferred acquisition expenses 39.3 43.6 44.0 44.0 170.9 40.4 40.2 45.8 39.9 166.3 Amortization related to operations (26.2 ) (29.3 ) (36.5 ) (35.9 ) (127.9 ) (43.9 ) (30.0 ) (29.8 ) (32.6 ) (136.3 )
Amortization related to net realized investment (gains) losses (0.5 ) 0.5 (1.0 ) (6.5 ) (7.5 ) (0.7 ) 0.2 (2.8 ) (1.5 ) (4.8 )
Amortization related to fair value changes in embedded derivative liabilities — — — — — — — 11.5 (0.1 ) 11.4 Adjustment related to unrealized (gain) or loss on fixed maturities, available for sale (24.7 ) (77.1 ) (67.1 ) 88.7 (80.2 ) (0.4 ) (19.9 ) (230.7 ) (29.2 ) (280.2 )
Balance, end of period $ 694.9 $ 632.6 $ 572.0 $ 662.3 $ 662.3 $ 657.7 $ 648.2 $ 442.2 $ 418.7 $ 418.7

Page 10
Bankers Life Segment EBIT Summarized by In-Force an d New Business (6)
(in millions)
CNO Financial Group, Inc. EBIT from In-force Business 1Q10 2Q10 3Q10 4Q10 2010 1Q11 2Q11 3Q11 4Q11 2011
Revenues Insurance policy income $ 336.9 $ 336.2 $ 340.5 $ 327.6 $ 1,341.2 $ 338.8 $ 346.3 $ 339.0 $ 334.8 $ 1,358.9 Net investment income (loss) 169.7 149.4 191.2 192.5 702.8 198.5 187.8 151.8 191.2 729.3 Fee revenue and other income 1.3 1.2 1.9 2.3 6.7 1.4 2.0 2.1 2.7 8.2
Total revenues 507.9 486.8 533.6 522.4 2,050.7 538.7 536.1 492.9 528.7 2,096.4
Benefits and expenses Insurance policy benefits 363.7 331.7 344.6 353.8 1,393.8 356.9 361.3 313.7 346.1 1,378.0 Interest expense — — — 1.0 1.0 1.2 1.1 1.2 1.3 4.8 Amortization 43.6 46.2 50.3 47.1 187.2 60.1 38.5 31.6 39.7 169.9 Other operating costs and expenses 39.8 37.1 34.3 35.3 146.5 33.8 36.6 34.8 38.9 144.1
Total benefits and expenses 447.1 415.0 429.2 437.2 1,728.5 452.0 437.5 381.3 426.0 1,696.8 EBIT from In-Force Business $ 60.8 $ 71.8 $ 104.4 $ 85.2 $ 322.2 $ 86.7 $ 98.6 $ 111.6 $ 102.7 $ 399.6
EBIT from New Business
Revenues Insurance policy income $ 59.3 $ 64.5 $ 64.6 $ 66.6 $ 255.0 $ 61.2 $ 63.3 $ 65.6 $ 63.4 $ 253.5 Net investment income (loss) 16.2 11.1 17.3 11.5 56.1 11.1 9.1 6.2 10.6 37.0 Fee revenue and other income 1.0 1.5 1.7 1.9 6.1 .9 1.3 1.5 1.9 5.6
Total revenues 76.5 77.1 83.6 80.0 317.2 73.2 73.7 73.3 75.9 296.1
Benefits and expenses Insurance policy benefits 52.8 51.0 57.5 52.2 213.5 47.9 47.6 46.9 49.7 192.1 Interest expense — — — — — — — — — — Amortization 5.1 4.6 5.3 5.7 20.7 8.4 8.4 12.5 7.1 36.4 Other operating costs and expenses 39.2 43.0 41.0 44.5 167.7 41.4 44.2 46.1 44.6 176.3
Total benefits and expenses 97.1 98.6 103.8 102.4 401.9 97.7 100.2 105.5 101.4 404.8 EBIT from New Business $ (20.6 ) $ (21.5 ) $ (20.2 ) $ (22.4 ) $ (84.7 ) $ (24.5 ) $ (26.5 ) $ (32.2 ) $ (25.5 ) $ (108.7 )
EBIT from In-Force and New Business
Revenues Insurance policy income $ 396.2 $ 400.7 $ 405.1 $ 394.2 $ 1,596.2 $ 400.0 $ 409.6 $ 404.6 $ 398.2 $ 1,612.4 Net investment income (loss) 185.9 160.5 208.5 204.0 758.9 209.6 196.9 158.0 201.8 766.3 Fee revenue and other income 2.3 2.7 3.6 4.2 12.8 2.3 3.3 3.6 4.6 13.8
Total revenues 584.4 563.9 617.2 602.4 2,367.9 611.9 609.8 566.2 604.6 2,392.5
Benefits and expenses Insurance policy benefits 416.5 382.7 402.1 406.0 1,607.3 404.8 408.9 360.6 395.8 1,570.1 Interest expense — — — 1.0 1.0 1.2 1.1 1.2 1.3 4.8 Amortization 48.7 50.8 55.6 52.8 207.9 68.5 46.9 44.1 46.8 206.3 Other operating costs and expenses 79.0 80.1 75.3 79.8 314.2 75.2 80.8 80.9 83.5 320.4
Total benefits and expenses 544.2 513.6 533.0 539.6 2,130.4 549.7 537.7 486.8 527.4 2,101.6 EBIT from In-Force and New Business $ 40.2 $ 50.3 $ 84.2 $ 62.8 $ 237.5 $ 62.2 $ 72.1 $ 79.4 $ 77.2 $ 290.9
Page 11
CNO Financial Group, Inc.
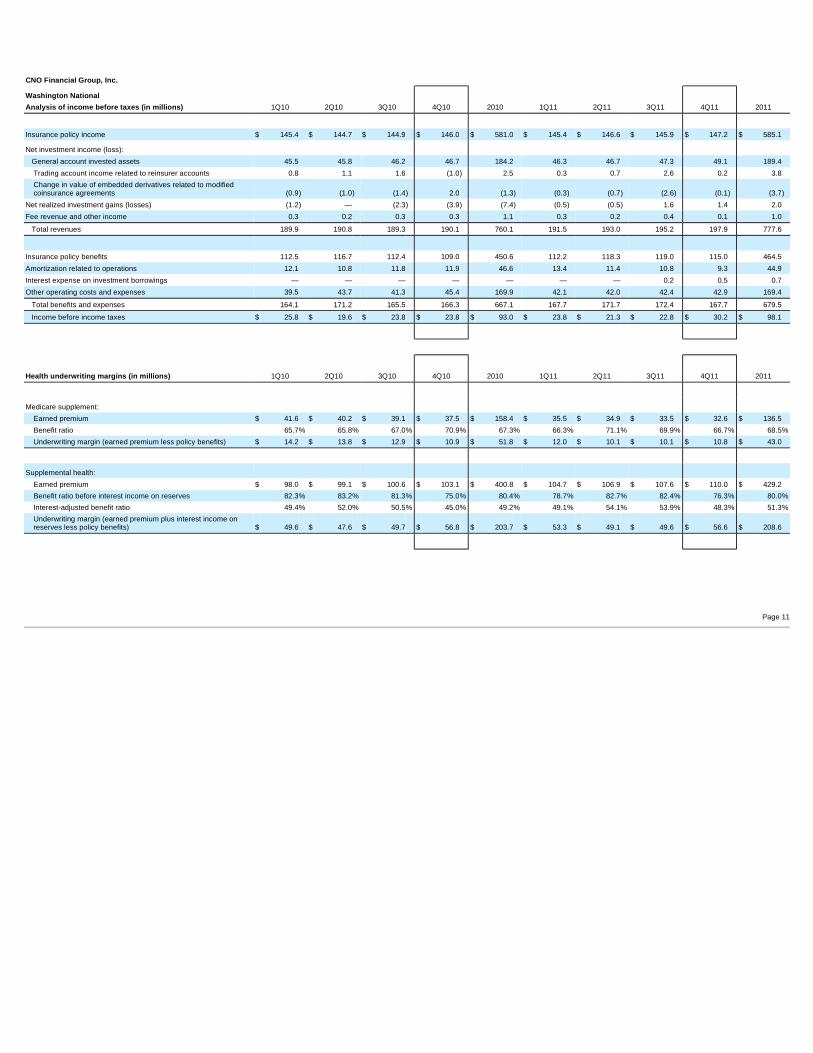
Washington National Analysis of income before taxes (in millions) 1Q10 2Q10 3Q10 4Q10 2010 1Q11 2Q11 3Q11 4Q11 2011
Insurance policy income $ 145.4 $ 144.7 $ 144.9 $ 146.0 $ 581.0 $ 145.4 $ 146.6 $ 145.9 $ 147.2 $ 585.1 Net investment income (loss): General account invested assets 45.5 45.8 46.2 46.7 184.2 46.3 46.7 47.3 49.1 189.4
Trading account income related to reinsurer accounts 0.8 1.1 1.6 (1.0 ) 2.5 0.3 0.7 2.6 0.2 3.8 Change in value of embedded derivatives related to modified coinsurance agreements (0.9 ) (1.0 ) (1.4 ) 2.0 (1.3 ) (0.3 ) (0.7 ) (2.6 ) (0.1 ) (3.7 )
Net realized investment gains (losses) (1.2 ) — (2.3 ) (3.9 ) (7.4 ) (0.5 ) (0.5 ) 1.6 1.4 2.0 Fee revenue and other income 0.3 0.2 0.3 0.3 1.1 0.3 0.2 0.4 0.1 1.0 Total revenues 189.9 190.8 189.3 190.1 760.1 191.5 193.0 195.2 197.9 777.6 Insurance policy benefits 112.5 116.7 112.4 109.0 450.6 112.2 118.3 119.0 115.0 464.5 Amortization related to operations 12.1 10.8 11.8 11.9 46.6 13.4 11.4 10.8 9.3 44.9 Interest expense on investment borrowings — — — — — — — 0.2 0.5 0.7 Other operating costs and expenses 39.5 43.7 41.3 45.4 169.9 42.1 42.0 42.4 42.9 169.4 Total benefits and expenses 164.1 171.2 165.5 166.3 667.1 167.7 171.7 172.4 167.7 679.5 Income before income taxes $ 25.8 $ 19.6 $ 23.8 $ 23.8 $ 93.0 $ 23.8 $ 21.3 $ 22.8 $ 30.2 $ 98.1
Health underwriting margins (in millions) 1Q10 2Q10 3Q10 4Q10 2010 1Q11 2Q11 3Q11 4Q11 2011
Medicare supplement: Earned premium $ 41.6 $ 40.2 $ 39.1 $ 37.5 $ 158.4 $ 35.5 $ 34.9 $ 33.5 $ 32.6 $ 136.5 Benefit ratio 65.7 % 65.8 % 67.0 % 70.9 % 67.3 % 66.3 % 71.1 % 69.9 % 66.7 % 68.5 %
Underwriting margin (earned premium less policy benefits) $ 14.2 $ 13.8 $ 12.9 $ 10.9 $ 51.8 $ 12.0 $ 10.1 $ 10.1 $ 10.8 $ 43.0
Supplemental health: Earned premium $ 98.0 $ 99.1 $ 100.6 $ 103.1 $ 400.8 $ 104.7 $ 106.9 $ 107.6 $ 110.0 $ 429.2 Benefit ratio before interest income on reserves 82.3 % 83.2 % 81.3 % 75.0 % 80.4 % 78.7 % 82.7 % 82.4 % 76.3 % 80.0 %
Interest-adjusted benefit ratio 49.4 % 52.0 % 50.5 % 45.0 % 49.2 % 49.1 % 54.1 % 53.9 % 48.3 % 51.3 %
Underwriting margin (earned premium plus interest income on reserves less policy benefits) $ 49.6 $ 47.6 $ 49.7 $ 56.8 $ 203.7 $ 53.3 $ 49.1 $ 49.6 $ 56.6 $ 208.6
Page 12
CNO Financial Group, Inc.
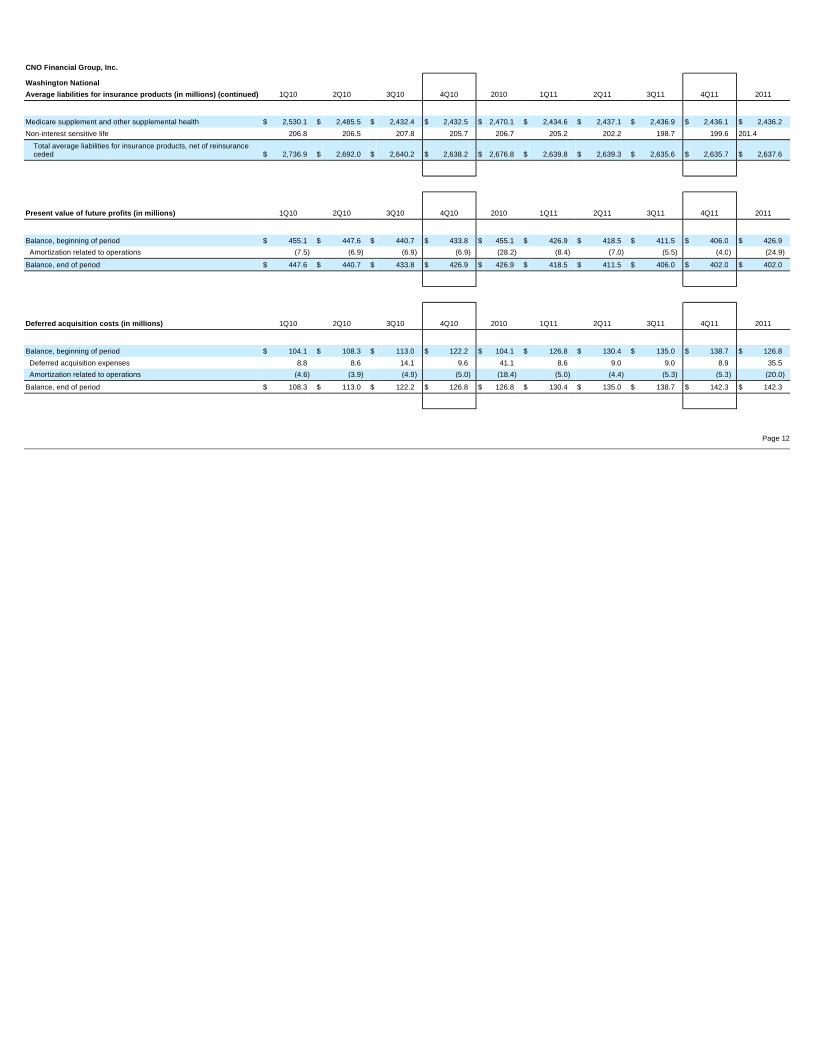
Washington National Average liabilities for insurance products (in mill ions) (continued) 1Q10 2Q10 3Q10 4Q10 2010 1Q11 2Q11 3Q11 4Q11 2011
Medicare supplement and other supplemental health $ 2,530.1 $ 2,485.5 $ 2,432.4 $ 2,432.5 $ 2,470.1 $ 2,434.6 $ 2,437.1 $ 2,436.9 $ 2,436.1 $ 2,436.2 Non-interest sensitive life 206.8 206.5 207.8 205.7 206.7 205.2 202.2 198.7 199.6 201.4
Total average liabilities for insurance products, net of reinsurance ceded $ 2,736.9 $ 2,692.0 $ 2,640.2 $ 2,638.2 $ 2,676.8 $ 2,639.8 $ 2,639.3 $ 2,635.6 $ 2,635.7 $ 2,637.6
Present value of future profits (in millions) 1Q10 2Q10 3Q10 4Q10 2010 1Q11 2Q11 3Q11 4Q11 2011
Balance, beginning of period $ 455.1 $ 447.6 $ 440.7 $ 433.8 $ 455.1 $ 426.9 $ 418.5 $ 411.5 $ 406.0 $ 426.9 Amortization related to operations (7.5 ) (6.9 ) (6.9 ) (6.9 ) (28.2 ) (8.4 ) (7.0 ) (5.5 ) (4.0 ) (24.9 )
Balance, end of period $ 447.6 $ 440.7 $ 433.8 $ 426.9 $ 426.9 $ 418.5 $ 411.5 $ 406.0 $ 402.0 $ 402.0
Deferred acquisition costs (in millions) 1Q10 2Q10 3Q10 4Q10 2010 1Q11 2Q11 3Q11 4Q11 2011
Balance, beginning of period $ 104.1 $ 108.3 $ 113.0 $ 122.2 $ 104.1 $ 126.8 $ 130.4 $ 135.0 $ 138.7 $ 126.8 Deferred acquisition expenses 8.8 8.6 14.1 9.6 41.1 8.6 9.0 9.0 8.9 35.5 Amortization related to operations (4.6 ) (3.9 ) (4.9 ) (5.0 ) (18.4 ) (5.0 ) (4.4 ) (5.3 ) (5.3 ) (20.0 )
Balance, end of period $ 108.3 $ 113.0 $ 122.2 $ 126.8 $ 126.8 $ 130.4 $ 135.0 $ 138.7 $ 142.3 $ 142.3

Page 13
Washington National Segment EBIT Summarized by In-F orce and New Business (6)
(in millions)
CNO Financial Group, Inc. EBIT from In-force Business 1Q10 2Q10 3Q10 4Q10 2010 1Q11 2Q11 3Q11 4Q11 2011
Revenues Insurance policy income $ 131.4 $ 130.9 $ 131.4 $ 132.3 $ 526.0 $ 131.9 $ 133.5 $ 132.1 $ 133.2 $ 530.7 Net investment income (loss) 45.4 45.9 46.4 47.7 185.4 46.3 46.7 47.3 49.2 189.5 Fee revenue and other income 0.3 0.2 0.3 0.3 1.1 0.3 0.2 0.4 0.1 1.0
Total revenues 177.1 177.0 178.1 180.3 712.5 178.5 180.4 179.8 182.5 721.2
Benefits and expenses Insurance policy benefits 106.5 110.9 106.8 103.3 427.5 106.6 112.9 113.3 109.2 442.0 Interest expense — — — — — — — 0.2 0.5 0.7 Amortization 11.2 10.2 11.3 11.3 44.0 12.7 10.6 10.2 8.6 42.1 Other operating costs and expenses 31.8 34.8 33.3 35.8 135.7 31.9 32.1 33.7 32.1 129.8
Total benefits and expenses 149.5 155.9 151.4 150.4 607.2 151.2 155.6 157.4 150.4 614.6 EBIT from In-Force Business $ 27.6 $ 21.1 $ 26.7 $ 29.9 $ 105.3 $ 27.3 $ 24.8 $ 22.4 $ 32.1 $ 106.6
EBIT from New Business
Revenues Insurance policy income $ 14.0 $ 13.8 $ 13.5 $ 13.7 $ 55.0 $ 13.5 $ 13.1 $ 13.8 $ 14.0 $ 54.4 Net investment income (loss) — — — — — — — — — — Fee revenue and other income — — — — — — — — — —
Total revenues 14.0 13.8 13.5 13.7 55.0 13.5 13.1 13.8 14.0 54.4
Benefits and expenses Insurance policy benefits 6.0 5.8 5.6 5.7 23.1 5.6 5.4 5.7 5.8 22.5 Interest expense — — — — — — — — — — Amortization 0.9 0.6 0.5 0.6 2.6 0.7 0.8 0.6 0.7 2.8 Other operating costs and expenses 7.7 8.9 8.0 9.6 34.2 10.2 9.9 8.7 10.8 39.6
Total benefits and expenses 14.6 15.3 14.1 15.9 59.9 16.5 16.1 15.0 17.3 64.9 EBIT from New Business $ (0.6 ) $ (1.5 ) $ (0.6 ) $ (2.2 ) $ (4.9 ) $ (3.0 ) $ (3.0 ) $ (1.2 ) $ (3.3 ) $ (10.5 )
EBIT from In-Force and New Business
Revenues Insurance policy income $ 145.4 $ 144.7 $ 144.9 $ 146.0 $ 581.0 $ 145.4 $ 146.6 $ 145.9 $ 147.2 $ 585.1 Net investment income (loss) 45.4 45.9 46.4 47.7 185.4 46.3 46.7 47.3 49.2 189.5 Fee revenue and other income 0.3 0.2 0.3 0.3 1.1 0.3 0.2 0.4 0.1 1.0
Total revenues 191.1 190.8 191.6 194.0 767.5 192.0 193.5 193.6 196.5 775.6
Benefits and expenses Insurance policy benefits 112.5 116.7 112.4 109.0 450.6 112.2 118.3 119.0 115.0 464.5 Interest expense — — — — — — — 0.2 0.5 0.7 Amortization 12.1 10.8 11.8 11.9 46.6 13.4 11.4 10.8 9.3 44.9 Other operating costs and expenses 39.5 43.7 41.3 45.4 169.9 42.1 42.0 42.4 42.9 169.4
Total benefits and expenses 164.1 171.2 165.5 166.3 667.1 167.7 171.7 172.4 167.7 679.5 EBIT from In-Force and New Business $ 27.0 $ 19.6 $ 26.1 $ 27.7 $ 100.4 $ 24.3 $ 21.8 $ 21.2 $ 28.8 $ 96.1

Page 14
CNO Financial Group, Inc.
Colonial Penn Analysis of income (loss) before taxes (in millions ) 1Q10 2Q10 3Q10 4Q10 2010 1Q11 2Q11 3Q11 4Q11 2011
Insurance policy income $ 48.2 $ 49.3 $ 48.8 $ 48.6 $ 194.9 $ 50.3 $ 50.9 $ 50.8 $ 51.0 $ 203.0 Net investment income on general account invested assets 9.7 9.7 9.9 10.0 39.3 10.3 10.5 10.1 10.2 41.1
Net realized investment gains 0.5 — 2.0 4.1 6.6 1.1 0.2 3.5 1.0 5.8
Fee revenue and other income 0.2 0.1 0.2 0.2 0.7 0.2 0.2 0.2 0.3 0.9
Total revenues 58.6 59.1 60.9 62.9 241.5 61.9 61.8 64.6 62.5 250.8
Insurance policy benefits 36.4 35.2 36.1 36.1 143.8 38.5 37.8 35.7 37.2 149.2
Amounts added to annuity and interest-sensitive life product account balances 0.3 0.2 0.3 0.2 1.0 0.2 0.2 0.3 0.2 0.9
Amortization related to operations 3.4 3.3 2.9 2.9 12.5 4.0 3.5 3.5 4.0 15.0 Other operating costs and expenses 22.1 17.8 17.4 16.1 73.4 23.8 19.6 22.9 18.3 84.6
Total benefits and expenses 62.2 56.5 56.7 55.3 230.7 66.5 61.1 62.4 59.7 249.7
Income (loss) before income taxes $ (3.6 ) $ 2.6 $ 4.2 $ 7.6 $ 10.8 $ (4.6 ) $ 0.7 $ 2.2 $ 2.8 $ 1.1
Average liabilities for insurance products (in mill ions) 1Q10 2Q10 3Q10 4Q10 2010 1Q11 2Q11 3Q11 4Q11 2011
Annuities - mortality based $ 79.9 $ 79.3 $ 79.2 $ 79.2 $ 79.4 $ 78.5 $ 77.8 $ 77.3 $ 77.1 $ 77.7 Supplemental health 18.3 17.7 17.5 17.1 17.6 16.6 16.3 16.1 15.8 16.2
Life: Interest sensitive 21.9 21.6 21.1 20.7 21.3 20.7 20.5 20.2 20.1 20.3
Non-interest sensitive 576.6 578.2 580.3 583.6 579.7 586.7 588.7 590.2 593.4 589.8
Total average liabilities for insurance products, net of reinsurance ceded $ 696.7 $ 696.8 $ 698.1 $ 700.6 $ 698.0 $ 702.5 $ 703.3 $ 703.8 $ 706.4 $ 704.0
Present value of future profits (in millions) 1Q10 2Q10 3Q10 4Q10 2010 1Q11 2Q11 3Q11 4Q11 2011
Balance, beginning of period $ 92.4 $ 89.4 $ 86.6 $ 84.0 $ 92.4 $ 81.7 $ 79.1 $ 76.9 $ 74.9 $ 81.7 Amortization related to operations (3.0 ) (2.8 ) (2.6 ) (2.3 ) (10.7 ) (2.6 ) (2.2 ) (2.0 ) (2.3 ) (9.1 )
Balance, end of period $ 89.4 $ 86.6 $ 84.0 $ 81.7 $ 81.7 $ 79.1 $ 76.9 $ 74.9 $ 72.6 $ 72.6
Deferred acquisition costs (in millions) 1Q10 2Q10 3Q10 4Q10 2010 1Q11 2Q11 3Q11 4Q11 2011
Balance, beginning of period $ 44.1 $ 45.9 $ 46.9 $ 48.0 $ 44.1 $ 48.5 $ 49.4 $ 50.4 $ 51.2 $ 48.5 Deferred acquisition expenses 2.2 1.5 1.4 1.1 6.2 2.3 2.3 2.3 2.0 8.9 Amortization related to operations (0.4 ) (0.5 ) (0.3 ) (0.6 ) (1.8 ) (1.4 ) (1.3 ) (1.5 ) (1.7 ) (5.9 )
Balance, end of period $ 45.9 $ 46.9 $ 48.0 $ 48.5 $ 48.5 $ 49.4 $ 50.4 $ 51.2 $ 51.5 $ 51.5
Page 15
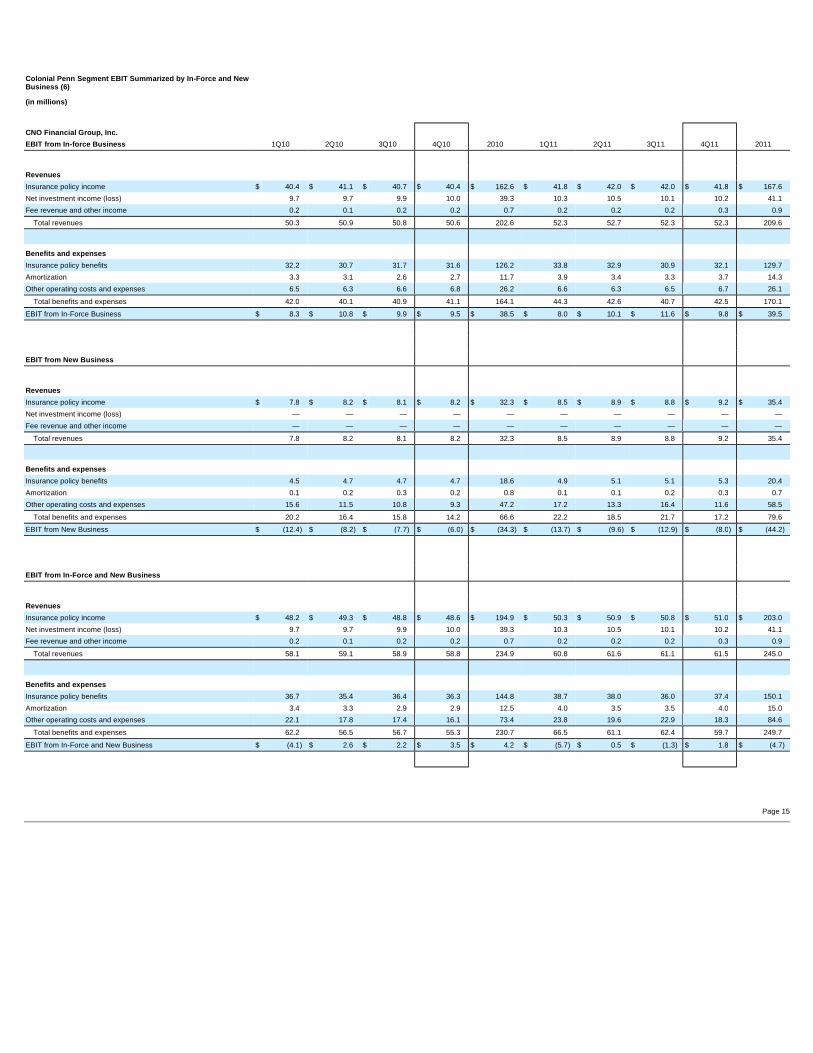
Colonial Penn Segment EBIT Summarized by In-Force a nd New Business (6)
(in millions)
CNO Financial Group, Inc. EBIT from In-force Business 1Q10 2Q10 3Q10 4Q10 2010 1Q11 2Q11 3Q11 4Q11 2011
Revenues Insurance policy income $ 40.4 $ 41.1 $ 40.7 $ 40.4 $ 162.6 $ 41.8 $ 42.0 $ 42.0 $ 41.8 $ 167.6 Net investment income (loss) 9.7 9.7 9.9 10.0 39.3 10.3 10.5 10.1 10.2 41.1 Fee revenue and other income 0.2 0.1 0.2 0.2 0.7 0.2 0.2 0.2 0.3 0.9
Total revenues 50.3 50.9 50.8 50.6 202.6 52.3 52.7 52.3 52.3 209.6
Benefits and expenses Insurance policy benefits 32.2 30.7 31.7 31.6 126.2 33.8 32.9 30.9 32.1 129.7 Amortization 3.3 3.1 2.6 2.7 11.7 3.9 3.4 3.3 3.7 14.3 Other operating costs and expenses 6.5 6.3 6.6 6.8 26.2 6.6 6.3 6.5 6.7 26.1
Total benefits and expenses 42.0 40.1 40.9 41.1 164.1 44.3 42.6 40.7 42.5 170.1 EBIT from In-Force Business $ 8.3 $ 10.8 $ 9.9 $ 9.5 $ 38.5 $ 8.0 $ 10.1 $ 11.6 $ 9.8 $ 39.5
EBIT from New Business
Revenues Insurance policy income $ 7.8 $ 8.2 $ 8.1 $ 8.2 $ 32.3 $ 8.5 $ 8.9 $ 8.8 $ 9.2 $ 35.4 Net investment income (loss) — — — — — — — — — — Fee revenue and other income — — — — — — — — — —
Total revenues 7.8 8.2 8.1 8.2 32.3 8.5 8.9 8.8 9.2 35.4
Benefits and expenses Insurance policy benefits 4.5 4.7 4.7 4.7 18.6 4.9 5.1 5.1 5.3 20.4 Amortization 0.1 0.2 0.3 0.2 0.8 0.1 0.1 0.2 0.3 0.7 Other operating costs and expenses 15.6 11.5 10.8 9.3 47.2 17.2 13.3 16.4 11.6 58.5
Total benefits and expenses 20.2 16.4 15.8 14.2 66.6 22.2 18.5 21.7 17.2 79.6 EBIT from New Business $ (12.4 ) $ (8.2 ) $ (7.7 ) $ (6.0 ) $ (34.3 ) $ (13.7 ) $ (9.6 ) $ (12.9 ) $ (8.0 ) $ (44.2 )
EBIT from In-Force and New Business
Revenues Insurance policy income $ 48.2 $ 49.3 $ 48.8 $ 48.6 $ 194.9 $ 50.3 $ 50.9 $ 50.8 $ 51.0 $ 203.0 Net investment income (loss) 9.7 9.7 9.9 10.0 39.3 10.3 10.5 10.1 10.2 41.1 Fee revenue and other income 0.2 0.1 0.2 0.2 0.7 0.2 0.2 0.2 0.3 0.9
Total revenues 58.1 59.1 58.9 58.8 234.9 60.8 61.6 61.1 61.5 245.0
Benefits and expenses Insurance policy benefits 36.7 35.4 36.4 36.3 144.8 38.7 38.0 36.0 37.4 150.1 Amortization 3.4 3.3 2.9 2.9 12.5 4.0 3.5 3.5 4.0 15.0 Other operating costs and expenses 22.1 17.8 17.4 16.1 73.4 23.8 19.6 22.9 18.3 84.6
Total benefits and expenses 62.2 56.5 56.7 55.3 230.7 66.5 61.1 62.4 59.7 249.7 EBIT from In-Force and New Business $ (4.1 ) $ 2.6 $ 2.2 $ 3.5 $ 4.2 $ (5.7 ) $ 0.5 $ (1.3 ) $ 1.8 $ (4.7 )

Page 16
CNO Financial Group, Inc.
Other CNO Business Analysis of income (loss) before taxes (in millions ) 1Q10 2Q10 3Q10 4Q10 2010 1Q11 2Q11 3Q11 4Q11 2011
Insurance policy income $ 74.8 $ 73.2 $ 75.7 $ 74.2 $ 297.9 $ 71.5 $ 72.5 $ 72.2 $ 73.8 $ 290.0 Net investment income (loss): General account invested assets 87.8 88.5 88.0 87.8 352.1 88.2 87.6 85.4 85.7 346.9 Fixed index products 3.9 (6.5 ) 6.2 6.2 9.8 5.0 (0.9 ) (8.4 ) 0.9 (3.4 )
Trading account income related to policyholder accounts 0.9 (1.6 ) 2.3 1.1 2.7 1.5 — (2.4 ) 1.5 0.6 Net realized investment gains (losses) 0.1 (5.0 ) (13.0 ) (9.7 ) (27.6 ) (1.0 ) 1.1 3.0 3.0 6.1 Total revenues 167.5 148.6 159.2 159.6 634.9 165.2 160.3 149.8 164.9 640.2 Insurance policy benefits 90.3 84.3 110.4 82.6 367.6 88.8 85.9 86.7 88.7 350.1 Insurance policy benefits - fair value changes in embedded derivative liabilities — — — — — — — 3.2 — 3.2 Amounts added to policyholder account balances:
Annuity products and interest-sensitive life products other than fixed index products 32.4 31.4 32.4 31.4 127.6 31.6 30.3 28.9 29.6 120.4
Fixed index products 10.6 0.5 6.3 8.4 25.8 7.1 3.0 (4.1 ) 3.4 9.4 Amortization related to operations 11.1 3.4 19.8 14.4 48.7 8.6 9.4 10.4 11.4 39.8 Amortization related to net realized investment gains (losses) (0.6 ) 1.0 (1.3 ) 2.2 1.3 (0.4 ) (0.3 ) 0.9 — 0.2 Amortization related to fair value changes in embedded derivative liabilities — — — — — — — (2.6 ) — (2.6 )
Interest expense on investment borrowings 5.0 5.0 5.1 4.9 20.0 4.9 5.0 5.3 5.1 20.3 Other operating costs and expenses 18.9 20.2 21.8 21.1 82.0 17.8 20.5 16.8 23.7 78.8 Total benefits and expenses 167.7 145.8 194.5 165.0 673.0 158.4 153.8 145.5 161.9 619.6 Income (loss) before income taxes $ (0.2 ) $ 2.8 $ (35.3 ) $ (5.4 ) $ (38.1 ) $ 6.8 $ 6.5 $ 4.3 $ 3.0 $ 20.6
Health underwriting margins (in millions) 1Q10 2Q10 3Q10 4Q10 2010 1Q11 2Q11 3Q11 4Q11 2011
Long-term care: Earned premium $ 7.7 $ 7.5 $ 7.5 $ 7.2 $ 29.9 $ 7.3 $ 7.0 $ 6.9 $ 6.4 $ 27.6 Benefit ratio before interest income on reserves 187.2 % 212.9 % 201.7 % 243.0 % 210.8 % 235.7 % 205.8 % 227.5 % 237.1 % 226.4 %
Interest-adjusted benefit ratio 96.8 % 128.0 % 116.9 % 155.1 % 123.8 % 148.0 % 106.4 % 126.1 % 127.8 % 127.3 %
Underwriting margin (earned premium plus interest income on reserves less policy benefits) $ 0.2 $ (2.1 ) $ (1.2 ) $ (4.0 ) $ (7.1 ) $ (3.5 ) $ (0.5 ) $ (1.8 ) $ (1.9 ) $ (7.7 )
Page 17
CNO Financial Group, Inc.
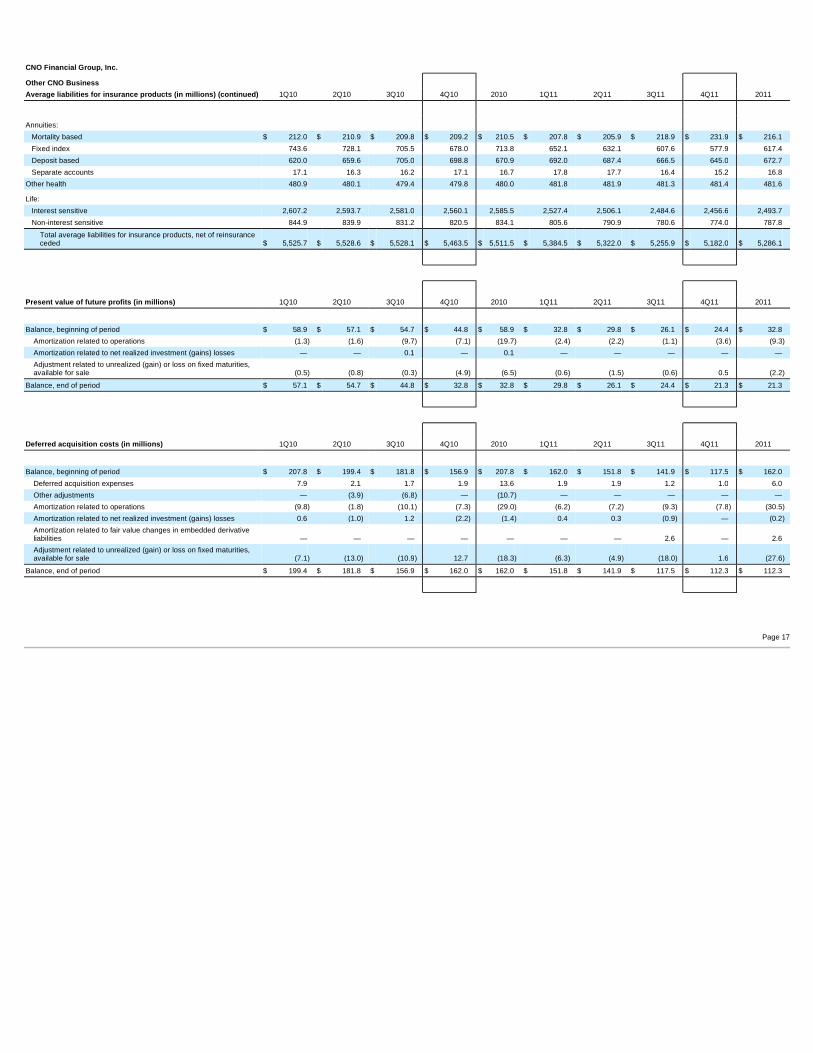
Other CNO Business Average liabilities for insurance products (in mill ions) (continued) 1Q10 2Q10 3Q10 4Q10 2010 1Q11 2Q11 3Q11 4Q11 2011
Annuities: Mortality based $ 212.0 $ 210.9 $ 209.8 $ 209.2 $ 210.5 $ 207.8 $ 205.9 $ 218.9 $ 231.9 $ 216.1 Fixed index 743.6 728.1 705.5 678.0 713.8 652.1 632.1 607.6 577.9 617.4 Deposit based 620.0 659.6 705.0 698.8 670.9 692.0 687.4 666.5 645.0 672.7 Separate accounts 17.1 16.3 16.2 17.1 16.7 17.8 17.7 16.4 15.2 16.8 Other health 480.9 480.1 479.4 479.8 480.0 481.8 481.9 481.3 481.4 481.6 Life: Interest sensitive 2,607.2 2,593.7 2,581.0 2,560.1 2,585.5 2,527.4 2,506.1 2,484.6 2,456.6 2,493.7 Non-interest sensitive 844.9 839.9 831.2 820.5 834.1 805.6 790.9 780.6 774.0 787.8
Total average liabilities for insurance products, net of reinsurance ceded $ 5,525.7 $ 5,528.6 $ 5,528.1 $ 5,463.5 $ 5,511.5 $ 5,384.5 $ 5,322.0 $ 5,255.9 $ 5,182.0 $ 5,286.1
Present value of future profits (in millions) 1Q10 2Q10 3Q10 4Q10 2010 1Q11 2Q11 3Q11 4Q11 2011
Balance, beginning of period $ 58.9 $ 57.1 $ 54.7 $ 44.8 $ 58.9 $ 32.8 $ 29.8 $ 26.1 $ 24.4 $ 32.8
Amortization related to operations (1.3 ) (1.6 ) (9.7 ) (7.1 ) (19.7 ) (2.4 ) (2.2 ) (1.1 ) (3.6 ) (9.3 )
Amortization related to net realized investment (gains) losses — — 0.1 — 0.1 — — — — — Adjustment related to unrealized (gain) or loss on fixed maturities, available for sale (0.5 ) (0.8 ) (0.3 ) (4.9 ) (6.5 ) (0.6 ) (1.5 ) (0.6 ) 0.5 (2.2 )
Balance, end of period $ 57.1 $ 54.7 $ 44.8 $ 32.8 $ 32.8 $ 29.8 $ 26.1 $ 24.4 $ 21.3 $ 21.3
Deferred acquisition costs (in millions) 1Q10 2Q10 3Q10 4Q10 2010 1Q11 2Q11 3Q11 4Q11 2011
Balance, beginning of period $ 207.8 $ 199.4 $ 181.8 $ 156.9 $ 207.8 $ 162.0 $ 151.8 $ 141.9 $ 117.5 $ 162.0
Deferred acquisition expenses 7.9 2.1 1.7 1.9 13.6 1.9 1.9 1.2 1.0 6.0 Other adjustments — (3.9 ) (6.8 ) — (10.7 ) — — — — — Amortization related to operations (9.8 ) (1.8 ) (10.1 ) (7.3 ) (29.0 ) (6.2 ) (7.2 ) (9.3 ) (7.8 ) (30.5 )
Amortization related to net realized investment (gains) losses 0.6 (1.0 ) 1.2 (2.2 ) (1.4 ) 0.4 0.3 (0.9 ) — (0.2 )
Amortization related to fair value changes in embedded derivative liabilities — — — — — — — 2.6 — 2.6 Adjustment related to unrealized (gain) or loss on fixed maturities, available for sale (7.1 ) (13.0 ) (10.9 ) 12.7 (18.3 ) (6.3 ) (4.9 ) (18.0 ) 1.6 (27.6 )
Balance, end of period $ 199.4 $ 181.8 $ 156.9 $ 162.0 $ 162.0 $ 151.8 $ 141.9 $ 117.5 $ 112.3 $ 112.3

Page 18
Other CNO Business Segment EBIT Summarized by In-Fo rce and New Business (6)
(in millions)
CNO Financial Group, Inc. EBIT from In-force Business 1Q10 2Q10 3Q10 4Q10 2010 1Q11 2Q11 3Q11 4Q11 2011
Revenues Insurance policy income $ 74.8 $ 73.2 $ 75.7 $ 74.2 $ 297.9 $ 71.5 $ 72.5 $ 72.2 $ 73.8 $ 290.0 Net investment income (loss) 92.6 80.4 96.5 95.1 364.6 94.7 86.7 74.6 88.1 344.1 Fee revenue and other income — — — — — — — — — —
Total revenues 167.4 153.6 172.2 169.3 662.5 166.2 159.2 146.8 161.9 634.1
Benefits and expenses Insurance policy benefits 133.3 116.2 149.1 122.4 521.0 127.5 119.2 111.5 121.7 479.9 Interest expense 5.0 5.0 5.1 4.9 20.0 4.9 5.0 5.3 5.1 20.3 Amortization 11.1 3.4 19.8 14.4 48.7 8.6 9.4 10.4 11.4 39.8 Other operating costs and expenses 18.9 20.2 21.8 21.1 82.0 17.8 20.5 16.8 23.7 78.8
Total benefits and expenses 168.3 144.8 195.8 162.8 671.7 158.8 154.1 144.0 161.9 618.8 EBIT from In-Force Business $ (.9 ) $ 8.8 $ (23.6 ) $ 6.5 $ (9.2 ) $ 7.4 $ 5.1 $ 2.8 $ — $ 15.3
EBIT from New Business
Revenues Insurance policy income $ — $ — $ — $ — $ — $ — $ — $ — $ — $ — Net investment income (loss) — — — — — — — — — — Fee revenue and other income — — — — — — — — — —
Total revenues — — — — — — — — — —
Benefits and expenses Insurance policy benefits — — — — — — — — — — Interest expense — — — — — — — — — — Amortization — — — — — — — — — — Other operating costs and expenses — — — — — — — — — —
Total benefits and expenses — — — — — — — — — — EBIT from New Business $ — $ — $ — $ — $ — $ — $ — $ — $ — $ —
EBIT from In-Force and New Business
Revenues Insurance policy income $ 74.8 $ 73.2 $ 75.7 $ 74.2 $ 297.9 $ 71.5 $ 72.5 $ 72.2 $ 73.8 $ 290.0 Net investment income (loss) 92.6 80.4 96.5 95.1 364.6 94.7 86.7 74.6 88.1 344.1 Fee revenue and other income — — — — — — — — — —
Total revenues 167.4 153.6 172.2 169.3 662.5 166.2 159.2 146.8 161.9 634.1
Benefits and expenses Insurance policy benefits 133.3 116.2 149.1 122.4 521.0 127.5 119.2 111.5 121.7 479.9 Interest expense 5.0 5.0 5.1 4.9 20.0 4.9 5.0 5.3 5.1 20.3 Amortization 11.1 3.4 19.8 14.4 48.7 8.6 9.4 10.4 11.4 39.8 Other operating costs and expenses 18.9 20.2 21.8 21.1 82.0 17.8 20.5 16.8 23.7 78.8
Total benefits and expenses 168.3 144.8 195.8 162.8 671.7 158.8 154.1 144.0 161.9 618.8 EBIT from In-Force and New Business $ (.9 ) $ 8.8 $ (23.6 ) $ 6.5 $ (9.2 ) $ 7.4 $ 5.1 $ 2.8 $ — $ 15.3

Page 19
CNO Financial Group, Inc.
Corporate Operations Analysis of loss before taxes (in millions) 1Q10 2Q10 3Q10 4Q10 2010 1Q11 2Q11 3Q11 4Q11 2011
Net investment income (loss): General account invested assets $ — $ 0.1 $ — $ — $ 0.1 $ — $ 0.9 $ 1.1 $ 1.0 $ 3.0 Other special-purpose portfolios 0.2 (3.2 ) 3.4 (1.9 ) (1.5 ) 8.2 (0.1 ) (13.7 ) (3.1 ) (8.7 )
Fee revenue and other income 0.5 0.4 0.4 0.3 1.6 0.4 0.2 0.3 0.4 1.3 Net operating results of variable interest entities 2.4 1.1 1.9 1.8 7.2 2.0 0.2 3.8 1.5 7.5 Interest expense on investment borrowings — — — — — — — (0.1 ) (0.1 ) (0.2 )
Other operating costs and expenses (8.1 ) (10.2 ) (18.0 ) (13.9 ) (50.2 ) (11.1 ) (12.5 ) (18.9 ) (8.1 ) (50.6 )
Corporate operations, excluding corporate interest expense (5.0 ) (11.8 ) (12.3 ) (13.7 ) (42.8 ) (0.5 ) (11.3 ) (27.5 ) (8.4 ) (47.7 )
Interest expense on corporate debt (19.5 ) (19.8 ) (20.0 ) (20.0 ) (79.3 ) (20.6 ) (19.3 ) (18.7 ) (17.7 ) (76.3 )
Loss before income taxes $ (24.5 ) $ (31.6 ) $ (32.3 ) $ (33.7 ) $ (122.1 ) $ (21.1 ) $ (30.6 ) $ (46.2 ) $ (26.1 ) $ (124.0 )
Page 20
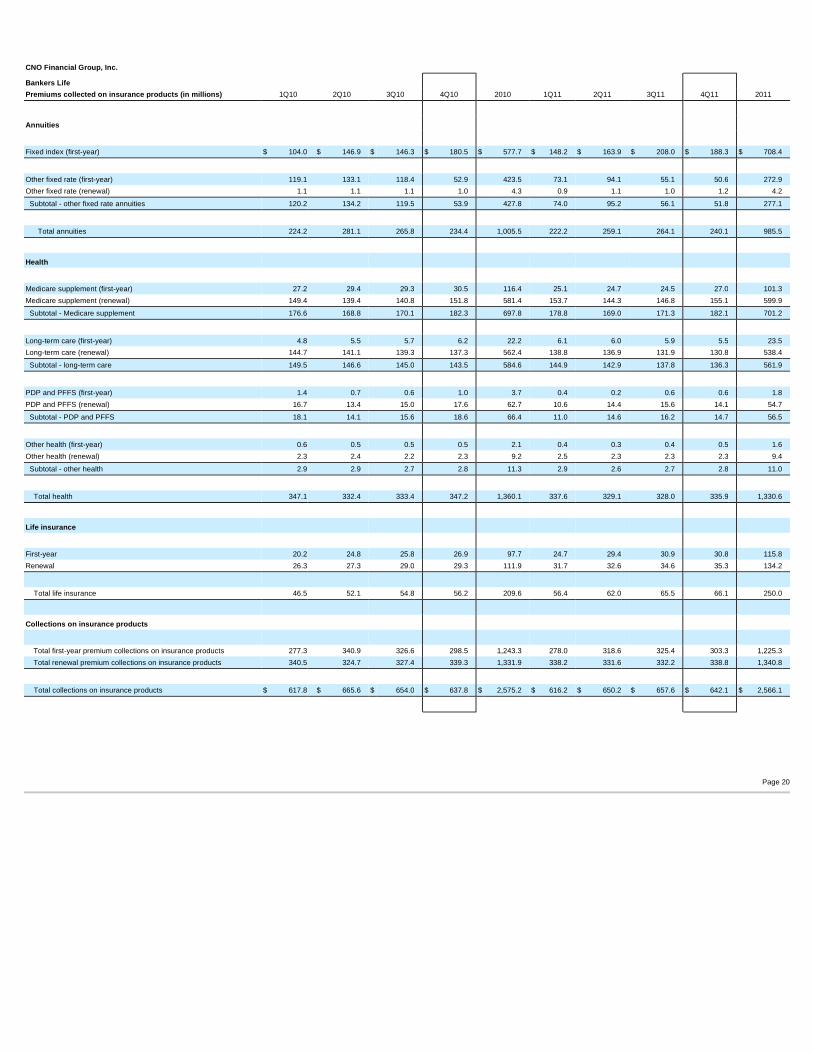
CNO Financial Group, Inc.
Bankers Life Premiums collected on insurance products (in millio ns) 1Q10 2Q10 3Q10 4Q10 2010 1Q11 2Q11 3Q11 4Q11 2011
Annuities
Fixed index (first-year) $ 104.0 $ 146.9 $ 146.3 $ 180.5 $ 577.7 $ 148.2 $ 163.9 $ 208.0 $ 188.3 $ 708.4 Other fixed rate (first-year) 119.1 133.1 118.4 52.9 423.5 73.1 94.1 55.1 50.6 272.9 Other fixed rate (renewal) 1.1 1.1 1.1 1.0 4.3 0.9 1.1 1.0 1.2 4.2 Subtotal - other fixed rate annuities 120.2 134.2 119.5 53.9 427.8 74.0 95.2 56.1 51.8 277.1 Total annuities 224.2 281.1 265.8 234.4 1,005.5 222.2 259.1 264.1 240.1 985.5
Health
Medicare supplement (first-year) 27.2 29.4 29.3 30.5 116.4 25.1 24.7 24.5 27.0 101.3 Medicare supplement (renewal) 149.4 139.4 140.8 151.8 581.4 153.7 144.3 146.8 155.1 599.9 Subtotal - Medicare supplement 176.6 168.8 170.1 182.3 697.8 178.8 169.0 171.3 182.1 701.2 Long-term care (first-year) 4.8 5.5 5.7 6.2 22.2 6.1 6.0 5.9 5.5 23.5 Long-term care (renewal) 144.7 141.1 139.3 137.3 562.4 138.8 136.9 131.9 130.8 538.4 Subtotal - long-term care 149.5 146.6 145.0 143.5 584.6 144.9 142.9 137.8 136.3 561.9 PDP and PFFS (first-year) 1.4 0.7 0.6 1.0 3.7 0.4 0.2 0.6 0.6 1.8 PDP and PFFS (renewal) 16.7 13.4 15.0 17.6 62.7 10.6 14.4 15.6 14.1 54.7 Subtotal - PDP and PFFS 18.1 14.1 15.6 18.6 66.4 11.0 14.6 16.2 14.7 56.5 Other health (first-year) 0.6 0.5 0.5 0.5 2.1 0.4 0.3 0.4 0.5 1.6 Other health (renewal) 2.3 2.4 2.2 2.3 9.2 2.5 2.3 2.3 2.3 9.4 Subtotal - other health 2.9 2.9 2.7 2.8 11.3 2.9 2.6 2.7 2.8 11.0 Total health 347.1 332.4 333.4 347.2 1,360.1 337.6 329.1 328.0 335.9 1,330.6
Life insurance
First-year 20.2 24.8 25.8 26.9 97.7 24.7 29.4 30.9 30.8 115.8 Renewal 26.3 27.3 29.0 29.3 111.9 31.7 32.6 34.6 35.3 134.2 Total life insurance 46.5 52.1 54.8 56.2 209.6 56.4 62.0 65.5 66.1 250.0
Collections on insurance products
Total first-year premium collections on insurance products 277.3 340.9 326.6 298.5 1,243.3 278.0 318.6 325.4 303.3 1,225.3 Total renewal premium collections on insurance products 340.5 324.7 327.4 339.3 1,331.9 338.2 331.6 332.2 338.8 1,340.8
Total collections on insurance products $ 617.8 $ 665.6 $ 654.0 $ 637.8 $ 2,575.2 $ 616.2 $ 650.2 $ 657.6 $ 642.1 $ 2,566.1

Page 21
CNO Financial Group, Inc.
Washington National Premiums collected on insurance products (in millio ns) 1Q10 2Q10 3Q10 4Q10 2010 1Q11 2Q11 3Q11 4Q11 2011
Health
Medicare supplement (first-year) $ 1.2 $ 1.1 $ 0.7 $ 0.8 $ 3.8 $ 0.6 $ 0.5 $ 0.4 $ 0.4 $ 1.9 Medicare supplement (renewal) 39.5 37.6 37.2 36.7 151.0 34.7 32.6 31.5 31.4 130.2 Subtotal - Medicare supplement 40.7 38.7 37.9 37.5 154.8 35.3 33.1 31.9 31.8 132.1 Supplemental health (first-year) 12.5 13.1 13.0 13.4 52.0 13.2 13.7 13.2 14.0 54.1 Supplemental health (renewal) 87.1 87.1 88.5 90.8 353.5 93.7 95.2 95.2 96.0 380.1 Subtotal - supplemental health 99.6 100.2 101.5 104.2 405.5 106.9 108.9 108.4 110.0 434.2 Other health (all renewal) 1.1 1.0 1.3 1.2 4.6 1.0 0.8 0.9 0.8 3.5 Total health 141.4 139.9 140.7 142.9 564.9 143.2 142.8 141.2 142.6 569.8
Life insurance
First-year 0.2 0.1 0.1 0.4 0.8 0.4 0.3 0.4 0.1 1.2 Renewal 4.2 3.7 3.7 3.8 15.4 3.9 3.6 3.7 3.6 14.8 Total life insurance 4.4 3.8 3.8 4.2 16.2 4.3 3.9 4.1 3.7 16.0
Collections on insurance products
Total first-year premium collections on insurance products 13.9 14.3 13.8 14.6 56.6 14.2 14.5 14.0 14.5 57.2 Total renewal premium collections on insurance products 131.9 129.4 130.7 132.5 524.5 133.3 132.2 131.3 131.8 528.6
Total collections on insurance products $ 145.8 $ 143.7 $ 144.5 $ 147.1 $ 581.1 $ 147.5 $ 146.7 $ 145.3 $ 146.3 $ 585.8

Page 22
CNO Financial Group, Inc.
Colonial Penn Premiums collected on insurance products (in millio ns) 1Q10 2Q10 3Q10 4Q10 2010 1Q11 2Q11 3Q11 4Q11 2011
Life insurance
First-year $ 7.9 $ 8.1 $ 8.1 $ 8.2 $ 32.3 $ 8.7 $ 8.6 $ 8.9 $ 9.2 $ 35.4 Renewal 39.4 38.6 38.8 38.6 155.4 40.7 39.9 40.3 40.1 161.0 Total life insurance 47.3 46.7 46.9 46.8 187.7 49.4 48.5 49.2 49.3 196.4
Health (all renewal)
Medicare supplement 1.5 1.6 1.4 1.5 6.0 1.3 1.4 1.3 1.2 5.2 Other health 0.1 0.1 0.1 0.1 0.4 0.2 0.1 0.1 0.1 0.5 Total health 1.6 1.7 1.5 1.6 6.4 1.5 1.5 1.4 1.3 5.7
Collections on insurance products
Total first-year premium collections on insurance products 7.9 8.1 8.1 8.2 32.3 8.7 8.6 8.9 9.2 35.4 Total renewal premium collections on insurance products 41.0 40.3 40.3 40.2 161.8 42.2 41.4 41.7 41.4 166.7
Total collections on insurance products $ 48.9 $ 48.4 $ 48.4 $ 48.4 $ 194.1 $ 50.9 $ 50.0 $ 50.6 $ 50.6 $ 202.1

Page 23
CNO Financial Group, Inc.
Other CNO Business Premiums collected on insurance products (in millio ns) 1Q10 2Q10 3Q10 4Q10 2010 1Q11 2Q11 3Q11 4Q11 2011
Annuities
Fixed index (first-year) $ 3.5 $ 2.0 $ 2.4 $ 2.4 $ 10.3 $ 2.7 $ 2.7 $ 2.2 $ 1.9 $ 9.5 Fixed index (renewal) 1.2 1.5 0.9 1.0 4.6 0.9 1.4 0.8 0.8 3.9 Subtotal - fixed index annuities 4.7 3.5 3.3 3.4 14.9 3.6 4.1 3.0 2.7 13.4 Other fixed rate (first-year) 0.2 0.5 0.2 — 0.9 0.4 1.6 0.1 — 2.1 Other fixed rate (renewal) 0.2 0.2 0.1 0.1 0.6 0.2 0.2 0.2 0.3 0.9 Subtotal - other fixed rate annuities 0.4 0.7 0.3 0.1 1.5 0.6 1.8 0.3 0.3 3.0 Total annuities 5.1 4.2 3.6 3.5 16.4 4.2 5.9 3.3 3.0 16.4
Health
Long-term care (all renewal) 7.7 7.5 7.1 6.9 29.2 7.4 7.0 6.5 6.1 27.0 Other health (all renewal) 0.7 0.7 0.5 0.6 2.5 0.2 0.2 0.2 0.2 0.8 Total health 8.4 8.2 7.6 7.5 31.7 7.6 7.2 6.7 6.3 27.8
Life insurance
First-year 0.6 0.7 0.6 0.4 2.3 0.4 0.9 0.3 0.5 2.1 Renewal 49.6 46.2 47.2 46.3 189.3 46.0 48.0 43.7 39.6 177.3 Total life insurance 50.2 46.9 47.8 46.7 191.6 46.4 48.9 44.0 40.1 179.4
Collections on insurance products
Total first-year premium collections on insurance products 4.3 3.2 3.2 2.8 13.5 3.5 5.2 2.6 2.4 13.7 Total renewal premium collections on insurance products 59.4 56.1 55.8 54.9 226.2 54.7 56.8 51.4 47.0 209.9
Total collections on insurance products $ 63.7 $ 59.3 $ 59.0 $ 57.7 $ 239.7 $ 58.2 $ 62.0 $ 54.0 $ 49.4 $ 223.6

Page 24
CNO Financial Group, Inc.
New Annualized Premiums ("NAP") (in millions)
Bankers Life 1Q10 2Q10 3Q10 4Q10 2010 1Q11 2Q11 3Q11 4Q11 2011
Medicare supplement $ 19.4 $ 21.0 $ 16.0 $ 31.8 $ 88.2 $ 18.3 $ 18.6 $ 19.4 $ 31.5 $ 87.8 Life 15.8 17.3 16.3 15.9 65.3 16.6 18.6 18.2 17.0 70.4 Long-term care 8.6 8.7 7.2 6.7 31.2 6.9 7.3 7.3 7.0 28.5 Annuity 13.7 17.0 15.8 14.2 60.7 13.4 15.6 15.9 14.3 59.2 Subtotal Bankers Life 57.5 64.0 55.3 68.6 245.4 55.2 60.1 60.8 69.8 245.9
Washington National
Supplemental health 14.6 17.5 18.0 17.5 67.6 15.7 17.9 18.6 18.9 71.1 Medicare supplement 1.1 0.7 0.4 0.8 3.0 0.5 0.4 0.3 0.3 1.5 Life 0.7 0.7 0.8 0.7 2.9 0.8 0.8 0.9 1.8 4.3 Annuity 0.3 0.2 0.2 0.2 0.9 0.2 0.3 0.2 0.2 0.9 Subtotal Washington National 16.7 19.1 19.4 19.2 74.4 17.2 19.4 20.0 21.2 77.8
Colonial Penn
Graded Life 13.1 12.2 11.5 9.5 46.3 13.6 12.8 12.7 12.3 51.4
Total NAP $ 87.3 $ 95.3 $ 86.2 $ 97.3 $ 366.1 $ 86.0 $ 92.3 $ 93.5 $ 103.3 $ 375.1

Page 25
CNO Financial Group, Inc. Statutory information - consolidated basis (7) (in millions) 1Q10 2Q10 3Q10 4Q10 2010 1Q11 2Q11 3Q11 4Q11 2011
Net gain from operations before interest expense and federal income taxes $ 55.6 $ 66.0 $ 97.3 $ 109.1 $ 328.0 $ 114.0 $ 92.9 $ 91.9 $ 132.8 $ 431.6 Interest expense on surplus debentures held by parent company 12.0 12.2 12.2 12.3 48.7 12.0 12.2 22.7 12.3 59.2
Net gain from operations before federal income taxes 43.6 53.8 85.1 96.8 279.3 102.0 80.7 69.2 120.5 372.4
Federal income tax expense (benefit) 4.3 7.6 1.6 4.3 17.8 0.6 2.0 3.7 3.0 9.3
Net gain from operations before net realized capital gains (losses) 39.3 46.2 83.5 92.5 261.5 101.4 78.7 65.5 117.5 363.1
Net realized capital gains (losses) (13.5 ) (10.2 ) (10.3 ) (45.6 ) (79.6 ) (15.0 ) 2.4 10.5 5.8 3.7
Net income $ 25.8 $ 36.0 $ 73.2 $ 46.9 $ 181.9 $ 86.4 $ 81.1 $ 76.0 $ 123.3 $ 366.8
Capital and surplus $ 1,418.5 $ 1,434.7 $ 1,443.1 $ 1,525.1 $ 1,525.1 $ 1,567.4 $ 1,551.5 $ 1,553.1 $ 1,578.1 $ 1,578.1 Asset valuation reserve (AVR) 46.0 61.9 78.6 71.3 71.3 97.7 116.5 143.2 168.4 168.4
Capital, surplus and AVR 1,464.5 1,496.6 1,521.7 1,596.4 1,596.4 1,665.1 1,668.0 1,696.3 1,746.5 1,746.5 Interest maintenance reserve (IMR) 308.6 319.5 343.9 428.1 428.1 448.3 475.8 507.1 552.0 552.0 Total statutory capital, surplus, AVR & IMR $ 1,773.1 $ 1,816.1 $ 1,865.6 $ 2,024.5 $ 2,024.5 $ 2,113.4 $ 2,143.8 $ 2,203.4 $ 2,298.5 $ 2,298.5

Notes (1) Excludes accumulated other comprehensive income (loss). (2) Shareholders' equity divided by common shares outstanding. (3) Assumes conversion of all convertible securities. (4) Management believes that an analysis of earnings before net realized investment gains (losses), fair value changes due to fluctuations in the interest rates used to discount embedded derivative
liabilities related to our fixed index annuities, corporate interest expense, loss on extinguishment of debt and taxes (“EBIT,” a non-GAAP financial measure) provides a clearer comparison of the operating results of the company quarter-over-quarter because these items are unrelated to the company's underlying fundamentals.
(5) Management believes that an analysis of Net income applicable to common stock before: (i) loss on extinguishment of debt, net of income taxes; (ii) net realized investment gains or losses, net of
related amortization and income taxes; and (iii) fair value changes due to fluctuations in the interest rates used to discount embedded derivative liabilities related to our fixed index annuities, net of related amortization and income taxes (“Net operating income,” a non-GAAP financial measure) is important to evaluate the financial performance of the company, and is a key measure commonly used in the life insurance industry. Management uses this measure to evaluate performance because the items excluded from net operating income can be affected by events that are unrelated to the company's underlying fundamentals. The impact of fair value changes in embedded derivative liabilities caused by interest rate fluctuations was insignificant in prior periods. Prior to June 30, 2011, certain of our trading securities were held to offset the income statement volatility caused by the effect of interest rate fluctuations on the value of embedded derivatives related to our fixed index annuity products. During 2Q2011, these securities were sold.
(6) Management believes that an analysis of EBIT, separated between in-force and new business provides increased clarity around the value drivers of our business, particularly since the new business
results are significantly impacted by the rate of sales, mix of business and the distribution channel through which new sales are made. EBIT from new business includes pre-tax revenues and expenses associated with new sales of our insurance products during the first year after the sale is completed. EBIT from in-force business includes all pre-tax revenues and expenses associated with sales of insurance products that were completed more than one year before the end of the reporting period. The allocation of certain revenues and expenses between new and in-force business is based on estimates, which we believe are reasonable.
(7) Based on statutory accounting practices prescribed or permitted by regulatory authorities for CNO Financial's insurance subsidiaries after appropriate elimination of intercompany accounts among such
subsidiaries. Such accounting practices differ from GAAP.
Page 26
Related Documents