CMV Studies: Crash Causation and Safety Belt Use Tapan K. Datta, Ph.D., P.E. Professor Wayne State University Transportation Research Group March 13, 2007

CMV Studies: Crash Causation and Safety Belt Use
Dec 31, 2015
CMV Studies: Crash Causation and Safety Belt Use. Tapan K. Datta, Ph.D., P.E. Professor Wayne State University Transportation Research Group March 13, 2007. Crash Statistics in Michigan. Source: www.michigantrafficcrashfacts. org. - PowerPoint PPT Presentation
Welcome message from author
This document is posted to help you gain knowledge. Please leave a comment to let me know what you think about it! Share it to your friends and learn new things together.
Transcript
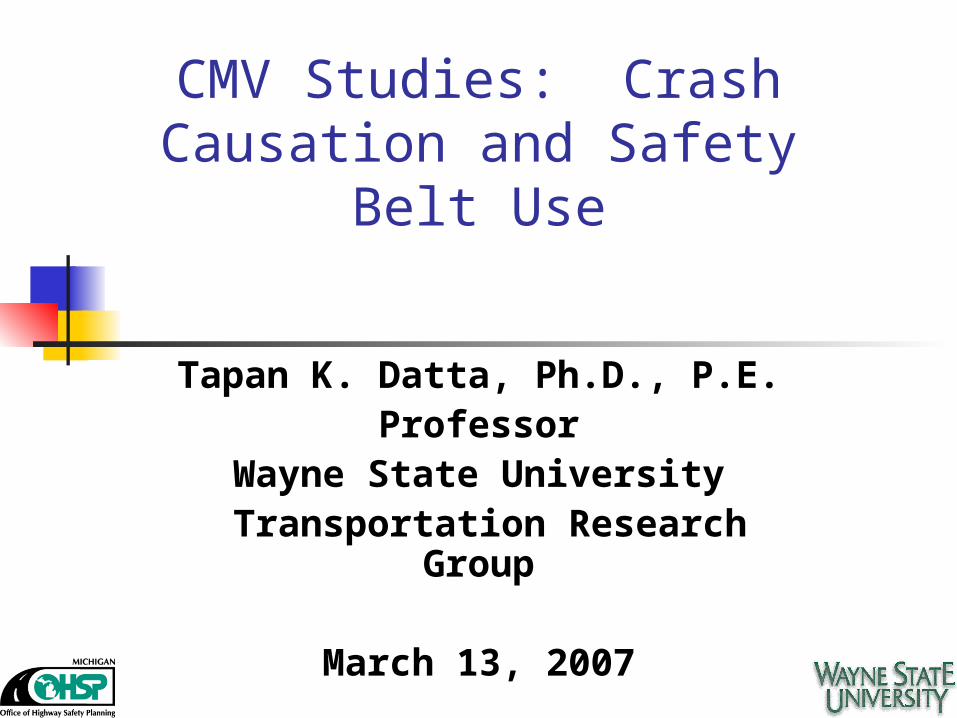
CMV Studies: Crash Causation and Safety Belt
Use
Tapan K. Datta, Ph.D., P.E.Professor
Wayne State University Transportation Research
Group
March 13, 2007
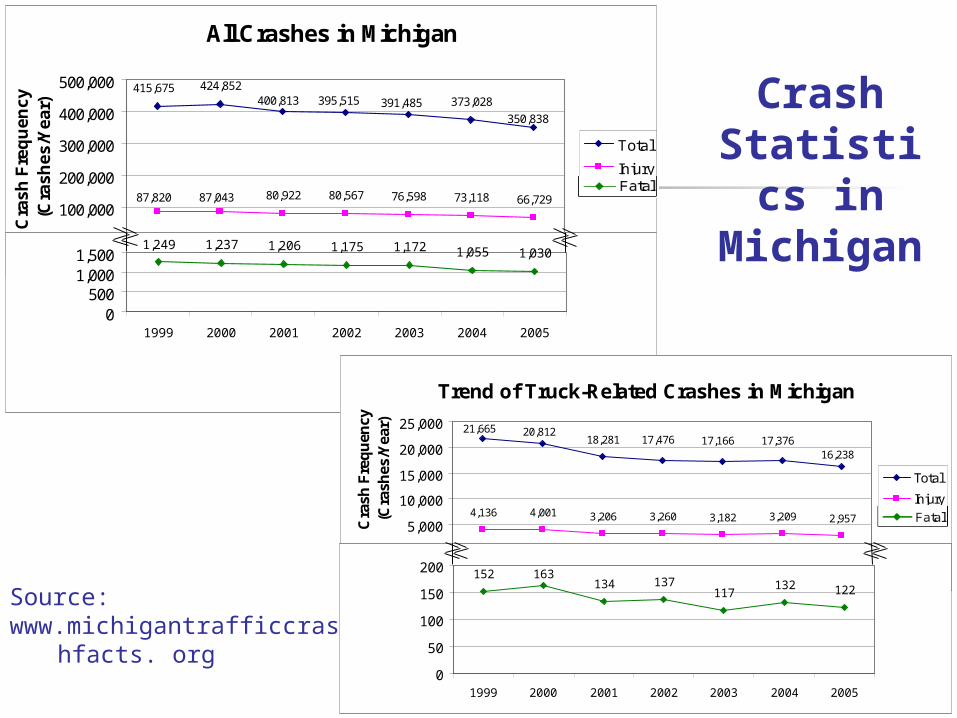
All Crashes in Michigan
424,852373,028
80,922 80,567 76,598 73,118 66,729
415,675400,813 395,515 391,485
350,838
87,820 87,043
0
100,000
200,000
300,000
400,000
500,000
1999 2000 2001 2002 2003 2004 2005
Cra
sh
Fre
qu
en
cy
(C
ras
he
s/Y
ea
r)
Total
Injury
1,249 1,237 1,206 1,175 1,172 1,055 1,030
0500
1,0001,500
1999 2000 2001 2002 2003 2004 2005
Trend of Truck-Related Crashes in Michigan
18,281
4,136 4,001 3,206 3,260 3,182 3,209 2,957
16,23817,37617,16617,476
20,81221,665
0
5,000
10,000
15,000
20,000
25,000
1999 2000 2001 2002 2003 2004 2005
Cra
sh F
req
uen
cy
(Cra
shes
/Yea
r)
Total
Injury
152134 137
117132 122
163
0
50
100
150
200
1999 2000 2001 2002 2003 2004 2005
Crash Statistic
s in Michiga
n
Source: www.michigantrafficcrashfa
cts. org
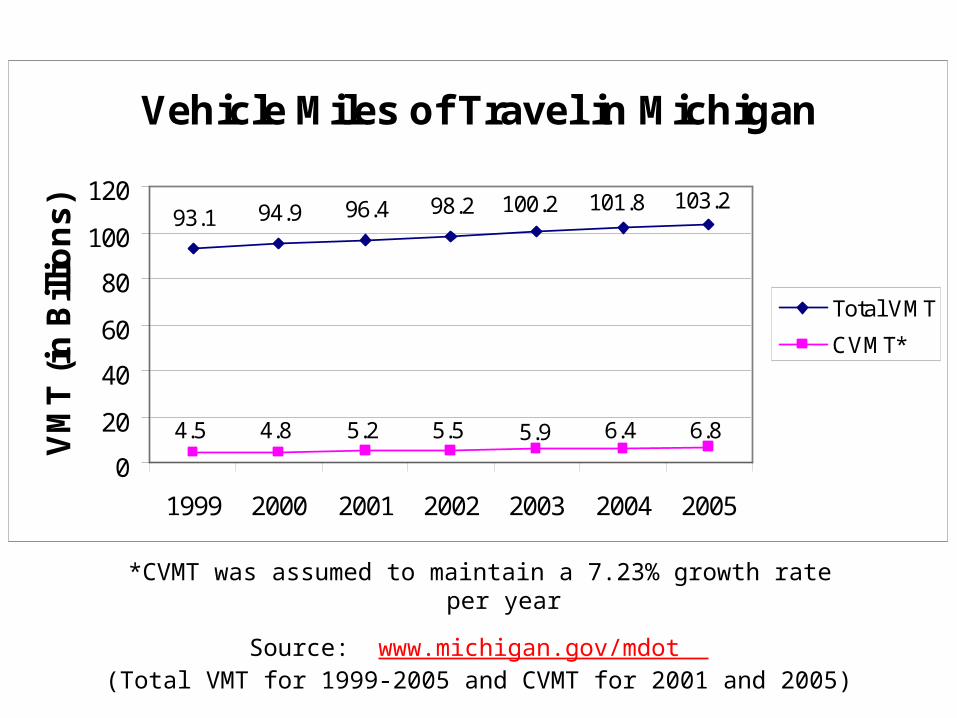
Source: www.michigan.gov/mdot (Total VMT for 1999-2005 and CVMT for 2001 and 2005)
Vehicle Miles of Travel in Michigan
93.1 94.9 96.4 98.2 100.2 101.8 103.2
4.5 4.8 5.2 5.5 5.9 6.4 6.8
0
20
40
60
80
100
120
1999 2000 2001 2002 2003 2004 2005
VM
T (
in B
illio
ns
)
Total VMT
CVMT*
*CVMT was assumed to maintain a 7.23% growth rate per year
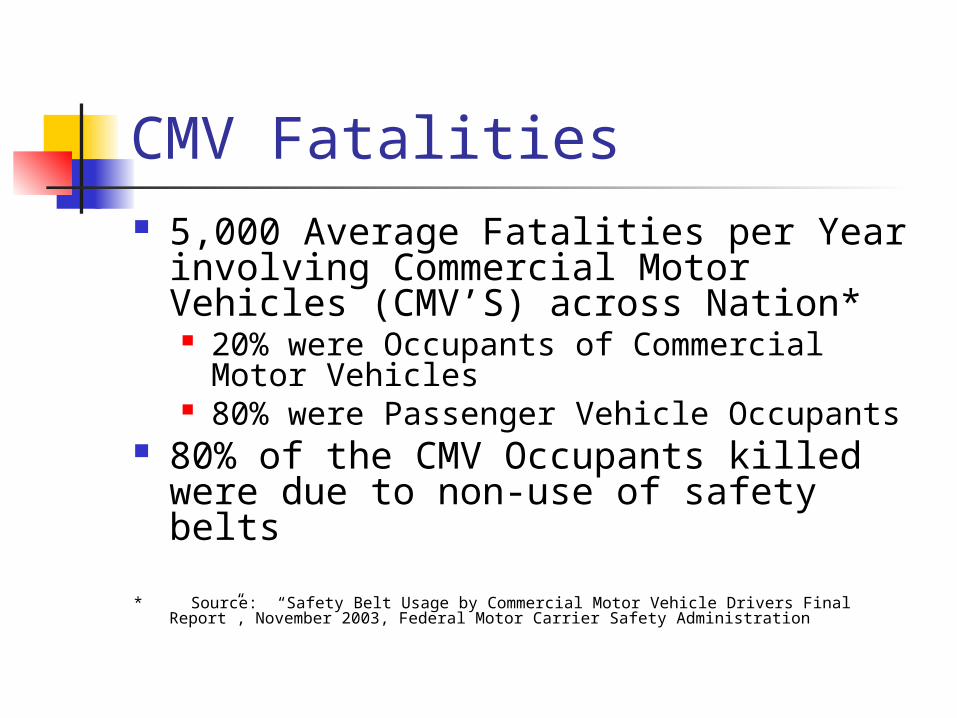
CMV Fatalities 5,000 Average Fatalities per Year
involving Commercial Motor Vehicles (CMV’S) across Nation* 20% were Occupants of Commercial Motor
Vehicles 80% were Passenger Vehicle Occupants
80% of the CMV Occupants killed were due to non-use of safety belts
* Source: “Safety Belt Usage by Commercial Motor Vehicle Drivers Final Report”, November 2003, Federal Motor Carrier Safety Administration

WSU’s 2004 Truck Safety Study
Phase I- Meta Analysis Review and synthesize the literature on truck
safety for long-term impacts of: Driver training, enforcement and regulations
Identify technology options Phase II- Evaluation Plans for:
Specialized Truck Enforcement Team (STET) Program Driver Performance Measurement (DPM) Program Decision Driving Course Program Safety Audit Program
Review and synthesize the literature on evaluation studies
Identify data needs to conduct evaluation studies

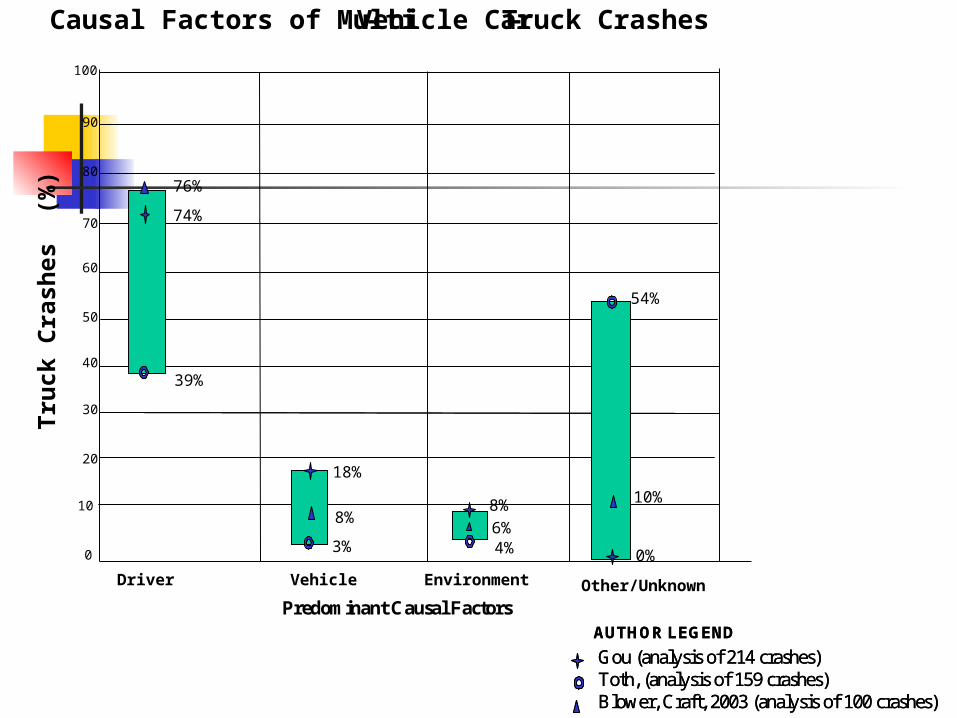
CMV Crash Causation
Percent of incidents due to drivers’ faults is greater than vehicle defects, environment or other causes Gou, et. al. study in Montreal, Quebec,
1999 Toth, et. al. study in the USA, 2003 Craft & Blower study in the USA, 2003
Tru
ck C
rash
es (
%)
0
10
20
30
40
50
60
Causal Factors of Multi-Vehicle Car-Truck Crashes
70
80
90
100
Driver Vehicle
10%
Environment Other/Unknown
54%
74%
76%
39%
3%6%
18%
8%
4%
8%
0%
AUTHOR LEGEND
Gou (analysis of 214 crashes) Toth, (analysis of 159 crashes) Blower, Craft, 2003 (analysis of 100 crashes)
AUTHOR LEGEND
Gou (analysis of 214 crashes) Toth, (analysis of 159 crashes) Blower, Craft, 2003 (analysis of 100 crashes)
Predominant Causal Factors

The following predominant causes of car-truck crashes were identified from the state-of-the-art review Excessive Speeding Driver Inattention Following too closely Failure to stop/yield Failure to stay in lane/improper merge Driver Fatigue
CMV Crash Causation

Safety Belt Usage for CMV Drivers Study conducted by USDOT and FMCSA in 2003 12 State Sample (not including
Michigan) One County Group from each State 117 Observation Sites
2003 CMV Safety Belt Use Study
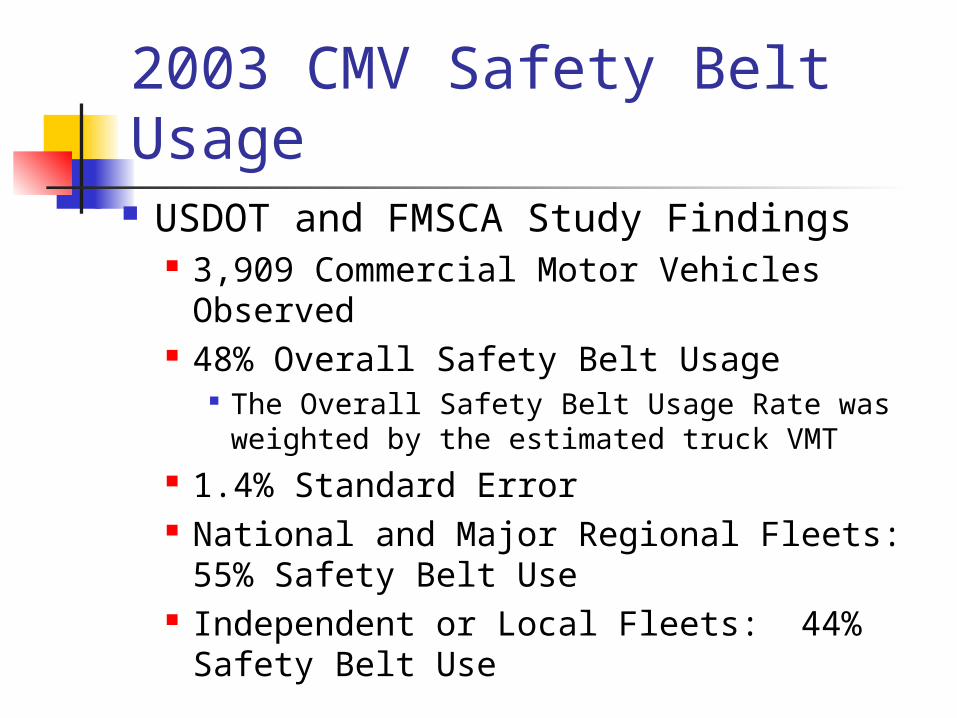
USDOT and FMSCA Study Findings 3,909 Commercial Motor Vehicles
Observed 48% Overall Safety Belt Usage
The Overall Safety Belt Usage Rate was weighted by the estimated truck VMT
1.4% Standard Error National and Major Regional Fleets:
55% Safety Belt Use Independent or Local Fleets: 44%
Safety Belt Use
2003 CMV Safety Belt Usage
WSU’s 2006 CMV Safety Belt Use Study
Determine CMV Driver and Passenger Safety Belt Use
Direct Observational Surveys Safety Belt Use and Misuse Geographic Characteristics Demographic Characteristics
Sample Size
Followed NHTSA Criteria for Passenger Vehicle Safety Belt Observations
32-county sample representing 86.86% of Michigan’s population
3 additional counties representing the UP were also added to the sample
County Partitioning
Counties Partitioned into 5 Strata Based upon Previous Safety Belt Criteria, Total Vehicle Miles of Travel as well as Commercial Vehicle Miles of Travel (CVMT)
Number of Observations per Strata Based upon % of CVMT
Study Locations
Locations Randomly Selected Freeway Exit/Entrance Ramps Truck Stops Truck Parking Lots Rest Areas Signalized Intersections
Weigh Stations avoided due to Police/ Weigh Master Presence
Observational Surveys
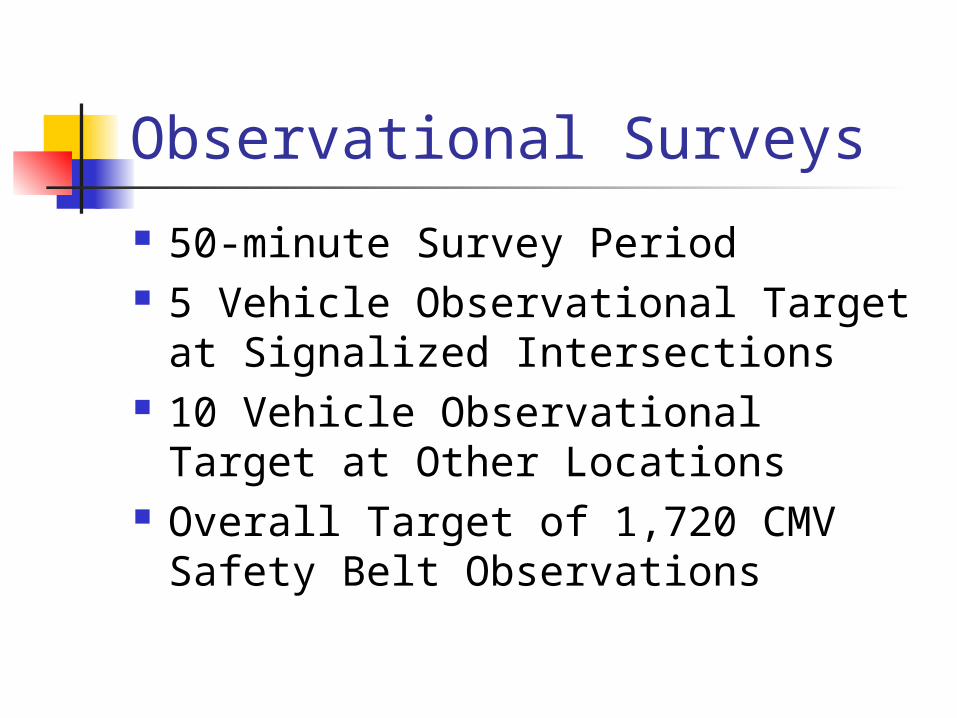
50-minute Survey Period 5 Vehicle Observational Target at
Signalized Intersections 10 Vehicle Observational Target at
Other Locations Overall Target of 1,720 CMV Safety
Belt Observations

Observer Training
One-Day Training Course on Safety Belt Observations Conducted at WSU-TRG Facilities
5-Day Field Data Collection Training on CMV Safety Belt Observations
QA/QC, Repeatability and Reliability Study

Data Collection
Timelines March 6 through April 15, 2006 Sunday through Saturday 7 am through 7 pm Equal Probability of being included in
the sample

Data Collection Vehicle Data
Collected Vehicle Type Ownership Range Type of Cargo Carrier Name License Plate,
State of Registration
Driver and Passenger Data Collected Safety Belt Use
and Misuse Gender Age Ethnicity

Data Collection
181 Locations Observed 2,528 CMV’s Observed 2,644 Drivers and Passengers
Observed 21 Locations did not have CMV
Traffic at the Time of Observation Alternate Locations were utilized
Findings of Observational Survey Overall Weighted Safety Belt Use was
calculated by summing the product of the stratum safety belt use rate and the stratum weight by the sum of the strata weights
Each stratum weight was determined by dividing the estimate CVMT in the stratum by the highest estimated CVMT for all the strata
The 95 percent confidence band were calculated by multiplying 1.96 by the square root of the variance
The standard error was equal to the square root of the variance
The relative error was calculated by dividing the standard error by the weighted overall safety belt use rate
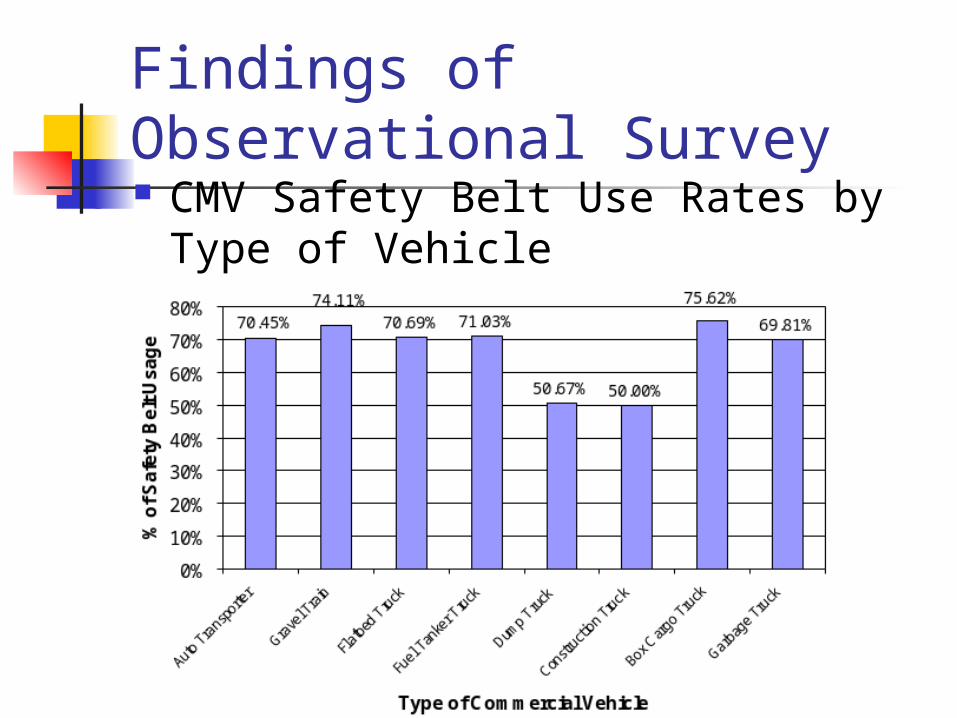
Findings of Observational Survey CMV Safety Belt Use Rates by Type
of Vehicle
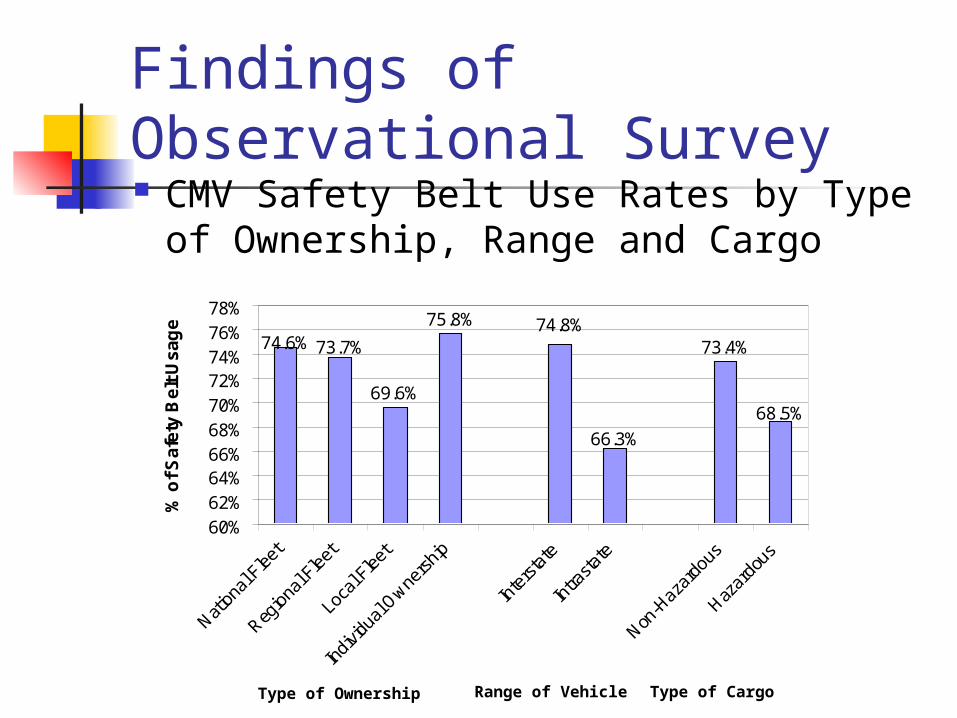
Findings of Observational Survey CMV Safety Belt Use Rates by Type
of Ownership, Range and Cargo
69.6%
75.8%
73.4%74.8%
73.7%74.6%
68.5%
66.3%
60%62%64%66%68%70%72%74%76%78%
Nation
al F
leet
Regio
nal F
leet
Loca
l Fle
et
Indi
vidua
l Owne
rship
Inte
rsta
te
Intra
state
Non-H
azar
dous
Hazar
dous
% o
f S
afe
ty B
elt
Us
ag
e
Type of Ownership Range of Vehicle Type of Cargo
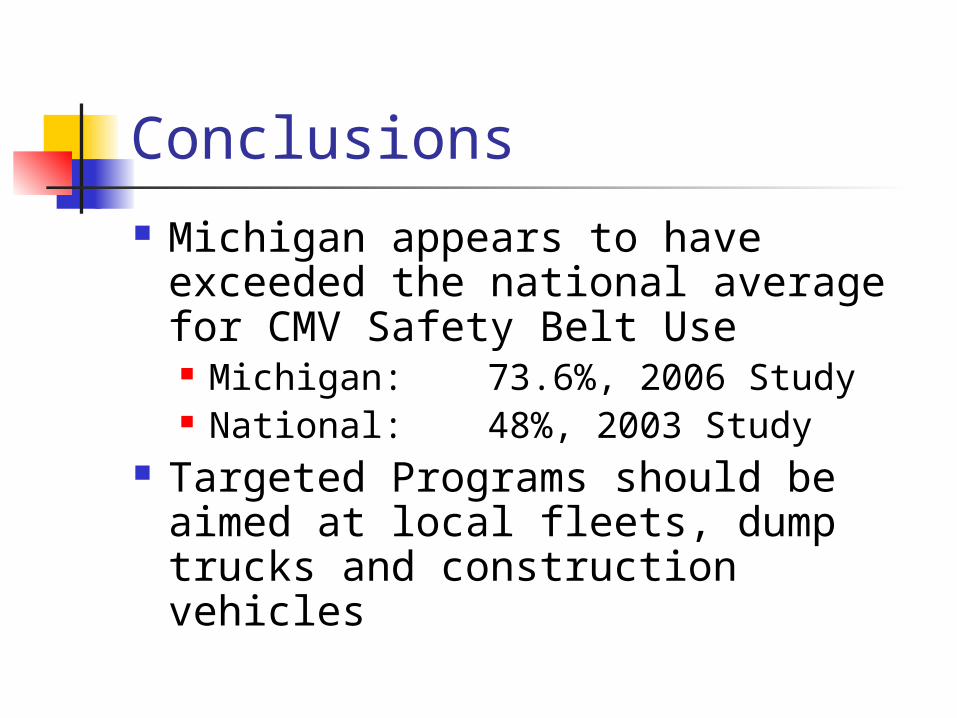
Conclusions Michigan appears to have
exceeded the national average for CMV Safety Belt Use Michigan: 73.6%, 2006 Study National: 48%, 2003 Study
Targeted Programs should be aimed at local fleets, dump trucks and construction vehicles
Related Documents