CMU SCS Sensor data mining and forecasting Christos Faloutsos CMU [email protected].
Dec 21, 2015
Welcome message from author
This document is posted to help you gain knowledge. Please leave a comment to let me know what you think about it! Share it to your friends and learn new things together.
Transcript

Telcordia 2003 C. Faloutsos 2
CMU SCS
Outline
• Problem definition - motivation
• Linear forecasting - AR and AWSOM
• Coevolving series - MUSCLES
• Fractal forecasting - F4
• Other projects– graph modeling, outliers etc
Telcordia 2003 C. Faloutsos 3
CMU SCS
Problem definition
• Given: one or more sequences x1 , x2 , … , xt , …
(y1, y2, … , yt, …
… )
• Find – forecasts; patterns– clusters; outliers
Telcordia 2003 C. Faloutsos 4
CMU SCS
Motivation - Applications• Financial, sales, economic series
• Medical
– ECGs +; blood pressure etc monitoring
– reactions to new drugs
– elderly care

Telcordia 2003 C. Faloutsos 5
CMU SCS
Motivation - Applications (cont’d)
• ‘Smart house’
– sensors monitor temperature, humidity, air quality
• video surveillance
Telcordia 2003 C. Faloutsos 6
CMU SCS
Motivation - Applications (cont’d)
• civil/automobile infrastructure
– bridge vibrations [Oppenheim+02]
– road conditions / traffic monitoring

Telcordia 2003 C. Faloutsos 7
CMU SCS
Stream Data: automobile traffic
Automobile traffic
0200400600800
100012001400160018002000
time
# cars
Telcordia 2003 C. Faloutsos 8
CMU SCS
Motivation - Applications (cont’d)
• Weather, environment/anti-pollution
– volcano monitoring
– air/water pollutant monitoring
Telcordia 2003 C. Faloutsos 9
CMU SCS
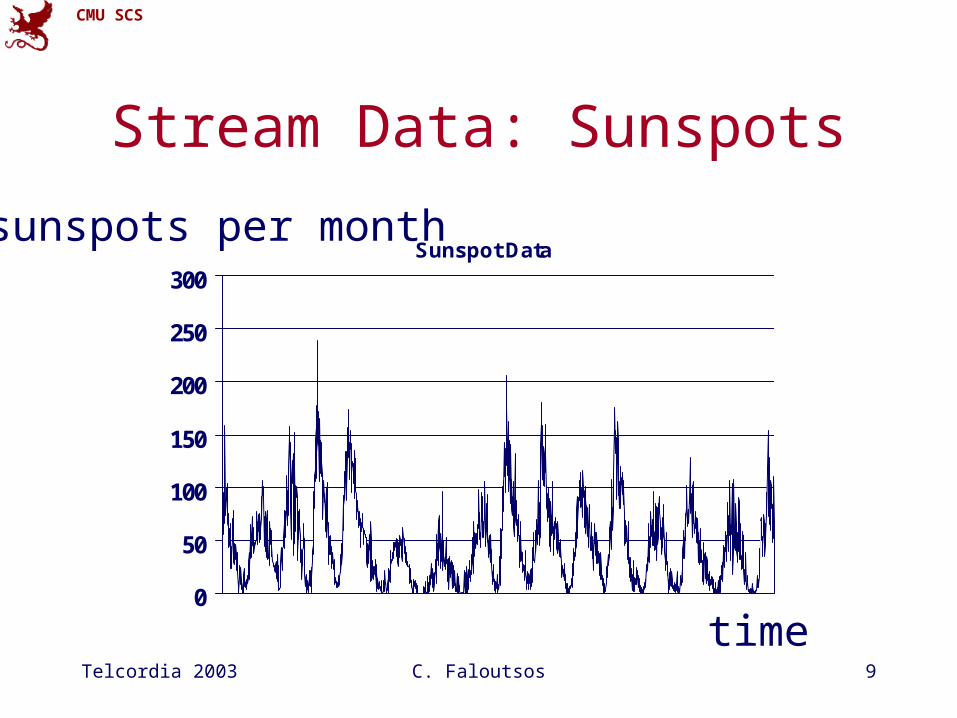
Stream Data: Sunspots
Sunspot Data
0
50
100
150
200
250
300
time
#sunspots per month

Telcordia 2003 C. Faloutsos 10
CMU SCS
Motivation - Applications (cont’d)
• Computer systems
– ‘Active Disks’ (buffering, prefetching)
– web servers (ditto)
– network traffic monitoring
– ...
Telcordia 2003 C. Faloutsos 11
CMU SCS
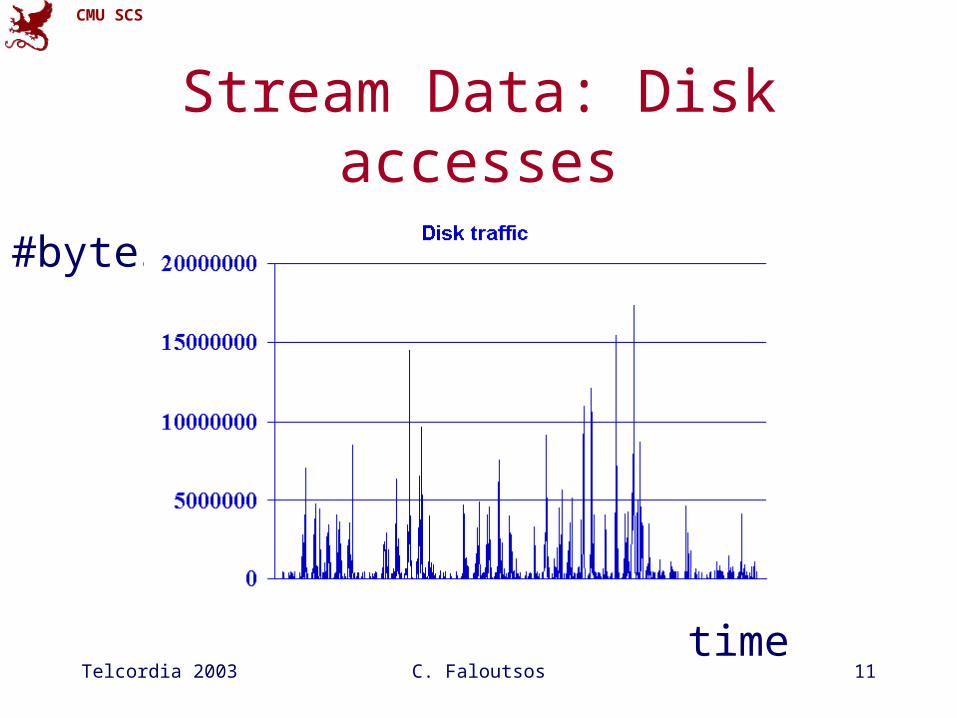
Stream Data: Disk accesses
time
#bytes

Telcordia 2003 C. Faloutsos 12
CMU SCS
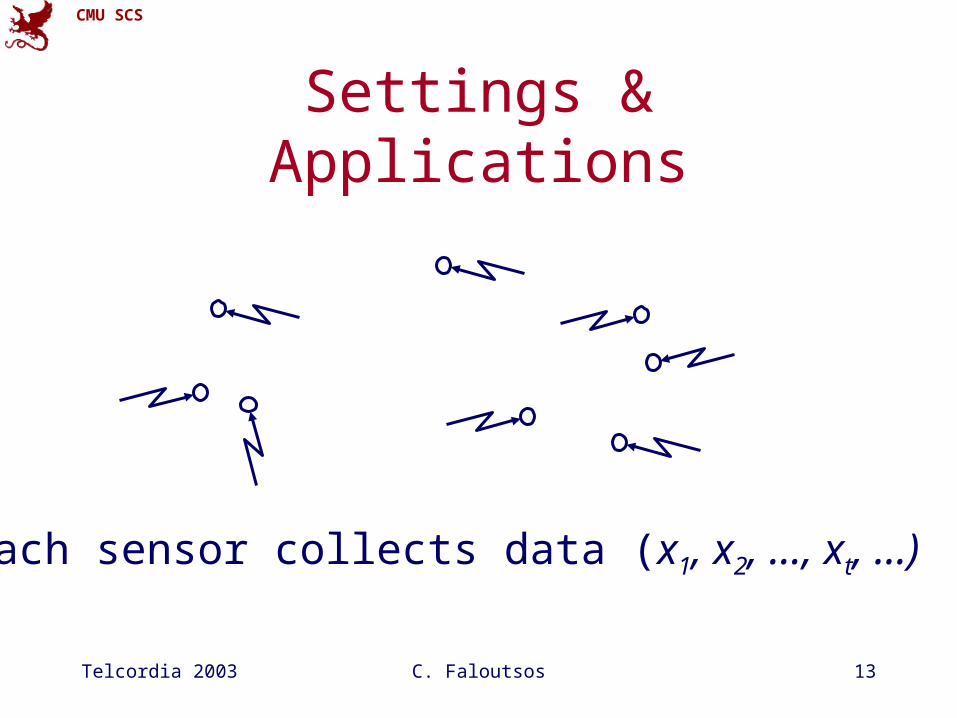
Settings & Applications
• One or more sensors, collecting time-series data
Telcordia 2003 C. Faloutsos 13
CMU SCS
Settings & Applications
Each sensor collects data (x1, x2, …, xt, …)

Telcordia 2003 C. Faloutsos 14
CMU SCS
Settings & Applications
Sensors ‘report’ to a central site
Telcordia 2003 C. Faloutsos 15
CMU SCS
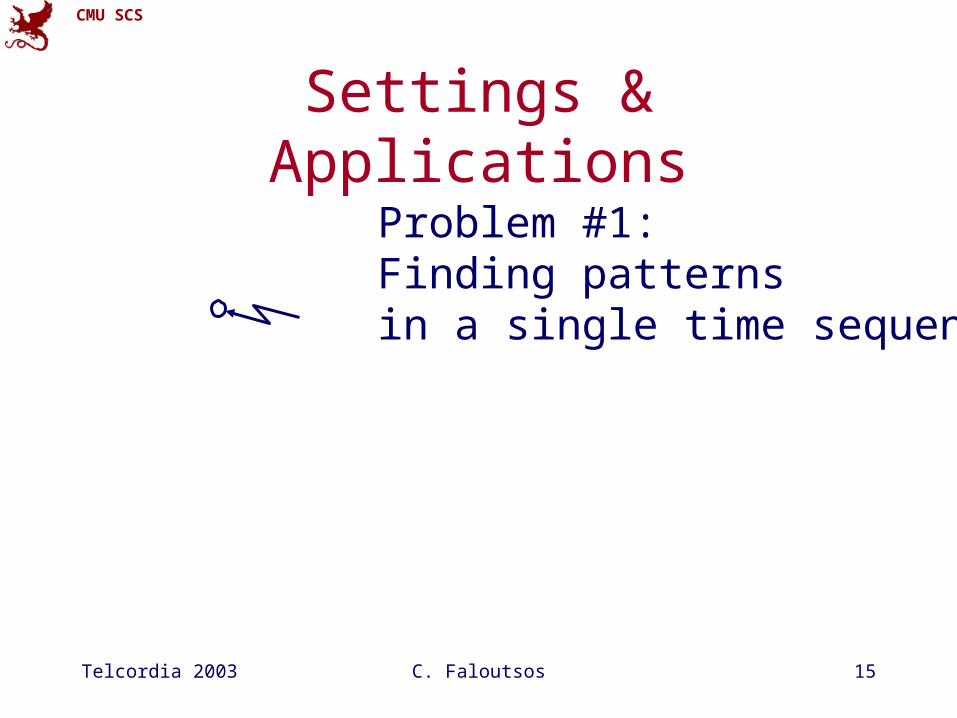
Settings & Applications
Problem #1:Finding patternsin a single time sequence
Telcordia 2003 C. Faloutsos 16
CMU SCS
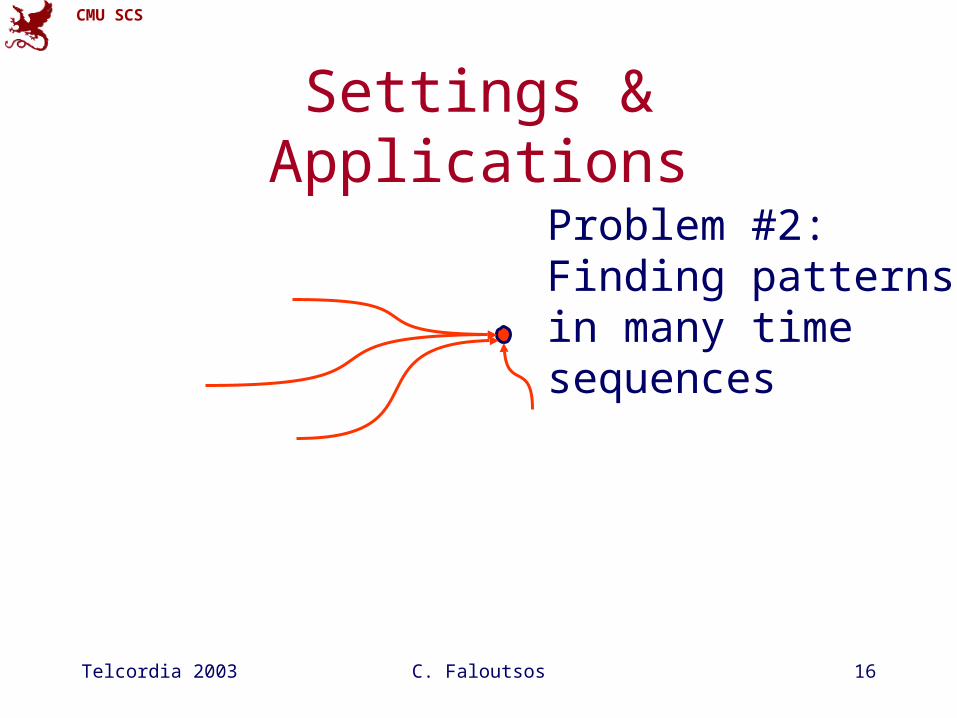
Settings & Applications
Problem #2:Finding patternsin many time sequences
Telcordia 2003 C. Faloutsos 17
CMU SCS
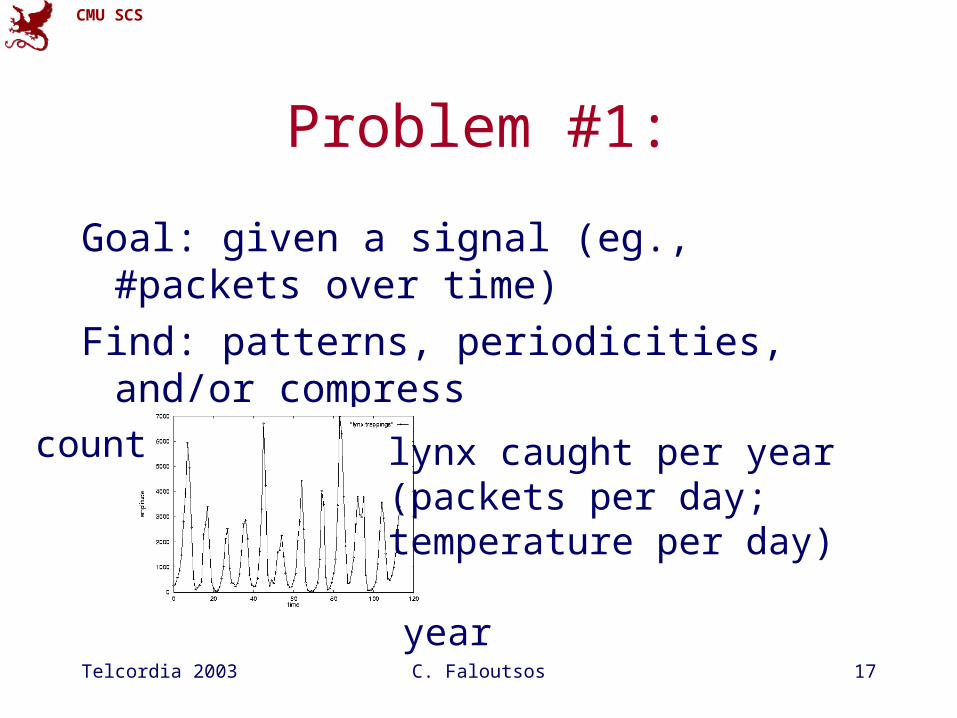
Problem #1:
Goal: given a signal (eg., #packets over time)
Find: patterns, periodicities, and/or compress
year
count lynx caught per year(packets per day;temperature per day)
Telcordia 2003 C. Faloutsos 18
CMU SCS
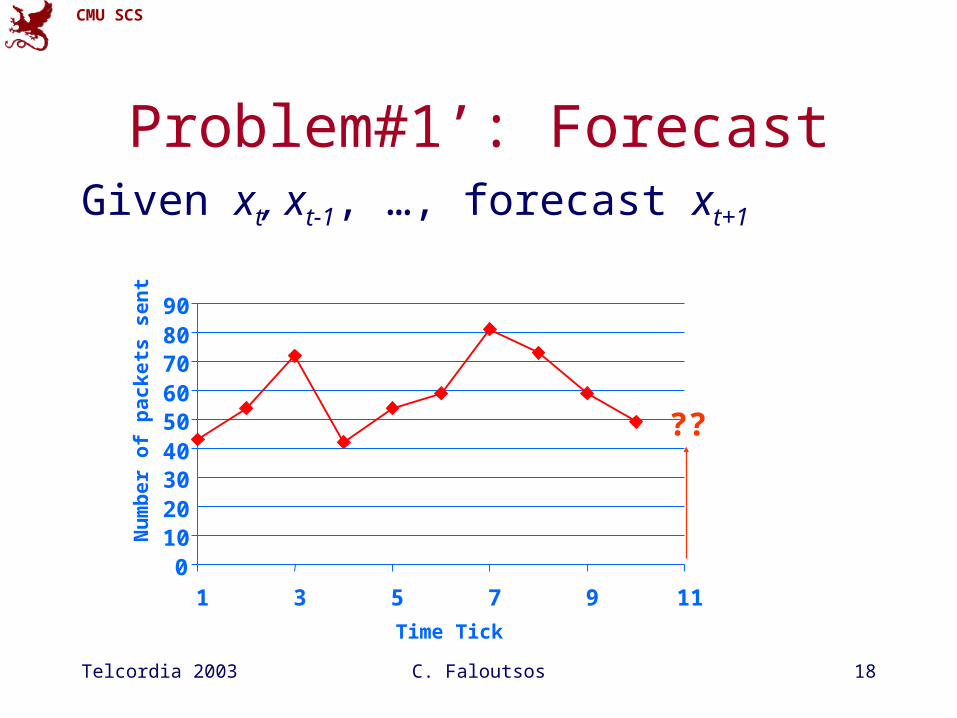
Problem#1’: ForecastGiven xt, xt-1, …, forecast xt+1
0102030405060708090
1 3 5 7 9 11
Time Tick
Nu
mb
er o
f p
ack
ets
sen
t
??

Telcordia 2003 C. Faloutsos 19
CMU SCS
Problem #2:• Given: A set of correlated time sequences
• Forecast ‘Sent(t)’
0102030405060708090
1 3 5 7 9 11
Time Tick
Nu
mb
er o
f p
ack
ets
sent
lost
repeated

Telcordia 2003 C. Faloutsos 20
CMU SCS
Differences from DSP/Stat
• Semi-infinite streams – we need on-line, ‘any-time’ algorithms
• Can not afford human intervention– need automatic methods
• sensors have limited memory / processing / transmitting power– need for (lossy) compression
Telcordia 2003 C. Faloutsos 21
CMU SCS
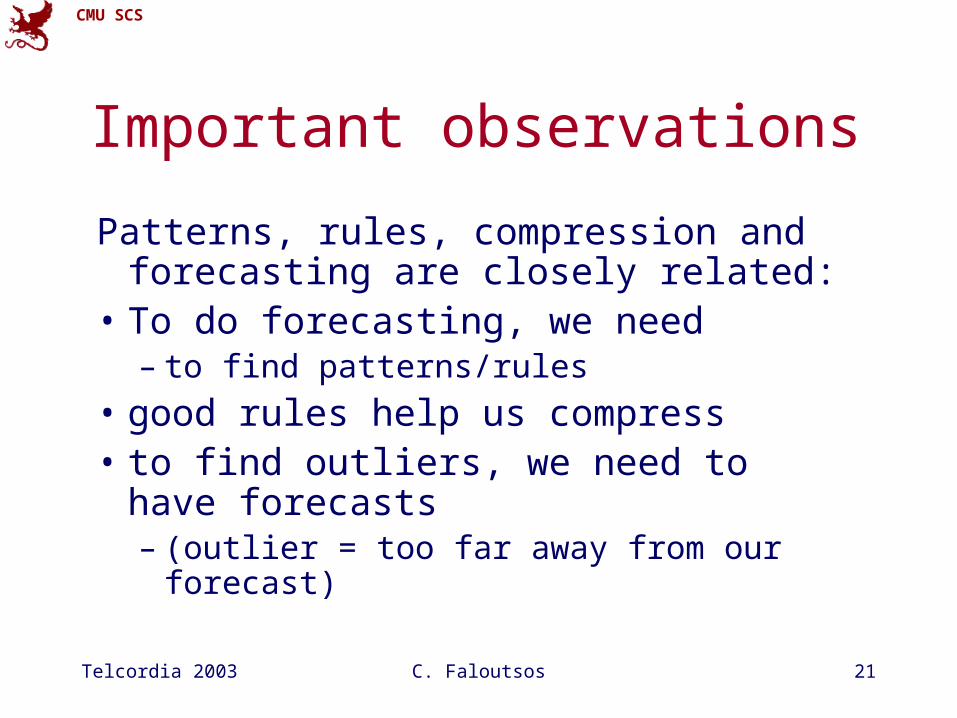
Important observations
Patterns, rules, compression and forecasting are closely related:
• To do forecasting, we need– to find patterns/rules
• good rules help us compress• to find outliers, we need to have forecasts
– (outlier = too far away from our forecast)
Telcordia 2003 C. Faloutsos 22
CMU SCS
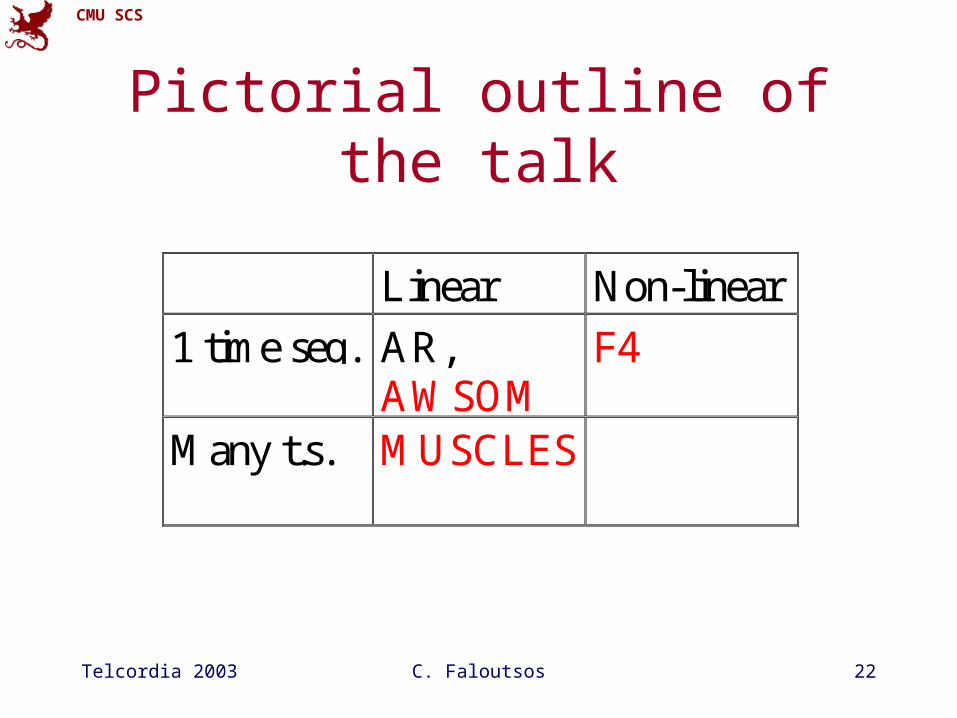
Pictorial outline of the talk
Linear Non-linear
1 time seq. AR,AWSOM
F4
Many t.s. MUSCLES

Telcordia 2003 C. Faloutsos 23
CMU SCS
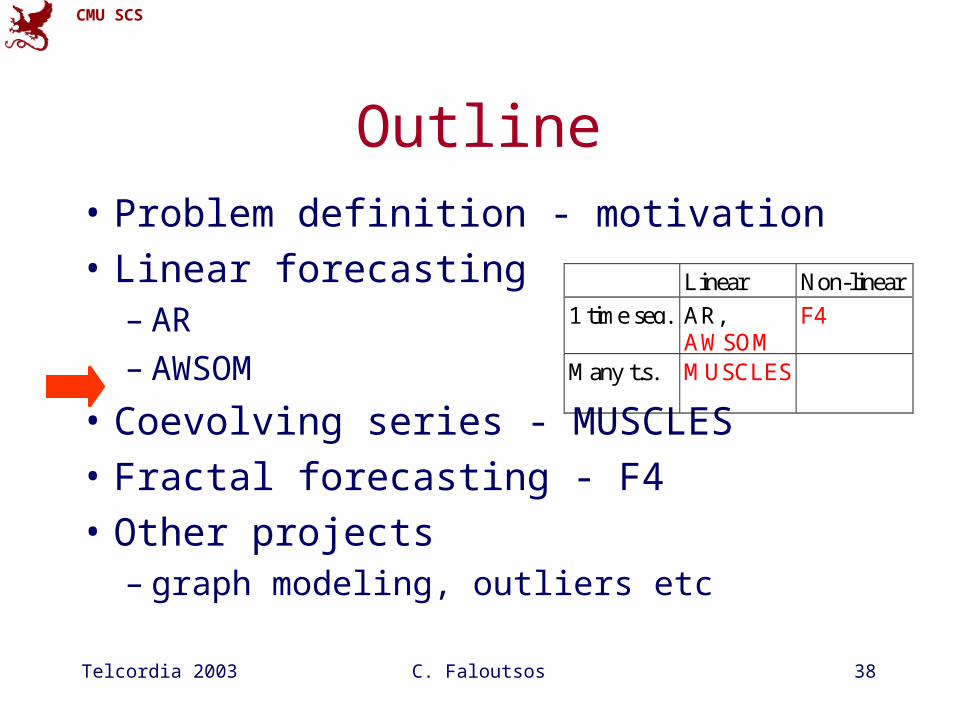
Outline• Problem definition - motivation• Linear forecasting
– AR – AWSOM
• Coevolving series - MUSCLES• Fractal forecasting - F4• Other projects
– graph modeling, outliers etc
Linear Non-linear
1 time seq. AR,AWSOM
F4
Many t.s. MUSCLES
Telcordia 2003 C. Faloutsos 24
CMU SCS
Mini intro to A.R.
Telcordia 2003 C. Faloutsos 25
CMU SCS
Forecasting
"Prediction is very difficult, especially about the future." - Nils Bohr
http://www.hfac.uh.edu/MediaFutures/thoughts.html

Telcordia 2003 C. Faloutsos 26
CMU SCS
Problem#1’: Forecast• Example: give xt-1, xt-2, …, forecast xt
0102030405060708090
1 3 5 7 9 11
Time Tick
Nu
mb
er o
f p
ack
ets
sen
t
??
Telcordia 2003 C. Faloutsos 28
CMU SCS
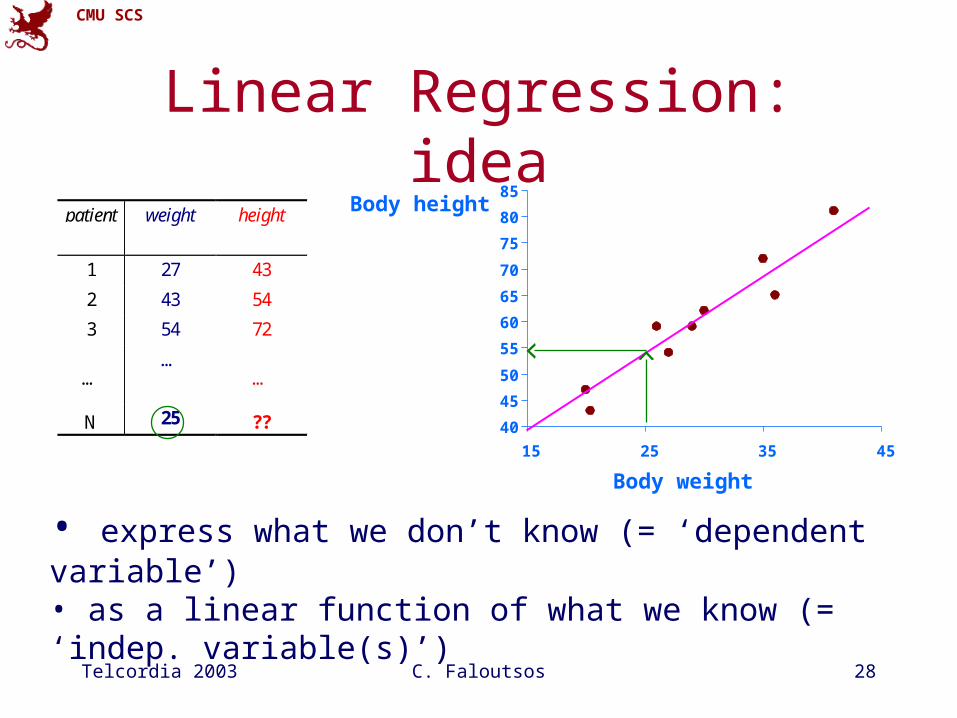
Linear Regression: idea
40
45
50
55
60
65
70
75
80
85
15 25 35 45
Body weight
patient weight height
1 27 43
2 43 54
3 54 72
……
…
N 25 ??
• express what we don’t know (= ‘dependent variable’)• as a linear function of what we know (= ‘indep. variable(s)’)
Body height

Telcordia 2003 C. Faloutsos 29
CMU SCS
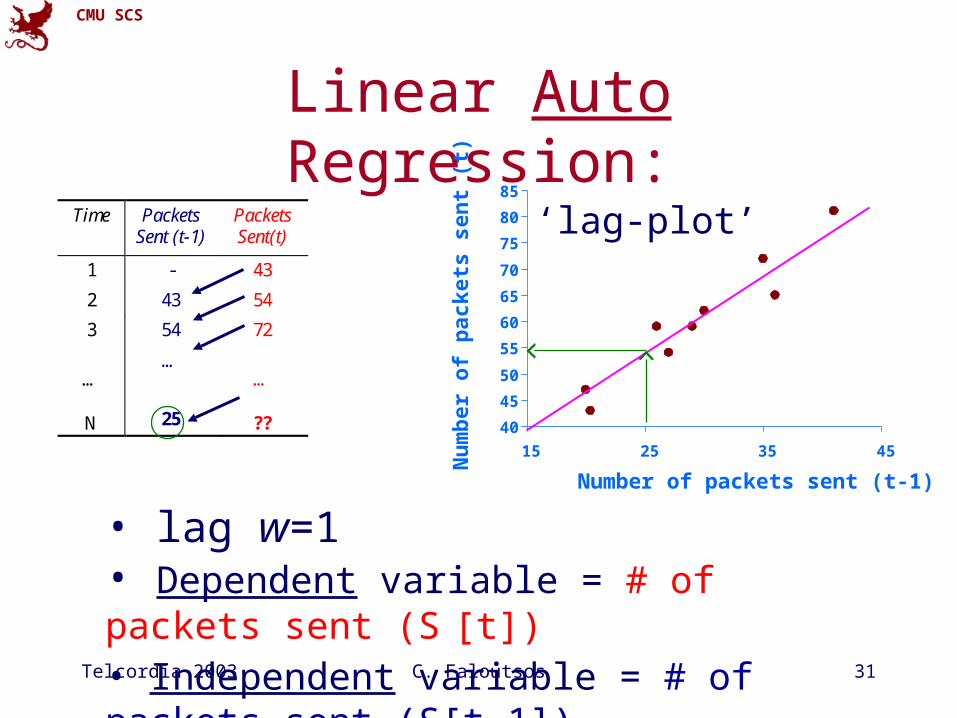
Linear Auto Regression:Time Packets
Sent (t-1)PacketsSent(t)
1 - 43
2 43 54
3 54 72
……
…
N 25 ??
Telcordia 2003 C. Faloutsos 30
CMU SCS
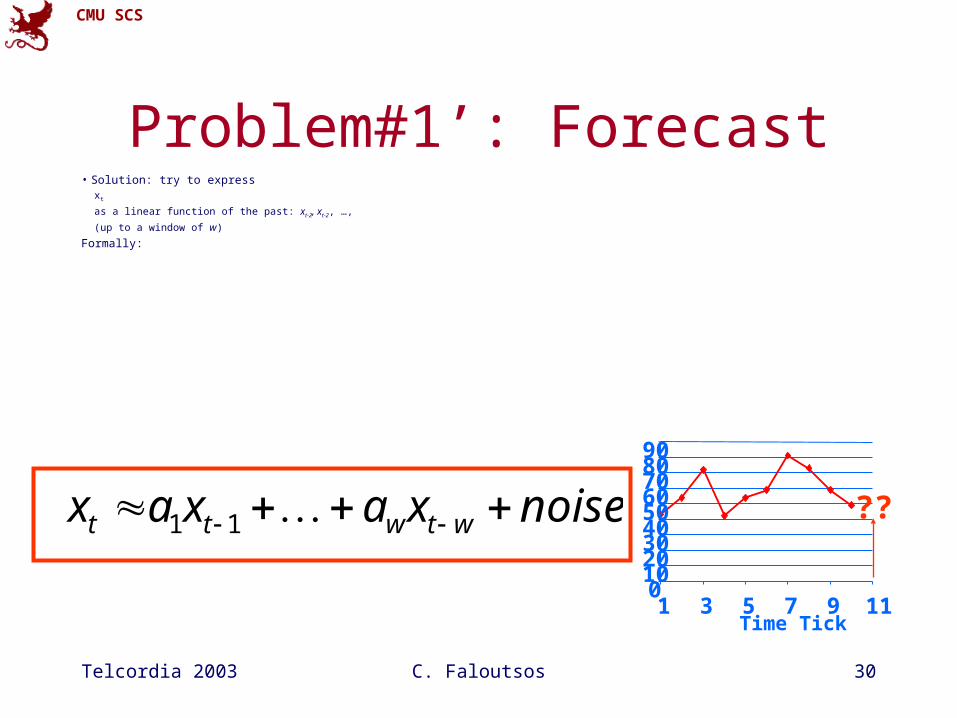
Problem#1’: Forecast• Solution: try to express
xt
as a linear function of the past: xt-2, xt-2, …,
(up to a window of w)
Formally:
0102030405060708090
1 3 5 7 9 11Time Tick
??noisexaxax wtwtt 11
Telcordia 2003 C. Faloutsos 31
CMU SCS
Linear Auto Regression:
40
45
50
55
60
65
70
75
80
85
15 25 35 45
Number of packets sent (t-1)N
um
ber
of
pac
ket
s se
nt
(t)
Time PacketsSent (t-1)
PacketsSent(t)
1 - 43
2 43 54
3 54 72
……
…
N 25 ??
• lag w=1• Dependent variable = # of packets sent (S [t])• Independent variable = # of packets sent (S[t-1])
‘lag-plot’
Telcordia 2003 C. Faloutsos 32
CMU SCS
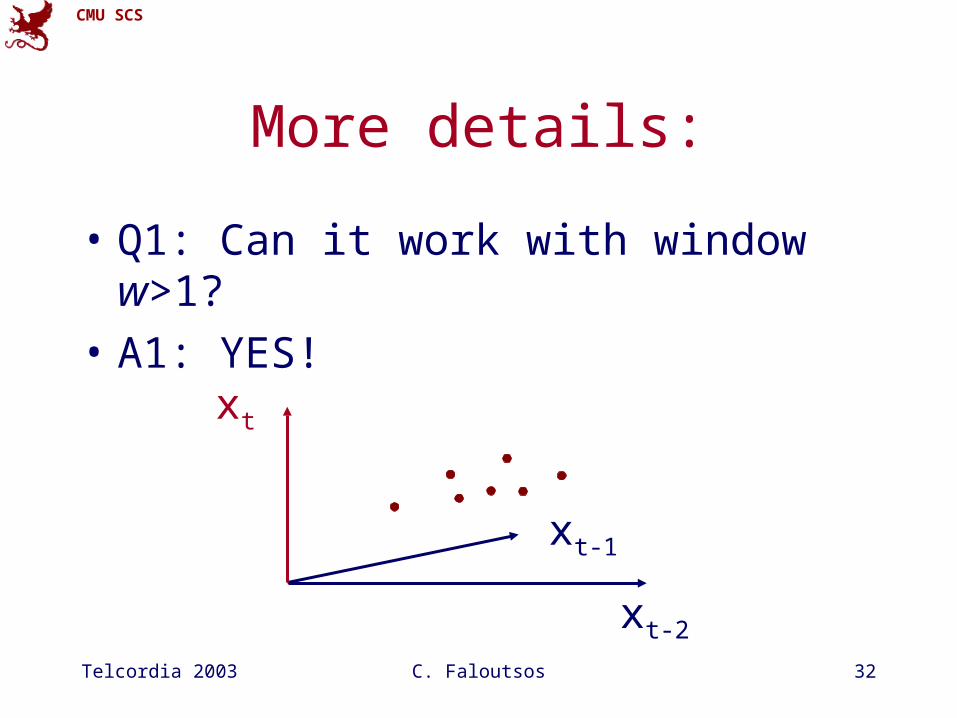
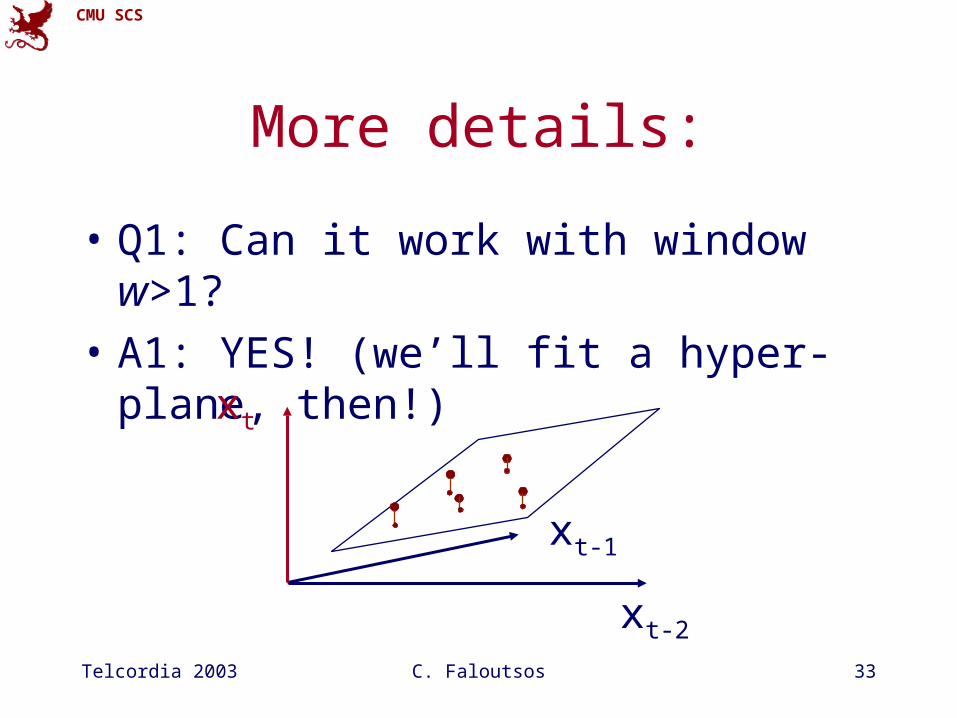
More details:
• Q1: Can it work with window w>1?
• A1: YES!
xt-2
xt
xt-1
Telcordia 2003 C. Faloutsos 33
CMU SCS
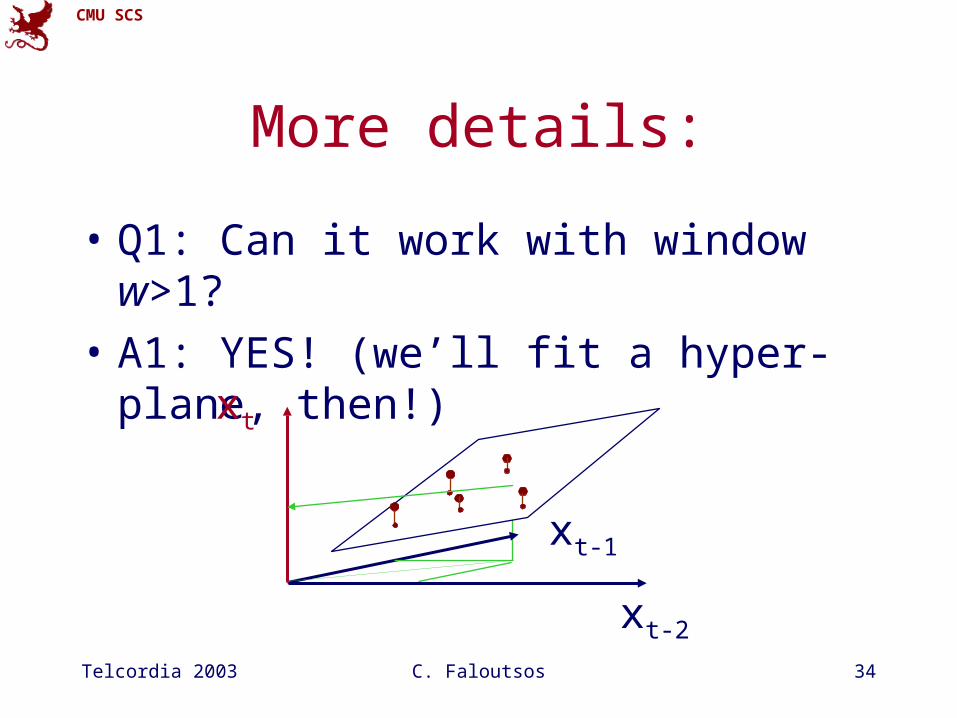
More details:
• Q1: Can it work with window w>1?
• A1: YES! (we’ll fit a hyper-plane, then!)
xt-2
xt
xt-1
Telcordia 2003 C. Faloutsos 34
CMU SCS
More details:
• Q1: Can it work with window w>1?
• A1: YES! (we’ll fit a hyper-plane, then!)
xt-2
xt-1
xt

Telcordia 2003 C. Faloutsos 35
CMU SCS
Even more details
• Q2: Can we estimate a incrementally?
• A2: Yes, with the brilliant, classic method of ‘Recursive Least Squares’ (RLS) (see, e.g., [Chen+94], or [Yi+00], for details)
• Q3: can we ‘down-weight’ older samples?
• A3: yes (RLS does that easily!)
Telcordia 2003 C. Faloutsos 36
CMU SCS
Mini intro to A.R.

Telcordia 2003 C. Faloutsos 37
CMU SCS
How to choose ‘w’?
• goal: capture arbitrary periodicities
• with NO human intervention
• on a semi-infinite stream
noisexaxax wtwtt 11
Telcordia 2003 C. Faloutsos 38
CMU SCS
Outline• Problem definition - motivation• Linear forecasting
– AR – AWSOM
• Coevolving series - MUSCLES• Fractal forecasting - F4• Other projects
– graph modeling, outliers etc
Linear Non-linear
1 time seq. AR,AWSOM
F4
Many t.s. MUSCLES
Telcordia 2003 C. Faloutsos 39
CMU SCS
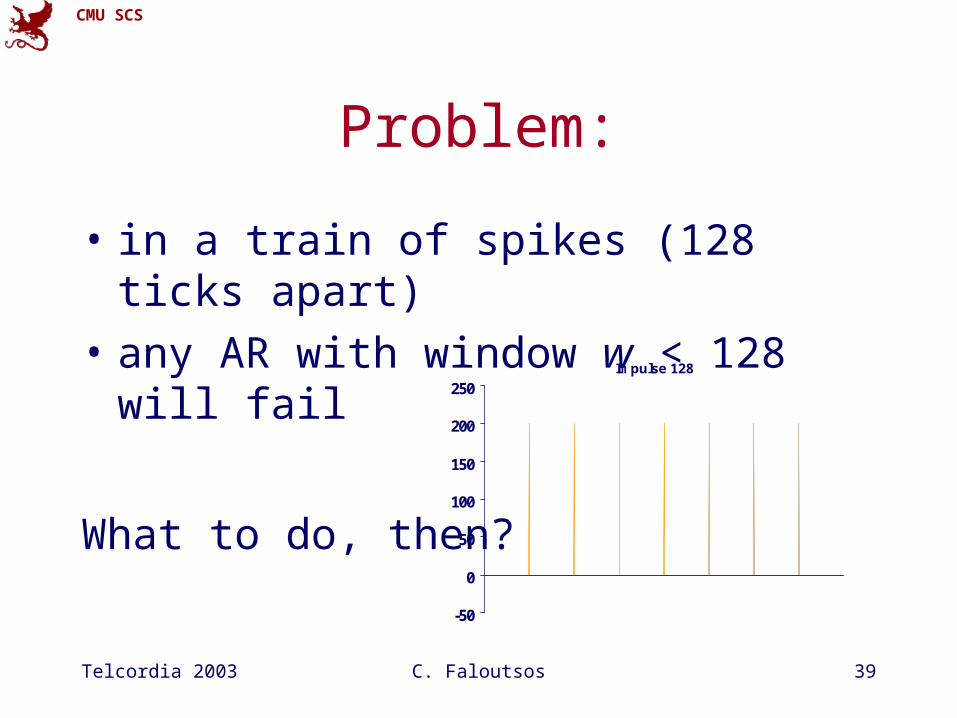
Problem:
• in a train of spikes (128 ticks apart)
• any AR with window w < 128 will fail
What to do, then?
Impulse 128
-50
0
50
100
150
200
250

Telcordia 2003 C. Faloutsos 40
CMU SCS
Answer (intuition)
• Do a Wavelet transform (~ short window DFT)
• look for patterns in every frequency
Telcordia 2003 C. Faloutsos 41
CMU SCS
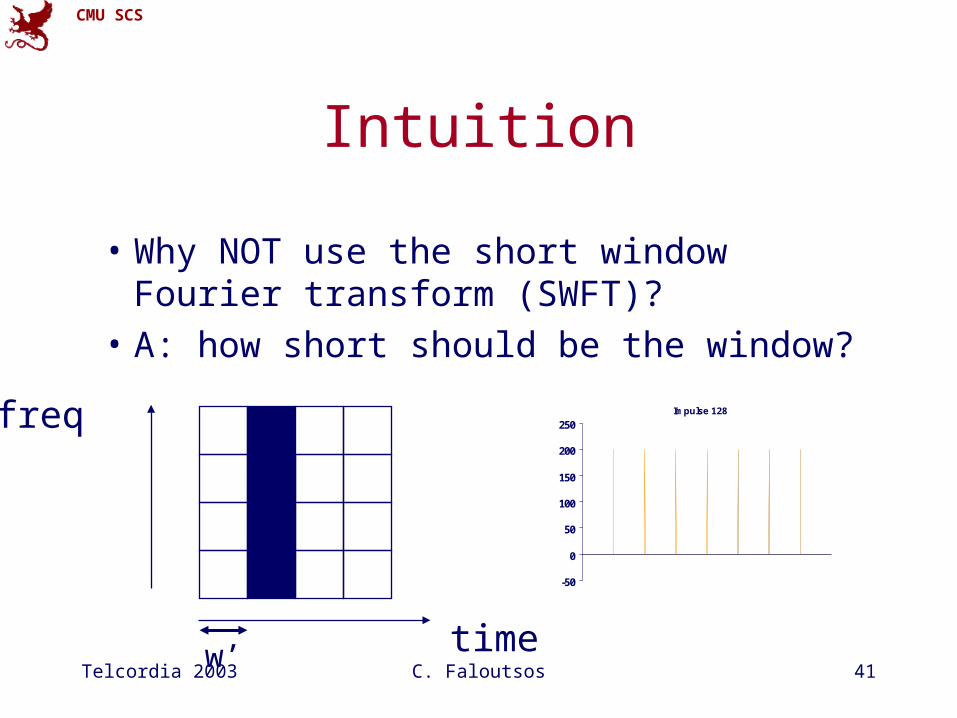
Intuition
• Why NOT use the short window Fourier transform (SWFT)?
• A: how short should be the window?
time
freq Impulse 128
-50
0
50
100
150
200
250
w’
Telcordia 2003 C. Faloutsos 42
CMU SCS
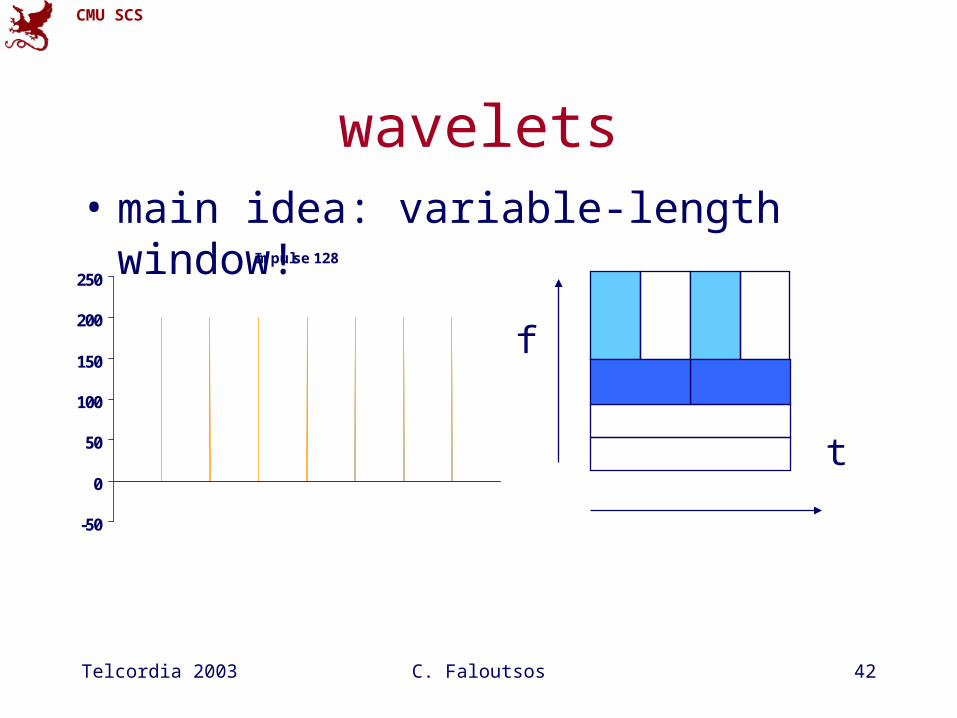
wavelets
Impulse 128
-50
0
50
100
150
200
250
t
f
• main idea: variable-length window!

Telcordia 2003 C. Faloutsos 43
CMU SCS
Advantages of Wavelets
• Better compression (better RMSE with same number of coefficients - used in JPEG-2000)
• fast to compute (usually: O(n)!)
• very good for ‘spikes’
• mammalian eye and ear: Gabor wavelets

Telcordia 2003 C. Faloutsos 44
CMU SCS
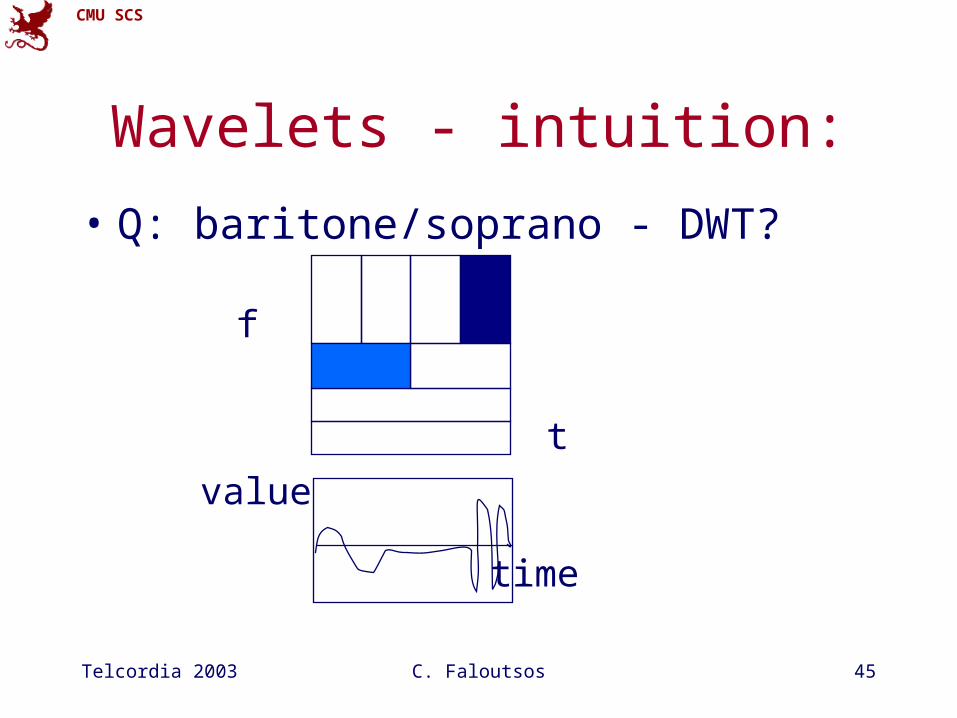
Wavelets - intuition:
t
f
• Q: baritone/silence/ soprano - DWT?
time
value
Telcordia 2003 C. Faloutsos 45
CMU SCS
Wavelets - intuition:
• Q: baritone/soprano - DWT?
t
f
time
value
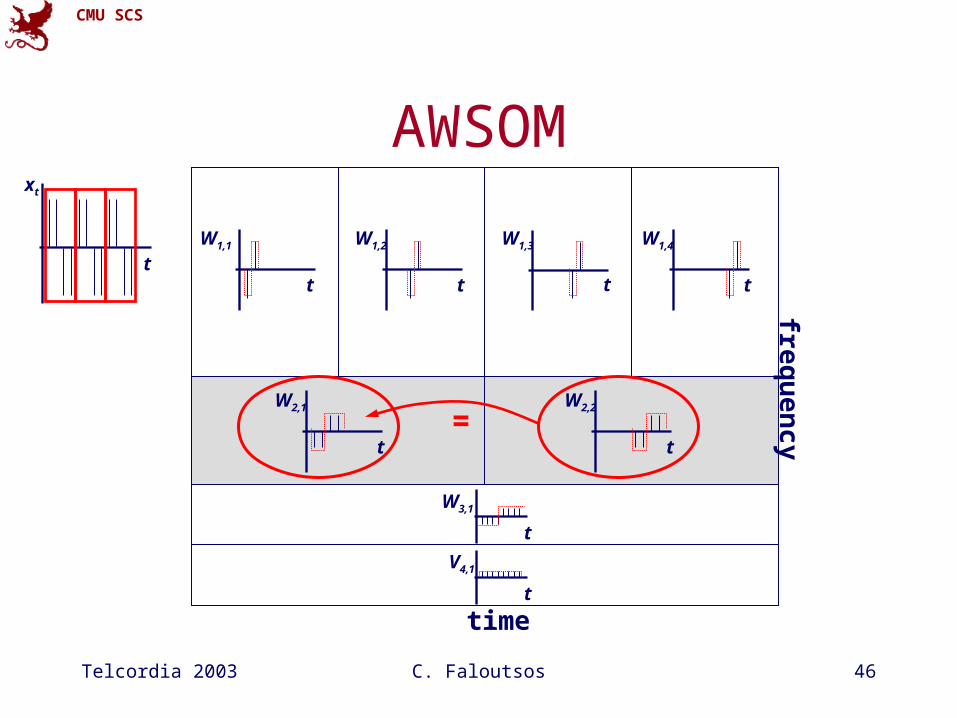
Telcordia 2003 C. Faloutsos 46
CMU SCS
AWSOMxt
tt
W1,1
t
W1,2
t
W1,3
t
W1,4
t
W2,1
t
W2,2
t
W3,1
t
V4,1
time
frequ
ency=
Telcordia 2003 C. Faloutsos 47
CMU SCS
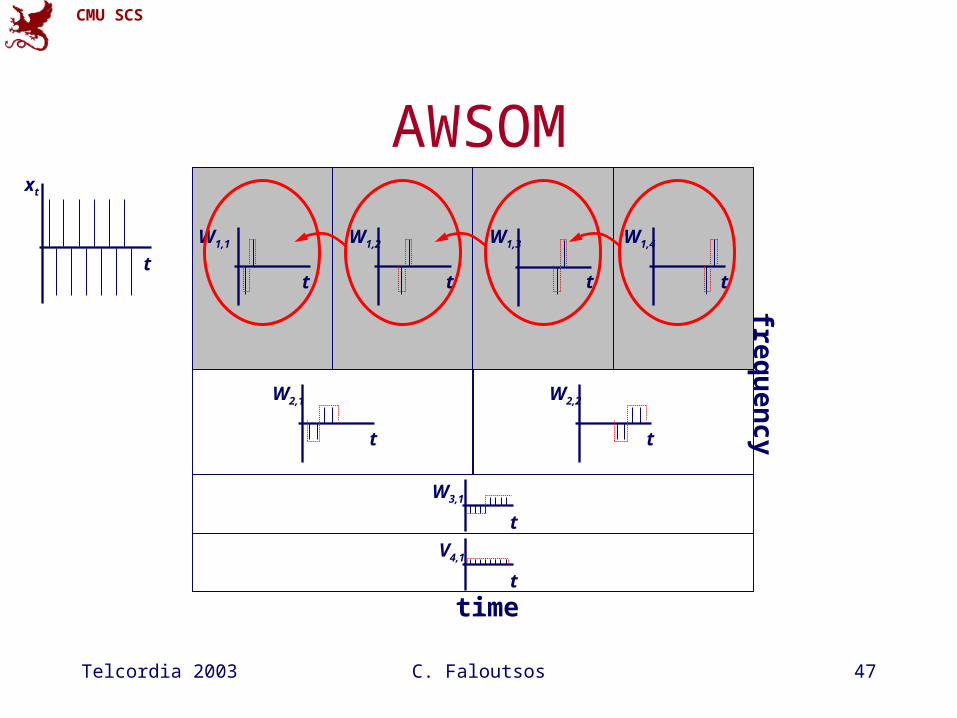
AWSOMxt
tt
W1,1
t
W1,2
t
W1,3
t
W1,4
t
W2,1
t
W2,2
t
W3,1
t
V4,1
time
frequ
ency

Telcordia 2003 C. Faloutsos 48
CMU SCS
AWSOM - idea
Wl,tWl,t-1Wl,t-2Wl,t l,1Wl,t-1 l,2Wl,t-2 …
Wl’,t’-1Wl’,t’-2Wl’,t’
Wl’,t’ l’,1Wl’,t’-1 l’,2Wl’,t’-2 …
Telcordia 2003 C. Faloutsos 52
CMU SCS
More details…
• Update of wavelet coefficients
• Update of linear models
• Feature selection– Not all correlations are significant– Throw away the insignificant ones (“noise”)
(incremental)
(incremental; RLS)
(single-pass)
Telcordia 2003 C. Faloutsos 53
CMU SCS
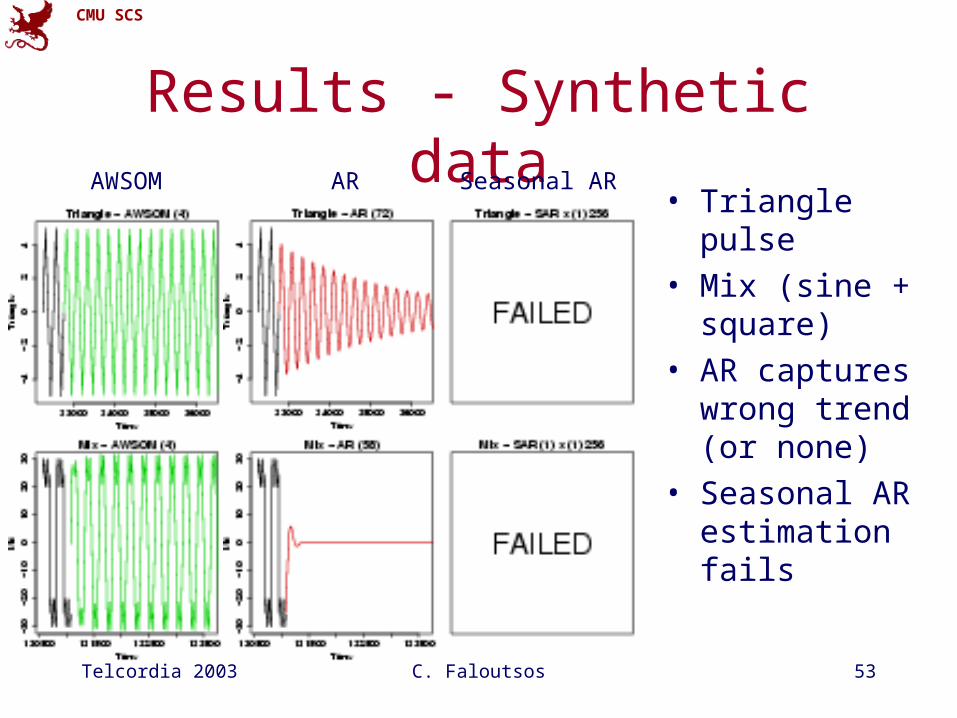
Results - Synthetic data• Triangle pulse
• Mix (sine + square)
• AR captures wrong trend (or none)
• Seasonal AR estimation fails
AWSOM AR Seasonal AR

Telcordia 2003 C. Faloutsos 54
CMU SCS
Results - Real data
• Automobile traffic– Daily periodicity– Bursty “noise” at smaller scales
• AR fails to capture any trend• Seasonal AR estimation fails
Telcordia 2003 C. Faloutsos 55
CMU SCS
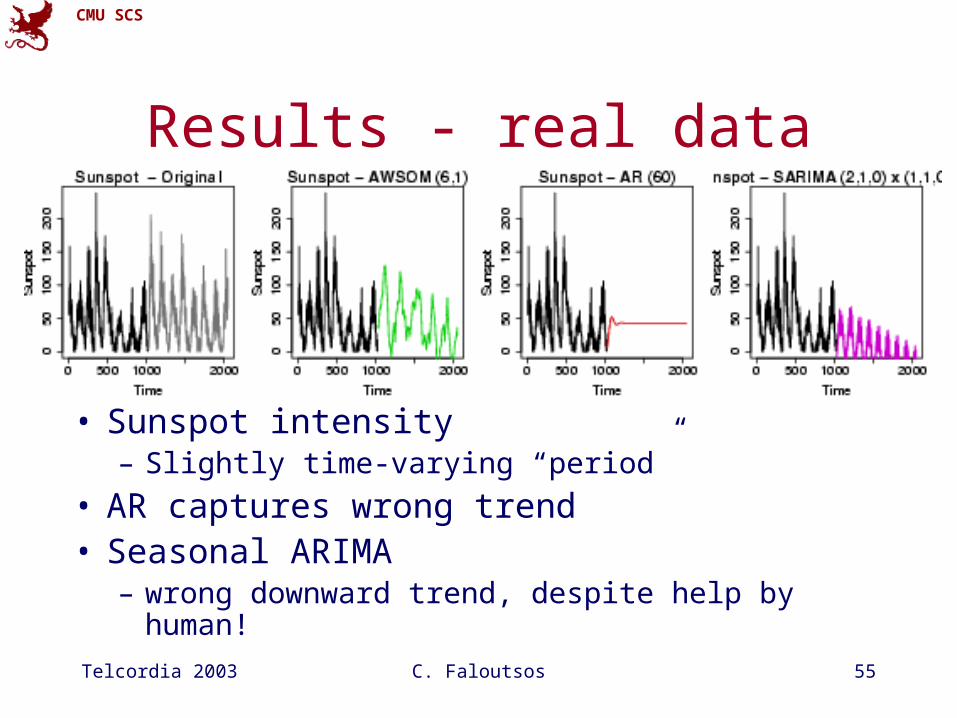
Results - real data
• Sunspot intensity– Slightly time-varying “period”
• AR captures wrong trend• Seasonal ARIMA
– wrong downward trend, despite help by human!
Telcordia 2003 C. Faloutsos 56
CMU SCS
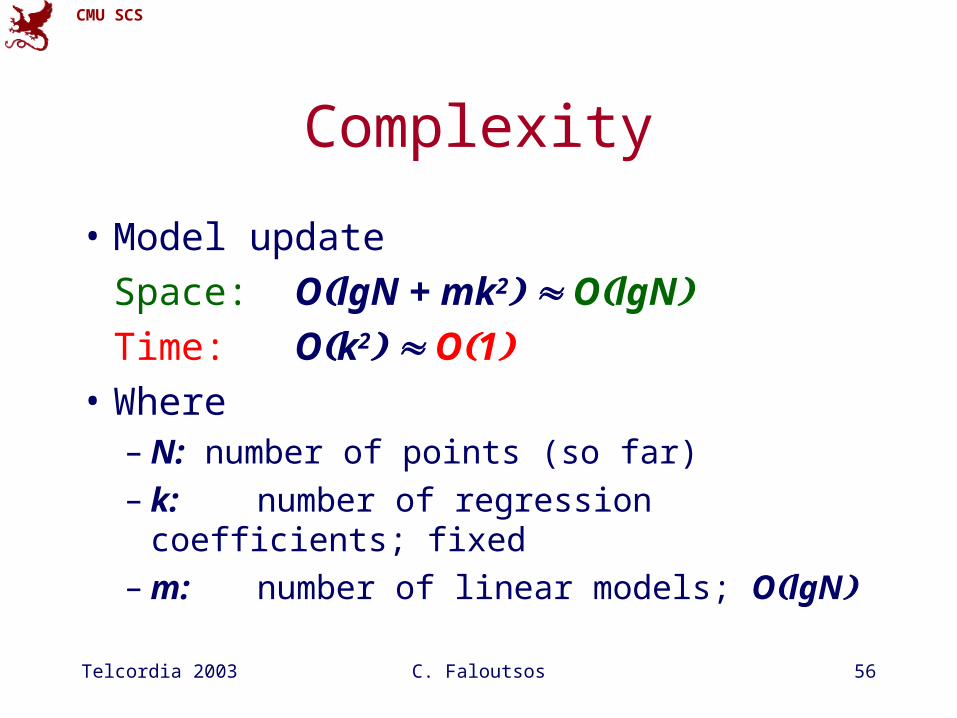
Complexity
• Model update
Space: OlgN + mk2 OlgNTime: Ok2 O1
• Where– N: number of points (so far)– k: number of regression coefficients; fixed– m: number of linear models; OlgN
Telcordia 2003 C. Faloutsos 57
CMU SCS
Conclusions
• AWSOM: Automatic, ‘hands-off’ traffic modeling (first of its kind!)
Telcordia 2003 C. Faloutsos 58
CMU SCS
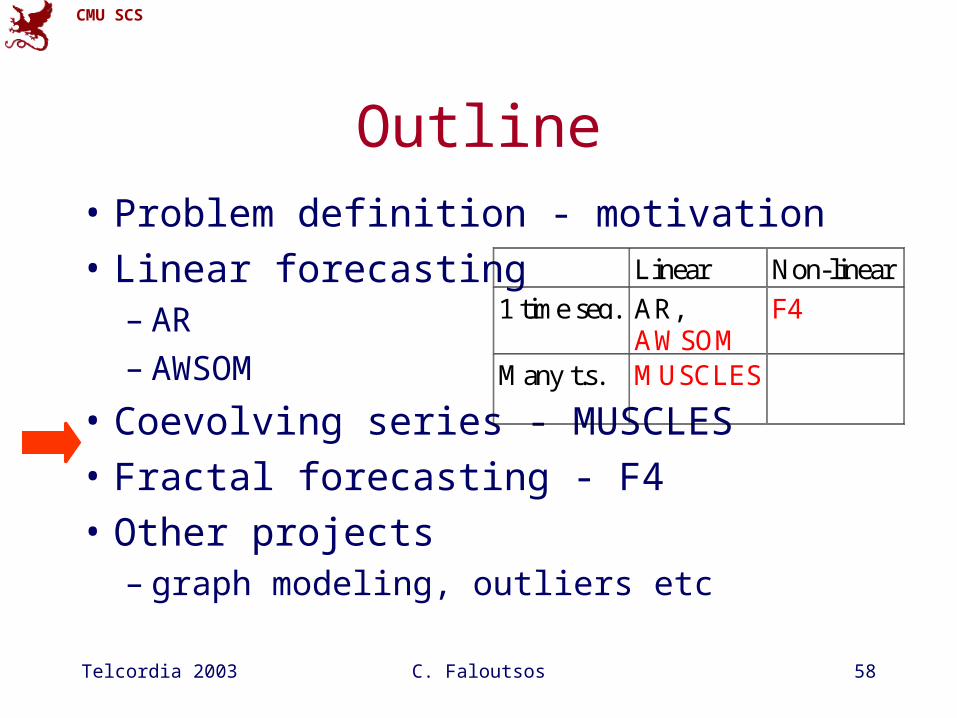
Outline• Problem definition - motivation• Linear forecasting
– AR – AWSOM
• Coevolving series - MUSCLES• Fractal forecasting - F4• Other projects
– graph modeling, outliers etc
Linear Non-linear
1 time seq. AR,AWSOM
F4
Many t.s. MUSCLES
Telcordia 2003 C. Faloutsos 59
CMU SCS
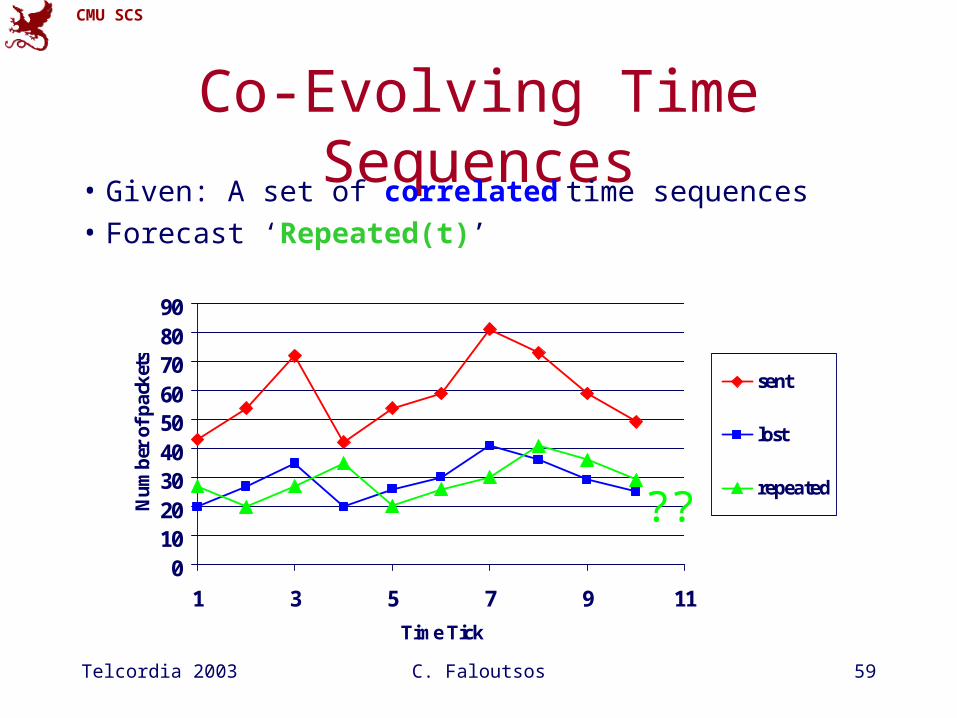
Co-Evolving Time Sequences• Given: A set of correlated time sequences
• Forecast ‘Repeated(t)’
0102030405060708090
1 3 5 7 9 11
Time Tick
Nu
mb
er o
f p
ack
ets
sent
lost
repeated
??
Telcordia 2003 C. Faloutsos 60
CMU SCS
Solution:
Q: what should we do?
Telcordia 2003 C. Faloutsos 61
CMU SCS
Solution:
Least Squares, with
• Dep. Variable: Repeated(t)
• Indep. Variables: Sent(t-1) … Sent(t-w); Lost(t-1) …Lost(t-w); Repeated(t-1), ...
• (named: ‘MUSCLES’ [Yi+00])

Telcordia 2003 C. Faloutsos 62
CMU SCS
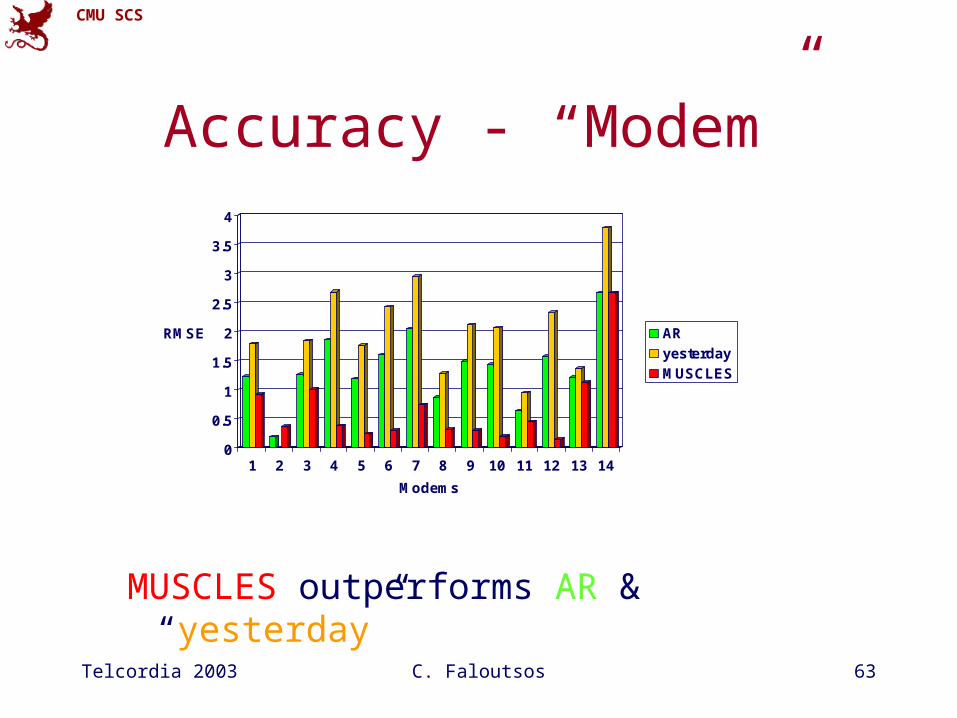
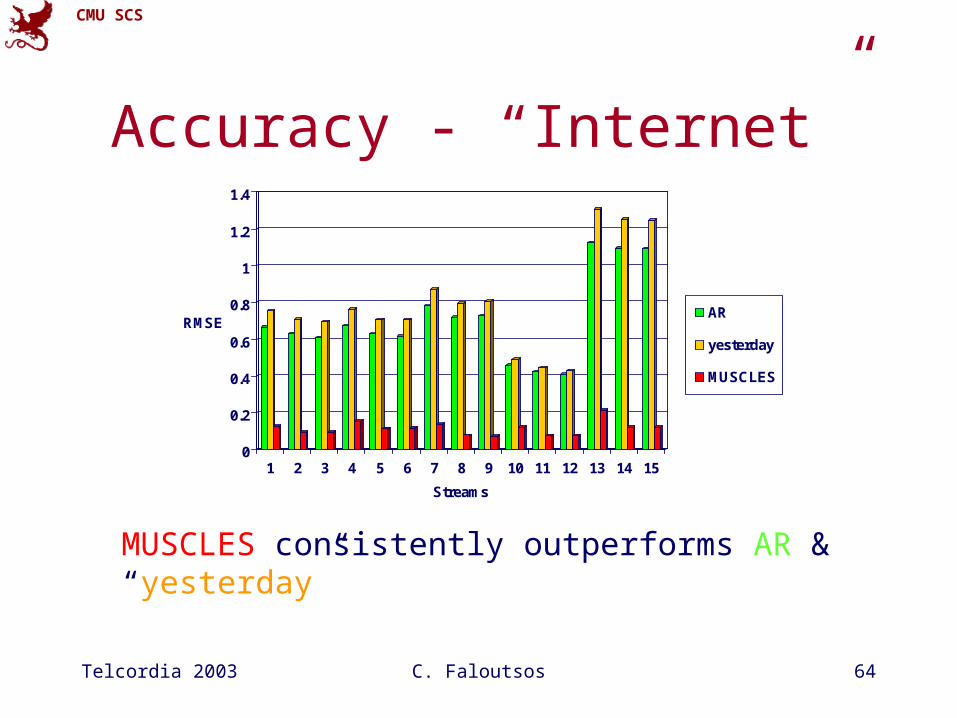
Examples - Experiments• Datasets
– Modem pool traffic (14 modems, 1500 time-ticks; #packets per time unit)
– AT&T WorldNet internet usage (several data streams; 980 time-ticks)
• Measures of success– Accuracy : Root Mean Square Error (RMSE)
Telcordia 2003 C. Faloutsos 63
CMU SCS
Accuracy - “Modem”
MUSCLES outperforms AR & “yesterday”
0
0.5
1
1.5
2
2.5
3
3.5
4
RMSE
1 2 3 4 5 6 7 8 9 10 11 12 13 14
Modems
AR
yesterday
MUSCLES
Telcordia 2003 C. Faloutsos 64
CMU SCS
Accuracy - “Internet”
0
0.2
0.4
0.6
0.8
1
1.2
1.4
RMSE
1 2 3 4 5 6 7 8 9 10 11 12 13 14 15
Streams
AR
yesterday
MUSCLES
MUSCLES consistently outperforms AR & “yesterday”
Telcordia 2003 C. Faloutsos 65
CMU SCS
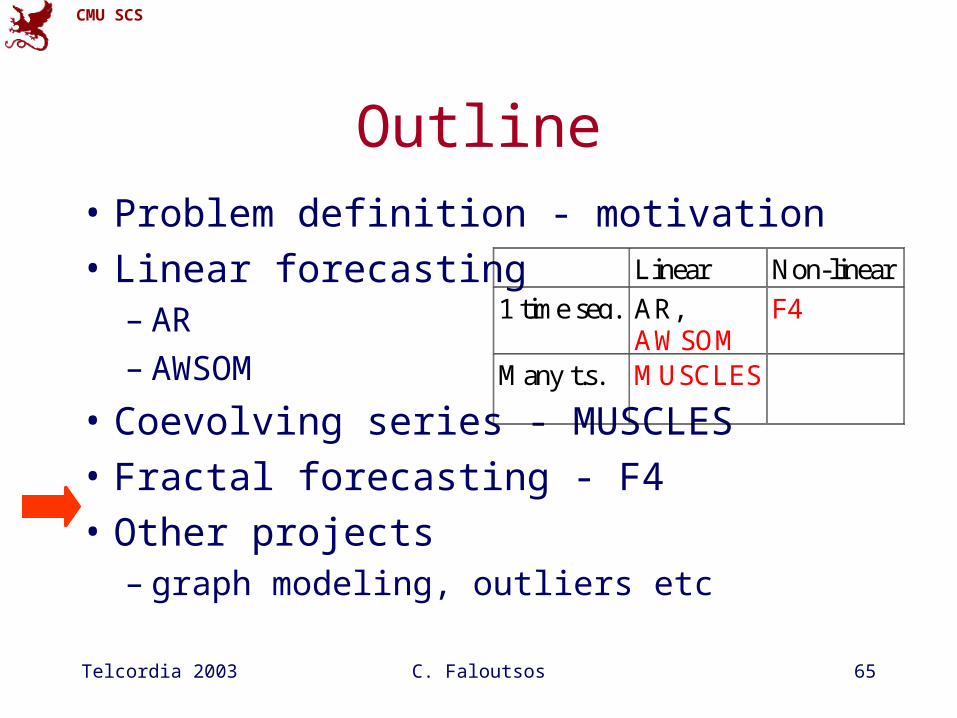
Outline• Problem definition - motivation• Linear forecasting
– AR – AWSOM
• Coevolving series - MUSCLES• Fractal forecasting - F4• Other projects
– graph modeling, outliers etc
Linear Non-linear
1 time seq. AR,AWSOM
F4
Many t.s. MUSCLES
Telcordia 2003 C. Faloutsos 66
CMU SCS
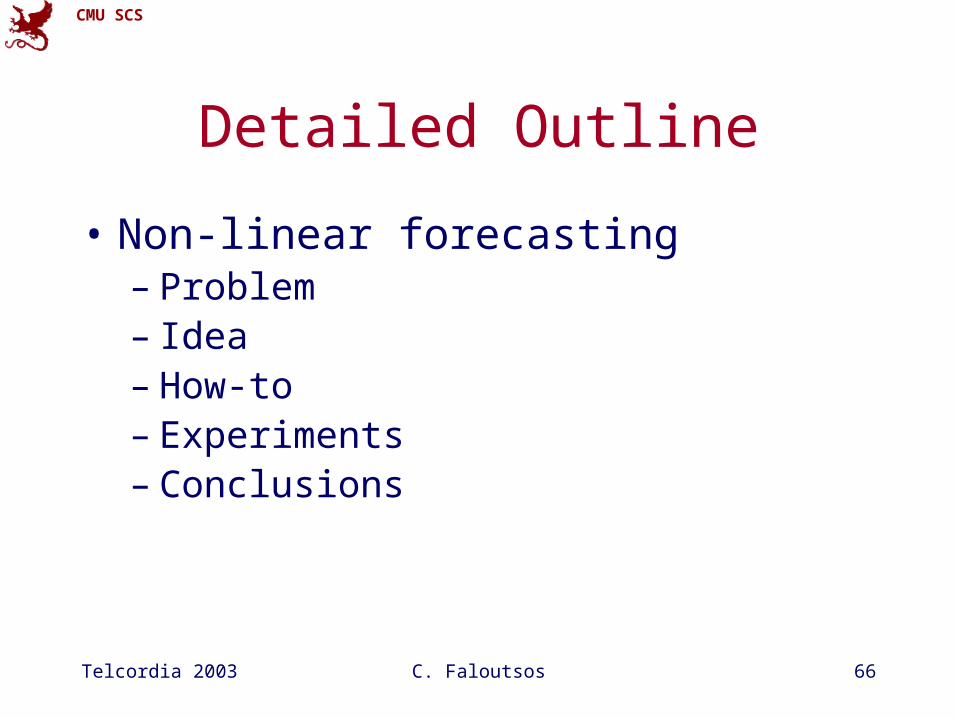
Detailed Outline
• Non-linear forecasting– Problem– Idea– How-to– Experiments– Conclusions

Telcordia 2003 C. Faloutsos 67
CMU SCS
Recall: Problem #1
Given a time series {xt}, predict its future course, that is, xt+1, xt+2, ...
Time
Value
Telcordia 2003 C. Faloutsos 68
CMU SCS
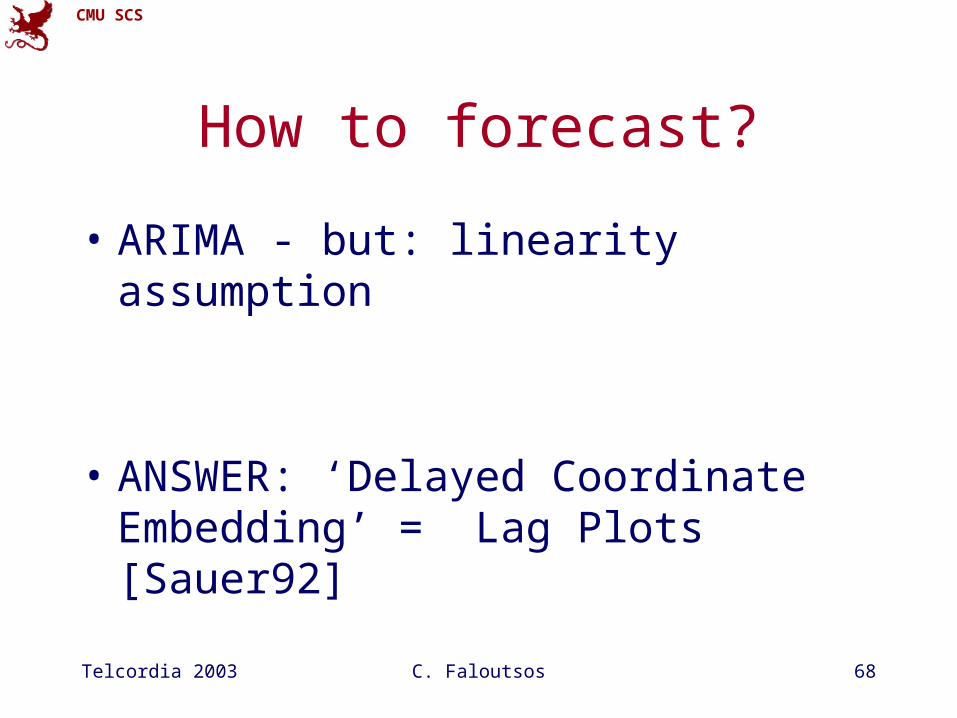
How to forecast?
• ARIMA - but: linearity assumption
• ANSWER: ‘Delayed Coordinate Embedding’ = Lag Plots [Sauer92]
Telcordia 2003 C. Faloutsos 69
CMU SCS
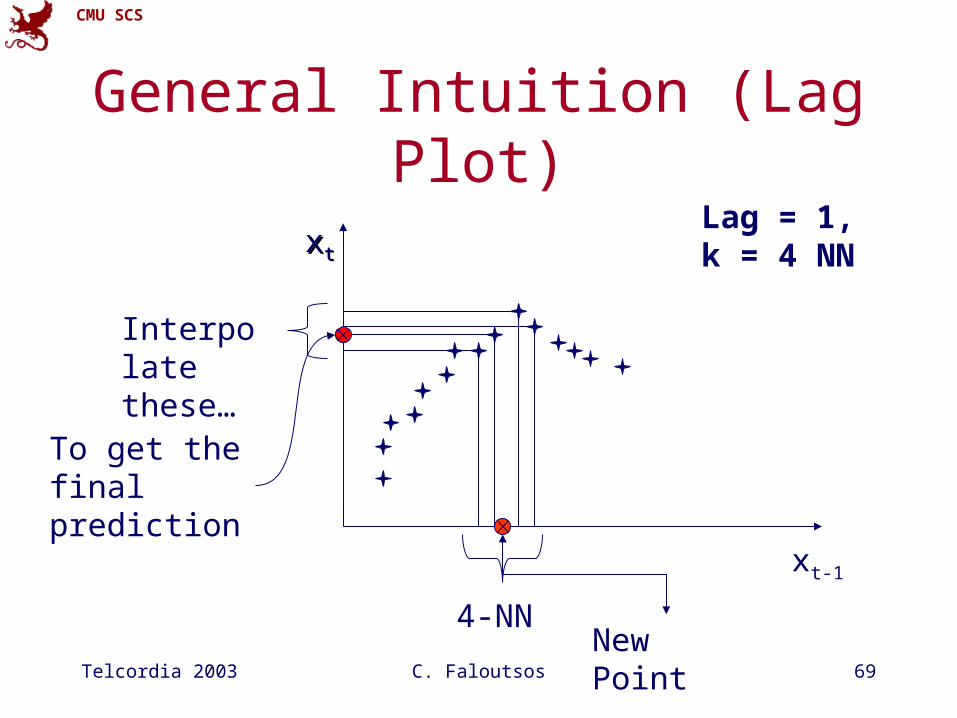
General Intuition (Lag Plot)
xt-1
xxtt
4-NNNew Point
Interpolate these…
To get the final prediction
Lag = 1,k = 4 NN
Telcordia 2003 C. Faloutsos 70
CMU SCS
Questions:
• Q1: How to choose lag L?• Q2: How to choose k (the # of NN)?• Q3: How to interpolate?• Q4: why should this work at all?
Telcordia 2003 C. Faloutsos 71
CMU SCS
Q1: Choosing lag L
• Manually (16, in award winning system by [Sauer94])
• Our proposal: choose L such that the ‘intrinsic dimension’ in the lag plot stabilizes [Chakrabarti+02]

Telcordia 2003 C. Faloutsos 72
CMU SCS
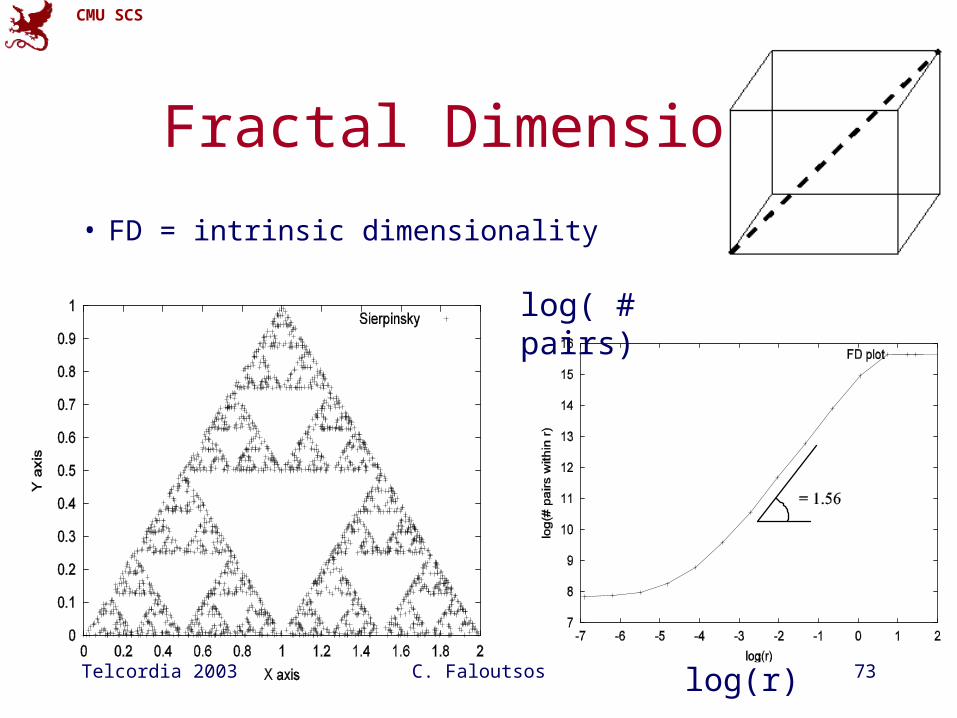
Fractal Dimensions
• FD = intrinsic dimensionality
Embedding dimensionality = 3
Intrinsic dimensionality = 1
Telcordia 2003 C. Faloutsos 73
CMU SCS
Fractal Dimensions
• FD = intrinsic dimensionality
log(r)
log( # pairs)
Telcordia 2003 C. Faloutsos 74
CMU SCS
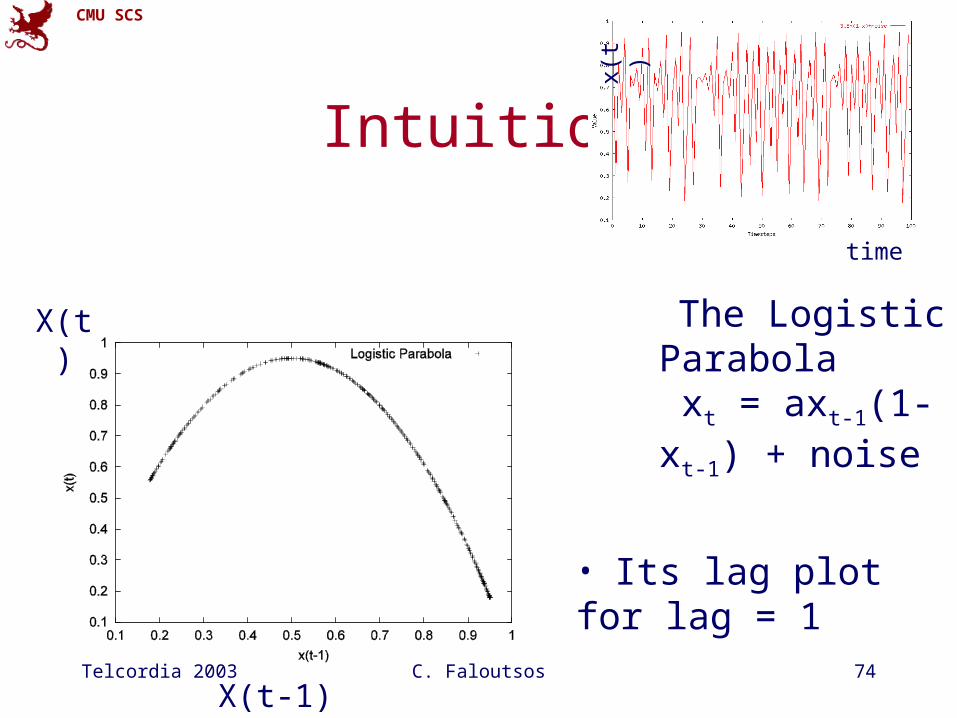
Intuition
• Its lag plot for lag = 1
X(t-1)
X(t) The Logistic Parabola xt = axt-1(1-xt-1) + noise
time
x(t
)

Telcordia 2003 C. Faloutsos 75
CMU SCS
Intuition
x(t-1)
x(t)
x(t-2)
x(t)
x(t)
x(t-2)
x(t-2) x(t-1)
x(t-1)
x(t-1)
x(t)
Telcordia 2003 C. Faloutsos 76
CMU SCS
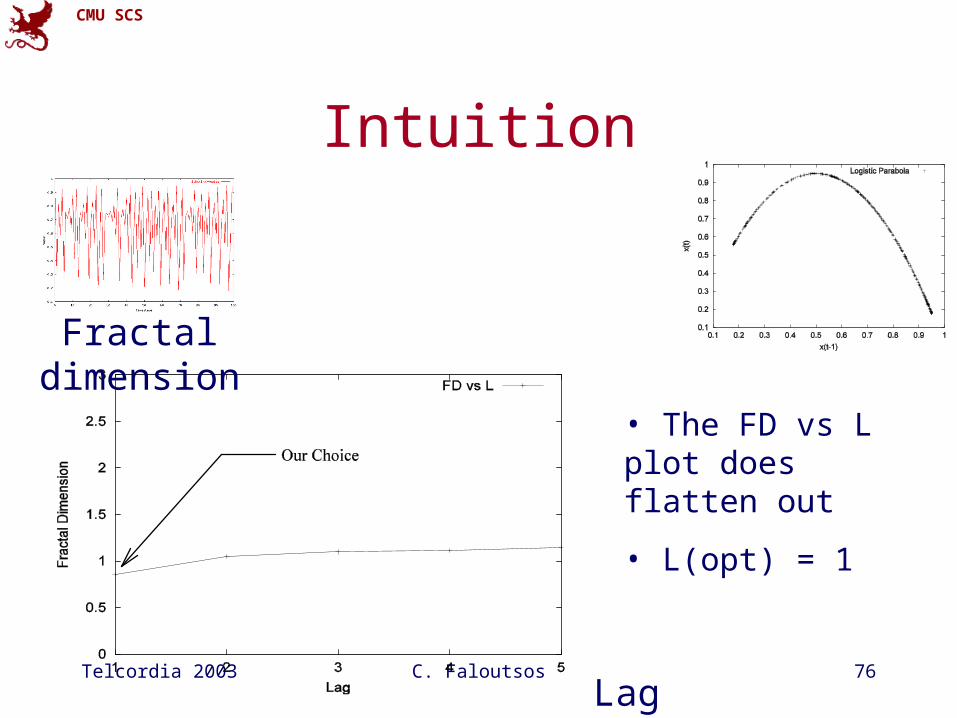
Intuition
• The FD vs L plot does flatten out
• L(opt) = 1
Lag
Fractal dimension
Telcordia 2003 C. Faloutsos 77
CMU SCS
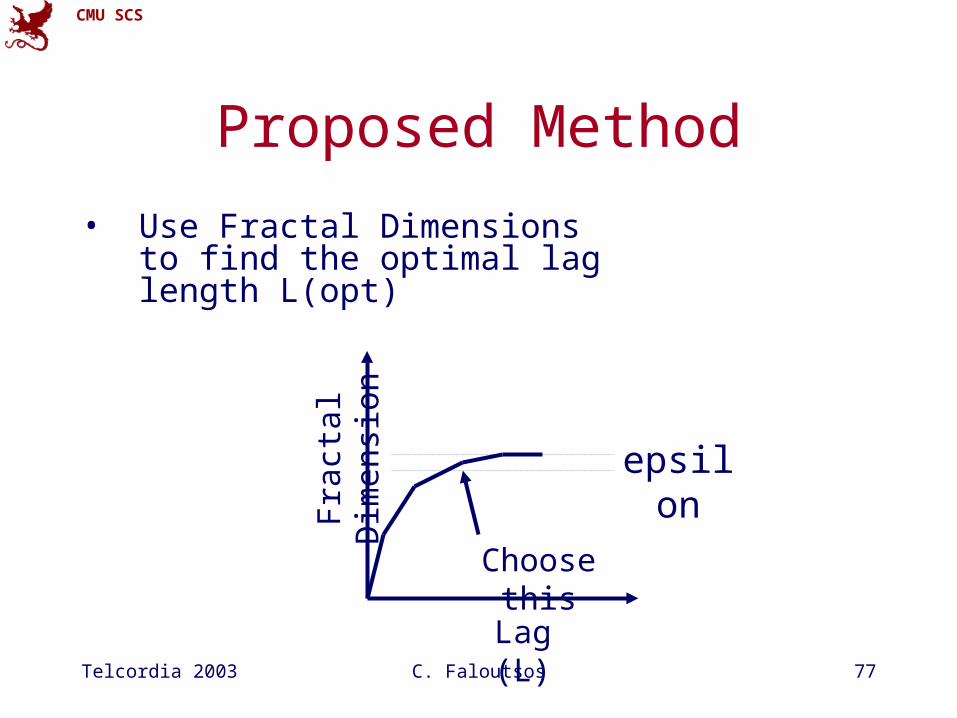
Proposed Method
• Use Fractal Dimensions to find the optimal lag length L(opt)
Lag (L)
Fra
ctal
Dim
ensi
on
Choose this
epsilon

Telcordia 2003 C. Faloutsos 78
CMU SCS
Q2: Choosing number of neighbors k
• Manually (typically ~ 1-10)

Telcordia 2003 C. Faloutsos 79
CMU SCS
Q3: How to interpolate?
How do we interpolate between the k nearest neighbors?
A3.1: Average
A3.2: Weighted average (weights drop with distance - how?)

Telcordia 2003 C. Faloutsos 80
CMU SCS
Q3: How to interpolate?
A3.3: Using SVD - seems to perform best ([Sauer94] - first place in the Santa Fe forecasting competition)
Xt-1
xt

Telcordia 2003 C. Faloutsos 81
CMU SCS
Q4: Any theory behind it?
A4: YES!
Telcordia 2003 C. Faloutsos 82
CMU SCS
Theoretical foundation
• Based on the “Takens’ Theorem” [Takens81]
• which says that long enough delay vectors can do prediction, even if there are unobserved variables in the dynamical system (= diff. equations)
Telcordia 2003 C. Faloutsos 83
CMU SCS
Theoretical foundation
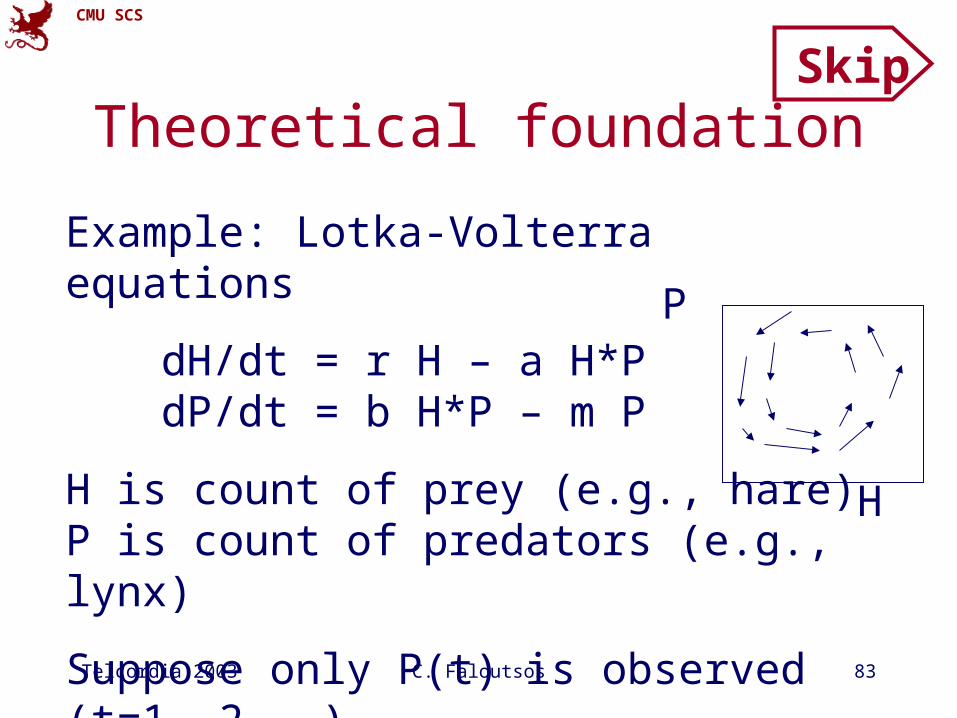
Example: Lotka-Volterra equations
dH/dt = r H – a H*P dP/dt = b H*P – m P
H is count of prey (e.g., hare)P is count of predators (e.g., lynx)
Suppose only P(t) is observed (t=1, 2, …).
H
P
Skip

Telcordia 2003 C. Faloutsos 84
CMU SCS
Theoretical foundation
• But the delay vector space is a faithful reconstruction of the internal system state
• So prediction in delay vector space is as good as prediction in state space
Skip
H
P
P(t-1)
P(t)

Telcordia 2003 C. Faloutsos 85
CMU SCS
Detailed Outline
• Non-linear forecasting– Problem– Idea– How-to– Experiments– Conclusions
Telcordia 2003 C. Faloutsos 86
CMU SCS
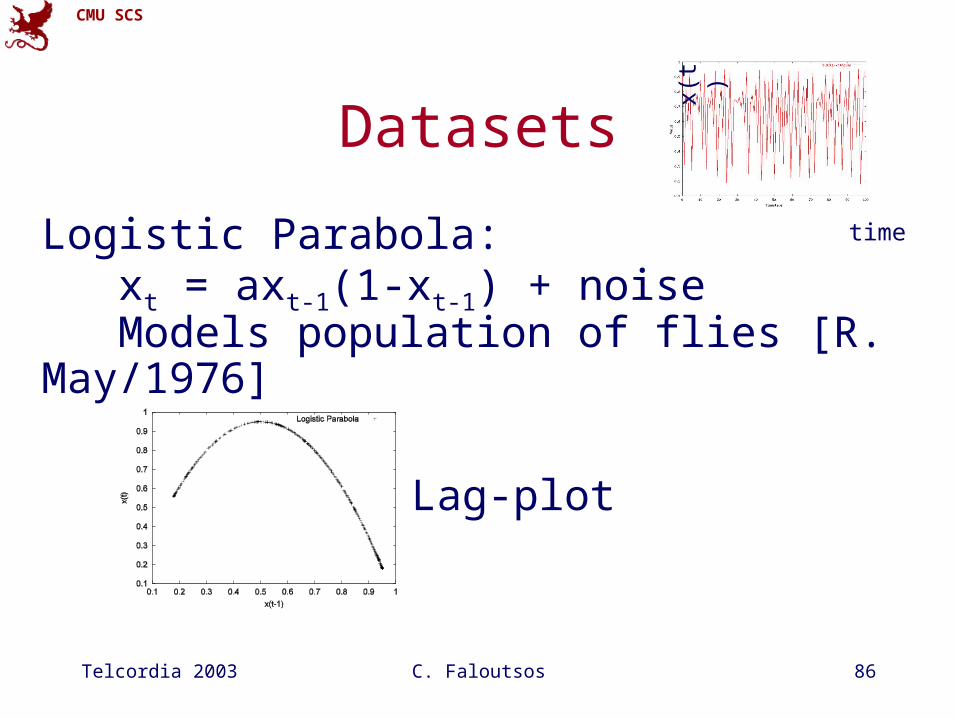
Datasets
Logistic Parabola: xt = axt-1(1-xt-1) + noise Models population of flies [R. May/1976]
time
x(t
)
Lag-plot

Telcordia 2003 C. Faloutsos 87
CMU SCS
Datasets
Logistic Parabola: xt = axt-1(1-xt-1) + noise Models population of flies [R. May/1976]
time
x(t
)
Lag-plot
ARIMA: fails
Telcordia 2003 C. Faloutsos 88
CMU SCS
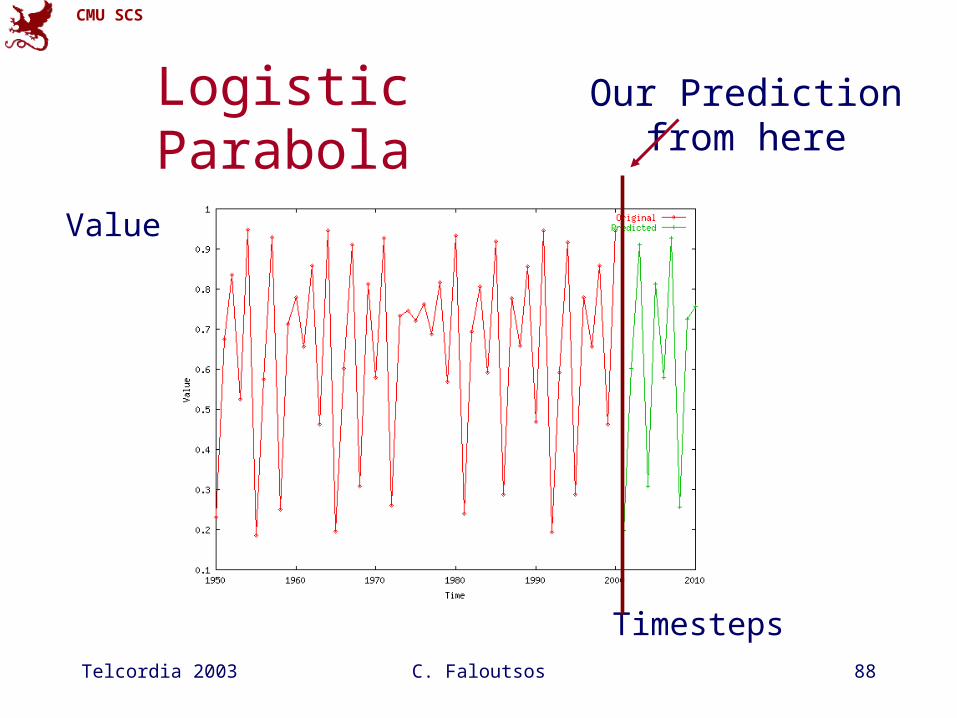
Logistic Parabola
Timesteps
Value
Our Prediction from here
Telcordia 2003 C. Faloutsos 89
CMU SCS
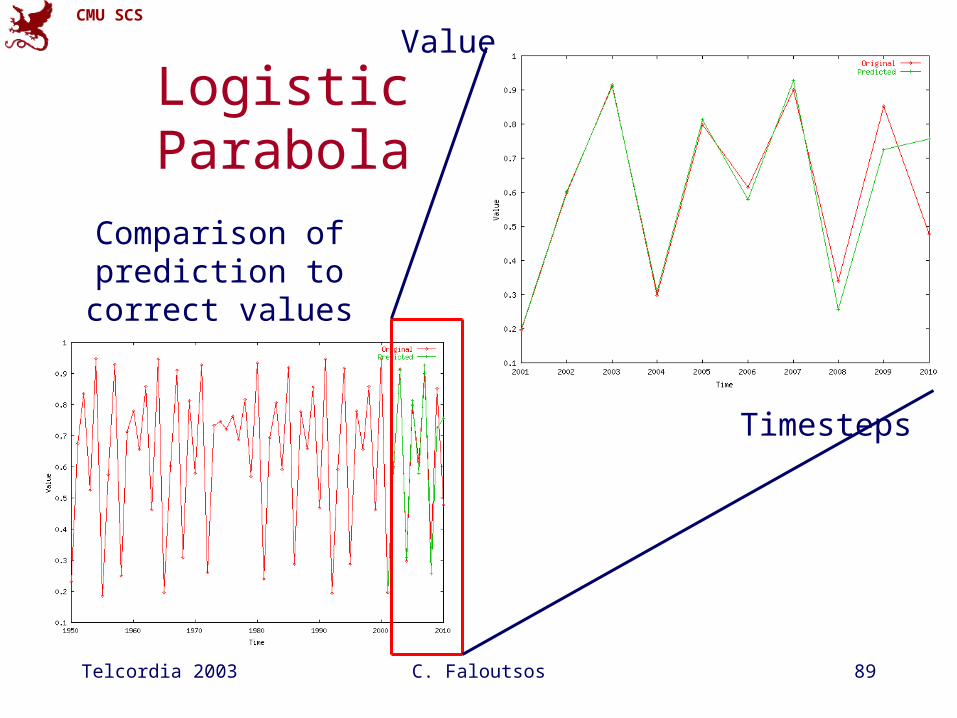
Logistic Parabola
Timesteps
Value
Comparison of prediction to correct values
Telcordia 2003 C. Faloutsos 90
CMU SCS
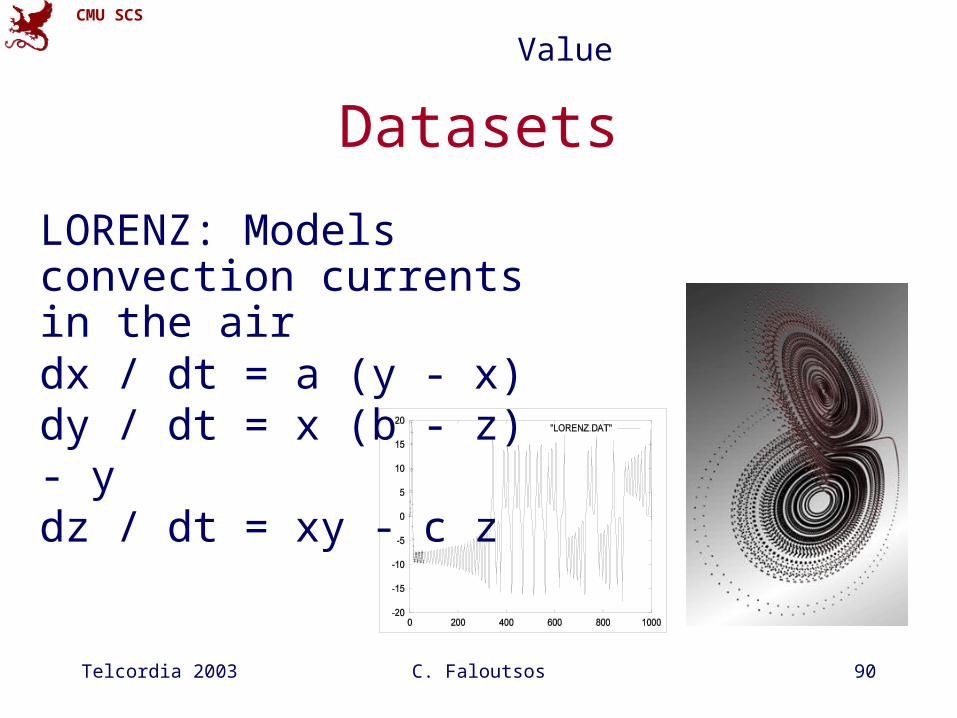
Datasets
LORENZ: Models convection currents in the airdx / dt = a (y - x) dy / dt = x (b - z) - y dz / dt = xy - c z
Value
Telcordia 2003 C. Faloutsos 91
CMU SCS
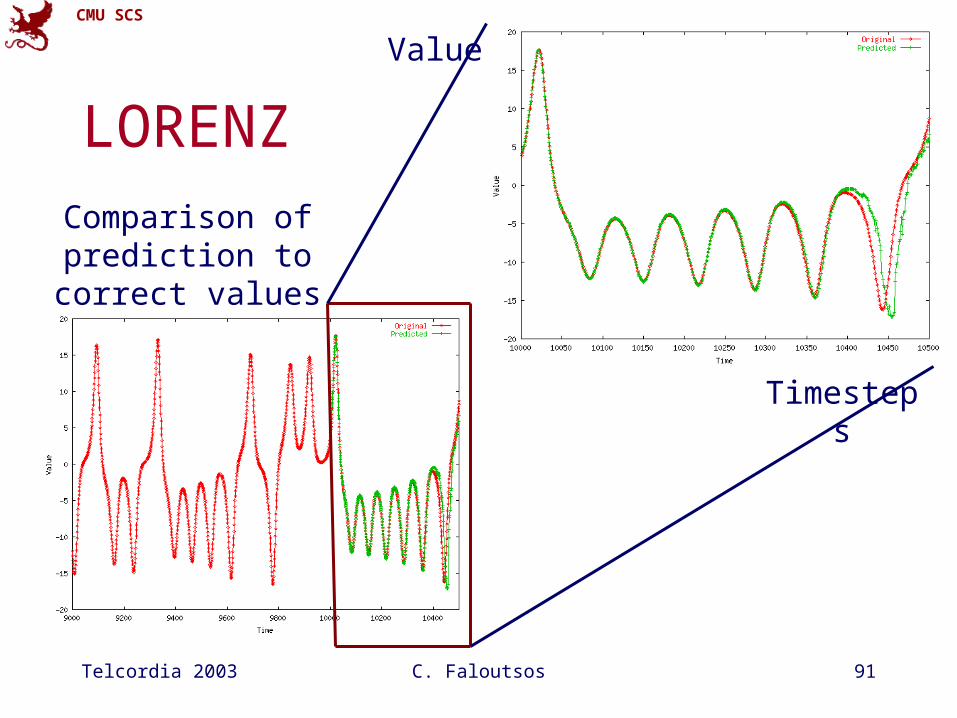
LORENZ
Timesteps
Value
Comparison of prediction to correct values

Telcordia 2003 C. Faloutsos 92
CMU SCS
Datasets
Time
Value
• LASER: fluctuations in a Laser over time (used in Santa Fe competition)

Telcordia 2003 C. Faloutsos 93
CMU SCS
Laser
Timesteps
Value
Comparison of prediction to correct values
Telcordia 2003 C. Faloutsos 94
CMU SCS
Conclusions
• Lag plots for non-linear forecasting (Takens’ theorem)
• suitable for ‘chaotic’ signals

Telcordia 2003 C. Faloutsos 95
CMU SCS
Additional projects at CMU
• Graph/Network mining
• spatio-temporal mining - outliers
Telcordia 2003 C. Faloutsos 96
CMU SCS
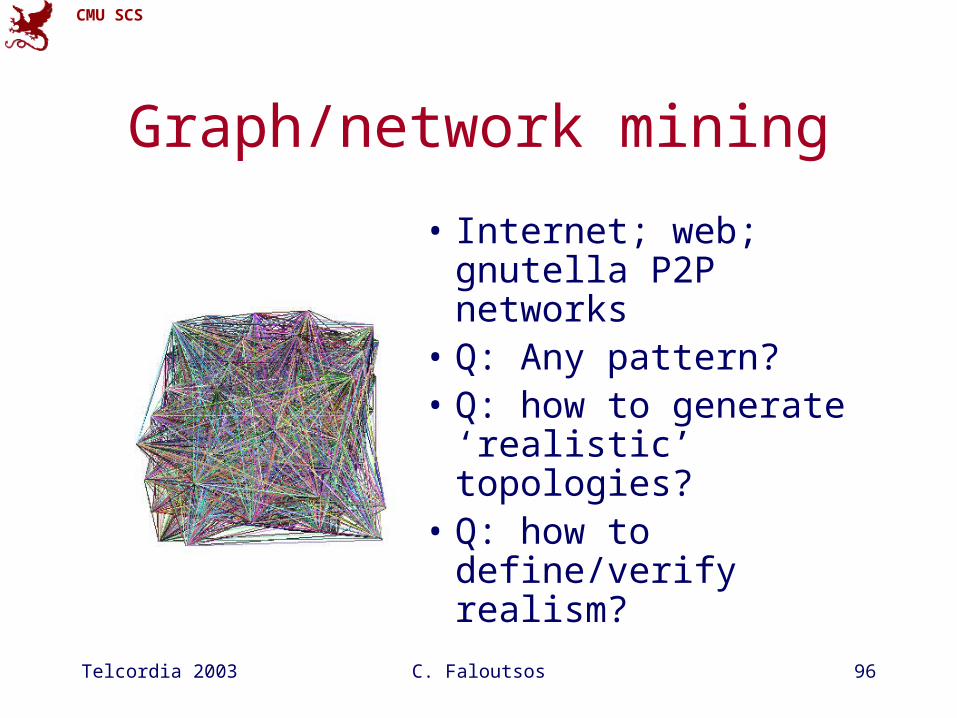
Graph/network mining
• Internet; web; gnutella P2P networks
• Q: Any pattern?• Q: how to generate
‘realistic’ topologies?• Q: how to define/verify
realism?
Telcordia 2003 C. Faloutsos 97
CMU SCS
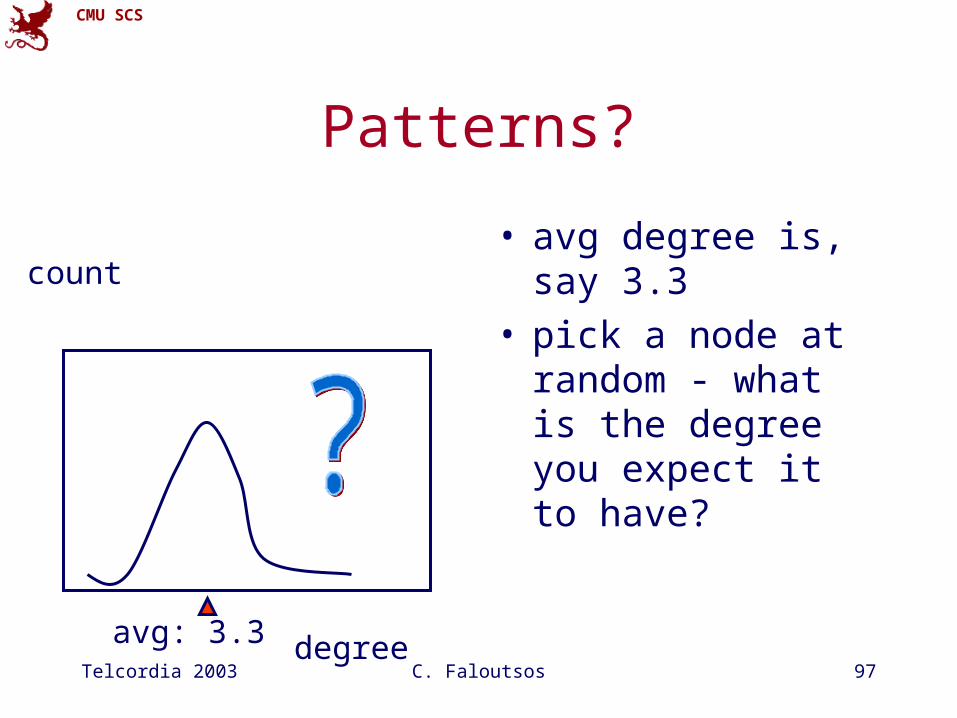
Patterns?
• avg degree is, say 3.3• pick a node at random
- what is the degree you expect it to have?
degree
count
avg: 3.3
Telcordia 2003 C. Faloutsos 98
CMU SCS
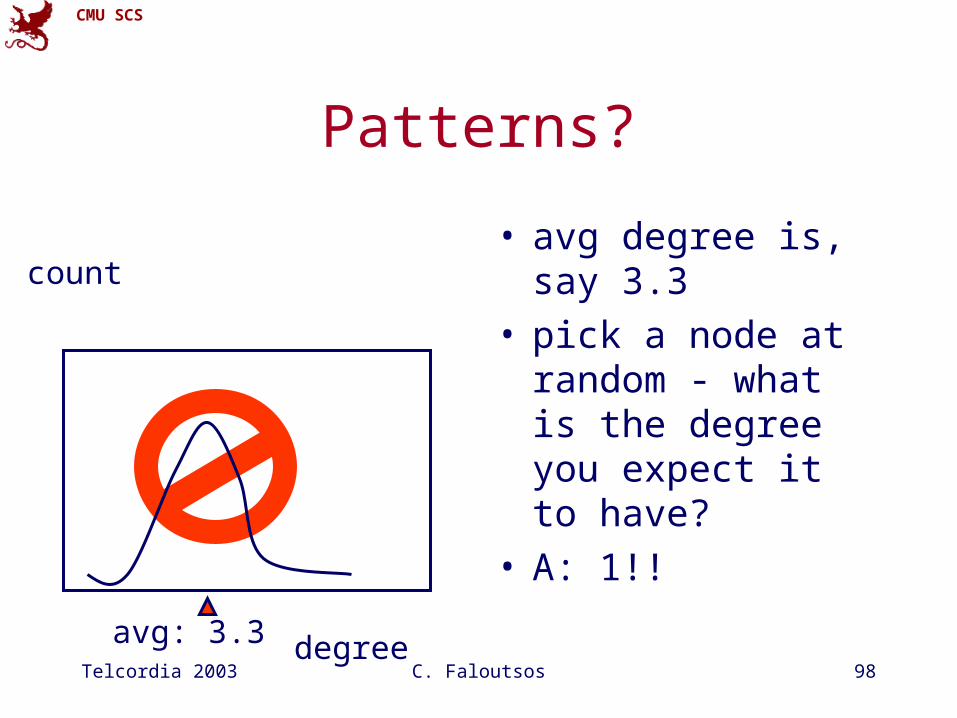
Patterns?
• avg degree is, say 3.3• pick a node at random
- what is the degree you expect it to have?
• A: 1!!
degree
count
avg: 3.3
Telcordia 2003 C. Faloutsos 99
CMU SCS
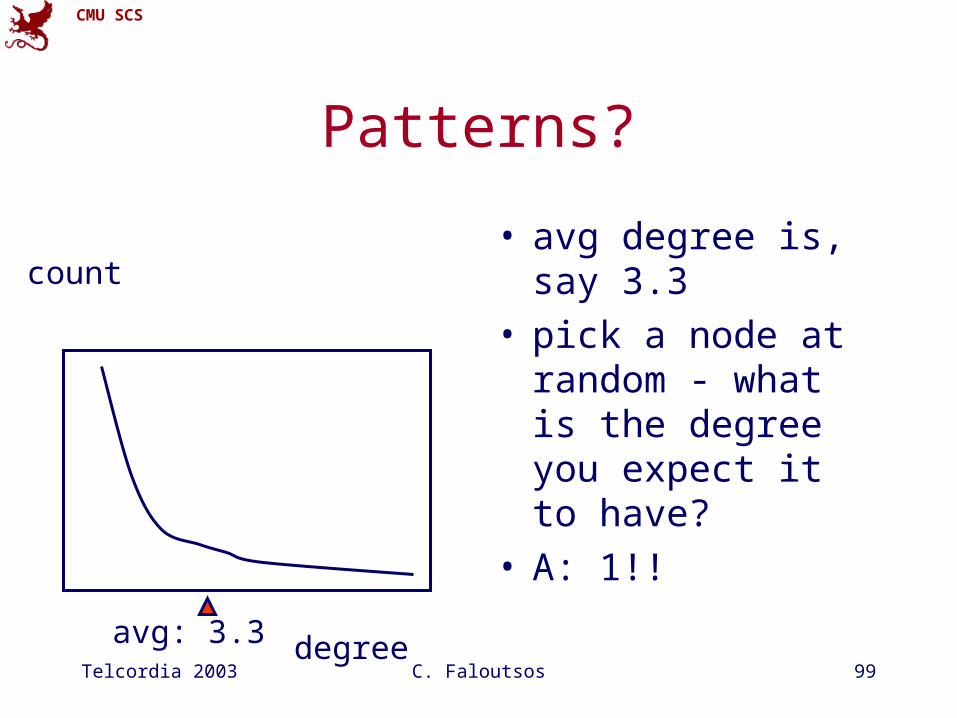
Patterns?
• avg degree is, say 3.3• pick a node at random
- what is the degree you expect it to have?
• A: 1!!
degree
count
avg: 3.3

Telcordia 2003 C. Faloutsos 100
CMU SCS
Patterns?
• A: Power laws!
log {(out) degree}
log(count)

Telcordia 2003 C. Faloutsos 101
CMU SCS
Other ‘laws’?
Count vs Outdegree Count vs Indegree Hop-plot
Eigenvalue vs Rank “Network value” Stress
Effective Diameter
Telcordia 2003 C. Faloutsos 102
CMU SCS
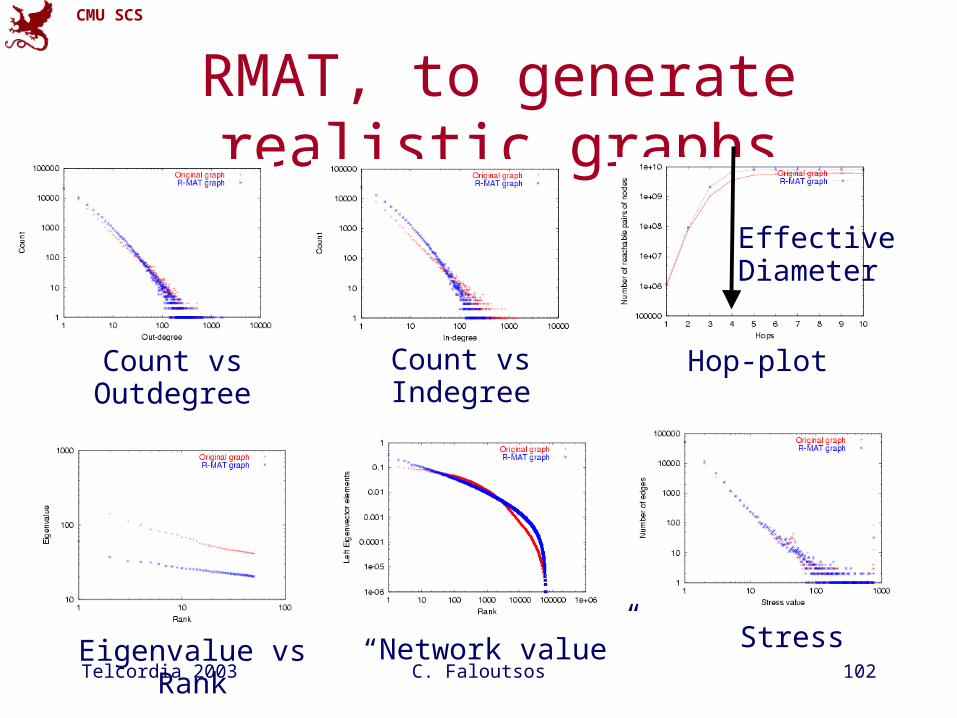
RMAT, to generate realistic graphs
Count vs Outdegree Count vs Indegree Hop-plot
Eigenvalue vs Rank “Network value” Stress
Effective Diameter
Telcordia 2003 C. Faloutsos 103
CMU SCS
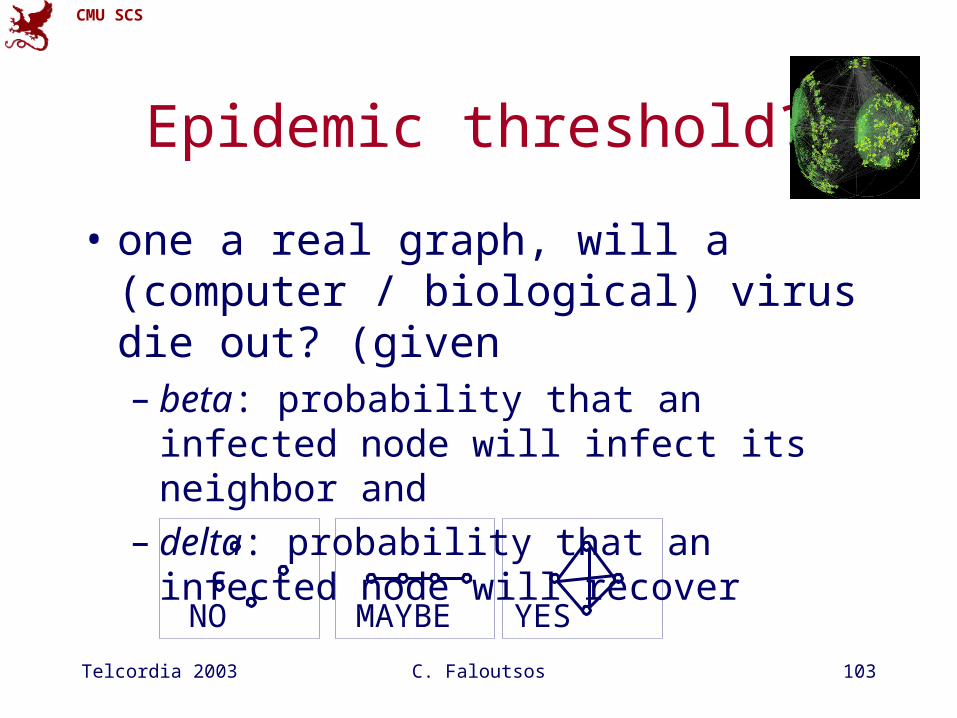
Epidemic threshold?
• one a real graph, will a (computer / biological) virus die out? (given– beta: probability that an infected node will
infect its neighbor and– delta: probability that an infected node will
recover
NO MAYBE YES
Telcordia 2003 C. Faloutsos 104
CMU SCS
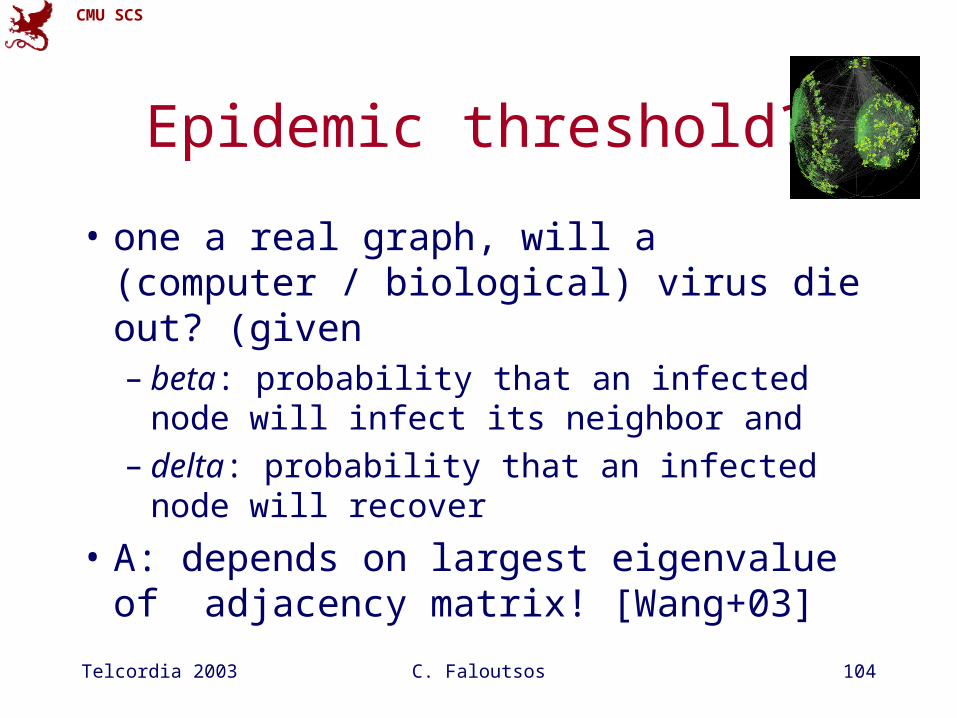
Epidemic threshold?
• one a real graph, will a (computer / biological) virus die out? (given– beta: probability that an infected node will
infect its neighbor and– delta: probability that an infected node will
recover
• A: depends on largest eigenvalue of adjacency matrix! [Wang+03]
Telcordia 2003 C. Faloutsos 105
CMU SCS
Additional projects
• Graph mining
• spatio-temporal mining - outliers
Telcordia 2003 C. Faloutsos 106
CMU SCS
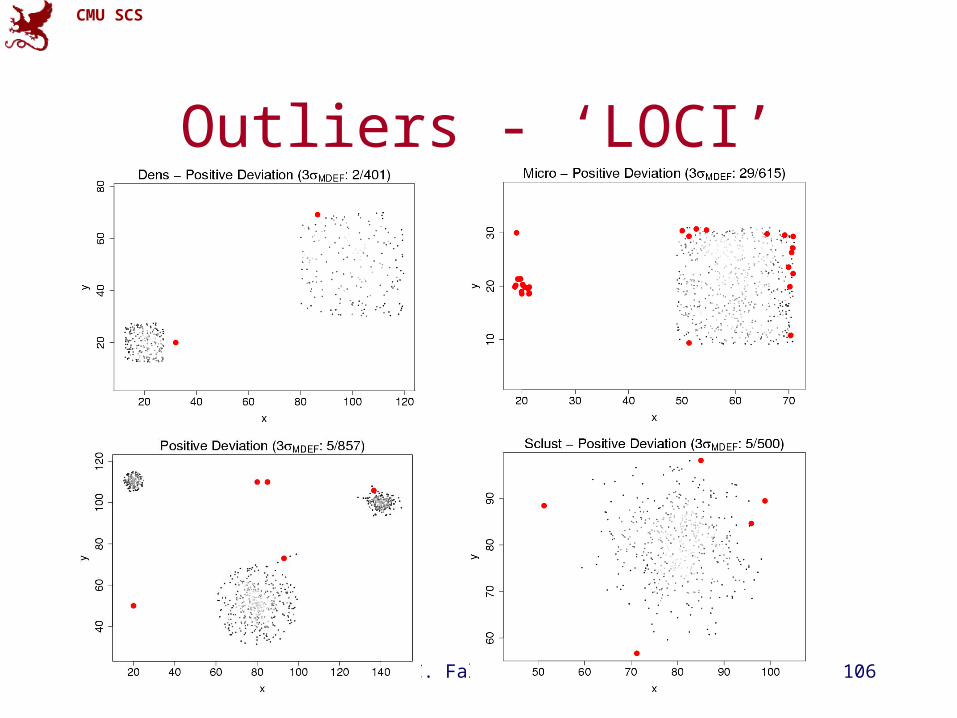
Outliers - ‘LOCI’
Telcordia 2003 C. Faloutsos 107
CMU SCS
Outliers - ‘LOCI’
• finds outliers quickly,
• with no human intervention

Telcordia 2003 C. Faloutsos 108
CMU SCS
Conclusions
• AWSOM for automatic, linear forecasting
• MUSCLES for co-evolving sequences
• F4 for non-linear forecasting
• Graph/Network topology: power laws and generators; epidemic threshold
• LOCI for outlier detection
Telcordia 2003 C. Faloutsos 109
CMU SCS
Conclusions• Overarching theme: automatic discovery of
patterns (outliers/rules) in– time sequences (sensors/streams)– graphs (computer/social networks)– multimedia (video, motion capture data etc)
www.cs.cmu.edu/[email protected]
Telcordia 2003 C. Faloutsos 110
CMU SCS
Books
• William H. Press, Saul A. Teukolsky, William T. Vetterling and Brian P. Flannery: Numerical Recipes in C, Cambridge University Press, 1992, 2nd Edition. (Great description, intuition and code for DFT, DWT)
• C. Faloutsos: Searching Multimedia Databases by Content, Kluwer Academic Press, 1996 (introduction to DFT, DWT)
Telcordia 2003 C. Faloutsos 111
CMU SCS
Books
• George E.P. Box and Gwilym M. Jenkins and Gregory C. Reinsel, Time Series Analysis: Forecasting and Control, Prentice Hall, 1994 (the classic book on ARIMA, 3rd ed.)
• Brockwell, P. J. and R. A. Davis (1987). Time Series: Theory and Methods. New York, Springer Verlag.
Telcordia 2003 C. Faloutsos 112
CMU SCS
Resources: software and urls
• MUSCLES: Prof. Byoung-Kee Yi:http://www.postech.ac.kr/~bkyi/or [email protected]
• AWSOM & LOCI: [email protected]• F4, RMAT: [email protected]
Telcordia 2003 C. Faloutsos 113
CMU SCS
Additional Reading
• [Chakrabarti+02] Deepay Chakrabarti and Christos Faloutsos F4: Large-Scale Automated Forecasting using Fractals CIKM 2002, Washington DC, Nov. 2002.
• [Chen+94] Chung-Min Chen, Nick Roussopoulos: Adaptive Selectivity Estimation Using Query Feedback. SIGMOD Conference 1994:161-172
• [Gilbert+01] Anna C. Gilbert, Yannis Kotidis and S. Muthukrishnan and Martin Strauss, Surfing Wavelets on Streams: One-Pass Summaries for Approximate Aggregate Queries, VLDB 2001
Telcordia 2003 C. Faloutsos 114
CMU SCS
Additional Reading
• Spiros Papadimitriou, Anthony Brockwell and Christos Faloutsos Adaptive, Hands-Off Stream Mining VLDB 2003, Berlin, Germany, Sept. 2003
• Spiros Papadimitriou, Hiroyuki Kitagawa, Phil Gibbons and Christos Faloutsos LOCI: Fast Outlier Detection Using the Local Correlation Integral ICDE 2003, Bangalore, India, March 5 - March 8, 2003.
• Sauer, T. (1994). Time series prediction using delay coordinate embedding. (in book by Weigend and Gershenfeld, below) Addison-Wesley.
Telcordia 2003 C. Faloutsos 115
CMU SCS
Additional Reading
• Takens, F. (1981). Detecting strange attractors in fluid turbulence. Dynamical Systems and Turbulence. Berlin: Springer-Verlag.
• Yang Wang, Deepayan Chakrabarti, Chenxi Wang and Christos Faloutsos Epidemic Spreading in Real Networks: An Eigenvalue Viewpoint 22nd Symposium on Reliable Distributed Computing (SRDS2003) Florence, Italy, Oct. 6-8, 2003
Telcordia 2003 C. Faloutsos 116
CMU SCS
Additional Reading
• Weigend, A. S. and N. A. Gerschenfeld (1994). Time Series Prediction: Forecasting the Future and Understanding the Past, Addison Wesley. (Excellent collection of papers on chaotic/non-linear forecasting, describing the algorithms behind the winners of the Santa Fe competition.)
• [Yi+00] Byoung-Kee Yi et al.: Online Data Mining for Co-Evolving Time Sequences, ICDE 2000. (Describes MUSCLES and Recursive Least Squares)
Related Documents


![Mining Billion-node Graphs: Patterns, Generators …christos/TALKS/10-PSU/FOILS/faloutsosPSU...CMU SCS C. Faloutsos (CMU) 5 Graphs - why should we care? Internet Map [lumeta.com] Food](https://static.cupdf.com/doc/110x72/5fd26c3fbbbad21df3533bc9/mining-billion-node-graphs-patterns-generators-christostalks10-psufoilsfaloutsospsu.jpg)