arXiv:astro-ph/0509308v1 12 Sep 2005 Clustering of Star-forming Galaxies Near a Radio Galaxy at z =5.2 1 Roderik A. Overzier 2 , G.K. Miley 2 , R.J. Bouwens 3 , N.J.G. Cross 4 , A.W. Zirm 2 , N. Ben´ ıtez 5 , J.P. Blakeslee 6 , M. Clampin 7 , R. Demarco 6 , H.C. Ford 6 , G.F. Hartig 8 , G.D. Illingworth 3 , A.R. Martel 6 , H.J.A. R¨ottgering 2 , B. Venemans 2 , D.R. Ardila 6 , F. Bartko 9 , L.D. Bradley 6 , T.J. Broadhurst 10 , D. Coe 6 , P.D. Feldman 6 , M. Franx 2 , D.A. Golimowski 6 , T. Goto 6 , C. Gronwall 11 , B. Holden 3 , N. Homeier 6 , L. Infante 12 R.A. Kimble 7 , J.E. Krist 13 , S. Mei 6 , F. Menanteau 6 , G.R. Meurer 6 , V. Motta 6,12 , M. Postman 8 , P. Rosati 14 , M. Sirianni 6 , W.B. Sparks 8 , H.D. Tran 15 , Z.I. Tsvetanov 6 , R.L. White 8 & W. Zheng 6 [email protected] ABSTRACT 1 Based on observations made with the NASA/ESA Hubble Space Telescope, which is operated by the Association of Universities for Research in Astronomy, Inc., under NASA contract NAS 5-26555. These observations are associated with program # 9291 2 Leiden Observatory, Postbus 9513, 2300 RA Leiden, Netherlands. 3 UCO/Lick Observatory, University of California, Santa Cruz, CA 95064. 4 Royal Observatory Edinburgh, Blackford Hill, Edinburgh, EH9 3HJ, UK 5 Inst. Astrof´ ısica de Andaluc´ ıa (CSIC), Camino Bajo de Hu´ etor, 24, Granada 18008, Spain 6 Department of Physics and Astronomy, The Johns Hopkins University, 3400 North Charles Street, Baltimore, MD 21218. 7 NASA Goddard Space Flight Center, Code 681, Greenbelt, MD 20771. 8 STScI, 3700 San Martin Drive, Baltimore, MD 21218. 9 Bartko Science & Technology, 14520 Akron Street, Brighton, CO 80602. 10 Racah Institute of Physics, The Hebrew University, Jerusalem, Israel 91904. 11 Department of Astronomy and Astrophysics, The Pennsylvania State University, 525 Davey Lab, Uni- versity Park, PA 16802. 12 Departmento de Astronom´ ıa y Astrof´ ısica, Pontificia Universidad Cat´olica de Chile, Casilla 306, Santiago 22, Chile. 13 Jet Propulsion Laboratory, M/S 183-900, 4800 Oak Grove Drive, Pasadena, CA 91109 14 European Southern Observatory, Karl-Schwarzschild-Strasse 2, D-85748 Garching, Germany. 15 W. M. Keck Observatory, 65-1120 Mamalahoa Hwy., Kamuela, HI 96743

Welcome message from author
This document is posted to help you gain knowledge. Please leave a comment to let me know what you think about it! Share it to your friends and learn new things together.
Transcript
arX
iv:a
stro
-ph/
0509
308v
1 1
2 Se
p 20
05
Clustering of Star-forming Galaxies Near a Radio Galaxy at
z = 5.21
Roderik A. Overzier2, G.K. Miley2, R.J. Bouwens3, N.J.G. Cross4, A.W. Zirm2, N.
Benıtez5, J.P. Blakeslee6, M. Clampin7, R. Demarco6, H.C. Ford6, G.F. Hartig8, G.D.
Illingworth3, A.R. Martel6, H.J.A. Rottgering2, B. Venemans2, D.R. Ardila6, F. Bartko9,
L.D. Bradley6, T.J. Broadhurst10, D. Coe6, P.D. Feldman6, M. Franx2, D.A. Golimowski6,
T. Goto6, C. Gronwall11, B. Holden3, N. Homeier6, L. Infante12 R.A. Kimble7, J.E. Krist13,
S. Mei6, F. Menanteau6, G.R. Meurer6, V. Motta6,12, M. Postman8, P. Rosati14, M.
Sirianni6, W.B. Sparks8, H.D. Tran15, Z.I. Tsvetanov6, R.L. White8 & W. Zheng6
ABSTRACT
1Based on observations made with the NASA/ESA Hubble Space Telescope, which is operated by the
Association of Universities for Research in Astronomy, Inc., under NASA contract NAS 5-26555. These
observations are associated with program # 9291
2Leiden Observatory, Postbus 9513, 2300 RA Leiden, Netherlands.
3UCO/Lick Observatory, University of California, Santa Cruz, CA 95064.
4Royal Observatory Edinburgh, Blackford Hill, Edinburgh, EH9 3HJ, UK
5Inst. Astrofısica de Andalucıa (CSIC), Camino Bajo de Huetor, 24, Granada 18008, Spain
6Department of Physics and Astronomy, The Johns Hopkins University, 3400 North Charles Street,
Baltimore, MD 21218.
7NASA Goddard Space Flight Center, Code 681, Greenbelt, MD 20771.
8STScI, 3700 San Martin Drive, Baltimore, MD 21218.
9Bartko Science & Technology, 14520 Akron Street, Brighton, CO 80602.
10Racah Institute of Physics, The Hebrew University, Jerusalem, Israel 91904.
11Department of Astronomy and Astrophysics, The Pennsylvania State University, 525 Davey Lab, Uni-
versity Park, PA 16802.
12Departmento de Astronomıa y Astrofısica, Pontificia Universidad Catolica de Chile, Casilla 306, Santiago
22, Chile.
13Jet Propulsion Laboratory, M/S 183-900, 4800 Oak Grove Drive, Pasadena, CA 91109
14European Southern Observatory, Karl-Schwarzschild-Strasse 2, D-85748 Garching, Germany.
15W. M. Keck Observatory, 65-1120 Mamalahoa Hwy., Kamuela, HI 96743
– 2 –
We present HST/ACS observations of the most distant radio galaxy known,
TN J0924–2201 at z = 5.2. This radio galaxy has 6 spectroscopically confirmed
Lyα emitting companion galaxies, and appears to lie within an overdense region.
The radio galaxy is marginally resolved in i775 and z850 showing continuum emis-
sion aligned with the radio axis, similar to what is observed for lower redshift
radio galaxies. Both the half-light radius and the UV star formation rate are
comparable to the typical values found for Lyman break galaxies at z ∼ 4 − 5.
The Lyα emitters are sub-L∗ galaxies, with deduced star formation rates of 1−10
M⊙ yr−1. One of the Lyα emitters is only detected in Lyα. Based on the star
formation rate of ∼ 3 M⊙ yr−1 calculated from Lyα, the lack of continuum emis-
sion could be explained if the galaxy is younger than ∼ 2 Myr and is producing
its first stars.
Observations in V606i775z850 were used to identify additional Lyman break
galaxies associated with this structure. In addition to the radio galaxy, there are
22 V606-break (z ∼ 5) galaxies with z850<26.5 (5σ), two of which are also in the
spectroscopic sample. We compare the surface density of ∼ 2 arcmin−2 to that
of similarly selected V606-dropouts extracted from GOODS and the UDF Parallel
fields. We find evidence for an overdensity to very high confidence (> 99%), based
on a counts-in-cells analysis applied to the control field. The excess is suggestive
of the V606-break objects being associated with a forming cluster around the radio
galaxy.
Subject headings: cosmology: observations – early universe – large-scale structure
of universe – galaxies: high-redshift – galaxies: clusters: general – galaxies:
starburst – galaxies: individual (TN J0924–2201)
1. Introduction
Where can we find the progenitors of the galaxy clusters that populate the local Uni-
verse? The evolution of rich galaxy clusters has been studied out to z ∼ 1.4 (Mullis et al.
2005). These clusters have been discovered primarily via their bright X-ray emission, the
signature of virialised gas within a deep gravitational potential well. Follow-up observations
have revealed that some of the galaxy populations in distant clusters are relatively old, as
evidenced by, for example, the tight scatter in the color-magnitude relation for early-type
galaxies (e.g. Stanford et al. 1998; Blakeslee et al. 2003a; Wuyts et al. 2004; Holden et al.
2005), and the mild evolution of the morphology density relation for cluster ellipticals since
z ∼ 1 (Postman et al. 2005). This suggests that an interesting epoch of cluster forma-
– 3 –
tion could lie at higher redshifts. Several good examples for overdensities of galaxies at
1.5 . z . 6, possibly the progenitors of clusters, exist in the literature (e.g. Pascarelle et al.
1996; Steidel et al. 1998; Keel et al. 1999; Steidel et al. 2000; Francis et al. 2001; Moller &
Fynbo 2001; Sanchez & Gonzalez-Serrano 2002; Shimasaku et al. 2003; Ouchi et al. 2005;
Steidel et al. 2005). These structures have been found often as by-products of large-area
field surveys using broad or narrow band imaging, or by targeting luminous radio sources.
One technique for finding distant galaxy overdensities is based on the empirical evidence
that powerful radio galaxies are among the most massive forming galaxies at high redshift
(e.g. De Breuck et al. 2002; Dey et al. 1997; Pentericci et al. 2001; Zirm et al. 2003). In the
standard cold dark matter (CDM) universe model, massive galaxies and galaxy clusters are
associated with the most massive dark matter haloes within the large-scale structure. It has
been found that massive black holes are a key-ingredient of local massive galaxies, and that
their mass scales in proportion to the mass of the spheroidal component of the host galaxy
(Magorrian et al. 1998; Gebhardt et al. 2000; Ferrarese & Merritt 2000). Radio galaxies
may therefore demarcate the location of forming clusters, analogous to the suggested scaling
relations between halo, host galaxy and black hole mass at low redshift. A program with
the Very Large Telescope (VLT) of the European Southern Observatory to search for galaxy
overdensities around luminous high-redshift radio galaxies through deep narrow band Lyα
imaging and spectroscopy has indeed revealed that the radio galaxies are often accompanied
by large numbers of line emitting galaxies (Pentericci et al. 2000; Kurk et al. 2003; Venemans
et al. 2002, 2004, 2005).
We have started a study with the Advanced Camera for Surveys on the Hubble Space
Telescope (HST/ACS; Ford et al. 1998) to survey some of these Lyα-selected protoclusters1.
Our goal is to augment our study of emission line objects by deep broad band observations
to search for Lyman break galaxies (LBGs). Observations of the radio galaxy protocluster
TN J1338–1942 at z = 4.1 have shown that the overdensity of Lyα emitters discovered by
Venemans et al. (2002) is accompanied by a similar overdensity of Lyman break galaxies,
allowing us to assess distinct galaxy populations in overdense regions (Miley et al. 2004,
Overzier et al., in prep.). The radio galaxy TN J1338–1942 was found to have a complex
morphology, showing clear signs of AGN feedback on the forming ISM and a starburst-driven
wind possibly feeding the gaseous halo that surrounds the galaxy (Zirm et al. 2005). The
Lyα emitters have relatively faint UV continua and small angular sizes compared to the
generally brighter LBG population in field studies (e.g. Ferguson et al. 2004; Bouwens et al.
1The term protocluster has no strict definition in literature. It is commonly used to describe galaxy
overdensities at high redshift with mass estimates that are comparable to those of galaxy clusters, but
without any detectable X-ray emission from a hot, virialised intra-cluster medium.
– 4 –
2004a).
TN J0924–2201 at z = 5.19 is the most distant radio galaxy known (van Breugel et al.
1999; De Breuck et al. 2000). Following the successes obtained in identifying Lyα galaxy
overdensities around our sample of powerful high redshift radio galaxies at 2.2 < z < 4.1,
Venemans et al. (2004) have probed the distribution of Lyα emitters around TN J0924–
2201: there are 6 spectroscopically confirmed companions within a (projected) radius of
2.5 Mpc and a (rest-frame) 1000 km s−1 from the radio galaxy, corresponding to a surface
overdensity of 1.5–6 with respect to the field. This overdensity is comparable to that of
radio galaxy/Lyα protoclusters at lower z, and is in support of the idea that radio galaxies
conspicuously identify groups or cluster-like regions in the very early Universe.
In this paper we present the results of a follow-up study of the galaxy overdensity near
TN J0924–2201 through high resolution imaging observations obtained with HST/ACS. The
primary goal of these observations was to look for an enhancement in the surface density of
Lyman break galaxies in the field of TN J0924–2201, which would generally be missed by
the selection based on the presence of a Lyα emission line alone. LBGs and Lyα emitters
are strongly clustered at z = 3 − 5, and are highly biased relative to predictions for the
dark matter distribution (Giavalisco et al. 1998; Adelberger et al. 1998; Ouchi et al. 2004b).
The biasing becomes stronger for galaxies with higher rest-frame UV luminosity (Giavalisco
& Dickinson 2001). In an excellent, all-encompassing census of the clustering properties of
LBGs, Ouchi et al. (2004b) found that the bias may also increase with redshift and dust
extinction, in addition to UV luminosity. By comparing the number densities of LBGs to
that of dark halos predicted by Sheth & Tormen (1999) they concluded that z = 4 LBGs
could be hosted by halos of 1 × 10¹¹ − 5 × 10¹² M⊙ (see also Hamana et al. 2004), and that
the descendants of those halos at z = 0 have masses that are comparable to the masses of
groups and clusters.
The structure of this paper is as follows. In Section 2 we describe our observations and
data analysis. Section 3 subsequently deals with the host galaxy of the radio source, the
spectroscopically confirmed Lyα emitters, and our sample of z ∼ 5 Lyman break galaxies.
In Section 4 we discuss the evidence that suggests that TN J0924–2201 may pinpoint a
young galaxy cluster, and we present our conclusions in Section 5. We use a cosmology in
which H0 = 72 km s−1 Mpc−1, ΩM = 0.27, and ΩΛ = 0.73 (Spergel et al. 2003). In this
Universe, the luminosity distance is 49.2 Gpc and the angular scale size is 6.2 kpc arcsec−1
at z = 5.2. The lookback time is 12.2 Gyr, corresponding to an epoch when the Universe
was approximately 8% of its current age.
– 5 –
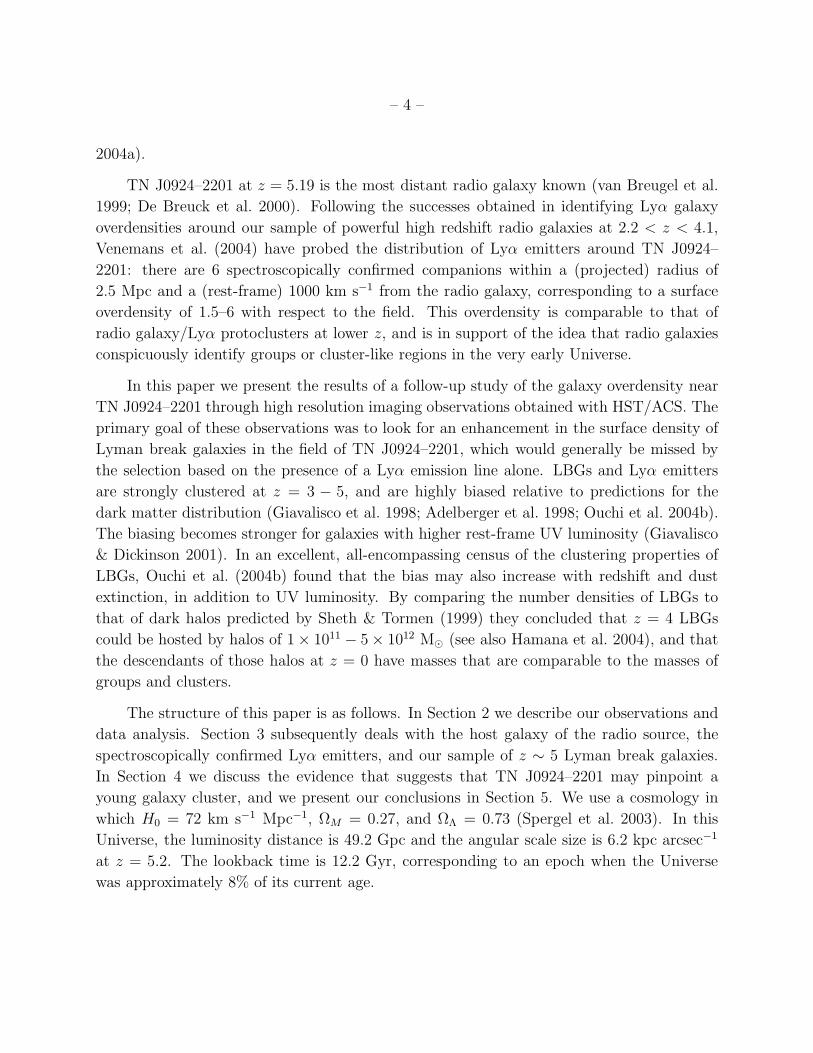
Fig. 1.— Total effective throughput of the HST/ACS filterset used in our observations. The
SED template shown is the SB2 template from Benıtez (2000), redshifted to z = 5.19 taking
into account the attenuation of the IGM following the prescription of Madau et al. (1996).
The Lyman break occurs between filters V606 and i775 for galaxies at z ∼ 5.
2. ACS Observations, data reduction and photometry
2.1. TN J0924–2201
We surveyed the field surrounding TN J0924–2201 with a single pointing of the Wide-
Field Channel (WFC) of HST/ACS. The field position was chosen in order to maximize the
number of spectroscopically-confirmed Lyα emitters in the field. The radio galaxy is located
at αJ2000 = 9h24m19.90s, δJ2000 = −2201′42.0′′, and 4 of the Lyα emitters fall within the
11.7 arcmin2 field. The field has an extinction value E(B −V ) = 0.057 determined from the
dust maps of Schlegel et al. (1998). The observations were carried out between 29 May and
8 June 2003, as part of the ACS Guaranteed Time Observing (GTO) high redshift cluster
program. The total observing time of 14 orbits was split over the V606 (9400 s), i775 (11800
s) and z850 (11800 s) broad-band filters, bracketing redshifted Lyα at 7527 A. The filter
transmission curves are indicated in Fig. 1. Each orbit was split into two 1200 s exposures
to facilitate the removal of cosmic rays. A color image of the field is shown in Fig. 2.
The data were processed through CALACS at STScI and the ACS pipeline science
investigation software Apsis (Blakeslee et al. 2003b) that was developed by and for the ACS
GTO team. By default Apsis provides final drizzled images with a pixel scale of 0.′′05 pixel−1.
However, to match the image scale of the public data release of the GOODS data (our main
comparison dataset), we drizzled the science images onto a frame with a pixel scale of 0.′′03
pixel−1. Fig. 3 (left panels) shows the limiting magnitudes for each filter as a function of
– 6 –
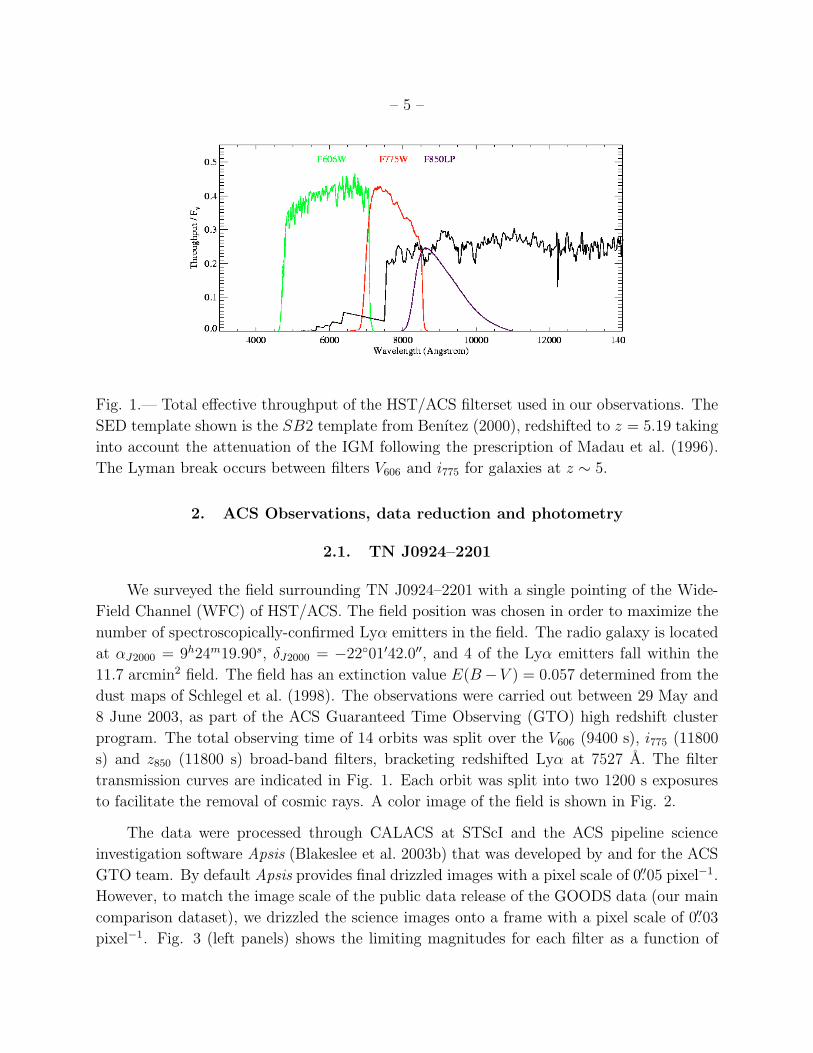
Fig. 2.— ACS color image showing V606 in blue, i775 in green and z850 in red. The field
measures 11.7 arcmin2. The approximate position of the radio galaxy is marked ‘RG’.
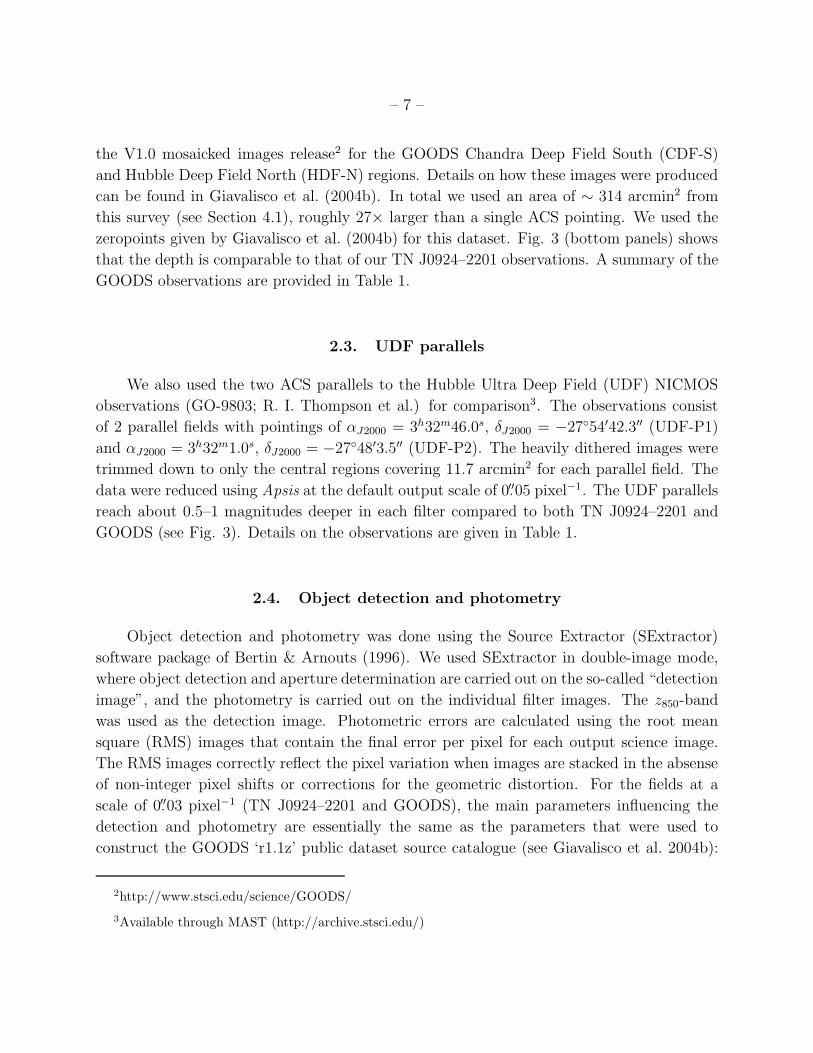
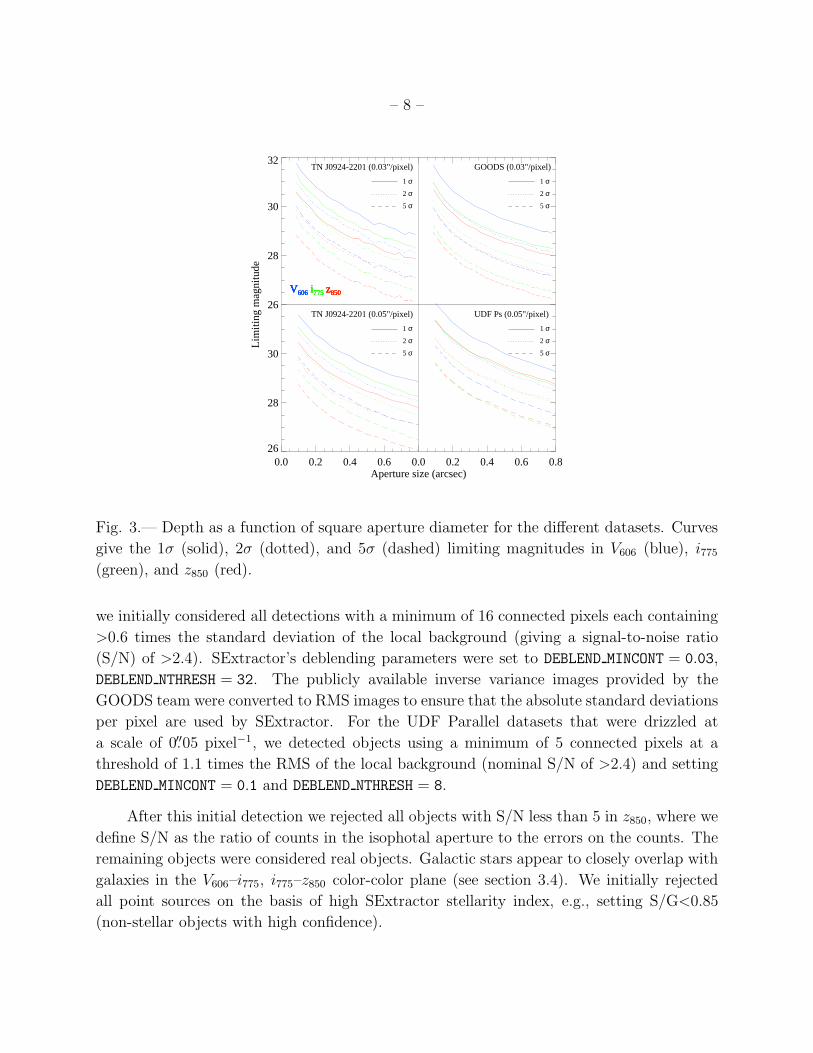
aperture diameter and signal-to-noise. The 2σ limiting magnitudes in a square aperture of
0.2 arcsec2 are ∼ 29.0 in V606, ∼ 28.5 in i775, and ∼ 28.0 in z850. There is no significant
difference in the detection limits for the 0.′′05 pixel−1 dataset and the 0.′′03 pixel−1 dataset.
The total filter exposure times, extinctions and zeropoints (Sirianni et al. 2005) are listed in
Table 1.
2.2. GOODS public data
We used the public imaging data from the Great Observatories Origins Deep Survey
(GOODS; Giavalisco et al. 2004b) as a control field for our data. Similar to TN J0924–2201,
GOODS has observations in V606, i775 and z850, and is comparably deep. We downloaded
– 7 –
the V1.0 mosaicked images release2 for the GOODS Chandra Deep Field South (CDF-S)
and Hubble Deep Field North (HDF-N) regions. Details on how these images were produced
can be found in Giavalisco et al. (2004b). In total we used an area of ∼ 314 arcmin2 from
this survey (see Section 4.1), roughly 27× larger than a single ACS pointing. We used the
zeropoints given by Giavalisco et al. (2004b) for this dataset. Fig. 3 (bottom panels) shows
that the depth is comparable to that of our TN J0924–2201 observations. A summary of the
GOODS observations are provided in Table 1.
2.3. UDF parallels
We also used the two ACS parallels to the Hubble Ultra Deep Field (UDF) NICMOS
observations (GO-9803; R. I. Thompson et al.) for comparison3. The observations consist
of 2 parallel fields with pointings of αJ2000 = 3h32m46.0s, δJ2000 = −2754′42.3′′ (UDF-P1)
and αJ2000 = 3h32m1.0s, δJ2000 = −2748′3.5′′ (UDF-P2). The heavily dithered images were
trimmed down to only the central regions covering 11.7 arcmin2 for each parallel field. The
data were reduced using Apsis at the default output scale of 0.′′05 pixel−1. The UDF parallels
reach about 0.5–1 magnitudes deeper in each filter compared to both TN J0924–2201 and
GOODS (see Fig. 3). Details on the observations are given in Table 1.
2.4. Object detection and photometry
Object detection and photometry was done using the Source Extractor (SExtractor)
software package of Bertin & Arnouts (1996). We used SExtractor in double-image mode,
where object detection and aperture determination are carried out on the so-called “detection
image”, and the photometry is carried out on the individual filter images. The z850-band
was used as the detection image. Photometric errors are calculated using the root mean
square (RMS) images that contain the final error per pixel for each output science image.
The RMS images correctly reflect the pixel variation when images are stacked in the absense
of non-integer pixel shifts or corrections for the geometric distortion. For the fields at a
scale of 0.′′03 pixel−1 (TN J0924–2201 and GOODS), the main parameters influencing the
detection and photometry are essentially the same as the parameters that were used to
construct the GOODS ‘r1.1z’ public dataset source catalogue (see Giavalisco et al. 2004b):
2http://www.stsci.edu/science/GOODS/
3Available through MAST (http://archive.stsci.edu/)
– 8 –
0.0 0.2 0.4 0.6 0.0 0.2 0.4 0.6 0.8Aperture size (arcsec)
26
28
30
26
28
30
32
Lim
iting
mag
nitu
de
1 σ
2 σ
5 σ
V606 i775 z850
TN J0924-2201 (0.03"/pixel)
1 σ
2 σ
5 σ
V606 i775 z850
GOODS (0.03"/pixel)
1 σ
2 σ
5 σ
V606 i775 z850
TN J0924-2201 (0.05"/pixel)
1 σ
2 σ
5 σ
V606 i775 z850
UDF Ps (0.05"/pixel)
Fig. 3.— Depth as a function of square aperture diameter for the different datasets. Curves
give the 1σ (solid), 2σ (dotted), and 5σ (dashed) limiting magnitudes in V606 (blue), i775(green), and z850 (red).
we initially considered all detections with a minimum of 16 connected pixels each containing
>0.6 times the standard deviation of the local background (giving a signal-to-noise ratio
(S/N) of >2.4). SExtractor’s deblending parameters were set to DEBLEND MINCONT = 0.03,
DEBLEND NTHRESH = 32. The publicly available inverse variance images provided by the
GOODS team were converted to RMS images to ensure that the absolute standard deviations
per pixel are used by SExtractor. For the UDF Parallel datasets that were drizzled at
a scale of 0.′′05 pixel−1, we detected objects using a minimum of 5 connected pixels at a
threshold of 1.1 times the RMS of the local background (nominal S/N of >2.4) and setting
DEBLEND MINCONT = 0.1 and DEBLEND NTHRESH = 8.
After this initial detection we rejected all objects with S/N less than 5 in z850, where we
define S/N as the ratio of counts in the isophotal aperture to the errors on the counts. The
remaining objects were considered real objects. Galactic stars appear to closely overlap with
galaxies in the V606–i775, i775–z850 color-color plane (see section 3.4). We initially rejected
all point sources on the basis of high SExtractor stellarity index, e.g., setting S/G<0.85
(non-stellar objects with high confidence).
– 9 –
2 1 0 -1 -2 ∆ RA (arcsec)
-2
-1
0
1
2
∆ D
ec (
arcs
ec)
2 1 0 -1 -2 ∆ RA (arcsec)
-2
-1
0
1
2
∆ D
ec (
arcs
ec)
2 1 0 -1 -2 ∆ RA (arcsec)
-2
-1
0
1
2
∆ D
ec (
arcs
ec)
i775
2 1 0 -1 -2 ∆ RA (arcsec)
-2
-1
0
1
2
∆ D
ec (
arcs
ec)
2 1 0 -1 -2 ∆ RA (arcsec)
-2
-1
0
1
2
∆ D
ec (
arcs
ec)
2 1 0 -1 -2 ∆ RA (arcsec)
-2
-1
0
1
2
∆ D
ec (
arcs
ec)
z850
2 1 0 -1 -2 ∆ RA (arcsec)
-2
-1
0
1
2
∆ D
ec (
arcs
ec)
2 1 0 -1 -2 ∆ RA (arcsec)
-2
-1
0
1
2
∆ D
ec (
arcs
ec)
2 1 0 -1 -2 ∆ RA (arcsec)
-2
-1
0
1
2
∆ D
ec (
arcs
ec)
i775 + Lyα 2 1 0 -1 -2
∆ RA (arcsec)
-2
-1
0
1
2
∆ D
ec (
arcs
ec)
2 1 0 -1 -2 ∆ RA (arcsec)
-2
-1
0
1
2
∆ D
ec (
arcs
ec)
2 1 0 -1 -2 ∆ RA (arcsec)
-2
-1
0
1
2
∆ D
ec (
arcs
ec)
z850 + 5 GHz
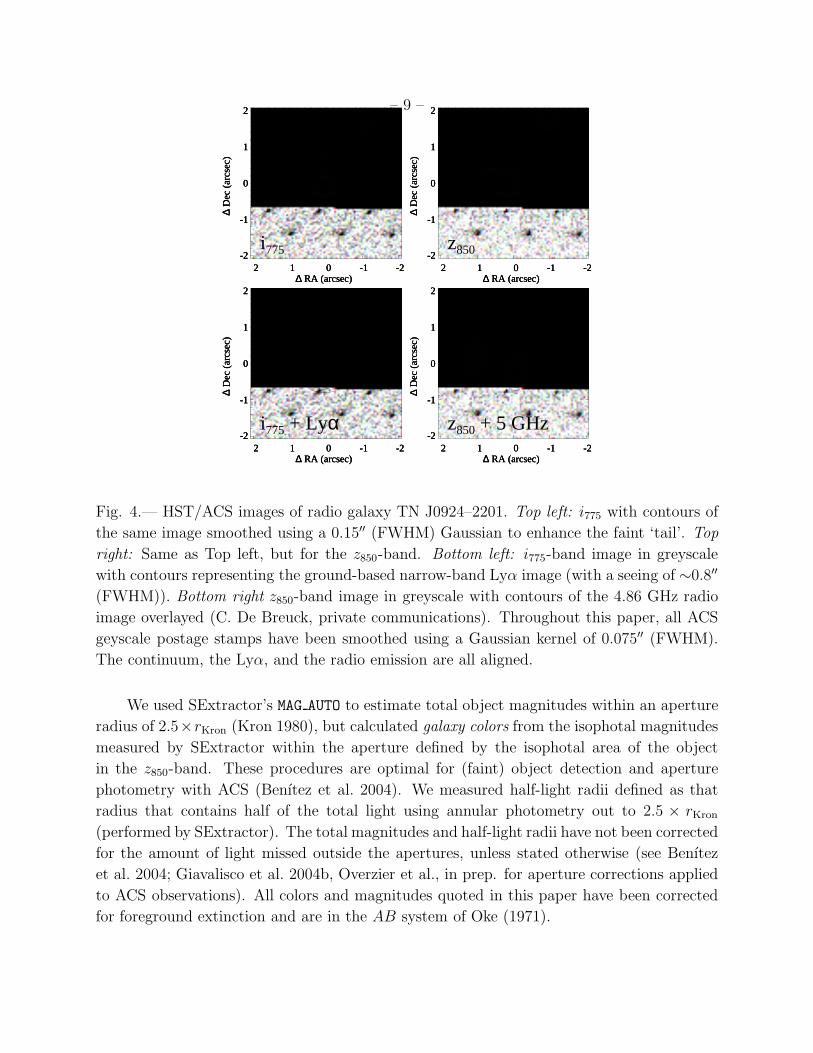
Fig. 4.— HST/ACS images of radio galaxy TN J0924–2201. Top left: i775 with contours of
the same image smoothed using a 0.15′′ (FWHM) Gaussian to enhance the faint ‘tail’. Top
right: Same as Top left, but for the z850-band. Bottom left: i775-band image in greyscale
with contours representing the ground-based narrow-band Lyα image (with a seeing of ∼0.8′′
(FWHM)). Bottom right z850-band image in greyscale with contours of the 4.86 GHz radio
image overlayed (C. De Breuck, private communications). Throughout this paper, all ACS
geyscale postage stamps have been smoothed using a Gaussian kernel of 0.075′′ (FWHM).
The continuum, the Lyα, and the radio emission are all aligned.
We used SExtractor’s MAG AUTO to estimate total object magnitudes within an aperture
radius of 2.5×rKron (Kron 1980), but calculated galaxy colors from the isophotal magnitudes
measured by SExtractor within the aperture defined by the isophotal area of the object
in the z850-band. These procedures are optimal for (faint) object detection and aperture
photometry with ACS (Benıtez et al. 2004). We measured half-light radii defined as that
radius that contains half of the total light using annular photometry out to 2.5 × rKron
(performed by SExtractor). The total magnitudes and half-light radii have not been corrected
for the amount of light missed outside the apertures, unless stated otherwise (see Benıtez
et al. 2004; Giavalisco et al. 2004b, Overzier et al., in prep. for aperture corrections applied
to ACS observations). All colors and magnitudes quoted in this paper have been corrected
for foreground extinction and are in the AB system of Oke (1971).
– 10 –
2.5. Photometric redshifts
We used the Bayesian Photometric Redshift code (BPZ) of Benıtez (2000) to obtain
estimates for galaxy redshifts, zB. For a complete description of BPZ and the robustness
of its results, we refer the reader to Benıtez (2000) and Benıtez et al. (2004). Our library
of galaxy spectra is based on the elliptical, intermediate (Sbc) and late type spiral (Scd),
and irregular templates of Coleman et al. (1980), augmented by starburst galaxy templates
with E(B − V ) ∼ 0.3 (SB2) and E(B − V ) ∼ 0.45 (SB3) from Kinney et al. (1996), and
two simple stellar population (SSP) models with ages of 5 Myr and 25 Myr from Bruzual &
Charlot (2003). The latter two templates have been found to improve the accuracy of BPZ
for very blue, young high redshift galaxies in the UDF (Coe et al., in prep.). BPZ makes
use of a parameter ‘ODDS’ defined as P (|z− zB | < ∆z) that gives the total probability that
the true redshift is within an uncertainty ∆z. For a Gaussian probability distribution a 2σ
confidence interval centered on zB would get an ODDS of > 0.95. The empirical accuracy
of BPZ is σ ≈ 0.1(1 + zB) for objects with I814 . 24 and z . 4 observed in the B435V606I814-
bands with ACS to a depth comparable to our observations (Benıtez et al. 2004). Note that
we will be applying BPZ to generally fainter objects at z ∼ 5 observed in (B435)V606i775z850.
The true accuracy for such a sample has yet to be determined empirically.
3. Results
3.1. Radio galaxy TN J0924–2201
The radio galaxy was not detected in V606 due to the attenuation of flux shortward of
Lyα by the intergalactic medium (IGM). We derive a 2σ upper limit of 28.3 magnitude within
rKron. The galaxy is detected in the other filters with total magnitudes of i775= 26.0 ± 0.1
and z850= 25.5 ± 0.1, and colors of V606–i775> 2.7 and i775–z850= 0.4 ± 0.1 (Table 2).
The radio galaxy’s V606–i775 color is affected by the relatively large equivalent width of
Lyα (EW0 = 83 A, Venemans et al. (2004)). In the i775- and z850-bands, the galaxy consists
of a compact object with a ∼ 1′′ ‘tail’ extending towards the East that we have made visible
by smoothing the ACS images shown in Fig. 4 using a Gaussian kernel of 0.′′15 (FWHM).
Also shown is the narrow-band Lyα from Venemans et al. (2004) in contours superposed on
the ACS i775-band (Fig. 4, bottom left). The narrow-band image was registered to the ACS
image using a nearby star ∼ 3′′ to the northwest of the radio galaxy. The main component
observed with ACS is entirely embedded in the ∼ 1.′′5 (∼ 9 kpc) Lyα halo (compared to a
seeing of 0.8′′). The lower right panel of Fig. 4 shows the VLA 4.86 GHz radio contours (C.
De Breuck, private communications), overlayed on the ACS z850-band image. The relative as-
– 11 –
trometry could not be determined to better than 0.′′5. We find good correspondence between
the orientations of the radio emission and the extended ACS emission. This is analogous
to the alignment of both the UV continuum and emission lines with the radio seen in other
HzRGs at lower redshifts, which can be due to (a combination of) scattered light, emission
lines and, possibly, jet-induced star formation (e.g. Best et al. 1998; Bicknell et al. 2000;
Zirm et al. 2005, and references therein). Several emission lines common to high-redshift
radio galaxies fall within the z850 transmission curve (CIV λ1549A, HeII λ1640A). Based on
a composite radio galaxy spectrum, we estimate that the contribution due to these lines is
at most ∼ 0.2 mag in z850. If the continuum is further dominated by the emission of young,
hot stars with little dust, we derive a star formation rate (SFR) of 13.3 M⊙ yr−1. This SFR
is comparable to that of normal star-forming galaxies at z ∼ 4 − 6 (e.g. Steidel et al. 1999;
Papovich et al. 2001; Ouchi et al. 2004a; Giavalisco et al. 2004a; Bouwens et al. 2004b).
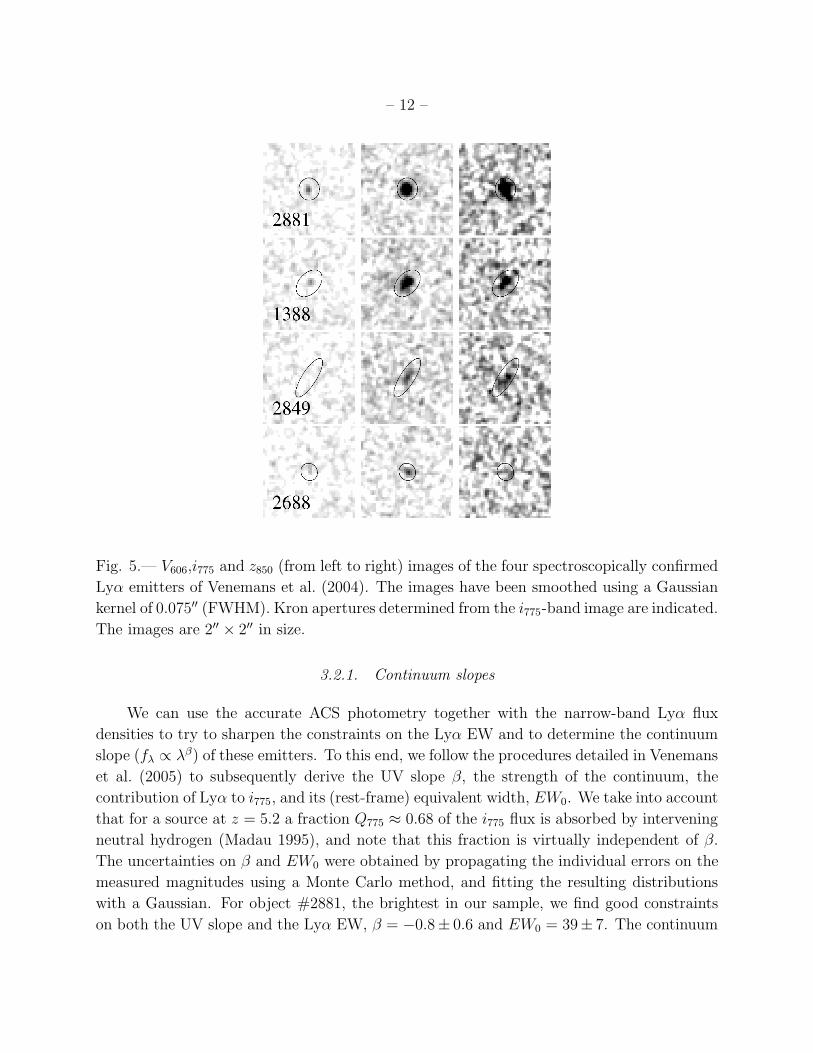
3.2. Properties of Lyα emitting galaxies at z ≈ 5.2
In this section we will study some of the properties of the four Lyα emitting galaxies
from Venemans et al. (2004). The morphologies in the 3 bands are shown in Fig. 5, and
their photometric properties are summarized in Table 2. All four Lyα emitters were detected
in i775, the filter that includes Lyα, with one object (#2688) being solely detected in this
filter. The UV continuum magnitudes measured from the z850-band are all fainter than 25.8
magnitudes, making them fainter than the faintest galaxies in the z ∼ 5 GOODS LBG
sample from Ferguson et al. (2004). This implies that this population of Lyα galaxies is
confined to luminosities of . 0.7 L∗, where L∗ is the characteristic continuum luminosity of
z = 3 LBGs from Steidel et al. (1999). Two emitters have a luminosity of . 0.3 L∗. It is
evident that the selection of these Lyα galaxies is biased in two important ways. One, the
sample is naturally biased towards galaxies with high equivalent width of Lyα, and second, it
is biased towards the fainter end of the Lyman break galaxy luminosity funtion. This finding
seems consistent with that of Shapley et al. (2003) who found evidence that Lyα equivalent
width increases towards fainter continuum magnitudes in their spectroscopic z ∼ 3 LBG
sample. The faint UV continuum of these Lyα emitting galaxies is similar to that observed
for Lyα galaxies associated with other radio galaxies (Venemans et al. 2004; Miley et al.
2004, Overzier et al., in prep.).
– 12 –
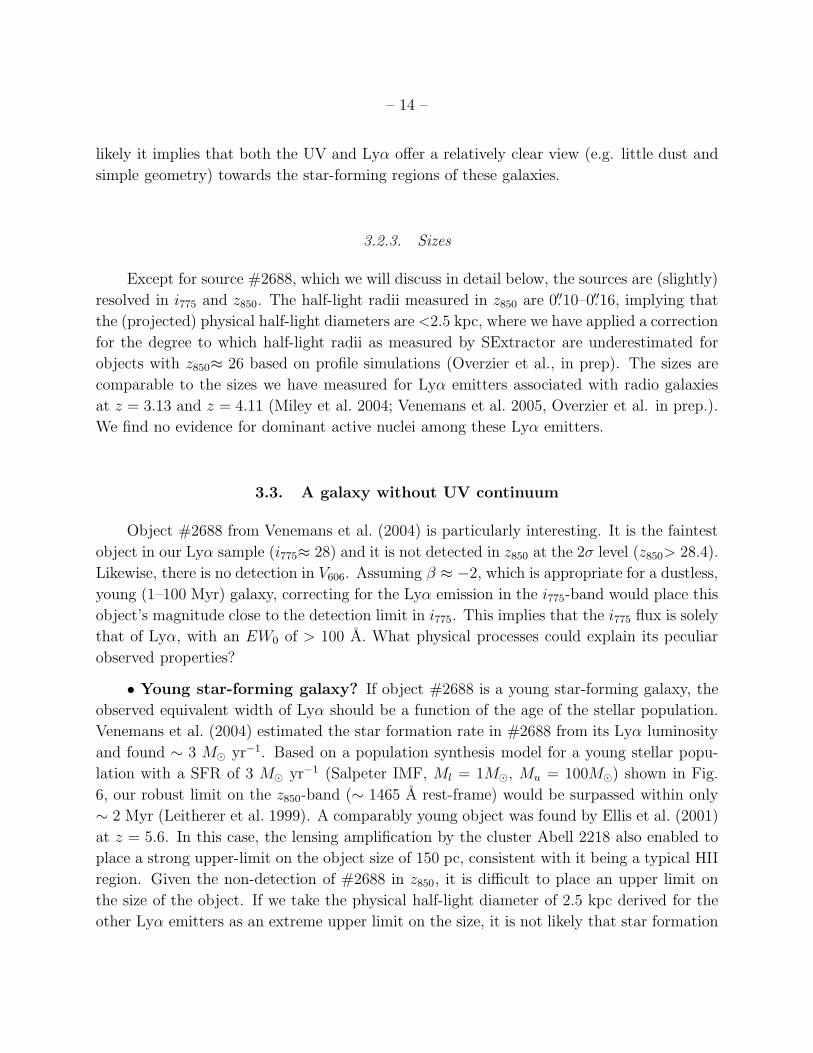
Fig. 5.— V606,i775 and z850 (from left to right) images of the four spectroscopically confirmed
Lyα emitters of Venemans et al. (2004). The images have been smoothed using a Gaussian
kernel of 0.075′′ (FWHM). Kron apertures determined from the i775-band image are indicated.
The images are 2′′ × 2′′ in size.
3.2.1. Continuum slopes
We can use the accurate ACS photometry together with the narrow-band Lyα flux
densities to try to sharpen the constraints on the Lyα EW and to determine the continuum
slope (fλ ∝ λβ) of these emitters. To this end, we follow the procedures detailed in Venemans
et al. (2005) to subsequently derive the UV slope β, the strength of the continuum, the
contribution of Lyα to i775, and its (rest-frame) equivalent width, EW0. We take into account
that for a source at z = 5.2 a fraction Q775 ≈ 0.68 of the i775 flux is absorbed by intervening
neutral hydrogen (Madau 1995), and note that this fraction is virtually independent of β.
The uncertainties on β and EW0 were obtained by propagating the individual errors on the
measured magnitudes using a Monte Carlo method, and fitting the resulting distributions
with a Gaussian. For object #2881, the brightest in our sample, we find good constraints
on both the UV slope and the Lyα EW, β = −0.8± 0.6 and EW0 = 39± 7. The continuum
– 13 –
seems redder than the average slope of β = −1.8±0.2 of V606-dropouts in GOODS found by
Bouwens et al. (2005b). However, we can not rule out the possibility that the Lyα flux in i775has been over-subtracted due to the presence of faint, extended Lyα in the VLT narrow-band
Lyα image (PSF of ∼ 0.′′8) not detected with ACS (PSF of ∼ 0.′′1). This could have caused
the slope calculated above to be shallower than it in fact is. We were not able to place tight
constraints on the two fainter objects #1388 and #2849 detected in i775 and z850, and refer
to Venemans et al. (2005) who find EW0 ∼ 50 A with large errors under the assumption of
a flat (in fν , i.e., β = −2) spectrum.
3.2.2. Star formation rates
Using the emission-line free UV flux at 1500A measured in z850, we derive star forma-
tion rates using the conversion between UV luminosity and SFR for a Salpeter initial mass
function (IMF) given in Madau et al. (1998):
SFR =L
1500A[erg s−1Hz−1]
8 × 1027M⊙ yr−1 (1)
We find 5.9 and 3.0 M⊙ yr−1 for objects #1388 and #2849. Object #2881 has a SFR of 9.7
M⊙ yr−1, quite comparable to that derived for the radio galaxy (see Sect. 3.1). These SFRs
are considered to be lower limits, since the presence of dust is likely to absorb the (rest-frame)
UV luminosities observed. The Lyα-to-continuum SFR ratios are in the range 0.7–3. The
Lyα SFRs were derived following the standard assumption of case B recombination, valid
for gas that is optically thick to HI resonance scattering (Venemans et al. 2005).
As modeled by Charlot & Fall (1993), high equivalent width Lyα is expected for a
relatively brief period in young (∼ 107−9 yr), nearly dust-free galaxies. However, the general
understanding is that, regardless of the effects of dust, the UV continuum is a better probe
of the SFR than Lyα, given the large cross-section to resonance scattering for the latter.
While the Lyα profile can be severely diminished depending on the geometry of the system,
the gas density, and the dust contents, the enhancement of Lyα flux over UV flux is also not
ruled out, at least theoretically. Young galaxies may consist of a 2-phase medium (e.g. Rees
1989) effectively thin to Lyα photons scattering off the surfaces of clouds that are optically
thick to unscattered UV photons (Neufeld 1991). For the Lyα emitters found in overdensities
associated with radio galaxies we find that the star formation rates derived from the UV
and Lyα are generally of a similar order of magnitude (e.g., this paper, Venemans et al.
2005, Overzier et al., in prep.). It is unlikely that geometry, dust and scattering medium all
conspire so that the SFRs derived from Lyα and the continuum will be comparable. More
– 14 –
likely it implies that both the UV and Lyα offer a relatively clear view (e.g. little dust and
simple geometry) towards the star-forming regions of these galaxies.
3.2.3. Sizes
Except for source #2688, which we will discuss in detail below, the sources are (slightly)
resolved in i775 and z850. The half-light radii measured in z850 are 0.′′10–0.′′16, implying that
the (projected) physical half-light diameters are <2.5 kpc, where we have applied a correction
for the degree to which half-light radii as measured by SExtractor are underestimated for
objects with z850≈ 26 based on profile simulations (Overzier et al., in prep). The sizes are
comparable to the sizes we have measured for Lyα emitters associated with radio galaxies
at z = 3.13 and z = 4.11 (Miley et al. 2004; Venemans et al. 2005, Overzier et al. in prep.).
We find no evidence for dominant active nuclei among these Lyα emitters.
3.3. A galaxy without UV continuum
Object #2688 from Venemans et al. (2004) is particularly interesting. It is the faintest
object in our Lyα sample (i775≈ 28) and it is not detected in z850 at the 2σ level (z850> 28.4).
Likewise, there is no detection in V606. Assuming β ≈ −2, which is appropriate for a dustless,
young (1–100 Myr) galaxy, correcting for the Lyα emission in the i775-band would place this
object’s magnitude close to the detection limit in i775. This implies that the i775 flux is solely
that of Lyα, with an EW0 of > 100 A. What physical processes could explain its peculiar
observed properties?
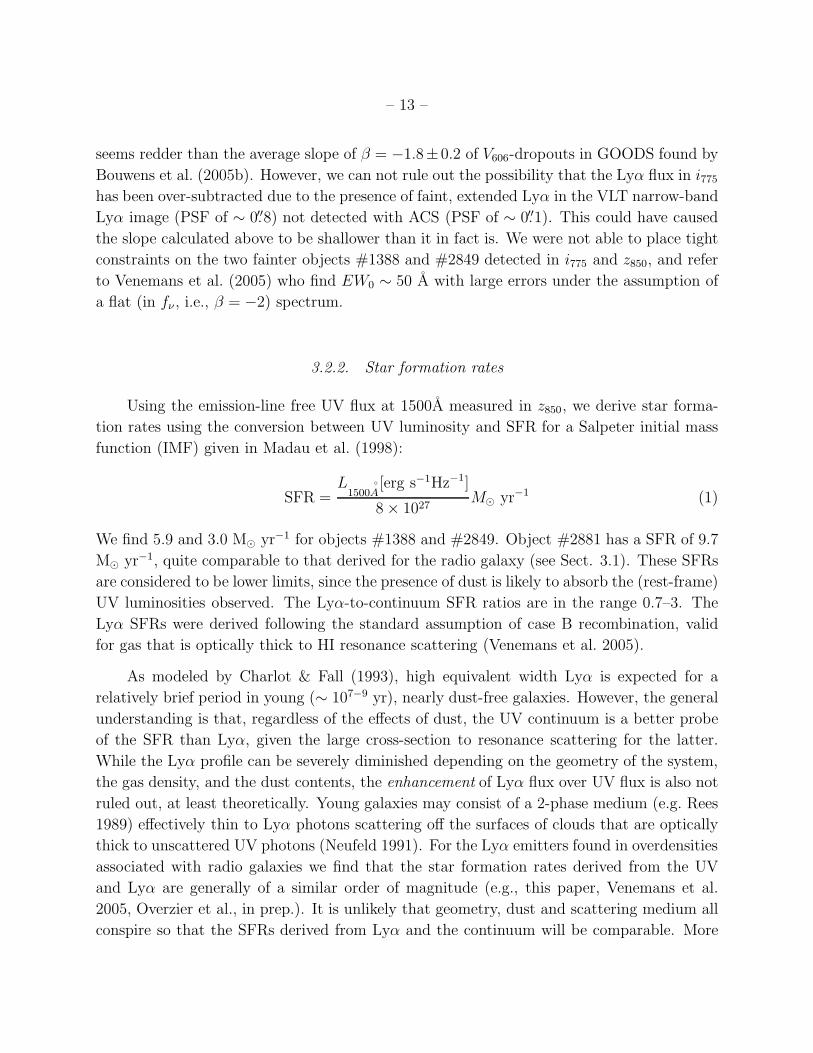
• Young star-forming galaxy? If object #2688 is a young star-forming galaxy, the
observed equivalent width of Lyα should be a function of the age of the stellar population.
Venemans et al. (2004) estimated the star formation rate in #2688 from its Lyα luminosity
and found ∼ 3 M⊙ yr−1. Based on a population synthesis model for a young stellar popu-
lation with a SFR of 3 M⊙ yr−1 (Salpeter IMF, Ml = 1M⊙, Mu = 100M⊙) shown in Fig.
6, our robust limit on the z850-band (∼ 1465 A rest-frame) would be surpassed within only
∼ 2 Myr (Leitherer et al. 1999). A comparably young object was found by Ellis et al. (2001)
at z = 5.6. In this case, the lensing amplification by the cluster Abell 2218 also enabled to
place a strong upper-limit on the object size of 150 pc, consistent with it being a typical HII
region. Given the non-detection of #2688 in z850, it is difficult to place an upper limit on
the size of the object. If we take the physical half-light diameter of 2.5 kpc derived for the
other Lyα emitters as an extreme upper limit on the size, it is not likely that star formation
– 15 –
1 10 100Age (Myr)
26.0
26.5
27.0
27.5
28.0
28.5
29.0
z 850
Z = 0.040
Z = 0.001
1 10 100Age (Myr)
26.0
26.5
27.0
27.5
28.0
28.5
29.0
z 850
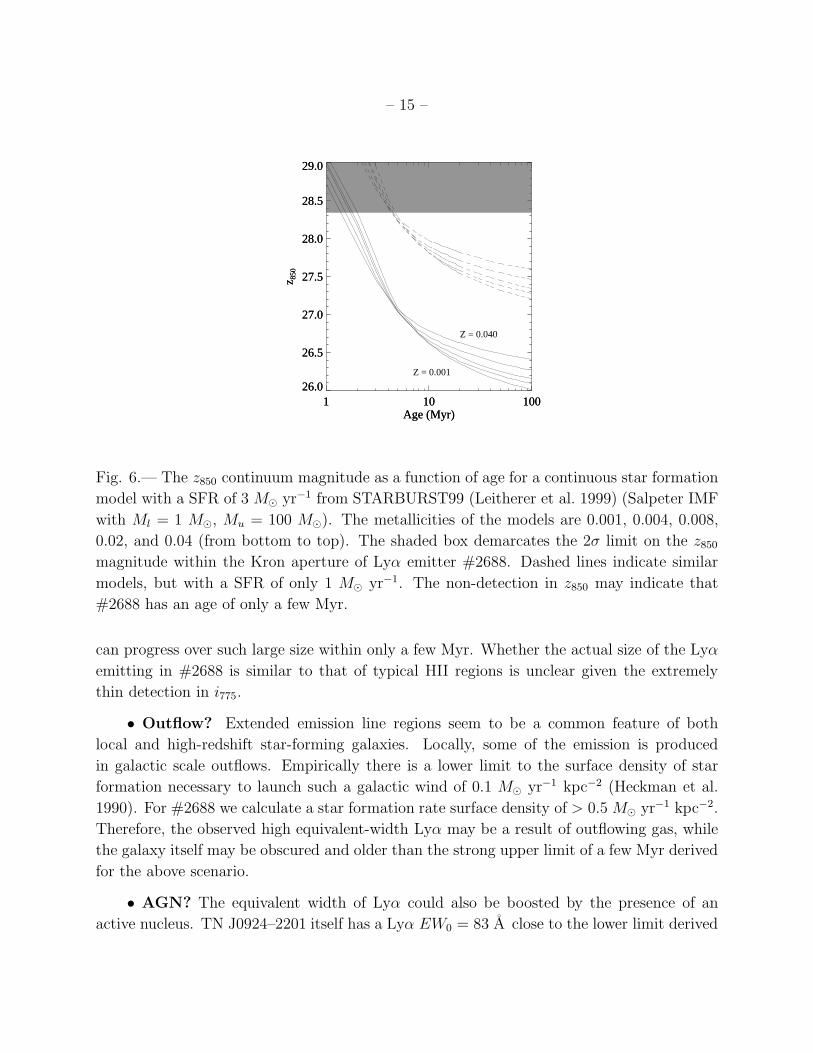
Fig. 6.— The z850 continuum magnitude as a function of age for a continuous star formation
model with a SFR of 3 M⊙ yr−1 from STARBURST99 (Leitherer et al. 1999) (Salpeter IMF
with Ml = 1 M⊙, Mu = 100 M⊙). The metallicities of the models are 0.001, 0.004, 0.008,
0.02, and 0.04 (from bottom to top). The shaded box demarcates the 2σ limit on the z850
magnitude within the Kron aperture of Lyα emitter #2688. Dashed lines indicate similar
models, but with a SFR of only 1 M⊙ yr−1. The non-detection in z850 may indicate that
#2688 has an age of only a few Myr.
can progress over such large size within only a few Myr. Whether the actual size of the Lyα
emitting in #2688 is similar to that of typical HII regions is unclear given the extremely
thin detection in i775.
• Outflow? Extended emission line regions seem to be a common feature of both
local and high-redshift star-forming galaxies. Locally, some of the emission is produced
in galactic scale outflows. Empirically there is a lower limit to the surface density of star
formation necessary to launch such a galactic wind of 0.1 M⊙ yr−1 kpc−2 (Heckman et al.
1990). For #2688 we calculate a star formation rate surface density of > 0.5 M⊙ yr−1 kpc−2.
Therefore, the observed high equivalent-width Lyα may be a result of outflowing gas, while
the galaxy itself may be obscured and older than the strong upper limit of a few Myr derived
for the above scenario.
• AGN? The equivalent width of Lyα could also be boosted by the presence of an
active nucleus. TN J0924–2201 itself has a Lyα EW0 = 83 A close to the lower limit derived
– 16 –
for #2688. While there is no evidence for a bright nuclear point-source in #2688, it could
be easily obscured by circumnuclear dust, particularly at rest-frame ultraviolet wavelengths.
Because the spectrum only has narrow Lyα, it could be a faint narrow line quasar. Several
of the Lyα emitters in the protocluster near radio galaxy MRC 1138–262 at z = 2.16 have
been detected with Chandra indicating that the AGN fraction of such protoclusters could be
significant. In contrast, Wang et al. (2004) found no evidence for AGN among a large field
sample of z ≈ 4.5 Lyα emitters observed in the X-ray.
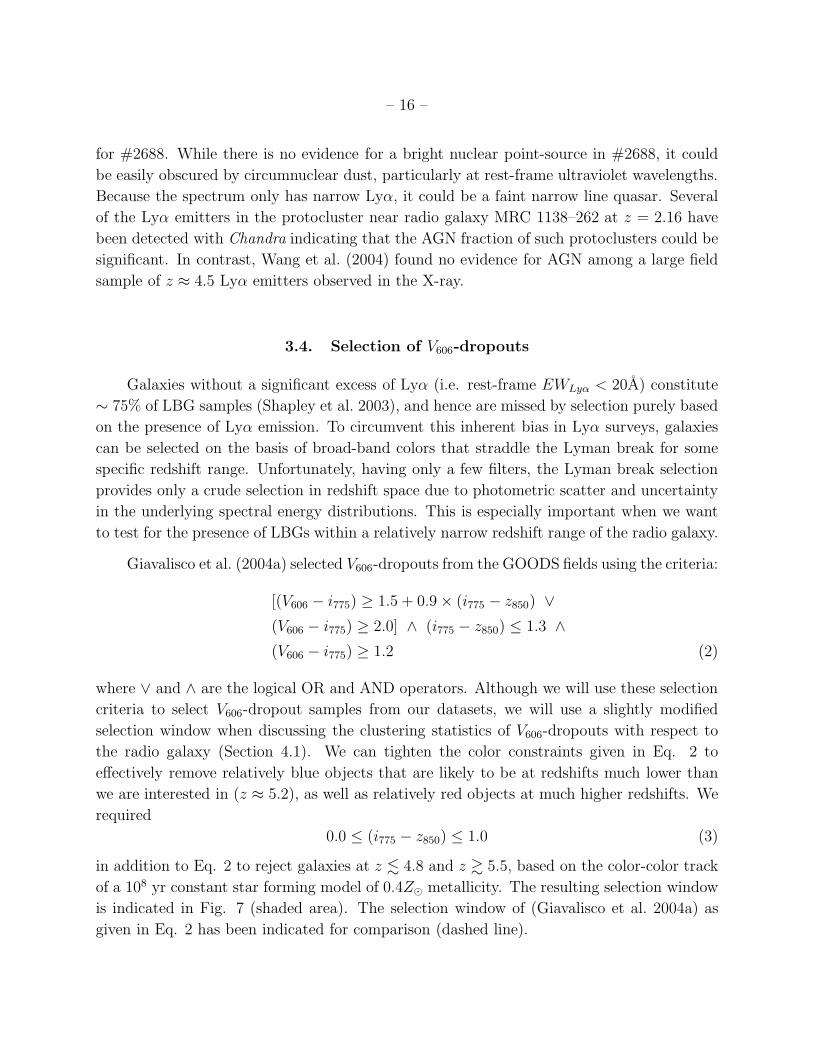
3.4. Selection of V606-dropouts
Galaxies without a significant excess of Lyα (i.e. rest-frame EWLyα < 20A) constitute
∼ 75% of LBG samples (Shapley et al. 2003), and hence are missed by selection purely based
on the presence of Lyα emission. To circumvent this inherent bias in Lyα surveys, galaxies
can be selected on the basis of broad-band colors that straddle the Lyman break for some
specific redshift range. Unfortunately, having only a few filters, the Lyman break selection
provides only a crude selection in redshift space due to photometric scatter and uncertainty
in the underlying spectral energy distributions. This is especially important when we want
to test for the presence of LBGs within a relatively narrow redshift range of the radio galaxy.
Giavalisco et al. (2004a) selected V606-dropouts from the GOODS fields using the criteria:
[(V606 − i775) ≥ 1.5 + 0.9 × (i775 − z850) ∨
(V606 − i775) ≥ 2.0] ∧ (i775 − z850) ≤ 1.3 ∧
(V606 − i775) ≥ 1.2 (2)
where ∨ and ∧ are the logical OR and AND operators. Although we will use these selection
criteria to select V606-dropout samples from our datasets, we will use a slightly modified
selection window when discussing the clustering statistics of V606-dropouts with respect to
the radio galaxy (Section 4.1). We can tighten the color constraints given in Eq. 2 to
effectively remove relatively blue objects that are likely to be at redshifts much lower than
we are interested in (z ≈ 5.2), as well as relatively red objects at much higher redshifts. We
required
0.0 ≤ (i775 − z850) ≤ 1.0 (3)
in addition to Eq. 2 to reject galaxies at z . 4.8 and z & 5.5, based on the color-color track
of a 108 yr constant star forming model of 0.4Z⊙ metallicity. The resulting selection window
is indicated in Fig. 7 (shaded area). The selection window of (Giavalisco et al. 2004a) as
given in Eq. 2 has been indicated for comparison (dashed line).
– 17 –
Unlike GOODS and the UDF parallel fields, there are no observations in B435 for our
field, which makes it impossible to remove low redshift contamination by requiring a maxi-
mum upper limit on detections in B435 (e.g., S/N < 2). The estimates for the low redshift
contamination fraction of V606-dropouts from GOODS amount to ∼ 10 − 30% (Bouwens
et al. 2005b). We note, however, that in some cases low redshift objects that have made it
into the selection window can still be rejected on the basis of their high relative brightness
and/or large sizes in the V606i775z850-bands during visual inspection.
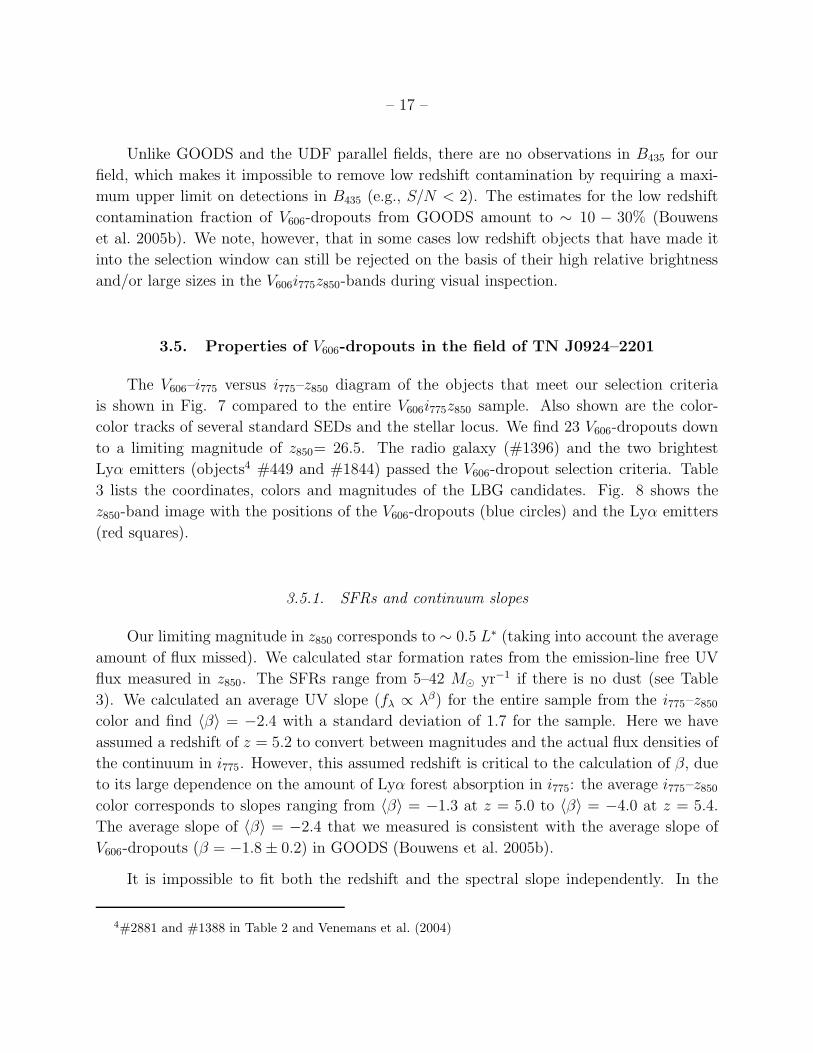
3.5. Properties of V606-dropouts in the field of TN J0924–2201
The V606–i775 versus i775–z850 diagram of the objects that meet our selection criteria
is shown in Fig. 7 compared to the entire V606i775z850 sample. Also shown are the color-
color tracks of several standard SEDs and the stellar locus. We find 23 V606-dropouts down
to a limiting magnitude of z850= 26.5. The radio galaxy (#1396) and the two brightest
Lyα emitters (objects4 #449 and #1844) passed the V606-dropout selection criteria. Table
3 lists the coordinates, colors and magnitudes of the LBG candidates. Fig. 8 shows the
z850-band image with the positions of the V606-dropouts (blue circles) and the Lyα emitters
(red squares).
3.5.1. SFRs and continuum slopes
Our limiting magnitude in z850 corresponds to ∼ 0.5 L∗ (taking into account the average
amount of flux missed). We calculated star formation rates from the emission-line free UV
flux measured in z850. The SFRs range from 5–42 M⊙ yr−1 if there is no dust (see Table
3). We calculated an average UV slope (fλ ∝ λβ) for the entire sample from the i775–z850
color and find 〈β〉 = −2.4 with a standard deviation of 1.7 for the sample. Here we have
assumed a redshift of z = 5.2 to convert between magnitudes and the actual flux densities of
the continuum in i775. However, this assumed redshift is critical to the calculation of β, due
to its large dependence on the amount of Lyα forest absorption in i775: the average i775–z850
color corresponds to slopes ranging from 〈β〉 = −1.3 at z = 5.0 to 〈β〉 = −4.0 at z = 5.4.
The average slope of 〈β〉 = −2.4 that we measured is consistent with the average slope of
V606-dropouts (β = −1.8 ± 0.2) in GOODS (Bouwens et al. 2005b).
It is impossible to fit both the redshift and the spectral slope independently. In the
4#2881 and #1388 in Table 2 and Venemans et al. (2004)
– 18 –
following we will assume that z = 5.2, and that the value of the spectral slope is largely
determined by dust, rather than age or metallicity. We have parametrized E(B−V )−βiz for
a base template consisting of a 100 Myr old (zf ≈ 5.6) SED with 0.2 Z⊙ metallicity that has
been forming stars at a continuous rate (from Bruzual & Charlot 2003). The template was
reddened by applying increasing values of E(B−V ) using the recipe of Calzetti et al. (2000).
The measured slopes are consistent with modest absorption by dust of E(B − V ) ∼ 0− 0.4,
with the lower values preferred given the mean slope of the sample. In some cases we also
found negative values of E(B − V ). This suggests that the color might be bluer than that
of the base template used, or that the redshift is off.
Bouwens et al. (2005b) found evidence for evolution in the mean UV slope from z ∼ 5
(β = −1.8± 0.2) to z ∼ 2.5 (β = −1.4± 0.1) (see also Lehnert & Bremer 2003; Ouchi et al.
2004a; Papovich et al. 2004; Bouwens et al. 2005a). They have interpreted this as an evolution
in the dust content rather than age or metallicity, based on the plausible assumption that
any change in these parameters by significantly large factors seems unlikely given that the
universe only doubles in age over this redshift interval and the gradual process of galaxy
formation. Reducing the dust content by a factor of ∼ 2 from z ∼ 3 to z ∼ 5 can explain
the relatively blue continuum of the V606-dropouts.
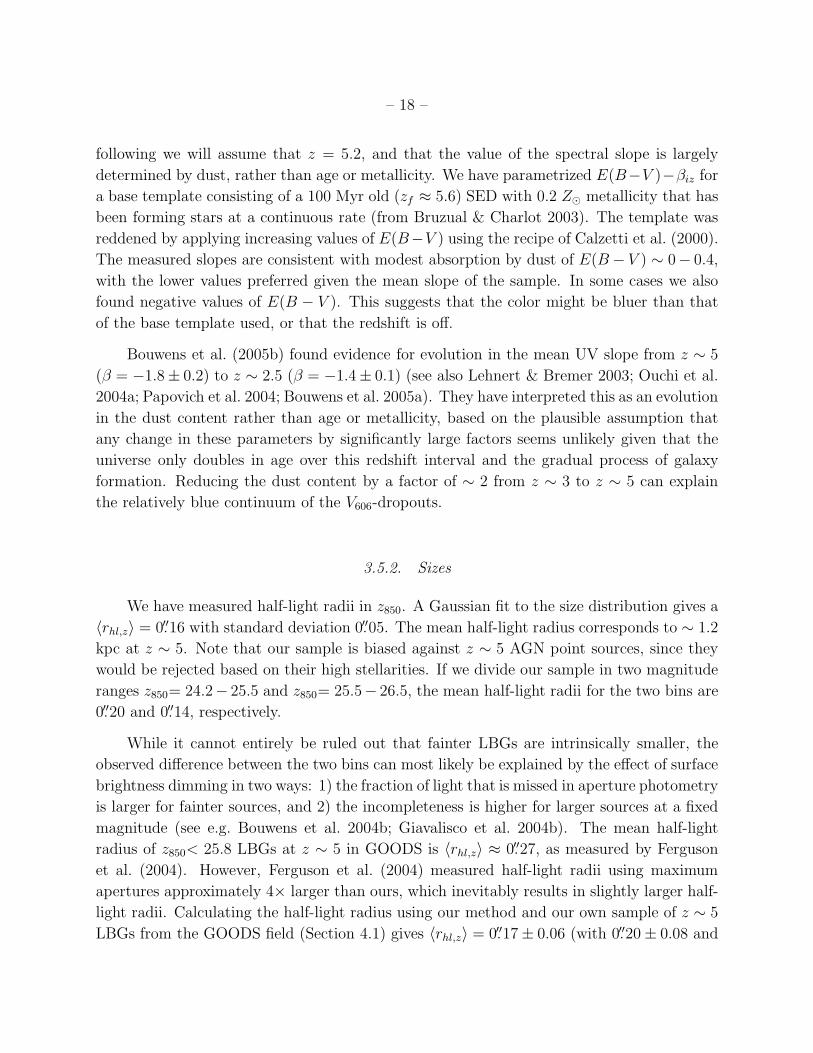
3.5.2. Sizes
We have measured half-light radii in z850. A Gaussian fit to the size distribution gives a
〈rhl,z〉 = 0.′′16 with standard deviation 0.′′05. The mean half-light radius corresponds to ∼ 1.2
kpc at z ∼ 5. Note that our sample is biased against z ∼ 5 AGN point sources, since they
would be rejected based on their high stellarities. If we divide our sample in two magnitude
ranges z850= 24.2− 25.5 and z850= 25.5− 26.5, the mean half-light radii for the two bins are
0.′′20 and 0.′′14, respectively.
While it cannot entirely be ruled out that fainter LBGs are intrinsically smaller, the
observed difference between the two bins can most likely be explained by the effect of surface
brightness dimming in two ways: 1) the fraction of light that is missed in aperture photometry
is larger for fainter sources, and 2) the incompleteness is higher for larger sources at a fixed
magnitude (see e.g. Bouwens et al. 2004b; Giavalisco et al. 2004b). The mean half-light
radius of z850< 25.8 LBGs at z ∼ 5 in GOODS is 〈rhl,z〉 ≈ 0.′′27, as measured by Ferguson
et al. (2004). However, Ferguson et al. (2004) measured half-light radii using maximum
apertures approximately 4× larger than ours, which inevitably results in slightly larger half-
light radii. Calculating the half-light radius using our method and our own sample of z ∼ 5
LBGs from the GOODS field (Section 4.1) gives 〈rhl,z〉 = 0.′′17 ± 0.06 (with 0.′′20 ± 0.08 and
– 19 –
0.′′16 ± 0.05 for the brighter and fainter magnitude bins, respectively), consistent with the
sizes we find in the TN J0924–2201 field.
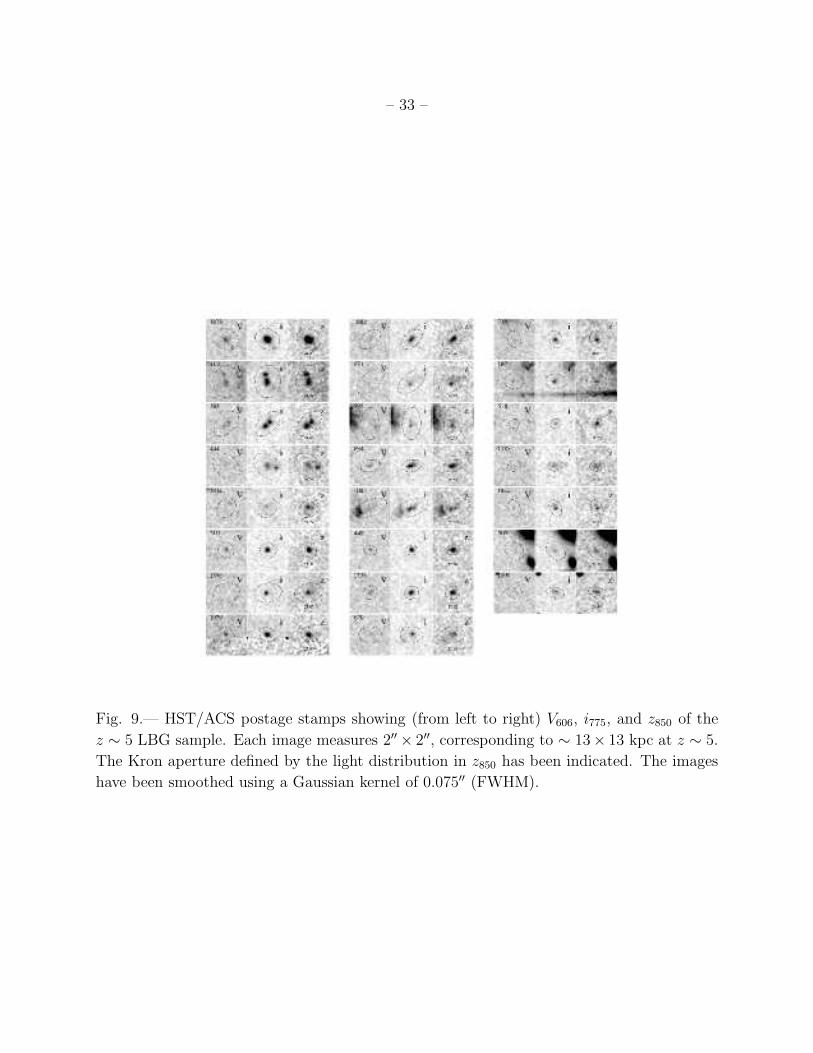
The V606, i775, and z850 morphologies are shown in Fig. 9. Three objects (#119, #303,
and #444) have a clear double morphology. Based on the large V606-dropout sample from
GOODS (Section 4.1) we would expect roughly 1.5 of such systems in our field, indicating
that our field might be relatively rich in merging systems. A more detailed, comparative
analysis of sizes and morphologies of LBGs and Lyα emitters in radio galaxy protoclusters
at 2 < z < 5.2 will be given elsewhere.
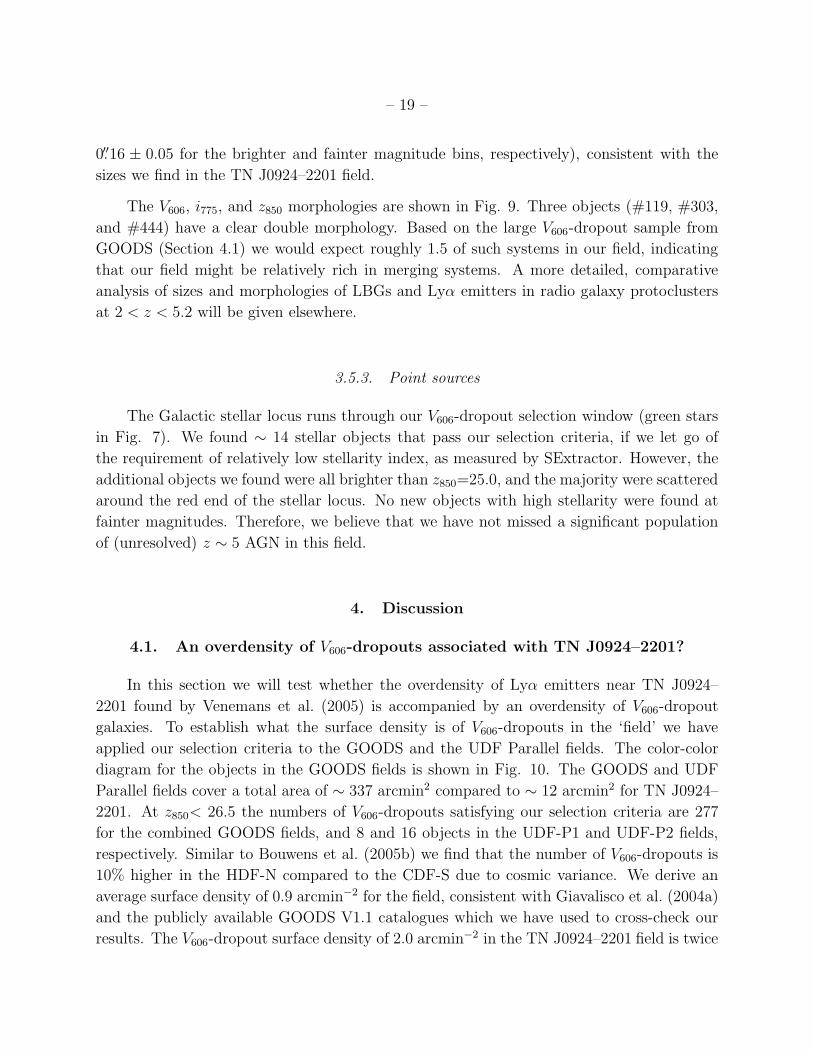
3.5.3. Point sources
The Galactic stellar locus runs through our V606-dropout selection window (green stars
in Fig. 7). We found ∼ 14 stellar objects that pass our selection criteria, if we let go of
the requirement of relatively low stellarity index, as measured by SExtractor. However, the
additional objects we found were all brighter than z850=25.0, and the majority were scattered
around the red end of the stellar locus. No new objects with high stellarity were found at
fainter magnitudes. Therefore, we believe that we have not missed a significant population
of (unresolved) z ∼ 5 AGN in this field.
4. Discussion
4.1. An overdensity of V606-dropouts associated with TN J0924–2201?
In this section we will test whether the overdensity of Lyα emitters near TN J0924–
2201 found by Venemans et al. (2005) is accompanied by an overdensity of V606-dropout
galaxies. To establish what the surface density is of V606-dropouts in the ‘field’ we have
applied our selection criteria to the GOODS and the UDF Parallel fields. The color-color
diagram for the objects in the GOODS fields is shown in Fig. 10. The GOODS and UDF
Parallel fields cover a total area of ∼ 337 arcmin2 compared to ∼ 12 arcmin2 for TN J0924–
2201. At z850< 26.5 the numbers of V606-dropouts satisfying our selection criteria are 277
for the combined GOODS fields, and 8 and 16 objects in the UDF-P1 and UDF-P2 fields,
respectively. Similar to Bouwens et al. (2005b) we find that the number of V606-dropouts is
10% higher in the HDF-N compared to the CDF-S due to cosmic variance. We derive an
average surface density of 0.9 arcmin−2 for the field, consistent with Giavalisco et al. (2004a)
and the publicly available GOODS V1.1 catalogues which we have used to cross-check our
results. The V606-dropout surface density of 2.0 arcmin−2 in the TN J0924–2201 field is twice
– 20 –
as high, while the overall object surface densities at z850< 26.5, S/N > 5 and S/G < 0.85
are fairly constant: 106 arcmin−2, 119 arcmin−2 and 98 arcmin−2 for the GOODS CDF-S,
HDF-N, and TN J0924–2201 fields, respectively.
What is the significance of this factor 2 surface overdensity? LBGs are known to be
strongly clustered at every redshift (Porciani & Giavalisco 2002; Ouchi et al. 2004b), and
are known to have large field-to-field variations. In our particular case, it is interesting
to calculate the probability of finding a certain number of V606-dropouts in a single ACS
pointing. Here we will use the additional constraint on the i775–z850 color specified in Eq. 3
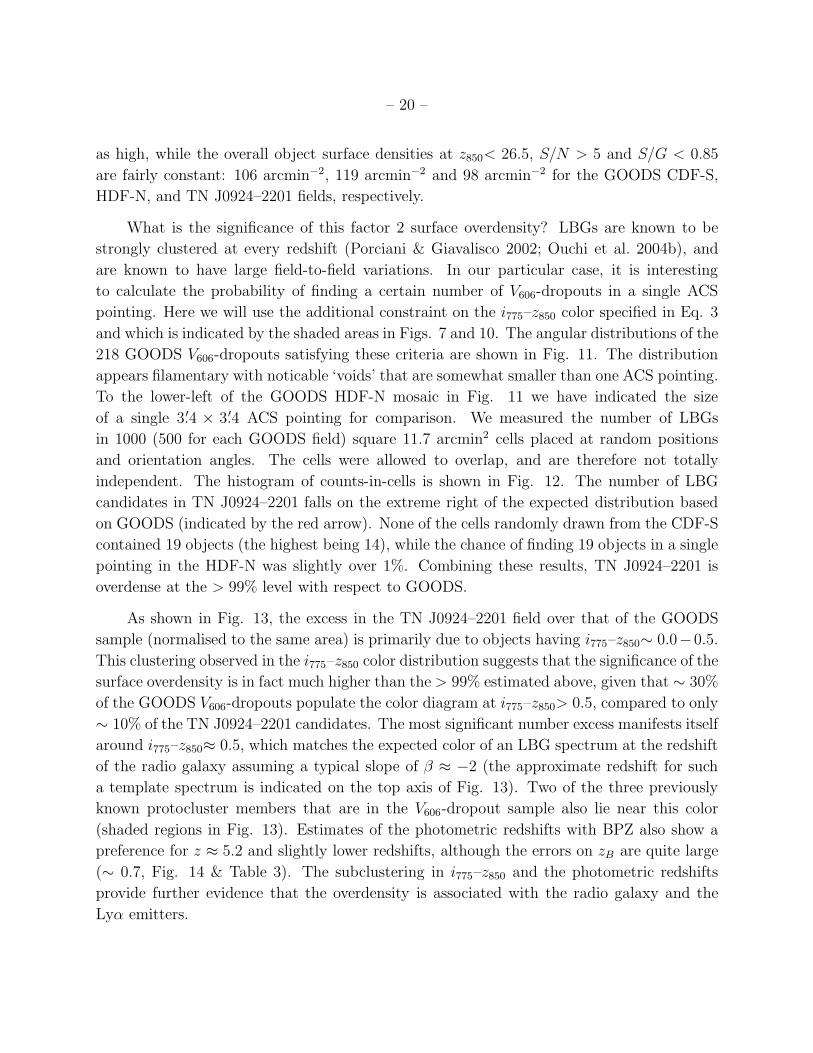
and which is indicated by the shaded areas in Figs. 7 and 10. The angular distributions of the
218 GOODS V606-dropouts satisfying these criteria are shown in Fig. 11. The distribution
appears filamentary with noticable ‘voids’ that are somewhat smaller than one ACS pointing.
To the lower-left of the GOODS HDF-N mosaic in Fig. 11 we have indicated the size
of a single 3.′4 × 3.′4 ACS pointing for comparison. We measured the number of LBGs
in 1000 (500 for each GOODS field) square 11.7 arcmin2 cells placed at random positions
and orientation angles. The cells were allowed to overlap, and are therefore not totally
independent. The histogram of counts-in-cells is shown in Fig. 12. The number of LBG
candidates in TN J0924–2201 falls on the extreme right of the expected distribution based
on GOODS (indicated by the red arrow). None of the cells randomly drawn from the CDF-S
contained 19 objects (the highest being 14), while the chance of finding 19 objects in a single
pointing in the HDF-N was slightly over 1%. Combining these results, TN J0924–2201 is
overdense at the > 99% level with respect to GOODS.
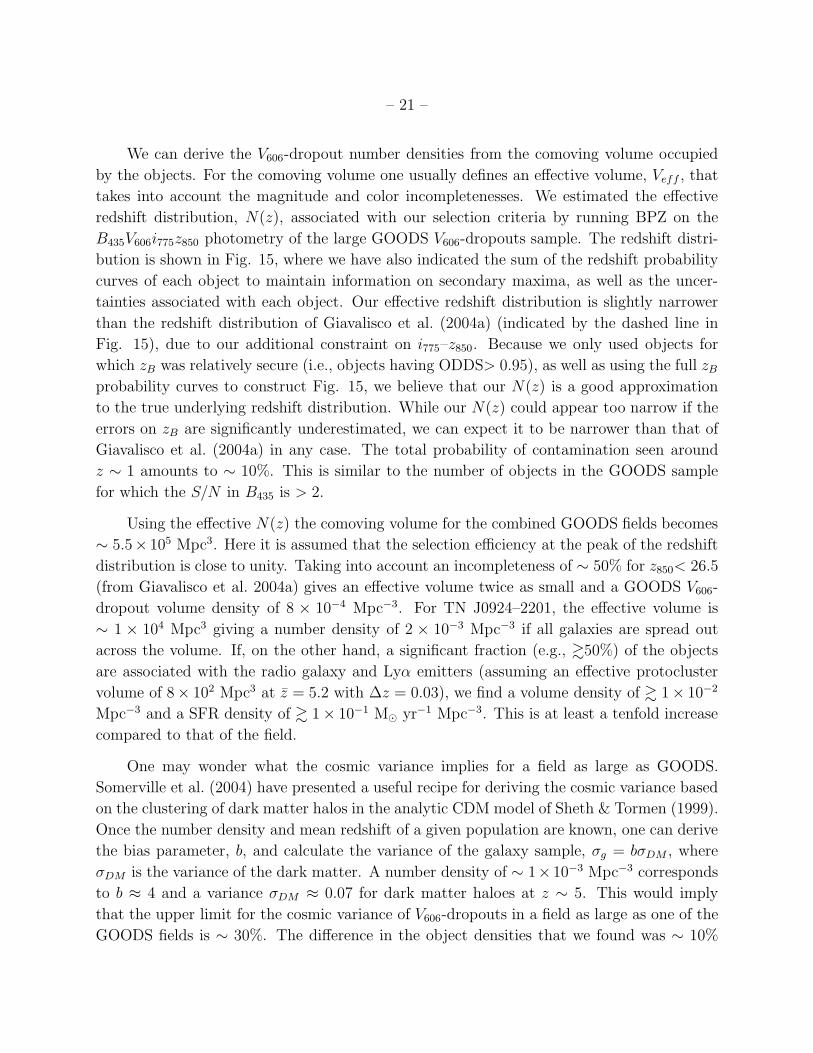
As shown in Fig. 13, the excess in the TN J0924–2201 field over that of the GOODS
sample (normalised to the same area) is primarily due to objects having i775–z850∼ 0.0−0.5.
This clustering observed in the i775–z850 color distribution suggests that the significance of the
surface overdensity is in fact much higher than the > 99% estimated above, given that ∼ 30%
of the GOODS V606-dropouts populate the color diagram at i775–z850> 0.5, compared to only
∼ 10% of the TN J0924–2201 candidates. The most significant number excess manifests itself
around i775–z850≈ 0.5, which matches the expected color of an LBG spectrum at the redshift
of the radio galaxy assuming a typical slope of β ≈ −2 (the approximate redshift for such
a template spectrum is indicated on the top axis of Fig. 13). Two of the three previously
known protocluster members that are in the V606-dropout sample also lie near this color
(shaded regions in Fig. 13). Estimates of the photometric redshifts with BPZ also show a
preference for z ≈ 5.2 and slightly lower redshifts, although the errors on zB are quite large
(∼ 0.7, Fig. 14 & Table 3). The subclustering in i775–z850 and the photometric redshifts
provide further evidence that the overdensity is associated with the radio galaxy and the
Lyα emitters.
– 21 –
We can derive the V606-dropout number densities from the comoving volume occupied
by the objects. For the comoving volume one usually defines an effective volume, Veff , that
takes into account the magnitude and color incompletenesses. We estimated the effective
redshift distribution, N(z), associated with our selection criteria by running BPZ on the
B435V606i775z850 photometry of the large GOODS V606-dropouts sample. The redshift distri-
bution is shown in Fig. 15, where we have also indicated the sum of the redshift probability
curves of each object to maintain information on secondary maxima, as well as the uncer-
tainties associated with each object. Our effective redshift distribution is slightly narrower
than the redshift distribution of Giavalisco et al. (2004a) (indicated by the dashed line in
Fig. 15), due to our additional constraint on i775–z850. Because we only used objects for
which zB was relatively secure (i.e., objects having ODDS> 0.95), as well as using the full zB
probability curves to construct Fig. 15, we believe that our N(z) is a good approximation
to the true underlying redshift distribution. While our N(z) could appear too narrow if the
errors on zB are significantly underestimated, we can expect it to be narrower than that of
Giavalisco et al. (2004a) in any case. The total probability of contamination seen around
z ∼ 1 amounts to ∼ 10%. This is similar to the number of objects in the GOODS sample
for which the S/N in B435 is > 2.
Using the effective N(z) the comoving volume for the combined GOODS fields becomes
∼ 5.5× 10⁵ Mpc3. Here it is assumed that the selection efficiency at the peak of the redshift
distribution is close to unity. Taking into account an incompleteness of ∼ 50% for z850< 26.5
(from Giavalisco et al. 2004a) gives an effective volume twice as small and a GOODS V606-
dropout volume density of 8 × 10⁻⁴ Mpc−3. For TN J0924–2201, the effective volume is
∼ 1 × 10⁴ Mpc3 giving a number density of 2 × 10⁻³ Mpc−3 if all galaxies are spread out
across the volume. If, on the other hand, a significant fraction (e.g., &50%) of the objects
are associated with the radio galaxy and Lyα emitters (assuming an effective protocluster
volume of 8× 10² Mpc3 at z = 5.2 with ∆z = 0.03), we find a volume density of & 1× 10⁻²
Mpc−3 and a SFR density of & 1× 10⁻¹ M⊙ yr−1 Mpc−3. This is at least a tenfold increase
compared to that of the field.
One may wonder what the cosmic variance implies for a field as large as GOODS.
Somerville et al. (2004) have presented a useful recipe for deriving the cosmic variance based
on the clustering of dark matter halos in the analytic CDM model of Sheth & Tormen (1999).
Once the number density and mean redshift of a given population are known, one can derive
the bias parameter, b, and calculate the variance of the galaxy sample, σg = bσDM , where
σDM is the variance of the dark matter. A number density of ∼ 1×10⁻³ Mpc−3 corresponds
to b ≈ 4 and a variance σDM ≈ 0.07 for dark matter haloes at z ∼ 5. This would imply
that the upper limit for the cosmic variance of V606-dropouts in a field as large as one of the
GOODS fields is ∼ 30%. The difference in the object densities that we found was ∼ 10%
– 22 –
between the two GOODS fields. Assuming that the CDF-S represents the absolute minimum
of the allowed range would imply that new fields may be discovered showing significantly
more sub-clustering on the scale of a single ACS pointing than currently observed. In the
other extreme case that the HDF-N represents the absolute maximum, the TN J0924–2201
field should exhibit one of the highest surface densities of V606-dropouts expected.
The surface overdensity of Lyα emitters around TN J0924–2201 was 1.5–6 compared
to the field (Venemans et al. 2004). Our results would be marginally consistent with the
lower value of ∼ 2. However, only two of the Lyα emitters are bright enough to be included
in our LBG sample. If the fraction of LBGs with high rest-frame equivalent width Lyα in
protoclusters is similar to that of the field (Shapley et al. (2003) find ∼ 25%), ∼ 6 additional
(i.e., non-Lyα) ‘protocluster’ LBGs are expected among our sample of 16 candidates (19 when
including the radio galaxy and the two Lyα emitters). Such an overdensity could easily
be accommodated given the relative richness of LBGs in this field, although its ultimate
verification must await spectroscopic follow-up.
Based on the clustering statistics of relatively bright (z′ < 25.8) V i′z′-selected LBGs at
z ∼ 5, Ouchi et al. (2004b) found that these objects are likely to be hosted by very massive
dark matter halos of ∼ 1012 M⊙. The halo occupation number for these LBGs is almost
unity, implying that almost every halo of this mass is expected to host a UV-bright LBG.
Our sample contains several V606-dropouts which have z850< 25.0 (the brightest being #1873
with z850= 24.2), implying present-day halo masses of 〈M(z = 0)〉 > 1014 M⊙. Whether any
of these objects are associated with the radio galaxy should be confirmed by spectroscopy.
4.2. The host galaxy of TN J0924–2201
The high radio luminosity of TN J0924–2201 indicates that it hosts a supermassive
black hole, which must have acquired its mass in less than ∼ 1 Gyr. However, in many
other respects we found that it appears unremarkable when compared to general Lyman
break galaxies at a similar redshift. Although there is a wide dispersion in the properties
of the highest redshift radio galaxies (e.g. Rawlings et al. 1996; Dey et al. 1997; Reuland
et al. 2003; Zirm et al. 2005) it might be interesting to naively compare TN J0924–2201 to
TN J1338–1942 at z = 4.1 also studied with ACS (Zirm et al. 2005). The optical host of
TN J0924–2201 is almost 2 magnitudes fainter (at similar rest-frame wavelengths) than TN
J1338–1941. There are several V606-dropouts in our sample that have brighter magnitudes
(and therefore higher SFRs) than the radio source, while TN J1338–1942 is by far the
brightest object among the sample of associated g475-dropouts found in that field (Miley
et al. 2004). Likewise, TN J0924–2201 has a size that is comparable to the average size
– 23 –
of V606-dropouts (Bouwens et al. 2004b; Ferguson et al. 2004), while TN J1338–1942 is an
exceptionally large (∼ 2′′) galaxy. If TN J0924–2201 is to develop into a similar source
within the ∼ 400 Myr or so between z ∼ 5 and z ∼ 4, it would require an increase in the
projected radio source size by a factor ∼ 5, in Lyα luminosity by a factor ∼ 60, in SFR by
a factor of ∼ 10, and in UV size by at least a factor of 2. The recent detection of molecular
gas (CO) by Klamer et al. (2005) suggests that there is ∼ 1011M⊙ of (inferred) gas mass
present. The rapid enrichment that brought about this reservoir of molecular gas could have
been facilitated by the early formation of the radio source and the triggering of massive star
formation. The amount of gas present shows that there is plenty of material available to
sustain a high SFR of several 100M⊙ yr−1, possibly allowing this source to undergo dramatic
changes in its UV luminosity and morphology during certain stages of its evolution.
5. Conclusions
We have presented statistical evidence for an overdensity of star forming galaxies asso-
ciated with the radio galaxy TN J0924–2201. Our result is consistent with the overdensity
of Lyα emitters discovered previously by Venemans et al. (2004), and is comparable to over-
densities of Lyα emitters and Lyman break galaxies found around other high redshift radio
galaxies. TN J0924–2201 could be a protocluster that will evolve into a cluster with a mass
of ∼ 1014 M⊙ at z = 0.
The existence of relatively massive structures in the early Universe may not be uncom-
mon, as suggested by, for example, the existence of quasars at even higher redshifts (e.g. Fan
et al. 2003), the evidence for protoclusters out to z < 6, and the increasingly higher limit
that can be set on the redshift of reionization. Regions of high mass concentrations are rare,
strongly clustered objects at every redshift, that underwent high amplification since the ini-
tial conditions (Kaiser 1984). Radio galaxies are suspected to be the sites of the formation of
a massive galaxy. The evidence reported of in this paper contributes to the hypothesis that
redshift filaments and possibly groups or clusters of galaxies emerged together with these
massive galaxies. In the radio-loud AGN unification model, the viewing angle relative to
the jet determines whether a galaxy will be seen as a radio galaxy or as a radio-loud quasar
(Barthel 1989). It is therefore expected that early galaxy overdensities could, in principle,
also be found around high redshift radio-loud quasars. Results indicate that the same may
hold for at least some radio-quiet quasars at z > 5 too (Djorgovski et al. 1999, 2003, Stiavelli
et al. 2005).
Although primordial galaxy overdensities so far discovered are not solely limited to fields
that contain a luminous AGN (e.g. Steidel et al. 1999; Ouchi et al. 2005), they hold a strong
– 24 –
connection to low redshift clusters due to the presence of a supermassive black hole and
possibly a developing brightest cluster galaxy (Zirm et al. 2005). When the radio source has
switched off, the host galaxy may become indistinguishable from other relatively massive,
quiescent galaxies that may have been active in the past. The clustering properties and
inferred halo masses of the brightest Lyman break galaxies suggest that their descendants at
z = 0 fall into groups and clusters of galaxies (Ouchi et al. 2004b). Interestingly, the number
densities of protoclusters, radio galaxies and Lyman break galaxy redshift spikes have all
been found to be consistent with the abundance of local clusters (e.g. Steidel et al. 1999;
Venemans et al. 2002; Ouchi et al. 2005, and references therein). Structures like TN J0924–
2201 provide ideal comparisons with state-of-the-art N -body simulations. Springel et al.
(2005) found that the descendants of the most massive objects at high redshift (presumed
to be luminous quasars) can almost exclusively be identified with the most massive clusters
at the current epoch. It might become possible to trace back cluster evolution from the
well-studied regimes at z . 1 to slight overdensities at very high redshifts, possibly up to
the epoch of reionization.
RAO is very grateful to Masami Ouchi for invaluable discussions, to Mike Dopita for
discussion of Fig. 6, and to Carlos De Breuck for providing the radio map of TN J0924–2201
shown in Fig. 4. We thank the anonymous referee for helping to improve the manuscript.
ACS was developed under NASA contract NAS 5-32865, and this research has been
supported by NASA grant NAG5-7697 and by an equipment grant from Sun Microsystems,
Inc. The Space Telescope Science Institute is operated by AURA Inc., under NASA contract
NAS5-26555. We are grateful to K. Anderson, J. McCann, S. Busching, A. Framarini,
S. Barkhouser, and T. Allen for their invaluable contributions to the ACS project at JHU.
REFERENCES
Adelberger, K. L., Steidel, C. C., Giavalisco, M., et al. 1998, ApJ, 505, 18
Barthel, P. 1989, Scientific American, 260, 20
Benıtez, N. 2000, ApJ, 536, 571
Benıtez, N., Ford, H., Bouwens, R., et al. 2004, ApJS, 150, 1
Bertin, E. & Arnouts, S. 1996, A&AS, 117, 393
Best, P. N., Longair, M. S., & Roettgering, H. J. A. 1998, MNRAS, 295, 549
– 25 –
Bicknell, G. V., Sutherland, R. S., van Breugel, W. J. M., et al. 2000, ApJ, 540, 678
Blakeslee, J. P., Anderson, K. R., Meurer, G. R., Benıtez, N., & Magee, D. 2003a, in ASP
Conf. Ser. 295: Astronomical Data Analysis Software and Systems XII, 257
Blakeslee, J. P., Franx, M., Postman, M., et al. 2003b, ApJ, 596, L143
Bouwens, R. J., Illingworth, G. D., Blakeslee, J. P., Broadhurst, T. J., & Franx, M. 2004a,
ApJ, 611, L1
Bouwens, R. J., Illingworth, G. D., Blakeslee, J. P., & Franx, M. 2005a, Submitted to ApJ
Bouwens, R. J., Illingworth, G. D., Broadhurst, T. J., et al. 2005b, Submitted to ApJ
Bouwens, R. J., Illingworth, G. D., Thompson, R. I., et al. 2004b, ApJ, 606, L25
Bruzual, G. & Charlot, S. 2003, MNRAS, 344, 1000
Calzetti, D., Armus, L., Bohlin, R. C., et al. 2000, ApJ, 533, 682
Charlot, S. & Fall, S. M. 1993, ApJ, 415, 580
Coleman, G. D., Wu, C.-C., & Weedman, D. W. 1980, ApJS, 43, 393
De Breuck, C., van Breugel, W., Rottgering, H. J. A., & Miley, G. 2000, A&AS, 143, 303
De Breuck, C., van Breugel, W., Stanford, S. A., et al. 2002, AJ, 123, 637
Dey, A., van Breugel, W., Vacca, W. D., & Antonucci, R. 1997, ApJ, 490, 698
Djorgovski, S. G., Odewahn, S. C., Gal, R. R., Brunner, R. J., & de Carvalho, R. R. 1999,
in Astronomical Society of the Pacific Conference Series, 179
Djorgovski, S. G., Stern, D., Mahabal, A. A., & Brunner, R. 2003, ApJ, 596, 67
Ellis, R., Santos, M. R., Kneib, J., & Kuijken, K. 2001, ApJ, 560, L119
Fan, X., Strauss, M. A., Schneider, D. P., et al. 2003, AJ, 125, 1649
Ferguson, H. C., Dickinson, M., Giavalisco, M., et al. 2004, ApJ, 600, L107
Ferrarese, L. & Merritt, D. 2000, ApJ, 539, L9
Ford, H. C., Bartko, F., Bely, P. Y., et al. 1998, in Proc. SPIE Vol. 3356, p. 234-248, Space
Telescopes and Instruments V, Pierre Y. Bely; James B. Breckinridge; Eds., 234–248
– 26 –
Francis, P. J., Williger, G. M., Collins, N. R., et al. 2001, ApJ, 554, 1001
Gebhardt, K., Bender, R., Bower, G., et al. 2000, ApJ, 539, L13
Gehrels, N. 1986, ApJ, 303, 336
Giavalisco, M. & Dickinson, M. 2001, ApJ, 550, 177
Giavalisco, M., Dickinson, M., Ferguson, H. C., et al. 2004a, ApJ, 600, L103
Giavalisco, M., Ferguson, H. C., Koekemoer, A. M., et al. 2004b, ApJ, 600, L93
Giavalisco, M., Steidel, C. C., Adelberger, K. L., et al. 1998, ApJ, 503, 543
Hamana, T., Ouchi, M., Shimasaku, K., Kayo, I., & Suto, Y. 2004, MNRAS, 347, 813
Heckman, T. M., Armus, L., & Miley, G. K. 1990, ApJS, 74, 833
Holden, B. P., van der Wel, A., Franx, M., et al. 2005, ApJ, 620, L83
Kaiser, N. 1984, ApJ, 284, L9
Keel, W. C., Cohen, S. H., Windhorst, R. A., & Waddington, I. 1999, AJ, 118, 2547
Kinney, A. L., Calzetti, D., Bohlin, R. C., et al. 1996, ApJ, 467, 38
Klamer, I. J., Ekers, R. D., Sadler, E. M., et al. 2005, ApJ, 621, L1
Kron, R. G. 1980, ApJS, 43, 305
Kurk, J., Rottgering, H., Pentericci, L., Miley, G., & Overzier, R. 2003, New Astronomy
Review, 47, 339
Lehnert, M. D. & Bremer, M. 2003, ApJ, 593, 630
Leitherer, C., Schaerer, D., Goldader, J. D., et al. 1999, ApJS, 123, 3
Moller, P. & Fynbo, J. U. 2001, A&A, 372, L57
Madau, P. 1995, ApJ, 441, 18
Madau, P., Ferguson, H. C., Dickinson, M. E., et al. 1996, MNRAS, 283, 1388
Madau, P., Pozzetti, L., & Dickinson, M. 1998, ApJ, 498, 106
Magorrian, J., Tremaine, S., Richstone, D., et al. 1998, AJ, 115, 2285
– 27 –
Miley, G. K., Overzier, R. A., Tsvetanov, Z. I., et al. 2004, Nature, 427, 47
Mullis, C. R., Rosati, P., Lamer, G., et al. 2005, ApJ, 623, L85
Neufeld, D. A. 1991, ApJ, 370, L85
Oke, J. B. 1971, ApJ, 170, 193
Ouchi, M., Shimasaku, K., Akiyama, M., et al. 2005, ApJ, 620, L1
Ouchi, M., Shimasaku, K., Okamura, S., et al. 2004a, ApJ, 611, 660
—. 2004b, ApJ, 611, 685
Papovich, C., Dickinson, M., & Ferguson, H. C. 2001, ApJ, 559, 620
Papovich, C., Dickinson, M., Ferguson, H. C., et al. 2004, ApJ, 600, L111
Pascarelle, S. M., Windhorst, R. A., Driver, S. P., Ostrander, E. J., & Keel, W. C. 1996,
ApJ, 456, L21
Pentericci, L., Kurk, J. D., Rottgering, H. J. A., et al. 2000, A&A, 361, L25
Pentericci, L., McCarthy, P. J., Rottgering, H. J. A., et al. 2001, ApJS, 135, 63
Porciani, C. & Giavalisco, M. 2002, ApJ, 565, 24
Postman, M., ACS IDT, ACS IDT, et al. 2005, ApJ, Accepted for publication
Rawlings, S., Lacy, M., Blundell, K. M., et al. 1996, Nature, 383, 502
Rees, M. J. 1989, MNRAS, 239, 1P
Reuland, M., van Breugel, W., Rottgering, H., et al. 2003, ApJ, 592, 755
Sanchez, S. F. & Gonzalez-Serrano, J. I. 2002, A&A, 396, 773
Schlegel, D. J., Finkbeiner, D. P., & Davis, M. 1998, ApJ, 500, 525
Shapley, A. E., Steidel, C. C., Pettini, M., & Adelberger, K. L. 2003, ApJ, 588, 65
Sheth, R. K. & Tormen, G. 1999, MNRAS, 308, 119
Shimasaku, K., Ouchi, M., Okamura, S., et al. 2003, ApJ, 586, L111
Sirianni, M., Jee, M., Benıtez, N., et al. 2005, Submitted to PASP
– 28 –
Somerville, R. S., Lee, K., Ferguson, H. C., et al. 2004, ApJ, 600, L171
Spergel, D. N., Verde, L., Peiris, H. V., et al. 2003, ApJS, 148, 175
Springel, V., White, S. D. M., Jenkins, A., et al. 2005, Nature, 435, 629
Stanford, S. A., Eisenhardt, P. R., & Dickinson, M. 1998, ApJ, 492, 461
Steidel, C. C., Adelberger, K. L., Dickinson, M., et al. 1998, ApJ, 492, 428
Steidel, C. C., Adelberger, K. L., Giavalisco, M., Dickinson, M., & Pettini, M. 1999, ApJ,
519, 1
Steidel, C. C., Adelberger, K. L., Shapley, A. E., Erb, D. K.and Reddy, N. A., & Pettini,
M. 2005, ApJ in Press (astro-ph/0502432), 626, 44
Steidel, C. C., Adelberger, K. L., Shapley, A. E., et al. 2000, ApJ, 532, 170
van Breugel, W., De Breuck, C., Stanford, S. A., et al. 1999, ApJ, 518, L61
Venemans, B. P., Kurk, J. D., Miley, G. K., et al. 2002, ApJ, 569, L11
Venemans, B. P., Rottgering, H. J. A., Miley, G. K., et al. 2005, A&A, 431, 793
Venemans, B. P., Rottgering, H., Overzier, R., et al. 2004, A&A, 424, L17
Wang, J. X., Rhoads, J. E., Malhotra, S., et al. 2004, ApJ, 608, L21
Wuyts, S., van Dokkum, P. G., Kelson, D. D., Franx, M., & Illingworth, G. D. 2004, ApJ,
605, 677
Zirm, A., Overzier, R., Miley, G., et al. 2005, ApJ, 630, In press
Zirm, A. W., Dickinson, M., & Dey, A. 2003, ApJ, 585, 90
This preprint was prepared with the AAS LATEX macros v5.2.
– 29 –
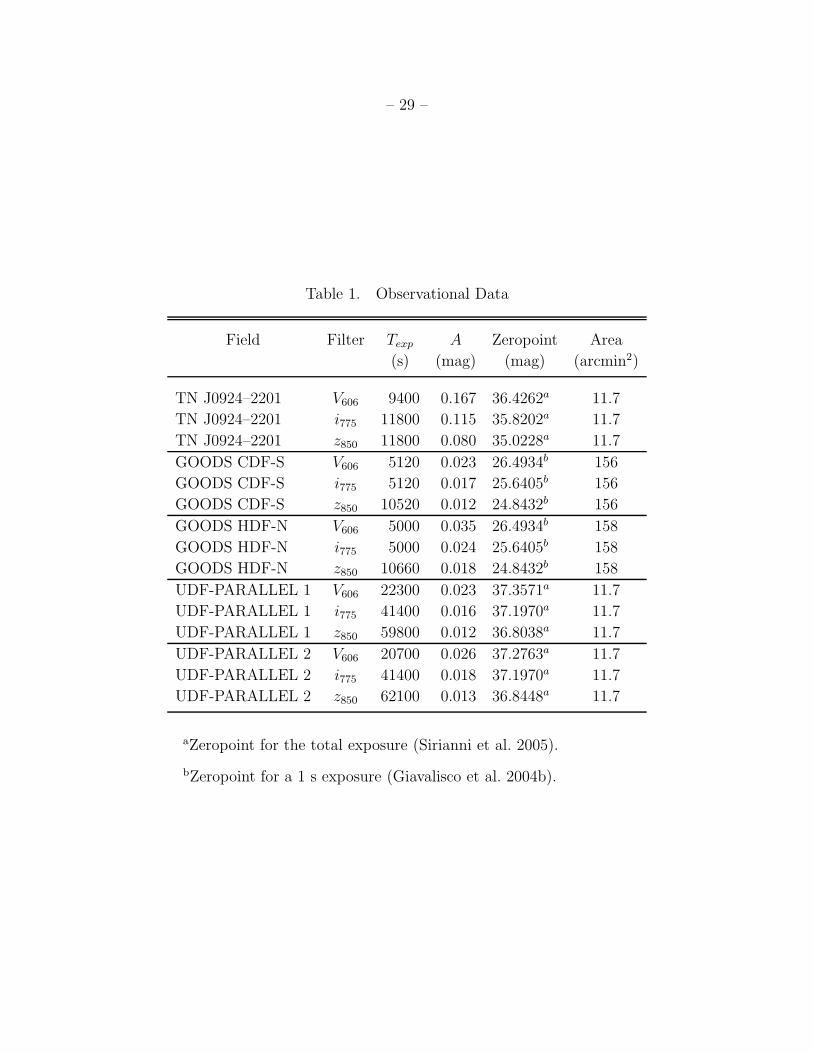
Table 1. Observational Data
Field Filter Texp A Zeropoint Area
(s) (mag) (mag) (arcmin2)
TN J0924–2201 V606 9400 0.167 36.4262a 11.7
TN J0924–2201 i775 11800 0.115 35.8202a 11.7
TN J0924–2201 z850 11800 0.080 35.0228a 11.7
GOODS CDF-S V606 5120 0.023 26.4934b 156
GOODS CDF-S i775 5120 0.017 25.6405b 156
GOODS CDF-S z850 10520 0.012 24.8432b 156
GOODS HDF-N V606 5000 0.035 26.4934b 158
GOODS HDF-N i775 5000 0.024 25.6405b 158
GOODS HDF-N z850 10660 0.018 24.8432b 158
UDF-PARALLEL 1 V606 22300 0.023 37.3571a 11.7
UDF-PARALLEL 1 i775 41400 0.016 37.1970a 11.7
UDF-PARALLEL 1 z850 59800 0.012 36.8038a 11.7
UDF-PARALLEL 2 V606 20700 0.026 37.2763a 11.7
UDF-PARALLEL 2 i775 41400 0.018 37.1970a 11.7
UDF-PARALLEL 2 z850 62100 0.013 36.8448a 11.7
aZeropoint for the total exposure (Sirianni et al. 2005).
bZeropoint for a 1 s exposure (Giavalisco et al. 2004b).
– 30 –
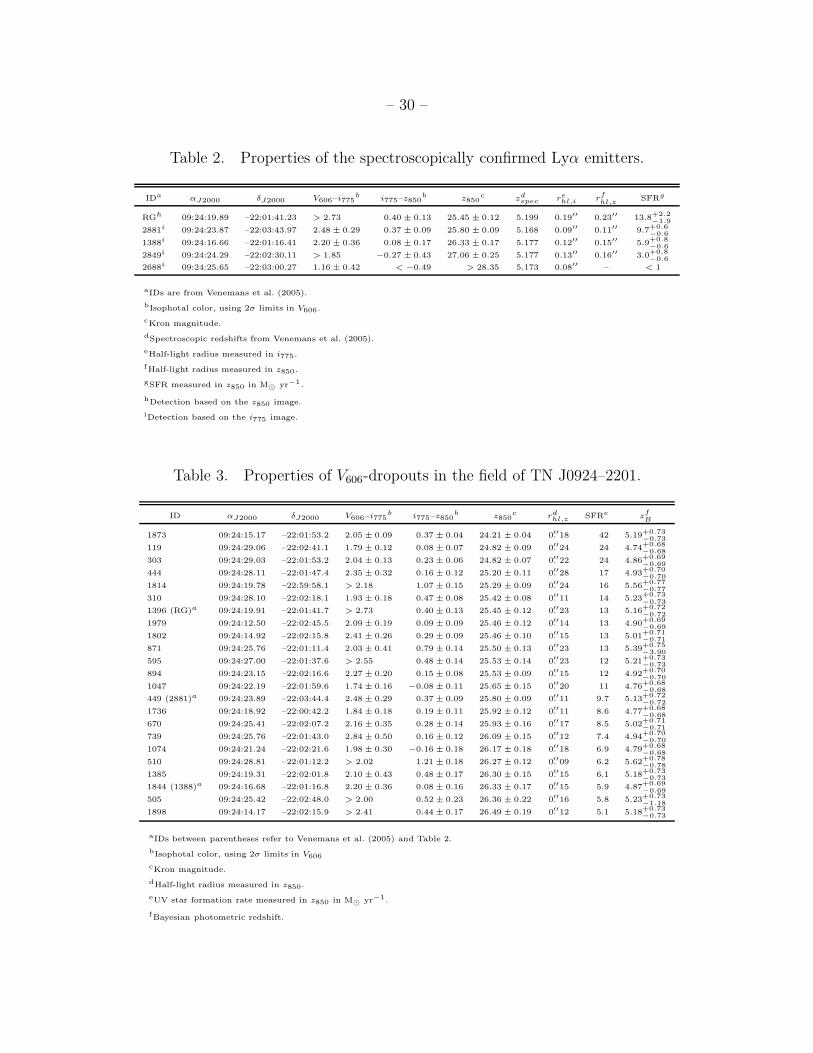
Table 2. Properties of the spectroscopically confirmed Lyα emitters.
IDaαJ2000 δJ2000 V606–i775
bi775–z850
bz850
cz
dspec r
ehl,i r
fhl,z
SFRg
RGh 09:24:19.89 –22:01:41.23 > 2.73 0.40 ± 0.13 25.45 ± 0.12 5.199 0.19′′ 0.23′′ 13.8+2.2−1.9
2881i 09:24:23.87 –22:03:43.97 2.48 ± 0.29 0.37 ± 0.09 25.80 ± 0.09 5.168 0.09′′ 0.11′′ 9.7+0.6−0.6
1388i 09:24:16.66 –22:01:16.41 2.20 ± 0.36 0.08 ± 0.17 26.33 ± 0.17 5.177 0.12′′ 0.15′′ 5.9+0.8−0.6
2849i 09:24:24.29 –22:02:30.11 > 1.85 −0.27 ± 0.43 27.06 ± 0.25 5.177 0.13′′ 0.16′′ 3.0+0.8−0.6
2688i 09:24:25.65 –22:03:00.27 1.16 ± 0.42 < −0.49 > 28.35 5.173 0.08′′ – < 1
aIDs are from Venemans et al. (2005).
bIsophotal color, using 2σ limits in V606.
cKron magnitude.
dSpectroscopic redshifts from Venemans et al. (2005).
eHalf-light radius measured in i775.
fHalf-light radius measured in z850.
gSFR measured in z850 in M⊙ yr−1.
hDetection based on the z850 image.
iDetection based on the i775 image.
Table 3. Properties of V606-dropouts in the field of TN J0924–2201.
ID αJ2000 δJ2000 V606–i775b
i775–z850b
z850c
rdhl,z SFRe
zfB
1873 09:24:15.17 –22:01:53.2 2.05 ± 0.09 0.37 ± 0.04 24.21 ± 0.04 0.′′18 42 5.19+0.73
−0.73
119 09:24:29.06 –22:02:41.1 1.79 ± 0.12 0.08 ± 0.07 24.82 ± 0.09 0.′′24 24 4.74+0.68
−0.68
303 09:24:29.03 –22:01:53.2 2.04 ± 0.13 0.23 ± 0.06 24.82 ± 0.07 0.′′22 24 4.86+0.69
−0.69
444 09:24:28.11 –22:01:47.4 2.35 ± 0.32 0.16 ± 0.12 25.20 ± 0.11 0.′′28 17 4.93+0.70
−0.70
1814 09:24:19.78 –22:59:58.1 > 2.18 1.07 ± 0.15 25.29 ± 0.09 0.′′24 16 5.56+0.77
−0.77
310 09:24:28.10 –22:02:18.1 1.93 ± 0.18 0.47 ± 0.08 25.42 ± 0.08 0.′′11 14 5.23
+0.73−0.73
1396 (RG)a 09:24:19.91 –22:01:41.7 > 2.73 0.40 ± 0.13 25.45 ± 0.12 0.′′23 13 5.16+0.72−0.72
1979 09:24:12.50 –22:02:45.5 2.09 ± 0.19 0.09 ± 0.09 25.46 ± 0.12 0.′′14 13 4.90+0.69
−0.69
1802 09:24:14.92 –22:02:15.8 2.41 ± 0.26 0.29 ± 0.09 25.46 ± 0.10 0.′′15 13 5.01+0.71
−0.71
871 09:24:25.76 –22:01:11.4 2.03 ± 0.41 0.79 ± 0.14 25.50 ± 0.13 0.′′23 13 5.39+0.75
−3.90
595 09:24:27.00 –22:01:37.6 > 2.55 0.48 ± 0.14 25.53 ± 0.14 0.′′23 12 5.21+0.73
−0.73
894 09:24:23.15 –22:02:16.6 2.27 ± 0.20 0.15 ± 0.08 25.53 ± 0.09 0.′′15 12 4.92+0.70
−0.70
1047 09:24:22.19 –22:01:59.6 1.74 ± 0.16 −0.08 ± 0.11 25.65 ± 0.15 0.′′20 11 4.76+0.68
−0.68
449 (2881)a 09:24:23.89 –22:03:44.4 2.48 ± 0.29 0.37 ± 0.09 25.80 ± 0.09 0.′′11 9.7 5.13+0.72−0.72
1736 09:24:18.92 –22:00:42.2 1.84 ± 0.18 0.19 ± 0.11 25.92 ± 0.12 0.′′11 8.6 4.77+0.68
−0.68
670 09:24:25.41 –22:02:07.2 2.16 ± 0.35 0.28 ± 0.14 25.93 ± 0.16 0.′′17 8.5 5.02+0.71
−0.71
739 09:24:25.76 –22:01:43.0 2.84 ± 0.50 0.16 ± 0.12 26.09 ± 0.15 0.′′12 7.4 4.94+0.70
−0.70
1074 09:24:21.24 –22:02:21.6 1.98 ± 0.30 −0.16 ± 0.18 26.17 ± 0.18 0.′′18 6.9 4.79+0.68
−0.68
510 09:24:28.81 –22:01:12.2 > 2.02 1.21 ± 0.18 26.27 ± 0.12 0.′′09 6.2 5.62+0.78
−0.78
1385 09:24:19.31 –22:02:01.8 2.10 ± 0.43 0.48 ± 0.17 26.30 ± 0.15 0.′′15 6.1 5.18+0.73
−0.73
1844 (1388)a 09:24:16.68 –22:01:16.8 2.20 ± 0.36 0.08 ± 0.16 26.33 ± 0.17 0.′′15 5.9 4.87+0.69−0.69
505 09:24:25.42 –22:02:48.0 > 2.00 0.52 ± 0.23 26.36 ± 0.22 0.′′16 5.8 5.23+0.73
−1.18
1898 09:24:14.17 –22:02:15.9 > 2.41 0.44 ± 0.17 26.49 ± 0.19 0.′′12 5.1 5.18+0.73
−0.73
aIDs between parentheses refer to Venemans et al. (2005) and Table 2.
bIsophotal color, using 2σ limits in V606
cKron magnitude.
dHalf-light radius measured in z850.
eUV star formation rate measured in z850 in M⊙ yr−1.
fBayesian photometric redshift.
– 31 –
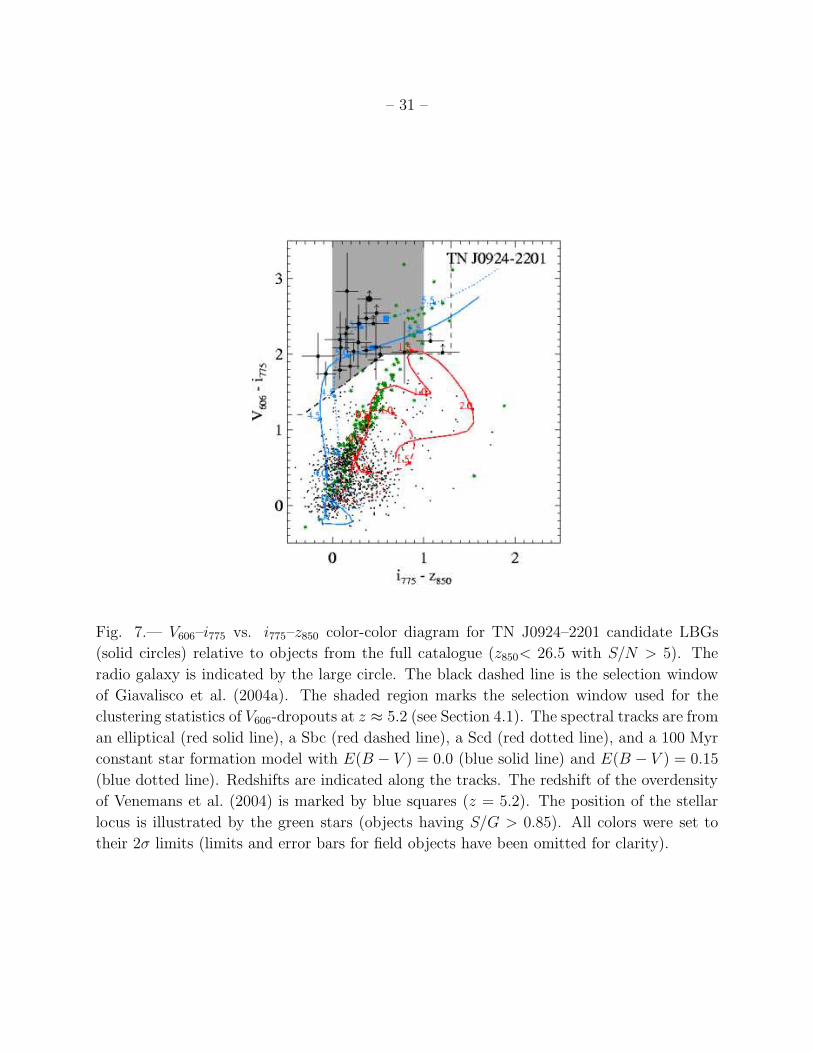
Fig. 7.— V606–i775 vs. i775–z850 color-color diagram for TN J0924–2201 candidate LBGs
(solid circles) relative to objects from the full catalogue (z850< 26.5 with S/N > 5). The
radio galaxy is indicated by the large circle. The black dashed line is the selection window
of Giavalisco et al. (2004a). The shaded region marks the selection window used for the
clustering statistics of V606-dropouts at z ≈ 5.2 (see Section 4.1). The spectral tracks are from
an elliptical (red solid line), a Sbc (red dashed line), a Scd (red dotted line), and a 100 Myr
constant star formation model with E(B − V ) = 0.0 (blue solid line) and E(B − V ) = 0.15
(blue dotted line). Redshifts are indicated along the tracks. The redshift of the overdensity
of Venemans et al. (2004) is marked by blue squares (z = 5.2). The position of the stellar
locus is illustrated by the green stars (objects having S/G > 0.85). All colors were set to
their 2σ limits (limits and error bars for field objects have been omitted for clarity).
– 32 –
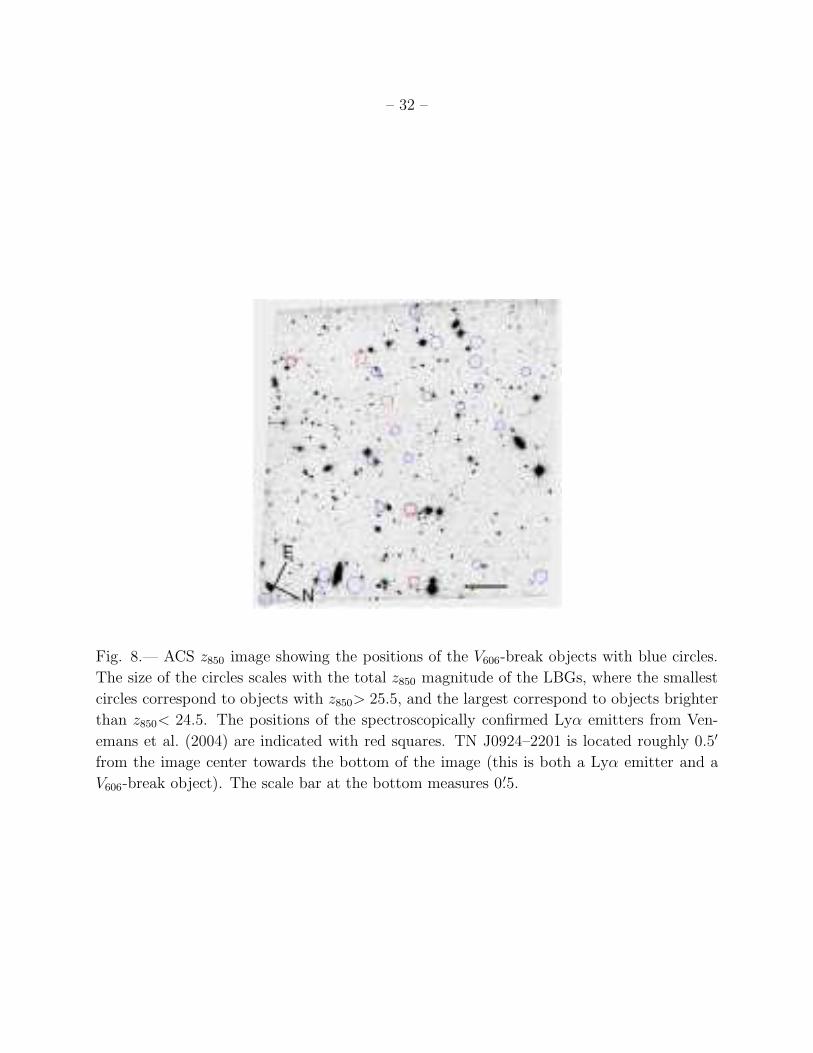
Fig. 8.— ACS z850 image showing the positions of the V606-break objects with blue circles.
The size of the circles scales with the total z850 magnitude of the LBGs, where the smallest
circles correspond to objects with z850> 25.5, and the largest correspond to objects brighter
than z850< 24.5. The positions of the spectroscopically confirmed Lyα emitters from Ven-
emans et al. (2004) are indicated with red squares. TN J0924–2201 is located roughly 0.5′
from the image center towards the bottom of the image (this is both a Lyα emitter and a
V606-break object). The scale bar at the bottom measures 0.′5.
– 33 –
Fig. 9.— HST/ACS postage stamps showing (from left to right) V606, i775, and z850 of the
z ∼ 5 LBG sample. Each image measures 2′′ × 2′′, corresponding to ∼ 13× 13 kpc at z ∼ 5.
The Kron aperture defined by the light distribution in z850 has been indicated. The images
have been smoothed using a Gaussian kernel of 0.075′′ (FWHM).
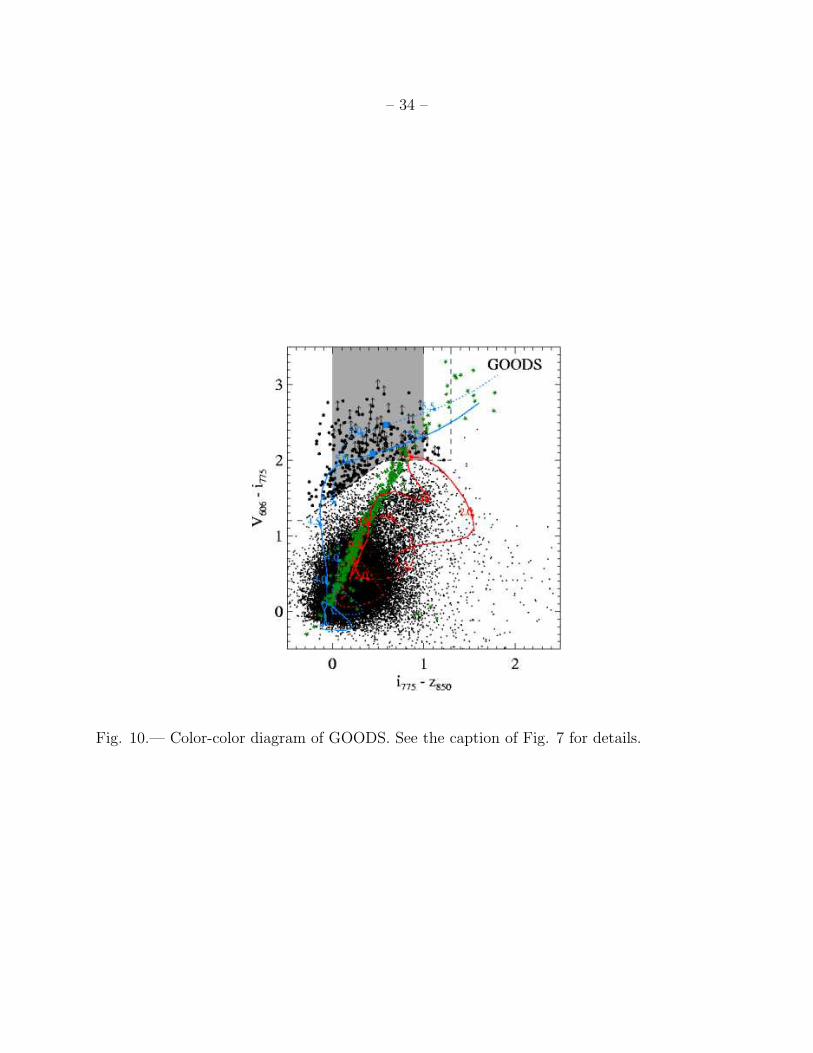
– 34 –
Fig. 10.— Color-color diagram of GOODS. See the caption of Fig. 7 for details.
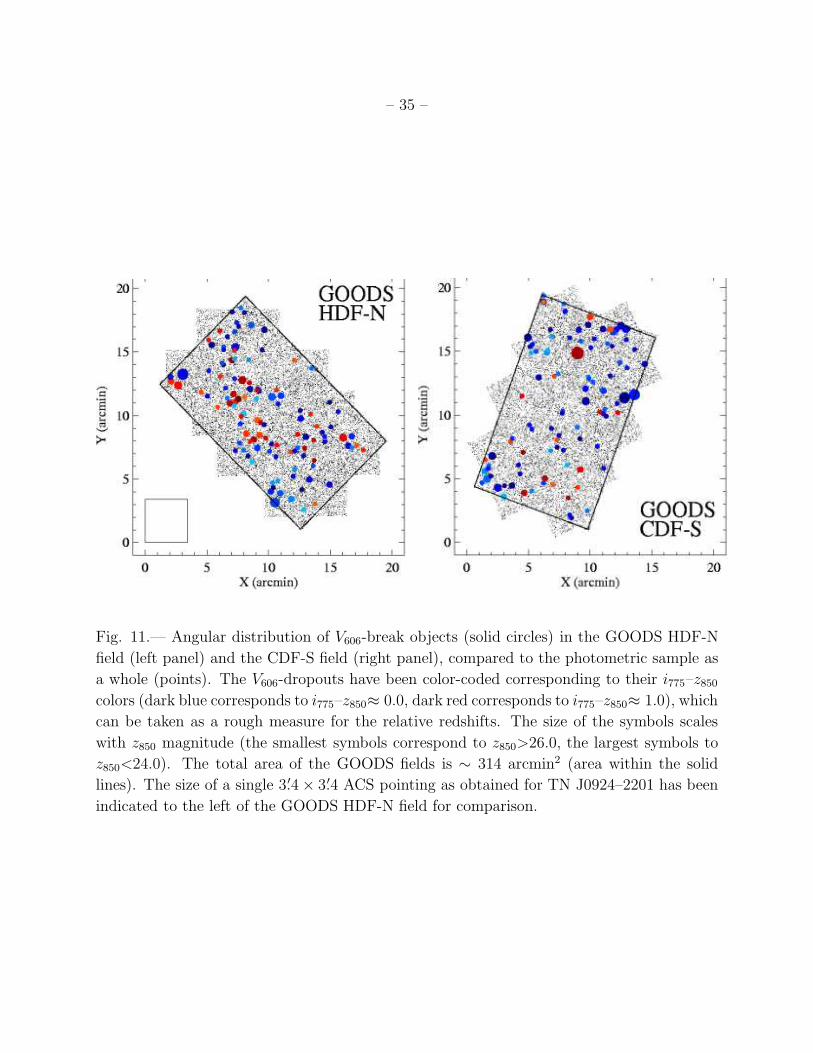
– 35 –
Fig. 11.— Angular distribution of V606-break objects (solid circles) in the GOODS HDF-N
field (left panel) and the CDF-S field (right panel), compared to the photometric sample as
a whole (points). The V606-dropouts have been color-coded corresponding to their i775–z850
colors (dark blue corresponds to i775–z850≈ 0.0, dark red corresponds to i775–z850≈ 1.0), which
can be taken as a rough measure for the relative redshifts. The size of the symbols scales
with z850 magnitude (the smallest symbols correspond to z850>26.0, the largest symbols to
z850<24.0). The total area of the GOODS fields is ∼ 314 arcmin2 (area within the solid
lines). The size of a single 3.′4 × 3.′4 ACS pointing as obtained for TN J0924–2201 has been
indicated to the left of the GOODS HDF-N field for comparison.
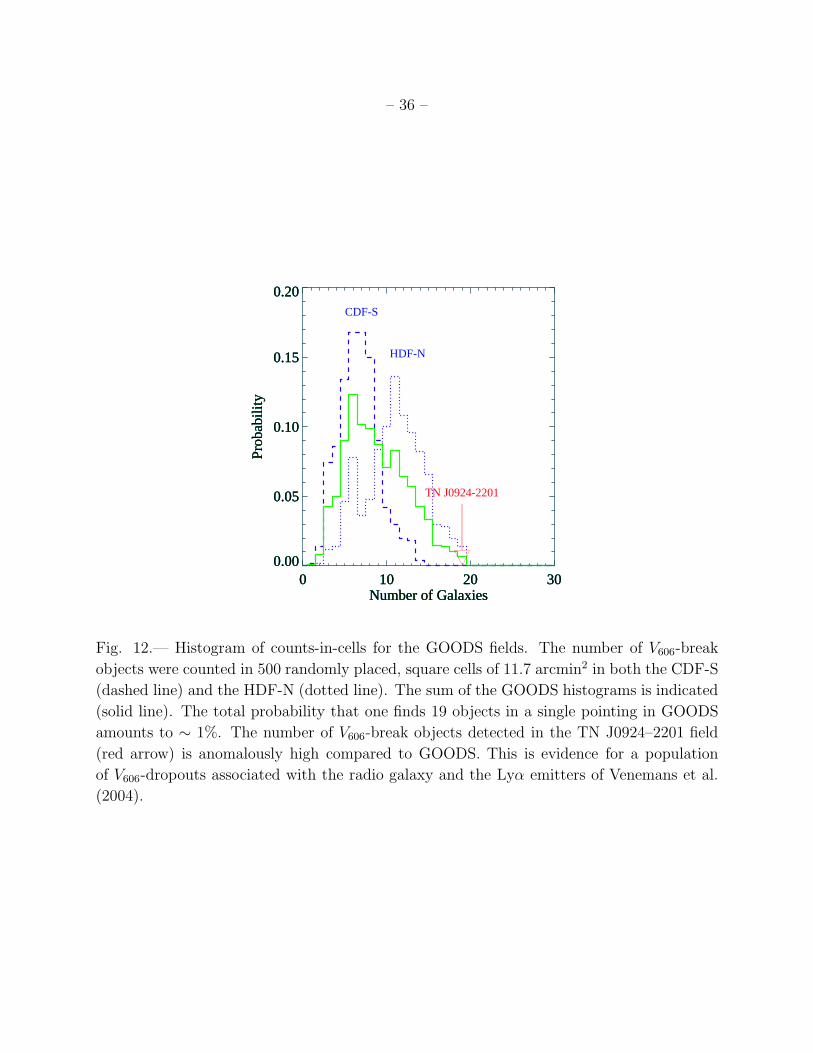
– 36 –
0 10 20 30Number of Galaxies
0.00
0.05
0.10
0.15
0.20
Prob
abili
ty
0 10 20 30Number of Galaxies
0.00
0.05
0.10
0.15
0.20
Prob
abili
ty
0 10 20 30Number of Galaxies
0.00
0.05
0.10
0.15
0.20
Prob
abili
ty
TN J0924-2201
CDF-S
HDF-N
0 10 20 30Number of Galaxies
0.00
0.05
0.10
0.15
0.20
Prob
abili
ty
Fig. 12.— Histogram of counts-in-cells for the GOODS fields. The number of V606-break
objects were counted in 500 randomly placed, square cells of 11.7 arcmin2 in both the CDF-S
(dashed line) and the HDF-N (dotted line). The sum of the GOODS histograms is indicated
(solid line). The total probability that one finds 19 objects in a single pointing in GOODS
amounts to ∼ 1%. The number of V606-break objects detected in the TN J0924–2201 field
(red arrow) is anomalously high compared to GOODS. This is evidence for a population
of V606-dropouts associated with the radio galaxy and the Lyα emitters of Venemans et al.
(2004).
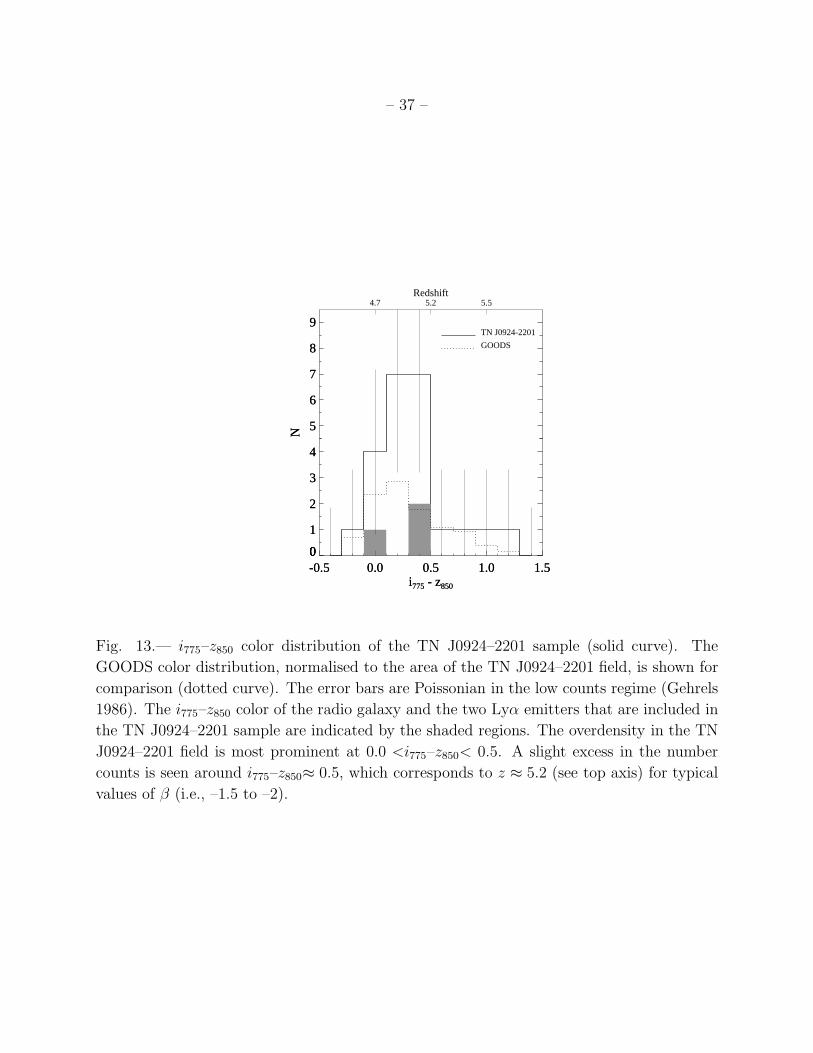
– 37 –
-0.5 0.0 0.5 1.0 1.5i775 - z850
0
1
2
3
4
5
6
7
8
9
0
N
-0.5 0.0 0.5 1.0 1.5i775 - z850
0
1
2
3
4
5
6
7
8
9
0
N
GOODS
TN J0924-2201
4.7 5.2 5.5Redshift
Fig. 13.— i775–z850 color distribution of the TN J0924–2201 sample (solid curve). The
GOODS color distribution, normalised to the area of the TN J0924–2201 field, is shown for
comparison (dotted curve). The error bars are Poissonian in the low counts regime (Gehrels
1986). The i775–z850 color of the radio galaxy and the two Lyα emitters that are included in
the TN J0924–2201 sample are indicated by the shaded regions. The overdensity in the TN
J0924–2201 field is most prominent at 0.0 <i775–z850< 0.5. A slight excess in the number
counts is seen around i775–z850≈ 0.5, which corresponds to z ≈ 5.2 (see top axis) for typical
values of β (i.e., –1.5 to –2).
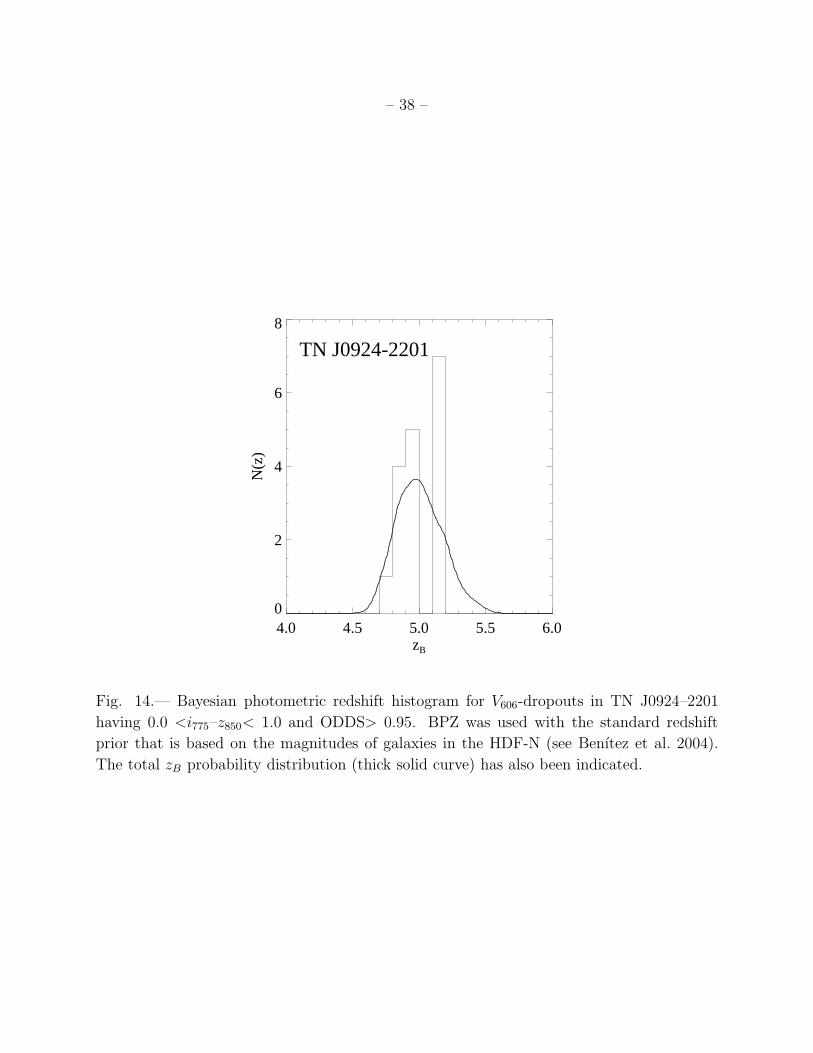
– 38 –
4.0 4.5 5.0 5.5 6.0zB
0
2
4
6
8
N(z
)
TN J0924-2201
Fig. 14.— Bayesian photometric redshift histogram for V606-dropouts in TN J0924–2201
having 0.0 <i775–z850< 1.0 and ODDS> 0.95. BPZ was used with the standard redshift
prior that is based on the magnitudes of galaxies in the HDF-N (see Benıtez et al. 2004).
The total zB probability distribution (thick solid curve) has also been indicated.
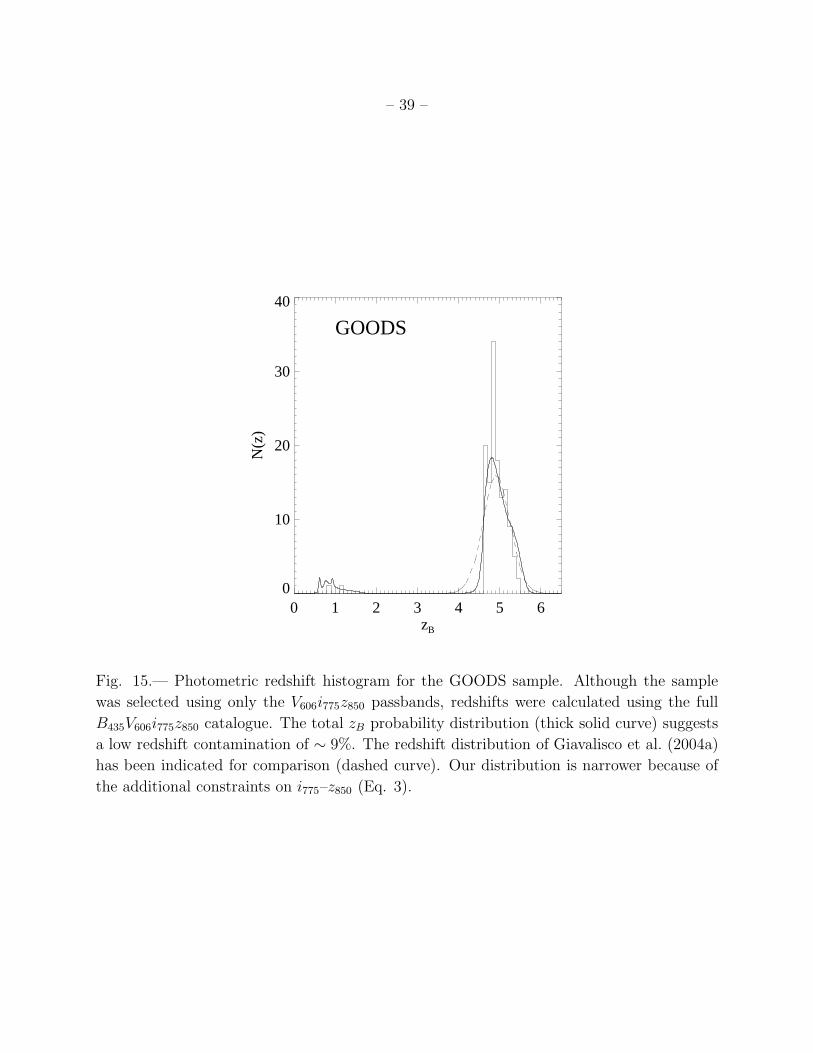
– 39 –
0 1 2 3 4 5 6zB
0
10
20
30
40
N(z
)
GOODS
Fig. 15.— Photometric redshift histogram for the GOODS sample. Although the sample
was selected using only the V606i775z850 passbands, redshifts were calculated using the full
B435V606i775z850 catalogue. The total zB probability distribution (thick solid curve) suggests
a low redshift contamination of ∼ 9%. The redshift distribution of Giavalisco et al. (2004a)
has been indicated for comparison (dashed curve). Our distribution is narrower because of
the additional constraints on i775–z850 (Eq. 3).
Related Documents