Clustering E-Commerce Search Engines based on Their Search Interface Pages Using WISE-Cluster Yiyao Lu, Hai He, Qian Peng, Weiyi Meng Department of Computer Science SUNY at Binghamton Binghamton, NY 13902, USA 1-607-777-4311 {ylu0, haihe, meng}@binghamton.edu Clement Yu Department of Computer Science University of Illinois at Chicago Chicago, IL 60607, USA 1-312-996-2318 [email protected] ABSTRACT In this paper, we propose a new approach to clustering e-commerce search engines (ESEs) on the Web. Our approach utilizes the features available on the interface page of each ESE, including the label terms and value terms appearing in the search form, the number of images, normalized price terms as well as other terms. The experimental results based on more than 400 ESEs indicate that the proposed approach has good clustering accuracy. The importance of different types of features is analyzed and the terms in the search form are the most important feature in obtaining quality clusters. Keywords: E-commerce, search engine, clustering, categorization, Web-based information systems Corresponding Author: Weiyi Meng Department of Computer Science SUNY at Binghamton Binghamton, NY 13902, USA Tel: 1-607-777-4311, Fax: 1-607-777-4729 Email: [email protected] 1

Welcome message from author
This document is posted to help you gain knowledge. Please leave a comment to let me know what you think about it! Share it to your friends and learn new things together.
Transcript
Clustering E-Commerce Search Engines based on Their Search Interface Pages Using WISE-Cluster
Yiyao Lu, Hai He, Qian Peng, Weiyi Meng
Department of Computer Science SUNY at Binghamton
Binghamton, NY 13902, USA 1-607-777-4311
{ylu0, haihe, meng}@binghamton.edu
Clement Yu Department of Computer Science University of Illinois at Chicago
Chicago, IL 60607, USA 1-312-996-2318 [email protected]
ABSTRACT
In this paper, we propose a new approach to clustering e-commerce search engines (ESEs) on the
Web. Our approach utilizes the features available on the interface page of each ESE, including the
label terms and value terms appearing in the search form, the number of images, normalized price
terms as well as other terms. The experimental results based on more than 400 ESEs indicate that
the proposed approach has good clustering accuracy. The importance of different types of features
is analyzed and the terms in the search form are the most important feature in obtaining quality
clusters.
Keywords: E-commerce, search engine, clustering, categorization, Web-based information systems
Corresponding Author: Weiyi Meng Department of Computer Science SUNY at Binghamton Binghamton, NY 13902, USA Tel: 1-607-777-4311, Fax: 1-607-777-4729 Email: [email protected]
1
Clustering E-Commerce Search Engines based on Their Search Interface Pages Using WISE-Cluster
Yiyao Lu, Hai He, Qian Peng, Weiyi Meng Department of Computer Science
SUNY at Binghamton Binghamton, NY 13902, USA
1-607-777-4311 {ylu0, haihe, meng}@binghamton.edu
Clement Yu
Department of Computer Science University of Illinois at Chicago
Chicago, IL 60607, USA 1-312-996-2318 [email protected]
ABSTRACT
In this paper, we propose a new approach to clustering e-commerce search engines (ESEs) on the
Web. Our approach utilizes the features available on the interface page of each ESE, including the
label terms and value terms appearing in the search form, the number of images, normalized price
terms as well as other terms. The experimental results based on more than 400 ESEs indicate that
the proposed approach has good clustering accuracy. The importance of different types of features
is analyzed and the terms in the search form are the most important feature in obtaining quality
clusters.
Keywords: E-commerce, Search engine, clustering, categorization, Web-based information systems
1. INTRODUCTION
A large number of databases are Web accessible through form-based search interfaces and many of these Web
sources are E-commerce Search Engines (ESEs) that are designed to sell products/services. Providing a
unified access to multiple ESEs selling similar products is of great importance as it allows users (shoppers) to
search and compare products from multiple sites with ease. A system that supports such a unified access to
2

multiple ESEs may be called as an E-commerce metasearch engine (EMSE for short). A number of EMSEs
have been created for some application areas on the Web. For example, addall.com searches books from
multiple book sites. To be able to provide users with a unified access to multiple ESEs, the first task is to
collect ESEs from the Web and classify them into different groups such that the ESEs in the same group sell
the same type of products/services (i.e., these ESEs are in the same domain) and those in different groups sell
different types of products/services. Next, the search interfaces of the ESEs in the same group are integrated
into a unified search interface, which becomes the search interface of the EMSE for this group. When a user
query is submitted to the EMSE, it will be mapped to the underlying ESEs for evaluation. In general, building
and maintaining EMSEs that involve a large number of ESEs is a labor-intensive and time-consuming
undertaking due to the autonomous nature of the Web environment. Our E-Metabase project aims to develop
techniques that can significantly enhance the automation of the process of building and maintaining large-
scale EMSEs. In [7], we reported WISE-Integrator – a prototype system for automatically integrating multiple
ESE search interfaces in the same domain into a unified search interface. WISE-Integrator and other search
interface integration techniques (e.g., [5, 17]) require that all the input search interfaces be from ESEs in the
same domain. In this paper, we report the design of WISE-Cluster – a tool that aims to automatically cluster
ESEs into different groups according to their domains. (In this paper, WISE stands for Web Interface of
Search Engine.)
ESE clustering has not received much attention despite its emerging importance. The work in [6] is the
only published work on this topic that we are aware of. In [6], a model-based clustering technique is applied
to the schema (i.e., the attribute labels) associated with the search form of each input ESE. While this
approach confirms the importance of attribute labels in the search interface schema (form) in clustering ESEs,
it has the following weaknesses: (1) much useful information on the interface (see Section 3) is not utilized;
and (2) the issue of handling different types of search interface pages (see Section 2) is not addressed. Our
approach is designed to address these issues while employing a different clustering method. ESE clustering is
related to search engine categorization [9, 14]. The search engines considered in these two papers are
document search engines (which search documents/Web pages) not ESEs (which search structured product
data). Both techniques are query submission based, i.e., queries are submitted and the returned results are
3

analyzed. They suffer from the difficulties of forming good probing queries and connecting to search engines
automatically. In contrast, the method proposed in this paper uses only the Web pages that contain the search
forms of the considered ESEs to perform clustering, and requires no probing queries to be submitted. The
reason that we do not need a query submission based approach for ESEs is that the interface pages of ESEs
usually contain a substantial amount of information about the searchable contents (products) while the
interfaces of document search engines contain little information about the indexed documents. ESE clustering
is also related to document clustering (e.g., [10, 12, 18, 19]) and Web page clustering (e.g., [1, 20]). However,
there are fundamental differences between existing approaches for clustering documents/Web pages and our
approach for clustering ESEs. Traditional document clustering uses only terms in each document while Web
page clustering uses both terms in Web pages and links connecting the Web pages. In contrast, our approach
places more emphasis on terms that appear in the search form of each ESE search interface. In addition, we
also utilize the number of images and normalized price terms in each ESE interface page. Furthermore, an
ESE interface page is not equivalent to a Web page/document because multiple ESEs may appear on a single
interface page (see Section 2 for more detail). The need of separating multiple ESEs from a single page and
extracting the feature information for each ESE automatically is unique in ESE clustering.
This paper has the following contributions. First, a new approach for clustering ESEs is proposed. It
is based on the interface pages of ESEs and utilizes the unique features of ESEs. Second, it provides a detailed
analysis of different types of ESE interface pages. Six different types are identified and different treatments of
these types are provided. The differentiation of different types of ESE interface pages is an important
preprocessing step to enable the clustering of ESEs. This information is also useful in improving the accuracy
of ESE clustering. Third, it provides a method to utilize price values that appear in ESE interface pages. We
also carry out extensive experiments to measure the effectiveness of the proposed clustering approach and to
find out the impact of different features on the effectiveness of our approach. The clustering algorithm used in
this study is a combination of several well-known clustering techniques. The main contribution of this paper
is not a new clustering algorithm but rather the identification of some new features useful for ESE clustering
and the impact of these features over ESE clustering, as well as the clustering process that takes into
consideration different types of ESE interface pages.
4
The rest of the paper is organized as follows. Section 2 discusses six types of ESE interfaces and their
preprocessing. Section 3 discusses the features that are utilized for ESE clustering in our approach and how
the features can be automatically extracted. Section 4 presents the ESE clustering algorithm. Section 5
discusses the assignment of each cluster to appropriate concepts in a concept hierarchy. Section 6 provides the
experimental results. Finally, Section 7 concludes the paper.
2. DIFFERENT TYPES OF ESE INTERFACES
While most ESEs are dedicated to one category of products or services, a significant number of ESEs cover
multiple categories of products. For examples, Barnes & Noble focuses mostly on book sale, but it also sells
music CDs, DVDs and online courses. Based on our analysis of 356 ESE sites, we identify the following 6
types of ESE interfaces.
1. Devoted Type. In such an interface, only one ESE search form exists and it can search only one category
of products. About 84.3% of the ESE sites we surveyed belong to this type (see Table 1).
2. Divided Type. Such an interface can search multiple categories of products but it also has separate child
ESE search interfaces for different categories of products. For example, Amazon.com has a simple parent
interface that can search different categories of products, but it also has different child search engines
such as Book Search Engine, Music Search Engine, etc. In this case, the child ESEs will be used for
clustering while the parent ESE will not. The relationships between child ESEs and the parent ESE can
be discovered by a Web crawler when these pages are crawled because the parent interface page (usually
the homepage) contains links to child interface pages.
3. Co-existing Type. In this case, multiple ESEs coexist on a single Web page. For example, the airfare.com
interface page (Figure 1) has 4 search forms that can search flight, car reservation, travel package and
hotels separately. In our approach, search forms on the same interface page are first separated and then
treated as separate ESE interfaces during clustering.
[Figure 1 here]
Figure 1. Airfare.com search forms
4. Merged Type. In this case, a single search form can search multiple categories of products and the search
fields of different types of products co-exist in the search form. Moreover, only one submission button is
5

available. For example, in Figure 2 alldirect.com sells books, music and movies, and its search form
contains book attributes (e.g., book ISBN), music attributes (e.g., music artist) and movie attribute (e.g.,
movie title). This type of interface is not common. Only less than 2% of our surveyed ESE sites are of
this type. In our approach, such attributes are separated into different logical interfaces such that each
logical interface covers only one category of products. A simple method is currently applied to achieve
this. First, attributes of the search form are grouped based on their leading words. For example, in Figure
2 attributes like book author and book ISBN will be grouped together while attributes like music artist
and music album title will form another group. Next, a logical interface is formed based on the rest of the
page (the non-form portion) and the terms in one group. The relationship between the real ESE interface
and its logical interfaces is kept. This heuristic method is based on the assumption that on a merged type
interface the leading words are usually the good indications of the product domains to which the
attributes belong, and that without them it would be hard for users to select the right product to search. In
our dataset, 4 out of 5 collected ESEs of this type can be successfully identified by this heuristic method
(one is too confusing even for human users, so it was processed manually). During ESE clustering, each
logical interface is treated as an independent ESE. After clustering is done, logical interfaces are replaced
by their corresponding real ESEs for creating EMSEs. As a result, a real ESE may appear in multiple
clusters.
[Figure 2 here]
Figure 2. Alldirect.com search interface
5. Shared Type. In this case, the ESE site has multiple child pages for different types of products but these
pages share the same search form (i.e., the same search form is available on all child interface pages).
Usually the search form in this case contains only one text input field but it can search multiple categories
of products. For example, in the HalfPriceBooks.com site, there are child pages for books, music,
software, etc., but they all contain the same search form. Note that each child page contains more
information about a specific category of products. In our approach, we treat each such child page as a
separate ESE for clustering purpose. Since these ESEs all correspond to the same real search engine, our
approach here leads to the same real search engine to be assigned to multiple clusters.
6

6. Multi-page Type. An ESE of this type spans multiple pages and it requires multiple interactions with the
user to complete a search query. For example, the insurance company AAMI in Australia has separate
search engines to quote car, home and caravan insurance policies. A query for an insurance quote
requires a sequence of pages to complete and each page requires a submission. Only after all pages are
submitted, the query is considered completed and the result will be displayed. As we do not employ
query-submission based approaches in this paper, for an ESE of the multi-page type, only the first page
of the ESE is used for clustering (note that the second page can be obtained only after the first page is
filled and submitted).
Table 1 shows the numbers of ESE interfaces of different types among the 356 ESE sites we studied.
The last column indicates the number of ESEs after child interfaces and logical interfaces have been
separated.
Type Counts Before Processing Percentage Counts After Processing Devoted 300 84.3% 300 Divided 20 5.6% 45 Co-existing 5 1.4% 13 Merged 5 1.4% 11 Shared 5 1.4% 11 Multi-page 21 5.9% 21 Total 356 100% 401
Table 1. The Distribution of Different Types of ESEs
3. ESE INTERFACE FEATURES AND FEATURE EXTRACTION
3.1 Features of ESE Interfaces
Our proposed ESE clustering method is based on the features available on ESE interface pages. As a result, it
is critical to identify important features on ESE interface pages. The following features are utilized in our
method.
1. The number of images. This feature may be useful for differentiating ESEs that sell tangible products
from those selling intangible products. Tangible products are those that have a physical presence such as
books and music CDs while intangible products such as insurance policy have no physical presence. The
interfaces of ESEs that sell tangible products usually have more images than those that sell intangible
products. The reason is that ESEs selling tangible products tend to display their products to attract
7
customers (as the saying goes: “A picture is worth a thousand words”) but ESEs selling intangible
products have no physical product to display. In this paper, images that we consider exclude junk images
such as decoration labels, buttons or icons. Junk images can largely be detected by their sizes (can be
obtained from the width and height attributes of images) and the ratio of width to height of the images.
2. Price values. For online shopping customers, price information is very important for their purchase
decisions. Therefore, to attract consumers, bargaining products or top-selling products are frequently
advertised with prices on the interface pages of ESEs that sell tangible products. Products of the same
category usually have similar prices. As such, the range of price values can be useful to differentiate
different types of products. For example, the typical price range of a book is between $5 and $25 in
1bookstreet.com and usually does not exceed the price of a digital camcorder, whose price typically
ranges from $200 to $1700 in cameraworld.com. It is easy to identify prices on ESE interfaces as they
usually have prefix of currency symbols, such as Dollar “$”, Yuan “¥” and Pound “£”. Price values
cannot be compared directly for matching purpose. For example, values 19.95 and 19.99 are very close
even though they are different. To facilitate meaningful matching, we convert each actual price to a
representative price that will then be used for comparison. Each representative price represents all prices
within a certain price range. For larger prices, the range should also be larger. This is because a $10
difference is much more significant for low-price items than for high-price items. In our method, we use
the following function to map an original price P to a representative price P':
⎡ ⎤ ⎣ ⎦⎩⎨⎧
>=∗−≤
=510,5.0/5,5
' log PifmmmPPif
P P
As an example, given a DVD with price $16.99, we have m = 10 and P'= 20. In fact, all prices in (15, 25]
will be mapped to the same representative price 20. The range grows larger for higher prices, reflecting
the fact that the prices of more expensive items fluctuate more in absolute values. As another example, all
prices in (1500, 2500] will be mapped to 2000 using the above formula. Representative prices are also
called price terms in this paper. The price information in an ESE interface can be represented as a vector
of price terms with weights. The weight of a price term can be computed using the standard tf*idf
formula [16], which is an increasing function of the term’s frequency on a page (i.e., the number of times
8
the price term appears on the interface) and a decreasing function of the term’s document frequency (i.e.,
the number of ESE interfaces that have the price term). If the prices are in different currencies, then they
need to be converted to prices in the same currency before their representative prices are generated.
3. Form label terms. A typical ESE search form has an interface schema, which contains some attributes.
Each attribute is associated with a label. For example, a book search engine usually has labels such as
“title”, “author”, “ISBN” and “category”, while an automobile search engine usually has labels such as
“year” and “make”. The label terms on a search interface are strong indicators of the contents of the ESE,
and are, therefore, very useful for ESE clustering. The form label terms on an ESE interface can also be
represented as a vector of terms with weights. Again, the weights are computed using the tf*idf formula
in our current implementation. In the approach in [6], on each search interface, form label terms are the
only information that is used to perform clustering.
4. Form value terms. Besides the label, each form attribute is associated with a type of control element, such
as text boxes, selection lists (i.e., pull-down menus), radio buttons or checkboxes. Many such elements
have some predefined values, for example, in the book search form of amazon.com, the label “Format” is
followed by a selection list which has values like “hardcover”, “paperback” and so on. The purpose of
these values is to allow users to specify more precise queries than using just keywords. In many cases, the
attribute labels alone cannot represent the real meanings of their associated elements. For example, both
automobile and book search engines usually have an attribute labeled “category”. However, in book
search engines, “category” has such values as “art”, “history”, “novel”, etc, while in automobile search
engines, “compact car”, “SUV”, “truck” are the common values associated with attribute “category”.
Thus, the attribute values are also important in terms of describing the contents of a search engine.
Therefore, unlike the approach in [6] where only the attribute labels are used, in our approach, attribute
values are also utilized for ESE clustering. The form value terms in an ESE interface can also be
represented as a vector of weighted terms. Again, the weights are computed using the tf*idf formula in
our current implementation.
5. Regular terms. All content terms in an ESE interface page, other than prices, form label terms and form
value terms, are called regular terms. Regular terms may also reflect the contents of ESE databases. For
9
example, in the Web pages of digital camera stores, there usually are some terms specific to cameras,
such as “Kodak”, “Olympus”, “Resolution pixel” and “LCD” while the Web pages selling cars may have
regular terms like “Honda”, “Ford”, “Model”, “Make”, “Engine”. The regular terms in an ESE interface
page can also be represented as a vector of regular terms with weights. Note that form label terms, form
value terms and regular terms may overlap.
To simplify notations in the following sections, for a given ESE interface, we use N to represent the total
number of images, LT to represent the vector of weighted form label terms, VT to represent the vector of
weighted form value terms, PT to represent the vector of price terms with weights, and RT to represent the
vector of weighted regular terms. Based on these notations, an ESE interface E can be represented as E = (N,
LT, VT, PT, RT). Some of these components may be empty for a given search interface, for example, a
particular search interface may have no form value terms.
3.2 Extracting Features from ESE Interfaces
In order to make WISE-Cluster a highly automated tool for ESE clustering, it needs to have a component that
is capable of automatically extracting the desired features from each ESE interface as described in Section 3.1
when the URL of an interface page containing the ESE is provided. There are primarily three tasks in
extracting desired features from ESE interfaces. The first is to extract all potential forms from the interface
page. The second is to identify appropriate search forms from the extracted forms. The third is to extract
regular terms, prices, and images from the non-search form portion of the interface page. These three tasks are
briefly discussed below.
1. Extract forms. An ESE interface page may contain more than one form and each form could be a
potential search form. To extract all forms as well as the label terms and the value terms on each form,
we employ a simplified version of WISE-iExtractor [8]. WISE-iExtractor is a prototype system in our E-
Metabase project that can automatically extract labels, element values and other useful information from
ESE search forms for ESE interface integration, deep Web crawling, and so on.
2. Identify search forms. A vast majority of the search forms of search engines are implemented using the
HTML form tag (<form> and </form>). However, form tags are also used to implement non-search
applications such as online survey and fact listing (e.g., using a pull-down menu to list all states).
10
Therefore, it is necessary to differentiate search forms from non-search forms. A machine learning
method for automatically discovering search engines is reported in [2]. However, it is not designed to
discover only ESEs. The approaches in [3, 15] first use some simple heuristics to identify and eliminate
some non-search forms and then they submit queries against the remaining forms. Based on the query
response, additional non-search forms can be identified and eliminated. Since query submission is not
considered in this paper, we only apply some heuristics to identify search forms. In our current
implementation, the following heuristics are employed: 1) the form has an action attribute for interacting
with the search engine server; 2) the form has a submission button with special associated keywords such
as “find”, “search”, “query” and “quote”; 3) the form should at least have an textbox or a selection list; 4)
forms that only contain checkboxes are not search forms; 5) forms that have only one element which is a
selection list are discarded; and 6) if multiple forms on the same page have the same action value, only
one form is randomly selected because we assume that these forms are used to search the same product.
After these heuristics are applied, the remaining forms are assumed to be the candidate search forms. If
there are multiple candidate search forms on the same page, each form is combined with the non-search
form information on the page to form a separate ESE (see Section 2).
3. Extract non-search form information. Extracting regular terms is straightforward. To obtain the number
of images, we first identify HTML image tags with src attribute (i.e., <img src= “imagefile”>). After each
image is fetched, its area and its height/width ratio are computed. If the area is below a threshold (images
of buttons, icons and labels are usually very small in size) or the ratio is above a threshold (many
decoration images have very large ratios), the image is eliminated. Then we count the number of
remaining images. Prices are identified by numbers prefixed with special symbols such as $ and ¥, and
thus can be easily obtained.
4. CLUSTERING ALGORITHM
The basic idea of our approach is to use the features extracted from ESE search interface pages to cluster
ESEs. In our approach, we define the similarity between two ESEs to be the weighted sum of the similarities
between the form label term vectors, the form value term vectors, the price term vectors, the regular term
vectors, and the number of images of the two ESEs, respectively. More specifically, for two ESEs E1 and E2,
11

let simN(E1, E2), simLT(E1, E2), simVT(E1, E2), simPT(E1, E2), and simRT(E1, E2) be the similarities
between E1 and E2 based on their numbers of images, form label term vectors, form value term vectors, price
term vectors, and regular term vectors respectively, and let similarity(E1, E2) be the overall similarity
between E1 and E2. The following formula is used to compute similarity(E1, E2):
similarity(E1, E2) = W1*simN(E1, E2) + W2*simLT(E1, E2) + W3*simVT(E1, E2)
+ W4*simPT(E1, E2) + W5*simRT(E1, E2), (1)
where weight coefficients W1, W2, W3, W4 and W5 will be determined by a genetic algorithm based method
to be described in Section 6.3. In our current implementation, the similarity between two vectors is computed
using the Cosine similarity function [16]. Let N1 and N2 be the numbers of images on the search interfaces of
E1 and E2, respectively. Then simN(E1, E2) can be defined as:
simN(E1, E2) = 1 – |N1 – N2| / max(N1, N2). (2)
When computing the similarity between two ESEs from the same site, a special care should be taken.
Among the six types of ESE sites that are discussed in Section 2, four (i.e., divided, co-existing, merged and
shared) will lead to the situation where multiple (logical) ESEs are from the same site. Our observation based
on the ESEs we studied indicates that most ESEs from the same site sell different types of products and
therefore should not be assigned to the same cluster. However, based on the way in which the ESEs from the
same site are represented, the similarities between these ESEs are likely to be high, making it likely that these
ESEs are assigned to the same cluster. For example, for the shared type, the ESEs from the same site share the
same search form, as a result, they have the same form label term vector and the same form value term vector.
To deal with this problem, we modify the similarity computation for two ESEs E1 and E2 that come from the
same site according to the following cases:
1. E1 and E2 are obtained from the same site of the co-existing type: In this case, E1 and E2 have different
search forms but they always have the same sets of regular terms and price terms as well as the same
number of images. In this case, the similarity between E1 and E2 is computed based on the form label
terms and the form value terms only.
2. E1 and E2 are obtained from the same site of the merged type: In this case, E1 and E2 always have the
same sets of regular terms and price terms as well as the same number of images. In addition, the only
12

search form on the same interface page is split into multiple groups to form several (logical) search forms
and the splitting is usually based on form values. As a result, E1 and E2 are likely to have the same set of
form label terms. Based on these observations, we compute the similarity between E1 and E2 based on
their form value terms only if they share the same set of form label terms; otherwise, both form label
terms and form value terms will be used to compute the similarity.
3. E1 and E2 are obtained from the same site of the shared type: In this case, E1 and E2 have the same
search form but usually different sets of regular terms and price terms as well as different numbers of
images. In this case, the similarity between E1 and E2 is computed based on the regular terms and price
terms as well as the numbers of images.
4. E1 and E2 are obtained from the same site of the divided type: In this case, E1 and E2 are extracted from
different pages. In this case, we treat them as completely independent ESEs and all features are used to
compute the similarity between E1 and E2.
For the first three cases above, if a feature is not used to compute the similarity between two ESEs, the
weight associated with this feature in Formula (1) is proportionally distributed to those weights whose
corresponding features are used. For example, suppose form label terms are not used while other features are
used, then W1 will be increased by W2*W1/tw, where tw = W1 + W3 + W4 + W5. Such an adjustment keeps
the total weight unchanged.
In the following, we describe the clustering algorithm used in our approach. The algorithm consists
of a preliminary clustering step and a refinement step.
• Preliminary Clustering Step: In this step, a supervised K-means clustering algorithm is applied. K is
the number of clusters and we assume that K is known beforehand. In practice, a list of product domains
can be compiled in advance (for example, from the Yahoo category “Business and Economy-> Shopping
and services”) and K can be assigned the number of product domains in the list. This step consists of two
phases. In the first phase, we manually select one ESE for each domain and assign it to the corresponding
cluster. The only requirements for the “seed” ESEs are that they are of the Devoted type and they have
sufficient information to describe the corresponding domain. Even though manual effort is needed in this
phase, it is a one-time effort (unless new product domains appear). Note that although the number of
13

ESEs on the Web can be very large, the number of product domains is much smaller. In the second phase,
for each of the remaining ESEs, the K-means algorithm is applied, i.e., we compute its similarity with
every cluster and assign it to the most similar cluster. The similarity between an ESE (denoted A) and a
cluster (denoted C) is defined to be the average of the similarities between A and every ESE in C. After
the preliminary clustering step, those clusters that still contain only the manually assigned ESE are
discarded. In other words, the initial K used is allowed to be larger than the actual number of domains
among the input ESEs.
• Refining Step: The idea of this step is to move potentially unfitting ESEs from their current clusters to
more suitable ones (The idea of reallocating objects to more fitting clusters after an initial clustering was
first proposed in [13]). This is carried out as follows in our implementation. (1) We compute the average
similarity AS of each cluster C, which is the average of the similarities between all ESE pairs in cluster C
(it is unnecessary to re-compute these similarity values as they were already computed in the preliminary
clustering step). (2) Identify every ESE A in C whose similarity(A, C) is less than AS. These ESEs are
considered to be potentially unfitting as their similarities with the cluster are below the average similarity
of the cluster. (3) For each ESE A obtained in Step (2), we compute its similarities with all current
clusters (including the cluster that contains A) and then move it to the cluster with the highest similarity.
Note that if ESE A has the highest similarity with the cluster that contains A in the first place, then A will
not be moved. The average similarity of cluster C is updated incrementally, i.e., immediately when an
ESE is removed from or added into it, rather than at the end of processing all unfitting ESEs of C. The
above refining process is repeated until there is no improvement (increase) on the sum of the similarities
of all clusters.
5. CLUSTER ASSIGNMENT
In this section we discuss a method to assign each cluster to an appropriate concept/category. There are two
motivations for performing this step. First, by assigning a cluster to an appropriate concept, we can use the
concept to name the cluster. This can be useful for summarizing the result of the clustering. Second, cluster
assignment can serve as a mechanism to adjust the initial clusters based on the concepts preferred by an
application. Clusters formed using the algorithm described in Section 4 are independent of any specific
14

applications. A particular application may sometimes require the merge of some basic clusters into a single
cluster. For example, suppose by using the clustering algorithm described in Section 4, a cluster for
“insurance” and a cluster for “investment” have been generated. But a particular application is interested in
clusters corresponding to higher-level concepts such as “financial service” (e.g., the concept hierarchy for the
application does not have concepts “insurance” and “investment” but only “financial service” and other high-
level concepts). Through the process of assigning basic clusters to appropriate concepts in a given concept
hierarchy and merging the clusters assigned to the same concept, application dependent clusters may be
generated from application independent clusters.
To assign clusters to the concepts, we first generate a representative for each cluster and a representative
for each concept in the hierarchy, and then match the representatives. The following explains how the
representatives are generated:
• The representative of a cluster is its centroid. Specifically, the representative of a cluster is also a vector
of features represented as (N, LT, VT, PT, RT), where each feature is the average of the corresponding
features of all the ESEs in this cluster. For example, each component in the form label term vector of the
centroid is the average of the corresponding components in the form label term vectors of all the ESEs in
the cluster. One difference between the vectors for each ESE here and those in previous sections is that
the weight of a term t in any term vector is computed based on the following tf*icf formula:
(0.5 + 0.5 * tf / max_tf) * log (N/cf),
rather than the tf*idf formula used before, where cf is the cluster frequency of t (i.e., the number of
clusters that contain t) and N is the number of clusters. The reason that icf is used here is because it is
clear that the more clusters a term appears in, the less useful the term is in differentiating different
clusters. The reason that icf was not used in previous sections is because the cf information was not
available before we have clusters.
• The representative of each concept is obtained as follows. For each concept, we manually select k ESEs
that belong to this concept and assign them to it for some small integer k (in our experiments to be
reported in Section 6, k = 3 is used). In other words, each concept is represented by a small cluster of k
ESEs. Then the centroid of each such cluster is computed and is used as the representative of the concept.
15
When assigning an ESE cluster to the concepts, we first compute the similarity between the
representative of this cluster and the representative of every concept using Formula (1), and assign the cluster
to the concept with the highest similarity value.
6. EXPERIMENTS
6.1 Data Sets
To make the evaluation of our clustering method reasonably objective, the following criteria are used when
selecting the testing samples: (1) The number of domains which the ESEs are selected from should be
reasonably large. (2) Some domains similar in nature should be included. Since the ESEs from similar
domains are likely to contain similar features, it makes accurate clustering more challenging. (3) The number
of ESEs selected for each domain should also be reasonably large. (4) The numbers of ESEs in different
domains are not uniform, i.e., some domains may contain much more ESEs than other domains. The testing
samples used in our experiments are selected from Yahoo directory. Yahoo has collected many homepages
and classified them into different categories. To concentrate on e-commerce applications, we chose the
category “Business and Economy-> Shopping and services” which has about 70 subcategories. After
examining these subcategories and their child categories, we selected 12 domains that contain mostly ESE
interface pages. They are: airlines, automotive, book, car rental, consumer electronics, employment, games,
hotel, insurance, music, real estate, and video. These domains are not at the same level in the Yahoo directory
hierarchy. For example, insurance is the child of subcategory Financial Services while airlines, car rental
and hotel are child categories of the travel and transportation subcategory. The domains of airlines, car
rental and hotel are similar, implying that they could easily be grouped into the same cluster incorrectly. The
12 domains and the number of ESEs selected for each domain are listed in Table 2. We can see that while
each domain has at least 20 ESEs, the book and the music domains have significantly more ESEs than the
other domains. All together, 356 ESE interface pages are obtained from these domains. After child/logical
ESE interfaces are identified (see Section 2), 401 ESEs are obtained.
Yahoo Category Name # of ESEs (After processing)Airlines 31 Automotive 23 Book 85 Car Rental 21
16

Consumer Electronics 27 Employment (job) 20 Games 25 Hotel 25 Insurance 22 Music 65 Real Estate 21 Video 36 Total 401
Table 2. ESE Distribution in Different Domains
In order to evaluate the performance of our clustering algorithm, both two-fold and three-fold cross-
validation tests are conducted. For two-fold cross-validation, we divide the 401 ESEs into two disjoint groups,
namely, DS1 and DS2. For each domain, the ESEs are randomly and evenly (as evenly as possible) divided
into the two groups. In this way, every group has about the same number of ESEs from each of the 12
domains. Each time we use one set as the training set to determine the optimal parameters (the weights in
Formula (1)), and the other one as the testing set (the learned parameters are applied to this set). The average
performance based on the two sets of tests is considered as the final performance of our clustering algorithm.
For the three-fold cross-validation, we partition the ESEs into three disjoint sets (DS3, DS4, and DS5) in the
same way and each time we use two sets for training and the remaining set for testing. In addition, a sixth data
set (DS6) that contains all 401 ESEs is also created and used for some other experiments.
To evaluate the cluster assignment method we described in Section 5, we need a list of concepts. The
number of concepts in the list should be more than the number of clusters used for test. In our experiment, a
total of 21 concepts are collected and they are all from the Yahoo hierarchy rooted at “Shopping and
Services”. Besides the 12 domains described in Table 2, 9 additional domains are selected and they are:
fragrance, furniture, toys, jewelry, lamp, loan, pharmacy, shoes, and watches. Again, they are not at the same
level in the hierarchy. For example, toys is directly under the root while pharmacy is a child of subcategory
health. For each concept, three ESEs that match the concept are manually assigned to the concept. These
ESEs are selected from the web and are different from those listed in Table 2. For example, to find three ESEs
for concept toys, we form a query “toy e-commerce search engine” and send it to Google. From the returned
results, we select the top three e-commerce search engines for toys.
17

6.2 Evaluation Criteria
Before evaluation, all ESEs are manually grouped based on what products they sell. Clusters obtained by the
manual clustering are deemed correct and are used as the basis to evaluate our clustering algorithm. The
following three criteria are used to measure the clustering performance.
1) Recall r: For a given cluster, recall is the ratio of the number of ESEs that are correctly clustered over the
number of ESEs that should have been clustered. For example, if a cluster should have 5 ESEs but the
clustering algorithm actually assigned only 3 of them to this cluster, then the recall for this cluster is 3/5
or 60%. The overall recall for all clusters is the average of the recalls for all clusters weighted by the size
of each cluster. Specifically, the formula for computing the overall recall is
r = ∑ (r=
n
i 1
i * Ni / N),
where ri is the recall of the i-th cluster, Ni is the number of ESEs in the i-th cluster, N is the total number
of ESEs and n is the total number of clusters.
2) Precision p: For a given cluster, precision is the ratio of the number of ESEs that are correctly clustered
over the number of ESEs that are assigned to the cluster. For example, if among the 5 ESEs assigned to a
cluster, only 4 are correct, then the precision for this cluster is 4/5 or 80%. The overall precision for all
clusters is the average of the precisions for all clusters weighted by the size of each cluster. Specifically,
the formula for computing the overall precision is
p = ∑ (p=
n
i 1
i * Ni / N),
where pi is the precision of the i-th cluster, and Ni, N and n are the same as in the definition of recall.
3) F Measure: F Measure is to normalize the precision and recall because higher precision is generally
sacrificed by lower recall and vice versa. The F measure is frequently used in document clustering
research [18, 19]. The formula for computing the F measure is:
F = 2*p*r / (p + r),
which is high only when both precision and recall are high.
18
The performance of assigning clusters to concepts is measured by the ratio of the number of correctly
assigned clusters over the number of all clusters.
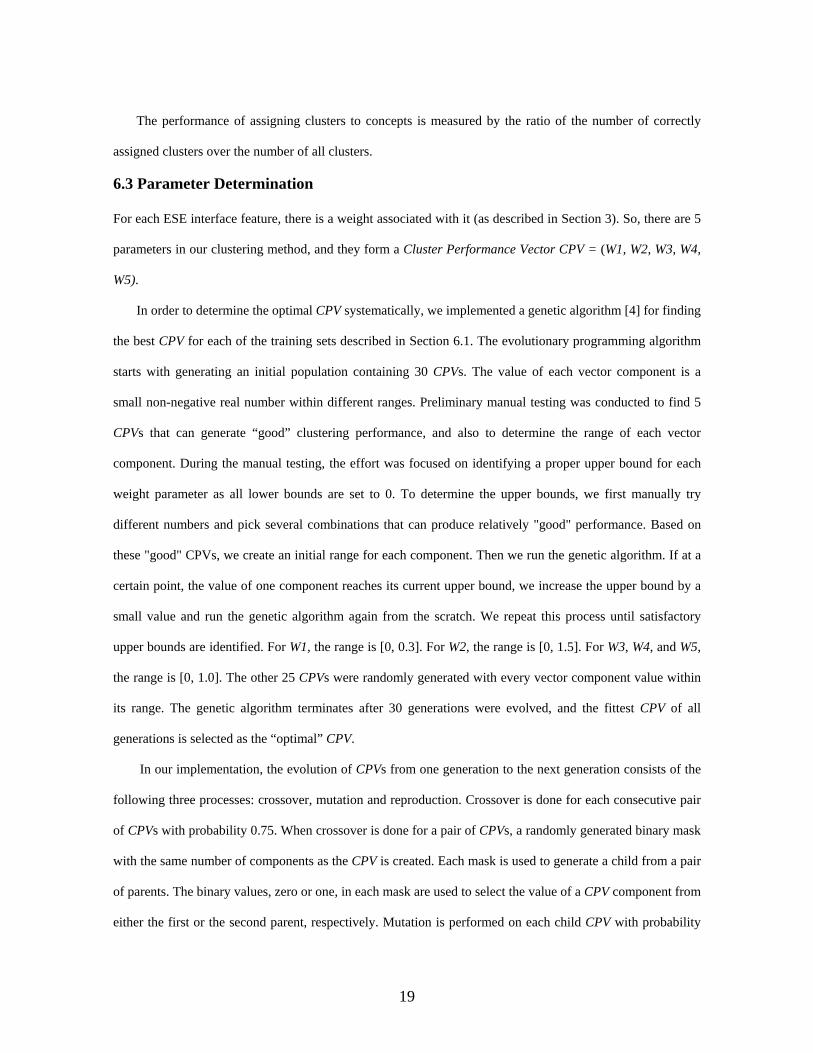
6.3 Parameter Determination
For each ESE interface feature, there is a weight associated with it (as described in Section 3). So, there are 5
parameters in our clustering method, and they form a Cluster Performance Vector CPV = (W1, W2, W3, W4,
W5).
In order to determine the optimal CPV systematically, we implemented a genetic algorithm [4] for finding
the best CPV for each of the training sets described in Section 6.1. The evolutionary programming algorithm
starts with generating an initial population containing 30 CPVs. The value of each vector component is a
small non-negative real number within different ranges. Preliminary manual testing was conducted to find 5
CPVs that can generate “good” clustering performance, and also to determine the range of each vector
component. During the manual testing, the effort was focused on identifying a proper upper bound for each
weight parameter as all lower bounds are set to 0. To determine the upper bounds, we first manually try
different numbers and pick several combinations that can produce relatively "good" performance. Based on
these "good" CPVs, we create an initial range for each component. Then we run the genetic algorithm. If at a
certain point, the value of one component reaches its current upper bound, we increase the upper bound by a
small value and run the genetic algorithm again from the scratch. We repeat this process until satisfactory
upper bounds are identified. For W1, the range is [0, 0.3]. For W2, the range is [0, 1.5]. For W3, W4, and W5,
the range is [0, 1.0]. The other 25 CPVs were randomly generated with every vector component value within
its range. The genetic algorithm terminates after 30 generations were evolved, and the fittest CPV of all
generations is selected as the “optimal” CPV.
In our implementation, the evolution of CPVs from one generation to the next generation consists of the
following three processes: crossover, mutation and reproduction. Crossover is done for each consecutive pair
of CPVs with probability 0.75. When crossover is done for a pair of CPVs, a randomly generated binary mask
with the same number of components as the CPV is created. Each mask is used to generate a child from a pair
of parents. The binary values, zero or one, in each mask are used to select the value of a CPV component from
either the first or the second parent, respectively. Mutation is performed on each child CPV with probability
19
0.1. When mutation is performed, each CPV component is either decreased or increased by one unit with
equal probability (0.5) subject to the constraint of the boundaries of each range. For W1, one unit equals 0.01.
For other parameters, one unit equals 0.02. Reproduction uses a wheel of fortune scheme to select CPVs in the
current generation to be in the next generation. It selects fit CPVs with high probability and unfit CPVs with
low probability. The exact probability that a CPV is selected is the fitness of the CPV, which is computed as
follows. If the value of each of the criteria – precision, recall, F measure – returned by a CPV is above 85%,
the initial fitness value is the returned F measure score. Otherwise, the initial fitness value of this CPV is 0.
The final fitness of a CPV in a generation is its initial fitness value divided by the sum of the initial fitness
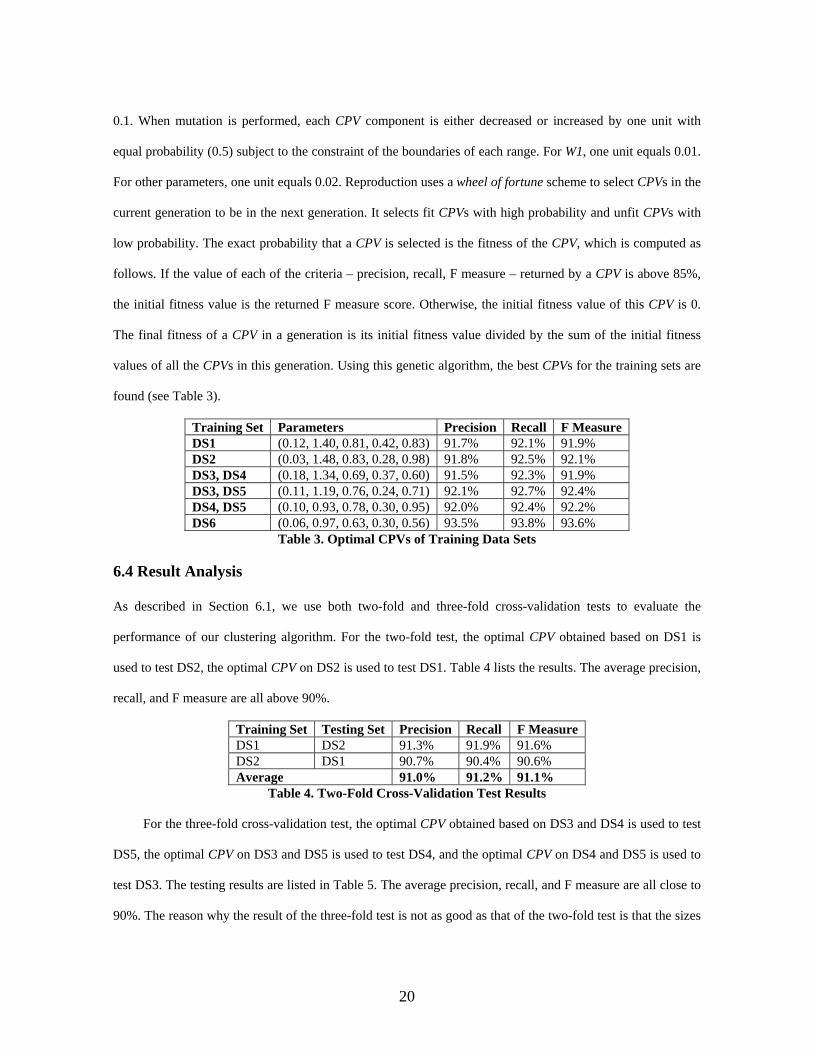
values of all the CPVs in this generation. Using this genetic algorithm, the best CPVs for the training sets are
found (see Table 3).
Training Set Parameters Precision Recall F Measure DS1 (0.12, 1.40, 0.81, 0.42, 0.83) 91.7% 92.1% 91.9% DS2 (0.03, 1.48, 0.83, 0.28, 0.98) 91.8% 92.5% 92.1% DS3, DS4 (0.18, 1.34, 0.69, 0.37, 0.60) 91.5% 92.3% 91.9% DS3, DS5 (0.11, 1.19, 0.76, 0.24, 0.71) 92.1% 92.7% 92.4% DS4, DS5 (0.10, 0.93, 0.78, 0.30, 0.95) 92.0% 92.4% 92.2% DS6 (0.06, 0.97, 0.63, 0.30, 0.56) 93.5% 93.8% 93.6%
Table 3. Optimal CPVs of Training Data Sets
6.4 Result Analysis
As described in Section 6.1, we use both two-fold and three-fold cross-validation tests to evaluate the
performance of our clustering algorithm. For the two-fold test, the optimal CPV obtained based on DS1 is
used to test DS2, the optimal CPV on DS2 is used to test DS1. Table 4 lists the results. The average precision,
recall, and F measure are all above 90%.
Training Set Testing Set Precision Recall F Measure DS1 DS2 91.3% 91.9% 91.6% DS2 DS1 90.7% 90.4% 90.6% Average 91.0% 91.2% 91.1%
Table 4. Two-Fold Cross-Validation Test Results
For the three-fold cross-validation test, the optimal CPV obtained based on DS3 and DS4 is used to test
DS5, the optimal CPV on DS3 and DS5 is used to test DS4, and the optimal CPV on DS4 and DS5 is used to
test DS3. The testing results are listed in Table 5. The average precision, recall, and F measure are all close to
90%. The reason why the result of the three-fold test is not as good as that of the two-fold test is that the sizes
20
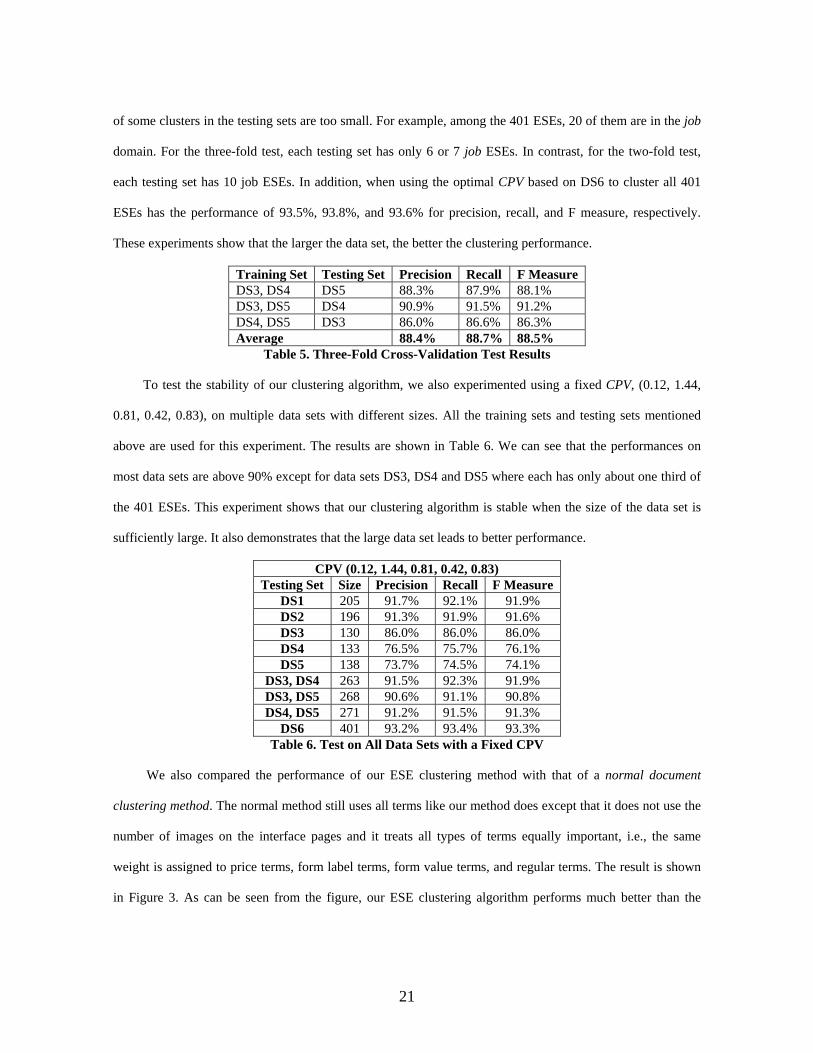
of some clusters in the testing sets are too small. For example, among the 401 ESEs, 20 of them are in the job
domain. For the three-fold test, each testing set has only 6 or 7 job ESEs. In contrast, for the two-fold test,
each testing set has 10 job ESEs. In addition, when using the optimal CPV based on DS6 to cluster all 401
ESEs has the performance of 93.5%, 93.8%, and 93.6% for precision, recall, and F measure, respectively.
These experiments show that the larger the data set, the better the clustering performance.
Training Set Testing Set Precision Recall F Measure DS3, DS4 DS5 88.3% 87.9% 88.1% DS3, DS5 DS4 90.9% 91.5% 91.2% DS4, DS5 DS3 86.0% 86.6% 86.3% Average 88.4% 88.7% 88.5%
Table 5. Three-Fold Cross-Validation Test Results
To test the stability of our clustering algorithm, we also experimented using a fixed CPV, (0.12, 1.44,
0.81, 0.42, 0.83), on multiple data sets with different sizes. All the training sets and testing sets mentioned
above are used for this experiment. The results are shown in Table 6. We can see that the performances on
most data sets are above 90% except for data sets DS3, DS4 and DS5 where each has only about one third of
the 401 ESEs. This experiment shows that our clustering algorithm is stable when the size of the data set is
sufficiently large. It also demonstrates that the large data set leads to better performance.
CPV (0.12, 1.44, 0.81, 0.42, 0.83) Testing Set Size Precision Recall F Measure
DS1 205 91.7% 92.1% 91.9% DS2 196 91.3% 91.9% 91.6% DS3 130 86.0% 86.0% 86.0% DS4 133 76.5% 75.7% 76.1% DS5 138 73.7% 74.5% 74.1%
DS3, DS4 263 91.5% 92.3% 91.9% DS3, DS5 268 90.6% 91.1% 90.8% DS4, DS5 271 91.2% 91.5% 91.3%
DS6 401 93.2% 93.4% 93.3% Table 6. Test on All Data Sets with a Fixed CPV
We also compared the performance of our ESE clustering method with that of a normal document
clustering method. The normal method still uses all terms like our method does except that it does not use the
number of images on the interface pages and it treats all types of terms equally important, i.e., the same
weight is assigned to price terms, form label terms, form value terms, and regular terms. The result is shown
in Figure 3. As can be seen from the figure, our ESE clustering algorithm performs much better than the
21
normal document clustering method. Specifically, our ESE clustering algorithm performs about 30 percentage
points better than the normal document clustering method for all three criteria.
[Figure 3 here]
Figure 3. Comparison with Normal Document Clustering
We also carried out experiments to evaluate the impact of manually assigning different number n of
ESEs to each cluster in the preliminary clustering step. We tried n = 1, 2, and 3. It turns out that manually
assigning more ESEs does help somewhat in the preliminary clustering step. However, with the refinement
step, this improvement becomes negligible. So, for our clustering algorithm, manually assigning only one
ESE to each cluster is sufficient.
In addition, we carried out experiments to evaluate the significance of each feature on the performance of
our clustering algorithm. To find out the impact of a particular feature, we compare the performance when the
feature is used with that when it is not. When a feature is not used, the weight of this feature in the optimal
CPV is proportionally distributed to other features based on the ratios of their weights to the total weight of
the used features. The results are reported in Table 7. It can be seen that form label terms are the most
important feature in achieving good clustering accuracy. Without it, the performance drops dramatically.
Specifically, the precision decreases by 49.8%, recall decreases by 44.7%, and F measure by 47.3%. An
interesting observation is that without form value terms, the precision, recall, and F measure only decrease
slightly. Some possible reasons are that first, more than 30% of our 401 ESEs do not have form values.
Second, many form value terms do not describe their domains well. For example, for the label term State, the
values are just the names of the 50 states and they are not useful for identifying product domains. As another
example, the from and to labels usually appear on the forms of travel-related search engines, such as reserving
hotel, booking flight ticket, and car rental. The year number, month, and the dates are the common values
associated with these labels. However, these values do not really help identifying different product domains.
We plan to study the problem of how to more effectively use form value terms in the future. Number of
images, price terms, and regular terms have similar impact on the clustering and if one of them is not used, the
accuracy (F measure) decreases by about 6% to 10%.
Tests Optimal Weight Values Precision Recall F Measure
22

Optimal W1=0.06, W2=0.97,W3=0.63, W4=0.30, W5=0.56
93.5% 93.8% 93.6%
No Num of Images
W1=0, W2=0.99, W3=0.65, W4=0.31, W5=0.57 86.0% 87.6% 86.8%
No Label Term W1=0.10, W2=0, W3=1.02, W4=0.49, W5=0.91 43.7% 49.1% 46.3% No Value Term W1=0.08, W2=1.29, W3=0, W4=0.40, W5=0.75 91.7% 91.8% 91.8% No Price Term W1=0.07, W2=1.10,W3=0.72, W4=0, W5=0.64 84.7% 83.5% 84.1%
No Regular Term W1=0.08, W2=1.25,W3=0.81, W4=0.39, W5=0 86.2% 88.8% 87.5% Table 7. Impact of Different Features on Effectiveness
Finally, we evaluated the performance of our method for assigning clusters to concepts based on data set
DS6. A genetic algorithm based method (similar to the one described in Section 6.3) is also used to determine
the optimal weights for the features in the similarity function (i.e., Formula (1)). We created 3 different sets
and each set contains the 12 domains used for clustering and several additional domains. The sizes of the
three sets are 15, 18 and 21, respectively. For the test on every set, our method is able to correctly assign all
the clusters to the corresponding concepts. This result indicates that using three ESEs to represent each
concept and using the proposed features on ESE interface pages are sufficient to achieve accurate ESE
categorization.
7. CONCLUSIONS
In this paper, we studied the problem of clustering e-commerce search engines. Effective solutions to this
problem can help develop large-scale comparison-shopping systems. Our proposed clustering method has
several special features. First, unlike existing search engine categorization approaches, it does not require
queries to be submitted to search engines. Second, unlike existing document and Web page clustering
techniques, it emphasizes features unique to e-commerce search engines such as form label terms, form value
terms and price terms in addition to regular terms. Third, it takes into consideration the special features of
different types of e-commerce search engines that we analyzed. Experimental results based on 401 e-
commerce search engines from 12 different domains indicate that the proposed method is quite effective. Our
experiments also revealed that form label terms are a key feature in accurate e-commerce search engine
clustering. We also studied the problem of assigning clusters to appropriate concepts.
One possible improvement to the proposed clustering method is to develop techniques to automatically
identify domain irrelevant information from search forms and discard it from search form related features.
The search forms of many e-commerce search engines often contain form labels/values that are not related to
23
their domains. For example, labels such as “Sort by” and “State”, and values such as different state names are
not related to any particular domain and their presence may be harmful for accurate clustering. Another
interesting issue that is worth careful study is to evaluate the usefulness of non-structural features such as the
meanings of terms and season-sensitive information for some products. For example, by identifying the
meanings of form terms via term sense disambiguation techniques, matches based on the meanings of terms
rather than their spellings may become possible.
ACKNOWLEDGMENTS
This work is supported in part by the grants IIS-0414981, IIS-0414939 and CNS-0454298 from the National
Science Foundation. We also would like to express our deep appreciation to the anonymous reviewers of the
paper for their highly constructive suggestions for improving the paper.
REFERENCES
[1] A. Broder, S. Glassman, and M. Manasse, Syntactic Clustering of the Web, Computer Network and ISDN
System 29(8-13) (1997) 1157-1166.
[2] J. Cope, N. Craswell, and D. Hawking, Automated Discovery of Search Interfaces on the Web, in: Proc.
ADC’03, vol. 17, (Adelaide, Australia, 2003) 181 - 189.
[3] R. B. Doorenbos, O. Etzioni and D. S. Weld, A Scalable Comparison-shopping Agent for the World-Wide
Web, in: Proc. of the First International Conference on Autonomous Agents, (Marina del Rey, California,
USA, 1997) 39 – 48.
[4] D. Goldberg, Genetic Algorithms in Search, Optimization and Machine Learning (Addison Wesley,
1989).
[5] B. He and K. Chang, Statistical Schema Matching across Web Query Interfaces, in: Proc. ACM SIGMOD
2003, (San Diego, California, USA, 2003) 217 – 228.
[6] B. He, T. Tao and K. Chang, Organizing Structured Web Sources by Query Schemas: A Clustering
Approach, in: Proc. CIKM’04, (Washington D.C., USA, 2004) 22 - 31.
24

[7] H. He, W. Meng, C. Yu, and Z. Wu, WISE-Integrator: An Automatic Integrator of Web Search Interfaces
for E-Commerce, in: Proc. VLDB’03, (Berlin, Germany, 2003) 357 - 368.
[8] H. He, W. Meng, C. Yu, and Z. Wu, Constructing Interface Schemas for Search Interfaces of Web
Database, in: Proc. WISE’05, (New York, USA, 2005), pp.29-42.
[9] P. Ipeirotis, L. Gravano, and M. Sahami, Probe, Count and Classify: Categorizing Hidden-web Databases,
in: Proc. ACM SIGMOD 2001, (Santa Barbara, California, USA, 2001) 67 - 78.
[10] T. Joachines. Text Categorization with Support Vector Machines: Learning with Many Relevant
Features, in: Proc. ECML’98, (Chemnitz, Germany, 1998) 137 - 142.
[11] L. Kaufman and P. Rousseeuw, Finding Groups in Data: An Introduction to Cluster Analysis (John
Wiley & Sons, 1990).
[12] D. Koller and M. Sahami, Hierarchically Classifying Documents Using Very Few Words, in: Proc.
ICML’97, (Nashville, TN, USA, 1997) 170 - 178.
[13] J. MacQueen, Some Methods for Classification and Analysis of Multivariate Observations, in: Proc.
Fifth Berkeley Symposium on Mathematical Statistics and Probability, vol. I, University of California, 1967,
281 - 297.
[14] W. Meng, W. Wang, H. Sun, and C. Yu, Concept Hierarchy Based Text Database Categorization,
Journal of Knowledge and Information Systems 4(2) (2002) 132 - 150.
[15] M. Perkowitz, R. B. Doorenbos, O. Etzioni and D. S. Weld, Learning to Understand Information on the
Internet: An Example-Based Approach, Journal of Intelligent Information Systems 8(2) (1997) 133 - 153.
[16] G. Salton and M. McGill, Introduction to Modern Information Retrieval (McGraw-Hill, 1983).
[17] W. Wu, C. Yu, A. Doan, and W. Meng, An Interactive Clustering-based Approach to Integrating Source
Query Interfaces on the Deep Web, in: Proc. ACM SIGMOD 2004, (Paris, France, 2004) 95 - 106.
[18] Y. Yang, S. Slattery and R. Ghani, A Study of Approaches to Hypertext Categorization, Journal of
Intelligent Information Systems 18(2) (2002) 219 - 241.
[19] Y. Yang, A Study on Thresholding Strategies for Text Categorization, in: Proc. ACM SIGIR 2001, (New
Orleans, Louisiana, USA, 2001) 137 - 145.
25

[20] O. Zamir and O. Etzioni, Web Document Clustering: A Feasibility Demonstration, in: Proc. ACM SIGIR
1998, (Melbourne, Australia, 1998) 46 - 54.
26
FIGURES
Figure 1. Airfare.com Search Forms
27

Figure 2. Alldirect.com Search Interface
28

0% 20% 40% 60% 80% 100%
Value
Precision Recall F MeasureCriteria
ESEs Clustering
Normal Document Clustering
Figure 3. Comparison with Normal Document Clustering
29
Related Documents


![Semantic Suffix Net Clustering for Search Results · web clustering engines [7]. Most search results clustering algorithms are a combination between search engines and text ... STC](https://static.cupdf.com/doc/110x72/5f78a07dc76845036c372ea6/semantic-suffix-net-clustering-for-search-results-web-clustering-engines-7-most.jpg)


