Clustering and visualization approaches for human cell cycle gene expression data analysis F. Napolitano a , G. Raiconi a , R. Tagliaferri a, * , A. Ciaramella b , A. Staiano b , G. Miele c,d a Department of Mathematics and Informatics, University of Salerno, I-84084, via Ponte don Melillo, Fisciano (SA), Italy b Department of Applied Sciences, University of Naples ‘‘Parthenope’’, I-80133, via A. de Gasperi 5, Napoli, Italy c Department of Physical Sciences, University of Naples, I-80136, via Cintia 6, Napoli, Italy d INFN, Unit of Naples, Napoli, Italy Received 20 April 2006; received in revised form 8 September 2006; accepted 15 March 2007 Available online 21 April 2007 Abstract In this work a comprehensive multi-step machine learning data mining and data visualization framework is introduced. The different steps of the approach are: preprocessing, clustering, and visualization. A preprocessing based on a Robust Principal Component Analysis Neural Network for feature extraction of unevenly sampled data is used. Then a Probabi- listic Principal Surfaces approach combined with an agglomerative procedure based on Fisher’s and Negentropy infor- mation is applied for clustering and labeling purposes. Furthermore, a Multi-Dimensional Scaling approach for a 2-dimensional data visualization of the clustered and labeled data is used. The method, which provides a user-friendly visu- alization interface in both 2 and 3 dimensions, can work on noisy data with missing points, and represents an automatic procedure to get, with no a priori assumptions, the number of clusters present in the data. Analysis and identification of genes periodically expressed in a human cancer cell line (HeLa) using cDNA microarrays is carried out as test case. Ó 2007 Elsevier Inc. All rights reserved. Keywords: Preprocessing analysis; Data analysis; Data visualization; Microarray data 1. Introduction Scientists have been successful in cataloguing genes through genome sequencing projects, and they can now generate large quantities of gene expression data using microarrays [19]. Proper regulation of the cell division cycle is crucial to the growth and development of all organisms; understanding this regulation is central to the study of many diseases, most notably cancer [9,10,11,21]. However, due to the sheer size of the data sets involved and to the complexity of the problems to be tackled, novel approaches to data mining and under- standing, relying on artificial intelligence tools, are necessary. These tools can be divided in two main families: 0888-613X/$ - see front matter Ó 2007 Elsevier Inc. All rights reserved. doi:10.1016/j.ijar.2007.03.013 * Corresponding author. E-mail addresses: [email protected] (F. Napolitano), [email protected] (G. Raiconi), [email protected] (R. Tagliaferri), [email protected] (A. Ciaramella), [email protected] (A. Staiano), [email protected] (G. Miele). Available online at www.sciencedirect.com International Journal of Approximate Reasoning 47 (2008) 70–84 www.elsevier.com/locate/ijar

Welcome message from author
This document is posted to help you gain knowledge. Please leave a comment to let me know what you think about it! Share it to your friends and learn new things together.
Transcript

Available online at www.sciencedirect.com
International Journal of Approximate Reasoning47 (2008) 70–84
www.elsevier.com/locate/ijar
Clustering and visualization approaches for human cellcycle gene expression data analysis
F. Napolitano a, G. Raiconi a, R. Tagliaferri a,*, A. Ciaramella b,A. Staiano b, G. Miele c,d
a Department of Mathematics and Informatics, University of Salerno, I-84084, via Ponte don Melillo, Fisciano (SA), Italyb Department of Applied Sciences, University of Naples ‘‘Parthenope’’, I-80133, via A. de Gasperi 5, Napoli, Italy
c Department of Physical Sciences, University of Naples, I-80136, via Cintia 6, Napoli, Italyd INFN, Unit of Naples, Napoli, Italy
Received 20 April 2006; received in revised form 8 September 2006; accepted 15 March 2007Available online 21 April 2007
Abstract
In this work a comprehensive multi-step machine learning data mining and data visualization framework is introduced.The different steps of the approach are: preprocessing, clustering, and visualization. A preprocessing based on a RobustPrincipal Component Analysis Neural Network for feature extraction of unevenly sampled data is used. Then a Probabi-listic Principal Surfaces approach combined with an agglomerative procedure based on Fisher’s and Negentropy infor-mation is applied for clustering and labeling purposes. Furthermore, a Multi-Dimensional Scaling approach for a2-dimensional data visualization of the clustered and labeled data is used. The method, which provides a user-friendly visu-alization interface in both 2 and 3 dimensions, can work on noisy data with missing points, and represents an automaticprocedure to get, with no a priori assumptions, the number of clusters present in the data. Analysis and identification ofgenes periodically expressed in a human cancer cell line (HeLa) using cDNA microarrays is carried out as test case.� 2007 Elsevier Inc. All rights reserved.
Keywords: Preprocessing analysis; Data analysis; Data visualization; Microarray data
1. Introduction
Scientists have been successful in cataloguing genes through genome sequencing projects, and they can nowgenerate large quantities of gene expression data using microarrays [19]. Proper regulation of the cell divisioncycle is crucial to the growth and development of all organisms; understanding this regulation is central to thestudy of many diseases, most notably cancer [9,10,11,21]. However, due to the sheer size of the data setsinvolved and to the complexity of the problems to be tackled, novel approaches to data mining and under-standing, relying on artificial intelligence tools, are necessary. These tools can be divided in two main families:
0888-613X/$ - see front matter � 2007 Elsevier Inc. All rights reserved.
doi:10.1016/j.ijar.2007.03.013
* Corresponding author.E-mail addresses: [email protected] (F. Napolitano), [email protected] (G. Raiconi), [email protected] (R. Tagliaferri),
[email protected] (A. Ciaramella), [email protected] (A. Staiano), [email protected] (G. Miele).

F. Napolitano et al. / Internat. J. Approx. Reason. 47 (2008) 70–84 71
tools for supervised learning, which make use of prior knowledge to group samples into different classes, andunsupervised tools, which rely only on the statistical properties of the data themselves [20,25,27,36,37,38,40].Both approaches have been used for a variety of applications and have advantages and disadvantages: thechoice of a specific tool depends on the purpose of the investigation and the structure of the data. Among var-ious applications, we recall:
• Diagnostic: i.e. to find gene expression patterns specific to given classes mainly dealt with supervised meth-ods [3,29].
• Clustering: aimed at grouping genes that are functionally related without attempting to model the under-lying biology [18,35,34].
• Model-based approach: generation of a model that justifies the grouping of specific genes and trains theparameters of the model on the data set [6,16,41].
• Projection methods: which decompose the data set into components that have the desired properties[1,28,7]. To this class belong some methods like Principal Components Analysis (PCA), Independent Com-ponents Analysis (ICA) and Probabilistic Principal Surfaces (PPS) which are discussed in this paper.
Moreover, many of these applications can suffer from poor data visualization techniques. Regarding theclustering problems, the most commonly used clustering algorithms, such as the hierarchical clustering andk-means [17] suffer from some limitations, namely:
(i) they need an arbitrary and a priori choice of the correct number of clusters, and this greatly affects thesuccess of the clustering procedure;
(ii) some of them, like hierarchical clustering, cannot properly handle large experimental data sets which aretypically noisy and incomplete (i.e. they contain a large fraction of missing data points);
(iii) they do not feature a user-friendly data visualization, which is quite crucial for further analysis andunderstanding in case of large amount of data.
On the other hand, data visualization is an important mean of extracting useful information from largequantities of raw data. The human eye and brain together make a formidable pattern detection tool, butfor them to work the data must be represented in a low-dimensional space, usually two or three dimensions.Even if simple relationships can seem very obscure when data is presented in tabular form, they are often veryeasy to see by visual inspection. Many results in experimental biology first appear in image: a photo of anorganism, cells, gels, or microarray scans. As the quantity of these results grows, automatic extraction of fea-tures and meaning from experimental images becomes crucial. At the other end of the data pipeline, 2D or 3Dvisualizations alone are inadequate for exploring bioinformatics data. Biologists need a visual environmentthat facilitates the exploration of high-dimensional data depending on many parameters. In this context,research needs further work into bioinformatics visualization to develop tools that will meet the upcominggenomic and proteomic challenges. Many algorithms for data visualization have been proposed by both neu-ral computing and statistics communities, most of which are based on a projection of data onto a two or three-dimensional visualization space. We mark that in [2] the authors introduced a multi-step approach for dataclustering. In this work we take advantage of that approach and a hierarchical clustering based on both Fish-er’s and Negentropy information is introduced. Moreover here we introduce an advanced visualization tech-nique and an integrated environment for clustering and 2D or 3D visualization of high-dimensionalbiomedical data. The approach enable the user to:
• project and visualize data on a spherical surface (which provides a useful continuous manifold that can berotated and manipulated in several ways) or map the sphere into a 2-dimensional space;
• perform deeper studies on the data by localizing regions of interest and interacting with the data themself;• interact with data, choose the points of interest, visualize their neighbors and similar points, print all related
information etc.;• label the data choosing the classes found by a Negentropy based dendrogram approach;• visualize the labeled data in a bi-dimensional space using a Multi-Dimensional Scaling (MDS) approach.

72 F. Napolitano et al. / Internat. J. Approx. Reason. 47 (2008) 70–84
In detail, in this work we propose a new approach, based on a solid mathematical formalism, able to visu-alize and cluster noisy gene expression data with missing data points. The method can be divided in two sep-arated parts: the preprocessing of the data, which, as widely occurs, is specifically tailored to the characteristicsof the data set under examination, and the clustering and visualization part which is of more general applica-bility. We stress that the preprocessing and clustering phases are absolutely independent. In this way we havethe possibility to apply separated adaptive processes (non-linear PCA, PPS, hierarchical clustering). We notethat this is really useful when a large data set is considered. The method was tested against the human cell cycleto identify genes periodically expressed in tumors [39]. The data set consists of gene expressions characterizedduring the cell division cycle in a human cancer cell line (HeLa) using cDNA microarrays.
The paper organization is as follows: in Section 2 we introduce the preprocessing approaches to eliminateand to extract features from the data by using a Robust Principal Component Analysis Neural Network; inSection 3 we introduce the Probabilistic Principal Surfaces approach for data clustering and visualization andin Section 4 the agglomerative hierarchical clustering approach based on Fisher and Negentropy information;in Section 5 we show the results obtained to cluster, label and visualize genes periodically expressed in ahuman cancer cell line; finally in Section 6 some comments on the approach are introduced.
2. Preprocessing
Microarray data are very noisy, and thus preprocessing plays an important role. Preprocessing is needed tofilter out noise and to deal with missing data points [30]. We used a two-step preprocessing phase: a prelimin-ary procedure of noisy data rejection, followed by a nonlinear PCA features extraction. About the first part ofthe preprocessing we simple eliminate the genes that have not samples in the particular experiment that weconsider. Moreover, in most cases an interpolation is needed to overcome the problem of the missing pointsin the data set. We stress that using a Robust PCA Neural Network (NN) technique it is possible to work withperiodic unevenly sampled data without using interpolation [13,32,33].
Summarizing, in our analysis this phase is accomplished by applying an on-line Robust PCA NN for eachgene that corresponds to an unevenly sampled sequence. From each of these sequences we extract the m principalcomponents to obtain the new feature vectors. In the following subsection we detail the PCA based approach.
2.1. Robust PCA based feature extraction
The second step of preprocessing is the extraction of the principal components (eigenvectors) of the auto-correlation matrices of the genes which passed the filtering procedure. This step is used to deal with missingdata points. Feature extraction process is based on a non-linear PCA method which can estimate the eigen-vectors from unevenly sampled data. This approach is based on the STIMA algorithm described in [13,32,33].
We note that PCA’s can be neurally realized in various ways [22,13,33,32]. In our case we used a non-linearPCA NN consisting of a one layer feedforward NN able to extract the principal components of the autocor-relation matrix of the input sources. Typically, Hebbian type learning rules are used, based on the one unitlearning algorithm originally proposed by Oja and co-workers [22]. Many different versions and extensionsof this basic algorithm have been proposed during the recent years [23,24,13,22]. The structure of the PCANN can be summarized as follows: there is one input layer and one forward layer of neurons totally connectedto the inputs; during the learning phase there are feedback links among neurons, that classify the networkstructure as either hierarchical or symmetric. After the learning phase the network becomes purely feedfor-ward. The hierarchical case leads to the well-known GHA algorithm; in the symmetric case we have the Oja’ssubspace network. PCA neural algorithms can be derived from optimization problems; in this way the learn-ing algorithms can be further classified in robust PCA algorithms and nonlinear PCA algorithms [23,24,13]. APCA algorithm is said robust, when the objective function grows less than quadratically; examples of validcost functions are ln(cosh(t))ejtj. In order to extract the principal components we use a Robust nonlinearPCA NN.
Finally, we see that the approach can be divided in the following two main steps:
• Normalization: we first calculate and subtract the average pattern to obtain a zero mean process.

F. Napolitano et al. / Internat. J. Approx. Reason. 47 (2008) 70–84 73
• Neural computing: the fundamental learning parameters are (i) the number of output neurons m, which isequal to the estimated embedding dimension and it is the number of principal eigenvectors that we need; (ii)the number of input neurons q; (iii) the initial weight matrix W of m · q dimension; (iv) a, the nonlinearlearning function parameter; (v) the learning rate l and the � tolerance.
This leads to the algorithm for the generic ith, m-dimensional weight matrix wiðkÞ (i = 1, . . . ,m) at time k:
wiðk þ 1Þ ¼ wiðkÞ þ lkgðyiðkÞÞeiðkÞ;
eiðkÞ ¼ xi �XIðiÞ
j¼1
yjðkÞwjðkÞð1Þ
In the hierarchical case we have I(i) = i. In the symmetric case I(i) = q, the error vector eiðkÞ becomes the sameei for all the neurons. For more details on the algorithm see [13,33,32].
3. Probabilistic Principal Surfaces
Probabilistic Principal Surfaces (PPS) [8,2,12] are a nonlinear extension of principal components, in thateach node on the PPS is the average of all data points that project near/onto it. From a theoretical standpoint,the PPS is a generalization of the Generative Topographic Mapping (GTM) [5], which can be seen as a para-metric alternative to Self Organizing Maps or SOM [26]. Advantages of PPS include its parametric and flexibleformulation for any geometry/topology in any dimension, guaranteed convergence (indeed the PPS training isaccomplished through the Expectation–Maximization algorithm) [15]. PPS are governed by their latent topol-ogy and owing to their flexibility, a variety of PPS topologies can be created, for example as a regular grid of a3D sphere. A sphere is finite, unbounded and symmetric, with all the nodes distributed on the surface, and it istherefore suitable for emulating the sparseness and peripheral property of high-D data. Furthermore, thesphere topology can be easily understood by humans and thereby used for visualizing high-D data.
PPS define a nonlinear, parametric mapping yðx; WÞ from a Q-dimensional latent space ðx 2 RQÞ to a D-dimensional data space ðt 2 RDÞ, where usually Q < D. The (continuous and differentiable) function y(x;W)maps each of the M points in the latent space (where M is the number of latent variables which is fixed a priori)to a corresponding point into the data space. Since the latent space is Q-dimensional, these points will be con-fined to a Q-dimensional manifold non-linearly embedded into the D-dimensional data space. We mark thatthe PPS approach builds a constrained mixture of Gaussians. Moreover, if Q = 3 is chosen, a spherical man-ifold [8,2,12] can be constructed using PPS with nodes arranged regularly on the surface of a sphere in R3
latent space, with the latent basis functions evenly distributed on the sphere at a lower density. After a PPSmodel is fitted to the data, several visualization possibilities are available like the projection of the data areprojected into the latent space as points onto a sphere.
Having projected the data into the latent sphere, a typical task performed by most data analyzers is thelocalization of the most interesting data points, for instance the ones lying far away from more dense areas(outliers), or those lying in the overlapping regions between clusters, and to investigate their characteristicsby linking the data points on the sphere with their position in the original data set.
Furthermore, the latent variables responsibilities can be plotted on the sphere in order to obtain the dataprobability density function visualization. Another advantage of the 3D sphere representation is that, unlike2D plot, it is possible to observe the distribution of the different clusters on the sphere and observe which clus-ters are similar to each other as the dense regions that are in close proximity. All these advanced visualizationoptions and successful applications to other research fields (i.e., in astrophysics) have been discussed in [2].
4. Negentropy based approach
At this point we introduce the second step of the hierarchical approach that uses both Fisher’s and Negen-tropy information to agglomerate the clusters found in the first phase (PPS clustering phase). We underlinethat the approach we are describing is based on that introduced in [12,2]. Such authors proposed a hierarchicalagglomerative clustering where the optimal number of clusters is decided by analyzing the plateaus obtained

74 F. Napolitano et al. / Internat. J. Approx. Reason. 47 (2008) 70–84
by varying an agglomerative threshold. We also stress that the most natural representation of a hierarchicalagglomerative clustering is obtained by using a corresponding tree, called a dendrogram, which shows how thesamples are grouped [17]. In this paper the optimal number of clusters is defined using the dendrograminformation.
We note that the Fisher’s linear discriminant is a projection method that projects high-dimensional dataonto a line and performs classification in this one-dimensional space [4]. The projection maximizes the distancebetween the means of the two classes while minimizing the variance within each class. The Fisher criterion fortwo classes is given by
J FðwÞ ¼wTSBw
wTSWwð2Þ
where SB is the between-class covariance matrix and SW is the total within-class covariance matrix. From Eq.(2) differentiating with respect to w we find the direction where J FðwÞ is maximized.
The definition of Negentropy JN is given by
J NðxÞ ¼ HðxGaussÞ � HðxÞ; ð3Þ
where xGauss is a Gaussian random vector of the same covariance matrix as x and H(Æ) is the differential entropy.Negentropy can also be interpreted as a measure of non-Gaussianity [22]. The classic method to approximateNegentropy is using higher-cumulants, through the polynomial density expansions. However, such cumulant-based methods sometimes provide a rather poor approximation of the entropy. A special approximation is ob-tained if one uses two functions G1 and G2, which are chosen so that G1 is odd and G2 is even. Such a system oftwo functions can measure the two most important features of non-Gaussian 1-D distributions. The odd func-tion measures the asymmetry, and the even function measures the dimension of bimodality vs. peck at zero,closely related to sub- vs. supergaussianity. Then the Negentropy approximation of Eq. (3) is
J NðxÞ / k1EfG1ðxÞg2 þ k2ðEfG2ðxÞg � EfG2ðtÞgÞ2 ð4Þ
where t is a Gaussian variable of zero mean and unit variance (i.e. standardized), the variable x is assumed tohave also zero mean and unit variance and k1 and k2 are positive constants. We note that choosing the func-tions Gi that do not grow too fast, one obtains more robust estimators.In this way we obtain approximations of Negentropy that give a very good compromise between the prop-erties of the two classic non-Gaussianity measures given by kurtosis and skewness [12,2,22]. They are concep-tually simple, fast to compute, yet have appealing statistical properties, especially robustness. We have to notethat several methods to accomplish Independent Component Analysis are based on entropy information. Atthis point we remark that our aim is to agglomerate by an unsupervised method the clusters (regions) that arefound by a clustering approach. The information, that we call J NEC, used to merge two clusters is based bothon the Fisher’s discriminant and on the Negentropy (NEC approach [12,2]):
J NECðXÞ ¼ aFJ FðwÞ þ aNJNðXÞ ð5Þ
where aF and aN are two defined (normalizing) constants and w is the Fisher’s direction. At this point usingthis information we apply the agglomerative hierarchical clustering approach and extract the dendrogram.The NEC algorithm is described in Algorithm 1.
Algorithm 1. NEC: Agglomerative Hierarchical Clustering
Begin initialize c ¼ c, Di X i, i = 1,. . .,cDO c c� 1find nearest clusters, say:calculate the Fisher’s direction between Di and Dj and project the data on itcalculate the JNEC information and merge clusters Di and Dj with lowest JNEC informationUNTIL c ¼ 1return the dendogramEnd

—0.8 —0.6 —0.4 —0.2 0 0.2 0.4 0.6 0.8 1—1
—0.5
0
0.5
1
1.5
2
2.5
x1
x 2
Data Set
—0.8 —0.6 —0.4 —0.2 0 0.2 0.4 0.6 0.8 1—1
—0.5
0
0.5
1
1.5
2
2.5
x1
Competitive NN Clustering
Centers (o)
1 10 3 15 6 7 8 12 2 4 14 9 13 5 11
0.5
1
1.5
2
—0.8 —0.6 —0.4 —0.2 0 0.2 0.4 0.6 0.8 1—1
—0.5
0
0.5
1
1.5
2
2.5
x1
x 2NEC clustering
Fig. 1. NEC experimental results: (a) 2-dimensional data set; (b) comparative NN clustering; (c) NEC Dendrogram and (d) NECclustering.
F. Napolitano et al. / Internat. J. Approx. Reason. 47 (2008) 70–84 75
To show the agglomerative hierarchical clustering process we describe the results on a synthetic data set.We mark that the shown examples are obtained by using aF = 0.1, aN = 10. The data set that we consideris composed by two 2-dimensional classes with a complex distribution (see Fig. 1). In Fig. 1a we plot the data.In Fig. 1b we show the clusters obtained using the PPS approach and in Fig. 1c the NEC dendrogram. Wenote that focusing our attention on the dendrogram we clearly can define two separated regions obtainingthe clusters in Fig. 1d.
5. Experimental results
To validate the proposed multi-step approach, in this section we detail its application to analyze and tovisualize a data set composed by genes periodically expressed. To be more precise we focus our attentionon the identification of genes periodically expressed in a human cancer cell line (HeLa) using cDNA micro-arrays. We stress that in [39] some results on this data set are presented. In that paper the authors used a par-ticular Fourier based preprocessing and a hierarchical clustering method. The approach revealed coexpressed

Fig. 2. PPS visualization: projection of the genes on the sphere.
76 F. Napolitano et al. / Internat. J. Approx. Reason. 47 (2008) 70–84
groups of previously well-characterized genes involved in essential cell cycle processes such as DNA replica-tion, chromosome segregation, and cell adhesion along with genes of uncharacterized function. In that papertranscripts of 874 genes showed periodic variation during the cell cycle.
To be more precise the data set is composed by 1134 genes where the values are obtained considering theratio between two channels of the microarray (Cy5/Cy3). These values describe the index of the expression at aspecific time. Approximatively we have one hour sampling period and the largest sequence cover about 2 days.The data set is composed by five experiments where the first 3 correspond to the same experiment but with adifferent overall sampling period. We also note that in the data set for some genes there are missing sequencesand/or missing samples. In our analysis we use the third experiment because it covers a longer period and haveless missing sequences and/or missing samples.
We remind that the first step needed to analyze a data set is the preprocessing. We wish to point out thatsince a Robust PCA NN method is used then we can elaborate unevenly sampled data directly. In fact in[13,32] the authors introduced and described a Robust PCA NN-based approach to analyze unevenly sampleddata without using interpolation. In that paper the authors concluded that the method has better propertieswith respect to Fourier-based methods.
Now, in this work, using the preprocessing step, we extract for each gene the first two 10-dimensional prin-cipal components obtaining in this way a 20-dimensional feature vector for each gene. On the so obtained fea-ture data set we apply the second step. In detail we apply the PPS approach to obtain a clustering with a highnumber of clusters that should be refined by using the NEC approach. In Fig. 2 we show the three-dimensionalprojection obtained by using the PPS approach.
Moreover, in Fig. 3 we show the 2-dimensional mapping obtained unfolding the sphere using a Robinsonmap projection (or orthophanic projection) [31]. At this point we apply the NEC agglomerative approach tocombine the clusters obtained by PPS. We also note that the NEC approach permits to build a dendrogramtree that can be used to decide the number of clustering regions. In Fig. 4 we show the dendrogram obtainedfrom this analysis. To compare and to validate the PPS 2D visualization we use a well-known methodology tomap and to visualize the data in a 2-dimensional subspace: the Multi-Dimensional Scaling (MDS) which is theprocess of converting a set of pairwise dissimilarities for a set of points into a set of coordinates for the points.In Fig. 5 we plot the MDS projection in which an Euclidean distance is used. In Fig. 6 we show the same kindof projection obtained by using a correlation measure. At this point we stress that in data analysis/visualiza-tion a fundamental role is covered by the data labeling that can be emphasized by using different symbols orcolors. In fact, now we focus our attention on the dendrogram of Fig. 4. From it we can clearly identify 4 main

Fig. 3. 2-Dimensional Robinson map projection of the PPS 3-dimensional sphere.
2021453233444526162541531767551842543019314383115912132335472436489571056581250151438374960273926164622402825512934
0.5
1
1.5
2
2.5
Fig. 4. NEC dendrogram.
Fig. 5. MDS 2-dimensional projection by using Euclidean distance.
F. Napolitano et al. / Internat. J. Approx. Reason. 47 (2008) 70–84 77
agglomerate regions and other 10 separated clusters. This becomes clearer when adding some graduated colorsto the tree now plotted in Fig. 7. We have to underline that these are the graduated colors that we also use inthe experiments described in the following so that it is simpler to understand the visualization features. We
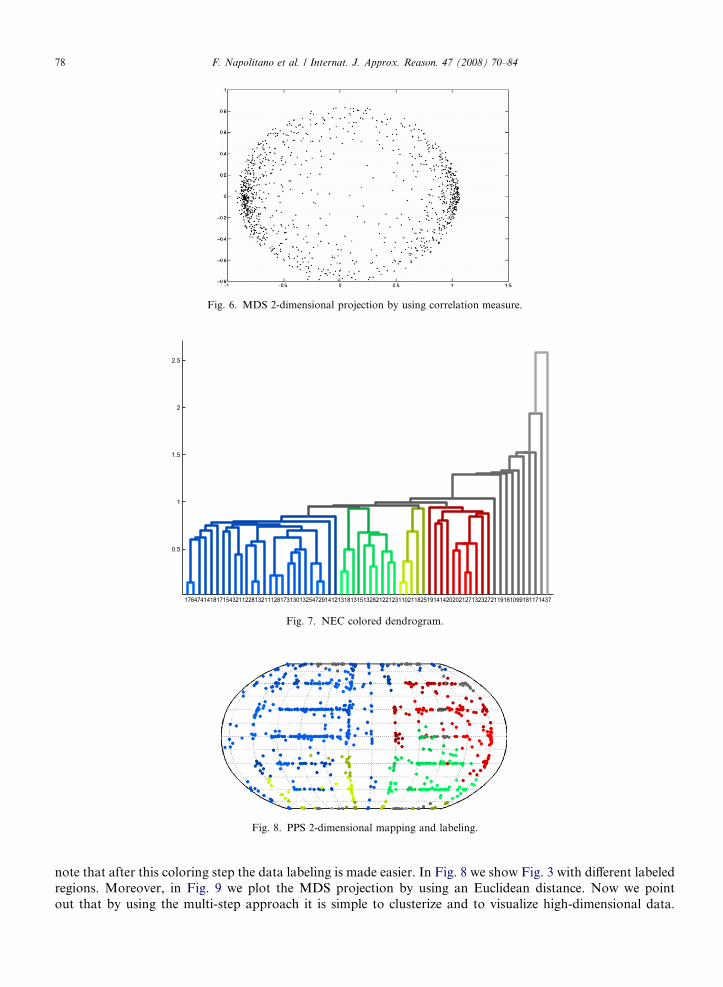
Fig. 6. MDS 2-dimensional projection by using correlation measure.
1764741418171543211228132111281731301325472914121318131513282122123110211825191414202021271323272119161099181171437
0.5
1
1.5
2
2.5
Fig. 7. NEC colored dendrogram.
Fig. 8. PPS 2-dimensional mapping and labeling.
78 F. Napolitano et al. / Internat. J. Approx. Reason. 47 (2008) 70–84
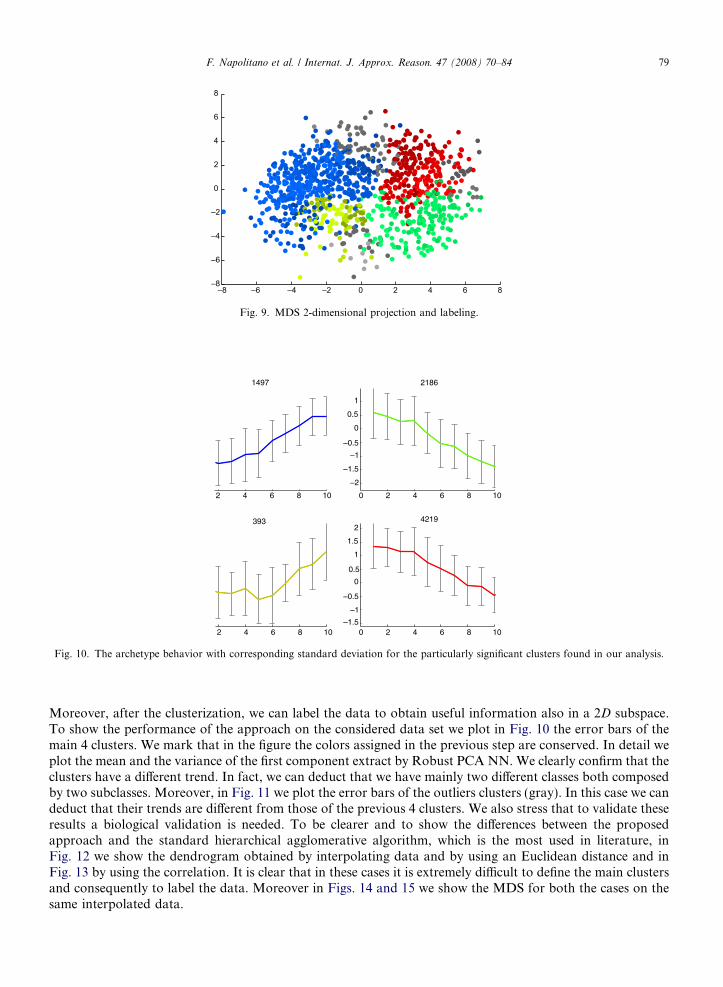
note that after this coloring step the data labeling is made easier. In Fig. 8 we show Fig. 3 with different labeledregions. Moreover, in Fig. 9 we plot the MDS projection by using an Euclidean distance. Now we pointout that by using the multi-step approach it is simple to clusterize and to visualize high-dimensional data.
—8 —6 —4 —2 0 2 4 6 8—8
—6
—4
—2
0
2
4
6
8
Fig. 9. MDS 2-dimensional projection and labeling.
2 4 6 8 10
1497
0 2 4 6 8 10
—2
—1.5
—1
—0.5
0
0.5
1
2186
2 4 6 8 10
393
0 2 4 6 8 10—1.5
—1
—0.5
0
0.5
1
1.5
24219
Fig. 10. The archetype behavior with corresponding standard deviation for the particularly significant clusters found in our analysis.
F. Napolitano et al. / Internat. J. Approx. Reason. 47 (2008) 70–84 79
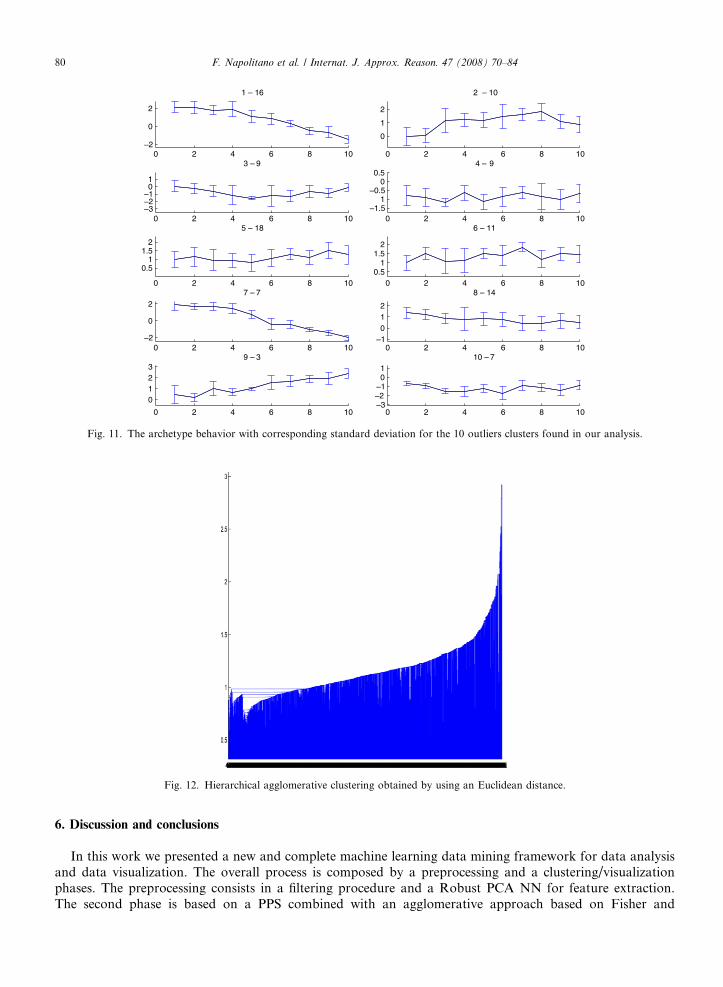
Moreover, after the clusterization, we can label the data to obtain useful information also in a 2D subspace.To show the performance of the approach on the considered data set we plot in Fig. 10 the error bars of themain 4 clusters. We mark that in the figure the colors assigned in the previous step are conserved. In detail weplot the mean and the variance of the first component extract by Robust PCA NN. We clearly confirm that theclusters have a different trend. In fact, we can deduct that we have mainly two different classes both composedby two subclasses. Moreover, in Fig. 11 we plot the error bars of the outliers clusters (gray). In this case we candeduct that their trends are different from those of the previous 4 clusters. We also stress that to validate theseresults a biological validation is needed. To be clearer and to show the differences between the proposedapproach and the standard hierarchical agglomerative algorithm, which is the most used in literature, inFig. 12 we show the dendrogram obtained by interpolating data and by using an Euclidean distance and inFig. 13 by using the correlation. It is clear that in these cases it is extremely difficult to define the main clustersand consequently to label the data. Moreover in Figs. 14 and 15 we show the MDS for both the cases on thesame interpolated data.
0 2 4 6 8 10—2
0
2
1 – 16
0 2 4 6 8 10
0
1
2
2 – 10
0 2 4 6 8 10—3—2—101
3 – 9
0 2 4 6 8 10—1.5
1—0.5
00.5
4 – 9
0 2 4 6 8 10
0.51
1.52
5 – 18
0 2 4 6 8 100.5
11.5
2
6 – 11
0 2 4 6 8 10—2
0
27 – 7
0 2 4 6 8 10—1012
8 – 14
0 2 4 6 8 10
0123
9 – 3
0 2 4 6 8 10—3—2—101
10 – 7
Fig. 11. The archetype behavior with corresponding standard deviation for the 10 outliers clusters found in our analysis.
Fig. 12. Hierarchical agglomerative clustering obtained by using an Euclidean distance.
80 F. Napolitano et al. / Internat. J. Approx. Reason. 47 (2008) 70–84
6. Discussion and conclusions
In this work we presented a new and complete machine learning data mining framework for data analysisand data visualization. The overall process is composed by a preprocessing and a clustering/visualizationphases. The preprocessing consists in a filtering procedure and a Robust PCA NN for feature extraction.The second phase is based on a PPS combined with an agglomerative approach based on Fisher and

732 737 764 849 858 792 817 794 780 760 799 814 862 728 756 546 560 619 615 584 758 504 545 519 517 531 525 520 559 554 544 568 602 593 866 914 911 669 793 653 555 570 569 581 931 676 641 716 542 557 587 613 886 645 740 775 871 880 881 428 449 455 469 468 475 480 657 925 687 731 795 685 690 768 834 682 810 717 710 586 447 537 633 753 564 674 842 675 549 625 530 666 491 692 572 770 773 726 677 427 488 583 603 644 463 472 476 522 528 473 500 501 506 445 486 956 444 992 788 502 421 456 90210201027 742 797 895 618 6221002 665 806 906 638 485 7911070 626 670 655 648 574 610 82210441043 630 772 865 777 579 636 743 946 652 684 928 747 679 571 884 523 433 507 8541060 460 932 659 826 580 416 426 738 365 392 405 408 396 387 631 673 643 467 478 529 719 766 397 434 585 802 701 714 384 565 511 811 934 920 954 713 927 724 635 356 379 339 361 378 362 383 390 409 376 375 861 330 879 867 820 26 29 44 76 97 144 183 112 122 102 193 110 137 77 191 133 170 160 202 204 128 258 48 79 103 155 118 129 180 234 168 162 201 211 218 240 297 263 233 318 241 287 299 326 42 296 194 199 90 267 33 40 237 309 279 966 324 521 741 366 515 394 815 285 899 709 909 35 36 400 184 246 281 910 198 314 882 856 61 41 512 181 229 465 543 131 169 185 459 274 735 983 243 608 661 629 562 466 804 482 846 605 78 703 302 171 200 67 385 730 89 332 952 292 306 667 702 329 178 470 121 787 964 291 739 828 848 47 73 50 897 214 656 113 725 595 245 74 873 239 790 8241001 140 590 158 342 363 369 373 52 298 343 270 192 215 360 705 186 957 551 438 182 436 453 457 458 474 487 712 247 316 341 115 163 101 853 527 208 125 300 418 419 84 492 153 325 391 161 734 220 830 785 518 598 672 663 278 402 577 150 232 803 99 395 117 688 484 601 796 870 930 839 175 349 305 311 358 368 371 114 715 921 892 924 9231081 534 157 3571029 415 900 9591008 370 413 624 260 271 681 127 207 727 338 10710711083 374 49 627 141 913 609 331 244 875 337 429 894101510281051 91 350 142 410 664 24 293 65 414 420 262 303 651 508 448 744 64 962 290 266 951 95 195 439 398 974 720 765 323 94710361091 752 123 197 203 248 2941033 596 693 783 835 736 9851023 9071032 84410191041 982 733 833 855105710771072 981 437 754 222 105 552 698 926 45 859 277 320 707 250 614 986 283 945 729 269 654 829 2561034 136 196 372 417 878 1521087 852 93 533 352 261 578 7791055 582 139 3541014 382 935 70 915 432 889 617 2051026 668 6601005 721 9481078 252 950 937 301 464 748 789 774 993 255 890 264 141007 896 386 189 566 990 100 944 81 757 321 344 56 493 658 749 933 968 999 917 918 63 805 567 597 454 86 286 313 116 548 219 431 980105810689 15 18 532 119 253 979 612 646 953 442 7451099 671 80 7061016 782 973 616 223 217 111 268 355 9891040 711 767 827 17 3591054 8131039 604 389 393 336 723 399 2721046 495 348 97010131042 689 8121088 148 547 750 808 821 90410251003 213 443 231 843 452 4241092 686 251 2261098 43 120 381 401 1241059 704 11 22 471 75 893 8641024 351 34710901004 257 623 490 145 64010311009 825 32 51 921061 965 513 987 978 159 156 851 7001075 450 335 151 280 969 3081073 9611065 9601000 576 3271047 556 9711067 514 34 177 333 607 575 462 55 606 963 289 422 21 310 265 66 135 494 976 7631018 786 563 304 477 699 319 307 3281086 190 3125 59 72 461 722 46 7181022 423 988 8451017 345 869 479 295 353 888 273 173 380 573 88 259 836 939 997 164 4981079 540 322 691 167103810661069 209 662 588 922108510301045 108 407 225 695 403 995 275 9031063 838 242 230 819 949 83 187 841 759 87 147 28 755 30 481 592 282 2881050 975 238 367 212 317 406 977 708 599 678 967 53 165 254 340 818 166 12610961037 412 807 172 346 524 6501012 85 499 683 364 8471053 334 8371048 104 143 936 541052 57 425 82 132 620 106 48910891080 4831006 451 430 539 798 746 611 919 510 634 37 497 536 840 831 850 134 526 649 441 146 8911084 832 96 883 71 1491056 44621094 179 762 62 601074 550 816 628 388 38 769 600 404 6391011 109 553 535 216 916 680 315 877 503 778 538310211035 9051 800 25 188 696 940 509 8606 901 9431082 809 885 228 505 642 887 912 496 236 801 68 868 591 249 561 377 227 10 776 929 751 411 942 235 206 7611093 872 516 174 8231010 23 221 31 991 9981049 6941097 69 647 874 594 20 632 210 19 941 154 7811076 276 637 98 621 697 9584 9081062 176 984 938 996 8631095 857 27 2848 435 440 784 13 58 771 589 972 138 955 127 39 941064 541 224 558 898 994 130 876 160
0.1
0.2
0.3
0.4
0.5
0.6
Fig. 13. Hierarchical agglomerative clustering obtained by using a correlation measure.
Fig. 14. MDS 2-dimensional projection obtained by using an Euclidean distance.
F. Napolitano et al. / Internat. J. Approx. Reason. 47 (2008) 70–84 81
Negentropy information aimed at clustering and visualization. The approach has been applied to a microarraydata set and more precisely to the analysis and identification of genes periodically expressed in a human cancercell line (HeLa) using cDNA microarrays. Genes which pass the filtering procedure undergo a feature extrac-tion process, based on a Robust PCA method, which allows us to obtain a matrix of eigenvectors fromunevenly sampled data. The results of the above preprocessing are then analyzed by a PPS algorithm whichhas proven to be a very powerful and efficient model in several data mining activities, and in particular forhigh-D data visualization and clustering. Spherical PPS, which consist of a spherical latent manifold lying

Fig. 15. MDS 2-dimensional projection obtained by using a correlation measure.
82 F. Napolitano et al. / Internat. J. Approx. Reason. 47 (2008) 70–84
in a three-dimensional latent space, better deal with high-D data. The sphere, in fact, is able to capture thesparsity and periphery of data in large input spaces which are due to the curse of dimensionality [4]. Theregions found by PPS are then agglomerated by NEC in a completely unsupervised manner obtaining in asimple way a dendrogram. In this way we can label the data in few regions that we decide. We stress thatthe 3D sphere is an innovative way of looking at gene expression data as compared to hierarchical clusteringthat displays a 2D plot. Furthermore, a mapping of the sphere in 2D can be obtained. Using a MDS approach,moreover, we also map our data into a bi-dimensional space keeping in mind the labeling obtained from thedendrogram. In the case of the analyzed data set, our visualizations capture the information on clusters ofgenes that do share similar behavior.
We have also to remark that other neural-based methods have already been investigated with success onmicroarray data, for example, in [35,34], Self Organizing Map (SOM) have been used for both visualizationand clustering purposes. However, SOM, while nice and understandable and appealing in a number of appli-cation fields, are less flexible in the sense that gives no way to directly interact with data and exhibits strongborder effects on 2D neurons grid since its manifold is bounded.
As shown in the paper by de Lichtenberg et al. [14] the jungle of available clustering methods often leads tocontradictory results, and often, it is difficult to choose a specific benchmark.
In this paper we use a data set of genes periodically expressed (see [39]) to show the performance of theproposed method in both clusterization and visualization. We however note that in [39] the authors clusteredthe genes using the hierarchical bottom-up algorithm which groups the genes that have similar relative con-centration profiles during cell life cycle and they use a Fourier based preprocessing. In [13,33,32] the authorsexperimentally demonstrated that for unevenly sampled data a Robust PCA NN permits us to obtain a betterperformance than the Fourier based approaches. For these reasons the authors in the next future will focustheir attention to use a frequency based preprocessing by using a MUSIC frequency estimator and a RobustPCA NN.
Moreover, we have that using Fisher and Negentropy information the clustering sequence is represented bya clear hierarchical tree which makes simple the identification of the clusters. In fact, in our case we identified 4main clusters and other 10 different clusters that helped us to label the data. From this labeling we map themultidimensional data set in two dimensions using the MDS approach or the PPS mapping in a 2-dimensionalspace. We also underline how our multi-step approach permits us to add graduated colors that help us to

F. Napolitano et al. / Internat. J. Approx. Reason. 47 (2008) 70–84 83
understand and to improve the data analysis process. In the next future the authors will focus their attentionto compare and to validate the found clusters from a biological point of view.
References
[1] O. Alter, P.O. Brown, D. Botstein, Singular value decomposition for genome-wide expression data processing and modeling, Proc.Natl. Acad. Sci. USA 97 (2000) 10101–10106.
[2] R. Amato, A. Ciaramella, N. Deniskina, et al., A multi-step approach to time series analysis and gene expression clustering,Bioinformatics 22 (5) (2006) 589–596.
[3] T. Ando, M. Suguro, H. Hanai, M. Seto, Fuzzy neural network applied to gene expression profiling for producing the prognosis ofdiffuse large B-cell lymphoma, Cancer Res. 93 (2002) 1207–1212.
[4] C.M. Bishop, Neural Networks for Pattern Recognition, Oxford University Press, 1995.[5] C.M. Bishop, M. Svensen, C.K.I. Williams, GTM: the generative topographic mapping, Neural Computation, 10(1) (1998) 215–234.[6] H.J. Bussermaker, H. Li, E.D. Siggia, Regulatory element detection using correlation with expression, Nat. Genet. 27 (2001) 167–174.[7] J.H. Chang, S.W. Chi, B.T. Zhang, Gene expression pattern analysis via latent variable models coupled with topographic clustering,
Genomics Inform. 1 (2003) 32–39.[8] K. Chang, J. Ghosh, A unified model for probabilistic principal surfaces, IEEE Trans. Pattern Anal. Mach. Intell. 23 (1) (2001).[9] Y. Chen, E.R. Dougherty, M.L. Bittner, Ratio-based decision and the quantitative analysis of cDNA microarray images, J. Biomed.
Opt. (1997) 364–374.[10] R.J. Cho, M.J. Cambell, E.A. Winzeler, L. Steinmerz, A. Conway, L. Wodicka, T.G. Wolfsberg, A.E. Gabrielian, D. Landsman, D.
Lockhard, R.W. Davis, A genom-wide transcriptional analysis of the mitotic cells, Mol. Cell 2 (1) (1998) 65–73.[11] K.R. Christie et al., Saccharomyces Genome Database (SGD) provides tools to identify and analyze sequences from Saccharomyces
cerevisiae and related sequences from other organisms, Nucleic Acids Res. (2004) 32, Database issue: D311-4.[12] A. Ciaramella, G. Longo, A. Staiano, R. Tagliaferri, NEC: a hierarchical agglomerative clustering based on Fisher and Negentropy
information, Lect. Notes Comp. Sci. 3931 (2006) 49–56.[13] A. Ciaramella, C. Bongardo, H.D. Aller, M.F. Aller, G. De Zotti, A. Lahteenmaki, G. Longo, L. Milano, R. Tagliaferri, H.
Terasranta, M. Tornikoski, S. Urpo, A multifrequency analysis of radio variability of blazars, Astron. Astrophys. J. 419 (2004) 485–500.
[14] U. de Lichtenberg, L.J. Jensen, A. Fausbøll, T.S. Jensen, P. Bork, S. Brunak, Comparison of computational methods for theidentification of cell cycle-regulated genes, Bioinformatics 21 (2005) 1164–1171.
[15] A.P. Dempster, N.M. Laird, D.B. Rubin, Maximum-likelihood from incomplete data via the EM algorithm, J. Roy. Stat. Soc. 39 (1)(1977).
[16] D. di Bernardo, M.J. Thompson, T.S. Gardner, S.E. Chobot, E.L. Eastwood, A.P. Wojtovich, S.J. Elliott, S.E. Schaus, J.J. Collins,Chemogenomic profiling on a genome-wide scale using reverse-engineered gene networks, Nat. Biotechnol. 23 (3) (2005) 377–383.
[17] R.O. Duda, P.E. Hart, D.G. Stork, Pattern Classification, second ed., John Wiley & Sons Inc., 2001.[18] M.B. Eisen, P.T. Spellman, P.O. Brown, D. Botstein, Clustering analysis and display of genome-wide expression patterns, PNAS
USA 95 (1998) 14863–14868.[19] O. Ermolaeva et al., Data management and analysis for gene expression arrays, Nat. Genet. 20 (1998) 19–23.[20] T. Hastie, R. Tibshirani, J. Friedman, The Elements of Statistical Learning, Springer-Verlag, New York, 2001.[21] T.R. Hughes et al., Functional discovery via a compendium of expression profiles, Cell 102 (2000) 109–126.[22] A. Hyvarinen, J. Karhunen, E. Oja, Independent Component Analysis, John Wiley & Sons, 2001.[23] J. Karhunen, J. Joutsensalo, Representation and separation of signals using non-linear PCA type learning, Neural Networks 7 (1994)
113–127.[24] J. Karhunen, J. Joutsensalo, Generalizations of principal component analysys, optimization problems and neural networks, Neural
Networks 8 (1995) 549–563.[25] M.K. Kerr, G.A. Churchill, Statistical design and the analysis of gene expression microarray data, Genet. Res. 77 (2001) 123–128.[26] T. Kohonen, Self-Organizing Maps, Springer-Verlag, Berlin, 1995.[27] W. Liebermeister, Linear modes of gene expression determined by independent component analysis, Bioinformatics 18 (2002) 51–60.[28] J. Misra, W. Schmitt, D. Hwang, L. Hsiao, S. Gullans, G. Stephanopoulos, Interactive exploration of microarray gene expression
patterns in a reduced dimensional space, Genome Res. 12 (2002) 1112–1120.[29] M. Mukherjee, P. Tamago, J.P. Mesirov, D. Slorim, A. Verni, T. Poggio, Support vector machine classification of microarray data,
Technical Report, Cambridge: MIT, N.182, 1999.[30] E. Purdom, S.P. Holmes, Error distribution for gene expression data, Stat. Appl. Genet. Mol. Biol. 4 (1) (2005) 16.[31] A. Robinson, A new map projection: its development and characteristics, International Yearbook of Cartography 14 (1974) 145–155.[32] R. Tagliaferri, A. Ciaramella, L. Milano, F. Barone, G. Longo, Spectral analysis of stellar light curves by means of neural networks,
Astron. Astrophys. Suppl. Ser. 137 (1999) 391–405.[33] R. Tagliaferri, N. Pelosi, A. Ciaramella, G. Longo, L. Milano, F. Barone, Soft computing methodologies for spectral analysis in
cyclostratigraphy, Comp. Geosci. 27 (2001) 535–548.[34] P. Tamayo, D. Slonim, J. Mesirov, Q. Zhu, S. Kitareewan, E. Dmitrovsky, E.S. Lander, T.R. Golub, Interpreting patterns of gene
expression with self-organizing maps: methods and application to hematopoietic differentiation, Proc. Natl. Acad. Sci. USA 96 (1999)2907–2912.

84 F. Napolitano et al. / Internat. J. Approx. Reason. 47 (2008) 70–84
[35] P. Toronen, M. Kolehmainen, G. Wong, E. Castren, Analysis of gene expression data using self-organizing maps, FEBS Lett. 451(1999) 142–146.
[36] J.P. Townsend, D.L. Hartl, Bayesian analysis of gene expression levels: statistical quantification of relative mRNA level acrossmultiple treatments or samples, Genome Biol. 3 (2002), research0071.1-0071.16.
[37] J.P. Townsend, Resolution of large and small differences in gene expression using models for the Bayesian analysis of gene expressionlevels and spotted DNA microarrays, BMC Bioinform. 5 (2004) 54.
[38] G.C. Tseng, M.K. Oh, L. Rohlin, et al., Issues in cDNA microarray analysis: quality filtering, channel normalization, models ofvariations and assessment of gene effects, Nucleic Acids Res. 29 (2001) 2549–2557.
[39] M.L. Whitfield, G. Sherlock, A.J. Saldanha, J.I. Murray, C.A. Ball, K.E. Alexander, J.C. Matese, C.M. Perou, M.M. Hurt, P.O.Brown, D. Botstein, Identification of genes periodically expressed in the human cell cycle and their expression in tumors, Mol. Biol.Cell 13 (2002) 1977–2000.
[40] R.D. Wolfinger, G. Gibson, E. Wolfinger, L. Bennett, H. Hamadeh, et al., Assessing gene significance from cDNA microarrayexpression data via mixed models, J. Comput. Biol. 8 (2001) 625–637.
[41] K.Y. Yeung, C. Fraley, A. Murua, A.E. Raftery, W.L. Ruzzo, Model based clustering and data transformations for gene expressiondata, Bioinformatics 17 (2001) 977–987.
Related Documents