PARALLEL SESSION: The science measuring aroma, texture and colour

Clustereventtaste2seas thescienceoftaste 18 11 2014
Apr 06, 2016
Â
Welcome message from author
This document is posted to help you gain knowledge. Please leave a comment to let me know what you think about it! Share it to your friends and learn new things together.
Transcript

PARALLEL SESSION:
The science
measuring aroma, texture and colour

• The importance industry
Charlotte Boone Flanders
• Chemical-analytical aroma research for food industry
Jim Van Durme KU Leuven, technology campus Ghent
• The importance of visual appearances of food products: case
Hannelore De Maere - KU Leuven, technology campus Ghent
• Why rheologie is important!
Mohammed Foukani Groupe ISA

Charlotte Boone

MEASURING FLAVOUR
What is flavour?
• Complex set of properties
• Different senses involved
How do we measure it?
• Quantitative
• Qualitative

WHAT IS FLAVOUR?
Taste: soluble compounds detected by the tongue

WHAT IS FLAVOUR?
Taste: 5 (?) basic taste sensations

WHAT IS FLAVOUR?
Smell/Aroma: volatile compounds detected by the nose

WHAT IS FLAVOUR?
Smell/Aroma: Several thousands of volatile components, detected by +/- 400 different aroma receptors
WHAT IS FLAVOUR?
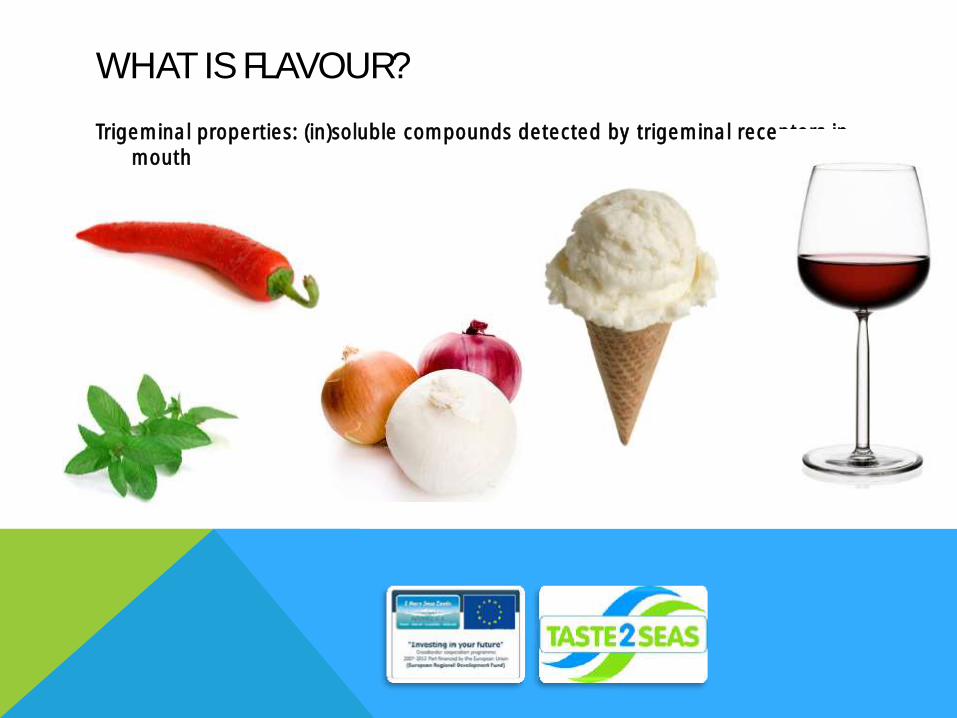
Trigeminal properties: (in)soluble compounds detected by trigeminal receptors in mouth

WHAT IS FLAVOUR?
Mouthfeel and texture: Structural and physical effects detected in the mouth
10

WHAT IS FLAVOUR?
Influenced by visual, auditory cues, and psychological effects

WHAT IS FLAVOUR?
Influenced by visual, auditory cues, and psychological effects
Tastes like white wine Tastes like red wine
HOW DO WE MEASURE IT?
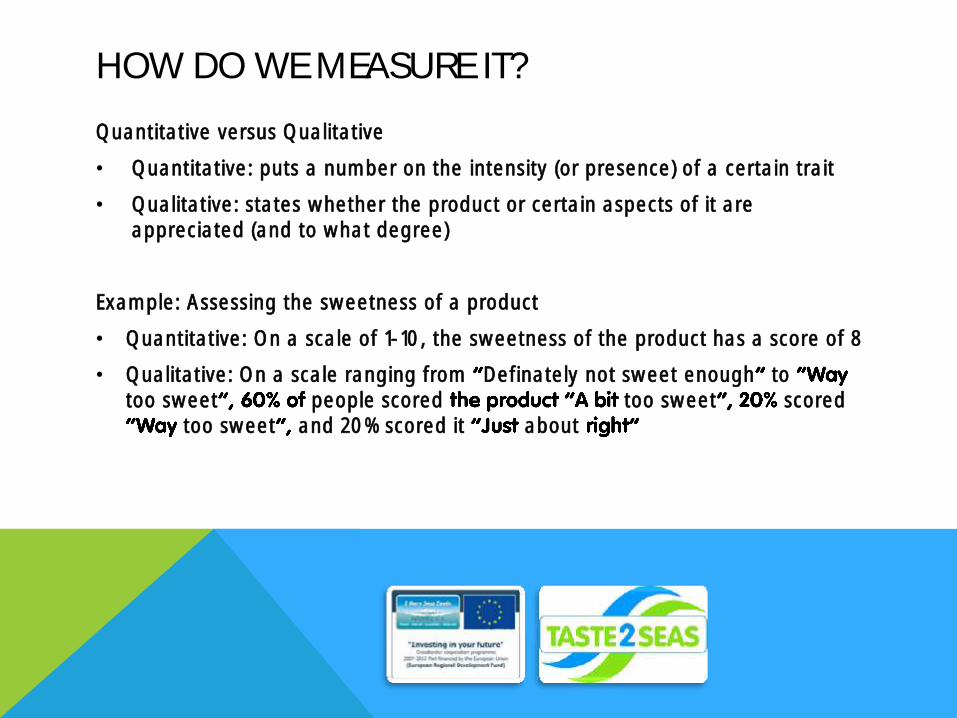
Quantitative versus Qualitative
• Quantitative: puts a number on the intensity (or presence) of a certain trait
• Qualitative: states whether the product or certain aspects of it are appreciated (and to what degree)
Example: Assessing the sweetness of a product
• Quantitative: On a scale of 1-10, the sweetness of the product has a score of 8
• Qualitative: On a scale ranging from Definately not sweet enough to too sweet people scored too sweet scored
too sweet and 20% scored it about

HOW DO WE MEASURE IT?
Quantitative
• Using laboratory analyses (colour, texture, taste, aroma)
• Using people: trained panels
(6-12 panel members)
Qualitative
• Using people: consumer panels
(>60 consumers)

Chemical-analytical aroma research for food industry
DR. IR. JIM VAN DURME
Molecular odour chemistry
KU Leuven, Technology Campus Ghent


Sample preparation: Headspace
Direct headspace HS-SPME HS-SBSE
HS-SBSE-derivatisation
SDE
TDU
Detection Gas chromatography mass
spectrometry TIC SIM
MS-nose
Chemical-analytical Sensory evaluation
Tasting room
Research Unit Molecular Odor Chemistry

Kopi Luwak (Indonesia)
Thousand year egg (China)
Mouldy cheese (Belgium, France)
Flavour Research Science culture - individual


Extraction of volatiles
(partit ioning/sorption in mucus)
Human odor perception vs. chemical analysis

Extraction of volatiles
(partit ioning/sorption in mucus)
Separation
Detection of aroma compounds
(olfactory receptors)
Human odor perception vs. chemical analysis

Extraction of volatiles
(partit ioning/sorption in mucus)
Separation
Detection of aroma compounds
(olfactory receptors)
Data processing
Bulbus olfactorius brain
Human odor perception vs. chemical analysis

EXTRACTION OF VOLATILES


Static Headspace (SHS)
Dynamic Headspace (DHS) Purge and Trap (P&T) In-tube sorptive extraction (eg ITEX) Thermal extraction (TE)
Solid Phase Micro-Extraction (SPME) Hollow fiber liquid phase micro-extraction (HF-LPME)
Stir Bar Sorptive Extraction (SBSE) Headspace Sorptive Extraction (HSSE)
ANALYSIS OF VOLATILES METHODS FOR TRACE ENRICHMENT/EXTRACTION

ANALYSIS OF VOLATILES METHODS FOR TRACE ENRICHMENT/EXTRACTION
(micro) Liquid-Liquid Extraction (LLE) Single drop micro-extraction (SDME)
Cold liquid-solid extraction Ultrasonic extraction
Membrane Extraction Membrane extraction with solvent interface (MESI)
Steam Destillation Solvent Extraction (MASE) Likens-Nickerson Microwave assisted steam destillation

Simultaneous Steam Destillation (SDE)
Extraction of volatiles

K as
K fa
Solid-phase MicroExtraction
Extraction of volatiles
Headspace SPME In-liquid SPME
NOSE TONGUE


Stirbar sorption extraction (SBSE)
Extraction of volatiles

Dynamic headspace sampling
Extraction of volatiles

SEPARATION AND DETECTION
Extraction of volatiles
Separation
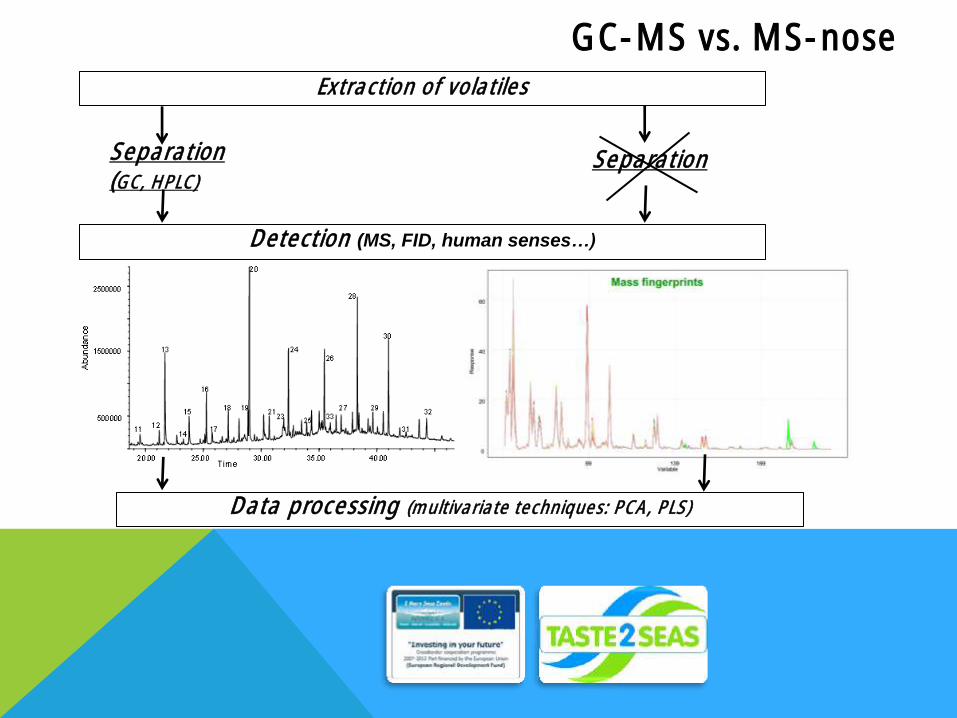
GC-MS vs. MS-nose
Detection (MS, FID, human senses…)
Separation (GC, HPLC)
Data processing (multivariate techniques: PCA, PLS)

Extraction of volatiles
Separation
GC-MS vs. MS-nose
Detection (MS, FID, human senses…)
Separation (GC, HPLC)
Data processing (multivariate techniques: PCA, PLS)
GC-MS

HS-SPME-GC-MS: examples Liquid smoke
0
1000000
2000000
3000000
4000000
5000000
6000000
5 10 15 20 25 30 35 40 45
Ab
un
da
nce
Time in minutes
Special H,1
Special H,2
Special H,3

Extraction of volatiles
Separation
GC-MS vs. MS-nose
Detection (MS, FID, human senses…)
Separation (GC, HPLC)
Data processing (multivariate techniques: PCA, PLS)
MS-nose

Figure 3D-Soft independent modeling of class analogy (SIMCA) plot (class projections) and principal component analysis (PCA) of the HS -SPME-MS-nose data, chocolate samples (n = 5)

Sensory evaluation GC-Olfactometry

Sensory evaluation GC-Olfactometry

CASE CASE: Healthy and tasty microalgae

Van Durme et al., 2013
Sensory evaluation Qualitative Desciptive Analysis
CASE: Healthy and tasty microalgae

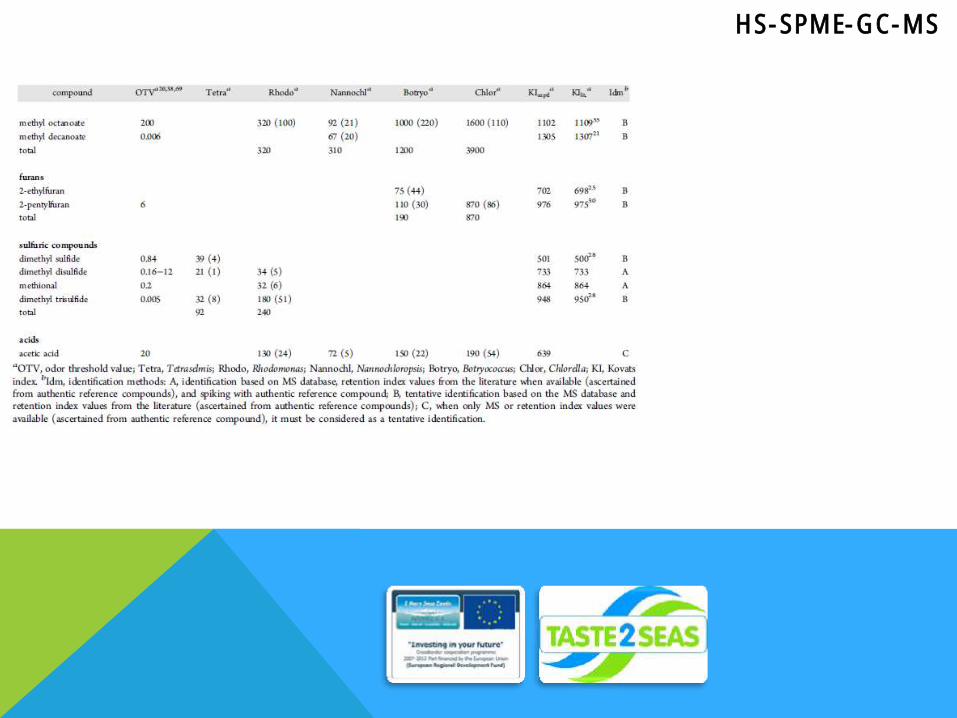
HS-SPME-GC-MS

HS-SPME-GC-MS
HS-SPME-GC-MS

HS-SPME-GC-MS
Highly detailled information! - How different are the samples? - Which are the most important aroma compounds? - Correlation with sensory evaluations?
-
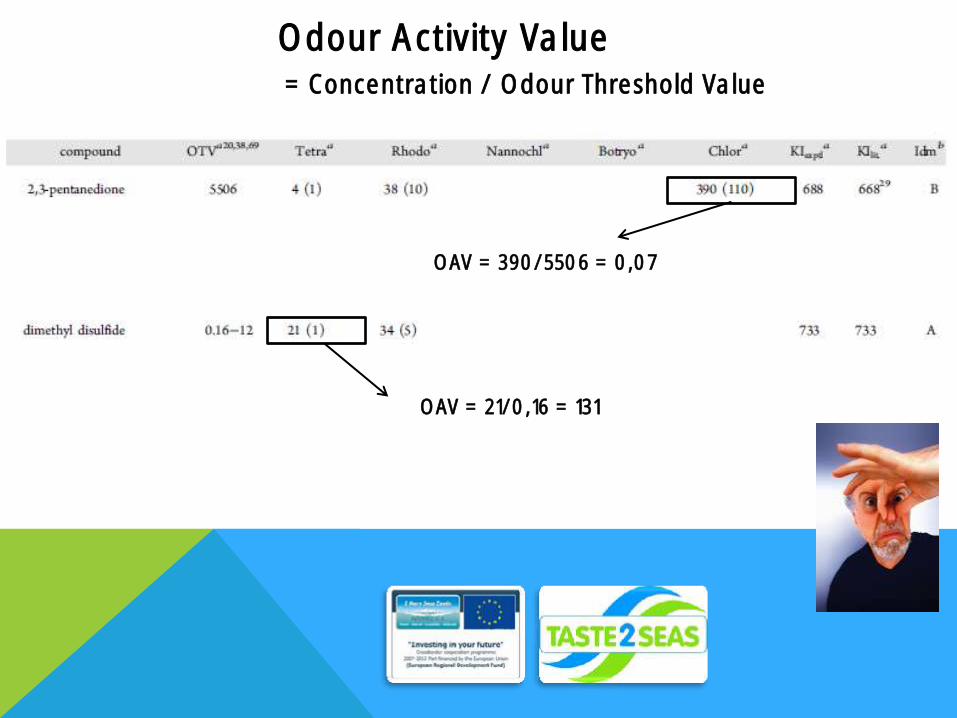
Odour Activity Value = Concentration / Odour Threshold Value
OAV = 390/5506 = 0,07
OAV = 21/0,16 = 131

Figure 3. Partial least squares regression (PLS2) correlation loadings plot (X-variables: OAV data; Y-variables: sensory
descriptors) of microalgae (Nanochloropsis, Botryococcus, Rhodomonas, Tetraselmis, Chlorella).
HS-SPME-GC-MS - PLS

[email protected] KU Leuven Technology Campus Ghent
Faculty of Industrial Engineering Technology | Department of Microbial and Molecular Systems (M2S) | Gebroeders De Smetstraat 1, B-9000 Gent | T +32 9 265 86 10

The importance of visual appearances of food products: case
Hannelore De Maere
Research Group for Technology and Quality of Animal Products
Faculty of Industrial Engineering Technology KU Leuven, Technology Campus Ghent

COLOUR
Colour defined in three dimensions:
Hue
Saturation
Lightness
Most important, e.g. sky
Most difficult to understand, e.g. purity, concentration
Black → white

COLOUR
Definitions:
Colour is electromagnetic radiation with a certain wavelength composition Physics
Colour is a property of chemical substances and depends on certain groups of atoms chromophores in the molecule
Chemistry
Colour is a nerve signal occuring in the eye in response to stimulation of rods and cones in the retina Biology
In general: Colour is the aspect of visual perception, allowing us to distinguish two similar objects

COLOUR
Description of colour:
colour
are based on visual perception of colour!
Ca. 500 000 hues
Ca. 25 000 industrial colours
Ca. 400 names
Zoom.nl Flexaverfshop.nl Garagepoortenantwerpen.be
Our vocabulary is limited and not precise → marketing

COLOUR
Pitfalls:
Personal.kent.edu; thebrain.mcgill.ca; www.psypress.co.uk
Influence form
Influence of background
Influence light source
Influence circumstances observer

COLOUR
These pitfalls are:
- Based on several laws of colour vision
- Described by Chevreul in 1839 on Simultaneous contrast
- Phenomena of interpretation
NOT of perception

APPEARANCE
Chromatic attributes
- Related to color-hue, saturation, purity
Geometric attributes
- Surface properties associated with the distribution of light from the object, such as gloss, haze or texture

STANDARDIZATION OBSERVER CONDITIONS
- Light sources
- Daylicht (D65 of D75)
- Incandescent 2856K
- Cool white Fluorescent 4200K
- Photometric conditions
- Illumination of 810-1880 Lux
- Geometric conditions
- Lighting overhead (0°)
- Viewing (45°) → observing colour, no gloss
- Background and surround
- Neutral Grey
- Uncluttered

Thing required to see colour:
1. Light source
2. Object
3. Observer

1. LIGHT SOURCE
Light source versus illuminant:
A light source is a physical emitter of radiation such as a
candle, a tungsten bulb or natural daylight
An illuminant is the spectral energy tabulated for each
wavelength of a black body at a given colour temperature
All light sources can be specified as an illuminant but not all
illuminants can be physically realized as a light source
Standardized by CIE (Commission Internationale de
l'Éclairage)

1. LIGHT SOURCE
Daylight Fluorescent Thungsten

2. OBJECT
An object partly reflects and partly absorbs light:
A green object absorbs mainly red light
→ reflects wavelengths from blue to yellow
• If an object absorbs all wavelengths < 600 nm
→ a red coloured object will be seen
3. OBSERVER
Trichromaticity of human perception:
Rod shaped receptors in the eye are responsible for night vision
Cone shaped receptors are responsible for daylight and colour
vision
There are three types of cone shaped receptors sensitive to red,
green and blue
→ Processing signals in the brains = interpretation of colour
(wavelength = physical data, colour = human interpretation)

3. OBSERVER
Human eye sensitivity:

Thing required to measure colour:
1. Light source
2. Specimen
3. spectrometer

COLOUR MEASUREMENT
Tristimulus colorimeter
Specrophotometer

MEASURING COLOUR WITH A TRISTIMULUS COLORIMETER
reflected light passes through
three glass filters
Detection beyond each filter
X, Y, Z values Taking into account the CIE illuminant and the
standard observer 2° of 10°

Standard observer
MEASURING COLOUR WITH A TRISTIMULUS COLORIMETER

Because X, Y, Z values are not easily understood in terms of object colour,
other colour scales have been developed to:
• Relate better of how we perceive colour
• Simplify understanding
• Improve communication of colour differences
• Be more linear throughout colour space
COLOUR SCALES

• Hunter L, a, b (1958)
→ 3-dimensional, cartesian, based on opponent colours
• CIELAB (1976): most complete colour model
→ standard to describe all colours visual for the human eye
• Independent of apparatus: same combination of L*, a* en b*, always
exactly the same colour
• Developed by CIE (Commission Internationale de l'Éclairage)
CIELAB COLOUR SPACE L*, A*, B* (1976)

CIELAB COLOUR SPACE L*, A*, B* (1976)
• L*- value: Lightness: 0 (black) tot 100 (white)
• a*- value: -60 (green) tot +60 (red)
• b*- value: -60 (blue) tot +60 (yellow)

CIELAB COLOUR SPACE L*, A*, B* (1976)
• L* (Lightness)
• Chroma (Saturation) = 𝑎 ∗ ² + 𝑏 ∗ ²
• Hue (colour) = arctan 𝑏∗
𝑎∗

European Union (EU) legislation requires most additives used in foods to be labelled clearly
in the list of ingredients, with their function, followed by either their name or E number.
An E number means that it has passed safety tests and has been approved by the
European Food Safety Authority.
additives
for
technological advantages negative connotation
ZINC PROTOPORPHYRIN IX FORMATION IN NITRITE-FREE DRY FERMENTED SAUSAGES

Positive balance Negative balance
Antioxidant properties
Antimicrobial properties
Colour formation
Specific aroma and taste
Direct toxicity (0 - 0.13 mg/kg body weight)
Indirect toxicity
(involvement in N - nitrosamines
formation)
Restriction in meat
products:
initial addition of 150 mg/kg
(Directive 2006/52/EC)
Interest:
How can the use of sodium nitrite be avoided
(without addition of other E numbers)? complex
Focus necessary
ZINC PROTOPORPHYRIN IX FORMATION IN NITRITE-FREE DRY FERMENTED SAUSAGES

Activity 1
Doctoral study
Formation of zinc protoporphyrin IX in relation to the colouring of
dry fermented meat products.
Promotor: Chris Michiels (KU Leuven)
Co-promotors: Hubert Paelinck (KU Leuven) and Sylvie Chollet (Groupe ISA)
ZINC PROTOPORPHYRIN IX FORMATION IN NITRITE-FREE DRY FERMENTED SAUSAGES

Ferrous protoporphyrin IX or heme (Fe(II)PPIX) (enclosed in
myoglobin) is responsible for the red colour in meat.
Nitrosoheme (NO-Fe(II)PPIX) – formed after addition of nitrite - is
responsible for the red colour in cured meat products.
Zinc protoporphyrin IX (Zn(II)PPIX) is able to form in nitrite-free, non
pasteurized meat products, with a red colour as result.
Only in dry cured hams!
NO
ZINC PROTOPORPHYRIN IX FORMATION IN NITRITE-FREE DRY FERMENTED SAUSAGES

Zinc protoporphyrin IX (Zn(II)PPIX) is able to form in nitrite-free, non
pasteurised meat products, with a red colour as result.
BUT
Reaction mechanisms are still uncertain
Influences of product- and process parameters
Investigation is still necessary to achieve formation of Zn(II)PPIX in dry cured
and/ or fermented meat products with a shorter production process.
Formation process needs time
ZINC PROTOPORPHYRIN IX FORMATION IN NITRITE-FREE DRY FERMENTED SAUSAGES

Experimental
dextrose 0.00%
day 0 day 21 month 2 month 6
day of production extensive drying
dextrose 0.25%
dextrose 0.50%
dextrose 0.75%
Fast screening method (Image analysis) and quantitative detection of zinc protoporphyrin IX (HPLC) - Nitrite-free dry fermented sausages with varying product parameter, pH
ZINC PROTOPORPHYRIN IX FORMATION IN DRY FERMENTED SAUSAGES
0,00% dextrose 0,25% dextrose 0,50% dextrose 0,75% dextrose

Experimental
dextrose 0.00%
day 0 day 21 month 2 month 6
day of production extensive drying
dextrose 0.25%
dextrose 0.50%
dextrose 0.75%
Fast screening method (Image analysis) and colour measurement (Miniscan EZ tristimulus colorimeter)
Nitrite-free dry fermented sausages with varying product parameter, pH
ZINC PROTOPORPHYRIN IX FORMATION IN DRY FERMENTED SAUSAGES
0,00% dextrose 0,25% dextrose 0,50% dextrose 0,75% dextrose

Colour measurement (Miniscan EZ tristimulus colorimeter) after an intensive drying period (day 129) - Dry fermented sausages with varying process parameter, addition of sodium nitrite
mean SD mean SD
53,05 1,41 55,14 1,84
16,12 1,35 8,86 1,52
11,81 0,73 15,16 2,35
19,47 1,26 17,69 1,62
38,46 6,23 58,88 6,83
Traditional product (with nitrite, low pH)
Innovative product (without nitrite, high pH)
L*
a*
b*
C
h
ZINC PROTOPORPHYRIN IX FORMATION IN NITRITE-FREE DRY FERMENTED SAUSAGES
colour?

ZINC PROTOPORPHYRIN IX FORMATION IN NITRITE-FREE DRY FERMENTED SAUSAGES
promising results
but
more investigation is still necessary to understand the effect of different product and process parameters on the formation of zinc protoporphyrin IX in dry cured
and/or fermented meat products, and their influence on colour formation.
Thank you for your attention Contact: [email protected]

WHY RHEOLOGY IS IMPORTANT !
M O H A M M E D F O U K A N I
I S A L I L L E

WHY RHEOLOGY IS IMPORTANT !
Rheology
Formulation
Processing
Structure Performance
Retro engineering
Raw material
During processing
Texture: creamy, crunchy, crispy
Rheology can be correlated with the sensory attributes to characterize the texture of the product
Rheology provides an important link between structure and performance of the product

WHAT IS RHEOLOGY ?
Stress
Rheology is the science of deformation and flow
Flow
Viscosity, spreadability, shear sensitivity
Viscosimety Oscillatory rheology
Deformation
Behaviour before flow, stability, Viscoelasticity

FLOW
n
k
Power Law model
k: consistancy (Pa.sn) n: Power-law index 0 < n < 1
)(fViscosity

M.FOUKANI Laboratoire Rhéologie
Mapping Profile
Thicker
More shear Thinning
Eau
Choc Choc Sauce
Miel Yoghurt
Syrup
Margarine
Mapping Profile can be used to optimize the performance of a product
Power-law index n
Co
nsi
sta
ncy
K

OSCILLATORY RHEOLOGY
Strain
Stress)(G Pa
Complex modulus
Stifness of material
Phase angle: Phase angle can be between 0° and 90°.
The higher the phase angle, the more viscous.
The lower the phase angle, the more elastic.

TEXTURE MAPPING
Complexe modulux G*
Phase angle
Mo
re r
igid
Less elastic
G* : stiffness under small deformations
Phase angle : viscous or elastic behavior associated

WHY RHEOLOGY IS IMPORTANT !
Scoopability
Coldness
Creaminess
Thikness, f irmess
regeneration

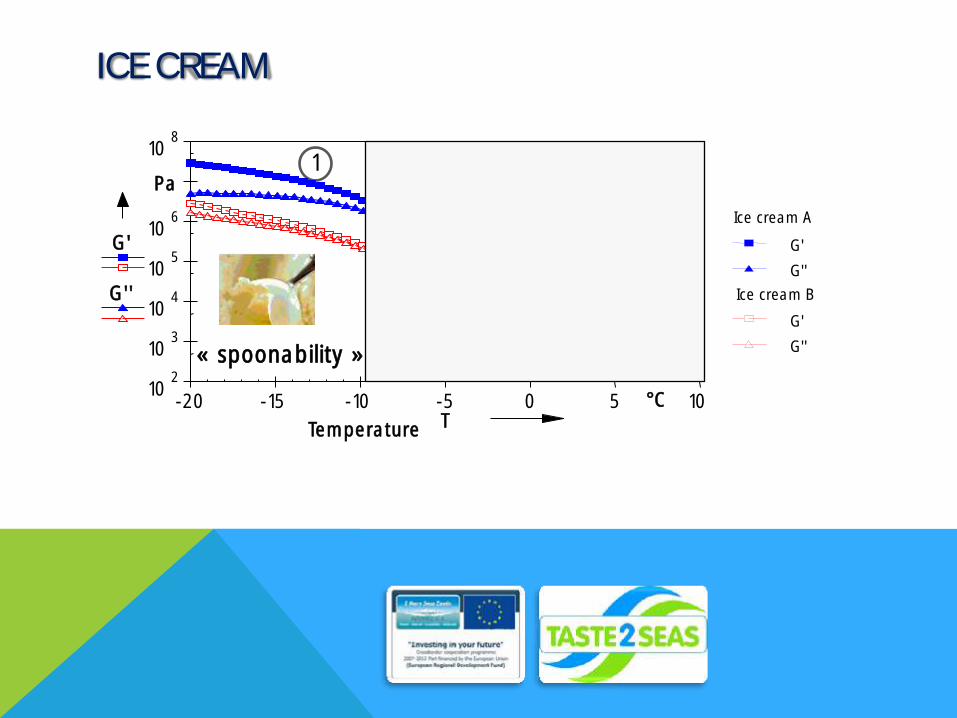
ICE CREAM
10 2
10 3
10 4
10 5
10 6
10 8
Pa
G'
G''
-20 -15 -10 -5 0 5 10 °C
Température T
G'
G''
G'
G''
1
2
3
Ice cream A
Ice cream B
« spoonability »
Coldness
Creaminess
ICE CREAM
1
Ice cream B
Ice cream A
10 2
10 3
10 4
10 5
10 6
10 8
Pa
G'
G''
-20 -15 -10 -5 0 5 10 °C
Temperature T
G'
G''
G'
G'' « spoonability »

ICE CREAM
Ice cream A
Ice cream B
10 2
10 3
10 4
10 5
10 6
10 8
Pa
G'
G''
-20 -15 -10 -5 0 5 10 °C Temperature T
G'
G''
G'
G''
2
Coldness

3
10 2
10 3
10 4
10 5
10 6
10 8
Pa
G'
G''
-20 -15 -10 -5 0 5 10 °C Temperature T
Ice cream A
G'
G''
Ice cream B
G'
G''
ICE CREAM
Creaminess

KETCHUP : YIELD STRESS
10 -2
10 -1
10 0
10 1
10 2
10 3
10 4
10 6
%
0.1 1 10 100 1,000 Pa
Stress
without texturing agent
with texturing agent
Yield stress without texturing agent
tau_0=13,5 Pa
Yield stress without texturing agent
tau_0=114 Pa
Strain

KETCHUP : THIXOTROPY 1
2
Oscillation Oscillation
rotation

CONCLUSION
Rheology is an important tool:
To compare products, formulations and processes To optimize the formulations
Viscosimetry tests can be used to describe and compare flow profiles of different
products
Oscillatory tests are a useful tool to compare textural properties of a material
Contact : [email protected]
Related Documents


