TRANSPORTATION RESEARCH RECORD 1165 105 Cluster Sampling Techniques for Estimating Transit Patronage PETER G. FURTH, KEITH L. KILLOUGH, AND GARY F. RUPRECHT Sampling of trips ls necessary to estimate rldership on most transit systems. Decause of UMTA Section 15 and other inter- nal requirements, It Is Important to know the accuracy of estimates made. Simple random sampling of trips Is a tech- nique approved by UMTA, and Its accuracy formulas are well known. However, random sampling of trips ls a very unnatural and wasteful method of gathering data becau ·e of time lost In truvellng from one selected trip to another. A more natural way of sampling Is by run-piece, the sequence of trips that a driver follows for a day or half a day. Estimation and accuracy formulas for several techniques of sampling by clusters of trips are 1>resented, with and without conversion factors. Stratifica- tion to improve accuracy Is also incorporated. A case study In Los Angeles Is used to demonstrate the merits of the various teclmlques. Pittsburgh data are also used to evaluate cluster sampling for route-level estimates. The results confirm the superior value of cluster sampling as compared to simple random sampling In most cases. Ever since the transit industry dropped the practice of issuing tickets to all patrons (due to the advent of lhe one-man crew), transit companies have had to cslimate patronage. Because of zone fares, reduced fares for various groups such as elderly and students, varying transfer policies, and the popularity of passes, applying a simple average fare factor to system revenue may not necessarily yield an accurate estimate. Even if the average fare factor is to be used, it should be estimated scientifically. Accurate patronage estimates are needed for many reasons. Many transit systems are evaluated and fWlded in proportion to the number of passengers lhcy carry. Patronage estimates are needed to evaluate lhe impacts of fare and service changes. Recognizing the need for accurate patronage estimates, Section 15 of the Urban Mass TransportaLion Act requires all systems receiving federal operating assistance to report total annual unlinked trips at a specified level of accuracy, namely, a precision of ±10 percent at the 95 percent confidence level. Many transit systems have developed lheiI own reporting requirements, which often call for accurate estimates on a monthly or quarterly basis. Along with its Section 15 reporting requirements, UMTA has issued two circulars (1, 2) containing approved sampling techniques for making the needed estimates. Both of them take a one-way vehicle trip as the sampling unit. The first technique is measuring boardings on a random sample of about 600 trips, P. G. Furch, Department of Civil Engineering, 420 Snell Engineering Cenicr, Nonheastern University, Boston, Mass. 02115. K. L. Killough, Southern California Rapid Transit Disoicl, Planning Department, 425 So. Main Street, Los Angeles, Calif. 90013. G. F. Ruptccht, Multi- systems, Inc., 1050 Massachuseits Avenue. Cambridge, Mass. 02138. calculating an estimate of systemwide mean boardings per trip, and then expanding it by the number of trips in lhe year. The second technique, described in more detail by Furth and McCollom (3), uses revenue as an auxiliary variable. In this technique, boardings and revenue are measured on a random sample of about 200 trips, from which average cash revenue per boarding is estimated. This figure is then applied to system annual revenue to yield an estimate of system annual board- ings. These estimation methods require a random sample of trips, and the UMTA circulars give clear instructions on how u-jps are to be selected to ensure randomness. Essentially, trips are chosen with equal probability out of a single "hat" that contains all trips. The only departure from pure random sam- pling allowed is the widely accepted practice of sampling the same number of trips each day. While random seleclion of trips has advantages in allowing the use of simple formulas for expansion of the sample results and estimating accuracy level, it is an inefficient, unnatural way of sampling. The checker must almost always perfonn a round trip so as not to be stranded at the end of the line, yet only data from half the round trip are allowed. There may be long waits and distances between lhe selected trips, resulting in unproduc- tive time spent either waiting or traveling. In contrast to random trip selection, transit systems have traditionally per- formed ride checks by having a checker stay on a bus, following the duty of a driver. This natural unit of sampling already conforms to work rules concerning the length of a workday. Furthermore, driver duties have been designed to cover the entire set of trips in lhe system efficiently, minimizing labor cost. Many driver duties, or runs as they are often called, consist of an early and a late piece of work of about 4 hr each, and in many transit systems lhese run-pieces form a natural sampling unit, as the early piece of one run can easily be matched with Lhe late piece of anolher. Since most run-pieces operate exclusively on a single line, sampling a rWl-piece will often provide line-specific data, which are often needed for internal monitoring and decision making. When a run-piece is interlined, special checker-pieces can be designed that switch vehicles once or twice in order to stay on a line if lhat is desired. The procedure of sampling by a natural group of elements (in this case trips) is known as cluster sampling. Anolher variation from random selection of trips lhat is useful is stratification. Stratification will improve accuracy when relatively homogeneous strata can be found. Perhaps more importantly, by making each line or each garage or each route type (local, express, etc.) a different stratum, estimates

Welcome message from author
This document is posted to help you gain knowledge. Please leave a comment to let me know what you think about it! Share it to your friends and learn new things together.
Transcript
TRANSPORTATION RESEARCH RECORD 1165 105
Cluster Sampling Techniques for Estimating Transit Patronage
PETER G. FURTH, KEITH L. KILLOUGH, AND GARY F. RUPRECHT
Sampling of trips ls necessary to estimate rldership on most transit systems. Decause of UMTA Section 15 and other internal requirements, It Is Important to know the accuracy of estimates made. Simple random sampling of trips Is a technique approved by UMTA, and Its accuracy formulas are well known. However, random sampling of trips ls a very unnatural and wasteful method of gathering data becau ·e of time lost In truvellng from one selected trip to another. A more natural way of sampling Is by run-piece, the sequence of trips that a driver follows for a day or half a day. Estimation and accuracy formulas for several techniques of sampling by clusters of trips are 1>resented, with and without conversion factors. Stratification to improve accuracy Is also incorporated. A case study In Los Angeles Is used to demonstrate the merits of the various teclmlques. Pittsburgh data are also used to evaluate cluster sampling for route-level estimates. The results confirm the superior value of cluster sampling as compared to simple random sampling In most cases.
Ever since the transit industry dropped the practice of issuing tickets to all patrons (due to the advent of lhe one-man crew), transit companies have had to cslimate patronage. Because of zone fares, reduced fares for various groups such as elderly and students, varying transfer policies, and the popularity of passes, applying a simple average fare factor to system revenue may not necessarily yield an accurate estimate. Even if the average fare factor is to be used, it should be estimated scientifically.
Accurate patronage estimates are needed for many reasons. Many transit systems are evaluated and fWlded in proportion to the number of passengers lhcy carry. Patronage estimates are needed to evaluate lhe impacts of fare and service changes. Recognizing the need for accurate patronage estimates, Section 15 of the Urban Mass TransportaLion Act requires all systems receiving federal operating assistance to report total annual unlinked trips at a specified level of accuracy, namely, a precision of ±10 percent at the 95 percent confidence level. Many transit systems have developed lheiI own reporting requirements, which often call for accurate estimates on a monthly or quarterly basis.
Along with its Section 15 reporting requirements, UMTA has issued two circulars (1, 2) containing approved sampling techniques for making the needed estimates. Both of them take a one-way vehicle trip as the sampling unit. The first technique is measuring boardings on a random sample of about 600 trips,
P. G. Furch, Department of Civil Engineering, 420 Snell Engineering Cenicr, Nonheastern University, Boston, Mass. 02115. K. L. Killough, Southern California Rapid Transit Disoicl, Planning Department, 425 So. Main Street, Los Angeles, Calif. 90013. G. F. Ruptccht, Multisystems, Inc., 1050 Massachuseits Avenue. Cambridge, Mass. 02138.
calculating an estimate of systemwide mean boardings per trip, and then expanding it by the number of trips in lhe year. The second technique, described in more detail by Furth and McCollom (3), uses revenue as an auxiliary variable. In this technique, boardings and revenue are measured on a random sample of about 200 trips, from which average cash revenue per boarding is estimated. This figure is then applied to system annual revenue to yield an estimate of system annual boardings. These estimation methods require a random sample of trips, and the UMTA circulars give clear instructions on how u-jps are to be selected to ensure randomness. Essentially, trips are chosen with equal probability out of a single "hat" that
contains all trips. The only departure from pure random sampling allowed is the widely accepted practice of sampling the same number of trips each day.
While random seleclion of trips has advantages in allowing the use of simple formulas for expansion of the sample results and estimating accuracy level, it is an inefficient, unnatural way of sampling. The checker must almost always perfonn a round trip so as not to be stranded at the end of the line, yet only data from half the round trip are allowed. There may be long waits and distances between lhe selected trips, resulting in unproductive time spent either waiting or traveling. In contrast to random trip selection, transit systems have traditionally performed ride checks by having a checker stay on a bus, following the duty of a driver. This natural unit of sampling already conforms to work rules concerning the length of a workday. Furthermore, driver duties have been designed to cover the entire set of trips in lhe system efficiently, minimizing labor cost. Many driver duties, or runs as they are often called, consist of an early and a late piece of work of about 4 hr each, and in many transit systems lhese run-pieces form a natural sampling unit, as the early piece of one run can easily be matched with Lhe late piece of anolher. Since most run-pieces operate exclusively on a single line, sampling a rWl-piece will often provide line-specific data, which are often needed for internal monitoring and decision making. When a run-piece is interlined, special checker-pieces can be designed that switch vehicles once or twice in order to stay on a line if lhat is desired. The procedure of sampling by a natural group of elements (in this case trips) is known as cluster sampling.
Anolher variation from random selection of trips lhat is useful is stratification. Stratification will improve accuracy when relatively homogeneous strata can be found. Perhaps more importantly, by making each line or each garage or each route type (local, express, etc.) a different stratum, estimates
106
for these subdivisions can be obtained at specified accuracy levels in the process of obtaining ystem estimates.
Because of the unnaturalness of random sampling by trip, most transit systems that follow the UMfA-published procedures perform their Section 15 ride checks separately from ride checks perform~ for other purposes, and they use the Section 15 data for no purpose other Lhan Section 15 reporting. Other transit systems have tried to develop patronage estimating procedures that involve sampling by run-piece and stratification and provide estimates that are used for internal as well as Section 15 reporting. In order to satisfy the Section 15 requirements, however, the transit system must demonstrate that its procedures are unbiased and that they meet the statistical accuracy target.
In the following sections of the paper, several unbiased cluster sampling techniques will be described. Where appropriate, stratification is incorporated. Estimation and variance/ precision formu.las are also supplied. A case slUdy is then de! cribed in which these techniques were applied to data from the Southern California Rapid Transit District (SCRTD). Finally, data from both SCRTD and the Port Authority for Allegheny County (Pittsburgh) are presented indicating the increase in sampling rate called for by cluster sampling (versus simple random sampling) in estimating items at the system, route, and route/direction time period levels.
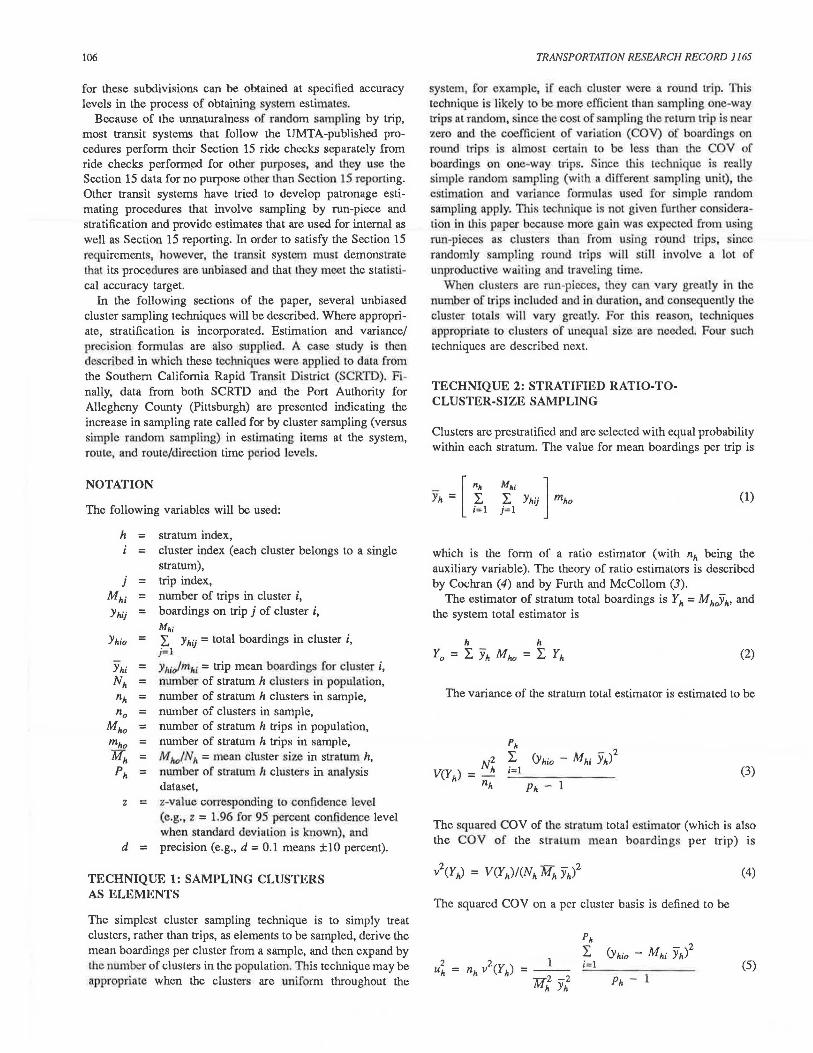
NOTATION
The following variables will be used:
h
j Mhi
YitiJ
Yhio
Yhi Nh nh no
MJIO mho Mh Ph
z
d
= =
= = = =
= = = = = = = =
=
=
stratum index, cluster index (each cluster belongs to a single stratum), trip index, number of trips in cluster i, boardings on trip j of cluster i, Mhi
L, Ynij = total boardings in cluster i, J=l Yh;0 /mhi = trip mean boardings for cluster i, number of stratum h clusters in population, number of stratum h clusters in sample, number of clusters in sample, number of stratum h trips in population, number of stratum h trips in sample, M110/N1o =mean cluster size in stratum h, number of stratum h clusters in analysis dataset, z-value corresponding to confidence level (e.g., z = 1.96 for 95 percent confidence level when standard devia1ion is known), and precision (e.g., d = 0.1 means ±10 percent).
TECHNIQUE 1: SAMPLING CLUSTERS AS ELEMENTS
The simplest cluster sampling technique is to simply treat clusters, rather than trips, as elements to be sampled, derive the mean boardings per cluster from a sample, and then expand by the number of clusters in the population. This technique may be appropriate when the clusters are uniform throughout the
TRANSPORTATION RESEARCH RECORD 1165
system, for example, if each cluster were a round trip. This technique is likely to be more efficient than sampling one-way trips at random, since the cost of sampling the return !rip is near zero and the coefficient of variation (COY) of boardings on round trips is almost certain to be less than the COY f boardings on one-way trips. Since this technique is really simple random sampling (with a different sampling unit), the estimation and variance formulas used for simple random sampling apply. Th.is technique is not given further consideration in this paper because more gain was expected from using run-pieces as clusters than from using round trips, s.incc randomly ampling round trips will slill involve a lot of unproductive waiting and traveling time.
When clu ters are run-pieces, they can vary g.rearly in the number of trips included and in duration, and consequently the cluster totals will vary greatly. For this reason, techniques appropriate co clusters of unequal size are needed. Four such techniques are described next.
TECHNIQUE 2: STRATIFIED RATIO-TOCLUSTER-SIZE SAMPLING
Clusters are prestratified and are selected with equal probability within each stratum. The value for mean boardings per trip is
(1)
which is the form of a ratio estimator (with nh being the auxiliary variable). The theory of ratio estimators is described by Cochran (4) and by Furth and McCollom (3).
The estimator of stratum total boardings is Yh = Mh,]11, and the system total estimator is
h h
Yo = L. Y.~ M 1io = L. Y1t (2)
The variance of the stratum total estimator is estimated to be
(3)
The squared COV of the stratum total e timator (which is also the COV of the stratum mean boardings per trip) is
The squared COV on a per cluster basis is defined to be
1 TA2 -2 m1o Y1t Ph - 1
(5)

Furth el al.
The per cluster term u11 lends itself to use in the familiar equation
(COV of mean or total) = ---'('-C_O_V_of_u_ru_·...:..r)_ (number of units)112
which for this case takes the form v(Y11 ) = u11/(n 11)1fl. The u11
term is also useful because it can be calculated from the analysis dataset without prior specification of n11•
The system total variance is simply
h V(Y0 ) = :E V(Y n) (6)
since the clusters in each stratum are selected independently. The system total COV is therefore
Iu~ M~0 y~/n,J 1 fl v(Y o> = -----
:E Nf,,o Y1t
and its precision (relative tolerance) is
d = z v(YJ
(7)
(8)
To minimize the system total COV for a given overall sample size or to minimize overall sample size for a desired overall COV, the number of clusters sampled in stratum h should be proportional to u,.M11;]11 , under the assumption that sampling cost is proportional to number of clusters sampled. This is easily seen by minimizing v(Y
0) subject to a constraint
on n0 , or by minimizing n0
subject to a given v(Y0
).
For a given total number of clusters n0 , optimal allocation is
(9)
and for a given desired precision d,
(10)
However, if cost is proportional to the number of trips sampled (rather than number of runs), it follows that strata with more trips per run should be sampled less. Optimizing leads to
(11)
Most generally, if the cost of sampling a stratum h cluster is c11 , optimum allocation calls for
(12)
However, Cochran (4) and others point out that the optimum is relatively flat, in the sense that even moderate departures from optimal allocation will lead to little deterioration in accuracy. In our case study, we found that using equal sampling rates (which has the advantage of simplicity and of flexibility in analysis) rarely increased necessary sample size by more than 5 percent optimum allocation.
107
TECHNIQUE 3: STRATIFIED CLUSTER SAMPLING WITH PROBABILITY PROPORTIONAL TO SIZE
Another sampling approach that recognizes differing cluster sizes is to sample clusters with the selection probability proportional to the number of trips in the cluster ( 4). The unbiased estimator of stratum h total boardings is
(13)
where y11 is the unweighted mean of the cluster trip-level means. One way of selecting run-pieces in proportion to this size is to select trips with equal probability and then take the run-piece to which the selected trips belong. The probability proportional to size (PPS) strategy is different from the ratiocluster-size approach and requires a different expansion procedure (Equation 13 versus Equation 1). Compared to the ratioto-cluster-size approach, PPS sampling will tend to sample more large clusters and fewer small clusters, often implying a greater sampling cost per cluster.
Using an analysis dataset of p 11 clusters, the variance of the stratum total estimator is estimated to be
(14)
Its squared COV on a per cluster basis is
Ph
L. - 2 <Yiii - 'Y1i) 2 2 i=I (15)
uhPPS =nit vltPPS = (p,. - 1) ~ y,,
The system total estimator is Y0 pps = :E11 Y11pps· Its variance is again the sum of the stratum total variances:
The system total is
h 2 2 - 2 1/2 I uhPPS Mho Y1tl11h)
v(YoPPs) = ---------'f!' MhoJh
Its precision is
(16)
(17)
(18)
If the sampling cost is proportional to the number of runs sampled, and all strata have the same cost per run, optimal allocation between strata calls for
(19)
If cost is proportional to number of trips, it is important to recognize that the expected number of trips per cluster sampled in stratum h is greater than M,. since bigger clusters are
108
sampled with greater probability. The expected size of a sampled cluster is M,. (1 + v!n), where v,,.,, is the COV of cluster size in stratum h. Optimum allocittion in this case yields
(20)
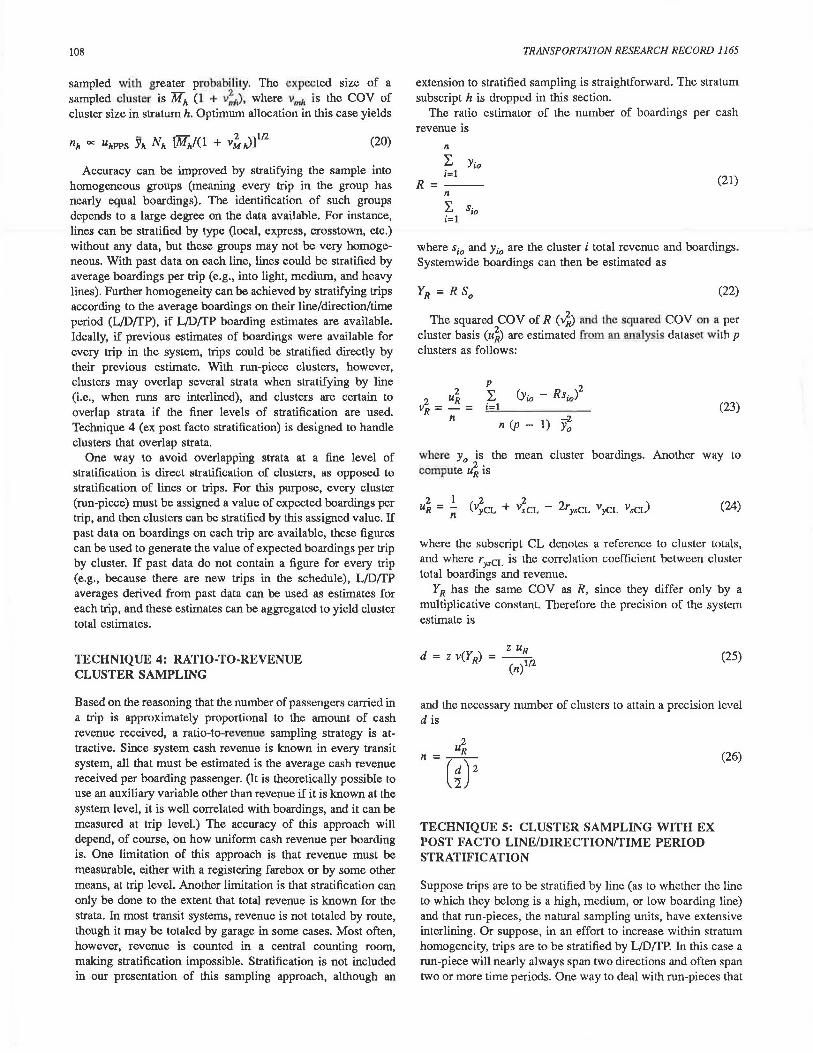
Accuracy can be improved by stratifying the sample into homogeneous groups (meaning every trip in the group has nearly equal boardings). The identification of such groups depends to a large degree on the data available. For instance, lines can be stratified by type (local, express, crosstown, etc.) without any data, but these groups may not be very homogeneous. With past data on each line, lines could be stratified by average boardings per trip (e.g., into light, medium, and heavy lines). Further homogeneity can be achieved by stratifying trips according to the average boardings on their line/direction/time period (L/Dff P), if L/Dff P boarding estimates are available. Ideally, if previous estimates of boardings were available for every trip in the system, trips could be stratified directly by their previous estimate. With run-piece clusters, however, clusters may overlap several strata when stratifying by line (i.e., when runs are interlined), and clusters are certain to overlap strata if the finer levels of stratification are used. Technique 4 (ex post facto stratification) is designed to handle clusters that overlap strata.
One way to avoid overlapping strata at a fine level of siraiificaiion is direci siraiificaiion of clusters, as opposed io stratification of lines or trips. For this purpose, every cluster (run-piece) must be assigned a value of expected boardings per trip, and then clusters can be stratified by this assigned value. If past data on boardings on each trip are available, these figures can be used to generate the value of expected boardings per trip by cluster. If past data do not contain a figure for every trip (e.g., because there are new trips in the schedule), L/Dff P averages derived from past data can be used as estimates for each trip, and these estimates can be aggregated to yield cluster total estimates.
TECHNIQUE 4: RATIO-TO-REVENlJE CLUSTER SAMPLING
Based on the reasoning that the number of passengers carried in a trip is approximately proportional to the amount of cash revenue received, a ratio-to-revenue sampling strategy is attractive. Since system cash revenue is known in every transit system, all that must be estimated is the average cash revenue received per boarding passenger. (It is theoretically possible to use an auxiliary variable other than revenue if it is known at the system level, it is well correlated with boardings, and it can be measured at trip level.) The accuracy of this approach will depend, of course, on how uniform cash revenue per boarding is. One limitation of this approach is that revenue must be measurable, either with a registering farebox or by some other means, at trip level. Another limitation is that stratification can only be done to the extent that total revenue is known for the strata. In most transit systems, revenue is not totaled by route, though it may be totaled by garage in some cases. Most often, however, revenue is counted in a central counting room, making stratification impossible. Stratification is not included in our presentation of this sampling approach, although an
TRANSPORTATION RESEARCH RECORD 1165
extension to stratified sampling is straightforward. The stratum subscript h is dropped in this section.
The ratio estimator of the number of boardings per cash revenue is
n
I. Yio i=l
(21) R =---n
I. sio i=l
where sio and Yio are the cluster i total revenue and boardings. Systemwide boardings can then be estimated as
(22)
The squared COV of R (v;) and Lhc squared COV on a per cluster basis (u;) are estimated from an maly i dataset with p clusters as follows:
p
I. i=l (23)
n (,p - 1) ~
where y0
is the mean cluster boardings. Another way to 2.
com-pute uR is
(24)
where the subscript CL denotes a reference to cluster totals, and where rysCL is the correlation coefficient between cluster total boardings and revenue.
YR has the same COV as R, since they differ only by a multiplicative constant. Therefore the precision of the system estimate is
d = rv' - z uR Z l\. R, - (n)l{l. (25)
and the necessary number of clusters to attain a precision level dis
TECHNIQUE 5: CLUSTER SAMPLING WITH EX POST FACTO LINE/DIRECTION/TIME PERIOD STRATIFICATION
(26)
Suppose trips are to be stratified by line (as to whether the line to which they belong is a high, medium, or low boarding line) and that run-pieces, the natural sampling units, have extensive interlining. Or suppose, in an effort to increase within stratum homogeneity, trips are to be stratified by L/D{f P. In this case a run-piece will nearly always span two directions and often span two or more time periods. One way to deal with run-pieces that
Furth el al.
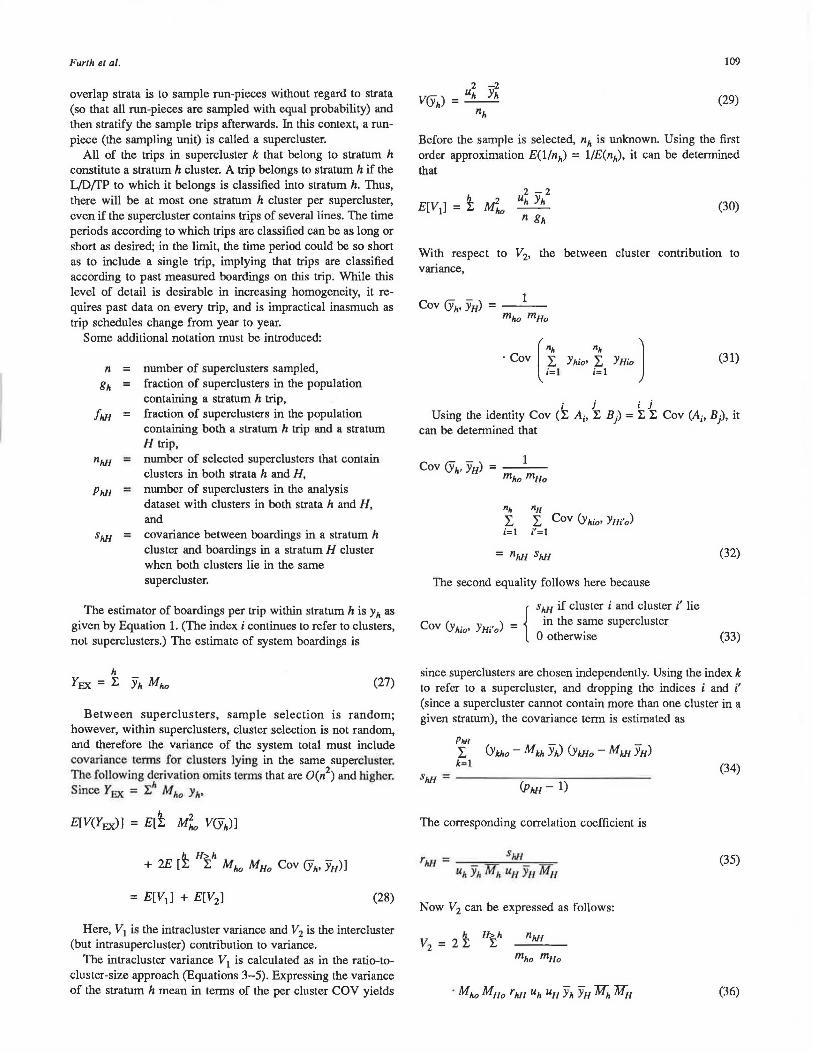
overlap strata is to sample run-pieces without regard to strata (so that all run-pieces are sampled with equal probability) and then stratify the sample trips afterwards. Jn this context, a runpiece (the sampling unit) is called a supercluster.
All of the trips in supercluster k that belong to stratum h constitute a stratum h cluster. A trip belongs to stratum h if the L/Dff P to which it belongs is classified into stratum h. Thus, there will be at most one stratum h cluster per supercluster, even if the supercluster contains trips of several lines. The time periods according to which trips are classified can be as long or short as desired; in the limit, the time period could be so short as to include a single trip, implying that trips are classified according to past measured boardings on this trip. While this level of detail is desirable in increasing homogeneity, it requires past data on every trip, and is impractical inasmuch as trip schedules change from year to year.
Some additional notation must be introduced:
n = g,, =
f 1i11 =
nhll =
P1i11 =
Shll =
number of superclusters sampled, fraction of superclusters in the population containing a stratum h trip, fraction of superclusters in the population containing both a stratum h trip and a stratum H trip, number of selected superclusters that contain clusters in both strata h and H, number of superclusters in the analysis dataset with clusters in both strata h and H, and covariance between boardings in a stratum h cluster and boardings in a stratum H cluster when both clusters lie in the same supercluster.
The estimator of boardings per trip within stratum h is y 11 as given by Equation 1. (The index i continues to refer to clusters, not superclusters.) The estimate of system boardings is
(27)
Between superclusters, sample selection is random; however, within superclusters, cluster selection is not random, and therefore the variance of the system total must include covariance teffilS for clusters lying in the same supercluster. The following derivation omits teffilS that are O(n2
) and hlgher. Since YEX = 'f." M1a 0 y,,,
= E[Vi] + E[V2] (28)
Here, V1 is the intracluster variance and V2 is the intercluster (but intrasupercluster) contribution to variance.
The intracluster variance V1 is calculated as in the ratio-tocluster-size approach (Equations 3-5). Expressing the variance of the stratum h mean in terms of the per cluster COV yields
109
(29)
Before the sample is selected, n11 is unknown. Using the first order approximation £(1/n,,) = 1/E(n11), it can be determined that
(30)
With respect to V2, the between cluster contribution to variance,
· Cov (31)
j j j j Using the identity Cov ('f. Ai, r. B) = r. r. Cov (Ai• Bi), it
can be determined that
nh nn L. L. Cov (yhio• Ym•o) i=l i'=l
The second equality follows here because
{
s11H if cluster i and cluster i' lie
Cov (y . y ., ) = in the same supercluster 11'0
' Hi 0 0 otherwise
(32)
(33)
since superclusters are chosen independently. Using the index k to refer to a supercluster, and dropping the indices i and i' (since a supercluster cannot contain more than one cluster in a given stratum), the covariance term is estimated as
P1r11 L. k=l (34)
The corresponding correlation coefficient is
(35)
Now V2 can be expressed as follows:
Vz = 2 ~ 11h nhff mho mHo
(36)

llO
To get E[V2], the first order approximation is made
E [ m~';., l = E[m:;::m8,]
nfhH (37) =-------
Combining the V1 and V2, the variance of the ex post facto estimator is
E[V(YEX)] _ .!_ { ~ M~0 u~ ~ n g,.
+ 2 ~ Hr_h M1w M,.,0 uh ufl Yn YH r1Jifhf1} (38)
gh g,.,
The per-supercluster squared COV uk (which is stratum independent) is given by
2 n E[V(YEX)] UEX = ----y2
EX
(39)
and can be calculated directly from an analysis dataset. The precision obtained from a sample of n superclusters (runpieces) is therefore
Z UEX d=--
(n/12 (40)
and the number of superclusters that must be sampled to obtain a precision d is
_ (z UEX) 2 n- --d
(41)
SCRTD CASE STUDY
SCRTD has for many years had a regular program of systemwide estimation of unlinked passenger trips. Fare checks are conducted on a sample of about 200 half-runs each quarter, observing the fare type for each boarding passenger. The estimation procedure used was ratio-to-cluster-size with lines stratified into four groups: express, and three groups of local lines. A dataset of most recent ride checks on each line provides an estimate of average boardings per trip on each line, and these estimates are used to stratify lines into low, medium, and high boarding groups. In order to provide a scientific basis for the choice of sample sizes, SCRTD contracted with Multisystems, Inc. to choose a sampling technique and to determine what sample size would be needed to meet both internal and external (Section 15) accuracy requirements.
Techniques 2-5 were tested. Technique 2 was tested with two different stratification schemes: stratification by line (as previously done by SCRTD) and direct stratification by cluster, using past ride check data to estimate expected boardings in each half-run. In all cases, the cluster used was half a run. A run at SCRTD is the set of trips performed in a day by a single vehicle.
TRANSPORTATION RESEARCH RECORD 1165
The 95 percent confidence level is used throughout. If the standard deviation is known, the corresponding z-value is 1.96 (i.e., there is a 95 percent chance that a standard normal variate lies between -1.96 and +1.96). Because standard deviations that are estimated from the samples are being used, a z-value of 2.1 is used throughout. (This may be somewhat conservative, since 2.1 is the t-value for the 95 percent confidence level with 18 degrees of freedom, whereas the fare survey results supplied between 15 and 200 degrees of freedom, depending on the level of stratification, in estimating standard deviations.)
Reported results are based on the February 1987 fare check dataset, weekdays only. The February dataset uniformly showed more variation than the November 1986 dataset, and so these results are conservative.
Ratio-to-cluster-size and PPS sampling were both analyzed using the stratification scheme now used by SCRTD (i.e., with one stratum for express lines and three strata for local lines according to whether the value of mean boardings per trip on a line, as measured by past ride checks, was high, medium, or low). These analyses were then repeated using eight strata, by simply bisecting the four strata. Ratio-to-cluster~size sampling was also analyzed with direct stratification of run-pieces. In this case, expected boardings were calculated for each runpiece in the population (by summing expected boardings on each trip in the run-piece, which was in tum set equal to the mean boardings for trips in the corresponding line, direction, and 1-hr time period from past data) and run-pieces were stratified into eight strata according to expected boardings per trip without regard to line type. A ninth stratum had to be created for clusters for which there were no past ride check data for calculating expected boardings.
The ratio-to-revenue approach was also analyzed, without stratification. This approach presented a difficulty in that SCRTD fareboxes do not register receipts. Cash revenue must therefore be estimated from the number of people boarding in each fare category and is subject to error from miscounting people and from underpayment and overpayment. A project report (5) documents how this problem was analyzed. Essentially, it was found that calculated revenue differed less from measured revenue than the normal sampling error expected for measured revenue, so that calculated revenue could be treated as virtually identical to measured revenue.
Finally, stratified sampling with ex post facto L/DffP stratification was examined. Five time periods were used. No distinction was made between express and local lines. Analyses were done using both four and eight strata. Optimum allocation was used with a goal of minimizing clusters.
The results of ratio-to-cluster-size and PPS sampling with four and eight strata are found in Tables 1 and 2. Accuracy improves significantly by going to eight strata. The methods produce similar results. To achieve a ±10 percent precision with eight strata, and constraining each stratum's sample to contain at least four clusters, the ratio-to-cluster-size approach requires 58 clusters, while the PPS approach requires 64 clusters. However, since the PPS method oversamples the larger cluster, the number of trips to be sampled by the PPS method is far more--408 versus 252 for ratio-to-cluster-size sampling.

TABLE 1 RESULTS: RATIO-TO-CLUSTER-SIZE APPROACH
Clusters Mean Clusters to Cluster in Mean Reach 10 Adjusted
Stratum Threshold Clusters Size Dataset Boardings COY Percent (min. 4)
Sample with Four Strata
1 100 1,874 4.0 49 111.8 0.32 36 36 2 50 1,178 4.7 53 68.0 0.45 23 23 3 0 252 6.0 44 29.8 0.70 4 4 4 Express 1,160 2.4 48 48.4 0.94 17 17 Total number of
clusters 80 80 Expected number of
trips 317 317
Sampling with Eight Strata
1 0 154 6.1 23 23.98 0.713 2 4 2 35 228 5.2 22 42.82 0.252 1 4 3 50 498 5.4 23 62.05 0.484 9 8 4 75 940 4.3 33 88.93 0.327 13 12 5 100 754 4.1 19 111.00 0.242 9 9 6 115 690 4.1 18 127.95 0.359 14 13 7 Express 244 2.7 18 28.47 0.582 1 4
0 8 Express 688 2.9 27 46.85 0.405 4 4
50 Total number of
clusters 53 58 Expected number of
trips 228 252
TABLE 2 RESULTS: SELECTION PROBABILITY PROPORTIONAL TO CLUSTER-SIZE APPROACH
Clusters Mean Clusters to Cluster in Mean Reach 10 Adjusted
Stratum Threshold Clusters Size Dataset Boardings COY Percent (min. 4)
Sample with Four Strata
1 100 1,874 4.9 49 118.2 0.121 36 34 2 50 1,178 5.9 53 72.8 0.175 20 20 3 0 252 9.1 44 33.1 0.177 2 4 4 Express 1,160 3.4 48 42.8 0.288 8 8 Total number of
clusters 66 66 Expected number of
trips 341 341
Sampling with Eight Strata
1 0 154 10.7 23 29.1 0.224 1.0 4 2 35 228 7.3 22 41.9 0.072 2.0 4 3 50 498 8.0 23 71.3 0.176 9.0 8 4 75 940 6.1 33 90.9 0.072 11.0 10 5 100 754 6.0 19 108.3 0.147 14.0 13 6 115 690 6.1 18 134.7 0.146 17.0 16 7 Express 244 4.7 18 30.3 0.348 1.0 4
0 8 Express 688 4.7 27 51.7 0.196 5.0 5
50 Total number of
clusters 60 64 Expected number of
trips 382 408

112
The results of directly stratifying run-pieces are found in Table 3. Only 38 clusters or 154 trips are needed to achieve ±10 percent precision. The improved accuracy follows from using a stratification scheme that indirectly accounts for direction and time period as well as line, and thus reduces the within stratum variability.
The ratio-to-revenue approach requires 59 clusters to achieve a ±10 percent precision, about the same as revenue-tocluster-size with eight strata. This implies that the boardings on a trip can be guessed equally well by either knowing cash revenue on the trip or knowing which of the eight strata it belongs to. This rather disappointing performance of the ratioto-revenue approach is apparently due to the variability between routes in the incidence of pass use (which constitutes 50 percent of all boardings) and of reduced fares, making cash revenue a weak indicator of total boardings.
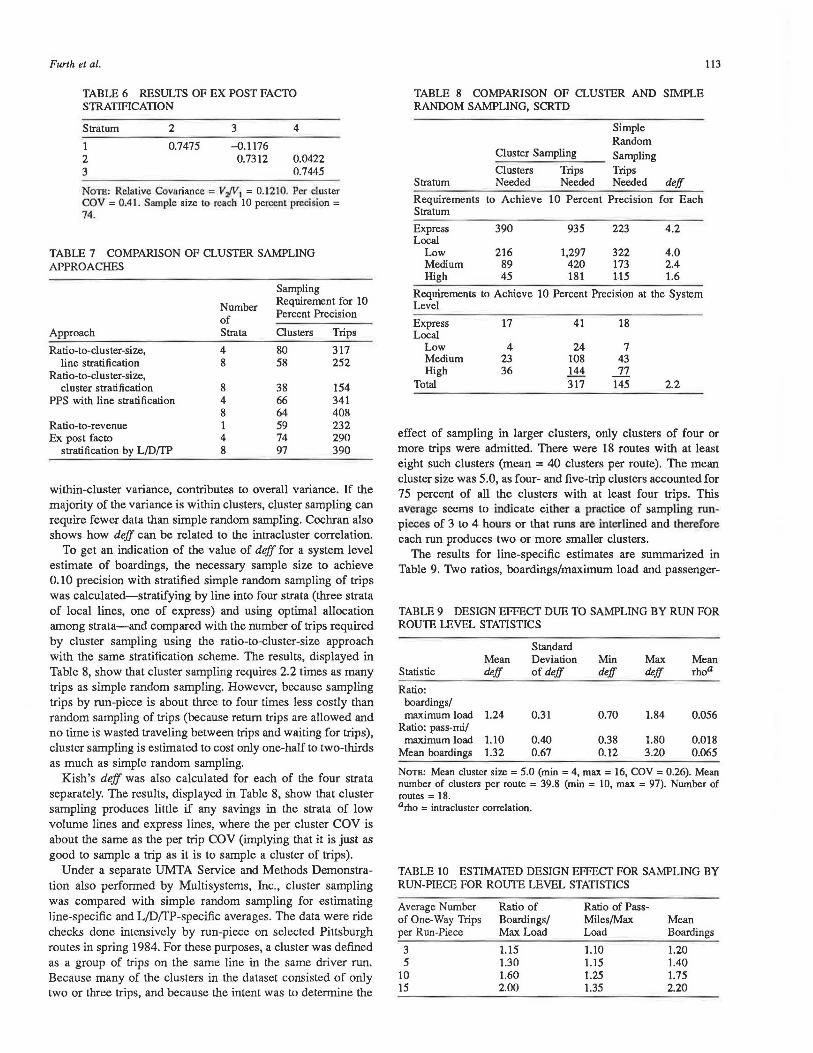
Ex post facto stratification stratum characteristics are given in Table 4 and the interstratum correlations in Table 5. The results of using ex post facto stratification with four strata are presented in Table 6. Of particular interest is the level of between-cluster, within-supercluster correlation. The correlations between adjacent strata are quite strong while those between nonadjacent strata are nearly zero. The overall between-cluster effect is small but significant; it is 12 percent as large as the within-cluster variance. (Interestingly, the betweencluster effect in the November dataset was slightly negative, reducing the overall COV.) The number of run-pieces needed to reach the ±10 percent precision, based on February results, is 74. With eight strata, the between-cluster effect is larger, increasing to 63 percent of the within-cluster effect, and the needed sample size increases to 97.
TRANSPORTATION RESEARCH RECORD 1165
TABLE 5 EX POST FACTO STRATIFICATION: INTERSTRATUM CORRELATION
Population Sample
Stratum 2 3 4 2 3 4
1 11 9 3 36 12 0 2 15 11 25 2 3 30 21
An overall comparison of the sample size requirements of the different sampling approaches is given in Table 7. The recommended approach, direct stratification, requires only 38 half-runs, an 81 percent savings as compared with the 200 halfruns that were being sampled by SCRTD before this study was done.
Comparison of Cluster Sampling and Simple Random Sampling
One way of comparing simple random sampling with cluster sampling is the quantity known as Kish 's def! (for design effect), given by
def!= sample size under cluster sampling (42) sample size under simple random sampling
Note that'the numerator is the number of elements (i.e., trips, sampled) rather than the number of clusters sampled.
Cochran (4) shows that deff will be greater or less than unity to the degree that between-cluster variance, as opposed to
TABLE 3 RESULTS: DIRECT STRATIFICATION OF CLUSTERS
Clusters Mean Clusters to Cluster in Mean Reach 10 Adjusted
Stratum Threshold Clusters Size Dataset Boardings cov Percent (min. 4)
0 Unknown 134 3.1 14 28.3 1.664 2 4 1 0 639 4.2 52 30.0 0.506 3 4 2 40 429 4.6 35 44.6 0.352 3 4 3 55 544 4.4 21 69.4 0.253 3 4 4 70 644 4.4 25 76.3 0.247 4 4 5 85 556 4.3 16 117.3 0.190 4 4 6 100 391 4.2 11 107.1 0.197 3 4 7 110 608 3.8 9 128.6 0.313 8 6 8 130 397 3.5 10 142.3 0.281 4 4 Total number of
clusters 34 38 Expected number of
trips 139 154
TABLE 4 EX POST FACTO STRATIFICATION: STRATUM CHARACTERISTICS
Population
Percent Sample
Su per clusters Trips/ Boardings/ Cluster Stratum Threshold Trips Touching Cluster Trip cov 1 0 1,712 18 3.2 39.3 0.63 2 30 2,781 31 2.4 54.6 0.68 3 50 4,345 49 2.4 90.8 0.44 4 80 8,170 62 2.4 104.9 0.43
Furth et al.
TABLE 6 RESULTS OF EX POST FACTO S1RATIFICATION
Stratum
1 2 3
2
0.7475
3
-0.1176 0.7312
4
0.0422 0.7445
Norn: Rela1ive Covuriance = V,,JV1 = 0.1210. Per clus1er COV = 0.41. Sample size 10 reach 10 percent precision= 74.
TABLE 7 COMPARISON OF CLUSTER SAMPLING APPROACHES
Sampling
Number Requirement for 10
of Percent Precision
Approach Strata Clusters Trips
Ratio-to-cluster-size, 4 80 317 line stratification 8 58 252
Ratio-to-cluster-size, cluster stratification 8 38 154
PPS with line stratification 4 66 341 8 64 408
Ratio-to-revenue 1 59 232 Ex post facto 4 74 290
stratification by L/D{fP 8 97 390
within-cluster variance, contributes to overall variance. If the majority of the variance is within clusters, cluster sampling can require fewer data than simple random sampling. Cochran also shows how deft can be related to the intracluster correlation.
To get an indication of the value of deft for a system level estimate of boardings, the necessary sample size to achieve 0.10 precision with stratified simple random sampling of trips was calculated-stratifying by line into four strata (three strata of local lines, one of express) and using optimal allocation among strata-and compared with the number of trips required by cluster sampling using the ratio-to-cluster-size approach with the same stratification scheme. The results, displayed in Table 8, show that cluster sampling requires 2.2 times as many trips as simple random sampling. However, because sampling trips by run-piece is about three to four times less costly than random sampling of trips (because return trips are allowed and no time is wasted traveling between trips and waiting for trips), cluster sampling is estimated to cost only one-half to two-thirds as much as simple random sampling.
Kish's deft was also calculated for each of the four strata separately. The results, displayed in Table 8, show that cluster sampling produces little if any savings in the strata of low volume lines and express lines, where the per cluster COV is about the same as the per trip COV (implying that it is just as good to sample a trip as it is to sample a cluster of trips).
Under a separate UMTA Service and Methods Demonstration also performed by Multisystems, Inc., cluster sampling was compared with simple random sampling for estimating line-specific and LID/IP-specific averages. The data were ride checks done intensively by run-piece on selected Pittsburgh routes in spring 1984. For these purposes, a cluster was defined as a group of trips on the same line in the same driver run. Because many of the clusters in the dataset consisted of only two or three trips, and because the intent was to determine the
113
TABLE 8 COMPARISON OF CLUSTER AND SIMPLE RANDOM SAMPLING, SCRTD
Simple Random
Cluster Sampling Sampling Clusters Trips Trips
Stratum Needed Needed Needed def!
Requirements to Achieve 10 Percent Precision for Each Stratum
Express 390 935 223 4.2 Local
Low 216 1,297 322 4.0 Medium 89 420 173 2.4 High 45 181 115 1.6
Requirements to Achieve 10 Percent Precision at the System Level
Express 17 41 18 Local
Low 4 24 7 Medium 23 108 43 High 36 144 -11
Total 317 145 2.2
effect of sampling in larger clusters, only clusters of four or more trips were admitted. There were 18 routes with at least eight such clusters (mean = 40 clusters per route). The mean cluster size was 5.0, as four- and five-trip clusters accounted for 75 percent of all the clusters with at least four trips. This average seems to indjcate either a practice of sampling runpieces of 3 to 4 hours or that runs are interlined and therefore each run produces two or more smaller clusters.
The results for line-specific estimates are summarized in Table 9. Two ratios, boardings/maximum load and passenger-
TABLE 9 DESIGN EFFECT DUE TO SAMPLING BY RUN FOR ROUTE LEVEL STATISTICS
Standard Mean Deviation Min Max Mean
Statistic def! of def! def! def! rhoa
Ratio: boardings/ maximum load 1.24 0.31 0.70 1.84 0.056
Ratio: pass-mi/ maximum load 1.10 0.40 0.38 1.80 O.Q18
Mean boardings 1.32 0.67 0.12 3.20 0.065
NoTE: Mean cluster size = 5.0 (min = 4, max = 16, COV = 0.26). Mean number of cluslers per route = 39.8 (min = 10, max = 97). Nwnber of routes = 18. arho = intracluster correlation.
TABLE 10 ESTIMATED DESIGN EFFECT FOR SAMPLING BY RUN-PIECE FOR ROUTE LEVEL STATISTICS
Average Number Ratio of Ratio of Pass-of One-Way Trips Boardings/ Miles/Max Mean per Run-Piece Max Load Load Boardings
3 1.15 1.10 1.20 5 1.30 1.15 1.40
10 1.60 1.25 1.75 15 2.00 1.35 2.20

114 TRANSPORTATION RESEARCH RECORD 1165
TABLE 11 DESIGN EFFECT AS A RESULT OF SAMPLING BY RUN FOR LINE/DIRECTION{fIME PERIOD STATISTICS
Standard Number of Mean Deviation
Time Period L/DffPs de ff of def! Min def! Max def! Mean rhoa
Early a.m 4 0.96 0.18 0.78 1.21 -0.03 Peak a.m. 5 0.60 0.35 0.40 1.22 -0.40 Base 25 1.00 0.33 0.52 1.60 -0.01 Peak p.m. 3 1.29 0.36 1.00 1.69 0.29 Evening 7 0.71 0.33 0.16 1.10 -0.22 Saturday 15 1.19 0.43 0.56 1.75 0.11 Sunday 10 1.10 0.29 0.62 1.72 0.06 Overall 69 1.01 0.38 0.16 1.75 -0.01
Norn: Statistic = ratio of boardings/max load. Mean cluster size = 2.3 (min = 2, max = 8, COV = 0.18). Mean number of clusters per L/D/TP = 13.6 (min = 8, max= 33). arho = intcluster correlation.
miles/maximwn load, were examined, along with one mean, boardings. The average design effect is moderate, calling for sample size increases of 10 to 32 percent. However, the variation is quite wide, especially for mean boardings, where def! varies from 0.12 for one route to 3.20 for another. The range for the ratios is smaller, with the highest def! calculated to be 1.84.
The results were extended to cover situations of different average cluster size. The average design effect was calculated using the measures of intracluster correlation (rho) and COV of cluster size calculated from the Pittsburgh data. The resulting figures were then inflated a little to make them somewhat conservative, considering the large amount of variation between routes. The resulting reconunended design effects are given in Table 10. As the results indicate, the design effect becomes quite large as cluster size increases. Since sampling run-pieces of around five trips captures most of the cost savings of sampling by run, sampling by half-run appears to be more efficient than sampling by entire run.
The impact of cluster sampling in estimating mearis and ratios at the line/direction/time period level was also investigated. Since runs do not usually contain more than a few trips in a given direction in a given time period, clusters are very small. In the Pittsburgh data, there were 69 L/D/TPs with at least eight clusters; average cluster size was 2.3. The results for the ratio of boardings to maximum load are presented in Table 11.
The overall average def! was 1.0, indicating a neutral effect of sampling by run. As expected, a larger design effect was observed in the all-day weekend periods (average def!= 1.19 for Saturday, 1.10 for Sunday), which have larger clusters. The greatest def! for a single L/D/TP was 1.75. A further test showed no difference between the average def! for better patronized L/D/TPs (mean peak load greater than 25) and less well patronized L/D/TPs. Because of the small cluster sizes and
neutral design effect found for the L/D/TP-level boardings per maximum load ratio, no further investigation for L/D/TP-level statistics was done.
Based on these results, it seems safe to say that cluster sampling for L/D/TP level statistics can be considered Lo be just as good as simple random sampling for weekday lime periods. For all-day weekend periods, sample size should be increased by 20 percent. This additional burden is still small, however, in comparison with the inefficiencies of simple random sampling by trip.
ACKNOWLEDGMENT
The research reported here was funded in part by UMTA.
REFERENCES
1. Sampling Procedures for Obtaining Pixed Ro111e Bus OperaJing Dala Required Under the Section 15 Reporting System. Circular UMTA-C-2710.1. UMTA, U.S. Department of Transportalion, 1978.
2. Reven.ue Based Sampling Procedures for Obtaining Fixed Route Bus Operating Data Required Under !he Section J 5 Reporting System. Circular UMTA-C-2710.4. UMTA, U.S. Dcpanmcnc of Transportation, 1985.
3. P. G. Furth and B. McCollom Using Conversion Factors to Lower Transit Data Collection Costs. In Transportation Research Record 1144, TRB, National Research Council, Washington, D.C., 1987, pp. 1-6.
4. W. G. Cochran. Sampling Techniques, 3rd ed. John Wiley & Sons, Inc., New York, N.Y., 1977.
5. Mullisystems Inc. Enhancing Patronage Estimation and line Performance Monitoring Procedures. Southern California Ra·pid Transit District, Los Angeles, 1987.
Publication of this paper sponsored by Cammi/lee on Public Transporta· lion Marketing and Fare Policy.
Related Documents