CLUSTER REPORT Justice NSW | PMES 2018 | NF0000

Welcome message from author
This document is posted to help you gain knowledge. Please leave a comment to let me know what you think about it! Share it to your friends and learn new things together.
Transcript
CLUSTER REPORT
Justice
NSW | PMES 2018 | NF0000
HEADLINESRESPONSERATE
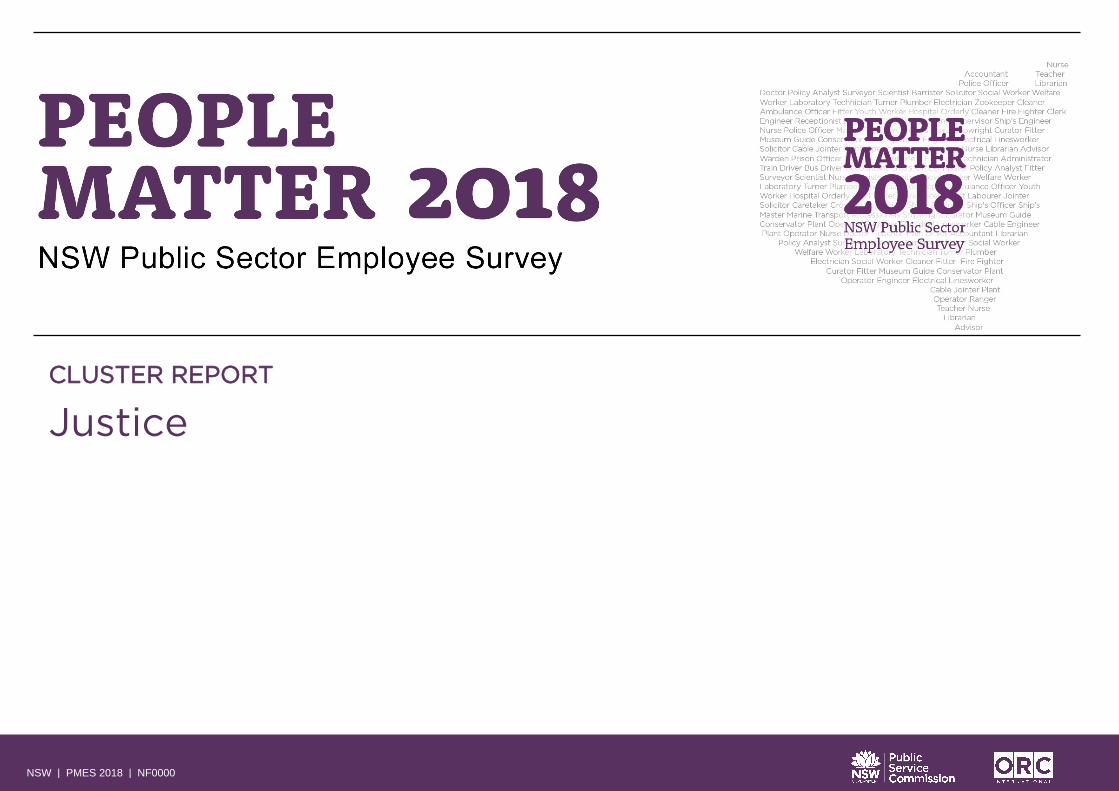
37%15,510 OF 41,523 RESPONDENTS
EMPLOYEE ENGAGEMENT
62%DIFFERENCE FROM 2017 0DIFFERENCE FROM PUBLIC SECTOR -4
QUESTIONS ARE GROUPED INTO TOPICS IN THIS REPORT.
ENGAGEMENT WITH WORK
66%DIFFERENCE FROM 2017 -1DIFFERENCE FROM PUBLIC SECTOR -6
SENIORMANAGERS
40%DIFFERENCE FROM 2017 +1DIFFERENCE FROM PUBLIC SECTOR -9
COMMUNICATION
54%DIFFERENCE FROM 2017 +1DIFFERENCE FROM PUBLIC SECTOR -8
HIGHPERFORMANCE
56%DIFFERENCE FROM 2017 0DIFFERENCE FROM PUBLIC SECTOR -9
This page compares the aggregate or individual scores for key topics. The individual questions in each group are listed in the All Questions section.
The Employee Engagement index is weighted. It cannot be compared to the other scores which are the average of the % agreement results (strongly agree and agree scores).
PUBLIC SECTOR VALUES
53%DIFFERENCE FROM 2017 0DIFFERENCE FROM PUBLIC SECTOR -9
DIVERSITY & INCLUSION
63%DIFFERENCE FROM PUBLIC SECTOR -5
FLEXIBLE WORKING SATISFACTION
60%DIFFERENCE FROM 2017 +2DIFFERENCE FROM PUBLIC SECTOR +1
ACTION ONRESULTS
28%DIFFERENCE FROM 2017 +2DIFFERENCE FROM PUBLIC SECTOR -8
Response Rate: some entities exceed 100% where responses were greater than the employee headcount. This is thought to be primarily due to employees selecting the wrong work location in the survey
ORC International | www.orcinternational.comPAGE 02NSW PMES 2018
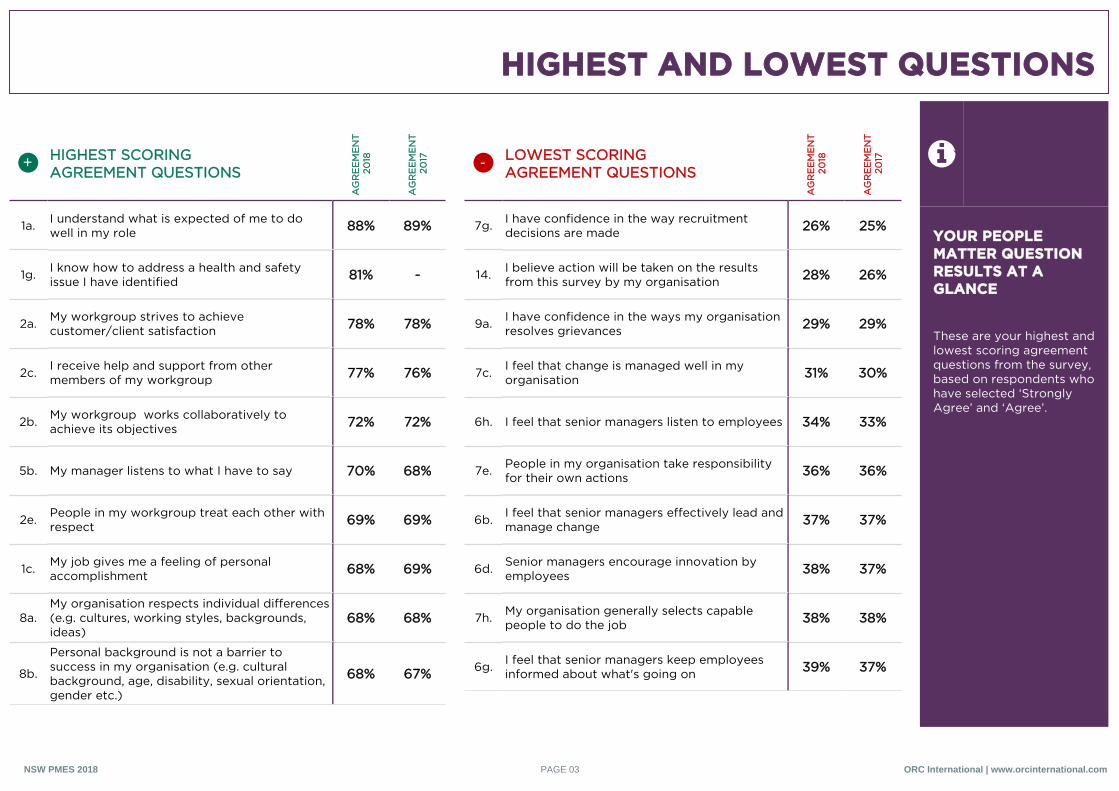
HIGHEST AND LOWEST QUESTIONS
l+ HIGHEST SCORINGAGREEMENT QUESTIONS
AG
RE
EM
EN
T
2018
AG
RE
EM
EN
T
2017
1a. I understand what is expected of me to do well in my role 88% 89%
1g. I know how to address a health and safety issue I have identified 81% -
2a. My workgroup strives to achieve customer/client satisfaction 78% 78%
2c. I receive help and support from other members of my workgroup 77% 76%
2b. My workgroup works collaboratively to achieve its objectives 72% 72%
5b. My manager listens to what I have to say 70% 68%
2e. People in my workgroup treat each other with respect 69% 69%
1c. My job gives me a feeling of personal accomplishment 68% 69%
8a.My organisation respects individual differences (e.g. cultures, working styles, backgrounds, ideas)
68% 68%
8b.
Personal background is not a barrier to success in my organisation (e.g. cultural background, age, disability, sexual orientation, gender etc.)
68% 67%
l- LOWEST SCORINGAGREEMENT QUESTIONS
AG
RE
EM
EN
T
2018
AG
RE
EM
EN
T
2017
7g. I have confidence in the way recruitment decisions are made 26% 25%
14. I believe action will be taken on the results from this survey by my organisation 28% 26%
9a. I have confidence in the ways my organisation resolves grievances 29% 29%
7c. I feel that change is managed well in my organisation 31% 30%
6h. I feel that senior managers listen to employees 34% 33%
7e. People in my organisation take responsibility for their own actions 36% 36%
6b. I feel that senior managers effectively lead and manage change 37% 37%
6d. Senior managers encourage innovation by employees 38% 37%
7h. My organisation generally selects capable people to do the job 38% 38%
6g. I feel that senior managers keep employees informed about what's going on 39% 37%
YOUR PEOPLE MATTER QUESTION RESULTS AT A GLANCE
These are your highest and lowest scoring agreement questions from the survey, based on respondents who have selected ‘Strongly Agree’ and ‘Agree’.
ORC International | www.orcinternational.comPAGE 03NSW PMES 2018
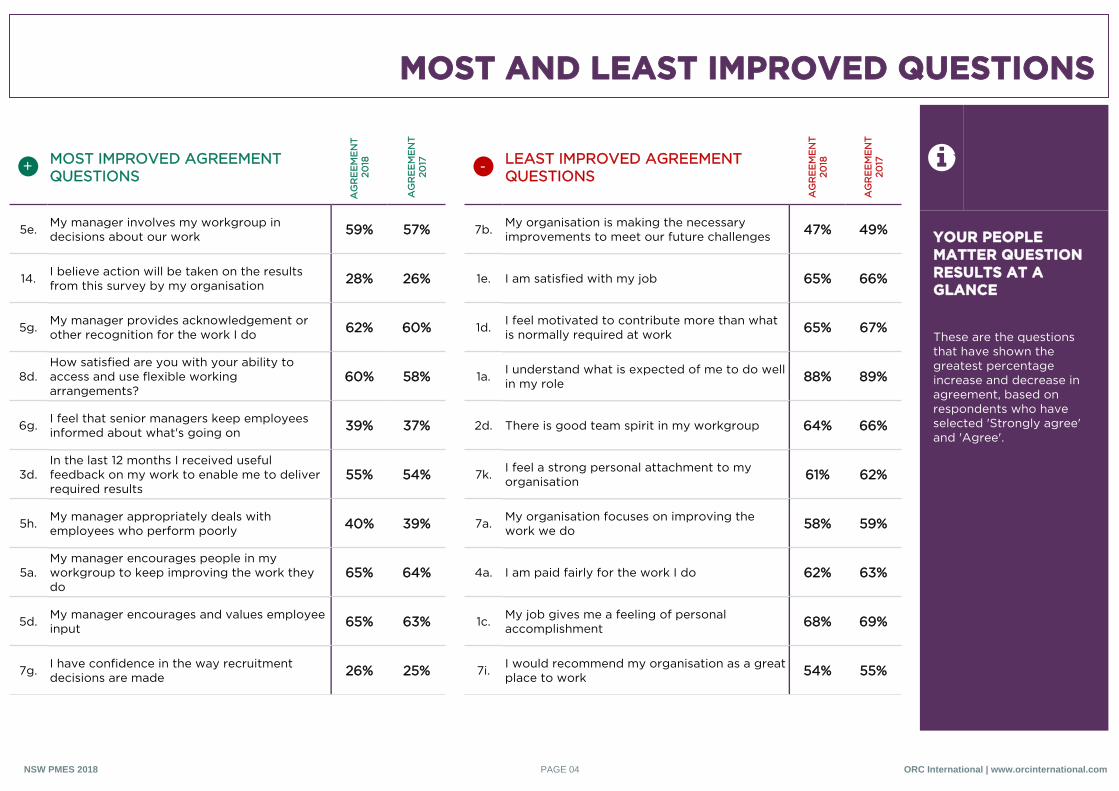
MOST AND LEAST IMPROVED QUESTIONS
l+ MOST IMPROVED AGREEMENT QUESTIONS
AG
RE
EM
EN
T
2018
AG
RE
EM
EN
T20
17
5e. My manager involves my workgroup in decisions about our work 59% 57%
14. I believe action will be taken on the results from this survey by my organisation 28% 26%
5g. My manager provides acknowledgement or other recognition for the work I do 62% 60%
8d.How satisfied are you with your ability to access and use flexible working arrangements?
60% 58%
6g. I feel that senior managers keep employees informed about what's going on 39% 37%
3d.In the last 12 months I received useful feedback on my work to enable me to deliver required results
55% 54%
5h. My manager appropriately deals with employees who perform poorly 40% 39%
5a.My manager encourages people in my workgroup to keep improving the work they do
65% 64%
5d. My manager encourages and values employee input 65% 63%
7g. I have confidence in the way recruitment decisions are made 26% 25%
l- LEAST IMPROVED AGREEMENT QUESTIONS
AG
RE
EM
EN
T
2018
AG
RE
EM
EN
T20
17
7b. My organisation is making the necessary improvements to meet our future challenges 47% 49%
1e. I am satisfied with my job 65% 66%
1d. I feel motivated to contribute more than what is normally required at work 65% 67%
1a. I understand what is expected of me to do well in my role 88% 89%
2d. There is good team spirit in my workgroup 64% 66%
7k. I feel a strong personal attachment to my organisation 61% 62%
7a. My organisation focuses on improving the work we do 58% 59%
4a. I am paid fairly for the work I do 62% 63%
1c. My job gives me a feeling of personal accomplishment 68% 69%
7i. I would recommend my organisation as a great place to work 54% 55%
YOUR PEOPLE MATTER QUESTION RESULTS AT A GLANCE
These are the questions that have shown the greatest percentage increase and decrease in agreement, based on respondents who have selected 'Strongly agree' and 'Agree'.
ORC International | www.orcinternational.comPAGE 04NSW PMES 2018
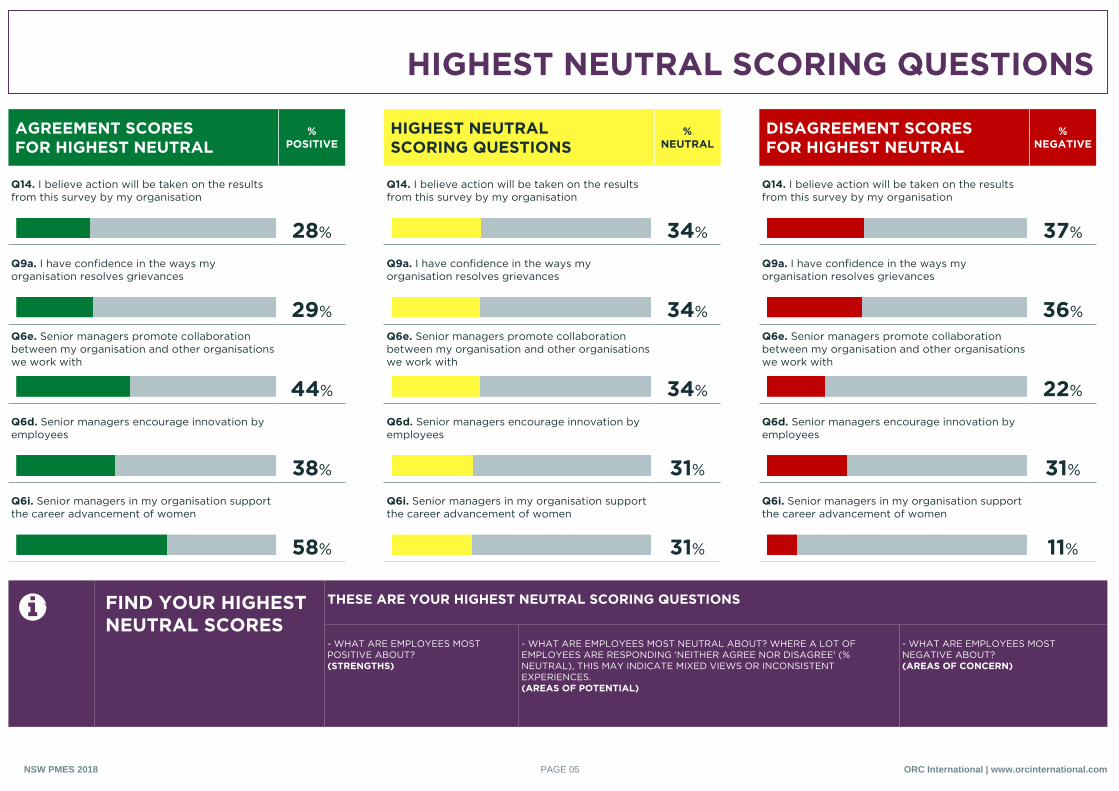
HIGHEST NEUTRAL SCORING QUESTIONS
AGREEMENT SCORESFOR HIGHEST NEUTRAL
%POSITIVE
Q14. I believe action will be taken on the results from this survey by my organisation
28%
Q9a. I have confidence in the ways my organisation resolves grievances
29%Q6e. Senior managers promote collaboration between my organisation and other organisations we work with
44%
Q6d. Senior managers encourage innovation by employees
38%
Q6i. Senior managers in my organisation support the career advancement of women
58%
HIGHEST NEUTRALSCORING QUESTIONS
%NEUTRAL
Q14. I believe action will be taken on the results from this survey by my organisation
34%
Q9a. I have confidence in the ways my organisation resolves grievances
34%Q6e. Senior managers promote collaboration between my organisation and other organisations we work with
34%
Q6d. Senior managers encourage innovation by employees
31%
Q6i. Senior managers in my organisation support the career advancement of women
31%
DISAGREEMENT SCORES FOR HIGHEST NEUTRAL
%NEGATIVE
Q14. I believe action will be taken on the results from this survey by my organisation
37%
Q9a. I have confidence in the ways my organisation resolves grievances
36%Q6e. Senior managers promote collaboration between my organisation and other organisations we work with
22%
Q6d. Senior managers encourage innovation by employees
31%
Q6i. Senior managers in my organisation support the career advancement of women
11%
FIND YOUR HIGHEST NEUTRAL SCORES
THESE ARE YOUR HIGHEST NEUTRAL SCORING QUESTIONS
- WHAT ARE EMPLOYEES MOST POSITIVE ABOUT?(STRENGTHS)
- WHAT ARE EMPLOYEES MOST NEUTRAL ABOUT? WHERE A LOT OF EMPLOYEES ARE RESPONDING 'NEITHER AGREE NOR DISAGREE' (% NEUTRAL), THIS MAY INDICATE MIXED VIEWS OR INCONSISTENT EXPERIENCES.(AREAS OF POTENTIAL)
- WHAT ARE EMPLOYEES MOST NEGATIVE ABOUT?(AREAS OF CONCERN)
ORC International | www.orcinternational.comPAGE 05NSW PMES 2018
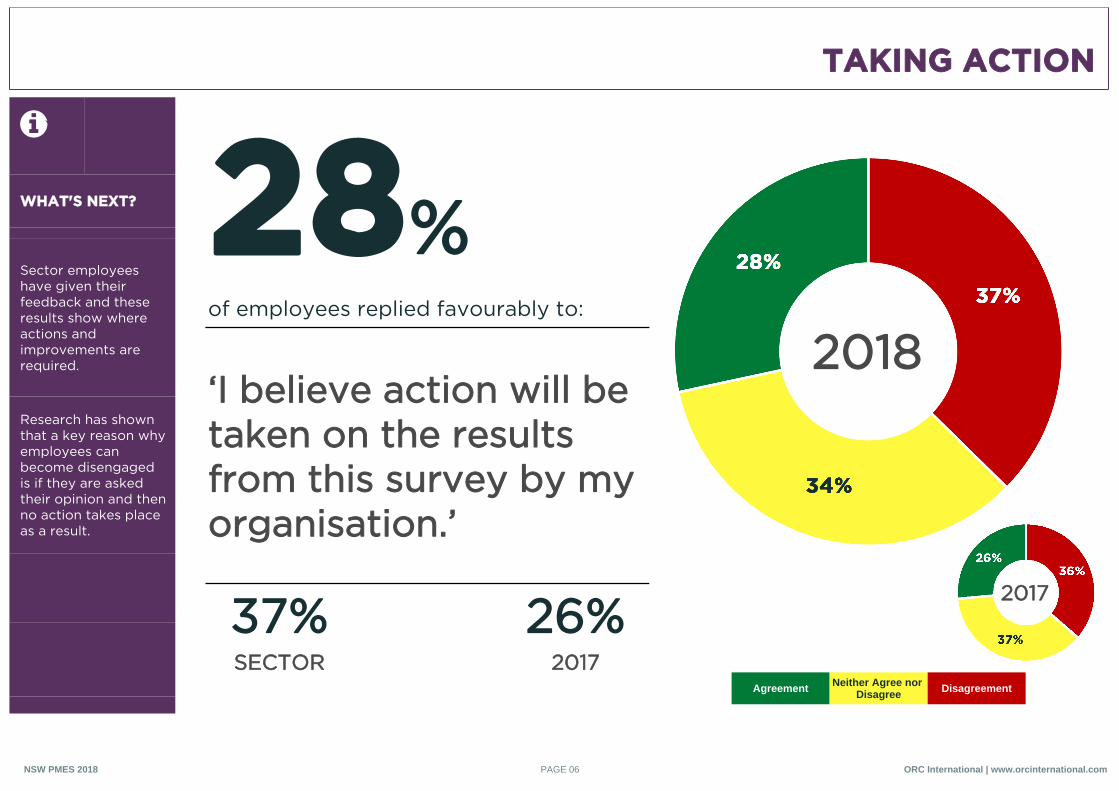
TAKING ACTION
WHAT'S NEXT?
Sector employees have given their feedback and these results show where actions and improvements are required.
Research has shown that a key reason why employees can become disengaged is if they are asked their opinion and then no action takes place as a result.
28%of employees replied favourably to:
‘I believe action will be taken on the results from this survey by my organisation.’
37% 26%SECTOR 2017
2017
2018
Agreement Neither Agree nor Disagree Disagreement
ORC International | www.orcinternational.comPAGE 06NSW PMES 2018
KEY DRIVERS OF ENGAGEMENT
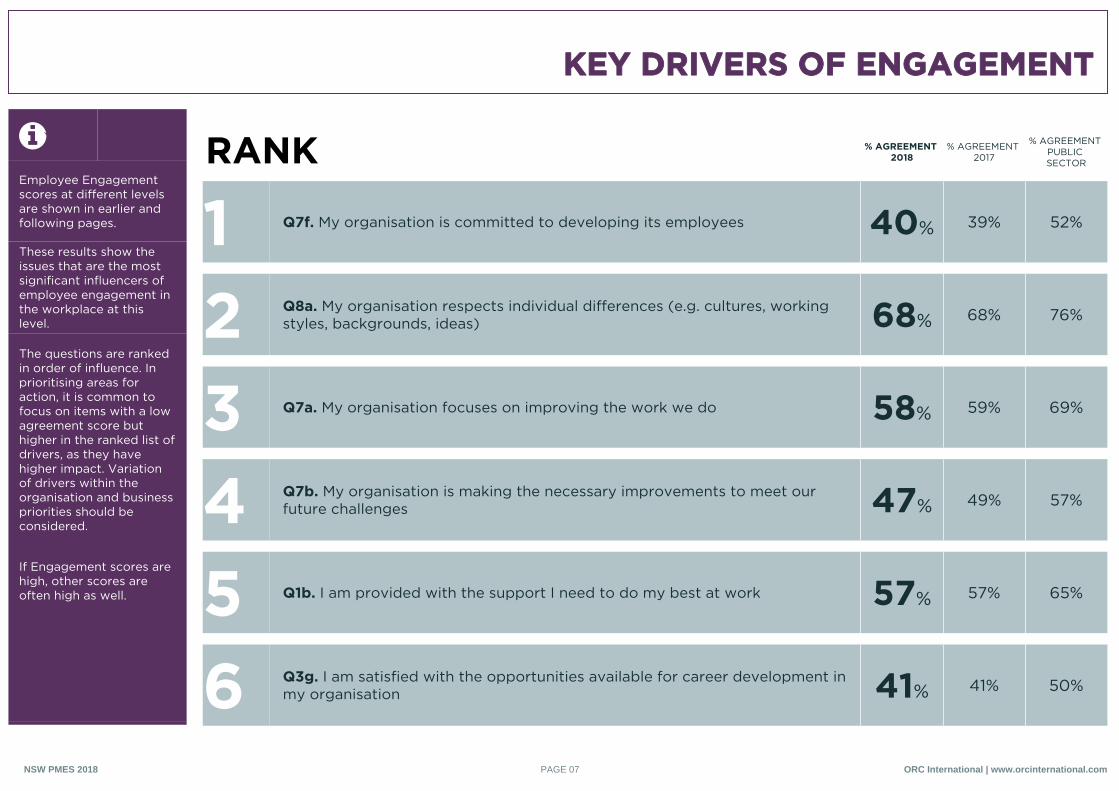
Employee Engagement scores at different levels are shown in earlier and following pages.
These results show the issues that are the most significant influencers of employee engagement in the workplace at this level.
The questions are ranked in order of influence. In prioritising areas for action, it is common to focus on items with a low agreement score but higher in the ranked list of drivers, as they have higher impact. Variation of drivers within the organisation and business priorities should be considered.
If Engagement scores are high, other scores are often high as well.
RANK % AGREEMENT 2018
% AGREEMENT 2017
% AGREEMENT PUBLIC SECTOR
1 Q7f. My organisation is committed to developing its employees 40% 39% 52%
2 Q8a. My organisation respects individual differences (e.g. cultures, working styles, backgrounds, ideas) 68% 68% 76%
3 Q7a. My organisation focuses on improving the work we do 58% 59% 69%
4 Q7b. My organisation is making the necessary improvements to meet our future challenges 47% 49% 57%
5 Q1b. I am provided with the support I need to do my best at work 57% 57% 65%
6 Q3g. I am satisfied with the opportunities available for career development in my organisation 41% 41% 50%
ORC International | www.orcinternational.comPAGE 07NSW PMES 2018
CLUSTER COMPARISON
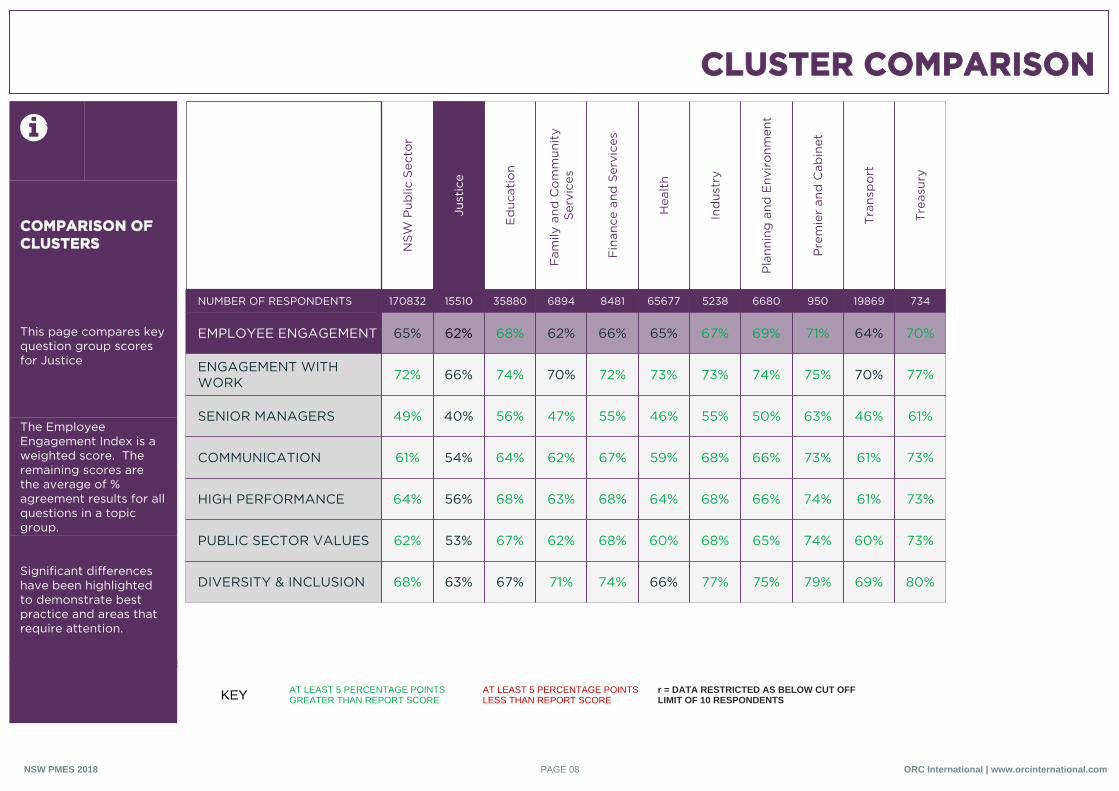
COMPARISON OF CLUSTERS
This page compares key question group scores for Justice
The Employee Engagement Index is a weighted score. The remaining scores are the average of % agreement results for all questions in a topic group.
Significant differences have been highlighted to demonstrate best practice and areas that require attention.
NS
W P
ublic
Sec
tor
Just
ice
Ed
ucat
ion
Fam
ily a
nd C
om
mun
ity
Ser
vice
s
Fin
ance
and
Ser
vice
s
Hea
lth
Ind
ustr
y
Pla
nnin
g a
nd E
nvir
onm
ent
Pre
mie
r an
d C
abin
et
Tra
nsp
ort
Tre
asur
y
NUMBER OF RESPONDENTS 170832 15510 35880 6894 8481 65677 5238 6680 950 19869 734
EMPLOYEE ENGAGEMENT 65% 62% 68% 62% 66% 65% 67% 69% 71% 64% 70%
ENGAGEMENT WITH WORK 72% 66% 74% 70% 72% 73% 73% 74% 75% 70% 77%
SENIOR MANAGERS 49% 40% 56% 47% 55% 46% 55% 50% 63% 46% 61%
COMMUNICATION 61% 54% 64% 62% 67% 59% 68% 66% 73% 61% 73%
HIGH PERFORMANCE 64% 56% 68% 63% 68% 64% 68% 66% 74% 61% 73%
PUBLIC SECTOR VALUES 62% 53% 67% 62% 68% 60% 68% 65% 74% 60% 73%
DIVERSITY & INCLUSION 68% 63% 67% 71% 74% 66% 77% 75% 79% 69% 80%
KEY AT LEAST 5 PERCENTAGE POINTS GREATER THAN REPORT SCORE
AT LEAST 5 PERCENTAGE POINTS LESS THAN REPORT SCORE
r = DATA RESTRICTED AS BELOW CUT OFF LIMIT OF 10 RESPONDENTS
ORC International | www.orcinternational.comPAGE 08NSW PMES 2018
AGENCY COMPARISON
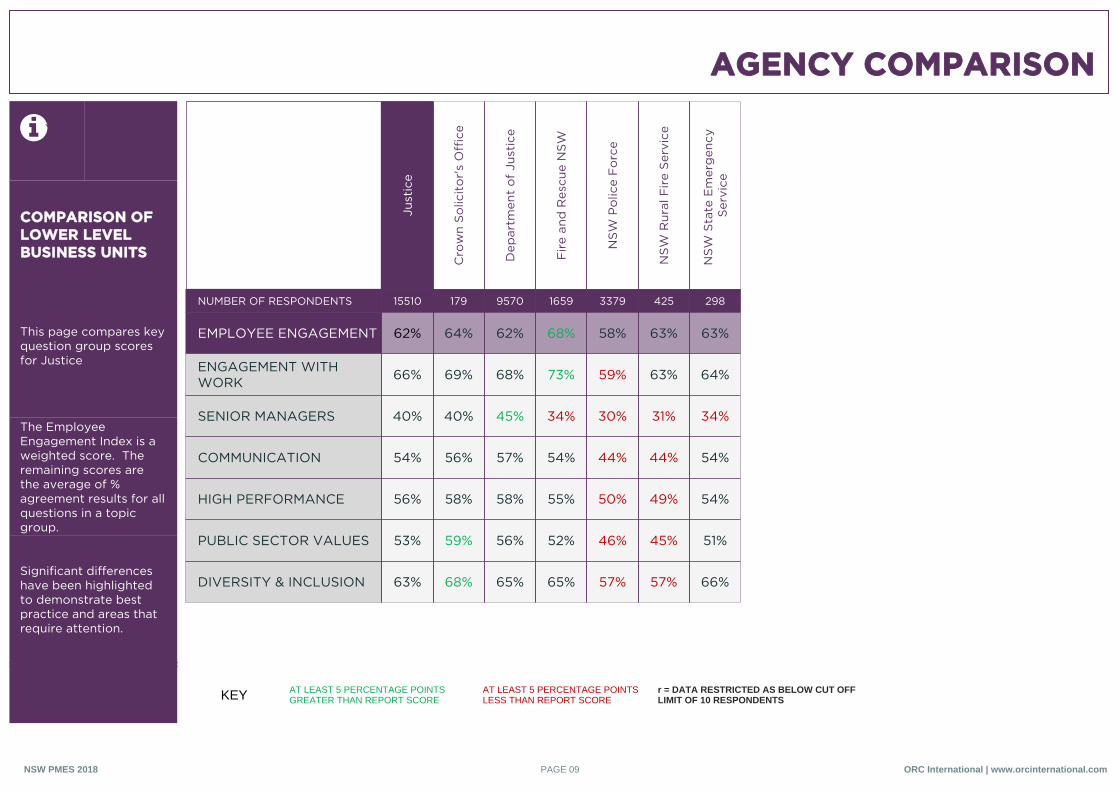
COMPARISON OF LOWER LEVEL BUSINESS UNITS
This page compares key question group scores for Justice
The Employee Engagement Index is a weighted score. The remaining scores are the average of % agreement results for all questions in a topic group.
Significant differences have been highlighted to demonstrate best practice and areas that require attention.
Just
ice
Cro
wn
So
licit
or'
s O
ffic
e
Dep
artm
ent
of
Just
ice
Fir
e an
d R
escu
e N
SW
NS
W P
olic
e F
orc
e
NS
W R
ural
Fir
e S
ervi
ce
NS
W S
tate
Em
erg
ency
S
ervi
ce
NUMBER OF RESPONDENTS 15510 179 9570 1659 3379 425 298
EMPLOYEE ENGAGEMENT 62% 64% 62% 68% 58% 63% 63%
ENGAGEMENT WITH WORK 66% 69% 68% 73% 59% 63% 64%
SENIOR MANAGERS 40% 40% 45% 34% 30% 31% 34%
COMMUNICATION 54% 56% 57% 54% 44% 44% 54%
HIGH PERFORMANCE 56% 58% 58% 55% 50% 49% 54%
PUBLIC SECTOR VALUES 53% 59% 56% 52% 46% 45% 51%
DIVERSITY & INCLUSION 63% 68% 65% 65% 57% 57% 66%
KEY AT LEAST 5 PERCENTAGE POINTS GREATER THAN REPORT SCORE
AT LEAST 5 PERCENTAGE POINTS LESS THAN REPORT SCORE
r = DATA RESTRICTED AS BELOW CUT OFF LIMIT OF 10 RESPONDENTS
ORC International | www.orcinternational.comPAGE 09NSW PMES 2018
ALL QUESTIONS
EXPLORE THE FULL RESULTS
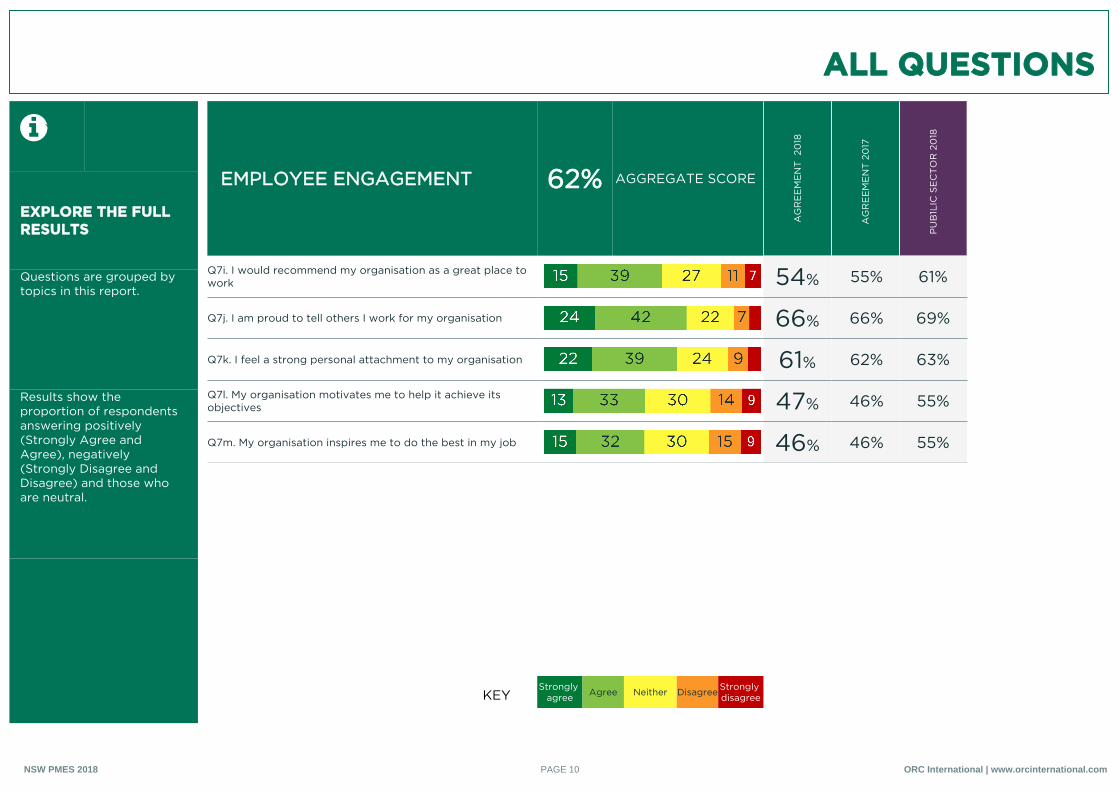
Questions are grouped by topics in this report.
Results show the proportion of respondents answering positively (Strongly Agree and Agree), negatively (Strongly Disagree and Disagree) and those who are neutral.
EMPLOYEE ENGAGEMENT 62% AGGREGATE SCORE
AG
RE
EM
EN
T 2
018
AG
RE
EM
EN
T 2
017
PU
B1L
IC S
EC
TO
R 2
018
Q7i. I would recommend my organisation as a great place to work 54% 55% 61%
Q7j. I am proud to tell others I work for my organisation 66% 66% 69%
Q7k. I feel a strong personal attachment to my organisation 61% 62% 63%
Q7l. My organisation motivates me to help it achieve its objectives 47% 46% 55%
Q7m. My organisation inspires me to do the best in my job 46% 46% 55%
KEYStrongly
agree Agree Neither Disagree Strongly disagree
ORC International | www.orcinternational.comPAGE 10NSW PMES 2018

ALL QUESTIONS
EXPLORE THE FULL RESULTS
Questions are grouped by topics in this report.
Results show the proportion of respondents answering positively (Strongly Agree and Agree), negatively (Strongly Disagree and Disagree) and those who are neutral.
ENGAGEMENT WITH WORK 66% AGGREGATE SCORE
AG
RE
EM
EN
T 2
018
AG
RE
EM
EN
T 2
017
PU
B1L
IC S
EC
TO
R 2
018
Q1c. My job gives me a feeling of personal accomplishment 68% 69% 76%
Q1d. I feel motivated to contribute more than what is normally required at work 65% 67% 72%
Q1e. I am satisfied with my job 65% 66% 69%
KEYStrongly
agree Agree Neither Disagree Strongly disagree
ORC International | www.orcinternational.comPAGE 11NSW PMES 2018
ALL QUESTIONS
EXPLORE THE FULL RESULTS
Questions are grouped by topics in this report.
Results show the proportion of respondents answering positively (Strongly Agree and Agree), negatively (Strongly Disagree and Disagree) and those who are neutral.
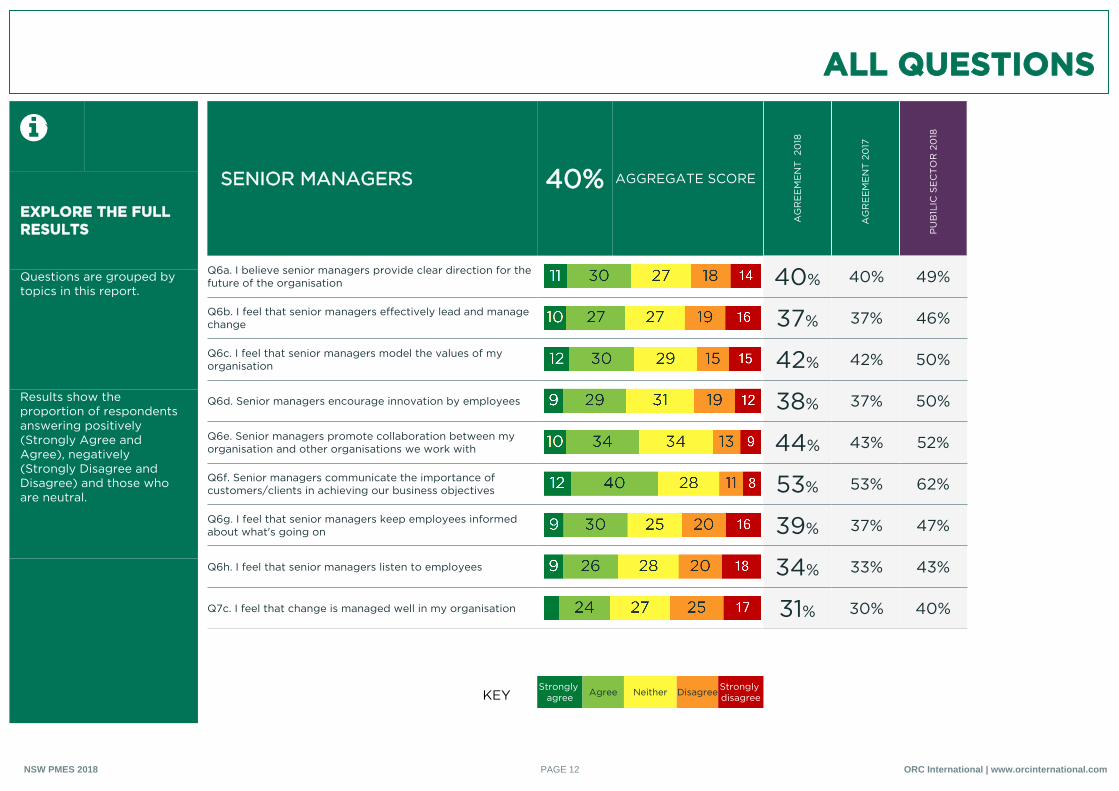
SENIOR MANAGERS 40% AGGREGATE SCORE
AG
RE
EM
EN
T 2
018
AG
RE
EM
EN
T 2
017
PU
B1L
IC S
EC
TO
R 2
018
Q6a. I believe senior managers provide clear direction for the future of the organisation 40% 40% 49%
Q6b. I feel that senior managers effectively lead and manage change 37% 37% 46%
Q6c. I feel that senior managers model the values of my organisation 42% 42% 50%
Q6d. Senior managers encourage innovation by employees 38% 37% 50%
Q6e. Senior managers promote collaboration between my organisation and other organisations we work with 44% 43% 52%
Q6f. Senior managers communicate the importance of customers/clients in achieving our business objectives 53% 53% 62%
Q6g. I feel that senior managers keep employees informed about what's going on 39% 37% 47%
Q6h. I feel that senior managers listen to employees 34% 33% 43%
Q7c. I feel that change is managed well in my organisation 31% 30% 40%
KEYStrongly
agree Agree Neither Disagree Strongly disagree
ORC International | www.orcinternational.comPAGE 12NSW PMES 2018
ALL QUESTIONS
EXPLORE THE FULL RESULTS
Questions are grouped by topics in this report.
Results show the proportion of respondents answering positively (Strongly Agree and Agree), negatively (Strongly Disagree and Disagree) and those who are neutral.
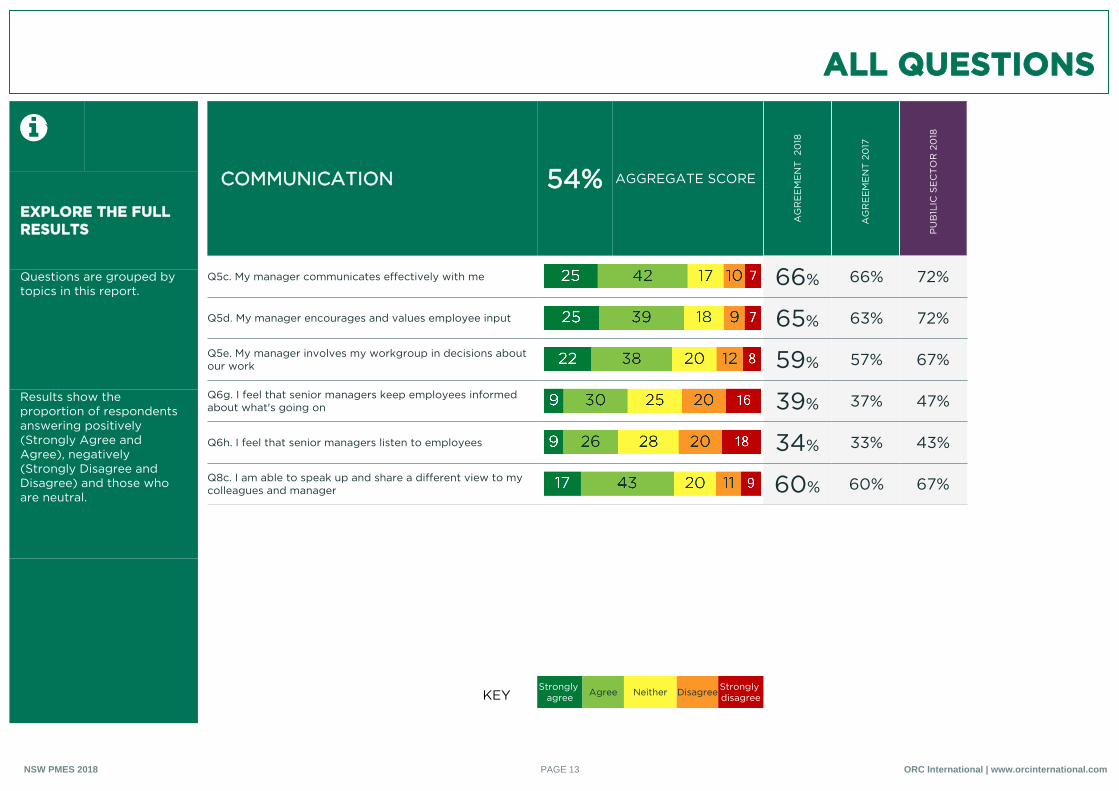
COMMUNICATION 54% AGGREGATE SCORE
AG
RE
EM
EN
T 2
018
AG
RE
EM
EN
T 2
017
PU
B1L
IC S
EC
TO
R 2
018
Q5c. My manager communicates effectively with me 66% 66% 72%
Q5d. My manager encourages and values employee input 65% 63% 72%
Q5e. My manager involves my workgroup in decisions about our work 59% 57% 67%
Q6g. I feel that senior managers keep employees informed about what's going on 39% 37% 47%
Q6h. I feel that senior managers listen to employees 34% 33% 43%
Q8c. I am able to speak up and share a different view to my colleagues and manager 60% 60% 67%
KEYStrongly
agree Agree Neither Disagree Strongly disagree
ORC International | www.orcinternational.comPAGE 13NSW PMES 2018
ALL QUESTIONS
EXPLORE THE FULL RESULTS
Questions are grouped by topics in this report.
Results show the proportion of respondents answering positively (Strongly Agree and Agree), negatively (Strongly Disagree and Disagree) and those who are neutral.
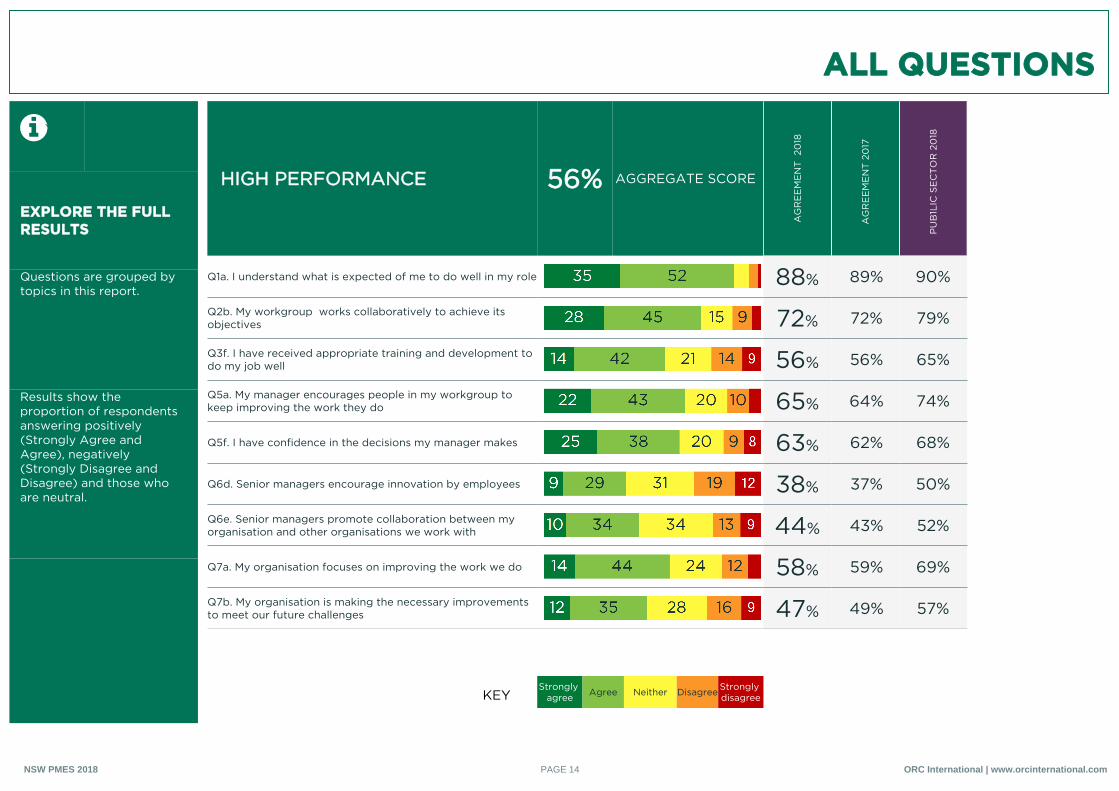
HIGH PERFORMANCE 56% AGGREGATE SCORE
AG
RE
EM
EN
T 2
018
AG
RE
EM
EN
T 2
017
PU
B1L
IC S
EC
TO
R 2
018
Q1a. I understand what is expected of me to do well in my role 88% 89% 90%
Q2b. My workgroup works collaboratively to achieve its objectives 72% 72% 79%
Q3f. I have received appropriate training and development to do my job well 56% 56% 65%
Q5a. My manager encourages people in my workgroup to keep improving the work they do 65% 64% 74%
Q5f. I have confidence in the decisions my manager makes 63% 62% 68%
Q6d. Senior managers encourage innovation by employees 38% 37% 50%
Q6e. Senior managers promote collaboration between my organisation and other organisations we work with 44% 43% 52%
Q7a. My organisation focuses on improving the work we do 58% 59% 69%
Q7b. My organisation is making the necessary improvements to meet our future challenges 47% 49% 57%
KEYStrongly
agree Agree Neither Disagree Strongly disagree
ORC International | www.orcinternational.comPAGE 14NSW PMES 2018
ALL QUESTIONS
EXPLORE THE FULL RESULTS
Questions are grouped by topics in this report.
Results show the proportion of respondents answering positively (Strongly Agree and Agree), negatively (Strongly Disagree and Disagree) and those who are neutral.
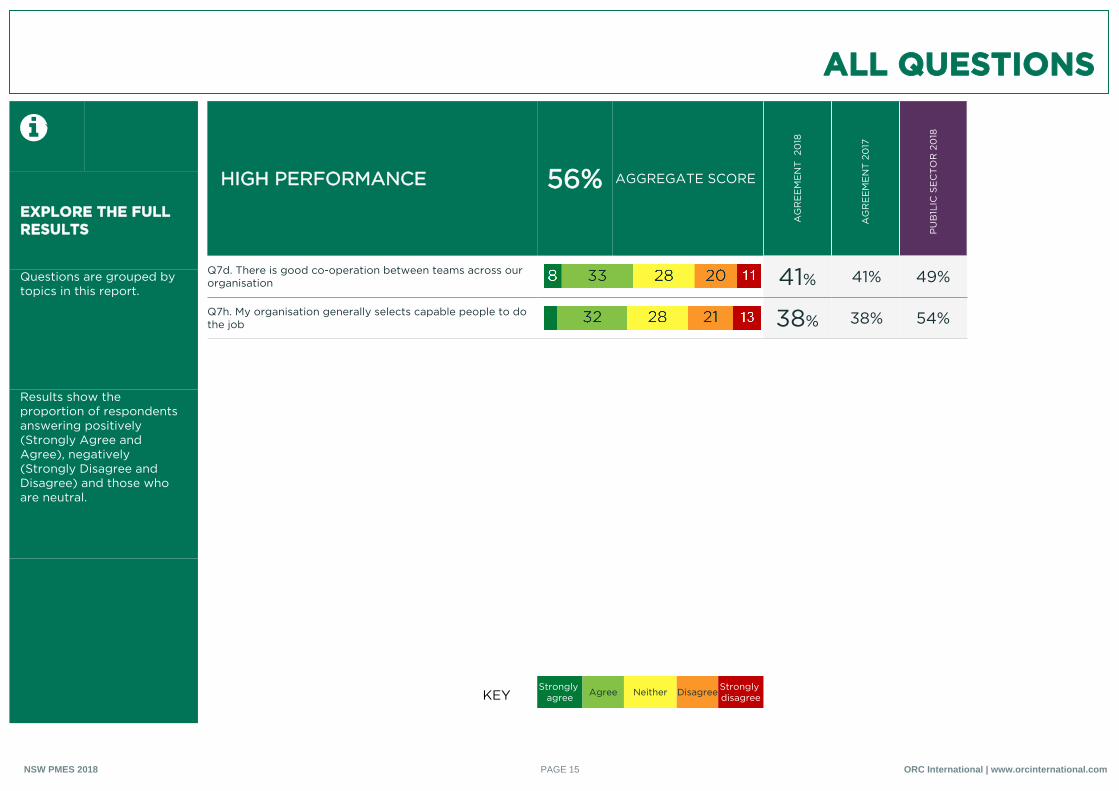
HIGH PERFORMANCE 56% AGGREGATE SCORE
AG
RE
EM
EN
T 2
018
AG
RE
EM
EN
T 2
017
PU
B1L
IC S
EC
TO
R 2
018
Q7d. There is good co-operation between teams across our organisation 41% 41% 49%
Q7h. My organisation generally selects capable people to do the job 38% 38% 54%
KEYStrongly
agree Agree Neither Disagree Strongly disagree
ORC International | www.orcinternational.comPAGE 15NSW PMES 2018
ALL QUESTIONS
EXPLORE THE FULL RESULTS
Questions are grouped by topics in this report.
Results show the proportion of respondents answering positively (Strongly Agree and Agree), negatively (Strongly Disagree and Disagree) and those who are neutral.
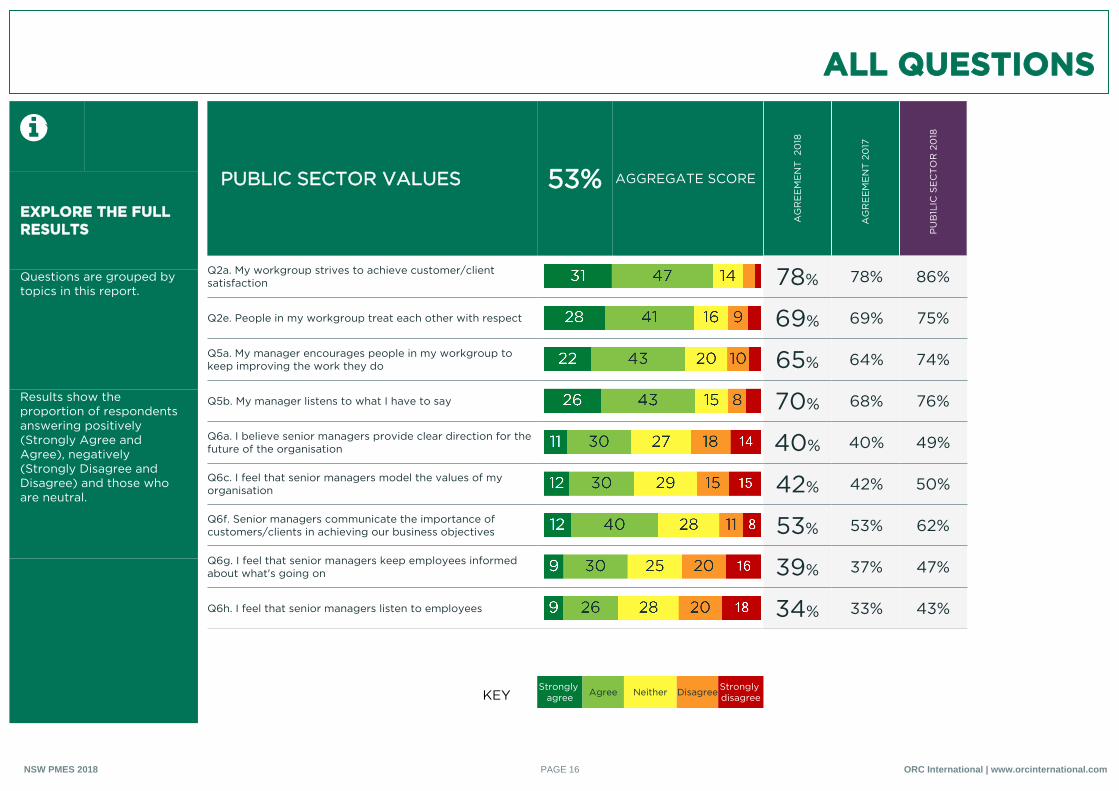
PUBLIC SECTOR VALUES 53% AGGREGATE SCORE
AG
RE
EM
EN
T 2
018
AG
RE
EM
EN
T 2
017
PU
B1L
IC S
EC
TO
R 2
018
Q2a. My workgroup strives to achieve customer/client satisfaction 78% 78% 86%
Q2e. People in my workgroup treat each other with respect 69% 69% 75%
Q5a. My manager encourages people in my workgroup to keep improving the work they do 65% 64% 74%
Q5b. My manager listens to what I have to say 70% 68% 76%
Q6a. I believe senior managers provide clear direction for the future of the organisation 40% 40% 49%
Q6c. I feel that senior managers model the values of my organisation 42% 42% 50%
Q6f. Senior managers communicate the importance of customers/clients in achieving our business objectives 53% 53% 62%
Q6g. I feel that senior managers keep employees informed about what's going on 39% 37% 47%
Q6h. I feel that senior managers listen to employees 34% 33% 43%
KEYStrongly
agree Agree Neither Disagree Strongly disagree
ORC International | www.orcinternational.comPAGE 16NSW PMES 2018

ALL QUESTIONS
EXPLORE THE FULL RESULTS
Questions are grouped by topics in this report.
Results show the proportion of respondents answering positively (Strongly Agree and Agree), negatively (Strongly Disagree and Disagree) and those who are neutral.
PUBLIC SECTOR VALUES 53% AGGREGATE SCORE
AG
RE
EM
EN
T 2
018
AG
RE
EM
EN
T 2
017
PU
B1L
IC S
EC
TO
R 2
018
Q7a. My organisation focuses on improving the work we do 58% 59% 69%
Q7e. People in my organisation take responsibility for their own actions 36% 36% 49%
KEYStrongly
agree Agree Neither Disagree Strongly disagree
ORC International | www.orcinternational.comPAGE 17NSW PMES 2018

ALL QUESTIONS
EXPLORE THE FULL RESULTS
Questions are grouped by topics in this report.
Results show the proportion of respondents answering positively (Strongly Agree and Agree), negatively (Strongly Disagree and Disagree) and those who are neutral.
DIVERSITY & INCLUSION 63% AGGREGATE SCORE
AG
RE
EM
EN
T 2
018
AG
RE
EM
EN
T 2
017
PU
B1L
IC S
EC
TO
R 2
018
Q1b. I am provided with the support I need to do my best at work 57% 57% 65%
Q5b. My manager listens to what I have to say 70% 68% 76%
Q5d. My manager encourages and values employee input 65% 63% 72%
Q6i. Senior managers in my organisation support the career advancement of women 58% 57% 60%
Q8a. My organisation respects individual differences (e.g. cultures, working styles, backgrounds, ideas) 68% 68% 76%
Q8b. Personal background is not a barrier to success in my organisation (e.g. cultural background, age, disability, sexual orientation, gender etc.)
68% 67% 75%
Q8c. I am able to speak up and share a different view to my colleagues and manager 60% 60% 67%
Q8d. How satisfied are you with your ability to access and use flexible working arrangements?Response scale Very satisfied - Very unsatisfied
60% 58% 59%
Q8e. My manager supports flexible working in my team 63% - 63%
KEYStrongly
agree Agree Neither Disagree Strongly disagree
ORC International | www.orcinternational.comPAGE 18NSW PMES 2018
ALL QUESTIONS
EXPLORE THE FULL RESULTS
Questions are grouped by topics in this report.
Results show the proportion of respondents answering positively (Strongly Agree and Agree), negatively (Strongly Disagree and Disagree) and those who are neutral.
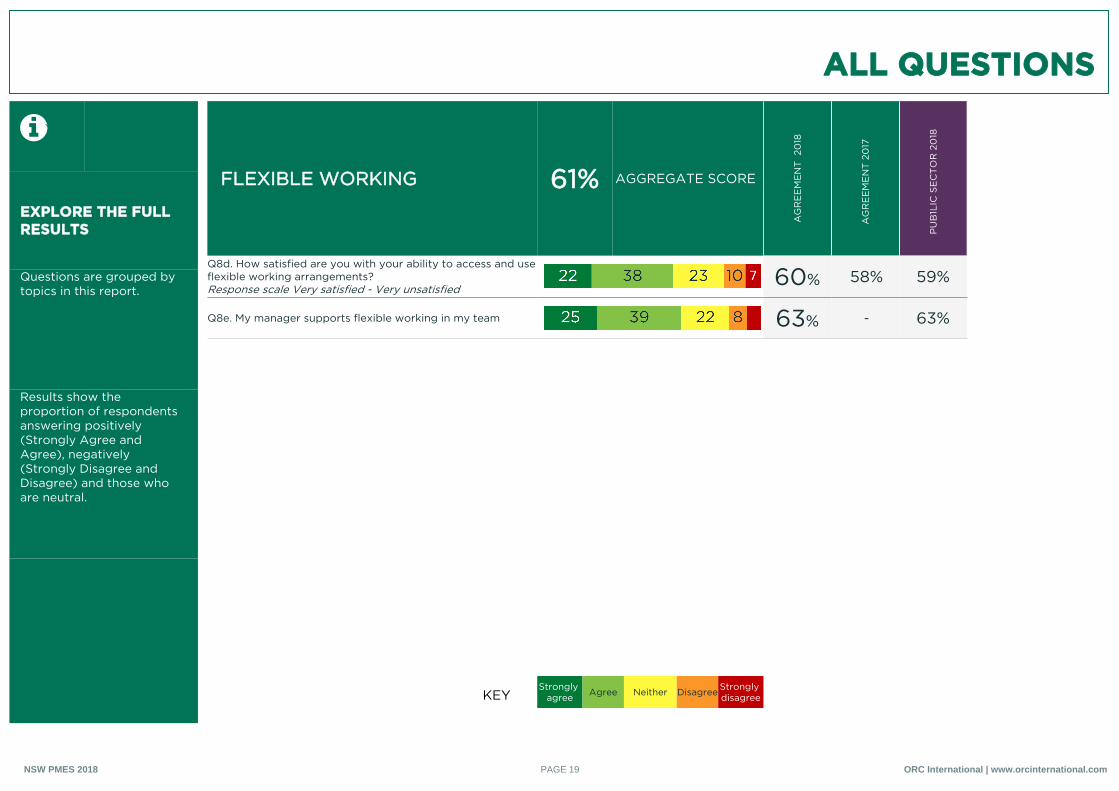
FLEXIBLE WORKING 61% AGGREGATE SCORE
AG
RE
EM
EN
T 2
018
AG
RE
EM
EN
T 2
017
PU
B1L
IC S
EC
TO
R 2
018
Q8d. How satisfied are you with your ability to access and use flexible working arrangements?Response scale Very satisfied - Very unsatisfied
60% 58% 59%
Q8e. My manager supports flexible working in my team 63% - 63%
KEYStrongly
agree Agree Neither Disagree Strongly disagree
ORC International | www.orcinternational.comPAGE 19NSW PMES 2018

ALL QUESTIONS
EXPLORE THE FULL RESULTS
Questions are grouped by topics in this report.
Results show the proportion of respondents answering positively (Strongly Agree and Agree), negatively (Strongly Disagree and Disagree) and those who are neutral.
RECRUITMENT 32% AGGREGATE SCORE
AG
RE
EM
EN
T 2
018
AG
RE
EM
EN
T 2
017
PU
B1L
IC S
EC
TO
R 2
018
Q7g. I have confidence in the way recruitment decisions are made 26% 25% 37%
Q7h. My organisation generally selects capable people to do the job 38% 38% 54%
KEYStrongly
agree Agree Neither Disagree Strongly disagree
ORC International | www.orcinternational.comPAGE 20NSW PMES 2018
ALL QUESTIONS
EXPLORE THE FULL RESULTS
Questions are grouped by topics in this report.
Results show the proportion of respondents answering positively (Strongly Agree and Agree), negatively (Strongly Disagree and Disagree) and those who are neutral.
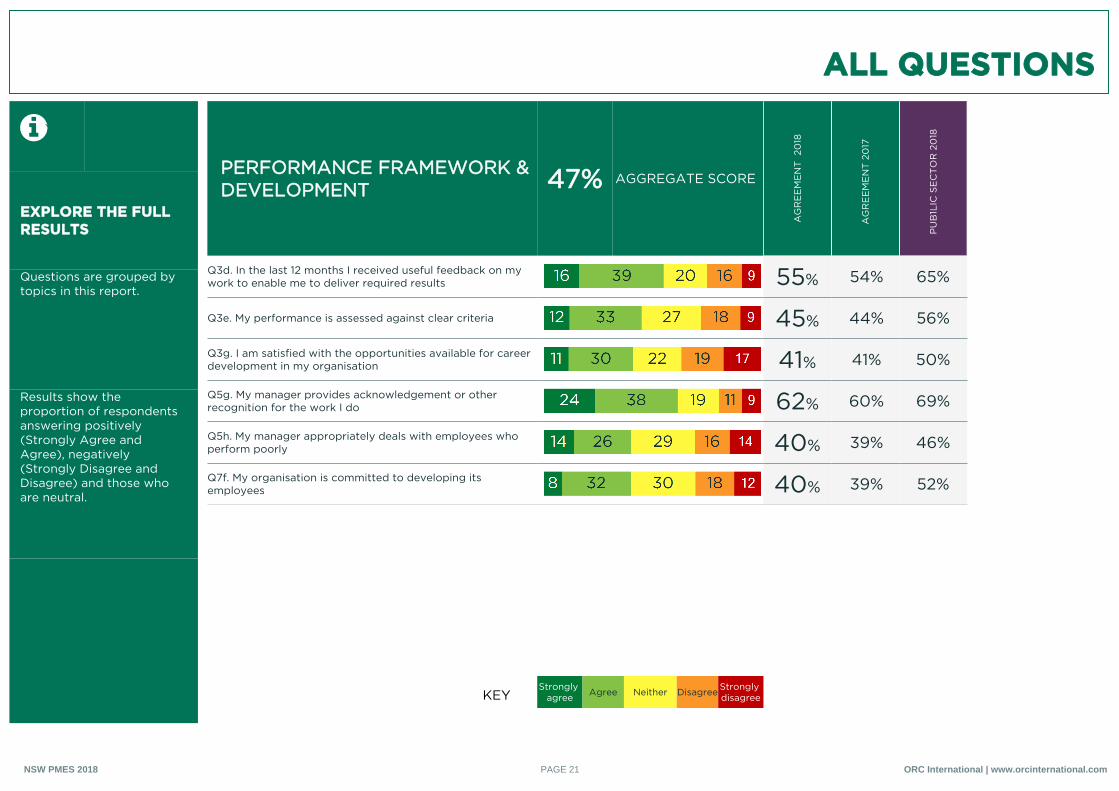
PERFORMANCE FRAMEWORK & DEVELOPMENT 47% AGGREGATE SCORE
AG
RE
EM
EN
T 2
018
AG
RE
EM
EN
T 2
017
PU
B1L
IC S
EC
TO
R 2
018
Q3d. In the last 12 months I received useful feedback on my work to enable me to deliver required results 55% 54% 65%
Q3e. My performance is assessed against clear criteria 45% 44% 56%
Q3g. I am satisfied with the opportunities available for career development in my organisation 41% 41% 50%
Q5g. My manager provides acknowledgement or other recognition for the work I do 62% 60% 69%
Q5h. My manager appropriately deals with employees who perform poorly 40% 39% 46%
Q7f. My organisation is committed to developing its employees 40% 39% 52%
KEYStrongly
agree Agree Neither Disagree Strongly disagree
ORC International | www.orcinternational.comPAGE 21NSW PMES 2018
ALL QUESTIONS
EXPLORE THE FULL RESULTS
Questions are grouped by topics in this report.
Results show the proportion of respondents answering positively (Strongly Agree and Agree), negatively (Strongly Disagree and Disagree) and those who are neutral.
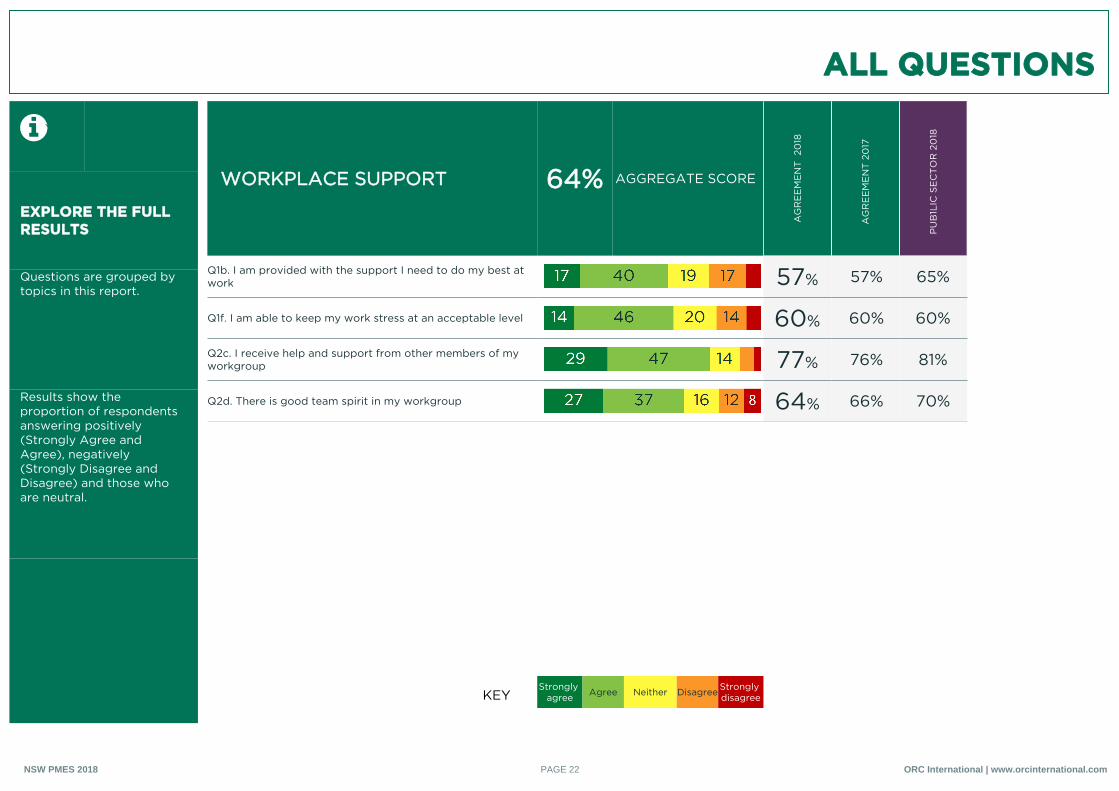
WORKPLACE SUPPORT 64% AGGREGATE SCORE
AG
RE
EM
EN
T 2
018
AG
RE
EM
EN
T 2
017
PU
B1L
IC S
EC
TO
R 2
018
Q1b. I am provided with the support I need to do my best at work 57% 57% 65%
Q1f. I am able to keep my work stress at an acceptable level 60% 60% 60%
Q2c. I receive help and support from other members of my workgroup 77% 76% 81%
Q2d. There is good team spirit in my workgroup 64% 66% 70%
KEYStrongly
agree Agree Neither Disagree Strongly disagree
ORC International | www.orcinternational.comPAGE 22NSW PMES 2018
ALL QUESTIONS
EXPLORE THE FULL RESULTS
Questions are grouped by topics in this report.
Results show the proportion of respondents answering positively (Strongly Agree and Agree), negatively (Strongly Disagree and Disagree) and those who are neutral.
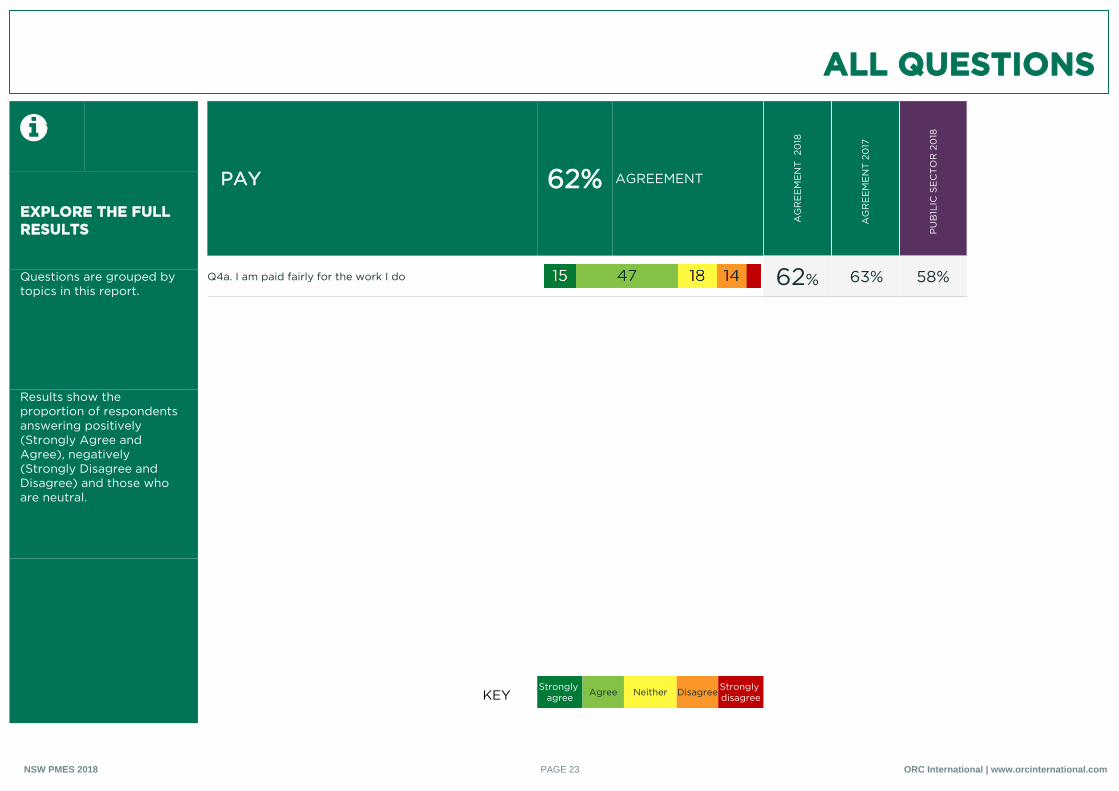
PAY 62% AGREEMENT
AG
RE
EM
EN
T 2
018
AG
RE
EM
EN
T 2
017
PU
B1L
IC S
EC
TO
R 2
018
Q4a. I am paid fairly for the work I do 62% 63% 58%
KEYStrongly
agree Agree Neither Disagree Strongly disagree
ORC International | www.orcinternational.comPAGE 23NSW PMES 2018
ALL QUESTIONS
EXPLORE THE FULL RESULTS
Questions are grouped by topics in this report.
Results show the proportion of respondents answering positively (Strongly Agree and Agree), negatively (Strongly Disagree and Disagree) and those who are neutral.
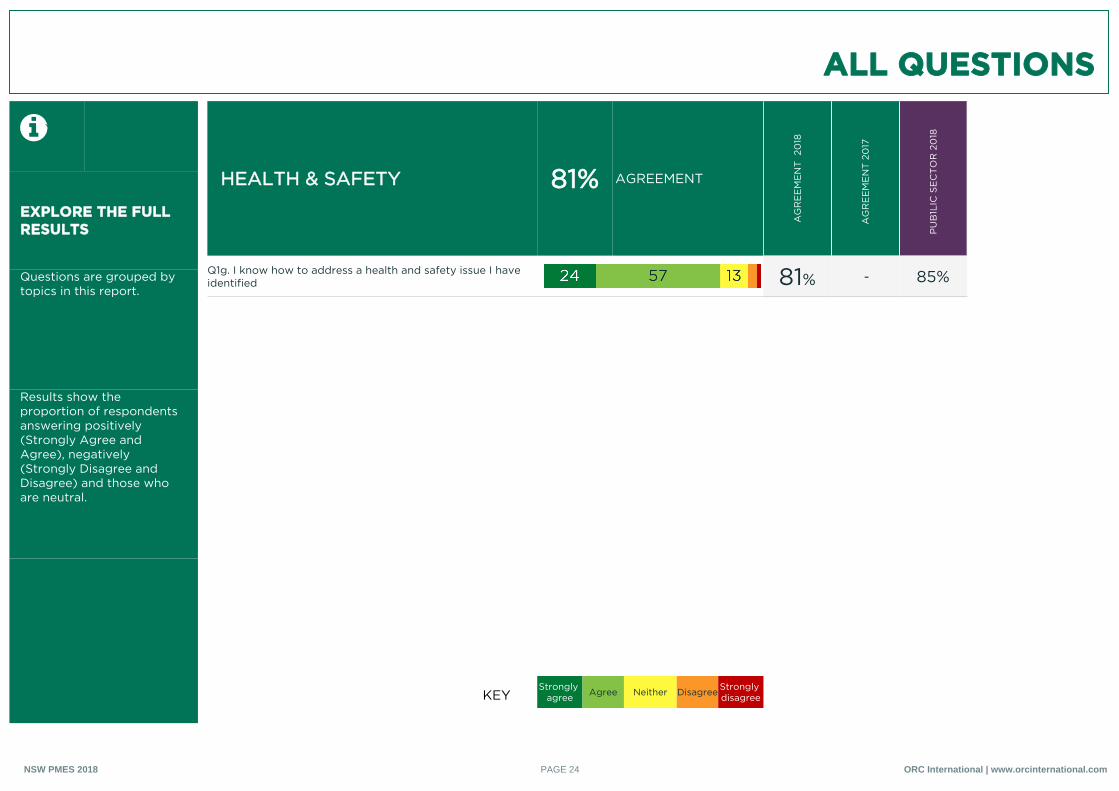
HEALTH & SAFETY 81% AGREEMENT
AG
RE
EM
EN
T 2
018
AG
RE
EM
EN
T 2
017
PU
B1L
IC S
EC
TO
R 2
018
Q1g. I know how to address a health and safety issue I have identified 81% - 85%
KEYStrongly
agree Agree Neither Disagree Strongly disagree
ORC International | www.orcinternational.comPAGE 24NSW PMES 2018
ALL QUESTIONS
EXPLORE THE FULL RESULTS
Questions are grouped by topics in this report.
Results show the proportion of respondents answering positively (Strongly Agree and Agree), negatively (Strongly Disagree and Disagree) and those who are neutral.
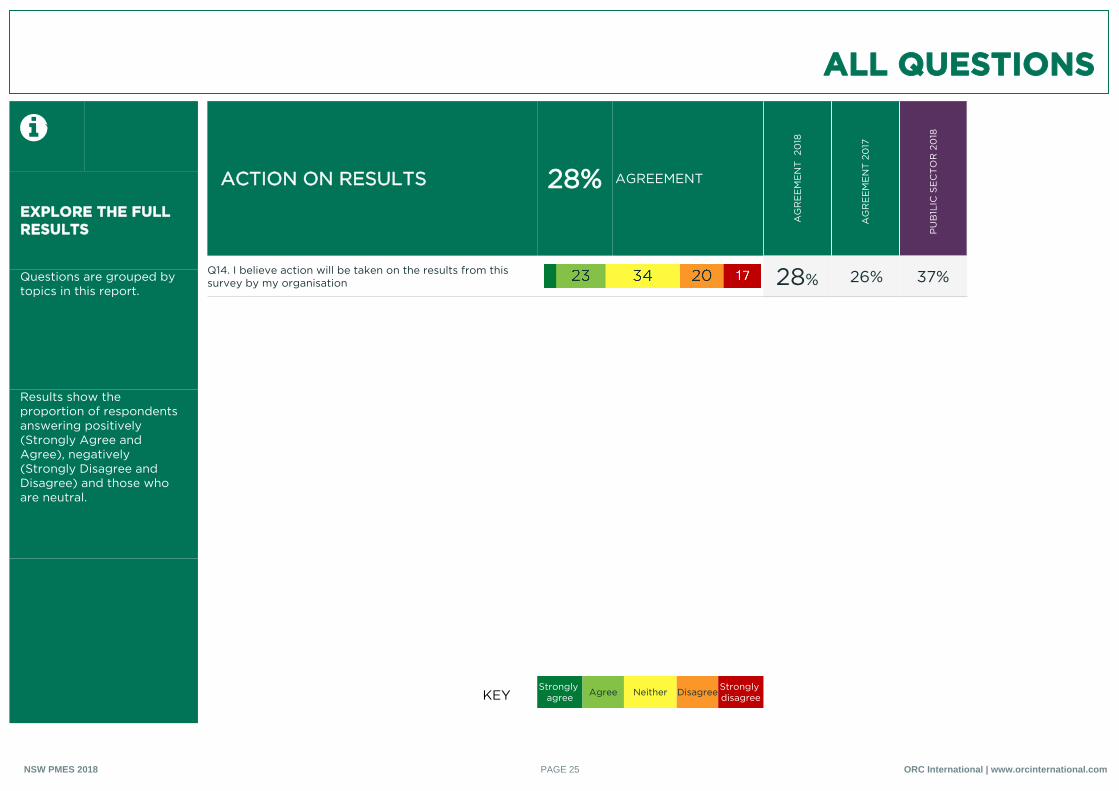
ACTION ON RESULTS 28% AGREEMENT
AG
RE
EM
EN
T 2
018
AG
RE
EM
EN
T 2
017
PU
B1L
IC S
EC
TO
R 2
018
Q14. I believe action will be taken on the results from this survey by my organisation 28% 26% 37%
KEYStrongly
agree Agree Neither Disagree Strongly disagree
ORC International | www.orcinternational.comPAGE 25NSW PMES 2018
ALL QUESTIONS
EXPLORE THE FULL RESULTS
Questions are grouped by topics in this report.
Results show the proportion of respondents answering positively (Strongly Agree and Agree), negatively (Strongly Disagree and Disagree) and those who are neutral.
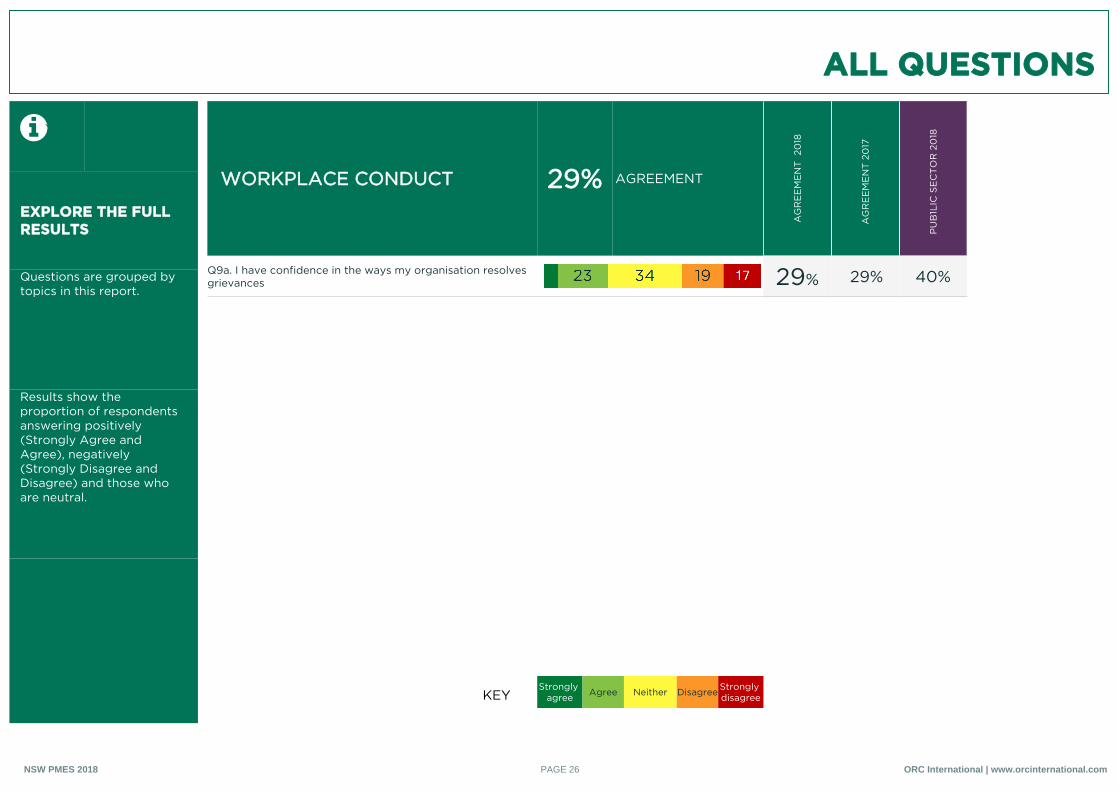
WORKPLACE CONDUCT 29% AGREEMENT
AG
RE
EM
EN
T 2
018
AG
RE
EM
EN
T 2
017
PU
B1L
IC S
EC
TO
R 2
018
Q9a. I have confidence in the ways my organisation resolves grievances 29% 29% 40%
KEYStrongly
agree Agree Neither Disagree Strongly disagree
ORC International | www.orcinternational.comPAGE 26NSW PMES 2018
ALL QUESTIONS
EXPLORE THE FULL RESULTS
Questions are grouped by topics in this report.
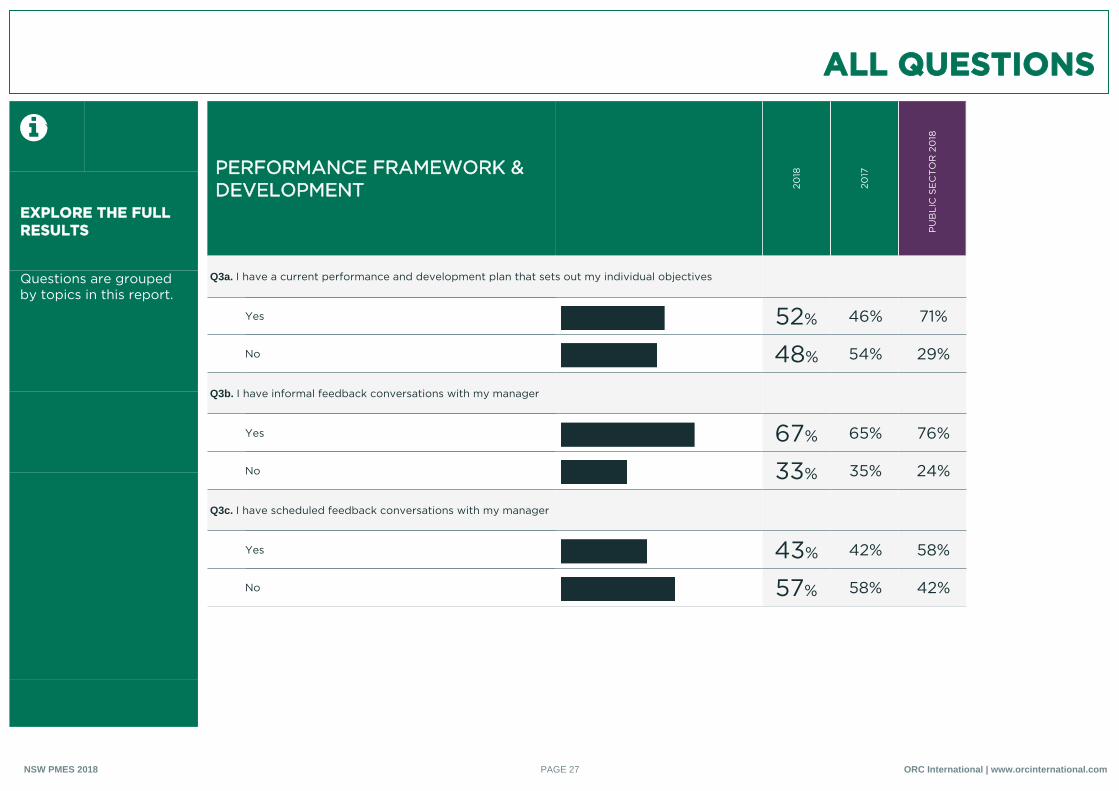
PERFORMANCE FRAMEWORK & DEVELOPMENT 20
18
2017
PU
BLI
C S
EC
TO
R 2
018
Q3a. I have a current performance and development plan that sets out my individual objectives
Yes 52% 46% 71%
No 48% 54% 29%
Q3b. I have informal feedback conversations with my manager
Yes 67% 65% 76%
No 33% 35% 24%
Q3c. I have scheduled feedback conversations with my manager
Yes 43% 42% 58%
No 57% 58% 42%
ORC International | www.orcinternational.comPAGE 27NSW PMES 2018
ALL QUESTIONS
EXPLORE THE FULL RESULTS
Questions are grouped by topics in this report.
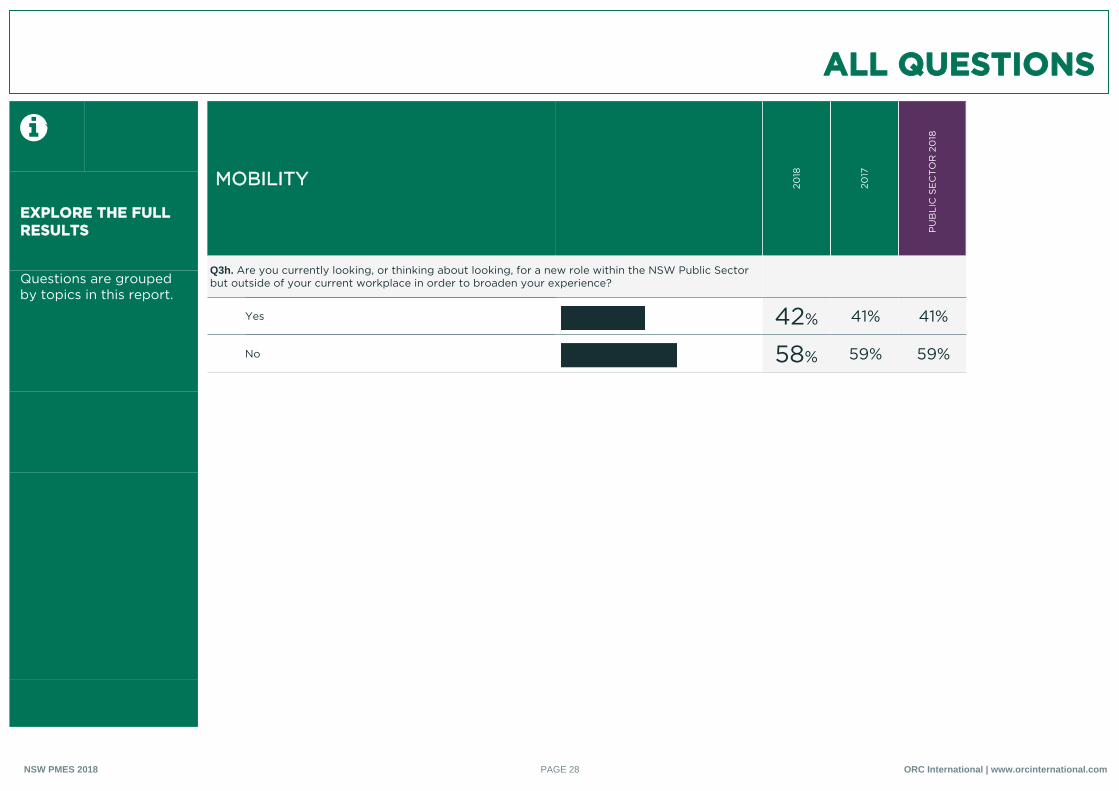
MOBILITY 2018
2017
PU
BLI
C S
EC
TO
R 2
018
Q3h. Are you currently looking, or thinking about looking, for a new role within the NSW Public Sector but outside of your current workplace in order to broaden your experience?
Yes 42% 41% 41%
No 58% 59% 59%
ORC International | www.orcinternational.comPAGE 28NSW PMES 2018
ALL QUESTIONS
EXPLORE THE FULL RESULTS
Questions are grouped by topics in this report.
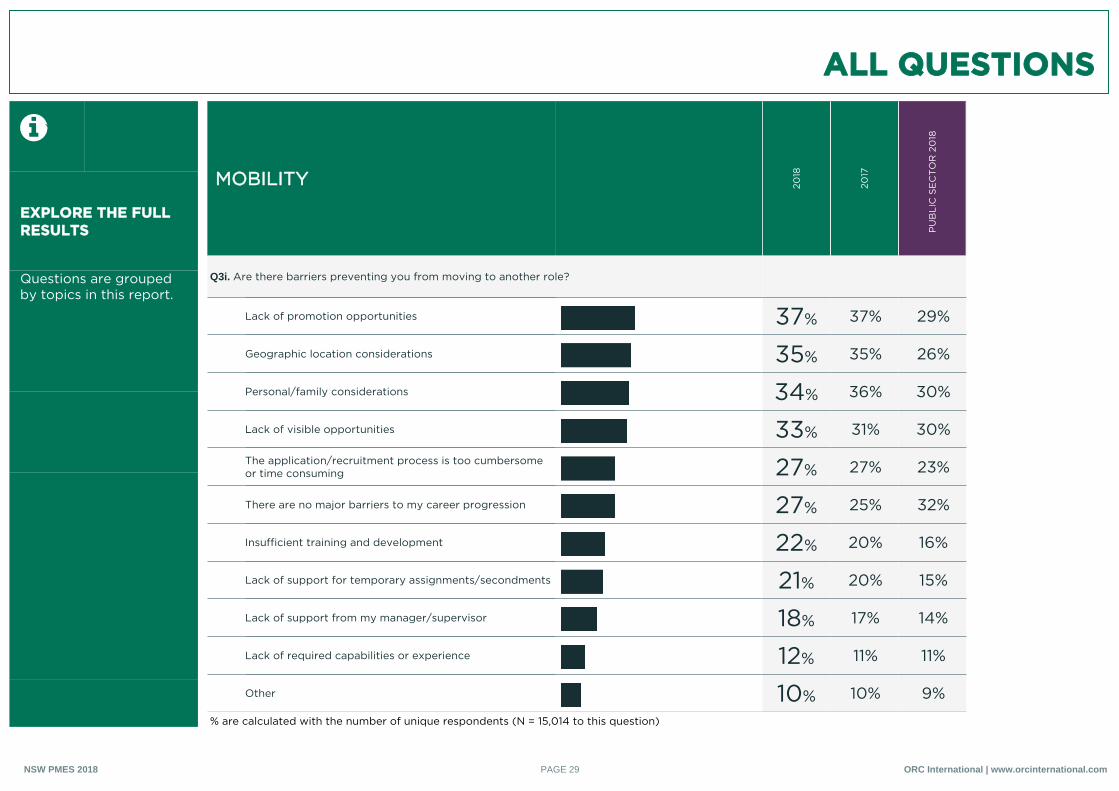
MOBILITY 2018
2017
PU
BLI
C S
EC
TO
R 2
018
Q3i. Are there barriers preventing you from moving to another role?
Lack of promotion opportunities 37% 37% 29%
Geographic location considerations 35% 35% 26%
Personal/family considerations 34% 36% 30%
Lack of visible opportunities 33% 31% 30%
The application/recruitment process is too cumbersome or time consuming 27% 27% 23%
There are no major barriers to my career progression 27% 25% 32%
Insufficient training and development 22% 20% 16%
Lack of support for temporary assignments/secondments 21% 20% 15%
Lack of support from my manager/supervisor 18% 17% 14%
Lack of required capabilities or experience 12% 11% 11%
Other 10% 10% 9%
% are calculated with the number of unique respondents (N = 15,014 to this question)
ORC International | www.orcinternational.comPAGE 29NSW PMES 2018
ALL QUESTIONS
EXPLORE THE FULL RESULTS
Questions are grouped by topics in this report.
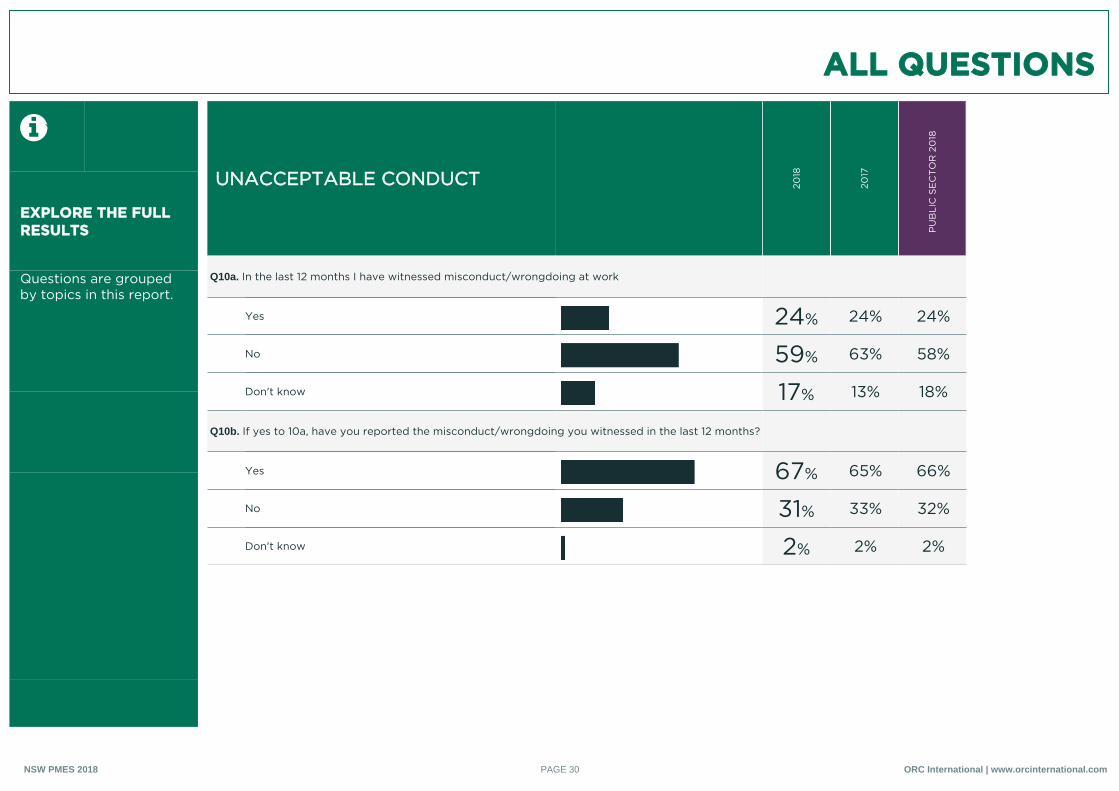
UNACCEPTABLE CONDUCT 2018
2017
PU
BLI
C S
EC
TO
R 2
018
Q10a. In the last 12 months I have witnessed misconduct/wrongdoing at work
Yes 24% 24% 24%
No 59% 63% 58%
Don't know 17% 13% 18%
Q10b. If yes to 10a, have you reported the misconduct/wrongdoing you witnessed in the last 12 months?
Yes 67% 65% 66%
No 31% 33% 32%
Don't know 2% 2% 2%
ORC International | www.orcinternational.comPAGE 30NSW PMES 2018
ALL QUESTIONS
EXPLORE THE FULL RESULTS
Questions are grouped by topics in this report.
UNACCEPTABLE CONDUCT 2018
2017
PU
BLI
C S
EC
TO
R 2
018
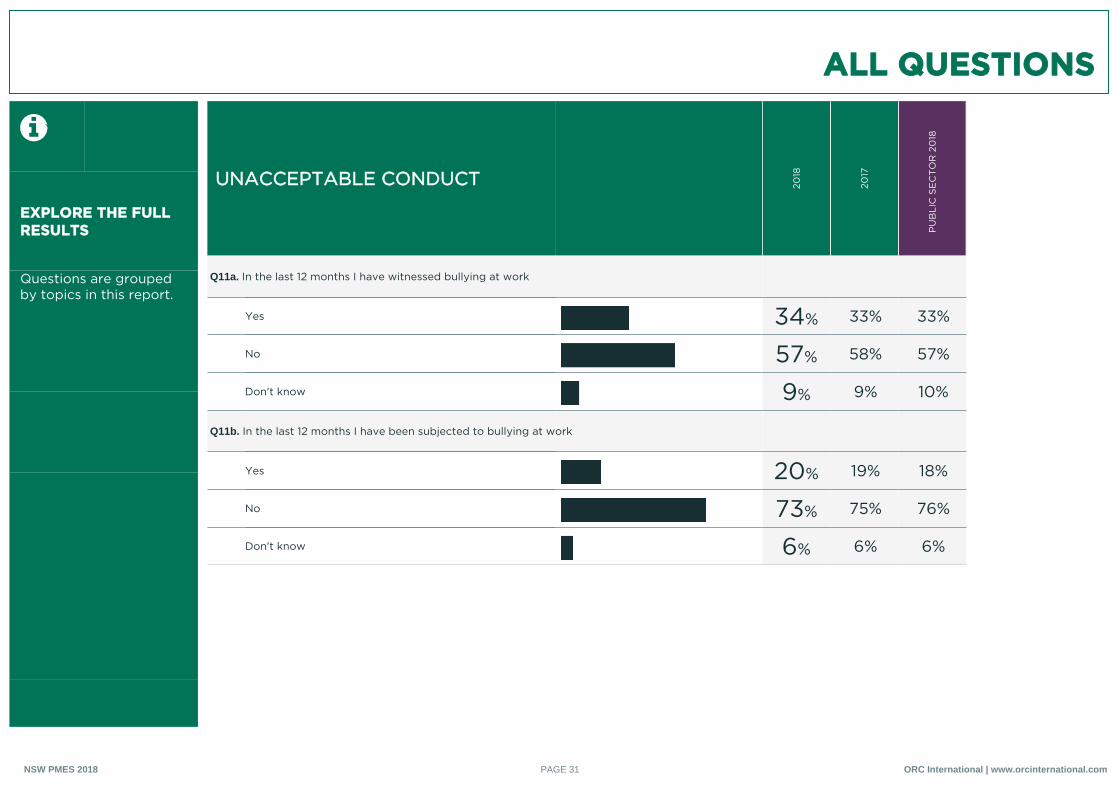
Q11a. In the last 12 months I have witnessed bullying at work
Yes 34% 33% 33%
No 57% 58% 57%
Don't know 9% 9% 10%
Q11b. In the last 12 months I have been subjected to bullying at work
Yes 20% 19% 18%
No 73% 75% 76%
Don't know 6% 6% 6%
ORC International | www.orcinternational.comPAGE 31NSW PMES 2018
ALL QUESTIONS
EXPLORE THE FULL RESULTS
Questions are grouped by topics in this report.
UNACCEPTABLE CONDUCT 2018
2017
PU
BLI
C S
EC
TO
R 2
018
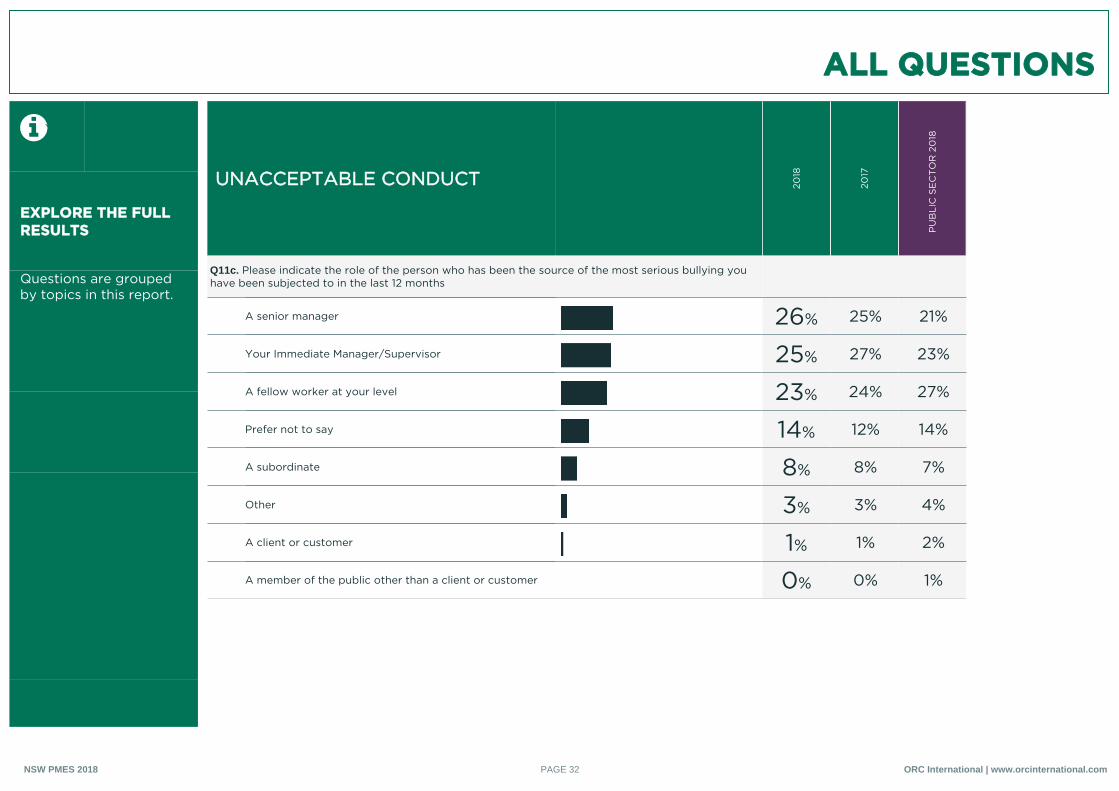
Q11c. Please indicate the role of the person who has been the source of the most serious bullying you have been subjected to in the last 12 months
A senior manager 26% 25% 21%
Your Immediate Manager/Supervisor 25% 27% 23%
A fellow worker at your level 23% 24% 27%
Prefer not to say 14% 12% 14%
A subordinate 8% 8% 7%
Other 3% 3% 4%
A client or customer 1% 1% 2%
A member of the public other than a client or customer 0% 0% 1%
ORC International | www.orcinternational.comPAGE 32NSW PMES 2018
ALL QUESTIONS
EXPLORE THE FULL RESULTS
Questions are grouped by topics in this report.
UNACCEPTABLE CONDUCT 2018
2017
PU
BLI
C S
EC
TO
R 2
018
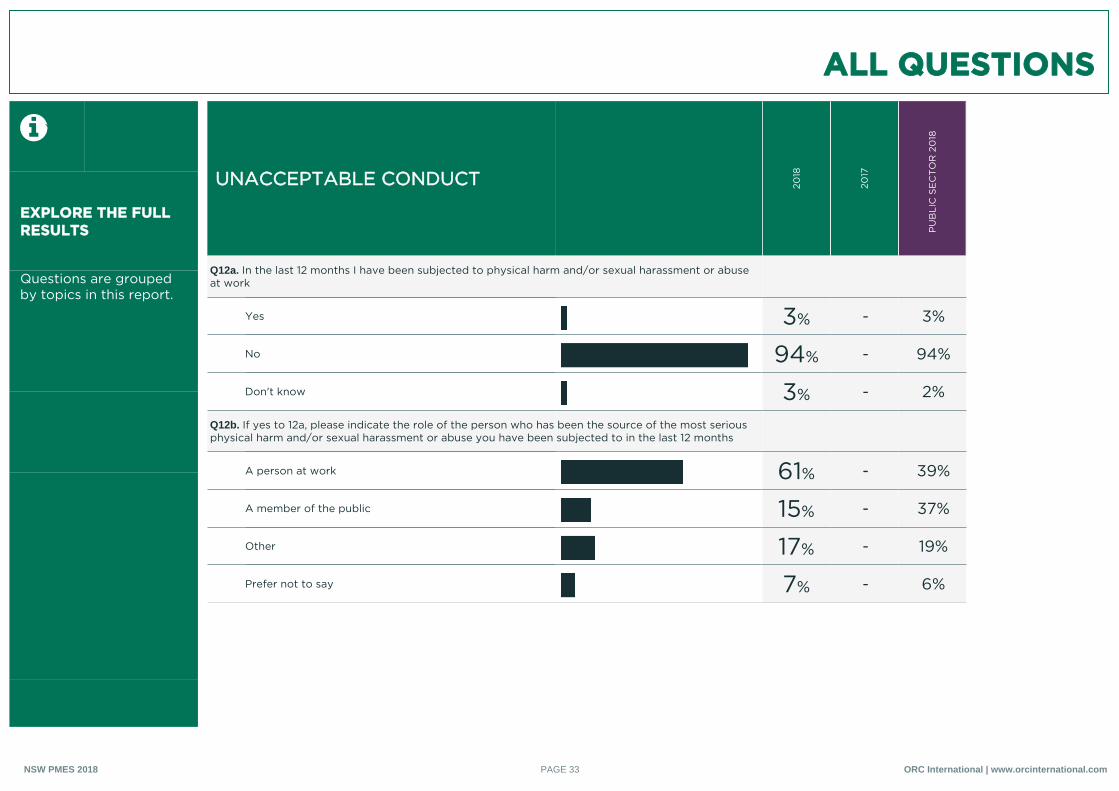
Q12a. In the last 12 months I have been subjected to physical harm and/or sexual harassment or abuse at work
Yes 3% - 3%
No 94% - 94%
Don't know 3% - 2%
Q12b. If yes to 12a, please indicate the role of the person who has been the source of the most serious physical harm and/or sexual harassment or abuse you have been subjected to in the last 12 months
A person at work 61% - 39%
A member of the public 15% - 37%
Other 17% - 19%
Prefer not to say 7% - 6%
ORC International | www.orcinternational.comPAGE 33NSW PMES 2018
ALL QUESTIONS
EXPLORE THE FULL SURVEY RESULTS
Questions are grouped by topics in this report.
JUSTICE
CUSTOMISED QUESTIONS
2018
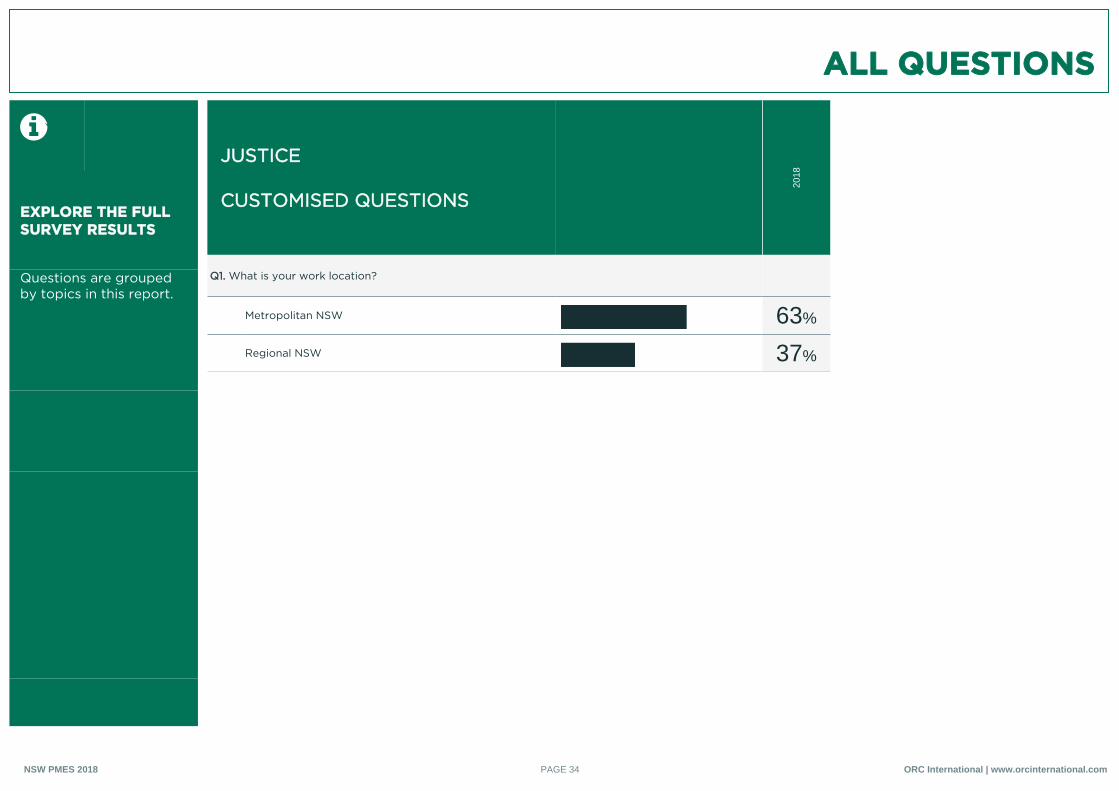
Q1. What is your work location?
Metropolitan NSW 63%
Regional NSW 37%
ORC International | www.orcinternational.comPAGE 34NSW PMES 2018
ALL QUESTIONS
EXPLORE THE FULL SURVEY RESULTS
Questions are grouped by topics in this report.
JUSTICE
CUSTOMISED QUESTIONS
2018
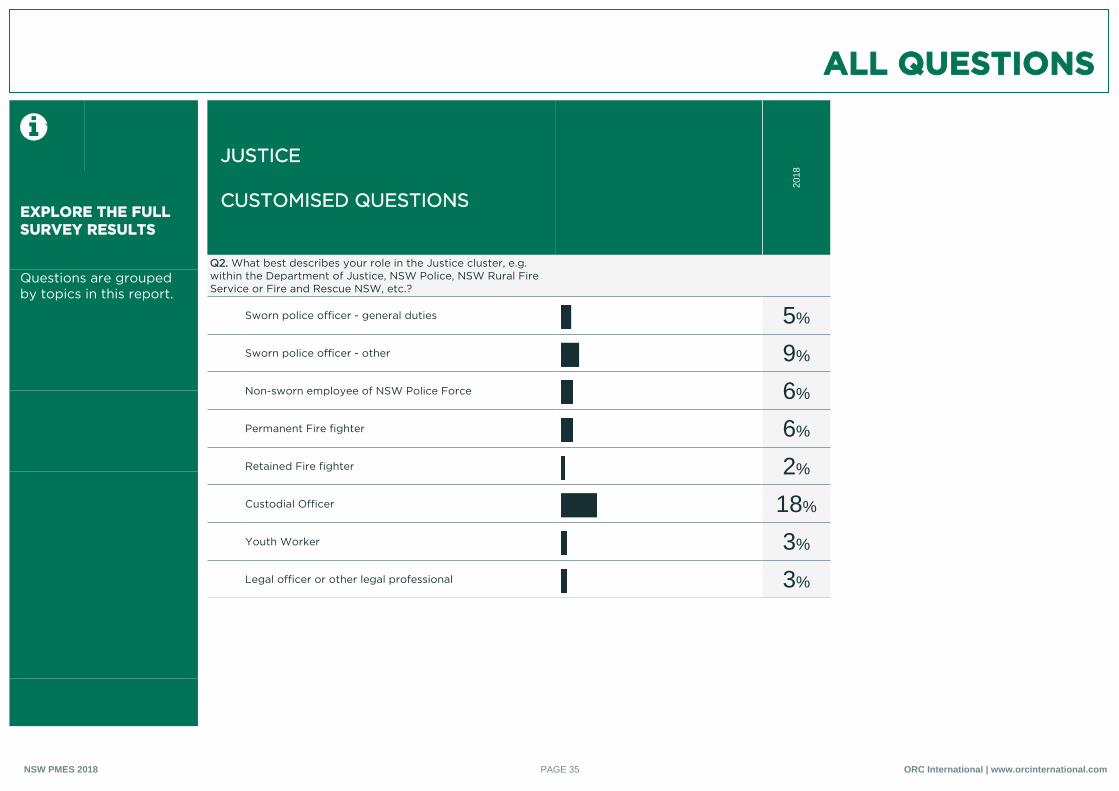
Q2. What best describes your role in the Justice cluster, e.g. within the Department of Justice, NSW Police, NSW Rural Fire Service or Fire and Rescue NSW, etc.?
Sworn police officer - general duties 5%
Sworn police officer - other 9%
Non-sworn employee of NSW Police Force 6%
Permanent Fire fighter 6%
Retained Fire fighter 2%
Custodial Officer 18%
Youth Worker 3%
Legal officer or other legal professional 3%
ORC International | www.orcinternational.comPAGE 35NSW PMES 2018
ALL QUESTIONS
EXPLORE THE FULL SURVEY RESULTS
Questions are grouped by topics in this report.
JUSTICE
CUSTOMISED QUESTIONS
2018
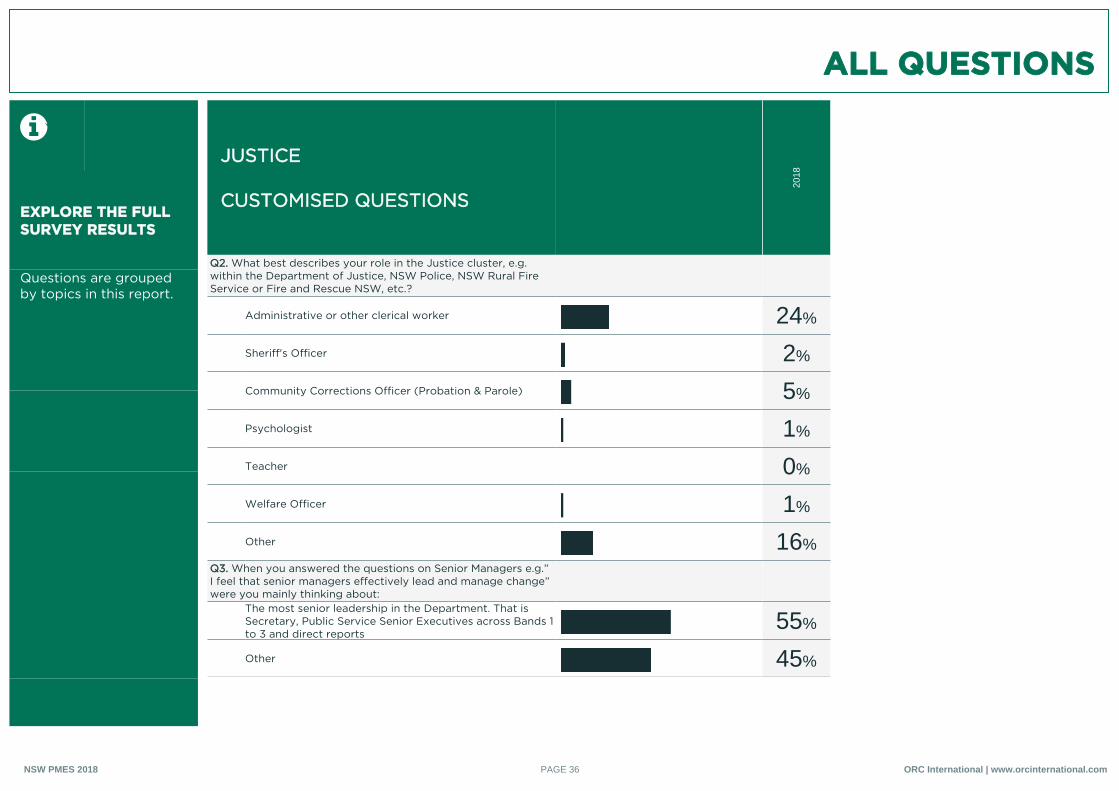
Q2. What best describes your role in the Justice cluster, e.g. within the Department of Justice, NSW Police, NSW Rural Fire Service or Fire and Rescue NSW, etc.?
Administrative or other clerical worker 24%
Sheriff's Officer 2%
Community Corrections Officer (Probation & Parole) 5%
Psychologist 1%
Teacher 0%
Welfare Officer 1%
Other 16%Q3. When you answered the questions on Senior Managers e.g.” I feel that senior managers effectively lead and manage change” were you mainly thinking about:
The most senior leadership in the Department. That is Secretary, Public Service Senior Executives across Bands 1 to 3 and direct reports
55%
Other 45%
ORC International | www.orcinternational.comPAGE 36NSW PMES 2018
PROFILE OF RESPONDENTS
PERSONAL AND WORK PROFILES
PE
RC
EN
TAG
E
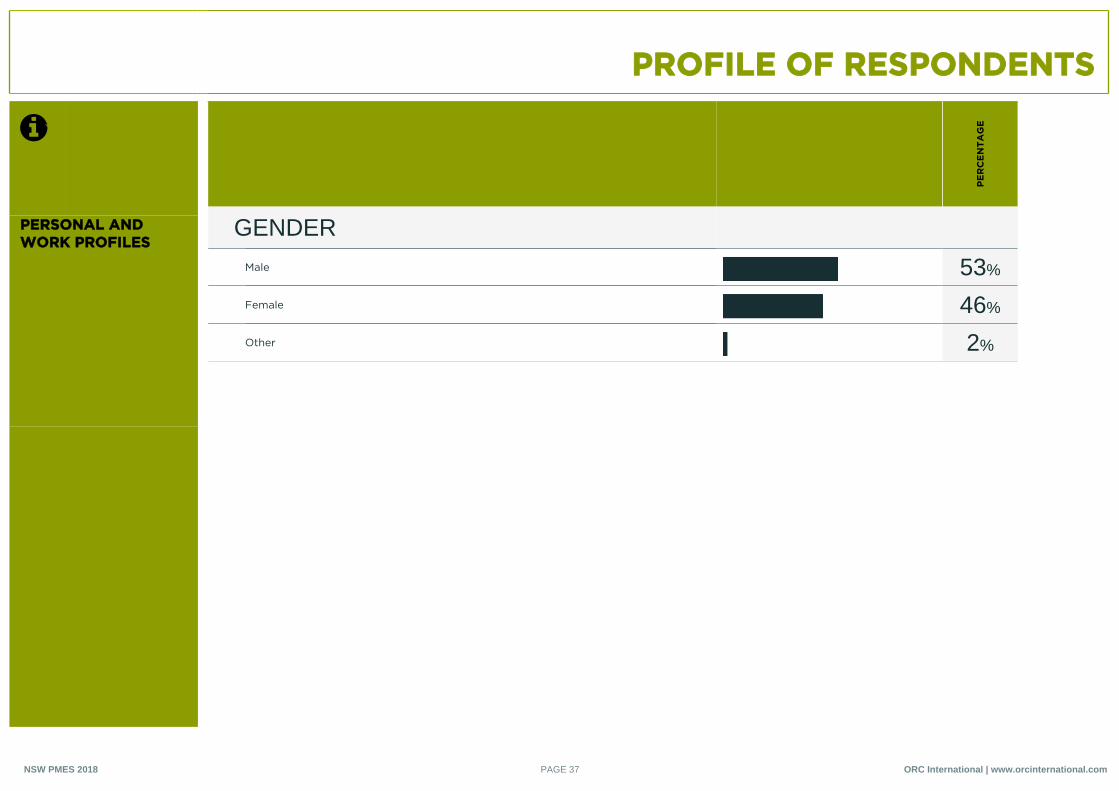
GENDER
Male 53%
Female 46%
Other 2%
ORC International | www.orcinternational.comPAGE 37NSW PMES 2018
PROFILE OF RESPONDENTS
PERSONAL AND WORK PROFILES
PE
RC
EN
TAG
E
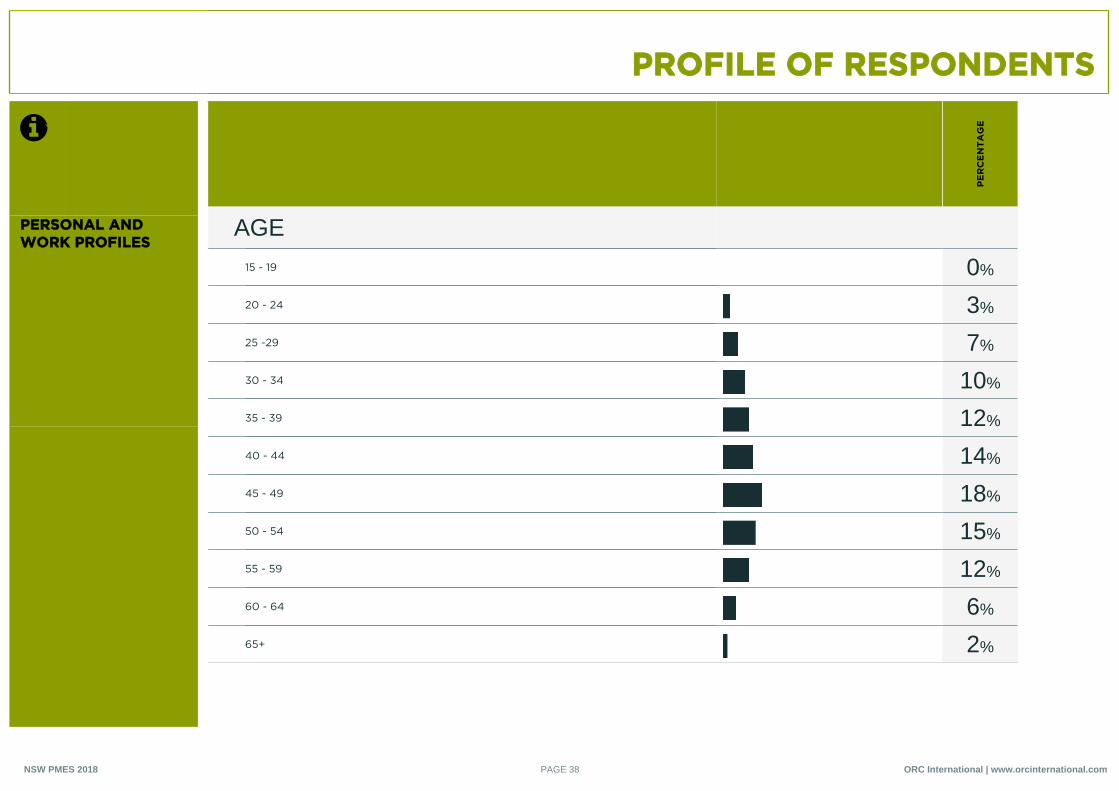
AGE
15 - 19 0%
20 - 24 3%
25 -29 7%
30 - 34 10%
35 - 39 12%
40 - 44 14%
45 - 49 18%
50 - 54 15%
55 - 59 12%
60 - 64 6%
65+ 2%
ORC International | www.orcinternational.comPAGE 38NSW PMES 2018
PROFILE OF RESPONDENTS
PERSONAL AND WORK PROFILES
PE
RC
EN
TAG
E
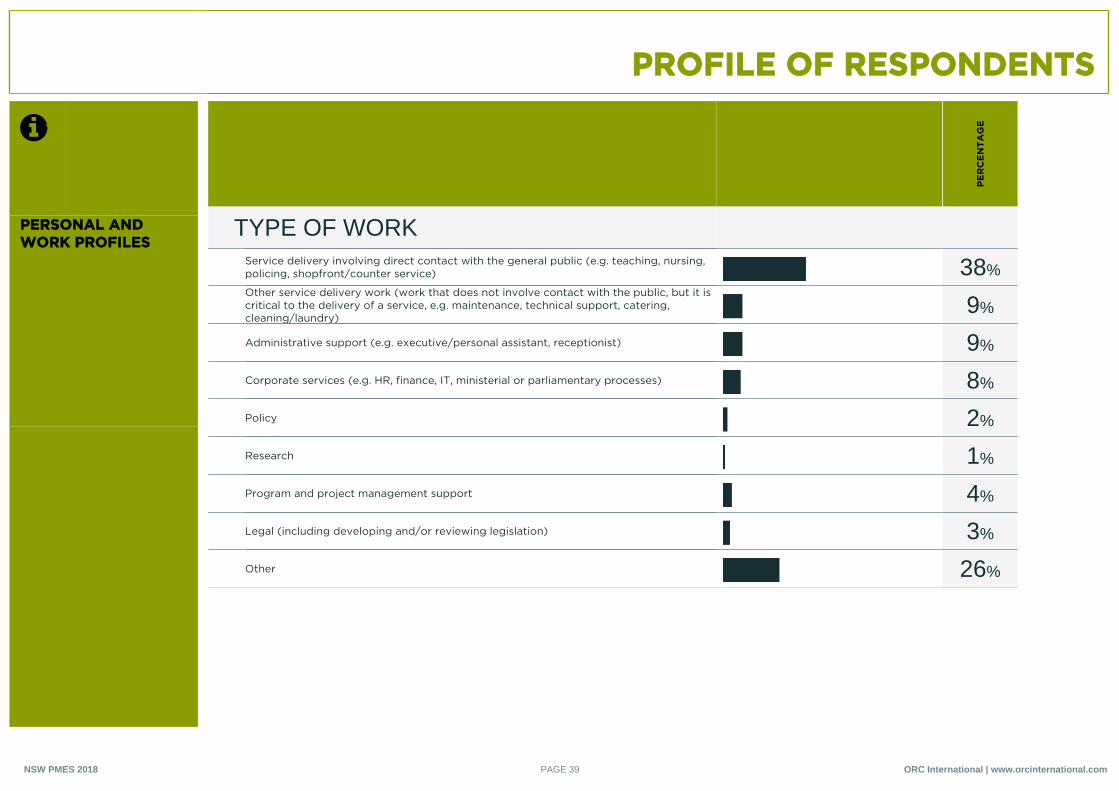
TYPE OF WORKService delivery involving direct contact with the general public (e.g. teaching, nursing, policing, shopfront/counter service) 38%Other service delivery work (work that does not involve contact with the public, but it is critical to the delivery of a service, e.g. maintenance, technical support, catering, cleaning/laundry)
9%
Administrative support (e.g. executive/personal assistant, receptionist) 9%
Corporate services (e.g. HR, finance, IT, ministerial or parliamentary processes) 8%
Policy 2%
Research 1%
Program and project management support 4%
Legal (including developing and/or reviewing legislation) 3%
Other 26%
ORC International | www.orcinternational.comPAGE 39NSW PMES 2018
PROFILE OF RESPONDENTS
PERSONAL AND WORK PROFILES
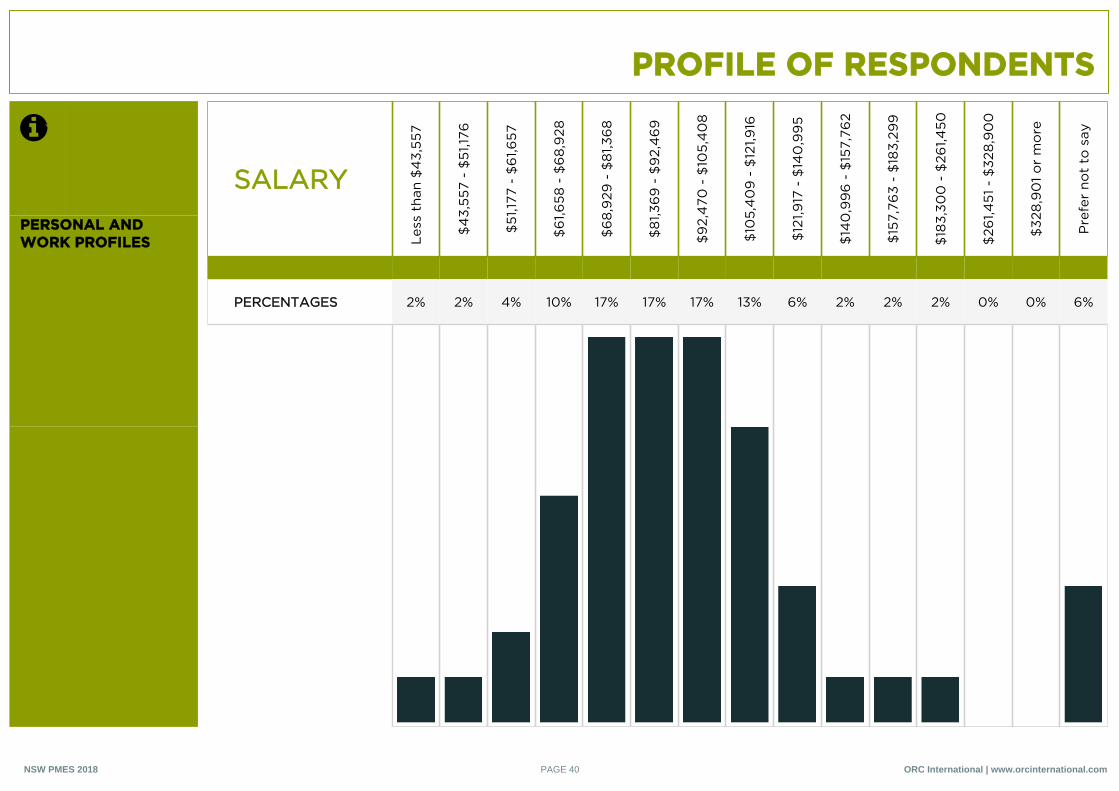
SALARY
Les
s th
an $
43,
557
$4
3,55
7 -
$51
,176
$51
,177
- $
61,6
57
$6
1,658
- $
68
,928
$6
8,9
29 -
$8
1,36
8
$8
1,36
9 -
$9
2,4
69
$9
2,4
70 -
$10
5,4
08
$10
5,4
09
- $
121,9
16
$12
1,917
- $
140
,99
5
$14
0,9
96
- $
157,
762
$15
7,76
3 -
$18
3,29
9
$18
3,30
0 -
$26
1,450
$26
1,451
- $
328
,90
0
$32
8,9
01
or
mo
re
Pre
fer
not
to s
ay
PERCENTAGES 2% 2% 4% 10% 17% 17% 17% 13% 6% 2% 2% 2% 0% 0% 6%
ORC International | www.orcinternational.comPAGE 40NSW PMES 2018
PROFILE OF RESPONDENTS
PERSONAL AND WORK PROFILES
PE
RC
EN
TAG
E
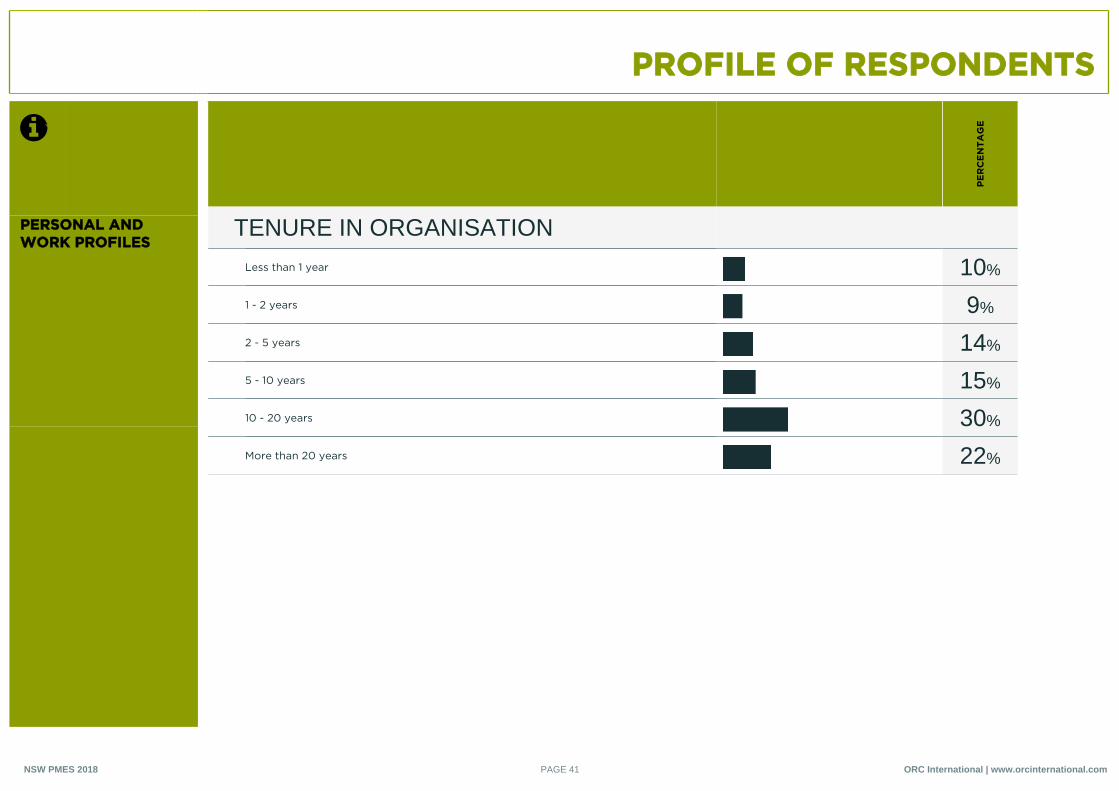
TENURE IN ORGANISATION
Less than 1 year 10%
1 - 2 years 9%
2 - 5 years 14%
5 - 10 years 15%
10 - 20 years 30%
More than 20 years 22%
ORC International | www.orcinternational.comPAGE 41NSW PMES 2018
PROFILE OF RESPONDENTS
PERSONAL AND WORK PROFILES
PE
RC
EN
TAG
E
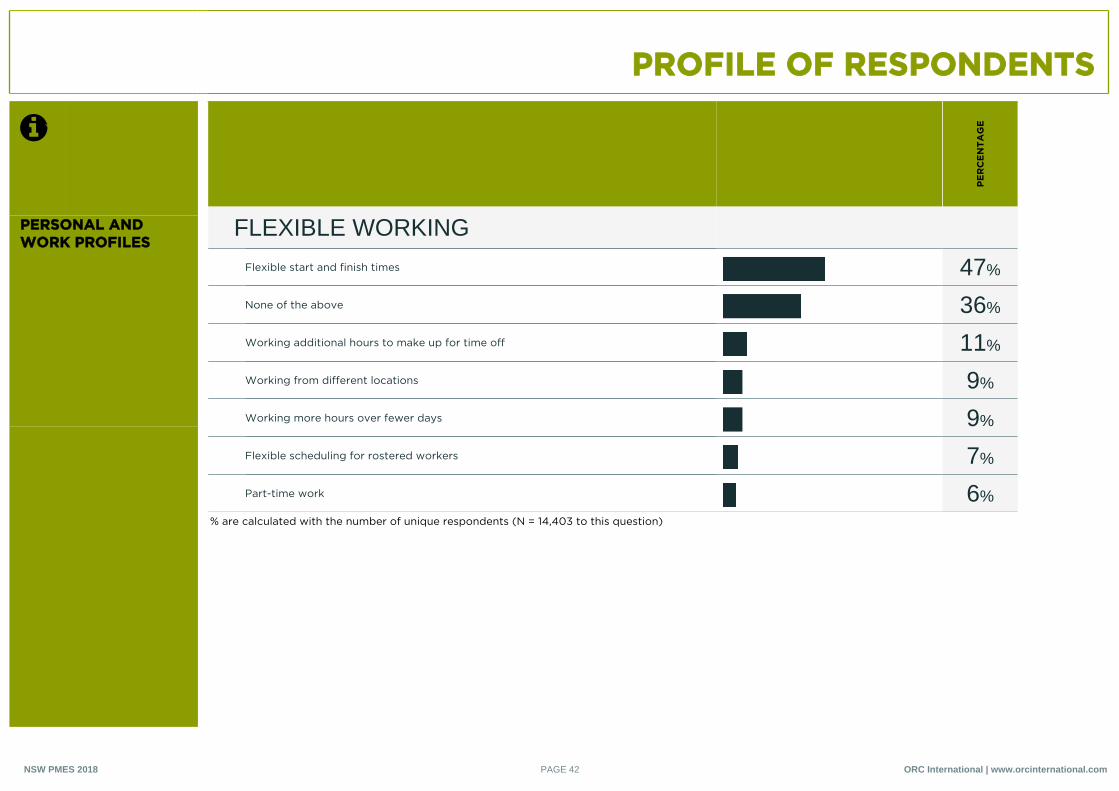
FLEXIBLE WORKING
Flexible start and finish times 47%
None of the above 36%
Working additional hours to make up for time off 11%
Working from different locations 9%
Working more hours over fewer days 9%
Flexible scheduling for rostered workers 7%
Part-time work 6%
% are calculated with the number of unique respondents (N = 14,403 to this question)
ORC International | www.orcinternational.comPAGE 42NSW PMES 2018
PROFILE OF RESPONDENTS
PERSONAL AND WORK PROFILES
PE
RC
EN
TAG
E
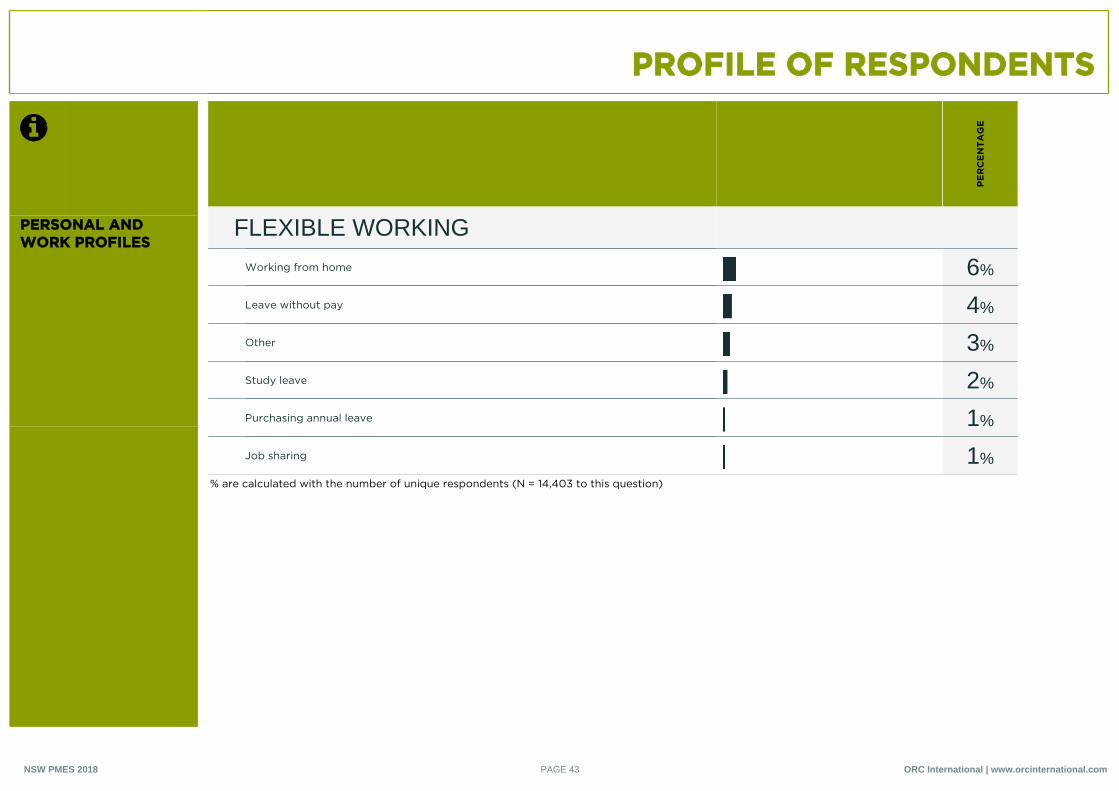
FLEXIBLE WORKING
Working from home 6%
Leave without pay 4%
Other 3%
Study leave 2%
Purchasing annual leave 1%
Job sharing 1%
% are calculated with the number of unique respondents (N = 14,403 to this question)
ORC International | www.orcinternational.comPAGE 43NSW PMES 2018
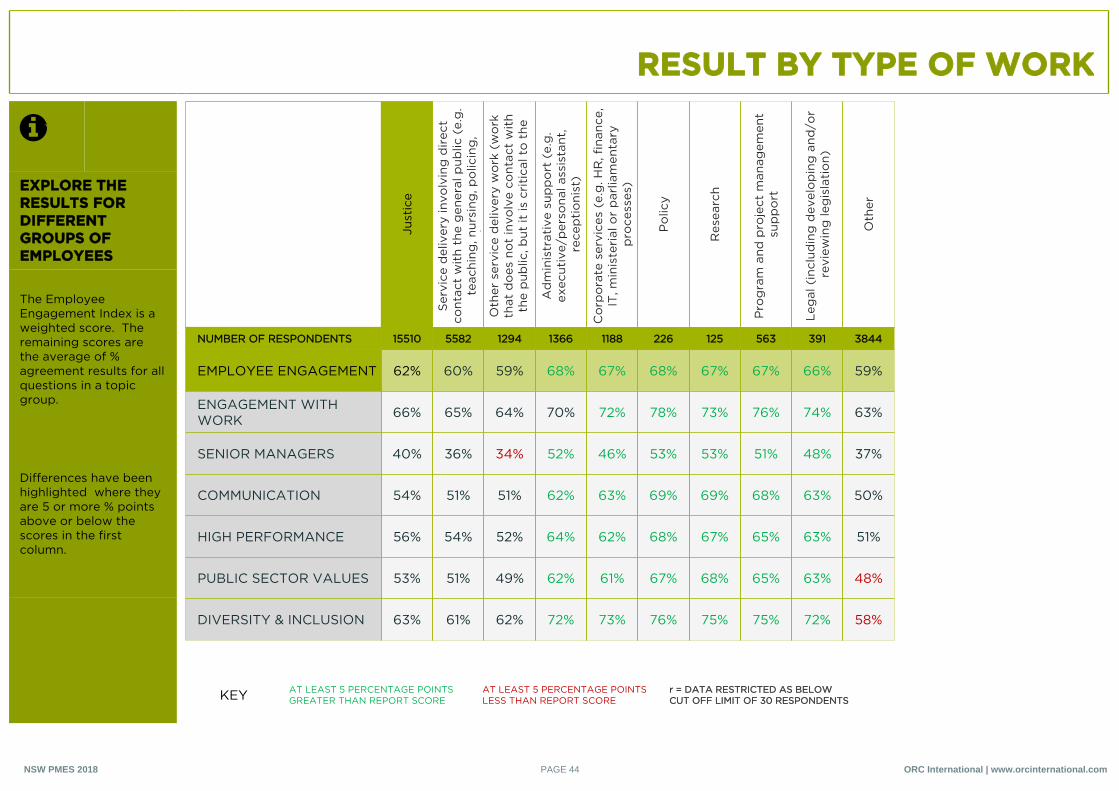
RESULT BY TYPE OF WORK
EXPLORE THE RESULTS FOR DIFFERENT GROUPS OF EMPLOYEES
The Employee Engagement Index is a weighted score. The remaining scores are the average of % agreement results for all questions in a topic group.
Differences have been highlighted where they are 5 or more % points above or below the scores in the first column.
Just
ice
Ser
vice
del
iver
y in
volv
ing
dir
ect
cont
act
wit
h th
e g
ener
al p
ublic
(e.
g.
teac
hing
, nur
sing
, po
licin
g,
sho
pfr
ont
/co
unte
r se
rvic
e)O
ther
ser
vice
del
iver
y w
ork
(w
ork
th
at d
oes
no
t in
volv
e co
ntac
t w
ith
the
pub
lic, b
ut it
is c
riti
cal t
o t
he
del
iver
y o
f a
serv
ice,
e.g
. mai
nten
anc
Ad
min
istr
ativ
e su
pp
ort
(e.
g.
exec
utiv
e/p
erso
nal a
ssis
tant
, re
cep
tio
nist
)
Co
rpo
rate
ser
vice
s (e
.g. H
R, f
inan
ce,
IT, m
inis
teri
al o
r p
arlia
men
tary
p
roce
sses
)
Po
licy
Res
earc
h
Pro
gra
m a
nd p
roje
ct m
anag
emen
t su
pp
ort
Leg
al (
incl
udin
g d
evel
op
ing
and
/or
revi
ewin
g le
gis
lati
on)
Oth
er
NUMBER OF RESPONDENTS 15510 5582 1294 1366 1188 226 125 563 391 3844
EMPLOYEE ENGAGEMENT 62% 60% 59% 68% 67% 68% 67% 67% 66% 59%
ENGAGEMENT WITH WORK 66% 65% 64% 70% 72% 78% 73% 76% 74% 63%
SENIOR MANAGERS 40% 36% 34% 52% 46% 53% 53% 51% 48% 37%
COMMUNICATION 54% 51% 51% 62% 63% 69% 69% 68% 63% 50%
HIGH PERFORMANCE 56% 54% 52% 64% 62% 68% 67% 65% 63% 51%
PUBLIC SECTOR VALUES 53% 51% 49% 62% 61% 67% 68% 65% 63% 48%
DIVERSITY & INCLUSION 63% 61% 62% 72% 73% 76% 75% 75% 72% 58%
KEY AT LEAST 5 PERCENTAGE POINTS GREATER THAN REPORT SCORE
AT LEAST 5 PERCENTAGE POINTS LESS THAN REPORT SCORE
r = DATA RESTRICTED AS BELOW CUT OFF LIMIT OF 30 RESPONDENTS
ORC International | www.orcinternational.comPAGE 44NSW PMES 2018
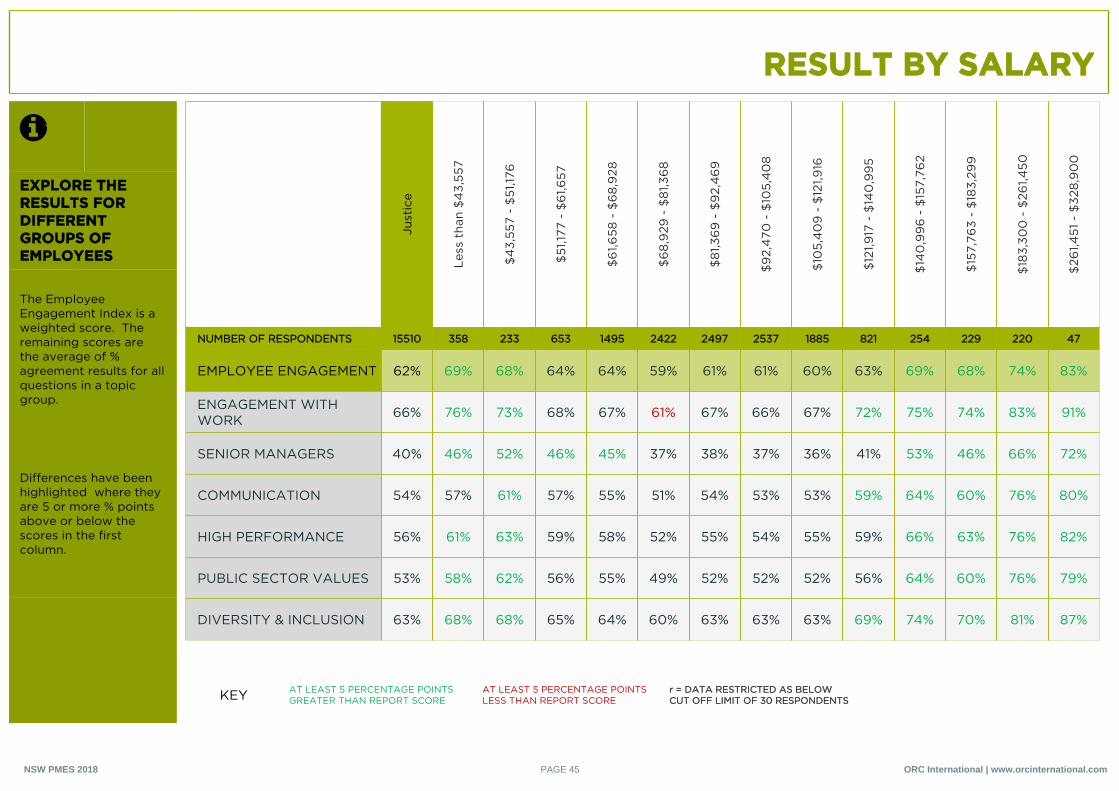
RESULT BY SALARY
EXPLORE THE RESULTS FOR DIFFERENT GROUPS OF EMPLOYEES
The Employee Engagement Index is a weighted score. The remaining scores are the average of % agreement results for all questions in a topic group.
Differences have been highlighted where they are 5 or more % points above or below the scores in the first column.
Just
ice
Less
tha
n $
43,
557
$4
3,55
7 -
$51
,176
$51
,177
- $
61,6
57
$6
1,658
- $
68
,928
$6
8,9
29 -
$8
1,36
8
$8
1,36
9 -
$9
2,4
69
$9
2,4
70 -
$10
5,4
08
$10
5,4
09
- $
121,9
16
$12
1,917
- $
140
,99
5
$14
0,9
96
- $
157,
762
$15
7,76
3 -
$18
3,29
9
$18
3,30
0 -
$26
1,450
$26
1,451
- $
328
,90
0
NUMBER OF RESPONDENTS 15510 358 233 653 1495 2422 2497 2537 1885 821 254 229 220 47
EMPLOYEE ENGAGEMENT 62% 69% 68% 64% 64% 59% 61% 61% 60% 63% 69% 68% 74% 83%
ENGAGEMENT WITH WORK 66% 76% 73% 68% 67% 61% 67% 66% 67% 72% 75% 74% 83% 91%
SENIOR MANAGERS 40% 46% 52% 46% 45% 37% 38% 37% 36% 41% 53% 46% 66% 72%
COMMUNICATION 54% 57% 61% 57% 55% 51% 54% 53% 53% 59% 64% 60% 76% 80%
HIGH PERFORMANCE 56% 61% 63% 59% 58% 52% 55% 54% 55% 59% 66% 63% 76% 82%
PUBLIC SECTOR VALUES 53% 58% 62% 56% 55% 49% 52% 52% 52% 56% 64% 60% 76% 79%
DIVERSITY & INCLUSION 63% 68% 68% 65% 64% 60% 63% 63% 63% 69% 74% 70% 81% 87%
KEY AT LEAST 5 PERCENTAGE POINTS GREATER THAN REPORT SCORE
AT LEAST 5 PERCENTAGE POINTS LESS THAN REPORT SCORE
r = DATA RESTRICTED AS BELOW CUT OFF LIMIT OF 30 RESPONDENTS
ORC International | www.orcinternational.comPAGE 45NSW PMES 2018
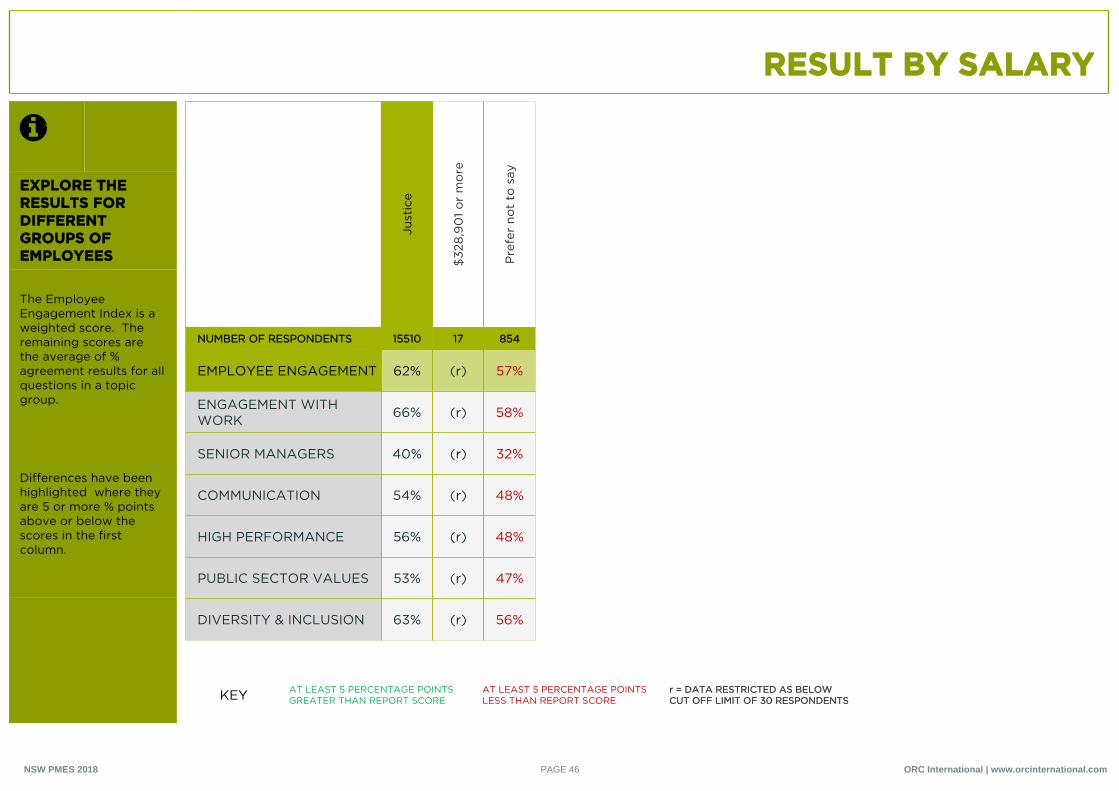
RESULT BY SALARY
EXPLORE THE RESULTS FOR DIFFERENT GROUPS OF EMPLOYEES
The Employee Engagement Index is a weighted score. The remaining scores are the average of % agreement results for all questions in a topic group.
Differences have been highlighted where they are 5 or more % points above or below the scores in the first column.
Just
ice
$32
8,9
01
or
mo
re
Pre
fer
not
to s
ay
NUMBER OF RESPONDENTS 15510 17 854
EMPLOYEE ENGAGEMENT 62% (r) 57%
ENGAGEMENT WITH WORK 66% (r) 58%
SENIOR MANAGERS 40% (r) 32%
COMMUNICATION 54% (r) 48%
HIGH PERFORMANCE 56% (r) 48%
PUBLIC SECTOR VALUES 53% (r) 47%
DIVERSITY & INCLUSION 63% (r) 56%
KEY AT LEAST 5 PERCENTAGE POINTS GREATER THAN REPORT SCORE
AT LEAST 5 PERCENTAGE POINTS LESS THAN REPORT SCORE
r = DATA RESTRICTED AS BELOW CUT OFF LIMIT OF 30 RESPONDENTS
ORC International | www.orcinternational.comPAGE 46NSW PMES 2018
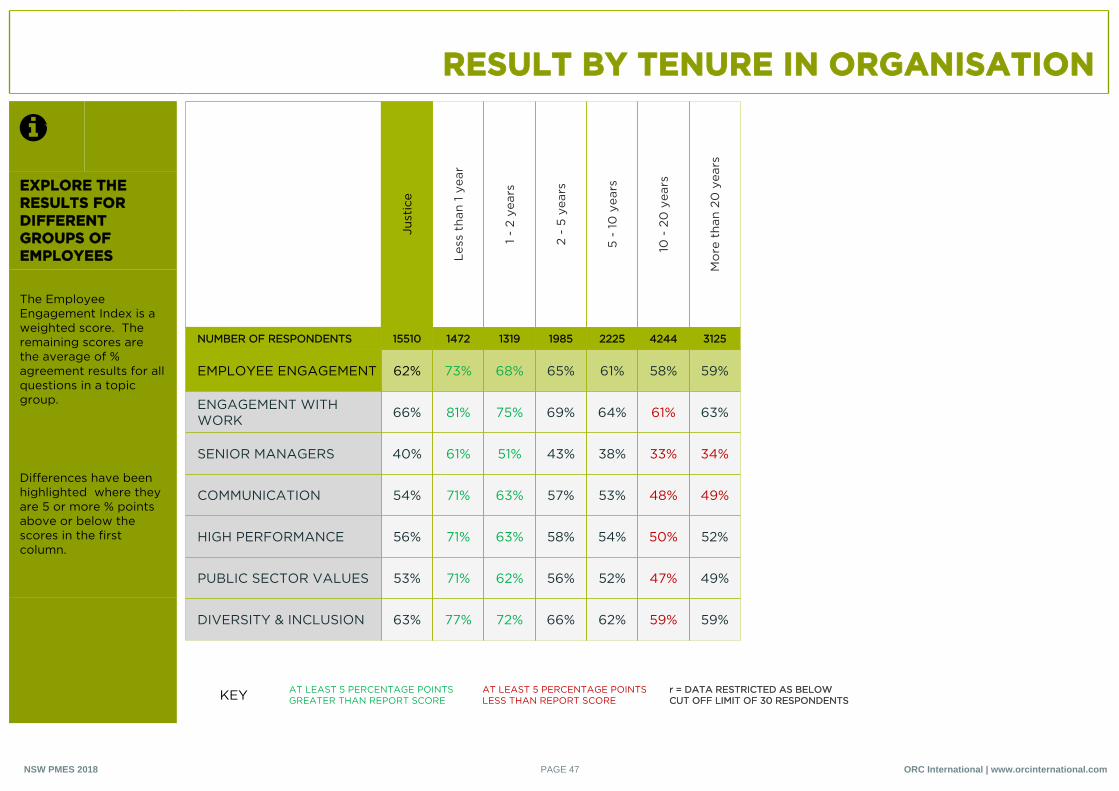
RESULT BY TENURE IN ORGANISATION
EXPLORE THE RESULTS FOR DIFFERENT GROUPS OF EMPLOYEES
The Employee Engagement Index is a weighted score. The remaining scores are the average of % agreement results for all questions in a topic group.
Differences have been highlighted where they are 5 or more % points above or below the scores in the first column.
Just
ice
Less
tha
n 1
year
1 -
2 ye
ars
2 -
5 ye
ars
5 -
10 y
ears
10 -
20
yea
rs
Mo
re t
han
20 y
ears
NUMBER OF RESPONDENTS 15510 1472 1319 1985 2225 4244 3125
EMPLOYEE ENGAGEMENT 62% 73% 68% 65% 61% 58% 59%
ENGAGEMENT WITH WORK 66% 81% 75% 69% 64% 61% 63%
SENIOR MANAGERS 40% 61% 51% 43% 38% 33% 34%
COMMUNICATION 54% 71% 63% 57% 53% 48% 49%
HIGH PERFORMANCE 56% 71% 63% 58% 54% 50% 52%
PUBLIC SECTOR VALUES 53% 71% 62% 56% 52% 47% 49%
DIVERSITY & INCLUSION 63% 77% 72% 66% 62% 59% 59%
KEY AT LEAST 5 PERCENTAGE POINTS GREATER THAN REPORT SCORE
AT LEAST 5 PERCENTAGE POINTS LESS THAN REPORT SCORE
r = DATA RESTRICTED AS BELOW CUT OFF LIMIT OF 30 RESPONDENTS
ORC International | www.orcinternational.comPAGE 47NSW PMES 2018
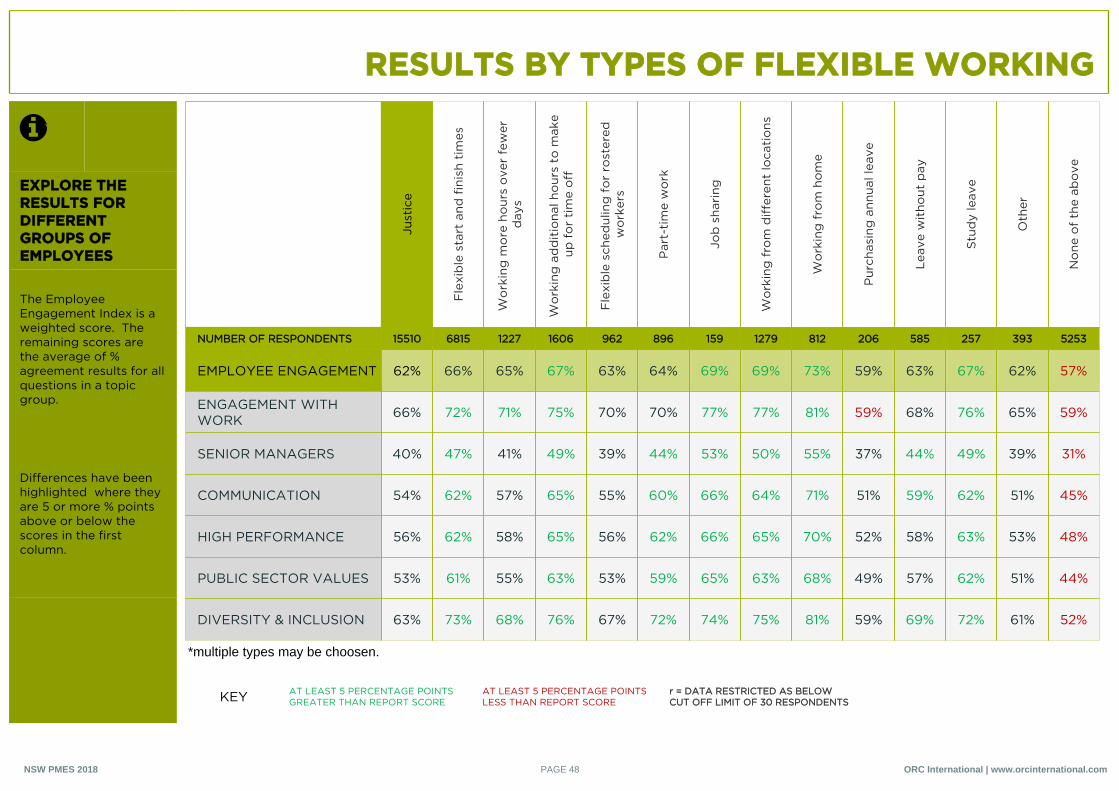
RESULTS BY TYPES OF FLEXIBLE WORKING
EXPLORE THE RESULTS FOR DIFFERENT GROUPS OF EMPLOYEES
The Employee Engagement Index is a weighted score. The remaining scores are the average of % agreement results for all questions in a topic group.
Differences have been highlighted where they are 5 or more % points above or below the scores in the first column.
Just
ice
Fle
xib
le s
tart
and
fin
ish
tim
es
Wo
rkin
g m
ore
ho
urs
ove
r fe
wer
d
ays
Wo
rkin
g a
dd
itio
nal h
our
s to
mak
e up
fo
r ti
me
off
Fle
xib
le s
ched
ulin
g f
or
rost
ered
w
ork
ers
Par
t-ti
me
wo
rk
Job
sha
ring
Wo
rkin
g f
rom
dif
fere
nt lo
cati
ons
Wo
rkin
g f
rom
ho
me
Pur
chas
ing
ann
ual l
eave
Leav
e w
itho
ut p
ay
Stu
dy
leav
e
Oth
er
No
ne o
f th
e ab
ove
NUMBER OF RESPONDENTS 15510 6815 1227 1606 962 896 159 1279 812 206 585 257 393 5253
EMPLOYEE ENGAGEMENT 62% 66% 65% 67% 63% 64% 69% 69% 73% 59% 63% 67% 62% 57%
ENGAGEMENT WITH WORK 66% 72% 71% 75% 70% 70% 77% 77% 81% 59% 68% 76% 65% 59%
SENIOR MANAGERS 40% 47% 41% 49% 39% 44% 53% 50% 55% 37% 44% 49% 39% 31%
COMMUNICATION 54% 62% 57% 65% 55% 60% 66% 64% 71% 51% 59% 62% 51% 45%
HIGH PERFORMANCE 56% 62% 58% 65% 56% 62% 66% 65% 70% 52% 58% 63% 53% 48%
PUBLIC SECTOR VALUES 53% 61% 55% 63% 53% 59% 65% 63% 68% 49% 57% 62% 51% 44%
DIVERSITY & INCLUSION 63% 73% 68% 76% 67% 72% 74% 75% 81% 59% 69% 72% 61% 52%
*multiple types may be choosen.
KEY AT LEAST 5 PERCENTAGE POINTS GREATER THAN REPORT SCORE
AT LEAST 5 PERCENTAGE POINTS LESS THAN REPORT SCORE
r = DATA RESTRICTED AS BELOW CUT OFF LIMIT OF 30 RESPONDENTS
ORC International | www.orcinternational.comPAGE 48NSW PMES 2018
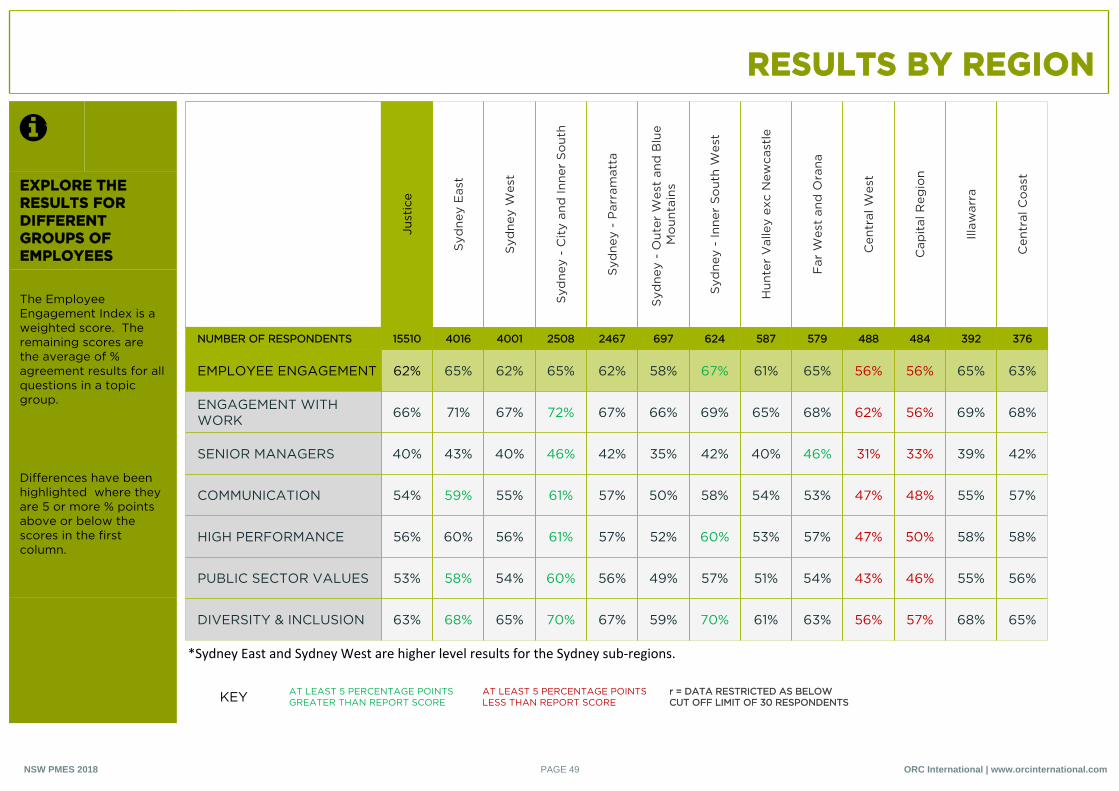
RESULTS BY REGION
EXPLORE THE RESULTS FOR DIFFERENT GROUPS OF EMPLOYEES
The Employee Engagement Index is a weighted score. The remaining scores are the average of % agreement results for all questions in a topic group.
Differences have been highlighted where they are 5 or more % points above or below the scores in the first column.
Just
ice
Syd
ney
Eas
t
Syd
ney
Wes
t
Syd
ney
- C
ity
and
Inne
r S
out
h
Syd
ney
- P
arra
mat
ta
Syd
ney
- O
uter
Wes
t an
d B
lue
Mo
unta
ins
Syd
ney
- In
ner
So
uth
Wes
t
Hun
ter
Val
ley
exc
New
cast
le
Far
Wes
t an
d O
rana
Cen
tral
Wes
t
Cap
ital
Reg
ion
Illaw
arra
Cen
tral
Co
ast
NUMBER OF RESPONDENTS 15510 4016 4001 2508 2467 697 624 587 579 488 484 392 376
EMPLOYEE ENGAGEMENT 62% 65% 62% 65% 62% 58% 67% 61% 65% 56% 56% 65% 63%
ENGAGEMENT WITH WORK 66% 71% 67% 72% 67% 66% 69% 65% 68% 62% 56% 69% 68%
SENIOR MANAGERS 40% 43% 40% 46% 42% 35% 42% 40% 46% 31% 33% 39% 42%
COMMUNICATION 54% 59% 55% 61% 57% 50% 58% 54% 53% 47% 48% 55% 57%
HIGH PERFORMANCE 56% 60% 56% 61% 57% 52% 60% 53% 57% 47% 50% 58% 58%
PUBLIC SECTOR VALUES 53% 58% 54% 60% 56% 49% 57% 51% 54% 43% 46% 55% 56%
DIVERSITY & INCLUSION 63% 68% 65% 70% 67% 59% 70% 61% 63% 56% 57% 68% 65%
*Sydney East and Sydney West are higher level results for the Sydney sub-regions.
KEY AT LEAST 5 PERCENTAGE POINTS GREATER THAN REPORT SCORE
AT LEAST 5 PERCENTAGE POINTS LESS THAN REPORT SCORE
r = DATA RESTRICTED AS BELOW CUT OFF LIMIT OF 30 RESPONDENTS
ORC International | www.orcinternational.comPAGE 49NSW PMES 2018
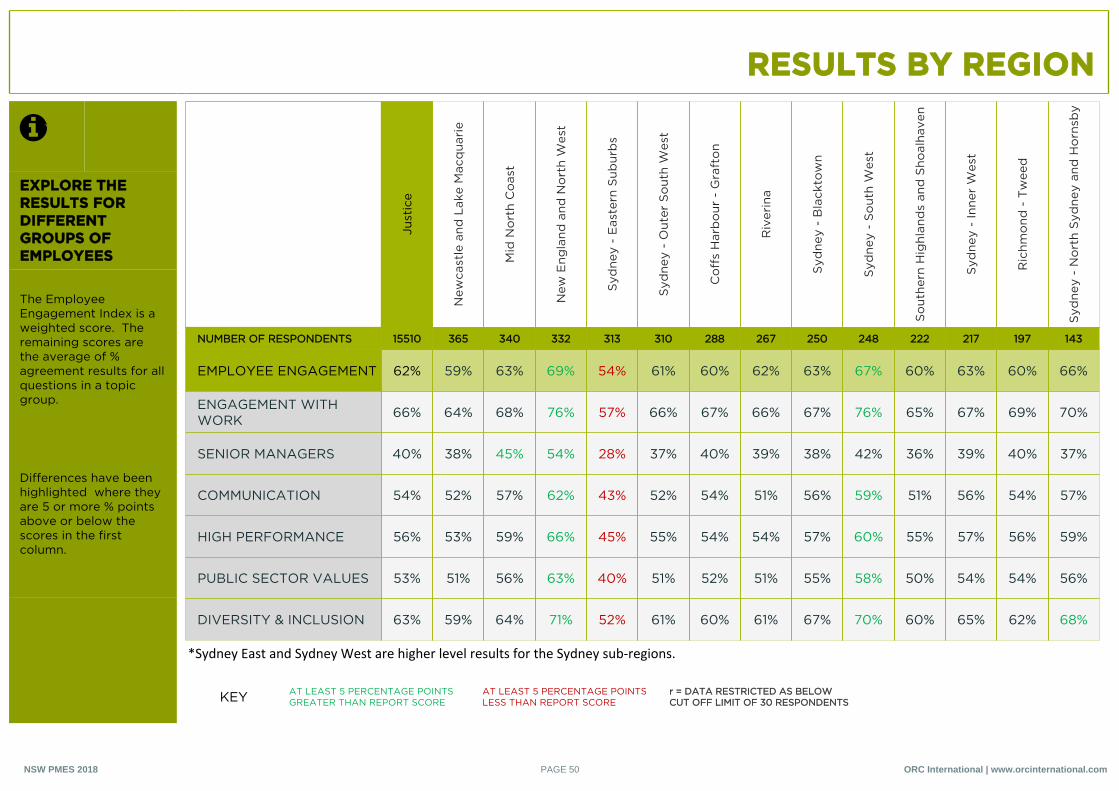
RESULTS BY REGION
EXPLORE THE RESULTS FOR DIFFERENT GROUPS OF EMPLOYEES
The Employee Engagement Index is a weighted score. The remaining scores are the average of % agreement results for all questions in a topic group.
Differences have been highlighted where they are 5 or more % points above or below the scores in the first column.
Just
ice
New
cast
le a
nd L
ake
Mac
qua
rie
Mid
No
rth
Co
ast
New
Eng
land
and
No
rth
Wes
t
Syd
ney
- E
aste
rn S
ubur
bs
Syd
ney
- O
uter
So
uth
Wes
t
Co
ffs
Har
bo
ur -
Gra
fto
n
Riv
erin
a
Syd
ney
- B
lack
tow
n
Syd
ney
- S
out
h W
est
So
uthe
rn H
ighl
and
s an
d S
hoal
have
n
Syd
ney
- In
ner
Wes
t
Ric
hmo
nd -
Tw
eed
Syd
ney
- N
ort
h S
ydne
y an
d H
orn
sby
NUMBER OF RESPONDENTS 15510 365 340 332 313 310 288 267 250 248 222 217 197 143
EMPLOYEE ENGAGEMENT 62% 59% 63% 69% 54% 61% 60% 62% 63% 67% 60% 63% 60% 66%
ENGAGEMENT WITH WORK 66% 64% 68% 76% 57% 66% 67% 66% 67% 76% 65% 67% 69% 70%
SENIOR MANAGERS 40% 38% 45% 54% 28% 37% 40% 39% 38% 42% 36% 39% 40% 37%
COMMUNICATION 54% 52% 57% 62% 43% 52% 54% 51% 56% 59% 51% 56% 54% 57%
HIGH PERFORMANCE 56% 53% 59% 66% 45% 55% 54% 54% 57% 60% 55% 57% 56% 59%
PUBLIC SECTOR VALUES 53% 51% 56% 63% 40% 51% 52% 51% 55% 58% 50% 54% 54% 56%
DIVERSITY & INCLUSION 63% 59% 64% 71% 52% 61% 60% 61% 67% 70% 60% 65% 62% 68%
*Sydney East and Sydney West are higher level results for the Sydney sub-regions.
KEY AT LEAST 5 PERCENTAGE POINTS GREATER THAN REPORT SCORE
AT LEAST 5 PERCENTAGE POINTS LESS THAN REPORT SCORE
r = DATA RESTRICTED AS BELOW CUT OFF LIMIT OF 30 RESPONDENTS
ORC International | www.orcinternational.comPAGE 50NSW PMES 2018
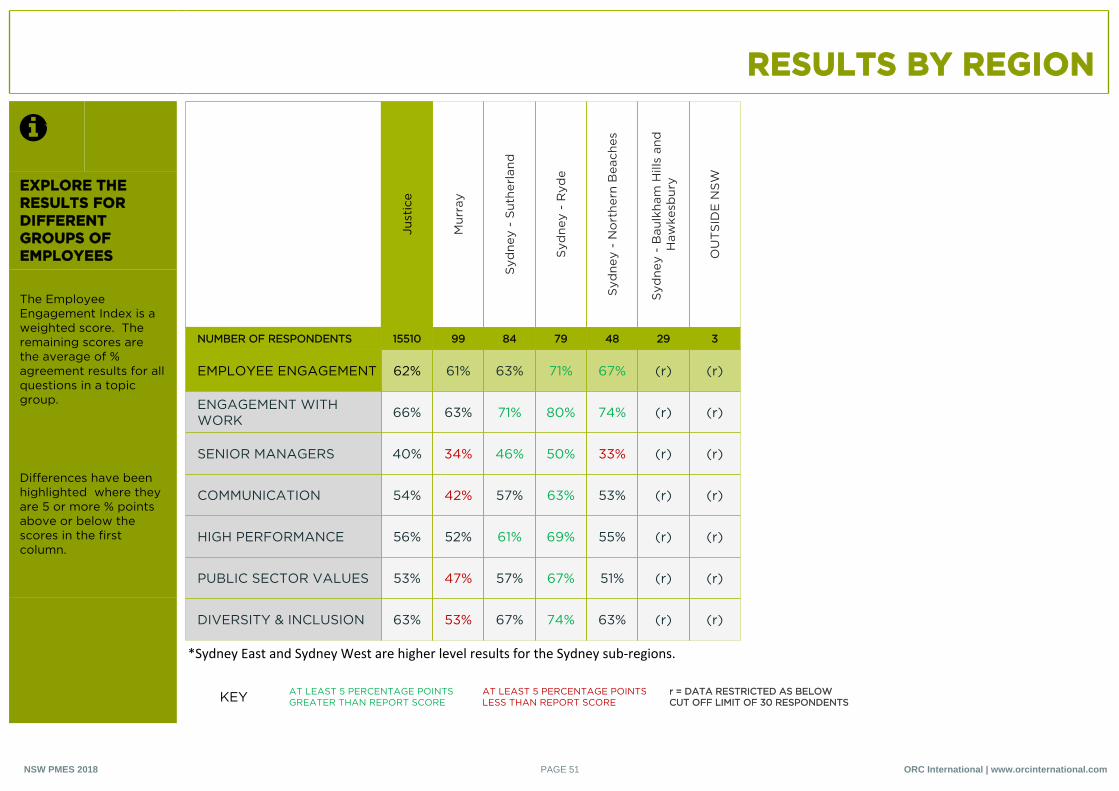
RESULTS BY REGION
EXPLORE THE RESULTS FOR DIFFERENT GROUPS OF EMPLOYEES
The Employee Engagement Index is a weighted score. The remaining scores are the average of % agreement results for all questions in a topic group.
Differences have been highlighted where they are 5 or more % points above or below the scores in the first column.
Just
ice
Mur
ray
Syd
ney
- S
uthe
rlan
d
Syd
ney
- R
yde
Syd
ney
- N
ort
hern
Bea
ches
Syd
ney
- B
aulk
ham
Hill
s an
d
Haw
kesb
ury
OU
TS
IDE
NS
W
NUMBER OF RESPONDENTS 15510 99 84 79 48 29 3
EMPLOYEE ENGAGEMENT 62% 61% 63% 71% 67% (r) (r)
ENGAGEMENT WITH WORK 66% 63% 71% 80% 74% (r) (r)
SENIOR MANAGERS 40% 34% 46% 50% 33% (r) (r)
COMMUNICATION 54% 42% 57% 63% 53% (r) (r)
HIGH PERFORMANCE 56% 52% 61% 69% 55% (r) (r)
PUBLIC SECTOR VALUES 53% 47% 57% 67% 51% (r) (r)
DIVERSITY & INCLUSION 63% 53% 67% 74% 63% (r) (r)
*Sydney East and Sydney West are higher level results for the Sydney sub-regions.
KEY AT LEAST 5 PERCENTAGE POINTS GREATER THAN REPORT SCORE
AT LEAST 5 PERCENTAGE POINTS LESS THAN REPORT SCORE
r = DATA RESTRICTED AS BELOW CUT OFF LIMIT OF 30 RESPONDENTS
ORC International | www.orcinternational.comPAGE 51NSW PMES 2018
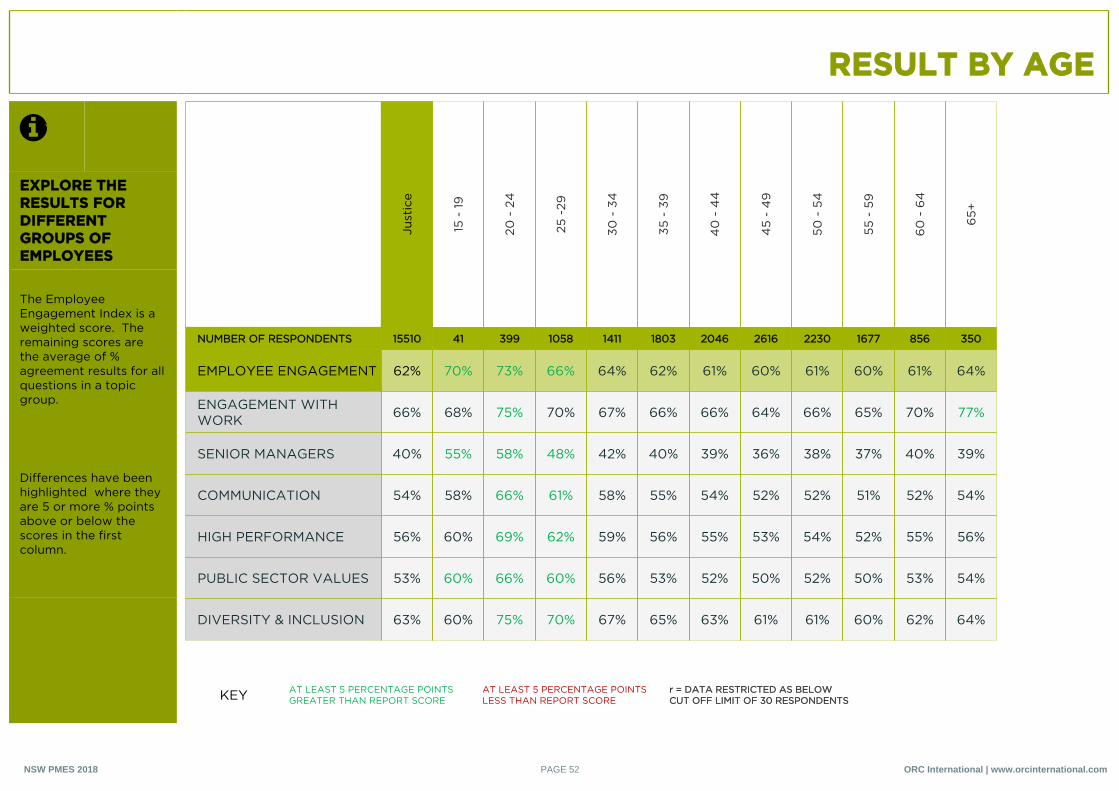
RESULT BY AGE
EXPLORE THE RESULTS FOR DIFFERENT GROUPS OF EMPLOYEES
The Employee Engagement Index is a weighted score. The remaining scores are the average of % agreement results for all questions in a topic group.
Differences have been highlighted where they are 5 or more % points above or below the scores in the first column.
Just
ice
15 -
19
20 -
24
25 -
29
30 -
34
35 -
39
40
- 4
4
45
- 4
9
50 -
54
55 -
59
60
- 6
4
65+
NUMBER OF RESPONDENTS 15510 41 399 1058 1411 1803 2046 2616 2230 1677 856 350
EMPLOYEE ENGAGEMENT 62% 70% 73% 66% 64% 62% 61% 60% 61% 60% 61% 64%
ENGAGEMENT WITH WORK 66% 68% 75% 70% 67% 66% 66% 64% 66% 65% 70% 77%
SENIOR MANAGERS 40% 55% 58% 48% 42% 40% 39% 36% 38% 37% 40% 39%
COMMUNICATION 54% 58% 66% 61% 58% 55% 54% 52% 52% 51% 52% 54%
HIGH PERFORMANCE 56% 60% 69% 62% 59% 56% 55% 53% 54% 52% 55% 56%
PUBLIC SECTOR VALUES 53% 60% 66% 60% 56% 53% 52% 50% 52% 50% 53% 54%
DIVERSITY & INCLUSION 63% 60% 75% 70% 67% 65% 63% 61% 61% 60% 62% 64%
KEY AT LEAST 5 PERCENTAGE POINTS GREATER THAN REPORT SCORE
AT LEAST 5 PERCENTAGE POINTS LESS THAN REPORT SCORE
r = DATA RESTRICTED AS BELOW CUT OFF LIMIT OF 30 RESPONDENTS
ORC International | www.orcinternational.comPAGE 52NSW PMES 2018
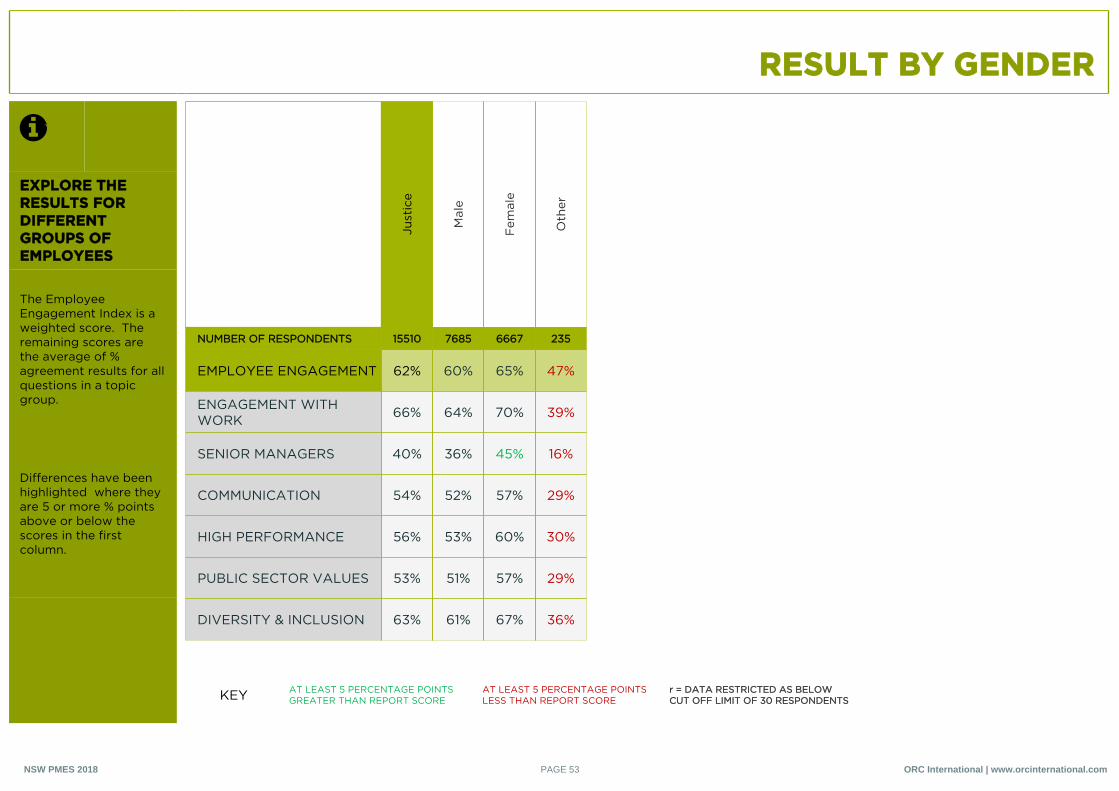
RESULT BY GENDER
EXPLORE THE RESULTS FOR DIFFERENT GROUPS OF EMPLOYEES
The Employee Engagement Index is a weighted score. The remaining scores are the average of % agreement results for all questions in a topic group.
Differences have been highlighted where they are 5 or more % points above or below the scores in the first column.
Just
ice
Mal
e
Fem
ale
Oth
er
NUMBER OF RESPONDENTS 15510 7685 6667 235
EMPLOYEE ENGAGEMENT 62% 60% 65% 47%
ENGAGEMENT WITH WORK 66% 64% 70% 39%
SENIOR MANAGERS 40% 36% 45% 16%
COMMUNICATION 54% 52% 57% 29%
HIGH PERFORMANCE 56% 53% 60% 30%
PUBLIC SECTOR VALUES 53% 51% 57% 29%
DIVERSITY & INCLUSION 63% 61% 67% 36%
KEY AT LEAST 5 PERCENTAGE POINTS GREATER THAN REPORT SCORE
AT LEAST 5 PERCENTAGE POINTS LESS THAN REPORT SCORE
r = DATA RESTRICTED AS BELOW CUT OFF LIMIT OF 30 RESPONDENTS
ORC International | www.orcinternational.comPAGE 53NSW PMES 2018
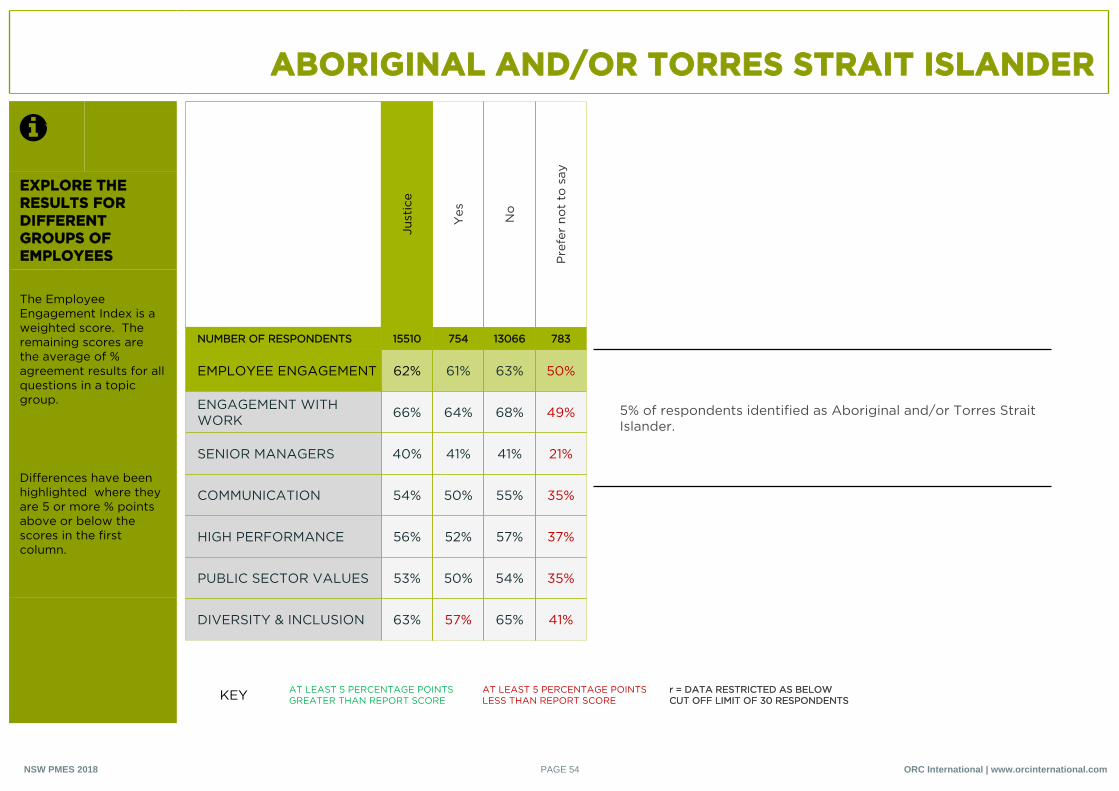
ABORIGINAL AND/OR TORRES STRAIT ISLANDER
EXPLORE THE RESULTS FOR DIFFERENT GROUPS OF EMPLOYEES
The Employee Engagement Index is a weighted score. The remaining scores are the average of % agreement results for all questions in a topic group.
Differences have been highlighted where they are 5 or more % points above or below the scores in the first column.
Just
ice
Yes No
Pre
fer
not
to s
ay
NUMBER OF RESPONDENTS 15510 754 13066 783
EMPLOYEE ENGAGEMENT 62% 61% 63% 50%
ENGAGEMENT WITH WORK 66% 64% 68% 49%
SENIOR MANAGERS 40% 41% 41% 21%
COMMUNICATION 54% 50% 55% 35%
HIGH PERFORMANCE 56% 52% 57% 37%
PUBLIC SECTOR VALUES 53% 50% 54% 35%
DIVERSITY & INCLUSION 63% 57% 65% 41%
5% of respondents identified as Aboriginal and/or Torres Strait Islander.
KEY AT LEAST 5 PERCENTAGE POINTS GREATER THAN REPORT SCORE
AT LEAST 5 PERCENTAGE POINTS LESS THAN REPORT SCORE
r = DATA RESTRICTED AS BELOW CUT OFF LIMIT OF 30 RESPONDENTS
ORC International | www.orcinternational.comPAGE 54NSW PMES 2018
LANGUAGE OTHER THAN ENGLISH
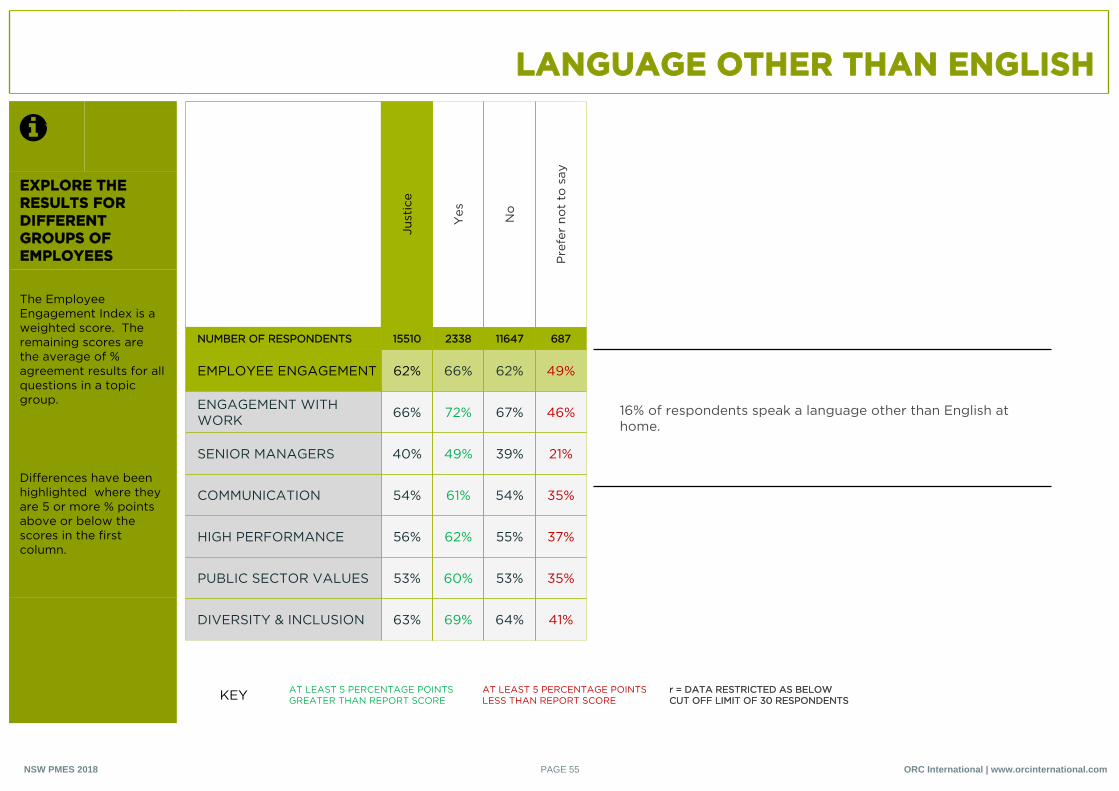
EXPLORE THE RESULTS FOR DIFFERENT GROUPS OF EMPLOYEES
The Employee Engagement Index is a weighted score. The remaining scores are the average of % agreement results for all questions in a topic group.
Differences have been highlighted where they are 5 or more % points above or below the scores in the first column.
Just
ice
Yes No
Pre
fer
not
to s
ay
NUMBER OF RESPONDENTS 15510 2338 11647 687
EMPLOYEE ENGAGEMENT 62% 66% 62% 49%
ENGAGEMENT WITH WORK 66% 72% 67% 46%
SENIOR MANAGERS 40% 49% 39% 21%
COMMUNICATION 54% 61% 54% 35%
HIGH PERFORMANCE 56% 62% 55% 37%
PUBLIC SECTOR VALUES 53% 60% 53% 35%
DIVERSITY & INCLUSION 63% 69% 64% 41%
16% of respondents speak a language other than English at home.
KEY AT LEAST 5 PERCENTAGE POINTS GREATER THAN REPORT SCORE
AT LEAST 5 PERCENTAGE POINTS LESS THAN REPORT SCORE
r = DATA RESTRICTED AS BELOW CUT OFF LIMIT OF 30 RESPONDENTS
ORC International | www.orcinternational.comPAGE 55NSW PMES 2018
DISABILITY
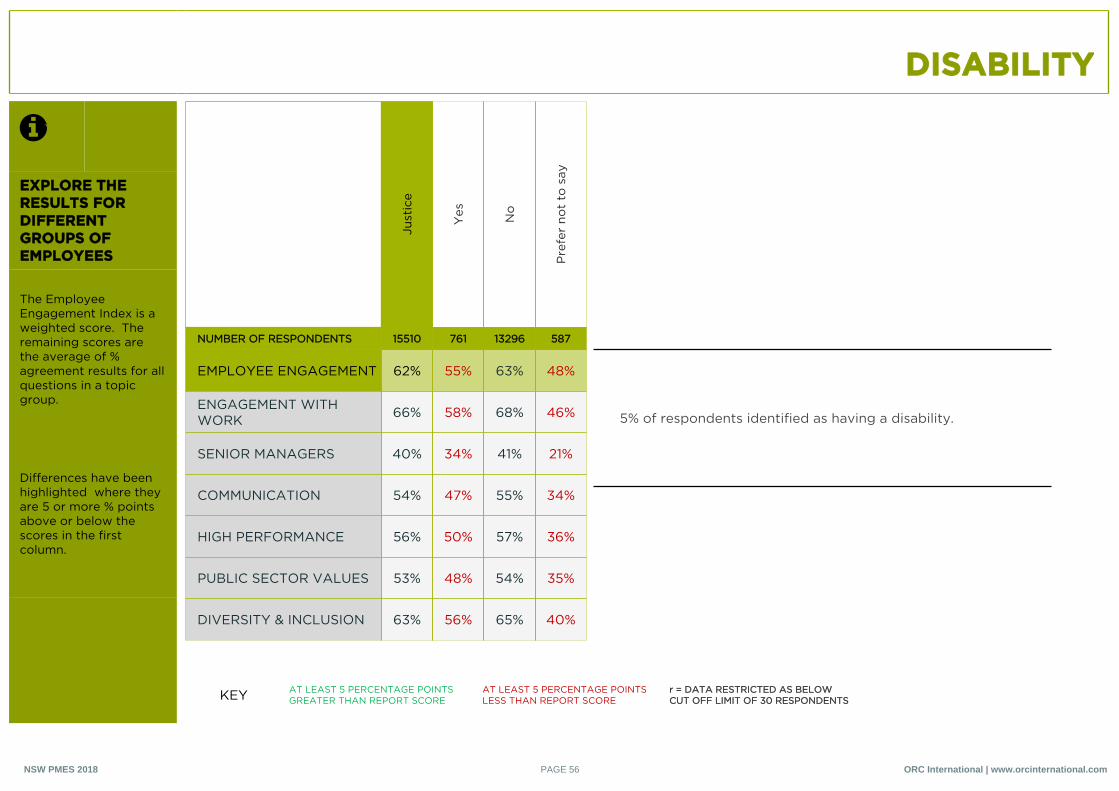
EXPLORE THE RESULTS FOR DIFFERENT GROUPS OF EMPLOYEES
The Employee Engagement Index is a weighted score. The remaining scores are the average of % agreement results for all questions in a topic group.
Differences have been highlighted where they are 5 or more % points above or below the scores in the first column.
Just
ice
Yes No
Pre
fer
not
to s
ay
NUMBER OF RESPONDENTS 15510 761 13296 587
EMPLOYEE ENGAGEMENT 62% 55% 63% 48%
ENGAGEMENT WITH WORK 66% 58% 68% 46%
SENIOR MANAGERS 40% 34% 41% 21%
COMMUNICATION 54% 47% 55% 34%
HIGH PERFORMANCE 56% 50% 57% 36%
PUBLIC SECTOR VALUES 53% 48% 54% 35%
DIVERSITY & INCLUSION 63% 56% 65% 40%
5% of respondents identified as having a disability.
KEY AT LEAST 5 PERCENTAGE POINTS GREATER THAN REPORT SCORE
AT LEAST 5 PERCENTAGE POINTS LESS THAN REPORT SCORE
r = DATA RESTRICTED AS BELOW CUT OFF LIMIT OF 30 RESPONDENTS
ORC International | www.orcinternational.comPAGE 56NSW PMES 2018

MENTAL HEALTH
EXPLORE THE RESULTS FOR DIFFERENT GROUPS OF EMPLOYEES
The Employee Engagement Index is a weighted score. The remaining scores are the average of % agreement results for all questions in a topic group.
Differences have been highlighted where they are 5 or more % points above or below the scores in the first column.
Just
ice
Yes No
Pre
fer
not
to s
ay
NUMBER OF RESPONDENTS 15510 1199 12543 878
EMPLOYEE ENGAGEMENT 62% 52% 63% 52%
ENGAGEMENT WITH WORK 66% 50% 69% 48%
SENIOR MANAGERS 40% 29% 42% 26%
COMMUNICATION 54% 42% 56% 38%
HIGH PERFORMANCE 56% 46% 58% 42%
PUBLIC SECTOR VALUES 53% 43% 55% 40%
DIVERSITY & INCLUSION 63% 51% 66% 47%
8% of respondents identified as having a mental health condition.
KEY AT LEAST 5 PERCENTAGE POINTS GREATER THAN REPORT SCORE
AT LEAST 5 PERCENTAGE POINTS LESS THAN REPORT SCORE
r = DATA RESTRICTED AS BELOW CUT OFF LIMIT OF 30 RESPONDENTS
ORC International | www.orcinternational.comPAGE 57NSW PMES 2018
LGBTI
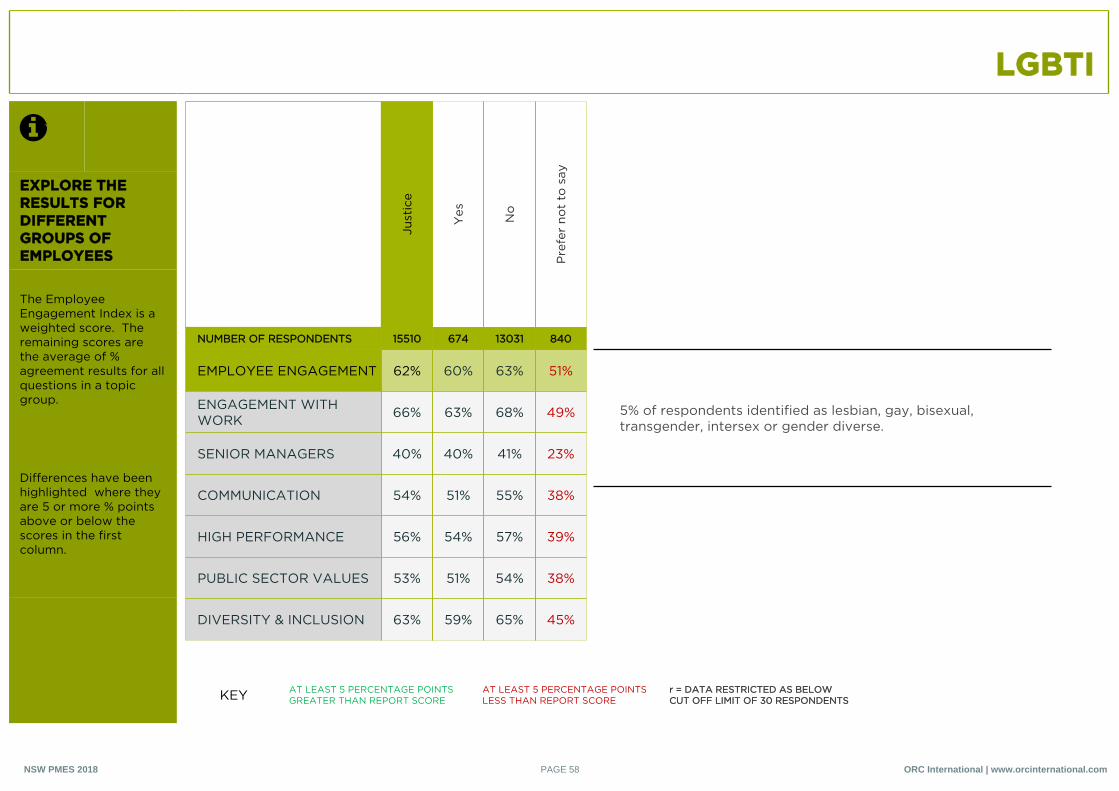
EXPLORE THE RESULTS FOR DIFFERENT GROUPS OF EMPLOYEES
The Employee Engagement Index is a weighted score. The remaining scores are the average of % agreement results for all questions in a topic group.
Differences have been highlighted where they are 5 or more % points above or below the scores in the first column.
Just
ice
Yes No
Pre
fer
not
to s
ay
NUMBER OF RESPONDENTS 15510 674 13031 840
EMPLOYEE ENGAGEMENT 62% 60% 63% 51%
ENGAGEMENT WITH WORK 66% 63% 68% 49%
SENIOR MANAGERS 40% 40% 41% 23%
COMMUNICATION 54% 51% 55% 38%
HIGH PERFORMANCE 56% 54% 57% 39%
PUBLIC SECTOR VALUES 53% 51% 54% 38%
DIVERSITY & INCLUSION 63% 59% 65% 45%
5% of respondents identified as lesbian, gay, bisexual, transgender, intersex or gender diverse.
KEY AT LEAST 5 PERCENTAGE POINTS GREATER THAN REPORT SCORE
AT LEAST 5 PERCENTAGE POINTS LESS THAN REPORT SCORE
r = DATA RESTRICTED AS BELOW CUT OFF LIMIT OF 30 RESPONDENTS
ORC International | www.orcinternational.comPAGE 58NSW PMES 2018
WHAT IS YOUR WORK LOCATION?
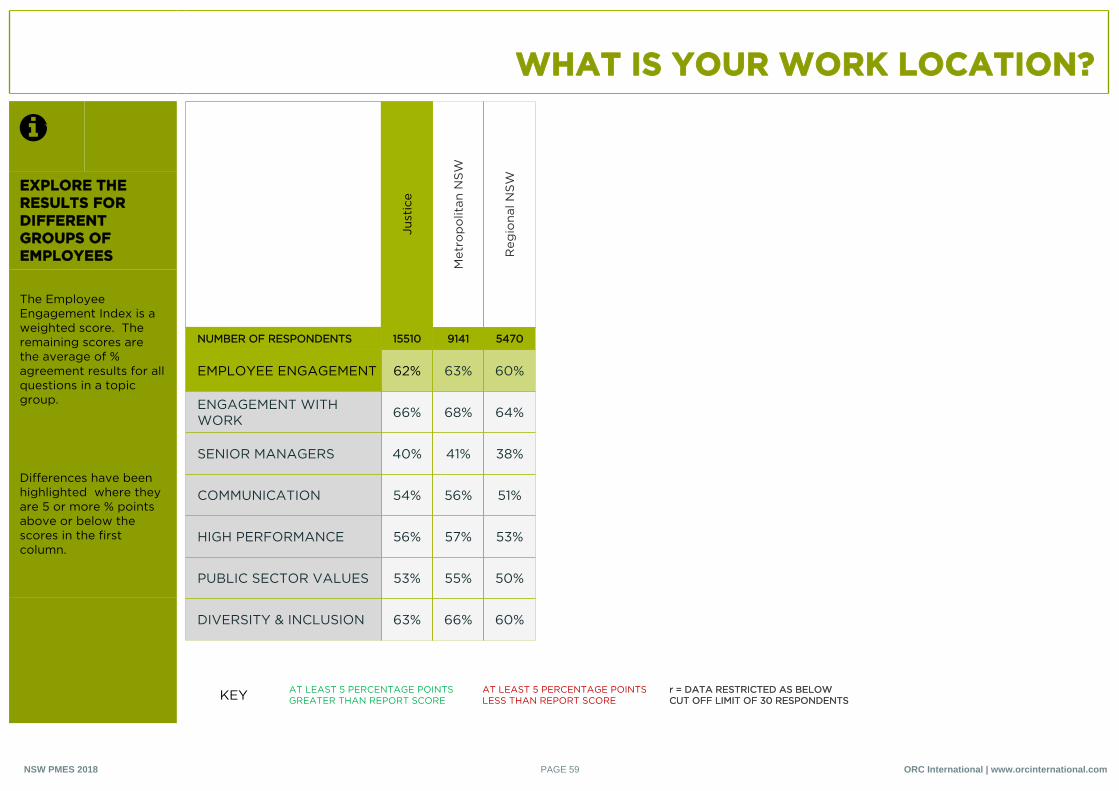
EXPLORE THE RESULTS FOR DIFFERENT GROUPS OF EMPLOYEES
The Employee Engagement Index is a weighted score. The remaining scores are the average of % agreement results for all questions in a topic group.
Differences have been highlighted where they are 5 or more % points above or below the scores in the first column.
Just
ice
Met
rop
olit
an N
SW
Reg
iona
l NS
W
NUMBER OF RESPONDENTS 15510 9141 5470
EMPLOYEE ENGAGEMENT 62% 63% 60%
ENGAGEMENT WITH WORK 66% 68% 64%
SENIOR MANAGERS 40% 41% 38%
COMMUNICATION 54% 56% 51%
HIGH PERFORMANCE 56% 57% 53%
PUBLIC SECTOR VALUES 53% 55% 50%
DIVERSITY & INCLUSION 63% 66% 60%
KEY AT LEAST 5 PERCENTAGE POINTS GREATER THAN REPORT SCORE
AT LEAST 5 PERCENTAGE POINTS LESS THAN REPORT SCORE
r = DATA RESTRICTED AS BELOW CUT OFF LIMIT OF 30 RESPONDENTS
ORC International | www.orcinternational.comPAGE 59NSW PMES 2018
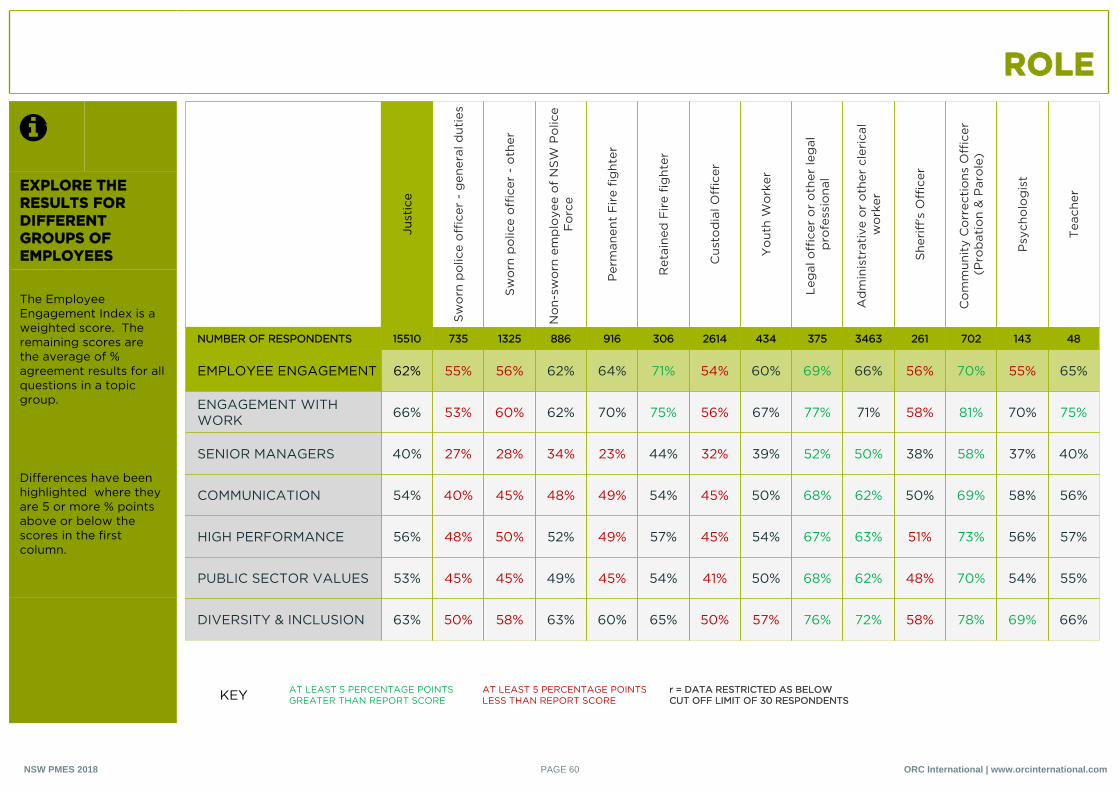
ROLE
EXPLORE THE RESULTS FOR DIFFERENT GROUPS OF EMPLOYEES
The Employee Engagement Index is a weighted score. The remaining scores are the average of % agreement results for all questions in a topic group.
Differences have been highlighted where they are 5 or more % points above or below the scores in the first column.
Just
ice
Sw
orn
po
lice
off
icer
- g
ener
al d
utie
s
Sw
orn
po
lice
off
icer
- o
ther
No
n-sw
orn
em
plo
yee
of
NS
W P
olic
e F
orc
e
Per
man
ent
Fir
e fi
ght
er
Ret
aine
d F
ire
fig
hter
Cus
tod
ial O
ffic
er
Yo
uth
Wo
rker
Leg
al o
ffic
er o
r o
ther
leg
al
pro
fess
iona
l
Ad
min
istr
ativ
e o
r o
ther
cle
rica
l w
ork
er
She
riff
's O
ffic
er
Co
mm
unit
y C
orr
ecti
ons
Off
icer
(P
rob
atio
n &
Par
ole
)
Psy
cho
log
ist
Tea
cher
NUMBER OF RESPONDENTS 15510 735 1325 886 916 306 2614 434 375 3463 261 702 143 48
EMPLOYEE ENGAGEMENT 62% 55% 56% 62% 64% 71% 54% 60% 69% 66% 56% 70% 55% 65%
ENGAGEMENT WITH WORK 66% 53% 60% 62% 70% 75% 56% 67% 77% 71% 58% 81% 70% 75%
SENIOR MANAGERS 40% 27% 28% 34% 23% 44% 32% 39% 52% 50% 38% 58% 37% 40%
COMMUNICATION 54% 40% 45% 48% 49% 54% 45% 50% 68% 62% 50% 69% 58% 56%
HIGH PERFORMANCE 56% 48% 50% 52% 49% 57% 45% 54% 67% 63% 51% 73% 56% 57%
PUBLIC SECTOR VALUES 53% 45% 45% 49% 45% 54% 41% 50% 68% 62% 48% 70% 54% 55%
DIVERSITY & INCLUSION 63% 50% 58% 63% 60% 65% 50% 57% 76% 72% 58% 78% 69% 66%
KEY AT LEAST 5 PERCENTAGE POINTS GREATER THAN REPORT SCORE
AT LEAST 5 PERCENTAGE POINTS LESS THAN REPORT SCORE
r = DATA RESTRICTED AS BELOW CUT OFF LIMIT OF 30 RESPONDENTS
ORC International | www.orcinternational.comPAGE 60NSW PMES 2018
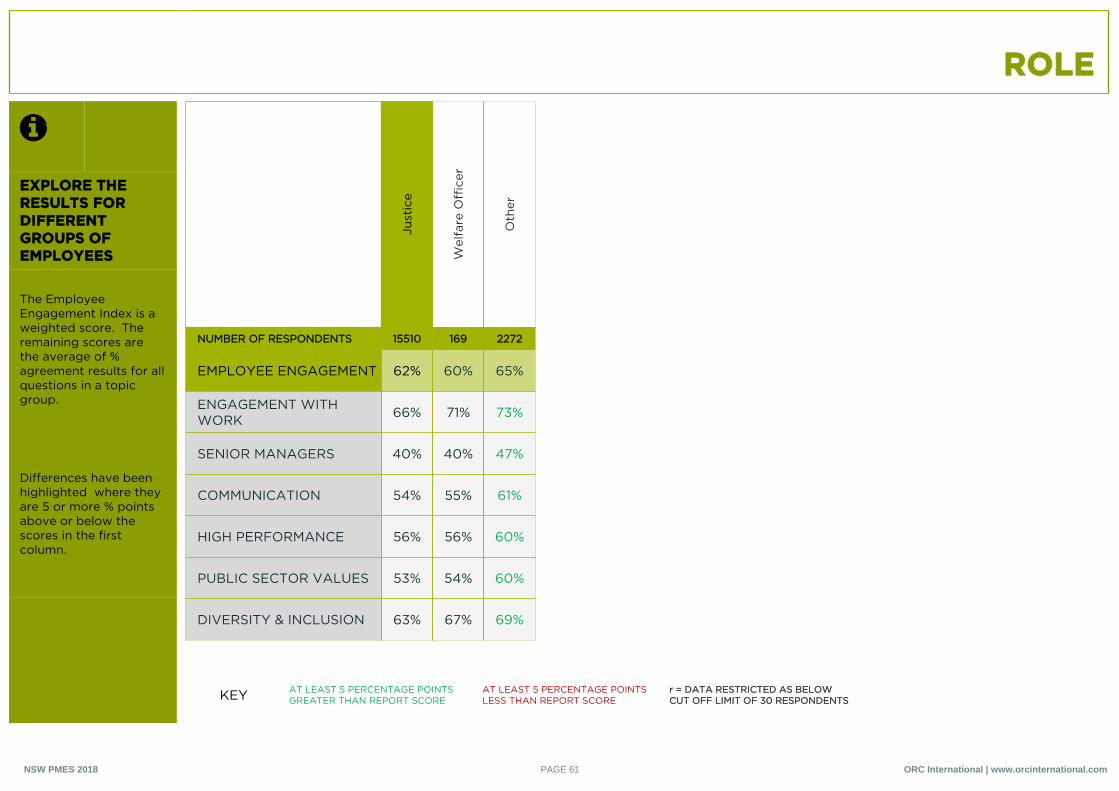
ROLE
EXPLORE THE RESULTS FOR DIFFERENT GROUPS OF EMPLOYEES
The Employee Engagement Index is a weighted score. The remaining scores are the average of % agreement results for all questions in a topic group.
Differences have been highlighted where they are 5 or more % points above or below the scores in the first column.
Just
ice
Wel
fare
Off
icer
Oth
er
NUMBER OF RESPONDENTS 15510 169 2272
EMPLOYEE ENGAGEMENT 62% 60% 65%
ENGAGEMENT WITH WORK 66% 71% 73%
SENIOR MANAGERS 40% 40% 47%
COMMUNICATION 54% 55% 61%
HIGH PERFORMANCE 56% 56% 60%
PUBLIC SECTOR VALUES 53% 54% 60%
DIVERSITY & INCLUSION 63% 67% 69%
KEY AT LEAST 5 PERCENTAGE POINTS GREATER THAN REPORT SCORE
AT LEAST 5 PERCENTAGE POINTS LESS THAN REPORT SCORE
r = DATA RESTRICTED AS BELOW CUT OFF LIMIT OF 30 RESPONDENTS
ORC International | www.orcinternational.comPAGE 61NSW PMES 2018
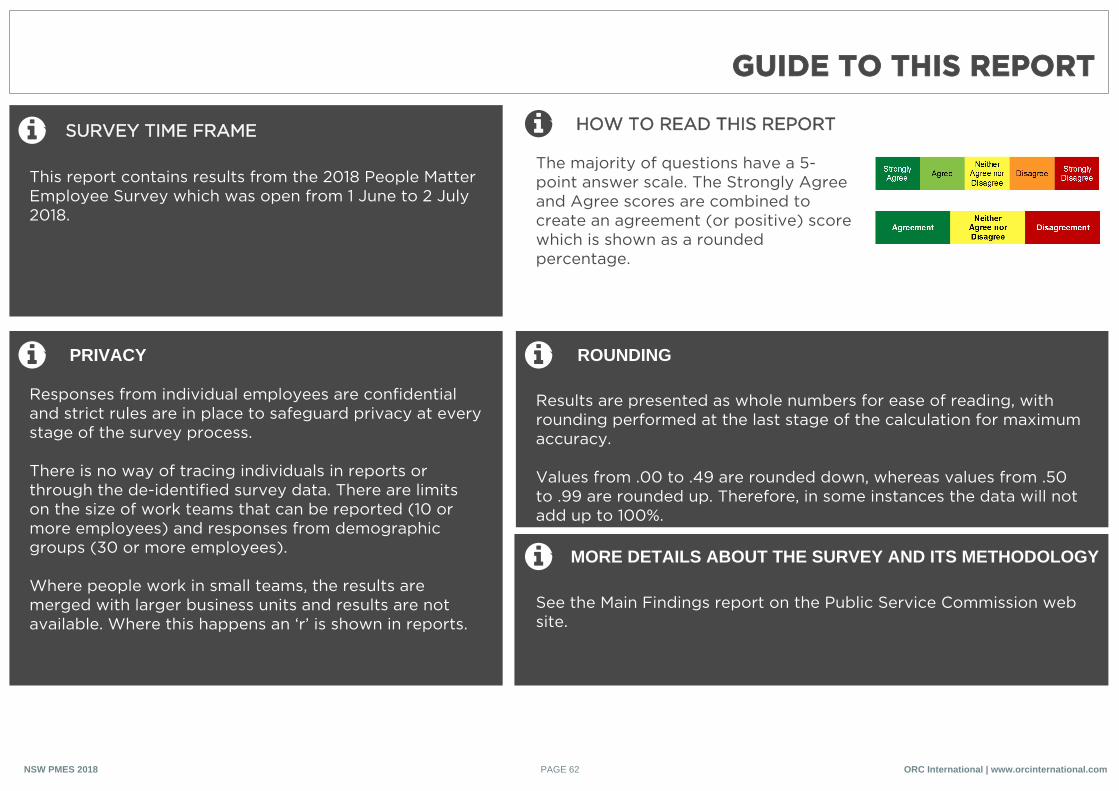
GUIDE TO THIS REPORT
Responses from individual employees are confidential and strict rules are in place to safeguard privacy at every stage of the survey process.
There is no way of tracing individuals in reports or through the de-identified survey data. There are limits on the size of work teams that can be reported (10 or more employees) and responses from demographic groups (30 or more employees).
Where people work in small teams, the results are merged with larger business units and results are not available. Where this happens an ‘r’ is shown in reports.
PRIVACY
Results are presented as whole numbers for ease of reading, with rounding performed at the last stage of the calculation for maximum accuracy.
Values from .00 to .49 are rounded down, whereas values from .50 to .99 are rounded up. Therefore, in some instances the data will not add up to 100%.
ROUNDING
See the Main Findings report on the Public Service Commission web site.
MORE DETAILS ABOUT THE SURVEY AND ITS METHODOLOGY
SURVEY TIME FRAME
This report contains results from the 2018 People Matter Employee Survey which was open from 1 June to 2 July 2018.
HOW TO READ THIS REPORT
The majority of questions have a 5-point answer scale. The Strongly Agree and Agree scores are combined to create an agreement (or positive) score which is shown as a rounded percentage.
ORC International | www.orcinternational.comPAGE 62NSW PMES 2018
Related Documents