Christopher Wood [email protected] +852 2600 8516 Thursday, 06 February 2014 Page 1 Bye bye Ben Geneva Billyboy Ben has vacated the Federal Reserve for the Brookings Institution, the natural home of the “liberal” Washington intellectual establishment, even though Bernanke remains a registered Republican. History will note that Bernanke commenced “tapering” before his departure. Still the interesting point to GREED & fear remains that the Treasury bond market’s response to the initial reduction in Fed purchases of securities has so far been the same as the first two times the Fed stopped QE. That is that the Treasury bond has been rallying, as noted here last week (see GREED & fear – Hong Kong’s holding pattern, 30 January 2014). Thus, the 10-year Treasury bond yield has fallen by 23bp since the Fed first announced a US$10bn tapering on 18 December, and is now 37bp below its recent high reached at the end of 2013 (see Figure 1). Figure 1 US 10-year Treasury bond yield Source: Bloomberg This is in direct contrast to the view of the consensus prevailing in the equity world, which is that bonds should sell off when quanto easing ends even though this is exactly what did not happen on the two previous occasions when QE ended; though clearly this time is a little different as so far markets are only focusing on “tapering” not the ending of QE. Still given the fact that the Fed bought one-third of the securities purchased under QE during 2013, a year when the glut of “Fed watchers” were talking about “tapering”, GREED & fear would advise investors not to underestimate the impact of any decline in securities purchased. On this point, the Fed’s holdings of securities have increased by US$3.3tn since the beginning of 2009 to US$3.8tn at the end of January, with US$1.1tn of that increase occurring in 2013. Now, clearly, if the American economy is really achieving “escape velocity”, then Treasury bonds should sell off as nominal GDP growth accelerates to a higher sustainable level than has so far prevailed since the recovery begun in 2009. But this is not GREED & fear’s view. In this respect, the latest GDP data is not quite as impressive as seen by the consensus. True, nominal GDP growth accelerated to 4.2%YoY in 4Q13, slightly above the annualised rate of 4% since the recovery began in 2H09. But excluding inventory, nominal final sales of domestic product rose by 3.3%YoY in 4Q13, up only from 3%YoY in 2Q13 (see Figure 2). 1.5 1.7 1.9 2.1 2.3 2.5 2.7 2.9 3.1 Jan 13 Feb 13 Mar 13 Apr 13 May 13 Jun 13 Jul 13 Aug 13 Sep 13 Oct 13 Nov 13 Dec 13 Jan 14 Feb 14 (%) US 10Y Treasury bond yield Prepared for: Bloomberg

Welcome message from author
This document is posted to help you gain knowledge. Please leave a comment to let me know what you think about it! Share it to your friends and learn new things together.
Transcript

Christopher Wood [email protected] +852 2600 8516
Thursday, 06 February 2014 Page 1
Bye bye Ben Geneva Billyboy Ben has vacated the Federal Reserve for the Brookings Institution, the natural home of the “liberal” Washington intellectual establishment, even though Bernanke remains a registered Republican. History will note that Bernanke commenced “tapering” before his departure. Still the interesting point to GREED & fear remains that the Treasury bond market’s response to the initial reduction in Fed purchases of securities has so far been the same as the first two times the Fed stopped QE. That is that the Treasury bond has been rallying, as noted here last week (see GREED & fear – Hong Kong’s holding pattern, 30 January 2014). Thus, the 10-year Treasury bond yield has fallen by 23bp since the Fed first announced a US$10bn tapering on 18 December, and is now 37bp below its recent high reached at the end of 2013 (see Figure 1).
Figure 1 US 10-year Treasury bond yield
Source: Bloomberg
This is in direct contrast to the view of the consensus prevailing in the equity world, which is that bonds should sell off when quanto easing ends even though this is exactly what did not happen on the two previous occasions when QE ended; though clearly this time is a little different as so far markets are only focusing on “tapering” not the ending of QE. Still given the fact that the Fed bought one-third of the securities purchased under QE during 2013, a year when the glut of “Fed watchers” were talking about “tapering”, GREED & fear would advise investors not to underestimate the impact of any decline in securities purchased. On this point, the Fed’s holdings of securities have increased by US$3.3tn since the beginning of 2009 to US$3.8tn at the end of January, with US$1.1tn of that increase occurring in 2013.
Now, clearly, if the American economy is really achieving “escape velocity”, then Treasury bonds should sell off as nominal GDP growth accelerates to a higher sustainable level than has so far prevailed since the recovery begun in 2009. But this is not GREED & fear’s view. In this respect, the latest GDP data is not quite as impressive as seen by the consensus. True, nominal GDP growth accelerated to 4.2%YoY in 4Q13, slightly above the annualised rate of 4% since the recovery began in 2H09. But excluding inventory, nominal final sales of domestic product rose by 3.3%YoY in 4Q13, up only from 3%YoY in 2Q13 (see Figure 2).
1.5
1.7
1.9
2.1
2.3
2.5
2.7
2.9
3.1
Jan
13
Feb
13
Mar
13
Apr
13
May
13
Jun
13
Jul 1
3
Aug
13
Sep
13
Oct
13
Nov
13
Dec
13
Jan
14
Feb
14
(%) US 10Y Treasury bond yield
Prepared for: Bloomberg
Christopher Wood [email protected] +852 2600 8516
Thursday, 06 February 2014 Page 2
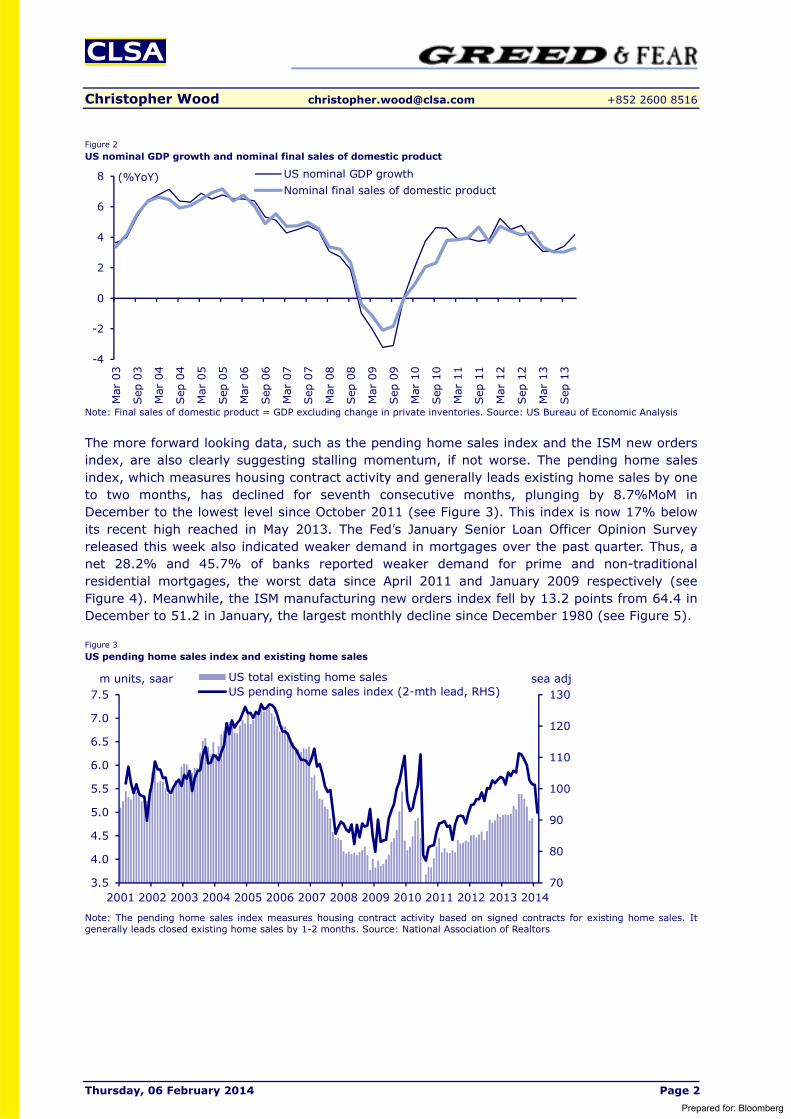
Figure 2 US nominal GDP growth and nominal final sales of domestic product
Note: Final sales of domestic product = GDP excluding change in private inventories. Source: US Bureau of Economic Analysis
The more forward looking data, such as the pending home sales index and the ISM new orders index, are also clearly suggesting stalling momentum, if not worse. The pending home sales index, which measures housing contract activity and generally leads existing home sales by one to two months, has declined for seventh consecutive months, plunging by 8.7%MoM in December to the lowest level since October 2011 (see Figure 3). This index is now 17% below its recent high reached in May 2013. The Fed’s January Senior Loan Officer Opinion Survey released this week also indicated weaker demand in mortgages over the past quarter. Thus, a net 28.2% and 45.7% of banks reported weaker demand for prime and non-traditional residential mortgages, the worst data since April 2011 and January 2009 respectively (see Figure 4). Meanwhile, the ISM manufacturing new orders index fell by 13.2 points from 64.4 in December to 51.2 in January, the largest monthly decline since December 1980 (see Figure 5).
Figure 3 US pending home sales index and existing home sales
Note: The pending home sales index measures housing contract activity based on signed contracts for existing home sales. It generally leads closed existing home sales by 1-2 months. Source: National Association of Realtors
-4
-2
0
2
4
6
8
Mar
03
Sep
03
Mar
04
Sep
04
Mar
05
Sep
05
Mar
06
Sep
06
Mar
07
Sep
07
Mar
08
Sep
08
Mar
09
Sep
09
Mar
10
Sep
10
Mar
11
Sep
11
Mar
12
Sep
12
Mar
13
Sep
13
(%YoY) US nominal GDP growthNominal final sales of domestic product
70
80
90
100
110
120
130
3.5
4.0
4.5
5.0
5.5
6.0
6.5
7.0
7.5
2001 2002 2003 2004 2005 2006 2007 2008 2009 2010 2011 2012 2013 2014
US total existing home salesUS pending home sales index (2-mth lead, RHS)
m units, saar sea adj
Prepared for: Bloomberg

Christopher Wood [email protected] +852 2600 8516
Thursday, 06 February 2014 Page 3
Figure 4 Net percentage of US banks reporting stronger demand for residential mortgages
Source: Federal Reserve - Senior Loan Officer Opinion Survey on Bank Lending Practices
Figure 5 US ISM manufacturing new orders index
Source: ISM
All this means that the US payroll data on Friday will be more important than normal given the overwhelming view in the market that December data was impacted by the weather, though it is also clearly the case that the weather has remained bad in January. It will certainly be watched closely by Fed Chairwoman Janet Yellen. Based on her public speeches, GREED & fear would suspect that she is rather nervous not only about tapering but also about the market consensus that tapering will be on an automatic US$10bn reduction at every FOMC meeting throughout the year. After all, inflation is still running at only 1.2%YoY based on the Fed’s favourite indicator, the price index of core personal consumption (see Figure 6), while America’s real unemployment rate is more likely in the range of 13%, based on the Bureau of Labour Statistics’ broadest measure of labour underutilisation which includes people who have given up looking for work or are working part time for economic reasons (see Figure 7).
Certainly, continuing disappointing macro data will soon raise an important issue. This is whether the Fed has decided, as many investors seem to believe, to get out of QE regardless of the data or whether policy on QE remains “data dependent”, which has been the official line of both Yellen and Bernanke. For now GREED & fear has continued to take the Fed at face value (i.e. the policy is data dependent). This means that if data disappoints and market action turns sufficiently negative then the Fed will first end tapering and even accelerate QE.
(80)
(60)
(40)
(20)
0
20
40
60
Apr
07
Jul 0
7O
ct 0
7Ja
n 08
Apr
08
Jul 0
8O
ct 0
8Ja
n 09
Apr
09
Jul 0
9O
ct 0
9Ja
n 10
Apr
10
Jul 1
0O
ct 1
0Ja
n 11
Apr
11
Jul 1
1O
ct 1
1Ja
n 12
Apr
12
Jul 1
2O
ct 1
2Ja
n 13
Apr
13
Jul 1
3O
ct 1
3Ja
n 14
(%) Prime mortgages Non-traditional mortgages
20
30
40
50
60
70
80
1979
1981
1983
1985
1987
1989
1991
1993
1995
1997
1999
2001
2003
2005
2007
2009
2011
2013
US ISM manufacturing survey - New orders index
Prepared for: Bloomberg

Christopher Wood [email protected] +852 2600 8516
Thursday, 06 February 2014 Page 4
Figure 6 US core PCE price index growth
Source: US Bureau of Economic Analysis
Figure 7 US measures of labour underutilisation
Note: U-6 measure include unemployed persons, persons who have given up looking for work but indicate that they want and are available for a job, and those employed part time for economic reasons. Source: US Bureau of Labour Statistics
But when GREED & fear refers to negative market action from a growth perspective, GREED & fear refers primarily to market action in the US, be it falling share prices or declining Treasury bond yields. In this context, it would seem clear that the Fed is seeking to convey the message that it does not want to be panicked into renewed easing by the current so-called “turmoil” in emerging markets. As regards this “turmoil”, there are two interesting points to note. The first is that the negative market action in emerging market debt and currencies is now much more concentrated in those countries which have high US dollar indebtedness, and so should be vulnerable, such as Turkey and Ukraine, rather than the likes of Indonesia and the Philippines (see Figure 8). Second, the latest emerging market debt selloff has, interestingly, not been correlated to a selloff in the Treasury bond market but rather the reverse. This has, for now at least, broken the strong correlation that was in evidence last year. Thus, the EMBI+ emerging market sovereign bond yield has risen by 22bp since mid-January, while the 10-year US Treasury bond yield has fallen by 23bp over the same period (see Figure 9). As a consequence, the correlation between EMBI+ sovereign bond yield and the US 10-year Treasury bond yield is a negative 0.82 so far this year, compared with a positive 0.97 in 2013.
0123456789
1011
1960 1965 1970 1975 1980 1985 1990 1995 2000 2005 2010
US core PCE price index growth(%YoY)
0
2
4
6
8
10
12
14
16
18
1948 1957 1966 1975 1984 1993 2002 2011
Broadest measure of labor underutilisation (U-6)US official unemployment rate
(%)
Prepared for: Bloomberg

Christopher Wood [email protected] +852 2600 8516
Thursday, 06 February 2014 Page 5
Figure 8 Emerging market currencies against the US dollar (Year to date 2014)
Source: Bloomberg
Figure 9 Emerging market sovereign bond yield and US 10-year Treasury bond yield
Source: Bloomberg, Datastream
Meanwhile, blanket generalisations about “emerging markets” ignore the reality that some countries have decent fundamentals and some do not. So for GREED & fear it is more a country specific issue than an asset class issue. Still where there is an asset class issue, as has been highlighted on several occasions by CLSA’s legendary investment guru Russell Napier (see CLSA research Solid Ground – How the yield bubble bursts, 3 December 2012), is the huge fund flows into the emerging market debt asset class since 2008, and not only into US dollar denominated debt but also local currency debt. Thus, the market value of two key JPMorgan indices tracking US-dollar (EMBI Global) and local-currency (GBI-EM Broad) denominated emerging market bonds have risen from US$205bn and US$799bn respectively in late 2008 to US$583bn and US$1.47tn (see Figure 10).
-18%-16%-14%-12%-10%-8%-6%-4%-2%0%
Chi
na
Thai
land
Indo
nesi
a
Peru
Rom
ania
Indi
a
Mal
aysi
a
Bul
garia
Bra
zil
Taiw
an
Mex
ico
Phili
ppin
es
Cze
ch
Pola
nd
Kor
ea
Turk
ey
Hun
gary
Sou
th A
fric
a
Col
ombi
a
Rus
sia
Ukr
aine
Chi
le
Arg
entin
a
1.0
1.5
2.0
2.5
3.0
3.5
4.0
4.0
4.5
5.0
5.5
6.0
6.5
7.0
7.5
Jan
10M
ar 1
0M
ay 1
0Ju
l 10
Sep
10
Nov
10
Jan
11M
ar 1
1M
ay 1
1Ju
l 11
Sep
11
Nov
11
Jan
12M
ar 1
2M
ay 1
2Ju
l 12
Sep
12
Nov
12
Jan
13M
ar 1
3M
ay 1
3Ju
l 13
Sep
13
Nov
13
Jan
14
(%) (%)EMBI+ emerging market sovereign bond yieldUS 10-year Treasury bond yield (RHS)
Prepared for: Bloomberg

Christopher Wood [email protected] +852 2600 8516
Thursday, 06 February 2014 Page 6
Figure 10 Market value of JPMorgan Emerging Market US-dollar and local-currency debt indices
Note: EMBI Global Index for US-dollar EM bonds, GBI-EM Broad Index for local-currency bonds. Source: Datastream
These huge fund flows have raised the risk of a redemption-driven liquidation which could trigger a selloff greater than warranted by the fundamentals; and it would be a selloff where the emerging equity asset class would to a certain extent inevitably be correlated; a correlation which would be made worse by the misplaced enthusiasm for investing in emerging markets in recent years via so-called “ETFs”, an issue that was discussed in a worthwhile article in the pinko paper this week (see Financial Times article “Emerging markets are not being well served by ETFs”, 3 February 2014 by John Authers).
Figure 11 iShares Emerging Market equity ETF and bond ETF
Source: Datastream
But if such a mass liquidation of emerging debt does occur, in line with the Napier theme, it will be important to note that the prime cause will not be the failure of emerging markets to address structural reform, contrary to the current conventional wisdom of the chattering classes. Rather it will be because five years and counting of ongoing QE caused a stampede into emerging market debt, be it US dollar or local currency denominated, as global fixed income investors sought to escape QE-distorted yield curves in those developed economies indulging in quanto easing. Even worse, the stampede was further encouraged by Billyboy’s extraordinarily irresponsible original “forward guidance” in early 2012 when he said he would not raise rates until at least late 2014, and the market believed him.
0.0
0.2
0.4
0.6
0.8
1.0
1.2
1.4
1.6
1.8
0
100
200
300
400
500
600
2002
2003
2004
2005
2006
2007
2008
2009
2010
2011
2012
2013
2014
(US$bn) (US$tn)US-dollar debt Local currency debt (RHS)
60
70
80
90
100
110
120
130
15
20
25
30
35
40
45
50
55
Jan
08Apr
08
Jul 0
8O
ct 0
8Ja
n 09
Apr
09
Jul 0
9O
ct 0
9Ja
n 10
Apr
10
Jul 1
0O
ct 1
0Ja
n 11
Apr
11
Jul 1
1O
ct 1
1Ja
n 12
Apr
12
Jul 1
2O
ct 1
2Ja
n 13
Apr
13
Jul 1
3O
ct 1
3Ja
n 14
iShares MSCI Emerging Markets equity ETFiShares JPMorgan USD EM bond ETF (RHS)
Prepared for: Bloomberg

Christopher Wood [email protected] +852 2600 8516
Thursday, 06 February 2014 Page 7
If this is the causation, GREED & fear’s hope is that the liquidation of emerging market debt as a whole will not be as bad as argued by Napier because in GREED & fear’s view the compensating factor will be declining US Treasury bond yields against which emerging market debt is priced. Thus, the spread of the 10-year Indonesia US-dollar sovereign bond yield over the 10-year US Treasury bond yield has widened by 32bp to 276bp since the 10-year Treasury bond yield peaked at 3.03% at the end of 2013 (see Figure 12). GREED & fear also suspects that the damage will be mitigated by the fact that any extreme negative market action would sooner or later cause a Yellen-run Fed to reverse tapering which would put renewed downward pressure on the US dollar.
Figure 12 Spread between 10Y Indonesia bond yield and US 10Y Treasury yield
Source: CLSA, Bloomberg
What about the Fed’s supposed “hawks” who seemingly want to end QE almost regardless of the data? The lesson from recent years is that they disappear down the proverbial plughole when market action turns sufficiently ugly. Meanwhile, the positive point for a country like Indonesia is that its currency already declined by 21% against the US dollar last year (see Figure 13). This to GREED & fear discounts a lot of the deterioration in the current account deficit in an economy which is now slowing. On this point, Indonesia’s trade balance swung into a US$2.3bn surplus in 4Q13, up from a US$3.1bn deficit in 3Q13 (see Figure 14).
Figure 13 Indonesian rupiah/US$ (inverted scale)
Source: Bloomberg
0
50
100
150
200
250
300
350
400
Jan
10M
ar 1
0
May
10
Jul 1
0
Sep
10
Nov
10
Jan
11M
ar 1
1
May
11
Jul 1
1
Sep
11
Nov
11
Jan
12M
ar 1
2
May
12
Jul 1
2
Sep
12
Nov
12
Jan
13M
ar 1
3
May
13
Jul 1
3
Sep
13
Nov
13
Jan
14
(bp) Indonesia 10Y USD bond yield - US 10Y Treasury bond yield
8,000
8,500
9,000
9,500
10,000
10,500
11,000
11,500
12,000
12,500
Jan
11
Mar
11
May
11
Jul 1
1
Sep
11
Nov
11
Jan
12
Mar
12
May
12
Jul 1
2
Sep
12
Nov
12
Jan
13
Mar
13
May
13
Jul 1
3
Sep
13
Nov
13
Jan
14
Indonesia rupiah/US$ (inverted scale)
Prepared for: Bloomberg

Christopher Wood [email protected] +852 2600 8516
Thursday, 06 February 2014 Page 8
Figure 14 Indonesia quarterly current account and trade balance
Source: CLSA, CEIC Data
Figure 15 Weekly net foreign buying of Japanese equities and the Topix
Source: Bloomberg
Elsewhere in Asia, Japan has succumbed to negative equity market action in line with other stock markets this year, with the biggest foreign selling of Japanese equities last week since June 2010 (see Figure 15). In this respect the Topix has maintained the pattern in place since the busting of the bubble in 1990; namely of being heavily correlated to the US 10-year Treasury bond yield (see Figure 16), which remains by the way the single most important market price for investors everywhere.
To get really positive on Japan on a sustainable basis, it will be necessary to see Tokyo break this correlation. This will only likely happen if the Japan stock market can re-rate because of a sustainable move out of deflation. The jury remains out on this, which is why GREED & fear remains agonistic for now on the success, or otherwise, of Abenomics. Still it is worth noting that the latest inflation data was encouraging at the margin. Thus, CPI excluding food and energy rose by 0.7%YoY in December, up from 0.6%YoY in November, the biggest increase since August 1998 (see Figure 17).
(10)
(8)
(6)
(4)
(2)
0
2
4
6
8
10
2008 2009 2010 2011 2012 2013
(US$bn) Currrent account balance Trade balance
700
800
900
1000
1100
1200
1300
-1000-800-600-400-200
0200400600800
1000120014001600
Jan-
10
Apr
-10
Jul-
10
Oct
-10
Dec
-10
Apr
-11
Jul-
11
Sep
-11
Dec
-11
Mar
-12
Jun-
12
Sep
-12
Dec
-12
Mar
-13
Jun-
13
Sep
-13
Dec
-13
Foreign net buying of Japanese equities
Topix (RHS)
(Yen bn)
Prepared for: Bloomberg

Christopher Wood [email protected] +852 2600 8516
Thursday, 06 February 2014 Page 9
Figure 16 Topix and US 10-year Treasury bond yield
Note: Correlation since 1990 = 0.80. Source: Bloomberg
Figure 17 Japan CPI inflation
Source: Statistics Bureau, Japan
Meanwhile, if the global market action is sufficiently deflationary, it will raise expectations that the Bank of Japan might start to reconsider its current stance; which is to wait and see how the economy responds to the April sales tax increase before deciding on another QE blast. The pressure point here is the yen. In GREED & fear’s view a break out of the Y95-105/US$ trading range, driven by yen strength, would be the sort of level to trigger such a policy response.
This is why GREED & fear sees the current selloff as a buying opportunity into the asset reflation story which GREED & fear still believes in. But clearly the yen has not yet reached 95, which is why a correction to the June 2013 lows of 1033-1040 in the Topix is technically possible (see Figure 18).
0
1
2
3
4
5
6
7
8
9
10
0
500
1,000
1,500
2,000
2,500
3,000
1989
1990
1991
1992
1993
1994
1995
1996
1997
1998
1999
2000
2001
2002
2003
2004
2005
2006
2007
2008
2009
2010
2011
2012
2013
2014
Topix US 10-year Treasury bond yield (RHS) (%)
(15)
(10)
(5)
0
5
10
15
(4)
(3)
(2)
(1)
0
1
2
3
4
1990
1991
1992
1993
1994
1995
1996
1997
1998
1999
2000
2001
2002
2003
2004
2005
2006
2007
2008
2009
2010
2011
2012
2013
2014
(%YoY) Japan core CPI (excl. fresh food)CPI excl. food & energyElectricity prices (RHS)
(%YoY)
Prepared for: Bloomberg

Christopher Wood [email protected] +852 2600 8516
Thursday, 06 February 2014 Page 10
Figure 18 Topix and Yen/US$
Source: Bloomberg
Figure 19 Eurozone CPI inflation
Source: Eurostat
Back in Europe where GREED & fear has been talking to investors in Switzerland this week, the latest inflation data in the Eurozone has renewed market focus on the growing deflationary risk, a risk Flexible Mario has started to talk up in his public comments. Thus, Eurozone CPI inflation slowed from 0.8%YoY in December to a four-year low of 0.7%YoY in January (see Figure 19).
The ever slick Flexible Mario has also started to prepare the ground, via cleverly managed press leaks, for a move towards unconventional easing. This can be seen in the form of press reports over the past week that the Bundesbank would not oppose a decision by the ECB to stop sterilising its Securities Markets Program (SMP) bond purchases (see The Wall Street Journal article “Bundesbank Would Favor End of ECB Sterilization”, 31 January 2014). It is also worth noting that the ECB has failed to sterilise the entire amount of its SMP bond purchases in six of the past 11 weeks (see Figure 20).
70
80
90
100
110
120
130
600700800900
1,0001,1001,2001,3001,4001,5001,6001,7001,8001,900
2004
2005
2006
2007
2008
2009
2010
2011
2012
2013
2014
Topix Yen/US$ (RHS)
(1.0)
(0.5)
0.0
0.5
1.0
1.5
2.0
2.5
3.0
3.5
4.0
1997
1998
1999
2000
2001
2002
2003
2004
2005
2006
2007
2008
2009
2010
2011
2012
2013
2014
(%YoY) Eurozone CPI inflation
Prepared for: Bloomberg

Christopher Wood [email protected] +852 2600 8516
Thursday, 06 February 2014 Page 11
Figure 20 ECB SMP sterilisation
Source: ECB
A decision to stop sterilising bond purchases would pave the way for ECB balance sheet expansion after the substantial shrinkage that has taken place over the past two years. Thus, ECB total assets peaked at €3.1tn in June 2012 and have since declined by 29% to €2.22tn at the end of January (see Figure 21). It is also likely to coincide with another ECB rate cut which in GREED & fear’s view is likely to happen next month. Another aspect to a move towards more unconventional ECB monetary policy which has begun to be discussed in the press, a discussion doubtless again encouraged by the ECB boss, is for the ECB to buy a “basket” of Eurozone government bonds with that basket weighted according to the relative size of Eurozone countries’ GDP.
Figure 21 ECB balance sheet
Source: ECB
True, all such initiatives will require a German sign-off. Still in GREED & fear’s view investors should assume that the politically slick and financially astute ECB boss will be able to build the case for a more overt move to unconventional monetary policy sooner rather than later; though he would probably prefer to wait until after Germany’s Constitutional Court ruling on the ECB's Outright Monetary Transactions (OMT) bond-buying program announced in August 2012. This ruling is now expected in April. GREED & fear is assuming this will prove to be a formality.
0
50
100
150
200
250
May
-10
Aug
-10
Nov
-10
Feb-
11
May
-11
Aug
-11
Nov
-11
Feb-
12
May
-12
Aug
-12
Nov
-12
Feb-
13
May
-13
Aug
-13
Nov
-13
Feb-
14
SMP-sterilising operations (allotment)Liquidity intended to absorb
(€ bn)
600800
1,0001,2001,4001,6001,8002,0002,2002,4002,6002,8003,0003,200
1999 2001 2003 2005 2007 2009 2011 2013
(€ bn) ECB total assets
Prepared for: Bloomberg

Christopher Wood [email protected] +852 2600 8516
Thursday, 06 February 2014 Page 12
Figure 22 Germany CPI inflation
Source: CEIC Data, Federal Statistical Office
Meanwhile, the more the current emerging market debt angst feeds into Eastern and Central Europe, the more this will create the trigger or catalyst that can be used by Draghi to make the case for an earlier introduction of unconventional monetary policy. But to GREED & fear the strength of the euro and the related increasingly overt deflationary trend is already providing sufficient a catalyst. After all even in Germany consumer prices are only rising at a rate of 1.3%YoY (see Figure 22).
With the ECB preparing to go unconventional, with the Bank of Japan contemplating sooner or later another QE blast and with “uber-dove” Chairwoman Janet Yellen having taken over at the Fed, unconventional monetary policy remains in GREED & fear’s view as entrenched as ever. In this respect, it is interesting to note that gold mining stocks have been outperforming gold bullion since early December (see Figure 23). It is early days. But this is an encouraging trend for those like GREED & fear who still own bullion and gold mining shares after the devastating losses last year. In this respect, CLSA’s technical analyst Laurence Balanco noted in his latest weekly report (Price Action Derivatives - Global technical research, 5 February 2014) that the improving technicals on gold mean that a break above US$1270/oz would suggest a “minimum upside” target of US$1370/oz. Gold broke that level yesterday “intraday” though it closed back at US$1258/oz.
Figure 23 Gold mining stocks relative to gold bullion price
Source: CLSA, Bloomberg
-1.0
-0.5
0.0
0.5
1.0
1.5
2.0
2.5
3.0
3.5
4.0
Jan
00Ju
l 00
Jan
01Ju
l 01
Jan
02Ju
l 02
Jan
03Ju
l 03
Jan
04Ju
l 04
Jan
05Ju
l 05
Jan
06Ju
l 06
Jan
07Ju
l 07
Jan
08Ju
l 08
Jan
09Ju
l 09
Jan
10Ju
l 10
Jan
11Ju
l 11
Jan
12Ju
l 12
Jan
13Ju
l 13
Jan
14
(%YoY) Germany CPI inflation
0.15
0.17
0.19
0.21
0.23
0.25
0.27
0.29
0.31
0.33
Jan-
12
Mar
-12
May
-12
Jul-
12
Sep
-12
Nov
-12
Jan-
13
Mar
-13
May
-13
Jul-
13
Sep
-13
Nov
-13
Jan-
14
NYSE Arca Gold BUGS Index / Gold bullion price ratio(x)
Prepared for: Bloomberg

Christopher Wood [email protected] +852 2600 8516
Thursday, 06 February 2014 Page 13
If this indeed proves to be the case, the action in the gold mining stocks is serving as a useful lead indicator for the price of bullion, with Newcrest Mining, for example, up 30% year to date. The gold mining stocks were certainly a lead indicator for the decline in the gold price last year.
What is clear is that anyone who wanted to construct a truly “contrarian” portfolio, positioned the opposite to the consensus at the start of 2014, would have included a large weighting in gold mining shares, as well as a large weighting in the 30-year Treasury bond. So far at least such a strategy would have worked with the gold mining index up 7.9% in US dollar terms and the US 30-year Treasury bond price up 5.9% so far in 2014.
What is also clear is that gold’s price action last year was amongst the weirdest GREED & fear has ever seen in the sense that gold bullion declined by 28% in a year when the Fed balance sheet expanded by US$1.1tn or 39% (see Figure 24). Remember in this context that the Fed increased its holdings of securities by US$1.1tn in 2013, a year when the glut of Fed watchers were talking non-stop about “tapering”, equivalent to half of the US$2.2tn of securities it purchased in the four previous years of quanto easing that preceded it.
Figure 24 Fed balance sheet and gold bullion price
Note: Weekly data. Source: CLSA, Federal Reserve, Bloomberg
Finally, GREED & fear is going to capitulate on Samsung Electronics in the Asia ex-Japan long-only portfolio, which has for now at least become a value trap. Nonetheless, the stock is up 141% in US dollar terms since inclusion in the portfolio in September 2008. A four percentage point investment in SK Hynix will be introduced (see Figure 25). The memory bandwagon is clearly already running. But the obsession with all things “smart”, and the related “internet of things”, is clearly a trend which has much further to run even if GREED & fear, at the personal level, will not be participating. A percentage point will also be added to the existing investment in Vipshop.
Finally, a short update from CLSA’s legendary investment guru Russell Napier on his financial course this year is shown on page 15.
600
800
1,000
1,200
1,400
1,600
1,800
2,000
500
1,000
1,500
2,000
2,500
3,000
3,500
4,000
4,500
Jan
07
May
07
Sep
07
Jan
08
May
08
Sep
08
Jan
09
May
09
Sep
09
Jan
10
May
10
Sep
10
Jan
11
May
11
Sep
11
Jan
12
May
12
Sep
12
Jan
13
May
13
Sep
13
Jan
14
(US$bn) (US$/oz)Fed total assets
Gold bullion price (RHS)
Prepared for: Bloomberg

Christopher Wood [email protected] +852 2600 8516
Thursday, 06 February 2014 Page 14
Figure 25 Asia ex-Japan thematic equity portfolio for long-only absolute-return investors
Note: Readers should refer to the relevant CLSA research reports for detailed analysis & disclosures. Source: CLSA
Regional consumer 4% Samsonite
Asean auto dealer 3% Kolao Holdings
Australia gold mining 5% Newcrest Mining
China internet hosting 3% 21Vianet
China internet search engine 5% Baidu
China online retailer 5% Vipshop
China online-offline travel company 3% Ctrip
Macau entertainment 4% Galaxy
India consumer 10% Titan Industries (3%), Godrej Consumer (4%), Nestle India (3%)
India banks 7% HDFC Bank (4%), IndusInd Bank (3%)
India housing finance 7% HDFC (4%), GRUH Finance (3%)
Korea electronics 4% SK Hynix
Philippines banks 10% Metrobank (5%), BPI (5%)
Philippines consumer 5% Universal Robina
Philippines media 4% ABS-CBN
Singapore dividend plays 8% StarHub (3%), SATS (5%)
Taiwan tech component makers 4% MediaTek
Thailand property 4% Land and Houses
Thai telecoms 5% Intouch (Shin Corp)
Prepared for: Bloomberg

Christopher Wood [email protected] +852 2600 8516
Thursday, 06 February 2014 Page 15
Practical History of Financial Markets Dates 2014
Almost all kinds of useful knowledge would be learned through the reading of history.
Benjamin Franklin
Is this an Emerging Market crisis? Is this just an Eastern European crisis? Is this the beginning of a US consumption driven deflationary boom? Is this the beginning of a global deflation shock? What would Einstein say?
“If I had 60 minutes to solve a problem and my life depended on it, I’d spend 55 minutes determining the right question to ask. Once I got the right question, I could easily answer it in 5 minutes.”
Are you asking the right questions or are you simply trying to answer the questions on the front page of the newspapers? The Practical History of Financial Markets course involves a two day intensive focus on financial history as a guide to asking the right questions. The course has been sold out since 2009 and we are now announcing the teaching dates for 2014-
London March 13th and 14th Edinburgh April 24th and 25th London October 2nd and 3rd Edinburgh November 13th and 14th
Can you spare two days out of the investment trenches to make sure that you are using the right strategy and tactics to win the war for investment survival? The course costs GBP1,750 and more details can be found at www.didaskoeducation.org. This analyst has taken the course over thirty times and believes the right question to be ‘Is this the beginning of a global deflation shock?’ If you’d like to come along for two days and think about the right questions and study the history of the range of right answers then email Russell Napier at [email protected].
Research subscriptions To change your report distribution requirements, please contact your CLSA sales representative or email us at [email protected]. You can also fine-tune your Research Alert email preferences at https://www.clsa.com/member/tools/email_alert/.
Key to CLSA/CAST investment rankings: BUY: Total stock return (including dividends) expected to exceed 20%; O-PF: Total expected return below 20% but exceeding market return; U-PF: Total expected return positive but below market return; SELL: Total expected return to be negative. For relative performance, we benchmark the 12-month total forecast return (including dividends) for the stock against the 12-month forecast return (including dividends) for the market on which the stock trades. • We define as “Double Baggers” stocks we expect to yield 100% or more (including dividends) within three years. ©2014 CLSA Limited (for research compiled by non-Taiwan analyst(s)) and/or Credit Agricole Securities Taiwan Co., Ltd (for research compiled by Taiwan analyst(s)). Note: In the interests of timeliness, this document has not been edited. The analyst/s who compiled this publication/communication hereby state/s and confirm/s that the contents hereof truly reflect his/her/their views and opinions on the subject matter and that the analyst/s has/have not been placed under any undue influence, intervention or pressure by any person/s in compiling such publication/communication. CLSA group of companies (excluding CLSA Americas, LLC) (“CLSA”), Credit Agricole Securities Taiwan Co., Ltd. (“CA Taiwan”), CLSA/CA Taiwan's analysts and/or their associates do and from time to time seek to establish business or financial relationships with companies covered in their research reports. As a result, investors should be aware that CLSA and/or such individuals may have one or more conflicts of interests that could affect the objectivity of this report. Regulations or market practice of some jurisdictions/markets prescribe certain disclosures to be made for certain actual, potential or perceived conflicts of interests relating to research reports and such details are available at www.clsa.com/member/research_disclosures/. Disclosures therein include the position of CLSA, CLSA Americas, LLC and CA Taiwan only and do not reflect those of CITIC Securities International Company Limited, Credit Agricole Corporate & Investment Bank and/or their respective affiliates. If investors have any difficulty accessing this website, please contact [email protected] or +852 2600 8111. If you require disclosure information on previous dates, please contact [email protected] IMPORTANT: The content of this report is subject to and should be read in conjunction with the disclaimer and CLSA's Legal and Regulatory Notices as set out at www.clsa.com/disclaimer.html, a hard copy of which may be obtained on request from CLSA Publications or CLSA Compliance Group (18/F, One Pacific Place, 88 Queensway, Hong Kong, telephone +852 2600 8888) and/or CA Taiwan Compliance (27/F, 95, Section 2 Dun Hua South Road, Taipei 10682, Taiwan, telephone +886 2 2326 8188). 01/01/2014
Prepared for: Bloomberg