D-533 FINAL . ... Clover/Chambers Creek geohydrologic study for 87300079Tacoma-Pierce ' I ,.

Welcome message from author
This document is posted to help you gain knowledge. Please leave a comment to let me know what you think about it! Share it to your friends and learn new things together.
Transcript

D-533 FINAL
-··-----~ . ... ~:-~~!
Clover/Chambers Creek geohydrologic study for
87300079Tacoma-Pierce
' I ,.


I I I I I I I I I I I I I I I I I I I
CLOVER/CHAMBERS CREEK
GEOHYDROLOGIC STUDY
FOR
TACOMA-PIERCE COUNTY HEALTH DEPARTMENT
Director of Health
R. M. Nicola, M.D., MHSA
Project Administrator
Derek I. Sandison
PHASE II REPORT
MARCH 11, 1985
BROWN AND CALDWELL
with Subconsultants
Sweet, Edwards & Associates
Robinson & Noble, Inc.

J I I I I I I I I I I I I I I I I I
BROWNANDCALDWELLI~c~J~~~~~~~------------------------------------CONSULTING ENGINEERS
March 12, 1985
Mr. Derek Sandison Tacoma-Pierce County Health Department 3629 South "D" Street Tacoma, Washington 98405
near Mr. Sandison:
14-1519-20
We are pleased to submit 30 copies of the Phase II report for the Clover/Chambers Creek Geohydrologic Study. This report summarizes the data collection efforts conducted during the second phase of the study.
Thank you for your cooperation and support throughout Phase II.
very truly yours,
BROWN AND CALDWELL
~a:=:~ Vice President
JW: sjw Enclosures
100 WEST HARRISON STREET SEATTLE. WA 98119 • (206)281-4000

I I I I I I I I I I I I I I I I I I I
TABLE OF CONTENTS
INTRODUCTION . . . . . . . . . . . . . . . TASK 15: IMPLEMENT DATA COLLECTION PROGRAM
Results Data Analysis Seasonal Variations Results of Monitoring in Individual Wells
Monitor Well #1, City of Tacoma Well 9-A Monitor Well #2, City of Tacoma Well 5-A Monitor Well #3, Charles Wright Academy Monitor Well #4, Boise Cascade .•.. Monitor well #5, Western State Hospital Monitor Well #6, Lakewood Well J-1 . Monitor Well #7, Lakewood Water District L-2 Monitor v1ell #8, McChora Air Force Base Well 832 Monitor Well #9, Lakewood Water District D-2 Monitor well #10, Parkland Water District #5 Monitor Well #11, Lakewood Water District G-1 Monitor Well #12, McChora Air Force Base Well 711 Monitor well #13, McChora Air Force Base Well 5001 Monitor Well #14, Parkland Light and Water District
Well 12 • • • • • • . • • • • • Monitor Well #15, Woodbrook Terrace Monitor Well #16, Spanaway Water Company Monitor Well #17, Fort Lewis Well 13 Monitor well #18, Fort Lewis Well 8 Monitor well #19, Dillinger Monitor Well #20, Dubis Monitor Well #21, Crouse Monitor Well #22, Kindell Monitor Well #23, Spanaway Water Company #3 Monitor well #24, Sager ..... . Monitor Well #25, Trevino .•.•. Monitor Well #26, Parkland Light and
Water company #5 . . . . . . . • • Monitor Well #27, Lakewood Water Department
Well A-2 • • • • • • • • • • • • • • • • Monitor Well #28, Tacoma Community College Monitor Well #29, Fircrest #7 ...•. Monitor Well #30, Lakewood Water District o-2 Monitor Well #31, Helm .••....•.. Monitor ~lell #32, City of Tacoma \-Jell U-10 Monitor Well #33, Lawrence . • . Monitor Well #34, Flett Dairy .•• Monitor well #35, Ponce de Leon Spring
i
1
2
3 3
12 12 13 14 14 15 15 15 15 16 16 16 17 17 17
18 18 18 19 19 19 19 19 20 20 20 20
21
21 21 21 22 22 22 23 24 24

I I I I I I I I I I I I I I I I I I I
TABLE OF CONTENTS
TASK 16: UPDATE CONCEPTUAL GROUNDI'IATER MODEL
Velocity Re-Evaluation . . • • . . Potentiometric Surface Analysis . • •
comparison of Historical Potentiometric Surfaces with Monitoring Information
Seasonal variations in Potentiometric Surface Groundwater Flow Systems . • • . . .
Surface Recharge and Discharge Subsurface Recharge and Discharge
Evaluation of Basin Recharge Estimates Dispersion Analysis . • . . •
TASK 17: PERFORM WATER QUALITY ANALYSIS
TASK 18: PERFORM ORGANIC CONTAMINATION ASSESSMENT
TASK 19: IDENTIFY PROJECTED LAND USE
TASK 20: PHASE II REPORT
TASKS 21 THROUGH 25
TASK 26: ORGANICS MONITORING
Monitoring Well Drilling Well BC-1 Well BC-2 . . • • • Well BC- 3 . • . • .
Monitoring Well Sampling Sampling Equipment Sampling Procedures
Results . . . . . . .
ii
25
25 26
26 27 28 28 29 29 30
35
36
37
37
37
38
38 38 38 39 39 39 39 41
I I I I I I I I I I I I I I I I I I I
No.
1
2
3
4
5
6
7
8
9
10
11
12
13
14
15
5-15
5-16
17
18
19
20
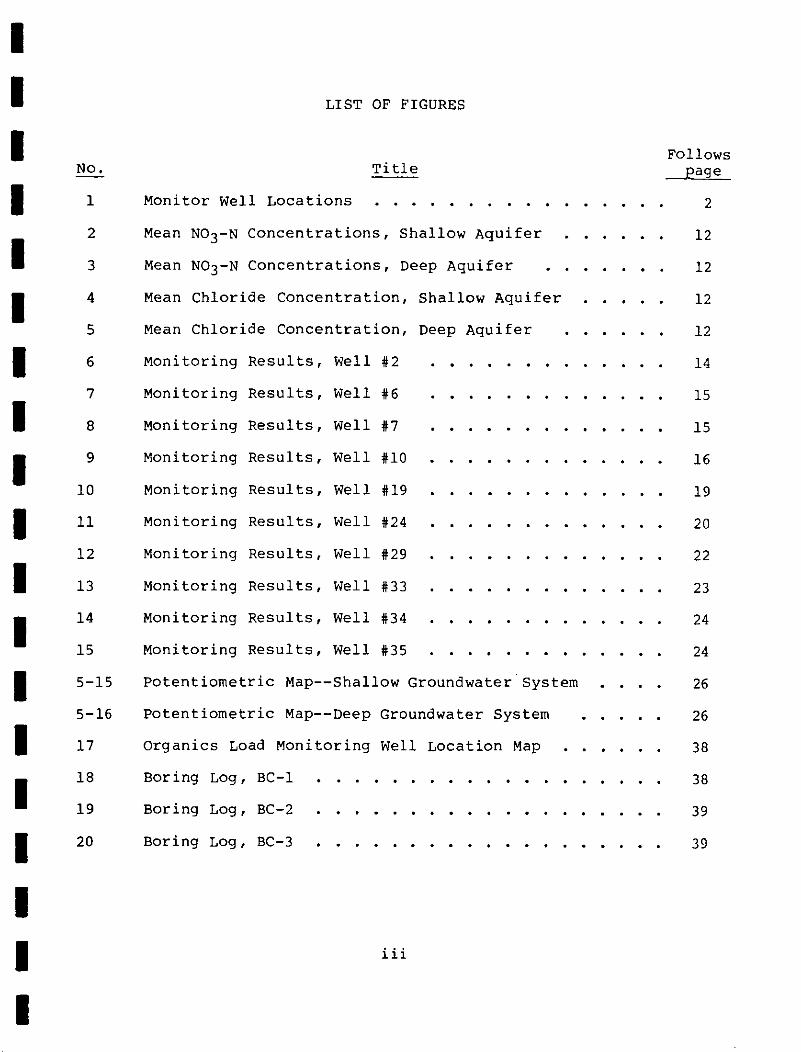
LIST OF FIGURES
Title
Monitor Well Locations
Mean N03-N Concentrations, Shallow Aquifer
Mean N03-N Concentrations, Deep Aquifer
Mean Chloride Concentration, Shallow Aquifer
Mean Chloride Concentration, Deep Aquifer
Monitoring Results, Well #2
Monitoring Results, Well #6
Monitoring Results, Well #7
Monitoring Results, Well #10
Monitoring Results, Well #19
Monitoring Results, Well #24
Monitoring Results, Well #29
Monitoring Results, Well #33
Monitoring Results, Well #34
Monitoring Results, Well #35
Potentiometric Map--Shallow Groundwater System
Potentiometric Map--Deep Groundwater System
Organics Load Monitoring Well Location Map
Boring Log, BC-1
Boring Log, BC-2
Boring Log, BC-3
iii
Follows page
2
12
12
12
12
14
15
15
16
19
20
22
23
24
24
26
26
38
38
39
39

I I I No.
I 1
I 2
I 3
4
I 5
I 6
I 7
8
I 9
I 10
I 11
12
I 13
I I I I I I
LIST OF TABLES
Title
Results, Clover/Chambers Creek Monitor Wells, January-February, 1984 . • . . . . • . . . .
Results, Clover/Chambers Creek Monitor Wells, March-April, 1984 .•.........•.
Results, Clover/Chambers Creek Monitor Wells, August-September, 1984 .•..•.•.•..
Results, Clover/Chambers Creek Monitor Wells, october 1984 . . . . . . . . . . . . . . . .
Results, Clover/Chambers Creek Monitor Wells, January 1985 • . • . • • • .
Historic N03-N Concentrations
Mean Nitrate and Chloride Concentrations
Mean Nitrate and Chloride Concentrations, Shallow and Deep Aquifers . . . • . • •
Range of Dispersivity Found in Literature
Dispersion Analysis Parameters
Sampling Procedures
Field water Quality Data
Results, Organics Monitoring
iv
4
5
6
7
8
9
10
11
32
34
40
40
42

I I I I I I I I I I I I I I I I J I I
INTRODUCTION
This report summarizes the Phase II work effort of the Clover/ Chambers Creek Geohydrologic Study. Phase I, a characterization of the study area, was summarized in the Phase I draft report, issued December 12, 1983. The Phase I report is referenced frequently throughout this report; we have not duplicated Phase I material in the Phase II report.
Phase II was conducted between January 1, 1984 and February 28, 1985. The major focus of Phase II was data collection; more specifically, a groundwater quality monitoring program was conducted over a 13-month period. The results of this monitoring effort, along with the results of a monitoring program designed to detect priority pollutants in a selected group of wells, will be described in the report. A summary of each task is included below.

I I I I I I I I I I I I I I I I II
' '
2
TASK 15: IMPLEMENT DATA COLLECTION PROGRAM
The purpose of the Phase II Clover/Chambers Creek Basin (C3) data collection effort was to:
1. Provide data for establishing the relationship between land use activities and water quality.
2. Augment existing baseline data to assist in identifying hydrologic and water quality trends.
3. Provide data to assist in identifying areas of contamination.
4. Establish a foundation for a long-term monitoring program.
The methodology utilized in setting up the Clover/Chambers Creek (C3) Geohydrologic Basin Data Collection Program was described in detail in Appendix VII of the Phase I C3 report. As described therein, existing wells were used as data collection sites. The monitor wells were selected based on:
1. The priority monitoring areas identified in Figure VII-S of the Phase I report.
2. The location of historical water quality data and the location of monitoring stations used by the Tacoma-Pierce County Health Department (TPCHD) and Washington State Department of Social and Health Services (DSHS) in their 1980-1982 monitoring effort.
3. Areas without any water quality characterization.
4. Control areas where water quality contamination is considered to be highly unlikely.
Figure 1 illustrates the 35 monitor wells.
Each well was sampled five times between January 1984 and January 1985. Samples were obtained during late January/early February 1984; late March/early April 1984; late August/early September 1984; mid-October 1984; and mid-January 1985. The sampling sequence was designed to correspond with the standard water year. Sampling was conducted by Robinson & Noble personnel and all samples were shipped directly to the Brown and Caldwell laboratory in Emeryville, California.
The parameters analyzed were selected to serve as indicators of general water quality. Nitrate as nitrogen, chloride, total dissolved solids, fecal coliform, temperature, conductivity, and pH were measured in each well for each quarter. A scan for priority pollutants was conducted in all 35 wells in January, 1984, with

I t: I I I I,
• I I I I I ' ' • • I •
I I I I ··-:::--
I I
• • • • '
Kl E
~01111£NC£M£Nr . .,
P a r k 1ia n d
SCALE IN MILES
0
0 MONITORING WELL
1 t.IONITORING WELL NUMBER 255 DATA MANAGEMENT SYSTEM NUMBER
I.IONITOR WELL LOCATIONS CNORTH HAl.F)

I I' I I r I r I I I I t I I I I: I I I
SCALE IN MILES
0 2
0 MONITORING WELL
I MCWITORING WELL NUMBER ffi DATA MANAGEMENT SYSTEM NUMBER
Spanaway
!
'
"" E w s
_1 ___ _
FIGURE I MOOITOR WELL LOCATIONS <SOUTH HALF)

I I I I I' I I a I
I I I I I I I
3
selected wells (those wells showing organic contamination in the January samples) sampled in April. The priority pollutant scan included purgeable priority pollutants (EPA Method 624) and base/ neutral, acid-extractable priority pollutants (EPA Method 625). The 35 monitor wells were sampled once for arsenic in April 1984, because of the potential source of arsenic in the area. Six wells had detectable levels of arsenic, ranging from 3 to 50 ug/1.
Results
In general, the level of indicator parameters, nitrate as nitrogen (N03-N) and chloride (Cl), was low relative to drinking water maximum contaminant levels (MCL) of 10 mg/1 N03-N and 250 mg/1 Cl. The naturally occurring background concentration of N03-N appears to be less than 1 mg/1, and in some parts of the study area (i.e., the southeastern study area) is less than 0.5 mg/1. Tables 1 through 5 summarize the sampling results for each quarter.
Data Analysis
Detailed analysis of the data is difficult because of the limited number of data points available. Twenty-one monitor wells have from one to three historical sample results available, but in many cases, the historic data are subject to question because of the methodology used. The historical chloride data is largely unusable, because until recently chloride data were reported as "less than 5 mg/1" or "less than 10 mg/1." Because the background chloride concentration is roughly 2.5 mg/1, all the data look the same. Therefore, only N03-N data were analyzed for possible water quality trends. Table 6 summarizes historic N03-N data for the monitor wells. Water quality trends in the wells are discussed in the individual wells' results section.
A statistical analysis was performed to determine any overall water quality trends in the aquifers. The analysis was performed separately for those wells in the shallow aquifer (Hydrostratigraphic Layer A) and those wells in the deep aquifer (Hydrostratigraphic Layer C). Table 7 summarizes the overall mean nitrate and chloride values for the monitor wells. As indicated by the variance, the range of values for chloride in the shallow aquifer was significant. The mean chloride concentration of 12.09 mg/1 in the shallow aquifer is skewed by the high chloride concentration in Well 1, which is a well known to be contaminated. Excluding this value, the mean year-round chloride concentration in the shallow aquifer is 8.105 mg/1. The wells drawing from the deep aquifer showed a mean year-round chloride concentration of 5.18 ~g/1. The range of chloride values in the deep aquifer, from 2.9 to 7.9 mg/1, showed less variance than the upper aquifer, where mean chloride concentrations varied from 2.1 to 13.9 mg/1 (excluding Well 1). The overall trend of chloride concentrations seems higher in the shallow aquifer, but because of the limited data, it is not statistically reliable.
\~

I I I I I I I I I I I I I I I I I I I
4
Table 1. Results, Clover/Chambers Creek Monitor Wells, January-February, 1984 (First Quarter)
COlifonn., Monitor .... Priority ..... 'hill per- COndue-
.. n ref • poll11tant, Nitrate, 0\l.oride TDS, organiSirl/ ature, tiTity, no. ~. """"' ""'' ""'' .. /1 .,,, 100 ml o!.-:Jr-• • -· ""
1 255 City of Taecaa 9-A 'l'C:Z: 4 2.5 " 190 0 53 310 6.3
2 257 City of beODa 5-A - 3.3 • 160 0 53 220 6.3
3 JB9 0\arlaa Nriqht - <0,1 • 106 onm: " 143 6.2
4 29 Boi- cascade - <0., '·' 170 0 ... .. ... 5 35 W.atern State
aoapital - 2.0 6 150 0 54 197 6. 2
6 59 lAkewood J-1 -- 3.0 , 166 0 52 230 6o 2 7 70 lAkewood L-2 - ••• 9.5 196 0 " 290 6.1
• ,. Hc:Ol.ord - <0. 1 3 .. 0 " 141 6.'
• 67 lAkewood D-2 - o.sg 3 110 0 50 125 6· 1 10 6 Parkland 5 - 3.2 • 120 0 53 172 s .•
, 64 Lakewood G-1 - 0.6] 6.5 131 0 50 1B5 6.2 12 300 He: Chord 'l'CE: 1 Oo75 • 110 0 53 162 6.3 , JB3 Me Chord. - <0.1 3 140 0 •• 154 6.2 ,. 496 Parkland , - 1.6 5 116 0 50 "' 5.7
" 603 lboc!brook 'l'errace - 3.5 7 160 0 49 220 6.3
" 327 Spanaway w.c. - 0.7 4 120 0 " "' 6.5 17 500 Fort Lewis - 0.]2 3 "' 0 " 140 •• 3
" ,. Fort Levie - 0-63 2 ,. 0 52 120 .. , 19 475 Dillinqer - <0. 1 1.5 .. """' 49 120 6.2 20 451 Dubie - <0.1 1 111 0 " ... ••• " 479 crouA - 2.3 • 103 - 50 145 5.9 22 622 J:indell - 0-92 2.5· 127 0 59 , 5.9 23 329 Spanavay " - 2.6 5 110 1 52 , 5.9 24 290 saqer - <0.1 3 157 9 " 199 5.7 25 623 Trevino - 3.7 5 100 0 50 164 5.6
26 39 PLO-Parkland t7 - 2.4 9 .. 3 52 134 5.9 27 .. lAkewood W.o. A-2 -- Oo45 2 93 0 51 "' 5.9 29 79 "'c 29 " Fircrest f7 - 3. 1 7 152 0 54 220 30 73 Lake111004 c>-2 -- 1.7 • 124 0 50 200 6.2
, 263 .. ,. - ,.. , , 0 " 210 5.9 32 "' City of T&COIII& O!.loro-
o-10 f0r1111 , Oo42 3 " 0 .. 55 •• o 33 267 IA.vranca - 0.73 3 .. 0 49 135 6.3 34 499 Flatt Dairy - 7.8 , 245 0 54 310 6.1 35 624 Ponca 4a IA.on - 2.3 ].5 109 19 53 127 5.2
Mean - t.79 5.65 , o/a 51.4 t71.5 6.1
Rang" I! o-7.8 t.0-21 45-245 o-19 48-59 55-310 5.2-6.
Means !. S.D.
Shallow aqW.far 2·5· 6.89 135 51 187 6.02 !_f o93 !;4-·98 ,. !_t. 7 !'5 !!J-36 .... aquifer 0-93 ... t5 1C8 52 153 6. 16
!.0· 75 !.'.as !_90 !_2.7 !_32 !.fl-30
Ranqas
Shallow aquifer <0.1 1.0 .. 49 120 5.2 -7.8 -zt.o -245 -53 -310 .....
Daap aquifer <0.1 3.0 93 50 120 5.7 -2.8 -7.8 ... , -59 -200 .... ,
~ • Not available.
Static wter level
60.8 44.2 61.7
-· 154.,
---... 3
-114.0
26.2 42.0
-· 69.2 29.8
120.1 109.0
40 .1 66.1 92.9
53.5 99.9 28 ,g
--26.0
--94.7 ----
159. 2
66.9
241.0 145.7
--1. 52
65 ,1.6
91.6 !,46·4
1.52 145.7
28.2 154.2

I I I I I I I I I I I I I I I I I I I
5
Table 2. Results, Clover/Chambers Creek Monitor Wells, March-April, 1984 (Second Quarter)
MOnitor DMS Priority well ref. pollutant, Nitrate,
no. no. OWner
, 255 City of Tacocaa ·-· 2 2S7 City of Taccaa 5-A , ,., Charles wriqht 4 29 aoise cascade 5 " Weatern state
HCiapital
6 " Lakai«JJ4 ,_,
7 " Lakewood. L-2 0 "' Me Chord
• 67 Lakewood D-2 10 6 P&rkland 5
, 64 Lakewood G-1 12 300 He Chord , 303 Me Chord 14 496 Parkland 12 15 603 Woodbrook Terrace
16 "' Span.t-y w.c. , 500 Fort Lewis 10 '" Fort Lewis ,. 475 Dillinger 20 451 """'' 21 479 Crouse 22 "' Kindall 23 329 Spanaway " 24 290 saqer 25 "' Trevino
26 39 PLU-Parkl&nd " " •• Lakewood w.o. A-2 20 70 ..:c 29 4J Fircrest " " " IAke...ood. D-2
" "' """' ,. "' City of 'f'aCOCIIa
m D-10 Jl 267 Lawrence 34 409 Flett Dairy
" 624 l'Once de Leon
~ans ! s.o.
Shallo~o~ aquifer
Deep aquifer
........ Shallow aquifer
Deep aquifer
*'I'CE: 4 Trana•1,2•d1chloroethylene: 2 1, 2-dic:hloropropane: 1 1,1,2,2-tetrachloroethana: 3
**Chloroform: 14
•••oic:hloroaethana: a o:richlorofluorcaethana r 5
ug/1 .,;1
. 2.6
- '·' -- o.to
- '·' - 2.9 - 4.5 - <0.1
- Oo53 - ,.. - 0.59
"'"' 2 0.57
- <0.1
- ••• - 3.5
- 0.32
- Q.J7 - 0.1
- <0.1 - <0.,
- 2.2
- o.as - ,.. - <0.,
-- '·' - 2.0 - Oo4J
<0.1 - ,.. - 1.4
- J.O .. 0.16 ... <0.10
- 0.37 - 7.4
-- 1.8
:z.39 !1.88
o.1o !0·66
<0.1 -7.4
<0., -2.3
32a aampla repreHnta City of 'l'accaa ll&in -tar 32b aample 1'8pra .. nta aquifer at '0-10
-
Cblifon~,
"""· 'l'Uiper- con due-Ol.loride, TDS, orq&ninll/ at.ure, tivity,
og/1 ..,;1 100 mJ. dlt9%'••• F _,.
pR
" 183 0 53 310 -7.5 ,., 0 53 "0 --- -- - On.available for NDiplillq - - . -- - --6.3 152 • 52 ,., 7.6
• 1C5 • 54 240 -" ISO 0 54 '" ••• " lBO 0 " 320 o.o
J.o 114 0 52 142 "' 5 100 0 " 126 1.2 , 120 • 52 "' 6.5
• 110 0 54 ,., 7.0 4.0 135 0 54 164 7. 3 J.o 120 0 " ISS 7.3
• 100 0 so 142 o.o
"' 147 0 53 230 ••• • 90 0 54 134 7.3
2.0 97 0 52 ,, 1.2 2.0 .. 0 53 ,. 7.4
4 02 so '" '·' 4 " 0 " "' 7.4
0 92 0 " 157 7 .•
• •• """' so "' 7. 2 0 , 0 52 , ••• • 124 55 51 200 "' 0 100 0 so 164 7.0
12 ,. , 49 ,., 6.4 5 95 0 55 "' 1.2 4 110 0 so '" 7.4 .. , 133 0 - 225 7. 2 7 ,, 0 55 197 7.,
14 81 0 54 250 6.7 2.2 " 0 - .. -2·5 63 0 - 92 •••
5 81 0 52 , 7. 2 , 240 0 56 .,, •• 7 0 .. , 52 125 '·'
e.a7 120 52 204 6.90
!4·0' !,46 !'.a :!:,80 ::o .41
5o46 100 " 162 7.22 !1.97 !23 !1.9 !36 !!J .20
3.0 , .. 125 '·' -17.0 -240 -56 -410 •7,S
4.0 .. 50 110 •• o .... o -152 -ss •Z40 -7.6
Arsenic,
""/1
o. 004 o.ooJ
-<0.01
<0. 01
<0. Cl1 <0.001
·-<0. 01
--<0.001 -
<0 -01 <O.OCt
<0.01 --
<0. 001
--<O .at
<O.Qt
--<0 .02
o.os --
<0 .01 <0.001
--<0-01 o. 004
<0.001
---o.oJ
I I I I I I I I I I I I I I I I I I I
6
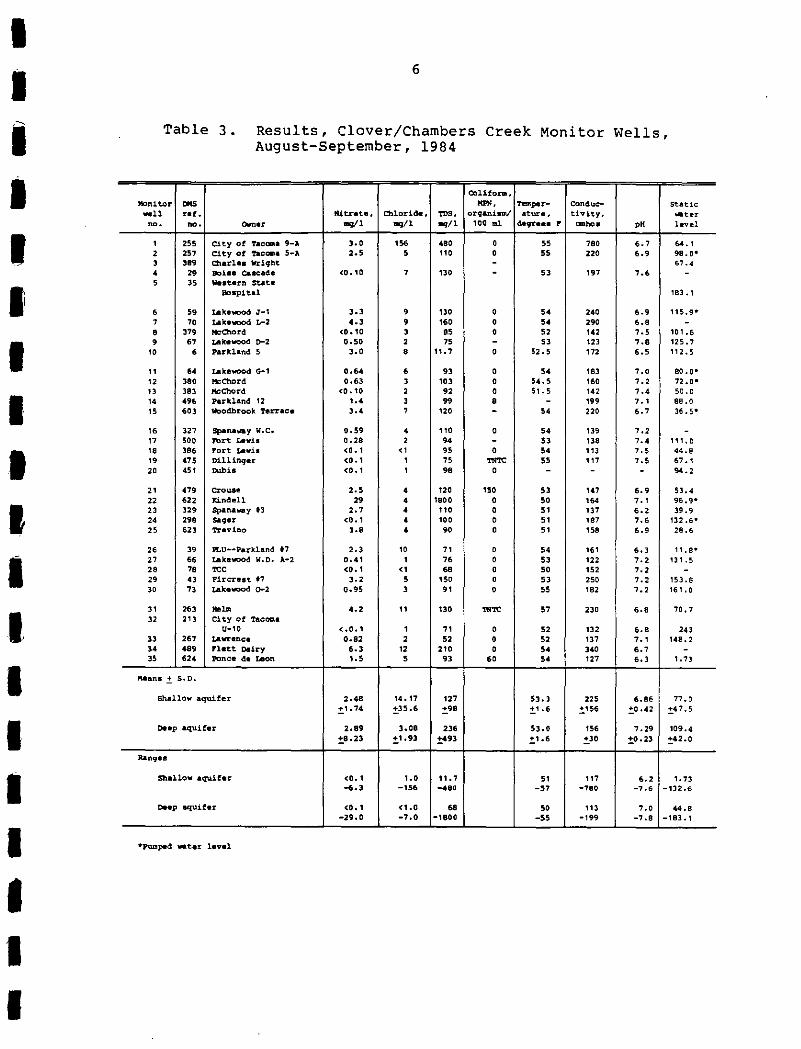
Table 3. Results, Clover/Chambers Creek Monitor Wells, August-September, 1984
Oolifon~~,
Monitor """ ...... Telllper• Conc!ue- St.& tie
-u ref. Nitrate, Chloride, TDS, organism/ ature, tivity, water no. oo. OomO< ,..;1 .. /1 oq/1 100 Gl 4•9T••• • _,, pH level
1 255 City of T&CQIII.& ·-· 3.0 1S6 '" 0 55 780 6.7 ... 1 2 257 City of 'h.c:cea ·-· '·' 5 110 0 55 220 6 •• 98. o•
' 3 .. Otarlea Wriqht - 67.4
• ,. Boiae OaiiCede <0. 10 7 130 - 53 107 7.6 -5 " western State
8Dapital 183. 1
6 50 X.kewood J-1 3.3 • 130 0 54 240 6 •• 115.9• 7 70 Lakewood L-2 4.3 • 160 0 " 200 6.8 -8 ,. MeChord <0.10 3 as 0 52 142 7.5 10, .6
• 67 ......... D-2 o.so 2 75 - 53 "' 7.8 125.7
10 6 Parkland 5 3.0 8 11.7 0 52.5 172 6.5 112.5
11 .. Lakewood G-1 o.64 6 •• 0 " 183 7.0 eo. o• 12 380 Me Chord o.63 ' 103 0 54.5 160 7. 2 72.0•
" 383 Me Chord <0 .10 2 ., 0 51.5 142 7.4 50 .o 14 406 Parkland 12 1.4 ' .. 8 - 100 7.1 BE! .o 15 603 Woodbrook Terraca ••• 7 120 - 54 220 6.7 J6. s•
16 327 Spana-y w.c. 0.59 • 110 0 54 ,. 7.2 -17 500 ~rt Levis 0.28 2 .. - 53 138 7.4 111. 0 18 386 Fort Levis <0.1 <1 •• 0 54 113 7. 5 44.e .. 415 Dillinqer <0. 1 1 75 """ 55 117 7. 5 67.1
20 451 """'' <0.1 1 08 0 - - - ... , 21 .,. crouae 2.5 4 120 150 53 147 6 •• 53.4
22 622 Xindell ,. 4 1800 0 50 164 7.1 96.9• 23 ,. Sp.l.ru!.Wfly " 2.7 • 110 0 51 137 6.2 39.9 24 ,.. Saqer <0.1 4 100 0 51 187 7.6 132.6• 25 623 Trevino 3-8 4 ., 0 51 158 6 •• 28.6
26 ,. PLU--Parkland ., 2-3 10 71 0 54 161 6.3 11.a• 27 66 Lakewood w.o. A-2 0.41 1 76 0 53 122 7.2 13 1. 5 28 78 "'c <0.1 <1 .. 0 so 152 7.2 -,.
" Flrerest " 3. 2 5 150 0 53 250 7., 153 .s 30 " Lakewood o-2 o.9s 3 01 0 55 182 7, 2 161.0
" 263 Helm 4.2 11 130 "'"' 57 230 6.8 70.7 J2 21] City of Tacoma
t1•10 <.0.1 1 71 0 52 132 6.8 "' JJ 267 Lawrence o.82 2 52 0 52 137 7.1 148.2 34 489 Plett Dairy 6.3 12 210 0 54 340 6.7 -" 624 Ponce de Leon 1.5 • 93 60 54 127 6.3 1. 73
Means ! s.o.
Shallow aquifer 2.48 14.17 127 53.3 m 6.86 77.0 !,1o 74 !,35.6 !,98 !,1 .6 !,156 !,0 .42 !_47.5
Deep aquifer 2o89 3.08 236 53.0 156 7.29 109.4 !,8.23 !,1.93 !,493 !.1.6 !,30 !.0. 23 !42.0
Ranqes
Shallow aquifer <0. 1 1.0 11.7 51 117 6.2 ,, 73 -6.3 -156 .... , -57 -780 -7.6 -132.6
Deep aquifer <0.1 <1.0 .. so "' 7.0 44.8 -29.0 -1.0 -1800 -55 •199 -7.8 -183.1
•Pumped -.ter level

I I I I I
I I I I I I I I I I
I I
Table 4. Results, October,
Monitor OMS -ll ,., .
no. ~- OWnor
1 255 City of T&COIIUI. ·-· 2 2S7 City of TaC'OIIa 5-A 3 389 Ol&rlee wri9ht 4 29 aobe Cll.aeade s " W.atern State
ft)spital
6 59 Lakewood J-1 7 70 LAkewood L-2 8 379 Mcc:hord
• 67 Lakawood D-2 10 6 Parkland 5
11 .. Lakewood G-1 12 380 Me Chord 13 383 Me Chord 14 ... Parkland 12 1S 603 Woodbrook Terrace
16 327 Spana-y w.c. 17 soo Port tewil 18 386 Port Lewis .. 47S Dillinger 20 451 """" " "' Cr'OUlllfl
22 622 JCindell 23 329 Spanaway ., 24 ,.. saqer 25 623. Trevino
26 " PLIJ-Parkland " 27 66 LAkewood w.c. ,_, ,. " '11:C
" 43 !'irerest " 30 73 Lakewood o-2
31 263 Helm 32 213 City o! Tacoma
o-10 33 267 lAwrence 34 489 Flett Dairy 35 624 Ponce 4e Leon
Mean• ! s.o.
Shallow aquifer
Deep aquifer
Ran9••
Shallow aqui!e~
oeep aquifer
7
Clover/Chambers Creek Monitor Wells, 1984
CDliform,
"'". 'l'e!ll.per- ConCiuc- static Nitrate, Chloride, ..... O'l'9&nilllll/ ature, tivity, wter
aq/1 aq/1 "'" 100 Ill deqreaa F -ho· pH level
2.2 186 SOl - S4 870 •• 7 61.5 , .. " ... - 53 2<0 6.7 46.3 - ... o <0.1 10 "' - S2 220 7.5
2.1 8. 0 126 - S4 215 6.8 21€.7•
2.8 22 148 - 52.5 230 ••• 116. J• •• 7 " 179 - 53 320 6.7
<0.1 •• 0 " - S2 152 7 •• 102.3 0.49 6.0 .. - S2.S 122 7.2 TJJ. o• 2·' 10 113 - S2 200 ••• 123.4
30 .o 0.76 6.0 111 - 55 177 7.' 4S <0 .1 s.o 100 - S2 167 7. 3 30
1.6 " 95 - so 143 6.8 12 .e 3.1 20 138 - 53 230 ••• 32.5
o.e6 6.0 98 - S2 140 ,. 0.19 7.0 83 - 51 146 7.4 112 <0. 1 5.0 " - 53 124 7.4 41.3
<0.10 e.o 77 - so 124 7.4 69.9 <0. 10 10 88 - 51 153 7.4 95.('
2.4 14 95 - 51 153 7.0 57.0 0.81 6.0 102 - " 170 7.2 102 .o
2.4 e.o •• - 51 154 ••• 39 .9* <0. 10 10 111 - 51 194 113.7 7. 5
"' 20 .. - 51 167 ,. 31.0
2.5 16 100 - S4 167 6.4 12. 2* 0.4] 12 88 - S2 124 TOO, C* <0.1 s.o •• - •• 167 7.5 -<0.1 7.' 153 .e
1.5 10 103 - S2 194 7. 0 161.0
3.5 20 "' - " 23S 6.7 70.7
- 54 .. 243 0.75 ••• 86 - so 148.2
••• 20 222 - 54 400 '"·' 1.6 ••• 65 - 56 144 1.82
2.27 23.4 138 52.3 243 .... 67.7 !.2. 02 ;!:42.3 ;!:102 :!:1.7 ;!:182 :!:0-37 !.'48.4
Oo75 12oJ 102 51.7 162 7.18 101.4
:!:0·66 ;!:18.7 ;!:15.8 :!:1.9 ;!:34 :!:" .26 ;!:58.4
<Oo1 ••• 65 so 124 ••• 1.82 -a.o -186 -503 _,. -870 -7.6 -153.8
<0.1 s.o 83 •• 122 6.8 41.3 -2.1 _,.
-137 -55 -220 -7.5 -216.7

I I I I I I I I I I I I I I I I I I I
Table 5. Results, January,
Monitor OMS -u ~f.
no. oo. "'""' 1 255 City of ,.._.. ·-· 2 257 City of .. _.. 5-A 3 389 Ola.rlaa Vri'iht 4 29 Boise Cascade 5 35 western state
Hospital
' 59 take~ J-1 7 70 Lakewood L-2 8 379 McChord 9 67 lAkewood. D-2
" • Parkland 5
, 64 taka111t10d G-1 12 380 '""'"'"'' 13 383 MCChord
" 496 Parkl•nd 12 , 603 Wooc!brook or.rraee
,. 327 Spana-y w.c. , 500 Fort Levie 18 386 Fort t.ewia 19 475 Dillinqer 20 '" OUbia
21 479 crouse 22 622 nndell 23 329 Spana-y tJ ,. 298 S.qer
" "' Trevino
26 39 PLU-Park.land " " " Lakewood w.o. A-2 2B 78 1CC 29 43 Fircre•t " 30 73 L&kevood o-2
31 263 Helm 32 213 City of T&CCXIIB
o-10 Jl 267 x.vrence 34 489 Flett Dairy 35 '" Ponce de Leon
Mean• ~ s.o.
Shallow aquifer
Deep aquifer
Ranqea
Shallow aquifer
Deep aquifer
8
Clover/Chambers Creek Monitor Wells, 1985
O:lliform,
"""· '!'em per- COn due:- static Nitrate, Chloride, ""'· orqaniGII,/ attJre, tbity, -ter .. ,, .. ,, .. ,, 100 al M9Z'• .. • ....., . pH laval
2.63 74 312 - " 510 •• 7 60.8 ).06 8.8 144 - " 240 •• 7 ... 2
61.7 <0.10 8.5 ... - 52 215 7.6
2.19 •• o 134 - 53 225 ••• 154.2
2.63 , 150 - 53 2JO 6.9
<0 .10 •• o 62 - 51.5 138 7.7 98.3 0.48 6.3 104 - 52.5 , 7.3 ]o28 19 193 - 52 195 6.9 , 14 .o
28.2 0.70 5.5 86 - " 169 7.4 42
<0 .10 2.1 68 - 49.5 153 7. 3 1.51 •• o 117 - 49.5 143 •• 9 68.2 ].06 9.0 138 - 52 225 6.8 29.8
o.sg 3. 0 ,. - 49 125 7.0 120. 1 109
<0 .10 3-3 107 - 52 122 7.9 40. 1 <0.10 2.5 91 - " 120 7.6 92.9 <0. 10 3.0 105 - 50 141 7.6 92.9
2.19 6.0 109 - 49 141 7.0 SJ, 5 o.79 23 125 - 48 163 7. 2 99.9
28.9 <0.10 5.0 130 - " 158 7. 0 26. 0 ],50 5.5 120 - , 158 7 .o 26. 0
2.63 9.0 110 - 52 157 ••• Oo48 7.7 240 - 53 120 7.2 ... 7
<0.10 1.5 130 - 49 154 7.4
1.75 4.5 940 - 53 190 7.0 159.2
3.28 " "' - .. 230 •• 7 66.9
<0-10 2.0 98 - " 129 7.0 241 0.79 2. 5 100 - 49 135 7.2 145.7 3. 72 9· 5 190 - 53 280 6.9 1.62 2.0 96 - 54.5 124 6o1 1.52
1.98 11.5 137 51. s 199 7. 03 65.4 !.1 .38 !.t1-9 !:<0 !.2-0 !.98 !.0 .48 :!;41.6
0.80 5.0 191 51.4 158 7.25 91.6 !.0-71 !.2.23 !.240 !.2-2 !.38 +0. 31 !46.4
<0. 1 2oO 62 " 120 6.1 1.52 -3.72
_,. -312 -54.5 -510 -7.8 -145.7
<0.1 •• o ,. 48 , 6.9 40. 1 -2.19 -e.5 ... ., _,.
-225 -7.6 -159.2

I I I I I I I I I I I I I I I I I I I
9
Table 6. Historic N03 as N Concentrations, Clover/Chambers Creek Monitor Wells, rng/1
Monitor OMS 1980 1981 well ref.
no. no. owner Jan Mar July Dec Jan Feb July
1 255 City of Tacoma 9-A 2.60 2 357 City of Tacoma 5-A 2.10 ].00 3 389 Charles Wright .30 .20 4 29 Boise Cascade .20 .20 .20 5 35 Western State 2.20 2.40
Hospital
6 59 Lakewood J-1 3·0 .90 3.00 2.0 3. 10 7 70 t.kewood L-2 .20 .20 .20 8 379 Me Chord .20 .20
• 67 Lakewood D-2 .70 .20 .20 10 6 Parkland 5
, 64 Lakewood G-1 12 380 Me Chord .eo .so 13 383 Me Chord .20 .20 14 496 Parkland 12 .4Qil .20 .20 .20 1S 603 woodbrook Terrace 3o20 2.90
16 327 Spanaway w.c. .90 .90/.20b 17 SOD Fort Lewis .20/.80 .20 18 386 Fort Lewis .20 .20 19 47S Dillinger 20 4S1 Dubis
21 479 crouse 22 622 Xindell 23 329 Spanaway t3 2.6 2.6 24 298 sager 2S 623 Trevino
26 39 PLU-Parkland 17 27 66 Lakewood w.o. A-2 .16 .40 .40 28 78 '11:C 29 43 Fircrest 17 2.90 30 73 Lakewood o-2
31 263 Helm 32 213 City of Tacoma
U-10 33 267 Lawrence .40 .40 34 489 Flett Dairy 3.10 3S 624 Ponce de Leon
8 sampled in January 1976.
bsamples showing two numbers Yere sampled twice in that month.
1984
Jan-Feb
2.5 3.30
.10
.10 2.80
J.oo 4.40
.10
.59 3.20
.63 • 7S .10
1.60 3.50
• 70 .32 .63 • 10 .10
2.3 .92
2.60 .10
3.70
2.40 .4S
3.10 1.70
J.eo
.42
.73 7.80 2.30

I I I I I I I I I I I I I I I I I I I
10
Table 7. Mean Nitrate and Chloride Concentrations in Monitor ~lells
- mean valL\es -Aq~ti fer Well !! - mg/L -Type Chloride Nitrate-N
A 1 90.0 2.59 A 6 13.2 2.93 A 7 11.9 4.48 A 8 3.4 o. 10 A 10 11 .4 3.06 A 15 10. 1 3.31 A 19 3.4 o. 10 A 20 3.8 o. 10 A 21 7.2 ~ -~ .::. . ._ ... ~
A ~~ .:,..,;. 6.3 ..., C:"':" .::. . .;.;._; . A 24 5.-6 o. 10 A ..,e ... _. 8.5 3.62 A 26 1 1 .2 2.37 A 29 5.7 2.97 A 31 13.:: - 72 -.:•.
A 33 ~ 7 (l. 69 ~·.
A 34 13.9 6.64 A ~e
~·...J e -...J • ._;. 1. 76 A-B 32 ::. 1 o.:o A-C :: 9. 1 3.03 B ~ N.A. ·-' A-C"' 13 3. ~) o. 10 c 4 7. 9 o. 10 c 5 7.0 ..... "':"C"
.::. • .....;· ..J
c 9 4. ~ 0.5: '"' c 11 ~ .., 0.62 ' ~
c 12 4.5 0.69 c 14 6. 8 1 c:~.
• ..J..::..
c 16 4.6 0.61 c 17 .. 7 0.29 ·-·. c 22 4. 1 1. 25 c 27 5.5 0.44 c 28 2.9 o. 10 c 30 6.0 1 .39 E 18 2.7 0.21

I I I I I I I I I I I I I I I I I I I
11
Nitrate-nitrogen (No3-N} concentrations in the shallow and deep aquifer are illustrated in Table 8. Values ranged widely in both aquifers. In the shallow aquifer, mean N03-N concentrations ranged from 0.10 mg/1 (essentially the lower detection limit} to 6.64 mg/1, with a mean of 1.84 mg/1. Ten of eighteen wells in the shallow aquifer were measured with mean N03-N concentrations greater than 2.5 mg/1, compared with no deep aquifer wells with mean N03-N concentrations greater than 2.5 mg/1. The overall mean N03-N concentration for 13 deep aquifer wells was 0.78 mg/1. Mean No3-N concentrations in the deep aquifer ranged from 0.10 to 2.35 mg/1.
Table 8. Mean Nitrate and Chloride Concentrations, Shallow and Deep Aquifers
Shallow Aqc1ifer
CHLORIDE Mean ; n <II>;
12.0952 19
Variance;370.6374 S.Dev.; 19.2519
NITRATE-N Mean ; 1.8447 n (II); 18 Variance= 3.2120 S.Dev.= 1.7922
A-C wells not used ir. calcLtlatlcn
Deep Aqctifer
CHLORIDE Mean; 5.1817 n <II>; 1::'. Variance= 2.8706 S.Dev.= 1.6943
NITRATE-N Mean = n (Ill= Variance= S.Dev.;
0.7757 13
0.4454 0.6674

I I I I I I I I I I I I I I I I I I
12
Seasonal variations
It is very difficult to identify seasonal trends with only five sampling dates. The conclusions drawn from this limited data are crude; however, some trends were seen in the 1984-1985 sampling period.
Figures 2 and 3 illustrate mean nitrate concentration by sampling quarter in the shallow and deep aquifers, respectively. As shown in the figures, there is little seasonal variability in the nitrate concentration in the shallow aquifer, but the deep aquifer showed a fluctuation of almost 1.5 mg/1 in the mean nitrate concentration during the summer. The reasons for this phenomenon are not clear. Reduced dilution as a result of increased consumption and decreased recharge is one possible cause, possibly in conjunction with increased fertilizer application and irrigation of lawns and gardens. Additional monitoring is necessary to determine the cause of this phenomemon.
Chloride concentrations measured in both shallow and deep aquifer wells fluctuated seasonally, as illustrated in Figures 4 and 5. Mean chloride concentrations increased significantly in both aquifers during the fourth sampling quarter (i.e., October).
The mean concentration of chloride in the shallow aquifer was lowest in the winter (first quarter) at 6.9 mg/1, increased to 8.9 mg/1 in the spring, 14.2 mg/1 in the summer, and 23.4 mg/1 in the fall, dropping to 11.5 mg/1 in the winter of 1984. The deep aquifer mean chloride concentration was relatively stable (i.e., between 3.0 and 5.5 mg/1) for all four quarters except the fall, when the mean concentration rose to 12.3 mg/1. The cause for the chloride concentration increase in the fall is not fully understood, and will require additional monitoring. It may be a natural phenomenon, relating to the aquifer's geochemistry. There appears to be no correlation between the behavior of nitrate and chloride in the aquifer, as has historically been the case in other groundwater studies.
Results of Monitoring in InQividual Wells
The following is a discussion of each monitor well in relation to potential water degradation and historic trends. Figures showing the results of water quality monitoring to date accompany selected wells; i.e., wells with obvious trends or particularly illustrative results.

-------------------
HITRATE
Mg/1
'l TAC-·PIERCE HITRATE
SHIALLOW MUIFER
2.5 · . .....__ ·-----.........._~-~
2
1.5
1
lit.5
--------t------------1-1 2 3
QUARTER
1/84 - 1/85
Figure 2 Mean Nitrate-N Concentration, Shallow Aquifer Wells
-l 5

-------------------
NITRATE
M!J/}
3
2.5
2
9.5
9 --------1----1 2
I
1AC-PIERCE NITRATE DEEP AQU I :FER
3 QUART EFt
1/84 -· 1.1'85
Figure 3 Mean Nitrate-N Concentration, Deep Aquifer Wells
)K--
----I 5

-------------------
CHLORIDE Mg/1
25
20
15
10
0 - ------------t-.1 2
TAC-PIERCE CHLORIDE SHALLOW AQIU I FE:R
)I<"
'
--+-----------1-3 4
QIUARTE:R 1/8•<1 - .1/8'5
Figure 4 Mean Chloride Concentration, Shallow Aquifer Wells
-! 5

-------------------
CHLORIDE
Mg/1
25
29
15
19
1 2
TAC·-PIERCE CHLORIDE DEE:P AQUIFER
-+--3
QUARTER
1/84 - 1/85
/' /
---+ 4
Figure 5 Mean Chloride Concentration, Deep Aquifer Wells
~:

I I I I I I I I I I I I I I I I I I I
13
Monitor Well #1, City of Tacoma Well 9-A. The driller's log for this well shows no completion details, therefore the elevation of the screen is not known. Presumably the well penetrates an aquifer in Layer A and has no extensive surface protection. Nitratenitrogen concentrations varied from 2.2 to 3.0 mg/1, with a mean of 2.6 mg/1. This concentration indicates an elevation over the background nitrate concentration, but does not represent significant contamination. The measured N03-N concentration in the well was 1.5 mg/1 in December 1980, rising to 2.6 mg/1 in January 1981 and 2.5 mg/1 in 1984. The 1.0 mg/1 concentration increase occurred between December 1980 and January 1981. Data prior to December 1980 are not available.
The mean chloride concentration in Well #1 (90 mg/1) was the highest of the five monitor wells. The chloride concentration in this well was 90 mg/1 in December 1980, 75 mg/1 in January 1981, and as high as 186 mg/1 in 1984, indicating that the well may have been contaminated for several years. The high chloride level in Well #1 has also been noted in other wells throughout what is locally called "Nalley Valley." There is a reasonable possibility that industrial brine has been released above the aquifer.
This well is in an area with known contamination by volatile organics. The first quarter priority pollutant scan showed a trichloroethylene concentration of 4 ug/1. Trichloroethylene is a clear, colorless liquid, used mainly as a degreaser/solvent, and its presence indicates contamination by surface activities. The proposed EPA criteria for protection of human health is a concentration of zero maximum in drinking water. The concentration of trichloroethylene estimated to result in one additional lifetime cancer case in a population of 1,000,000 is 2.1 ug/1.
Well #1 was sampled for purgeable priority pollutants in the second sampling quarter, during which time the following compounds were found:
Trichloroethylene: Trans,l-2-dichloroethylene: 1,2-dichloropropane: 1,1,2,2-tetrachloroethane:
4 ug/1 2 ug/1 1 ug/1
Federal drinking water standards have not been adopted for most of these parameters. The EPA published drinking water standards as recommended maximum contaminant levels (RCMLs) in the June 12, 1984 Federal Register. RCMLs are "non-enforceable health goals which would result in no known or anticipated adverse health effects with an adequate margin of safety." The proposed RCML for trichloroethylene is zero; the remaining three compounds discovered in Well #1 have no proposed RCMLs at this time. Risk levels for these pollutants have been determined based on studies with animals. These risk levels are established by EPA cancer researchers to indicate the concentration that is anticipated to cause one additional

I I I I I I I I I I I I I I I I I I I
14
case of cancer for every 100,000 persons exposed. The lo-S cancer risk level for trichloroethylene is 27 ug/1; trans,l,2-dichloroethylene is 2 ug/1; 1,2-dichloropropane is 87.9 ug/1; and 1,1,2,2-tetrachloroethane is 1.7 ug/1. Arsenic was detected in this well at a concentration of 4 ug/1. The EPA-determined health risk level for arsenic of one cancer case per 100,000 persons is 0.02 ug/1.
This well is located in a highly industrialized and commercial area with a high concentration of subsurface stormwater disposal facilities.
Monitor Well #2: City of Tacoma Well 5-A. The mean nitrate concentration for the 1984-1985 monitoring period was 3.03 mg/1, ranging from 2.5 to 3.3 mg/1. This level is comparable to the single historic value for the well, which was 2.6 mg/1 in December 1980. The nitrate concentration in Well #2 is roughly 2.5 mg/1 higher than the background concentration. The mean chloride concentration for the 1984-1985 period was 9.06 mg/1, indicating a slight deterioration of water quality when compared with the background chloride concentration.
Figure 6 summarizes existing monitoring information for Well #2. Priority pollutants were not detected in this well. Arsenic was detected at a concentration of 3 ug/1.
This well is perforated through several horizons, the uppermost 65 feet below ground. Deeper zones may be exposed to aquifer Layer C and the shallowest zone is definitely in Layer A. The shallower zones open to the well are unprotected. The surrounding land use is high-density residential utilization, with some commercial facilities.
Monitor Well #3: Charles Wright Academy. Nitrate concentrations in this well are consistent w1th the background level, and chloride concentrations are similarly low. The total coliform counts in this well have exceeded standards on each sampling occasion and have increased since 1981. The 1980 and 1981 coliform counts were 16 organisms per 100 ml, which increased to "Too Numerous to Count" on two occasions in 1984. The resampling of this site in 1984 by TPCHD duplicated this finding. The low concentrations of nitrate, chloride, and total dissolved solids do not indicate the presence of sewage or septic tank effluent.
This well is locally designated as the Old Farm ~lell and has open bottom construction which probably ends in Layer B. There would be moderate surface protection expected at this site. The coliform concentration may be somehow related to current extensive dewatering works for a sewer tunnel which is under construction. It is more probable, however, that the high coliform count is related to a direct contamination at the well casing. The well is located in a relatively low-density area, predominantly residential, with the upgradient area increasing in density.

- -CL N0
3 TDS
mg/1 mg/1 mgll
to. o -4.4 170-
9.0 ll.D 160-
'·' ISO
8.0 -
'·' too
7.0 -
2.8 tlO
••• '·. 120
5.0 :z. 0 110
- - -12 CITY OF TACOMA s-A
' DEC 80 JAN Bl
----CL ----NO] --·-- TOS --·- SWL ----~coHo
- - -
' JAN 84
CHLORIDE NITRATE-NITROGEN TOTAL DISSOLVED SOLIDS STATIC WATER LEVEL CONDUCTIVITY
-
' APR 84
- - - -
' AUG 84
Figure 6 Monitoring Results, City of Tacoma 5-A
- - - - - -SWL COND
feet mhos
THE VALUE FOR kJ:. IN OCT 84 WAS 16
I ,,
\ 60 300
80 280
100 260
140 220
160 200

I I I I I I I I I I I I I I I I I I I
15
Monitor Well #4: Boise Cascade. The mean nitrate concentration in this well is 0.1 mg/1, which is essentially the detection limit. The mean chloride concentration, however, was 7.9 mg/1 for the five-quarter sampling period, which is relatively high compared to the other deep aquifer wells.
This is an exceptionally deep well which is exposed only to aquifers below Layer F. The somewhat elevated chloride is probably not indicative of quality degradation, but is more likely a result of the natural geochemistry. Several very deep wells in the region have been noted to have chloride in the range of 10 or more parts per million.
Monitor Well #5: Western State Hospital. Nitrate concentrations at this well have remained roughly stable since 1900: 2.2 mg/1 in December 1980, 2.4 mg/1 in January 1981, and a mean concentration of 2.35 mg/1 in 1984. The mean chloride concentration was 7.0 mg/1 in the 1984/1985 sampling program, indicating slight elevation over background conditions. Conductivity was higher than the mean for this sampling period.
The well is screened against an aquifer in Layer C which in this area is overlain by a considerable thickness of clay. As such, the aquifer should be highly protected. The presence of nitrate in the range of 2.0 to 2.8 mg/1 is evidence that slight to moderate degradation appears to have occurred in Layer C.
The tributary area is largely high-density residential and commercial utilization.
Monitor Well #6: Lakewood Well J-1. Measured nitrate concentrations in this well have fluctuated between roughly 1.0 mg/1 and 3.0 mg/1 since monitoring was first conducted in 1980. The mean nitrate concentration in the 1984-1985 program was 2.9 mg/1, indicating a slight elevation over background concentrations. The mean chloride concentration in that same period was 13.2 mg/1, which is roughly 10 mg/1 higher than the background level, and indicates moderate degradation. This well is completed in the shallow aquifer with no appreciable surface protection, and the elevated nitrate and chloride levels are not unexpected. Figure 7 illustrates the available water quality data for Well #6.
Monitor Well #7: Lakewood Water District L-2. The measured concentration of nitrate in this well increased by nearly 4 mg/1 between 1981 and 1984. Figure 8 illustrates the quality trends in the well water. The mean nitrate value for the 1984-1985 program was 4.5 mg/1, which is roughly 4 mg/1 higher than the level considered background for the basin. The chloride concentration is similarly elevated, with a mean of 11.9 mg/1. The mean total dissolved solids concentration in this well was 176 mg/1, which exceeds the mean in the shallow aquifer by 60 mg/1. Conductivity in this well was also relatively high compared to other shallow

-----------CL N03 TDS
mg/1 mg/1 mg/1
••• n.o 190
].0
12.0 180
'· 5 10.0 170
8.0 2.0 liO
••• 150
'· 5
••• ... 1.0
••• no
••• •••
16 LAKEWOOD J-1
r---1 ~ I .....,_ ___ _
I I I I \
I I I I I I
\ I \ I I I \ I I I 1 I I I \ I I I V I I
\ : I I I I I I I I I I ,, f
JAN MAR DEC JAN JUL •• 80 81 81
--- CL CHLORIDE ---- NO] "' NITRATE-NITROGEN
JAN •• -·- TOS .. TOTAL DISSOLVED SOLIDS ---- PWL • PUMPED WATER LEVEL -···- COND c CONDUCTIVITY
APR ••
--------THE VALUE FOR c.L,.IN OCT 811 WAS ll
AUG
•• 'OCT 811 JAN 85
PWL OND
10 280
100 270
120 260
1110 . 250
110 ·21l0
180 230
220
'PWL
Figure 7 ~-~onitoring Results, Well #6

- -CL N03 TDS
mg/1 mg/1 mg/1
18.0
17.0 •• 0 220
16.0
15.0 "" ••• 14.0
ll.O 200
12.0 3. 0
11.0 110
10.0
2.0
••• 80
8.0
7.0 1.0 170
•••
••• 0.2 1.0
- - - - - - - - - - - - - - -f7 LAKEWOOD L-2
~---;::=:.: ==-.:.:.--===i::.::_ ----- ::::Vo :,.',-"' I -------- J -
/ /"· -- Slol" /
1/ ··~. v / "'··. ,.
I .
I I
I I
I I
I I
I ____ _}
JUL 80 DEC BO
----CL ---- N03 --·-- TDS ----SWL
JAN 81
CHLORIDE NITRATE-NITROGEN
"' TOTAL DISSOLVED SOLIDS STATIC WATER LEVEL CONDUCTIVITY -···-COND:
JAN Ill APR 811
Figure 8. l.lonitoring Results, Well 117
AUG 84 OCT 811 JAN 85
- -SWL COND
feet llmhos
160
,. 180
320
200
310
220
••• no
,..
"" 280
270
'PWL
I I I I I I I I I I I I I I I I I I I
16
aquifer wells. No standards are being exceeded, and there is no evidence of priority pollutant contamination, but this well exhibits signs of moderate water quality degradation.
Well #7 is located on top of Hemlock Hill and penetrates a considerable thickness of vashon Till which offers extensive surface protection. However, the well is completed in Layer A which elsewhere has a much lesser degree of surface protection. Accordingly, the relatively elevated nitrate and chloride may be extensive through this part of the aquifer and is not dependent on a direct contamination source. The contributing area includes high density residential and commercial utilization, and, until completion of ULID 73-1, was unsewered. The area is also heavily dependent upon subsurface stormwater disposal.
Monitor Well #8: McChord Air Force Base Well 832. All parameters measured were low in concentration, and were consistently below mean values for other wells in the shallow aquifer. Records indicate that this well is completed in Layer A. Contaminant indicators were expected; none were noted.
Monitor Well #9: Lakewood Water District D-2. Nitrate as N concentratlons have fluctuated slightly since 1980; N03-N decreased from 0.7 mg/1 in 1980 to 0.2 mg/1 in 1981, and to a mean of 0.52 mg/1 in the 1984/1985 sampling period. Chloride concentrations have not appreciably changed since the 1980 sampling, and appear to be near the background level, with a mean of 4.5 mg/1. Total dissolved solids and conductivity are similarly low.
This well is completed in Layer E and has extensive surface protection at three underlying zones. Surrounding land use is lowand high-density residential. As would be expected, contaminant indicators are minor to not present.
Monitor Well #10: Parkland Water District #5. This well had not been monitored prior to the Clover/Chambers Creek Study. The mean NO~-N concentration was 3.1 mg/1, and the mean chloride concentratlon was 11.4 mg/1. Total dissolved solids and conductivity are typical for background levels. Water quality appears to be slightly degraded in this well, based upon the slightly elevated nitrate and chloride concentrations. Figure 9 illustrates monitoring results in the well.
Well #10 is completed in Layer A and has no evidence of surface protection. Upgradient of the well, land use is predominantly lowto high-density residential, and was unsewered (including several community septic systems) until completion of ULID 73-1. Numerous subsurface stormwater recharge facilities are located upgradient of the site, as well. A relatively elevated amount of nitrate and chloride is not unexpected.

- -CL N03 TDS
mg/1 mg/1 mg/1
13.0 ].Ia
170
12.0 3.3
160
11.0 3.2
150
10.0 3.1 1110
130
9.0 3.0
120
8.0 2. 9
110
- - - - - - - - - - - - - - -110 PARKLAND S THE VALUE FOR ~IN JAN 85 WAS 193
THE VALUE FOR CJ.. IN JAN BS WAS 19
~ --------.. '- -- -----'--- -.--------
I A---I / I /1
.. _J /1 (!··--
\ /~ ;·I ' . Ill
\\ / --------~ ;/ TOS ... ~···-. _/ / '-.....__'- j'f -· ~---'\-· --........ ~ co"o... \ ::;:---- ==--::::::, .. ". ~~-;;;;--- -- . . - ....... v ·-.
JAN 811
----CL ---- N03 --·-TOS ---- SWL -•··- COND=
APR B'l
CHLORIDE NITRATE-NITROGEN TOTAL DISSOLVED SOLIDS STATIC WATER LEVEL CONDUCTIVITY
Figure 9
AUC 811 OCT aq
Monitoring Results, Well #10
JAN as
- -SWL COHO
feet p.raho
100 230
120 120
no 210
160 100
180 190
200 180
170
*PWL

I I I I I I I I I I I I I I I I I I I
17
Monitor Well #11: Lakewood Water District G-1. This well was first sampled as part of the Clover/Chambers Creek study; historical data are not available. The mean nitrate concentration (0.62 mg/1) is only slightly elevated over the background level. Similarly, the chloride concentration appears to be slightly greater than background levels, with a mean concentration of 7.2 mg/1.
The slight elevation in chloride may be due to naturallyoccurring geochemical influences; however, without historical data for comparison, this cannot be determined.
This well is completed in Layer C and has a distinct protective layer above the aquifer. Upgradient land use includes residential development and McChord Air Force Base.
Monitor l'lell #12: McChord Air Force Base Well 711. Trichloroethylene (TCE) was d1scovered in this well at a concentration of 1 ug/1 in the first quarter and 2 ug/1 in the second quarter of sampling. Although these are minute concentrations, they indicate that contamination by volatile organics has occurred in this well at some point. Downhole sampling of the well, as opposed to the pumped sampling conducted for this study, will give a better representation of the organic contaminants in the well.
All other constituents monitored at Well #12 appear to be relatively unchanged since 1980 and 1981. The measured No 3-N concentration has declined since 1981, from 1.2 mg/1 to a measured mean of 0.7 mg/1 in 1984/1985. The mean chloride concentration was 4.5 mg/1, which does not indicate aquifer degradation. All other constituents measured in Well #12 are near or below the mean values for the 35 monitor wells.
This well is completed in Layer C and shows evidence of a 10-foot protective layer above the aquifer. This well should be watched for degradation, particularly because the protective layering found in Layer B is thin or missing in the region. The well is downgradient of an industrial/commercial area employing numerous stormwater recharge facilities as well as two liquid spill and disposal sites on McChord Air Force Base.
Monitor Well #13: McChord Air Force Base Well 5001. Mean nitrate and chloride concentrations in this well are low, 0.1 mg/1 and 3.0 mg/1 respectively, and do not indicate degradation when compared with historical data. Total dissolved solids and conductivity in Well #13 are considered to be within expected background ranges.
This well penetrates several water-bearing zones, with the shallowest open to Layer A. Below Layer A are several impermeable layers which could serve as seals to deeper water-bearing zones. Upgradient land use is forest, with a small amount of residential development.

I I I I I I I I I I I I I I I I I
I I I
18
Monitor Well #14: Rockland Light and Water District Well 12. The nitrate concentration monitored in this well 1n 1981 was 0.2 mg/1; the mean nitrate concentration in 1984 was 1.5 mg/1. Nitrate concentrations varied little throughout the 1984-1985 sampling program, revealing a lack of seasonal variation. Based on the limited historical data, nitrate concentrations appear to be increasing. The mean chloride concentration, at 6.8 mg/1, is slightly higher than the background level. Water sampled in Well #14 increased significantly in chloride concentration during the fall, a trend that was experienced in both the deep and shallow aquifer.
The slight increase in N03-N concentration indicates a potential trend in the well that should continue to be monitored.
The driller's log indicates this well to be completed in Layer E but without benefit of protective layers above the aquifer. Thus, it is in an area with a potential "window" which would allow contaminants to leak downward to deeper zones. Surrounding land use is residential, and the area is not sewered.
Well #15: woodbrook Terrace. Nitrate concentrations measured in Well #15 1n 1980 and 1981 were 3.2 mg/1 and 2.9 mg/1 respectively, and were at roughly the same level during the 1984/1985 monitoring season, when the mean measured N03-N concentration was 3.3 mg/1. Chloride values ranged from 7 to 20 mg/1, with a mean of 10.1 mg/1. These concentrations are above the background level, particularly the nitrate concentrations. The well water appears to be slightly degraded.
The well log for Well #15 is not available, but the total depth is reported as 72 feet. Accordingly, the well would penetrate Layer A and probably have no existing surface protection. The presence of contamination indicators is not unexpected. The upgradient land use is largely forest and open space, mainly within the Fort Lewis military reservation. The area is sewered, except for one community septic system (Fort Lewis-maintained) upgradient of the well.
Well #16: Spanaway Water Company. Nitrate concentrations in samples taken from this well have been below 1 mg/1 since monitoring was first conducted in 1980, and chloride does not seem to have varied greatly. The water appears to be free from degradation.
This well is completed in Layer C, but has no evidence of extensive layers above the aquifer. The possibility of a contaminant "window" also occurs here, and despite the fact that no contamination is evident at this time, the well should be monitored in the future for potential degradation. Upgradient land use includes unsewered residential areas, agriculture, and forest.

I I I I I I I I I I I I I I I I I I I
19
Monitor Well *17: Fort Lewis Well 13. Concentrations of all const1tuents measured in 1984-1985 are low, with a mean measured NOj-N concentration of 0.29 mg/1, and a mean chloride concentration of 3.7 mg/1. A comparison with historical data does not indicate water quality degradation in this well.
This well is probably completed in Layer C. Records show no evidence for protective layers above the aquifer. However, there is no evidence of contamination at this time. Upgradient land use is open space and forest.
Monitor Well *18: Fort Lewis Well 8. The mean measured chloride concentration was 2.6 mg/1 in Well *18 for the 1984-1985 sampling period, and the mean nitrate concentration was 0.2 mg/1. All measured parameters in this well were roughly equivalent to background levels.
This is a deep well completed in Layers E and F. Records show extensive layering of surface protection above the aquifer. In this area, and at this depth, the increase of nitrate or chloride would not be expected. Surrounding land use is largely forest and open space.
Monitor Well *19: Dillinger. Concentrations of all inorganic constituents measured in this well water were low (mean N03-N was 0.1 mg/1, mean chloride was 3.4 mg/1), but the total coliform count was "Too Numerous to Count" (TNTC) on two sampling occasions. This count may indicate a localized contamination source, because all other parameters do not indicate contamination by sewage or other pollutants. Subsequent samples will reveal more about the potential source of contamination in this well. Unfortunately, this well has never been sampled before, so a comparison with historical data is not possible. Figure 10 illustrates the water quality data for well *19.
Well *19 is probably completed in Layer A, and has no extensive protection. The well is located in a largely undeveloped area. Upgradient land use is forest. There is no surface evidence for a ready source of high bacterial contamination, but the well is in an unprotected area and is not enclosed in a pump house.
Monitor Well *20: Dubis. All parameters measured in this well, which was sampled for the first time in 1984/1985, were at or near background concentrations. The mean nitrate concentration was 0.1 mg/1, and the mean chloride concentration is 3.8 mg/1. This well is completed in Layer A and has no evidence of surface protection, but it is located in an area of low-density residential utilization with no sanitary sewer service.
Monitor Well *21: Crouse. The measured mean nitrate concentratlon 1n th1s well water 1s above what is considered to be the natural background level at 2.3 mg/1. Historical data are not

- -CL N03 TOS
mg/1 mg/1 mg/1
130
6.0 0.6
120
5.0 o. 5
110
•. 0 o.• 100
3.0 0.3 90
80
2.0 0.2
70
1.0 0. I
- - -119 DILLINGER
2!k------
- -· - - - - - - - -
----- --------
" ·"---·-----·· ·-.
---
THE VALUE FOR CL IN OCT S. WAS 8
--------1--
/ /
-------···-···
-
... ------ ... _ ---.. -. . .1---
~L------------ ---
DEC 83 JAN 84
----CL ----NO --·-TO~ -·-- SWL - ... - CONO
APR 811
CHLORIDE NITRATE-NITROGEN TOTAL DISSOLVED SOLIDS STATIC WATER LEVEL CONDUCTIVITY
Figure 10
AUG Blf OCT 811
Monitoring Results, Well #19
JAN 85
- - -SWL COND
feet l.lmhos
•o
60 170
80 160
100 150
120 1110
140 130
160 120

I I I I I I I I I I I I I I I I I I I
20
available for comparison, so we cannot define a trend at this time; however, there was little seasonal variation during the 1984-1985 sampling period. All other parameters are typical for the area.
This well is completed in Layer A and has no evidence of a surface protective layer. The elevated nitrate content would not be unexpected, considering the lack of surface protection. The upgradient land use is low-density residential and agricultural; the nitrate levels may be due at least in part to fertilizer application.
Monitor Well #22: Kindell. Samples from this well, monitored for the first time in February 1984, were low in mean measured chloride, which was 4.1 mg/1. Measured nitrate concentrations were low (less than 1 mg/1) in this well for all sampling periods except August, when the N03-N concentration was measured as 2.9 mg/1. This substantial increase may be due to a number of factors, including sampling error. The well is located in an area where the predominant land use is forest, with small agricultural areas. The increased nitrate concentration may be due to increased fertilization during the spring and summer, coupled with increased irrigation and resulting percolation and reduced dilution in the aquifer. Driller's logs indicate this well is completed in Layer C with no evidence of protective layering above the aquifer.
Monitor Well #23: Spanaway Water Company #3. The measured nitrate concentration in this well has been very stable, between 2.4 and 2.7 mg/1, on every sampling occasion since 1980 (a total of 7 including 1984/1985 samples). The mean chloride concentration in the 1984/1985 samples was 6.3 mg/1; the samples showed little seasonal variability. Well #23 is a relatively shallow well, completed in Layer A with no extensive surface protection. It is located in a densely-developed area that has been unsewered for many years. Farther upgradient, the land use is forest. The elevated nitrate concentration is not unexpected.
Monitor Well #24: Sager. The mean nitrate concentration in this well water was 0.1 mg/1, and the mean chloride concentration was 5.6 mg/1, indicating no evidence of contamination. Total coliform counts of 8 MPN and 55 MPN were measured in this well in the first and second sampling periods, respectively. This is likely due to surface contamination rather than a result of septic tank effluents. The well is completed in Layer A, and has no extensive surface protection. Surrounding land use is low-density residential utilization and open space. Figure 11 illustrates the water quality trends measured in Well #24.
Monitor Well #25: Trevino. Nitrate concentrations measured in the well water ranged from 3.5 to 3.8 mg/1, with a mean value of 3.6 mg/1. This concentration is roughly 3.0 mg/1 higher than what we consider the background level, and indicates potential contamination. The mean chloride, total dissolved solids, and conductivity

- -CL N03 TOS
mgll mg/1 mg/1
·~ B.O
175
111.0 7.0
u.o •• 0 150
10.0 '· 0
125
8.0 ••• 100
6.0 3.0 75
•• 0 2.0 50
2.0 1.0 25
- - - - - - - - - - - - -,,. SAGER LAYER A
............. ............................
--.......__
···-~· -··· ... -~P.!!E.,__ ... ... -·-·--·---···
------
JAN Bit
CL N03 TOS SWL COND
·--- c.--· . --· --~·--·
~ ----- _§WL ---------- -------
APR 811
CHLORIDE NITRATE-NITROGEN TOTAL DISSOLVED SOLIDS STATIC WATER LEVEL CONDUCT! VI TV
Figure 11
-- v
No 3 -AUG 811 OCT 811
Monitoring Results, Well #24
- - - -SWL CONO
loot \.llfthOI
20 280
•o 200
..-... """"____...-- 60 200
80 160
... 120
120 80
.. o .. - ---
JAN 85

I I I I I I I I I I I I I I I I I I I
21
concentrations, however, do not indicate contamination. The well is completed in Layer A and has no evidence of surface protection above the aquifer. Upgradient land use is largely agriculture and low-density residential. In addition to a potential load from fertilizer, the elevated nitrate concentration may be due to "natural" loading from vegetation; i.e., alder trees are very significant sources of nitrogen loading to groundwater.
Monitor Well #26: Parkland Light & Water Company #5. Mean nitrate and chloride concentrations in samples from this well were 2.4 and 11.2 mg/1, respectively. Total coliform organisms were detected in the well in the first and second sampling quarters. No historic data are available, so we cannot identify any kind of trend. Arsenic was detected in the well water at a concentration of 50 ug/1.
This is one of the exceptionally shallow and exceptionally high yield wells in the study area. The aquifer is presumed to be in the uppermost part of Layer A, which is the Steilacoom gravel. Although the nitrate content is elevated, this particular location is one where it could be expected to be considerably higher. The water company routinely chlorinates this water because of its shallow and unprotected nature. The source of arsenic is not known. Upgradient land use is low density residential and open space.
Monitor Well #27: Lakewood Water Department Well A-2. The samples taken from this well showed consistently low concentrations of all parameters, except for an elevation of the chloride concentration to 12.0 mg/1 in the fall 1985 sample. This phenomenon was observed throughout the entire study area in both upper and lower aquifers and is considered to be a natural rather than a humaninduced phenomenon. Upgradient land use is high-density residential and the I-5 corridor. This well is completed in Layer C and has an extensive sealing layer above the aquifer. Accordingly, surface protection should be very good. The water data indicate that Layer C is uncontaminated in this area.
Monitor Well #28: Tacoma Community College. The mean nitrate concentration measured in this well water was 0.1 mg/1, and the mean chloride concentration was 2.9 mg/1. The well was drilled in late 1983, and was not available for sampling until February 1984. The well is completed in Layer C, but has no significant sealing layer above the aquifer. At the current time, water quality in the well water is excellent. The upgradient land use is high density residential; the area has been served by sanitary sewers since the 1940s. Storm drainage from this area is not discharged to the subsurface.
Monitor Well #29: Fircrest #7. This well is one of several in the study area exhibiting elevated nitrate concentrations {compared to our designated "background" concentrations) , with no other elevated parameters. The mean measured nitrate concentration

I I I I I I I I I I I I I I I I I I I
22
was 3.0 mg/1, and the mean chloride concentration was 5.7 mg/1. Data from 1981 are available, indicating nitrate concentrations comparable to the 1984-1985 data. From the limited data currently available, it would appear that the elevated nitrate concentration may be due to natural loading (i.e., alder trees). Figure 12 illustrates the monitoring results for this well.
The surrounding land use is largely high density residential. The upgradient area is not sewered; stormwater disposal is mainly to surface water systems.
The well is completed in a lower part of Layer A, but has a sealing layer above the aquifer. Accordingly, the aquifer is expected to be reasonably protected. Additional monitoring will be necessary to determine if the local water quality is deteriorating or in a roughly steady-state condition.
Monitor Well #30: Lakewood Water District 0-2. The mean measured concentration of nitrate during the 1984-1985 monitoring period was 1.4 mg/1, indicating only a slight increase over background levels comparable to the mean chloride concentration of 6.0 mg/1. -
The well is completed in Layer C and has an extensive sealing layer above the aquifer. This well draws from the same aquifer as Monitor Well #5, and water quality in the two wells is very similar. Surrounding land use for Well #30 is commercial and high-density residential. Portions of the upgradient area are served by sanitary sewers, but the tributary area includes four community septic systems. Stormwater is routed to surface water systems.
Monitor Well #31: Helm. The mean measured nitrate concentration in the well water for 1984-1985 was 3.7 mg/1, ranging from 3.3 to 4.2 mg/1. Measured chloride concentrations ranged from 10.0 to 20.0 mg/1, with a mean value of 13.2 mg/1. Conductivity values were consistently above the mean for the shallow aquifer, as well. The well water appears to indicate some water quality degradation. The well is completed in Layer A and has no evidence of surface protection above the aquifer. Upgradient land uses include residential, commercial, and industrial. The area is included in the ULID 73-1 construction area, and also extensively utilizes subsurface disposal for stormwater.
Evidence of water quality degradation is not unexpected. The well should continue to be monitored in the future.
Monitor Well #32: City of Tacoma Well U-10. The first sample taken from this well (January 1984) was inadvertently taken from a City of Tacoma supply main used for pre-lube water at the well. This sample was low in nitrate, chloride, and total disolved solids, but 13 ug/1 chloroform was measured in the sample.

- -CL No3 TDS
mg/1 mg/1 mg/1
14.0 7.0 ttiO
12.0 6.0 150
10.0 5. 0 100.
8.0 •.o no
••• l.O 120
•. o 2.0 ItO
2.0 1. 0 tOO
- - - - - - - - - -"' FIRCREST LOWER PORTION OF A, WITH A SEALING LAVER ABOVE AQUIFER
~ .S?Y ~ /-·" ~ ./.."/
"""' _././ jffY" ~- .··
/ ... -··./
t-~.03--------~..:.:.:- ---- - ---- ---
I
JAN 81
-- CL
-------
JAN 811
CL No1 TDS SWL CONO
---------~!L
' APR 811
CHLORIDE NITRATE-NITROGEN TOTAL DISSOLVED SOLIDS STATIC WATER LEVEL CONDUCTIVITY
AUG 811
Figure 12. Monitorin<:t Results, Well #29
- - - - - - -SWL CONO
feet J,lmhos
too 260
ItO 250
120 200
no 230
.. o 220
150 210
160 200
OCT 84 JAN 85

I I I I I I I I I I I I I I I I I I I
23
Chloroform is a chlorinated methane and enters the environment largely as the result of water and wastewater chlorination. Chloroform is also used as a solvent and an intermediate in certain industrial operations, including refrigerant and plastics production. It is a carcinogen and exhibits temporary and lasting toxic effects. There is no recognized safe concentration of chloroform in drinking water. The EPA criteria estimated to result in an additional lifetime cancer risk of 1 in 100,000 is 2.1 ug/1.
This water (City of Tacoma main) was sampled again in the second sampling quarter, when the chloroform concentration was measured at 14 ug/1. This may be the result of the City's chlorination system, or it may be due to an industrial source. Additional sampling is necessary to determine the extent and cause of this contaminant. Arsenic was also detected in the water, at a concentration of 4 ug/1.
Well #32 was sampled for priority pollutants in April 1984, when the well was pumped continuously for several hours to ensure that the aquifer was actually being sampled. At this time, dichloromethane (Freon 12) was discovered in the well at a concentration of 8 ug/1, and 5 ug/1 of trichlorofluoromethane (Freon 11) was found. Freon 11 and 12 are used as refrigerants and propellants, and would appear to be anomalous to this site. Both mean nitrate and chloride concentrations are near designated background levels.
The well is completed in Layer C but has no extensive protective layering above the aquifer. Surrounding land use is predominantly residential. The area is not served by sanitary sewers; storrnwater runoff is routed to surface water systems.
Monitor Well #33: Lawrence. The mean measured nitrate concentratlon measured ln the well water here was 0.7 mg/1 for the 1984-1985 monitoring season, compared with a single measurement of 0.4 mg/1 in 1981. This increase is not seen as significant. The mean chloride concentration for the 1984-1985 monitoring period was 3.7 mg/1, which is near the background level. Figure 13 summarizes the sampling results for this well.
The well is completed in Layer A and has no protection above the aquifer. Surrounding land use is residential, with roughly half of the tributary area included in the ULID 73-1 project. There are no subsurface storrnwater disposal systems in the area.

- -CL N01 TOS
mg/1 atg/1 mg/1
7.0 0.9 110
6.0 0.8 100
5.0 0.7 90
11.0 0.6 80
3.0 0.5 70
2.0 0.11 60
1.0 O.l SO
- - -Ill LAWRENCE
I ____ _/
DEC 80 JAN 81
---CL
I
---- N03 --·- TDS ---- SWL
I
-···-COHO
I
- - - - - - - - - -
I . '•! ,' / I \ ---· X I
I I
I
1/ \ ~ / ,\ ,I /. '\ "/ \v' ;· \ /'-.
\ / "' . \ I '"' C( I v . ' '\"9 ---···r-···--.. ·--·.. ...-:_I -----··· ,.~
DEC 83 JAN B4
CHLORIDE NITRATE-NITROGEN TOTAL DISSOLVED SOLIDS STATIC WATER LEVEL CONDUCTIVITY
Figure 13
APR 811 AUG 811
Monitoring Results, Well #33
OCT a•
- - - -SWL COHO
feet \!mhos
...
150
160 170
170 . 160
180 ISO
190 . 1110
0coNo
200 130
JAN 85

I I I I I I I I I I I I I I I I I I I
24
Monitor Well #34: Flett Dairy. This well, a shallow well located in the middle of an actively-used pasture, had the highest nitrate concentration measured anywhere in the study area. The measured nitrate concentrations in the well water ranged from 3.7 to 8.0 mg/1, with a mean of 6.6 mg/1. The chloride concentration ranged from 9.5 to 20.0 mg/1, with a mean concentration of 13.9 mg/1. The well is significantly degraded in comparison to the other wells in the study area, and it is probably due in large part to the surrounding land activity, which is largely agricultural (mainly pasture). Figure 14 illustrates the monitoring results for Well #34 •
Monitor Well #35: Ponce_de Leon Spring. The mean nitrate concentration in this ·-spri"n-g was 1.8 mg/1, and the mean chloride concentration was 5.3 mg/1. These constituent concentrations indicate slight degradation over background conditions. Coliform organisms were consistently measured in the spring, which could be the result of direct contamination through the soil or could be related to septic tank discharge through coarse gravels (the nearest drainfield is roughly 150 feet away). Figure 15 illustrates the monitoring results for this well.
There is a well point at this location which is used to measure static water levels. The water sample was taken from an adjacent spring that is one of numerous springs forming the head of Ponce de Leon Creek. These springs are the outflow of the shallowest part of Layer A in the highly urbanized area represented by Villa Plaza and the Ponce de Leon apartments. The site was specifically chosen as one where the possibility of extensive degradation to the shallowest aquifer could be expected. Surprisingly, the nitrate and chloride content were not exceptionally elevated.
Arsenic was measured in the spring at a concentration of 30 ug/1 in April 1984, which was the highest concentration measured in the monitoring program.

- --CL NO, TDS
mg/1 mg/1 mg/1 ... 11.0 260
•. o
16.0 250
B.O
15.0 2QO
1.0
111,0 2l0
6.0
1],0 220
•. o
n.o 210
•.o
11.0 200
l.O
- - - - - - - - - - - - -FLETT DAIRY
THE VALUE FOR .c..L_ IN OCT Ill WAS 20
,r--------I
I I
I I -----------r
I I
I I
I I
I I
I I
I I
I
DEC 80 DEC 83
---- CL ---- N03 --·- TDS ---- SWL -···- COND
/
JAN 84
CHLORIDE NITRATE-NITROGEN TOTAL DISSOLVED SOLIDS STATIC WATER LEVEL CONDUCTIVITY
Figure 14
'--..., ............... , -~ '-'~'o ......... \
""""~--- \ .!i'!h..
"' \
0swL \
" \
/'··. '\ \
~;/'\, ', ""-· .. -~ ~o+.. "
y \\' ·-.0~
t\ '\. \ .,. \
APR 811 AUG 811 OCT aq JAN 85
4 '
Monitorin9 Results, Well #34
- --SWL COHO
foot ~nih<¥
0
10 •oo
20 460
lO ·1120
•o ·l8D
•o .. o
60 ]00

- -CL N03 TDS
mg/1 mg/1 mg/1
1.0 11.0 1110
7.0 l.S 130
6.0 3.0 120
s.o :z.s 110
lf.O 2.0 100
3.0 1.5 90
2.0 1.0 80
- - - - - - - - - - - - - - -135 PONCE DE LEON
--~.----
--------
~---- .··""'··. . ~~~- / "" ""' ---~, ,~s ··· ·~- L
'\. ~~. ------- '\. .
"----···-.. '\. _...-· .. CONO./ .
--.. ~v- -· ···- ·\. I \ I
. THE VALUE FOR TOS IN OCT 811 WAS 65
JAN 8ll
---CL ---- N03 --·- TOS ---- SWL -···- COND
APR 8ll
CHLORIDE NITRATE-NITROGEN TOTAL DISSOLVED SOLIDS STATIC WATER LEVEL CONDUCTIVITY
Figure 15
AUG 811 OCT 811
+
Monitoring Results, Well #35
JAN 85
- -SWL COND
f•t l&Mhos
•••
170
••• 2.0
ISO
.. . 3.0 130
120

I I I I I I I I I I I I I I I I I I I
25
TASK 16: UPDATE CONCEPTUAL GROUNDHATER MODEL
The objective of this task was to modify the conceptual groundwater model developed in Phase I to reflect the data obtained during Phase II monitoring and incorporate comments and information provided by the Technical Advisory Committee. In addition, this task included modifications to the model to reflect the study team's increasing knowledge of the basin's geohydrology and contaminant flow parameters for evaluating the relationship between land use and groundwater quality during Phase III.
Based on meetings with the Technical Advisory Committee and the lack of any written response, we are assuming that all of the major elements of the conceptual groundwater model are sufficiently representative of basin conditions to continue with further analysis and evaluation. The only exceptions include well location discrepancies and basin recharge estimates identified and developed by Hart-Crowser and Associates for the Pierce County Planning Department's Coordinated Water Plan. (Both Hart-Crowser and the Planning Department are members of the Technical Advisory Committee.)
Model update elements include:
• Velocity re~evaluation • Potentiometric surface analysis • Groundwater flow systems • Evaluation of basin recharge estimates • Dispersion analysis
Velocity Re-Evaluation
During Phase I, velocity estimates for the shallow groundwater system were developed for a number of areas throughout the basin for the purpose of defining priority monitoring areas. However, calculated velocities were extremely high, rendering the entire basin a priority monitoring area. Therefore, velocities one to two orders of magnitude lower were used to focus monitoring into zones closer to potential contaminant sources.
Study team analysis of the 1984 Parkland gasoline leak substantiated the high velocities typical of the basin and the need or usefulness of establishing representative velocities throughout the basin for planning and emergency spill response. Refer to Figure VII-4, Appendix VII, Phase I Report. However, it is important to recognize·that the calculated values are gross estimates for the entire thickness of the "A" hydrostratigraphic layer, and should be supplemented with actual field determinations as early as possible in an emergency.
As Figure VII-4 indicates, basin velocities typically range from about 0.02 ft/day to 63 ft/day and average about 4.4 ft/day.

I I I I I I I I I I I I I I I I I I I
26
As these numbers indicate, most of the Clover/Chambers Creek Basin exhibits exceptionally high groundwater velocities. Such atypical velocities also illustrate the vulnerability of groundwater supplies to contaminant spills or leaks.
Potentiometric Surface Analysis
The single most important factor in characterizing a basin's hydrogeology is definition of the groundwater system's potentiometric surface. Potentiometric maps were developed in Phase I for the shallow and deep groundwater systems. The data used for these maps were based on driller's logs and consultant studies spanning several years, and therefore are not time-equivalent. For regional (basin-wide) interpretation, the margin of error or inaccuracies due to non-time equivalence may not be significant. However, on the sub-basin or local level, non-time equivalence of data can result in a significant difference in flow direction/velocity interpretations and actual flow conditions.
Comparison of Historical Potentiometric Surfaces with Monitoring Information. Comparison of recent and historic water levels in 34 monltor wells reveals several differences or discrepancies in mapped potentiometric surfaces based on non-time equivalent water level data from well logs and 1984 monitoring data. These differences were observed in both the shallow and deep groundwater systems. Twelve monitor wells showed significant differences in their piezometric levels and non-time equivalent potentiometric surfaces. Most of these wells (8) are located in the western portion of the study area. The Chambers Creek, Clover Creek, and University sub-basins had the highest proportion (8 out of 16) of monitor wells with significant piezometric differences. Except for two wells in the extreme southeastern part of the study area and east of American Lake, water levels in monitor wells were generally lower than the interpreted non-time equivalent potentiometric surface.
The Phase I potentiometric maps for both the shallow and deep groundwater systems (Figures 5-15 and 5-16, respectively) were modified to reflect the 1984 monitoring data. The enclosed figures 5-15 and 5-16 illustrate the revised versions of these figures. These figures replace the earlier versions of Figures 5-15 and 5-16. Changes in the pre- and post-monitoring maps were noted in a number of areas in the basin. On the shallow potentiometric map (Figure 5-15, north half), corrections were made to the pre-monitoring map to account for a 50 percent increase in the groundwater gradient south of Chambers Creek (Section 27) and a 34 percent decrease in gradients north of Chambers Creek (Sections 21, 22, 23, and 24).
Changes in the pre-monitoring deep potentiometric map (Figure 5-16, north half) were made in areas north and northwest of Fircrest, where the groundwater gradient has increased by about 50 percent, and southeast of Tillicum (Figure 5-16, south half),

I I I I I I I I I I I •
I ' ' • • I •
I I I I I I
• • • •
COMM£NC£11£NT
BAY
SCALE IN MILES
0 2
• 21 0 LOCATION OF WELL PROOUCING FROM AQUIFERS ABOVE LAYER B CKITSAP FORMATION), NUMBER DENOTES STATIC WATER LEVEL
- 200- LINES OF EQUAL ELEVATION FOR POTENTIOMETRIC SURFACE OF SHALLOW GROUNDWATER SYSTEM
• DIRECTION OF GROI.RtOWATER FLOW
----- SOUTH TACOMA CHANNEL
---- GROONOWATER FLOW REGIME IMPACTING SOUTH TACOMA CHANNEL
POTENTICNETRIC MAP--81-lAl.LOW GROONOWATER SYSTEM (NORTH HALF>

I I I I I I I I I I I I I I I I I I I
SCALE IN MILES
0 2
e2:10 LOCATICJ\1 OF WELL PRODUCING FROM AQUIFERS ABOVE LAYER B (KITSAP FORMATION), NUMBER DENOTES STATIC WATER LEVEL
-200--- LINES OF EQUAL ELEVATION FOR POTENTIOMETRIC SURFACE OF SHALLOW GROUND WATER SYSTEM
• DIRECTION OF GROJNOWATER FLOW
D
FIGURE !5-1!5
POTENTIOMETRIC MAP--SHALLOW GROUNDWATER SYSTEM (SOOTH HALF>

I I I I I I I I I I
• I '
I ' ' •
I • •
I I I I I I
COIIIIENCCIIENT
SA'
• • •
SCALE IN MILES
0
I f 91 LOCATION OF WELL PROOUCING FROM AQUIFERS BELOW LAYER B
<KITSAP FORMATION). NUMBER DENOTES STATIC WATER LEVEL
_.,- 200- LINES OF EQUAL ELEVATION FOR POTENTIOMETRIC SURFACE OF DEEP GROUNDWATER SYSTEM
.. DIRECTION OF GROUNDWATER FLOW
__ .... __ SOUTH TACOMA CHANNEL
--'-- GROUNDWATER FLOW REGIME IMPACTING SOUTH TACOMA CHANNEL
POTENTIOMETRIC MAP--DEEP GROUNDWATER SYSTEM (NORTH HALFl

I I I I I I I I I I I I I I I I I I I
SCALE IN MILES
0 2
e 9 t LOCATION OF WELL PRODUCING FROM AQUIFERS BELOW LAYER 8 (KITSAP FORMATION), NUMBER DENOTES STATIC WATE~ LEVEL
__.- 200- LINES OF EQUAL ELEVATION FOR POTENTIOMETRIC SURFACE OF DEEP GROUND WATER SYSTEM
.. DIRECTION Of GROUNDWATER FLOW
POTENTIOMETRIC MAP--DEEP GROUNDWATER SYSTEM <SOUTH HALF)

I I I I I I I I I I I I I I I I I I I
27
where gradients have increased approximately 33 percent. Groundwater flow directions appear generally the same on both pre- and post-monitoring maps. However, significant differences in hydraulic gradient are apparent.
Considering that the number of monitor well data points is less than 10 percent of the total non-time equivalent data points used in developing the potentiometric maps, it is reasonable to conclude that in many areas of the basin, potentiometric surfaces may not be accurately portrayed by use of historic non-time equivalent data. Before present potentiometric surfaces can be more adequately defined, additional time-equivalent data is needed.
Seasonal variations in Potentiometric Surface. Seasonal water level changes influence both the direct1on and flow of groundwater and consequently the movement of contaminants. Water level measurements for the 34 existing domestic and municipal wells monitored during 1984 and early 1985 provide some data to evaluate the seasonal variations in the potentiometric surface.
Seasonal and annual fluctuations in precipitation usually cause changes in the potentiometric surface of the groundwater. The long-term average annual precipitation in the study area is approximately 40.5 inches per year. November through March are typically the wettest months, while July to September are the driest. The total rainfall of 47.49 inches in 1984 was above average and the seasonal pattern was atypical. Most noticeably there was a 40 percent increase above the average rainfall between May and August and a 26 percent decrease from September to December.
Examination of the seasonal water level fluctuation in 13 monitor wells shows piezometric levels rising in most wells during months of greatest rainfall and piezometric levels dropping during the summer when rainfall is least (Figure 16). Wells showing the greatest fluctuations (14-19 feet) are those tapping shallow aquifers in the North Fork and Spanaway Lake sub-basins and wells tapping the deep aquifer in the American Lake sub-basin. The change in piezometric surfaces of some wells in the Clover Creek, Chambers Creek, and Spanaway Lake sub-basins did not always follow the seasonal trends. The drop in water levels for wells in the Chambers Creek sub-basin from February to April, typically a period of increasing water levels, is most likely the effect of dewatering associated with the ULID 73-1 sewer project. It is unclear as to why water levels continue to drop in the Chambers Creek and Spanaway Lake sub-basins during the fall. It could be a combination of the relatively dry fall and well pumpage.
A larger data base over a longer period of time is required before a meaningful evaluation of seasonal variation can be performed. In particular, water level measurements are needed from additional wells in each of the 8 sub-basins and from the deeper aquifers.

I I I I I I I I I I I I I I I I I I I
28
Groundwater Flow Systems
Groundwater flow systems can be divided into three major patterns: regional, intermediate, and local. Generally regional flow systems exhibit the greatest chemical quality changes and the longest flow paths and residence times, while local systems show little water quality change and short flow paths and times.
In the Clover/Chambers Creek Basin, recharge is predominately through local and intermediate flow systems. Regional recharge occurs mainly east of the basin in the Cascade Mountains, while regional discharge is primarily to Puget sound and the Puyallup and Nisqually River Valleys.
Surface Recharge and Discharge. Because recharge areas are an input source for downgradient groundwater systems, their contamination can present a serious threat to water quality. Examination of the average potentiometric surfaces for the Clover/Chambers Creek Basin, shown in Figures 5-15 and 5-16, allows for the qualitative identification of groundwater recharge and discharge areas.
By definition a recharge area is any portion of a drainage basin where the net saturated flow of groundwater is directed away from the water table. In discharge areas the net saturated flow of groundwater is directed toward the water table. The water table in recharge areas is usually at some depth, while in discharge areas it is at or very near the surface.
Surface discharge of groundwater within the basin occurs along the margin of the upland adjacent to Puget Sound and probably on the floor of the Sound. The other major areas are along Chambers Creek upstream to near Steilacoom Lake, along most of Leach Creek, and probably south of Steilacoom Lake along Clover Creek. Two isolated discharge areas were found in the southern half of the basin. One was located in the Clover Creek sub-basin northwest of Thun Field, while the other was in the extreme southeast corner of the Spanaway Lake sub-basin. These two areas are probably a reflection of inadequate data since the potentiometric surface maps are drawn from water level information which is a composite of various years and seasons (non-equivalent times). Springs occurring in many regions of the basin not typically considered discharge zones, could often represent the seasonal discharge of locally perched groundwater. Lakes in the American Lake and Chambers Creek sub-basins appear to be in approximate balance with the surrounding water table, and as such, may not be significant discharge or recharge areas.
Although net groundwater recharge occurs in many areas throughout the basin, the major recharge locations are the upland areas in the western portions of Clover Creek and Spanaway Lake sub-basins.

I I
I I I I I I I I I I I I I I I I
29
Subsurface Recharge and Discharge. In addition to identifying areas of surface recharge and discharge, water level elevations can indicate regions of inter-aquifer recharge and discharge. Areas where the hydraulic head is greater in the deeper groundwater system than in the shallow system indicate discharge zones for the deeper system. In the reverse situation, where the hydraulic head is greater in the shallow system than in the deeper system, the vertical potential gradient is downward and the net effect on the deeper system is recharge.
With few exceptions, the vertical potential gradient between the shallow and deeper groundwater systems appears to be primarily downward, indicating potential recharge of the deeper aquifers throughout most of the basin. In the Clover Creek sub-basin immediately east of Frederickson (refer to Figure 5-15), these conditions are reversed, indicating potential discharge of groundwater from the deeper system. Two small areas west and northwest of Frederickson also exhibit a potential upward vertical gradient. Similar conditions exist in the Flett Creek sub-basin north of Flett Creek in the South Tacoma Channel.
In the Flett Creek area, an absence of hydrostratigraphic layer B, heavy pumpage by Tacoma city wells, and a generally higher transmissivity in the shallow aquifers could account for the apparent upward vertical gradient. Likewise, pumping from a heavy concentration of wells in the rapidly developing areas near Frederickson (Figure 5-17 in the Phase I report) might result in upward vertical gradients. The region northwest of Frederickson with suspected anomalous vertical gradients does not appear to be readily explainable with available information.
Evaluation of Basin Recharge Estimates
Recharge to the basin's groundwater system includes all subsurface and surface interflow inflows. Potentiometric maps for the shallow (Figure 5-15) and deep (Figure 5-16) groundwater systems indicate that little or no sub-surface recharge occurs. Therefore, recharge is primarily infiltration from precipitation, surface water bodies, wastewater, and stormwater. As indicated in Figure 5-7, Surface Water-Groundwater Interflows within the Clover/Chambers Creek Basin (refer to Phase I report), infiltration of precipitation is 120,300 acre-feet per year (approximately 518 gpm per square mile). This value appears consistent with estimates developed by other investigators. Griffin and others (1962) estimated recharge due to infiltration in the Tacoma area to be approximately 450 gpm per square mile. Shamir, in his 1981 study of the South Tacoma Aquifer, estimated infiltration of precipitation to be about 496 gpm per square mile. Hart-Crowser and Associates, in their draft evaluation for the Pierce County Coordinated Water Plan, established a range of 300-600 gpm per square mile for infiltration of precipitation.
I I I I I I I I I I I I I I I I I I I
30
Infiltration of precipitation is two-thirds the total basin recharge, and infiltration estimates are in general agreement. Therefore, a total basin recharge of 180,900 acre-feet per year (779 gpm per square mile) appears reasonable.
Dispersion Analysis
The transport of groundwater contaminants through an aquifer system depends primarily on advection and hydrodynamic dispersion. Advection is the component of solute movement attributed to transport by the flowing groundwater. Hydrodynamic dispersion represents the combined effect of molecular diffusion and mechanical dispersion. At all but low flow velocities, mechanical dispersion is the important contributor to contaminant dispersion. Dispersion is much stronger in the direction of flow (longitudinal dispersion) than in directions normal to the flow line (transverse dispersion), generally by a factor of 5 to 20.
The effects of dispersion must be considered in order to establish the area of influence for a monitor well and subsequently establish the relationship between land use activity and groundwater quality. A variety of analytical solutions designed to model the migration of contaminants in two and three dimensional space can be found in the literature. Although these mathematical descriptions provide only very idealistic solutions to a complex process, they do provide insight to potential contaminant migration paths and approximate values for dispersion.
To define the relative area of influence around 14 monitoring wells, we employed a random-walk computer model to provide a semianalytical solution to the advection-dispersion process of a hypothetical dissolved contaminant. This modeling simulated pollutant plume travel and relative width of dispersion over time and distance from a hypothetical source.
The "random-walk" model used was developed by the International Groundwater Modeling Center (van der Heijde, 1983) and run in BASIC on an IBM-AT. (The general model predictions were verified by using the analytical solution to the advective-dispersion equations with the Hantush leaky well function [according to EPA/Tetratech, 1984] .)
The "random-walk" method models overall plume (groundwater) movement according to a standard, modified Theis equation and models plume dispersion based on the concept that dispersion is a randomwalk process of pollutant particles. The program assumes:
1. A non-reactive contaminant.
2. A saturated, homogenous, and isotrophic aquifer.
3. Uniform and steady-state flow.

I I I I I I I I I I I I I I I I I I I
31
4. No significant density contrast between the contaminant and surrounding groundwater.
5. Aquifer is of infinite areal extent, homogenous, with a single set of flow parameters. The origin of each simulated plume is x=o, y=o, with flow in the plus-x direction only.
Since the model simulation used generalizes slope and other parameters over an entire flow path and applies a statistical process to dispersion, it should be viewed as providing only an approximation to real contaminant movement with an accuracy on the order of +50 percent. That is, the predictions need to be viewed as generally correct but as ball-park estimates, and a predicted dispersion width of 500 feet might be off by 50 percent.
Physical parameters used in the dispersion model are: Transmissivity (T), Storage Coefficient (S), Hydraulic Conductivity or Permeability (K), Porosity (0), Velocity (V), Longitudinal Dispersivity (Ld), Transverse Dispersivity (Td), and Time (t).
Transmissivity was derived from the product of the average saturated aquifer thickness near each well and the mean estimated hydraulic conductivity value for the area.
Storage coefficient values of unconfined aquifers usually range from 0.01 to 0.30. A storage coefficient value was assigned to each well based on the general lithological conditions. Areas of coarse sand and gravel were given a high value (0.30), while areas of silt or clay received a low value (0.01).
Hydraulic conductivities were obtained by taking the mean of the estimated range of conductivities (Figure 5-7, Phase I Report) for the area where the well is located.
Todd, 1980, has listed representative porosities for varying material types as well as hydraulic conductivities. Based on this information, porosities were assigned to each well area depending on conductivity, as follows:
Hydraulic conductivity (gallons/day/sq ft)
10-100 100-300 100-1,000 300-1,000
1,000-3,000 >3,000
Porosity (percent)
49 43 36 36 32 38

I I I I I I I I I I I I I I I I I I I
32
Groundwater velocity or flow rates were calculated using modification of Darcy's Law, where:
Ki v =n
-v = velocity of flow in ft/day.
K = hydraulic conductivity in gallons/day/sq ft.
i = hydraulic gradient.
n = porosity.
Longitudinal dispersivity values were arbitrarily chosen for each site from ranges of dispersivity found in the literature for relatively similar lithologic conditions (Table 9).
Table 9.
Dispersivity (feet)
0.01 - 0.016
1.0- 3.0
3.0 - 10.0
17.5- 59.6
70.0
3 X 10
0.1 - 3.0
Range of Dispersivity Found in Literature
Ion
Chloride
Nitrate
Chromium
Nitrate
Soil
Panoche clay-loam
Sand and gravel (homogeneous)
Sand and gravel with clay particles
Silty-clayloam
Glacial till
Strip mile spoils
Florence site, beach sand
Reference
Bresler ( 19 73)
van Genuehten (1979)
van Genuehten (1979)
Sweet, et al. (1979)
Pinder (1973)
Amend, et al. (1976)
Sweet, et al. (1981)
Transverse dispersivity was assumed to be 10 percent of the longitudinal dispersivity. Time (t) was taken to be zero at the contaminant source site (the nearest upgradient groundwater divide).

I I I I I I I I I I I I I I I I I I I
33
Before application of the "random-walk" dispersion analysis, all 14 sites were placed in one of five "model" areas based on their similar physical site conditions. Model Area 1 represents three sites (Wells 19, 20 ,. and 21) which have relatively low flow velocities (1-3ft/day) and hydraulic conductivities (55-200 gpd/ft). Model Area 2 includes four sites (Wells 2, 7, 29, and 32) with moderate flow velocities (4.5 - 5.0 ft/day) and hydraulic conductivities (650 gpd/ft). Model Area 3 includes four sites (Wells 6, 31, 34, and 35) with relatively high flow velocities (17-39 ft/day) and hydraulic conductivities (2,000 gpd/ft). Model Area 4 includes two sites (Wells 24 and 33) which have parameters similar to Model Area 2 but with downgradient flow times from a source site to a well of less than one year. Model Area 5 has only one site (Well 3), which has a very high flow velocity (94 ft/day) and a very short downgradient flow time (0.10 year).
Table 10 shows the parameter values for each site, model area, and the results of the "random-walk" dispersion analysis. The results show, as expected, that the more permeable an area, the less a contaminant will be dispersed. Contaminant plumes in till zones (Model Area 1) dispersed transversely about 6 times farther than contaminant plumes in the highly permeable sand-gravel zones (Model Area 3, Well 34).

- -·- - - - - - - - - - - - - -'- --Table 10. Dispersion Analysis Parameters
VELL SITE T s I 0 v Ld Td t L v
19 8,250 .01 55 .49 1.7 70.0 1.0 4.5 3,500 420
20 8,250 .01 55 .49 1.0 70.0 1.0 15.0 11,000 1,-"00
21 32,000 .025 200 .H 3.0 40.0 4.0 2.0 1,500 186
Hodel Area 1 16,000 .02 100 ·" 2.0 55.0 5.5 15.0 ' 11,0'00 I
1,400
2 61,750 .10 650 .36 5.5 6.0 .6 1.6 3,000 99 I ' 1 48,150 .10 650 .36 4.5 6.0 .6 1.2 2,200 75
29 78,000 .10 650 • 36 4.6 6.0 .6 7.0 12,4'oo • 30
32 13,000 .10 650 .36 5.0 5.0 6.0 13.0 23,000 800
Hodel Area 2 66,600 .10 650 • 36 5.0 5.0 6.0 13.0 23,000 800 w 6 154,000 . • 20 2000 .32 24.0 3.0 .3 0.60
... 5,850 120
31 154,000 .20 2000 .32 39.0 3.0 .3 0.25 2,500 50
34 154,000 .20 2000 .32 28.0 3.0 .3 1.2 11,100 240
35 154 ,ooo .20 2000 .32 17.0 3.0 • 3 2.0 19,500 400
Hodel Area 3 154,000 .20 2000 .32 27.0 3.0 .3 2.0 19,500 400
24 61.7 50 .10 650 • 36 25 .o 6.0 .6 1.0 9,000 4 51
33 61,750 .10 650 .36 ztt.o 6.0 .6 .56 5,000 255
Hodel &rea tl 61,750 .10 650 .36 24 .o 6.0 .6 2.0 17,500 1,000
3 1511,000 .20 2000 • 36 94.0 3.0 .3 .10 3,000 270 (Hodol Area 51
T • Tran3mlaa1v1tr (&pd/rt) 0 • Poroeltr (unit laaa) Td • Tranaveraa dlaperaiylty I rt l s • Storage ooafticient (unit leaa) ' • Voloc1tJ Itt/d) t • Tim a (raara) I •. Hydraulic oonductivltJ (&pd/ft ) Ld • Lonattudinal dlaparalvttr Itt) L • Plume length (tt) v • Plume width (ft)

I I I I I I I I I I I I I I I I I I I
35
TASK 17: PERFORM WATER QUALITY ANALYSIS
The objective of this task was to characterize bacteriological and inorganic hydrochemical parameters. The results of these analyses were summarized in the report of Task 15. Water samples were taken by Robinson & Noble, who prepared a summary report of the monitor wells, which is being kept at the Tacoma-Pierce County Health Departrment. This report includes a detailed description of the well location, physical characteristics, and instructions for future monitoring staff. The water quality analyses were performed by Brown and Caldwell's laboratory in Emeryville, California.

I I I I I I I I I I I I I I I I I I I
36
TASK 18: PERFORM ORGANIC CONTAMINATION ASSESSMENT
The objective of this task was to assess potential organic contamination problems in the study area. To provide an initial basin-wide assessment of the problem, all 35 wells were sampled for purgeable priority pollutants (EPA Method 624). This method of analysis was performed because the chemicals measured by this method include solvents, volatiles, and other compounds that are highly mobile in groundwater systems. These types of chemicals were considered to be the most likely to be detected in the basin, if any were found. As previously described under Task 15, organic contaminants were found in three study area wells as well as a City of Tacoma main line. The levels detected were low, less than 5 ug/1 in all cases except one, and do not represent an imminent health hazard at this time. What the results do indicate is the presence of lowlevel priority pollutants in the shallow aquifer at two locations, and possibly contamination of the lower aquifer in one location (Well 32b--City of Tacoma Well U-10).
The results of our organics monitoring program must, however, be qualified because of the sampling method utilized. Because of the significant expense involved in sampling the wells according to EPA-approved methods for volatiles (i.e., downhole sampling, which requires removal of the pump and bailing the well), the samples were obtained from pumped water. Pumping volatilizes many constituents, resulting in potential lower concentrations in the sample than may actually occur in the aquifer. However, the pumped water represents what is actually being consumed. At any rate, the organics scan did not indicate widespread groundwater contamination; rather, it appears that isolated "hot spots," probably related to point sources of pollution, are located mainly in the heavily-developed portions of the basin.
A follow-up program, specifically assigned to detect organic contaminants in the areas considered most likely to be "hot spots"-i.e., areas with high concentrations of industrial activities, and/or waste and stormwater disposal facilities--was conducted and described in the Task 26 report.

I I I I I I I I I I I I I I I I I I I
37
TASK 19: IDENTIFY PROJECTED LAND USE
The objective of this task was to characterize projected land use in the basin. The task effort was delayed as long as possible, in order to include the most recent update of the Pierce County Comprehensive Growth Management Plan (GMP). Because of the highly controversial nature of the proposed comprehensive plan, revisions have been numerous and it is anticipated that revisions will continue to be made for an additional six months to one year following completion of the Phase II effort. It is recommended that upon final adoption of the GMP, the future land use file be updated. Until that time, any projections made using the existing file will be reviewed by County Planning staff.
TASK 20: PHASE II REPORT
This document serves as the product of Task 20.
TASKS 21 THROUGH 25
Tasks 21 through 25 are being performed as part of Phase III. Task reports for those tasks will be included in the Phase III final report.

I I I I I I I I I I I I I I I I I I I
38
TASK 26: ORGANICS MONITORING
Many heavily developed urban areas such as the San Fernando Valley, California, and the "Silicon" Valley of San Jose, California, are experiencing basin-wide organics contamination due to unrestricted land use activity. The occurrence and detection of organic contamination within the Clover/Chambers Creek Basin has generally been limited to specific point source problems, such as the Lakewood Wells Hl and H2 (source: Plaza Dry Cleaners) and American Lake Gardens (source: McChord Air Force Base).
The objective of this task was to determine if basin-wide (non-point source) organics contamination was occurring in the Clover/Chambers Creek Basin. Five sites in the central part of the Clover/Chambers Creek Basin were selected based on priority monitoring areas identified in Phase I (Appendix VII, Data Collection Program), and information on the concentration of potential organic contaminant sources. Monitoring sites included two existing domestic wells and three specially constructed monitor wells to allow downhole sampling for volatile organic constituents.
Monitoring Well Drilling
Three monitoring wells were drilled between January 29 and 31, 1985. Drilling was conducted by Johnson Drilling using a Speedstar air rotary drilling rig. Monitoring well installations are shown on the attached boring logs. A steel security casing with lockable cover was placed over each well and cemented into the ground. Yellow marker posts were installed at each well. Screen development was done by air lift, and an in-line air filter was used for removal of particulates and fluids. Well elevations were taken from USGS topographic maps. Well heads should be surveyed in the future for accurate water level determinations.
Well BC-1. This well was drilled on the east shoulder of Lakeview Avenue Southwest approximately 200 feet north of lOOth Street Southwest; see Location Map, Figure 17. Permission was granted to drill this well within the 60-foot wide public rightof-way by Pierce County Public Works Department. Drilling was done on January 31, 1985. Although this boring was dominated by gravels throughout, sufficient fines were present below a depth of 24 feet to provide a partial confining barrier. Groundwater was encountered at 32 feet and water rose to approximately 23 feet after development. Figure 18 illustrates the boring log for Well BC-1.
Well BC-2. Well BC-2 is located on the west shoulder of Union Street Southwest approximately 200 feet south of Pacific Highway South. Permission was granted to drill within the public rightof-way by the Pierce County Public Works Department. Drilling, installation and development of the well was carried out on January 29, 1985. This boring encountered gravels throughout

- - - - - - - - - - - - - - - - - - -
~·iL_' .: .. . ~-1 -.--::-· "~ --, c
:. _,: . ' . .-"' W~~lcon Hoi~ ;> j·
Fi11ure 17 OrC)anics Load Monitorim) \Veil Location Mat)
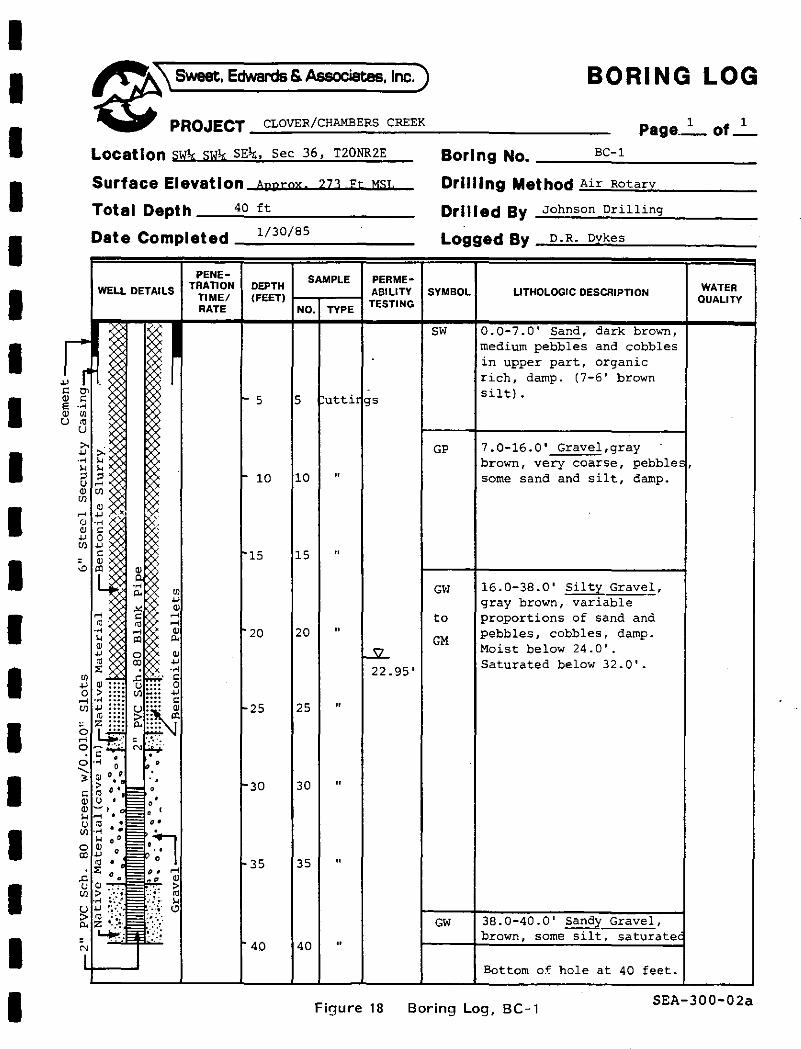
I I I I I I I I I I I I I I I I I I I
e\-.-&.-1...,.) PROJECT CLOVER/CHAMBERS CREEK
LOCation SW!,; SW!,; SEI,;, Sec 36, T20NR2E
Surface Elevation Apprnx 271 Fr Msr.
BORING LOG
1 1 Page._ of_
Total Depth __ ~4~0~ft~-------------Date Completed ___ 1_13_0_1_85 __________ _
WELL DETAILS
I
PENE• TRATION
TIME/ RATE
DEPTH SAMPLE PERME• (FEET) 1---.---1 ABILITY
TESTING NO. TYPE
f.. 5 5 uttirgs
1- 10 10 "
15 "
20 20 "
~ 22.95'
25 25 "
30 "
1-35 35 "
40 40 "
Borl ng No. ______ e_c:....-.:.1 ____________ _
Drllll ng Met hod :.:.A"'ir,__,R"'-ot:;_:a;o:r'""v ____ _
Drilled By Johnson Drilling
Logged By ....!D~-.::R.:.. . ...:D~y;:_ke::_:s"--------
SYMBOL
SW
GP
G~l
to
GM
GW
LITHOLOGIC DESCRIPTION
0.0-7.0' Sand, dark brown, medium pebbles and cobbles in upper part, organic rich, damp. (7-6' brown silt).
7.0-16.0' Gravel,gray brown, very coarse, pebble!: , some sand and silt, damp.
16.0-38.0' Silty Grave!, gray brown, variable proportions of sand and pebbles, cobbles, damp. Moist below 24.0'. Saturated below 32.0'.
38.0-40.0' Sandy Gravel, brown, some silt, saturatec
Bottom of hole at 40 feet.
WATER QUALITY
Figure 18 Boring Log, BC-1 SEA-300-02a

I I I I I I I I I I I I I I I I I I I
39
with fines present between 24 and 32 feet (possibly till). Groundwater was encountered at 28 feet rising to 19-1/2 feet after development. Figure 19 illustrates the boring log for this well.
Well BC-3. This well was drilled on the grounds of the Clover Park School District Administration Building. It is in a central western corner of the parking lot near the fence that separates it from the playing fields. This well was completed on January 30, 1985. Coarse gravels were encountered to a depth of 26 feet where 10 feet of till was penetrated. Groundwater was confined beneath the till and rose to approximately 19 feet after development. Figure 20 illustrates the boring log for this well.
Monitoring Well Sampling
On February 4, 1985, Sweet-Edwards sampled the three monitoring wells and two domestic wells included in the organics monitoring program. Field procedures used were designed to obtain groundwater samples representative of existing water quality.
Sampling Equipment. Sampling equipment consisted of:
• Geotech peristaltic pump equipped with polyethylene eductor tubing.
• Geotech 142 mm field filter apparatus. • Schleicker and Schuell 0.45 micron nitrocellulose
filters. • 2,000 ml vacuum flask. • Altex pH meter. • Double check valve Teflon bailer.
Sampling Procedures. All sampling equipment was cleaned with a soap and water wash, rinsed with distilled water, followed by a methanol rinse, another distilled water rinse, and a final sample rinse. Table 11 shows the depth-to-water measured in each well, the volume of water per pore volume, the total gallons removed, method of removal, and number of pore volumes removed prior to sampling. This information is included on Sweet-Edwards' Field Data/Chain-of-Custody forms attached.
Sample water was filtered directly into sample bottles via the Geotech filtering apparatus. Samples to be analyzed for volatile organics were collected with the double check valve Teflon bailer and not field-filtered. A QA/QC transfer blank was filled at Well BC-3.
All samples were stored on ice prior to shipment to the lab. Table 12 summarizes the water quality data measured in the field at the time of sampling. This information also appears on the attached Field Data Sheets.

I I I I I I I I I I I I I I I I I I I
~2-\"-.......... &A-.""-) PROJECT CLOVER/CHAMBERS CREEK
BORING LOG
1 1 Page_ of_ Location SE\ NE\ NE\, Sec 1 Tl9NR2E Boring No. _..:a:..:c_-:..2 ________ _
Surface Elevation Apprnx 295 Ft MSI
Total Depth _.._:::3~8...!f"'-t ______ _
Date Completed ____ 1 :....12_9.:.1_85 ___ _
WELL DETAILS
PENETRATION
TIME/ RATE
DEPTH SAMPLE PERME• ABILITY
(FEET) 1-"""T""---1 TESTING NO, TYPE
5 5
10 10 "
15 15 "
20 20 " 19.5'
25 25 "
30 30 "
"
38 "
Dr 1111 ng Met hod ....::oA'~· r:....,::R~ot:::a:!rJ..y ____ _
Drilled By Johnson Drilling
Logged By _o_._R_. _o.;.y_ke_s ______ _
SYMBOL
GW
GW
to
GM
GW
LITHOLOGIC DESCRIPTION
0-24.0' Sandy Gravel, gray brown, sand is coarse, pebbles, cobbles, damp below 15 feet, Some fine sand and silt.
24.0-32.0' Sandy Silty Gravel, gray, sand is fine to coarse, silt tan water strike at 28.0 feet.
32.0-38.0' Sandy Gravel, gray, sand is fine to coarse, some silt, saturated.
Botton of hole at 38 feet.
WATER QUALITY
SEA-300-02a Figure 19 Boring Log, BC-2

I I I I I I I I I I I I I I I I I I I
....,
" "' ffi u
-l " ·.-< Ul
"' u
"' ...., -~ ... ~ u
"' Ul
..-;
" " ...., Ul
..,
Ul ...., 0
..-; Ul
0 ..-; 0
0 ...._ 3
" "' "' ... u Ul
0
"' .c u Ul
u > "' "!
e \ ............... & ............. )
PROJECT CLOVER/CHAMBERS CREEK
BORING LOG
Page_1_ of_1 _
location NW!,; NW!,; NE!,; SW!§ Sec. 2 Tl9NR2E
Surface Elevation Approx. 255 Ft. MSL
Total Depth __ 4~0~ft~------
Date Com pi eted _l~/-=3~0/c.:B:.;:5~-----
PENE· SAMPLE PERME• WELL DETAILS TRATION DEPTH ABILITY
TIME/ (FEET) TESTING RATE NO. TYPE
~
"-5 5 Cutti gs
~ ~
- I:X f-10 10 " c I~
im I~
& ~ . ., 3~ "' 1-15 15 " "' ... " ~~ "' "' ...., ..-;
i ~--. "' ~~ 0 t• ·'· UJ
-~~t~~ "' ::.·• Ill ~ • ,.:::_ +J i-20 20 " 19.35' +J •· :•-: .c
::)a ~;:;:;..: u
Ul
1 ~ ~ :::: N f-25 25 " ~ til''' +J ••• Q) •••
...-!•••
~ -:.;..;.;: . & 0 • ..
' . ' f-30 30 " "' ~ ...., ·.-1 , • ... " ' ' 0 ' ' • ~ ...., 0 . " . . a.l, Oo • ' "' 0 • . ,. 35 35 " ' . .. ~. 0 • ' .. ~; .o• · .. >' • . ' "' ' .. 39 " .... " .. • • f-40 ,,o ' .
Boring No. sc-3
DrillIng Met hod ~A'"-ir~R~o:.;t!!:ar'-"y'-----
Drlll ed By Johnson Drilling
Logged By _.:;.D;.:. R;.:._D;;.;y:...k;.:e...;.s ______ _
SYMBOL LITHOLOGIC DESCRIPTION WATER QUALITY
GW 0-3.0' Pebbley Gravelly Soil, dark brown, organic rich, damp.
GP 3.0-6.0' Gravel, brown, some sand and silt., cobbles.
GP 6.0-15.0' Pebbley Gravel, gray, some coarse sand, cobbles, dry .
GW 15.0-26.0' Sandy Pebbley Gravel, brown, pebble beds minor silt increases with depth, moist, wet below 23.0 feet.
GM 26.0-36.0' Sandy Pebbley Silt, gray, soft, moist,
TO sandy till?
ML
SM 36.0-40.0' Silty Sand, green brown, medium, saturated, silt is gray.
Bottom of hole at 40 feet.
Figure 20 Boring Log, BC-3 SEA-300-02a
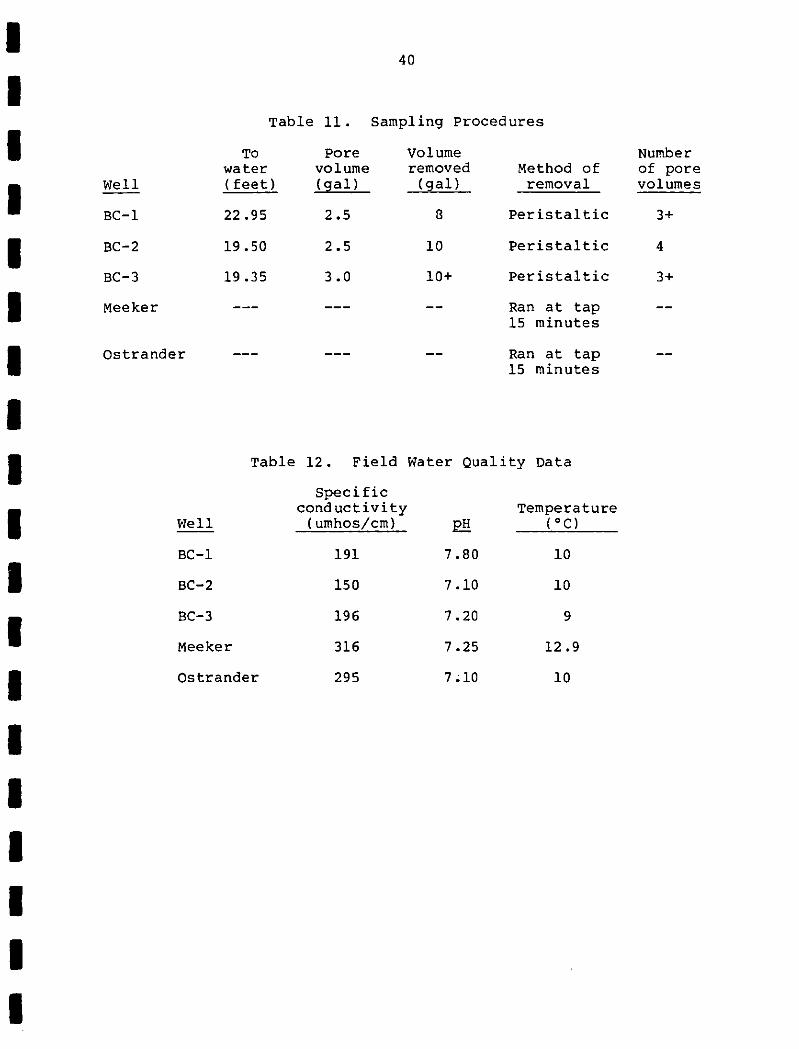
I I I I I I I I I I I I I I I I I I I
40
Table 11. Sampling Procedures
To Pore Volume water volume removed Method of
~lell (feet) (gal) (gal) removal
BC-1 22.95 2.5 8 Peristaltic
BC-2 19.50 2.5 10 Peristaltic
BC-3 19.35 3.0 10+ Peristaltic
Meeker Ran at tap 15 minutes
Ostrander Ran at tap 15 minutes
Table 12. Field Water Quality Data
Specific conductivity Temperature
Well (umhos/cm) E!! ( 0 c)
BC-1 191 7.80 10
BC-2 150 7.10 10
BC-3 196 7.20 9
Meeker 316 7.25 12.9
Ostrander 295 7.10 10
Number of pore volumes
3+
4
3+

I I I I I I I I I I I I I I I I I I I
41
Results
The results of the sampling program are illustrated in Table 13.
The toluene results in BC-1 and BC-2 are likely invalid, because a toluene concentration of 2 ug/1 was found in the field blank. Therefore, we are assuming these results are due to laboratory or sampling contamination. The compound bis {2-ethylhexyl) phthalate, found in BC-2, BC-3, and the Meeker Well {BC-4), was the only compound detected in the 625 analysis. These concentrations are the highest levels of any potentially toxic compound detected in the study area. Phthalates are mainly used as plasticizers, and are widely present in the environment. Phthalate esters are reportedly acutely and chronically toxic to freshwater and marine organisms. Toxicological investigations in mammals show that phthalates have low acute toxicity but induce serious chronic effects including teratogenicity and mutagenicity. The recommended human health criteria for diethylhexyl phthalate is 10 mg/1. There is no criterion for bis {2-ethylhexyl) phthalate, but it would likely be very close to the diethylhexyl phthalate standard, because the two compounds are very similar. These three wells were the only wells in the study area with detectable levels of phthalates. Because plastic tubing products are often used in the laboratory, laboratory contamination can be a source of phthalates. None of the other samples, however, including the field blank, had detectable levels of phthalates. The level of laboratory contamination by phthalates is typically in the range of 10 to 20 ug/1.
The Meeker Well and Well BC-2 are located very close to each other, and it would be expected that they have comparable levels of the compound. Both wells are downgradient of McChord Air Force Base, as well as I-5, and numerous stormwater recharge facilities. Several solid and liquid waste disposal facilities are located upgradient of the wells, including the Cascade Demolition Landfill, which may be a source of the compound. BC-2, located near the Villa Plaza Shopping Center, is in an area with extensive use of subsurface storm drainage disposal.
Because phthalate esters are so widespread, the source of the contamination in these wells is not clear. The level of concentration, although relatively high compared with other toxic compounds measured, is not a significant potential health risk. The wells should, however, continue to be monitored to determine the significance of these analyses.
All the wells except BC-3 have nitrate and chloride concentrations significantly above our designated background levels for the study area. The Ostrander Well {BC-5), although not contaminated by organics, indicates a moderate to significant elevation in nitrate {i.e., greater than 1/2 the standard). This is in an area with a high concentration of stormwater recharge facilities, as well as

- -- -- -
Purgeable priority
Well pollutants (625). ug/1
BC-1 Toluene: 1
BC-2 Toluene: 1
BC-3 --
Meeker --(BC-4)
Ostrander --'(BC-5)
- - - - - - -Table 13. Results, Organics Monitoring
Acid/ base Arsenic, Chromium, Lead, neutrals mg/1 mg/1 mg/1 (625). ug/1
-- -- <O. 2 <0.001
Bis -- <0.2 <0.001 (2-ethylhexyl) phthalate: 99
Bis 0.018 <0.2 <0 .001 (2-ethylhexyl) phthalate: 77
Bis 0.011 <0.2 <0.001 (2-ethylhexyl) phthalate: 130
-- -- <O. 2 <0.001
- -
Nitrate, mg/1
2.49
3.62
<0.01
4.75
5.9
-
Chloride, mg/1
4.9
9.9
0.9
12.0
7.9
- -
... "'
-

I I I I I I I I I I I I I I I I I I I
43
being unsewered. Continued monitoring in these wells is recommended to determine the rate of water quality degradation.
In summary, it appears at this time that organics contamination in the Clover/Chambers Creek basin is related to point rather than non-point sources. We have not seen widespread low level organics contamination. At this time, it appears that we should focus our investigative scrutiny upon known sources of contaminants (i.e., point sources) in "window" areas.
Related Documents