Clouds at the tropical tropopause: A case study during the APE-THESEO campaign over the western Indian Ocean Vincenzo Santacesaria, 1,2 Roberto Carla, 1 Robert MacKenzie, 3 Alberto Adriani, 4 Francesco Cairo, 4 Guido Didonfrancesco, 4,5 Christoph Kiemle, 6 Gianluca Redaelli, 7 Ju ¨rgen Beuermann, 8 Cornelius Schiller, 8 Thomas Peter, 9 Beiping Luo, 9 Heini Wernli, 9 Fabrizio Ravegnani, 10 Alexey Ulanovsky, 11 Vladimir Yushkov, 11 Nikolay Sitnikov, 11 Stefano Balestri, 12 and Leopoldo Stefanutti 13 Received 5 February 2002; revised 10 May 2002; accepted 22 May 2002; published 18 January 2003. [1] In this paper, we report a detailed description of a thin cirrus at the tropopause above a cumulonimbus (Cb) convective cluster observed during the Airborne Platform for Earth Observation – Third European Stratospheric Experiment for Ozone (APE-THESEO) campaign in February–March 1999 in the western Indian Ocean. The thin cirrus (Ci) has an optical depth at 532 nm below 0.1, with extended subvisible stretches, and is located directly below the tropopause, which was supersaturated with respect to ice. A direct comparison between the optical depth retrieved by Meteosat and that obtained by means of the hygrometers installed on the M55-Geophysica aircraft is discussed showing discrepancies ranging from 10 to 20%. Combining satellite and aircraft data, we show that the observed Ci is not due to cirrus outflow from Cb anvils. In the absence of any deeply convective clouds reaching altitudes above 15 km, we propose a possible mechanism of Ci formation based on a net mesoscale transport of water vapor from altitudes above 16 km to the tropopause region around 18 km. This transport could be driven by the critical layer and turbulence induced by gravity waves that could have been generated by lower level Cb cluster activity. The proposed mechanism for high-altitude Ci formation corroborates the new paradigm of a tropical tropopause layer (TTL) or ‘‘substratosphere,’’ several kilometers thick, which is decoupled from the convection-dominated lower troposphere. INDEX TERMS: 0320 Atmospheric Composition and Structure: Cloud physics and chemistry; 0368 Atmospheric Composition and Structure: Troposphere—constituent transport and chemistry; 0394 Atmospheric Composition and Structure: Instruments and techniques; KEYWORDS: thin tropical cirrus, APE-THESEO campaign, tropical tropopause layer (TTL), convective system Citation: Santacesaria, V., et al., Clouds at the tropical tropopause: A case study during the APE-THESEO campaign over the western Indian Ocean, J. Geophys. Res., 108(D2), 4044, doi:10.1029/2002JD002166, 2003. 1. Introduction [2] Past observations have revealed very low water vapor concentrations in the lower stratosphere over tropical regions [Holton et al., 1995; Tuck et al., 1997]. The Brewer-Dobson theory for stratospheric circulation [Brewer , 1949] suggests that the upward branch of the circulation is located in the tropics. The cold temperatures encountered by the air masses upon crossing the tropical tropopause region limits the water vapor content with which they enter the stratosphere. Recently, the special character of the altitude range a few kilometers below the tropical tropopause, which is only rarely penetrated by deep convection, has been emphasized by naming this region ‘‘substratosphere’’ [Thu- burn and Craig, 2000] or tropical tropopause layer (TTL) [Sherwood and Dessler, 2000]. JOURNAL OF GEOPHYSICAL RESEARCH, VOL. 108, NO. D2, 4044, doi:10.1029/2002JD002166, 2003 1 Istituto di Fisica Applicata ‘‘Nello Carrara,’’ Consiglio Nazionale delle Richerche, Florence, Italy. 2 Now at Advanced Computer System SpA, Rome, Italy. 3 Environmental Science Department, Lancaster University, Lancaster, UK. 4 Istituto di Scienze dell’Atmosfera e del Clima, Consiglio Nazionale delle Richerche, Rome, Italy. 5 Ente per le Nuove Tecnologie, l’Energia e l’Ambiente-Clim, Rome, Italy. 6 Deutsches Zentrum fu ¨r Luft- und Raumfahrt, Oberpfaffenhofen, Wessling, Germany. Copyright 2003 by the American Geophysical Union. 0148-0227/03/2002JD002166 AAC 1 - 1 7 Dipartimento di Fisica, Universita’ Dell’Aquila, Coppito, L’Aquila, Italy. 8 Forschungszentrum Ju ¨lich, Ju ¨lich, Germany. 9 Institute for Atmospheric and Climate Science, Swiss Federal Institute of Technology (ETH), Zurich, Switzerland. 10 Istituto di Scienze dell’Atmosfera e del Clima, Consiglio Nazionale delle Richerche, Bologna, Italy. 11 Central Aerological Observatory, Dolgoprudny, Russia. 12 Airborne Platform for Earth Observation srl, Florence, Italy. 13 Geophysica-Gruppo Europeo di Interesse Economico, Florence, Italy.

Welcome message from author
This document is posted to help you gain knowledge. Please leave a comment to let me know what you think about it! Share it to your friends and learn new things together.
Transcript

Clouds at the tropical tropopause: A case study during the
APE-THESEO campaign over the western Indian Ocean
Vincenzo Santacesaria,1,2 Roberto Carla,1 Robert MacKenzie,3 Alberto Adriani,4
Francesco Cairo,4 Guido Didonfrancesco,4,5 Christoph Kiemle,6 Gianluca Redaelli,7
Jurgen Beuermann,8 Cornelius Schiller,8 Thomas Peter,9 Beiping Luo,9 Heini Wernli,9
Fabrizio Ravegnani,10 Alexey Ulanovsky,11 Vladimir Yushkov,11 Nikolay Sitnikov,11
Stefano Balestri,12 and Leopoldo Stefanutti13
Received 5 February 2002; revised 10 May 2002; accepted 22 May 2002; published 18 January 2003.
[1] In this paper, we report a detailed description of a thin cirrus at the tropopause above acumulonimbus (Cb) convective cluster observed during the Airborne Platform for EarthObservation–Third European Stratospheric Experiment for Ozone (APE-THESEO)campaign in February–March 1999 in the western Indian Ocean. The thin cirrus (Ci) hasan optical depth at 532 nm below 0.1, with extended subvisible stretches, and is locateddirectly below the tropopause, which was supersaturated with respect to ice. A directcomparison between the optical depth retrieved by Meteosat and that obtained by means ofthe hygrometers installed on the M55-Geophysica aircraft is discussed showingdiscrepancies ranging from 10 to 20%. Combining satellite and aircraft data, we show thatthe observed Ci is not due to cirrus outflow from Cb anvils. In the absence of any deeplyconvective clouds reaching altitudes above 15 km, we propose a possible mechanismof Ci formation based on a net mesoscale transport of water vapor from altitudes above16 km to the tropopause region around 18 km. This transport could be driven by the criticallayer and turbulence induced by gravity waves that could have been generated by lowerlevel Cb cluster activity. The proposed mechanism for high-altitude Ci formationcorroborates the new paradigm of a tropical tropopause layer (TTL) or ‘‘substratosphere,’’several kilometers thick, which is decoupled from the convection-dominated lowertroposphere. INDEX TERMS: 0320 Atmospheric Composition and Structure: Cloud physics and
chemistry; 0368 Atmospheric Composition and Structure: Troposphere—constituent transport and chemistry;
0394 Atmospheric Composition and Structure: Instruments and techniques; KEYWORDS: thin tropical cirrus,
APE-THESEO campaign, tropical tropopause layer (TTL), convective system
Citation: Santacesaria, V., et al., Clouds at the tropical tropopause: A case study during the APE-THESEO campaign over the
western Indian Ocean, J. Geophys. Res., 108(D2), 4044, doi:10.1029/2002JD002166, 2003.
1. Introduction
[2] Past observations have revealed very low water vaporconcentrations in the lower stratosphere over tropicalregions [Holton et al., 1995; Tuck et al., 1997]. TheBrewer-Dobson theory for stratospheric circulation [Brewer,1949] suggests that the upward branch of the circulation is
located in the tropics. The cold temperatures encountered bythe air masses upon crossing the tropical tropopause regionlimits the water vapor content with which they enter thestratosphere. Recently, the special character of the altituderange a few kilometers below the tropical tropopause, whichis only rarely penetrated by deep convection, has beenemphasized by naming this region ‘‘substratosphere’’ [Thu-burn and Craig, 2000] or tropical tropopause layer (TTL)[Sherwood and Dessler, 2000].
JOURNAL OF GEOPHYSICAL RESEARCH, VOL. 108, NO. D2, 4044, doi:10.1029/2002JD002166, 2003
1Istituto di Fisica Applicata ‘‘Nello Carrara,’’ Consiglio Nazionale delleRicherche, Florence, Italy.
2Now at Advanced Computer System SpA, Rome, Italy.3Environmental Science Department, Lancaster University, Lancaster,
UK.4Istituto di Scienze dell’Atmosfera e del Clima, Consiglio Nazionale
delle Richerche, Rome, Italy.5Ente per le Nuove Tecnologie, l’Energia e l’Ambiente-Clim, Rome,
Italy.6Deutsches Zentrum fur Luft- und Raumfahrt, Oberpfaffenhofen,
Wessling, Germany.
Copyright 2003 by the American Geophysical Union.0148-0227/03/2002JD002166
AAC 1 - 1
7Dipartimento di Fisica, Universita’ Dell’Aquila, Coppito, L’Aquila,Italy.
8Forschungszentrum Julich, Julich, Germany.9Institute for Atmospheric and Climate Science, Swiss Federal Institute
of Technology (ETH), Zurich, Switzerland.10Istituto di Scienze dell’Atmosfera e del Clima, Consiglio Nazionale
delle Richerche, Bologna, Italy.11Central Aerological Observatory, Dolgoprudny, Russia.12Airborne Platform for Earth Observation srl, Florence, Italy.13Geophysica-Gruppo Europeo di Interesse Economico, Florence,
Italy.
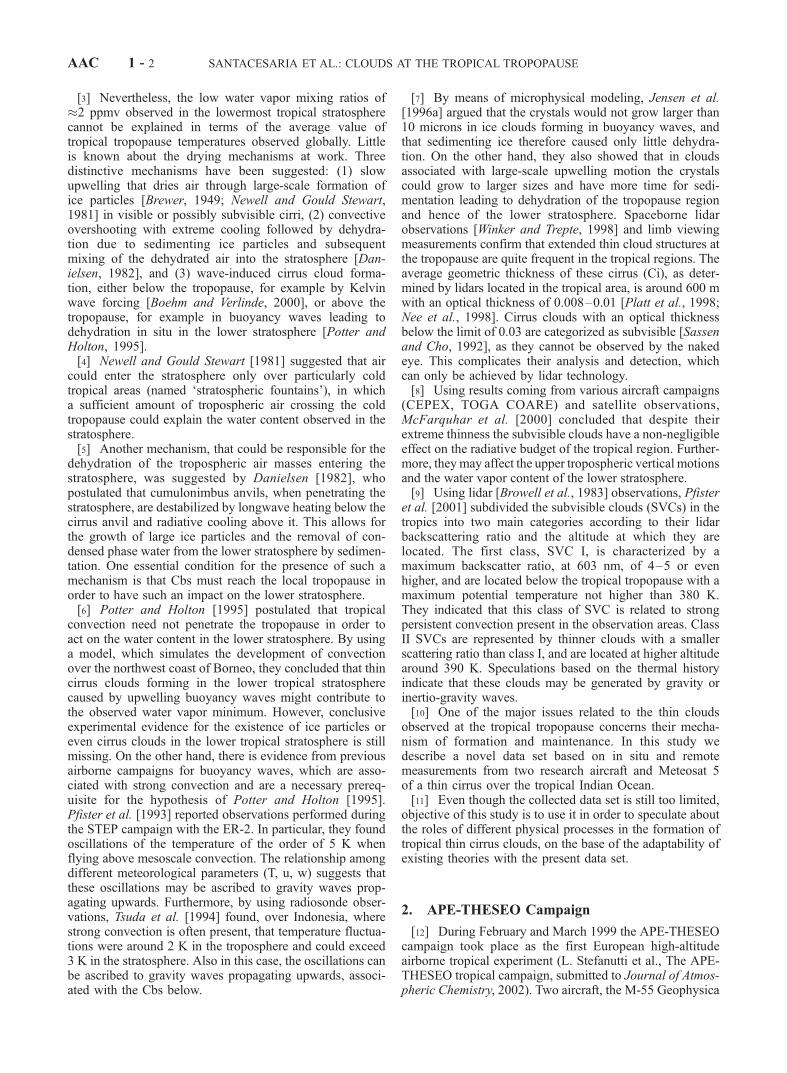
[3] Nevertheless, the low water vapor mixing ratios of�2 ppmv observed in the lowermost tropical stratospherecannot be explained in terms of the average value oftropical tropopause temperatures observed globally. Littleis known about the drying mechanisms at work. Threedistinctive mechanisms have been suggested: (1) slowupwelling that dries air through large-scale formation ofice particles [Brewer, 1949; Newell and Gould Stewart,1981] in visible or possibly subvisible cirri, (2) convectiveovershooting with extreme cooling followed by dehydra-tion due to sedimenting ice particles and subsequentmixing of the dehydrated air into the stratosphere [Dan-ielsen, 1982], and (3) wave-induced cirrus cloud forma-tion, either below the tropopause, for example by Kelvinwave forcing [Boehm and Verlinde, 2000], or above thetropopause, for example in buoyancy waves leading todehydration in situ in the lower stratosphere [Potter andHolton, 1995].[4] Newell and Gould Stewart [1981] suggested that air
could enter the stratosphere only over particularly coldtropical areas (named ‘stratospheric fountains’), in whicha sufficient amount of tropospheric air crossing the coldtropopause could explain the water content observed in thestratosphere.[5] Another mechanism, that could be responsible for the
dehydration of the tropospheric air masses entering thestratosphere, was suggested by Danielsen [1982], whopostulated that cumulonimbus anvils, when penetrating thestratosphere, are destabilized by longwave heating below thecirrus anvil and radiative cooling above it. This allows forthe growth of large ice particles and the removal of con-densed phase water from the lower stratosphere by sedimen-tation. One essential condition for the presence of such amechanism is that Cbs must reach the local tropopause inorder to have such an impact on the lower stratosphere.[6] Potter and Holton [1995] postulated that tropical
convection need not penetrate the tropopause in order toact on the water content in the lower stratosphere. By usinga model, which simulates the development of convectionover the northwest coast of Borneo, they concluded that thincirrus clouds forming in the lower tropical stratospherecaused by upwelling buoyancy waves might contribute tothe observed water vapor minimum. However, conclusiveexperimental evidence for the existence of ice particles oreven cirrus clouds in the lower tropical stratosphere is stillmissing. On the other hand, there is evidence from previousairborne campaigns for buoyancy waves, which are asso-ciated with strong convection and are a necessary prereq-uisite for the hypothesis of Potter and Holton [1995].Pfister et al. [1993] reported observations performed duringthe STEP campaign with the ER-2. In particular, they foundoscillations of the temperature of the order of 5 K whenflying above mesoscale convection. The relationship amongdifferent meteorological parameters (T, u, w) suggests thatthese oscillations may be ascribed to gravity waves prop-agating upwards. Furthermore, by using radiosonde obser-vations, Tsuda et al. [1994] found, over Indonesia, wherestrong convection is often present, that temperature fluctua-tions were around 2 K in the troposphere and could exceed3 K in the stratosphere. Also in this case, the oscillations canbe ascribed to gravity waves propagating upwards, associ-ated with the Cbs below.
[7] By means of microphysical modeling, Jensen et al.[1996a] argued that the crystals would not grow larger than10 microns in ice clouds forming in buoyancy waves, andthat sedimenting ice therefore caused only little dehydra-tion. On the other hand, they also showed that in cloudsassociated with large-scale upwelling motion the crystalscould grow to larger sizes and have more time for sedi-mentation leading to dehydration of the tropopause regionand hence of the lower stratosphere. Spaceborne lidarobservations [Winker and Trepte, 1998] and limb viewingmeasurements confirm that extended thin cloud structures atthe tropopause are quite frequent in the tropical regions. Theaverage geometric thickness of these cirrus (Ci), as deter-mined by lidars located in the tropical area, is around 600 mwith an optical thickness of 0.008–0.01 [Platt et al., 1998;Nee et al., 1998]. Cirrus clouds with an optical thicknessbelow the limit of 0.03 are categorized as subvisible [Sassenand Cho, 1992], as they cannot be observed by the nakedeye. This complicates their analysis and detection, whichcan only be achieved by lidar technology.[8] Using results coming from various aircraft campaigns
(CEPEX, TOGA COARE) and satellite observations,McFarquhar et al. [2000] concluded that despite theirextreme thinness the subvisible clouds have a non-negligibleeffect on the radiative budget of the tropical region. Further-more, theymay affect the upper tropospheric vertical motionsand the water vapor content of the lower stratosphere.[9] Using lidar [Browell et al., 1983] observations, Pfister
et al. [2001] subdivided the subvisible clouds (SVCs) in thetropics into two main categories according to their lidarbackscattering ratio and the altitude at which they arelocated. The first class, SVC I, is characterized by amaximum backscatter ratio, at 603 nm, of 4–5 or evenhigher, and are located below the tropical tropopause with amaximum potential temperature not higher than 380 K.They indicated that this class of SVC is related to strongpersistent convection present in the observation areas. ClassII SVCs are represented by thinner clouds with a smallerscattering ratio than class I, and are located at higher altitudearound 390 K. Speculations based on the thermal historyindicate that these clouds may be generated by gravity orinertio-gravity waves.[10] One of the major issues related to the thin clouds
observed at the tropical tropopause concerns their mecha-nism of formation and maintenance. In this study wedescribe a novel data set based on in situ and remotemeasurements from two research aircraft and Meteosat 5of a thin cirrus over the tropical Indian Ocean.[11] Even though the collected data set is still too limited,
objective of this study is to use it in order to speculate aboutthe roles of different physical processes in the formation oftropical thin cirrus clouds, on the base of the adaptability ofexisting theories with the present data set.
2. APE-THESEO Campaign
[12] During February and March 1999 the APE-THESEOcampaign took place as the first European high-altitudeairborne tropical experiment (L. Stefanutti et al., The APE-THESEO tropical campaign, submitted to Journal of Atmos-pheric Chemistry, 2002). Two aircraft, the M-55 Geophysica
AAC 1 - 2 SANTACESARIA ET AL.: CLOUDS AT THE TROPICAL TROPOPAUSE

(which can fly up to 22 km) and the DLR Falcon, performedcombined flights over the western Indian Ocean.[13] During the campaign, convective activity was gen-
erally not strong enough to reach the tropopause. Thesatellite data show that anvils associated with Cbs on theaverage remained a couple of km below the local tropo-pause (with the exception of the last four days of thecampaign). This is in accord with our in situ and lidarmeasurements of deeply convective systems. Conversely,the measurements show thin clouds at the tropopause, aswell as a surprisingly cold and dry tropopause (A. R.MacKenzie et al., manuscript in preparation, 2002).[14] Amongst the most remarkable findings of this cam-
paign was the detection of ultrathin tropical tropopauseclouds (UTTCs) with geometrical thicknesses around200–300 m and optical depths around 10�4. These distinctlayers appear to be long lasting and geographically veryextended; see B. P. Luo et al. (Dehydration potential ofultrathin clouds at the tropical tropopause, submitted toGeophysical Research Letters, 2002) (hereinafter referredto as Luo et al., submitted manuscript, 2002) for details.Here we do not report on UTTCs but on thicker SVCs thatmight lead to UTTC formation upon evaporation.
2.1. In Situ Measurements
[15] During APE-THESEO, the Geophysica carried acomprehensive scientific payload with in situ sensors tomeasure meteorological parameters, water vapor, ozone,and trace gases, further with an in situ size-resolving aerosolcounter as well as with two upward looking aerosol lidarsystems. The current analysis relies mostly on data from thefollowing in situ instruments on board Geophysica: datafrom MAS [Adriani et al., 1999], a multiwavelength aerosolscatterometer, which operated at 532 nm during the tropicalcampaign and allows to measure both, the parallel and theperpendicular (depolarized) components of the backscat-tered light; data from FISH [Zoger et al., 1999] and fromFLASH [Merkulov and Yushkov, 1999], two Ly-a fluores-cence hygrometers measuring the total and the gas phasecontent of H2O, respectively; data from FOZAN, a chem-iluminescent ozone sensor that detects fast ozone variations[Yushkov et al., 1999], which are used to distinguish tropo-spheric from stratospheric air. The in situ payload includesalso a modified FSSP-300 optical particle detection instru-ment covering a particle diameter size ranging from 0.4 to23 mm. Unfortunately, this instrument did not work duringthe first flight, but it collected several measurements infollowing flights [Thomas et al., 2002].
2.2. Remote Sensing of Clouds by Lidar
[16] The research aircraft Falcon of the German Aero-space Center (DLR) carried the 4-wavelength aerosol andozone lidar OLEX (Ozone Lidar Experiment) in zenith-viewing mode [Wirth and Renger, 1996]. OLEX providedtwo-dimensional vertical cross sections of visible and sub-visible cirrus cloud backscatter ratios at 354, 532 and 1064nm, of the depolarization ratio at 532 nm, and of strato-spheric ozone. The backscatter ratio is defined as the ratio oftotal (aerosol plus air molecular) backscatter coefficientdivided by pure air molecular backscatter coefficient. TheOLEX on board of the Falcon provided unprecedented newviews of Ci and SVCs in the TTL (cf. Luo et al., submitted
manuscript, 2002). Besides following its own researchgoals, the Falcon served as path-finding aircraft for theGeophysica. Both aircraft can fly with the same speed attheir respective altitudes, allowing simultaneous detailed insitu and remote measurements of the same clouds.
2.3. Satellite Support
[17] The campaign took place simultaneously with theINDOEX (Indian Ocean Experiment) intensive field phase(A. Clarke et al., An overview of the C-130 flight missionsand measurements during INDOEX, submitted to Journalof Geophysical Research, 2001), which was supported byMeteosat 5 cloud images in order to provide information onconvective cloud activity in the area. For this purposeMeteosat 5 was relocated to 63�E, i.e., directly above theIndian Ocean, and APE-THESEO profited from this relo-cation. The satellite radiometer acquires images simultane-ously in three spectral ranges: in the visible (0.5–0.9 mm),thermal infrared (IR) (10.5–12.5 mm), and water vapor(WV) (5.7–7.1 mm). The acquisition frequencies of 30minutes with total coverage and high spatial resolution of5 km at the equator are adequate for the observation of fastatmospheric processes in a large oceanic region.
2.4. Case Study
[18] In this paper we describe specifically the flight of 19February when extended thin cirrus with optical depthsbetween 0.01 and 0.09 was observed. The cirrus waslocated close to the tropopause above, but clearly detachedfrom an area of moderate Cb activity, similar to visualobservations from aircraft by Harris-Hobbs et al. [1990].The cloud is characterized by a relatively high backscatter-ing ratio and optical depth. Its high altitude does not allowthe cloud to be classified according to the scheme proposedby Pfister et al. [2001], who considered Ci as an anviloutflow. Conversely, these clouds may play a role in theformation of UTTCs (Luo et al., submitted manuscript,2002).
3. Case Study of Flight on 19 February 1999
[19] In Figure 1, the Geophysica flight path is shown onthe corresponding IR Meteosat 5 image. The Falcon flewprecisely the same path 30 to 60 minutes ahead of theGeophysica in order to serve as pathfinder and to providethe Geophysica pilot with cloud altitude information.
3.1. Meteorological Characterization
[20] The color code used in Figure 1 represents cloud topbrightness temperature. Two different convective regionscan be identified. The more intense and extensive system islocated to the west and southwest of the Seychelles, and hasa cloud top temperature around �65�C, corresponding toroughly 2 km below the tropopause (measured along theflight path). Another system is located to the north of theSeychelles, characterized by a cluster of isolated Cbs withcloud top brightness temperatures higher than �50�C. Itshould be noted that these temperatures are only estimates.The brightness temperature in the IR images corresponds tothe actual temperature only for opaque clouds, as is appro-priate for Cbs. For thin cirrus clouds, however, the weakemissivity would have to be taken into account in the
SANTACESARIA ET AL.: CLOUDS AT THE TROPICAL TROPOPAUSE AAC 1 - 3
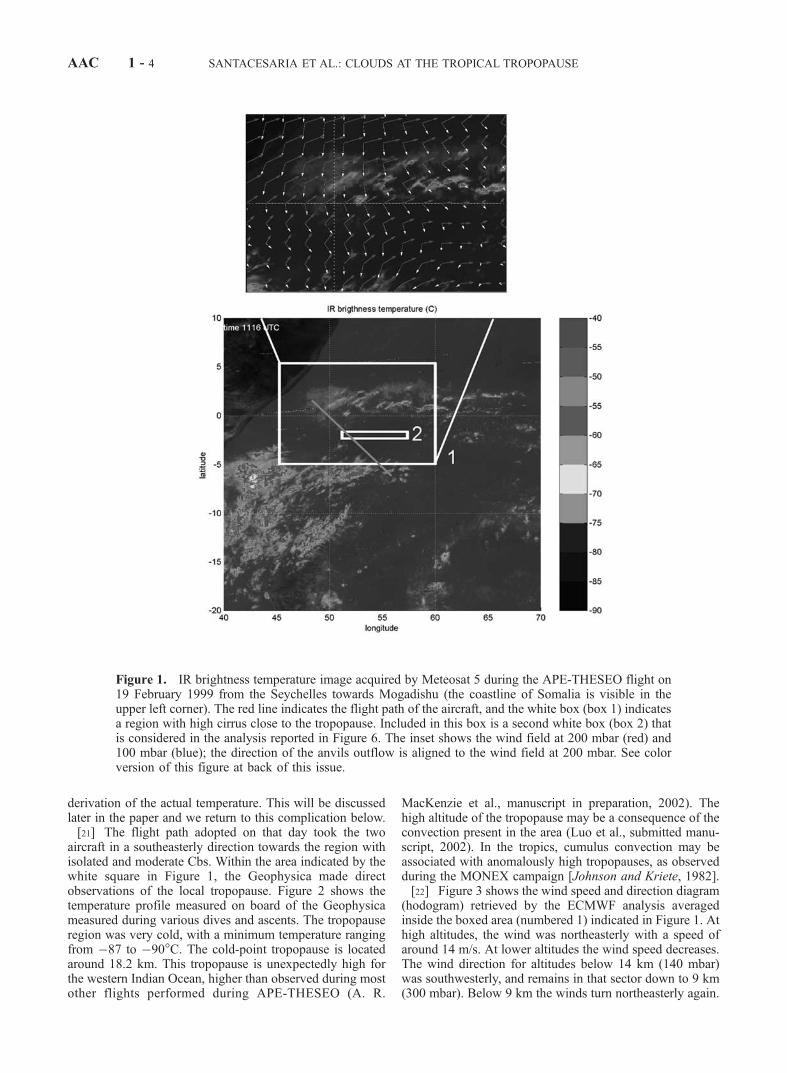
derivation of the actual temperature. This will be discussedlater in the paper and we return to this complication below.[21] The flight path adopted on that day took the two
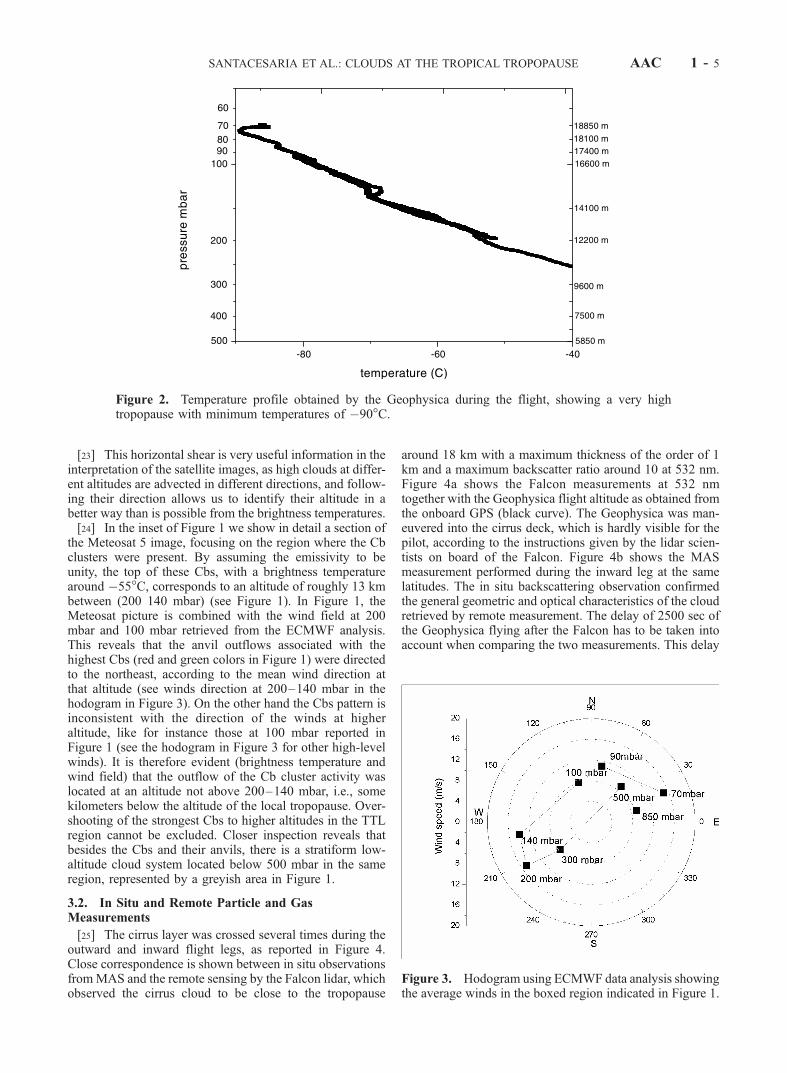
aircraft in a southeasterly direction towards the region withisolated and moderate Cbs. Within the area indicated by thewhite square in Figure 1, the Geophysica made directobservations of the local tropopause. Figure 2 shows thetemperature profile measured on board of the Geophysicameasured during various dives and ascents. The tropopauseregion was very cold, with a minimum temperature rangingfrom �87 to �90�C. The cold-point tropopause is locatedaround 18.2 km. This tropopause is unexpectedly high forthe western Indian Ocean, higher than observed during mostother flights performed during APE-THESEO (A. R.
MacKenzie et al., manuscript in preparation, 2002). Thehigh altitude of the tropopause may be a consequence of theconvection present in the area (Luo et al., submitted manu-script, 2002). In the tropics, cumulus convection may beassociated with anomalously high tropopauses, as observedduring the MONEX campaign [Johnson and Kriete, 1982].[22] Figure 3 shows the wind speed and direction diagram
(hodogram) retrieved by the ECMWF analysis averagedinside the boxed area (numbered 1) indicated in Figure 1. Athigh altitudes, the wind was northeasterly with a speed ofaround 14 m/s. At lower altitudes the wind speed decreases.The wind direction for altitudes below 14 km (140 mbar)was southwesterly, and remains in that sector down to 9 km(300 mbar). Below 9 km the winds turn northeasterly again.
Figure 1. IR brightness temperature image acquired by Meteosat 5 during the APE-THESEO flight on19 February 1999 from the Seychelles towards Mogadishu (the coastline of Somalia is visible in theupper left corner). The red line indicates the flight path of the aircraft, and the white box (box 1) indicatesa region with high cirrus close to the tropopause. Included in this box is a second white box (box 2) thatis considered in the analysis reported in Figure 6. The inset shows the wind field at 200 mbar (red) and100 mbar (blue); the direction of the anvils outflow is aligned to the wind field at 200 mbar. See colorversion of this figure at back of this issue.
AAC 1 - 4 SANTACESARIA ET AL.: CLOUDS AT THE TROPICAL TROPOPAUSE
[23] This horizontal shear is very useful information in theinterpretation of the satellite images, as high clouds at differ-ent altitudes are advected in different directions, and follow-ing their direction allows us to identify their altitude in abetter way than is possible from the brightness temperatures.[24] In the inset of Figure 1 we show in detail a section of
the Meteosat 5 image, focusing on the region where the Cbclusters were present. By assuming the emissivity to beunity, the top of these Cbs, with a brightness temperaturearound �55�C, corresponds to an altitude of roughly 13 kmbetween (200 140 mbar) (see Figure 1). In Figure 1, theMeteosat picture is combined with the wind field at 200mbar and 100 mbar retrieved from the ECMWF analysis.This reveals that the anvil outflows associated with thehighest Cbs (red and green colors in Figure 1) were directedto the northeast, according to the mean wind direction atthat altitude (see winds direction at 200–140 mbar in thehodogram in Figure 3). On the other hand the Cbs pattern isinconsistent with the direction of the winds at higheraltitude, like for instance those at 100 mbar reported inFigure 1 (see the hodogram in Figure 3 for other high-levelwinds). It is therefore evident (brightness temperature andwind field) that the outflow of the Cb cluster activity waslocated at an altitude not above 200–140 mbar, i.e., somekilometers below the altitude of the local tropopause. Over-shooting of the strongest Cbs to higher altitudes in the TTLregion cannot be excluded. Closer inspection reveals thatbesides the Cbs and their anvils, there is a stratiform low-altitude cloud system located below 500 mbar in the sameregion, represented by a greyish area in Figure 1.
3.2. In Situ and Remote Particle and GasMeasurements
[25] The cirrus layer was crossed several times during theoutward and inward flight legs, as reported in Figure 4.Close correspondence is shown between in situ observationsfromMAS and the remote sensing by the Falcon lidar, whichobserved the cirrus cloud to be close to the tropopause
around 18 km with a maximum thickness of the order of 1km and a maximum backscatter ratio around 10 at 532 nm.Figure 4a shows the Falcon measurements at 532 nmtogether with the Geophysica flight altitude as obtained fromthe onboard GPS (black curve). The Geophysica was man-euvered into the cirrus deck, which is hardly visible for thepilot, according to the instructions given by the lidar scien-tists on board of the Falcon. Figure 4b shows the MASmeasurement performed during the inward leg at the samelatitudes. The in situ backscattering observation confirmedthe general geometric and optical characteristics of the cloudretrieved by remote measurement. The delay of 2500 sec ofthe Geophysica flying after the Falcon has to be taken intoaccount when comparing the two measurements. This delay
Figure 2. Temperature profile obtained by the Geophysica during the flight, showing a very hightropopause with minimum temperatures of �90�C.
Figure 3. Hodogram using ECMWF data analysis showingthe average winds in the boxed region indicated in Figure 1.
SANTACESARIA ET AL.: CLOUDS AT THE TROPICAL TROPOPAUSE AAC 1 - 5
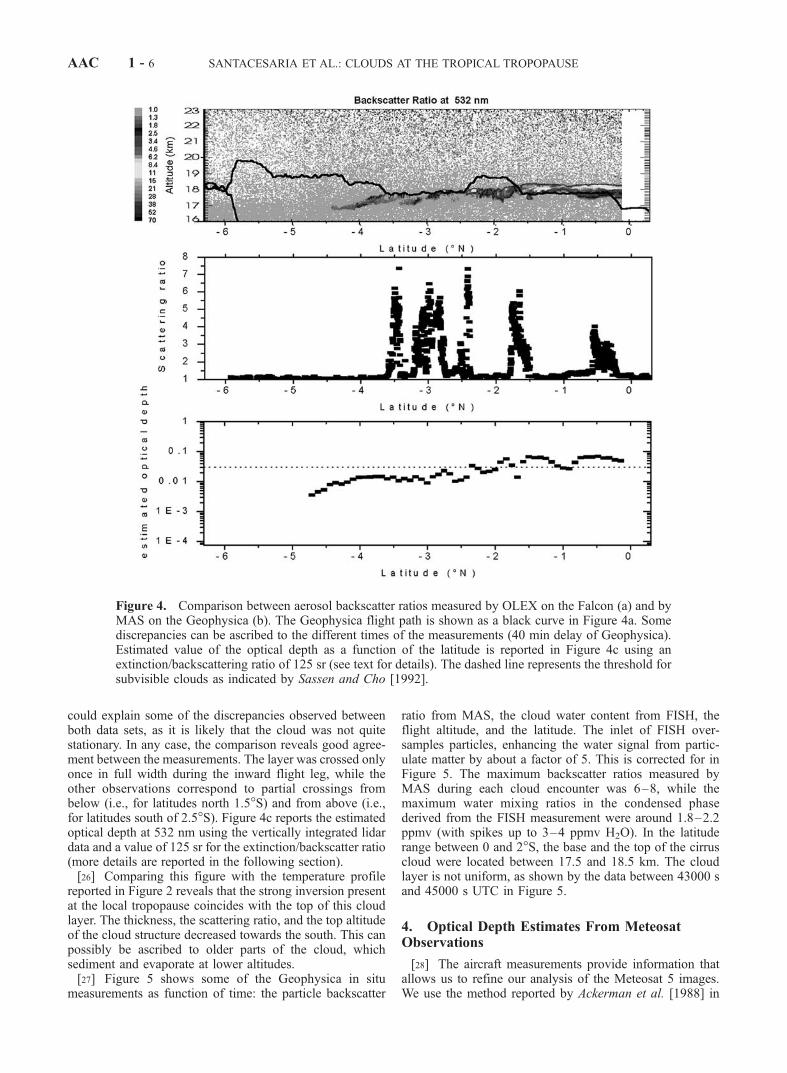
could explain some of the discrepancies observed betweenboth data sets, as it is likely that the cloud was not quitestationary. In any case, the comparison reveals good agree-ment between the measurements. The layer was crossed onlyonce in full width during the inward flight leg, while theother observations correspond to partial crossings frombelow (i.e., for latitudes north 1.5�S) and from above (i.e.,for latitudes south of 2.5�S). Figure 4c reports the estimatedoptical depth at 532 nm using the vertically integrated lidardata and a value of 125 sr for the extinction/backscatter ratio(more details are reported in the following section).[26] Comparing this figure with the temperature profile
reported in Figure 2 reveals that the strong inversion presentat the local tropopause coincides with the top of this cloudlayer. The thickness, the scattering ratio, and the top altitudeof the cloud structure decreased towards the south. This canpossibly be ascribed to older parts of the cloud, whichsediment and evaporate at lower altitudes.[27] Figure 5 shows some of the Geophysica in situ
measurements as function of time: the particle backscatter
ratio from MAS, the cloud water content from FISH, theflight altitude, and the latitude. The inlet of FISH over-samples particles, enhancing the water signal from partic-ulate matter by about a factor of 5. This is corrected for inFigure 5. The maximum backscatter ratios measured byMAS during each cloud encounter was 6–8, while themaximum water mixing ratios in the condensed phasederived from the FISH measurement were around 1.8–2.2ppmv (with spikes up to 3–4 ppmv H2O). In the latituderange between 0 and 2�S, the base and the top of the cirruscloud were located between 17.5 and 18.5 km. The cloudlayer is not uniform, as shown by the data between 43000 sand 45000 s UTC in Figure 5.
4. Optical Depth Estimates From MeteosatObservations
[28] The aircraft measurements provide information thatallows us to refine our analysis of the Meteosat 5 images.We use the method reported by Ackerman et al. [1988] in
Figure 4. Comparison between aerosol backscatter ratios measured by OLEX on the Falcon (a) and byMAS on the Geophysica (b). The Geophysica flight path is shown as a black curve in Figure 4a. Somediscrepancies can be ascribed to the different times of the measurements (40 min delay of Geophysica).Estimated value of the optical depth as a function of the latitude is reported in Figure 4c using anextinction/backscattering ratio of 125 sr (see text for details). The dashed line represents the threshold forsubvisible clouds as indicated by Sassen and Cho [1992].
AAC 1 - 6 SANTACESARIA ET AL.: CLOUDS AT THE TROPICAL TROPOPAUSE

order to calculate the cloud optical depth in the presence ofthin cirrus clouds. From this we estimate the ice watercontent, using the thermal channel data of Meteosat 5.
4.1. Meteosat-FISH Comparison
[29] Assuming that no midlevel clouds were presentbetween the sea surface and the cirrus layer, the IR thermalradiance measured by the radiometer on board of Meteosatcan be expressed as:
Bo ¼ Bs 1� eð Þ þ Bceþ Bsds tð Þ � Bcdc tð Þ; ð1Þ
Bs represents the radiance emitted by the surface below thecloud, which we assume to be the highest radiance observedaround the region of interest; Bc is the blackbody cloudradiance calculated assuming the cloud isothermal tempera-ture to be equal to Tc; t is the cloud optical depth; and e isthe cloud absorption emissivity which is related to t by thefollowing expression:
e ¼ 1� e�t ð2Þ
This expression is very approximate, because we assumedthat inside the cloud layer the temperature was isothermal.[30] In equation (1), the first two terms represent the
transmission and the thermal emission through the cloudtreated as a non-scattering medium. Corrections due to the
scattering are represented by the third and the fourth terms(Bsds(t); Bcdc(t)), which are a function among others of thesingle scattering albedo (v) and the asymmetry factor (g)[cf. Ackerman et al., 1988]. We use values of v = 0.5 andg = 0.85 assuming the particles to be cirrus ice crystals, ashas been suggested by Liou [1974]. From equation (1),given the values of Bo and Bs and the temperature of thecloud layer Tc (measured directly by the aircraft), the opticaldepth of the cloud can be retrieved. It is worthwhile toobserve that, due to the small value of the optical depthreported in this study, neglecting the terms for the correctionfor scattering the induced error in the estimated value of theoptical depth is about only 5%.[31] Another issue concerns the calibration of the IR
channel of the Meteosat 5. In this case we have estimatedthan an error up to 50% in the value of the calibrationcoefficient will induce an error in the estimated opticaldepth of less than 3%. This implies that the estimatedoptical depth is not very sensitive to the calibration coef-ficient. That is probably due to the fact that assuming thesame coefficient for the determination of the radiance clearsky surfaces and the radiance cloudy sky, the net effect onthe estimated optical depths compensate.[32] The optical depth can also be retrieved using the
cloud water measurement performed by FISH. The raw datafrom FISH are first corrected for the oversampling ofparticles by dividing the fraction of the signal due to theparticles by a factor of 5. The optical depth is related to thetotal column ice water path (IWP expressed in g m�2)through the following expression:
t ¼ b� IWP ð3Þ
where b is the broadband absorption coefficient [Starr andCox, 1985]. We assumed the value b = 0 048 m2g�1
obtained using the formulas described by Ebert and Curry[1992] and assuming a size distributions with particle modearound r � 5–6 mm and particle number densities of 6–9L�1 for r > 3 mm which was measured by FSSP-300 in thincirrus clouds at the tropopause observed during followingflights.[33] The Falcon and the Geophysica followed the same
path, so the geometric parameters of the layer could bedetected. From 0�S to 2�S, the layer was at a constantaltitude of 18 km with a geometric thickness of approx-imately 1 km. We focus our attention on the portions of theflight, during which the Geophysica traversed the cloudlayer, retrieving the total column ice water path (IWP) bymeans of FISH. The midcloud average temperature meas-ured in situ by the Geophysica was equal to �86�C. Wehave used the algorithm relative to the points of theMeteosat images in which the Geophysica crossed the cloudlayer, assuming midlevel clouds to be absent. The in situobservation (FISH) is compared with the satellite analysis inTable 1.[34] The water path (i.e., optical depth) measured in situ
by FISH in the cloud layer was comparable with theestimate based on the Meteosat image, using the algorithmsdescribed above. This means that the radiance observed byMeteosat can actually be ascribed to the presence of thiscloud layer with the features (i.e., optical depth, altitude)observed by the aircraft. In conclusion, the direct informa-
Figure 5. Latitudes covered (upper panel) and in situmeasurements performed by the Geophysica (middle andlower panels) during the flight on 19 February 1999. Lowerpanel: aerosol backscattering ratio at 532 nm from MAS.Middle panel: condensed phase water mixing ratio (aftersubtraction of gas phase mixing ratio) and GPS flightaltitude. See color version of this figure at back of this issue.
SANTACESARIA ET AL.: CLOUDS AT THE TROPICAL TROPOPAUSE AAC 1 - 7
tion retrieved by the two aircraft and the Meteosat obser-vations confirm the scenario that high clouds at the tropo-pause were present at altitudes much higher than those ofthe cumulus convection, which did not reach altitudes above12 km (i.e., remained 6 km below the observed Ci). Theeffective emissivity of the cloud layer was very small,ranging from 0.068 to 0.061 for the two cases, respectively.From these values it can be determined that the visibleoptical depth at 532 nm results ranges from 0.088 to 0.078.From MAS we can retrieve a total backscatter coefficient,integrated over altitude, of 7.5 � 10�4 1/sr and 6 � 10�4 1/sr for traversing the cloud. Thus, for this cloud, we obtain anextinction/backscatter ratio approximately equal to 117–130 sr. Similar values have been found in the past by lidarobservation [Sassen and Cho, 1992] for extremely high andcold clouds, as well as by laboratory tests [Sassen and Lou,1979]. These values are comparable with those obtained in acloud chamber by ice crystals shapes corresponding to smallplates and columns. In situ observations performed byHeymsfield [1986] in a cirriform cloud at �83�C revealedsuch crystals shapes (amongst others). Applying thesevalues of the lidar ratio to the OLEX data we can evaluatethe optical depth of the cloud along all its structure, seeFigure 4c. This indicates that the thinner parts of the cloud,where the large particle may already have sedimented out,have an optical depth around 0.012, which is below thethreshold for visibility defined by Sassen and Cho [1992].
4.2. Generalization for the Western Indian Ocean
[35] We tried to generalize the local, in situ, observationsto a larger region. For this purpose we used a qualitativemethod based on the Meteosat 5 IR and WV images byapplying the Szejwach method. This qualitative methodallows one to recognize the signature of a high cirrus cloudin the Meteosat images assuming that the radiative proper-ties are uniform and similar to the cirrus observe during theflight.[36] Szejwach [1982] describes a method for determining
the temperature of semi-transparent cirrus clouds from theinfrared radiances (namely the window channel and thewater vapor absorption channel) measured by Meteosat.This method is based on the combination of WV andthermal IR channels through a bi-dimensional histogram,which is used to extrapolate the cloud top temperature forsemi-transparent cirrus [Desbois et al., 1982]. This methodcannot be applied for cloud thickness below 0.0145 in theIR (approximately 0.03 in the visible range) because thecloud signature will be lost in the background fluctuations.This threshold value has been obtained from Figure 6considering IR values that are 3 standard deviations abovethe mean of the background values.[37] We have considered for these two channels an area of
100 � 13 pixel (approximately 500 � 65 km) as indicated
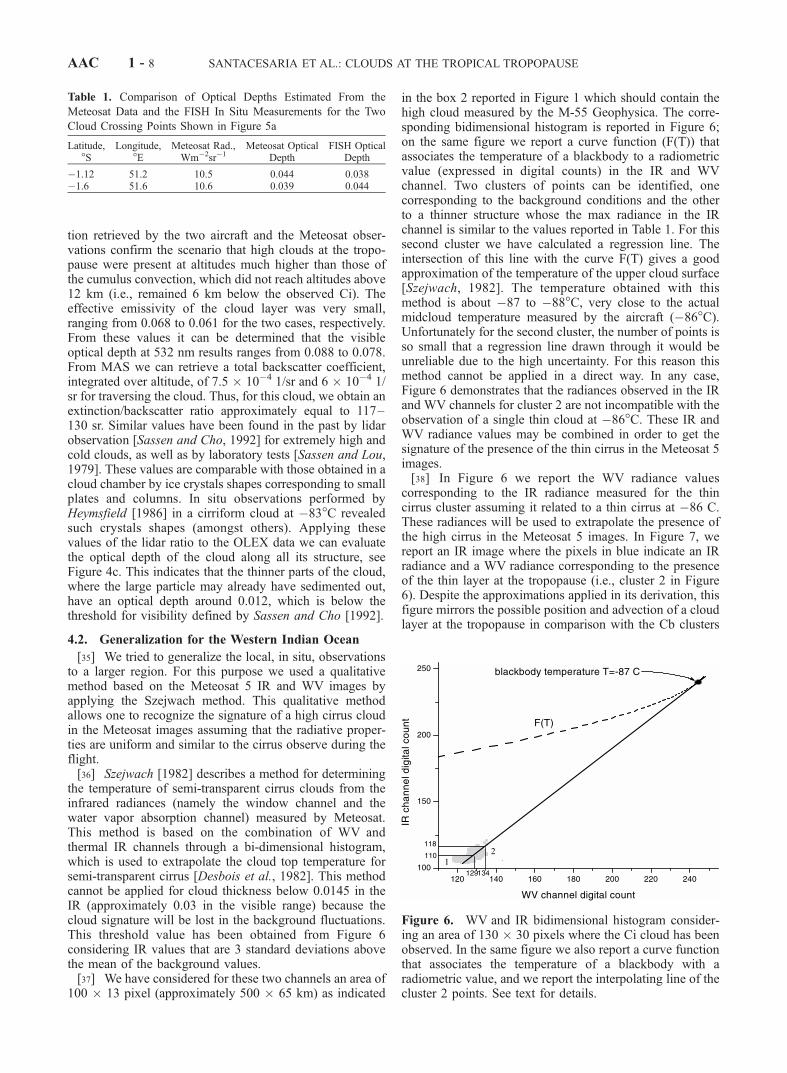
in the box 2 reported in Figure 1 which should contain thehigh cloud measured by the M-55 Geophysica. The corre-sponding bidimensional histogram is reported in Figure 6;on the same figure we report a curve function (F(T)) thatassociates the temperature of a blackbody to a radiometricvalue (expressed in digital counts) in the IR and WVchannel. Two clusters of points can be identified, onecorresponding to the background conditions and the otherto a thinner structure whose the max radiance in the IRchannel is similar to the values reported in Table 1. For thissecond cluster we have calculated a regression line. Theintersection of this line with the curve F(T) gives a goodapproximation of the temperature of the upper cloud surface[Szejwach, 1982]. The temperature obtained with thismethod is about �87 to �88�C, very close to the actualmidcloud temperature measured by the aircraft (�86�C).Unfortunately for the second cluster, the number of points isso small that a regression line drawn through it would beunreliable due to the high uncertainty. For this reason thismethod cannot be applied in a direct way. In any case,Figure 6 demonstrates that the radiances observed in the IRand WV channels for cluster 2 are not incompatible with theobservation of a single thin cloud at �86�C. These IR andWV radiance values may be combined in order to get thesignature of the presence of the thin cirrus in the Meteosat 5images.[38] In Figure 6 we report the WV radiance values
corresponding to the IR radiance measured for the thincirrus cluster assuming it related to a thin cirrus at �86 C.These radiances will be used to extrapolate the presence ofthe high cirrus in the Meteosat 5 images. In Figure 7, wereport an IR image where the pixels in blue indicate an IRradiance and a WV radiance corresponding to the presenceof the thin layer at the tropopause (i.e., cluster 2 in Figure6). Despite the approximations applied in its derivation, thisfigure mirrors the possible position and advection of a cloudlayer at the tropopause in comparison with the Cb clusters
Table 1. Comparison of Optical Depths Estimated From the
Meteosat Data and the FISH In Situ Measurements for the Two
Cloud Crossing Points Shown in Figure 5a
Latitude,�S
Longitude,�E
Meteosat Rad.,Wm�2sr�1
Meteosat OpticalDepth
FISH OpticalDepth
�1.12 51.2 10.5 0.044 0.038�1.6 51.6 10.6 0.039 0.044
Figure 6. WV and IR bidimensional histogram consider-ing an area of 130 � 30 pixels where the Ci cloud has beenobserved. In the same figure we also report a curve functionthat associates the temperature of a blackbody with aradiometric value, and we report the interpolating line of thecluster 2 points. See text for details.
AAC 1 - 8 SANTACESARIA ET AL.: CLOUDS AT THE TROPICAL TROPOPAUSE
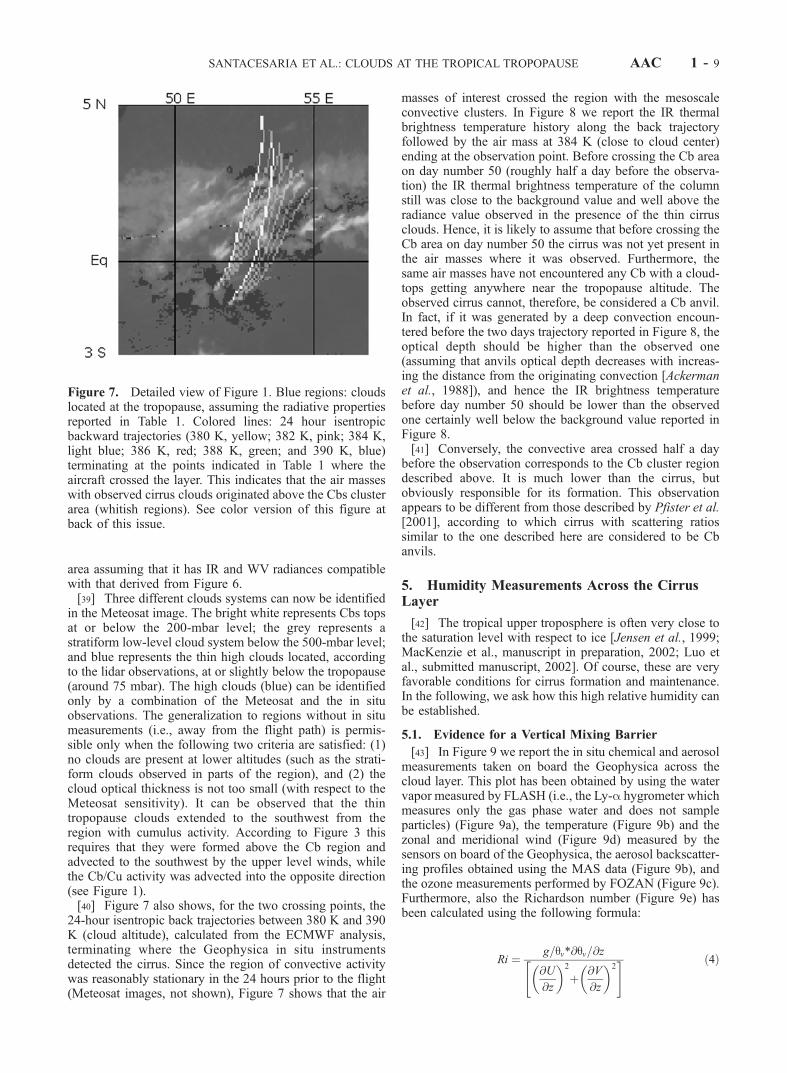
area assuming that it has IR and WV radiances compatiblewith that derived from Figure 6.[39] Three different clouds systems can now be identified
in the Meteosat image. The bright white represents Cbs topsat or below the 200-mbar level; the grey represents astratiform low-level cloud system below the 500-mbar level;and blue represents the thin high clouds located, accordingto the lidar observations, at or slightly below the tropopause(around 75 mbar). The high clouds (blue) can be identifiedonly by a combination of the Meteosat and the in situobservations. The generalization to regions without in situmeasurements (i.e., away from the flight path) is permis-sible only when the following two criteria are satisfied: (1)no clouds are present at lower altitudes (such as the strati-form clouds observed in parts of the region), and (2) thecloud optical thickness is not too small (with respect to theMeteosat sensitivity). It can be observed that the thintropopause clouds extended to the southwest from theregion with cumulus activity. According to Figure 3 thisrequires that they were formed above the Cb region andadvected to the southwest by the upper level winds, whilethe Cb/Cu activity was advected into the opposite direction(see Figure 1).[40] Figure 7 also shows, for the two crossing points, the
24-hour isentropic back trajectories between 380 K and 390K (cloud altitude), calculated from the ECMWF analysis,terminating where the Geophysica in situ instrumentsdetected the cirrus. Since the region of convective activitywas reasonably stationary in the 24 hours prior to the flight(Meteosat images, not shown), Figure 7 shows that the air
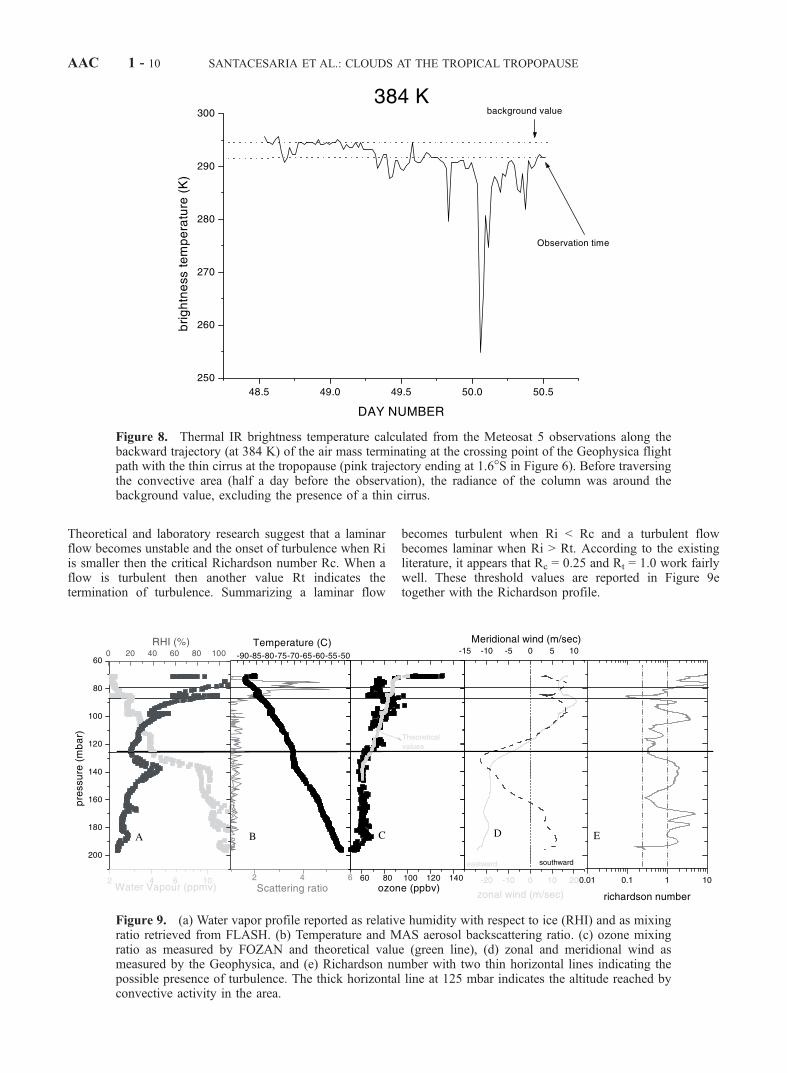
masses of interest crossed the region with the mesoscaleconvective clusters. In Figure 8 we report the IR thermalbrightness temperature history along the back trajectoryfollowed by the air mass at 384 K (close to cloud center)ending at the observation point. Before crossing the Cb areaon day number 50 (roughly half a day before the observa-tion) the IR thermal brightness temperature of the columnstill was close to the background value and well above theradiance value observed in the presence of the thin cirrusclouds. Hence, it is likely to assume that before crossing theCb area on day number 50 the cirrus was not yet present inthe air masses where it was observed. Furthermore, thesame air masses have not encountered any Cb with a cloud-tops getting anywhere near the tropopause altitude. Theobserved cirrus cannot, therefore, be considered a Cb anvil.In fact, if it was generated by a deep convection encoun-tered before the two days trajectory reported in Figure 8, theoptical depth should be higher than the observed one(assuming that anvils optical depth decreases with increas-ing the distance from the originating convection [Ackermanet al., 1988]), and hence the IR brightness temperaturebefore day number 50 should be lower than the observedone certainly well below the background value reported inFigure 8.[41] Conversely, the convective area crossed half a day
before the observation corresponds to the Cb cluster regiondescribed above. It is much lower than the cirrus, butobviously responsible for its formation. This observationappears to be different from those described by Pfister et al.[2001], according to which cirrus with scattering ratiossimilar to the one described here are considered to be Cbanvils.
5. Humidity Measurements Across the CirrusLayer
[42] The tropical upper troposphere is often very close tothe saturation level with respect to ice [Jensen et al., 1999;MacKenzie et al., manuscript in preparation, 2002; Luo etal., submitted manuscript, 2002]. Of course, these are veryfavorable conditions for cirrus formation and maintenance.In the following, we ask how this high relative humidity canbe established.
5.1. Evidence for a Vertical Mixing Barrier
[43] In Figure 9 we report the in situ chemical and aerosolmeasurements taken on board the Geophysica across thecloud layer. This plot has been obtained by using the watervapor measured by FLASH (i.e., the Ly-a hygrometer whichmeasures only the gas phase water and does not sampleparticles) (Figure 9a), the temperature (Figure 9b) and thezonal and meridional wind (Figure 9d) measured by thesensors on board of the Geophysica, the aerosol backscatter-ing profiles obtained using the MAS data (Figure 9b), andthe ozone measurements performed by FOZAN (Figure 9c).Furthermore, also the Richardson number (Figure 9e) hasbeen calculated using the following formula:
Ri ¼ g=qv*@qv=@z
@U
@z
� �2
þ @V
@z
� �2" # ð4Þ
Figure 7. Detailed view of Figure 1. Blue regions: cloudslocated at the tropopause, assuming the radiative propertiesreported in Table 1. Colored lines: 24 hour isentropicbackward trajectories (380 K, yellow; 382 K, pink; 384 K,light blue; 386 K, red; 388 K, green; and 390 K, blue)terminating at the points indicated in Table 1 where theaircraft crossed the layer. This indicates that the air masseswith observed cirrus clouds originated above the Cbs clusterarea (whitish regions). See color version of this figure atback of this issue.
SANTACESARIA ET AL.: CLOUDS AT THE TROPICAL TROPOPAUSE AAC 1 - 9
Theoretical and laboratory research suggest that a laminarflow becomes unstable and the onset of turbulence when Riis smaller then the critical Richardson number Rc. When aflow is turbulent then another value Rt indicates thetermination of turbulence. Summarizing a laminar flow
becomes turbulent when Ri < Rc and a turbulent flowbecomes laminar when Ri > Rt. According to the existingliterature, it appears that Rc = 0.25 and Rt = 1.0 work fairlywell. These threshold values are reported in Figure 9etogether with the Richardson profile.
Figure 8. Thermal IR brightness temperature calculated from the Meteosat 5 observations along thebackward trajectory (at 384 K) of the air mass terminating at the crossing point of the Geophysica flightpath with the thin cirrus at the tropopause (pink trajectory ending at 1.6�S in Figure 6). Before traversingthe convective area (half a day before the observation), the radiance of the column was around thebackground value, excluding the presence of a thin cirrus.
Figure 9. (a) Water vapor profile reported as relative humidity with respect to ice (RHI) and as mixingratio retrieved from FLASH. (b) Temperature and MAS aerosol backscattering ratio. (c) ozone mixingratio as measured by FOZAN and theoretical value (green line), (d) zonal and meridional wind asmeasured by the Geophysica, and (e) Richardson number with two thin horizontal lines indicating thepossible presence of turbulence. The thick horizontal line at 125 mbar indicates the altitude reached byconvective activity in the area.
AAC 1 - 10 SANTACESARIA ET AL.: CLOUDS AT THE TROPICAL TROPOPAUSE
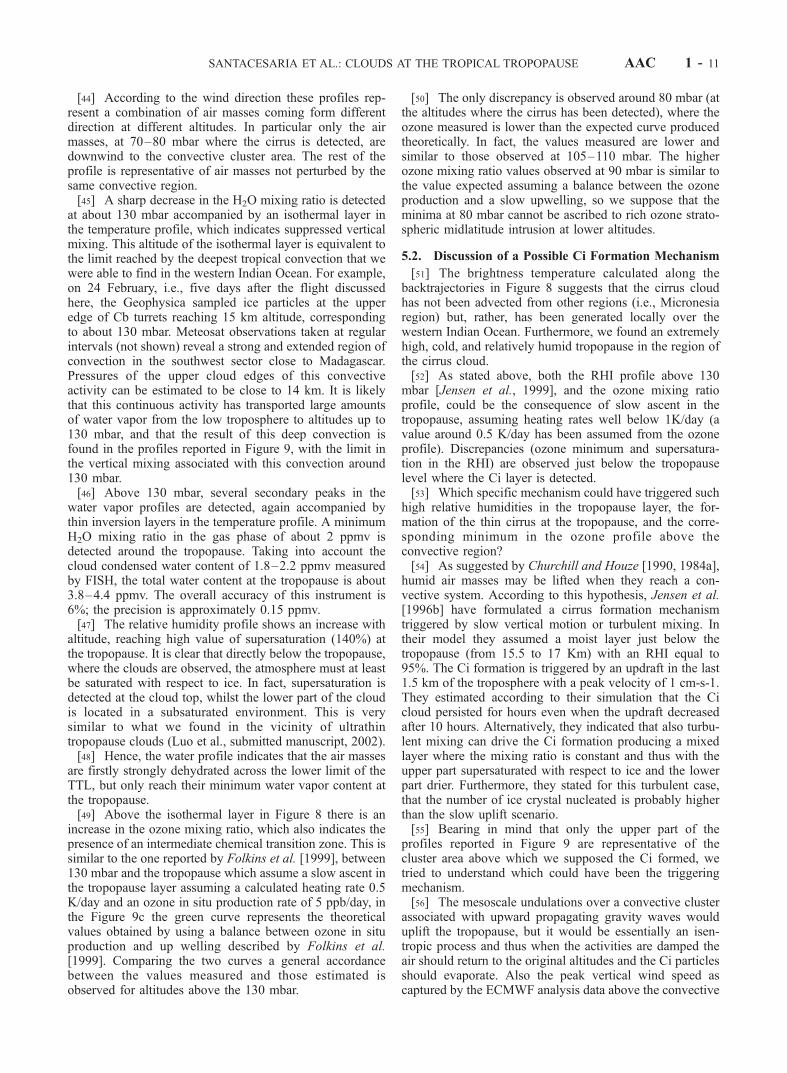
[44] According to the wind direction these profiles rep-resent a combination of air masses coming form differentdirection at different altitudes. In particular only the airmasses, at 70–80 mbar where the cirrus is detected, aredownwind to the convective cluster area. The rest of theprofile is representative of air masses not perturbed by thesame convective region.[45] A sharp decrease in the H2O mixing ratio is detected
at about 130 mbar accompanied by an isothermal layer inthe temperature profile, which indicates suppressed verticalmixing. This altitude of the isothermal layer is equivalent tothe limit reached by the deepest tropical convection that wewere able to find in the western Indian Ocean. For example,on 24 February, i.e., five days after the flight discussedhere, the Geophysica sampled ice particles at the upperedge of Cb turrets reaching 15 km altitude, correspondingto about 130 mbar. Meteosat observations taken at regularintervals (not shown) reveal a strong and extended region ofconvection in the southwest sector close to Madagascar.Pressures of the upper cloud edges of this convectiveactivity can be estimated to be close to 14 km. It is likelythat this continuous activity has transported large amountsof water vapor from the low troposphere to altitudes up to130 mbar, and that the result of this deep convection isfound in the profiles reported in Figure 9, with the limit inthe vertical mixing associated with this convection around130 mbar.[46] Above 130 mbar, several secondary peaks in the
water vapor profiles are detected, again accompanied bythin inversion layers in the temperature profile. A minimumH2O mixing ratio in the gas phase of about 2 ppmv isdetected around the tropopause. Taking into account thecloud condensed water content of 1.8–2.2 ppmv measuredby FISH, the total water content at the tropopause is about3.8–4.4 ppmv. The overall accuracy of this instrument is6%; the precision is approximately 0.15 ppmv.[47] The relative humidity profile shows an increase with
altitude, reaching high value of supersaturation (140%) atthe tropopause. It is clear that directly below the tropopause,where the clouds are observed, the atmosphere must at leastbe saturated with respect to ice. In fact, supersaturation isdetected at the cloud top, whilst the lower part of the cloudis located in a subsaturated environment. This is verysimilar to what we found in the vicinity of ultrathintropopause clouds (Luo et al., submitted manuscript, 2002).[48] Hence, the water profile indicates that the air masses
are firstly strongly dehydrated across the lower limit of theTTL, but only reach their minimum water vapor content atthe tropopause.[49] Above the isothermal layer in Figure 8 there is an
increase in the ozone mixing ratio, which also indicates thepresence of an intermediate chemical transition zone. This issimilar to the one reported by Folkins et al. [1999], between130 mbar and the tropopause which assume a slow ascent inthe tropopause layer assuming a calculated heating rate 0.5K/day and an ozone in situ production rate of 5 ppb/day, inthe Figure 9c the green curve represents the theoreticalvalues obtained by using a balance between ozone in situproduction and up welling described by Folkins et al.[1999]. Comparing the two curves a general accordancebetween the values measured and those estimated isobserved for altitudes above the 130 mbar.
[50] The only discrepancy is observed around 80 mbar (atthe altitudes where the cirrus has been detected), where theozone measured is lower than the expected curve producedtheoretically. In fact, the values measured are lower andsimilar to those observed at 105–110 mbar. The higherozone mixing ratio values observed at 90 mbar is similar tothe value expected assuming a balance between the ozoneproduction and a slow upwelling, so we suppose that theminima at 80 mbar cannot be ascribed to rich ozone strato-spheric midlatitude intrusion at lower altitudes.
5.2. Discussion of a Possible Ci Formation Mechanism
[51] The brightness temperature calculated along thebacktrajectories in Figure 8 suggests that the cirrus cloudhas not been advected from other regions (i.e., Micronesiaregion) but, rather, has been generated locally over thewestern Indian Ocean. Furthermore, we found an extremelyhigh, cold, and relatively humid tropopause in the region ofthe cirrus cloud.[52] As stated above, both the RHI profile above 130
mbar [Jensen et al., 1999], and the ozone mixing ratioprofile, could be the consequence of slow ascent in thetropopause, assuming heating rates well below 1K/day (avalue around 0.5 K/day has been assumed from the ozoneprofile). Discrepancies (ozone minimum and supersatura-tion in the RHI) are observed just below the tropopauselevel where the Ci layer is detected.[53] Which specific mechanism could have triggered such
high relative humidities in the tropopause layer, the for-mation of the thin cirrus at the tropopause, and the corre-sponding minimum in the ozone profile above theconvective region?[54] As suggested by Churchill and Houze [1990, 1984a],
humid air masses may be lifted when they reach a con-vective system. According to this hypothesis, Jensen et al.[1996b] have formulated a cirrus formation mechanismtriggered by slow vertical motion or turbulent mixing. Intheir model they assumed a moist layer just below thetropopause (from 15.5 to 17 Km) with an RHI equal to95%. The Ci formation is triggered by an updraft in the last1.5 km of the troposphere with a peak velocity of 1 cm-s-1.They estimated according to their simulation that the Cicloud persisted for hours even when the updraft decreasedafter 10 hours. Alternatively, they indicated that also turbu-lent mixing can drive the Ci formation producing a mixedlayer where the mixing ratio is constant and thus with theupper part supersaturated with respect to ice and the lowerpart drier. Furthermore, they stated for this turbulent case,that the number of ice crystal nucleated is probably higherthan the slow uplift scenario.[55] Bearing in mind that only the upper part of the
profiles reported in Figure 9 are representative of thecluster area above which we supposed the Ci formed, wetried to understand which could have been the triggeringmechanism.[56] The mesoscale undulations over a convective cluster
associated with upward propagating gravity waves woulduplift the tropopause, but it would be essentially an isen-tropic process and thus when the activities are damped theair should return to the original altitudes and the Ci particlesshould evaporate. Also the peak vertical wind speed ascaptured by the ECMWF analysis data above the convective
SANTACESARIA ET AL.: CLOUDS AT THE TROPICAL TROPOPAUSE AAC 1 - 11
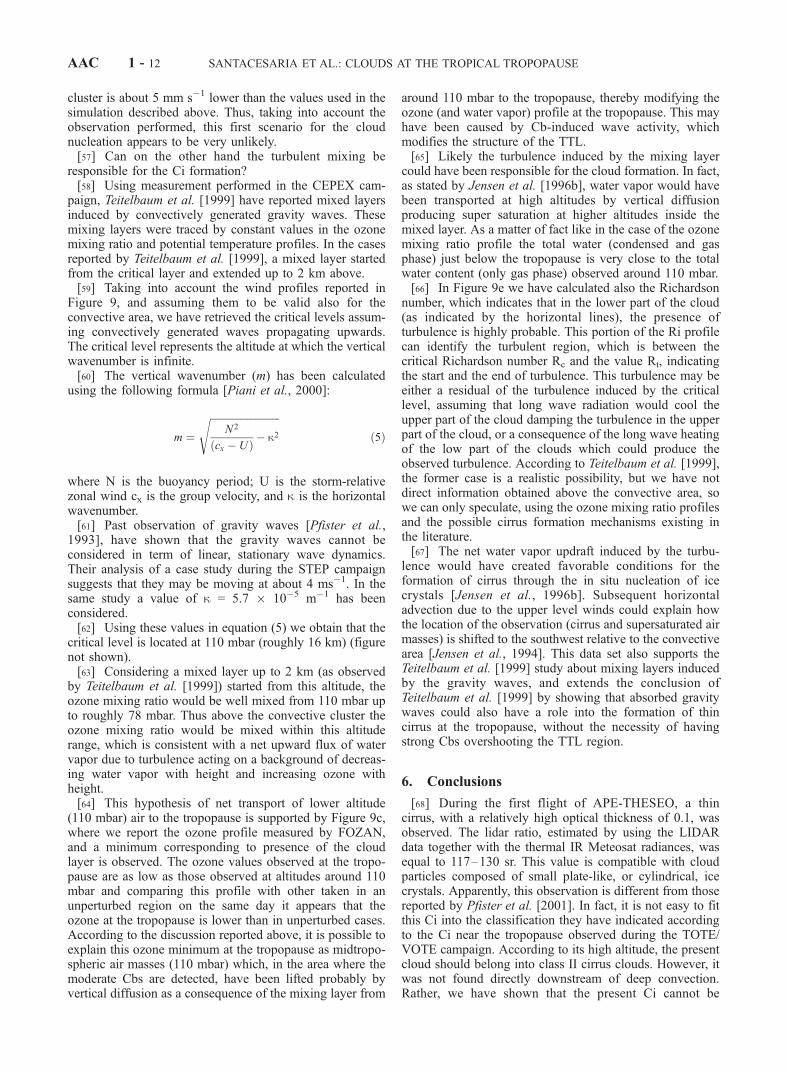
cluster is about 5 mm s�1 lower than the values used in thesimulation described above. Thus, taking into account theobservation performed, this first scenario for the cloudnucleation appears to be very unlikely.[57] Can on the other hand the turbulent mixing be
responsible for the Ci formation?[58] Using measurement performed in the CEPEX cam-
paign, Teitelbaum et al. [1999] have reported mixed layersinduced by convectively generated gravity waves. Thesemixing layers were traced by constant values in the ozonemixing ratio and potential temperature profiles. In the casesreported by Teitelbaum et al. [1999], a mixed layer startedfrom the critical layer and extended up to 2 km above.[59] Taking into account the wind profiles reported in
Figure 9, and assuming them to be valid also for theconvective area, we have retrieved the critical levels assum-ing convectively generated waves propagating upwards.The critical level represents the altitude at which the verticalwavenumber is infinite.[60] The vertical wavenumber (m) has been calculated
using the following formula [Piani et al., 2000]:
m ¼
ffiffiffiffiffiffiffiffiffiffiffiffiffiffiffiffiffiffiffiffiffiffiffiffiffiffiffiffiN2
cx � Uð Þ � k2
sð5Þ
where N is the buoyancy period; U is the storm-relativezonal wind cx is the group velocity, and k is the horizontalwavenumber.[61] Past observation of gravity waves [Pfister et al.,
1993], have shown that the gravity waves cannot beconsidered in term of linear, stationary wave dynamics.Their analysis of a case study during the STEP campaignsuggests that they may be moving at about 4 ms�1. In thesame study a value of k = 5.7 � 10�5 m�1 has beenconsidered.[62] Using these values in equation (5) we obtain that the
critical level is located at 110 mbar (roughly 16 km) (figurenot shown).[63] Considering a mixed layer up to 2 km (as observed
by Teitelbaum et al. [1999]) started from this altitude, theozone mixing ratio would be well mixed from 110 mbar upto roughly 78 mbar. Thus above the convective cluster theozone mixing ratio would be mixed within this altituderange, which is consistent with a net upward flux of watervapor due to turbulence acting on a background of decreas-ing water vapor with height and increasing ozone withheight.[64] This hypothesis of net transport of lower altitude
(110 mbar) air to the tropopause is supported by Figure 9c,where we report the ozone profile measured by FOZAN,and a minimum corresponding to presence of the cloudlayer is observed. The ozone values observed at the tropo-pause are as low as those observed at altitudes around 110mbar and comparing this profile with other taken in anunperturbed region on the same day it appears that theozone at the tropopause is lower than in unperturbed cases.According to the discussion reported above, it is possible toexplain this ozone minimum at the tropopause as midtropo-spheric air masses (110 mbar) which, in the area where themoderate Cbs are detected, have been lifted probably byvertical diffusion as a consequence of the mixing layer from
around 110 mbar to the tropopause, thereby modifying theozone (and water vapor) profile at the tropopause. This mayhave been caused by Cb-induced wave activity, whichmodifies the structure of the TTL.[65] Likely the turbulence induced by the mixing layer
could have been responsible for the cloud formation. In fact,as stated by Jensen et al. [1996b], water vapor would havebeen transported at high altitudes by vertical diffusionproducing super saturation at higher altitudes inside themixed layer. As a matter of fact like in the case of the ozonemixing ratio profile the total water (condensed and gasphase) just below the tropopause is very close to the totalwater content (only gas phase) observed around 110 mbar.[66] In Figure 9e we have calculated also the Richardson
number, which indicates that in the lower part of the cloud(as indicated by the horizontal lines), the presence ofturbulence is highly probable. This portion of the Ri profilecan identify the turbulent region, which is between thecritical Richardson number Rc and the value Rt, indicatingthe start and the end of turbulence. This turbulence may beeither a residual of the turbulence induced by the criticallevel, assuming that long wave radiation would cool theupper part of the cloud damping the turbulence in the upperpart of the cloud, or a consequence of the long wave heatingof the low part of the clouds which could produce theobserved turbulence. According to Teitelbaum et al. [1999],the former case is a realistic possibility, but we have notdirect information obtained above the convective area, sowe can only speculate, using the ozone mixing ratio profilesand the possible cirrus formation mechanisms existing inthe literature.[67] The net water vapor updraft induced by the turbu-
lence would have created favorable conditions for theformation of cirrus through the in situ nucleation of icecrystals [Jensen et al., 1996b]. Subsequent horizontaladvection due to the upper level winds could explain howthe location of the observation (cirrus and supersaturated airmasses) is shifted to the southwest relative to the convectivearea [Jensen et al., 1994]. This data set also supports theTeitelbaum et al. [1999] study about mixing layers inducedby the gravity waves, and extends the conclusion ofTeitelbaum et al. [1999] by showing that absorbed gravitywaves could also have a role into the formation of thincirrus at the tropopause, without the necessity of havingstrong Cbs overshooting the TTL region.
6. Conclusions
[68] During the first flight of APE-THESEO, a thincirrus, with a relatively high optical thickness of 0.1, wasobserved. The lidar ratio, estimated by using the LIDARdata together with the thermal IR Meteosat radiances, wasequal to 117–130 sr. This value is compatible with cloudparticles composed of small plate-like, or cylindrical, icecrystals. Apparently, this observation is different from thosereported by Pfister et al. [2001]. In fact, it is not easy to fitthis Ci into the classification they have indicated accordingto the Ci near the tropopause observed during the TOTE/VOTE campaign. According to its high altitude, the presentcloud should belong into class II cirrus clouds. However, itwas not found directly downstream of deep convection.Rather, we have shown that the present Ci cannot be
AAC 1 - 12 SANTACESARIA ET AL.: CLOUDS AT THE TROPICAL TROPOPAUSE

considered to be anvil outflow, because of the low altitudereached by the Cbs in the western Indian Ocean at this time.A first strong decrease in the water vapor content isobserved across the lower limit of the TTL at 14–15 km,followed by a slower decrease and a minimum at thetropopause. The dehydration potential of the observed Ciis high. We have measured roughly 2 ppmv (at 18 km) ofwater condensed in the cloud particles. Simple microphys-ical argumentation, based on T-matrix computations, sug-gests that the observed ice particles had an average radiusaround 5 mm and were aspherical, with an aspect ratioranging from 0.5 to 0.7 (Luo et al., submitted manuscript,2002), in agreement with cold cirrus cloud observationsreported by Heymsfield [1986]. This implies a sedimenta-tion speed of about 1 km in 24 hours.[69] These observed Ci are extremely cold, and their
potential impact on radiative transfer may not be negligible.The estimated effective emissivity retrieved by Meteosat inthe thermal IR channel is of the order of 0.068 and, thesurface radiance in the area is equal to 11.6 Wm�2sr�1, butthe IR thermal radiance emitted in space was reduced,according to Table 1, by 10%.
7. Suggested Interpretations
[70] In this study we have described a data set, which isimportant in the context of the current discussion onformation and maintenance of cirrus clouds at the tropicaltropopause. Unfortunately the collected data are not enoughfor a complete and clear analysis, so only interpretationbased on the most likely explanation can be performedusing the existing literature and recent studies in this field.[71] In this section we summarize our speculations.It is
very likely that the thin cirrus was formed above the Cbs, ashas been observed in the past [Harris-Hobbs et al., 1990;Churchill and Houze, 1984b]. According to the existingliterature describing the mechanism of cirrus formation, wesuggest that the cirrus observed is most likely generated bya net water vapor transport, possibly consequence of aturbulence layer induced at the critical levels by inertia-gravity waves generated by the convective system at middlealtitudes.[72] The mechanism of high-altitude Ci formation cor-
roborates the new paradigm of a tropical tropopause layer(TTL) [Sherwood and Dessler, 2000] or ‘‘substratosphere’’[Thuburn and Craig, 2000], which is decoupled from theconvection-dominated lower troposphere. The formation ofcirrus, observed during the flight described in this paper, istherefore a consequence of local activity in the area of thewestern Indian Ocean, and does not require tropopause-penetrating Cbs.[73] This mechanism could have a significant impact on
the water vapor distribution in the tropical upper tropo-sphere, although this remains to be tested.[74] Furthermore, the radiative heating in the cloud could
drive a local temperature increase combined with upwardmotion of the cloud and turbulent motions in the cloud[Rosenfield et al., 1998]. This implies that cirrus at thetropopause could affect the lower stratospheric circulationthrough an upward vertical motion driven by diabaticheating [Gage et al., 1991]. These effects depend stronglyon the horizontal scale of the cirrus and on the temperature
lapse rate at the tropopause [Jensen et al., 1999]. While themagnitude of the radiative effect of this thin cirrus at thetropopause is locally very small when compared to thickercirrus cloud, taking into account their high aerial coverageand relatively high stability, they may significantly perturbthe heat budget near the tropopause.[75] Finally, thin cirrus at the tropopause can act as a
precursor of the subvisible cirrus observed very often duringAPE-THESEO, and in particular also of the ultrathintropical tropopause clouds described by Luo et al. (sub-mitted manuscript, 2002).
[76] Acknowledgments. This research has been performed in theframe of the APE-THESEO project supported by EU contractENV4CT970533, by the Italian Space Agency, by the U.K. NERC UTLSOzone Programme, by the German Bundesministerium fur Bildung undForschung within contract 01 LA 9829 and by INTAS grant YSF00-231.The authors wish to thank the ECMWF for the meteorology data providedthrough the NILU data center, EUMETSAT for the assistance providedduring the campaign and for the availability and the decryption of Meteosat5 high-resolution data used in this paper, and the U.K. Met Office, inparticular Peter Salter and Ian Cameron, for their professional and funda-mental meteorological support provided during the campaign. We thankBoris Lepukhov for in situ meteorological data measured by the M-55Geophysica. Furthermore, both the Geophysica and Falcon airplane team,and in particular the pilots, are greatly acknowledged. Finally, the authorswish to thank Gilbert Faure, Alain Volcere and all the personnel of thedirectorate of Seychelles civil aviation for their assistance and supportprovided during the campaign.
ReferencesAckerman, T. P., et al., Heating rates in tropical Anvils, J. Atmos Sci., 45,1606–1623, 1988.
Adriani, A., M. Viterbini, F. Cairo, S. Mandolini, and G. Di Donfrencesco,Multi wavelength Aerosol Scatterometer for airborne experiments tostudy the stratospheric particle optical properties, J. Atmos. OceanicTechnol., 16, 1328–1335, 1999.
Boehm, M. T., and J. Verlinde, Stratospheric influence on upper tropo-spheric tropical cirrus, Geophys. Res. Lett., 27, 3209–3212, 2000.
Brewer, A. W., Evidence for a world circulation provided by the measure-ments of helium and water vapour distribution in the stratosphere, Q. J. R.Meteorol. Soc., 75, 351–363, 1949.
Browell, E. V., A. F. Carter, S. T. Shipley, R. J. Allen, C. F. Butler, M. N.Mayo, J. H. Siviter Jr., and W. M. Hall, NASA Multipurpose AirborneDIAL system and measurements of ozone and aerosol profiles, Appl.Opt., 22, 522–534, 1983.
Churchill, D. D., and R. A. Houze, Mesoscale updraft magnitude and cloudice content deduced from the ice budget of the stratiform region of atropical cloud cluster, J. Atmos. Sci., 41, 1717–1725, 1984a.
Churchill, D. D., and R. A. Houze, Development and structure of wintermonsoon cloud cluster on 10 December 1978, J. Atmos. Sci., 41, 933–960, 1984b.
Churchill, D. D., and R. A. Houze, Radiatively driven stratosphere-tropo-sphere interaction near the tops of tropical cloud clusters, paper presentedat Conference on Cloud Physics, Am. Meteorol. Soc., San Francisco,Calif., 1990.
Danielsen, E., A dehydration mechanism for the stratosphere, Geophys.Res. Lett., 9, 605–608, 1982.
Desbois, M., G. Seze, and G. Szejwach, Automatic classification of cloudson Meteosat imagery: Application to high level clouds, J. Appl. Meteor-ol., 21, 401–412, 1982.
Ebert, E. E., and J. A. Curry, A parametrization of ice cloud optical proper-ties for climate models, J. Geophys. Res., 97, 3831–3836, 1992.
Folkins, I., M. Lowenstein, J. Podolske, S. J. Oltmans, and M. Proffitt, Abarrier to vertical mixing at 14 km in the tropics: Evidence from ozone-sondes and aircraft measurements, J. Geophys. Res., 104, 22,095–22,102, 1999.
Gage, K. S., J. R. McAfee, D. A. Carter, A. C. Riddle, G. C. Reid, and B. B.Balsley, Long term mean vertical motion over the tropical Pacific: Windprofiling Doppler radar measurements, Science, 254, 1771–1773, 1991.
Harris-Hobbs, R., D. Rusk, M. Bradford, and D. R. Booker, HAT cirrusnotes and observation, U.S. Army Strategic Command, Huntsville, Ala.,1990.
Heymsfield, A. J., Ice particles observed in a cirriform cloud at �83 C andimplication for polar stratospheric clouds, J. Atmos. Sci., 43, 851–855,1986.
SANTACESARIA ET AL.: CLOUDS AT THE TROPICAL TROPOPAUSE AAC 1 - 13
Holton, J. R., P. H. Haynes, M. E. McIntyre, A. R. Douglass, R. B. Rood,and L. Pfister, Stratosphere-troposphere exchange, Rev. Geophys., 33,403–439, 1995.
Houze, R. A., Observed structure of mesoscale convective systems andimplications for large scale heating, Q. J. R. Meteorol. Soc., 115, 425–432, 1989.
Jensen, E. J., O. B. Toon, D. L. Westphal, S. Kinne, and A. J. Heymsfield,Microphysical modelling of cirrus, 1, Comparison with 1986 FIRE IFOmeasurements, J. Geophys. Res., 10,421–10,442, 1994.
Jensen, E., O. W. Toon, L. Pfister, and H. B. Selkirk, Dehydration of theupper troposphere and lower stratosphere by subvisible cirrus clouds nearthe tropical tropopause, Geophys. Res. Lett., 23, 825–828, 1996a.
Jensen, E. J., O. B. Toon, H. B. Selkirk, J. D. Spinhirne, and M. R.Schoeberl, On the formation and persistence of subvisible cirrus cloudsnear the tropical tropopause, J. Geophys. Res., 101, 21,361–21,375,1996b.
Jensen, E. J., W. G. Read, J. Mergenthaler, B. J. Sandor, L. Pfister, andA. Tabazadeh, High humidity and subvisible clouds near the tropicaltropopause, Geophys. Res. Lett., 26, 2347–2350, 1999.
Johnson, R., and D. Kriete, Thermodynamic circulation characteristics ofthe winter monsoon tropical mesoscal convection, Mon. Weather Rev.,110, 1898–1911, 1982.
Liou, K. N., On the radiative properties of cirrus in the window region andtheir influence on remote sensing of the atmosphere, J. Atmos. Sci., 31,522–532, 1974.
McFarquhar, G. M., A. Heymesfield, J. Spinhirne, and B. Hart, Thin andsubvisible tropopause cirrus: Observations and radiative impacts, J. At-mos. Sci., 57, 1841–1853, 2000.
Merkulov, S., and V. Yushkov, Some results of aircraft stratospheric watervapor measurement in the arctic polar vortex (in Russian), Meteorol.Hydrol., 7, 107–113, 1999.
Nee, J. B., C. N. Len, W. N. Chen, and C. I. Lin, Lidar observation of thecirrus cloud in the tropopause at Chung-Li (25�N, 121�E), J. Atmos. Sci.,55, 1977–1996, 1998.
Newell, R. E., and S. Gould Stewart, A stratospheric fountain?, J. Atmos.Sci., 38, 2789–2795, 1981.
Pfister, L., K. R. Chan, T. P. Bui, S. Bowen, M. Legg, B. Gary, K. Kelly,M. Proffitt, and W. Starr, Gravity waves generated by a tropical cycloneduring the STEP tropical field program: A case study, J. Geophys. Res.,98, 8611–8638, 1993.
Pfister, L., et al., Aircraft observations of thin cirrus clouds near the tropicaltropopause, J. Geophys. Res., 106, 9765–9786, 2001.
Piani, C., D. Durran, M. J. Alexander, and J. R. Holton, A numerical studyof three dimensional gravity waves triggered by deep tropical convectionand their role in the dynamics of the QBO, J. Atmos. Sci., 57, 3689–3702, 2000.
Platt, C. M. R., S. A. Young, P. J. Mason, G. R. Patterson, S. C. Marsden,and R. T. Austin, The optical properties of equatorial cirrus from obser-vation in the ARM pilot radiation observation experiment, J. Atmos. Sci.,55, 1977–1996, 1998.
Potter, B., and J. Holton, The role of monsoon convection in the dehydra-tion of the lower tropical stratosphere, J. Atmos. Sci., 52, 1034–1050,1995.
Rosenfield, J. E., D. B. Considine, M. R. Schoeberl, and E. V. Browell, Theimpact of subvisible cirrus clouds near the tropical tropopause on strato-spheric water vapor, Geophys. Res. Lett., 25, 1883–1886, 1998.
Sassen, K., and B. S. Cho, Subvisual-thin cirrus lidar data set for satelliteverification and climatological research, J. Appl. Meteorol., 31, 1275–1285, 1992.
Sassen, K., and K. N. Lou, Scattering of polarized laser light by waterdroplet, mixed phase and ice clouds, II, J. Atmos. Sci., 36, 852–861, 1979.
Sherwood, S. C., and A. E. Dessler, On the control of stratospheric humid-ity, Geophys. Res. Lett., 27, 2513–2516, 2000.
Starr, D. O’C., and S. K. Cox, Cirrus clouds, part I, A cirrus cloud model,J. Atmos. Sci., 42, 2663–2681, 1985.
Szejwach, G., Determination of semi-transparent cirrus cloud temperaturefrom infrared radiances: Application to Meteosat, J. Appl. Meteorol., 21,348–393, 1982.
Teitelbaum, H., M. Moustaoui, R. Sadourny, and F. Lott, Critical levels andmixing layers induced by convectively generated gravity waves duringCEPEX, Q. J. R. Meteorol. Soc., 125, 1715–1734, 1999.
Thomas, A., et al., In situ measurements of background aerosol and sub-visible cirrus in the tropical tropopause region, J. Geophys. Res.,107(D24), 4763, doi:10.1029/2001JD001385, 2002.
Thuburn, J., and G. C. Craig, Stratospheric influence on tropopause height:The radiative constraint, J. Atmos. Sci., 57, 17–28, 2000.
Tsuda, T., Y. Murayama, H. Wiryosumarto, S. W. B. Harijono, and S. Kato,Radiosonde observation of equatorial atmosphere dynamics over Indone-sia, 2, Characteristic of gravity waves, J. Geophys. Res., 99, 10,507–10,516, 1994.
Tuck, A. F., et al., The Brewer-Dobson circulation in the light of highaltitude in situ aircraft observations, Q. J. R. Meteorol. Soc., 123, 1–69, 1997.
Winker, D. M., and C. R. Trepte, Laminar cirrus observed near the tropicaltropopause by LITE, Geophys. Res. Lett., 25, 3351–3354, 1998.
Wirth, M., and W. Renger, Evidence of large scale ozone depletion withinthe arctic polar vortex 94/95 based on airborne LIDAR measurements,Geophys. Res. Lett., 23, 813–816, 1996.
Yushkov, V., A. Oulanovsky, N. Lechenuk, I. Rudakov, L. Stefanutti,F. Ravegnani, U. Bonafe, and T. Georgiadis, A chemiluminescent analy-zer for stratospheric measurements of the ozone concentration (FOZAN),J. Atmos. Oceanic Technol., 16, 1344–1349, 1999.
Zoger, M., et al., Fast in situ hygrometers: A new family of balloonborneand airborne Lyman-a photofragment fluorescence hygrometers, J. Geo-phys. Res., 104, 1807–1816, 1999.
�����������������������A. Adriani, F. Cairo, and G. Didonfrancesco, ISAC-CNR, Via Fosso del
Cavaliere, 00133 Roma, Italy.S. Balestri, APE srl, Via Jacopo Nardi 65, 50127 Firenze, Italy.J. Beuermann and C. Schiller, Forschungszentrum Julich, D-52425
Julich, Germany.R. Carla, IFAC-CNR, Via Panciatichi 64, 50127 Firenze, Italy.C. Kiemle, Deutsches Zentrum fur Luft- und Raumfahrt (DLR),
Oberpfaffenhofen, 82234 Wessling, Germany.B. Luo, T. Peter, and H. Wernli, Institute for Atmospheric and Climate
Science, ETH-Hoenggerberg, CH-8093 Zurich, Switzerland.R. MacKenzie, Environmental Science Department, Lancaster University,
Lancaster, LA1 4YQ, UK.F. Ravegnani, ISAC-CNR, Via Gobetti 101, 40129 Bologna, Italy.G. Redaelli, Dipartimento di Fisica, Universita’ Dell’Aquila, Via Vetoio,
67010 Coppito (AQ), Italy.V. Santacesaria, Advanced Computer System SpA, Via Della Bufalotta
378, 00139 Roma, Italy.N. Sitnikov, A. Ulanovsky, and V. Yushkov, CAO, Pervomayskaya 3,
Dolgoprudny, Moscow region 141700, Russia.L. Stefanutti, Geophysica-GEIE, Via Pancaldo 21, 50127 Firenze, Italy.
AAC 1 - 14 SANTACESARIA ET AL.: CLOUDS AT THE TROPICAL TROPOPAUSE
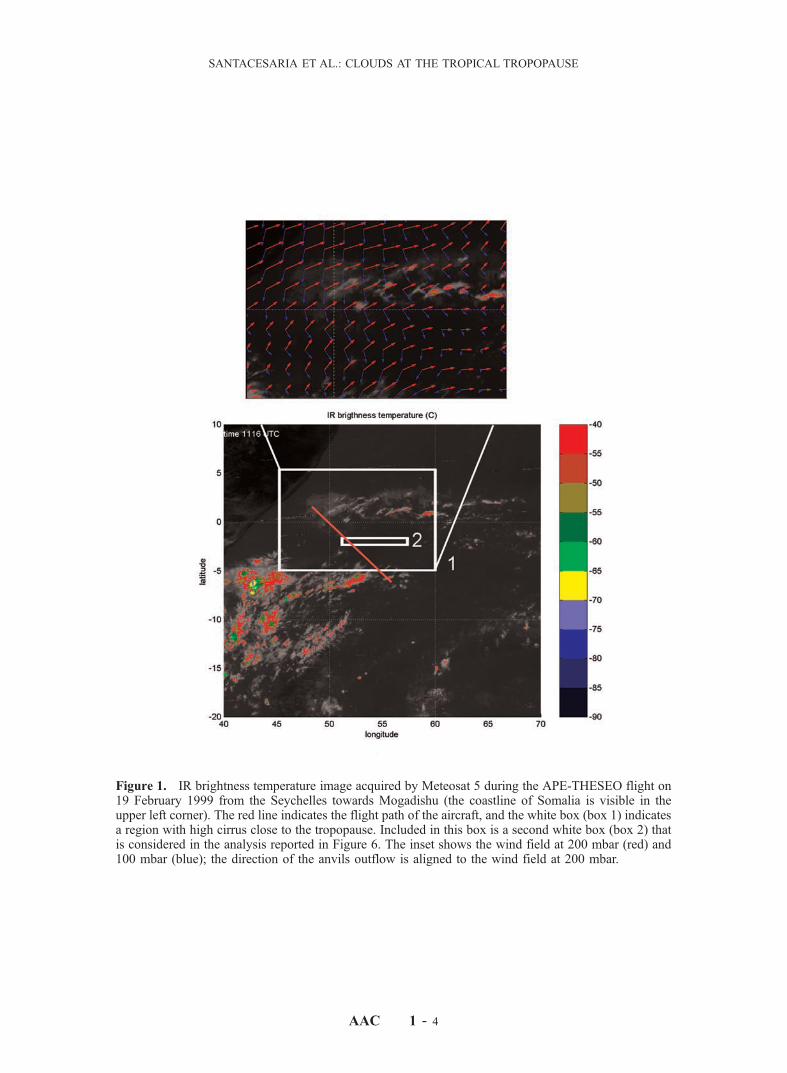
Figure 1. IR brightness temperature image acquired by Meteosat 5 during the APE-THESEO flight on19 February 1999 from the Seychelles towards Mogadishu (the coastline of Somalia is visible in theupper left corner). The red line indicates the flight path of the aircraft, and the white box (box 1) indicatesa region with high cirrus close to the tropopause. Included in this box is a second white box (box 2) thatis considered in the analysis reported in Figure 6. The inset shows the wind field at 200 mbar (red) and100 mbar (blue); the direction of the anvils outflow is aligned to the wind field at 200 mbar.
SANTACESARIA ET AL.: CLOUDS AT THE TROPICAL TROPOPAUSE
AAC 1 - 4
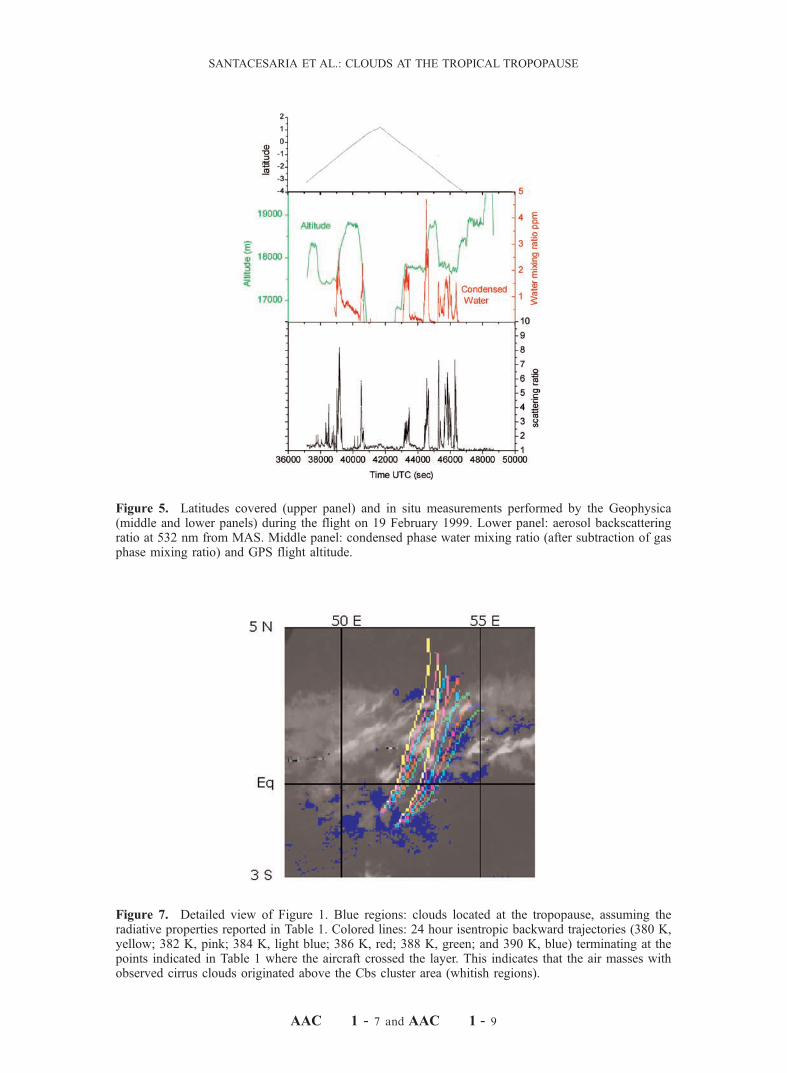
Figure 5. Latitudes covered (upper panel) and in situ measurements performed by the Geophysica(middle and lower panels) during the flight on 19 February 1999. Lower panel: aerosol backscatteringratio at 532 nm from MAS. Middle panel: condensed phase water mixing ratio (after subtraction of gasphase mixing ratio) and GPS flight altitude.
Figure 7. Detailed view of Figure 1. Blue regions: clouds located at the tropopause, assuming theradiative properties reported in Table 1. Colored lines: 24 hour isentropic backward trajectories (380 K,yellow; 382 K, pink; 384 K, light blue; 386 K, red; 388 K, green; and 390 K, blue) terminating at thepoints indicated in Table 1 where the aircraft crossed the layer. This indicates that the air masses withobserved cirrus clouds originated above the Cbs cluster area (whitish regions).
AAC 1 - 7 and AAC 1 - 9
SANTACESARIA ET AL.: CLOUDS AT THE TROPICAL TROPOPAUSE
Related Documents