Atmos. Meas. Tech., 12, 2019–2031, 2019 https://doi.org/10.5194/amt-12-2019-2019 © Author(s) 2019. This work is distributed under the Creative Commons Attribution 4.0 License. Cloud products from the Earth Polychromatic Imaging Camera (EPIC): algorithms and initial evaluation Yuekui Yang 1 , Kerry Meyer 1 , Galina Wind 2,1 , Yaping Zhou 3,1 , Alexander Marshak 1 , Steven Platnick 1 , Qilong Min 4 , Anthony B. Davis 5 , Joanna Joiner 1 , Alexander Vasilkov 2 , David Duda 2,6 , and Wenying Su 6 1 NASA Goddard Space Flight Center, Greenbelt, MD, USA 2 Science Systems and Applications Inc., Lanham, MD, USA 3 Goddard Earth Sciences Technology and Research, Morgan State University, Baltimore, MD, USA 4 Atmospheric Sciences Research Center, State University of New York at Albany, Albany, NY, USA 5 Jet Propulsion Laboratory, California Institute of Technology, Pasadena, CA, USA 6 NASA Langley Research Center, Hampton, VA, USA Correspondence: Yuekui Yang ([email protected]) Received: 18 September 2018 – Discussion started: 13 November 2018 Revised: 10 February 2019 – Accepted: 11 March 2019 – Published: 29 March 2019 Abstract. This paper presents the physical basis of the Earth Polychromatic Imaging Camera (EPIC) cloud product algo- rithms and an initial evaluation of their performance. Since June 2015, EPIC has been providing observations of the sun- lit side of the Earth with its 10 spectral channels ranging from the UV to the near-infrared. A suite of algorithms has been developed to generate the standard EPIC Level 2 cloud prod- ucts that include cloud mask, cloud effective pressure/height, and cloud optical thickness. The EPIC cloud mask adopts the threshold method and utilizes multichannel observations and ratios as tests. Cloud effective pressure/height is derived with observations from the O 2 A-band (780 and 764 nm) and B-band (680 and 688 nm) pairs. The EPIC cloud opti- cal thickness retrieval adopts a single-channel approach in which the 780 and 680 nm channels are used for retrievals over ocean and over land, respectively. Comparison with co-located cloud retrievals from geosynchronous earth orbit (GEO) and low earth orbit (LEO) satellites shows that the EPIC cloud product algorithms are performing well and are consistent with theoretical expectations. These products are publicly available at the Atmospheric Science Data Center at the NASA Langley Research Center for climate studies and for generating other geophysical products that require cloud properties as input. 1 Introduction Since June 2015, the Earth Polychromatic Imaging Cam- era (EPIC) aboard the Deep Space Climate Observatory (DSCOVR) has been providing observations of the sunlit side of the Earth at the L1 Lagrangian point approximately 1.5 million km from the Earth. The simultaneous coverage of the Earth from sunrise to sunset is a capability not pre- viously available from any other spacecraft or Earth observ- ing platform. These observations provide new opportunities in climate research and applications (e.g., Marshak et al., 2018; Holdaway and Yang, 2016a, b). One important con- tribution of EPIC is the ability to observe and retrieve key radiative properties of clouds, which are of critical impor- tance for understanding the current climate system and for predicting climate change (e.g., Boucher et al., 2013, and references therein). The Decadal Survey for Earth Science and Applications from Space (National Academies of Sci- ences, Engineering, and Medicine, 2018) lists “how chang- ing cloud cover and precipitation will affect climate, weather, and Earth’s energy balance in the future” as one of the key science questions and places the observation of clouds and precipitation on the priority list. Equipped with 10 spectral channels ranging from the UV to the near-infrared, EPIC observations provide essential information for cloud system monitoring and cloud product development. Published by Copernicus Publications on behalf of the European Geosciences Union.

Welcome message from author
This document is posted to help you gain knowledge. Please leave a comment to let me know what you think about it! Share it to your friends and learn new things together.
Transcript
Atmos. Meas. Tech., 12, 2019–2031, 2019https://doi.org/10.5194/amt-12-2019-2019© Author(s) 2019. This work is distributed underthe Creative Commons Attribution 4.0 License.
Cloud products from the Earth Polychromatic Imaging Camera(EPIC): algorithms and initial evaluationYuekui Yang1, Kerry Meyer1, Galina Wind2,1, Yaping Zhou3,1, Alexander Marshak1, Steven Platnick1, Qilong Min4,Anthony B. Davis5, Joanna Joiner1, Alexander Vasilkov2, David Duda2,6, and Wenying Su6
1NASA Goddard Space Flight Center, Greenbelt, MD, USA2Science Systems and Applications Inc., Lanham, MD, USA3Goddard Earth Sciences Technology and Research, Morgan State University, Baltimore, MD, USA4Atmospheric Sciences Research Center, State University of New York at Albany, Albany, NY, USA5Jet Propulsion Laboratory, California Institute of Technology, Pasadena, CA, USA6NASA Langley Research Center, Hampton, VA, USA
Correspondence: Yuekui Yang ([email protected])
Received: 18 September 2018 – Discussion started: 13 November 2018Revised: 10 February 2019 – Accepted: 11 March 2019 – Published: 29 March 2019
Abstract. This paper presents the physical basis of the EarthPolychromatic Imaging Camera (EPIC) cloud product algo-rithms and an initial evaluation of their performance. SinceJune 2015, EPIC has been providing observations of the sun-lit side of the Earth with its 10 spectral channels ranging fromthe UV to the near-infrared. A suite of algorithms has beendeveloped to generate the standard EPIC Level 2 cloud prod-ucts that include cloud mask, cloud effective pressure/height,and cloud optical thickness. The EPIC cloud mask adoptsthe threshold method and utilizes multichannel observationsand ratios as tests. Cloud effective pressure/height is derivedwith observations from the O2 A-band (780 and 764 nm)and B-band (680 and 688 nm) pairs. The EPIC cloud opti-cal thickness retrieval adopts a single-channel approach inwhich the 780 and 680 nm channels are used for retrievalsover ocean and over land, respectively. Comparison withco-located cloud retrievals from geosynchronous earth orbit(GEO) and low earth orbit (LEO) satellites shows that theEPIC cloud product algorithms are performing well and areconsistent with theoretical expectations. These products arepublicly available at the Atmospheric Science Data Center atthe NASA Langley Research Center for climate studies andfor generating other geophysical products that require cloudproperties as input.
1 Introduction
Since June 2015, the Earth Polychromatic Imaging Cam-era (EPIC) aboard the Deep Space Climate Observatory(DSCOVR) has been providing observations of the sunlitside of the Earth at the L1 Lagrangian point approximately1.5 million km from the Earth. The simultaneous coverageof the Earth from sunrise to sunset is a capability not pre-viously available from any other spacecraft or Earth observ-ing platform. These observations provide new opportunitiesin climate research and applications (e.g., Marshak et al.,2018; Holdaway and Yang, 2016a, b). One important con-tribution of EPIC is the ability to observe and retrieve keyradiative properties of clouds, which are of critical impor-tance for understanding the current climate system and forpredicting climate change (e.g., Boucher et al., 2013, andreferences therein). The Decadal Survey for Earth Scienceand Applications from Space (National Academies of Sci-ences, Engineering, and Medicine, 2018) lists “how chang-ing cloud cover and precipitation will affect climate, weather,and Earth’s energy balance in the future” as one of the keyscience questions and places the observation of clouds andprecipitation on the priority list. Equipped with 10 spectralchannels ranging from the UV to the near-infrared, EPICobservations provide essential information for cloud systemmonitoring and cloud product development.
Published by Copernicus Publications on behalf of the European Geosciences Union.
2020 Y. Yang et al.: Cloud products from the Earth Polychromatic Imaging Camera (EPIC)
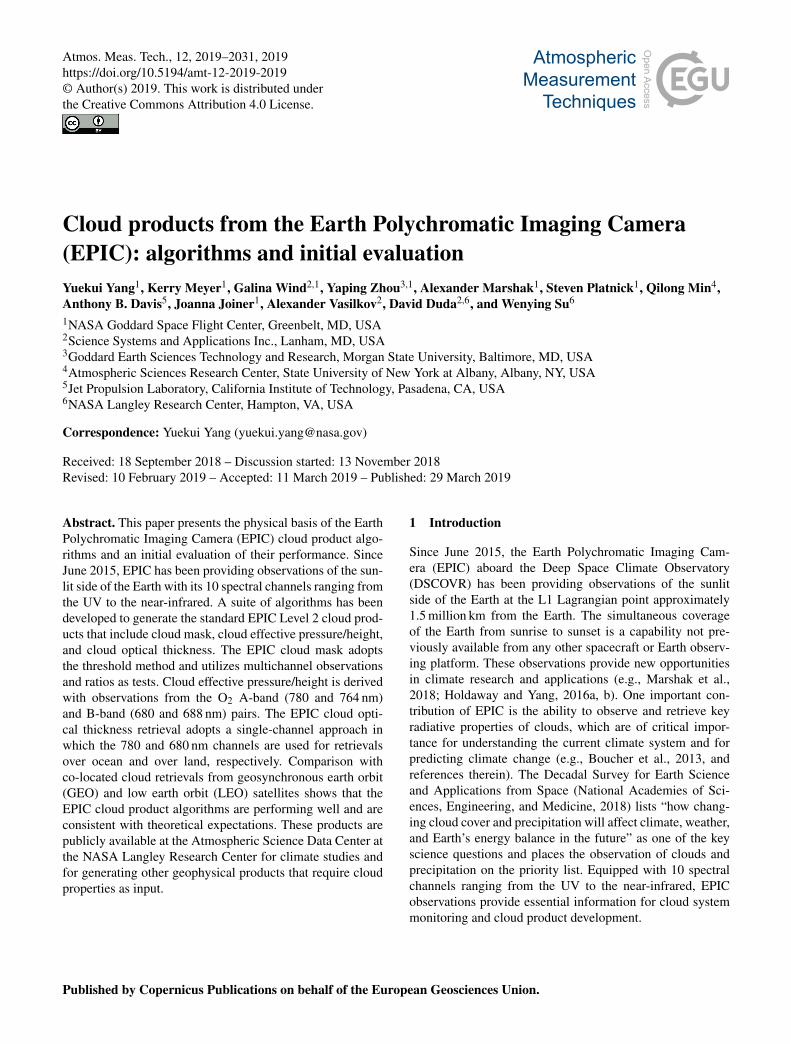
Figure 1. Observation time from the start of acquisition for eachEPIC channel starting from 443 nm. Red dots are the channels usedfor cloud retrievals. It takes about 7 min to complete the 10-channelimage set.
The focal plane of the EPIC system is a2048 pixel× 2048 pixel CCD array. The point spreadfunction of the CCD array has a full width at half maximum(FWHM) of ∼ 1.34 pixels. Images for the 10 spectralchannels are obtained using a 10-color filter wheel assemblyand shutter, the operation of which takes about 7 min toacquire a complete set of observations. As shown in Fig. 1,the observation starts with the 443 nm channel, followedby the 551, 688, 680, 764, 780, 388, 340, 325, and 317 nmchannels. The time difference between one channel and thenext consists of readout, exposure, and filter rotation time.Limited by data transmission capability, only the 443 nmchannel image is downlinked at its original size; the rest areall reduced to 1024 pixels× 1024 pixels through onboardprocessing and then interpolated back to the full size of2048 pixels× 2048 pixels after being downlinked. As canbe seen from Fig. 1, the observation time difference betweenone channel and the next is usually half a minute, exceptbetween the 443 and 551 nm, which is ∼ 3 min. At fullresolution, the pixel size of EPIC observations is ∼ 8 kmat nadir. For view zenith angle (VZA) > 0, the EPIC pixelsbecome elliptical, whereby the longer axis increases by afactor of about 1/cos(VZA) and the shorter axis remains∼ 8 km.
Due to the latency between imaging different wavelengthsand the rotation of the Earth, the regions covered by the im-ages of the 10 EPIC spectral channels are not exactly thesame. For algorithm development and research, all 10 spec-tral channels are projected to a common grid in the Level-1B(L1B) radiance product. The projection procedure includes(see details in Marshak et al., 2018) (1) mapping the imagesto a 3-D model of the Earth in order to calculate the geolo-cation of each pixel and (2) projecting and regridding eachimage onto the common reference grid.
A suite of algorithms has been developed for generatingthe standard EPIC Level 2 cloud products that include cloud
mask, cloud effective pressure/height (CEP/CEH), and cloudoptical thickness (COT). These algorithms use as input theobservations from five EPIC channels, namely the 388 nmand the two pairs of O2 A-band (780 and 764 nm) and B-band (680 and 688 nm) reference and absorption channels.These observations provide the most cloud information con-tent and are close to each other in observation time, whichis important for reducing uncertainties resulting from tempo-ral changes in clouds and the rotation of the Earth. Table 1gives a summary of the EPIC L2 cloud products. These prod-ucts, which are publicly available at the Atmospheric ScienceData Centre at the NASA Langley Research Center, providecloud properties of the sunlit side of Earth and are being usedin applications such as cloud screening for aerosol propertyretrievals, ocean color studies, and trace gas retrieval correc-tions.
The remainder of the paper is organized as follows: Sect. 2presents the algorithm theoretical basis for the standard EPICL2 cloud products; Sect. 3 presents an initial assessment ofthe performance of these products through comparison withresults from co-located geosynchronous earth orbit (GEO)and low earth orbit (LEO) observations; a summary and dis-cussions are presented in Sect. 4.
2 EPIC cloud product algorithms
The three components of the EPIC cloud product system,cloud mask, CEP/CEH retrieval, and COT retrieval are runindependently. The EPIC cloud mask serves as input to boththe CEP/CEH and COT retrievals, for which only pixels clas-sified as cloudy are processed.
2.1 EPIC cloud mask algorithm
The basis for cloud detection is the contrast between cloudand the background surface. To separate cloudy and clearpixels, satellite missions usually adopt the threshold method,which classifies a pixel through comparing the values of anobserved quantity, such as the bidirectional reflectance fac-tor (BRF), to a predefined threshold (e.g., Ackerman et al.,2010; Yang et al., 2007; Rossow and Garder, 1993). More-over, multiple thresholds can be defined such that the cloudmask is assigned a confidence level. Similarly, the goal ofthe EPIC cloud mask is to label each pixel as clear with highconfidence, clear with low confidence, cloudy with low con-fidence, or cloudy with high confidence. Because EPIC ob-servations are limited to the shortwave channels, the widelyused infrared-based tests (e.g., temperature contrast) are notavailable. However, effective tests can still be constructed.To do that, the Earth’s surface is separated into three types:land, ocean, and snow/ice; two tests are applied to each sur-face type. Table 2 lists the EPIC cloud detection tests usedfor each surface type.
Atmos. Meas. Tech., 12, 2019–2031, 2019 www.atmos-meas-tech.net/12/2019/2019/
Y. Yang et al.: Cloud products from the Earth Polychromatic Imaging Camera (EPIC) 2021
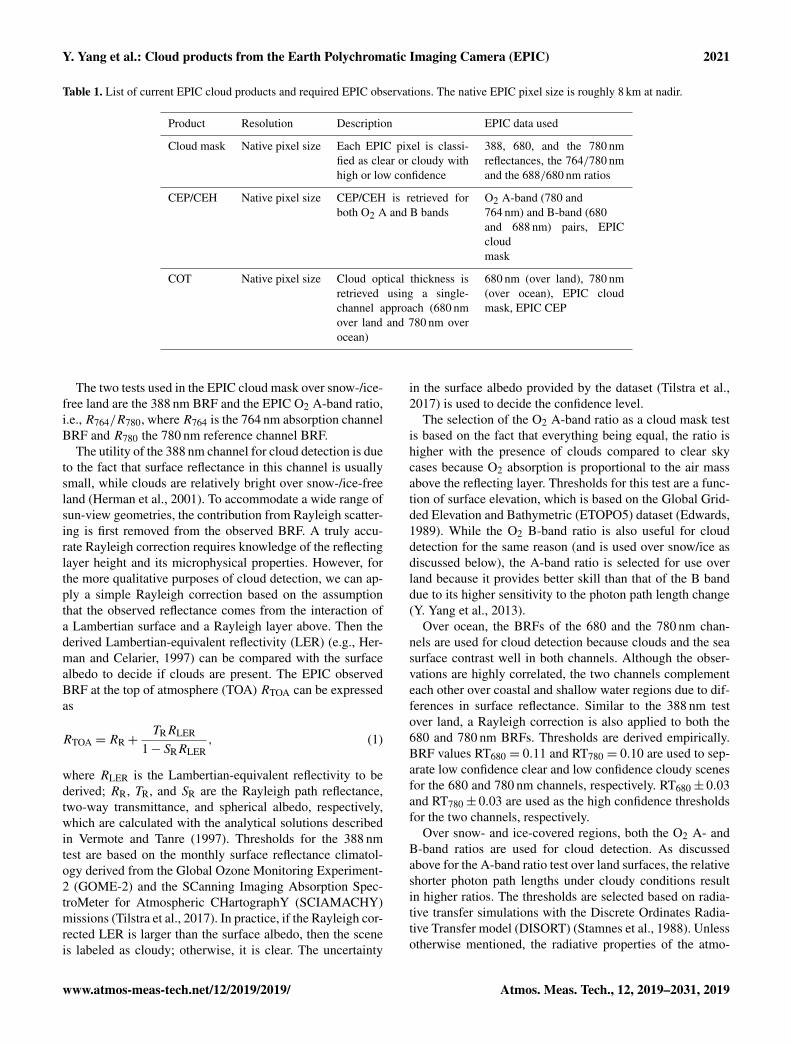
Table 1. List of current EPIC cloud products and required EPIC observations. The native EPIC pixel size is roughly 8 km at nadir.
Product Resolution Description EPIC data used
Cloud mask Native pixel size Each EPIC pixel is classi-fied as clear or cloudy withhigh or low confidence
388, 680, and the 780 nmreflectances, the 764/780 nmand the 688/680 nm ratios
CEP/CEH Native pixel size CEP/CEH is retrieved forboth O2 A and B bands
O2 A-band (780 and764 nm) and B-band (680and 688 nm) pairs, EPICcloudmask
COT Native pixel size Cloud optical thickness isretrieved using a single-channel approach (680 nmover land and 780 nm overocean)
680 nm (over land), 780 nm(over ocean), EPIC cloudmask, EPIC CEP
The two tests used in the EPIC cloud mask over snow-/ice-free land are the 388 nm BRF and the EPIC O2 A-band ratio,i.e., R764/R780, where R764 is the 764 nm absorption channelBRF and R780 the 780 nm reference channel BRF.
The utility of the 388 nm channel for cloud detection is dueto the fact that surface reflectance in this channel is usuallysmall, while clouds are relatively bright over snow-/ice-freeland (Herman et al., 2001). To accommodate a wide range ofsun-view geometries, the contribution from Rayleigh scatter-ing is first removed from the observed BRF. A truly accu-rate Rayleigh correction requires knowledge of the reflectinglayer height and its microphysical properties. However, forthe more qualitative purposes of cloud detection, we can ap-ply a simple Rayleigh correction based on the assumptionthat the observed reflectance comes from the interaction ofa Lambertian surface and a Rayleigh layer above. Then thederived Lambertian-equivalent reflectivity (LER) (e.g., Her-man and Celarier, 1997) can be compared with the surfacealbedo to decide if clouds are present. The EPIC observedBRF at the top of atmosphere (TOA) RTOA can be expressedas
RTOA = RR+TRRLER
1− SRRLER, (1)
where RLER is the Lambertian-equivalent reflectivity to bederived; RR, TR, and SR are the Rayleigh path reflectance,two-way transmittance, and spherical albedo, respectively,which are calculated with the analytical solutions describedin Vermote and Tanre (1997). Thresholds for the 388 nmtest are based on the monthly surface reflectance climatol-ogy derived from the Global Ozone Monitoring Experiment-2 (GOME-2) and the SCanning Imaging Absorption Spec-troMeter for Atmospheric CHartographY (SCIAMACHY)missions (Tilstra et al., 2017). In practice, if the Rayleigh cor-rected LER is larger than the surface albedo, then the sceneis labeled as cloudy; otherwise, it is clear. The uncertainty
in the surface albedo provided by the dataset (Tilstra et al.,2017) is used to decide the confidence level.
The selection of the O2 A-band ratio as a cloud mask testis based on the fact that everything being equal, the ratio ishigher with the presence of clouds compared to clear skycases because O2 absorption is proportional to the air massabove the reflecting layer. Thresholds for this test are a func-tion of surface elevation, which is based on the Global Grid-ded Elevation and Bathymetric (ETOPO5) dataset (Edwards,1989). While the O2 B-band ratio is also useful for clouddetection for the same reason (and is used over snow/ice asdiscussed below), the A-band ratio is selected for use overland because it provides better skill than that of the B banddue to its higher sensitivity to the photon path length change(Y. Yang et al., 2013).
Over ocean, the BRFs of the 680 and the 780 nm chan-nels are used for cloud detection because clouds and the seasurface contrast well in both channels. Although the obser-vations are highly correlated, the two channels complementeach other over coastal and shallow water regions due to dif-ferences in surface reflectance. Similar to the 388 nm testover land, a Rayleigh correction is also applied to both the680 and 780 nm BRFs. Thresholds are derived empirically.BRF values RT680 = 0.11 and RT780 = 0.10 are used to sep-arate low confidence clear and low confidence cloudy scenesfor the 680 and 780 nm channels, respectively. RT680± 0.03and RT780± 0.03 are used as the high confidence thresholdsfor the two channels, respectively.
Over snow- and ice-covered regions, both the O2 A- andB-band ratios are used for cloud detection. As discussedabove for the A-band ratio test over land surfaces, the relativeshorter photon path lengths under cloudy conditions resultin higher ratios. The thresholds are selected based on radia-tive transfer simulations with the Discrete Ordinates Radia-tive Transfer model (DISORT) (Stamnes et al., 1988). Unlessotherwise mentioned, the radiative properties of the atmo-
www.atmos-meas-tech.net/12/2019/2019/ Atmos. Meas. Tech., 12, 2019–2031, 2019
2022 Y. Yang et al.: Cloud products from the Earth Polychromatic Imaging Camera (EPIC)
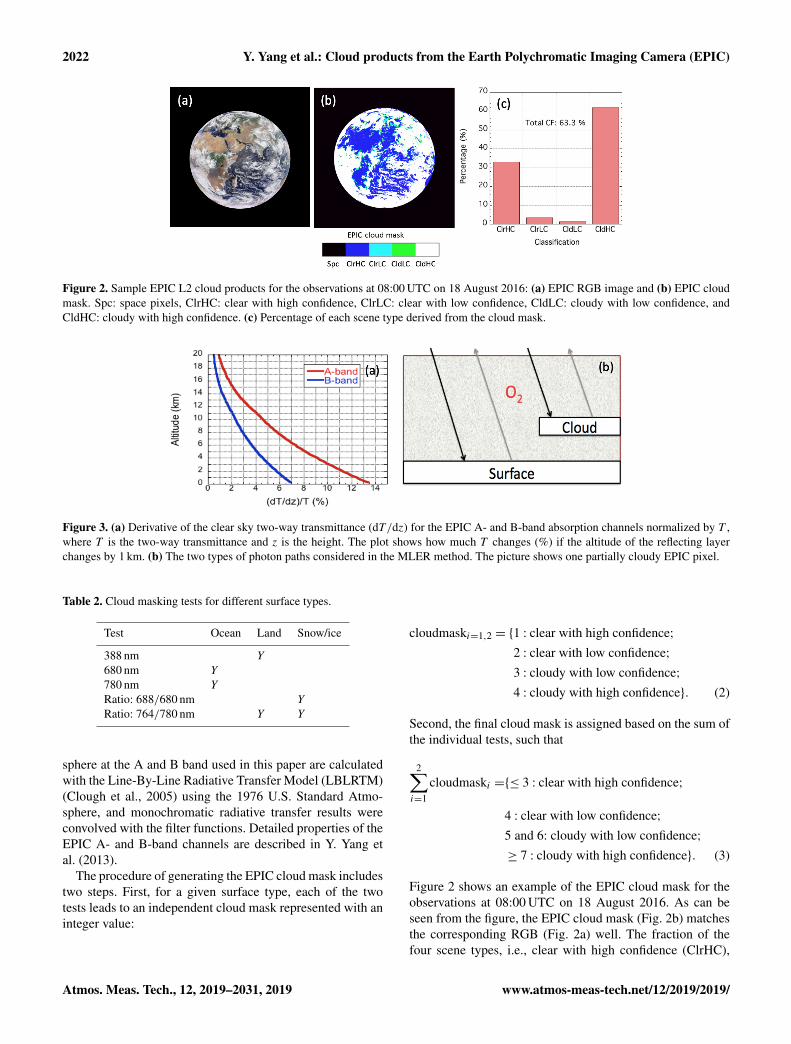
Figure 2. Sample EPIC L2 cloud products for the observations at 08:00 UTC on 18 August 2016: (a) EPIC RGB image and (b) EPIC cloudmask. Spc: space pixels, ClrHC: clear with high confidence, ClrLC: clear with low confidence, CldLC: cloudy with low confidence, andCldHC: cloudy with high confidence. (c) Percentage of each scene type derived from the cloud mask.
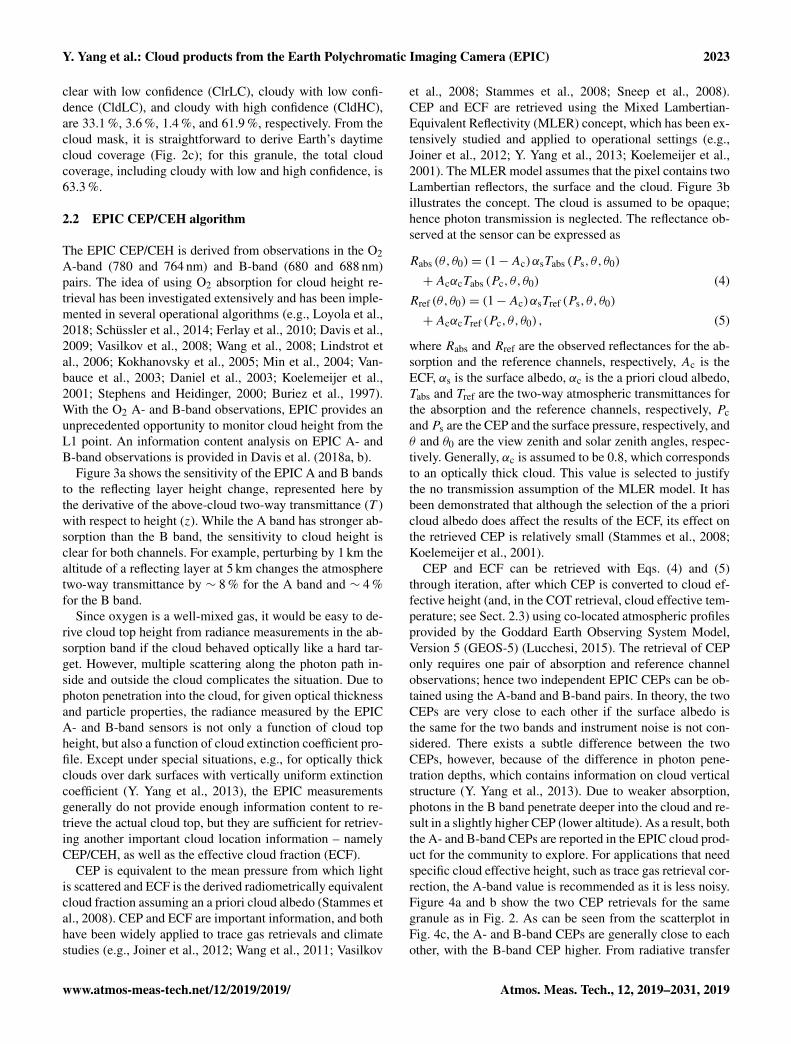
Figure 3. (a) Derivative of the clear sky two-way transmittance (dT/dz) for the EPIC A- and B-band absorption channels normalized by T ,where T is the two-way transmittance and z is the height. The plot shows how much T changes (%) if the altitude of the reflecting layerchanges by 1 km. (b) The two types of photon paths considered in the MLER method. The picture shows one partially cloudy EPIC pixel.
Table 2. Cloud masking tests for different surface types.
Test Ocean Land Snow/ice
388 nm Y
680 nm Y
780 nm Y
Ratio: 688/680 nm Y
Ratio: 764/780 nm Y Y
sphere at the A and B band used in this paper are calculatedwith the Line-By-Line Radiative Transfer Model (LBLRTM)(Clough et al., 2005) using the 1976 U.S. Standard Atmo-sphere, and monochromatic radiative transfer results wereconvolved with the filter functions. Detailed properties of theEPIC A- and B-band channels are described in Y. Yang etal. (2013).
The procedure of generating the EPIC cloud mask includestwo steps. First, for a given surface type, each of the twotests leads to an independent cloud mask represented with aninteger value:
cloudmaski=1,2 = {1 : clear with high confidence;2 : clear with low confidence;3 : cloudy with low confidence;4 : cloudy with high confidence}. (2)
Second, the final cloud mask is assigned based on the sum ofthe individual tests, such that
2∑i=1
cloudmaski ={≤ 3 : clear with high confidence;
4 : clear with low confidence;5 and 6: cloudy with low confidence;≥ 7 : cloudy with high confidence}. (3)
Figure 2 shows an example of the EPIC cloud mask for theobservations at 08:00 UTC on 18 August 2016. As can beseen from the figure, the EPIC cloud mask (Fig. 2b) matchesthe corresponding RGB (Fig. 2a) well. The fraction of thefour scene types, i.e., clear with high confidence (ClrHC),
Atmos. Meas. Tech., 12, 2019–2031, 2019 www.atmos-meas-tech.net/12/2019/2019/
Y. Yang et al.: Cloud products from the Earth Polychromatic Imaging Camera (EPIC) 2023
clear with low confidence (ClrLC), cloudy with low confi-dence (CldLC), and cloudy with high confidence (CldHC),are 33.1 %, 3.6 %, 1.4 %, and 61.9 %, respectively. From thecloud mask, it is straightforward to derive Earth’s daytimecloud coverage (Fig. 2c); for this granule, the total cloudcoverage, including cloudy with low and high confidence, is63.3 %.
2.2 EPIC CEP/CEH algorithm
The EPIC CEP/CEH is derived from observations in the O2A-band (780 and 764 nm) and B-band (680 and 688 nm)pairs. The idea of using O2 absorption for cloud height re-trieval has been investigated extensively and has been imple-mented in several operational algorithms (e.g., Loyola et al.,2018; Schüssler et al., 2014; Ferlay et al., 2010; Davis et al.,2009; Vasilkov et al., 2008; Wang et al., 2008; Lindstrot etal., 2006; Kokhanovsky et al., 2005; Min et al., 2004; Van-bauce et al., 2003; Daniel et al., 2003; Koelemeijer et al.,2001; Stephens and Heidinger, 2000; Buriez et al., 1997).With the O2 A- and B-band observations, EPIC provides anunprecedented opportunity to monitor cloud height from theL1 point. An information content analysis on EPIC A- andB-band observations is provided in Davis et al. (2018a, b).
Figure 3a shows the sensitivity of the EPIC A and B bandsto the reflecting layer height change, represented here bythe derivative of the above-cloud two-way transmittance (T )with respect to height (z). While the A band has stronger ab-sorption than the B band, the sensitivity to cloud height isclear for both channels. For example, perturbing by 1 km thealtitude of a reflecting layer at 5 km changes the atmospheretwo-way transmittance by ∼ 8 % for the A band and ∼ 4 %for the B band.
Since oxygen is a well-mixed gas, it would be easy to de-rive cloud top height from radiance measurements in the ab-sorption band if the cloud behaved optically like a hard tar-get. However, multiple scattering along the photon path in-side and outside the cloud complicates the situation. Due tophoton penetration into the cloud, for given optical thicknessand particle properties, the radiance measured by the EPICA- and B-band sensors is not only a function of cloud topheight, but also a function of cloud extinction coefficient pro-file. Except under special situations, e.g., for optically thickclouds over dark surfaces with vertically uniform extinctioncoefficient (Y. Yang et al., 2013), the EPIC measurementsgenerally do not provide enough information content to re-trieve the actual cloud top, but they are sufficient for retriev-ing another important cloud location information – namelyCEP/CEH, as well as the effective cloud fraction (ECF).
CEP is equivalent to the mean pressure from which lightis scattered and ECF is the derived radiometrically equivalentcloud fraction assuming an a priori cloud albedo (Stammes etal., 2008). CEP and ECF are important information, and bothhave been widely applied to trace gas retrievals and climatestudies (e.g., Joiner et al., 2012; Wang et al., 2011; Vasilkov
et al., 2008; Stammes et al., 2008; Sneep et al., 2008).CEP and ECF are retrieved using the Mixed Lambertian-Equivalent Reflectivity (MLER) concept, which has been ex-tensively studied and applied to operational settings (e.g.,Joiner et al., 2012; Y. Yang et al., 2013; Koelemeijer et al.,2001). The MLER model assumes that the pixel contains twoLambertian reflectors, the surface and the cloud. Figure 3billustrates the concept. The cloud is assumed to be opaque;hence photon transmission is neglected. The reflectance ob-served at the sensor can be expressed as
Rabs (θ,θ0)= (1−Ac)αsTabs (Ps,θ,θ0)
+AcαcTabs (Pc,θ,θ0) (4)Rref (θ,θ0)= (1−Ac)αsTref (Ps,θ,θ0)
+AcαcTref (Pc,θ,θ0) , (5)
where Rabs and Rref are the observed reflectances for the ab-sorption and the reference channels, respectively, Ac is theECF, αs is the surface albedo, αc is the a priori cloud albedo,Tabs and Tref are the two-way atmospheric transmittances forthe absorption and the reference channels, respectively, Pcand Ps are the CEP and the surface pressure, respectively, andθ and θ0 are the view zenith and solar zenith angles, respec-tively. Generally, αc is assumed to be 0.8, which correspondsto an optically thick cloud. This value is selected to justifythe no transmission assumption of the MLER model. It hasbeen demonstrated that although the selection of the a prioricloud albedo does affect the results of the ECF, its effect onthe retrieved CEP is relatively small (Stammes et al., 2008;Koelemeijer et al., 2001).
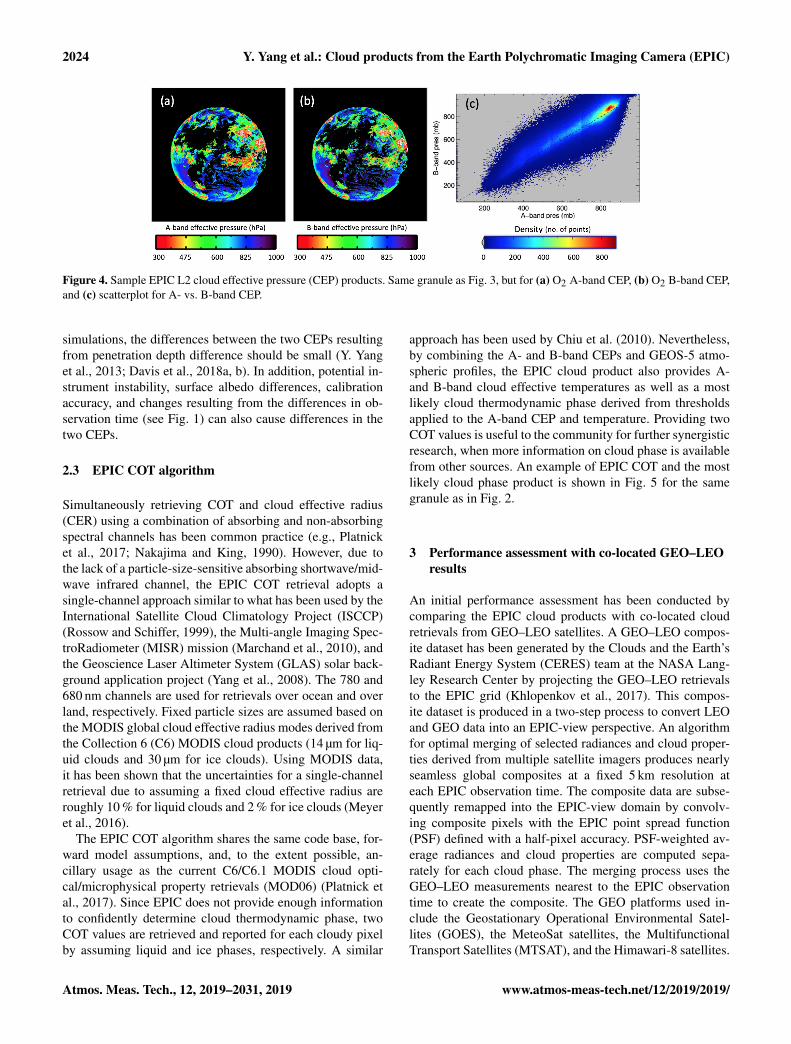
CEP and ECF can be retrieved with Eqs. (4) and (5)through iteration, after which CEP is converted to cloud ef-fective height (and, in the COT retrieval, cloud effective tem-perature; see Sect. 2.3) using co-located atmospheric profilesprovided by the Goddard Earth Observing System Model,Version 5 (GEOS-5) (Lucchesi, 2015). The retrieval of CEPonly requires one pair of absorption and reference channelobservations; hence two independent EPIC CEPs can be ob-tained using the A-band and B-band pairs. In theory, the twoCEPs are very close to each other if the surface albedo isthe same for the two bands and instrument noise is not con-sidered. There exists a subtle difference between the twoCEPs, however, because of the difference in photon pene-tration depths, which contains information on cloud verticalstructure (Y. Yang et al., 2013). Due to weaker absorption,photons in the B band penetrate deeper into the cloud and re-sult in a slightly higher CEP (lower altitude). As a result, boththe A- and B-band CEPs are reported in the EPIC cloud prod-uct for the community to explore. For applications that needspecific cloud effective height, such as trace gas retrieval cor-rection, the A-band value is recommended as it is less noisy.Figure 4a and b show the two CEP retrievals for the samegranule as in Fig. 2. As can be seen from the scatterplot inFig. 4c, the A- and B-band CEPs are generally close to eachother, with the B-band CEP higher. From radiative transfer
www.atmos-meas-tech.net/12/2019/2019/ Atmos. Meas. Tech., 12, 2019–2031, 2019
2024 Y. Yang et al.: Cloud products from the Earth Polychromatic Imaging Camera (EPIC)
Figure 4. Sample EPIC L2 cloud effective pressure (CEP) products. Same granule as Fig. 3, but for (a) O2 A-band CEP, (b) O2 B-band CEP,and (c) scatterplot for A- vs. B-band CEP.
simulations, the differences between the two CEPs resultingfrom penetration depth difference should be small (Y. Yanget al., 2013; Davis et al., 2018a, b). In addition, potential in-strument instability, surface albedo differences, calibrationaccuracy, and changes resulting from the differences in ob-servation time (see Fig. 1) can also cause differences in thetwo CEPs.
2.3 EPIC COT algorithm
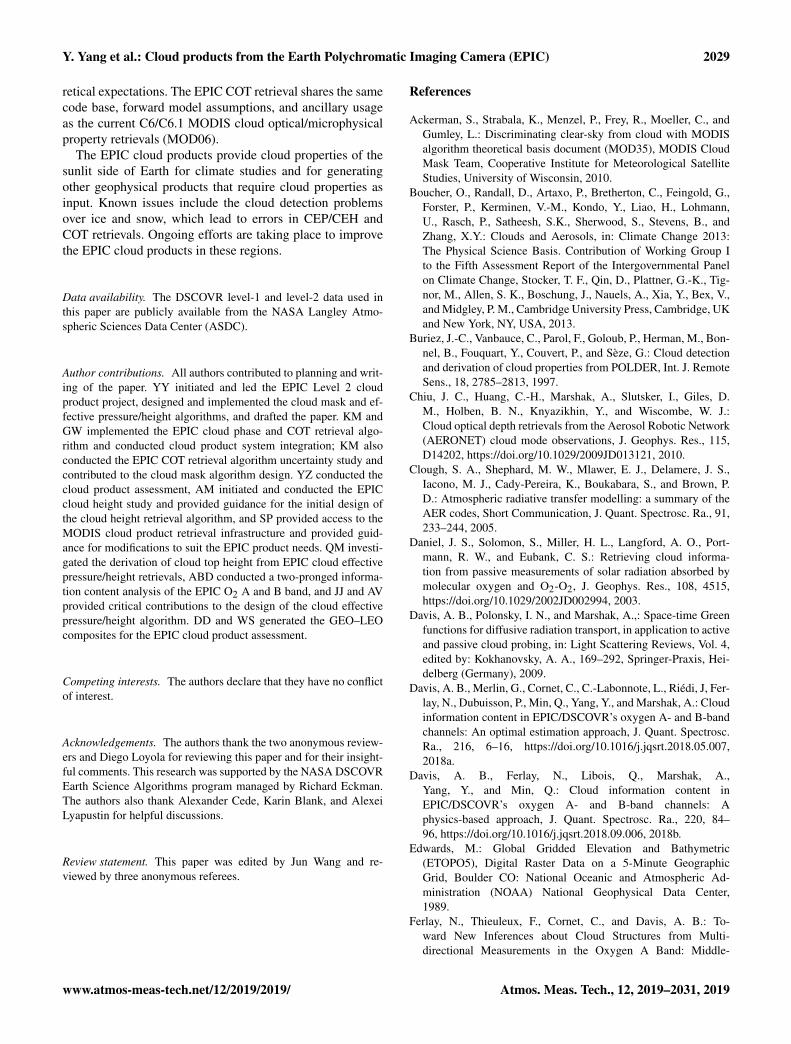
Simultaneously retrieving COT and cloud effective radius(CER) using a combination of absorbing and non-absorbingspectral channels has been common practice (e.g., Platnicket al., 2017; Nakajima and King, 1990). However, due tothe lack of a particle-size-sensitive absorbing shortwave/mid-wave infrared channel, the EPIC COT retrieval adopts asingle-channel approach similar to what has been used by theInternational Satellite Cloud Climatology Project (ISCCP)(Rossow and Schiffer, 1999), the Multi-angle Imaging Spec-troRadiometer (MISR) mission (Marchand et al., 2010), andthe Geoscience Laser Altimeter System (GLAS) solar back-ground application project (Yang et al., 2008). The 780 and680 nm channels are used for retrievals over ocean and overland, respectively. Fixed particle sizes are assumed based onthe MODIS global cloud effective radius modes derived fromthe Collection 6 (C6) MODIS cloud products (14 µm for liq-uid clouds and 30 µm for ice clouds). Using MODIS data,it has been shown that the uncertainties for a single-channelretrieval due to assuming a fixed cloud effective radius areroughly 10 % for liquid clouds and 2 % for ice clouds (Meyeret al., 2016).
The EPIC COT algorithm shares the same code base, for-ward model assumptions, and, to the extent possible, an-cillary usage as the current C6/C6.1 MODIS cloud opti-cal/microphysical property retrievals (MOD06) (Platnick etal., 2017). Since EPIC does not provide enough informationto confidently determine cloud thermodynamic phase, twoCOT values are retrieved and reported for each cloudy pixelby assuming liquid and ice phases, respectively. A similar
approach has been used by Chiu et al. (2010). Nevertheless,by combining the A- and B-band CEPs and GEOS-5 atmo-spheric profiles, the EPIC cloud product also provides A-and B-band cloud effective temperatures as well as a mostlikely cloud thermodynamic phase derived from thresholdsapplied to the A-band CEP and temperature. Providing twoCOT values is useful to the community for further synergisticresearch, when more information on cloud phase is availablefrom other sources. An example of EPIC COT and the mostlikely cloud phase product is shown in Fig. 5 for the samegranule as in Fig. 2.
3 Performance assessment with co-located GEO–LEOresults
An initial performance assessment has been conducted bycomparing the EPIC cloud products with co-located cloudretrievals from GEO–LEO satellites. A GEO–LEO compos-ite dataset has been generated by the Clouds and the Earth’sRadiant Energy System (CERES) team at the NASA Lang-ley Research Center by projecting the GEO–LEO retrievalsto the EPIC grid (Khlopenkov et al., 2017). This compos-ite dataset is produced in a two-step process to convert LEOand GEO data into an EPIC-view perspective. An algorithmfor optimal merging of selected radiances and cloud proper-ties derived from multiple satellite imagers produces nearlyseamless global composites at a fixed 5 km resolution ateach EPIC observation time. The composite data are subse-quently remapped into the EPIC-view domain by convolv-ing composite pixels with the EPIC point spread function(PSF) defined with a half-pixel accuracy. PSF-weighted av-erage radiances and cloud properties are computed sepa-rately for each cloud phase. The merging process uses theGEO–LEO measurements nearest to the EPIC observationtime to create the composite. The GEO platforms used in-clude the Geostationary Operational Environmental Satel-lites (GOES), the MeteoSat satellites, the MultifunctionalTransport Satellites (MTSAT), and the Himawari-8 satellites.
Atmos. Meas. Tech., 12, 2019–2031, 2019 www.atmos-meas-tech.net/12/2019/2019/
Y. Yang et al.: Cloud products from the Earth Polychromatic Imaging Camera (EPIC) 2025
Figure 5. Sample EPIC L2 cloud optical thickness (CODT) products. Same granule as Fig. 3, but for (a) COT retrieval assuming liquidthermodynamic phase, (b) COT retrieval assuming ice thermodynamic phase, and (c) the most likely cloud phase based on cloud effectivetemperature derived from the A-band CEP.
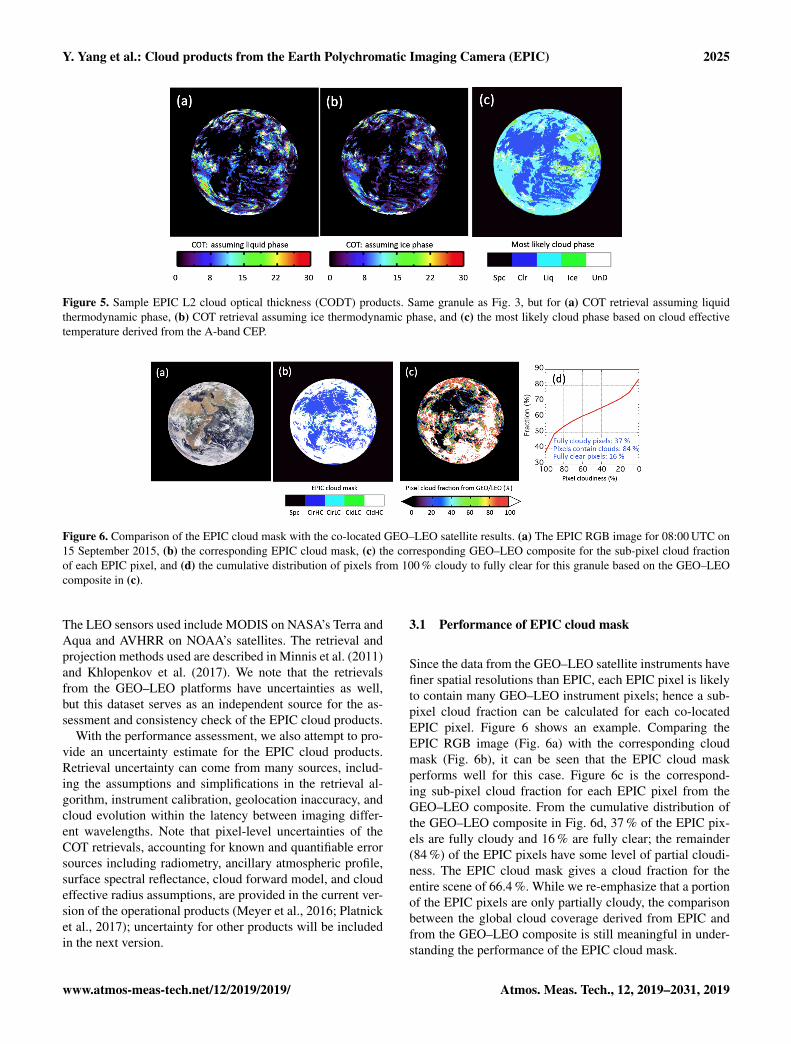
Figure 6. Comparison of the EPIC cloud mask with the co-located GEO–LEO satellite results. (a) The EPIC RGB image for 08:00 UTC on15 September 2015, (b) the corresponding EPIC cloud mask, (c) the corresponding GEO–LEO composite for the sub-pixel cloud fractionof each EPIC pixel, and (d) the cumulative distribution of pixels from 100 % cloudy to fully clear for this granule based on the GEO–LEOcomposite in (c).
The LEO sensors used include MODIS on NASA’s Terra andAqua and AVHRR on NOAA’s satellites. The retrieval andprojection methods used are described in Minnis et al. (2011)and Khlopenkov et al. (2017). We note that the retrievalsfrom the GEO–LEO platforms have uncertainties as well,but this dataset serves as an independent source for the as-sessment and consistency check of the EPIC cloud products.
With the performance assessment, we also attempt to pro-vide an uncertainty estimate for the EPIC cloud products.Retrieval uncertainty can come from many sources, includ-ing the assumptions and simplifications in the retrieval al-gorithm, instrument calibration, geolocation inaccuracy, andcloud evolution within the latency between imaging differ-ent wavelengths. Note that pixel-level uncertainties of theCOT retrievals, accounting for known and quantifiable errorsources including radiometry, ancillary atmospheric profile,surface spectral reflectance, cloud forward model, and cloudeffective radius assumptions, are provided in the current ver-sion of the operational products (Meyer et al., 2016; Platnicket al., 2017); uncertainty for other products will be includedin the next version.
3.1 Performance of EPIC cloud mask
Since the data from the GEO–LEO satellite instruments havefiner spatial resolutions than EPIC, each EPIC pixel is likelyto contain many GEO–LEO instrument pixels; hence a sub-pixel cloud fraction can be calculated for each co-locatedEPIC pixel. Figure 6 shows an example. Comparing theEPIC RGB image (Fig. 6a) with the corresponding cloudmask (Fig. 6b), it can be seen that the EPIC cloud maskperforms well for this case. Figure 6c is the correspond-ing sub-pixel cloud fraction for each EPIC pixel from theGEO–LEO composite. From the cumulative distribution ofthe GEO–LEO composite in Fig. 6d, 37 % of the EPIC pix-els are fully cloudy and 16 % are fully clear; the remainder(84 %) of the EPIC pixels have some level of partial cloudi-ness. The EPIC cloud mask gives a cloud fraction for theentire scene of 66.4 %. While we re-emphasize that a portionof the EPIC pixels are only partially cloudy, the comparisonbetween the global cloud coverage derived from EPIC andfrom the GEO–LEO composite is still meaningful in under-standing the performance of the EPIC cloud mask.
www.atmos-meas-tech.net/12/2019/2019/ Atmos. Meas. Tech., 12, 2019–2031, 2019
2026 Y. Yang et al.: Cloud products from the Earth Polychromatic Imaging Camera (EPIC)
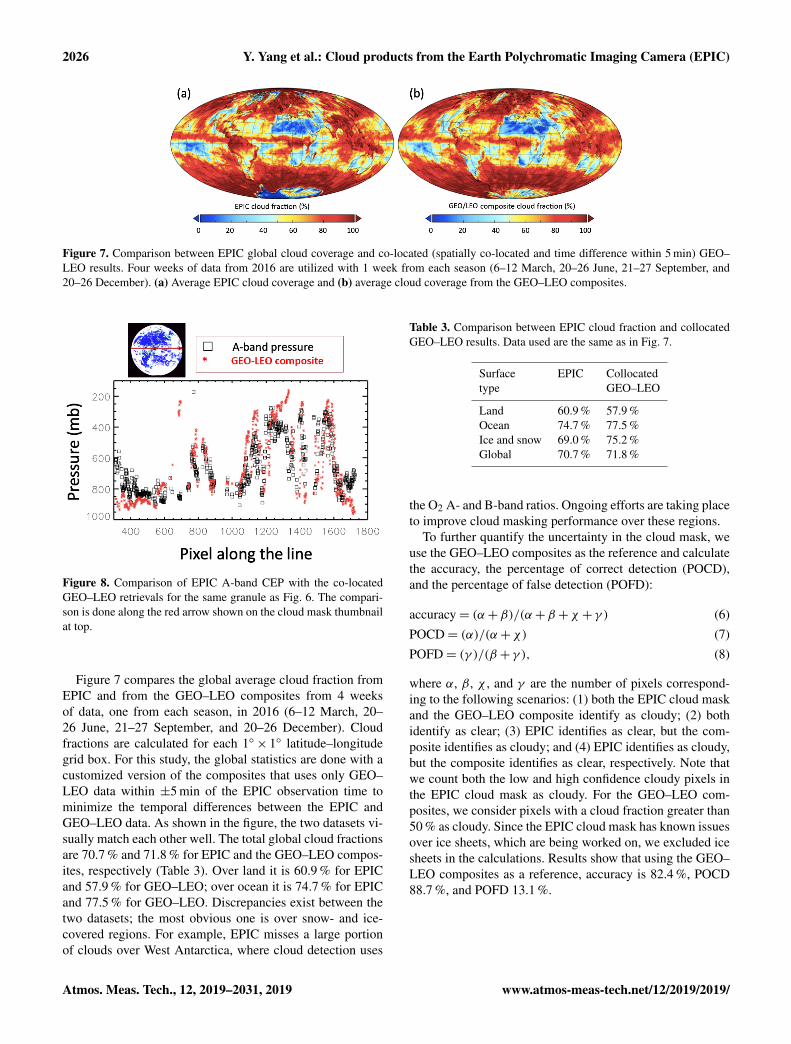
Figure 7. Comparison between EPIC global cloud coverage and co-located (spatially co-located and time difference within 5 min) GEO–LEO results. Four weeks of data from 2016 are utilized with 1 week from each season (6–12 March, 20–26 June, 21–27 September, and20–26 December). (a) Average EPIC cloud coverage and (b) average cloud coverage from the GEO–LEO composites.
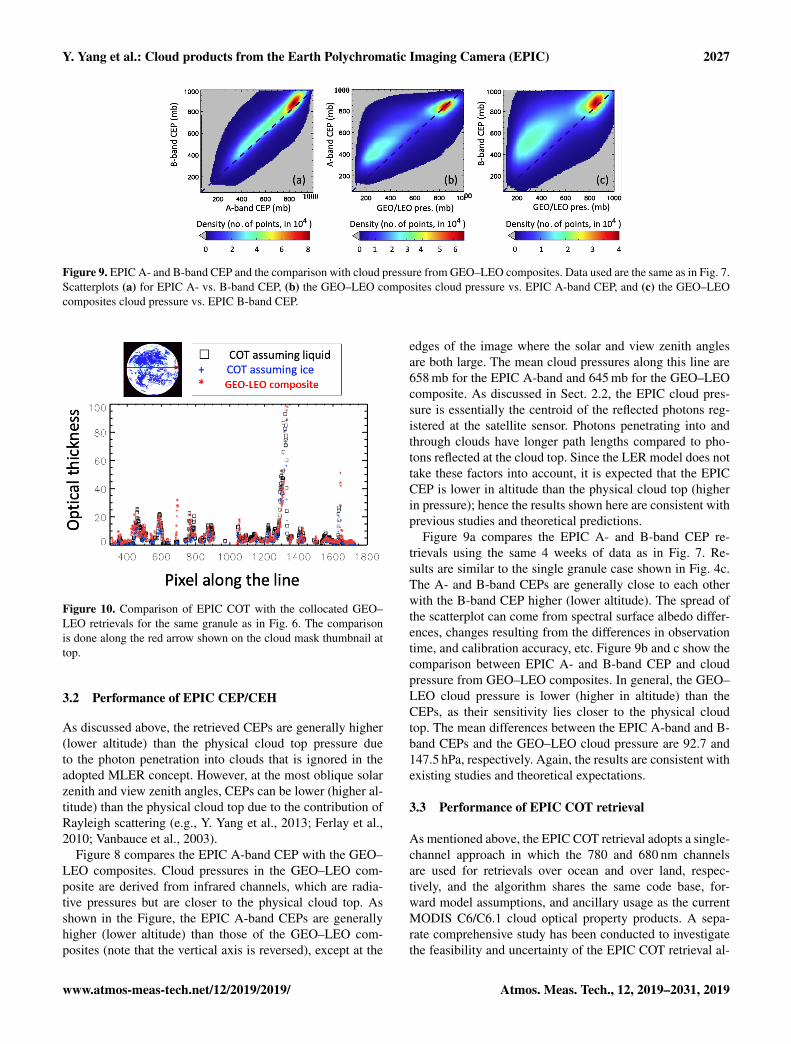
Figure 8. Comparison of EPIC A-band CEP with the co-locatedGEO–LEO retrievals for the same granule as Fig. 6. The compari-son is done along the red arrow shown on the cloud mask thumbnailat top.
Figure 7 compares the global average cloud fraction fromEPIC and from the GEO–LEO composites from 4 weeksof data, one from each season, in 2016 (6–12 March, 20–26 June, 21–27 September, and 20–26 December). Cloudfractions are calculated for each 1◦× 1◦ latitude–longitudegrid box. For this study, the global statistics are done with acustomized version of the composites that uses only GEO–LEO data within ±5 min of the EPIC observation time tominimize the temporal differences between the EPIC andGEO–LEO data. As shown in the figure, the two datasets vi-sually match each other well. The total global cloud fractionsare 70.7 % and 71.8 % for EPIC and the GEO–LEO compos-ites, respectively (Table 3). Over land it is 60.9 % for EPICand 57.9 % for GEO–LEO; over ocean it is 74.7 % for EPICand 77.5 % for GEO–LEO. Discrepancies exist between thetwo datasets; the most obvious one is over snow- and ice-covered regions. For example, EPIC misses a large portionof clouds over West Antarctica, where cloud detection uses
Table 3. Comparison between EPIC cloud fraction and collocatedGEO–LEO results. Data used are the same as in Fig. 7.
Surface EPIC Collocatedtype GEO–LEO
Land 60.9 % 57.9 %Ocean 74.7 % 77.5 %Ice and snow 69.0 % 75.2 %Global 70.7 % 71.8 %
the O2 A- and B-band ratios. Ongoing efforts are taking placeto improve cloud masking performance over these regions.
To further quantify the uncertainty in the cloud mask, weuse the GEO–LEO composites as the reference and calculatethe accuracy, the percentage of correct detection (POCD),and the percentage of false detection (POFD):
accuracy= (α+β)/(α+β +χ + γ ) (6)POCD= (α)/(α+χ) (7)POFD= (γ )/(β + γ ), (8)
where α, β, χ , and γ are the number of pixels correspond-ing to the following scenarios: (1) both the EPIC cloud maskand the GEO–LEO composite identify as cloudy; (2) bothidentify as clear; (3) EPIC identifies as clear, but the com-posite identifies as cloudy; and (4) EPIC identifies as cloudy,but the composite identifies as clear, respectively. Note thatwe count both the low and high confidence cloudy pixels inthe EPIC cloud mask as cloudy. For the GEO–LEO com-posites, we consider pixels with a cloud fraction greater than50 % as cloudy. Since the EPIC cloud mask has known issuesover ice sheets, which are being worked on, we excluded icesheets in the calculations. Results show that using the GEO–LEO composites as a reference, accuracy is 82.4 %, POCD88.7 %, and POFD 13.1 %.
Atmos. Meas. Tech., 12, 2019–2031, 2019 www.atmos-meas-tech.net/12/2019/2019/
Y. Yang et al.: Cloud products from the Earth Polychromatic Imaging Camera (EPIC) 2027
Figure 9. EPIC A- and B-band CEP and the comparison with cloud pressure from GEO–LEO composites. Data used are the same as in Fig. 7.Scatterplots (a) for EPIC A- vs. B-band CEP, (b) the GEO–LEO composites cloud pressure vs. EPIC A-band CEP, and (c) the GEO–LEOcomposites cloud pressure vs. EPIC B-band CEP.
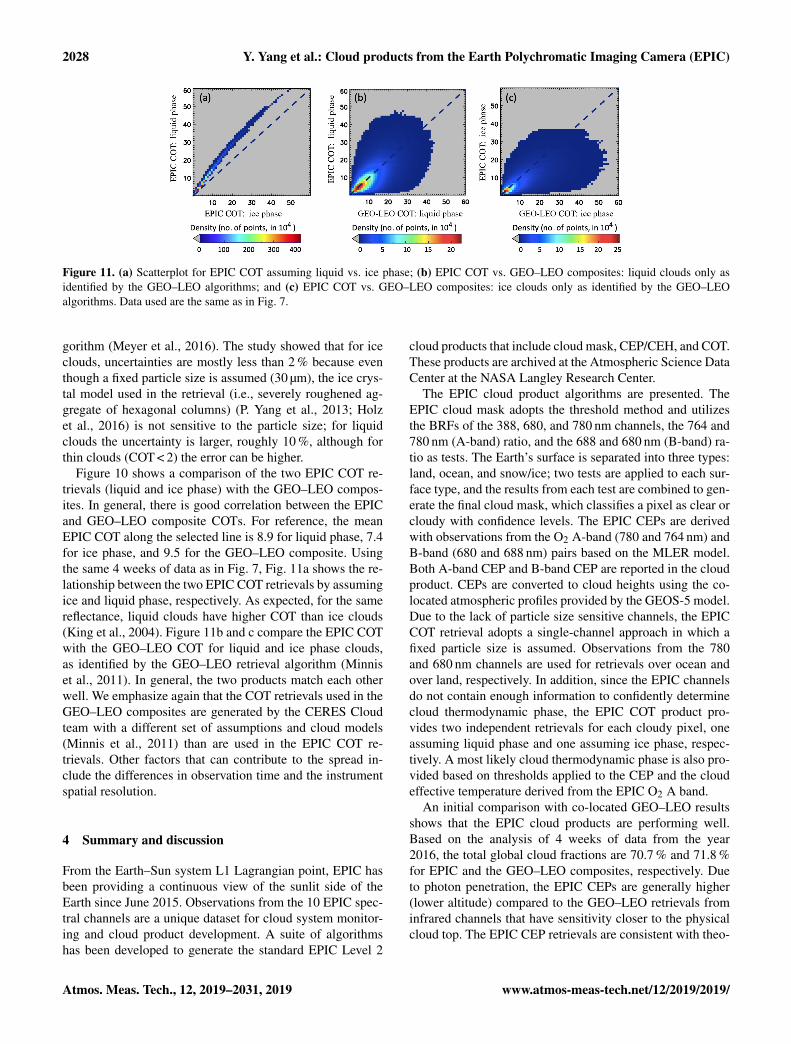
Figure 10. Comparison of EPIC COT with the collocated GEO–LEO retrievals for the same granule as in Fig. 6. The comparisonis done along the red arrow shown on the cloud mask thumbnail attop.
3.2 Performance of EPIC CEP/CEH
As discussed above, the retrieved CEPs are generally higher(lower altitude) than the physical cloud top pressure dueto the photon penetration into clouds that is ignored in theadopted MLER concept. However, at the most oblique solarzenith and view zenith angles, CEPs can be lower (higher al-titude) than the physical cloud top due to the contribution ofRayleigh scattering (e.g., Y. Yang et al., 2013; Ferlay et al.,2010; Vanbauce et al., 2003).
Figure 8 compares the EPIC A-band CEP with the GEO–LEO composites. Cloud pressures in the GEO–LEO com-posite are derived from infrared channels, which are radia-tive pressures but are closer to the physical cloud top. Asshown in the Figure, the EPIC A-band CEPs are generallyhigher (lower altitude) than those of the GEO–LEO com-posites (note that the vertical axis is reversed), except at the
edges of the image where the solar and view zenith anglesare both large. The mean cloud pressures along this line are658 mb for the EPIC A-band and 645 mb for the GEO–LEOcomposite. As discussed in Sect. 2.2, the EPIC cloud pres-sure is essentially the centroid of the reflected photons reg-istered at the satellite sensor. Photons penetrating into andthrough clouds have longer path lengths compared to pho-tons reflected at the cloud top. Since the LER model does nottake these factors into account, it is expected that the EPICCEP is lower in altitude than the physical cloud top (higherin pressure); hence the results shown here are consistent withprevious studies and theoretical predictions.
Figure 9a compares the EPIC A- and B-band CEP re-trievals using the same 4 weeks of data as in Fig. 7. Re-sults are similar to the single granule case shown in Fig. 4c.The A- and B-band CEPs are generally close to each otherwith the B-band CEP higher (lower altitude). The spread ofthe scatterplot can come from spectral surface albedo differ-ences, changes resulting from the differences in observationtime, and calibration accuracy, etc. Figure 9b and c show thecomparison between EPIC A- and B-band CEP and cloudpressure from GEO–LEO composites. In general, the GEO–LEO cloud pressure is lower (higher in altitude) than theCEPs, as their sensitivity lies closer to the physical cloudtop. The mean differences between the EPIC A-band and B-band CEPs and the GEO–LEO cloud pressure are 92.7 and147.5 hPa, respectively. Again, the results are consistent withexisting studies and theoretical expectations.
3.3 Performance of EPIC COT retrieval
As mentioned above, the EPIC COT retrieval adopts a single-channel approach in which the 780 and 680 nm channelsare used for retrievals over ocean and over land, respec-tively, and the algorithm shares the same code base, for-ward model assumptions, and ancillary usage as the currentMODIS C6/C6.1 cloud optical property products. A sepa-rate comprehensive study has been conducted to investigatethe feasibility and uncertainty of the EPIC COT retrieval al-
www.atmos-meas-tech.net/12/2019/2019/ Atmos. Meas. Tech., 12, 2019–2031, 2019
2028 Y. Yang et al.: Cloud products from the Earth Polychromatic Imaging Camera (EPIC)
Figure 11. (a) Scatterplot for EPIC COT assuming liquid vs. ice phase; (b) EPIC COT vs. GEO–LEO composites: liquid clouds only asidentified by the GEO–LEO algorithms; and (c) EPIC COT vs. GEO–LEO composites: ice clouds only as identified by the GEO–LEOalgorithms. Data used are the same as in Fig. 7.
gorithm (Meyer et al., 2016). The study showed that for iceclouds, uncertainties are mostly less than 2 % because eventhough a fixed particle size is assumed (30 µm), the ice crys-tal model used in the retrieval (i.e., severely roughened ag-gregate of hexagonal columns) (P. Yang et al., 2013; Holzet al., 2016) is not sensitive to the particle size; for liquidclouds the uncertainty is larger, roughly 10 %, although forthin clouds (COT < 2) the error can be higher.
Figure 10 shows a comparison of the two EPIC COT re-trievals (liquid and ice phase) with the GEO–LEO compos-ites. In general, there is good correlation between the EPICand GEO–LEO composite COTs. For reference, the meanEPIC COT along the selected line is 8.9 for liquid phase, 7.4for ice phase, and 9.5 for the GEO–LEO composite. Usingthe same 4 weeks of data as in Fig. 7, Fig. 11a shows the re-lationship between the two EPIC COT retrievals by assumingice and liquid phase, respectively. As expected, for the samereflectance, liquid clouds have higher COT than ice clouds(King et al., 2004). Figure 11b and c compare the EPIC COTwith the GEO–LEO COT for liquid and ice phase clouds,as identified by the GEO–LEO retrieval algorithm (Minniset al., 2011). In general, the two products match each otherwell. We emphasize again that the COT retrievals used in theGEO–LEO composites are generated by the CERES Cloudteam with a different set of assumptions and cloud models(Minnis et al., 2011) than are used in the EPIC COT re-trievals. Other factors that can contribute to the spread in-clude the differences in observation time and the instrumentspatial resolution.
4 Summary and discussion
From the Earth–Sun system L1 Lagrangian point, EPIC hasbeen providing a continuous view of the sunlit side of theEarth since June 2015. Observations from the 10 EPIC spec-tral channels are a unique dataset for cloud system monitor-ing and cloud product development. A suite of algorithmshas been developed to generate the standard EPIC Level 2
cloud products that include cloud mask, CEP/CEH, and COT.These products are archived at the Atmospheric Science DataCenter at the NASA Langley Research Center.
The EPIC cloud product algorithms are presented. TheEPIC cloud mask adopts the threshold method and utilizesthe BRFs of the 388, 680, and 780 nm channels, the 764 and780 nm (A-band) ratio, and the 688 and 680 nm (B-band) ra-tio as tests. The Earth’s surface is separated into three types:land, ocean, and snow/ice; two tests are applied to each sur-face type, and the results from each test are combined to gen-erate the final cloud mask, which classifies a pixel as clear orcloudy with confidence levels. The EPIC CEPs are derivedwith observations from the O2 A-band (780 and 764 nm) andB-band (680 and 688 nm) pairs based on the MLER model.Both A-band CEP and B-band CEP are reported in the cloudproduct. CEPs are converted to cloud heights using the co-located atmospheric profiles provided by the GEOS-5 model.Due to the lack of particle size sensitive channels, the EPICCOT retrieval adopts a single-channel approach in which afixed particle size is assumed. Observations from the 780and 680 nm channels are used for retrievals over ocean andover land, respectively. In addition, since the EPIC channelsdo not contain enough information to confidently determinecloud thermodynamic phase, the EPIC COT product pro-vides two independent retrievals for each cloudy pixel, oneassuming liquid phase and one assuming ice phase, respec-tively. A most likely cloud thermodynamic phase is also pro-vided based on thresholds applied to the CEP and the cloudeffective temperature derived from the EPIC O2 A band.
An initial comparison with co-located GEO–LEO resultsshows that the EPIC cloud products are performing well.Based on the analysis of 4 weeks of data from the year2016, the total global cloud fractions are 70.7 % and 71.8 %for EPIC and the GEO–LEO composites, respectively. Dueto photon penetration, the EPIC CEPs are generally higher(lower altitude) compared to the GEO–LEO retrievals frominfrared channels that have sensitivity closer to the physicalcloud top. The EPIC CEP retrievals are consistent with theo-
Atmos. Meas. Tech., 12, 2019–2031, 2019 www.atmos-meas-tech.net/12/2019/2019/
Y. Yang et al.: Cloud products from the Earth Polychromatic Imaging Camera (EPIC) 2029
retical expectations. The EPIC COT retrieval shares the samecode base, forward model assumptions, and ancillary usageas the current C6/C6.1 MODIS cloud optical/microphysicalproperty retrievals (MOD06).
The EPIC cloud products provide cloud properties of thesunlit side of Earth for climate studies and for generatingother geophysical products that require cloud properties asinput. Known issues include the cloud detection problemsover ice and snow, which lead to errors in CEP/CEH andCOT retrievals. Ongoing efforts are taking place to improvethe EPIC cloud products in these regions.
Data availability. The DSCOVR level-1 and level-2 data used inthis paper are publicly available from the NASA Langley Atmo-spheric Sciences Data Center (ASDC).
Author contributions. All authors contributed to planning and writ-ing of the paper. YY initiated and led the EPIC Level 2 cloudproduct project, designed and implemented the cloud mask and ef-fective pressure/height algorithms, and drafted the paper. KM andGW implemented the EPIC cloud phase and COT retrieval algo-rithm and conducted cloud product system integration; KM alsoconducted the EPIC COT retrieval algorithm uncertainty study andcontributed to the cloud mask algorithm design. YZ conducted thecloud product assessment, AM initiated and conducted the EPICcloud height study and provided guidance for the initial design ofthe cloud height retrieval algorithm, and SP provided access to theMODIS cloud product retrieval infrastructure and provided guid-ance for modifications to suit the EPIC product needs. QM investi-gated the derivation of cloud top height from EPIC cloud effectivepressure/height retrievals, ABD conducted a two-pronged informa-tion content analysis of the EPIC O2 A and B band, and JJ and AVprovided critical contributions to the design of the cloud effectivepressure/height algorithm. DD and WS generated the GEO–LEOcomposites for the EPIC cloud product assessment.
Competing interests. The authors declare that they have no conflictof interest.
Acknowledgements. The authors thank the two anonymous review-ers and Diego Loyola for reviewing this paper and for their insight-ful comments. This research was supported by the NASA DSCOVREarth Science Algorithms program managed by Richard Eckman.The authors also thank Alexander Cede, Karin Blank, and AlexeiLyapustin for helpful discussions.
Review statement. This paper was edited by Jun Wang and re-viewed by three anonymous referees.
References
Ackerman, S., Strabala, K., Menzel, P., Frey, R., Moeller, C., andGumley, L.: Discriminating clear-sky from cloud with MODISalgorithm theoretical basis document (MOD35), MODIS CloudMask Team, Cooperative Institute for Meteorological SatelliteStudies, University of Wisconsin, 2010.
Boucher, O., Randall, D., Artaxo, P., Bretherton, C., Feingold, G.,Forster, P., Kerminen, V.-M., Kondo, Y., Liao, H., Lohmann,U., Rasch, P., Satheesh, S.K., Sherwood, S., Stevens, B., andZhang, X.Y.: Clouds and Aerosols, in: Climate Change 2013:The Physical Science Basis. Contribution of Working Group Ito the Fifth Assessment Report of the Intergovernmental Panelon Climate Change, Stocker, T. F., Qin, D., Plattner, G.-K., Tig-nor, M., Allen, S. K., Boschung, J., Nauels, A., Xia, Y., Bex, V.,and Midgley, P. M., Cambridge University Press, Cambridge, UKand New York, NY, USA, 2013.
Buriez, J.-C., Vanbauce, C., Parol, F., Goloub, P., Herman, M., Bon-nel, B., Fouquart, Y., Couvert, P., and Sèze, G.: Cloud detectionand derivation of cloud properties from POLDER, Int. J. RemoteSens., 18, 2785–2813, 1997.
Chiu, J. C., Huang, C.-H., Marshak, A., Slutsker, I., Giles, D.M., Holben, B. N., Knyazikhin, Y., and Wiscombe, W. J.:Cloud optical depth retrievals from the Aerosol Robotic Network(AERONET) cloud mode observations, J. Geophys. Res., 115,D14202, https://doi.org/10.1029/2009JD013121, 2010.
Clough, S. A., Shephard, M. W., Mlawer, E. J., Delamere, J. S.,Iacono, M. J., Cady-Pereira, K., Boukabara, S., and Brown, P.D.: Atmospheric radiative transfer modelling: a summary of theAER codes, Short Communication, J. Quant. Spectrosc. Ra., 91,233–244, 2005.
Daniel, J. S., Solomon, S., Miller, H. L., Langford, A. O., Port-mann, R. W., and Eubank, C. S.: Retrieving cloud informa-tion from passive measurements of solar radiation absorbed bymolecular oxygen and O2-O2, J. Geophys. Res., 108, 4515,https://doi.org/10.1029/2002JD002994, 2003.
Davis, A. B., Polonsky, I. N., and Marshak, A.,: Space-time Greenfunctions for diffusive radiation transport, in application to activeand passive cloud probing, in: Light Scattering Reviews, Vol. 4,edited by: Kokhanovsky, A. A., 169–292, Springer-Praxis, Hei-delberg (Germany), 2009.
Davis, A. B., Merlin, G., Cornet, C., C.-Labonnote, L., Riédi, J, Fer-lay, N., Dubuisson, P., Min, Q., Yang, Y., and Marshak, A.: Cloudinformation content in EPIC/DSCOVR’s oxygen A- and B-bandchannels: An optimal estimation approach, J. Quant. Spectrosc.Ra., 216, 6–16, https://doi.org/10.1016/j.jqsrt.2018.05.007,2018a.
Davis, A. B., Ferlay, N., Libois, Q., Marshak, A.,Yang, Y., and Min, Q.: Cloud information content inEPIC/DSCOVR’s oxygen A- and B-band channels: Aphysics-based approach, J. Quant. Spectrosc. Ra., 220, 84–96, https://doi.org/10.1016/j.jqsrt.2018.09.006, 2018b.
Edwards, M.: Global Gridded Elevation and Bathymetric(ETOPO5), Digital Raster Data on a 5-Minute GeographicGrid, Boulder CO: National Oceanic and Atmospheric Ad-ministration (NOAA) National Geophysical Data Center,1989.
Ferlay, N., Thieuleux, F., Cornet, C., and Davis, A. B.: To-ward New Inferences about Cloud Structures from Multi-directional Measurements in the Oxygen A Band: Middle-
www.atmos-meas-tech.net/12/2019/2019/ Atmos. Meas. Tech., 12, 2019–2031, 2019
2030 Y. Yang et al.: Cloud products from the Earth Polychromatic Imaging Camera (EPIC)
of-Cloud Pressure and Cloud Geometrical Thickness fromPOLDER-3/PARASOL, J. Appl. Meteor. Climatol., 49, 2492–2507, https://doi.org/10.1175/2010JAMC2550.1, 2010.
Herman, J. R. and Celarier, E. A.: Earth surface reflectivity clima-tology at 340–380 nm from TOMS data, J. Geophys. Res., 102,28003–28011, 1997.
Herman, J. R., Celarier, E., and Larko, D.: UV 380 nm reflectivity ofthe Earth’s surface, clouds and aerosols, J. Geophys. Res., 106,5335–5351, https://doi.org/10.1029/2000JD900584, 2001.
Holdaway, D. and Yang, Y.: Study of the Effect of Temporal Sam-pling Frequency on DSCOVR Observations Using the GEOS-5Nature Run Results (Part II): Cloud Coverage, Remote Sens., 8,431, https://doi.org/10.3390/rs8050431, 2016a.
Holdaway, D. and Yang, Y.: Study of the Effect of Temporal Sam-pling Frequency on DSCOVR Observations Using the GEOS-5Nature Run Results (Part I): Earth’s Radiation Budget, RemoteSens., 8, 98, https://doi.org/10.3390/rs8020098, 2016b.
Holz, R. E., Platnick, S., Meyer, K., Vaughan, M., Heidinger, A.,Yang, P., Wind, G., Dutcher, S., Ackerman, S., Amarasinghe, N.,Nagle, F., and Wang, C.: Resolving ice cloud optical thickness bi-ases between CALIOP and MODIS using infrared retrievals, At-mos. Chem. Phys., 16, 5075–5090, https://doi.org/10.5194/acp-16-5075-2016, 2016.
Joiner, J., Vasilkov, A. P., Gupta, P., Bhartia, P. K., Veefkind, P.,Sneep, M., de Haan, J., Polonsky, I., and Spurr, R.: Fast simula-tors for satellite cloud optical centroid pressure retrievals; evalu-ation of OMI cloud retrievals, Atmos. Meas. Tech., 5, 529–545,https://doi.org/10.5194/amt-5-529-2012, 2012.
Khlopenkov, K., Duda, D., Thieman, M., Minnis, P., Su, W., andBedka, K.: Development of multi-sensor global cloud and ra-diance composites for earth radiation budget monitoring fromDSCOVR, Proc. SPIE 10424, Remote Sens., 104240K, Warsaw,2 October 2017, https://doi.org/10.1117/12.2278645, 2017.
King, M. D., Platnick, S., Yang, P., Arnold, G. T., Gray, M. A.,Riedi, J. C., Ackerman, S. A., and Liou, K. N.: Remote sensing ofliquid water and ice cloud optical thickness and effective radiusin the Arctic: Application of airborne multispectral MAS data, J.Atmos. Ocean. Tech., 21, 857–875, 2004.
Koelemeijer, R. B. A., Stammes, P., Hovenier, J. W., and de Haan,J. F.: A fast method for retrieval of cloud parameters using oxy-gen A band measurements from the Global Ozone MonitoringExperiment, J. Geophys. Res., 106, 3475–3490, 2001.
Kokhanovsky, A. A., Rozanov, V. V., Burrows, J. P., Eichmann, K.-U., Lotz, W., and Vountas, M.: The SCIAMACHY cloud prod-ucts: Algorithms and examples from ENVISAT, Adv. Space Res.,36, 789–799, https://doi.org/10.1016/j.asr.2005.03.026, 2005.
Lindstrot, R., Preusker, R., Ruhtz, T., Heese, B., Wiegner, M., Lin-demann, C., and Fischer, J.: Validation of MERIS cloud top pres-sure using airborne lidar measurements, J. Appl. Meteor. Clima-tol., 45, 1612–1621, 2006.
Loyola, D. G., Gimeno García, S., Lutz, R., Argyrouli, A., Rom-ahn, F., Spurr, R. J. D., Pedergnana, M., Doicu, A., Molina Gar-cía, V., and Schüssler, O.: The operational cloud retrieval algo-rithms from TROPOMI on board Sentinel-5 Precursor, Atmos.Meas. Tech., 11, 409–427, https://doi.org/10.5194/amt-11-409-2018, 2018.
Lucchesi, R.: File Specification for GEOS-5 FP-IT, GMAO Of-fice Note No. 2 (Version 1.4), 63 pp., available at: https:
//gmao.gsfc.nasa.gov/pubs/docs/Lucchesi865.pdf (last access:26 March 2019), 2015.
Marchand, R., Ackerman, T., Smyth, M., and Rossow, W. B.: Areview of cloud top height and optical depth histograms fromMISR, ISCCP, and MODIS, J. Geophys. Res., 115, D16206,https://doi.org/10.1029/2009JD013422, 2010.
Marshak, A., Herman, J., Szabo, A., Blank, K., Cede, A., Carn,S., Geogdzhayev, I., Huang, D., Huang, L-K, Knyazikhin, Y.,Kowalewski, M., Krotkov, N., Lyapustin, A., McPeters, R.,Meyer, K., Torres, O., and Yang, Y.: Earth observations fromDSCOVR/EPIC instrument, B. Am. Meteor. Soc., 99, 1829–1850, https://doi.org/10.1175/BAMS-D-17-0223.1, 2018.
Meyer, K., Yang, Y., and Platnick, S.: Uncertainties in cloud phaseand optical thickness retrievals from the Earth PolychromaticImaging Camera (EPIC), Atmos. Meas. Tech., 9, 1785–1797,https://doi.org/10.5194/amt-9-1785-2016, 2016.
Min, Q. L., Harrison, L. C., Kiedron, P., Berndt, J., andJoseph, E.: A high-resolution oxygen A-band and watervapor band spectrometer, J. Geophys. Res., 109, D02202,https://doi.org/10.1029/2003JD003540, 2004.
Minnis, P., Sun-Mack, S., Chen, Y., Khaiyer, M. M., Yi, Y., Ayers,J. K., Brown, R. R., Dong, X., Gibson, S. C., Heck, P. W., Lin,B., Nordeen, M.L., Nguyen, L., Palikonda, R., Smith Jr., W. L.,Spangenberg, D. A., Trepte, Q. Z., and Xi, B.: CERES Edition-2cloud property retrievals using TRMM VIRS and Terra and AquaMODIS data, Part II: Examples of average results and compar-isons with other data, IEEE T. Geosci. Remote, 49, 4401–4430,https://doi.org/10.1109/TGRS.2011.2144602, 2011.
Nakajima, T. and King, M. D.: Determination of the optical thick-ness and effective particle radius of clouds from reflected solarradiation measurements, Part I: Theory, J. Atmos. Sci., 47, 1878–1893, 1990.
National Academies of Sciences, Engineering, and Medicine:Thriving on Our Changing Planet: A Decadal Strategy for EarthObservation from Space, https://doi.org/10.17226/24938, TheNational Academies Press, Washington, DC, 2018.
Platnick, S., Meyer, K., King, M. D., Wind, G., Amarasinghe, N.,Marchant, B., Arnold, G. T., Zhang, Z., Hubanks, P. A., Holz, R.E., Yang, P., Ridgway, W. L., and Riedi, J.: The MODIS cloudoptical and microphysical products: Collection 6 updates and ex-amples from Terra and Aqua, IEEE T. Geosci. Remote, 55, 502–525, https://doi.org/10.1109/TGRS.2016.2610522, 2017.
Rossow, W. B. and Garder, L. C.: Cloud Detection Using SatelliteMeasurements of Infrared and Visible Radiances for ISCCP, J.Climate, 6, 2341–2369, 1993.
Rossow, W. B. and Schiffer, R. A.: Advances in un-derstanding clouds from ISCCP, B. Am. Meteor.Soc., 80, 2261–2287, https://doi.org/10.1175/1520-0477(1999)080<2261:AIUCFI>2.0.CO;2, 1999.
Schüssler, O., Loyola, D., Doicu, A., and Spurr, R.: InformationContent in the Oxygen A-band for the Retrieval of Macrophysi-cal Cloud Parameters, IEEE T. Geosci. Remote, 52, 3246–3255,2014.
Sneep, M., de Haan, J. F., Stammes, P., Wang, P., Van-bauce, C., Joiner, J., Vasilkov, A. P., and Levelt, P.F.: Three-way comparison between OMI and PARASOLcloud pressure products, J. Geophys. Res., 113, D15S23,https://doi.org/10.1029/2007JD008694, 2008.
Atmos. Meas. Tech., 12, 2019–2031, 2019 www.atmos-meas-tech.net/12/2019/2019/

Y. Yang et al.: Cloud products from the Earth Polychromatic Imaging Camera (EPIC) 2031
Stammes, P., Sneep, M., de Haan, J. F., Veefkind, J. P.,Wang, P., and Levelt, P. F.: Effective cloud fractions fromthe Ozone Monitoring Instrument: Theoretical frame-work and validation, J. Geophys. Res., 113, D16S38,https://doi.org/10.1029/2007JD008820, 2008.
Stamnes, K., Tsay, S.-C., Wiscombe, W. J., and Jayaweera, K.: Nu-merically stable algorithm for discrete-ordinate-method radiativetransfer in multiple scattering and emitting layered media, Appl.Opt., 27, 2502–2512, 1988.
Stephens, G. L. and Heidinger, A. K.: Molecular line absorption ina scattering atmosphere: Part I, Theory, J. Atmos. Sci., 57, 1599–1614, 2000.
Tilstra, L. G., Tuinder, O. N. E., Wang, P., and Stammes, P.: Surfacereflectivity climatologies from UV to NIR determined from Earthobservations by GOME-2 and SCIAMACHY, J. Geophys. Res.-Atmos., 122, 4084–4111, 2017.
Vanbauce, C., Cadet, B., and Marchand, R. T.: Compari-son of POLDER apparent and corrected oxygen pressure toARM/MMCR cloud boundary pressures, Geophys. Res. Lett.,30, 1212, https://doi.org/10.1029/2002GL016449, 2003.
Vasilkov, A., Joiner, J., Spurr, R., Bhartia, P. K., Levelt, P., andStephens, G.: Evaluation of the OMI cloud pressures derivedfrom rotational Raman scattering by comparisons with othersatellite data and radiative transfer simulations, J. Geophys. Res.,113, D15S19, https://doi.org/10.1029/2007JD008689, 2008.
Vermote, E. F. and Tanre, D.: Analytical expressions for radiativeproperties of planar Rayleigh scattering media including polar-ization contribution, J. Quant. Spectrosc. Ra., 47, 305–314, 1992.
Wang, P., Stammes, P., van der A, R., Pinardi, G., and van Roozen-dael, M.: FRESCO+: an improved O2 A-band cloud retrievalalgorithm for tropospheric trace gas retrievals, Atmos. Chem.Phys., 8, 6565–6576, https://doi.org/10.5194/acp-8-6565-2008,2008.
Wang, P., Stammes, P., and Mueller, R.: Surface solar irradiancefrom SCIAMACHY measurements: algorithm and validation,Atmos. Meas. Tech., 4, 875–891, https://doi.org/10.5194/amt-4-875-2011, 2011.
Yang, P., Bi, L., Baum, B. A., Liou, K.-N., Kattawar, G. W.,Mishchenko, M. I., and Cole, B.: Spectrally Consistent Scatter-ing, Absorption, and Polarization Properties of Atmospheric IceCrystals at Wavelengths from 0.2 to 100 µm, J. Atmos. Sci., 70,330–347, https://doi.org/10.1175/JAS-D-12-039.1, 2013.
Yang, Y., Di Girolamo, L., and Mazzoni, D.: Selection ofthe automated thresholding algorithm for Multi-angle Imag-ing SpectroRadiometer Radiometric Camera-by-Camera CloudMask over land, Remote Sens. Environ., 107, 159–171,https://doi.org/10.1016/j.rse.2006.05.020, 2007.
Yang, Y., Marshak, A., Chiu, J. C., Wiscombe, W. J., Palm, S.P., Davis, A. B., Spangenberg, D. A., Nguyen, L., Spinhirne,J. D., and Minnis, P.: Retrievals of Thick Cloud Optical Depthfrom the Geoscience Laser Altimeter System (GLAS) by Cali-bration of Solar Background Signal, J. Atmos. Sci., 65, 3513–3526, https://doi.org/10.1175/2008JAS2744.1, 2008.
Yang, Y., Marshak, A., Mao, J., Lyapustin, A., and Herman, J.:A Method of Retrieving Cloud Top Height and Cloud Ge-ometrical Thickness with Oxygen A and B bands for theDeep Space Climate Observatory (DSCOVR) Mission: Radia-tive Transfer Simulations, J. Quant. Spectrosc. Ra., 122, 141–149, https://doi.org/10.1016/j.jqsrt.2012.09.017, 2013.
www.atmos-meas-tech.net/12/2019/2019/ Atmos. Meas. Tech., 12, 2019–2031, 2019
Related Documents