Closing the Motor Vehicle Industry: The Impact on Australia Map series by Local Government Area, Australia Date

Closing the Motor Vehicle Industry: The Impact on Australia
Jan 11, 2016
Closing the Motor Vehicle Industry: The Impact on Australia. Map series by Local Government Area, Australia. Date. Employment change (no.) for place of work by LGA. 3 months (1 qtr ) after closure. Employment change (no.) for place of work by LGA. 1 year (4 qtrs ) after closure. - PowerPoint PPT Presentation
Welcome message from author
This document is posted to help you gain knowledge. Please leave a comment to let me know what you think about it! Share it to your friends and learn new things together.
Transcript

Closing the Motor Vehicle Industry: The Impact on Australia
Map series by Local Government Area, Australia
Date

Employment change (no.) for place of work by LGA3 months (1 qtr) after closure

1 year (4 qtrs) after closureEmployment change (no.) for place of work by LGA
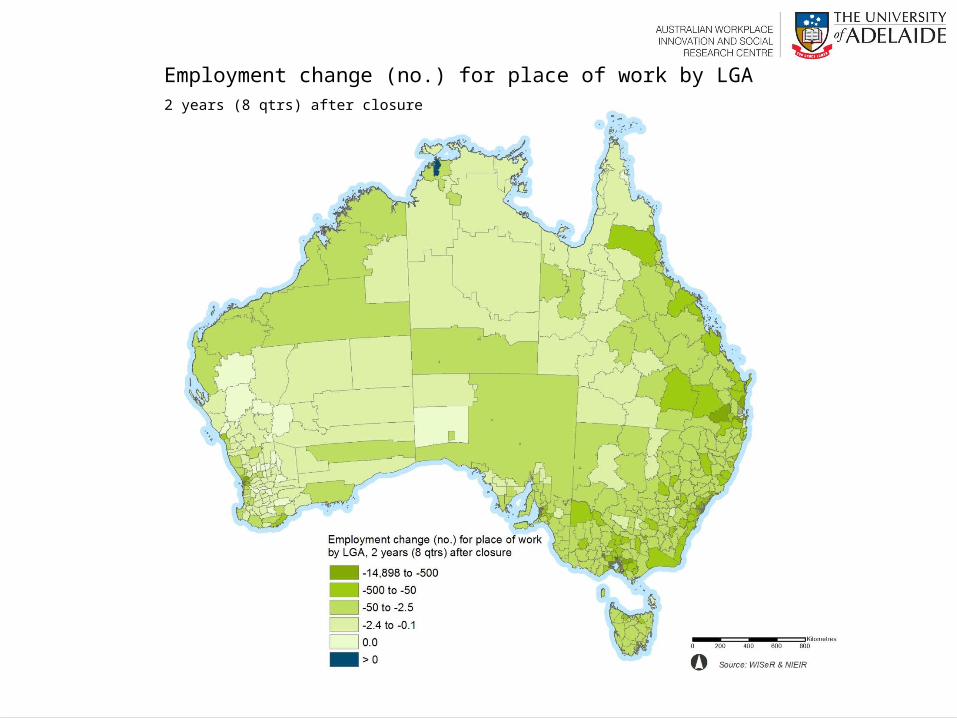
Employment change (no.) for place of work by LGA2 years (8 qtrs) after closure

Employment change (no.) for place of work by LGA3 years (12 qtrs) after closure

Employment change (no.) for place of work by LGA4 years (16 qtrs) after closure

Percentage employment change for place of work by LGA3 months (1 qtr) after closure
Data calculated as percent of 2012 level

Percentage employment change for place of work by LGA1 year (4 qtrs) after closure
Data calculated as percent of 2012 level

Percentage employment change for place of work by LGA2 years (8 qtrs) after closure
Data calculated as percent of 2012 level

Percentage employment change for place of work by LGA3 years (12 qtrs) after closure
Data calculated as percent of 2012 level

Percentage employment change for place of work by LGA4 years (16 qtrs) after closure
Data calculated as percent of 2012 level

Employment change (no.) for residents by LGA3 months (1 qtr) after closure
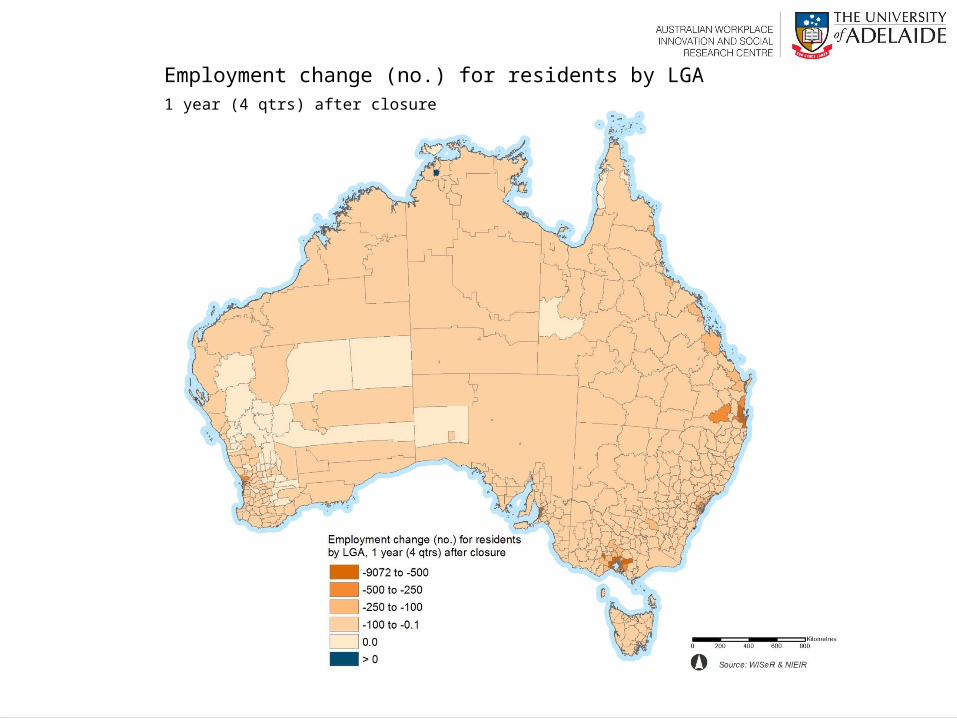
Employment change (no.) for residents by LGA1 year (4 qtrs) after closure

Employment change (no.) for residents by LGA2 years (8 qtrs) after closure

Employment change (no.) for residents by LGA3 years (12 qtrs) after closure

Employment change (no.) for residents by LGA4 years (16 qtrs) after closure

Percentage employment change for residents by LGA3 months (1 qtr) after closure
Data calculated as percent of 2012 level

Percentage employment change for residents by LGA1 year (4 qtrs) after closure
Data calculated as percent of 2012 level

Percentage employment change for residents by LGA2 years (8 qtrs) after closure
Data calculated as percent of 2012 level

Percentage employment change for residents by LGA3 years (12 qtrs) after closure
Data calculated as percent of 2012 level

Percentage employment change for residents by LGA4 years (16 qtrs) after closure
Data calculated as percent of 2012 level

Gross Regional Product (change in $ million) by LGA3 months (1 qtr) after closure
Data expressed as $ per million in 2011 prices

Gross Regional Product (change in $ million) by LGA1 year (4 qtrs) after closure
Data expressed as $ per million in 2011 prices

Gross Regional Product (change in $ million) by LGA2 years (8 qtrs) after closure
Data expressed as $ per million in 2011 prices

Gross Regional Product (change in $ million) by LGA3 years (12 qtrs) after closure
Data expressed as $ per million in 2011 prices

Gross Regional Product (change in $ million) by LGA4 years (16 qtrs) after closure
Data expressed as $ per million in 2011 prices

Percentage of Gross Regional Product by LGA3 months (1 qtr) after closure
Data expressed as $ per million in 2011 prices, calculated as percent of 2012 level

Percentage of Gross Regional Product by LGA1 year (4 qtrs) after closure
Data expressed as $ per million in 2011 prices, calculated as percent of 2012 level

Percentage of Gross Regional Product by LGA2 years (8 qtrs) after closure
Data expressed as $ per million in 2011 prices, calculated as percent of 2012 level

Percentage of Gross Regional Product by LGA3 years (12 qtrs) after closure
Data expressed as $ per million in 2011 prices, calculated as percent of 2012 level

Percentage of Gross Regional Product by LGA4 years (16 qtrs) after closure
Data expressed as $ per million in 2011 prices, calculated as percent of 2012 level

Data based on modelling work undertaken by the National Institute of Economic and Industry Research
(NIEIR) and commissioned by the Australian Workplace Innovation & Social Research Centre (WISeR).
More information including the reports and data available at www.adelaide.edu.au/wiser
Related Documents


