ver the last several years, the number of children in the United States with access to computer technology has increased significantly. Two recent reports from the National Center for Education Sta- tistics (NCES) emphasize the progress that our nation has made over the last decade in technology access and high- light the role of schools in achieving parity in computer and Internet access for children. “Internet Access in U.S. Public Schools and Classrooms” (Kleiner & Lewis, 2003) documents that 99% of American schools had access to the Internet in fall 2002. “Computer and Internet Use” (DeBell & Chapman, 2003) reported that in 2001, more children and adolescents used computers at school (81%) than at home (65%). Despite the fact that schools across the country achieved near parity in availability and quality of access, evidence shows continued significant disparities across different groups of children in terms of computer and Internet use (Becker, 2000; DeBell & Chapman; Fairlie, 2002; Puma, Chapin, & Pape, 2003; Solomon, 2002). Most educators agree that computer access and literacy have become vital and necessary for young learners in the 21st century. If one assumes that academic achievement is facilitated by access to computers at home and at school, the gap in access to computer technology is cause for con- cern. Digital equity is a social justice goal, ensuring that all students have access to information and communication technologies for learning, regardless of socioeconomic sta- tus (SES), disability, language, race, gender, or any charac- teristics that have been linked with unequal treatment. Equitable access to technology resources (e.g., computers, software, connectivity) is one aspect of the concern for dig- ital equity. Other dimensions include (a) effective use of technology for teaching and learning, (b) access to high quality and culturally relevant content, and (c) opportuni- ties to create new content (National Institute for Commu- nity Innovations, 2003). The nation’s continued investment in school-based technology has resulted in significant progress toward clos- ing the digital divide. For example, between 1994 and 2002, the percentage of instructional classrooms with Internet access in schools with the highest poverty con- centrations (75% or more students eligible for free or reduced-price lunches) grew from 2% to 89%. In compari- son, in 2002, 93% of instructional classrooms had Internet access in schools with low-poverty concentrations (less than 35% of students eligible for free or reduced-price lunches). No differences in school Internet access were observed on the basis of school characteristics such as locale, school size, percentage of minority enrollment, poverty concentration, or instructional level (Kleiner & Lewis, 2003). Although access to technology resources is improving, equitable access has evidently not been fully achieved (DeBell & Chapman, 2003). In 2001, children and adoles- cents living in poor families were less likely to use comput- ers at school (75%) and at home (32%) than were children Address correspondence to Sharon Judge, Department of Theory & Practice in Teacher Education, College of Education, Health, & Human Sciences, The University of Tennessee, A 423 Claxton com- plex, Knoxville, TN 37996-3442. (E-mail: [email protected]) Copyright © 2006 Heldref Publications Closing the Digital Divide: Update From the Early Childhood Longitudinal Study SHARON JUDGE KATHLEEN PUCKETT SHERRY MEE BELL University of Tennessee, Knoxville Arizona State University, West University of Tennessee, Knoxville ABSTRACT The authors examined the progress made toward equitable technology access and use over children’s first 4 years of school. The sample consisted of 8,283 public school children who attended kindergarten, 1st, and 3rd grades. In 3rd grade, high-poverty schools had significantly more computers for instruction and a smaller ratio of children to computers than did low-poverty schools. Over the first 4 years of school, however, children attending low-poverty schools had significantly more access to home computers than did those attending high-poverty schools. Children’s use of computers during 3rd grade differed by school-poverty status. Results indicate that access to, and use of, a home computer, the presence of a computer area in classrooms, frequent use of the Internet, proficiency in computer use, and low-poverty school status were correlated positively with academic achievement. In contrast, frequent use of software for reading was correlated negatively with reading achievement. Key words: computer access in high- and low-poverty schools; Early Childhood Longitudinal Study; kindergarten, first-, and third-grade children O 52

Welcome message from author
This document is posted to help you gain knowledge. Please leave a comment to let me know what you think about it! Share it to your friends and learn new things together.
Transcript
ver the last several years, the number of childrenin the United States with access to computertechnology has increased significantly. Two
recent reports from the National Center for Education Sta-tistics (NCES) emphasize the progress that our nation hasmade over the last decade in technology access and high-light the role of schools in achieving parity in computerand Internet access for children. “Internet Access in U.S.Public Schools and Classrooms” (Kleiner & Lewis, 2003)documents that 99% of American schools had access to theInternet in fall 2002. “Computer and Internet Use”(DeBell & Chapman, 2003) reported that in 2001, morechildren and adolescents used computers at school (81%)than at home (65%). Despite the fact that schools acrossthe country achieved near parity in availability and qualityof access, evidence shows continued significant disparitiesacross different groups of children in terms of computer andInternet use (Becker, 2000; DeBell & Chapman; Fairlie,2002; Puma, Chapin, & Pape, 2003; Solomon, 2002).
Most educators agree that computer access and literacyhave become vital and necessary for young learners in the
21st century. If one assumes that academic achievement isfacilitated by access to computers at home and at school,the gap in access to computer technology is cause for con-cern. Digital equity is a social justice goal, ensuring that allstudents have access to information and communicationtechnologies for learning, regardless of socioeconomic sta-tus (SES), disability, language, race, gender, or any charac-teristics that have been linked with unequal treatment.Equitable access to technology resources (e.g., computers,software, connectivity) is one aspect of the concern for dig-ital equity. Other dimensions include (a) effective use oftechnology for teaching and learning, (b) access to highquality and culturally relevant content, and (c) opportuni-ties to create new content (National Institute for Commu-nity Innovations, 2003).
The nation’s continued investment in school-basedtechnology has resulted in significant progress toward clos-ing the digital divide. For example, between 1994 and2002, the percentage of instructional classrooms withInternet access in schools with the highest poverty con-centrations (75% or more students eligible for free orreduced-price lunches) grew from 2% to 89%. In compari-son, in 2002, 93% of instructional classrooms had Internetaccess in schools with low-poverty concentrations (lessthan 35% of students eligible for free or reduced-pricelunches). No differences in school Internet access wereobserved on the basis of school characteristics such aslocale, school size, percentage of minority enrollment,poverty concentration, or instructional level (Kleiner &Lewis, 2003).
Although access to technology resources is improving,equitable access has evidently not been fully achieved(DeBell & Chapman, 2003). In 2001, children and adoles-cents living in poor families were less likely to use comput-ers at school (75%) and at home (32%) than were children
Address correspondence to Sharon Judge, Department of Theory &Practice in Teacher Education, College of Education, Health, &Human Sciences, The University of Tennessee, A 423 Claxton com-plex, Knoxville, TN 37996-3442. (E-mail: [email protected])
Copyright © 2006 Heldref Publications
Closing the Digital Divide:Update From the Early Childhood
Longitudinal StudySHARON JUDGE KATHLEEN PUCKETT SHERRY MEE BELLUniversity of Tennessee, Knoxville Arizona State University, West University of Tennessee, Knoxville
ABSTRACT The authors examined the progress madetoward equitable technology access and use over children’sfirst 4 years of school. The sample consisted of 8,283 publicschool children who attended kindergarten, 1st, and 3rdgrades. In 3rd grade, high-poverty schools had significantlymore computers for instruction and a smaller ratio of childrento computers than did low-poverty schools. Over the first 4years of school, however, children attending low-povertyschools had significantly more access to home computers thandid those attending high-poverty schools. Children’s use ofcomputers during 3rd grade differed by school-poverty status.Results indicate that access to, and use of, a home computer,the presence of a computer area in classrooms, frequent use ofthe Internet, proficiency in computer use, and low-povertyschool status were correlated positively with academicachievement. In contrast, frequent use of software for readingwas correlated negatively with reading achievement.
Key words: computer access in high- and low-povertyschools; Early Childhood Longitudinal Study; kindergarten,first-, and third-grade children
O
52
and adolescents living in families with high SES (83% and75%, respectively). Increases in a student’s age, parent edu-cation, and family income were associated with an increasein a child’s tendency to use computers and the Internet. Inaddition, Becker (2000) found that technology available inschools with a majority of students from low-income fami-lies is usually 1 to 2 years behind that offered in schoolswith students from middle-income families, and 3 to 4 yearsbehind schools serving students from high-income families.
The number of computers available in American schoolsalso has increased substantially. In 2002, the average ratioof students to instructional computers with Internet accessin all public schools was 4.8 to 1, and nearly half of allclassrooms had at least one computer (Kleiner & Lewis,2003; Norris, Sullivan, Poirot, & Soloway, 2003; U.S.Department of Commerce, 2000). However, the ratio ofstudents to instructional computers with Internet accesswas higher in schools with the highest poverty concentra-tion than in schools with the lowest poverty concentration(5.5 to 1 compared with 4.6 to 1). Although some expertsconsider five students per computer a “reasonable level”(President’s Committee of Advisors on Science and Tech-nology, 1997), researchers familiar with details of these sta-tistics interpret the figures as evidence that most schools donot have the infrastructure necessary to use technology asan integral part of classroom practice. For example, surveydata gathered by Norris and colleagues indicate that whilethe average school ratio of computers may be 5 to 1, actualclassroom accessibility is much lower. Nearly half of U.S.classrooms are equipped with only one computer, and 97%of all classrooms have five or fewer computers per class.
Access is also hampered by the location of computers,which are often placed in laboratories rather than in class-rooms, a situation that further impedes access for studentsand teachers (Ringstaff & Kelley, 2002). For many students,opportunities for computer laboratory access vary. Norrisand colleagues (2003) found that 39% of all U.S. teachersreported no scheduled laboratory access, and 29% reportedlaboratory access of only 1 day per week. Their data show-ing number of classroom computers with days per week oflaboratory access illustrate that only 21% of teachers workin “technology rich” environments, defined as those havingmore than 10 computers per classroom or regular laboratoryaccess more than twice per week (Norris et al.). Althoughfew teachers reported no technology access, 29% worked intechnology poor environments, defined as no more than oneclassroom computer and no scheduled laboratory access.Thus, in spite of real gains in technology infrastructure inthe schools, the current status of technology access is still“instructionally inadequate” for meaningful integration oftechnology with instruction to occur (Norris et al.).
As part of the No Child Left Behind Act of 2001, theEnhancing Education Through Technology (ED Tech) pro-gram seeks improved student academic achievement in ele-mentary and secondary schools through technology to helpstudents become technically literate by the eighth grade
and to ensure that teachers integrate technology into thecurriculum to improve student achievement. Studies con-ducted on the effectiveness of technology in the classroomoften have mixed results, making it difficult for one to gen-eralize about the overall impact of technology in improvinglearning (Schacter, 1999; Sivin-Kachala & Bialo, 1999).More recent reports on the use of computers for instructionare beginning to demonstrate evidence of relationshipsbetween computer use and academic achievement (Brush,Armstrong, Barbrow, & Ulintz, 1999; Coley, Cradler, &Engel, 1998; Wenglinsky, 1998).
However, the types of opportunities that students haveto use computers vary widely. According to surveys con-ducted by the CEO Forum (2001), teachers in schools withlow-poverty concentrations assigned many more technolo-gy activities involving word processing and spreadsheets,multimedia, Internet research, graphic presentations, andsimulations than did teachers in schools with the highestpoverty concentrations. Smerdon and colleagues (2000)reported in “Teacher Use of Computers and the Internet inPublic Schools” that students in high-poverty schools usedcomputers for drill and practice 35% of the time, comparedwith students in low-poverty schools who used computersfor drill and practice 26% of the time. Other researchers(Becker, 2000; Norris et al., 2003; Swain & Pearson, 2002;Wenglinksy, 1998) concluded that students in schools withthe highest poverty concentrations used computers morefrequently than did students with low-poverty concentra-tions; however, computer use was not associated with aca-demic gains for students from high-poverty schools. Clear-ly, there is much information for one to learn about therelationship between children’s use of computer technolo-gy and their educational outcomes.
We build on earlier research examining young children’sdifferential access to computers in school and at home andthe varying conditions that affect the way in which chil-dren experience computers (Judge, Puckett, & Cabuk,2004). Data from the Early Childhood Longitudinal Study-Kindergarten (ECLS-K) Class of 1998–1999 (U.S. Depart-ment of Education, 2000) showed that low- and high-poverty schools were about equally likely to havecomputers available for children when they started theirformal schooling; however, the digital gap began to widenas children moved into first grade. Furthermore, high-poverty children were less likely to have a computer oraccess to the Internet at home. In the present study, we usedata from the ECLS-K to examine the progress towardequitable technology access and use over children’s first 4years of school, from the start of kindergarten to the end ofthird grade. We extend our previous research by addressingthe following questions: (a) Does technology access differfor children attending high-poverty and low-povertyschools? (b) Does computer use differ for children attend-ing high-poverty and low-poverty schools? and (c) Arethere differences in frequency of computer use according toacademic achievement and school-poverty concentrations?
September/October 2006 [Vol. 100(No. 1)] 53
54 The Journal of Educational Research
Method
Sample
The ECLS-K is the first large-scale nationally represen-tative sample of children studied as they age through ele-mentary school years. The U.S. Department of Educationdesigned and implemented the ECLS-K, which reporteddata collected over children’s first 4 years of school. Theprimary sampling units were geographic areas consisting ofcounties or groups of counties from which 1,280 public andprivate schools offering kindergarten programs participat-ed. The sample contained 21,260 children when it was cap-tured initially in fall 1998. As of summer 2004, data on thefull sample of children from Wave 1 (fall kindergarten),Wave 2 (spring kindergarten), Wave 4 (spring first grade),and Wave 5 (spring third grade) had been released for pub-lic use; we used data on public school children from Waves2, 4 and 5 for our analysis. (Wave 3 was not involvedbecause the sampling design of ECLS-K included a 27%subsample of the total sample in the fall of first grade.) Wecollected data from adaptive, individually administeredchild assessments, parent interviews, and teacher andschool administrator questionnaires.
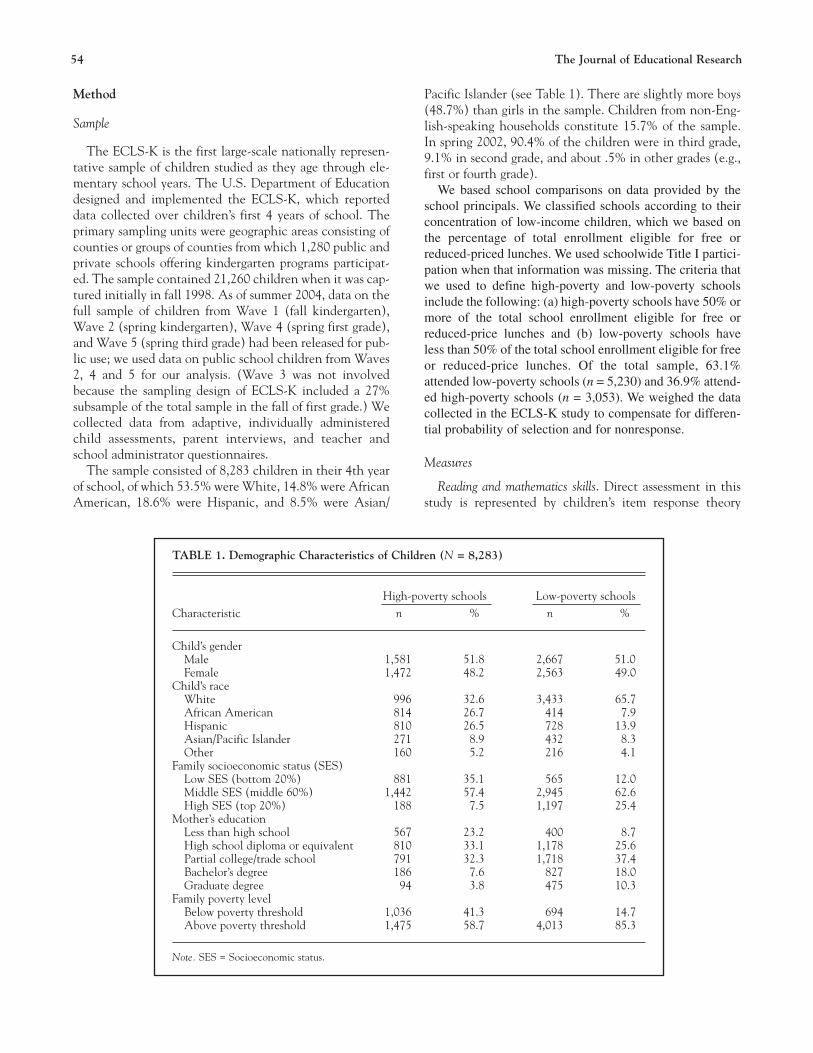
The sample consisted of 8,283 children in their 4th yearof school, of which 53.5% were White, 14.8% were AfricanAmerican, 18.6% were Hispanic, and 8.5% were Asian/
Pacific Islander (see Table 1). There are slightly more boys(48.7%) than girls in the sample. Children from non-Eng-lish-speaking households constitute 15.7% of the sample.In spring 2002, 90.4% of the children were in third grade,9.1% in second grade, and about .5% in other grades (e.g.,first or fourth grade).
We based school comparisons on data provided by theschool principals. We classified schools according to theirconcentration of low-income children, which we based onthe percentage of total enrollment eligible for free orreduced-priced lunches. We used schoolwide Title I partici-pation when that information was missing. The criteria thatwe used to define high-poverty and low-poverty schoolsinclude the following: (a) high-poverty schools have 50% ormore of the total school enrollment eligible for free orreduced-price lunches and (b) low-poverty schools haveless than 50% of the total school enrollment eligible for freeor reduced-price lunches. Of the total sample, 63.1%attended low-poverty schools (n = 5,230) and 36.9% attend-ed high-poverty schools (n = 3,053). We weighed the datacollected in the ECLS-K study to compensate for differen-tial probability of selection and for nonresponse.
Measures
Reading and mathematics skills. Direct assessment in thisstudy is represented by children’s item response theory
TABLE 1. Demographic Characteristics of Children (N = 8,283)
High-poverty schools Low-poverty schoolsCharacteristic n % n %
Child’s genderMale 1,581 51.8 2,667 51.0Female 1,472 48.2 2,563 49.0
Child’s raceWhite 996 32.6 3,433 65.7African American 814 26.7 414 7.9Hispanic 810 26.5 728 13.9Asian/Pacific Islander 271 8.9 432 8.3Other 160 5.2 216 4.1
Family socioeconomic status (SES)Low SES (bottom 20%) 881 35.1 565 12.0Middle SES (middle 60%) 1,442 57.4 2,945 62.6High SES (top 20%) 188 7.5 1,197 25.4
Mother’s educationLess than high school 567 23.2 400 8.7High school diploma or equivalent 810 33.1 1,178 25.6Partial college/trade school 791 32.3 1,718 37.4Bachelor’s degree 186 7.6 827 18.0Graduate degree 94 3.8 475 10.3
Family poverty levelBelow poverty threshold 1,036 41.3 694 14.7Above poverty threshold 1,475 58.7 4,013 85.3
Note. SES = Socioeconomic status.
(IRT) scale scores on an individually administered cogni-tive test in reading and mathematics in the spring of thirdgrade. The assessments included multiple-choice and open-ended questions; there were practice items for each type ofquestion format. We instructed children to answer ques-tions verbally or by pointing. Test reliabilities of the IRT-based reading and mathematics scores were high (between.94 and .95 for all assessments).
The reading test included items that measured phonemicawareness, single-word decoding, vocabulary, and passagecomprehension. The comprehension items measured skillsin initial understanding, developing interpretation, person-al reflection, and demonstrating a critical stance. The pas-sage reading section examined sentence, paragraph, andstory comprehension and comprised a variety of literacygenres. The reading section also included some of the moredifficult test items from the kindergarten through first-gradebattery, such as identifying sight words and reading words incontext to link the kindergarten and first-grade assessmentwith the third-grade assessment for scaling purposes. Themathematics test measured skills on number sense, proper-ties, and operations; measurement; geometry and spatialsense; data analysis, statistics, and probability; and pattern,algebra, and functions. Similar to the reading evaluation,we included a subset of items from the first-grade assessmentin the third-grade assessment to link the kindergarten andfirst-grade assessment with the third-grade assessment.
Technology access and computer use. We collected datathrough parent interviews and teacher and school adminis-trator questionnaires. School administrators and kinder-garten, first-grade, and third-grade teachers of the sampledchildren completed paper-and-pencil questionnaires assess-ing availability and adequacy of various computer resources.We asked teachers to rate the adequacy of their preparationto use computers with their class and adequacy of support forcomputer problems on a 5-point, Likert-type scale (1 =strongly disagree; 5 = strongly agree). Teachers also rated theirstudents’ proficiency in computers for a variety of goals on a5-point scale ranging from 1 (not yet) to 5 (proficient). In addi-tion, third-grade teachers indicated the frequency with whichtheir class as a whole used computers and the frequency of usefor several instructional purposes, including learning reading,mathematics, social studies, and science concepts, and forInternet access. School administrators also provided countson the total number of computers in the school and the num-ber of classrooms with computer resources. Parents providedinformation on whether there were home computers thattheir children used, frequency of computer use, and whethertheir child accessed the Internet from home.
Results
Technology Access in Classrooms and Homes
We examined descriptive statistics and mean compar-isons to determine differences and trends in technology
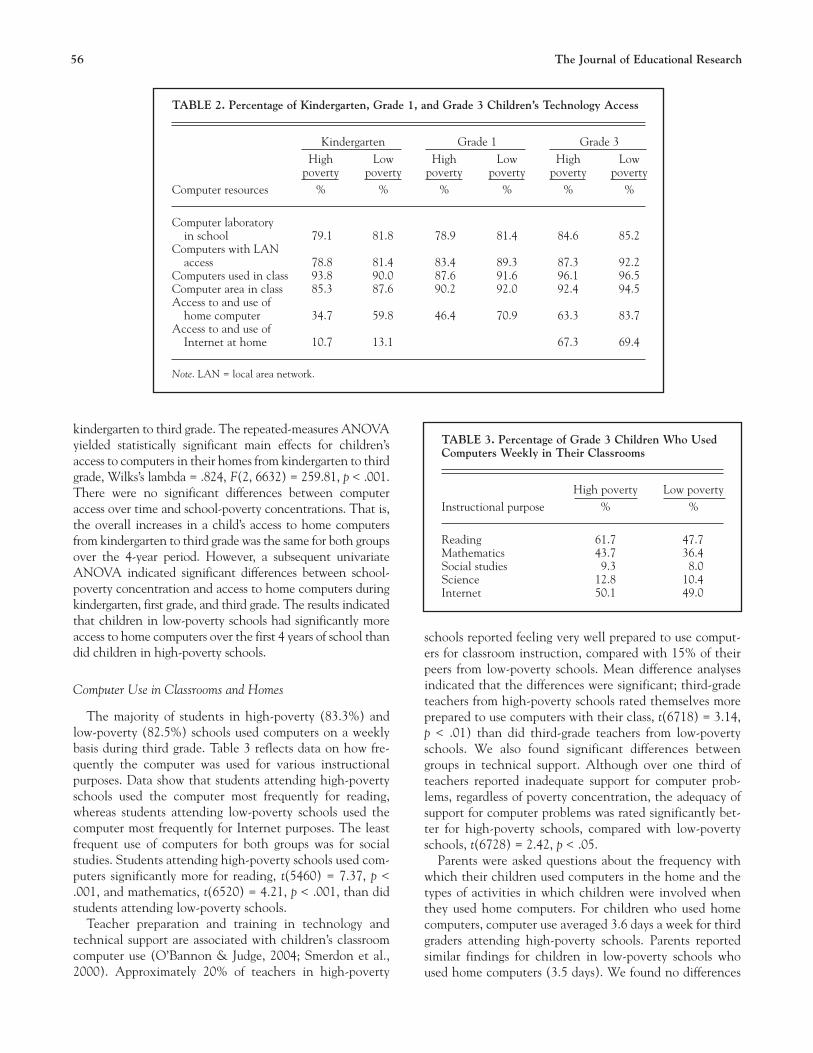
access in class and at home. The data indicate that tech-nology access increased over the first 4 years of children’sschooling. From kindergarten through third grade, all pub-lic school children attended schools that had at least onecomputer. However, the number of computers used duringthird grade varied greatly across schools—some schools hadmore than 400 computers, whereas other schools had lessthan 10 computers (range = 1–500 computers). High-poverty schools had an average of 125 computers perschool, compared with an average of 114 computers perschool for low-poverty schools. The majority of schools(84%) had computer laboratories. Mean difference analysisindicated no significant group differences regarding thepresence of a computer laboratory in the school duringthird grade or in the adequacy of these computer laborato-ries. Table 2 shows descriptive data on various aspects oftechnology access on the basis of school-poverty status.
Most children (approximately 96%) had computers avail-able in their classrooms during third grade. Among high-poverty schools, 5.7% of third-grade classrooms had noinstructional computers, whereas only 4% of classrooms inlow-poverty schools had no computers. However, childrenattending high-poverty schools had significantly moreinstructional computers, t(6749) = 3.97, p < .001, andinstructional computers with Internet access, t(6749) = 2.86,p < .01, in their classrooms than did children in low-povertyschools. Conversely, children attending low-poverty schoolshad significantly more computer areas, t(6741) = –2.16,p < .05, available in their classroom than did children inhigh-poverty schools.
We examined the availability of computer resources atschool in terms of the average student-to-computer ratio.The ratio of children to computers during third grade was5.3 to 1 in high-poverty schools, a figure that begins toapproximate the recommended ratio necessary to achieve areasonable level of technology integration within the cur-riculum (Ringstaff & Kelly, 2002; U.S. Department of Edu-cation, 1999). Low-poverty schools reported a ratio of 5.8third-grade students per computer, indicating the need forfurther resources to approximate the standard. Furthermore,high-poverty schools were more likely than were low-poverty schools to have classrooms with at least one com-puter for five students. During third grade, 60% of class-rooms in high-poverty schools had at least one computerper five children, whereas only 53% of classrooms in low-poverty schools reported the same. Those differences weresignificant, t(6623) = 5.26, p < .001, indicating more class-room computer access among high-poverty schools.
We compared children’s access to home computerresources by school-poverty concentration. As shown inTable 2, a high percentage of children in low-poverty schoolshad access to, and use of, home computers. Children’s accessto computers in their homes improved as they moved fromkindergarten to third grade. We used a repeated-measuresanalysis of variance (ANOVA) to test school-poverty con-centration differences on access to home computers from
September/October 2006 [Vol. 100(No. 1)] 55
56 The Journal of Educational Research
kindergarten to third grade. The repeated-measures ANOVAyielded statistically significant main effects for children’saccess to computers in their homes from kindergarten to thirdgrade, Wilks’s lambda = .824, F(2, 6632) = 259.81, p < .001.There were no significant differences between computeraccess over time and school-poverty concentrations. That is,the overall increases in a child’s access to home computersfrom kindergarten to third grade was the same for both groupsover the 4-year period. However, a subsequent univariateANOVA indicated significant differences between school-poverty concentration and access to home computers duringkindergarten, first grade, and third grade. The results indicatedthat children in low-poverty schools had significantly moreaccess to home computers over the first 4 years of school thandid children in high-poverty schools.
Computer Use in Classrooms and Homes
The majority of students in high-poverty (83.3%) andlow-poverty (82.5%) schools used computers on a weeklybasis during third grade. Table 3 reflects data on how fre-quently the computer was used for various instructionalpurposes. Data show that students attending high-povertyschools used the computer most frequently for reading,whereas students attending low-poverty schools used thecomputer most frequently for Internet purposes. The leastfrequent use of computers for both groups was for socialstudies. Students attending high-poverty schools used com-puters significantly more for reading, t(5460) = 7.37, p <.001, and mathematics, t(6520) = 4.21, p < .001, than didstudents attending low-poverty schools.
Teacher preparation and training in technology andtechnical support are associated with children’s classroomcomputer use (O’Bannon & Judge, 2004; Smerdon et al.,2000). Approximately 20% of teachers in high-poverty
schools reported feeling very well prepared to use comput-ers for classroom instruction, compared with 15% of theirpeers from low-poverty schools. Mean difference analysesindicated that the differences were significant; third-gradeteachers from high-poverty schools rated themselves moreprepared to use computers with their class, t(6718) = 3.14,p < .01) than did third-grade teachers from low-povertyschools. We also found significant differences betweengroups in technical support. Although over one third ofteachers reported inadequate support for computer prob-lems, regardless of poverty concentration, the adequacy ofsupport for computer problems was rated significantly bet-ter for high-poverty schools, compared with low-povertyschools, t(6728) = 2.42, p < .05.
Parents were asked questions about the frequency withwhich their children used computers in the home and thetypes of activities in which children were involved whenthey used home computers. For children who used homecomputers, computer use averaged 3.6 days a week for thirdgraders attending high-poverty schools. Parents reportedsimilar findings for children in low-poverty schools whoused home computers (3.5 days). We found no differences
TABLE 2. Percentage of Kindergarten, Grade 1, and Grade 3 Children’s Technology Access
Kindergarten Grade 1 Grade 3High Low High Low High Low
poverty poverty poverty poverty poverty povertyComputer resources % % % % % %
Computer laboratory in school 79.1 81.8 78.9 81.4 84.6 85.2
Computers with LANaccess 78.8 81.4 83.4 89.3 87.3 92.2
Computers used in class 93.8 90.0 87.6 91.6 96.1 96.5Computer area in class 85.3 87.6 90.2 92.0 92.4 94.5Access to and use of
home computer 34.7 59.8 46.4 70.9 63.3 83.7Access to and use of
Internet at home 10.7 13.1 67.3 69.4
Note. LAN = local area network.
TABLE 3. Percentage of Grade 3 Children Who UsedComputers Weekly in Their Classrooms
High poverty Low povertyInstructional purpose % %
Reading 61.7 47.7Mathematics 43.7 36.4Social studies 9.3 8.0Science 12.8 10.4Internet 50.1 49.0
September/October 2006 [Vol. 100(No. 1)] 57
in the frequency of home computer use during third gradewith respect to school-poverty concentration. Approxi-mately 69% of children who used home computers did so toaccess the Internet. There were no significant group differ-ences in home computer use for the Internet.
Differences in Computer Use by Achievement and School-Poverty Concentration
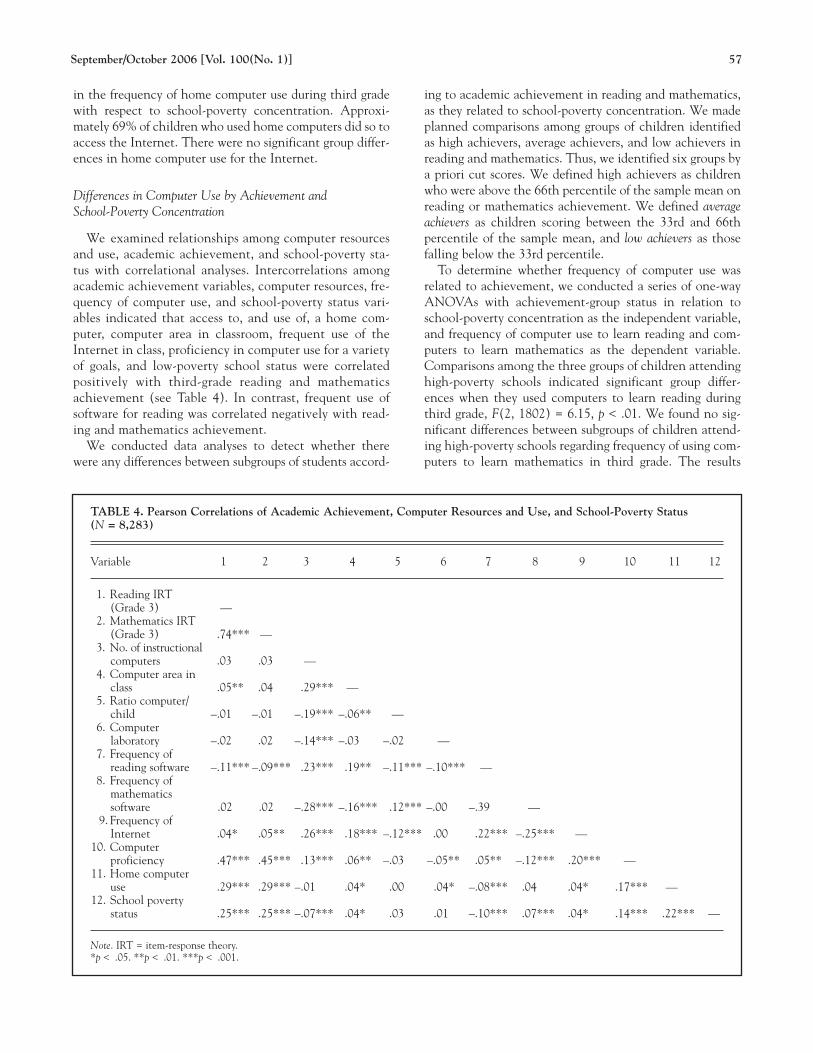
We examined relationships among computer resourcesand use, academic achievement, and school-poverty sta-tus with correlational analyses. Intercorrelations amongacademic achievement variables, computer resources, fre-quency of computer use, and school-poverty status vari-ables indicated that access to, and use of, a home com-puter, computer area in classroom, frequent use of theInternet in class, proficiency in computer use for a varietyof goals, and low-poverty school status were correlatedpositively with third-grade reading and mathematicsachievement (see Table 4). In contrast, frequent use ofsoftware for reading was correlated negatively with read-ing and mathematics achievement.
We conducted data analyses to detect whether therewere any differences between subgroups of students accord-
ing to academic achievement in reading and mathematics,as they related to school-poverty concentration. We madeplanned comparisons among groups of children identifiedas high achievers, average achievers, and low achievers inreading and mathematics. Thus, we identified six groups bya priori cut scores. We defined high achievers as childrenwho were above the 66th percentile of the sample mean onreading or mathematics achievement. We defined averageachievers as children scoring between the 33rd and 66thpercentile of the sample mean, and low achievers as thosefalling below the 33rd percentile.
To determine whether frequency of computer use wasrelated to achievement, we conducted a series of one-wayANOVAs with achievement-group status in relation toschool-poverty concentration as the independent variable,and frequency of computer use to learn reading and com-puters to learn mathematics as the dependent variable.Comparisons among the three groups of children attendinghigh-poverty schools indicated significant group differ-ences when they used computers to learn reading duringthird grade, F(2, 1802) = 6.15, p < .01. We found no sig-nificant differences between subgroups of children attend-ing high-poverty schools regarding frequency of using com-puters to learn mathematics in third grade. The results
TABLE 4. Pearson Correlations of Academic Achievement, Computer Resources and Use, and School-Poverty Status (N = 8,283)
Variable 1 2 3 4 5 6 7 8 9 10 11 12
1. Reading IRT (Grade 3) —
2. Mathematics IRT (Grade 3) .74*** —
3. No. of instructional computers .03 .03 —
4. Computer area in class .05** .04 .29*** —
5. Ratio computer/ child –.01 –.01 –.19*** –.06** —
6. Computer laboratory –.02 .02 –.14*** –.03 –.02 —
7. Frequency of reading software –.11*** –.09*** .23*** .19** –.11*** –.10*** —
8. Frequency of mathematics software .02 .02 –.28*** –.16*** .12*** –.00 –.39 —
9. Frequency of Internet .04* .05** .26*** .18*** –.12*** .00 .22*** –.25*** —
10. Computer proficiency .47*** .45*** .13*** .06** –.03 –.05** .05** –.12*** .20*** —
11. Home computer use .29*** .29*** –.01 .04* .00 .04* –.08*** .04 .04* .17*** —
12. School poverty status .25*** .25*** –.07*** .04* .03 .01 –.10*** .07*** .04* .14*** .22*** —
Note. IRT = item-response theory.*p < .05. **p < .01. ***p < .001.
indicate that children who were low achievers in reading athigh-poverty schools used computers to learn reading sig-nificantly more than did high achievers at those schoolsduring third grade.
Univariate analyses displayed significant group differ-ences with respect to third-grade children who attendedlow-poverty schools regarding their use of computers tolearn reading, F(2, 4348) = 8.72, p < .001. There were nosignificant group differences in using computers to learnmathematics for third-grade children in low-povertyschools. Similar to the high-poverty group, significant post-hoc comparisons revealed that low achievers in third-gradereading in low-poverty schools used computers more forreading than did the high-achieving group. There were nosignificant differences in computer usage between the highachievers and average achievers in low-poverty schools inthird grade.
Discussion
Our data indicate that overall access to computers andtechnology use is increasing. That finding is consistentwith recent reports (DeBell & Chapman, 2003; Kleiner &Lewis, 2003) documenting national progress toward tech-nology access and use among schoolchildren. In addition,data from the present study indicate that differences intechnology access between high- and low-poverty schoolshave decreased. Schools designated as high-poverty con-centration had more computers per school than did schoolsdesignated as low-poverty concentration (125 vs. 114).Furthermore, the ratio of children to computers was greaterfor third-grade students in low-poverty schools than forthose from high-poverty schools. Even though the ratio ofchildren to computers decreased from kindergarten to thirdgrade, only 60% of third-grade classrooms in high-povertyschools and 53% of classrooms in low-poverty schools hadenough classroom computers to provide a ratio of at leastone computer for every 5 students. Thus, for computers tobecome an integral tool for learning, further improvementsare needed in the quantity and quality of computers avail-able in classrooms.
Although equality of computer access and use hasimproved for all schools, a digital divide still exists in homecomputer access. Our findings indicate that althoughaccess to home computers increased significantly fromkindergarten to third grade for children attending high-poverty and low-poverty schools, those attending high-poverty schools had less access to home computers. Muchof the disparity regarding ownership of home computers isrelated to family income. In this analysis, almost all upperincome households had a computer that was available fortheir children (96.5%), yet less than half of low-incomehouseholds (45.4%) had a computer. Attowell (2000) hasshown that having a personal computer at home is associ-ated with high test scores in reading, even after controllingfor income and other factors. The data presented here indi-
cate that mathematics and reading achievement were cor-related significantly with home computer use. Thus, chil-dren’s lack of access to technology in the home can be adisadvantage.
Another important factor in effective computer use isstaff training and technology support. Teacher familiarity,confidence, and skill for choosing software and integratingtechnology into the curriculum are dependent on teachertraining and time for self-directed exploration and learn-ing. Research has shown that teachers who reported feelingbetter prepared were more likely to use those technologiesthan were their less prepared colleagues (Smerdon et al.,2000). Because only 15%–20% of all teachers believed thatthey were well prepared to use computers, technologytraining clearly should become a high priority.
Another concern is the high percentage of schools inboth groups that reported having computer laboratories.Computers concentrated in laboratories, rather than inter-spersed in classrooms, is an apparent conflict with recom-mendations regarding appropriate use of technologyresources. Research has shown that students were morethan twice as likely to use computers frequently when thecomputers were accessible in their classrooms, rather thanwhen they were located in the laboratories (Becker, 2000).
Although differences in access based on school-povertystatus have diminished, differences in computer use associ-ated with school-poverty status continue to exist. That is,students from high-poverty schools used computers morefor reading and mathematics, whereas students from low-poverty schools used computers more for Internet func-tions. That corroborates the findings of others (Becker,2000; Coley et al., 1998; Smerdon et al., 2000; Wenglinsky,1998) who reported more frequent use of computers byteachers of low-income students than by teachers of high-and moderate-income students. Although the data do notdescribe the instructional use or the type or quality of thesoftware, differing use by poverty concentration may indi-cate a concern.
Finally, more frequent computer use among low-achiev-ing readers from both economic groups did not result inacademic gains. Although computer use and access werecorrelated positively to achievement in several ways, fre-quency of computer use for reading was correlated nega-tively with achievement. Those findings are consistentwith those of Becker (2000), who found that students inhigh-poverty schools used computers more frequently thandid students in low-poverty schools, but this use was notassociated with gains in academic achievement.
These findings raise some issues that might be of inter-est. Why should frequency of computer use be associatednegatively with reading achievement? Although beyondthe scope of our data, it would be informative for educatorsto know how and what types of software are being used inhigh- versus low-poverty schools, and with high versus lowachievers. If, as indicated by Becker (2000), teachers oflow-achieving students use more drill- and practice-type
58 The Journal of Educational Research
software, perhaps these students are spending relativelymore of their instructional time in front of computers andless instructional time face to face with a teacher. ANational Reading Panel report (see National Institute ofChild Health and Human Development, 2000) suggeststhat low-achieving students may benefit from instructiondesigned to improve basic reading skills and fluency, butthis type of instruction should not replace face-to-face timewith a teacher engaged in a variety of literacy and problem-solving activities. If drill-and-practice computer instructionreplaces face-to-face teacher instruction, net achievementgains may not be exhibited. According to the NationalReading Panel, the efficacy of computer instruction forreading still needs to be investigated. Researchers need todetermine not only the nature and frequency of computerinstruction occurring in classrooms but also the place ofthis instruction within the context of overall reading andmathematics instruction within classrooms.
The first limitation of this study is the lack of specificinformation on the quality of hardware and software avail-able or the convenience of access. As a secondary dataanalysis, our construction of the use of computer resourcesmeasures is confined to the questions that were included inthe survey for teachers and school administrators. Theteacher questionnaires assessed only the frequencies ofcomputer use for various instructional purposes in theirclassroom as a whole. We do not know how much timechildren spent using computers. The second limitation isthat although school and classroom indicators provided theoverall level of resources available to students in the schoolattended, they did not provide direct information onwhether certain computer resources were available to theparticipants. The third limitation is that children’s accessto, and use of, computer resources were compared fromkindergarten in spring 1999 to third grade in spring 2002.Differences found across grade levels may also be creditedto increased computer resources from 1999 to 2002.
Schools are apparently achieving digital-equity goals interms of computer access, but issues of use are still a con-cern. Significant differences also remain in home comput-er use by students of disparate socioeconomic backgrounds.To bridge the digital divide and receive the benefits thatsociety desires for children, attention to the human ele-ment must accompany progress in computer access. Teach-ers need (a) improved technology skills, (b) ability to inte-grate technology into effective instruction, and (c) a beliefsystem that supports high expectations for all students. Thekindergarten class of 1999 has experienced great gains inaccess and use of technology during the first 4 years of thisstudy. The critical goal of digital inclusion for all childrenwill greatly help young people become productive andengaged citizens in the 21st century.
NOTES
This research was supported by a grant from the American EducationalResearch Association, which receives funds for its AERA Grants Program
from the National Science Foundation and the U.S. Department of Edu-cation (National Center for Education of the Office of EducationalResearch and Improvement) under NSF Grant No. REC-9980573. Opin-ions reflect those of the authors and do not necessarily reflect those of thegranting agencies.
REFERENCES
Attowell, P. (2000, November). Beyond the digital divide (Working PaperNo. 164). New York: Sage.
Becker, H. J. (2000). Who’s wired and who’s not: Children’s access to anduse of computer technology. The Future of Children: Children and Com-puter Technology, 10(2), 44–75.
Brush, T. A., Armstrong, J., Barbrow, D., & Ulintz, L. (1999). Design anddelivery of integrated learning systems: Their impact on studentachievement and attitudes. Journal of Educational Computing Research,21, 475–486.
CEO Forum. (2001, June). School technology and readiness report. RetrievedJune 21, 2002, from http://www.ceoforum.org/downloads/report4.pdf
Coley, R., Cradler, J., & Engel, P. (1998). Computers and classrooms: Thestatus of technology in U.S. schools. Princeton, NJ: Educational TestingService.
DeBell, M., & Chapman, C. (2003). Computer and Internet use by childrenand adolescents in 2001 (NCES 2004-014). U.S. Department of Educa-tion, Washington, DC: National Center for Education Statistics.
Fairlie, R. (2002). Race and the digital divide. Chicago: Joint Center forPoverty Research.
Judge, S., Puckett, K., & Cabuk, B. (2004). Digital equity: New findingsfrom the Early Childhood Longitudinal Study. Journal of Research onTechnology in Education, 36(4), 383–396.
Kleiner, A., & Lewis, L. (2003). Internet access in U.S. public schools andclassrooms: 1994-2002 (NCES 2004-011). U.S. Department of Educa-tion, Washington, DC: National Center for Education Statistics.
National Institute for Community Innovations. (2003). The five dimen-sions of digital equity. Retrieved August 29, 2003, from http://digitalequity.edreform.net/
National Institute of Child Health and Human Development. (2000).Teaching children to read: An evidence-based assessment of the scientificresearch literature on reading and its implications for reading instruction(National Reading Panel Report No. 00-4769). Washington, DC: U.S.Government Printing Office.
No Child Left Behind Act of 2001, Pub. L. No. 107–110, 115 Stat. 1425 (2002). Norris, C., Sullivan, T., Poirot, J., & Soloway, E. (2003). No access, no
use, no impact: Snapshot surveys of educational technology in K–12.Journal of Research on Technology in Education, 36(1), 15–27.
O’Bannon, B., & Judge, S. (2004). Implementing partnerships across thecurriculum with technology. Journal of Research on Technology in Educa-tion, 37(2), 197–216.
President’s Committee of Advisors on Science and Technology. (1997).Report to the President on the use of technology to strengthen K–12 educa-tion in the United States. [Online version]. Washington, DC: U.S. Gov-ernment, Office of Science and Technology Policy. Retrieved June 6,2002, from http://www.ostp.gov/PCAST/k-12ed.html
Puma M., Chapin, D., & Pape, A. (2003). E-rate and the digital divide: Apreliminary analysis from the integrated studies of educational technology.Washington DC: The Urban Institute.
Ringstaff, C., & Kelley, L. (2002). The learning return on our education tech-nology investment: A review of findings from research. San Francisco:WestEd. Retrieved July 21, 2003, from www.WestEd.org/online_ppubs/learning_return.pdf
Schacter, J. (1999). The impact of education technology on student achieve-ment: What the most current research has to say. Santa Monica, CA:Milken Exchange on Education Technology. (ERIC Document Repro-duction Service No. ED430537)
Sivin-Kachala, J., & Bialo, E. R. (1999). 1999 research report on the effec-tiveness of technology in schools (6th ed.). Washington, DC: Software andInformation Industry Association.
Smerdon, B., Cronen, S., Lanahan, L., Anderson, J., Iannotti, N., &Angeles J. (2000). Teachers’ tools for the 21st century: A report on teach-ers’ use of technology (NCES 2000-102). U.S. Department of Education,Washington, DC: National Center for Education Statistics.
Solomon, G. (2002). Digital equity: It’s not just about access anymore.Technology & Learning, 22(9), 18–26.
Swain, C., & Pearson, T. (2002). Educators and technology standards:
September/October 2006 [Vol. 100(No. 1)] 59

60 The Journal of Educational Research
Influencing the digital divide. Journal of Research on Technology in Edu-cation, 34(3), 326–336.
U.S. Department of Commerce. (2000, October). Falling through the net:Toward digital inclusion. Retrieved June 6, 2002, from http://search.ntia.doc.gov/pdf/fttnoo.pdf
U.S. Department of Education. (1999). Student computer use (Office of
Educational Research and Improvement, NCES Publication 1999-011). Washington, DC: U.S. Government Printing Office.
Wenglinsky, H. (1998). Does it compute? The relationship between educa-tional technology and student achievement in mathematics (Policy informa-tion report. Princeton, NJ: Educational Testing Services. RetrievedJune 12, 2002, from http://ftp.ets.org/pub/res/technolog.pdf

Related Documents