Clonal and systemic analysis of long- term hematopoiesis in the mouse Craig T. Jordan and Ihor R. Lemischka 1 Department of Biology, Princeton University, Princeton, New Jersey 08544 USA We have analyzed the temporal in vivo fate of 142 individual stem cell clones in 63 reconstituted mice. Long- term sequential analyses of the four major peripheral blood lineages, obtained from animals engrafted with genetically marked stem cells, indicate that developmental behavior is primarily a function of time. As such, the first 4-6 months post-engraftment is characterized by frequent fluctuations in stem cell proliferation and differentiation behavior. Gradually, a stable hematopoietic system emerges, dominated by a small number of totipotent clones. We demonstrate that single stem cell clones are sufficient to maintain hematopoiesis over the lifetime of an animal and suggest that mono- or oligoclonality may be a hallmark of long-term reconstituted systems. A model is proposed, wherein lineage-restricted differentiation and dramatic clonal flux are consequences of mechanisms acting on an expanding pool of totipotent cells and are not indicative of intrinsically distinct stem cell classes. [Key Words: Hematopoiesis; stem cells; clonal analysis; developmental behavior] Received September 25, 1989; revised version accepted November 29, 1989. Hematopoiesis is a complex program of cellular differen- tiation that yields at least eight cell lineages in a contin- uous and regulated fashion (for review, see Metcalf 1988). At the center of this system is a population of stem cells endowed with the ability to self-renew, as well as to differentiate into mature cell types. The in vivo developmental and proliferative properties of such cells have been inferred by functional assays involving transplantation of marked cell populations into radia- tion-ablated or genetically deficient mice (for review, see Dexter and Spooncer 1987). The existence of totipotent stem cells able to clonally contribute to all mature blood cell populations has been established (Abramson et al. 1977); however, the inherent limitations of classical techniques have not permitted a definition of develop- mental events occurring at early times in the clonal pro- liferation of totipotent cells. Other studies have defined classes of progenitor cells with limited in vitro developmental and self-renewal potential (Metcalf 1984). These cells are considered to be closely linked to mature cell populations and, as such, define the opposite end of a hematopoietic hierarchy, in which a segregation of developmental potential accom- panies a decrease in self-renewal capacity (Ogawa et al. 1983}. These in vitro studies have also suggested that developmental decisions of self-renewal and lineage commitment may be governed by stochastic mecha- nisms (Korn et al. 1973; Nakahata et al. 1982). Other studies have indicated that specific microenvironments 1Correspondingauthor. are instrumental in determining stem or progenitor cell behavior (Trentin 1970; Dexter et al. 1976}. More recent in vivo studies have employed retroviral- mediated gene transfer to efficiently and randomly mark the entire spectrum of stem cells {Dick et al. 1985; Keller et al. 1985; Lemischka et al. 1986). The distribu- tion of proviral markers in mature tissues identifies dis- tinct types of stem cell developmental behavior. These include totipotent lineage contribution, as well as a va- riety of contributions to individual lineages or subsets of lineages. Such lineage-restricted behavior may represent intrinsically distinct classes of stem cells, the influence of the host environment, or the result of stochastic mechanisms acting on unrestricted totipotent stem cells. Previous studies have also demonstrated that the clonal contribution of individual stem cells to mature hematopoietic tissues can change with time (Mintz et al. 1984; Lemischka et al. 1986; Snodgrass and Keller 1987; Capel et al. 1989). These fluctuations have been interpreted as a reflection of previously proposed clonal succession models of stem cell utilization (Kay 1965; Micklem et al. 1983, 1987; Mintz et al. 1984}. However, because of the limited scope of these approaches and their inability to sample the system sequentially, these studies may simply reflect a system not at steady-state or particular post-reconstitution demands. Taken together, these experimental difficulties neces- sitated a long-term, sequential lineage-specific analysis in deriving an accurate developmental and proliferative fate map of stem cell behavior. Consequently, in the 220 GENES & DEVELOPMENT 4:220-232 © 1990 by Cold Spring HarborLaboratory Press ISSN0890-9369/90 $1.00 Cold Spring Harbor Laboratory Press on January 31, 2022 - Published by genesdev.cshlp.org Downloaded from

Welcome message from author
This document is posted to help you gain knowledge. Please leave a comment to let me know what you think about it! Share it to your friends and learn new things together.
Transcript
Clonal and systemic analysis of long- term hematopoiesis in the mouse Craig T. Jordan and Ihor R. L e m i s c h k a 1
Department of Biology, Princeton University, Princeton, New Jersey 08544 USA
We have analyzed the temporal in vivo fate of 142 individual stem cell clones in 63 reconstituted mice. Long- term sequential analyses of the four major peripheral blood lineages, obtained from animals engrafted with genetically marked stem cells, indicate that developmental behavior is primarily a function of time. As such, the first 4-6 months post-engraftment is characterized by frequent fluctuations in stem cell proliferation and differentiation behavior. Gradually, a stable hematopoietic system emerges, dominated by a small number of totipotent clones. We demonstrate that single stem cell clones are sufficient to maintain hematopoiesis over the lifetime of an animal and suggest that mono- or oligoclonality may be a hallmark of long-term reconstituted systems. A model is proposed, wherein lineage-restricted differentiation and dramatic clonal flux are consequences of mechanisms acting on an expanding pool of totipotent cells and are not indicative of intrinsically distinct stem cell classes.
[Key Words: Hematopoiesis; stem cells; clonal analysis; developmental behavior]
Received September 25, 1989; revised version accepted November 29, 1989.
Hematopoiesis is a complex program of cellular differen- tiation that yields at least eight cell lineages in a contin- uous and regulated fashion (for review, see Metcalf 1988). At the center of this system is a population of stem cells endowed with the ability to self-renew, as well as to differentiate into mature cell types. The in vivo developmental and proliferative properties of such cells have been inferred by functional assays involving transplantation of marked cell populations into radia- tion-ablated or genetically deficient mice (for review, see Dexter and Spooncer 1987). The existence of totipotent stem cells able to clonally contribute to all mature blood cell populations has been established (Abramson et al. 1977); however, the inherent limitations of classical techniques have not permitted a definition of develop- mental events occurring at early times in the clonal pro- liferation of totipotent cells.
Other studies have defined classes of progenitor cells with limited in vitro developmental and self-renewal potential (Metcalf 1984). These cells are considered to be closely linked to mature cell populations and, as such, define the opposite end of a hematopoietic hierarchy, in which a segregation of developmental potential accom- panies a decrease in self-renewal capacity (Ogawa et al. 1983}. These in vitro studies have also suggested that developmental decisions of self-renewal and lineage commitment may be governed by stochastic mecha- nisms (Korn et al. 1973; Nakahata et al. 1982). Other studies have indicated that specific microenvironments
1Corresponding author.
are instrumental in determining stem or progenitor cell behavior (Trentin 1970; Dexter et al. 1976}.
More recent in vivo studies have employed retroviral- mediated gene transfer to efficiently and randomly mark the entire spectrum of stem cells {Dick et al. 1985; Keller et al. 1985; Lemischka et al. 1986). The distribu- tion of proviral markers in mature tissues identifies dis- tinct types of stem cell developmental behavior. These include totipotent lineage contribution, as well as a va- riety of contributions to individual lineages or subsets of lineages. Such lineage-restricted behavior may represent intrinsically distinct classes of stem cells, the influence of the host environment, or the result of stochastic mechanisms acting on unrestricted totipotent stem cells.
Previous studies have also demonstrated that the clonal contribution of individual stem cells to mature hematopoietic tissues can change with time (Mintz et al. 1984; Lemischka et al. 1986; Snodgrass and Keller 1987; Capel et al. 1989). These fluctuations have been interpreted as a reflection of previously proposed clonal succession models of stem cell utilization (Kay 1965; Micklem et al. 1983, 1987; Mintz et al. 1984}. However, because of the limited scope of these approaches and their inability to sample the system sequentially, these studies may simply reflect a system not at steady-state or particular post-reconstitution demands.
Taken together, these experimental difficulties neces- sitated a long-term, sequential lineage-specific analysis in deriving an accurate developmental and proliferative fate map of stem cell behavior. Consequently, in the
220 GENES & DEVELOPMENT 4:220-232 © 1990 by Cold Spring Harbor Laboratory Press ISSN 0890-9369/90 $1.00
Cold Spring Harbor Laboratory Press on January 31, 2022 - Published by genesdev.cshlp.orgDownloaded from
present studies, we have developed a system and applied techniques to permit such an in vivo evaluation of s tem cell behavior.
Results
We analyzed the behavior of 142 hematopoietic s tem cells in the context of 63 recipients for periods of 4 - 1 6 months. Our basic strategy employed transplantation of retrovirally "marked" stem cells into lethally irradiated adult mice. Because of random retroviral integration properties, each virally transduced s tem cell is uniquely marked. On engraftment of such marked stem cells, their developmental and proliferative behavior is mea- sured by Southern blot analysis of the distribution and molar i ty of proviral markers in DNA obtained from ma- ture hematopoiet ic tissues. Similarly, f luctuation in s tem cell behavior can be identified by the variation of markers over time.
Temporal analysis strategy
The first step in the experimental strategy is the in vitro infection of hematopoiet ic tissue wi th recombi- nant retroviruses. In the following studies, adult bone marrow obtained at different stages of a post-5-fluoro- uracil (5-FU) regeneration period, as well as mid-gesta- tion (day 14) fetal liver, were used as s tem cell sources. A
Clonal dynamics of the hematopoietic system
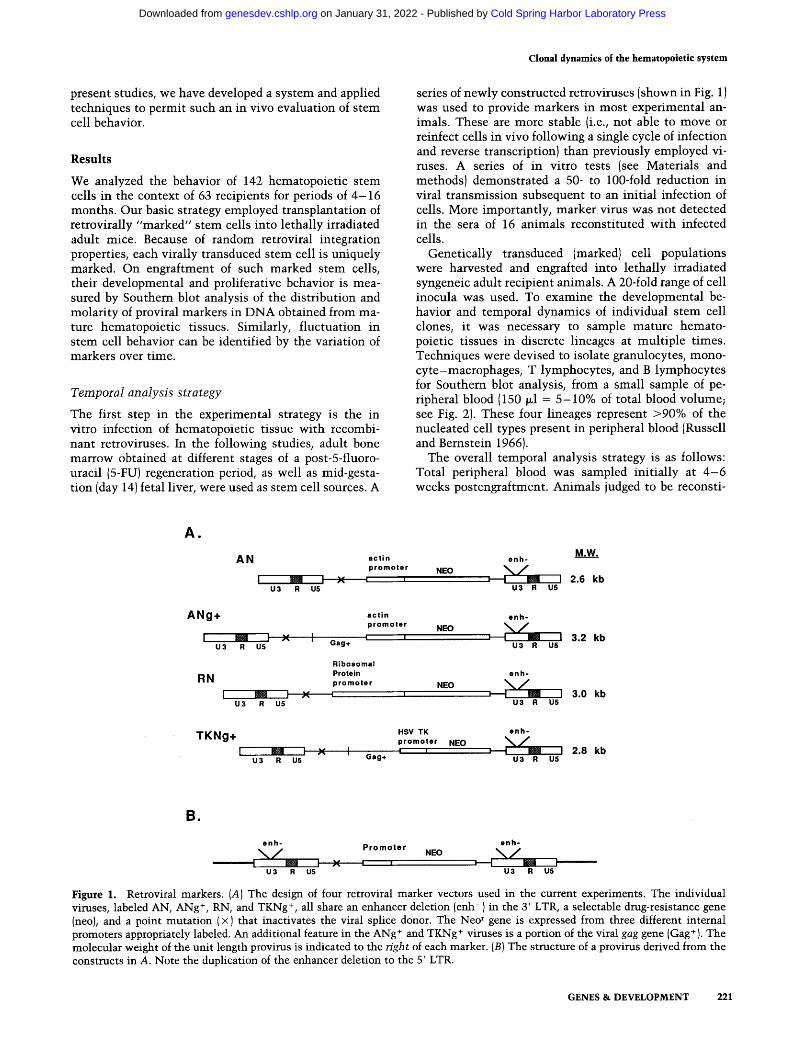
series of newly constructed retroviruses {shown in Fig. 1) was used to provide markers in most experimental an- imals. These are more stable {i.e., not able to move or reinfect cells in vivo following a single cycle of infection and reverse transcription} than previously employed vi- ruses. A series of in vitro tests (see Materials and methods) demonstrated a 50- to 100-fold reduction in viral t ransmission subsequent to an init ial infection of cells. More importantly, marker virus was not detected in the sera of 16 animals reconstituted wi th infected cells.
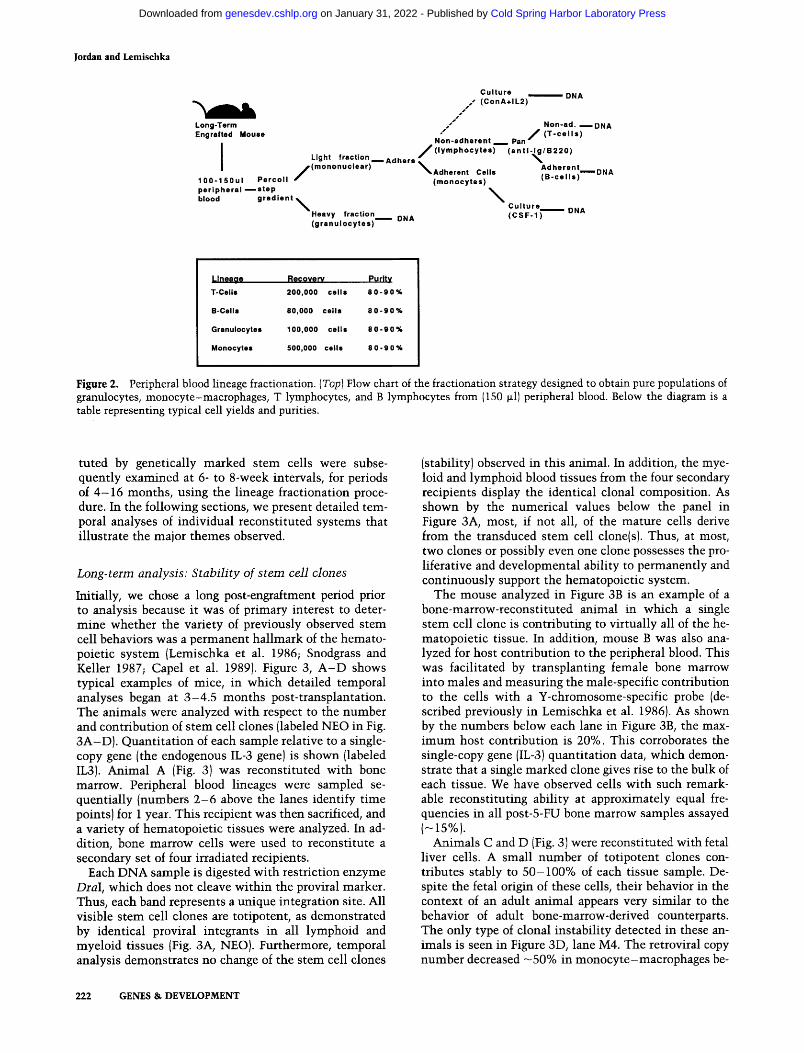
Genet ical ly transduced {marked) cell populations were harvested and engrafted into lethal ly irradiated syngeneic adult recipient animals. A 20-fold range of cell inocula was used. To examine the developmental be- havior and temporal dynamics of individual s tem cell clones, it was necessary to sample mature hemato- poietic tissues in discrete lineages at mul t ip le times. Techniques were devised to isolate granulocytes, mono- cyte-macrophages, T lymphocytes, and B lymphocytes for Southern blot analysis, from a small sample of pe- ripheral blood (150 txl = 5 - 1 0 % of total blood volume; see Fig. 2). These four lineages represent >90% of the nucleated cell types present in peripheral blood {Russell and Bemstein 1966).
The overall temporal analysis strategy is as follows: Total peripheral blood was sampled ini t ia l ly at 4 - 6 weeks postengraftment. Animals judged to be reconsti-
A.
A N
I B : ~. U3 R U5
A N g +
I U3
m : ~. : R U5 Gag+
R N I m : ;<
U3 R U5
T K N g +
I U3
M . W . e c t i n e n h - p r o m o t e r NSO ~
. I ~ I ~ I 2 .6 k b U3 R U5
e c t i n e n h - p r o m o t e r N E O ~ /
; ~ ~ m I 3 .2 k b U3 R U5
Ribosomal Protein • n h- p r o m o t e r NEO ~ J , ~ ~ ~ 1 I 3 .0 k b
U3 R U5
HSV TK e n h - p r o m o t e r NEO ~ J
Be. '. ~-. ', • , P-- ' l mm I 2 . 8 k b R U5 Gag+ U3 R U5
B.
e n h - e n h - ~ / / P r o m o t e r NEO ~ . ~
I IWI : ~ , ; i I ~ l i l I U 3 R U5 U 3 R U5
Figure 1. Retroviral markers. (A) The design of four retroviral marker vectors used in the current experiments. The individual viruses, labeled AN, ANg ÷, RN, and TKNg ÷, all share an enhancer deletion (enh-I in the 3' LTR, a selectable drug-resistance gene (neo), and a point mutation Ix) that inactivates the viral splice donor. The Neo r gene is expressed from three different internal promoters appropriately labeled. An additional feature in the ANg ÷ and TKNg ÷ viruses is a portion of the viral gag gene (Gag + t. The molecular weight of the unit length provirus is indicated to the right of each marker. [B) The structure of a provirus derived from the constructs in A. Note the duplication of the enhancer deletion to the 5' LTR.
GENES & DEVELOPMENT 221
Cold Spring Harbor Laboratory Press on January 31, 2022 - Published by genesdev.cshlp.orgDownloaded from
Jordan and Lemischka
Culture DNA / (ConA+IL2)
Long-Term j Non-ad. ~ DNA Engrafted Mouse "" Non-adherent ~ Pan / (T-cells)
Light f r a c t i o n A d h e r e / ( l y m p h o c y t e s ) ( e n t i - ~ / . 2 2 0 )
Adherent 100-150 I Percoll / ( m o n o n u c l e a r ) NAdherent Cells ( B . c e l l s ) ~ D N A
u (monocytes) peripheral ~ s t e p N blood gradient
Culture DNA Heavy f r a c t i o n DNA (CSF-1) (granulocytes)
Llneaoe Recoverv Purltv T-Cells 200,000 cel ls 8 0 - 9 0 %
B-Cells 80,000 cel ls 8 0 - 9 0 %
Granulocytes 100,000 cells 8 0 - 9 0 %
Monocytea 500,000 cells 8 0- 9 0 %
Figure 2. Peripheral blood lineage fractionation. (Top) Flow chart of the fractionation strategy designed to obtain pure populations of granulocytes, monocyte-macrophages, T lymphocytes, and B lymphocytes from (150 ~1) peripheral blood. Below the diagram is a table representing typical cell yields and purities.
tuted by genetically marked stem cells were subse- quently examined at 6- to 8-week intervals, for periods of 4 -16 months, using the lineage fractionation proce- dure. In the following sections, we present detailed tem- poral analyses of individual reconstituted systems that illustrate the major themes observed.
Long-term analysis: Stability of stem cell clones
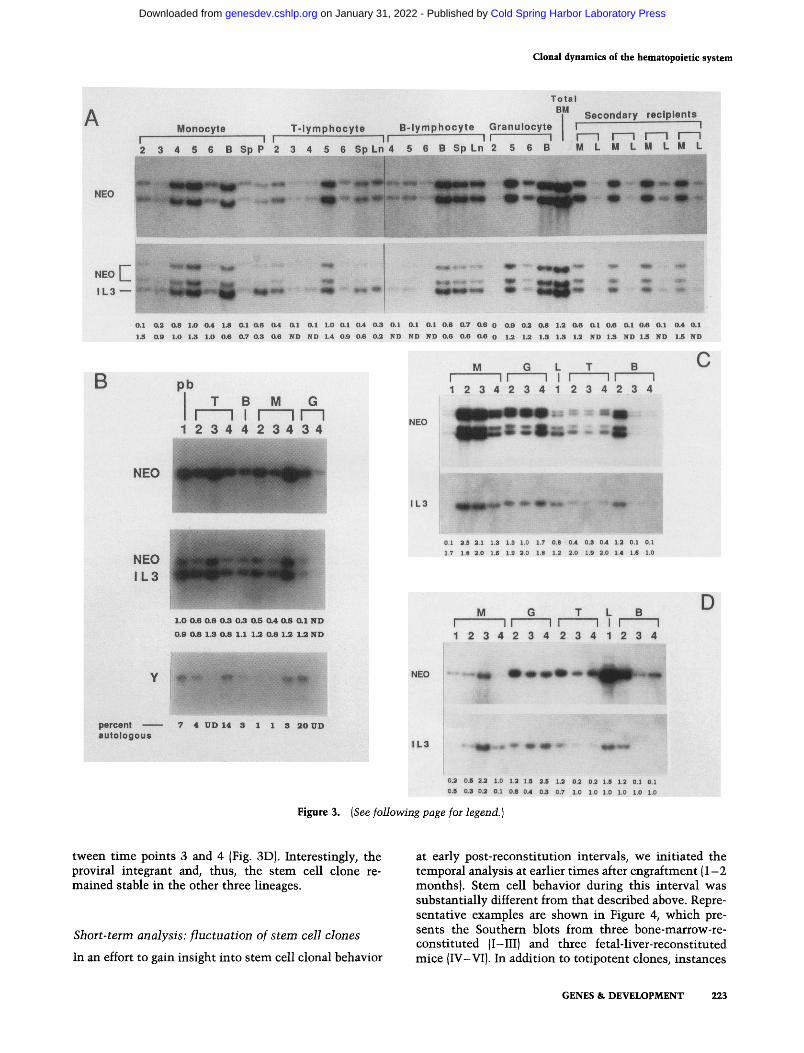
Initially, we chose a long post-engraltment period prior to analysis because it was of primary interest to deter- mine whether the variety of previously observed stem cell behaviors was a permanent hallmark of the hemato- poietic system (Lemischka et al. 1986; Snodgrass and Keller 1987; Capel et al. 1989). Figure 3, A - D shows typical examples of mice, in which detailed temporal analyses began at 3-4 .5 months post-transplantation. The animals were analyzed with respect to the number and contribution of stem cell clones {labeled NEO in Fig. 3A-D). Quantitation of each sample relative to a single- copy gene (the endogenous IL-3 gene) is shown {labeled IL3). Animal A (Fig. 3) was reconstituted with bone marrow. Peripheral blood lineages were sampled se- quentially (numbers 2 - 6 above the lanes identify time points) for 1 year. This recipient was then sacrificed, and a variety of hematopoietic tissues were analyzed. In ad- dition, bone marrow cells were used to reconstitute a secondary set of four irradiated recipients.
Each DNA sample is digested with restriction enzyme DraI, which does not cleave within the proviral marker. Thus, each band represents a unique integration site. All visible stem cell clones are totipotent, as demonstrated by identical proviral integrants in all lymphoid and myeloid tissues (Fig. 3A, NEO). Furthermore, temporal analysis demonstrates no change of the stem cell clones
(stability) observed in this animal. In addition, the mye- loid and lymphoid blood tissues from the four secondary recipients display the identical clonal composition. As shown by the numerical values below the panel in Figure 3A, most, if not all, of the mature cells derive from the transduced stem cell clone(s). Thus, at most, two clones or possibly even one clone possesses the pro- liferative and developmental ability to permanently and continuously support the hematopoietic system.
The mouse analyzed in Figure 3B is an example of a bone-marrow-reconstituted animal in which a single stem cell clone is contributing to virtually all of the he- matopoietic tissue. In addition, mouse B was also ana- lyzed for host contribution to the peripheral blood. This was facilitated by transplanting female bone marrow into males and measuring the male-specific contribution to the cells with a Y-chromosome-specific probe (de- scribed previously in Lemischka et al. 1986). As shown by the numbers below each lane in Figure 3B, the max- imum host contribution is 20%. This corroborates the single-copy gene (IL-3) quantitation data, which demon- strate that a single marked clone gives rise to the bulk of each tissue. We have observed cells with such remark- able reconstituting ability at approximately equal fre- quencies in all post-5-FU bone marrow samples assayed (-15%).
Animals C and D (Fig. 31 were reconstituted with fetal liver cells. A small number of totipotent clones con- tributes stably to 50-100% of each tissue sample. De- spite the fetal origin of these cells, their behavior in the context of an adult animal appears very similar to the behavior of adult bone-marrow-derived counterparts. The only type of clonal instability detected in these an- imals is seen in Figure 3D, lane M4. The retroviral copy number decreased -50% in monocyte-macrophages be-
222 GENES & DEVELOPMENT
Cold Spring Harbor Laboratory Press on January 31, 2022 - Published by genesdev.cshlp.orgDownloaded from
NEO
NEO [ IL3
! 2 3 4 5 6 B Sp P 2 3 4 5 S SpLn 4
B
Clonal dynamics of the hematopoietic system
Total
BMI SeCondary recipients
Monocyte T- lymphocyte B- lymphocyte Granulocyte I I . . . . . . . . I i I i! I[ l I ~ F'--I I---'I r~
5 6 B Sp Ln 2 5 6 B M L M L M L M L //
N E O
A
percent autologous
0 . I 0,2 0,8 1.0 0.4 1.8 0, I 0.6 0.4 0.1 0. I L 0 0 . I 0 A 0.3 0 . I 0 . I 0.1 0.8 0.7 0.6 0 0,9 0.2 0.8 1.2 0.6 0 , I 0.6 0 . I 0 .6 (I,1 0 A 0 . l
1.5 (kS) 1.0 1.3 1.0 0,6 0.7 0.3 0.6 ND ND 1.4 0.9 0.6 0.2 ND ND ND 0.6 0.6 (1.6 0 1.2 1.2 1.3 1,3 1.2 ND 1.3 ND 1.5 ND 1.5 ND
NEO
N E O
I L 3
pb
i T I B M G I I ' - ' - '1 i - 7
1 2 3 4 4 2 3 4 3 4
1.0 0 .6 0 .8 0 . 3 0 .8 0 .5 0 .4 0 .8 0.1 N D
0 .9 0 .8 1.3 0 . 8 1.1 1.2 0 . 8 1 .2 1.2 N D
7 4 U I ) 1 4 8 1 ~ 8 2 0 U D
IL3
i': ̧ :?iilJiii:<i? , ~ , ~ :!~ : ~I/:C91.I/:I~I~I
M G L T B ............. I I ~ l I r .............. I I I
1 2 , 3 4 , 2 3 4 1 2 3 4 2 3 4 . . . .
C
0.1 3.5 2.1 1,3 1,3 1.0 1.7 0,8 0A 0.3 0A 1.2 0,1 0.1
1.7 1.8 2.9 1.6 149 20 1,8 1,2 2.0 1.9 2,0 1.4 1,6 1,0
NEO
M G T L B I . . . . . . . . . . i i - - - - ' - ~ i J I r - - - - - " l 1 2 3 4 2 3 4 2 3 4 1 2 3 4
D
IL3
0.2 0JS 2~ 1.0 1.2 1~5 3~5 1.2 0.2 0~2 L8 1.3 0.I 0;1
0.5 0.3 0~ 0~1 O~S ~)A g.S 0.7 10 1,0 L0 1.0 1.9 1,0
Figure 3. (See following page for legend.)
tween time points 3 and 4 (Fig. 3D). Interestingly, the proviral integrant and, thus, the stem cell clone re- mained stable in the other three lineages.
Short-term analysis: fluctuation of stem cell clones
In an effort to gain insight into stem cell clonal behavior
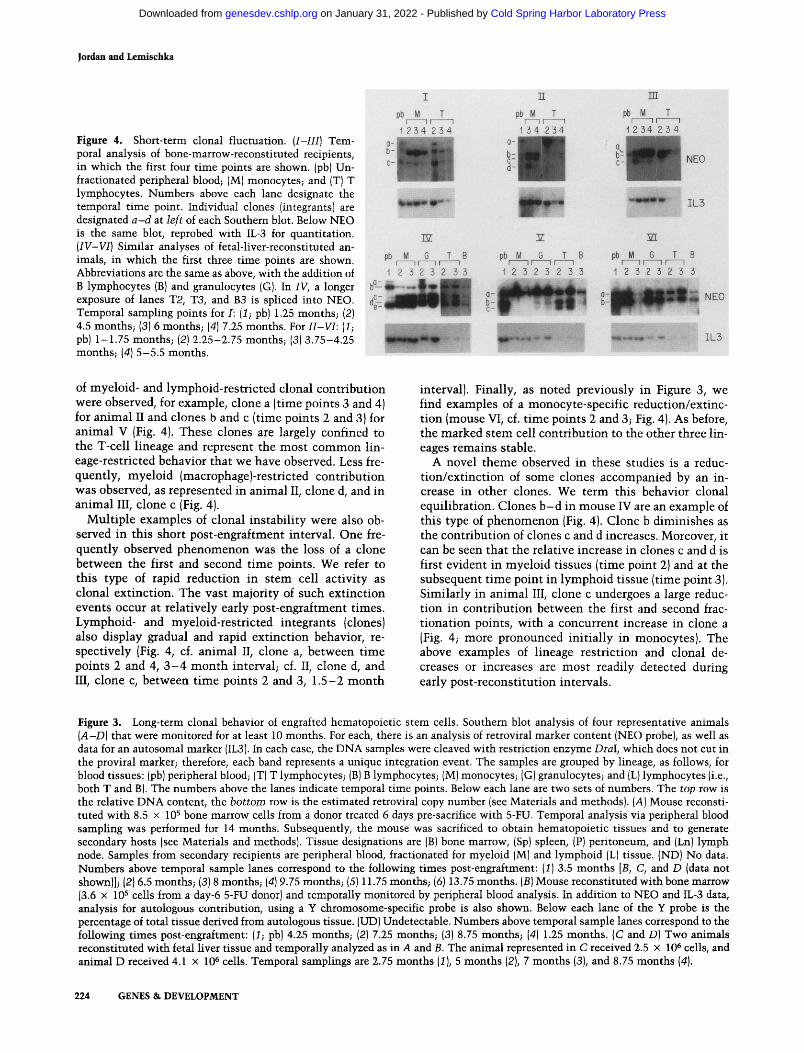
at early post-reconstitution intervals, we initiated the temporal analysis at earlier times after engraftment (1-2 months}. Stem cell behavior during this interval was substantially different from that described above. Repre- sentative examples are shown in Figure 4, which pre- sents the Southem blots from three bone-marrow-re- constituted {I-III) and three fetal-liver-reconstituted mice (IV-VI). In addition to totipotent clones, instances
GENES & DEVELOPMENT 223
Cold Spring Harbor Laboratory Press on January 31, 2022 - Published by genesdev.cshlp.orgDownloaded from
Jordan and Lemischka
Figure 4. Short-term clonal fluctuation. (I-III) Tem- poral analysis of bone-marrow-reconstituted recipients, in which the first four time points are shown. (pb) Un- fractionated peripheral blood; (M) monocytes; and (T) T lymphocytes. Numbers above each lane designate the temporal time point. Individual clones (integrants) are designated a-d at left of each Southern blot. Below NEO is the same blot, reprobed with IL-3 for quantitation. (/V-W) Similar analyses of fetal-liver-reconstituted an- imals, in which the first three time points are shown. Abbreviations are the same as above, with the addition of B lymphocytes (B) and granulocytes (G). In IV, a longer exposure of lanes T2, T3, and B3 is spliced into NEO. Temporal sampling points for I: (1; pb) 1.25 months; (2) 4.5 months; (3) 6 months; (4) 7.25 months. For II-W: (1; pb) 1-1.75 months; (2) 2.25-2.75 months; (3) 3.75-4.25 months; (4) 5-5.5 months.
pb M T
i 234 234
1V
pb M G T B f - - l | I I i
i 2 3 2 3 2 33
pb M T F-- - - } [ 1
134 27,4
!
"V
pb M G T B F----1 T i l ~ i
i 2 3 2 3 2 3 3
m
DbF'~--7 r T ' ~ 2 3 4 2 3 4
¢ _ ~ NEO
p b M G T B P--=If!
i 2 3 2 3 2 3 3
NEO
IL3
of myeloid- and lymphoid-res t r ic ted clonal cont r ibut ion were observed, for example, clone a (t ime points 3 and 4) for an ima l II and clones b and c (t ime points 2 and 3) for an ima l V (Fig. 4). These clones are largely confined to the T-cell l ineage and represent the mos t c o m m o n lin- eage-restr icted behavior tha t we have observed. Less fre- quent ly , myelo id (macrophage)-restr icted cont r ibut ion was observed, as represented in an imal II, clone d, and in an ima l III, clone c (Fig. 4).
Mul t ip le examples of clonal ins tabi l i ty were also ob- served in this short pos t -engraf tment interval . One fre- quent ly observed p h e n o m e n o n was the loss of a clone be tween the first and second t ime points. We refer to this type of rapid reduct ion in s tem cell act ivi ty as clonal ext inct ion. The vast major i ty of such ext inct ion events occur at re lat ively early pos t -engraf tment t imes. Lymphoid- and myeloidorestr icted in tegrants (clones) also display gradual and rapid ext inct ion behavior, re- spect ively (Fig. 4, cf. an ima l II, clone a, be tween t ime points 2 and 4, 3 - 4 m o n t h interval; cf. II, clone d, and III, clone c, be tween t ime points 2 and 3, 1 . 5 - 2 m o n t h
interval). Finally, as noted previously in Figure 3, we find examples of a monocyte-speci f ic reduct ion/ext inc- t ion (mouse VI, cf. t ime points 2 and 3; Fig. 4). As before, the m a r k e d s t em cell cont r ibu t ion to the other three lin- eages remains stable.
A novel t h e m e observed in these studies is a reduc- t ion /ex t inc t ion of some clones accompanied by an in- crease in o ther clones. We te rm this behavior clonal equil ibrat ion. Clones b - d in mouse IV are an example of this type of p h e n o m e n o n (Fig. 4). Clone b diminishes as the cont r ibut ion of clones c and d increases. Moreover, it can be seen tha t the relat ive increase in clones c and d is first evident in myelo id t issues ( t ime point 2) and at the subsequent t ime point in lymphoid t issue (t ime point 3). Similar ly in an ima l III, clone c undergoes a large reduc- t ion in cont r ibu t ion be tween the first and second frac- t ionat ion points, wi th a concur ren t increase in clone a (Fig. 4; more pronounced ini t ia l ly in monocytes) . The above examples of lineage res t r ic t ion and clonal de- creases or increases are m o s t readily detected during early pos t - reconst i tu t ion intervals .
Figure 3. Long-term clonal behavior of engrafted hematopoietic stem cells. Southern blot analysis of four representative animals {A-D} that were monitored for at least 10 months. For each, there is an analysis of retroviral marker content (NEO probe), as well as data for an autosomal marker (IL3). In each case, the DNA samples were cleaved with restriction enzyme DraI, which does not cut in the proviral marker; therefore, each band represents a unique integration event. The samples are grouped by lineage, as follows, for blood tissues: (pb) peripheral blood; (T) T lymphocytes; (B) B lymphocytes; (M) monocytes; (G) granulocytes; and (L) lymphocytes (i.e., both T and B). The numbers above the lanes indicate temporal time points. Below each lane are two sets of numbers. The top row is the relative DNA content, the bottom row is the estimated retroviral copy number (see Materials and methods). (A) Mouse reconsti- tuted with 8.5 × 10 s bone marrow cells from a donor treated 6 days pre-sacrifice with 5-FU. Temporal analysis via peripheral blood sampling was performed for 14 months. Subsequently, the mouse was sacrificed to obtain hematopoietic tissues and to generate secondary hosts (see Materials and methods). Tissue designations are (B) bone marrow, (Sp) spleen, (P) peritoneum, and (Ln) lymph node. Samples from secondary recipients are peripheral blood, fractionated for myeloid (M) and lymphoid (L) tissue. (ND) No data. Numbers above temporal sample lanes correspond to the following times post-engraftment: (1) 3.5 months [B, C, and D (data not shown)]; (2) 6.5 months; (3) 8 months; (4) 9.75 months; (5) 11.75 months; (6) 13.75 months. (B) Mouse reconstituted with bone marrow (3.6 x 10 s cells from a day-6 5-FU donor) and temporally monitored by peripheral blood analysis. In addition to NEO and IL-3 data, analysis for autologous contribution, using a Y chromosome-specific probe is also shown. Below each lane of the Y probe is the percentage of total tissue derived from autologous tissue. (UD) Undetectable. Numbers above temporal sample lanes correspond to the following times post-engraftment: (1; pb) 4.25 months; (2) 7.25 months; (3) 8.75 months; (4) 1.25 months. (C and D) Two animals reconstituted with fetal liver tissue and temporally analyzed as in A and B. The animal represented in C received 2.5 x 10⁶ cells, and animal D received 4.1 x 10⁶ cells. Temporal samplings are 2.75 months (1), 5 months (2), 7 months (3), and 8.75 months {4).
224 GENES & DEVELOPMENT
Cold Spring Harbor Laboratory Press on January 31, 2022 - Published by genesdev.cshlp.orgDownloaded from
I M G T+B T 8 r - - 1 ~ 1 F 1
2 3 4 5 3 4 5 2 3 4 5 3
NEO
ILS
T[ SHORT -TERM LONG -TERM pb T BM G M T G 8
r - - -q F--1F--I r ~ l r r [ f l ~ l 1 2 3 4 4 2 4 3 4 4 5 6 7 3 4 5 6 7 3 6 7 5 6 7
N EO c I L 3 - ~
N'EO
ZL5
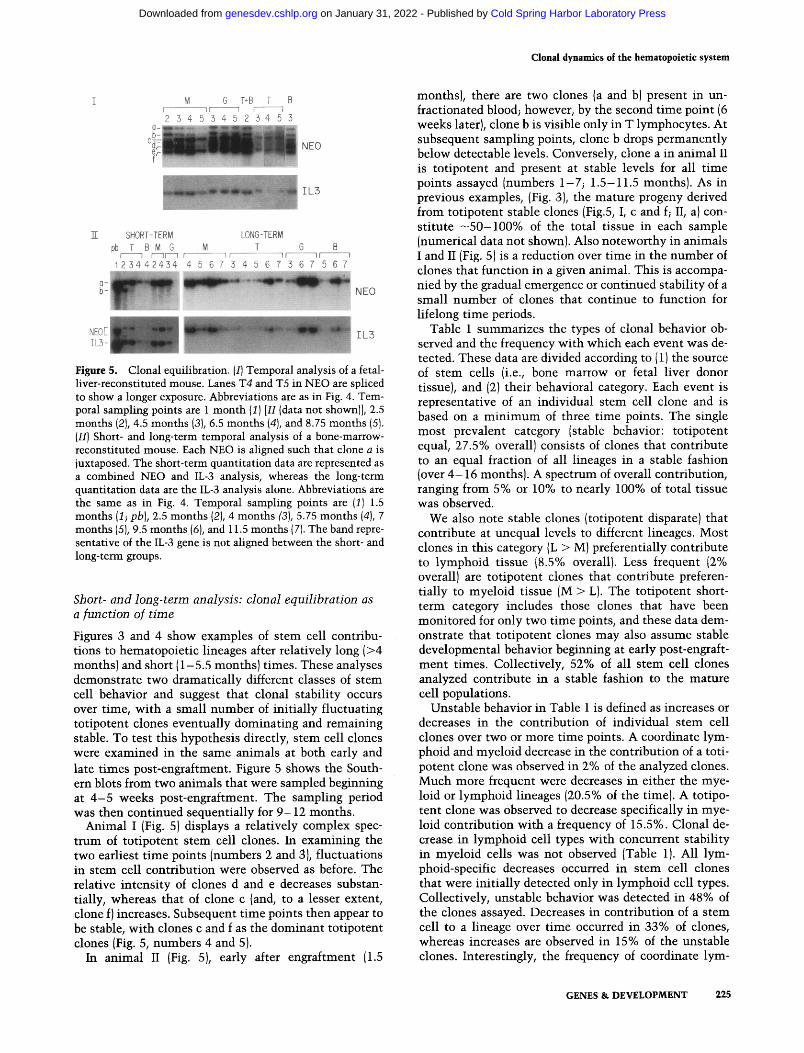
Figure 5. Clonal equilibration. (I) Temporal analysis of a fetal- liver-reconstituted mouse. Lanes T4 and T5 in NEO are spliced to show a longer exposure. Abbreviations are as in Fig. 4. Tem- poral sampling points are 1 month (1) [II {data not shown}], 2.5 months (2), 4.5 months (3}, 6.5 months (4), and 8.75 months (5}. (H) Short- and long-term temporal analysis of a bone-marrow- reconstituted mouse. Each NEO is aligned such that clone a is juxtaposed. The short-term quantitation data are represented as a combined NEO and IL-3 analysis, whereas the long-term quantitation data are the IL-3 analysis alone. Abbreviations are the same as in Fig. 4. Temporal sampling points are (1) 1.5 months (1; pb), 2.5 months (2), 4 months (3), 5.75 months (4), 7 months (5), 9.5 months (6), and 11.5 months {7). The band repre- sentative of the IL-3 gene is not aligned between the short- and long-term groups.
Short- and long-term analysis: clonal equilibration as a function of t ime
Figures 3 and 4 show examples of stem cell contribu- tions to hematopoietic lineages after relatively long (>4 months) and short (1-5.5 months) times. These analyses demonstrate two dramatically different classes of stem cell behavior and suggest that clonal stability occurs over time, with a small number of initially fluctuating totipotent clones eventually dominating and remaining stable. To test this hypothesis directly, stem cell clones were examined in the same animals at both early and late times post-engraftment. Figure 5 shows the South- em blots from two animals that were sampled beginning at 4 - 5 weeks post-engraftment. The sampling period was then continued sequentially for 9 -12 months.
Animal I (Fig. 5) displays a relatively complex spec- trum of totipotent stem cell clones. In examining the two earliest time points (numbers 2 and 3), fluctuations in stem cell contribution were observed as before. The relative intensity of clones d and e decreases substan- tially, whereas that of clone c (and, to a lesser extent, clone f) increases. Subsequent time points then appear to be stable, with clones c and f as the dominant totipotent clones (Fig. 5, numbers 4 and 5).
In animal II (Fig. 5), early after engraftment (1.5
Clonal dynamics of the hematopoietic system
months), there are two clones (a and b) present in un- fractionated blood; however, by the second time point (6 weeks later), clone b is visible only in T lymphocytes. At subsequent sampling points, clone b drops permanently below detectable levels. Conversely, clone a in animal II is totipotent and present at stable levels for all time points assayed (numbers 1-7; 1.5-11.5 months). As in previous examples, {Fig. 3), the mature progeny derived from totipotent stable clones (Fig.5, I, c and f; II, a) con- stitute - 5 0 - 1 0 0 % of the total tissue in each sample (numerical data not shown). Also noteworthy in animals I and II {Fig. 5) is a reduction over time in the number of clones that function in a given animal. This is accompa- nied by the gradual emergence or continued stability of a small number of clones that continue to function for lifelong time periods.
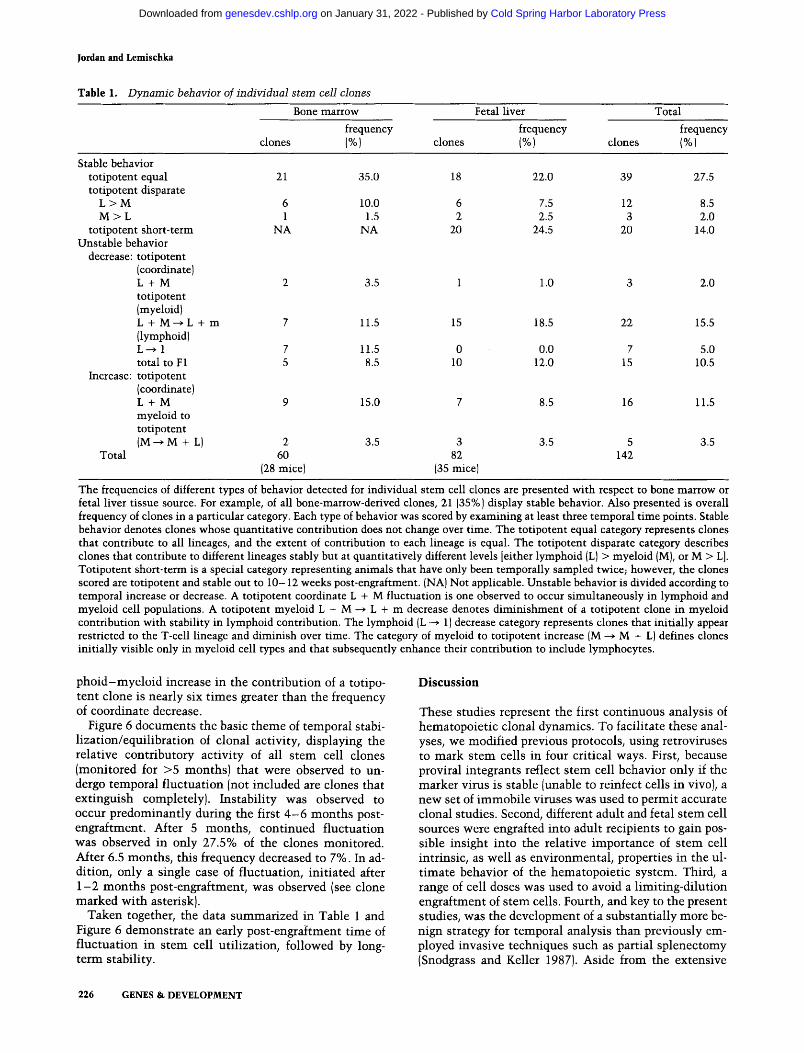
Table 1 summarizes the types of clonal behavior ob- served and the frequency with which each event was de- tected. These data are divided according to (1} the source of stem cells {i.e., bone marrow or fetal liver donor tissue}, and (2} their behavioral category. Each event is representative of an individual stem cell clone and is based on a minimum of three time points. The single most prevalent category (stable behavior: totipotent equal, 27.5% overall) consists of clones that contribute to an equal fraction of all lineages in a stable fashion {over 4 - 1 6 months). A spectrum of overall contribution, ranging from 5% or 10% to nearly 100% of total tissue was observed.
We also note stable clones (totipotent disparate} that contribute at unequal levels to different lineages. Most clones in this category (L > M) preferentially contribute to lymphoid tissue {8.5% overall}. Less frequent (2% overall) are totipotent clones that contribute preferen- tially to myeloid tissue (M > L). The totipotent short- term category includes those clones that have been monitored for only two time points, and these data dem- onstrate that totipotent clones may also assume stable developmental behavior beginning at early post-engraft- ment times. Collectively, 52% of all stem cell clones analyzed contribute in a stable fashion to the mature cell populations.
Unstable behavior in Table 1 is defined as increases or decreases in the contribution of individual stem cell clones over two or more time points. A coordinate lym- phoid and myeloid decrease in the contribution of a toti- potent clone was observed in 2% of the analyzed clones. Much more frequent were decreases in either the mye- loid or lymphoid lineages {20.5% of the time). A totipo- tent clone was observed to decrease specifically in mye- loid contribution with a frequency of 15.5%. Clonal de- crease in lymphoid cell types with concurrent stability in myeloid cells was not observed (Table 1). All lym- phoid-specific decreases occurred in stem cell clones that were initially detected only in lymphoid cell types. Collectively, unstable behavior was detected in 48% of the clones assayed. Decreases in contribution of a stem cell to a lineage over time occurred in 33% of clones, whereas increases are observed in 15% of the unstable clones. Interestingly, the frequency of coordinate lym-
GENES & DEVELOPMENT 225
Cold Spring Harbor Laboratory Press on January 31, 2022 - Published by genesdev.cshlp.orgDownloaded from
Jordan and Lemischka
Table 1. Dynamic behavior of individual stem cell clones
Bone marrow Fetal liver Total
frequency frequency frequency clones (%) clones (%) clones (%)
Stable behavior totipotent equal 21 35.0 18 22.0 39 27.5 totipotent disparate
L > M 6 10.0 6 7.5 12 8.5 M > L 1 1.5 2 2.5 3 2.0
totipotent short-term NA NA 20 24.5 20 14.0 Unstable behavior
decrease: totipotent (coordinate) L + M 2 3.5 1 1.0 3 2.0 totipotent {myeloid) L + M--~ L + m 7 11.5 15 18.5 22 15.5 {lymphoid) L --~ 1 7 11.5 0 0.0 7 5.0 total to F1 5 8.5 10 12.0 15 10.5
Increase: totipotent {coordinate) L + M 9 15.0 7 8.5 16 11.5 myeloid to totipotent (M ~ M + L) 2 3.5 3 3.5 5 3.5
Total 60 82 142 (28 mice) (35 mice)
The frequencies of different types of behavior detected for individual stem cell clones are presented with respect to bone marrow or fetal liver tissue source. For example, of all bone-marrow-derived clones, 21 [35%) display stable behavior. Also presented is overall frequency of clones in a particular category. Each type of behavior was scored by examining at least three temporal time points. Stable behavior denotes clones whose quantitative contribution does not change over time. The totipotent equal category represents clones that contribute to all lineages, and the extent of contribution to each lineage is equal. The totipotent disparate category describes clones that contribute to different lineages stably but at quantitatively different levels [either lymphoid {L) > myeloid {MI, or M > L]. Totipotent short-term is a special category representing animals that have only been temporally sampled twice; however, the clones scored are totipotent and stable out to 10-12 weeks post-engraftment. {NAI Not applicable. Unstable behavior is divided according to temporal increase or decrease. A totipotent coordinate L + M fluctuation is one observed to occur simultaneously in lymphoid and myeloid cell populations. A totipotent myeloid L + M --> L + m decrease denotes diminishment of a totipotent clone in myeloid contribution with stability in lymphoid contribution. The lymphoid {L ---> 1) decrease category represents clones that initially appear restricted to the T-cell lineage and diminish over time. The category of myeloid to totipotent increase (M ~ M + L) defines clones initially visible only in myeloid cell types and that subsequently enhance their contribution to include lymphocytes.
pho id -mye lo id increase in the contribution of a totipo- tent clone is nearly six t imes greater than the frequency of coordinate decrease.
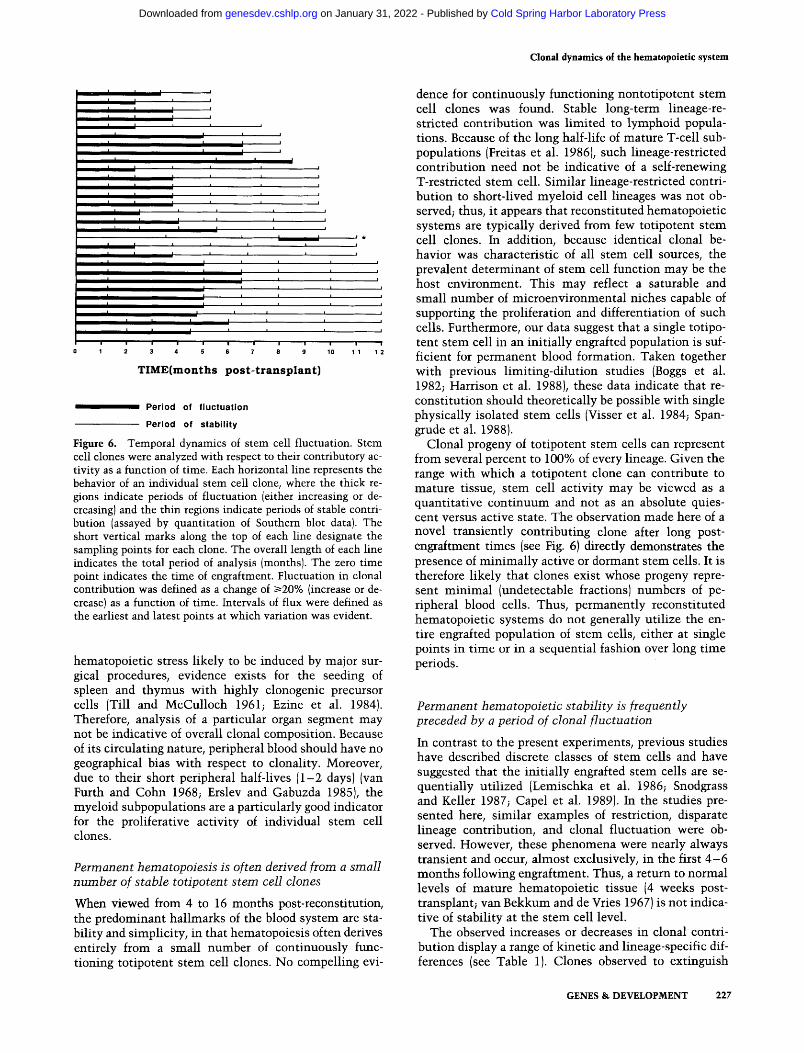
Figure 6 documents the basic theme of temporal stabi- l ization/equilibration of clonal activity, displaying the relative contributory activity of all s tem cell clones [monitored for >5 months) that were observed to un- dergo temporal f luctuation [not included are clones that extinguish completely). Instability was observed to occur predominant ly during the first 4 - 6 months post- engraftment. After 5 months, continued fluctuation was observed in only 27.5% of the clones monitored. After 6.5 months, this frequency decreased to 7%. In ad- dition, only a single case of fluctuation, initiated after 1 - 2 months post-engraftment, was observed [see clone marked wi th asteriskl.
Taken together, the data summarized in Table 1 and Figure 6 demonstrate an early post-engraftment t ime of f luctuation in s tem cell utilization, followed by long- term stability.
D i s c u s s i o n
These studies represent the first continuous analysis of hematopoiet ic clonal dynamics. To facilitate these anal- yses, we modified previous protocols, using retroviruses to mark s tem cells in four critical ways. First, because proviral integrants reflect s tem cell behavior only if the marker virus is stable [unable to reinfect cells in vivo), a new set of immobile viruses was used to permit accurate clonal studies. Second, different adult and fetal s tem cell sources were engrafted into adult recipients to gain pos- sible insight into the relative importance of s tem cell intrinsic, as well as environmental, properties in the ul- t imate behavior of the hematopoiet ic system. Third, a range of cell doses was used to avoid a limiting-dilution engraftment of s tem cells. Fourth, and key to the present studies, was the development of a substantially more be- nign strategy for temporal analysis than previously em- ployed invasive techniques such as partial splenectomy (Snodgrass and Keller 1987). Aside from the extensive
226 GENES & DEVELOPMENT
Cold Spring Harbor Laboratory Press on January 31, 2022 - Published by genesdev.cshlp.orgDownloaded from
I
i I I
I i
I I
i
i
l
I I
I I
I l
!
I
I
I ' k
i
I
I I I l t
I I I ' ' '
l I i n l I . I l I I
1 2 3 4 5 6 7 8 9 10 1 1
T I M E ( m o n t h s p o s t - t r a n s p l a n t )
i
i
i
i
i
i
i
i
!
i
1 2
Period of f l u c t u a t i o n
P e r i o d o f s t a b i l i t y
Figure 6. Temporal dynamics of stem cell fluctuation. Stem cell clones were analyzed with respect to their contributory ac- tivity as a function of time. Each horizontal line represents the behavior of an individual stem cell clone, where the thick re- gions indicate periods of fluctuation (either increasing or de- creasing) and the thin regions indicate periods of stable contri- bution (assayed by quantitation of Southern blot data). The short vertical marks along the top of each line designate the sampling points for each clone. The overall length of each line indicates the total period of analysis (months). The zero time point indicates the time of engraftment. Fluctuation in clonal contribution was defined as a change of >120% (increase or de- crease) as a function of time. Intervals of flux were defined as the earliest and latest points at which variation was evident.
hematopoietic stress likely to be induced by major sur- gical procedures, evidence exists for the seeding of spleen and thymus with highly clonogenic precursor cells (Till and McCulloch 1961; Ezine et al. 1984). Therefore, analysis of a particular organ segment may not be indicative of overall clonal composition. Because of its circulating nature, peripheral blood should have no geographical bias with respect to clonality. Moreover, due to their short peripheral half-lives (1-2 days)(van Furth and Cohn 1968; Erslev and Gabuzda 1985), the myeloid subpopulations are a particularly good indicator for the proliferative activity of individual stem cell clones.
Permanent hematopoiesis is often derived from a small number of stable totipotent stem cell clones
When viewed from 4 to 16 months post-reconstitution, the predominant hallmarks of the blood system are sta- bility and simplicity, in that hematopoiesis often derives entirely from a small number of continuously func- tioning totipotent stem cell clones. No compelling evi-
Clonal dynamics of the hematopoietic system
dence for continuously functioning nontotipotent stem cell clones was found. Stable long-term lineage-re- stricted contribution was limited to lymphoid popula- tions. Because of the long half-life of mature T-cell sub- populations (Freitas et al. 1986), such lineage-restricted contribution need not be indicative of a self-renewing T-restricted stem cell. Similar lineage-restricted contri- bution to short-lived myeloid cell lineages was not ob- served; thus, it appears that reconstituted hematopoietic systems are typically derived from few totipotent stem cell clones. In addition, because identical clonal be- havior was characteristic of all stem cell sources, the prevalent determinant of stem cell function may be the host environment. This may reflect a saturable and small number of microenvironmental niches capable of supporting the proliferation and differentiation of such cells. Furthermore, our data suggest that a single totipo- tent stem cell in an initially engrafted population is suf- ficient for permanent blood formation. Taken together with previous limiting-dilution studies (Boggs et al. 1982; Harrison et al. 1988), these data indicate that re- constitution should theoretically be possible with single physically isolated stem cells (Visser et al. 1984; Span- grude et al. 1988).
Clonal progeny of totipotent stem cells can represent from several percent to 100% of every lineage. Given the range with which a totipotent clone can contribute to mature tissue, stem cell activity may be viewed as a quantitative continuum and not as an absolute quies- cent versus active state. The observation made here of a novel transiently contributing clone after long post- engraftment times (see Fig. 6) directly demonstrates the presence of minimally active or dormant stem cells. It is therefore likely that clones exist whose progeny repre- sent minimal (undetectable fractions) numbers of pe- ripheral blood cells. Thus, permanently reconstituted hematopoietic systems do not generally utilize the en- tire engrafted population of stem cells, either at single points in time or in a sequential fashion over long time periods.
Permanent hematopoietic stability is frequently preceded by a period of clonal fluctuation
In contrast to the present experiments, previous studies have described discrete classes of stem cells and have suggested that the initially engrafted stem cells are se- quentially utilized (Lemischka et al. 1986; Snodgrass and Keller 1987; Capel et al. 1989). In the studies pre- sented here, similar examples of restriction, disparate lineage contribution, and clonal fluctuation were ob- served. However, these phenomena were nearly always transient and occur, almost exclusively, in the first 4 - 6 months following engraftment. Thus, a return to normal levels of mature hematopoietic tissue (4 weeks post- transplant; van Bekkum and de Vries 1967) is not indica- tive of stability at the stem cell level.
The observed increases or decreases in clonal contri- bution display a range of kinetic and lineage-specific dif- ferences (see Table 1). Clones observed to extinguish
GENES & DEVELOPMENT 227
Cold Spring Harbor Laboratory Press on January 31, 2022 - Published by genesdev.cshlp.orgDownloaded from
Jordan and Lemischka
completely and rapidly (within 6 - 8 weeks) may repre- sent transiently functioning totipotent stem cell clones or myeloid-restricted cells, whose short-lived progeny would not be detectable at later times. We have observed initially totipotent clones, whose progeny, at subse- quent time points, are only visible in the T-cell popula- tion. Over time, such T-restricted contribution dimin- ishes further, consistent with a gradual turnover of a mature long-lived cell population. The converse situa- tion of initially totipotent and subsequently myeloid-re- stricted clones is not observed.
An intriguing case of extinction of stem cell activity is specific to the macrophage lineage. This phenomenon suggests that in vivo, the regulation of this lineage can be independent of the granulocyte lineage and may therefore involve monopotential intermediates and not bipotential progenitors such as CFU-GM (Metcalf 1984). Granulocyte-specific extinction is not observed nor are there obvious examples of extinction specific to the lymphoid cell populations accompanied by persistence of the given stem cell clone in the myeloid lineages. However, a coordinate decrease in both myeloid cell populations has been observed. Taken together, these observations suggest that in vivo developmental deci- sions by a totipotent clone may progress in a relatively ordered fashion. The initial loss of macrophage contribu- tory behavior may be the earliest indicator for the extin- guishment of a totipotent stem cell clone. Given that the contribution of a totipotent stem cell clone to dis- crete cell lineages proceeds through an intermediate class(es) of committed progenitors or restricted stem cells, the rapid disappearance of stem cell progeny in the macrophage lineage directly suggests that such re- stricted stem cells are not capable of extensive self-re- newal.
Hematopoietic stabiEty is the result of an emergence and dominance of few stem cell clones
An additional class of fluctuation behavior observed at early times post-engraftment is clonal enhancement (in- creases). The identification of clones contributing to major cell populations only after 2.5-3 months fol- lowing engraftment demonstrates that a stem cell can remain functionally dormant and that not all stem cells assume major hematopoietic roles in a concurrent f~shion. In fact, the stem cell clones whose contributory activity is relatively slow in manifestation are fre- quently destined to remain stable over long time pe- riods. Stem cell clones that expand their lineage contri- bution from one lineage to additional lineages have also been observed. Such clones contribute first to myeloid tissues and subsequently to both myeloid and lymphoid tissues (Table 1).
Collectively, the above observations indicate that clonal fluctuation is a reflection of hematopoietic disequilibrium. Our data indicate that disequilibrium is generally evident for the first 4 - 6 months post-engraft- ment. At later times, the system appears to achieve a dynamic steady state, and very little fluctuation (i.e.,
changes in clonal stem cell contribution) is observed. Therefore, variance in clonal behavior is a function of time and, thus, may depend more on systemic equilib- rium than on intrinsically different classes of stem cells. In some cases, an additional characteristic is the emer- gence of a small number of clones that ultimately domi- nate the clonal profile. The outgrowth of dominant clones appears to occur simultaneously with the extinc- tion of lesser clones. Thus, systemic equilibration may involve the gradual selection of a subset of engrafted to- tipotent clones.
A model for the temporal behavior of engrafted totipotent stem cell clones and the reconstituted hematopoietic system
By definition, the clonal proliferation of uncommitted stem cells is accompanied by self-renewal or commit- ment decisions. Analysis of mature hematopoietic tissues at single points in time can only measure stem cell commitment; however, self-renewal activity can be revealed by the temporal behavior of a given stem cell clone.
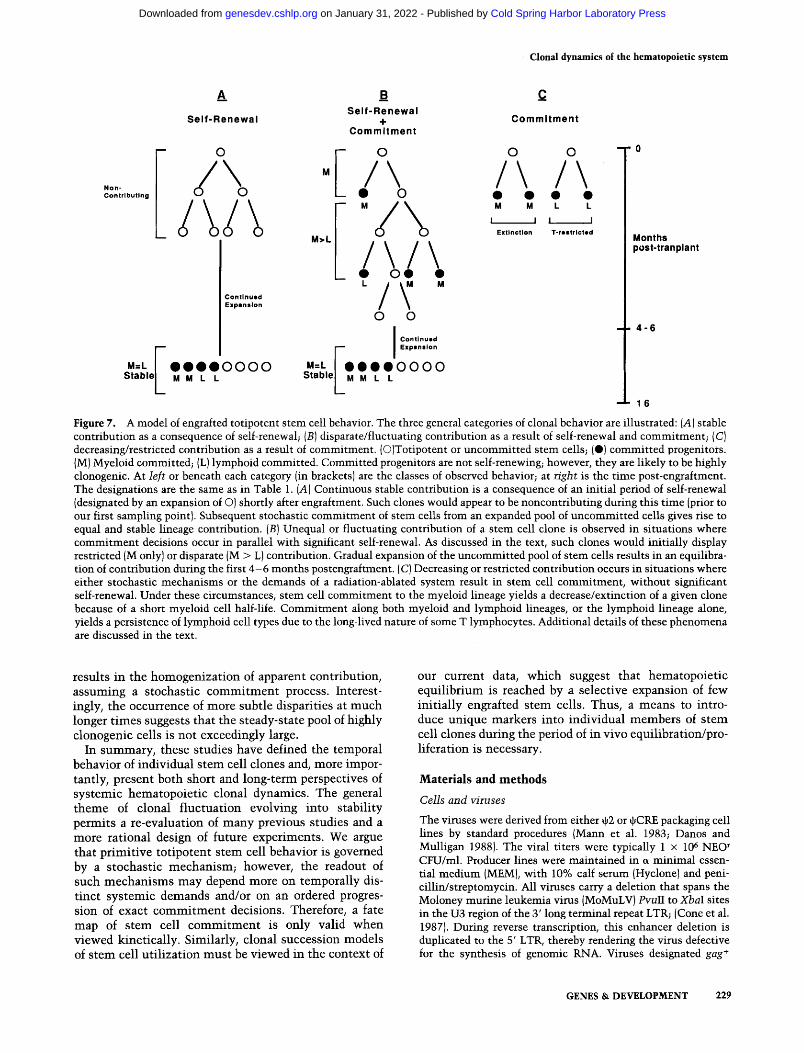
Discrete clonal markers can only be detected in sub- stantially large fractions of a cell population; therefore, the mechanisms that mediate either clonal stability or shifts are likely to function directly on highly clono- genie cells. We have presented evidence that the vast majority of clones in our analyses are totipotent; thus, an attractive hypothesis is that these cells are uncom- mitted, that is, can self-renew. The temporal segregation of unstable and stable clonal behavior is consistent with the action of stochastic commitment versus self-re- newal mechanisms on an expanding pool (clonel of target stem cells. The temporal behavior of stem cells can be interpreted in the context of a simple model, pre- sented in Figure 7. Stable behavior would be a reflection of a relatively large pool of clonally related stem cells and, therefore, a significant amount of prior self-renewal (Fig. 7A). Stem cells undergoing an initial period of ex- tensive self-renewal thus appear minimal in lineage-re- populating activity during this interval. However, such expanded (self-renewed) stem cell clones would subse- quently dominate long-term hematopoiesis. Because clonal expansion is exponential, a dominant (largel clone of stem cells could result from a subtle initial prolifera- tive or self-renewal advantage. Extinction, as well as lin- eage-restricted behavior of particular stem cell clones, would only be observed when the target cell population was small enough so that all members of a given clone could be statistically expected to either self-renew or commit to a program of differentiation {Fig. 7C). A nu- merically small clone of stem cells would also account for disparity, enhancement, or fluctuations in lineage contribution. Dramatic disparity observed at short post- reconstitution times would be a simple consequence of small numbers of clonally related uncommitted stem cells upon which mechanisms governing developmental decisions operate (Fig. 7B). A gradual clonal expansion of such cells {during the first 4 - 6 months postengraftment)
228 GENES & DEVELOPMENT
Cold Spring Harbor Laboratory Press on January 31, 2022 - Published by genesdev.cshlp.orgDownloaded from
, Clonal dynamics of the hematopoietic system
A _s c Sent-Renewal Self-Renewal + C o m m i t m e n t Commitment
I / E ° ° °
\ M / \ / \ / \ ,~o°n";,,,.u,,.. o • o • • • •
Extinction T-restricted M>L
• O0 •
Continued L / ~M M Expanelon
0 0
M=L I @@@@0000 Stable M M L L
I Continued ~O Expansion
M=L e e e o o o o Stable/M-- M L L
L_
- - 0
Months post-tranplant
4 - 6
16
Figure 7. A model of engrafted totipotent stem cell behavior. The three general categories of clonal behavior are illustrated: (A) stable contribution as a consequence of self-renewal; (B) disparate/fluctuating contribution as a result of self-renewal and commitment; (C) decreasing/restricted contribution as a result of commitment. (©)Totipotent or uncommitted stem cells; (O) committed progenitors. (M) Myeloid committed; (L) lymphoid committed. Committed progenitors are not self-renewing; however, they are likely to be highly clonogenic. At left or beneath each category (in brackets) are the classes of observed behavior; at right is the time post-engraftment. The designations are the same as in Table 1. (A) Continuous stable contribution is a consequence of an initial period of self-renewal (designated by an expansion of ©) shortly after engraftment. Such clones would appear to be noncontributing during this time (prior to our first sampling point). Subsequent stochastic commitment of stem cells from an expanded pool of uncommitted cells gives rise to equal and stable lineage contribution. (B) Unequal or fluctuating contribution of a stem cell clone is observed in situations where commitment decisions occur in parallel with significant self-renewal. As discussed in the text, such clones would initially display restricted (M only) or disparate (M > L) contribution. Gradual expansion of the uncommitted pool of stem cells results in an equilibra- tion of contribution during the first 4 -6 months postengraftment. (C) Decreasing or restricted contribution occurs in situations where either stochastic mechanisms or the demands of a radiation-ablated system result in stem cell commitment, without significant self-renewal. Under these circumstances, stem cell commitment to the myeloid lineage yields a decrease/extinction of a given clone because of a short myeloid cell half-life. Commitment along both myeloid and lymphoid lineages, or the lymphoid lineage alone, yields a persistence of lymphoid cell types due to the long-lived nature of some T lymphocytes. Additional details of these phenomena are discussed in the text.
resul ts in the homogen iza t i on of apparent contr ibut ion, assuming a s tochas t ic c o m m i t m e n t process. Interest- ingly, the occurrence of more subtle dispari t ies at m u c h longer t imes suggests tha t the s teady-state pool of h ighly c lonogenic cells is no t exceedingly large.
In summary , these studies have defined the temporal behavior of indiv idual s t em cell clones and, more impor- tant ly, present both shor t and long- term perspectives of sys temic hema topo ie t i c clonal dynamics . The general t heme of clonal f luc tua t ion evolving in to s tabi l i ty pe rmi t s a re-evaluat ion of m a n y previous studies and a more ra t iona l design of future exper iments . We argue tha t p r imi t ive to t ipo ten t s tem cell behavior is governed by a s tochas t ic mechan i sm; however, the readout of such m e c h a n i s m s may depend more on tempora l ly dis- t inc t sys temic demands and/or on an ordered progres- sion of exact c o m m i t m e n t decisions. Therefore, a fate map of s tem cell c o m m i t m e n t is only valid w h e n viewed kinet ica l ly . Similarly, c lonal succession models of s t em cell u t i l i za t ion m u s t be viewed in the context of
our current data, wh ich suggest tha t hema topo ie t i c equ i l ib r ium is reached by a select ive expans ion of few in i t i a l ly engrafted s tem cells. Thus, a means to intro- duce un ique markers in to ind iv idua l members of s tem cell clones dur ing the period of in v ivo equi l ibra t ion/pro- l i fera t ion is necessary.
Mater ia l s and m e t h o d s
Cells and viruses
The viruses were derived from either 42 or OCRE packaging cell lines by standard procedures (Mann et al. 1983; Danos and Mulligan 1988). The viral titers were typically 1 x 10⁶ NEO r CFU/ml. Producer lines were maintained in a minimal essen- tial medium (MEM), with 10% calf serum {Hyclone) and peni- cillin/streptomycin. All viruses carry a deletion that spans the Moloney murine leukemia virus (MoMuLV) PvulI to XbaI sites in the U3 region of the 3' long terminal repeat LTR; (Cone et al. 1987). During reverse transcription, this enhancer deletion is duplicated to the 5' LTR, thereby rendering the virus defective for the synthesis of genomic RNA. Viruses designated gag +
GENES & D E V E L O P M E N T 229
Cold Spring Harbor Laboratory Press on January 31, 2022 - Published by genesdev.cshlp.orgDownloaded from
Jordan and Lemischka
contain the S' portion of the viral gag gene (gift of D. Miller). This region has been shown to increase retroviral titer 5- to 10-fold (Bender et al. 1987). In addition, all viruses carry the neomycin phosphotransferase gene, driven by an internal pro- moter. The AN and ANg ÷ viruses use the chicken [3-actin pro- moter (Seiler-Tuyns et al. 1984), whereas the TKNg + virus em- ploys the herpes simplex virus (HSV) thymidine kinase pro- moter, and the RN virus uses the mouse L32 ribosomal protein promoter (Dudov and Perry 1984). In each case, the promoters are derived from constitutively expressed housekeeping genes. Supernatants from virus producer cells, as well as blood samples from reconstituted animals, were assayed for the transmission of both NEO r virus and transferable helper virus function. NEO r virus was assayed using standard infection of NIH-3T3 cells to quantitate virus content. Helper function was tested by infection of the 3T3-116 indicator cell line (Danos and Mulligan 1988), followed by quantitation of mobilized virus carrying the histidinol dehydrogenase (HisD) gene (Hartman and Mulligan 1988). The presence of HisD virus was assayed by infection of NIH-3T3 cells and selection for resistance to L-his- tidinol (4 raM, Sigma). In addition to selecting for HIS r, both the infected 3T3-116 cells and the subsequently infected NIH-3T3 cells (i.e., the target cells for infection with supernatant from the 116 cells) were also selected for NEO ~. Because helper ac- tivity varied no more than twofold between different virus pro- ducer lines, differences in the quantity of NEO ~ virus detected in 116 supernatants provides a measure of the efficacy of the enhancer deletion, when compared to an intact LTR virus. For our enhancer-deleted producer lines, we observed a 50- to 100- fold decrease in the quantity of NEO ~ virus present in 116 su- pernatant, in comparison to the intact LTR murine sarcoma virus (MSV DHFR Neo) described previously (Williams et al. 1984).
To test blood samples for helper activity, 100 ~1 of serum was used to infect 2 x 10⁴ to 4 x 10⁴ 3T3-116 cells by standard procedure. Forty-eight hours later, supernatant was harvested and used to infect naive NIH-3T3 cells. These cells were then cultured for an additional 48 hr, followed by selection in L-his- tidinol. In addition, supernatants from 3T3-116 cells were used to infect @CRE cells and qJCRIP cells (an amphotropic pack- aging line) to amplify initially released HisD indicator virus. Forty-eight hours later, supernatants from the ~CRE and t~CRIP irdections were used to infect naive packaging cells of the opposite host range (i.e., ~CRE supernatants onto t~CRIP cells and t~CRIP supernatants onto t~CRE cells), to further am- plify HisD mobilization (Danos and Mulligan 1988). Finally, after an additional 48 hr, supernatants from secondary t~CRE- and t~GRIP-infected cells were used to infect NIH-3T3 cells, and these were subsequently selected for the presence of the HisD indicator virus. Of 16 serum samples tested, only 1 had any detectable helper activity, as assayed by HisD mobiliza- tion. Nonetheless, no sera, including the sample in which helper was evident, showed any detectable NEO * virus.
Infection of hematopoietic tissue
All mice were of the C3H/HeJ strain background and were ob- tained from Jackson laboratories. To obtain donor bone marrow, female mice (aged 7-12 weeks) were injected with 5-FU (150 mg/kg), 2, 4, 6, or 8 days prior to sacrifice. The cells were plated onto monolayers of virus-producing fibroblasts at a concentration of 3 x 10⁶ to 5 x 10⁶ cells/10-cm dish. Virus- producing cells were seeded one day previous at a concentration of - 5 x 10⁵ cells per plate. Coculture was performed as de- scribed (Lemischka et al. 1986), using recombinant IL-3 ( 10-15 U/ml) (gift from Frank Lee, DNAX; and Biogen) in place of
WEHI-3B supernatant. Hematopoietic cell harvest and engraft- ment into lethally irradiated syngeneic male mice were per- formed as described (Lemischka et al. 1986). Cell doses ranged from 0.1 x 10⁶ to 2.5 x 10⁶ cells per recipient.
To obtain fetal liver cells, donor females were mated, and the time of vaginal plug discovery was scored as day 0. Preliminary experiments had demonstrated a high transduction efficiency for fetal liver. On day 14 of gestation, donors were sacrificed (cervical dislocation) and fetal liver was dissected in Iscove's modified Dulbecco's medium (IMDM; with 5% fetal calf serum and 3% BSA). Livers were homogenized by repeated passages through a 10-ml pipette, followed by filtration through sterile wire mesh (75qam pore size). Cells were plated at 3 x 10⁶ to 5 x 10⁶ cells/10-cm dish on virus-producing fibroblasts. Cocul- ture was done in 10 ml of e~MEM with 8% calf serum, 10% fetal calf serum (FCS), 0.5% BSA (Boehringer-Mannheim), 10-15 U/ml recombinant IL-3 (a generous gift of John McKearn, Mon- santo), 5 ng/ml of IL-1- ~ (gift from P. Lomedico, Hoffman-LaR- oche), and 2 ~g/ml Polybrene (Sigma). After 40-48 hr, fetal liver cells were harvested and processed for injection into leth- ally irradiated syngeneic recipients. Some recipients received reconstituted complete fetal liver cell populations, previously fractionated on the basis of expression of the antigen AA4.1 (McKearn et al. 1984). Inocula sizes ranged from 2.5 x 10⁶ to 1.5 x 10⁷ cells per animal. One initial experiment utilized MSV-DHFR-NEO (Williams et al. 1984); however, all subse- quent studies employed the viral markers described in Figure 1.
Temporal analysis and peripheral blood fractionation
At 4-5 weeks post-engraftment, 100 ~1 of blood was taken from recipient mice via capillary puncture of the retro-orbital sinus. Samples were processed by standard procedure (Maniatis et al. 1982) to yield genomic DNA representative of the total nu- cleated cell population. Six to 12 weeks later and, subsequently, at 6- to 8-week intervals, 150-~1 aliquots of peripheral blood were obtained from individual recipients. Each sample was fractionated into individual hematopoietic lineages, using the following procedure: Blood was diluted to - 1.0 ml with physio- logically buffered saline (PBS) and layered onto a two-step iso- tonic Percoll (Pharmacia) gradient (steps of 1.078 and 1.090 g/ml). Samples were centrifuged at 850 g for 25 min. Using this procedure, the red blood cells pellet, granulocytes band at the 1.078/1.090 g/ml interface, and mononuclear cells remain at the 1.078 g/ml step. Mononuclear cells and granulocytes were collected individually and washed twice with 10 ml of PBS plus 0.5% FCS. Granulocytes were processed to yield genomic DNA, using a variation of the agarose block procedure de- scribed by Poustka et al. (1987). Cells were resuspended in 35 ~1 PBS, mixed with an equal volume of 1% low-melt agarose {Sea- plaque, FMC), and cast into two blocks per sample (done on ice to rapidly solidify blocks). The blocks were cast in a custom- made Plexiglas mold with internal dimensions of 0.18 x 0.18 x 0.07 inches for each well. Each cell sample was transferred to a digestion buffer consisting of 2 mg/ml pro- teinase K, 1% Sarkosyl, and 0.1 M EDTA and incubated at 50°C for 48 hr. Blocks were then rinsed in 20-30 ml of TE and incu- bated in 10 mM Tris (pH 7.5), 1 mM EDTA, and 40 ~g/ml phen- ylmethylsulfonyl fluoride (PMSF) for 1 hr at 50°C. Finally, samples were rinsed with an additional 20-30 ml of TE. (At this point, the blocks can be digested with restriction enzyme or stored in 0.2 M EDTA at 4°C). Mononuclear cells, from the light density fraction, were incubated for 2-3 hours in IMDM with 10% FCS and 20% L-cell conditioned medium (LCM). (The monocytes adhere to the tissue culture plastic, whereas lymphocytes remain in suspension.) After incubation, the non-
230 GENES & DEVELOPMENT
Cold Spring Harbor Laboratory Press on January 31, 2022 - Published by genesdev.cshlp.orgDownloaded from
adherent mononuclear cells were harvested and transferred to 1.5-cm petri dishes coated with 10 ~g/ml of goat anti-mouse immunoglobulin (gift of T. Manser). Cells were "panned" as described previously (Wysocki and Sato 1978), to separate B and T lymphocytes. The adherent B lymphocytes were lysed di- rectly on the panning dish and processed by standard proce- dures to yield the B-cell DNA sample. Nonadherent T lympho- cytes were processed via the agarose block procedure described above. In some cases, the earliest T-lymphocyte DNA samples were derived by first culturing the T cells in RPMI, 10% FCS, IL-2 (20 U/ml), and concanavalin A (3 txg/ml) for 3 -5 days. Ad- herent monocytes were cultured (IMDM, 10% FCS, and 20% LCM) for 6-10 days, and genomic DNA prepared by standard procedure. Purity of the granulocyte and lymphocyte popula- tions was assessed by immunofluorescence analysis, using lin- eage-specific monoclonal antibodies. Granulocytes and B lym- phocytes were stained with antibodies RB6-8C5 and RA3-6B2, respectively (gift of R. Coffman, DNAX). T lymphocytes were stained with the aThy-l.2 antibody, 30-H12 (Becton-Dick- inson). In each of the assayed populations, cells were 80-90% positive for the lineage-specific antibody. Monocyte-macro- phages were identified by morphological characteristics and growth response to LCM. Cells in the monocyte-macrophage fraction were 80-90% pure after 6-10 days of culture.
Hematopoietic tissue fractionation
After obtaining a final blood sample, animals were sacrificed and hematopoietic tissues harvested. Peritoneal macrophages were obtained by rinsing the abdominal cavity with 2 - 4 ml PBS, followed by culture in IMDM with 10% FCS and 20% LCM for 3 -5 days. Bone marrow was harvested and divided into three samples. The first sample was used to reconstitute lethally irradiated secondary recipients (2 x 10⁶ tO 5 X 10⁶ cells per animal). The second sample was depleted of mono- cytes and B cells by serially adhering the sample to a tissue culture dish, followed by an anti-mouse immunoglobulin pan- ning dish. The depleted sample was considered to be largely granulocytic, whereas the adherent cells were cultured to ob- tain bone marrow macrophages and the B cells were directly processed for genomic DNA. The final sample was prepared simply as total bone marrow. Lymph nodes were separated into B- and T-lymphocyte-enriched populations by panning cell sus- pensions on anti-mouse immunoglobulin dishes. Cell suspen- sions from spleen were subjected to the same panning proce- dure to yield B and T lymphocytes, as well as an adherence step to derive splenic macrophages (cultured as for bone marrow macrophages). Also, a portion of spleen was set aside for a total spleen DNA sample. In some cases, spleen cells were cultured in RPMI, 10% FCS, IL-2 (20 U/ml), and concanavalin A (3 ~g/ml) to obtain T-lymphocyte samples.
Southern blot procedure
Restriction digest and electrophoresis were also carried out ac- cording to standard procedure (Maniatis et al. 1982). Samples cast in agarose blocks were rinsed (if previously stored in EDTA) with 20-30ml TE and equilibrated in 1 x restriction buffer for 30-45 min. The buffer was then replaced with 1 x buffer plus restriction enzyme and incubated at the appropriate temperature overnight. Following digestion, the blocks were electrophoresed, along with standard digests. After electropho- resis, all gels were transferred to nylon membrane (Zeta-bind, CUNO) and cross-linked using the ultraviolet light procedure described by Church and Gilbert (1984). Limiting quantities of DNA necessitated the use of high specific activity probes pre-
Clonal dynamics of the hematopoietic system
pared by nick translation, using all four high specific activity {3000 Ci/mmole) [a2P]dNTPs (Lemischka et al. 1986). Hybrid- ization was performed using conditions originally described by Reed (1988). A hybridization solution consisting of 0.36 M NaC1, 20 mM NaPO4, 2 mM EDTA, 1% SDS, 0.5% nonfat milk, 10% dextran sulfate, and 500 ~g/ml denatured herring sperm DNA was used. Hybridization was performed at 65°C for 12-14 hr. Inside the hybridization bags, the membranes were sand- wiched between two pieces of Schleicher & Schuell 589-WH paper to help reduce background (Reed 1988).
Probes were linear fragments of NEO, IL-3 eDNA (Yokota et al. 1984), or a Y chromosome-specific probe (pY2; Lamar and Palmer 1984), all gel-purified as described (Vogelstein and Gil- lespie 1979). Quantitation was performed exactly as described previously (Lemischka et al. 1986). Briefly, membranes were probed sequentially with a retroviral marker-specific probe (NEO), an autosomal probe (IL-3), and a host-specific probe (pY2, only used for bone-marrow-reconstituted recipients). [Normalization of DNA content by densitometric analysis of IL-3 signal, allows quantitation of NEO-specific signal (also by densitometry).] Differences in IL-3 and NEO probe-specific ac- tivity were compensated by analysis of a marker sample that consisted of a cloned 3T3 line carrying a single NEO virus. Quantitation of host-derived DNA was performed as described (Lemischka et al. 1986).
A c k n o w l e d g m e n t s
We thank the following individuals for invaluable critical com- ments and discussion: Jean Schwarzbauer, Eric Wieschaus, Ar- nold Levine, Philip Sharp, and Makio Ogawa. For excellent technical assistance, we thank Joanne Skevington and Barbara Smith. Expert preparation of the manuscript was carried out by Nancy Plum. This work was supported by grants from the Na- tional Institutes of Health (NIH; RO1-CA45339), a Dupont Young Faculty grant, and American Cyanamid. C.T.J. was sup- ported by an NIH training grant (T32-CA09528).
References
Abramson, S., R.G. Miller, and R.A. Phillips. 1977. The identi- fication in adult bone marrow of pluripotent and restricted stem cells of the myeloid and lymphoid systems. J. Exp. Med. 145: 1567-1579.
Bender, M.A., T.D. Palmer, R.E. Gelinas, and D.A. Miller. 1987. Evidence that the packaging signal of Moloney murine leu- kemia virus extends into the gag region. J. Virol. 61: 1639- 1646.
Boggs, D.R., S.S. Boggs, D.F. Saxe, L.A. Gress, and D.R. Can- field. 1982. Hematopoietic stem cells with high proliferative potential: Assay of their concentration in marrow by the fre- quency and duration of cure of W/W v mice. J. Clin. Invest. 70: 242-252.
Capel, B., R. Hawley, L. Covarrubias, T. Hawley, and B. Mintz. 1989. Clonal contributions of small numbers of retrovirally marked hematopoietic stem ceils engrafted in unirradiated neonatal W/W v mice. Proc. Natl. Acad. Sci. 86: 4564-4568.
Church, G.M. and W. Gilbert. 1984. Genomic sequencing. Proc. Natl. Acad. Sci. 81: 1991-1995.
Cone, R.D., A. Weber-Benarous, D. Baorto, and R.C. Mulligan. 1987. Regulated expression of a complete human B-globin gene encoded by a transmissible retrovirus vector. Mol. Cell. Biol. 7: 887-897.
Danos, O. and R.C. Mulligan. 1988. Safe and efficient genera-
GENES & DEVELOPMENT 231
Cold Spring Harbor Laboratory Press on January 31, 2022 - Published by genesdev.cshlp.orgDownloaded from
Jordan and Lemischka
tion of recombinant retroviruses with amphotropic and eco- tropic host ranges. Proc. Natl. Acad. Sci. 85: 6460-6464.
Dexter, T.M., T.D. Allen, and L.G. Lajtha. 1976. Conditions controlling the proliferation of haemopoietic stem cells in vitro. J. Cell Physiol. 91: 335-344.
Dexter, T.M. and E. Spooncer. 1987. Growth and differentiation in the Hemopoietic system. Ann. Rev. Cell Biol. 3: 423- 441.
Dick, J.E., M.C. Magli, D. Huszar, R.A. Phillips, and A. Bem- stein. 1985. Introduction of a selectable gene into primitive stem cells capable of long-term reconstitution of the hemo- poietic system of W/W v mice. Cell 42: 71-79.
Dudov, K.P. and R.P. Perry. 1984. The gene family encoding the mouse ribosomal protein L32 contains a uniquely expressed intron-containing gene and an unmutated processed gene. Cell 37: 457-468.
Erslev, A.J. and T. Gabuzda. 1985. Pathophysiology of Blood, pp. 141-142. W.B. Sanders, Philadelphia.
Ezine, S., I. Weissman, and R. Rouse. 1984. Bone marrow cells give rlse to distinct cell clones within the thymus. Nature 309: 629-631.
Freitas, A.A., B. Rocha, and A.A. Coutinho. 1986. Lymphocyte population kinetics in the mouse. Immunol. Rev. 91: 5-37.
Harrison, D.E., C.M. Astle, and C. Lerner. 1988. Number and continuous proliferative pattern of transplanted primitive immunohematopoietic stem ceils. Proc. Natl. Acad. Sci. 85: 822-826.
Hartman, S. C. and R.C. Mulligan. 1988. Two dominant-acting selectable markers for gene transfer studies in mammalian cells. Proc. Natl. Acad. Sci. 85: 8047-8051.
Kay, H.E.M. 1965. How many cell-generations? Lancet if: 418- 419.
Keller, G., C. Paige, E. Gilboa, and E.F. Wagner. 1985. Expres- sion of a foreign gene in myeloid and lymphoid ceils derived from multipotent hematopoietic precursors. Nature 318:149-154.
Korn, A.P., R.M. Henkelman, F.P. Ottensmeyer, J.E. Till. 1973. Investigations of a stochastic model of haemopoiesis. Exp. Hematol. 1: 362-375.
Lamar, E.E. and E. Palmer. 1984. Y-encoded species-specific DNA in mice: Evidence that the Y chromosome exists in two polymorphic forms in inbred strains. Cell 37: 171-177.
Lemischka, I.R., D.H. Raulet, and R.C. Mulligan. 1986. Devel- opmental potential and dynamic behavior of hematopoietic stem cells. Cell 45:917-927.
Maniatis, T., P. Fritsch, and J. Sambrook. 1982. Molecular cloning: A laboratory manual. Cold Spring Harbor Labora- tory Press, Cold Spring Harbor, New York.
Mann, R., R.C. Mulligan, and D. Baltimore. 1983. Construction of a retrovirus packaging mutant and its use to produce helper-free defective retrovirus. Cell 33: 153-159.
McKearn, J.P., J. McCubrey, and B. Fagg. 1984. Enrichment of hematopoietic precursor cells and cloning of multipotential B-lymphocyte precursors. Proc. Natl. Acad. Sci. 82: 7414- 7418.
Metcalf, D. 1984. The hemopoietic colony stimulating factors. Elsevier, New York.
Metcalf, D. 1988. The molecular control of blood cells. Harvard University Press, Cambridge.
Micklem, H.S., J.D. Ansell, J.E. Wayman, and L. Forrester. 1983. The clonal organization of hematopoiesis in the mouse. Prog. Immunol. 5: 633-644.
Micklem, H.S., J.E. Lermon, J.D. Ansell, and R.A. Gray. 1987. Numbers and dispersion of repopulating hematopoietic cell clones in radiation chimeras as functions of injected cell dose. Exp. Hematol. 15: 251-257.
232 GENES & DEVELOPMENT
Mintz, B., K. Anthony, and S. Litwin. 1984. Monoclonal deriva- tion of mouse myeloid and lymphoid lineages from totipo- tent hematopoietic stern cells experimentally engrafted in fetal hosts. Proc. Natl. Acad. Sci. 81: 7835-7839.
Nakahata, T., A.I. Gross, and M. Ogawa. 1982. A stochastic model of self-renewal of the primitive hemopoietic stem ceils in culture. J. Cell. Physiol. 113: 455-458.
Ogawa, M., P.N. Porter, and T. Nakahata. 1983. Renewal and commitment to differentiation of hemopoietic stem cells. Blood 61: 823-829.
Poustka, A., T.M. Pohl, D.P. Barlow, A.M. Frischauf, and H. Lehrach. 1987. Construction and use of human chromosome jumping libraries from NotI-digested DNA. Nature 325: 353-355.
Reed, K.C. 1988. Evaluation of alkaline southern transfers. Bio- Rad Mol. Biol. Rep. 4: 3-4.
Russell, EIS. and S.E. Bemstein. 1966. Blood and blood forma- tion. In Biology of the laboratory mouse, 2nd ed. {ed. E.L. Green), pp. 351-372. McGraw-Hill, New York.
Seiler-Tuyns, A., I.D. Eldridge, and B.M. Paterson. 1984. Ex- pression and regulation of chicken actin genes introduced into mouse myogenic and nonmyogenic cells. Proc. Natl. Acad. Sci. 81: 2980-2984.
Snodgrass, R. and G. Keller. 1987. Clonal fluctuation within the haematopoietic system of mice reconstituted with retro- virus-infected stem ceils. EMBO ]. 6: 3955-3960.
Spangrude, G.J., S. Heimfeld, and I.L. Weissman. 1988. Purifica- tion and characteristics of mouse hematopoietic stem cells. Science 241: 58-62.
Till, I.E. and E.A. McCulloch. 1961. A direct measurement of the radiation sensitivity of normal mouse bone marrow cells. Rad. Res. 14: 213-222.
Trentin, l.l. 1970. Influence of hematopoietic organstroma (he- matopoietic inductive microenvironments) on stern cell dif- ferentiation. In Regulation of hematopoiesis led. A.S. Gordonl, pp. 161. Appleton-Century-Crofts, New York.
van Bekkum, D.W. and M.J. De Vries. 1967. Radiation chi- meras, Academic Press, New York.
van Furth, R. and Z.A. Cohn. 1968. The origin and kinetics of mononuclear phagocytes. ]. Exp. Med. 128: 415-433.
Visser, J.W.M., J.G.I. Bauman, A.H. Mulder, J.F. Eliason, and A.M. de Leeuw. 1984. Isolation of murine pluripotent he- mopoietic stem cells. ]. Exp. Med. 59: 1576-1590.
Vogelstein, B. and D. Gillespie. 1979. Preparative and analytical purification of DNA from agarose. Proc. Natl. Acad. Sci. 76: 615-619.
Williams, D.A., I.R. Lemischka, D.G. Nathan, and R.C. Mul- ligan. 1984. Introduction of new genetic material into pluri- potent haematopoietic stem cells of the mouse. Nature 310: 476-480.
Wysocki, L.J. and V.L. Sato. 1978. 'Panning' for lymphocytes: A method for cell selection. Proc. Natl. Acad. Sci. 75: 2844- 2848.
Yokota, T., F. Lee, D. Rennick, L. Hall, N. Arai, T. Mosman, G. Nabel, H. Cantor, and K. Arai. 1984. Isolation and character- ization of a mouse eDNA that expresses MAST-cell-growth- factor activity in monkey cells. Proc. Natl. Acad. Sci. 81: 1070-1075.
Cold Spring Harbor Laboratory Press on January 31, 2022 - Published by genesdev.cshlp.orgDownloaded from
10.1101/gad.4.2.220Access the most recent version at doi: 4:1990, Genes Dev.
C T Jordan and I R Lemischka mouse.Clonal and systemic analysis of long-term hematopoiesis in the
References
http://genesdev.cshlp.org/content/4/2/220.full.html#ref-list-1
This article cites 38 articles, 16 of which can be accessed free at:
License
ServiceEmail Alerting
click here.right corner of the article or
Receive free email alerts when new articles cite this article - sign up in the box at the top
Copyright © Cold Spring Harbor Laboratory Press
Cold Spring Harbor Laboratory Press on January 31, 2022 - Published by genesdev.cshlp.orgDownloaded from
Related Documents