http://tpx.sagepub.com/ Toxicologic Pathology http://tpx.sagepub.com/content/35/4/521 The online version of this article can be found at: DOI: 10.1080/01926230701338933 2007 35: 521 Toxicol Pathol Amy Yang, Dusko Trajkovic, Oscar Illanes and Fernando Ramiro-Ibáñez Dawley Rats - Clinicopathological and Tissue Indicators of Para-Aminophenol Nephrotoxicity in Sprague Published by: http://www.sagepublications.com On behalf of: Society of Toxicologic Pathology can be found at: Toxicologic Pathology Additional services and information for http://tpx.sagepub.com/cgi/alerts Email Alerts: http://tpx.sagepub.com/subscriptions Subscriptions: http://www.sagepub.com/journalsReprints.nav Reprints: http://www.sagepub.com/journalsPermissions.nav Permissions: What is This? - Jun 1, 2007 Version of Record >> by guest on October 11, 2013 tpx.sagepub.com Downloaded from by guest on October 11, 2013 tpx.sagepub.com Downloaded from by guest on October 11, 2013 tpx.sagepub.com Downloaded from by guest on October 11, 2013 tpx.sagepub.com Downloaded from by guest on October 11, 2013 tpx.sagepub.com Downloaded from by guest on October 11, 2013 tpx.sagepub.com Downloaded from by guest on October 11, 2013 tpx.sagepub.com Downloaded from by guest on October 11, 2013 tpx.sagepub.com Downloaded from by guest on October 11, 2013 tpx.sagepub.com Downloaded from by guest on October 11, 2013 tpx.sagepub.com Downloaded from by guest on October 11, 2013 tpx.sagepub.com Downloaded from by guest on October 11, 2013 tpx.sagepub.com Downloaded from by guest on October 11, 2013 tpx.sagepub.com Downloaded from

Welcome message from author
This document is posted to help you gain knowledge. Please leave a comment to let me know what you think about it! Share it to your friends and learn new things together.
Transcript
http://tpx.sagepub.com/Toxicologic Pathology
http://tpx.sagepub.com/content/35/4/521The online version of this article can be found at:
DOI: 10.1080/01926230701338933
2007 35: 521Toxicol PatholAmy Yang, Dusko Trajkovic, Oscar Illanes and Fernando Ramiro-Ibáñez
Dawley Rats−Clinicopathological and Tissue Indicators of Para-Aminophenol Nephrotoxicity in Sprague
Published by:
http://www.sagepublications.com
On behalf of:
Society of Toxicologic Pathology
can be found at:Toxicologic PathologyAdditional services and information for
http://tpx.sagepub.com/cgi/alertsEmail Alerts:
http://tpx.sagepub.com/subscriptionsSubscriptions:
http://www.sagepub.com/journalsReprints.navReprints:
http://www.sagepub.com/journalsPermissions.navPermissions:
What is This?
- Jun 1, 2007Version of Record >>
by guest on October 11, 2013tpx.sagepub.comDownloaded from by guest on October 11, 2013tpx.sagepub.comDownloaded from by guest on October 11, 2013tpx.sagepub.comDownloaded from by guest on October 11, 2013tpx.sagepub.comDownloaded from by guest on October 11, 2013tpx.sagepub.comDownloaded from by guest on October 11, 2013tpx.sagepub.comDownloaded from by guest on October 11, 2013tpx.sagepub.comDownloaded from by guest on October 11, 2013tpx.sagepub.comDownloaded from by guest on October 11, 2013tpx.sagepub.comDownloaded from by guest on October 11, 2013tpx.sagepub.comDownloaded from by guest on October 11, 2013tpx.sagepub.comDownloaded from by guest on October 11, 2013tpx.sagepub.comDownloaded from by guest on October 11, 2013tpx.sagepub.comDownloaded from
Toxicologic Pathology, 35:521–532, 2007Copyright C© by the Society of Toxicologic PathologyISSN: 0192-6233 print / 1533-1601 onlineDOI: 10.1080/01926230701338933
Clinicopathological and Tissue Indicators of Para-AminophenolNephrotoxicity in Sprague–Dawley Rats
AMY YANG1, DUSKO TRAJKOVIC,2 OSCAR ILLANES,3 AND FERNANDO RAMIRO-IBANEZ4
2World Wide Safety Sciences, Pfizer Global Research and Development, San Diego, California 92121, USA
ABSTRACT
A model of para-aminophenol (PAP) nephrotoxicity in Sprague–Dawley rats was utilized to characterize potential indicators of toxicity in thekidney and in biofluids, and to chronicle the progression of acute renal injury. Rats were administered PAP at a low or high dose and examinedterminally at 6, 24 and 48 hours (4 animals/group with matching controls). Acute tubular necrosis was observed in the medullary rays (low and highdoses) and the outer stripe of outer medulla (high dose only) as early as 6 hours postdosing. Starting at 24 hours, regeneration of the tubular epitheliumwas evident in both low and high dose studies. Associated with the tubular lesions, we observed elevation of urinary α-glutathione S-transferase levels,an indicator of proximal tubular injury. By immunohistochemistry of the kidney, decreased γ -glutamylcysteine synthetase expression correlated withtubular injury, especially at high dose, whereas elevation of vimentin, osteopontin, and Ki-67 expression was concurrent with tubular regeneration.Clusterin and kidney injury molecule-1 displayed expression patterns characteristic of both renal injury and regeneration. Taken together, this studyprovided insight into the progression of nephrotoxicity, and allowed the evaluation of potential urinary and tissue protein biomarkers that couldcomplement the early detection of acute tubular injury.
Keywords. Nephrotoxicity; p-aminophenol; immunohistochemistry; α-glutathione S-transferase; clusterin; KIM-1; osteopontin
INTRODUCTION
Drug-induced nephrotoxicity is one of the major safetyconcerns in drug development due to the risk of clinicalrenal complications associated with drug therapy (Racusenand Solez 1986; Hoitsma et al., 1991; Perazella 2005).Moreover, drug-induced toxicosis is an important cause ofacute renal failure in humans (Brady et al., 2004). Basedon these premises, the early prediction of nephrotoxicityin preclinical models is of great interest to the pharmaceu-tical industry, since the characterization of reliable trans-lational biomarkers of nephrotoxicosis would improve themonitoring of renal function in clinical trials (Hewitt et al.,2004).
Para-aminophenol (PAP; also known as 4-aminophenolor p-aminophenol) is a well-known metabolite of ac-etaminophen and phenacetin, and a derivative of anilinesin industrial use (Green et al., 1969; Newton et al., 1983;McCarthy et al., 1985; Kanbak et al., 1996). It induces acute
Authors Yang and Ramiro-Ibanez contributed equally to this work.1Current address: Department of Molecular and Investigative Toxicol-
ogy, Iconix Biosciences, Inc., 325 East Middlefield Road, Mountain View,CA 94043.
3Current address: Department of Pathology, College of VeterinaryMedicine, Western University, 309 E Second St., Pomona, CA 91766.
4Current address: IDEXX Laboratories Ltd., Grange House, SandbeckWay, Wetherby, West Yorkshire, LS22 7DN, UK.
Address correspondence to: Fernando Ramiro-Ibanez, IDEXX Labora-tories Ltd., Grange House, Sandbeck Way, Wetherby, West Yorkshire, LS227DN, UK; e-mail: [email protected]
Abbreviations: ATN, acute tubular necrosis; BUN, blood urea nitro-gen; GCS, γ -glutamylcysteine synthetase; GGT, γ -glutamyl transpepti-dase; GST, glutathione S-transferase; H&E, hematoxylin and eosin; IHC,immunohistochemistry; ISOM, inner stripe of the outer medulla; KIM-1, kidney injury molecule-1; MR, medullary ray; NAG, N-acetyl-ß-D-glucosaminidase; OSOM, outer stripe of the outer medulla; PAP, para-aminophenol; PAS, periodic acid-Schiff; PST, proximal straight tubule.
tubular necrosis (ATN) affecting the proximal straight tubule(PST; S3 segment of the proximal tubule), a property that jus-tifies the use of PAP as a model for acute analgesic nephropa-thy (Green et al., 1969). The lesions produced by PAP in thekidney are dose-responsive: at low dose they affect only thePST within the medullary rays (MRs), with a selectivity forcortical nephrons, while at higher concentrations they extendto the PSTs in the outer stripe of outer medulla (OSOM;Fowler et al., 1991, 1994). This selectivity might be relatedto the differential perfusion of the tubular areas (Fowler et al.,1991). The PAP-induced tubular damage appears early afteradministration (Green et al., 1969; Davis et al., 1983), allow-ing the use of early time points to study the progress of thelesions and the changes in the expression of relevant proteins.
There is currently an ongoing search for indicators of re-nal toxicity in animal models that could translate into humanmedicine. Some of the most promising molecules indicativeof tubular damage are clusterin and kidney injury molecule-1 (KIM-1) (Hidaka et al., 2002; Han and Bonventre, 2004).Others, such as osteopontin, vimentin and Ki-67, may actas indicators of regeneration (Chevalier et al., 1998; Persyet al., 1999; Endl and Gerdes, 2000). The changes in ex-pression levels of these and a few other proteins followingPAP administration were evaluated by immunohistochem-istry (IHC) to assess their utility as potential nephrotoxicitymarkers.
Of major interest in clinical settings is the assessment of re-nal function with non-invasive methods. Traditional markersof renal damage like blood urea nitrogen (BUN) and creati-nine are often of low sensitivity or capture only irreversiblelesions (Brady et al., 2004). Currently many scientists andphysicians are collaborating in an attempt to obtain more re-liable biomarkers of early renal damage (Han and Bonventre,2004; Hewitt et al., 2004). In this sense, the glutathione S-transferase (GST) molecules have shown great potential as
521
522 YANG ET AL. TOXICOLOGIC PATHOLOGY
indicators of tubular injury due to their enhanced sensibilityand specific distribution (Rozell et al., 1993; Han and Bon-ventre, 2004). We chose α-GST and µ-GST, markers of prox-imal and distal tubular damage, respectively, to evaluate thechronological variation in the urine of rats administered PAP.
In summary, the goals of this study were two-fold: tocharacterize the time-dependent changes of the microscopiclesions that occur in the kidneys of rats after a single PAPadministration, and to correlate these findings to clinicalpathology parameters and potential tissue biomarkers ofnephrotoxicity.
MATERIALS AND METHODS
Animals and SamplesForty-eight 7-week-old male Sprague–Dawley rats (Crl:
CD (SD) IGS BR) from Charles River Laboratories (Boston,MA) were distributed between low (50 mg/kg) and high dose(150 mg/kg) groups using a computer-assisted randomiza-tion procedure to ensure similar distribution of body weights.Each group was subdivided among three terminal time points(6, 24, and 48 hours), with 4 treated and 4 control animals pertime point. The rats were housed individually in metaboliccages (VWR, West Chester, PA) to obtain urine at selectedtime points. The rats were kept in air-conditioned rooms withcontrolled temperature 20–24◦C, relative humidity 55 ± 15%and 12:12 hours dark:light cycles.
For all purposes, standard procedures and conditions wereapplied for animal care, feeding and maintenance. Water andfood were provided ad libitum. Clinical signs were monitoredfor the duration of the study. Rats were sacrificed with CO2overexposure, followed by puncture of the diaphragm andcervical dislocation. All experimental procedures were re-viewed and approved by the Pfizer Institutional Animal Careand Use Committee and followed the published guidelinesfor animal welfare (Guide for the Care and Use of Labora-tory Animals, 1996; Animal Welfare Act, 1966, as amendedin 1970, 1976, and 1985, 9 CFR Parts 1, 2, and 3).
The urine was collected via metabolic cages in chilled15 ml standard conical polypropylene tubes (VWR, WestChester, PA) and stored at 4◦C until processed. Blood collec-tion for clinical biochemistry was done following euthanasiawith CO2 overexposure and previous to puncture of the di-aphragm. The blood was collected into 3 ml tubes containinglithium heparin.
Postmortem examination was performed on each rat andthe gross findings annotated. A central slice was obtainedfrom each kidney and fixed in 10% buffered formalin for48 hours.
Chemical Formulation and AdministrationPAP (Sigma-Aldrich, St. Louis, MO) was prepared in ster-
ile saline at a concentration of 15 mg/ml for the high doseand 5 mg/ml for the low dose. At time 0, each animal wasgiven a single ip injection of PAP or saline at a final volumeof 10 ml/kg.
Laboratory TestsUrine samples were analyzed for the following param-
eters using standard laboratory procedures: urine volume(measured manually), specific gravity (Clinitek Atlas, BayerCorporation, Elkhart, IN), total protein (Hitachi 911, Roche
Diagnostics, Indianapolis, IN), glucose (Hitachi 911),microalbumin (Hitachi 911), ß2-microglobulin (Immulite,Diagnostic Products Corporation, Los Angeles, CA),creatinine (Hitachi 911), N-acetyl-ß-D-glucosaminidase(NAG) (Hitachi 911), and γ -glutamyl transpeptidase (GGT;Hitachi 911). α-GST and µ-GST were evaluated via enzymeimmunoassay with commercial antibodies (Biotrin, Dublin,Ireland). Routine blood chemistry parameters were obtainedutilizing the Hitachi 911.
Numerical and Statistical AnalysisAll urinalysis and blood chemistry results were expressed
as mean ± standard error of the mean (SEM). Since low doseand high-dose studies were conducted independently of eachother, Student’st-test was performed between values fromcontrol and treated animals at each dose-time combinationto determine whether statistical significance (p < 0.05) wasreached.
Tissue Processing and PreparationFormalin-fixed kidneys were embedded in paraffin blocks
and sectioned at 4 µm following routine histological proto-cols. The sections were placed on frosted glass slides, stainedwith hematoxylin and eosin (H&E) and periodic acid-Schiff(PAS), and examined by light microscopy. Samples fromtreated rats and time-matched control rats were examinedin parallel. The changes we took into consideration for eval-uation purposes were: tubular degeneration/necrosis, tubu-lar dilation, intratubular protein, interstitial infiltrates, andmineralization.
Immunohistochemistry (IHC)The selection of antibodies was based on preliminary gene
expression profiling analysis (manuscript in preparation), andthe relevance of the proteins in nephrotoxicity based on litera-ture reviews. The chosen proteins were clusterin, KIM-1, os-teopontin, vimentin, γ -glutamylcysteine synthetase (GCS),Ki-67 and cleaved caspase 3. Clusterin, KIM-1, osteopontinand vimentin show modulation during renal damage (Cheva-lier et al., 1998; Ichimura et al., 1998; Persy et al., 1999;Hidaka et al., 2002). Ki-67 is a well-recognized proliferationmarker. GCS is specifically localized to the PST (Shepherdet al., 2000), and its expression was decreased following PAPtreatment as shown by gene expression analysis (manuscriptin preparation). Cleaved caspase 3 is a well-known markerof apoptosis. The IHC procedures were optimized for eachantibody. The antibodies chosen and the methods used arelisted in Table 1.
Blocking steps for all techniques included quenching of en-dogenous peroxidase with 3% H2O2 in distilled water, avidin-biotin blocking from Ventana (Tucson, AZ) or from Biocare(Walnut Creek, CA) (except for the Omni-Map kit), and pro-tein blocking (TNB, Perkin-Elmer, Boston, MA). The IHCsignal for clusterin was amplified with the TSA kit (Perkin-Elmer). Each secondary antibody was chosen to match theprimary antibody and used at concentrations between 1:200–1:500. All slides were counterstained with hematoxylin, andexamined by light microscopy in order to describe endoge-nous antigen distribution and treatment- and time-dependentchanges.
Vol. 35, No. 4, 2007 MARKERS OF ANALGESIC NEPHROTOXICITY 523
TABLE 1.—Immunohistochemistry reagents and protocols.
Provider Type Dilution Instrument Antigen Retrieval Incubation
Clusterin Santa Cruz (#sc-6420) Goat polyclonal 1:3000 Dako Reveal 60 min, 25◦CKIM-1 Pfizer (In-house) Rabbit polyclonal 1:100 Ventana Dab Map CC1 std 60 min, 37◦COsteopontin Assay Design (#915-058) Rabbit polyclonal 1:100 Ventana Omni Map CC2 std. 60 min, 25◦CVimentin Dako (#M0725) Mouse Monoclonal 1:300 Dako Reveal 60 min, 25◦CKi-67 Lab Vision (#RM-9106) Rabbit monoclonal 1:900 Ventana Dab Map CC1 std. 60 min, 37◦CGCS Lab Vision (#RB-1697) Rabbit polyclonal 1:100 Ventana Dab Map Protease 2 60 min, 37◦CCaspase 3 Cell Signaling (#9661) Rabbit polyclonal 1:100 Ventana Dab Map CC1std. 60 min, 37◦C
RESULTS
Clinical Signs, Clinical Pathology, and Gross FindingsHigh-Dose: The administration of a single dose of
PAP at 150 mg/kg produced significant decreases in bodyweight and increases in absolute and relative kidney weights(Table 2). Grossly, the kidneys were swollen, and uponcross-section presented a pale band between the cortexand medulla, corresponding to the outer stripe of the outermedulla (OSOM), and extending along the medullary rays(MRs) into the cortex. A minimal amount of clear, straw-colored fluid (less than 1 ml) was found in the peritoneum ofall animals at 6 and 48 hours postdosing.
Results of the urinalysis are presented in Table 3. One of themost remarkable findings in the urinalysis was the elevation inα-GST levels, peaking at 6 hr post-dosing (856-fold increase)and decreasing over time (Table 3). Additional indicators ofrenal toxicity were GGT, NAG, urinary glucose, total urinaryprotein, and µ-GST, showing different chronological trends(Table 3). Detectable microalbuminuria was only present at48 hr post-dosing (Table 3).
Serum biochemistry is shown in Table 4. BUN and creati-nine at all time points were the most significant parametersindicative of renal damage. The maximum values for bothBUN and creatinine were observed at 48 hours postdosing.
Low Dose: The ip administration of a single dose of PAPat 50 mg/kg did not produce any clinical signs or body weightloss (Table 5). In contrast to the high- dose study, there wereno gross findings at necropsy and no changes in the terminalrelative kidney weights (Table 5).
Due to the expected dose-response effect, both the urinaly-sis and the clinical chemistry displayed more subtle changescompared to the high dose study. Interestingly, the GST anal-ysis in the urine showed a similar trend, though with a lowermagnitude of change, compared to the high-dose study. α-GST peaked at 6 hours (99-fold increase) and decreasedsteadily over time to control levels (Table 6). µ-GST also hada peak at 6 hours (48-fold increase), but not as pronounced asthe α-GST elevation, and it showed a similar steep decreaseover time. Both the microalbumin and the total protein had amaximum at 12 hours (data not shown), with significant ele-
vation of the microalbumin also at 6 and 24 hours (Table 6).No serum biochemistry abnormalities reflective of renal dam-age were observed between the control and treated groups atany time point (Table 7).
HistopathologyHigh Dose: The histopathological changes in the
kidney were remarkable from 6 hours onward. The kidneysshowed acute tubular necrosis (ATN) extending along theMRs towards the outer cortex and also into the OSOM(Figure 1A). These areas of necrosis corresponded to theproximal straight tubule (PST; Figure 1C). The lumen ofthe affected tubules was slightly wider as a consequenceof the damage to the epithelial lining (compare Figure 1B,C). Abundant intratubular eosinophilic and pale basophilicproteinaceous material was seen in affected areas, mostlydownstream of the damaged PST and extending into themedulla and outer cortex (within distal convoluted tubules)(Figure 1A).
In some cases there was evidence of mineralization withinthe lumen of necrotic tubules and occasionally in the corre-sponding basement membranes, more frequently in the outermedulla. At 24 and 48 hours, the progression of the lesionswas characterized by an increased number of regeneratingtubules (Figure 1C). These regenerating cells often lacked adefined brush border, as observed with the PAS stain (com-pare Figure 1B, C). At 6 hours postdosing, interstitial cap-illaries and small vessels in the areas of damage often hadan increased number of leukocytes, progressing to mild infil-trates of lymphocytes and macrophages at 24 and 48 hours.
Other lesions found in the kidney with uncertain correla-tion with treatment were erosion and hyperplasia with disor-ganization of the papillary epithelium (4/4 at 24 hours and2/4 at 48 hours; Figure 1D); and multifocal vasculopathy withmural deposition of PAS positive material in high-dose rats(3/4 at 24 hours and 2/4 at 48 hours; Figure 1E).
Low Dose: The only region of the nephron apparentlyaffected by low-dose PAP corresponded to the PST in theMRs (Figures 1F-H). The most prominent and extensive ini-tial lesion (at 6 hours) was expansion of the tubular lumen,
TABLE 2.—Body and kidney weights for the high-dose (150 mg/kg) PAP study.
6 hr 24 hr 48 hr
Control PAP Control PAP Control PAP
Body Weight Change (terminal vs. day 1) −2%∗ −2%∗ 2%∗ −5%∗ 6%∗ −8%∗Kidney absolute weight (g) 2.26 ± 0.09 2.81± 0.07∗ 2.27 ±0.08 3.03 ± 0.28∗ 2.35 ± 0.11 2.92 ± 0.08∗Kidney-to-brain weight ratio 1.19 ± 0.05 1.52 ± 0.05∗ 1.22 ± 0.05 1.68 ± 0.13∗ 1.25 ± 0.05 1.58 ± 0.05∗
Values are reported as mean ± SEM.∗Statistically significant difference (p < 0.05 by Student’s t-test) between treated samples and time-matched vehicle controls is bolded. In the case of body weight differences, statistical
significance was determined by comparing terminal vs. day 1 weights in the same animals.
524 YANG ET AL. TOXICOLOGIC PATHOLOGY
TABLE 3.—Urinalysis results for the high-dose (150 mg/kg) PAP study.
0 hr 6 hr 24 hr 48 hr
Control PAP Control PAP Control PAP Control PAP
Volume (ml/6hr) 1.9 ± 0.2 1.9 ± 0.1 2.5 ± 0.3 4.2 ± 0.6∗ 3.6 ± 0.4 4.2 ± 1.0 3.1 ± 0.3 4.8 ± 0.9Specific gravity 1.016 ± 0.001 1.018 ± 0.002 1.021 ± 0.002 1.027 ± 0.002 1.018 ±0.002 1.020 ± 0.001 1.013 ± 0.001 1.018 ±0.002GGT (U/6hr) 2.2 ± 0.2 2.0 ± 0.2 2.3 ± 0.2 109 ± 23∗ 3.4 ± 0.5 5.8 ± 1.4 2.5 ± 0.3 1.0 ± 0.3∗NAG (U/6hr) 0.038 ± 0.003 0.040 ± 0.002 0.040 ± 0.005 0.39 ± 0.08∗ 0.061 ± 0.007 0.07 ± 0.02 0.060 ± 0.004 0.066 ± 0.008Glucose (mg/6hr) 0.58 ± 0.05 0.60 ± 0.03 0.46 ± 0.04 31 ± 8∗ 1.47 ± 0.15 47 ± 11∗ 0.97 ±0.07 30 ± 2∗Total protein (mg/6hr) 1.4 ± 0.1 1.3 ± 0.1 1.4 ± 0.2 66 ± 16∗ 2.1 ± 0.3 29 ± 6∗ 2.4 ± 0.3 3.1 ± 0.5Microalbumin (mg/6 hr) <0.007 <0.006 <0.008 <0.011 <0.014 <0.012 <0.009 0.30 ± 0.04∗α-GST (µg/6hr) 0.35 ± 0.03 0.33 ± 0.02 0.49 ± 0.07 423 ± 88∗ 0.49 ± 0.07 7 ± 2∗ 0.44 ± 0.05 1.9 ± 0.7µ-GST (µg/6hr) 0.04 ± 0.01 0.031 ± 0.004 0.034 ± 0.007 1.7 ± 0.3∗ 0.041 ± 0.006 0.21 ± 0.07∗ 0.051 ± 0.004 0.07 ± 0.02
Values are reported as mean ± SEM.∗Statistically significant difference (p < 0.05 by Student’s t-test) between treated samples and time-matched vehicle controls is bolded.
TABLE 4.—Clinical chemistry findings for the high-dose (150 mg/kg) PAP study.
6 hr 24 hr 48 hr
Control PAP Control PAP Control PAP
ALT (U/L)a 48 ± 2 106 ± 21∗ 48 ± 1 86 ± 34 54 ± 4 46 ± 3AST (U/L)b 121 ± 14 1001 ± 337∗ 98 ± 5 310 ± 122 101 ± 3 103 ± 9Creatine Kinase (U/L) 567 ± 85 640 ± 165 451 ± 57 328 ± 16 419 ± 10 342 ± 28GGT (U/L) <3.0 24 ± 13 <3.0 8 ± 2∗ <3.0 27 ± 24BUN (mg/dL)c 17 ± 2 53 ± 4∗ 19 ± 2 92 ± 14∗ 20 ± 1 103 ± 10∗Creatinine (mg/dL) <0.4 1.2 ± 0.1∗ <0.4 3.2 ± 0.5∗ <0.4 3.3 ± 0.5∗Ca (mg/dL) 12.4 ± 0.3 14.2 ± 0.5∗ 12.5 ± 0.1 12.1 ± 0.9 12.3 ± 0.5 12.6 ± 0.6Phosphorus (mg/dL) 12.2 ± 0.5 18.6 ± 0.8∗ 11.1 ± 0.1 16.0 ± 2.3 10.8 ± 0.7 12.8 ± 1.3Total Bilirubin (mg/dL) 0.20 ± 0.04 0.30 ± 0.06 0.18 ± 0.03 0.43 ± 0.06∗ 0.28 ± 0.05 0.55 ± 0.09Total Protein (g/dL) 5.8 ± 0.1 5.4 ± 0.1∗ 6.2 ± 0.1 5.7 ± 0.1∗ 6.4 ± 0.1 6.1 ± 0.1Albumin Plus (g/dL) 4.10 ± 0.09 3.68 ± 0.06∗ 4.35 ± 0.05 3.55 ± 0.13∗ 4.38 ± 0.06 3.88 ± 0.11∗Globulin (g/dL) 1.73 ± 0.03 1.75 ± 0.03 1.88 ± 0.09 2.13 ± 0.06 2.03 ± 0.07 2.20 ± 0.12A/G ratiod 2.4 2.1 2.3 1.7 2.2 1.8Cholesterol (mg/dL) 64 ± 7 83 ± 22 68 ± 3 85 ± 8 68 ± 3 72 ± 10Triglycerides (mg/dL) 56 ± 7 32 ± 14 91 ± 23 30 ± 4∗ 109 ± 27 20 ± 4K (mmol/L) 6.4 ± 0.5 7.5 ± 0.4 5.4 ± 0.2 8.0 ± 1.0∗ 5.8 ± 0.4 7.6 ± 0.5∗
Values are reported as mean ± SEM.∗Statistically significant difference (p < 0.05 by Student’st-test) between treated samples and time-matched vehicle controls is bolded.aAlanine transaminase.bAspartate transaminase.cBlood urea nitrogen.d Albumin/globulin ratio.
TABLE 5.—Body and kidney weights for the low dose (50 mg/kg) PAP study.
6 hr 24 hr 48 hr
Control PAP Control PAP Control PAP
Body Weight (terminal vs. day 1) 0% -2% 1%∗ 1% 4%∗ 4%∗Kidney absolute weight (g) 2.25 ± 0.09 2.47± 0.01∗ 2.34 ±0.11 2.38 ± 0.06 2.50 ± 0.10 2.54 ± 0.10Kidney-to-brain weight ratio 1.19 ± 0.06 1.34 ± 0.02 1.22 ± 0.06 1.27 ± 0.04 1.36 ± 0.08 1.30 ± 0.05
Values are reported as mean ± SEM.∗Statistically significant difference (p <0.05 by Student’s t-test) between treated samples and time-matched vehicle controls is bolded. In the case of body weight differences, statistical
significance was determined by comparing terminal vs. day 1 weights in the same animals.
TABLE 6.—Urinalysis results for the low dose (50 mg/kg) PAP study.
0 hr 6 hr 24 hr 48 hr
Control PAP Control PAP Control PAP Control PAP
Volume (ml/6hr) 3.2 ± 0.3 3.2 ± 0.2 3.4 ± 0.5 4.0 ± 0.4 3.3 ± 0.3 3.2 ± 0.3 3.0 ± 0.1 3.1 ± 0.7Specific gravity 1.018 ± 0.001 1.019 ± 0.001 1.012 ± 0.002 1.016 ± 0.002 1.015 ± 0.001 1.020 ± 0.001∗ 1.014 ± 0.001 1.015 ± 0.000GGT (U/6hr) 0.3 ± 0.1 0.8 ± 0.2∗a 0.5 ± 0.1 3.5 ±1.1∗a 0.8 ± 0.3 1.1 ± 0.5 0.7 ± 0.1 1.0 ± 0.2NAG (U/6hr) 0.06 ± 0.01 0.050 ± 0.004 0.05 ± 0.01 0.06 ± 0.01 0.08 ± 0.01 0.09 ± 0.01 0.07 ± 0.01 0.06 ± 0.01Glucose (mg/6hr) 0.7 ± 0.1 0.8 ± 0.1 0.7 ± 0.1 0.7 ± 0.1 1.0 ± 0.1 0.9 ± 0.1 0.9 ± 0.1 0.8 ± 0.2Total proteinb 1.3 ± 0.2 1.3 ± 0.2 0.9 ± 0.2 1.5 ± 0.3 1.5 ± 0.2 2.0 ± 0.2 2.3 ± 0.3 2.5 ± 0.3Microalbumin (mg/6hr) <0.03 < 0.016 <0.04 <0.17∗ <0.03 0.4 ± 0.1∗ <0.03 <0.02α-GST (ug/6hr) 0.26 ± 0.03 0.35 ± 0.05 0.31 ± 0.05 31.2 ± 7.7∗ 0.28 ± 0.02 2.9 ± 0.3∗ 0.20 ± 0.03 0.35 ± 0.09µ-GST (ug/6hr) 0.020 ± 0.002 0.020 ± 0.002 0.018 ± 0.003 0.9 ± 0.3∗ 0.014 ± 0.002 0.07 ± 0.02∗ 0.023 ± 0.009 0.012 ± 0.003
Values are reported as mean ± SEM.∗Statistically significant difference (p < 0.05 by Student’s t-test) between treated samples and time-matched vehicle controls is bolded.aWhen taking into account the fold change at 0 hours, there is no statistically significant difference in GGT at 6 hours.bReported as a dipstick score.
Vol. 35, No. 4, 2007 MARKERS OF ANALGESIC NEPHROTOXICITY 525
TABLE 7.—Clinical chemistry findings for the low dose (50 mg/kg) PAP study.
6 hr 24 hr 48 hr
Control PAP Control PAP Control PAP
ALT (U/L) 60 ± 2 67 ± 6 64 ± 7 70 ± 3 60 ± 6 66 ± 5AST (U/L) 119 ± 5 111 ± 5 110 ± 4 105 ± 4 104 ± 9 104 ± 8Creatine Kinase (U/L) 479 ± 57 297 ± 8 341 ± 29 335 ± 29 407 ± 76 448 ±26GGT (U/L) <3.0 <3.0 <3.0 <3.0 <3.0 <3.0BUN (mg/dL) 15.9 ± 0.9 14.3 ± 1.0 21.4 ± 1.7 20.3 ± 0.7 18.5 ± 1.1 20.7 ± 0.5Creatinine (mg/dL) <0.4 <0.4 <0.4 <0.4 <0.4 <0.4Ca (mg/dL) 12.3 ± 0.2 12.7 ± 0.4 12.8 ± 0.1 13.0 ± 0.1 12.9 ± 0.2 12.6 ± 0.4Phosphorus (mg/dL) 11.6 ± 0.6 10.9 ± 0.3 12.0 ± 0.4 12.2 ± 0.4 12.8 ± 0.3 11.8 ± 0.3Total Bilirubin (mg/dL) 0.18 ± 0.03 0.15 ± 0.03 0.15 ± 0.03 0.15 ± 0.03 0.15 ± 0.03 0.20 ± 0.00Total Protein (g/dL) 5.8 ± 0.1 5.8 ± 0.1 6.3 ± 0.1 6.5 ± 0.1 6.2 ± 0.1 6.2 ± 0.2Albumin Plus (g/dL) 4.15 ± 0.06 4.15 ± 0.05 4.48 ± 0.09 4.48 ± 0.07 4.25 ± 0.06 4.28 ± 0.16Globulin (g/dL) 1.68 ± 0.07 1.65 ± 0.09 1.78 ± 0.12 2.00 ± 0.04 1.90 ± 0.04 1.90 ± 0.06A/G ratiod 2.08 ± 0.03 2.08 ± 0.02 2.24 ± 0.04 2.24 ± 0.04 2.13 ± 0.03 2.14 ± 0.08Cholesterol (mg/dL) 66 ± 5 68 ± 61 54 ± 4 74 ± 7∗ 60 ± 4 57 ± 4Triglycerides (mg/dL) 69 ± 8 73 ± 21 61 ± 11 63 ± 6 63 ± 10 76 ± 16K (mmol/L) 7.2 ± 1.1 5.4 ± 0.3 6.2 ± 0.2 5.9 ± 0.2 6.5 ± 0.2 6.0 ± 0.4
Values are reported as mean ± SEM.∗Statistically significant difference (p < 0.05 by Student’st-test) between treated samples and time-matched vehicle controls is bolded.
accompanied by flattening of the epithelial cells (Figure 1F)and by variable degree of tubulo-epithelial degeneration. Thedegenerative cells often remained attached to the basementmembrane at this time point. In addition, we observed a clearincrease in the number of leukocytes within interstitial ves-sels in and around injured renal areas (Figure 1F). At 24 hoursthe majority of the degenerative cells were sloughed into thelumen of the PSTs, and initial regeneration was observed.These changes were accompanied by an increased number oflymphocytes and macrophages infiltrating the areas of dam-age (Figure 1G).
At 48 hours, the lumen of the affected tubules contained avariable amount of cellular debris lacking recognizable nu-clei, and the tubular epithelial lining was continuous and ac-tively engaged in regeneration (Figure 1H). At this time pointmononuclear infiltrates remained around the areas of damageand were slightly more cellular compared to those at 24 hours(Figure 1H).
ImmunohistochemistryClusterin: Positive staining in the control animals was
of variable intensity and comprised the lumen of vessels,including glomerular capillaries (Figure 2A). In addition,there was positive staining of tubules in areas of nephropathy,rare tubules in the inner medulla, and epithelial cells of thetransitional epithelium of the renal pelvis. After treatmentwith 150 mg/kg of PAP, positive staining was seen initially innecrotic tubules (6 hours); at later time points it was centeredin areas of regeneration (OSOM, MRs) and intraluminalmaterial (Figure 2C), and extended to the inner stripe ofouter medulla (ISOM) and inner medulla. The parietalepithelium of some glomeruli was also positive. The stainingvaried from diffusely cytoplasmic to granular or apicallyoriented (Table 8).
Animals receiving a low dose (50 mg/kg) PAP at 6 hourspresented scattered positive cells in damaged PSTs of theMRs often with cytoplasmic staining and staining of pyknoticnuclei (Figure 2B). This distribution was similar at 24 hours,although with fewer positive cells and weaker cytoplasmicstaining. At 48 hours, positive cells were even less frequentand had decreased staining intensity (Table 8).
Kidney Injury Molecule-1 (KIM-1): The normal distri-bution of KIM-1 in untreated animals was sparse and limitedto small foci of rat nephropathy (Figure 2D). Following high-dose PAP treatment, increased KIM-1 expression was seenmultifocally at the periphery of necrotic areas, later on ex-tending along regenerating tubules into the MRs and OSOM,with a maximum intensity at 24 hours. A few glomerulishowed positive parietal epithelium. The positive stainingwas often apically oriented in the tubular cells (Table 8 andFigure 2F).
In the low dose treated animals, rare and usually isolatedpositive cells in tubules near the areas of damage were ob-served at 6 hours, extending to the periphery of the MRs andslightly to the OSOM (Table 8). The staining evolved fromcytoplasmic to apical (Figure 2E).
Osteopontin: The normal expression of osteopontin incontrol rats was intensely cytoplasmic in the simple papil-lary epithelium. Faint cytoplasmic staining was observed innumerous tubular cells at the transition of ISOM and OSOM.Six hours following high-dose treatment, an increased num-ber of osteopontin-positive tubules were seen mostly withinthe ISOM and in the viable tubules within necrotic areas ofthe MRs and OSOM. The staining was more intense over time(24 and 48 hours; Figure 2I) and progressed from diffuselycytoplasmic to apical. Some parietal cells in glomeruli, prox-imal convoluted tubules and the intratubular material werealso positive. Interestingly, the positive staining of the pap-illary epithelium disappeared partially or completely in ani-mals showing histological evidence of damage (Table 8).
Animals treated with the low-dose PAP showed a differ-ent pattern of osteopontin expression from those treated withthe high-dose PAP. A few positive cells in non-PST tubulesof the MRs were present. This pattern was slightly more in-tense at 24 and 48 hours, with scattered positivity in proximalconvoluted tubules and parietal cells (Table 8 and Figure 2H).
Vimentin: Vimentin-positive areas in control kidneyswere distributed in the mesangium of glomeruli, interstitium,and blood vessels (Figure 2J), and in the epithelium of sometubules in the ISOM and inner medulla. Tubules in areasof nephropathy were also positive. In animals treated withhigh dose PAP there were minor changes at 6 hours, evolving
526 YANG ET AL. TOXICOLOGIC PATHOLOGY
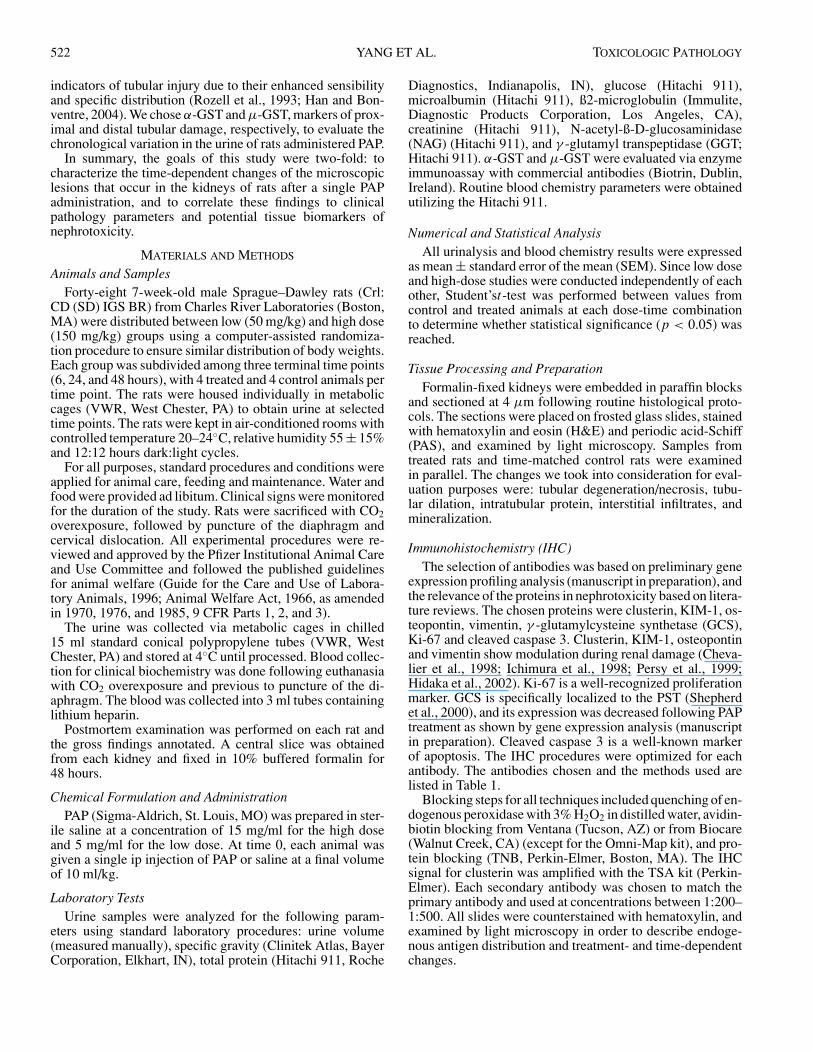
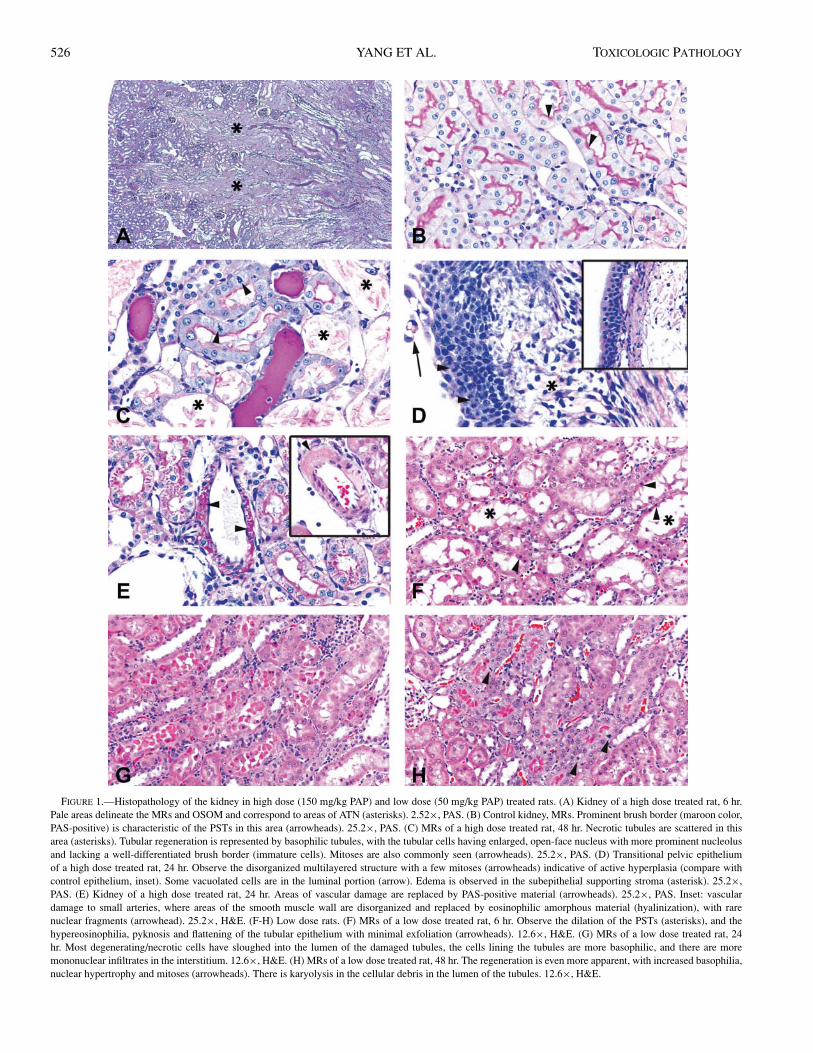
FIGURE 1.—Histopathology of the kidney in high dose (150 mg/kg PAP) and low dose (50 mg/kg PAP) treated rats. (A) Kidney of a high dose treated rat, 6 hr.Pale areas delineate the MRs and OSOM and correspond to areas of ATN (asterisks). 2.52×, PAS. (B) Control kidney, MRs. Prominent brush border (maroon color,PAS-positive) is characteristic of the PSTs in this area (arrowheads). 25.2×, PAS. (C) MRs of a high dose treated rat, 48 hr. Necrotic tubules are scattered in thisarea (asterisks). Tubular regeneration is represented by basophilic tubules, with the tubular cells having enlarged, open-face nucleus with more prominent nucleolusand lacking a well-differentiated brush border (immature cells). Mitoses are also commonly seen (arrowheads). 25.2×, PAS. (D) Transitional pelvic epitheliumof a high dose treated rat, 24 hr. Observe the disorganized multilayered structure with a few mitoses (arrowheads) indicative of active hyperplasia (compare withcontrol epithelium, inset). Some vacuolated cells are in the luminal portion (arrow). Edema is observed in the subepithelial supporting stroma (asterisk). 25.2×,PAS. (E) Kidney of a high dose treated rat, 24 hr. Areas of vascular damage are replaced by PAS-positive material (arrowheads). 25.2×, PAS. Inset: vasculardamage to small arteries, where areas of the smooth muscle wall are disorganized and replaced by eosinophilic amorphous material (hyalinization), with rarenuclear fragments (arrowhead). 25.2×, H&E. (F-H) Low dose rats. (F) MRs of a low dose treated rat, 6 hr. Observe the dilation of the PSTs (asterisks), and thehypereosinophilia, pyknosis and flattening of the tubular epithelium with minimal exfoliation (arrowheads). 12.6×, H&E. (G) MRs of a low dose treated rat, 24hr. Most degenerating/necrotic cells have sloughed into the lumen of the damaged tubules, the cells lining the tubules are more basophilic, and there are moremononuclear infiltrates in the interstitium. 12.6×, H&E. (H) MRs of a low dose treated rat, 48 hr. The regeneration is even more apparent, with increased basophilia,nuclear hypertrophy and mitoses (arrowheads). There is karyolysis in the cellular debris in the lumen of the tubules. 12.6×, H&E.
Vol. 35, No. 4, 2007 MARKERS OF ANALGESIC NEPHROTOXICITY 527
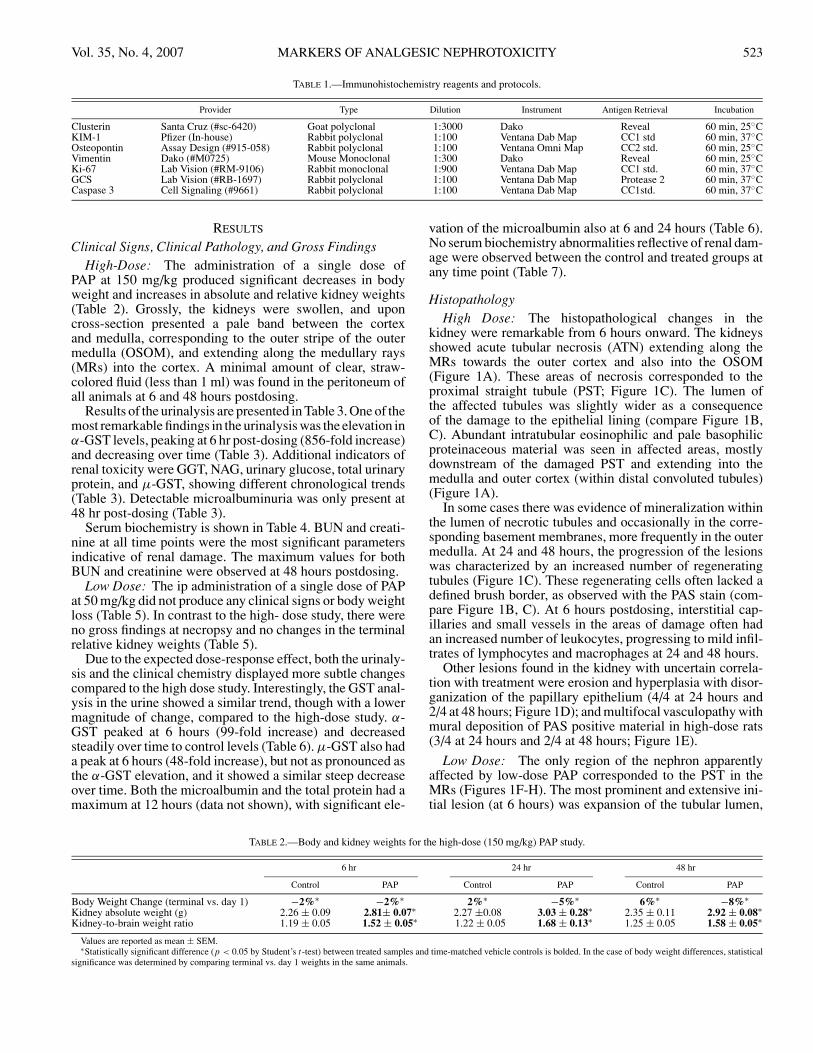
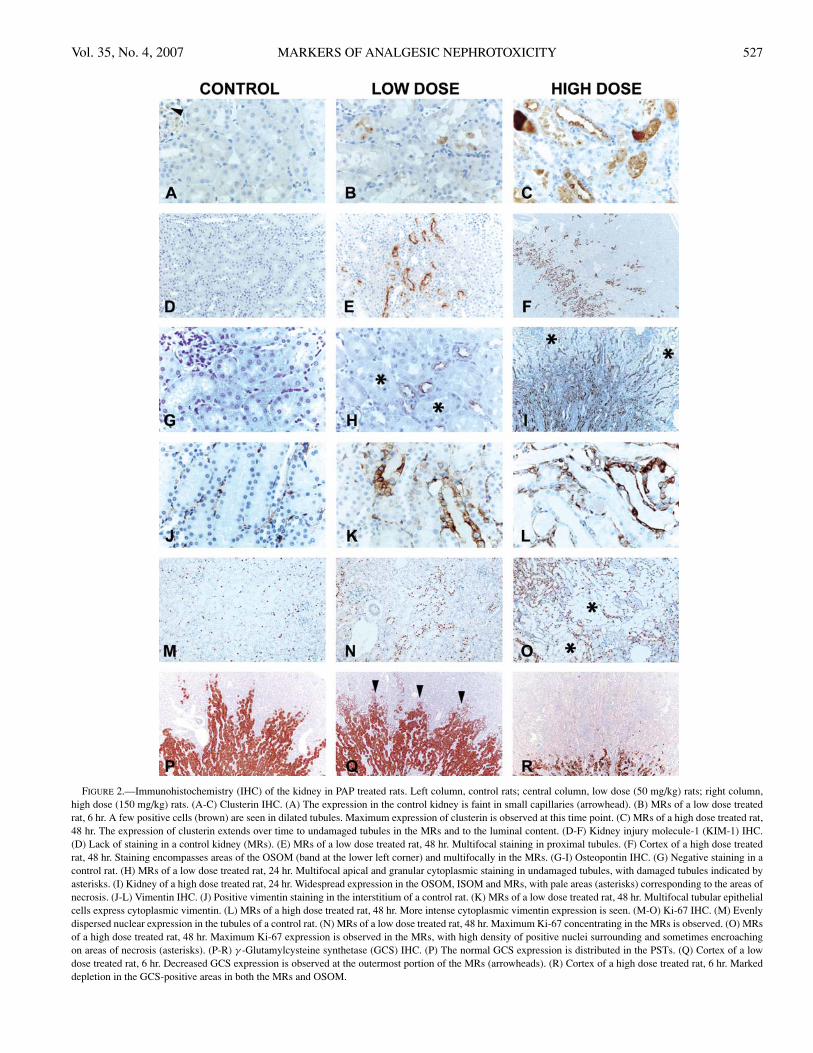
FIGURE 2.—Immunohistochemistry (IHC) of the kidney in PAP treated rats. Left column, control rats; central column, low dose (50 mg/kg) rats; right column,high dose (150 mg/kg) rats. (A-C) Clusterin IHC. (A) The expression in the control kidney is faint in small capillaries (arrowhead). (B) MRs of a low dose treatedrat, 6 hr. A few positive cells (brown) are seen in dilated tubules. Maximum expression of clusterin is observed at this time point. (C) MRs of a high dose treated rat,48 hr. The expression of clusterin extends over time to undamaged tubules in the MRs and to the luminal content. (D-F) Kidney injury molecule-1 (KIM-1) IHC.(D) Lack of staining in a control kidney (MRs). (E) MRs of a low dose treated rat, 48 hr. Multifocal staining in proximal tubules. (F) Cortex of a high dose treatedrat, 48 hr. Staining encompasses areas of the OSOM (band at the lower left corner) and multifocally in the MRs. (G-I) Osteopontin IHC. (G) Negative staining in acontrol rat. (H) MRs of a low dose treated rat, 24 hr. Multifocal apical and granular cytoplasmic staining in undamaged tubules, with damaged tubules indicated byasterisks. (I) Kidney of a high dose treated rat, 24 hr. Widespread expression in the OSOM, ISOM and MRs, with pale areas (asterisks) corresponding to the areas ofnecrosis. (J-L) Vimentin IHC. (J) Positive vimentin staining in the interstitium of a control rat. (K) MRs of a low dose treated rat, 48 hr. Multifocal tubular epithelialcells express cytoplasmic vimentin. (L) MRs of a high dose treated rat, 48 hr. More intense cytoplasmic vimentin expression is seen. (M-O) Ki-67 IHC. (M) Evenlydispersed nuclear expression in the tubules of a control rat. (N) MRs of a low dose treated rat, 48 hr. Maximum Ki-67 concentrating in the MRs is observed. (O) MRsof a high dose treated rat, 48 hr. Maximum Ki-67 expression is observed in the MRs, with high density of positive nuclei surrounding and sometimes encroachingon areas of necrosis (asterisks). (P-R) γ -Glutamylcysteine synthetase (GCS) IHC. (P) The normal GCS expression is distributed in the PSTs. (Q) Cortex of a lowdose treated rat, 6 hr. Decreased GCS expression is observed at the outermost portion of the MRs (arrowheads). (R) Cortex of a high dose treated rat, 6 hr. Markeddepletion in the GCS-positive areas in both the MRs and OSOM.
528 YANG ET AL. TOXICOLOGIC PATHOLOGY
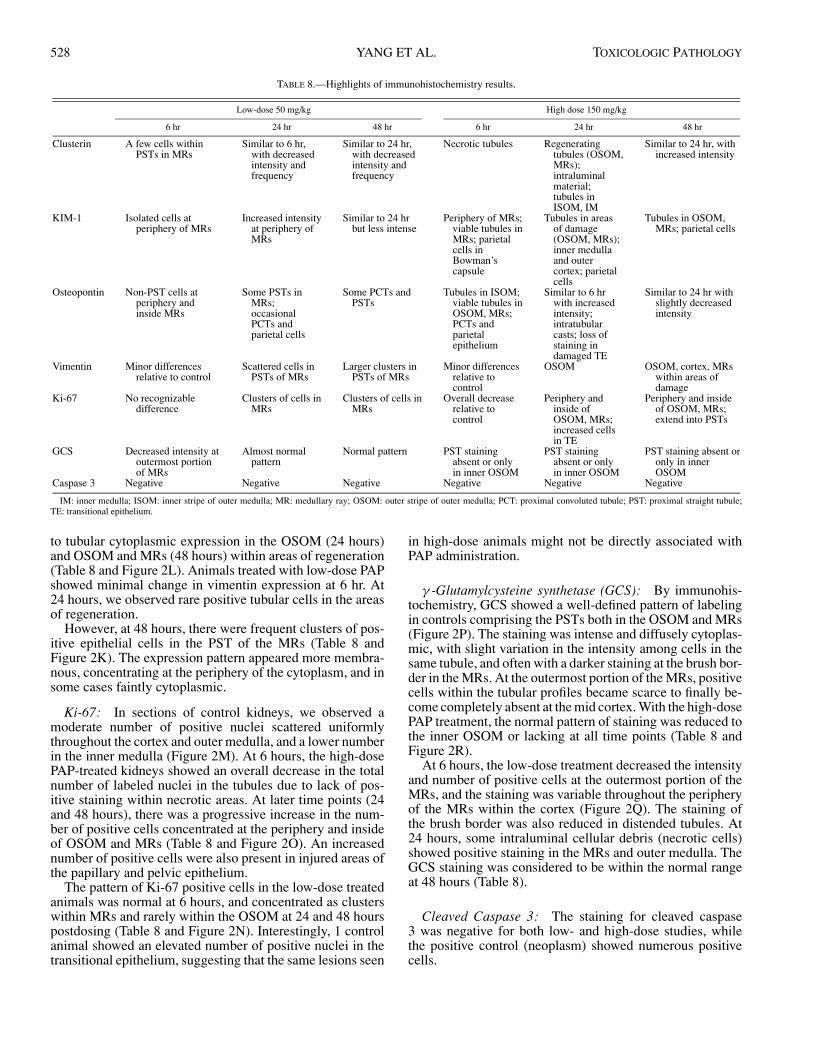
TABLE 8.—Highlights of immunohistochemistry results.
Low-dose 50 mg/kg High dose 150 mg/kg
6 hr 24 hr 48 hr 6 hr 24 hr 48 hr
Clusterin A few cells withinPSTs in MRs
Similar to 6 hr,with decreasedintensity andfrequency
Similar to 24 hr,with decreasedintensity andfrequency
Necrotic tubules Regeneratingtubules (OSOM,MRs);intraluminalmaterial;tubules inISOM, IM
Similar to 24 hr, withincreased intensity
KIM-1 Isolated cells atperiphery of MRs
Increased intensityat periphery ofMRs
Similar to 24 hrbut less intense
Periphery of MRs;viable tubules inMRs; parietalcells inBowman’scapsule
Tubules in areasof damage(OSOM, MRs);inner medullaand outercortex; parietalcells
Tubules in OSOM,MRs; parietal cells
Osteopontin Non-PST cells atperiphery andinside MRs
Some PSTs inMRs;occasionalPCTs andparietal cells
Some PCTs andPSTs
Tubules in ISOM;viable tubules inOSOM, MRs;PCTs andparietalepithelium
Similar to 6 hrwith increasedintensity;intratubularcasts; loss ofstaining indamaged TE
Similar to 24 hr withslightly decreasedintensity
Vimentin Minor differencesrelative to control
Scattered cells inPSTs of MRs
Larger clusters inPSTs of MRs
Minor differencesrelative tocontrol
OSOM OSOM, cortex, MRswithin areas ofdamage
Ki-67 No recognizabledifference
Clusters of cells inMRs
Clusters of cells inMRs
Overall decreaserelative tocontrol
Periphery andinside ofOSOM, MRs;increased cellsin TE
Periphery and insideof OSOM, MRs;extend into PSTs
GCS Decreased intensity atoutermost portionof MRs
Almost normalpattern
Normal pattern PST stainingabsent or onlyin inner OSOM
PST stainingabsent or onlyin inner OSOM
PST staining absent oronly in innerOSOM
Caspase 3 Negative Negative Negative Negative Negative Negative
IM: inner medulla; ISOM: inner stripe of outer medulla; MR: medullary ray; OSOM: outer stripe of outer medulla; PCT: proximal convoluted tubule; PST: proximal straight tubule;TE: transitional epithelium.
to tubular cytoplasmic expression in the OSOM (24 hours)and OSOM and MRs (48 hours) within areas of regeneration(Table 8 and Figure 2L). Animals treated with low-dose PAPshowed minimal change in vimentin expression at 6 hr. At24 hours, we observed rare positive tubular cells in the areasof regeneration.
However, at 48 hours, there were frequent clusters of pos-itive epithelial cells in the PST of the MRs (Table 8 andFigure 2K). The expression pattern appeared more membra-nous, concentrating at the periphery of the cytoplasm, and insome cases faintly cytoplasmic.
Ki-67: In sections of control kidneys, we observed amoderate number of positive nuclei scattered uniformlythroughout the cortex and outer medulla, and a lower numberin the inner medulla (Figure 2M). At 6 hours, the high-dosePAP-treated kidneys showed an overall decrease in the totalnumber of labeled nuclei in the tubules due to lack of pos-itive staining within necrotic areas. At later time points (24and 48 hours), there was a progressive increase in the num-ber of positive cells concentrated at the periphery and insideof OSOM and MRs (Table 8 and Figure 2O). An increasednumber of positive cells were also present in injured areas ofthe papillary and pelvic epithelium.
The pattern of Ki-67 positive cells in the low-dose treatedanimals was normal at 6 hours, and concentrated as clusterswithin MRs and rarely within the OSOM at 24 and 48 hourspostdosing (Table 8 and Figure 2N). Interestingly, 1 controlanimal showed an elevated number of positive nuclei in thetransitional epithelium, suggesting that the same lesions seen
in high-dose animals might not be directly associated withPAP administration.
γ -Glutamylcysteine synthetase (GCS): By immunohis-tochemistry, GCS showed a well-defined pattern of labelingin controls comprising the PSTs both in the OSOM and MRs(Figure 2P). The staining was intense and diffusely cytoplas-mic, with slight variation in the intensity among cells in thesame tubule, and often with a darker staining at the brush bor-der in the MRs. At the outermost portion of the MRs, positivecells within the tubular profiles became scarce to finally be-come completely absent at the mid cortex. With the high-dosePAP treatment, the normal pattern of staining was reduced tothe inner OSOM or lacking at all time points (Table 8 andFigure 2R).
At 6 hours, the low-dose treatment decreased the intensityand number of positive cells at the outermost portion of theMRs, and the staining was variable throughout the peripheryof the MRs within the cortex (Figure 2Q). The staining ofthe brush border was also reduced in distended tubules. At24 hours, some intraluminal cellular debris (necrotic cells)showed positive staining in the MRs and outer medulla. TheGCS staining was considered to be within the normal rangeat 48 hours (Table 8).
Cleaved Caspase 3: The staining for cleaved caspase3 was negative for both low- and high-dose studies, whilethe positive control (neoplasm) showed numerous positivecells.
Vol. 35, No. 4, 2007 MARKERS OF ANALGESIC NEPHROTOXICITY 529
DISCUSSION
To study the modulation of protein expression at the tissuelevel and in biofluids, we have chosen to evaluate a modelof analgesic nephropathy utilizing PAP, a toxicant known tocause necrosis of the renal PST (Green et al., 1969; Daviset al., 1983; Fowler et al., 1994; Harmon et al., 2005). Thiswork followed the dose- and time-dependent progression ofATN lesions and protein expression changes that correlatedwith morphological stages of injury. The changes in proteinexpression may also be useful indicators of renal toxicolog-ical injury. In addition, clinical pathology showed the rele-vance of sensitive parameters (GSTs) in the detection of earlytubular damage.
Clinical PathologyAt the clinico-pathological level the traditional markers
of urinary disease (urine volume, urine specific gravity, uri-nary glucose, urinary protein, BUN, and serum creatinine)were poor indicators of early renal damage due to their lowsensitivity and low dynamic range. In particular, BUN andserum creatinine detected the extensive renal lesions seen inthe high-dose rats, but their overall variation in magnitudewas minimal compared with nonroutine tests, especially α-GST (Tables 3 and 4). Results from these nonroutine tests,including NAG, GGT, α-GST and µ-GST, indicated dam-age as early as 6 hours postdosing (Tables 3 and 6). Of themarkers evaluated, α-GST was the best in terms of greaterdynamic range to detect ATN, showing a higher elevation atthe earliest time point (6 hours). The lysosomal enzyme NAGand the brush border enzyme GGT are both excreted into thelumen of the tubules and can be detected in the urine whentubules are damaged but are known to show diurnal variation(Kramer et al., 2004).
µ-GST, traditionally recognized as an indicator of dis-tal tubular damage (Rozell et al., 1993; Han and Bonven-tre, 2004; Howard, 2005), was elevated both in the low andhigh dose studies. Since distal tubular damage was not read-ily seen by histopathology and there was a lack of dose-responsiveness in µ-GST urinary levels, possible damageto distal tubules might be secondary to PAP toxicity (Daviset al., 1983). Finally, microalbumin, a nonspecific marker ofglomerular or proximal tubular damage (Lebeau et al., 2005),was elevated at early time points at low dose, but only at 48hours at high dose. This paradoxical finding could be bestexplained by the prozone effect in the presence of excessantigen (Jury et al., 1990) following high dose PAP adminis-tration. Together, these results emphasize the need to expandthe monitoring of the renal function with a wider and moresensitive array of indicators, as underscored previously byother authors (Han and Bonventre, 2004; Hewitt et al., 2004;Howard, 2005).
HistopathologyThe earliest and most significant change observed in the
low dose study was tubular dilation and occasional hypere-osinophilic cells in the MRs, whereas in the high dose studythere was diffuse necrosis with loss of epithelial lining in theMRs and OSOM. The rapid dilation of tubules in the lowdose has been attributed to a sudden increase in intratubularpressure (Davis et al., 1983). This pattern of lesion distribu-tion along with dose responsiveness is characteristic of the
analgesic model of ATN (Newton et al., 1983; Fowler et al.,1991; Harmon et al., 2005).
Evidence of epithelial regeneration for both doses waspresent at as early as 24 hours and was more prominent at 48hours. The regeneration started at the periphery of necroticareas in the high dose study, due to the complete absenceon viable cells in the damaged segments of the tubules. Inclear contrast, viable epithelial cells within the injured seg-ments were the initial source of regeneration in the low-dosestudy. A similar phenomenon has been shown for other mod-els (Ghielli et al., 1998). In general, the regenerating cellsshowed features of immaturity, expressing vimentin and lack-ing mature brush border (Witzgall et al., 1994). The increasednumber and the change in distribution of Ki-67 positive cellswithin areas of damage further supported the morphologicalinterpretation of augmented regeneration in the tubules.
The lesions of ATN were accompanied by the presence ofminimal-to-mild interstitial mononuclear infiltrates for bothdosage regimens. Initially (6 hours) the cells were containedwithin vessels, and at later time points (24–48 hours) theyinfiltrated the interstitium around injured regions. This obser-vation is in contrast to the “paucity of inflammatory reaction”attributed to this model in other studies (Green et al., 1969;Kiese et al., 1975; Newton et al., 1983). This discrepancymay be a consequence of the different route of administra-tion, or the strain of rats used, among other possible factors.In general, infiltrating cells appearing after ATN are believedto play a relevant role in the local delivery of cytokines, andthey are known to appear rapidly after injury and disappearupon complete repair (Ghielli et al., 1996; Ysebaert et al.,2004).
Vasculopathic changes and changes to the papillary epithe-lium were seen with relatively high frequency in high-dosePAP-treated rats. To our knowledge, similar lesions have notbeen reported in association with PAP nephrotoxicity. Therelevance or mechanistic relationship to the treatment is un-clear at this time. Fibrinoid necrosis of the mural arterial wallcan be seen sporadically in rats (M. Albassam, personal com-munications), but in this study it was observed exclusively inhigh-dose treated rats.
Experimentally, similar pathology was induced in rats ina model of hypertension, with lesions appearing in kidney,pancreas, and mesentery as early as 12 hours (Wolfgarten andMagarey, 1959). Other possible causes of this type of vas-cular damage include uremia and polyarteritis (Wolfgartenand Magarey, 1959). Unfortunately, vascular dynamics werenot monitored during the course of the study; therefore themechanism of these vascular lesions remains unknown. Theinjury to the papillary and transitional pelvic epithelia couldbe an indirect response to severe renal tubular injury sincesimilar changes have been seen with other tubular toxicants(F. Ramiro-Ibanez, personal observation).
ImmunohistochemistryProtein expression studies represent a useful complement
to gene expression studies, since the correlation betweenmRNA and protein levels for a given gene is sometimes vari-able due, for example, to posttranslational protein modifica-tions. Evaluation of the distribution and intensity of relevantprotein expression by IHC therefore provides a direct meansof assessing the impact ATN at the tissue level.
530 YANG ET AL. TOXICOLOGIC PATHOLOGY
Clusterin is a secreted glycoprotein present in many phys-iologic fluids and often overexpressed in different organssubject to injury or tissue remodeling, including the kid-ney (Rosenberg and Silkensen, 1995). Clusterin is producedduring renal development; however, its specific function re-mains unclear, with proposed roles including protection ofcell membranes and cell-to-cell contact (Nath et al., 1994;Rosenberg and Silkensen, 1995; Chevalier et al., 1999; Hi-daka et al., 2002). In high-dose treated rats the renal expres-sion of clusterin was observed in necrotic tubules and adjacenttubules, often with higher intensity at the apical pole of theepithelium, in agreement with results from other models ofrenal injury (Witzgall et al., 1994; Rosenberg and Silkensen1995; Hidaka et al., 2002). Intense positive signal was alsoseen in tubular luminal contents, as would be expected of asecreted protein (Witzgall et al., 1994).
Moreover, different expression patterns manifested inproximal tubules (granular and cytoplasmic) and distaltubules (intensely perinuclear, diffusely cytoplasmic and api-cal) 48 hours following high-dose PAP treatment, suggestingdifferent cellular roles at different locations. At low-dose PAP,sometimes only single or a few cells within a tubular profileshowed positive signal for clusterin, in contrast with the con-cept of “all or none” expressed by some authors (Nath et al.,1994; Rosenberg and Silkensen, 1995). This finding also sug-gests that an initial increase of clusterin level might be usedas an indicator of tubular damage at a low level of ATN, and areduction in clusterin staining over time as a sign of recovery(Chevalier et al., 1999).
KIM-1, initially identified in postischemic rat kidneys(Ichimura et al., 1998), is a type I transmembrane glyco-protein with Ig and mucin ectodomains. Its basal expressionis very low in the kidney, but is highly upregulated in dedif-ferentiated and regenerating proximal tubular epithelial cells(Ichimura et al., 1998). In this study, the expression of KIM-1after treatment was often seen in regenerating tubules withboth apical and cytoplasmic patterns, as described by others(Ichimura et al., 2004). The intensity and quantity of KIM-1positive signal also correlated with the amount of damageobserved histologically, which could allow the use of KIM-1as a tissue indicator of renal injury. In addition, KIM-1 wasdetected in the parietal epithelium of some glomeruli and insome proximal convoluted tubules, suggesting an additionalfunction for the protein in areas distant from the direct injury.
Osteopontin is an acidic phosphoprotein and cell adhesionmolecule isolated from tissues such as bone and body fluids(Rittling and Denhardt, 1999). Up-regulation of osteopon-tin has been observed in a variety of renal pathologies, butthe precise role of the protein in nephropathies is currentlyunclear (Rittling and Denhardt, 1999). In this study, the nor-mal expression in the kidney followed previously describedpatterns, being localized at the transition ISOM and OSOM(thin limb of the loop of Henle) and in the papillary epithelium(Persy et al., 1999). There was also a difference in the sub-cellular expression between the proximal and distal tubulesafter PAP treatment (Persy et al., 1999).
Osteopontin has been recognized in the kidney as an in-dicator of tubular regeneration, playing a role in the re-epithelialization of the tubules (Persy et al., 1999), consis-tent with the time-dependent variation and distribution usu-ally away from the obviously damaged tubules in this study.
Interestingly, the normal pattern of expression of osteopontinin the papillary transitional epithelium diminished in thoseanimals that showed hyperplasia of the transitional epithe-lium, suggesting that decreased osteopontin expression mayindicate epithelial immaturity for that area.
Vimentin is an intermediate filament that is widely utilizedas a protein tissue marker for mesenchymal cells (Frankeet al., 1982). In the context of renal injury and regeneration,vimentin has been shown to be expressed in undifferentiatedcells repopulating the tubular structures after injury (Witzgallet al., 1994; Chevalier et al., 1998). Similarly, in this studyvimentin was expressed in areas of tubular regeneration, andthe level of expression directly correlated with the extent ofregeneration, with positive tubular cells detected as early as24 hours in both high- and low-dose studies.
The Ki-67 antigen is reported as strongly associated withcell proliferation and expressed in the nucleus and nucleolusin all phases of the cell cycle (Endl and Gerdes, 2000). HereKi-67 IHC was used to assess the proliferative status of thetubular cells after toxic damage. There was a clear concen-tration of labeled cells in and around injured renal areas asearly as 24 hours post-PAP dosing, coinciding with the on-set of regeneration. Animals with barely recognizable lesions(low-dose PAP at 48 hours) did not show the characteristicgrouping of positive cells in areas of the MRs, indicating thatregeneration and damage were tightly associated.
GCS catalyzes the rate-limiting reaction in the glutathionebiosynthesis and is known to be feedback-inhibited by glu-tathione (Griffith, 1999; Wild and Mulcahy, 2000). Increasedexpression of genes encoding GCS is thought to provide cyto-protection against oxidative stress, and is frequently observedin response to inducers of Phase II metabolizing enzymes, in-cluding oxidants, heavy metals, and glutathione-conjugatingagents (Griffith, 1999; Wild and Mulcahy, 2000). Since PAPand some of its metabolites have been shown previouslyto conjugate and deplete cellular glutathione levels (Croweet al., 1979; Fowler et al., 1991; Klos et al., 1992; Fowleret al., 1994), the decline of GCS protein levels followingPAP treatment, most apparent at high dose, was unexpected,and cannot be explained by glutathione feedback inhibition.The initial wave of GCS repression could be attributed to cel-lular necrosis and/or active transcriptional downregulation ofthe genes encoding the enzyme (Jeyapaul and Jaiswal, 2000;Jardine et al., 2002; Bakin et al., 2005). Later on, during re-generation, GCS protein levels could still remain low due tothe immature status of the regenerating tubular cells.
A lack of apoptosis in this model of ATN was suggestedby an absence of cleaved caspase 3 signal. Apoptosis is arecognized mechanism of injury to the renal tubular epithe-lium in some cases of ATN and is triggered by multiple factors(Brady et al., 2004). For some compounds, such as cisplatin,apoptosis is a major player in toxic damage (Lieberthal et al.,1996). Despite the lack of positive results in this model, acaspase 3-independent apoptotic mechanism participating inthe toxic injury cannot be completely ruled out (Kroemer andMartin, 2005).
SUMMARY
In this work we studied in detail the chronology of the re-nal lesions induced by a single ip PAP administration at low(50 mg/kg) and high doses (150 mg/kg). Tubular dilation
Vol. 35, No. 4, 2007 MARKERS OF ANALGESIC NEPHROTOXICITY 531
in the MRs was the earliest change detectable at low dose,while lesions of ATN were obvious in the MRs and OSOMat high dose. Rapid regeneration of the damaged tubules oc-curred at both doses and was detectable by H&E and IHC asearly as 24 hours. At the clinico-pathological level, urinaryα-GST was the best marker of tubular injury by virtue ofits wide dynamic range and good chronological correlationwith pathology. The IHC analysis revealed significant trendsin protein expression associated with time course and severityof the lesions. Clusterin IHC may be a useful auxiliary toolto detect minimal damage in tubular cells at early stages ofATN, since it correlates with tubular injury and could poten-tially be quantified. The analysis of protein levels by IHC orother proteomics tools is an important complement to geneexpression studies, allowing for a comprehensive evaluationof changes during toxicity studies.
ACKNOWLEDGMENTS
We would like to express out gratitude to Drs. WinstonEvering, Mudher Albassam, and Carmen Fuentealba for theirinsightful comments, to Miles McQuerter for his help withfigure preparation, and to the Clinical Pathology and Histol-ogy Laboratories at Pfizer Global Research & Development,La Jolla Laboratories for their technical support.
REFERENCES
Bakin, A. V., Stourman, N. V., Sekhar, K. R., Rinehart, C., Yan, X., Meredith,M. J., Arteaga, C. L., and Freeman, M. L. (2005). Smad3-ATF3 signalingmediates TGF-beta suppression of genes encoding Phase II detoxifyingproteins. Free Radic Biol Med 38, 375–87.
Brady, H. R., Clarkson, M. R., and Lieberthal, W. (2004). Acute Renal Failure.In Brenner’s and Rector’s The Kidney (B. M. Brenner, ed., pp. 1215–1292.Saunders, Philadelphia, PA.
Chevalier, R. L., Goyal, S., and Thornhill, B. A. (1999). EGF improves recoveryfollowing relief of unilateral ureteral obstruction in the neonatal rat. J Urol162, 1532–6.
Chevalier, R. L., Goyal, S., Wolstenholme, J. T., and Thornhill, B. A. (1998).Obstructive nephropathy in the neonatal rat is attenuated by epidermalgrowth factor. Kidney Int 54, 38–47.
Crowe, C. A., Yong, A. C., Calder, I. C., Ham, K. N., and Tange, J. D. (1979).The nephrotoxicity of p-aminophenol. I. The effect on microsomal cy-tochromes, glutathione and covalent binding in kidney and liver. ChemBiol Interact 27, 235–43.
Davis, J. M., Emslie, K. R., Sweet, R. S., Walker, L. L., Naughton, R. J., Skinner,S. L., and Tange, J. D. (1983). Early functional and morphological changesin renal tubular necrosis due to p-aminophenol. Kidney Int 24, 740–7.
Endl, E., and Gerdes, J. (2000). The Ki-67 protein: fascinating forms and anunknown function. Exp Cell Res 257, 231–7.
Fowler, L. M., Foster, J. R., and Lock, E. A. (1994). Nephrotoxicity of 4-amino-3-S-glutathionylphenol and its modulation by metabolism or transport in-hibitors. Arch Toxicol 68, 15–23.
Fowler, L. M., Moore, R. B., Foster, J. R., and Lock, E. A. (1991). Nephro-toxicity of 4-aminophenol glutathione conjugate. Hum Exp Toxicol 10,451–9.
Franke, W. W., Grund, C., Kuhn, C., Jackson, B. W., and Illmensee, K. (1982).Formation of cytoskeletal elements during mouse embryogenesis. III. Pri-mary mesenchymal cells and the first appearance of vimentin filaments.Differentiation 23, 43–59.
Ghielli, M., Verstrepen, W. A., Nouwen, E. J., and De Broe, M. E. (1996).Inflammatory cells in renal regeneration. Ren Fail 18, 355–75.
Ghielli, M., Verstrepen, W., Nouwen, E. J., and De Broe, M. E. (1998). Regen-eration processes in the kidney after acute injury: role of infiltrating cells.Exp Nephrol 6, 502–7.
Green, C. R., Ham, K. N., and Tange, J. D. (1969). Kidney lesions induced inrats by p-aminophenol. Br Med J 1, 162–4.
Griffith, O. W. (1999). Biologic and pharmacologic regulation of mammalianglutathione synthesis. Free Radic Biol Med 27, 922–35.
Han, W. K., and Bonventre, J. V. (2004). Biologic markers for the early detectionof acute kidney injury. Curr Opin Crit Care 10, 476–82.
Harmon, R. C., Terneus, M. V., Kiningham, K. K., and Valentovic, M. (2005).Time-dependent effect of p-aminophenol (PAP) toxicity in renal slices anddevelopment of oxidative stress. Toxicol Appl Pharmacol 209, 86–94.
Hewitt, S. M., Dear, J., and Star, R. A. (2004). Discovery of protein biomarkersfor renal diseases. J Am Soc Nephrol 15, 1677–89.
Hidaka, S., Kranzlin, B., Gretz, N., and Witzgall, R. (2002). Urinary clusterinlevels in the rat correlate with the severity of tubular damage and may helpto differentiate between glomerular and tubular injuries. Cell Tissue Res310, 289–96.
Hoitsma, A. J., Wetzels, J. F., and Koene, R. A. (1991). Drug-induced nephro-toxicity. Aetiology, clinical features and management. Drug Saf 6, 131–47.
Howard, M. A. (2005). Nephroscreen: a diagnostic test for predicting acute renalfailure? Expert Rev Mol Diagn 5, 633–42.
Ichimura, T., Bonventre, J. V., Bailly, V., Wei, H., Hession, C. A., Cate, R. L., andSanicola, M. (1998). Kidney injury molecule-1 (KIM-1), a putative epithe-lial cell adhesion molecule containing a novel immunoglobulin domain, isup-regulated in renal cells after injury. J Biol Chem 273, 4135–42.
Ichimura, T., Hung, C. C., Yang, S. A., Stevens, J. L., and Bonventre, J. V.(2004). Kidney injury molecule-1: a tissue and urinary biomarker fornephrotoxicant-induced renal injury. Am J Physiol Renal Physiol 286,F552–63.
Jardine, H., MacNee, W., Donaldson, K., and Rahman, I. (2002). Molecu-lar mechanism of transforming growth factor (TGF)-beta1-induced glu-tathione depletion in alveolar epithelial cells. Involvement of AP-1/AREand Fra-1. J Biol Chem 277, 21158–66.
Jeyapaul, J., and Jaiswal, A. K. (2000). Nrf2 and c-Jun regulation of antioxidantresponse element (ARE)-mediated expression and induction of gamma-glutamylcysteine synthetase heavy subunit gene. Biochem Pharmacol 59,1433–9.
Jury, D. R., Mikkelsen, D. J., and Dunn, P. J. (1990). Prozone effect and theimmunoturbidimetric measurement of albumin in urine. Clin Chem 36,1518–19.
Kanbak, G., Inal, M., and Baycu, C. (1996). The role of free radicals in p-aminophenol-induced nephrotoxicity: does reduced glutathione have aprotective effect? Clin Chim Acta 252, 61–71.
Kiese, M., Szinicz, L., Thiel, N., and Weger, N. (1975). Ferrihemoglobin and kid-ney lesions in rats produced by 4-aminophenol or 4-dimethylaminophenol.Arch Toxicol 34, 337–40.
Klos, C., Koob, M., Kramer, C., and Dekant, W. (1992). p-aminophenol nephro-toxicity: biosynthesis of toxic glutathione conjugates. Toxicol Appl Phar-macol 115, 98–106.
Kramer, J. A., Pettit, S. D., Amin, R. P., Bertram, T. A., Car, B., Cunningham,M., Curtiss, S. W., Davis, J. W., Kind, C., Lawton, M., Naciff, J. M.,Oreffo, V., Roman, R. J., Sistare, F. D., Stevens, J., Thompson, K., Vickers,A. E., Wild, S., and Afshari, C. A. (2004). Overview on the applicationof transcription profiling using selected nephrotoxicants for toxicologyassessment. Environ Health Perspect 112, 460–4.
Kroemer, G., and Martin, S. J. (2005). Caspase-independent cell death. Nat Med11, 725–30.
Lebeau, C., Debelle, F. D., Arlt, V. M., Pozdzik, A., De Prez, E. G., Phillips,D. H., Deschodt-Lanckman, M. M., Vanherweghem, J. L., and Nortier, J.L. (2005). Early proximal tubule injury in experimental aristolochic acidnephropathy: functional and histological studies. Nephrol Dial Transplant20, 2321–32.
Lieberthal, W., Triaca, V., and Levine, J. (1996). Mechanisms of death inducedby cisplatin in proximal tubular epithelial cells: apoptosis vs. necrosis. AmJ Physiol 270, F700–8.
McCarthy, D. J., Waud, W. R., Struck, R. F., and Hill, D. L. (1985). Dispositionand metabolism of aniline in Fischer 344 rats and C57BL/6 X C3H F1mice. Cancer Res 45, 174–80.
532 YANG ET AL. TOXICOLOGIC PATHOLOGY
Nath, K. A., Dvergsten, J., Correa-Rotter, R., Hostetter, T. H., Manivel, J. C.,and Rosenberg, M. E. (1994). Induction of clusterin in acute and chronicoxidative renal disease in the rat and its dissociation from cell injury. LabInvest 71, 209–18.
Newton, J. F., Yoshimoto, M., Bernstein, J., Rush, G. F., and Hook, J. B. (1983).Acetaminophen nephrotoxicity in the rat. II. Strain differences in nephro-toxicity and metabolism of p-aminophenol, a metabolite of acetaminophen.Toxicol Appl Pharmacol 69, 307–18.
Perazella, M. A. (2005). Drug-induced nephropathy: an update. Expert OpinDrug Saf 4, 689–706.
Persy, V. P., Verstrepen, W. A., Ysebaert, D. K., De Greef, K. E., and De Broe,M. E. (1999). Differences in osteopontin up-regulation between proxi-mal and distal tubules after renal ischemia/reperfusion. Kidney Int 56,601–11.
Racusen, L. C., and Solez, K. (1986). Nephrotoxic tubular and interstitial lesions:morphology and classification. Toxicol Pathol 14, 45–57.
Rittling, S. R., and Denhardt, D. T. (1999). Osteopontin function in pathology:lessons from osteopontin-deficient mice. Exp Nephrol 7, 103–13.
Rosenberg, M. E., and Silkensen, J. (1995). Clusterin and the kidney. ExpNephrol 3, 9–14.
Rozell, B., Hansson, H. A., Guthenberg, C., Tahir, M. K., and Mannervik, B.(1993). Glutathione transferases of classes alpha, mu and pi show selectiveexpression in different regions of rat kidney. Xenobiotica 23, 835–49.
Shepherd, A. G., Manson, M. M., Ball, H. W., and McLellan, L. I. (2000).Regulation of rat glutamate-cysteine ligase (gamma-glutamylcysteine syn-thetase) subunits by chemopreventive agents and in aflatoxin B(1)-inducedpreneoplasia. Carcinogenesis 21, 1827–34.
Wild, A. C., and Mulcahy, R. T. (2000). Regulation of gamma-glutamylcysteinesynthetase subunit gene expression: insights into transcriptional control ofantioxidant defenses. Free Radic Res 32, 281–301.
Witzgall, R., Brown, D., Schwarz, C., and Bonventre, J. V. (1994). Localizationof proliferating cell nuclear antigen, vimentin, c-Fos, and clusterin in thepostischemic kidney. Evidence for a heterogenous genetic response amongnephron segments, and a large pool of mitotically active and dedifferenti-ated cells. J Clin Invest 93, 2175–88.
Wolfgarten, M., and Magarey, F. R. (1959). Vascular fibrinoid necrosis in hy-pertension. J Pathol Bacteriol 77, 597–603.
Ysebaert, D. K., De Greef, K. E., De Beuf, A., Van Rompay, A. R., Vercauteren,S., Persy, V. P., and De Broe, M. E. (2004). T cells as mediators in renalischemia/reperfusion injury. Kidney Int 66, 491–6.
Related Documents


