Contents: Volume 82, Issue 3 (Sep 1 2005) Editorials: Teodoro Bottiglieri and Ramon Diaz-Arrastia Hyperhomocysteinemia and cognitive function: more than just a casual link? Am J Clin Nutr 2005 82: 493-494. Paolo Boffetta Alcohol and lung cancer: do we have the answers? Am J Clin Nutr 2005 82: 495-496. Review Article: g f e d c Michael J Gibney, Marianne Walsh, Lorraine Brennan, Helen M Roche, Bruce German, and Ben van Ommen Metabolomics in human nutrition: opportunities and challenges Am J Clin Nutr 2005 82: 497-503. Obesity and eating disorders: g f e d c Victoria J Vieira, Anne M Ronan, Mark R Windt, and Anthony R Tagliaferro Elevated atopy in healthy obese women Am J Clin Nutr 2005 82: 504-509. Lipids: g f e d c Myriam A Thijssen and Ronald P Mensink Small differences in the effects of stearic acid, oleic acid, and linoleic acid on the serum lipoprotein profile of humans Am J Clin Nutr 2005 82: 510-516. g f e d c W Garry John, Kate Noonan, Nasima Mannan, and Barbara J Boucher Hypovitaminosis D is associated with reductions in serum apolipoprotein A-I but not with fasting lipids in British Bangladeshis Am J Clin Nutr 2005 82: 517-522.

Welcome message from author
This document is posted to help you gain knowledge. Please leave a comment to let me know what you think about it! Share it to your friends and learn new things together.
Transcript
Contents: Volume 82, Issue 3 (Sep 1 2005)
Editorials: Teodoro Bottiglieri and Ramon Diaz-Arrastia
Hyperhomocysteinemia and cognitive function: more than just a casual link? Am J Clin Nutr 2005 82: 493-494.
Paolo Boffetta Alcohol and lung cancer: do we have the answers? Am J Clin Nutr 2005 82: 495-496.
Review Article: gfedc Michael J Gibney, Marianne Walsh, Lorraine Brennan, Helen M Roche, Bruce
German, and Ben van Ommen Metabolomics in human nutrition: opportunities and challenges Am J Clin Nutr 2005 82: 497-503.
Obesity and eating disorders: gfedc Victoria J Vieira, Anne M Ronan, Mark R Windt, and Anthony R Tagliaferro
Elevated atopy in healthy obese women Am J Clin Nutr 2005 82: 504-509.
Lipids: gfedc Myriam A Thijssen and Ronald P Mensink
Small differences in the effects of stearic acid, oleic acid, and linoleic acid on the serum lipoprotein profile of humans Am J Clin Nutr 2005 82: 510-516.
gfedc W Garry John, Kate Noonan, Nasima Mannan, and Barbara J Boucher Hypovitaminosis D is associated with reductions in serum apolipoprotein A-I but not with fasting lipids in British Bangladeshis Am J Clin Nutr 2005 82: 517-522.
Cardiovascular disease risk: gfedc Leila Azadbakht, Parvin Mirmiran, Ahmad Esmaillzadeh, and Fereidoun Azizi
Dairy consumption is inversely associated with the prevalence of the metabolic syndrome in Tehranian adults Am J Clin Nutr 2005 82: 523-530.
Nutritional status, dietary intake, and body composition:
gfedc Marjolein Visser, Stephen B Kritchevsky, Anne B Newman, Bret H Goodpaster, Frances A Tylavsky, Michael C Nevitt, Tamara B Harris for the Health, Aging and Body Composition Study
Lower serum albumin concentration and change in muscle mass: the Health, Aging and Body Composition Study Am J Clin Nutr 2005 82: 531-537.
gfedc Peggy C Papathakis, Nigel C Rollins, Kenneth H Brown, Michael L Bennish, and Marta D Van Loan
Comparison of isotope dilution with bioimpedance spectroscopy and anthropometry for assessment of body composition in asymptomatic HIV-infected and HIV-uninfected breastfeeding mothers Am J Clin Nutr 2005 82: 538-546.
Carbohydrate metabolism and diabetes: gfedc Nadine R Sahyoun, Amy L Anderson, Alka M Kanaya, Pauline Koh-Banerjee,
Stephen B Kritchevsky, Nathalie de Rekeneire, Frances A Tylavsky, Ann V Schwartz, Jung Sun Lee, and Tamara B Harris
Dietary glycemic index and load, measures of glucose metabolism, and body fat distribution in older adults Am J Clin Nutr 2005 82: 547-552.
Energy and protein metabolism: gfedc Petra Verhoef, Trinette van Vliet, Margreet R Olthof, and Martijn B Katan
A high-protein diet increases postprandial but not fasting plasma total homocysteine concentrations: a dietary controlled, crossover trial in healthy volunteers Am J Clin Nutr 2005 82: 553-558.
gfedc M Denise Robertson, Alex S Bickerton, A Louise Dennis, Hubert Vidal, and Keith N Frayn
Insulin-sensitizing effects of dietary resistant starch and effects on skeletal muscle and adipose tissue metabolism Am J Clin Nutr 2005 82: 559-567.
Vitamins, minerals, and phytochemicals: gfedc Rosalie AM Dhonukshe-Rutten, Moniek van Zutphen, Lisette CPGM de Groot,
Simone JPM Eussen, Henk J Blom, and Wija A van Staveren Effect of supplementation with cobalamin carried either by a milk product or a capsule in mildly cobalamin-deficient elderly Dutch persons Am J Clin Nutr 2005 82: 568-574.
gfedc Thomas Dietrich, Martha Nunn, Bess Dawson-Hughes, and Heike A Bischoff-Ferrari
Association between serum concentrations of 25-hydroxyvitamin D and gingival inflammation Am J Clin Nutr 2005 82: 575-580.
gfedc Randi L Wolf, Jane A Cauley, Mary Pettinger, Rebecca Jackson, Andrea Lacroix, Meryl S Leboff, Cora E Lewis, Michael C Nevitt, Joel A Simon, Katie L Stone, and Jean Wactawski-Wende
Lack of a relation between vitamin and mineral antioxidants and bone mineral density: results from the Women's Health Initiative Am J Clin Nutr 2005 82: 581-588.
gfedc Zamzam K (Fariba) Roughead, Carol A Zito, and Janet R Hunt Inhibitory effects of dietary calcium on the initial uptake and subsequent retention of heme and nonheme iron in humans: comparisons using an intestinal lavage method Am J Clin Nutr 2005 82: 589-597.
Growth, development, and pediatrics: gfedc Charlotte A Hobbs, Mario A Cleves, Weizhi Zhao, Stepan Melnyk, and S Jill
James Congenital heart defects and maternal biomarkers of oxidative stress Am J Clin Nutr 2005 82: 598-604.
gfedc W Abdullah Brooks, Mathuram Santosham, Swapan K Roy, Abu SG Faruque, M Abdu'l Wahed, Kamrun Nahar, Ashrafu'l I Khan, A Fazu'l Khan, George J Fuchs, and Robert E Black
Efficacy of zinc in young infants with acute watery diarrhea Am J Clin Nutr 2005 82: 605-610.
Digestive and liver diseases: gfedc Catherine H MacLean, Walter A Mojica, Sydne J Newberry, James Pencharz,
Rena Hasenfeld Garland, Wenli Tu, Lara G Hilton, Ian M Gralnek, Shannon Rhodes, Puja Khanna, and Sally C Morton
Systematic review of the effects of n–3 fatty acids in inflammatory bowel disease Am J Clin Nutr 2005 82: 611-619.
Cancer: gfedc Kenneth F Adams, Paul D Lampe, Katherine M Newton, J Thomas Ylvisaker,
Andrew Feld, David Myerson, Scott S Emerson, Emily White, John D Potter, and Johanna W Lampe
Soy protein containing isoflavones does not decrease colorectal epithelial cell proliferation in a randomized controlled trial Am J Clin Nutr 2005 82: 620-626.
Aging: gfedc Katherine L Tucker, Ning Qiao, Tammy Scott, Irwin Rosenberg, and Avron
Spiro, III High homocysteine and low B vitamins predict cognitive decline in aging men: the Veterans Affairs Normative Aging Study Am J Clin Nutr 2005 82: 627-635.
gfedc Giovanni Ravaglia, Paola Forti, Fabiola Maioli, Mabel Martelli, Lucia Servadei, Nicoletta Brunetti, Elisa Porcellini, and Federico Licastro
Homocysteine and folate as risk factors for dementia and Alzheimer disease Am J Clin Nutr 2005 82: 636-643.
gfedc Jung Sun Lee, Stephen B Kritchevsky, Tamara B Harris, Frances Tylavsky, Susan M Rubin, and Anne B Newman
Short-term weight changes in community-dwelling older adults: the Health, Aging, and Body Composition Weight Change Substudy Am J Clin Nutr 2005 82: 644-650.
gfedc Zhao Chen, Tamsen Bassford, Sylvan B Green, Jane A Cauley, Rebecca D Jackson, Andrea Z LaCroix, Meryl Leboff, Marcia L Stefanick, and Karen L Margolis
Postmenopausal hormone therapy and body composition—a substudy of the estrogen plus progestin trial of the Women's Health Initiative Am J Clin Nutr 2005 82: 651-656.
Nutritional epidemiology and public health: gfedc Jo L Freudenheim, John Ritz, Stephanie A Smith-Warner, Demetrius Albanes,
Elisa V Bandera, Piet A van den Brandt, Graham Colditz, Diane Feskanich, R Alexandra Goldbohm, Lisa Harnack, Anthony B Miller, Eric Rimm, Thomas E Rohan, Thomas A Sellers, Jarmo Virtamo, Walter C Willett, and David J Hunter
Alcohol consumption and risk of lung cancer: a pooled analysis of cohort studies Am J Clin Nutr 2005 82: 657-667.
gfedc Anwar T Merchant, Gary C Curhan, Eric B Rimm, Walter C Willett, and Wafaie W Fawzi
Intake of n–6 and n–3 fatty acids and fish and risk of community-acquired pneumonia in US men Am J Clin Nutr 2005 82: 668-674.
gfedc Matthias B Schulze, Kurt Hoffmann, JoAnn E Manson, Walter C Willett, James B Meigs, Cornelia Weikert, Christin Heidemann, Graham A Colditz, and Frank B Hu
Dietary pattern, inflammation, and incidence of type 2 diabetes in women Am J Clin Nutr 2005 82: 675-684.
gfedc Terry Coyne, Torukiri I Ibiebele, Peter D Baade, Annette Dobson, Christine McClintock, Sophie Dunn, Dympna Leonard, and Jonathan Shaw
Diabetes mellitus and serum carotenoids: findings of a population-based study in Queensland, Australia Am J Clin Nutr 2005 82: 685-693.
gfedc Christos Pitsavos, Demosthenes B Panagiotakos, Natalia Tzima, Christina Chrysohoou, Manolis Economou, Antonis Zampelas, and Christodoulos Stefanadis
Adherence to the Mediterranean diet is associated with total antioxidant capacity in healthy adults: the ATTICA study Am J Clin Nutr 2005 82: 694-699.
Bone metabolism: gfedc Hassanali Vatanparast, Adam Baxter-Jones, Robert A Faulkner, Donald A Bailey,
and Susan J Whiting Positive effects of vegetable and fruit consumption and calcium intake on bone mineral accrual in boys during growth from childhood to adolescence: the University of Saskatchewan Pediatric Bone Mineral Accrual Study Am J Clin Nutr 2005 82: 700-706.
Letters to the Editor: Martin A Weinstock and DeAnn Lazovich
Tanning and vitamin D status Am J Clin Nutr 2005 82: 707.
Michael F Holick and Vin Tangpricha Reply to MA Weinstock and D Lazovich Am J Clin Nutr 2005 82: 707-708.
Rajat Prakash High thyroid volume in children with excess dietary iodine intakes Am J Clin Nutr 2005 82: 708-709.
Errata: Erratum Am J Clin Nutr 2005 82: 709.

Book Reviews: Athena S Papas
Nutrition and Oral Medicine,: edited by Riva Touger-Decker, David A Sirois, and Connie C Mobley, 2004, 379 pages, hardcover, $135. Humana Press, Totowa, NJ. Am J Clin Nutr 2005 82: 710.
Liz Applegate Nutritional Ergogenic Aids,: edited by Ira Wolinsky and Judy A Driskell, 2004, 536 pages, hardcover, $99.95. CRC Press, Boca Raton, FL. Am J Clin Nutr 2005 82: 710-711.
Continuing Medical Education: Continuing Medical Education Am J Clin Nutr 2005 82: 712-713. Continuing Medical Education Am J Clin Nutr 2005 82: 714-715. AJCN CME Participant Response Form Am J Clin Nutr 2005 82: 716.
Editorial
See corresponding articles on pages 627 and 636.
Hyperhomocysteinemia and cognitive function: more than just acasual link?1–3
Teodoro Bottiglieri and Ramon Diaz-Arrastia
Over the past 2 decades, numerous epidemiologic studies haveconfirmed that elevated plasma total homocysteine (tHcy) isassociated with an increased risk of vascular diseases, includingcardiovascular, peripheral vascular, and cerebral vascular dis-ease (1, 2). Because elevated plasma tHcy is effectively treatedwith B vitamin supplements (folic acid, vitamin B-12, and vita-min B-6), therapy that is inexpensive and well tolerated, an ex-plosion of clinical and basic research on the vascular effects ofhyperhomocysteinemia has occurred over the past decade. Vas-cular disease has deleterious effects on various organs of thebody, and the brain is particularly susceptible. Elevated tHcy isnow a recognized risk factor for vascular dementia. More sur-prising have been a series of observations from cross-sectionaland prospective epidemiologic studies that elevated tHcy is as-sociated with an increased risk of Alzheimer disease (AD) andwith cognitive problems in the elderly that fall short of dementia.
In this issue of the Journal, Ravaglia et al (3) present the latestdata on this issue, which led them to conclude that elevatedplasma tHcy and low serum folate concentrations are indepen-dent predictors of AD development. The prospective and longi-tudinal nature of this study provides an important measure ofconfidence to their conclusions. The authors point out that sev-eral case-control and cross-sectional studies have reported anassociation between AD and elevated plasma tHcy. However,only 2 prospective longitudinal studies, which have conflictingresults, have appeared in the literature. The findings of the cur-rent study by Ravaglia et al confirm previous findings from theFramingham Study (4), which indicate that hyperhomocysteine-mia is associated with a 2-fold increase in the relative risk ofdeveloping AD. The negative findings from the WashingtonHeights–Inwood Columbia Ageing Project (WHICAP) (5) weredismissed on the basis of insufficient statistical power and othermethodologic issues. There are other important findings of thestudy by Ravaglia et al. The increased risk of developing AD inhyperhomocysteinemic persons remained unchanged even aftersubjects with brain imaging evidence of vascular disease wereexcluded. Although elevated tHcy may promote vascular diseasethat contributes to AD pathology, it may also have other directneurotoxic effects. Another interesting aspect of this study,which was conducted in Italy (where food fortification is notmandated), was the observation that low folate status is indepen-dently associated with an increased risk of developing AD—afinding not evident in the Framingham Study or WHICAP.
Another article in this issue, by Tucker et al (6), presents dataon the relation between tHcy, B vitamins, and cognitive declinethat falls short of dementia. Study subjects from the VA Norma-tive Aging Study were assessed over a 3-y period before thefortification of food sources with folate. On the basis of bothplasma concentrations and dietary intake assessments, this lon-gitudinal study showed that tHcy, folate, vitamin B-12, and vi-tamin B-6 are independently associated with various measures ofcognitive decline. Although elevated plasma tHcy was shown tobe associated with memory recall, low plasma folate was shownto be associated with constructural praxis after adjustment fortHcy and other B vitamins. These independent associations high-light a central argument in this field of research: whether elevatedplasma tHcy is merely a marker for deficiencies in folate andother B vitamins or whether it is more directly involved in cog-nitive function and dementia. Recent data from studies in Par-kinson disease (PD) argue for a more direct neurotoxic role forHcy in central nervous system function. In the setting of L-dopatherapy for PD, hyperhomocysteinemia results from an excessivemethylation burden rather than from a vitamin deficiency, and PDpatients with elevated plasma tHcy and normal B vitamin status aremore likely to be cognitively impaired and depressed (7).
Epidemiologic studies, even when elegantly designed and rig-orously conducted, cannot address the issue of causality. Theavailable data are consistent with the hypothesis that elevatedtHcy is toxic to the nervous system; however, the possibility thatelevated plasma tHcy is simply a marker of an underlying neu-rodegenerative process cannot be excluded. In the latter case,therapy aimed at correcting hyperhomocysteinemia will not beeffective at correcting neurodegeneration. Studies to address thisimportant issue will have to focus in 2 directions. First, molecularand animal model studies are needed to identify as precisely aspossible the neuropathogenic mechanisms associated with tHcyelevations. The metabolic relations between homocysteine, fo-late, and B vitamins are intimate and complex. The consequences
1 From the Institute of Metabolic Disease, Baylor University MedicalCenter, and the Department of Neurology, University of Texas SouthwesternMedical Center, Dallas, TX.
2 Work in the authors’ laboratories was supported by NIH RO1AG17861,P30AG12300, and a grant from the Institute for the Study of Aging.
3 Address reprint requests to T Bottiglieri, Institute of Metabolic Disease,Baylor University Medical Center, 3812 Elm Street, Dallas, TX 75226.E-mail: [email protected].
493Am J Clin Nutr 2005;82:493–4. Printed in USA. © 2005 American Society for Clinical Nutrition
of hyperhomocysteinemia or B vitamin deficiency and the po-tentially associated neurotoxic mechanisms involved are equallycomplex. These consequences have been discussed in variousreviews (8–11) and include the following: Hcy-induced athero-sclerosis; neurotoxicity from the activation of N-methyl-D-aspartate receptors; hypomethylation of DNA, proteins, lipids,and neurotransmitters; increased oxidative stress; and increased�-amyloid toxicity. It is probable that multiple mechanisms,perhaps acting synergistically, may be responsible for the patho-physiologic consequences of hyperhomocysteinemia and B vi-tamin deficiency. Fortunately, animal models are now availableto test these possibilities. Second, clinical studies are needed todetermine whether the correction of tHcy concentrations resultsin cognitive improvement or, at a minimum, protection fromcognitive deterioration. Several secondary treatment trials arecurrently underway. Although we eagerly await their results, wemust realize that the epidemiologic literature indicates that thetoxic effects of elevated plasma tHcy may occur over years ordecades, which raises the possibility that the ongoing secondarytherapy trials may fail to identify a beneficial effect of tHcy-lowering therapy. Primary treatment trials are expensive andlengthy, and, although such trials are ultimately necessary, clin-ical scientists must first take advantage of insights from preclin-ical studies to design more feasible studies that use biomarkers orneuroimaging as surrogate endpoints.
The direction pointed to by excellent epidemiologic studies,such as those conducted by Ravaglia et al and Tucker et al andpublished in this issue of the Journal, should stimulate excitingstudies over the next decade. Although it is unlikely that theanswers will be simple, the potential to ameliorate one of the
major public health burdens facing developed nations today issubstantial.
None of the authors had a conflict of interest.
REFERENCES1. Kaplan ED. Association between homocyst(e)ine levels and risk of vas-
cular events. Drugs Today 2003;39:175–92.2. The Homocysteine Studies Collaboration. Homocysteine and risk of
ischemic heart disease and stroke: a meta-analysis. JAMA 2002;288:2015–22.
3. Ravaglia G, Forti P, Maioli, F, et al. Homocysteine and folate as riskfactors for dementia and Alzheimer disease. Am J Clin Nutr 2005;82:636–43.
4. Seshadri S, Beiser A, Selhub J, et al. Plasma homocysteine as a risk factorfor dementia and Alzheimer’s disease. N Engl J Med 2002;346:476–83.
5. Luchsinger JA, Tang MX, Shea S, Miller J, Green R, Mayeux R. Plasmahomocysteine levels and risk of Alzheimer disease. Neurology 2004;62:1972–6.
6. Tucker KL, Qiao N, Scott T, Irwin T, Rosenberg I, Spiro A III. Highhomocysteine and low B vitamins predict cognitive decline in agingmen: the VA Normative Aging Study. Am J Clin Nutr 2005;82:627–35.
7. O’Suilleabhain PE, Sung V, Hernandez C, et al. Elevated plasma homo-cysteine level in patients with Parkinson disease: motor, affective, andcognitive associations. Arch Neurol 2004;61:865–8.
8. Haynes WG. Hyperhomocysteinemia, vascular function and atheroscle-rosis: effects of vitamins. Cardiovasc Drugs Ther 2002;16:391–9.
9. Ho PI, Ashline D, Dhitavat S, et al. Folate deprivation induces neuro-degeneration: roles of oxidative stress and increased homocysteine.Neurobiol Dis 2003;14:32–42.
10. Parnetti L, Bottiglieri T, Lowenthal D. Role of homocysteine in age-related vascular and non-vascular diseases. Aging (Milano) 1997;9:241–57.
11. Mattson MP, Haberman F. Folate and homocysteine metabolism: ther-apeutic targets in cardiovascular and neurodegenerative disorders. CurrMed Chem 2003;10:1923–9.
494 EDITORIAL
Editorial
See corresponding article on page 657.
Alcohol and lung cancer: do we have the answers?1,2
Paolo Boffetta
The risk of lung cancer as a result of alcohol consumption hasbeen the subject of epidemiologic investigation for �40 y [thefirst report was a case-control study from France published in1962 (1)], but, as is the case with many other important questionsaddressed by observational research, the evidence has not yetfirmly allowed a conclusion on the presence or absence of acausal relation (2). There is little doubt that heavy drinkers ex-perience a greater incidence of lung cancer than do abstainers orlight drinkers; in addition, a lower incidence of lung cancer hasbeen observed among moderate drinkers than among abstainersin several populations. A causal interpretation of these observa-tions requires that both bias and confounding be excluded asexplanations. Residual confounding by tobacco smoking is oneof the main concerns in the interpretation of the increased riskamong heavy drinkers, as is misclassification as nondrinkers ofdrinkers who are at high risk of lung cancer, in light of alcohol’sapparent protective effect among light drinkers.
The report by Freudenheim et al (3) in this issue of the Journalrepresents the most ambitious attempt to address this issue froman epidemiologic perspective. The analysis is based on studies in7 cohorts from North America and Europe with a range of drink-ing patterns (eg, the average consumption in the Alpha-Tocopherol Beta-Carotene Cancer Prevention Study cohort ofmen from Finland was more than 4 times that in the Iowa Wom-en’s Health Study cohort) and with each cohort contributing�120 cases of lung cancer. This study therefore leads to veryprecise overall effect estimates and allows an exploration ofconsistency among populations and sources of heterogeneity.We can still ask: Does it provide the final answers to the questionsmentioned above? If not, what else do we need?
Let us consider first whether tobacco smoking explains thegreater risk of lung cancer in heavy drinkers than in lighterdrinkers or nondrinkers. During the past couple of decades, therehas been vigorous debate about whether a residual confoundingeffect can be ruled out (4, 5). Recent simulations have suggestedthat even a moderate misclassification of smoking status mightexplain most of the results reported in the literature (6). Theresults of the pooled analysis by Freudenheim et al (3) can beinterpreted as offering arguments for both sides: on the one hand,the strong relation observed in male nonsmokers would excludeconfounding as an explanation; on the other hand, the lack of aneffect in smokers—the group in which most of the previouspositive results were reported—would suggest that careful con-trol for smoking eliminates a spurious association (the results infemale nonsmokers are hampered by the small number of heavydrinkers in this group). One should consider, however, that any
effect, if real, is likely to appear only in drinkers of �60 galcohol/d (6), a group for which Freudenheim et al did not reportresults.
Because most drinkers in the pooled analysis had a low con-sumption, the study may be particularly helpful in addressing theapparent protective effect in light drinkers that was reported inprevious investigations (7, 8). The results show such an effect inwomen (and particularly in smoking women) but not in men, atleast not in drinkers of �5 g alcohol/d, which corresponds to onedrink every 2 or 3 d. Whereas it might be possible to provide amechanistic interpretation for these findings [eg, by postulatinga stronger reduction in C-reactive protein concentrations amongfemale than male drinkers, as suggested in a few studies (9, 10)],I prefer to interpret these results with caution while waiting forreplication.
What are the conclusions, then, that we can draw from thestudy by Freudenheim et al? All questions dealing with the eti-ology and the mechanisms of human cancers are more complexthan they look superficially, and, the more we learn, the morecomplexity emerges. The large study by Freudenheim et al isvery useful in clarifying and sharpening our questions, but it doesnot answer them completely. Contributions toward a full eluci-dation of these questions will come from studies encompassinglarge populations with a high proportion of heavy drinkers and avalidation of self-reported alcohol intake, coupled with researchon the mechanisms of alcohol carcinogenesis in human and an-imal models. Each year, alcohol causes an estimated 355 000deaths worldwide from cancer, of which 17 000 occur in theUnited States and Canada (11), and yet the resources dedicated tothis area of research are scanty.
The author had no personal or financial conflict of interest with the articleby Freudenheim et al or the study it concerned.
REFERENCES1. Schwartz D, Lellouch J, Flamant R, Denoix PF. Alcohol and cancer.
Results of a retrospective investigation. Rev Fr Etud Clin Biol 1962;7:590–604.
2. World Cancer Research Fund and American Institute for Cancer Re-search. Food and nutrition and cancer prevention: a global perspective.Washington, DC: World Cancer Research Fund/American Institute forCancer Research, 1997.
1 From the International Agency for Research on Cancer, Lyon, France.2 Reprints not available. Address correspondence to P Boffetta, Gene-
Environment Epidemiology Group, International Agency for Research onCancer, 150 cours Albert-Thomas, 69008 Lyon, France. E-mail:[email protected].
495Am J Clin Nutr 2005;82:495–6. Printed in USA. © 2005 American Society for Clinical Nutrition

3. Freudenheim JL, Ritz J, Smith-Warner SA, et al. Alcohol consumptionand risk of lung cancer: a pooled analysis of cohort studies. Am J ClinNutr 2005;82:657–67.
4. Zang EA, Wynder EL. Reevaluation of the confounding effect of cigarettesmoking on the relationship between alcohol use and lung cancer risk, withlarynx cancer used as a positive control. Prev Med 2001;32:359–70.
5. Potter JD, McMichael AJ. Alcohol, beer and lung cancer—a meaningfulrelationship? Int J Epidemiol 1984;13:240–2.
6. Korte JE, Brennan P, Henley SJ, Boffetta P. Dose-specific meta-analysisand sensitivity analysis of the relation between alcohol consumption andlung cancer risk. Am J Epidemiol 2002;155:496–506.
7. Carpenter CL, Morgenstern H, London SJ. Alcoholic beverage con-sumption and lung cancer risk among residents of Los Angeles County.J Nutr 1998;128:694–700.
8. Klatsky AL, Friedman GD, Siegelaub AB. Alcohol and mortality. Aten-year Kaiser-Permanente experience. Ann Intern Med 1981;95:139 – 45.
9. Stewart SH, Mainous AG III, Gilbert G. Relation between alcohol con-sumption and C-reactive protein levels in the adult US population. J AmBoard Fam Pract 2002;15:437–42.
10. Albert MA, Glynn RJ, Ridker PM. Alcohol consumption and plasmaconcentration of C-reactive protein. Circulation 2003;107:443–7.
11. Rehm J, Room R, Monteiro M, et al. Alcohol use. In: Ezzati M, MurrayC, Lopez A, Rodgers A, eds. Comparative quantification of health risks:global and regional burden of disease attributable to selected major riskfactors. Geneva, Switzerland: World Health Organization, 2004:959–1108.
496 EDITORIAL
Review Article
Metabolomics in human nutrition: opportunities and challenges1–3
Michael J Gibney, Marianne Walsh, Lorraine Brennan, Helen M Roche, Bruce German, and Ben van Ommen
ABSTRACTMetabolomics has been widely adopted in pharmacology and toxi-cology but is relatively new in human nutrition. The ultimate goal, tounderstand the effects of exogenous compounds on human meta-bolic regulation, is similar in all 3 fields. However, the application ofmetabolomics to nutritional research will be met with unique chal-lenges. Little is known of the extent to which changes in the nutrientcontent of the human diet elicit changes in metabolic profiles. More-over, the metabolomic signal from nutrients absorbed from the dietmust compete with the myriad of nonnutrient signals that are ab-sorbed, metabolized, and secreted in both urine and saliva. Thelarge-bowel microflora also produces significant metabolic signalsthat can contribute to and alter the metabolome of biofluids in humannutrition. Notwithstanding these possible confounding effects, ev-ery reason exists to be optimistic about the potential of metabolomicsfor the assessment of various biofluids in nutrition research. Thispotential lies both in metabolic profiling through the use of pattern-recognition statistics on assigned and unassigned metabolite signalsand in the collection of comprehensive data sets of identified me-tabolites; both objectives have the potential to distinguish betweendifferent dietary treatments, which would not have been targetedwith conventional techniques. The latter objective sets out a well-recognized challenge to modern biology: the development of librar-ies of small molecules to aid in metabolite identification. The pur-pose of the present review was to highlight some early challengesthat need to be addressed if metabolomics is to realize its greatpotential in human nutrition. Am J Clin Nutr 2005;82:497–503.
KEY WORDS Metabolomics, metabonomics, nutrigenomics,metabolic pathways, pattern recognition, metabolic profiling
INTRODUCTION
Since the discovery of essential nutrients and key metabolites,nutritionists have been conducting nutrition profiles of mankind.Such profiling has been targeted at specific ranges of plasmanutrients and metabolites, depending on the hypothesis beingtested. Today, with rapid advances in analytic chemistry tech-nologies such as nuclear magnetic resonance (NMR) spectros-copy and mass spectrometry (MS), the capacity exists for a far
wider collection of data on nutrients, metabolites, and other com-pounds in various human biofluids. This approach to humanassessment can be either open-ended through total data capture(1) or highly targeted, such as measuring the full spectrum oflipids (2). Of course, the assessment can also be both, and thiscomprehensive spectrum of metabolites and nutrients is knownas the metabolome. Whereas the potential of metabolomics inpharmacology and in toxicology has been well recognized (3), itsrole in human nutrition is in its infancy. Metabolomics and meta-bonomics, 2 terms that in effect mean the same thing, haveemerged from the fields of plant science and pharmacology,respectively. The former term is now more widely accepted (4),but readers are warned to always conduct literature searches withboth terms. Metabolomics will be central to biology in the com-ing decades because it has been highlighted for funding in therecently published roadmap of the US National Institutes ofHealth (NIH) (5). Note that this review focuses on the study ofhuman nutrition and excludes studies of animal models, whichwere extensively reviewed previously (6).
The 2 biggest challenges for metabolomics in human nutritioncenter around the vast output of spectral data on compounds in
1 From the Nutrition Unit, Department of Clinical Medicine, Trinity Col-lege, Dublin, Ireland (MJG, MW, and HMR); the Department of Biochem-istry, Conway Institute of Biomolecular and Biomedical Research, Univer-sity College, Dublin, Ireland (LB); the Department of Nutrition, Universityof California, Davis, CA and the Nestle Nutrition Research Centre, Lau-sanne, Switzerland (BG); and the TNO Quality of Life, TNO Voeding, Zeist,Netherlands (BvO).
2 Supported by the Irish Research Council for Science, Engineering, andTechnology (postgraduate studentship to MW); the Health Research Board,Ireland (LM); an EU funded Integrated Project (Lipgene; www.lipgene.tc-d.ie; principal investigator awards to MJG and HR); the Wellcome Trust NewBlood Fellowship Programme (HR); an EU funded Network of Excellence(NuGo; www.nugo.org; directorship to BvO); and the Center for Children’sEnvironmental Health & The CHARGE Study University of California,Davis (grant P01 ES11269 to BG).
3 Reprints not available. Address correspondence to MJ Gibney, NutritionUnit, Department of Clinical Medicine, Trinity Health Science Centre, StJames’s Hospital, Dublin 8, Ireland. E-mail: [email protected].
Received February 22, 2005.Accepted for publication May 16, 2005.
497Am J Clin Nutr 2005;82:497–503. Printed in USA. © 2005 American Society for Clinical Nutrition
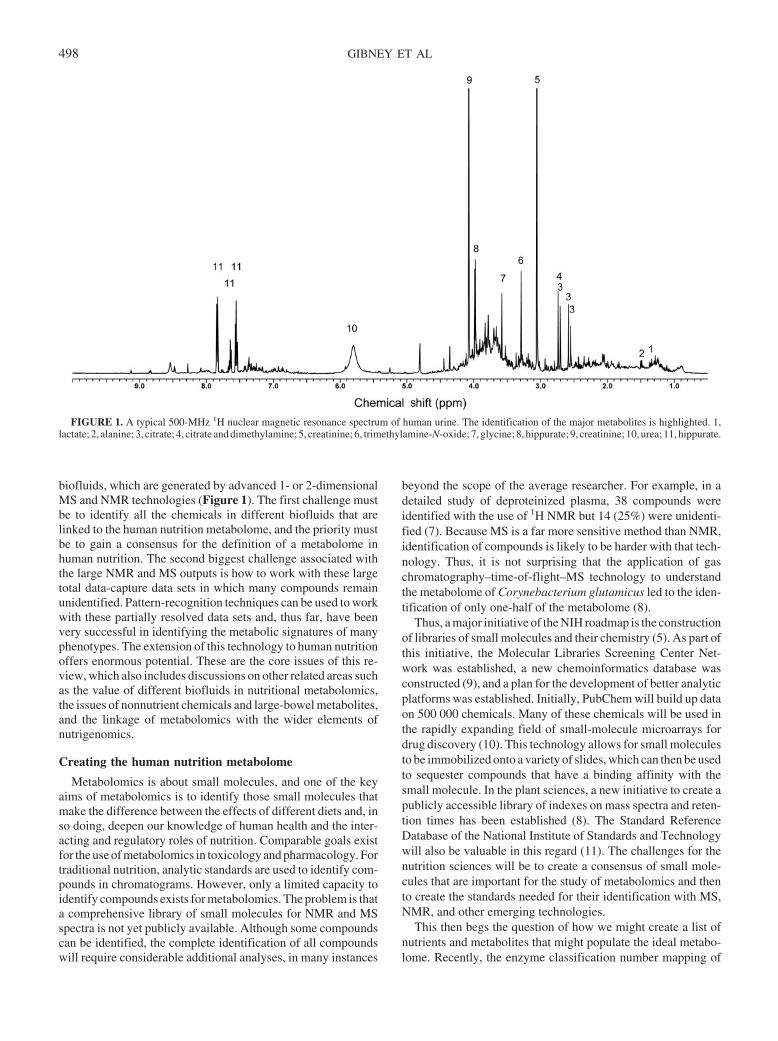
biofluids, which are generated by advanced 1- or 2-dimensionalMS and NMR technologies (Figure 1). The first challenge mustbe to identify all the chemicals in different biofluids that arelinked to the human nutrition metabolome, and the priority mustbe to gain a consensus for the definition of a metabolome inhuman nutrition. The second biggest challenge associated withthe large NMR and MS outputs is how to work with these largetotal data-capture data sets in which many compounds remainunidentified. Pattern-recognition techniques can be used to workwith these partially resolved data sets and, thus far, have beenvery successful in identifying the metabolic signatures of manyphenotypes. The extension of this technology to human nutritionoffers enormous potential. These are the core issues of this re-view, which also includes discussions on other related areas suchas the value of different biofluids in nutritional metabolomics,the issues of nonnutrient chemicals and large-bowel metabolites,and the linkage of metabolomics with the wider elements ofnutrigenomics.
Creating the human nutrition metabolome
Metabolomics is about small molecules, and one of the keyaims of metabolomics is to identify those small molecules thatmake the difference between the effects of different diets and, inso doing, deepen our knowledge of human health and the inter-acting and regulatory roles of nutrition. Comparable goals existfor the use of metabolomics in toxicology and pharmacology. Fortraditional nutrition, analytic standards are used to identify com-pounds in chromatograms. However, only a limited capacity toidentify compounds exists for metabolomics. The problem is thata comprehensive library of small molecules for NMR and MSspectra is not yet publicly available. Although some compoundscan be identified, the complete identification of all compoundswill require considerable additional analyses, in many instances
beyond the scope of the average researcher. For example, in adetailed study of deproteinized plasma, 38 compounds wereidentified with the use of 1H NMR but 14 (25%) were unidenti-fied (7). Because MS is a far more sensitive method than NMR,identification of compounds is likely to be harder with that tech-nology. Thus, it is not surprising that the application of gaschromatography–time-of-flight–MS technology to understandthe metabolome of Corynebacterium glutamicus led to the iden-tification of only one-half of the metabolome (8).
Thus, a major initiative of the NIH roadmap is the constructionof libraries of small molecules and their chemistry (5). As part ofthis initiative, the Molecular Libraries Screening Center Net-work was established, a new chemoinformatics database wasconstructed (9), and a plan for the development of better analyticplatforms was established. Initially, PubChem will build up dataon 500 000 chemicals. Many of these chemicals will be used inthe rapidly expanding field of small-molecule microarrays fordrug discovery (10). This technology allows for small moleculesto be immobilized onto a variety of slides, which can then be usedto sequester compounds that have a binding affinity with thesmall molecule. In the plant sciences, a new initiative to create apublicly accessible library of indexes on mass spectra and reten-tion times has been established (8). The Standard ReferenceDatabase of the National Institute of Standards and Technologywill also be valuable in this regard (11). The challenges for thenutrition sciences will be to create a consensus of small mole-cules that are important for the study of metabolomics and thento create the standards needed for their identification with MS,NMR, and other emerging technologies.
This then begs the question of how we might create a list ofnutrients and metabolites that might populate the ideal metabo-lome. Recently, the enzyme classification number mapping of
FIGURE 1. A typical 500-MHz 1H nuclear magnetic resonance spectrum of human urine. The identification of the major metabolites is highlighted. 1,lactate; 2, alanine; 3, citrate; 4, citrate and dimethylamine; 5, creatinine; 6, trimethylamine-N-oxide; 7, glycine; 8, hippurate; 9, creatinine; 10, urea; 11, hippurate.
498 GIBNEY ET AL
metabolically active enzymes to metabolic pathway and to ge-nome data (12, 13) was carried out. In one study, the HumanCycdatabase was used to assign 2709 human enzymes to 135 pre-dicted metabolic pathways (12). Many metabolites will exist insignaling, receptor binding, translocation, and other reactionpathways. However, it must be possible to begin to list the keymetabolites of the various metabolic pathways that nutrients areinvolved in and to begin to build up a library of compounds thatparticularly interest nutritionists. A first priority must be to an-alyze the carbohydrate, fat, protein, and energy metabolism path-ways along with the mineral, trace element, and vitamin metab-olism pathways. These pathways will involve anabolic andcatabolic pathways as well as transport and transformation path-ways. Subsequently, we will need to address reproductive, in-flammatory, satiety, and other such pathways as well as tissue-specific pathways, signaling pathways, and cell regulatorypathways. In all these endeavors, consideration must be given totheir relevance in human nutrition.
Pattern-recognition techniques and their application tohuman nutrition
The large data sets produced with the use of metabolomicanalyses in pharmacology and toxicology have been used toidentify compounds that differ between 2 treated groups, similarto the uses described in the previous section, and they have alsobeen used for the recognition of an overall pattern of NMR or MSspectral output but not for the recognition of specific compounds.In metabolomics, this pattern recognition is achieved through theuse of principal component analysis, which is unsupervised, andwith the use of partial least-squares discriminate analysis, whichis supervised and separates classes of individuals or animals. Todate, pattern-recognition techniques have been used in metabo-lomics research to successfully separate case and control subjectsfor cardiovascular disease (1), for multiple sclerosis (14), forhypertension (15), for epithelial ovarian cancer (16), for thedetection of inborn errors of metabolism (17), for species ofanimals (18), for strains of animals within a species (19), foranimals treated with drugs (3) or fed different diets, for humansfed different diets (20), or for humans from disparate geographiclocations (21, 22). This application of metabolomics may have
great potential in nutrition research, but the issues raised in en-suing parts of this review that relate to the nonnutrient elementsof human foods will need to be factored in when comparingdifferent diets. If these effects can be either eliminated or con-trolled for in some way, then pattern-recognition approachesoffer enormous opportunities for the identification of the meta-bolic signatures of different diets. If a protocol for linking NMRor MS metabolomics to phenotypes can be established and an-notated to an international standard, and if corresponding data-bases are created and made publicly available, then the science ofhuman nutrition will experience a giant leap. So great is thatpotential leap, that testing the validity of this hypothesis is worththorough and collaborative efforts. Thus, any expert group thatsets out to define a consensus on the nutritional metabolome, asdescribed in the previous section, should also be charged withsetting up the standards that will allow the creation of databasesthat link metabolomes to phenotypes.
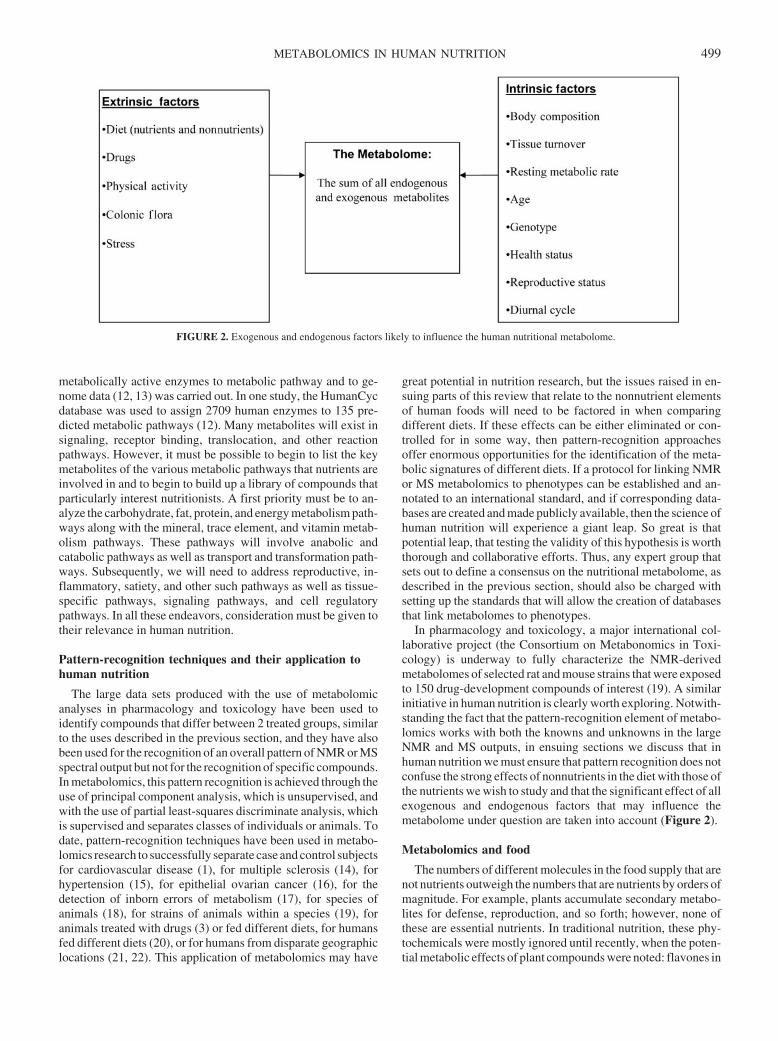
In pharmacology and toxicology, a major international col-laborative project (the Consortium on Metabonomics in Toxi-cology) is underway to fully characterize the NMR-derivedmetabolomes of selected rat and mouse strains that were exposedto 150 drug-development compounds of interest (19). A similarinitiative in human nutrition is clearly worth exploring. Notwith-standing the fact that the pattern-recognition element of metabo-lomics works with both the knowns and unknowns in the largeNMR and MS outputs, in ensuing sections we discuss that inhuman nutrition we must ensure that pattern recognition does notconfuse the strong effects of nonnutrients in the diet with those ofthe nutrients we wish to study and that the significant effect of allexogenous and endogenous factors that may influence themetabolome under question are taken into account (Figure 2).
Metabolomics and food
The numbers of different molecules in the food supply that arenot nutrients outweigh the numbers that are nutrients by orders ofmagnitude. For example, plants accumulate secondary metabo-lites for defense, reproduction, and so forth; however, none ofthese are essential nutrients. In traditional nutrition, these phy-tochemicals were mostly ignored until recently, when the poten-tial metabolic effects of plant compounds were noted: flavones in
FIGURE 2. Exogenous and endogenous factors likely to influence the human nutritional metabolome.
METABOLOMICS IN HUMAN NUTRITION 499
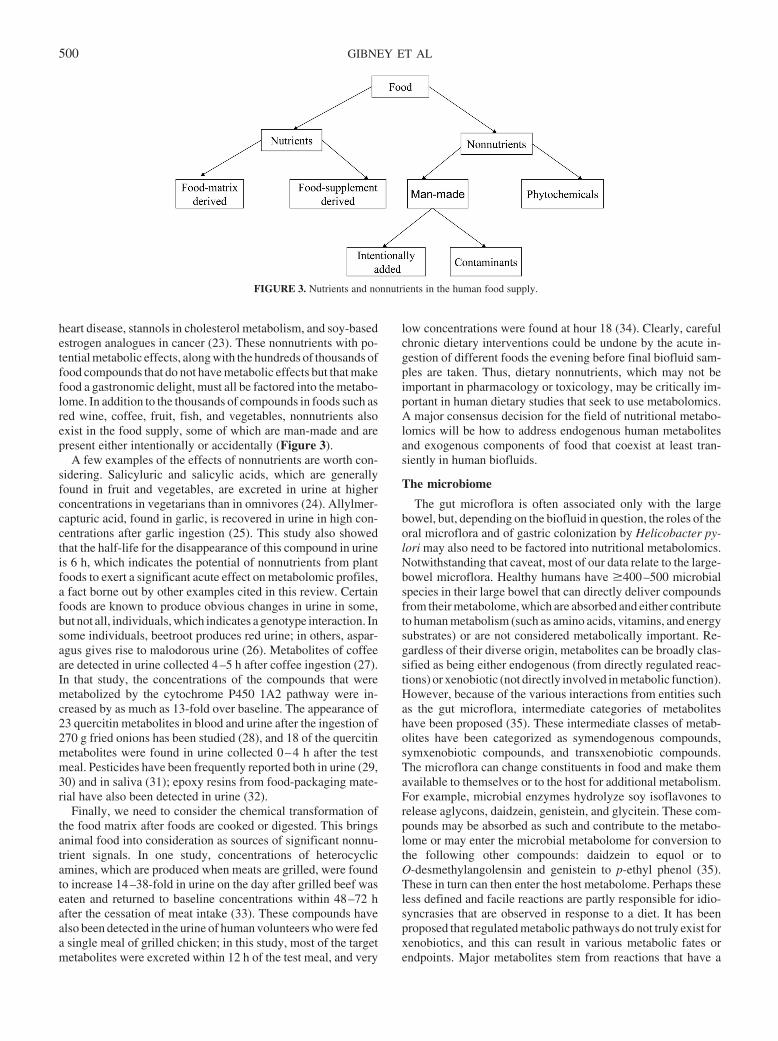
heart disease, stannols in cholesterol metabolism, and soy-basedestrogen analogues in cancer (23). These nonnutrients with po-tential metabolic effects, along with the hundreds of thousands offood compounds that do not have metabolic effects but that makefood a gastronomic delight, must all be factored into the metabo-lome. In addition to the thousands of compounds in foods such asred wine, coffee, fruit, fish, and vegetables, nonnutrients alsoexist in the food supply, some of which are man-made and arepresent either intentionally or accidentally (Figure 3).
A few examples of the effects of nonnutrients are worth con-sidering. Salicyluric and salicylic acids, which are generallyfound in fruit and vegetables, are excreted in urine at higherconcentrations in vegetarians than in omnivores (24). Allylmer-capturic acid, found in garlic, is recovered in urine in high con-centrations after garlic ingestion (25). This study also showedthat the half-life for the disappearance of this compound in urineis 6 h, which indicates the potential of nonnutrients from plantfoods to exert a significant acute effect on metabolomic profiles,a fact borne out by other examples cited in this review. Certainfoods are known to produce obvious changes in urine in some,but not all, individuals, which indicates a genotype interaction. Insome individuals, beetroot produces red urine; in others, aspar-agus gives rise to malodorous urine (26). Metabolites of coffeeare detected in urine collected 4–5 h after coffee ingestion (27).In that study, the concentrations of the compounds that weremetabolized by the cytochrome P450 1A2 pathway were in-creased by as much as 13-fold over baseline. The appearance of23 quercitin metabolites in blood and urine after the ingestion of270 g fried onions has been studied (28), and 18 of the quercitinmetabolites were found in urine collected 0–4 h after the testmeal. Pesticides have been frequently reported both in urine (29,30) and in saliva (31); epoxy resins from food-packaging mate-rial have also been detected in urine (32).
Finally, we need to consider the chemical transformation ofthe food matrix after foods are cooked or digested. This bringsanimal food into consideration as sources of significant nonnu-trient signals. In one study, concentrations of heterocyclicamines, which are produced when meats are grilled, were foundto increase 14–38-fold in urine on the day after grilled beef waseaten and returned to baseline concentrations within 48–72 hafter the cessation of meat intake (33). These compounds havealso been detected in the urine of human volunteers who were feda single meal of grilled chicken; in this study, most of the targetmetabolites were excreted within 12 h of the test meal, and very
low concentrations were found at hour 18 (34). Clearly, carefulchronic dietary interventions could be undone by the acute in-gestion of different foods the evening before final biofluid sam-ples are taken. Thus, dietary nonnutrients, which may not beimportant in pharmacology or toxicology, may be critically im-portant in human dietary studies that seek to use metabolomics.A major consensus decision for the field of nutritional metabo-lomics will be how to address endogenous human metabolitesand exogenous components of food that coexist at least tran-siently in human biofluids.
The microbiome
The gut microflora is often associated only with the largebowel, but, depending on the biofluid in question, the roles of theoral microflora and of gastric colonization by Helicobacter py-lori may also need to be factored into nutritional metabolomics.Notwithstanding that caveat, most of our data relate to the large-bowel microflora. Healthy humans have �400–500 microbialspecies in their large bowel that can directly deliver compoundsfrom their metabolome, which are absorbed and either contributeto human metabolism (such as amino acids, vitamins, and energysubstrates) or are not considered metabolically important. Re-gardless of their diverse origin, metabolites can be broadly clas-sified as being either endogenous (from directly regulated reac-tions) or xenobiotic (not directly involved in metabolic function).However, because of the various interactions from entities suchas the gut microflora, intermediate categories of metaboliteshave been proposed (35). These intermediate classes of metab-olites have been categorized as symendogenous compounds,symxenobiotic compounds, and transxenobiotic compounds.The microflora can change constituents in food and make themavailable to themselves or to the host for additional metabolism.For example, microbial enzymes hydrolyze soy isoflavones torelease aglycons, daidzein, genistein, and glycitein. These com-pounds may be absorbed as such and contribute to the metabo-lome or may enter the microbial metabolome for conversion tothe following other compounds: daidzein to equol or toO-desmethylangolensin and genistein to p-ethyl phenol (35).These in turn can then enter the host metabolome. Perhaps theseless defined and facile reactions are partly responsible for idio-syncrasies that are observed in response to a diet. It has beenproposed that regulated metabolic pathways do not truly exist forxenobiotics, and this can result in various metabolic fates orendpoints. Major metabolites stem from reactions that have a
FIGURE 3. Nutrients and nonnutrients in the human food supply.
500 GIBNEY ET AL
high probability of occurring whereas micrometabolites stemfrom reactions that have a lower probability of occurring (35).Metabolomic studies in rat urine have shown very marked dif-ferences between rats with a germ-free status and rats with aconventional status (36). However, whereas large differencesbetween the total absence of a gut microflora and its presencemight be expected in urinary metabolomes, exactly how diet-related changes in the composition of the gut microflora of hu-mans influence the metabolomic profiles of his different bioflu-ids remains to be determined.
Which metabolome?
Having considered these various potential confounding fac-tors in human nutrition metabolomics, the available biofluids andwhat role they might play in the field are worth considering.Blood, urine, and saliva are the most likely sources of biofluidsfor human metabolomics. Fecal water offers an opportunity tostudy gut microflora metabolomics but must be treated cau-tiously because this biofuluid cannot indicate the metabolitesfrom the large-bowel microflora that are actually absorbed by thehost. Obtaining other metabolomes (eg, cerebrospinal fluid,liver, gut, or muscle biopsy specimens) is more invasive, but wecan anticipate the use of such tissues, as well as the use of culturedhuman cells such as peripheral blood mononuclear cells or fi-broblasts, for metabolomic studies. Nonetheless, the 3 mainbiofluids that will probably be used in nutritional metabolomicsare saliva, blood, and urine.
Saliva is not widely used in human nutrition research, but acase for its inclusion in nutritional metabolomics can be made.Saliva is a readily attainable biofluid that is rich in hormones suchas 17-OH progesterone, testosterone, estradiol, and free cortisol(37). Its fatty acid composition has been used as a biomarker ofplasma arachidonic acid (38), and it has been extensively studiedfor its antioxidant capacity (39). Although saliva has not beenused in metabolomic studies, its potential for distinguishing be-tween metabolic profiles and for monitoring changes in meta-bolic profiles induced by diet would be worth exploring. Bothserum and plasma will undoubtedly be used for nutritionalmetabolomic analyses, but they will yield very different NMRand MS spectra because of the large number of small moleculesthat are released in the clotting process, which gives rise to serum.The nature of the anticoagulant used when the plasma samples areobtained may also have an effect on the metabolomic analysis.
A major difference between urine and plasma is the ratio ofmetabolites (signal) to nonmetabolites that are derived fromplant food phytochemicals and chemicals that arise from cooking(noise); urine has a higher level of noise than does plasma. Bloodis a rich source of nutrients and metabolites that are in transit fromone organ to another. These metabolically active compounds areretained in blood as much as possible and only spill over intourine when their concentrations in plasma rise and exceed therelevant renal threshold. In contrast, the diet-derived nonnutrientcompounds that are not involved in metabolism are renderedmore polar to decrease their renal threshold, which favors theirentry into urine. The major function of urine is to dispose ofunwanted compounds in the body; consequently, the concentra-tion of nonnutrient compounds is usually higher in urine than inplasma. In the study of the acute effects of onion ingestion onquercitin metabolism, 11 quercitin metabolites unique to urinewere found, whereas only 5 quercitin metabolites were unique toplasma (28). Thus, if the objective is to study the direct effect of
dietary intervention on the urinary metabolome, then a relativeenrichment of urine in nonnutrient compounds represents anincrease in noise. A second major difference is that lipid-solublecompounds can exist in plasma but not in urine. Urine, however,has become a major biofluid of choice in pharmacologic andtoxicological metabolomics and, thus, is also likely to be of majorimportance for many nutritionists.
These examples point to the necessity of standardizing theapplication of metabolomics in nutrition studies, at least in termsof sample collection and preparation and of standardization offluids, times, volumes, and processing aids. The use of databasesfor comparison of dietary or other treatment groups and theidentification of discriminating metabolites makes sense only ifcertain minimal criteria are met for all elements of the datacollection. Several initiatives are being undertaken to standard-ize approaches (40–42). Such standardization has been estab-lished for the application of metabolomics to plant sciences (43).
Adjusting metabolomic profiles for the experimentalinput
Toxicological and pharmacologic studies apply an externalcompound, drug, or toxin and then measure the effects onmetabolomic profiles. However, the drug or chemical and theirmetabolites should not, as signals, be confused with the meta-bolic consequences of the signal and are normally deleted fromthe metabolic profile. From the limited number of animal studiesthat have used single nutrients as metabolic inputs (signals), suchas ascorbic acid in metabolomics research, a similar approach ofsignal correction has been applied (44). Although the principle ofcorrecting for the spectral effect of the test nutrient is possible forcompounds such as vitamin C or folic acid, this correction willnot be possible in nutritional studies that involve complex mix-tures of nonnutrient small molecules. For example, a study of thedifferences between the effects of soy protein and the effects ofcow milk protein will show very different urinary metabolomes,and the frequently used statistical techniques, which involvemegavariate analyses, will show a significant separation of the 2treatment groups. Will this difference be due to the metabolicconsequences of differences in amino acid compositions, to dif-ferences in the metabolic effects of soy- or milk-derived pep-tides, or simply to the appearance of soy phytochemicals inbiofluids?
Another example of the problems or challenges we face innutrition is when removing the direct effect of the input is notfeasible. The addition of fatty acids to a diet will lead to theirincorporation into a metabolic pool of fixed size, such as in a poolof phospholipids, and will lead to the displacement of some fattyacids that are already present therein. In other instances, meta-bolic pools will resist change, eg, pools of ionizable calcium inplasma or pools of any mineral or trace elements in plasma.Finally, for complex dietary interventions, such as altering theintake of fruit and vegetables, the deletion of signal noise will beimpossible with nonspecific techniques such as NMR and willonly be possible with selective techniques such as MS.
Linking metabolomes with cell regulatory processes
The tendency exists to think that the connection of one gene toone transcript to one protein to specific metabolites can be uni-versally applied and that through a systems biology approach,which integrates all connections, we will eventually obtain a
METABOLOMICS IN HUMAN NUTRITION 501
qualitative, quantitative, and probabilistic overview of biologicalprocesses. Metabolism, however, is dynamic, and measurementsof the flux of metabolites through metabolic pools, perhaps forvery narrow or focused metabolomes (eg, the folate metabo-lome), will somehow need to be measured with the use of stableisotopes (45–47). Even with a comprehensive set of transcrip-tomic and proteomic data with some elements of dynamic mea-sures, linking metabolites back to proteins and genes will not besimple. Cells operate many sensory, regulatory, and compensa-tory systems that regulate the flux of metabolites through path-ways without involving hormonal or endocrine signals, and al-though these pathways are known, the exact sensor remainsunclear (48). AMP-activated protein kinase is uniquely sensitiveto the ratio of AMP to ATP in cells, whereas amino acids arepositive regulators of mammalian target of rapamycin kinase,which regulates cell size. Recently, a direct effect of metaboliccofactors on gene expression has been discovered, but this effectdoes not involve any of the normal signal transduction pathways(12). A series of metabolic-related enzymes, which are namedmetabolic transcription factors, act independently of their cata-lytic properties and in direct association with enzyme cofactorssuch as ATP, NAD, NADP, FAD, and S-adenosylmethionineand appear to be key in the regulation of gene expression. Forexample, S-adenosylmethionine in association with histonemethyltransferases regulates histones, and arginine 82 requiresATP binding to modulate the arginine- and phosphate-responsive gene transcription factor. Clearly, metabolic functiondoes not necessarily lead to gene expression through hormones orthrough signal transduction pathways, which is an important factfor systems biology.
Metabolomics—nutrition compared with pharmacologyand toxicology
Experimental pharmacology and toxicology differ from hu-man nutrition in 3 major respects with regard to metabolomics.First, much of the research in pharmacology and toxicology isconducted in laboratory animals that are genetically and nutri-tionally more homogeneous than are humans. Second, experi-ments in both pharmacology and toxicology involve the directadministration of a xenobiotic at a dose that is intended to havean effect on metabolism. Finally, major metabolic signals that actin concert on the pathologic regulation of the disease have aprofound effect on the human metabolome and will affect theapplication of metabolomics in clinical medicine for the detec-tion of diseases, such as cardiovascular disease or multiple scle-rosis. Because of these differences, the signal-to-noise ratio willbe higher in pharmacology and toxicology research than in hu-man nutrition research. Thus, it is clear that, in human nutritionresearch, a great effort should be made to maximize the accuracyand precision of metabolite measurements to ensure that the dataobtained maintain the biological information that underlies thephenotype variations of interest. The field will need this level ofaccuracy to understand the separate effects of drugs, food sup-plements, stress, physical activity, body composition, age, sex,colonic flora, and reproductive factors.
CONCLUSIONS
Nutrigenomics and nutrigenetics dominate the diet-gene andgene-diet responsiveness research in the field of personalized
nutrition, and the literature for these subjects, both in the scien-tific (49) and policy (50) areas, is rapidly expanding. In contrast,only one peer-reviewed article on the application of metabolo-mics to human nutrition exists (51), a situation that will surely beshort-lived. Individual researchers will apply this technologybecause it exists and because it will give them some useful insightinto their metabolic questions. However, some of the potential ofmetabolomics for human nutrition requires international schol-arly reflection leading to an international collaborative project,which should have 2 aims in mind. The first aim should be toconstruct metabolomic databases that are linked to phenotypedatabases, which should be rigidly constructed under variousdietary conditions that are agreed on by the collaborators. Thesecond aim should be to agree on a first set of metabolites that areof interest to nutrition and would aid in compound identificationwith the use of both NMR and MS technologies and that wouldbe entered into a library of small molecules. Before these studiesare undertaken, however, more basic studies are needed to as-certain the acute and chronic effects of diet on biofluid metabo-lomes, to clarify the role of the colonic microflora, to explore therole of nonnutrients through purified and low-residue diets, andto ascertain the rates of change of human biofluid metabolomesin response to various dietary interventions. For all of this tohappen, an international collaborative project must be agreed on.The American Society for Nutritional Sciences, in its report fromthe Long Range Planning Committee, has set out its commitmentto personalized nutrition (52), and the time is nigh for the inter-national community to spell out a technical roadmap for nutri-tional metabolomics. To that end, the European NutrigenomicsOrganisation, the American Society for Nutritional Sciences,and the Metabolomics Society should work together on a globalinitiative to create a research roadmap and a standard of datacollection and curation for metabolomics in human nutrition.
MJG completed the literature research and prepared the first draft of themanuscript and all subsequent drafts after feedback from all other authors.None of the authors had any conflicts of interest.
REFERENCES1. Brindle JT, Antti H, Holmes E, et al. Rapid and noninvasive diagnosis of
the presence and severity of coronary heart disease using 1H NMR-basedmetabonomics. Nat Med 2002;8:1439–44.
2. Watkins SM, Reifsnyder PR, Pan HJ, German JB, Leiter EH. Lipidmetabolome-wide effects of the PPARgamma agonist rosiglitazone.Lipid Res 2002;43:1809–17.
3. Nicholson JK, Connelly J, Lindon JC, Holmes E. Metabonomics: aplatform for studying drug toxicity and gene function. Nat Rev DrugDiscov 2002;1:153–61.
4. Metabolomics Society. 2004. Internet: http://www.metabolomicssoci-ety.org (accessed 9 February 2005).
5. National Institutes of Health. National Institutes of Health roadmap—accelerating medical discovery to improve health. 2005. Internet: http://nihroadmap.nih.gov (accessed 9 February 2005).
6. Bollard ME, Stanley EG, Lindon JC, Nicholson JK, Holmes E. NMR-based metabonomic approaches for evaluating physiological influenceson biofluid composition. NMR Biomed 2005;18:143–62.
7. Ala-Korpela M. 1H NMR spectroscopy of human plasma. Prog NuclMag Res Sp 1995;27:475–554.
8. Schauer N, Steinhauser D, Strelkov S, et al. GC-MS libraries for the rapididentification of metabolites in complex biological samples. FEBS Lett2005; 579:1332–7.
9. National Institutes of Health, National Library of Medicine, NationalCentre for Bioinformatic Information. PubChem. 2005. Internet: http://pubchem.ncbi.nlm.nih.gov (accessed 9 February 2005).
10. Uttamchandani M, Walsh DP, Yao SQ, Chang YT. Small molecule
502 GIBNEY ET AL
microarrays: recent advances and applications. Curr Opin Chem Biol2005;9:4–13.
11. National Institute of Standards and Technology. Standard reference da-tabase 1a.http. 2005. Internet: http://www.nist.gov/srd/nist1a.htm (ac-cessed 9 February 2005).
12. Bono H, Nikaido I, Kasukawa T, Hayashizaki Y, Okazaki Y. Compre-hensive analysis of the mouse metabolome based on the transcriptome.Genome Res 2003;13:1345–9.
13. Romero P, Wagg J, Green ML, Kaiser D, Krummenacker M, Karp PD.Computational prediction of human metabolic pathways from the com-plete human genome. Genome Biol 2005;6:R2.
14. ’t Hart BA, Vogels JT, Spijksma G, Brok HP, Polman C, van der GreefJ. 1H-NMR spectroscopy combined with pattern recognition analysisreveals characteristic chemical patterns in urines of MS patients andnon-human primates with MS-like disease. J Neurol Sci 2003;212:21–30.
15. Brindle JT, Nicholson JK, Schofield PM, Grainger DJ, Holmes E. Ap-plication of chemometrics to 1H NMR spectroscopic data to investigatea relationship between human serum metabolic profiles and hyperten-sion. Analyst 2003;128:32–6.
16. Odunsi K, Wollman RM, Ambrosone CB, et al. Detection of epithelialovarian cancer using 1H-NMR-based metabonomics. Int J Cancer 2005;113:782–8.
17. Constantinou MA, Papakonstantinou E, Benaki D, et al. Application ofnuclear magnetic resonance spectroscopy combined with principal com-ponent analysis in detecting inborn errors of metabolism using bloodsports: a metabonomic approach. Anal Chim Acta 2004;511:303–12.
18. Potts BC, Deese AJ, Stevens GJ, Reily MD, Robertson DG, Theiss J.NMR of biofluids and pattern recognition: assessing the impact of NMRparameters on the principal component analysis of urine from rat andmouse. J Pharm Biomed Anal 2001;26:463–76.
19. Lindon JC, Nicholson JK, Holmes E, et al. Contemporary issues intoxicology the role of metabonomics in toxicology and its evaluation bythe COMET project. Toxicol Appl Pharmacol 2003;187:137–46.
20. Solanky KS, Bailey NJ, Beckwith-Hall BM, et al. Application of biofluid1H nuclear magnetic resonance-based metabonomic techniques for theanalysis of the biochemical effects of dietary isoflavones on humanplasma profile. Anal Biochem 2003;323:197–204.
21. Lenz EM, Bright J, Wilson ID, et al. Metabonomics, dietary influencesand cultural differences: a 1H NMR-based study of urine samples ob-tained from healthy British and Swedish subjects. J Pharm Biomed Anal2004;36:841–9.
22. Zuppi C, Messana I, Forni F, Ferrari F, Rossi C, Giardina B. Influence offeeding on metabolite excretion evidenced by urine 1H NMR spectralprofiles: a comparison between subjects living in Rome and subjectsliving at arctic latitudes (Svaldbard). Clin Chim Acta 1998;278:75–9.
23. Cassidy A, Dalais FS. Phytochemicals. In: Gibney MJ, Macdonald I,Roche HM, eds. Nutrition & Metabolism. Oxford, United Kingdom:Blackwell Science, 2003:307–17.
24. Lawrence JR, Peter R, Baxter GJ, Robson J, Graham AB, Paterson JR.Urinary excretion of salicyluric and salicylic acids by non-vegetarians,vegetarians, and patients taking low dose aspirin. J Clin Pathol 2003;56:651–3.
25. de Rooij BM, Boogaard PJ, Rijksen DA, Commandeur JN, VermeulenNP. Urinary excretion of N-acetyl-S-allyl-L-cysteine upon garlic con-sumption by human volunteers. Arch Toxicol 1996;70:635–9.
26. Mitchell SC. Food idiosyncrasies: beetroot and asparagus. Drug MetabDispos 2001;29:539–43.
27. Schneider H, Ma L, Glatt H. Extractionless method for the determinationof urinary caffeine metabolites using high-performance liquid chroma-tography coupled with tandem mass spectrometry. J Chromatogr B Ana-lyt Technol Biomed Life Sci 2003;789:227–37.
28. Mullen W, Boitier A, Stewart AJ, Crozier A. Flavonoid metabolites inhuman plasma and urine after the consumption of red onions: analysis byliquid chromatography with photodiode array and full scan tandem massspectrometric detection. J Chromatogr A 2004;1058:163–8.
29. Fustinoni S, Campo L, Colosio C, Birindelli S, Foa V. Application of gaschromatography-mass spectrometry for the determination of urinaryethylenethiourea in humans. J Chromatogr B Analyt Technol BiomedLife Sci 2005;814:251–8.
30. Mage DT, Allen RH, Gondy G, Smith W, Barr DB, Needham LL.Estimation pecticide dose from urinary pesticide concentration data bycreatinine correction in the Third National Health and Nutrition Exam-ination Survey (NHANES-III). J Expo Anal Environ Epidemiol 2004;14:457–65.
31. Timchalk C, Poet TS, Kousba AA, Campbell JA, Lin Y. Noninvasivebiomonitoring approaches to determine dosimetry and risk followingacute chemical exposure: analysis of lead and organophosphate insec-ticide in saliva. J Toxicol Environ Health A 2004;28:635–50.
32. Ouchi KWS. Measurement of bisphenol A in human urine using liquidchromatography with multi-channel coulometric electrochen detection.J Chromatogr B Analyt Technol Biomed Life Sci 2002;780:365–70.
33. Strickland PT, Qian Z, Friesen MD, Rothman N, Sinha R. Metabolites of2-amino-1-methyl-6-phenylimidazo(4,5-b)pyridine (PhIP) in humanurine after consumption of charbroiled or fried beef. Mutat Res 2002;506–507:163–73.
34. Kulp KS, Knize MG, Malfatti MA, Salmon CP, Felton JS. Identificationof urine metabolites of 2-amino-1-methyl-6-phenylimidazo[4,5-b]pyridine following consumption of a single cooked chicken meal inhumans. Carcinogenesis 2000;21:2065–72.
35. Wiseman H, Casey K, Bowey EA, et al. Influence of 10 wk of soyconsumption on plasma concentrations and excretion of isoflavonoidsand on gut microflora metabolism in healthy adults. Am J Clin Nutr2004;80:692–9.
36. Nicholls AW, Mortishire-Smith RJ, Nicholson JK. NMR spectroscopic-based metabonomic studies of urinary metabolite variation in acclima-tizing germ-free rats. Chem Res Toxicol 2003;16:1395–404.
37. Hofman LF. Human saliva as a diagnostic specimen. J Nutr 2001;131(suppl):S1621–5.
38. Actis AB, Perovic NR, Defago D, Beccacece C, Eynard AR. Fatty acidprofile of human saliva: a possible indicator of dietary fat intake. ArchOral Biol 2005;50:1–6.
39. Battino M, Ferreiro MS, Gallardo I, Newman HN, Bullon P. The anti-oxidant capacity of saliva. J Clin Periodontol 2002;29:189–94.
40. The Standard Metabolic Reporting Structure: an open standard for re-porting metabolic data (2nd draft recommendation). 2004. Internet:http://www.smrsgroup.org (accessed 9 February 2005).
41. Microarray Gene Expression Data Society. Reporting structure for bio-logical investigations working groups (RSBIWGs). NutrigenomicsWorking Group. 2004. Internet: http://www.mged.org/Workgroups/rsbi/rsbi.html. (accessed 9 February 2005).
42. UK Biobank. Sample handling and storage subgroup protocol and rec-ommendations. Version 1.0, 7 July 2004. Internet: http://www.ukbio-bank.ac.uk/science/science.php (accessed 29 June 2005).
43. Jenkins H, Hardy N, Beckmann M, et al. A proposed framework for thedescription of plant metabolomics experiments and their results. NatBiotechnol 2004;22:1601–6.
44. van Ommen B. Nutrigenomics: exploiting systems biology in the nutri-tion and health arenas. Nutrition 2004;20:4–8.
45. Sauer U. High-throughput phenomics: experimental methods for map-ping fluxomes. Curr Opin Biotechnol 2004;15:58–63.
46. Birkemeyer C, Luedemann A, Wagner C, Erban A, Kopka J. Metabo-lome analysis: the potential of in vivo labeling with stable isotopes formetabolite profiling. Trends Biotechnol 2005;23:28–33.
47. Hellerstein MK. In vivo measurement of fluxes through metabolic path-ways: the missing link in functional genomics and pharmaceutical re-search. Annu Rev Nutr 2003;23:379–402.
48. Lindsley JE, Rutter J. Nutrient sensing and metabolic decisions. CompBiochem Physiol B Biochem Mol Biol 2004;139:543–59.
49. Gillies PJ. Nutrigenomics: the Rubicon of molecular nutrition. J Am DietAssoc 2003;103(suppl):S50–5.
50. Gibney MJ, Gibney ER. Diet, genes and disease: implications for nutri-tion policy. Proc Nutr Soc 2004;63:491–500.
51. Whitfield PD, German AJ, Nobel PJ. Metabolomics: an emerging post-genomic tool for nutrition. Br J Nutr 2004;92:549–55.
52. German JB, Bauman DE, Burrin DG, et al. Metabolomics in the openingdecade of the 21st century: building the roads to individualized health. JNutr 2004;134:2729–32.
METABOLOMICS IN HUMAN NUTRITION 503
Original Research Communications
Elevated atopy in healthy obese women1–5
Victoria J Vieira, Anne M Ronan, Mark R Windt, and Anthony R Tagliaferro
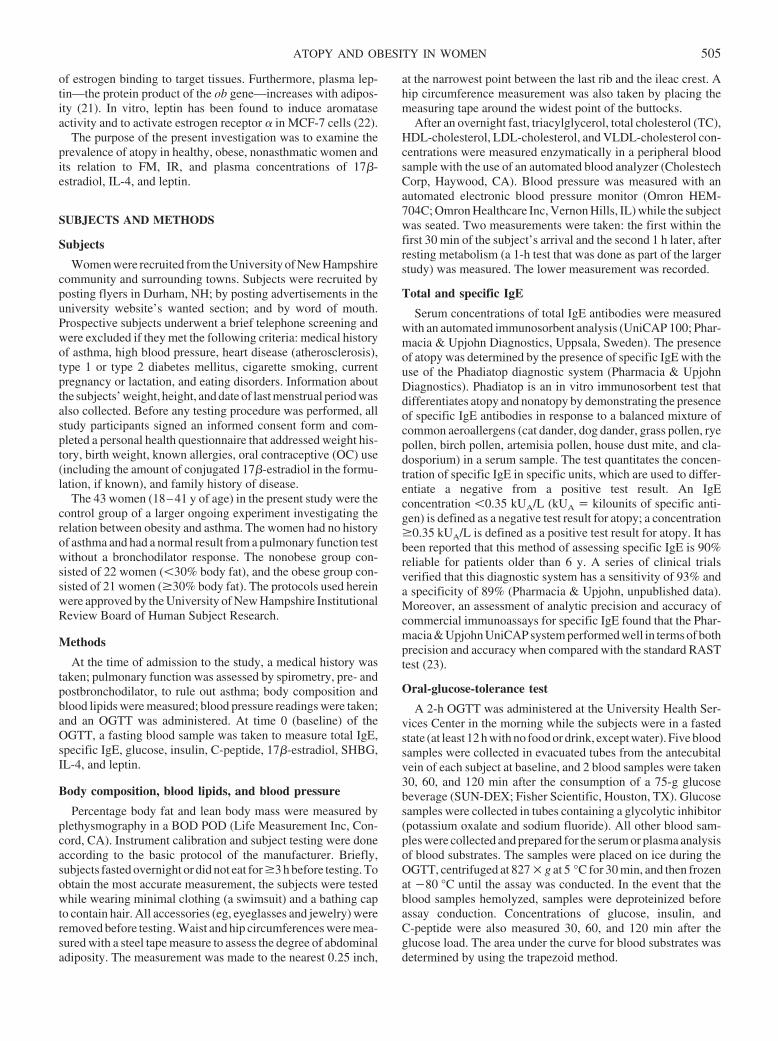
ABSTRACTBackground: Allergic disorders, including asthma, have increaseddramatically in the United States in the past 20 y. Epidemiologicstudies have found body mass index (body weight in kg/heightsquared in m) to be a positive independent correlate of atopy inwomen but not in men.Objective: We investigated the prevalence of atopy among healthyobese and nonobese women and its relation to fat mass (FM), insulinresistance, and plasma concentrations of 17�-estradiol, interleukin 4(IL-4), and leptin.Design: A cross-sectional study of 21 obese (�30% body fat) and 22nonobese (�30% body fat) women (18–41 y of age) was performed.The following measurements were taken: FM by plethysmography,total and specific immunoglobulin E (IgE) by automated immu-nosorbent analysis, and blood glucose, insulin, C-peptide, 17�-estradiol, sex hormone–binding globulin, and IL-4. Insulin sensi-tivity was determined on the basis of the fasting insulin resistanceindex and with an oral-glucose-tolerance test.Results: The frequency of specific IgE in the obese group wasalmost 3 times that in the nonobese group (P � 0.008). The total IgEconcentration was not significantly different between groups.Plasma concentrations of 17�-estradiol, the ratio of 17�-estradiol tosex hormone–binding globulin, the fasting insulin resistance index,and C-peptide and leptin concentrations were higher in the obesethan in the nonobese group (P � 0.05) after adjustment for oralcontraceptive use. All factors correlated positively with FM. Logis-tic regression showed FM to be the only positive predictor of specificIgE (P � 0.01).Conclusion: The findings confirm a direct relation between obesityand a T helper 2 cell immune response in women. Am J ClinNutr 2005;82:504–9.
KEY WORDS Allergy, obesity, leptin, atopy, insulin resis-tance, 17�-estradiol
INTRODUCTION
Atopy is a genetically determined state that is characterized byan elevation of circulating specific immunoglobulin E (IgE) an-tibodies to environmental allergens. Atopy is viewed as a majorrisk factor for asthma and other allergic diseases (1). Factors thatmay cause the development of an atopic state are not well un-derstood. Some have hypothesized that vaccines, the frequentuse of antibiotics, and the promotion of a pathogen-free environ-ment may inadvertently cause a shift toward the T helper 2 (Th2)
cell immune response, or atopic state, rather than a T helper 1 cellimmune response or nonatopic state (2). Not all evidence, how-ever, supports this “hygiene hypothesis.” For example, innercities, one of the least hygienic areas in our society, continue tohave the greatest percentage of allergic asthmatics (3). Suchobservations have moved some researchers to look at other fac-tors characteristic of westernized living that could cause allergicdisorders.
In 1980, the prevalence of obesity [body mass index (BMI; inkg/m2) �30] in adult Americans was 14.5% (4). At the end of thepast decade, 1 in 4 Americans was obese (5). An impressive bodyof experimental evidence strongly suggests a causal relation be-tween obesity and asthma development (6). Recent clinical andepidemiologic investigations of men and women have reportedBMI to be a positive and independent risk factor of allergy insexually mature teenage girls (7, 8) and asthma in women (9–14),respectively. It is noteworthy that these effects are specific tofemales, which suggests that fat mass (FM) and hormonalchanges associated with menarche promote atopy in women.
The major female sex hormone, 17�-estradiol, has been foundex vivo to up-regulate the expression and secretion of interleukin4 (IL-4) from CD4� helper cells (15). IL-4 is one of the primarysignals for activating an immune response toward atopy (16).Obesity also affects both the circulating concentration of 17�-estradiol (17) and the biological availability of 17�-estradiol(BAE) (18). With increased adiposity, a state of insulin resistance(IR) develops (19). IR suppresses the hepatic production of thetransport protein, sex hormone–binding globulin (SHBG). Adecrease in SHBG has been shown to increase free 17�-estradiol(20). An increase in free estrogen would increase the likelihood
1 From the Department of Animal and Nutritional Sciences, University ofNew Hampshire, Durham, NH (VJV, AMR, MRW, and ART).
2 Scientific Contribution no. 2258 from the New Hampshire ExperimentStation.
3 Presented in part at Experimental Biology Meetings, San Diego, CA,April 2003.
4 Supported by the American Lung Association of New Hampshire, theNew Hampshire Agricultural Experiment Station (Project H285), GlaxoWellcome, Schering Plough, and Aventis Pharmaceuticals.
5 Address reprint requests to AR Tagliaferro, Department of Animal andNutritional Sciences, University of New Hampshire, Durham, NH 03824.E-mail: [email protected].
Received January 25, 2005.Accepted for publication May 30, 2005.
504 Am J Clin Nutr 2005;82:504–9. Printed in USA. © 2005 American Society for Clinical Nutrition
of estrogen binding to target tissues. Furthermore, plasma lep-tin—the protein product of the ob gene—increases with adipos-ity (21). In vitro, leptin has been found to induce aromataseactivity and to activate estrogen receptor � in MCF-7 cells (22).
The purpose of the present investigation was to examine theprevalence of atopy in healthy, obese, nonasthmatic women andits relation to FM, IR, and plasma concentrations of 17�-estradiol, IL-4, and leptin.
SUBJECTS AND METHODS
Subjects
Women were recruited from the University of New Hampshirecommunity and surrounding towns. Subjects were recruited byposting flyers in Durham, NH; by posting advertisements in theuniversity website’s wanted section; and by word of mouth.Prospective subjects underwent a brief telephone screening andwere excluded if they met the following criteria: medical historyof asthma, high blood pressure, heart disease (atherosclerosis),type 1 or type 2 diabetes mellitus, cigarette smoking, currentpregnancy or lactation, and eating disorders. Information aboutthe subjects’ weight, height, and date of last menstrual period wasalso collected. Before any testing procedure was performed, allstudy participants signed an informed consent form and com-pleted a personal health questionnaire that addressed weight his-tory, birth weight, known allergies, oral contraceptive (OC) use(including the amount of conjugated 17�-estradiol in the formu-lation, if known), and family history of disease.
The 43 women (18–41 y of age) in the present study were thecontrol group of a larger ongoing experiment investigating therelation between obesity and asthma. The women had no historyof asthma and had a normal result from a pulmonary function testwithout a bronchodilator response. The nonobese group con-sisted of 22 women (�30% body fat), and the obese group con-sisted of 21 women (�30% body fat). The protocols used hereinwere approved by the University of New Hampshire InstitutionalReview Board of Human Subject Research.
Methods
At the time of admission to the study, a medical history wastaken; pulmonary function was assessed by spirometry, pre- andpostbronchodilator, to rule out asthma; body composition andblood lipids were measured; blood pressure readings were taken;and an OGTT was administered. At time 0 (baseline) of theOGTT, a fasting blood sample was taken to measure total IgE,specific IgE, glucose, insulin, C-peptide, 17�-estradiol, SHBG,IL-4, and leptin.
Body composition, blood lipids, and blood pressure
Percentage body fat and lean body mass were measured byplethysmography in a BOD POD (Life Measurement Inc, Con-cord, CA). Instrument calibration and subject testing were doneaccording to the basic protocol of the manufacturer. Briefly,subjects fasted overnight or did not eat for �3 h before testing. Toobtain the most accurate measurement, the subjects were testedwhile wearing minimal clothing (a swimsuit) and a bathing capto contain hair. All accessories (eg, eyeglasses and jewelry) wereremoved before testing. Waist and hip circumferences were mea-sured with a steel tape measure to assess the degree of abdominaladiposity. The measurement was made to the nearest 0.25 inch,
at the narrowest point between the last rib and the ileac crest. Ahip circumference measurement was also taken by placing themeasuring tape around the widest point of the buttocks.
After an overnight fast, triacylglycerol, total cholesterol (TC),HDL-cholesterol, LDL-cholesterol, and VLDL-cholesterol con-centrations were measured enzymatically in a peripheral bloodsample with the use of an automated blood analyzer (CholestechCorp, Haywood, CA). Blood pressure was measured with anautomated electronic blood pressure monitor (Omron HEM-704C; Omron Healthcare Inc, Vernon Hills, IL) while the subjectwas seated. Two measurements were taken: the first within thefirst 30 min of the subject’s arrival and the second 1 h later, afterresting metabolism (a 1-h test that was done as part of the largerstudy) was measured. The lower measurement was recorded.
Total and specific IgE
Serum concentrations of total IgE antibodies were measuredwith an automated immunosorbent analysis (UniCAP 100; Phar-macia & Upjohn Diagnostics, Uppsala, Sweden). The presenceof atopy was determined by the presence of specific IgE with theuse of the Phadiatop diagnostic system (Pharmacia & UpjohnDiagnostics). Phadiatop is an in vitro immunosorbent test thatdifferentiates atopy and nonatopy by demonstrating the presenceof specific IgE antibodies in response to a balanced mixture ofcommon aeroallergens (cat dander, dog dander, grass pollen, ryepollen, birch pollen, artemisia pollen, house dust mite, and cla-dosporium) in a serum sample. The test quantitates the concen-tration of specific IgE in specific units, which are used to differ-entiate a negative from a positive test result. An IgEconcentration �0.35 kUA/L (kUA � kilounits of specific anti-gen) is defined as a negative test result for atopy; a concentration�0.35 kUA/L is defined as a positive test result for atopy. It hasbeen reported that this method of assessing specific IgE is 90%reliable for patients older than 6 y. A series of clinical trialsverified that this diagnostic system has a sensitivity of 93% anda specificity of 89% (Pharmacia & Upjohn, unpublished data).Moreover, an assessment of analytic precision and accuracy ofcommercial immunoassays for specific IgE found that the Phar-macia & Upjohn UniCAP system performed well in terms of bothprecision and accuracy when compared with the standard RASTtest (23).
Oral-glucose-tolerance test
A 2-h OGTT was administered at the University Health Ser-vices Center in the morning while the subjects were in a fastedstate (at least 12 h with no food or drink, except water). Five bloodsamples were collected in evacuated tubes from the antecubitalvein of each subject at baseline, and 2 blood samples were taken30, 60, and 120 min after the consumption of a 75-g glucosebeverage (SUN-DEX; Fisher Scientific, Houston, TX). Glucosesamples were collected in tubes containing a glycolytic inhibitor(potassium oxalate and sodium fluoride). All other blood sam-ples were collected and prepared for the serum or plasma analysisof blood substrates. The samples were placed on ice during theOGTT, centrifuged at 827 � g at 5 °C for 30 min, and then frozenat �80 °C until the assay was conducted. In the event that theblood samples hemolyzed, samples were deproteinized beforeassay conduction. Concentrations of glucose, insulin, andC-peptide were also measured 30, 60, and 120 min after theglucose load. The area under the curve for blood substrates wasdetermined by using the trapezoid method.
ATOPY AND OBESITY IN WOMEN 505
Blood assays
Plasma glucose concentrations were measured enzymaticallyaccording to the glucose oxidase method with the use of a com-mercial diagnostic kit (no. 510; Sigma Diagnostics, St Louis,MO). Insulin and C-peptide were measured by competitive bind-ing radioimmunoassay (RIA) with commercial diagnostic kits(Diagnostic Systems Laboratories, Webster, TX). The fastinginsulin concentration was used to determine insulin sensitivity.C-peptide was used to assess insulin secretion under fasting andpostglucose challenge conditions. Commercial RIA assay kitswere used to measure plasma leptin (Linco Research Inc, StCharles, MO) and 17�-estradiol and SHBG (Diagnostic SystemsLaboratories, Webster, TX). Serum IL-4 concentrations weremeasured by a quantitative sandwich enzyme immunoassay withthe use of a commercial diagnostic kit (Quantikine; R&D Sys-tems Inc, Minneapolis, MN).
Insulin resistance
IR was assessed by using an empirical fasting insulin resis-tance index (FIRI) according to the calculations of Duncan et al(24). The FIRI method compares fasting insulin and glucoseconcentrations with an expected reference range centered aroundunity. FIRI has been shown to be comparable with well-knownreliable methods of assessing insulin sensitivity, such as theminimal model of Bergman et al and the HOMA-R (homeostasismodel assessment) model. FIRI was calculated as follows:
FIRI � fasting glucose (mmol/L)
� fasting insulin (mU/L)/25 (1)
Biological availability of 17�-estradiol
In this study, the ratio of total circulating 17�-estradiol (pg/mL) was expressed relative to SHBG (nmol/L) to serve as anindex of free 17�-estradiol or BAE. For this purpose, estradiolunits were converted to nmol/L by multiplying by 0.0037.
Statistics
Chi-square analyses were used to compare categorical vari-ables (atopy, OC use, and reported allergies) between groups. Allother comparisons between groups were done by analysis ofvariance (ANOVA) with the use of a general linear model(GLM). Because OC use affects female sex hormone concentra-tions and has been reported to reduce insulin sensitivity inwomen (25), all analyses of carbohydrate metabolism and hor-mone concentrations were reported both with and without ad-justment for OC use. Because of the variability in insulin con-centrations, the insulin and FIRI values were log transformed.Differences between groups in glucose, insulin, and C-peptideduring the OGTT were analyzed by using an ANOVA GLM forrepeated measures, both with and without adjustment for OC use.Areas under the curve (AUCs) for glucose, insulin, and C-peptidewere analyzed by using an ANOVA GLM. Simple Pearson’spairwise correlations of adiposity (FM and waist circumference),IR, C-peptide, BAE, and leptin were done by using uncorrectedprobability values. Logistic regression techniques were used todetermine significant predictors of atopy. Unless otherwisestated, P values � 0.05 were considered significant. All statis-tical analyses were done by using SYSTAT (version 10.0; SystatInc, Richmond, CA).
RESULTS
Characteristics of the subject population
Characteristics of the women in the obese and nonobesegroups are presented in Table 1. The obese women had a greaterpercentage of body fat, had a greater waist circumference, andwere significantly heavier than the nonobese women. The prev-alence of OC use was significantly lower in obese than in thenonobese women. Of the total 23 OC users (6 obese and 17nonobese), the most common formulation used in obese (33%)and nonobese (50%) women was 35 �g 17�-estradiol:0.25 �gprogestin. There were no significant differences in the history ofallergies between the 2 groups of women. No significant differ-ences in fasting blood triacylglycerols or in total cholesterol or itssubfactions were observed between groups.
IgE, IL-4, sex hormones, and leptin
There were no significant differences in circulating concen-trations of total IgE antibodies between the obese and nonobesewomen (87.1 43.5 and 110.8 44.3 kU/L, respectively). Thepresence of specific IgE in the obese women, however, wasalmost 3 times that in the nonobese women (Figure 1). The obesewomen had higher circulating 17�-estradiol and lower SHBGconcentrations than did the nonobese women. After adjustmentfor OC use, the differences in SHBG between the obese andnonobese women were no longer significant. BAE was signifi-cantly higher in the obese than in the nonobese women (Table 2).
Plasma concentrations of leptin in the obese women were �2times those in the nonobese women (Table 2). The differences inleptin remained after adjustment for OC use. Circulating con-centrations of IL-4 could not be detected.
Carbohydrate metabolism and insulin resistance
Fasting concentrations of glucose, insulin, and C-peptide andthe FIRI were greater in the obese than in the nonobese womenafter adjustment for OC usage (Table 3). In the same analysis,with OC as an independent factor, OC users had higher FIRIvalues than did nonusers (P � 0.051). The interaction between
TABLE 1Descriptive characteristics of the obese and nonobese women1
Obese(n � 21)
Nonobese(n � 22) P2
Age (y) 21.6 0.8 21.4 0.8 0.40Birth weight (kg) 3.4 0.15 3.4 0.15 0.78BMI (kg/m2) 26.6 0.5 21.1 0.5 � 0.001Fat mass (%) 35.4 0.8 22.9 0.8 � 0.001WC (cm) 30.7 0.5 26.6 0.4 � 0.001WHR 0.76 0.01 0.73 0.01 0.027SBP (mm Hg) 118.5 2.2 114.2 2.2 0.166DBP (mm Hg) 76.9 2.2 72.4 2.2 0.149OC users (%) 28 77 � 0.001Reported allergies (%) 43 41 0.897
1 All values are least-squares means least-squares errors. WC, waistcircumference; WHR, waist-to-hip ratio; SBP, systolic blood pressure; DBP,diastolic blood pressure; OC, oral contraceptive.
2 Differences between groups were determined by using a general linearmodel ANOVA for all variables except OC and allergies, which were ana-lyzed by using Pearson’s chi-square.
506 VIEIRA ET AL
body fat status and OC use was not significant, which indicatedthat the effect of OC use on the FIRI was independent of obesity.
After the glucose test load, there were no significant differ-ences in glucose or insulin concentrations between the obese andnonobese women over the time points studied, regardless ofwhether OC was unadjusted or adjusted for. Plasma concentra-tions of C-peptide in the obese women, however, remained
greater than those in the nonobese women over the course of theOGTT. On average, the C-peptide concentrations of the obesewomen were 22% higher (P � 0.05) than those in the nonobesewomen across the 4 time points.
A comparison of the AUCs of glucose, insulin, and C-peptidebetween groups showed that only plasma glucose, after adjust-ment for OC, was greater in the obese than in the nonobesewomen (7044 267 compared with 5944 271 mg · min/dL,respectively; P � 0.01).
Multiple correlations
A simple Pearson’s multiple correlation analysis showed thatseveral hormonal and metabolic variables tested were interre-lated (Table 4). Percentage FM correlated positively and signif-icantly with waist circumference, FIRI, C-peptide, BAE, andleptin. FIRI was positively associated with fasting concentra-tions of C-peptide and leptin. BAE was significantly related toC-peptide and leptin. Logistic regression analysis with FM,BAE, and leptin as independent variables showed FM to be apositive predictor of specific IgE. Leptin tended toward a nega-tive correlation with specific IgE (Table 5).
DISCUSSION
The prevalence of an atopic state, as indicated by the presenceof specific IgE, was greater in the obese than in the nonobesewomen in this study. Although the frequencies of self-reportedallergies and total IgE antibody concentrations were similar be-tween the 2 groups of women, the test for the presence of specificIgE showed that 62% of the obese women, in contrast with 28%of the nonobese women, tested positively for atopy. To ourknowledge, this is the first evidence of a direct relation betweenadiposity and a Th2 immune response in women. The presentfindings are an extension of previous investigations that reported
FIGURE 1. Number of obese (n � 21) and nonobese (n � 22) womenwho tested positively for the presence of circulating specific immunoglobulinE antibodies (gray shading). Black shading represents the total number ofwomen. Differences were determined by Pearson’s chi-square analysis, P �0.008.
TABLE 2Hormone and leptin concentrations adjusted for oral contraceptive use inobese and nonobese women1
Obese(n � 21)
Nonobese(n � 22) P2
17�-Estradiol (pg/mL)3 57.4 6.2 35.4 6.2 0.024SHBG (nmol/L) 71.3 8.9 76.4 9.0 0.7BAE (nmol/L) 0.009 0.001 0.003 0.002 0.01Leptin (ng/mL) 24.5 2.0 11.2 2.0 � 0.001
1 All values are least-squares means least-squares errors. SHBG, sexhormone–binding globulin; BAE, biologically available 17�-estradiol (es-timated by the ratio of 17�-estradiol to SHBG).
2 Differences were determined by using a general linear modelANOVA.
3 For women not using oral contraceptives, blood concentrations weremeasured during the luteal phase of the menstrual cycle.
TABLE 3Fasting blood values and insulin resistance adjusted for oral contraceptiveuse in obese and nonobese women1
Obese(n � 21)
Nonobese(n � 22) P2
Glucose (mg/dL) 88.1 1.5 81.7 1.5 0.007Insulin (�U/mL)3 8.6 � 9.8/�7.5 5.4 � 6.1/�4.7 0.025C-peptide (ng/mL) 2.3 0.1 1.5 0.1 0.001FIRI3 1.68 � 1.9/�1.5 �1.03 � 1.1/�1.2 0.01
1 All values are least-squares means least-squares errors. FIRI, fast-ing insulin resistance index.
2 Differences were determined by using a general linear modelANOVA.
3 Values were log transformed.
TABLE 4Pearson’s multiple correlation analysis (r values)1
FM WC FIRI2 C-peptide BAE
WC 0.763
FIRI2 0.304 0.265
C-peptide 0.364 0.304 0.553
BAE 0.553 0.553 0.235 0.304
Leptin 0.773 0.773 0.453 0.304 0.453
1 FM, fat mass; WC, waist circumference; FIRI, fasting insulin resis-tance index; BAE, biologically available 17�-estradiol.
2 Values were log transformed.3 P � 0.01.4 P � 0.05.5 P � 0.1.
TABLE 5Logistic regression analysis of specific immunoglobulin E antibodies1
Parameter Estimate SE P2
Constant �6.58 2.37 0.005Fat mass 0.28 0.11 0.008BAE �26.81 52.38 0.609Leptin �0.11 0.06 0.059
1 BAE, 17�-estradiol.2 Overall chi-square P value � 0.009.
ATOPY AND OBESITY IN WOMEN 507
a significant correlation between positive skin test results tocommon aeroallergens (8) or asthma-like symptoms (7) and BMIin adolescent girls. Furthermore, in those studies, the positiverelation between overweight status and atopic state was observedonly among sexually mature females. Those results suggest thatthe predisposition toward a humoral-mediated immune responseis related to menarche and to an increased production of 17�-estradiol (8). In the present investigation, plasma concentrationsof 17�-estradiol and BAE were higher in the obese than in thenonobese women.
Adipose tissue has been reported to contain the full comple-ment of steroidogenic enzymes for synthesizing estrogens (18).Adipogenic synthesis and aromatization of testosterone to estra-diol has been shown to be elevated in female obesity. Moreover,abdominal obesity in women has been shown to be associatedwith greater plasma concentrations of free estradiol (18) and IR(26). Waist circumference, a close correlate measure of abdom-inal obesity (27), was greater in the obese than in the nonobesewomen in the present study. The higher FIRI values and fastingC-peptide and glucose concentrations during the OGTT all in-dicated that the obese women were more insulin resistant thanwere the nonobese women.
Estradiol has been shown to be a modulator of IL-4 secretionfrom CD4� T helper cells. Peripheral blood mononuclear cells,isolated ex vivo from women who were sensitized to mite aller-gen, were found to increase IL-4 secretion in a dose-responsefashion (relative to phosphate buffer control) when differentphysiologic concentrations of estradiol were added to the incu-bation medium (15). In a related study, IL-4 release from periph-eral blood mononuclear cells, in response to mitogenic provoca-tion, was shown to parallel closely plasma estradiolconcentrations measured during the follicular (low) and luteal(high) phases of the menstrual cycle of healthy women (28). Inthe present study, we measured the nonstimulated release of IL-4,which may explain our failure to detect circulating concentra-tions of this cytokine (29).
Although 17�-estradiol and BAE were greater in the obesethan in the nonobese women, we found that neither of thesefactors, nor FIRI (data not shown), correlated directly with spe-cific IgE. FM was the only positive predictor, and leptin tendedto be a negative predictor of atopy.
Leptin concentrations in the present study were greater in theobese than in the nonobese women. Leptin correlated positivelywith plasma concentrations of 17�-estradiol and BAE andtended to correlate negatively with atopy (Table 5). The direc-tionality of the correlation was unexpected, given that leptin isdirectly related to adiposity. This inverse relation may suggestthat leptin could have a homeostatic function in immunity, anal-ogous to that for energy balance (for a review see reference 30).One hypothesis is that leptin may down-regulate the Th2 re-sponse in obese women by facilitating estrogen binding to up-regulate receptors, thereby reducing estrogen availability to in-fluence Th2 immunity.
Our failure to observe a stronger relation between atopy andeither IR or estradiol could have been the result of the confound-ing influence of OC use by the women. The OC users had higherFIRI values than did the nonusers; 77% of the nonobese womenand 28% of the obese women reported using OCs. The possibledirect biological effect that synthetic steroids may have had onthe Th2 immune response was not assessed. The relatively small
sample size and cross-sectional design of the present study lim-ited our ability to resolve this issue. It will be necessary to controlfor this factor in future studies related to the present experimentalquestion. Alternatively, it is possible that the strong relation thatwe found between FM and atopy may indicate the involvementof other chemical mediators, such as IL-18, which has beenreported to be elevated in obesity (31) and also has been linked toTh2 immunity (32).
The prevalence of asthma has increased �50% in the UnitedStates since 1980 (33), with a greater incidence in adolescent andadult females than in males. Allergic disorders, particularlyasthma, cost Americans �6 billion dollars annually in health careand lost productivity in the workplace (34). The findings of thepresent investigation strongly indicate that obesity, a preventablenutritional condition, is a risk factor for atopy. Although IR wasnot shown in this study to correlate with a Th2 immune response,obesity and IR have been shown to up-regulate a Th2 response inanimal models (35). In view of our present findings and those ofothers, additional investigations of the mechanism by whichadiposity is related to the Th2 immune response should be pur-sued.
We thank the phlebotomist, Jennifer Holzinger, for her assistance with theOGTT.
MRW and ART were responsible for the conceptualization of the researchhypothesis and experimental design. ART was responsible for the overallexecution of the study. VJV was responsible for the recruitment of subjects,collection of data, statistical analysis, biochemical assays, and preparation ofthe manuscript. AMR was responsible for the management of all laboratorytesting, biochemical assays, and data management. None of the authors hada conflict of interest relative to the study.
REFERENCES1. Simon H-U. CRC desk reference for allergy and asthma. Boca Raton,
FL: CRC Press, 2000.2. von Hertzen LC. Puzzling associations between childhood infections
and the later occurrence of asthma and atopy. Ann Med 2000;32:397–400.
3. Weiss KB, Gergen PJ, Crain EF. Inner-city asthma. The epidemiology ofan emerging US public health concern. Chest 1992;101:362S–7S.
4. Mokdad AH, Ford ES, Bowman BA, et al. Prevalence of obesity, dia-betes, and obesity-related health risk factors, 2001. JAMA 2003;289:76–9.
5. McTigue K, Garrett JM, Popkin BM. The natural history of the devel-opment of obesity in a cohort of young U.S. adults between 1981 and1998. Ann Intern Med 2002;136:857–64.
6. Tantisira KG, Weiss ST. Complex interactions in complex traits: obesityand asthma. Thorax 2001;56(suppl):64–73.
7. Huang SL, Shiao G, Chou P. Association between body mass index andallergy in teenage girls in Taiwan. Clin Exp Allergy 1999;29:323–9.
8. Castro-Rodriguez JA, Holberg CJ, Morgan WJ, Wright AL, MartinezFD. Increased incidence of asthma-like symptoms in girls who becomeoverweight or obese during the school years. Am J Respir Crit Care Med2001;163:1344–9.
9. Xu B, Jarvelin MR, Pekkanen J. Body build and atopy. J Allergy ClinImmunol 2000;105:393–4.
10. Young SY, Gunzenhauser JD, Malone KE, McTiernan A. Body massindex and asthma in the military population of the northwestern UnitedStates. Arch Intern Med 2001;161:1605–11.
11. Beckett WS, Jacobs DR Jr, Yu X, Iribarren C, Williams OD. Asthma isassociated with weight gain in females but not males, independent ofphysical activity. Am J Respir Crit Care Med 2001;164:2045–50.
12. Chen Y, Dales R, Tang M, Krewski D. Obesity may increase the inci-dence of asthma in women but not men: longitudinal observations fromthe Canadian National Population Health Surveys. Am J Epidemiol2002;155:191–7.
13. Shaheen SO, Sterne JA, Montgomery SM, Azima H. Birth weight, bodymass index and asthma in young adults. Thorax 1999;54:396–402.
508 VIEIRA ET AL
14. Guerra S, Sherrill DL, Bobadilla A, Martinez FD, Barbee RA. Therelation of body mass index to asthma, chronic bronchitis, and emphy-sema. Chest 2002;122:1256–63.
15. Hamano N, Terada N, Maesako K, et al. Effect of female hormones onthe production of IL-4 and IL-13 from peripheral blood mononuclearcells. Acta Otolaryngol Suppl 1998;537:27–31.
16. Howarth PH. The cellular basis for allergic rhinitis. Allergy 1995;50:6–10.
17. Belanger C, Luu-The V, Dupont P, Tchernof A. Adipose tissue intra-crinology: potential importance of local androgen/estrogen metabolismin the regulation of adiposity. Horm Metab Res 2002;34:737–45.
18. Kirschner MA, Samojlik E, Drejka M, Szmal E, Schneider G, Ertel N.Androgen-estrogen metabolism in women with upper body versus lowerbody obesity. J Clin Endocrinol Metab 1990;70:473–9.
19. Reaven GM. Pathophysiology of insulin resistance in human disease.Physiol Rev 1995;75:473–86.
20. Livingstone C, Collison M. Sex steroids and insulin resistance. Clin Sci(Lond) 2002;102:151–66.
21. Thomas T, Burguera B, Melton LJ III, et al. Relationship of serum leptinlevels with body composition and sex steroid and insulin levels in menand women. Metabolism 2000;49:1278–84.
22. Catalano S, Mauro L, Marsico S, et al. Leptin induces, via ERK1/ERK2signal, functional activation of estrogen receptor alpha in MCF-7 cells.J Biol Chem 2004;279:19908–15.
23. Williams PB, Barnes JH, Szeinbach SL, Sullivan TJ. Analytic precisionand accuracy of commercial immunoassays for specific IgE: establish-ing a standard. J Allergy Clin Immunol 2000;105:1221–30.
24. Duncan MH, Singh BM, Wise PH, Carter G, Alaghband-Zadeh J. Asimple measure of insulin resistance. Lancet 1995;346:120–1.
25. Godsland IF, Walton C, Felton C, Proudler A, Patel A, Wynn V. Insulin
resistance, secretion, and metabolism in users of oral contraceptives.J Clin Endocrinol Metab 1991;74:64–70.
26. Krotkiewski M, Holm G, Shono N. Small doses of triiodothyronine canchange some risk factors associated with abdominal obesity. Int J ObesRelat Metab Disord 1997;21:922–9.
27. Despres J-P. The insulin resistance-dyslipidemic syndrome of visceralobesity: effect on patient’s risk. Obes Res 1998;6:8S–17S.
28. Verthelyi D, Klinman DM. Sex hormone levels correlate with the ac-tivity of cytokine-secreting cells in vivo. Immunology 2000;100:384–90.
29. Hagiwara E, Abbasi F, Mor G, Ishigatsubo Y, Klinman DM. Phenotypeand frequency of cells secreting IL-2, IL-4, IL-6, IL-10, IFN and TNF-alpha in human peripheral blood. Cytokine 1995;7:815–22.
30. Margetic S, Gazzola C, Pegg GG, Hill RA. Leptin: a review of itsperipheral actions and interactions. Int J Obes Relat Metab Disord 2002;26:1407–33.
31. Esposito K, Pontillo A, Ciotola M, et al. Weight loss reducesinterleukin-18 levels in obese women. J Clin Endocrinol Metab 2002;87:3864–6.
32. Kruse S, Kuehr J, Moseler M, et al. Polymorphisms in the IL 18 gene areassociated with specific sensitization to common allergens and allergicrhinitis. J Allergy Clin Immunol 2003;111:117–22.
33. Mannino DM, Homa DM, Akinbami LJ, Moorman JE, Gwynn C, ReddSC. Surveillance for asthma—United States, 1980–1999. MMWR Sur-veill Summ 2002;51:1–13.
34. Weiss KB, Gergen PJ, Hodgson TA. An economic evaluation of asthmain the United States. N Engl J Med 1992;326:862–6.
35. Mito N, Hosoda T, Kato C, Sato K. Change of cytokine balance indiet-induced obese mice. Metabolism 2000;49:1295–300.
ATOPY AND OBESITY IN WOMEN 509
Small differences in the effects of stearic acid, oleic acid, andlinoleic acid on the serum lipoprotein profile of humans1–3
Myriam A Thijssen and Ronald P Mensink
ABSTRACTBackground: Studies have suggested that oleic and stearic acids, aswell as oleic and linoleic acids, have comparable effects on the serumlipoprotein profile. If so, then substituting these three 18-carbon fattyacids for each other would result in similar effects on the serumlipoprotein profile.Objective: The aim of this study was to compare simultaneously theeffects of stearic, oleic, and linoleic acids on the serum lipoproteinprofile of healthy subjects.Design: Forty-five subjects (27 women and 18 men) consumed inrandom order 3 experimental diets, each for 5 wk. The diets provided38% of energy from fat, of which 60% was supplied by the experi-mental fats. The dietary compositions of the diets were the same,except for 7% of energy, which was provided by stearic, oleic, orlinoleic acid. At the end of each intervention period, serum lipidand lipoprotein concentrations were measured. In addition, LDL,HDL, and VLDL particle sizes and particle concentrations of li-poprotein subclasses were analyzed by nuclear magnetic resonancespectroscopy.Results: No significant diet-induced changes in serum lipids andlipoproteins were found. Mean (�SD) serum LDL-cholesterol con-centrations were 3.79 � 0.91, 3.71 � 0.79, and 3.65 � 0.91 mmol/Lwith the high–stearic acid, high–oleic acid, and high–linoleic aciddiets, respectively (P � 0.137 for diet effects). Mean (�SD) HDL-cholesterol concentrations were 1.45 � 0.43, 1.46 � 0.45, and 1.46� 0.44 mmol/L (P � 0.866). LDL, HDL, and VLDL particle sizesand lipoprotein subclass distributions also did not differ significantlybetween the 3 diets.Conclusions: With realistic intakes of stearic, oleic, and linoleicacids, differences between their effects on the serum lipoproteinprofile are small. Am J Clin Nutr 2005;82:510–6.
KEY WORDS Stearic acid, oleic acid, linoleic acid, total cho-lesterol, LDL cholesterol, HDL cholesterol, lipoprotein profile, hu-mans
INTRODUCTION
It is well known that the various fatty acids in the diet exertdifferent effects on serum lipid and lipoprotein concentrations.Saturated fatty acids are thought to increase cardiovascular dis-ease risk because they elevate serum total and LDL-cholesterolconcentrations relative to monounsaturated and polyunsaturatedfatty acids. These effects have been quantified by earlier well-controlled dietary studies (1, 2). Relative to an isoenergeticamount of carbohydrates, a mixture of saturated fatty acids ele-vated serum total cholesterol concentrations, monounsaturated
fatty acids had comparable effects, and polyunsaturated fattyacids were hypocholesterolemic. In contrast with the other sat-urated fatty acids, stearic acid—a saturated fatty acid with 18carbon atoms—had no effects on serum total cholesterol con-centrations (1, 2). These earlier studies, however, did not exam-ine the effects of fatty acids on specific lipoproteins, which isimportant because of the opposing effects of LDL and HDLcholesterol on cardiovascular disease risk.
More recently, several studies have compared the effects ofstearic acid on lipid and lipoprotein concentrations with those ofunsaturated fatty acids. When stearic acid was substituted foroleic acid, effects on serum LDL- and HDL-cholesterol concen-trations did not differ (3). Also, with realistic intakes of linoleicacid (�13% of energy), oleic and linoleic acids had similareffects on the serum lipoprotein profile (4, 5). If these findings aretrue (3-5), then the consequence is that the effects of stearic,oleic, and linoleic acids on serum lipid and lipoprotein concen-trations would be comparable. To examine this hypothesis, wecompared the effects of diets enriched in these three 18-carbonfatty acids on serum concentrations of triacylglycerol and total,LDL, and HDL cholesterol in a controlled crossover study inhealthy subjects. In addition, we investigated the effects of thesediets on LDL, HDL, and VLDL particle sizes and on the subclassdistributions of these lipoprotein particles by nuclear magneticresonance (NMR) spectroscopy.
SUBJECTS AND METHODS
Subjects
Healthy male and female nonsmoking subjects were recruitedvia advertisements in local newspapers and in a university hos-pital newsletter and via posters in university buildings. Personswho were interested were informed about the purposes and re-quirements of the study and had to give their written informedconsent before entering the screening phase. At screening, 2fasting blood samples were taken for the measurement of serumlipid and lipoprotein concentrations and hematologic variables,
1 From the Department of Human Biology, Maastricht University, Maas-tricht, Netherlands.
2 Supported by the Dutch Dairy Association.3 Reprints not available. Address correspondence to MA Thijssen, Depart-
ment of Human Biology, Maastricht University, PO Box 616, 6200 MDMaastricht, Netherlands. E-mail: [email protected].
Received December 28, 2004.Accepted for publication May 11, 2005.
510 Am J Clin Nutr 2005;82:510–6. Printed in USA. © 2005 American Society for Clinical Nutrition
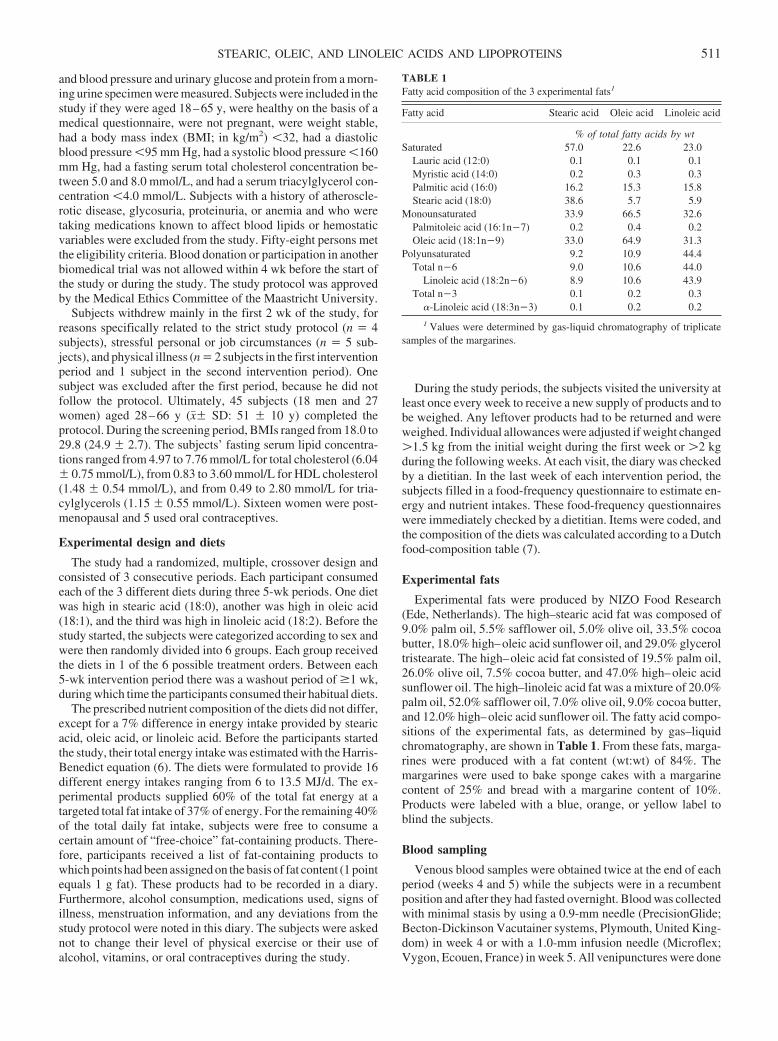
and blood pressure and urinary glucose and protein from a morn-ing urine specimen were measured. Subjects were included in thestudy if they were aged 18–65 y, were healthy on the basis of amedical questionnaire, were not pregnant, were weight stable,had a body mass index (BMI; in kg/m2) �32, had a diastolicblood pressure �95 mm Hg, had a systolic blood pressure �160mm Hg, had a fasting serum total cholesterol concentration be-tween 5.0 and 8.0 mmol/L, and had a serum triacylglycerol con-centration �4.0 mmol/L. Subjects with a history of atheroscle-rotic disease, glycosuria, proteinuria, or anemia and who weretaking medications known to affect blood lipids or hemostaticvariables were excluded from the study. Fifty-eight persons metthe eligibility criteria. Blood donation or participation in anotherbiomedical trial was not allowed within 4 wk before the start ofthe study or during the study. The study protocol was approvedby the Medical Ethics Committee of the Maastricht University.
Subjects withdrew mainly in the first 2 wk of the study, forreasons specifically related to the strict study protocol (n � 4subjects), stressful personal or job circumstances (n � 5 sub-jects), and physical illness (n � 2 subjects in the first interventionperiod and 1 subject in the second intervention period). Onesubject was excluded after the first period, because he did notfollow the protocol. Ultimately, 45 subjects (18 men and 27women) aged 28–66 y (x�� SD: 51 � 10 y) completed theprotocol. During the screening period, BMIs ranged from 18.0 to29.8 (24.9 � 2.7). The subjects’ fasting serum lipid concentra-tions ranged from 4.97 to 7.76 mmol/L for total cholesterol (6.04� 0.75 mmol/L), from 0.83 to 3.60 mmol/L for HDL cholesterol(1.48 � 0.54 mmol/L), and from 0.49 to 2.80 mmol/L for tria-cylglycerols (1.15 � 0.55 mmol/L). Sixteen women were post-menopausal and 5 used oral contraceptives.
Experimental design and diets
The study had a randomized, multiple, crossover design andconsisted of 3 consecutive periods. Each participant consumedeach of the 3 different diets during three 5-wk periods. One dietwas high in stearic acid (18:0), another was high in oleic acid(18:1), and the third was high in linoleic acid (18:2). Before thestudy started, the subjects were categorized according to sex andwere then randomly divided into 6 groups. Each group receivedthe diets in 1 of the 6 possible treatment orders. Between each5-wk intervention period there was a washout period of �1 wk,during which time the participants consumed their habitual diets.
The prescribed nutrient composition of the diets did not differ,except for a 7% difference in energy intake provided by stearicacid, oleic acid, or linoleic acid. Before the participants startedthe study, their total energy intake was estimated with the Harris-Benedict equation (6). The diets were formulated to provide 16different energy intakes ranging from 6 to 13.5 MJ/d. The ex-perimental products supplied 60% of the total fat energy at atargeted total fat intake of 37% of energy. For the remaining 40%of the total daily fat intake, subjects were free to consume acertain amount of “free-choice” fat-containing products. There-fore, participants received a list of fat-containing products towhich points had been assigned on the basis of fat content (1 pointequals 1 g fat). These products had to be recorded in a diary.Furthermore, alcohol consumption, medications used, signs ofillness, menstruation information, and any deviations from thestudy protocol were noted in this diary. The subjects were askednot to change their level of physical exercise or their use ofalcohol, vitamins, or oral contraceptives during the study.
During the study periods, the subjects visited the university atleast once every week to receive a new supply of products and tobe weighed. Any leftover products had to be returned and wereweighed. Individual allowances were adjusted if weight changed�1.5 kg from the initial weight during the first week or �2 kgduring the following weeks. At each visit, the diary was checkedby a dietitian. In the last week of each intervention period, thesubjects filled in a food-frequency questionnaire to estimate en-ergy and nutrient intakes. These food-frequency questionnaireswere immediately checked by a dietitian. Items were coded, andthe composition of the diets was calculated according to a Dutchfood-composition table (7).
Experimental fats
Experimental fats were produced by NIZO Food Research(Ede, Netherlands). The high–stearic acid fat was composed of9.0% palm oil, 5.5% safflower oil, 5.0% olive oil, 33.5% cocoabutter, 18.0% high–oleic acid sunflower oil, and 29.0% glyceroltristearate. The high–oleic acid fat consisted of 19.5% palm oil,26.0% olive oil, 7.5% cocoa butter, and 47.0% high–oleic acidsunflower oil. The high–linoleic acid fat was a mixture of 20.0%palm oil, 52.0% safflower oil, 7.0% olive oil, 9.0% cocoa butter,and 12.0% high–oleic acid sunflower oil. The fatty acid compo-sitions of the experimental fats, as determined by gas–liquidchromatography, are shown in Table 1. From these fats, marga-rines were produced with a fat content (wt:wt) of 84%. Themargarines were used to bake sponge cakes with a margarinecontent of 25% and bread with a margarine content of 10%.Products were labeled with a blue, orange, or yellow label toblind the subjects.
Blood sampling
Venous blood samples were obtained twice at the end of eachperiod (weeks 4 and 5) while the subjects were in a recumbentposition and after they had fasted overnight. Blood was collectedwith minimal stasis by using a 0.9-mm needle (PrecisionGlide;Becton-Dickinson Vacutainer systems, Plymouth, United King-dom) in week 4 or with a 1.0-mm infusion needle (Microflex;Vygon, Ecouen, France) in week 5. All venipunctures were done
TABLE 1Fatty acid composition of the 3 experimental fats1
Fatty acid Stearic acid Oleic acid Linoleic acid
% of total fatty acids by wtSaturated 57.0 22.6 23.0
Lauric acid (12:0) 0.1 0.1 0.1Myristic acid (14:0) 0.2 0.3 0.3Palmitic acid (16:0) 16.2 15.3 15.8Stearic acid (18:0) 38.6 5.7 5.9
Monounsaturated 33.9 66.5 32.6Palmitoleic acid (16:1n�7) 0.2 0.4 0.2Oleic acid (18:1n�9) 33.0 64.9 31.3
Polyunsaturated 9.2 10.9 44.4Total n�6 9.0 10.6 44.0
Linoleic acid (18:2n�6) 8.9 10.6 43.9Total n�3 0.1 0.2 0.3
�-Linoleic acid (18:3n�3) 0.1 0.2 0.2
1 Values were determined by gas-liquid chromatography of triplicatesamples of the margarines.
STEARIC, OLEIC, AND LINOLEIC ACIDS AND LIPOPROTEINS 511
by the same person, in the same room, and mostly at the sametime of the day.
For lipid and lipoprotein analyses, 10 mL blood was collectedinto a serum tube (Corvac; Becton Dickinson Vacutainer Sys-tems). At least 1 h after venipuncture, serum was obtained bycentrifugation at 3500 � g for 30 min at 4 °C and stored at�80 °C.
Lipids and apolipoproteins
Serum total cholesterol (ABX Diagnostics, Montpellier,France), HDL cholesterol (precipitation method; Roche Diag-nostics Corporation, Indianapolis, IN), and triacylglycerol(Sigma Aldrich Chemie, Steinheim, Germany) concentrationswere analyzed enzymatically. The within-run CVs were 1.3% fortotal cholesterol, 4.8% for HDL cholesterol, and 3.7% for tria-cylglycerols. LDL cholesterol was calculated by using the equa-tion of Friedewald (8).
Apolipoprotein (apo) A-I and apo B were measured in serumby using an immunoturbidimetric method (ABX Diagnostics).The within-run CVs for apo A-I and apo B were 0.9% and 1.2%,respectively. All samples from one subject were analyzed withinone run.
Serum concentrations of lipoprotein particles and their sub-classes and particle sizes of lipoproteins were analyzed in arandomly chosen subset (stratified for sex) of 22 subjects (9 menand 13 women) by NMR spectroscopy (Liposcience, Raleigh,NC) as previously described (9). Before NMR analysis, serumsamples from the end of each intervention period (weeks 4 and 5)were pooled.
Fatty acid composition
The fatty acid compositions of serum phospholipids in apooled sample from weeks 4 and 5 and of the margarines weredetermined as previously described (10). Briefly, total lipidswere extracted from 100 �L serum or 10 mg margarine accordingto the method of Bligh and Dyer (11). Aminopropyl-bondedsilica columns (Varian, Harbor City, CA) were used to separatephospholipids from the total lipid extract of serum (12). Thephospholipids from the serum and the triacylglycerols from themargarines were then saponified, and the resultant fatty acidswere methylated into their corresponding fatty acid methyl esters(FAMEs) (13). Fatty acids were separated on an Autosystem(Perkin-Elmer, Norwalk, CT) gas chromatograph that was fittedwith a silica-gel column (Cp-sil 88 for FAME, 50 m � 0.25 mm,0.2-�m film thickness; Chrompack, Middelburg, Netherlands)with helium gas (130 kPa) as the carrier gas (10). A comparableprotocol was used to separate the FAMEs from the triacylglyc-erols. For triacylglycerols, the injection and detection tempera-tures were both 300 °C. The starting temperature of the columnwas 160 °C. Ten minutes after injection, the temperature wasincreased up to 190 °C at a rate of 2.5 °C/min. After 20 min at190 °C, the temperature was increased up to 230 °C at a rate of4 °C/min. The final temperature of 230 °C was maintained for10 min.
Data were analyzed by using CHROMCARD software (ver-sion 1.21; CE Instruments, Milan, Italy). The fatty acid compo-sitions of the margarines and serum phospholipids are expressedin relative amounts (% of total fatty acids identified; wt:wt).
Statistics
For serum lipids and lipoproteins, the results of the 2 serumsamples from weeks 4 and 5 were averaged before the statisticalanalyses. The statistical power to detect a true difference in totalcholesterol of 0.21 mmol/L, in LDL cholesterol of 0.17 mmol/L,and in HDL cholesterol of 0.06 mmol/L was �80%. The datawere analyzed with the general linear model procedure of theSPSS 11 for MacIntosh OS X package. A P value � 0.05 wasconsidered statistically significant. Differences in effects on lipidand lipoprotein concentrations were examined with diet and pe-riod as fixed factors and subject number as a random factor. Toanalyze whether the effects of diet were modified by sex or BMI,the diet � sex or diet � BMI interaction terms were added to themodel as fixed factors. To examine the effects of BMI, the sub-jects were divided into 2 groups. One group consisted of subjectswith a BMI � 25 (n � 25) and the other group of subjects witha BMI � 25 (n � 20). When the analyses indicated a significanteffect of diet, the diets were compared pairwise. When the inter-action terms diet � sex or diet � BMI were significant, the dietswere compared pairwise for the 2 sex or BMI groups separately.Between-diets comparisons were corrected for 3-group compar-isons by the Bonferroni correction; 95% CIs were calculated forthe differences between the diets. Values are presented as means� SDs. Pearson’s correlations were determined to examine lin-ear relations between variables.
RESULTS
Diets and dietary adherence
The mean daily energy intake and the composition of the 3diets, as determined by the food-frequency questionnaires (Ta-ble 2), agreed well with the prescribed composition of the diets.Intakes of test products (bread, cake, and margarines) did notdiffer between diets. Total fat intake, on average, was 38% ofenergy and did not differ between the 3 diets (P � 0.701). Thenutrient composition of the diets also did not differ, except that7% of energy was provided by different fats: stearic, oleic, orlinoleic acid. Because of minor differences in the fatty acid com-position of the experimental fats, the estimated intakes of�-linolenic acid were, respectively, 0.02% (P � 0.214) and0.03% (P � 0.004) of energy higher with the oleic acid andlinoleic acid diets than with the stearic acid diet. The meanamount of fat consumed as free-choice fat-containing productsdenoted in the subjects’ diaries was 41.5% of total fat intake. Thisagreed well with the intended amount of 40%.
Mean body weights at the end of each dietary period did notdiffer significantly between the 3 diets (P � 0.449) and were 72.5� 13.0 kg with the stearic acid diet, 72.5 � 13.2 kg with the oleicacid diet, and 72.7 � 12.9 kg with the linoleic acid diet.
Dietary adherence was confirmed by the fatty acid composi-tions of serum phospholipids (Table 3). During the stearic aciddiet, the proportion of stearic acid was increased mainly at theexpense of oleic acid. Likewise, the proportion of oleic acidincreased after consumption of the oleic acid diet, mainly at theexpense of stearic acid. During the diet rich in linoleic acid, theproportion of linoleic acid increased, whereas those of�-linolenic acid, eicosapentaenoic acid, oleic acid, and stearicacid decreased.
512 THIJSSEN ET AL
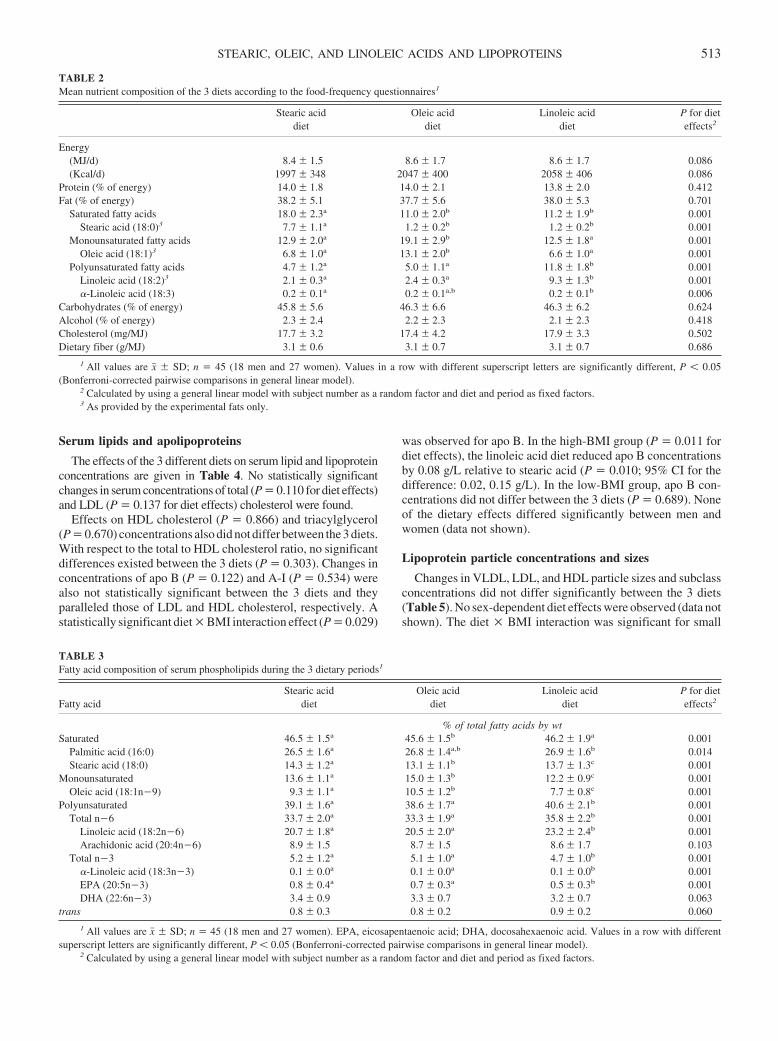
Serum lipids and apolipoproteins
The effects of the 3 different diets on serum lipid and lipoproteinconcentrations are given in Table 4. No statistically significantchanges in serum concentrations of total (P � 0.110 for diet effects)and LDL (P � 0.137 for diet effects) cholesterol were found.
Effects on HDL cholesterol (P � 0.866) and triacylglycerol(P � 0.670) concentrations also did not differ between the 3 diets.With respect to the total to HDL cholesterol ratio, no significantdifferences existed between the 3 diets (P � 0.303). Changes inconcentrations of apo B (P � 0.122) and A-I (P � 0.534) werealso not statistically significant between the 3 diets and theyparalleled those of LDL and HDL cholesterol, respectively. Astatistically significant diet � BMI interaction effect (P � 0.029)
was observed for apo B. In the high-BMI group (P � 0.011 fordiet effects), the linoleic acid diet reduced apo B concentrationsby 0.08 g/L relative to stearic acid (P � 0.010; 95% CI for thedifference: 0.02, 0.15 g/L). In the low-BMI group, apo B con-centrations did not differ between the 3 diets (P � 0.689). Noneof the dietary effects differed significantly between men andwomen (data not shown).
Lipoprotein particle concentrations and sizes
Changes in VLDL, LDL, and HDL particle sizes and subclassconcentrations did not differ significantly between the 3 diets(Table 5). No sex-dependent diet effects were observed (data notshown). The diet � BMI interaction was significant for small
TABLE 2Mean nutrient composition of the 3 diets according to the food-frequency questionnaires1
Stearic aciddiet
Oleic aciddiet
Linoleic aciddiet
P for dieteffects2
Energy(MJ/d) 8.4 � 1.5 8.6 � 1.7 8.6 � 1.7 0.086(Kcal/d) 1997 � 348 2047 � 400 2058 � 406 0.086
Protein (% of energy) 14.0 � 1.8 14.0 � 2.1 13.8 � 2.0 0.412Fat (% of energy) 38.2 � 5.1 37.7 � 5.6 38.0 � 5.3 0.701
Saturated fatty acids 18.0 � 2.3a 11.0 � 2.0b 11.2 � 1.9b 0.001Stearic acid (18:0)3 7.7 � 1.1a 1.2 � 0.2b 1.2 � 0.2b 0.001
Monounsaturated fatty acids 12.9 � 2.0a 19.1 � 2.9b 12.5 � 1.8a 0.001Oleic acid (18:1)3 6.8 � 1.0a 13.1 � 2.0b 6.6 � 1.0a 0.001
Polyunsaturated fatty acids 4.7 � 1.2a 5.0 � 1.1a 11.8 � 1.8b 0.001Linoleic acid (18:2)3 2.1 � 0.3a 2.4 � 0.3a 9.3 � 1.3b 0.001�-Linoleic acid (18:3) 0.2 � 0.1a 0.2 � 0.1a,b 0.2 � 0.1b 0.006
Carbohydrates (% of energy) 45.8 � 5.6 46.3 � 6.6 46.3 � 6.2 0.624Alcohol (% of energy) 2.3 � 2.4 2.2 � 2.3 2.1 � 2.3 0.418Cholesterol (mg/MJ) 17.7 � 3.2 17.4 � 4.2 17.9 � 3.3 0.502Dietary fiber (g/MJ) 3.1 � 0.6 3.1 � 0.7 3.1 � 0.7 0.686
1 All values are x� � SD; n � 45 (18 men and 27 women). Values in a row with different superscript letters are significantly different, P � 0.05(Bonferroni-corrected pairwise comparisons in general linear model).
2 Calculated by using a general linear model with subject number as a random factor and diet and period as fixed factors.3 As provided by the experimental fats only.
TABLE 3Fatty acid composition of serum phospholipids during the 3 dietary periods1
Fatty acidStearic acid
dietOleic acid
dietLinoleic acid
dietP for dieteffects2
% of total fatty acids by wtSaturated 46.5 � 1.5a 45.6 � 1.5b 46.2 � 1.9a 0.001
Palmitic acid (16:0) 26.5 � 1.6a 26.8 � 1.4a,b 26.9 � 1.6b 0.014Stearic acid (18:0) 14.3 � 1.2a 13.1 � 1.1b 13.7 � 1.3c 0.001
Monounsaturated 13.6 � 1.1a 15.0 � 1.3b 12.2 � 0.9c 0.001Oleic acid (18:1n�9) 9.3 � 1.1a 10.5 � 1.2b 7.7 � 0.8c 0.001
Polyunsaturated 39.1 � 1.6a 38.6 � 1.7a 40.6 � 2.1b 0.001Total n�6 33.7 � 2.0a 33.3 � 1.9a 35.8 � 2.2b 0.001
Linoleic acid (18:2n�6) 20.7 � 1.8a 20.5 � 2.0a 23.2 � 2.4b 0.001Arachidonic acid (20:4n�6) 8.9 � 1.5 8.7 � 1.5 8.6 � 1.7 0.103
Total n�3 5.2 � 1.2a 5.1 � 1.0a 4.7 � 1.0b 0.001�-Linoleic acid (18:3n�3) 0.1 � 0.0a 0.1 � 0.0a 0.1 � 0.0b 0.001EPA (20:5n�3) 0.8 � 0.4a 0.7 � 0.3a 0.5 � 0.3b 0.001DHA (22:6n�3) 3.4 � 0.9 3.3 � 0.7 3.2 � 0.7 0.063
trans 0.8 � 0.3 0.8 � 0.2 0.9 � 0.2 0.060
1 All values are x� � SD; n � 45 (18 men and 27 women). EPA, eicosapentaenoic acid; DHA, docosahexaenoic acid. Values in a row with differentsuperscript letters are significantly different, P � 0.05 (Bonferroni-corrected pairwise comparisons in general linear model).
2 Calculated by using a general linear model with subject number as a random factor and diet and period as fixed factors.
STEARIC, OLEIC, AND LINOLEIC ACIDS AND LIPOPROTEINS 513
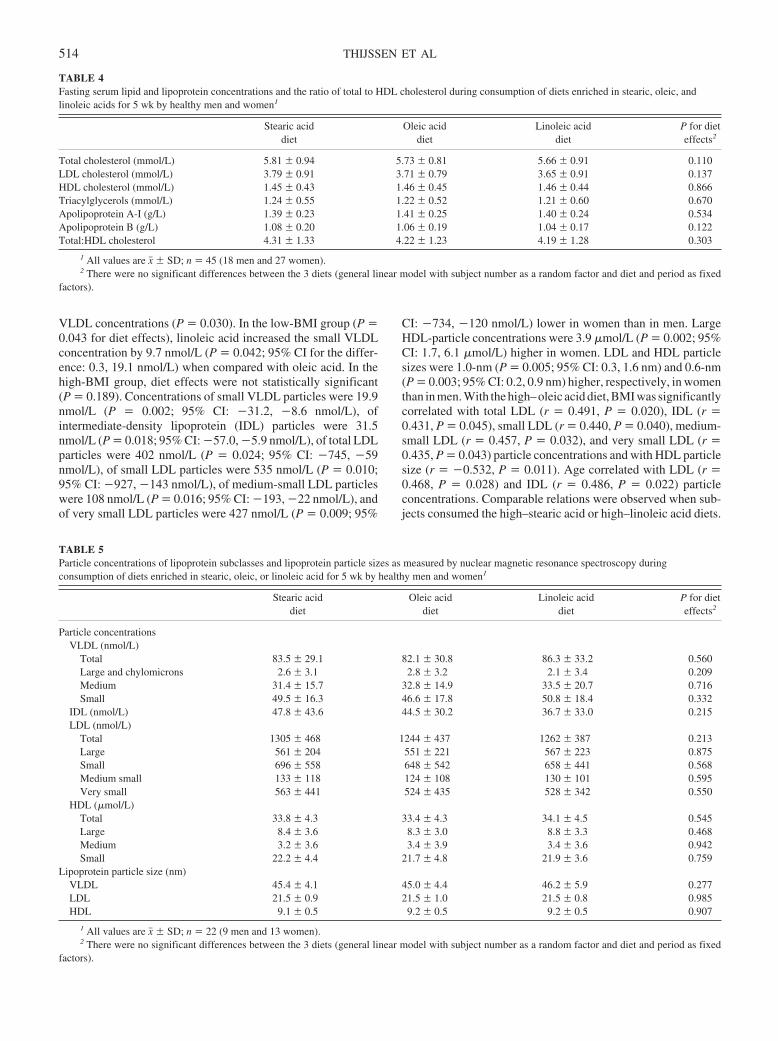
VLDL concentrations (P � 0.030). In the low-BMI group (P �0.043 for diet effects), linoleic acid increased the small VLDLconcentration by 9.7 nmol/L (P � 0.042; 95% CI for the differ-ence: 0.3, 19.1 nmol/L) when compared with oleic acid. In thehigh-BMI group, diet effects were not statistically significant(P � 0.189). Concentrations of small VLDL particles were 19.9nmol/L (P � 0.002; 95% CI: �31.2, �8.6 nmol/L), ofintermediate-density lipoprotein (IDL) particles were 31.5nmol/L (P � 0.018; 95% CI: �57.0, �5.9 nmol/L), of total LDLparticles were 402 nmol/L (P � 0.024; 95% CI: �745, �59nmol/L), of small LDL particles were 535 nmol/L (P � 0.010;95% CI: �927, �143 nmol/L), of medium-small LDL particleswere 108 nmol/L (P � 0.016; 95% CI: �193, �22 nmol/L), andof very small LDL particles were 427 nmol/L (P � 0.009; 95%
CI: �734, �120 nmol/L) lower in women than in men. LargeHDL-particle concentrations were 3.9 �mol/L (P � 0.002; 95%CI: 1.7, 6.1 �mol/L) higher in women. LDL and HDL particlesizes were 1.0-nm (P � 0.005; 95% CI: 0.3, 1.6 nm) and 0.6-nm(P � 0.003; 95% CI: 0.2, 0.9 nm) higher, respectively, in womenthan in men. With the high–oleic acid diet, BMI was significantlycorrelated with total LDL (r � 0.491, P � 0.020), IDL (r �0.431, P � 0.045), small LDL (r � 0.440, P � 0.040), medium-small LDL (r � 0.457, P � 0.032), and very small LDL (r �0.435, P � 0.043) particle concentrations and with HDL particlesize (r � �0.532, P � 0.011). Age correlated with LDL (r �0.468, P � 0.028) and IDL (r � 0.486, P � 0.022) particleconcentrations. Comparable relations were observed when sub-jects consumed the high–stearic acid or high–linoleic acid diets.
TABLE 4Fasting serum lipid and lipoprotein concentrations and the ratio of total to HDL cholesterol during consumption of diets enriched in stearic, oleic, andlinoleic acids for 5 wk by healthy men and women1
Stearic aciddiet
Oleic aciddiet
Linoleic aciddiet
P for dieteffects2
Total cholesterol (mmol/L) 5.81 � 0.94 5.73 � 0.81 5.66 � 0.91 0.110LDL cholesterol (mmol/L) 3.79 � 0.91 3.71 � 0.79 3.65 � 0.91 0.137HDL cholesterol (mmol/L) 1.45 � 0.43 1.46 � 0.45 1.46 � 0.44 0.866Triacylglycerols (mmol/L) 1.24 � 0.55 1.22 � 0.52 1.21 � 0.60 0.670Apolipoprotein A-I (g/L) 1.39 � 0.23 1.41 � 0.25 1.40 � 0.24 0.534Apolipoprotein B (g/L) 1.08 � 0.20 1.06 � 0.19 1.04 � 0.17 0.122Total:HDL cholesterol 4.31 � 1.33 4.22 � 1.23 4.19 � 1.28 0.303
1 All values are x� � SD; n � 45 (18 men and 27 women).2 There were no significant differences between the 3 diets (general linear model with subject number as a random factor and diet and period as fixed
factors).
TABLE 5Particle concentrations of lipoprotein subclasses and lipoprotein particle sizes as measured by nuclear magnetic resonance spectroscopy duringconsumption of diets enriched in stearic, oleic, or linoleic acid for 5 wk by healthy men and women1
Stearic aciddiet
Oleic aciddiet
Linoleic aciddiet
P for dieteffects2
Particle concentrationsVLDL (nmol/L)
Total 83.5 � 29.1 82.1 � 30.8 86.3 � 33.2 0.560Large and chylomicrons 2.6 � 3.1 2.8 � 3.2 2.1 � 3.4 0.209Medium 31.4 � 15.7 32.8 � 14.9 33.5 � 20.7 0.716Small 49.5 � 16.3 46.6 � 17.8 50.8 � 18.4 0.332
IDL (nmol/L) 47.8 � 43.6 44.5 � 30.2 36.7 � 33.0 0.215LDL (nmol/L)
Total 1305 � 468 1244 � 437 1262 � 387 0.213Large 561 � 204 551 � 221 567 � 223 0.875Small 696 � 558 648 � 542 658 � 441 0.568Medium small 133 � 118 124 � 108 130 � 101 0.595Very small 563 � 441 524 � 435 528 � 342 0.550
HDL (�mol/L)Total 33.8 � 4.3 33.4 � 4.3 34.1 � 4.5 0.545Large 8.4 � 3.6 8.3 � 3.0 8.8 � 3.3 0.468Medium 3.2 � 3.6 3.4 � 3.9 3.4 � 3.6 0.942Small 22.2 � 4.4 21.7 � 4.8 21.9 � 3.6 0.759
Lipoprotein particle size (nm)VLDL 45.4 � 4.1 45.0 � 4.4 46.2 � 5.9 0.277LDL 21.5 � 0.9 21.5 � 1.0 21.5 � 0.8 0.985HDL 9.1 � 0.5 9.2 � 0.5 9.2 � 0.5 0.907
1 All values are x� � SD; n � 22 (9 men and 13 women).2 There were no significant differences between the 3 diets (general linear model with subject number as a random factor and diet and period as fixed
factors).
514 THIJSSEN ET AL
DISCUSSION
In this well-controlled crossover study of healthy subjects, wefound that the differences in effects of stearic, oleic, and linoleicacids on the serum lipoprotein profile were less than expected.Although total and LDL-cholesterol concentrations tended todecrease with the increasing degree of unsaturation, the changesbetween the 3 diets were not significant. Based on the classicequations derived by Keys et al (1), a decrease of 0.21 mmol/L intotal cholesterol concentrations is expected when 7% of energyfrom stearic acid or oleic acid in the diet is exchanged for linoleicacid. However, we found decreases of 0.15 and 0.07 mmol/L,respectively.
Until now, only a few studies have examined simultaneouslythe effects of stearic acid, oleic acid, and linoleic acid. Consistentwith our results, Hunter et al (14) found no differences in theeffects of these fatty acids on plasma total or LDL-cholesterolconcentrations. However, only 6 healthy male subjects partici-pated in that study, and the statistical power may have been toolow to detect any changes. Kris-Etherton et al (15) examined in19 young men the effects of natural edible fats and oils rich instearic acid (cocoa butter), oleic acid (olive oil), or linoleic acid(soybean oil) on the serum lipoprotein profile. It was found thatthe diet rich in linoleic acid significantly lowered serum totalcholesterol concentrations relative to stearic acid or oleic acid. Inaddition, the LDL-cholesterol concentration was lower with thediet rich in linoleic acid than with the diet rich in stearic acid. Apossible explanation for these apparent discrepancies with ourresults might be that, in their study, �10% of energy from stearicacid and �16% of energy from oleic acid was exchanged forlinoleic acid. The expected decreases in total and LDL-cholesterol concentrations were therefore greater. In that study(15), the high–oleic acid diet also decreased total and LDL-cholesterol concentrations significantly more than did the high–stearic acid diet. The difference in response between these 2 dietscan at least partly be explained by the higher intake of palmiticacid from the diet rich in stearic acid. Palmitic acid is known toincrease serum total and LDL-cholesterol concentrations relativeto stearic or oleic acid (3, 16).
Our results agree with the many studies that compared stearicacid with oleic acid (3) or oleic acid with linoleic acid (4, 5, 17,18) and also found no different effects on the serum lipoproteinprofile. In one study, however, an exchange of 8% of energy fromstearic acid for oleic acid significantly decreased serum LDLcholesterol by 0.15 mmol/L. Surprisingly, no effects on apo Bconcentrations were found (19). In addition, Zock and Katan (20)found that when 8% of energy from stearic acid was replaced bylinoleic acid, the linoleic acid diet significantly decreased serumLDL cholesterol by 0.17 mmol/L. When expressed as a percent-age of energy, however, their effects did not differ from those inour study.
In a recent meta-analysis, equations were developed to de-scribe the effects of individual fatty acids on serum lipids andlipoproteins (21). On the basis of these equations, replacement of7% of energy from stearic acid by oleic acid may result in adecrease in LDL-cholesterol concentrations of 0.04 mmol/L anda decrease of 0.11 mmol/L when replaced by linoleic acid. Theseestimates agree well with the observed differences in LDL-cholesterol concentrations of �0.08 mmol/L between the dietsenriched in stearic and oleic acids and of �0.14 mmol/L betweenthe diets high in stearic acid and linoleic acid. The power of our
study to pick up this latter difference was 60%. Taken together,evidence continues to accumulate to suggest that the earlier for-mulas (1, 2) overestimate the effects of linoleic acid on serumtotal cholesterol concentrations.
On the basis of the earlier meta-analysis (21), decreases inHDL-cholesterol concentrations of 0.04 mmol/L were predictedwhen oleic acid was replaced by stearic acid, and of 0.03 mmol/Lwhen stearic acid was exchanged for linoleic acid. In our study,however, decreases were slightly, but not significantly, lowerwhen stearic acid replaced either oleic or linoleic acid. Otherstudies also reported no differential effects of oleic and linoleicacids on HDL-cholesterol concentrations (4, 5, 14, 15). In con-trast, some studies have reported that linoleic acid decreasesHDL-cholesterol concentrations relative to oleic acid (17, 18).Zock and Katan (20) reported a decrease in HDL cholesterolwhen linoleic acid was exchanged for stearic acid, whereas Juddet al (19) reported a decrease when oleic acid was replaced forstearic acid. A nonsignificant decrease was also observed byBonanome and Grundy (3). Thus, these 3 studies suggest thatstearic acid may lower HDL cholesterol relative to oleic andlinoleic acids, which is not supported by our results or the studiesthat simultaneously compared stearic, oleic, and linoleic acids(14, 15). In the 3 other studies, stearic acid was largely providedby interesterified and hydrogenated synthetic fats (3, 19, 20). Inthese fats, stearic acid was not only located at the sn-1 and sn-3positions, as is the case in natural fats, but also at the sn-2 position(22). Because of these stereospecific distributions, it is possiblethat the effects of natural fats rich in stearic acid on the serumlipoprotein profile are different from those of synthetic fats. Thissuggestion, however, requires further investigation.
No differential effects of stearic acid, oleic acid, or linoleicacid were found on lipoprotein particle sizes and concentrations.As is true for small, dense LDL particles (23, 24), small HDLparticles (25, 26) are positively associated with increased car-diovascular disease risk. Therefore, we also examined the effectsof stearic, oleic, and linoleic acids on LDL, HDL, and VLDLparticle size and subclass particle concentrations by using NMRspectroscopy. Until now, only a few studies have examined theeffects of the quality of dietary fat on lipoprotein particle sizes orsubclass distributions of lipoprotein particles. Relative to satu-rated fat, monounsaturated and n�6 and n�3 polyunsaturatedfatty acids slightly but significantly decreased LDL particle size(27). In contrast, in another study no significant changes in LDLparticle size were observed when saturated fatty acids were ex-changed for monounsaturated fatty acids (28). Unfortunately, nodetails about the individual saturated fatty acid composition ofthe diets were given. Observed differences in particle sizes andparticle concentrations between men and women in our studyagreed well with those of The Framingham Offspring Study, inwhich these variables were measured in a large group of 1574men and 1692 women (9).
In summary, the effects of stearic acid, oleic acid, and linoleicacid on LDL-cholesterol concentrations were less than expected.Effects on HDL-cholesterol and triacylglycerol concentrationsas well as the size and the concentration of the lipoprotein particlesalso did not differ significantly between diets. These findings, how-ever, do not imply that these three 18-carbon fatty acids can beexchanged without affecting cardiovascular disease risk, becauseother cardiovascular disease risk markers (eg, hemostatic func-tion, oxidative stress, and low-grade inflammation) are also in-fluenced by the fatty acid composition of the diet.
STEARIC, OLEIC, AND LINOLEIC ACIDS AND LIPOPROTEINS 515
We appreciated the support of the members of our dietary and technicalstaff and thank all participants for their cooperation and interest.
MAT and RPM were responsible for the design of the study and thecollection and analysis of the data. Both authors wrote the manuscript. Noneof the authors had any conflict of interest in any company or organizationsponsoring the research, including advisory board affiliations.
REFERENCES1. Keys A, Anderson JT, Grande F. Serum cholesterol response to changes
in the diet. IV. Particular saturated fatty acids in the diet. Metabolism1965;14:776–87.
2. Hegsted DM, McGandy RB, Myers ML, Stare FJ. Quantitative effects ofdietary fat on serum cholesterol in man. Am J Clin Nutr 1965;17:281–95.
3. Bonanome A, Grundy SM. Effect of dietary stearic acid on plasmacholesterol and lipoprotein levels. N Engl J Med 1988;318:1244–8.
4. Mensink RP, Katan MB. Effect of a diet enriched with monounsaturatedor polyunsaturated fatty acids on levels of low-density and high-densitylipoprotein cholesterol in healthy women and men. N Engl J Med 1989;321:436–41.
5. Howard BV, Hannah JS, Heiser CC, et al. Polyunsaturated fatty acidsresult in greater cholesterol lowering and less triacylglycerol elevationthan do monounsaturated fatty acids in a dose-response comparison in amultiracial study group. Am J Clin Nutr 1995;62:392–402.
6. Harris J, Benedict F. A biometric study of basal metabolism in man.Washington, DC: Carnegie Institute of Washington, 1919.
7. Voedingsstoffenbestand SN. NEVO tabel, Nederlands voedingsstoffen-bestand. (Dutch food composition table.) Den Haag, Netherlands: Voor-lichtingsbureau voor de voeding, 1996:1–235 (in Dutch).
8. Friedewald WT, Levy RI, Fredrickson DS. Estimation of the concen-tration of low-density lipoprotein cholesterol in plasma, without use ofthe preparative ultracentrifuge. Clin Chem 1972;18:499–502.
9. Freedman DS, Otvos JD, Jeyarajah EJ, et al. Sex and age differences inlipoprotein subclasses measured by nuclear magnetic resonance spec-troscopy: the Framingham Study. Clin Chem 2004;50:1189–200.
10. Wensing AG, Mensink RP, Hornstra G. Effects of dietary n�3 polyun-saturated fatty acids from plant and marine origin on platelet aggregationin healthy elderly subjects. Br J Nutr 1999;82:183–91.
11. Bligh EG, Dyer WJ. A rapid method of total lipid extraction and puri-fication. Can J Biochem Physiol 1959;37:911–7.
12. Kaluzny MA, Duncan LA, Merritt MV, Epps DE. Rapid separation oflipid classes in high yield and purity using bonded phase columns. J LipidRes 1985;26:135–40.
13. Morrison WR, Smith LM. Preparation of fatty acid methyl esters anddimethylacetals from lipids with boron fluoride-methanol. J Lipid Res1964;5:600–8.
14. Hunter KA, Crosbie LC, Weir A, Miller GJ, Dutta-Roy AK. A residentialstudy comparing the effects of diets rich in stearic acid, oleic acid, and
linoleic acid on fasting blood lipids, hemostatic variables and platelets inyoung healthy men. J Nutr Biochem 2000;11:408–16.
15. Kris-Etherton PM, Derr J, Mitchell DC, et al. The role of fatty acidsaturation on plasma lipids, lipoproteins, and apolipoproteins: I. Effectsof whole food diets high in cocoa butter, olive oil, soybean oil, dairybutter, and milk chocolate on the plasma lipids of young men. Metabo-lism 1993;42:121–9.
16. Temme EH, Mensink RP, Hornstra G. Comparison of the effects of dietsenriched in lauric, palmitic, or oleic acids on serum lipids and lipopro-teins in healthy women and men. Am J Clin Nutr 1996;63:897–903.
17. Mattson FH, Grundy SM. Comparison of effects of dietary saturated,monounsaturated, and polyunsaturated fatty acids on plasma lipids andlipoproteins in man. J Lipid Res 1985;26:194–202.
18. Hodson L, Skeaff CM, Chisholm WA. The effect of replacing dietarysaturated fat with polyunsaturated or monounsaturated fat on plasmalipids in free-living young adults. Eur J Clin Nutr 2001;55:908–15.
19. Judd JT, Baer DJ, Clevidence BA, Kris-Etherton P, Muesing RA, IwaneM. Dietary cis and trans monounsaturated and saturated FA and plasmalipids and lipoproteins in men. Lipids 2002;37:123–31.
20. Zock PL, Katan MB. Hydrogenation alternatives: effects of trans fattyacids and stearic acid versus linoleic acid on serum lipids and lipopro-teins in humans. J Lipid Res 1992;33:399–410.
21. Mensink RP, Zock PL, Kester AD, Katan MB. Effects of dietary fattyacids and carbohydrates on the ratio of serum total to HDL cholesteroland on serum lipids and apolipoproteins: a meta-analysis of 60 controlledtrials. Am J Clin Nutr 2003;77:1146–55.
22. Hunter JE. Studies on effects of dietary fatty acids as related to theirposition on triglycerides. Lipids 2001;36:655–68.
23. Griffin BA, Freeman DJ, Tait GW, et al. Role of plasma triglyceride inthe regulation of plasma low density lipoprotein (LDL) subfractions:relative contribution of small, dense LDL to coronary heart disease risk.Atherosclerosis 1994;106:241–53.
24. Gardner CD, Fortmann SP, Krauss RM. Association of small low-density lipoprotein particles with the incidence of coronary artery dis-ease in men and women. JAMA 1996;276:875–81.
25. Cheung MC, Brown BG, Wolf AC, Albers JJ. Altered particle sizedistribution of apolipoprotein A-I-containing lipoproteins in subjectswith coronary artery disease. J Lipid Res 1991;32:383–94.
26. Freedman DS, Otvos JD, Jeyarajah EJ, Barboriak JJ, Anderson AJ,Walker JA. Relation of lipoprotein subclasses as measured by protonnuclear magnetic resonance spectroscopy to coronary artery disease.Arterioscler Thromb Vasc Biol 1998;18:1046–53.
27. Kratz M, Gulbahce E, von Eckardstein A, et al. Dietary mono- andpolyunsaturated fatty acids similarly affect LDL size in healthy men andwomen. J Nutr 2002;132:715–8.
28. Rivellese AA, Maffettone A, Vessby B, et al. Effects of dietary saturated,monounsaturated and n�3 fatty acids on fasting lipoproteins, LDL sizeand post-prandial lipid metabolism in healthy subjects. Atherosclerosis2003;167:149–58.
516 THIJSSEN ET AL
Hypovitaminosis D is associated with reductions in serumapolipoprotein A-I but not with fasting lipids in BritishBangladeshis1–3
W Garry John, Kate Noonan, Nasima Mannan, and Barbara J Boucher
ABSTRACTBackground: Although hypovitaminosis D has been suggested toincrease the risk of heart disease, its relation to components of thefasting lipid profile has not been clarified for specific ethnic groups.Objective: The objective was to determine the relation of circulating25-hydroxyvitamin D [25(OH)D] concentrations to fasting lipidconcentrations in South Asian subjects at risk of hypovitaminosis D.Design: The present study was conducted in 170 British Bang-ladeshi adults, 69 men and 101 women, from east London who werefree of known diabetes or chronic disorders. Vitamin D repletion wasassessed by measuring fasting serum 25(OH)D concentrations. Fast-ing lipid profiles were measured as part of a study of the risk factorsfor type 2 diabetes and ischemic heart disease, which included hy-povitaminosis D.Results: A univariate analysis showed that total cholesterol, LDLcholesterol, and both apolipoprotein (apo) A-I and apo B concen-trations correlated directly with serum 25(OH)D concentrations.However, a multiple regression analysis, which included all thedocumented risk factors for diabetes and ischemic heart disease,showed that the 25(OH)D concentration (vitamin D status) was anindependent predictor of increasing apo A-I concentrations (stan-dardized coefficient � � 0.3; P � 0.001) but not of fasting lipidconcentrations.Conclusions: In this study of British South Asians, the data showeda positive relation of fasting apo A-I concentrations to serum25(OH)D concentrations, independent of glycemia and other di-etary, anthropometric, and lifestyle risk factors for type 2 diabetesand ischemic heart disease after multiple regression analyses. Sub-jects with hypovitaminosis D are likely to have an increased risk ofischemic heart disease independent of their increased risk of type 2diabetes. Am J Clin Nutr 2005;82:517–22.
KEY WORDS Vitamin D, fasting lipids, hypovitaminosis D,triacylglycerol, cholesterol, apolipoprotein A-I, apolipoprotein B,HDL cholesterol, LDL cholesterol, South Asians
INTRODUCTION
Vitamin D repletion is achieved by environmental factors,such as exposure to ultraviolet light and consumption of foodsrich in fat-soluble vitamin D (eg, oily sea fish, meat, and eggs),and can be assessed by measurement of the concentration ofserum 25-hydroxyvitamin D [25(OH)D] (1–3). Hypovitamino-sis D is common in the Northern Hemisphere of the Westernworld but is also becoming increasingly common in the Southern
Hemisphere because of changes in lifestyle, such as workingindoors, wearing occlusive clothing, and increasing the use ofsunscreen creams. Vitamin D deficiency is a risk factor for os-teoporosis, certain cancers, type 1 diabetes, and hypertension.The association of vitamin D deficiency with ischemic heartdisease (IHD) may be partly attributable to its association withthe metabolic syndrome (4–6). The reductions in insulin secre-tion and insulin sensitivity that are found in persons with hypo-vitaminosis D, and the improvements in these abnormalities seenafter vitamin D repletion, may explain the association with IHD,because IHD is increased in relation to glycemia in nondiabeticpatients as well as in patients with diabetes (7–11). The reductionin the risk of type 2 diabetes and of IHD with increased fishconsumption, especially consumption of oily fish, and the asso-ciated improvements in fasting lipid profiles are usually attrib-uted to increases in the consumption of n�3 fatty acids (12, 13)but may also reflect any benefits from increased vitamin D intake(4). Hypovitaminosis D has also been reported to be associatedwith increased total cholesterol concentrations and with reducedapolipoprotein (apo) A-I concentrations in Belgian men (14, 15).Abnormal glucose tolerance adversely affects fasting lipid pro-files, and some studies suggest that diabetes can also lower cir-culating 25(OH)D concentrations (16). More recently, hypovi-taminosis D was shown to be associated not only with loweredinsulin secretion and sensitivity but also with adverse effects onboth total cholesterol and LDL-cholesterol concentrations in astudy of healthy men and women from several racial and ethnicgroups (8). Thus, hypovitaminosis D appears to be directly as-sociated with adverse effects on lipid profiles independent of anyadverse effects that might result from the increased risk of type2 diabetes.
Because few studies of the relation between fasting lipid pro-files and vitamin D status have been done, we report our findings
1 From the Centre for Diabetes and Metabolic Medicine, Queen MarySchool of Medicine and Dentistry, University of London, London, UnitedKingdom (NM and BJB), and the Department of Clinical Chemistry, Bart’sand The London NHS Trust, London, United Kingdom (WGJ and KN).
2 Supported by a grant from the North East- (later North-) Thames NHSResearch & Development Directorate, London.
3 Reprints not available. Address correspondence to BJ Boucher, Depart-ment of Diabetes and Metabolic Medicine, Royal London Hospital, London,E11BB, United Kingdom. E-mail: [email protected].
Received January 18, 2005.Accepted for publication June 1, 2005.
517Am J Clin Nutr 2005;82:517–22. Printed in USA. © 2005 American Society for Clinical Nutrition
in a group of British South Asians who were of Bangladeshiorigin and were selected as being free of known diabetes and inwhom we have already shown an association between increasedinflammatory activity, in terms of circulating concentrations ofboth sensitive C-reactive protein and matrix metalloproteinase 9,and hypovitaminosis D (17).
SUBJECTS AND METHODS
Subjects
The present study was conducted in British men and women ofBangladeshi origin aged 35–65 y who were free of known dia-betes, IHD, hypertension, or other ongoing illness. The subjectswere recruited randomly during visits to their family physician’soffices with relatives or for minor intercurrent illness. The sub-jects gave informed consent both verbally and in writing for astudy that was designed to examine the effect of vitamin Dsupplementation on the development of type 2 diabetes in sub-jects who were at the upper range of normoglycemia and were athigh risk of vitamin D deficiency. The subjects who gave in-formed consent and who were defined as being at risk of diabeteswere assessed as previously described (17, 18). Diabetes risk wasdefined as a random blood glucose concentration (which wasmeasured with the use of a point-of-care hexokinase method andwas validated with the use of standard autoanalyzer methods) of�6.4 mmol/L �2 h after food ingestion or �4.4 mmol/L �2 hafter food ingestion. In brief, the subjects were recruited at theirfamily physician’s office by one bilingual researcher (NM) overa period of time that included all 4 seasons of 1 year. Six hundredthirty-one persons who consecutively attended the doctor’s of-fice and who met the initial selection criteria agreed to participatein the study and were screened by measurement of a randomblood glucose concentration. Twenty-five subjects who had ran-dom glucose values of �12 mmol/L were determined to havepreviously undiagnosed diabetes and were thus excluded fromadditional study because overt diabetes may have confoundedthe analyses by lowering circulating 25(OH)D concentrations(16). Two hundred thirty subjects met the random blood glucosecriteria. Of these, 38 subjects declined further participation in thestudy, 2 subjects reported a recent oral-glucose-tolerance test(OGTT), and 19 subjects were unable to attend a morning OGTT,which left 171 subjects who were enrolled into the study. Theinitial survey of these subjects provided the cross-sectionalstudy, which was the basis for the present study. The study wasapproved by the local District Ethical Committee and was per-formed in accordance with its requirements.
Assessment of build, diet, and glucose tolerance
Anthropometric measurements were made with the use ofstandard techniques (19). In brief, a 15-mm fiberglass tape wasused to measure waist circumference (to the nearest cm; betweenthe costal margin and the iliac crests) and hip circumference (tothe nearest cm; at the level of the greater trochanters). Height wasmeasured (without shoes; to within 0.1 cm) with the use ofstandard National Health Service wall-fixed scales. Weight wasmeasured (to the nearest 0.5 kg) with a single scale. The subjectscompleted a validated questionnaire, which was provided in bothEnglish and Bengali and that covered paan usage (number ofpaan quids, which contain betel nuts, chewed daily), aspects ofdiet that were relevant to vitamin D intake (egg, fish, meat, and
yogurt consumption per week, and whether �15 g margarine/dwas used), and cigarette smoking (no. cigarettes/d) (17). The 171subjects, who were defined as at risk of developing diabetes,underwent a 75-g OGTT, which was carried out after an over-night fast in a hospital-based clinical research facility, as previ-ously described (17, 18). One hundred seventy of the 171 sub-jects completed the assessments, including the 75-g OGTT.Vitamin D status was defined by the subjects’ serum 25(OH)Dconcentration (20).
Laboratory assays
Blood samples from fasting subects were taken without ve-nous constriction during the OGTT, and serum and plasma ali-quots were frozen at �20 °C before the samples were blinded forassay within single analytic runs. Insulin profiles were assessedduring the OGTT (fasting and 30-min concentrations of insulin,proinsulin, and 32:33 split proinsulin) as well as the calculatedinsulin secretion index [(30 � 0 min plasma glucose concentra-tions)/(30 � 0 min serum insulin concentrations)] and the cal-culated fasting 32:33 split proinsulin-to-insulin ratios (21, 22), aspreviously reported (23). Fresh blood samples were analyzed forfasting serum triacylglycerol, cholesterol, and HDL-cholesterolconcentrations (after precipitation with magnesium and phos-photungstate) with the use of enzymatic methods according to themanufacturer’s procedures (Instrumentation Laboratory UKLtd, Warrington, United Kingdom). LDL-cholesterol concentra-tions were calculated with the use of the Friedewald formula.Apo A-I and apo B concentrations were measured by immuno-turbidimetry (Instrumentation Laboratory UK Ltd) on previ-ously unthawed serum samples (24). Fasting serum 25(OH)Dconcentrations were measured by immunoassay (IncStar, MN;within- and between-assay CVs �3.8%); vitamin D concentra-tions �11 ng/mL were defined as vitamin D deficiency (23).Fasting serum concentrations of intact parathyroid hormonewere measured with a radioimmunometric assay (Nichols Insti-tutes Diagnostics, San Juan Capistrano, CA; within- andbetween-assay CVs were �7% and �10%, respectively; normalrange: 48–119 nmol/L). Vitamin D receptor (VDR) genotyping,which tested for ApaI, BsmI, TaqI, and FokI polymorphisms, wasavailable for the subjects as previously reported (25).
Statistical analyses
Analyses were performed with SPSS version 11.0 (SPSS Inc,Chicago, IL). A multivariate analysis with stepwise logistic re-gression (to P � 0.05) was used to examine the influence ofvitamin D status and of relevant risk factors, which were treatedas potentially confounding variables. Continuous variables thatwere not normally distributed were normalized by logarithmictransformation before analysis. Pearson correlations were exam-ined, and nonparametric Spearman’s rank tests were used if thedata were not normally distributed. Differences between menand women in means for each variable were examined withone-factor analysis of variance or with nonparametric Kruskal-Wallis tests if the data were not normally distributed.
RESULTS
Although subjects with known diabetes were excluded fromthe study, diabetes was found in 14 subjects (8.19% of the totalnumber of subjects) and impaired oral glucose tolerance wasfound in 28 subjects (16.37% of the total number of subjects)
518 JOHN ET AL
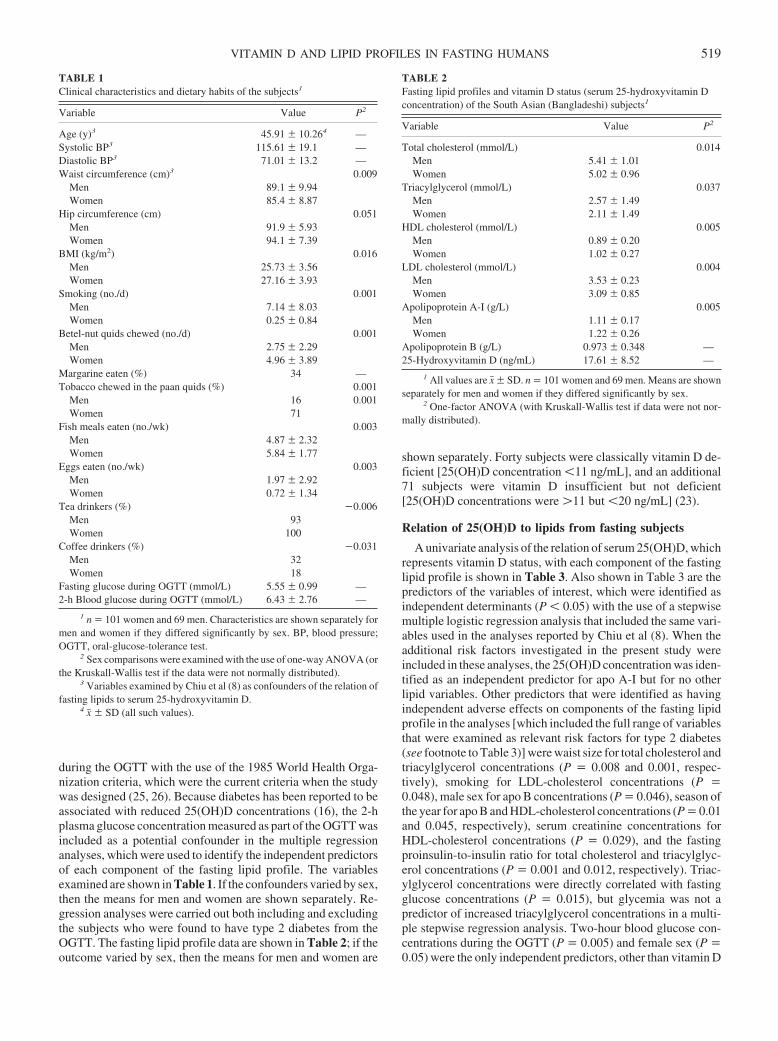
during the OGTT with the use of the 1985 World Health Orga-nization criteria, which were the current criteria when the studywas designed (25, 26). Because diabetes has been reported to beassociated with reduced 25(OH)D concentrations (16), the 2-hplasma glucose concentration measured as part of the OGTT wasincluded as a potential confounder in the multiple regressionanalyses, which were used to identify the independent predictorsof each component of the fasting lipid profile. The variablesexamined are shown in Table 1. If the confounders varied by sex,then the means for men and women are shown separately. Re-gression analyses were carried out both including and excludingthe subjects who were found to have type 2 diabetes from theOGTT. The fasting lipid profile data are shown in Table 2; if theoutcome varied by sex, then the means for men and women are
shown separately. Forty subjects were classically vitamin D de-ficient [25(OH)D concentration �11 ng/mL], and an additional71 subjects were vitamin D insufficient but not deficient[25(OH)D concentrations were �11 but �20 ng/mL] (23).
Relation of 25(OH)D to lipids from fasting subjects
A univariate analysis of the relation of serum 25(OH)D, whichrepresents vitamin D status, with each component of the fastinglipid profile is shown in Table 3. Also shown in Table 3 are thepredictors of the variables of interest, which were identified asindependent determinants (P � 0.05) with the use of a stepwisemultiple logistic regression analysis that included the same vari-ables used in the analyses reported by Chiu et al (8). When theadditional risk factors investigated in the present study wereincluded in these analyses, the 25(OH)D concentration was iden-tified as an independent predictor for apo A-I but for no otherlipid variables. Other predictors that were identified as havingindependent adverse effects on components of the fasting lipidprofile in the analyses [which included the full range of variablesthat were examined as relevant risk factors for type 2 diabetes(see footnote to Table 3)] were waist size for total cholesterol andtriacylglycerol concentrations (P � 0.008 and 0.001, respec-tively), smoking for LDL-cholesterol concentrations (P �0.048), male sex for apo B concentrations (P � 0.046), season ofthe year for apo B and HDL-cholesterol concentrations (P � 0.01and 0.045, respectively), serum creatinine concentrations forHDL-cholesterol concentrations (P � 0.029), and the fastingproinsulin-to-insulin ratio for total cholesterol and triacylglyc-erol concentrations (P � 0.001 and 0.012, respectively). Triac-ylglycerol concentrations were directly correlated with fastingglucose concentrations (P � 0.015), but glycemia was not apredictor of increased triacylglycerol concentrations in a multi-ple stepwise regression analysis. Two-hour blood glucose con-centrations during the OGTT (P � 0.005) and female sex (P �0.05) were the only independent predictors, other than vitamin D
TABLE 1Clinical characteristics and dietary habits of the subjects1
Variable Value P2
Age (y)3 45.91 � 10.264 —Systolic BP3 115.61 � 19.1 —Diastolic BP3 71.01 � 13.2 —Waist circumference (cm)3 0.009
Men 89.1 � 9.94Women 85.4 � 8.87
Hip circumference (cm) 0.051Men 91.9 � 5.93Women 94.1 � 7.39
BMI (kg/m2) 0.016Men 25.73 � 3.56Women 27.16 � 3.93
Smoking (no./d) 0.001Men 7.14 � 8.03Women 0.25 � 0.84
Betel-nut quids chewed (no./d) 0.001Men 2.75 � 2.29Women 4.96 � 3.89
Margarine eaten (%) 34 —Tobacco chewed in the paan quids (%) 0.001
Men 16 0.001Women 71
Fish meals eaten (no./wk) 0.003Men 4.87 � 2.32Women 5.84 � 1.77
Eggs eaten (no./wk) 0.003Men 1.97 � 2.92Women 0.72 � 1.34
Tea drinkers (%) �0.006Men 93Women 100
Coffee drinkers (%) �0.031Men 32Women 18
Fasting glucose during OGTT (mmol/L) 5.55 � 0.99 —2-h Blood glucose during OGTT (mmol/L) 6.43 � 2.76 —
1 n � 101 women and 69 men. Characteristics are shown separately formen and women if they differed significantly by sex. BP, blood pressure;OGTT, oral-glucose-tolerance test.
2 Sex comparisons were examined with the use of one-way ANOVA (orthe Kruskall-Wallis test if the data were not normally distributed).
3 Variables examined by Chiu et al (8) as confounders of the relation offasting lipids to serum 25-hydroxyvitamin D.
4 x� � SD (all such values).
TABLE 2Fasting lipid profiles and vitamin D status (serum 25-hydroxyvitamin Dconcentration) of the South Asian (Bangladeshi) subjects1
Variable Value P2
Total cholesterol (mmol/L) 0.014Men 5.41 � 1.01Women 5.02 � 0.96
Triacylglycerol (mmol/L) 0.037Men 2.57 � 1.49Women 2.11 � 1.49
HDL cholesterol (mmol/L) 0.005Men 0.89 � 0.20Women 1.02 � 0.27
LDL cholesterol (mmol/L) 0.004Men 3.53 � 0.23Women 3.09 � 0.85
Apolipoprotein A-I (g/L) 0.005Men 1.11 � 0.17Women 1.22 � 0.26
Apolipoprotein B (g/L) 0.973 � 0.348 —25-Hydroxyvitamin D (ng/mL) 17.61 � 8.52 —
1 All values are x� � SD. n � 101 women and 69 men. Means are shownseparately for men and women if they differed significantly by sex.
2 One-factor ANOVA (with Kruskall-Wallis test if data were not nor-mally distributed).
VITAMIN D AND LIPID PROFILES IN FASTING HUMANS 519
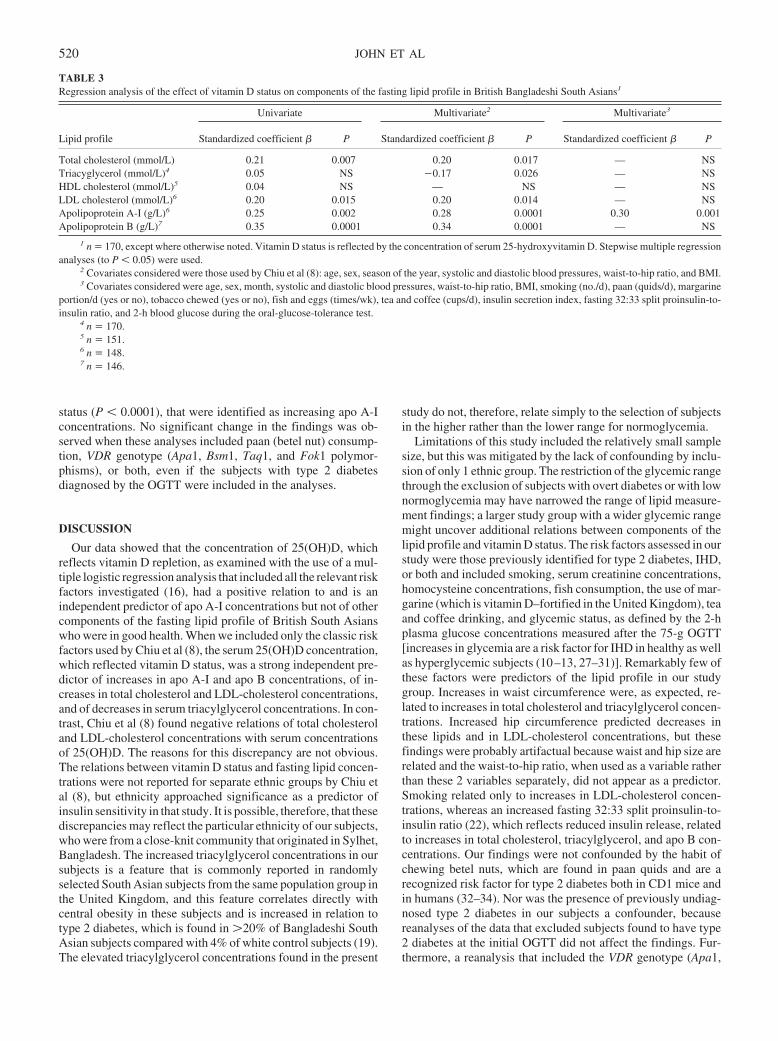
status (P � 0.0001), that were identified as increasing apo A-Iconcentrations. No significant change in the findings was ob-served when these analyses included paan (betel nut) consump-tion, VDR genotype (Apa1, Bsm1, Taq1, and Fok1 polymor-phisms), or both, even if the subjects with type 2 diabetesdiagnosed by the OGTT were included in the analyses.
DISCUSSION
Our data showed that the concentration of 25(OH)D, whichreflects vitamin D repletion, as examined with the use of a mul-tiple logistic regression analysis that included all the relevant riskfactors investigated (16), had a positive relation to and is anindependent predictor of apo A-I concentrations but not of othercomponents of the fasting lipid profile of British South Asianswho were in good health. When we included only the classic riskfactors used by Chiu et al (8), the serum 25(OH)D concentration,which reflected vitamin D status, was a strong independent pre-dictor of increases in apo A-I and apo B concentrations, of in-creases in total cholesterol and LDL-cholesterol concentrations,and of decreases in serum triacylglycerol concentrations. In con-trast, Chiu et al (8) found negative relations of total cholesteroland LDL-cholesterol concentrations with serum concentrationsof 25(OH)D. The reasons for this discrepancy are not obvious.The relations between vitamin D status and fasting lipid concen-trations were not reported for separate ethnic groups by Chiu etal (8), but ethnicity approached significance as a predictor ofinsulin sensitivity in that study. It is possible, therefore, that thesediscrepancies may reflect the particular ethnicity of our subjects,who were from a close-knit community that originated in Sylhet,Bangladesh. The increased triacylglycerol concentrations in oursubjects is a feature that is commonly reported in randomlyselected South Asian subjects from the same population group inthe United Kingdom, and this feature correlates directly withcentral obesity in these subjects and is increased in relation totype 2 diabetes, which is found in �20% of Bangladeshi SouthAsian subjects compared with 4% of white control subjects (19).The elevated triacylglycerol concentrations found in the present
study do not, therefore, relate simply to the selection of subjectsin the higher rather than the lower range for normoglycemia.
Limitations of this study included the relatively small samplesize, but this was mitigated by the lack of confounding by inclu-sion of only 1 ethnic group. The restriction of the glycemic rangethrough the exclusion of subjects with overt diabetes or with lownormoglycemia may have narrowed the range of lipid measure-ment findings; a larger study group with a wider glycemic rangemight uncover additional relations between components of thelipid profile and vitamin D status. The risk factors assessed in ourstudy were those previously identified for type 2 diabetes, IHD,or both and included smoking, serum creatinine concentrations,homocysteine concentrations, fish consumption, the use of mar-garine (which is vitamin D–fortified in the United Kingdom), teaand coffee drinking, and glycemic status, as defined by the 2-hplasma glucose concentrations measured after the 75-g OGTT[increases in glycemia are a risk factor for IHD in healthy as wellas hyperglycemic subjects (10–13, 27–31)]. Remarkably few ofthese factors were predictors of the lipid profile in our studygroup. Increases in waist circumference were, as expected, re-lated to increases in total cholesterol and triacylglycerol concen-trations. Increased hip circumference predicted decreases inthese lipids and in LDL-cholesterol concentrations, but thesefindings were probably artifactual because waist and hip size arerelated and the waist-to-hip ratio, when used as a variable ratherthan these 2 variables separately, did not appear as a predictor.Smoking related only to increases in LDL-cholesterol concen-trations, whereas an increased fasting 32:33 split proinsulin-to-insulin ratio (22), which reflects reduced insulin release, relatedto increases in total cholesterol, triacylglycerol, and apo B con-centrations. Our findings were not confounded by the habit ofchewing betel nuts, which are found in paan quids and are arecognized risk factor for type 2 diabetes both in CD1 mice andin humans (32–34). Nor was the presence of previously undiag-nosed type 2 diabetes in our subjects a confounder, becausereanalyses of the data that excluded subjects found to have type2 diabetes at the initial OGTT did not affect the findings. Fur-thermore, a reanalysis that included the VDR genotype (Apa1,
TABLE 3Regression analysis of the effect of vitamin D status on components of the fasting lipid profile in British Bangladeshi South Asians1
Lipid profile
Univariate Multivariate2 Multivariate3
Standardized coefficient � P Standardized coefficient � P Standardized coefficient � P
Total cholesterol (mmol/L) 0.21 0.007 0.20 0.017 — NSTriacyglycerol (mmol/L)4 0.05 NS �0.17 0.026 — NSHDL cholesterol (mmol/L)5 0.04 NS — NS — NSLDL cholesterol (mmol/L)6 0.20 0.015 0.20 0.014 — NSApolipoprotein A-I (g/L)6 0.25 0.002 0.28 0.0001 0.30 0.001Apolipoprotein B (g/L)7 0.35 0.0001 0.34 0.0001 — NS
1 n � 170, except where otherwise noted. Vitamin D status is reflected by the concentration of serum 25-hydroxyvitamin D. Stepwise multiple regressionanalyses (to P � 0.05) were used.
2 Covariates considered were those used by Chiu et al (8): age, sex, season of the year, systolic and diastolic blood pressures, waist-to-hip ratio, and BMI.3 Covariates considered were age, sex, month, systolic and diastolic blood pressures, waist-to-hip ratio, BMI, smoking (no./d), paan (quids/d), margarine
portion/d (yes or no), tobacco chewed (yes or no), fish and eggs (times/wk), tea and coffee (cups/d), insulin secretion index, fasting 32:33 split proinsulin-to-insulin ratio, and 2-h blood glucose during the oral-glucose-tolerance test.
4 n � 170.5 n � 151.6 n � 148.7 n � 146.
520 JOHN ET AL
Bsm1, Taq1, and Fok1 polymorphisms), which were previouslyshown to relate to the insulin secretion index (25) of the subjects,did not affect the findings. This suggests that vitamin D activity,insofar as it affects lipid metabolism directly, does not vary withVDR genotype and that the variation in insulin secretion becauseof a VDR polymorphism, which we reported previously in thiscohort of subjects, has no significant effect on the fasting lipidprofiles.
Previous work conducted in white subjects in Belgium showedthat fasting apo A-I concentrations correlate directly with serum25(OH)D concentrations in men but not in women (15), but wehave found no other studies of apolipoprotein in relation to serum25(OH)D concentrations to date. The present study in BritishBangladeshis (South Asians) showed no significant variation inthe fasting lipid concentrations with regard to sex: vitamin Dstatus was an independent predictor for serum apo A-I concen-trations in both men (P � 0.003) and women (P � 0.011). Therelation found between vitamin D status and HDL-cholesterolconcentrations in white subjects by Auwerx et al (15) was notobserved in our subjects.
It has been postulated in a review of the literature (4) and, inparticular, in epidemiologic and cross-sectional studies (8, 35–38) that hypovitaminosis D contributes to the risk of the meta-bolic syndrome (syndrome X). This postulate is supported byprevious findings of correlations between serum 25(OH)D con-centrations and both HDL-cholesterol concentrations and apoA-I concentrations (15) and by data from the Coronary ArteryRisk Development in Young Adults study (39), which showedthat the consumption of dairy-based foods, including the vitaminD–fortified milk sold in the United States, is inversely related tothe risk of type 2 diabetes and IHD. This finding was, paradox-ically, noted in overweight subjects, whereas obesity is normallyregarded as a powerful risk factor for the metabolic syndrome(40, 41). Obese subjects are now thought to be at an increased riskof hypovitaminosis D because of sequestration of vitamin D inadipose tissue, which may contribute to the risk of the metabolicsyndrome that is associated with obesity (42). Inverse associa-tions between vitamin D status and both diabetes and insulinresistance were recently reported in Mexican Americans andnon-Hispanic whites but not in non-Hispanic blacks (43). Serumtotal cholesterol concentrations have not been found to relate toserum 25(OH)D concentrations in the few studies reported overthe past 25 y (44–46). The additional finding that insulin sensi-tivity and � cell function are both adversely affected by worsen-ing hypovitaminosis D in normoglycemic subjects as well as inthose with dysglycemia (8, 7, 9, 14, 37) is important becauseincreases in insulin resistance and in glycemia are associatedwith an increased risk of cardiovascular disease even in normo-glycemic subjects (10, 11, 40). Although the contribution ofhypovitaminosis D to dyslipidemia in British South Asians in thepresent study did not appear to extend beyond an effect on apoA-I concentrations, our findings support the postulate that avoid-ance of hypovitaminosis D could contribute to reductions in therisk of the sequelae of the metabolic syndrome. Because apo A-Iis involved in the reverse transport system that clears tissuecholesterol (47), lowering the availability of apo A-I will in-crease the risk of vascular damage associated with overt type 2diabetes and, specifically, of IHD and stroke, which are alsoassociated with the metabolic syndrome. These findings furtherjustify the need for inclusion of variables of the metabolic syn-drome in future considerations of the overall benefits of the
avoidance of vitamin D deficiency (8, 48, 49). However, largerstudies that provide estimates of the preventable proportion of themetabolic syndrome–related disease at both the personal andpopulation levels are still needed for public health planning, andsuch studies appear to be long overdue.
The authors are grateful to BV North, Academic Department of Psychi-atry, Queen Mary School of Medicine & Dentistry, for statistical advice.
WGJ advised on the biochemical methodology and carried out the lipidanalyses; KN advised on the immunoassay methodology and carried out thevitamin D metabolite and parathyroid hormone immunoassays; NM assistedin the study design and organization, assisted in the preparation of bilingualmaterial (including the questionnaires), carried out all subject assessments,assisted with the oral-glucose-tolerance tests, made the data records, andassisted with preliminary data analysis; and BJB was responsible for theinception of the study, raising grant support, statistical analyses, and fordrafting and finalizing the report. All authors contributed to the preparationof the manuscript and all authors saw and agreed on the final submittedversion. None of the authors had a conflict of interest.
REFERENCES1. Holick MF. Evolution, biologic functions, and recommended dietary
allowances for vitamin D. In: Holick MF, ed. Vitamin D: Physiology,molecular biology, and clinical applications. Totowa, NJ: Humana PressInc, 1998:1–16.
2. Norman AW. Sunlight, season, skin pigmentation, vitamin D, and 25-hydroxyvitamin D: integral components of the vitamin D endocrinesystem. Am J Clin Nutr 1998;67:1108–10.
3. Hollis BW. Assessment of vitamin D nutritional and hormonal status:what to measure and how to do it. Calcif Tissue Int 1996;58:4–5.
4. Boucher BJ. Inadequate vitamin D status: does it contribute to the dis-orders comprising Syndrome ‘X’? Br J Nutr 1998;79:315–27. (Pub-lished erratum appears in Br J Nutr 1998;80:585.)
5. Holick MF. Vitamin D: importance in the prevention of cancers, type 1diabetes, heart disease, and osteoporosis. Am J Clin Nutr 2004;79:362–71. (Published erratum appears in Am J Clin Nutr 2004;79:890.)
6. Holick MF. Sunlight and vitamin D: both good for cardiovascular heath.J Gen Intern Med 2002;17:733–5.
7. Boucher BJ, Mannan N, Noonan K, Hales CN, Evans SJW. Glucoseintolerance and impairment of insulin secretion in relation to vitamin Ddeficiency in east London Asians. Diabetologia 1995;38:1239–45.
8. Chiu KC, Chu A, Go VLW, Saad MF. Hypovitaminosis D is associatedwith insulin resistance and � cell dysfunction. Am J Clin Nutr 2004;79:820–5.
9. Inomata S, Kadowaki S, Yamatani T, Fukase M, Fujita T. Effect of 1alpha (OH)-vitamin D3 on insulin secretion in diabetes mellitus. BoneMiner 1986;1:187–92.
10. Khaw K-T, Wareham N, Luben R, et al. Glycosylated hemoglobin,diabetes and mortality in men in Norfolk cohort of European ProspectiveInvestigation of Cancer and Nutrition (EPIC-Norfolk). BMJ 2001;322:15–8.
11. Barrett-Connor E, Wingard DL. “Normal” blood glucose and coronaryrisk. BMJ 2001;322:5–6.
12. Feskens EJ, Bowles CH, Kromhout D. Association between fish intakeand coronary heart disease mortality. Differences in normoglycemic andglucose intolerant elderly subjects. Diabetes Care 1991;16:1029–34.
13. Feskens EJ, Kromhout D. Inverse association between fish intake andrisk of glucose intolerance in normoglycemic elderly men and women.Diabetes Care 1991;14:935–41.
14. Grimes DS, Hindle E, Dyer T. Sunlight, cholesterol and coronary heartdisease. QJM 1996;89:579–89.
15. Auwerx J, Bouillon R, Kesteloot H. Relation between 25-hydroxyvitamin D3, apolipoprotein A-1 and high density lipoproteincholesterol. Aterioscler Thromb 1992;12:671–4.
16. Schneider LE, Schedl HP, McCain T, Haussler MR. Experimental dia-betes reduces circulating 1,25-dihydroxyvitamin D in the rat. Science1977;196:1452–4.
17. Timms PM, Mannan N, Hitman GA, et al. Circulating MMP9, vitaminD and variation in the TIMP-1 response with VDR genotype: mecha-nisms for inflammatory damage in chronic disorders? QJM 2002;95:787–96.
VITAMIN D AND LIPID PROFILES IN FASTING HUMANS 521
18. Mannan N, Boucher BJ, Evans SJW. Increased waist size and weight inrelation to consumption of Areca catechu (betel-nut); a risk factor forincreased glycaemia in Asians in east London. B J Nutr 2000;83:267–75.
19. McKeigue PM, Marmot MG, Syndercombe Court YD, Cottier DE, Rah-man S, Riemersma RA. Diabetes, hyperinsulinemia, and coronary riskfactors in Bangladeshis in east London. Br Heart J 1988;60:390–6.
20. Malaban A, Veronikis IE, Holick MF. Redefining vitamin D deficiency.Lancet 1998;351:805–6.
21. Phillips DI, Clark PM, Hales CN, Osmond C. Understanding oral glu-cose tolerance: comparison of glucose or insulin measurements duringthe oral glucose tolerance tests with specific measurements of insulinresistance and insulin secretion. Diabet Med 1994;11:286–92.
22. Mykkanen L, Haffner SM, Hales CN, Ronnemaa T, Laakso M. Therelation of proinsulin, insulin, and proinsulin-to-insulin ratio to insulinsensitivity and acute insulin response in normoglycemic subjects. Dia-betes 1976;46:1990–5.
23. Ogunkolade BW, Boucher BJ, Prahl JM, et al. Vitamin D receptormRNA and VDR protein levels in relation to vitamin D status, insulinsecretory capacity and VDR genotype in Bangladeshi Asians. Diabetes2002;51:2294–302.
24. Expert Panel on Detection, Evaluation and Treatment of High BloodCholesterol in Adults. Executive summary of the third report of theNational Cholesterol Education Programme (NCEP) Expert Panel on theDetection, Evaluation and Treatment of High Blood Cholesterol inAdults (Adult Treatment Panel 111). JAMA 2001;285:2486–97.
25. Hitman GA, Mannan N, McDermott MF, Aganna E, Hales CN, BoucherBJ. Vitamin D receptor polymorphisms influence insulin secretion inBangladeshi Asians. Diabetes 1998;47:688–90.
26. WHO Study Group on Diabetes Mellitus. Diabetes mellitus: report of aWHO study group. World Health Organ Tech Rep Ser 1985;727.
27. Parish S, Collins R, Peto R, et al. Cigarette smoking, tar yields andnon-fatal myocardial infarction: 14,000 cases and 32,000 controls in theUnited Kingdom. The International Studies of Infarct Survival (ISIS)Collaborators. BMJ 1995;311:471–7.
28. Larsen SF, Oleson KH, Jacobsen E, et al. Prediction of cardiac risk innon-cardiac surgery. Eur Heart J 1987;8:179–85.
29. Obeid OA, Mannan N, Perry G, Iles RA, Boucher BJ. Homocysteine andfolate in healthy east London Bangladeshis. Lancet 1998;352:1829–30.
30. Woodward M, Tunstall-Pedoe H. Coffee and tea consumption in theScottish Heart Health Study follow up: conflicting relations with coro-nary risk factors, coronary disease, and all causes mortality. J EpidemiolCommunity Health 1999;53:481–7.
31. Sesso HD, Gaziano JM, Buring JE, Hennekens CH. Coffee and tea intakeand the risk of myocardial infarction. Am J Epidemiol 1999;149:162–7.
32. Boucher BJ, Ewen SWB, Stowers JM. Betel nut (Areca catechu) con-sumption and the induction of glucose intolerance in adult CD1 mice andtheir F1 and F2 offspring. Diabetologia 1994;37:49–55.
33. Benjamin AL. Community screening for diabetes in the National CapitalDistrict, Papua New Guinea: is betel nut chewing a risk factor for dia-betes? P N G Med J 2001;44:101–7.
34. Tung TH, Chiu YH, Chen LS, Wu HM, Boucher BJ, Chen THH. Apopulation-based study of the association between Areca-nut chewingand type 2 diabetes mellitus in men (Keelung Community-based Inte-grated Screening Programme No 2). Diabetologia 2004;47:1776–81.
35. Cade C, Norman AW. Vitamin D3 improves impaired glucose toleranceand insulin secretion in the vitamin D deficient rat in vivo. Endocrinol-ogy 1986;119:84–90.
36. Scragg R, Jackson R, Holdaway IM, Lim T, Beaglehold R. Myocardialinfarction is inversely related with plasma 25-hydroxyvitamin D levels:a community-based study. Int J Epidemiol 1990;19:559–63.
37. Baynes KC, Boucher BJ, Feskens EJ, Kromhout D. Vitamin D, glucosetolerance and insulinemia in elderly men. Diabetologia 1997;40:344–7.
38. Scragg R. Sunlight, vitamin D and cardiovascular disease. In: Crass MF,Aviol LV, eds. Calcium regulating hormones and cardiovascular func-tion. Boca Raton, FL: CRC Press Inc, 1994:213–37.
39. Carnethon MR, Loria CM, Hill JO, Sidney S, Savage PJ, Liu K. Riskfactors for the metabolic syndrome: the Coronary Artery Risk Develop-ment in Young Adults (CARDIA) Study, 1985–2001. Diabetes Care2004;27:2707–15.
40. Park SH, Lee WY, Lee YS, Rhee EJ, Kim SW. The relative effects ofobesity and insulin resistance on cardiovascular risk factors in nondia-betic and normotensive men. Korean J Intern Med 2004;19:75–80.
41. Sheligar KM, Hockaday TDR, Yajnik CS. Central rather than general-ized obesity is related to hyperglycemia. Diabet Med 1992;8:P712–7.
42. Worstman J, Matsuoka LY, Chen TC, Lu Z, Holick MF. Decreasedbioavailability of vitamin D in obesity. Am J Clin Nutr 2000;72:690–3.
43. Scragg R, Sowers M, Bell C. Serum 25-hydroxyvitamin D, diabetes, andethnicity in the Third National Health and Nutrition Examination Sur-vey. Diabetes Care 2004;27:2813–8.
44. Lund B, Badskjaer J, Lund B, Soerensen OH. Vitamin D and ischaemicheart disease. Horm Metab Res 1978;10:553–6.
45. Vik B, Try K, Thelle DS, Forde OH. Tromso Heart Study: vitamin Dmetabolism and myocardial infarction. Br Med J 1979;2:176.
46. Scragg R, Holdaway I, Jackson R, Lim T. Plasma 25-hydroxyvitamin D3
and its relation to physical activity and other heart disease risk factors inthe general population. Ann Epidemiol 1992;2:697–703.
47. Lewis B. Hyperlipidemia. In: Cohen RD, Lewis B, Alberti KGMM,Denman AM, eds. The metabolic basis of acquired disease. London:Balliere-Tindall, 1990:860–920.
48. Utiger RD. The need for more vitamin D. N Engl J Med 1998;338:828–9.
49. Zitterman A. Vitamin D in preventative medicine: are we ignoring theevidence? Br J Nutr 2002;89:552–72.
522 JOHN ET AL
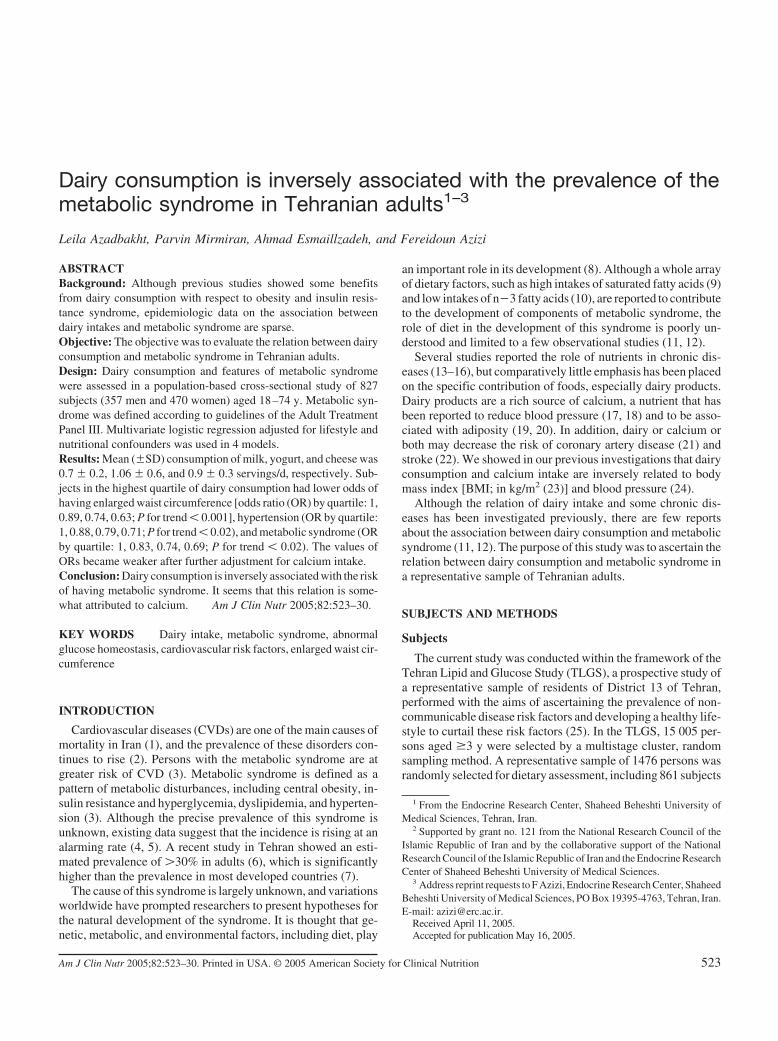
Dairy consumption is inversely associated with the prevalence of themetabolic syndrome in Tehranian adults1–3
Leila Azadbakht, Parvin Mirmiran, Ahmad Esmaillzadeh, and Fereidoun Azizi
ABSTRACTBackground: Although previous studies showed some benefitsfrom dairy consumption with respect to obesity and insulin resis-tance syndrome, epidemiologic data on the association betweendairy intakes and metabolic syndrome are sparse.Objective: The objective was to evaluate the relation between dairyconsumption and metabolic syndrome in Tehranian adults.Design: Dairy consumption and features of metabolic syndromewere assessed in a population-based cross-sectional study of 827subjects (357 men and 470 women) aged 18–74 y. Metabolic syn-drome was defined according to guidelines of the Adult TreatmentPanel III. Multivariate logistic regression adjusted for lifestyle andnutritional confounders was used in 4 models.Results: Mean (�SD) consumption of milk, yogurt, and cheese was0.7 � 0.2, 1.06 � 0.6, and 0.9 � 0.3 servings/d, respectively. Sub-jects in the highest quartile of dairy consumption had lower odds ofhaving enlarged waist circumference [odds ratio (OR) by quartile: 1,0.89, 0.74, 0.63; P for trend � 0.001], hypertension (OR by quartile:1, 0.88, 0.79, 0.71; P for trend � 0.02), and metabolic syndrome (ORby quartile: 1, 0.83, 0.74, 0.69; P for trend � 0.02). The values ofORs became weaker after further adjustment for calcium intake.Conclusion: Dairy consumption is inversely associated with the riskof having metabolic syndrome. It seems that this relation is some-what attributed to calcium. Am J Clin Nutr 2005;82:523–30.
KEY WORDS Dairy intake, metabolic syndrome, abnormalglucose homeostasis, cardiovascular risk factors, enlarged waist cir-cumference
INTRODUCTION
Cardiovascular diseases (CVDs) are one of the main causes ofmortality in Iran (1), and the prevalence of these disorders con-tinues to rise (2). Persons with the metabolic syndrome are atgreater risk of CVD (3). Metabolic syndrome is defined as apattern of metabolic disturbances, including central obesity, in-sulin resistance and hyperglycemia, dyslipidemia, and hyperten-sion (3). Although the precise prevalence of this syndrome isunknown, existing data suggest that the incidence is rising at analarming rate (4, 5). A recent study in Tehran showed an esti-mated prevalence of �30% in adults (6), which is significantlyhigher than the prevalence in most developed countries (7).
The cause of this syndrome is largely unknown, and variationsworldwide have prompted researchers to present hypotheses forthe natural development of the syndrome. It is thought that ge-netic, metabolic, and environmental factors, including diet, play
an important role in its development (8). Although a whole arrayof dietary factors, such as high intakes of saturated fatty acids (9)and low intakes of n�3 fatty acids (10), are reported to contributeto the development of components of metabolic syndrome, therole of diet in the development of this syndrome is poorly un-derstood and limited to a few observational studies (11, 12).
Several studies reported the role of nutrients in chronic dis-eases (13–16), but comparatively little emphasis has been placedon the specific contribution of foods, especially dairy products.Dairy products are a rich source of calcium, a nutrient that hasbeen reported to reduce blood pressure (17, 18) and to be asso-ciated with adiposity (19, 20). In addition, dairy or calcium orboth may decrease the risk of coronary artery disease (21) andstroke (22). We showed in our previous investigations that dairyconsumption and calcium intake are inversely related to bodymass index [BMI; in kg/m2 (23)] and blood pressure (24).
Although the relation of dairy intake and some chronic dis-eases has been investigated previously, there are few reportsabout the association between dairy consumption and metabolicsyndrome (11, 12). The purpose of this study was to ascertain therelation between dairy consumption and metabolic syndrome ina representative sample of Tehranian adults.
SUBJECTS AND METHODS
Subjects
The current study was conducted within the framework of theTehran Lipid and Glucose Study (TLGS), a prospective study ofa representative sample of residents of District 13 of Tehran,performed with the aims of ascertaining the prevalence of non-communicable disease risk factors and developing a healthy life-style to curtail these risk factors (25). In the TLGS, 15 005 per-sons aged �3 y were selected by a multistage cluster, randomsampling method. A representative sample of 1476 persons wasrandomly selected for dietary assessment, including 861 subjects
1 From the Endocrine Research Center, Shaheed Beheshti University ofMedical Sciences, Tehran, Iran.
2 Supported by grant no. 121 from the National Research Council of theIslamic Republic of Iran and by the collaborative support of the NationalResearch Council of the Islamic Republic of Iran and the Endocrine ResearchCenter of Shaheed Beheshti University of Medical Sciences.
3 Address reprint requests to F Azizi, Endocrine Research Center, ShaheedBeheshti University of Medical Sciences, PO Box 19395-4763, Tehran, Iran.E-mail: [email protected].
Received April 11, 2005.Accepted for publication May 16, 2005.
523Am J Clin Nutr 2005;82:523–30. Printed in USA. © 2005 American Society for Clinical Nutrition
aged 18–74 y. In the current population-based cross-sectionalstudy, subjects with a history of CVD, diabetes, or stroke wereexcluded because of possible changes in diet. We also excludedsubjects whose reported daily energy intakes outside the range of800–4200 kcal/d (3347–17 573 kJ/d) (26). Therefore, 827 sub-jects (357 men and 470 women) aged 18–74 y remained for thecurrent analysis.
Each subject provided written informed consent. The protocolof this study was approved by the research council of the Endo-crine Research Center of Shaheed Beheshti University of Med-ical Sciences.
Assessment of dietary intake
Usual dietary intake was assessed with the use of a 168-itemsemiquantitative food-frequency questionnaire (FFQ). All thequestionnaires were administered by trained dietitians who had�5 y experience in the Nationwide Food Consumption Surveyproject (27, 28). The FFQ consisted of a list of foods with astandard serving size (Willett format). Participants were asked toreport their frequency of consumption of each food item duringthe previous year on a daily (eg, bread), weekly (eg, rice or meat),or monthly (eg, fish) basis. Portion sizes of consumed foods wereconverted from household measures to grams (29). Each foodand beverage was then coded according to the prescribed proto-col and analyzed for content of energy and the other nutrients byusing NUTRITIONIST III software (version 7.0; N-SquaredComputing, Salem, OR), which was designed for Iranian foods.
Dairy products were defined according to the US Food GuidePyramid (30). The amounts of yogurt, milk, and cheese that count asa serving were 8 ounces (240 g), 1 cup (240 cc), and 1.5 ounces (45g), respectively (31).
The reliability of the FFQ in this cohort was evaluated in arandomly chosen subgroup of 132 subjects by comparing nutri-ent consumption ascertained by FFQ responses on 2 occasions.The correlation coefficients for the repeatability of cheese, milk,and yogurt were 0.73, 0.69, and 0.79, respectively. The FFQ alsohad high reliability for nutrients. For example, the correlationcoefficients were 0.78 for dietary protein, 0.70 for riboflavin, and0.75 for dietary calcium. Comparative validity was determinedby comparison with intake estimated from the average of twelve24-h dietary recalls (one for each month of the year). Preliminaryanalysis of the validation study showed that nutrients commonlyfound in dairy products were moderately correlated (all correla-tion coefficients were �0.5) between these 2 methods after con-trol for total energy intake. The performance of the FFQ inassessing the individual dairy products also was high. For exam-ple, between FFQ and detailed dietary recalls, correlation coef-ficients were 0.66 for cheese, 0.61 for yogurt, and 0.70 for milk.Overall, these data indicate that the FFQ provides reasonablyvalid measures of the average long-term dietary intake.
Assessment of other variables
While the subjects were minimally clothed and not wearingshoes, weight was measured with the use of digital scales and re-corded to the nearest 100 g. Height was measured with a tape mea-sure while the subjects were in a standing position and not wearingshoes and while the shoulders were in a normal position. BMI wascalculated. Waist circumference was measured at the narrowestlevelbetweenthe lowest riband the iliaccrestandhipcircumferencewasmeasuredat themaximumlevelover lightclothing,with theuse
ofanunstretchedtapemeasurewithoutanypressure tobodysurface.Measurements were recorded to the nearest 0.1 cm, as reportedearlier (32), and the waist-to-hip ratio was calculated.
Blood pressure was measured twice after the participants satfor 15 min (33). Additional covariate information about age,smoking habits (34), physical activity (35), medical history, andcurrent use of medications (34) was obtained with the use ofvalidated questionnaires, as reported earlier.
Fasting blood samples for the measurement of glucose andlipid concentrations were drawn after an overnight fast of 12 h(36). Blood glucose was measured on the day of blood collectionby using the enzymatic colorimetric method with glucose oxi-dase. Serum concentrations of total cholesterol and triacylglyc-erols were measured by using commercially available enzymaticreagents (Pars Azmoon, Tehran, Iran) adapted to the Selectraautoanalyzer (Vital Scientific, Spankeren, Netherlands). HDLcholesterol was measured after precipitation of the apolipopro-tein B–containing lipoproteins with phosphotungstic acid. LDLcholesterol was calculated according to the method of Friede-wald et al (37). It was not calculated when the serum concentra-tion of triacylglycerol was �400 mg/dL. All samples were ana-lyzed when internal quality control met the acceptable criteria.Interassay and intraassay CVs were 2% and 0.5% for total cho-lesterol and 1.6% and 0.6% for triacylglycerol, respectively.
Definition of terms
Metabolic syndrome was defined as the presence of �3 of thefollowing 5 components as recommended by the Adult Treat-ment Panel III (38): 1) enlarged waist circumference (waist cir-cumference �102 cm in men and �88 cm in women); 2) lowserum HDL cholesterol (�40 mg/dL in men and �50 mg/dL inwomen); 3) high serum triacylglycerol concentrations (�150mg/dL); 4) elevated blood pressure (�130/85 mm Hg); and 5)abnormal glucose homeostasis (fasting plasma glucose concen-tration �110 mg/dL).
Statistical analysis
We used SPSS software (version 9.05; SPSS Inc, Chicago IL)for all statistical analyses. In separate models, first-order inter-actions between sex and dairy intakes were entered to ascertainwhether associations were similar between men and women. Nosignificant interactions by sex were observed for the associationof dairy intakes and metabolic risk factors. Cutoffs for quartilesof dairy intake were calculated, and subjects were categorizedaccording to the quartiles. The cutoffs were the same for men andwomen: �1.0, 1.0 to �1.8, 1.8 to �2.7, and �2.7 servings/d forquartiles 1–4, respectively.
Significant differences in general characteristics across quar-tiles of dairy intake were searched by using one-way analysis ofvariance. If there was a significant main effect, Tukey test wasused to detect pairwise differences. Chi-square test was used todetect any significant differences in the distribution of subjectsacross quartiles of dairy intake with regard to qualitative vari-ables. We determined multivariate-adjusted means (ie, age; sex;physical activity; smoking; BMI; waist-to-hip ratio; total energyintake; consumption of fruit, vegetables, and meats and fish;percentage of energy from fat; and current use of antihyperten-sive medication and estrogen replacement therapy) for metabolicrisk factors and determined age-, sex-, and energy-adjustedmeans for dietary variables across quartiles of dairy intake by
524 AZADBAKHT ET AL
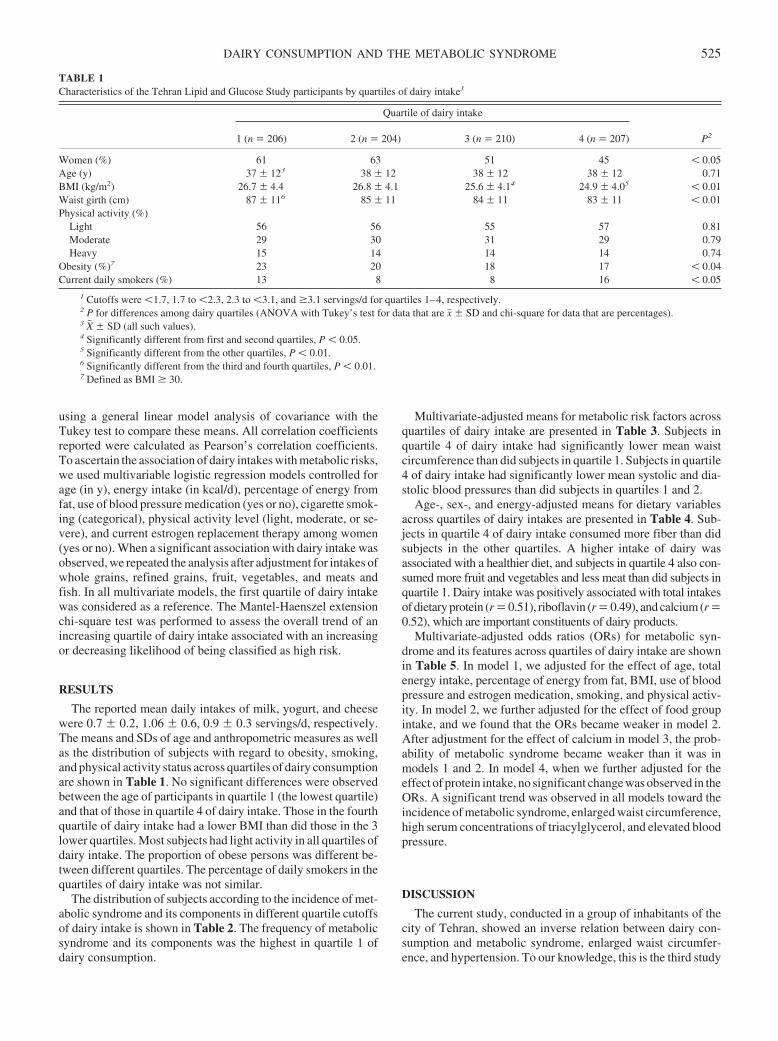
using a general linear model analysis of covariance with theTukey test to compare these means. All correlation coefficientsreported were calculated as Pearson’s correlation coefficients.To ascertain the association of dairy intakes with metabolic risks,we used multivariable logistic regression models controlled forage (in y), energy intake (in kcal/d), percentage of energy fromfat, use of blood pressure medication (yes or no), cigarette smok-ing (categorical), physical activity level (light, moderate, or se-vere), and current estrogen replacement therapy among women(yes or no). When a significant association with dairy intake wasobserved, we repeated the analysis after adjustment for intakes ofwhole grains, refined grains, fruit, vegetables, and meats andfish. In all multivariate models, the first quartile of dairy intakewas considered as a reference. The Mantel-Haenszel extensionchi-square test was performed to assess the overall trend of anincreasing quartile of dairy intake associated with an increasingor decreasing likelihood of being classified as high risk.
RESULTS
The reported mean daily intakes of milk, yogurt, and cheesewere 0.7 � 0.2, 1.06 � 0.6, 0.9 � 0.3 servings/d, respectively.The means and SDs of age and anthropometric measures as wellas the distribution of subjects with regard to obesity, smoking,and physical activity status across quartiles of dairy consumptionare shown in Table 1. No significant differences were observedbetween the age of participants in quartile 1 (the lowest quartile)and that of those in quartile 4 of dairy intake. Those in the fourthquartile of dairy intake had a lower BMI than did those in the 3lower quartiles. Most subjects had light activity in all quartiles ofdairy intake. The proportion of obese persons was different be-tween different quartiles. The percentage of daily smokers in thequartiles of dairy intake was not similar.
The distribution of subjects according to the incidence of met-abolic syndrome and its components in different quartile cutoffsof dairy intake is shown in Table 2. The frequency of metabolicsyndrome and its components was the highest in quartile 1 ofdairy consumption.
Multivariate-adjusted means for metabolic risk factors acrossquartiles of dairy intake are presented in Table 3. Subjects inquartile 4 of dairy intake had significantly lower mean waistcircumference than did subjects in quartile 1. Subjects in quartile4 of dairy intake had significantly lower mean systolic and dia-stolic blood pressures than did subjects in quartiles 1 and 2.
Age-, sex-, and energy-adjusted means for dietary variablesacross quartiles of dairy intakes are presented in Table 4. Sub-jects in quartile 4 of dairy intake consumed more fiber than didsubjects in the other quartiles. A higher intake of dairy wasassociated with a healthier diet, and subjects in quartile 4 also con-sumed more fruit and vegetables and less meat than did subjects inquartile 1. Dairy intake was positively associated with total intakesof dietary protein (r � 0.51), riboflavin (r � 0.49), and calcium (r �0.52), which are important constituents of dairy products.
Multivariate-adjusted odds ratios (ORs) for metabolic syn-drome and its features across quartiles of dairy intake are shownin Table 5. In model 1, we adjusted for the effect of age, totalenergy intake, percentage of energy from fat, BMI, use of bloodpressure and estrogen medication, smoking, and physical activ-ity. In model 2, we further adjusted for the effect of food groupintake, and we found that the ORs became weaker in model 2.After adjustment for the effect of calcium in model 3, the prob-ability of metabolic syndrome became weaker than it was inmodels 1 and 2. In model 4, when we further adjusted for theeffect of protein intake, no significant change was observed in theORs. A significant trend was observed in all models toward theincidence of metabolic syndrome, enlarged waist circumference,high serum concentrations of triacylglycerol, and elevated bloodpressure.
DISCUSSION
The current study, conducted in a group of inhabitants of thecity of Tehran, showed an inverse relation between dairy con-sumption and metabolic syndrome, enlarged waist circumfer-ence, and hypertension. To our knowledge, this is the third study
TABLE 1Characteristics of the Tehran Lipid and Glucose Study participants by quartiles of dairy intake1
Quartile of dairy intake
P21 (n � 206) 2 (n � 204) 3 (n � 210) 4 (n � 207)
Women (%) 61 63 51 45 � 0.05Age (y) 37 � 123 38 � 12 38 � 12 38 � 12 0.71BMI (kg/m2) 26.7 � 4.4 26.8 � 4.1 25.6 � 4.14 24.9 � 4.05 � 0.01Waist girth (cm) 87 � 116 85 � 11 84 � 11 83 � 11 � 0.01Physical activity (%)
Light 56 56 55 57 0.81Moderate 29 30 31 29 0.79Heavy 15 14 14 14 0.74
Obesity (%)7 23 20 18 17 � 0.04Current daily smokers (%) 13 8 8 16 � 0.05
1 Cutoffs were �1.7, 1.7 to �2.3, 2.3 to �3.1, and �3.1 servings/d for quartiles 1–4, respectively.2 P for differences among dairy quartiles (ANOVA with Tukey’s test for data that are x� � SD and chi-square for data that are percentages).3 X� � SD (all such values).4 Significantly different from first and second quartiles, P � 0.05.5 Significantly different from the other quartiles, P � 0.01.6 Significantly different from the third and fourth quartiles, P � 0.01.7 Defined as BMI � 30.
DAIRY CONSUMPTION AND THE METABOLIC SYNDROME 525
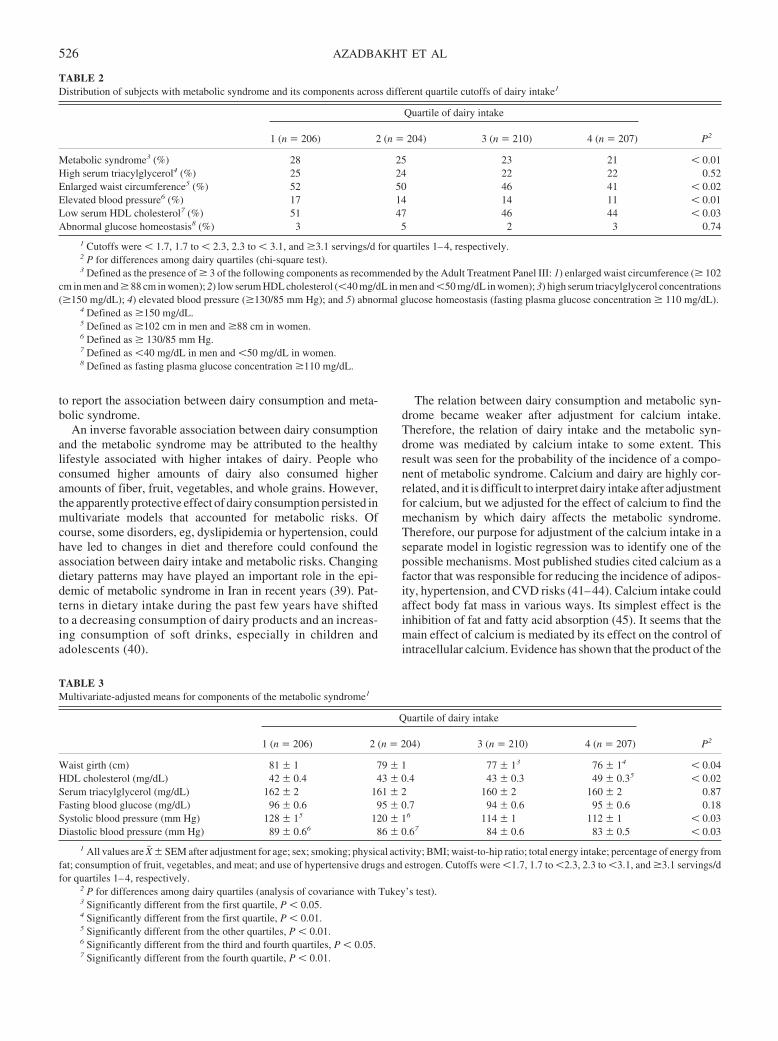
to report the association between dairy consumption and meta-bolic syndrome.
An inverse favorable association between dairy consumptionand the metabolic syndrome may be attributed to the healthylifestyle associated with higher intakes of dairy. People whoconsumed higher amounts of dairy also consumed higheramounts of fiber, fruit, vegetables, and whole grains. However,the apparently protective effect of dairy consumption persisted inmultivariate models that accounted for metabolic risks. Ofcourse, some disorders, eg, dyslipidemia or hypertension, couldhave led to changes in diet and therefore could confound theassociation between dairy intake and metabolic risks. Changingdietary patterns may have played an important role in the epi-demic of metabolic syndrome in Iran in recent years (39). Pat-terns in dietary intake during the past few years have shiftedto a decreasing consumption of dairy products and an increas-ing consumption of soft drinks, especially in children andadolescents (40).
The relation between dairy consumption and metabolic syn-drome became weaker after adjustment for calcium intake.Therefore, the relation of dairy intake and the metabolic syn-drome was mediated by calcium intake to some extent. Thisresult was seen for the probability of the incidence of a compo-nent of metabolic syndrome. Calcium and dairy are highly cor-related, and it is difficult to interpret dairy intake after adjustmentfor calcium, but we adjusted for the effect of calcium to find themechanism by which dairy affects the metabolic syndrome.Therefore, our purpose for adjustment of the calcium intake in aseparate model in logistic regression was to identify one of thepossible mechanisms. Most published studies cited calcium as afactor that was responsible for reducing the incidence of adipos-ity, hypertension, and CVD risks (41–44). Calcium intake couldaffect body fat mass in various ways. Its simplest effect is theinhibition of fat and fatty acid absorption (45). It seems that themain effect of calcium is mediated by its effect on the control ofintracellular calcium. Evidence has shown that the product of the
TABLE 2Distribution of subjects with metabolic syndrome and its components across different quartile cutoffs of dairy intake1
Quartile of dairy intake
P21 (n � 206) 2 (n � 204) 3 (n � 210) 4 (n � 207)
Metabolic syndrome3 (%) 28 25 23 21 � 0.01High serum triacylglycerol4 (%) 25 24 22 22 0.52Enlarged waist circumference5 (%) 52 50 46 41 � 0.02Elevated blood pressure6 (%) 17 14 14 11 � 0.01Low serum HDL cholesterol7 (%) 51 47 46 44 � 0.03Abnormal glucose homeostasis8 (%) 3 5 2 3 0.74
1 Cutoffs were � 1.7, 1.7 to � 2.3, 2.3 to � 3.1, and �3.1 servings/d for quartiles 1–4, respectively.2 P for differences among dairy quartiles (chi-square test).3 Defined as the presence of � 3 of the following components as recommended by the Adult Treatment Panel III: 1) enlarged waist circumference (� 102
cm in men and � 88 cm in women); 2) low serum HDL cholesterol (�40 mg/dL in men and �50 mg/dL in women); 3) high serum triacylglycerol concentrations(�150 mg/dL); 4) elevated blood pressure (�130/85 mm Hg); and 5) abnormal glucose homeostasis (fasting plasma glucose concentration � 110 mg/dL).
4 Defined as �150 mg/dL.5 Defined as �102 cm in men and �88 cm in women.6 Defined as � 130/85 mm Hg.7 Defined as �40 mg/dL in men and �50 mg/dL in women.8 Defined as fasting plasma glucose concentration �110 mg/dL.
TABLE 3Multivariate-adjusted means for components of the metabolic syndrome1
Quartile of dairy intake
P21 (n � 206) 2 (n � 204) 3 (n � 210) 4 (n � 207)
Waist girth (cm) 81 � 1 79 � 1 77 � 13 76 � 14 � 0.04HDL cholesterol (mg/dL) 42 � 0.4 43 � 0.4 43 � 0.3 49 � 0.35 � 0.02Serum triacylglycerol (mg/dL) 162 � 2 161 � 2 160 � 2 160 � 2 0.87Fasting blood glucose (mg/dL) 96 � 0.6 95 � 0.7 94 � 0.6 95 � 0.6 0.18Systolic blood pressure (mm Hg) 128 � 15 120 � 16 114 � 1 112 � 1 � 0.03Diastolic blood pressure (mm Hg) 89 � 0.66 86 � 0.67 84 � 0.6 83 � 0.5 � 0.03
1 All values are X� � SEM after adjustment for age; sex; smoking; physical activity; BMI; waist-to-hip ratio; total energy intake; percentage of energy fromfat; consumption of fruit, vegetables, and meat; and use of hypertensive drugs and estrogen. Cutoffs were �1.7, 1.7 to �2.3, 2.3 to �3.1, and �3.1 servings/dfor quartiles 1–4, respectively.
2 P for differences among dairy quartiles (analysis of covariance with Tukey’s test).3 Significantly different from the first quartile, P � 0.05.4 Significantly different from the first quartile, P � 0.01.5 Significantly different from the other quartiles, P � 0.01.6 Significantly different from the third and fourth quartiles, P � 0.05.7 Significantly different from the fourth quartile, P � 0.01.
526 AZADBAKHT ET AL
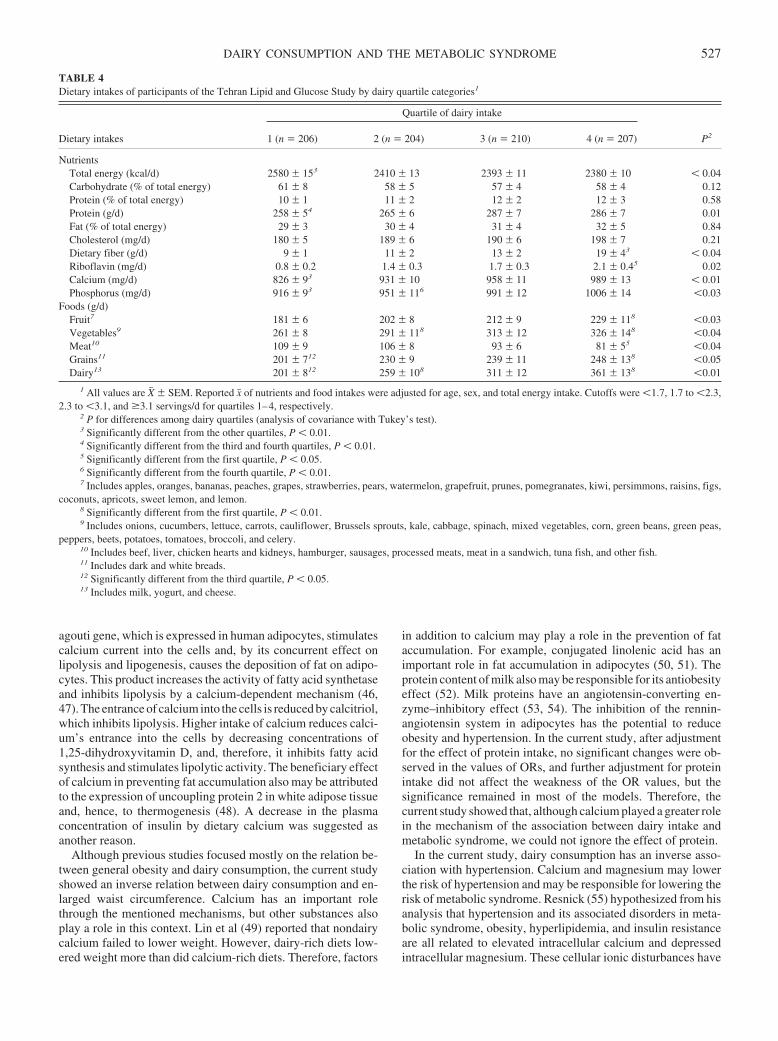
agouti gene, which is expressed in human adipocytes, stimulatescalcium current into the cells and, by its concurrent effect onlipolysis and lipogenesis, causes the deposition of fat on adipo-cytes. This product increases the activity of fatty acid synthetaseand inhibits lipolysis by a calcium-dependent mechanism (46,47). The entrance of calcium into the cells is reduced by calcitriol,which inhibits lipolysis. Higher intake of calcium reduces calci-um’s entrance into the cells by decreasing concentrations of1,25-dihydroxyvitamin D, and, therefore, it inhibits fatty acidsynthesis and stimulates lipolytic activity. The beneficiary effectof calcium in preventing fat accumulation also may be attributedto the expression of uncoupling protein 2 in white adipose tissueand, hence, to thermogenesis (48). A decrease in the plasmaconcentration of insulin by dietary calcium was suggested asanother reason.
Although previous studies focused mostly on the relation be-tween general obesity and dairy consumption, the current studyshowed an inverse relation between dairy consumption and en-larged waist circumference. Calcium has an important rolethrough the mentioned mechanisms, but other substances alsoplay a role in this context. Lin et al (49) reported that nondairycalcium failed to lower weight. However, dairy-rich diets low-ered weight more than did calcium-rich diets. Therefore, factors
in addition to calcium may play a role in the prevention of fataccumulation. For example, conjugated linolenic acid has animportant role in fat accumulation in adipocytes (50, 51). Theprotein content of milk also may be responsible for its antiobesityeffect (52). Milk proteins have an angiotensin-converting en-zyme–inhibitory effect (53, 54). The inhibition of the rennin-angiotensin system in adipocytes has the potential to reduceobesity and hypertension. In the current study, after adjustmentfor the effect of protein intake, no significant changes were ob-served in the values of ORs, and further adjustment for proteinintake did not affect the weakness of the OR values, but thesignificance remained in most of the models. Therefore, thecurrent study showed that, although calcium played a greater rolein the mechanism of the association between dairy intake andmetabolic syndrome, we could not ignore the effect of protein.
In the current study, dairy consumption has an inverse asso-ciation with hypertension. Calcium and magnesium may lowerthe risk of hypertension and may be responsible for lowering therisk of metabolic syndrome. Resnick (55) hypothesized from hisanalysis that hypertension and its associated disorders in meta-bolic syndrome, obesity, hyperlipidemia, and insulin resistanceare all related to elevated intracellular calcium and depressedintracellular magnesium. These cellular ionic disturbances have
TABLE 4Dietary intakes of participants of the Tehran Lipid and Glucose Study by dairy quartile categories1
Dietary intakes
Quartile of dairy intake
P21 (n � 206) 2 (n � 204) 3 (n � 210) 4 (n � 207)
NutrientsTotal energy (kcal/d) 2580 � 153 2410 � 13 2393 � 11 2380 � 10 � 0.04Carbohydrate (% of total energy) 61 � 8 58 � 5 57 � 4 58 � 4 0.12Protein (% of total energy) 10 � 1 11 � 2 12 � 2 12 � 3 0.58Protein (g/d) 258 � 54 265 � 6 287 � 7 286 � 7 0.01Fat (% of total energy) 29 � 3 30 � 4 31 � 4 32 � 5 0.84Cholesterol (mg/d) 180 � 5 189 � 6 190 � 6 198 � 7 0.21Dietary fiber (g/d) 9 � 1 11 � 2 13 � 2 19 � 43 � 0.04Riboflavin (mg/d) 0.8 � 0.2 1.4 � 0.3 1.7 � 0.3 2.1 � 0.45 0.02Calcium (mg/d) 826 � 93 931 � 10 958 � 11 989 � 13 � 0.01Phosphorus (mg/d) 916 � 93 951 � 116 991 � 12 1006 � 14 �0.03
Foods (g/d)Fruit7 181 � 6 202 � 8 212 � 9 229 � 118 �0.03Vegetables9 261 � 8 291 � 118 313 � 12 326 � 148 �0.04Meat10 109 � 9 106 � 8 93 � 6 81 � 55 �0.04Grains11 201 � 712 230 � 9 239 � 11 248 � 138 �0.05Dairy13 201 � 812 259 � 108 311 � 12 361 � 138 �0.01
1 All values are X� � SEM. Reported x� of nutrients and food intakes were adjusted for age, sex, and total energy intake. Cutoffs were �1.7, 1.7 to �2.3,2.3 to �3.1, and �3.1 servings/d for quartiles 1–4, respectively.
2 P for differences among dairy quartiles (analysis of covariance with Tukey’s test).3 Significantly different from the other quartiles, P � 0.01.4 Significantly different from the third and fourth quartiles, P � 0.01.5 Significantly different from the first quartile, P � 0.05.6 Significantly different from the fourth quartile, P � 0.01.7 Includes apples, oranges, bananas, peaches, grapes, strawberries, pears, watermelon, grapefruit, prunes, pomegranates, kiwi, persimmons, raisins, figs,
coconuts, apricots, sweet lemon, and lemon.8 Significantly different from the first quartile, P � 0.01.9 Includes onions, cucumbers, lettuce, carrots, cauliflower, Brussels sprouts, kale, cabbage, spinach, mixed vegetables, corn, green beans, green peas,
peppers, beets, potatoes, tomatoes, broccoli, and celery.10 Includes beef, liver, chicken hearts and kidneys, hamburger, sausages, processed meats, meat in a sandwich, tuna fish, and other fish.11 Includes dark and white breads.12 Significantly different from the third quartile, P � 0.05.13 Includes milk, yogurt, and cheese.
DAIRY CONSUMPTION AND THE METABOLIC SYNDROME 527
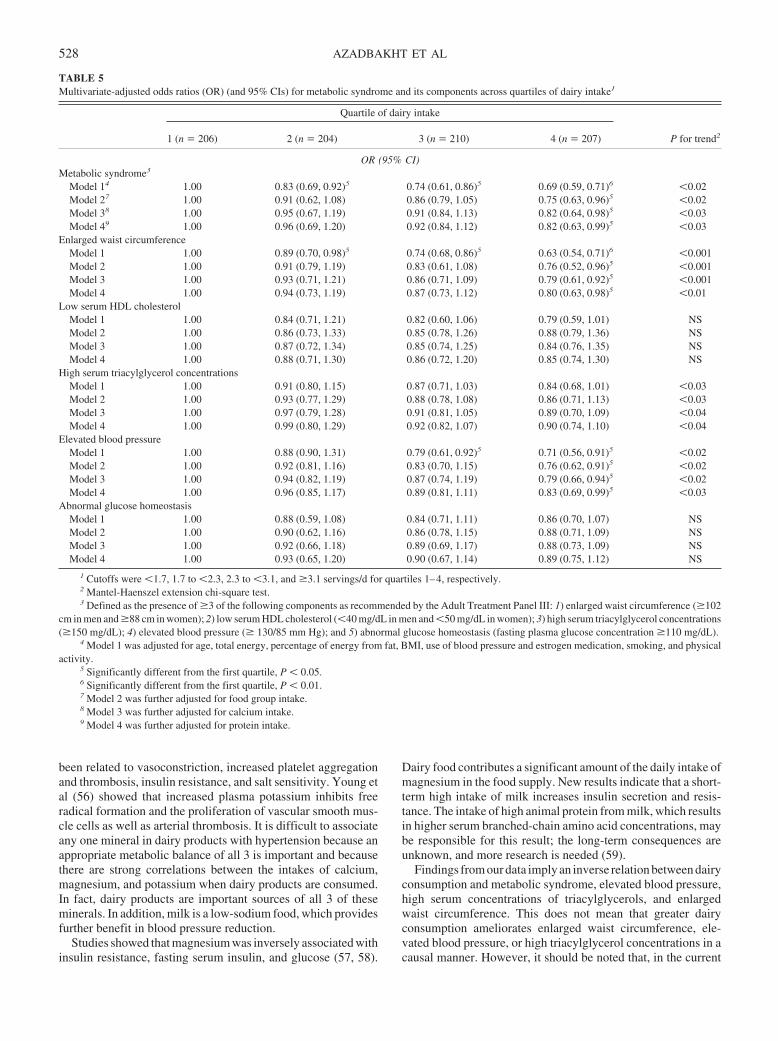
been related to vasoconstriction, increased platelet aggregationand thrombosis, insulin resistance, and salt sensitivity. Young etal (56) showed that increased plasma potassium inhibits freeradical formation and the proliferation of vascular smooth mus-cle cells as well as arterial thrombosis. It is difficult to associateany one mineral in dairy products with hypertension because anappropriate metabolic balance of all 3 is important and becausethere are strong correlations between the intakes of calcium,magnesium, and potassium when dairy products are consumed.In fact, dairy products are important sources of all 3 of theseminerals. In addition, milk is a low-sodium food, which providesfurther benefit in blood pressure reduction.
Studies showed that magnesium was inversely associated withinsulin resistance, fasting serum insulin, and glucose (57, 58).
Dairy food contributes a significant amount of the daily intake ofmagnesium in the food supply. New results indicate that a short-term high intake of milk increases insulin secretion and resis-tance. The intake of high animal protein from milk, which resultsin higher serum branched-chain amino acid concentrations, maybe responsible for this result; the long-term consequences areunknown, and more research is needed (59).
Findings from our data imply an inverse relation between dairyconsumption and metabolic syndrome, elevated blood pressure,high serum concentrations of triacylglycerols, and enlargedwaist circumference. This does not mean that greater dairyconsumption ameliorates enlarged waist circumference, ele-vated blood pressure, or high triacylglycerol concentrations in acausal manner. However, it should be noted that, in the current
TABLE 5Multivariate-adjusted odds ratios (OR) (and 95% CIs) for metabolic syndrome and its components across quartiles of dairy intake1
Quartile of dairy intake
P for trend21 (n � 206) 2 (n � 204) 3 (n � 210) 4 (n � 207)
OR (95% CI)Metabolic syndrome3
Model 14 1.00 0.83 (0.69, 0.92)5 0.74 (0.61, 0.86)5 0.69 (0.59, 0.71)6 �0.02Model 27 1.00 0.91 (0.62, 1.08) 0.86 (0.79, 1.05) 0.75 (0.63, 0.96)5 �0.02Model 38 1.00 0.95 (0.67, 1.19) 0.91 (0.84, 1.13) 0.82 (0.64, 0.98)5 �0.03Model 49 1.00 0.96 (0.69, 1.20) 0.92 (0.84, 1.12) 0.82 (0.63, 0.99)5 �0.03
Enlarged waist circumferenceModel 1 1.00 0.89 (0.70, 0.98)5 0.74 (0.68, 0.86)5 0.63 (0.54, 0.71)6 �0.001Model 2 1.00 0.91 (0.79, 1.19) 0.83 (0.61, 1.08) 0.76 (0.52, 0.96)5 �0.001Model 3 1.00 0.93 (0.71, 1.21) 0.86 (0.71, 1.09) 0.79 (0.61, 0.92)5 �0.001Model 4 1.00 0.94 (0.73, 1.19) 0.87 (0.73, 1.12) 0.80 (0.63, 0.98)5 �0.01
Low serum HDL cholesterolModel 1 1.00 0.84 (0.71, 1.21) 0.82 (0.60, 1.06) 0.79 (0.59, 1.01) NSModel 2 1.00 0.86 (0.73, 1.33) 0.85 (0.78, 1.26) 0.88 (0.79, 1.36) NSModel 3 1.00 0.87 (0.72, 1.34) 0.85 (0.74, 1.25) 0.84 (0.76, 1.35) NSModel 4 1.00 0.88 (0.71, 1.30) 0.86 (0.72, 1.20) 0.85 (0.74, 1.30) NS
High serum triacylglycerol concentrationsModel 1 1.00 0.91 (0.80, 1.15) 0.87 (0.71, 1.03) 0.84 (0.68, 1.01) �0.03Model 2 1.00 0.93 (0.77, 1.29) 0.88 (0.78, 1.08) 0.86 (0.71, 1.13) �0.03Model 3 1.00 0.97 (0.79, 1.28) 0.91 (0.81, 1.05) 0.89 (0.70, 1.09) �0.04Model 4 1.00 0.99 (0.80, 1.29) 0.92 (0.82, 1.07) 0.90 (0.74, 1.10) �0.04
Elevated blood pressureModel 1 1.00 0.88 (0.90, 1.31) 0.79 (0.61, 0.92)5 0.71 (0.56, 0.91)5 �0.02Model 2 1.00 0.92 (0.81, 1.16) 0.83 (0.70, 1.15) 0.76 (0.62, 0.91)5 �0.02Model 3 1.00 0.94 (0.82, 1.19) 0.87 (0.74, 1.19) 0.79 (0.66, 0.94)5 �0.02Model 4 1.00 0.96 (0.85, 1.17) 0.89 (0.81, 1.11) 0.83 (0.69, 0.99)5 �0.03
Abnormal glucose homeostasisModel 1 1.00 0.88 (0.59, 1.08) 0.84 (0.71, 1.11) 0.86 (0.70, 1.07) NSModel 2 1.00 0.90 (0.62, 1.16) 0.86 (0.78, 1.15) 0.88 (0.71, 1.09) NSModel 3 1.00 0.92 (0.66, 1.18) 0.89 (0.69, 1.17) 0.88 (0.73, 1.09) NSModel 4 1.00 0.93 (0.65, 1.20) 0.90 (0.67, 1.14) 0.89 (0.75, 1.12) NS
1 Cutoffs were �1.7, 1.7 to �2.3, 2.3 to �3.1, and �3.1 servings/d for quartiles 1–4, respectively.2 Mantel-Haenszel extension chi-square test.3 Defined as the presence of �3 of the following components as recommended by the Adult Treatment Panel III: 1) enlarged waist circumference (�102
cm in men and �88 cm in women); 2) low serum HDL cholesterol (�40 mg/dL in men and �50 mg/dL in women); 3) high serum triacylglycerol concentrations(�150 mg/dL); 4) elevated blood pressure (� 130/85 mm Hg); and 5) abnormal glucose homeostasis (fasting plasma glucose concentration �110 mg/dL).
4 Model 1 was adjusted for age, total energy, percentage of energy from fat, BMI, use of blood pressure and estrogen medication, smoking, and physicalactivity.
5 Significantly different from the first quartile, P � 0.05.6 Significantly different from the first quartile, P � 0.01.7 Model 2 was further adjusted for food group intake.8 Model 3 was further adjusted for calcium intake.9 Model 4 was further adjusted for protein intake.
528 AZADBAKHT ET AL
study, although we did not separate high- and low-fat dairy prod-ucts, we did control for the effect of fat intake on our data.Although low-fat dairy products are available today in Iran, only2.5%-fat dairy products were available when the data for thecurrent study were gathered (1999–2000). We adjusted for theeffect of fat intake in all analyses. Because butter is categorizedin the fat group and not in the dairy group (60), we did not includebutter in our analysis as a dairy product. The amount of fat inIranian ice cream is high. Many kinds of ice cream in Iran are notproduced from milk but, rather, are fruit-based ice creams. Be-cause in our data the kind of ice cream was not separated, we didnot include ice cream in our analysis as a dairy product. Inaddition, the amount of ice cream consumption was low, whichis another reason for its exclusion as a dairy food.
Two previous studies were conducted in this field, one cross-sectional and one prospective. In the cross-sectional study, theeffects of confounders such as physical activity and the intake ofother food groups, such as vegetables and fruit, were not consid-ered (11). However, in the current study, we adjusted for theeffect of different lifestyle factors, and we observed the associ-ation in separated models that were further adjusted for the in-takes of other food groups, calcium, and protein. In the prospec-tive study, the longitudinal design compared the 10-y cumulativeincidence of insulin resistance syndrome across dairy categories(12). However, we were unable to conclude in the current studythat a higher dairy intake reduces the incidence of metabolicsyndrome in a causal manner and in a longitudinal design.
Several limitations should be considered when examining theresults of the current study. We used cross-sectional data toidentify the association of dairy consumption with the metabolicsyndrome, whereas future studies that use longitudinal data willprovide stronger evidence on this association. It must be kept inmind, however, that appropriate analysis of cross-sectional datarepresents a valuable initial step in identifying relations betweendiet and disease. Moreover, prospective cohort studies and clin-ical trials have their own weaknesses. High consumption of dairyproducts appears to reflect an overall healthier lifestyle that maynot have been accurately captured and controlled for in our anal-ysis, and this omission would result in residual confounding.Subjects with known CVD, diabetes, or stroke were excludedfrom the study. These exclusions may have reduced the likeli-hood of finding significant trends in the odds of metabolic risksacross quartiles of dairy consumption. In addition, chronic dis-eases such as metabolic syndrome are heterogeneous, and, alongwith dietary patterns, factors such as heredity may need to beconsidered. In addition, most of the risk factors are interrelatedand could confound the relation between dairy consumption andmetabolic risk factors.
The current study has several strengths, including the use of apopulation sample that is representative of Tehran, the use oflogistic regression models and simultaneous adjustment of con-founding variables in the association of dairy consumption withmetabolic syndrome, and the finding of a cross-sectional relationbetween dairy intake and metabolic syndrome and some of itsfeatures, such as hypertension and enlarged waist circumference.In conclusion, we found evidence indicative of an inverse rela-tion between dairy consumption and metabolic syndrome. It isrecommended that future studies assess this issue further byaddressing the components of dairy products and related mech-anisms of action that are responsible for this effect (11).
We thank the participants in the Tehran Lipid and Glucose Study for theirenthusiastic support and the staff of the Endocrine Research Center, TehranLipid and Glucose Study Unit, for their valuable help in the conduct of thisstudy.
LA, PM, and AE designed the study, collected and analyzed the data, andwrote the manuscript. FA supervised the research. None of the authors hadany personal or financial conflicts of interest.
REFERENCES1. Sarraf-Zadegan N, Boshtam M, Malekafzali H, et al. Secular trends in
cardiovascular mortality in Iran, with special reference to Isfahan. ActaCardiol 1999;54:327–33.
2. Azizi F, Rahmani M, Emami H, et al. Cardiovascular risk factors in anIranian urban population: Tehran Lipid and Glucose Study. Soc PrevMed 2002;47:408–26.
3. Reaven GM. Banting lecture 1988. Role of insulin resistance in humandisease. Diabetes 1988;37:1595–607.
4. Arslanian S, Suprasongsin C. Insulin sensitivity, lipids, and body com-position: is syndrome X present? J Clin Endocrinol Metab 1996;81:1058–62.
5. Young-Hyman D, Schlundt DG, Herman L, De Luca F, Counts D.Evaluation of the insulin resistance syndrome in 5- to 10-year-oldoverweight/obese African-American children. Diabetes Care 2001;24:1359–64.
6. Azizi F, Salehi P, Etemadi A, Zahedi-Asl S. Prevalence of metabolicsyndrome in an urban population: Tehran Lipid and Glucose Study.Diabetes Res Clin Pract 2003;61:29–37.
7. Ford ES, Giles WH, Dietz WH. Prevalence of the metabolic syndromeamong US adults: findings from the third National Health and NutritionExamination Survey. JAMA 2002;287:356–9.
8. Hollenberg NK. Genetic versus environmental etiology of the metabolicsyndrome among male and female twins. Curr Hypertens Rep 2002;4:178.
9. Vessby B. Dietary fat and insulin action in humans. Br J Nutr 2000;83:591–6.
10. Connor W. Importance of n�3 fatty acids in health and disease. Am JClin Nutr 2000;47:419–25.
11. Mennen L, Lafay L, Feskens EJ, Novak M, Lepinary P, Balkau B.Possible protective effect of bread and dairy products on the risk of themetabolic syndrome. Nutr Res 2000;20:335–47.
12. Pereira MA, Jacobs DR Jr, Van Horn L, Slattery ML, Kartashov AI,Ludwig DS. Dairy consumption, obesity, and the insulin resistance syn-drome in young adults: the CARDIA Study. JAMA 2002;287:2081–9.
13. Rimm EB, Willett WC, Hu FB, et al. Folate and vitamin B6 from diet andsupplements in relation to risk of coronary heart disease among women.JAMA 1998;281:359–64.
14. Wolk A, Manson JE, Stampfer MJ, et al. Long-term intake of dietaryfiber and decreased risk of coronary heart disease among women. JAMA1999;281:1998–2004.
15. Azizi F, Mirmiran P, Azadbakht L. Predictors of cardiovascular riskfactors in Tehranian adolescents: Tehran Lipid and Glucose Study. Int JVitam Nutr Res 2004;74:307–12.
16. Azadbakht L, Mirmiran P, Azizi F. predictors of cardiovascular riskfactors in Tehranian adults: diet and life style. East Meditter Health J (inpress).
17. Hajjar IM, Grim CE, Kotchen TA. Dietary calcium lowers the age-related rise in blood pressure in the United States: the NHANES IIIsurvey. J Clin Hypertens 2003;5:122–6.
18. Jorde R, Bonna KH. Calcium from dairy products, vitamin D intake, andblood pressure: the Tromso Study. Am J Clin Nutr 2000;71:1530–5.
19. Loos RJ, Rankinen T, Leon AS, et al. Calcium intake is associated withadiposity in black and white men and white women of the HERITAGEFamily Study. J Nutr 2004;134:1772–8.
20. Zemel MB, Miller SL. Dietary calcium and dairy modulation of adipos-ity and obesity risk. Nutr Rev 2004;62:125–31.
21. Ness AR, Smith GD, Hart C. Milk, coronary heart disease and mortality.J Epidemiol Community Health 2001;55:379–82.
22. Iso H, Stampfer MJ, Manson JE, et al. Prospective study of calcium,potassium, and magnesium intake and risk of stroke in women. Stroke1999;30:1772–9.
23. Mirmiran P, Esmaillzadeh A, Azizi F. Dairy consumption and body mass
DAIRY CONSUMPTION AND THE METABOLIC SYNDROME 529
index: an inverse relationship. Int J Obes Relat Metab Disord 2005;29:115–21.
24. Esmaillzadeh A, Mirmiran P, Azadbakht L, Azizi F. Dietary intake ofcalcium, magnesium and potassium in relation to blood pressure: TehranLipid and Glucose Study. Irn J Endocrinol Metab 2004;5:315–24 (inFarsi).
25. Azizi F, Rahmani M, Emami H, Madjid M. Tehran Lipid and GlucoseStudy: rationale and design. CVD Prev 2000;3:242–7.
26. Fung TT, Hu FB, Pereira MA, et al. Whole-grain intake and the risk oftype 2 diabetes: a prospective study in men. Am J Clin Nutr 2002;76:535–40.
27. Kimiagar SM, Ghaffarpour M, Houshiar-Rad A, Hormozdyari H, Zel-lipour L. Food consumption pattern in the Islamic Republic of Iran andits relation to coronary heart disease. East Mediterr Health J 1998;4:539–47.
28. National Food Consumption Survey. Tehran, Iran: National Nutritionand Food Technology Research Institute, 1995.
29. Ghaffarpour M, Houshiar-Rad A, Kianfar H. The manual for householdmeasures, cooking yields factors and edible portion of foods. Tehran,Iran: Keshaverzi Press, 1999 (in Farsi).
30. USDA. Food Guide Pyramid. Washington, DC: US Department of Ag-riculture. Internet: http://www.usda.gov/cnpp/pyramid.html (accessed12 December 2004).
31. Mirmiran P. Principles of dietary planning. Tehran, Iran: EndocrineResearch Center, 2001 (in Farsi).
32. Esmaillzadeh A, Mirmiran P, Azizi F. Waist-to-hip ratio is a betterscreening measure for cardiovascular risk factors than other anthropo-metric indicators in Tehranian adult men. Int J Obes Relat Metab Disord2004;28:1325–32.
33. Azizi F, Ghanbarian A, Madjid M, Rahmani M. Distribution of bloodpressure and prevalence of hypertension in Tehran adult population:Tehran Lipid and Glucose Study, 1999–2000. J Hum Hypertens 2002;16:305–12.
34. Azizi F, Emami H, Salehi P, et al. Cardiovascular risk factors in theelderly: the Tehran Lipid and Glucose Study. J Cardiovasc Risk 2003;10:65–73.
35. Mirmiran P, Mohammadi F, Allahverdian S, Azizi F. Estimation ofenergy requirements for adults: Tehran Lipid and Glucose Study. Int JVitam Nutr Res 2003;73:193–200.
36. Azizi F, Rahmani M, Ghanbarian A, et al. Serum lipid levels in an Iranianadult population: Tehran Lipid and Glucose Study. Eur J Epidemiol2003;18:311–9.
37. Friedewald WT, Levy RI, Fredrickson DS. Estimation of the concen-tration of low-density lipoprotein cholesterol in plasma, without use ofthe preparative ultracentrifuge. Clin Chem 1972;18:499–502.
38. National Cholesterol Education Program (NCEP) Expert Panel on De-tection, Evaluation, and Treatment of High Blood Cholesterol in Adults(Adults Treatment Panel III). Third report of the National CholesterolEducation Program (NCEP) Expert Panel on detection, evaluation, andtreatment of high blood cholesterol in adults. Circulation 2002;106:3143–421.
39. Ghassemi H, Harison G, Mohammad K. An accelerated nutrition in Iran.Public Health Nutr 2002;5:149–55.
40. Azadbakht L, Mirmiran P, Momenan AA, Azizi F. Knowledge, attitudeand practice of adolescents regarding the role of nutrition in non-communication disease. Iran J Endocrinol Metab 2004;5:409–16 (inFarsi).
41. Zemel MB, Shi H, Greer B, Dirienzo D, Zemel PC. Regulation of adi-posity by dietary calcium. FASEB J 2000;14:1132–8.
42. Bursey RG, Sharkey T, Miller GD. High calcium intake lowers weightin lean and fatty zucker rats. FASEB J 1989;3137:A265 (abstr).
43. McCarron DA, Morris CD, Henry HJ, Stanton JL. Blood pressure andnutrient intake in the United States. Science 1984;224:1392–8.
44. Fleming KH, Heimbach JT. Consumption of calcium in the US: foodsources and intake levels. J Nutr 1994;124:1426–30S.
45. Welberg JWM, Monkelbaan JF, de Vries EGE, et al. Effects of supple-mental dietary calcium on quantitative and qualitative fecal fat excretionin man. Ann Nutr Metab 1994;38:185–91.
46. Comuzzie AG, Allison DB. The search for human obesity genes. Science1998;280:1374–7.
47. Xue B, Moustaid-Moussa N, Wilkinson WD, Zemel MB. The agoutigene product inhibits lipolysis in human adipocytes via a Ca2�-dependent mechanism. FASEB J 1998;12:1391–6.
48. Shi H, Dirienzo D, Zemel MB. Effects of dietary calcium on adipocytelipid metabolism and body weight regulation in energy-restricted ap2-agouti transgenic mice. FASEB J 2000;8:291–30.
49. Lin YC, Lyle RM, McCabe LD, McCabe GP, Weaver CM, Teegarden D.Dairy calcium is related to changes in body composition during a two-year exercise intervention in young women. J Am Coll Nutr 2000;19:754–60.
50. Awad AB, Bernardis LL, Fink CS. Failure to demonstrate an effect ofdietary fatty acid composition on body weight, body composition and pa-rameters of lipid metabolism in mature rats. J Nutr 1990;120:1277–82.
51. Belury MA, Kempa-Steezko A. Conjugated linoleic acid modulateshepatic lipid composition in mice. Lipids 1997;32:199–204.
52. Trichopoulou A, Gnardellis C, Bentou V, Lagiou P, Bamia C, Tricho-poulos D. Lipid, protein and carbohydrate intake in relation to body massindex. Eur J Clin Nutr 2002;56:37–43.
53. Pihlanto-Leppala A, Koskinen P, Piilola K, Tspasela T, Korhonen H.Angiotensin-I converting enzyme inhibitory properties of whey proteindigests: concentration and characterization of active peptides. J DairyRes 2000;96:53–4.
54. Mullally M, Meisel H, Fitzgerald R. Angiotensin-I converting enzymeinhibitory activities of gastric and pancreatic proteinase digests of wheyprotein. Int Dairy J 1997;2:299–303.
55. Resnick L. The cellular ionic basis of hypertension and allied clinicalconditions. Prog Cardiovasc Dis 1999;42:1–22.
56. Young DB, Lin H, Mc Cabe RD. Potassium’s cardiovascular protectivemechanisms. Am J Physiol 1995;37:R825–37.
57. Ma J, Folsom AR, Melnick SL, et al. Associations of serum and dietarymagnesium with cardiovascular disease, hypertension, diabetes, insulinand carotid arterial wall thickness: the ARIC study. J Clin Epidemiol1995;48:927–40.
58. Humpries S, Kushner H, Falkner B. Low dietary magnesium is associ-ated with insulin resistance in a sample of young, nondiabetic blackAmericans. Am J Hypertens 1999;12:747–56.
59. Hoppe C, Molgaard C, Vaag A, Barkholt V, Michaelsen KF. Highintakes of milk, but not meat, increase s-insulin and insulin resistance in8-year-old boys. Eur J Clin Nutr 2005;59:398–8. (Advance online pub-lication, 17 November 2004.)
60. Willett WC. Eat, drink, and be healthy. New York: Simon & Schuster,2001.
530 AZADBAKHT ET AL
Lower serum albumin concentration and change in muscle mass:the Health, Aging and Body Composition Study1–3
Marjolein Visser, Stephen B Kritchevsky, Anne B Newman, Bret H Goodpaster, Frances A Tylavsky, Michael C Nevitt,and Tamara B Harris, for the Health, Aging and Body Composition Study
ABSTRACTBackground: Low albumin concentrations in older persons in-crease the risk of poor health outcomes, including functional decline.Objective: The aim of the study was to investigate the associationbetween serum albumin concentration and skeletal muscle loss (sar-copenia) in old age.Design: Serum albumin concentration was measured in 1882 blackand white men and women aged 70–79 y participating in the Health,Aging and Body Composition Study. Five-year changes in appen-dicular skeletal muscle mass (ASMM), total-body fat-free mass(FFM), and trunk lean mass (TLM) were measured by using dual-energy X-ray absorptiometry. Confounders included health and life-style factors, which are markers of inflammation and protein intake.Results: A low albumin concentration (�38 g/L) was observed in21.2% of the study participants. After adjustment for confounders,the mean (�SE) change in ASMM was �82 � 26 g per 3-g/L loweralbumin concentration (P � 0.002). This association remained afterpersons with a low albumin concentration (�38 g/L) were excluded.The decline in ASMM in subjects with low albumin concentrationswas almost 30% higher (�930 � 56 g) than that in those withalbumin concentrations �42 g/L (�718 � 38 g; P � 0.01). Theassociation between albumin and change in ASMM remained afteradditional adjustment for weight change. A weak association wasobserved for FFM, whereas no association was observed for TLM,which suggests a specific role of albumin in skeletal muscle change.Conclusions: Lower albumin concentrations, even above the clin-ical cutoff of 38 g/L, are associated with future loss of ASMM inolder persons. Low albumin concentration may be a risk factor forsarcopenia. Am J Clin Nutr 2005;82:531–7.
KEY WORDS Sarcopenia, dual-energy X-ray absorptiom-etry, body composition, aging, protein, inflammation
INTRODUCTION
Low albumin concentrations are commonly observed in olderpersons and are associated with worse health outcomes and mor-tality (1–4). Low albumin concentration has been used as amarker of (protein) malnutrition (5). However, the finding thatlow albumin predicts cardiovascular disease risk (6, 7) and therealization that low albumin is not completely normalized infeeding studies (8) has led to research on other aspects of albuminmetabolism. Albumin is a negative acute phase protein that de-creases with ongoing inflammation (9), and many of the reported
associations with albumin may reflect this. Albumin concentra-tion and clinical assessments of nutritional status may reflectdifferent clinical processes (10).
Several studies in patient groups or population samples haveshown a relation between low albumin concentration and poorfunctional status in older persons (11, 12). Even among nondis-abled older persons, lower albumin concentrations have beenshown to be independently associated with poorer performanceas assessed by objective physical performance tests (13). Lowalbumin concentration is also predictive of a greater decline infunctional status (14).
Albumin concentrations have also been related to muscle char-acteristics,whichcouldpotentiallyexplain theassociationwithpoorfunctional status. Cross-sectional studies in older persons haveshown a positive association of albumin with appendicular skeletalmuscle mass (ASMM) assessed by dual-energy X-ray absorptiom-etry (DXA)(15,16)andwithcalfmuscleareaassessedbycomputedtomography (17). However, these studies did not adjust for elevatedinflammation status (15, 16) or low protein intake (17), factors thathave been associated with low muscle mass (18–20).
In this prospective study the relation between serum albuminconcentration and 5-y change in skeletal muscle mass was in-vestigated in well-functioning older men and women participat-ing in the Health, Aging and Body Composition Study. In addi-tion, the potential role of protein intake, inflammation status, andweight change was investigated as modulators of this relation.
1 From the Institute of Health Sciences, Faculty of Earth and Life Sciences,Vrije Universiteit, Amsterdam, Netherlands (MV); the Institute for Researchin Extramural Medicine, VU University Medical Center, Amsterdam, Neth-erlands (MV); the Sticht Center on Aging, Wake Forest University School ofMedicine, Winston-Salem, NC (SBK); the Department of Medicine, Uni-versity of Pittsburgh, Pittsburgh, PA (ABN and BHG); the University ofTennessee Health Science Center, Memphis, TN (FAT); the Prevention Sci-ences Group, University of California, San Francisco, San Francisco, CA(MCN); the National Institute on Aging, Laboratory of Epidemiology, De-mography and Biometry, Bethesda, MD (TBH).
2 Supported by National Institute on Aging contracts NO1-AG-6-2101,NO1-AG-6-2103, and NO1-AG-6-2106. The research of MV was madepossible by a fellowship of the Royal Netherlands Academy of Arts andSciences.
3 Reprints not available. Address correspondence to M Visser, Instituteof Health Sciences, Faculty of Earth and Life Sciences, Vrije Universiteit,De Boelelaan 1085, 1081 HV Amsterdam, Netherlands. E-mail:[email protected].
Received March 23, 2005.Accepted for publication May 30, 2005.
531Am J Clin Nutr 2005;82:531–7. Printed in USA. © 2005 American Society for Clinical Nutrition
SUBJECTS AND METHODS
Study population
The study population consists of 3075 well-functioning blackand white men and women aged 70–79 y participating in theHealth, Aging, and Body Composition (Health ABC) Study.White participants were recruited from a random sample ofMedicare beneficiaries residing in zip codes from the metropol-itan areas surrounding Pittsburgh, PA, and Memphis, TN. Blackparticipants were recruited from all age-eligible residents inthese geographic areas. After receiving information describingthe study, potential participants were screened for eligibility.Eligibility criteria included the following: age 70–79 y in therecruitment period from March 1997 to July 1998; self-report ofno difficulty walking one-quarter of a mile or climbing 10 stepswithout resting; no difficulty performing basic activities of dailyliving; no reported use of a cane, walker, crutches or other specialequipment to get around; no history of active treatment for cancerin the previous 3 y; and no plan to move out of the area in thenext 3 y.
Of the 3075 participants, we excluded those with missingbaseline data on albumin concentration (n � 28), those whoreported oral steroids use at baseline (n � 69), and those who hadmissing baseline data on body composition (n � 19). We alsoexcluded those with missing protein intake data obtained at thefirst annual follow-up examination (n � 441). Of the 2518 par-ticipants with complete data, 1882 had 5-y follow-up data onbody composition [n � 1866 for change in ASMM, n � 1784 forchange in total body fat-free mass (FFM), and n � 1849 forchange in trunk lean mass (TLM)]. The reasons for not having5-y follow-up data on body composition were death (n � 250), noclinic examination (home examination n � 262; proxy interviewn � 80), and no contact (n � 42).
The Health ABC Study was reviewed and approved by theInstitutional Review Boards at the University of Tennessee andthe University of Pittsburgh. All participants provided informedconsent before participating in the study.
Albumin and inflammatory markers
Blood samples were collected at the clinic in the morning afterthe subjects had fasted overnight for �8 h. After processing, thespecimens were portioned into cryovials, frozen at �70 °C, andshipped to the Health ABC Core Laboratory at the University ofVermont. Serum albumin concentration was measured by usingthe bromocresol green method (Vitros; Ortho-Clinical Diagnos-tics Inc, Rochester NY). The plasma concentrations of interleu-kin 6 (IL-6) and C-reactive protein (CRP) were used as indicatorsof inflammation status. Plasma IL-6 concentration was measuredin duplicate by means of a commercial enzyme-linked immu-nosorbent assay (ELISA; High Sensitivity HS600 Quantikinekit; R&D Systems Inc, Minneapolis, MN). Serum concentrationsof CRP were also measured in duplicate by ELISA based onpurified protein and polyclonal anti-CRP antibodies(Calbiochem-Novabiochem Corp, San Diego, CA). The CRPassay was standardized according to the World Health Organi-zation’s First International Reference Standard and had a sensi-tivity of 0.08 �g/mL. Assays of blind duplicates collected for 150participants yielded an average interassay CV of 2.0% for albu-min, 10.3% for IL-6, and 8.0% for CRP.
Body composition
Body composition at baseline and the 5-y follow-up was as-sessed by using fan-beam dual-energy X-ray absorptiometry(model QDR4500, software version 8.21; Hologic, Waltham,MA). Information regarding the extensive quality-assuranceprotocol of this measurement in the Health ABC Study wasdescribed elsewhere (21). The sum of nonfat, nonbone tissue ofboth arms and legs was used to represent ASMM (22). Thenonfat, nonbone tissue of the trunk was used as a measure ofTLM, which represented the nonmuscle component of lean bodymass. We also used total body FFM as an overall measure of totalbody composition.
Protein intake
A modified Block 98 food-frequency questionnaire (FFQ)was administered by a trained dietary interviewer to estimate theindividual participant’s usual nutrient intakes. Dietary informa-tion was not obtained at the baseline examination but at the firstannual follow-up examination. The FFQ, developed and modi-fied by Block Dietary Data Systems (Berkeley, CA) for theHealth ABC Study, was based on age-appropriate intake datafrom the third National Health and Nutrition Examination Sur-vey. The food lists were based on the survey 24-h dietary recalldata for those aged �65 y, either non-Hispanic white or black,and residing in either the northeast or the south. A total of 108food items was included. All interviews were periodically mon-itored throughout the study to ensure the quality and consistencyof the data collection procedures. Wood blocks, real food mod-els, and flash cards were used to help participants estimate por-tion size. Protein and energy intakes were estimated by BlockDietary Data Systems. Dietary information for 57 persons wasexcluded because of serious errors. The residual protein intake(g/d), after total energy intake was accounted for, was calculatedas a measure of protein intake (23). Those who reported extremesex-specific residual protein intakes (lowest and highest 1%)were excluded from the analyses (n � 50). Persons in the lowestsex-specific quintile of residual protein intake were considered tohave a low protein intake.
Other covariates
Other covariates included demographics (sex, race, and studysite), lifestyle variables (physical activity, smoking status, andalcohol consumption), and health variables (chronic disease andantiinflammatory drug use) assessed at baseline and follow-up.The time spent on gardening, heavy chores, light house work,grocery shopping, laundry, climbing stairs, walking for exercise,walking for other purposes, aerobics, weight or circuit training,high-intensity exercise activities, and moderate-intensity exer-cise activities in the past 7 d was obtained as was information onthe intensity level at which each activity was performed. For eachparticipant, the scores of all performed activities were summed tocreate an overall physical activity score in kilocalories per kilo-gram per week (24). A dichotomous variable was created forweight training (yes or no). Smoking status was categorized ascurrent, former, and never smokers. The number of alcoholicbeverages ingested in a typical week during the past 12 mo wascategorized as none, �7/wk, and �7/wk. Current presence ofdisease was determined by using self-reported physician-diagnosed disease information, clinic data, and medication useand included cerebrovascular disease; coronary heart disease;
532 VISSER ET AL
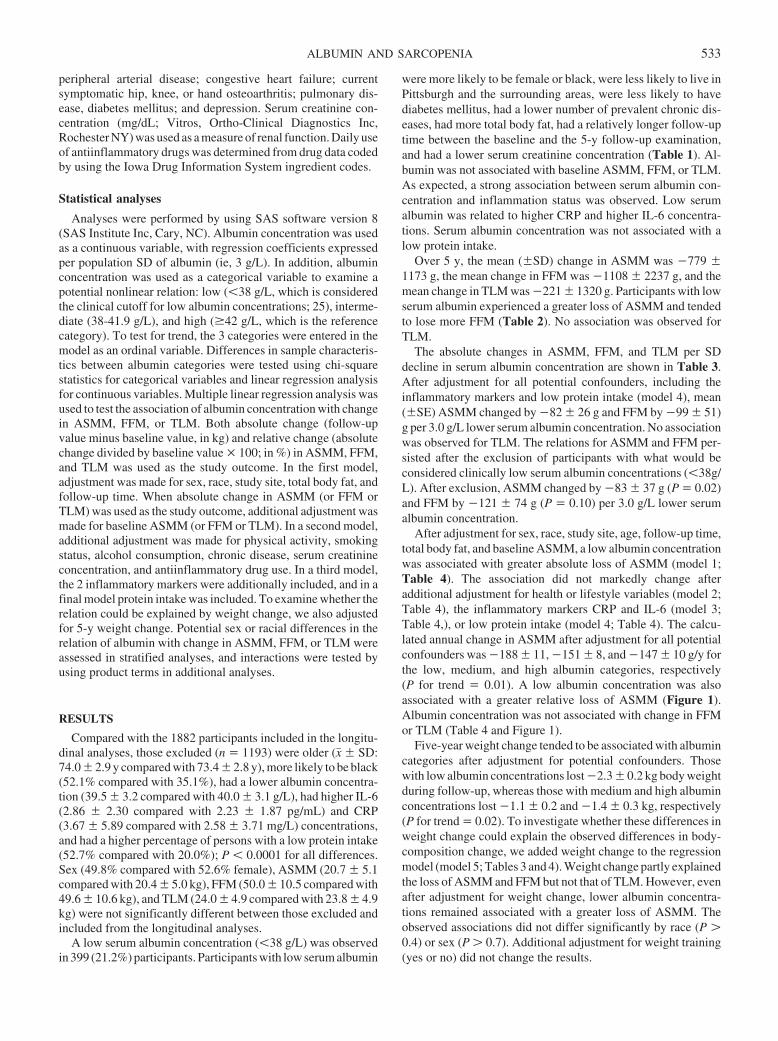
peripheral arterial disease; congestive heart failure; currentsymptomatic hip, knee, or hand osteoarthritis; pulmonary dis-ease, diabetes mellitus; and depression. Serum creatinine con-centration (mg/dL; Vitros, Ortho-Clinical Diagnostics Inc,Rochester NY) was used as a measure of renal function. Daily useof antiinflammatory drugs was determined from drug data codedby using the Iowa Drug Information System ingredient codes.
Statistical analyses
Analyses were performed by using SAS software version 8(SAS Institute Inc, Cary, NC). Albumin concentration was usedas a continuous variable, with regression coefficients expressedper population SD of albumin (ie, 3 g/L). In addition, albuminconcentration was used as a categorical variable to examine apotential nonlinear relation: low (�38 g/L, which is consideredthe clinical cutoff for low albumin concentrations; 25), interme-diate (38-41.9 g/L), and high (�42 g/L, which is the referencecategory). To test for trend, the 3 categories were entered in themodel as an ordinal variable. Differences in sample characteris-tics between albumin categories were tested using chi-squarestatistics for categorical variables and linear regression analysisfor continuous variables. Multiple linear regression analysis wasused to test the association of albumin concentration with changein ASMM, FFM, or TLM. Both absolute change (follow-upvalue minus baseline value, in kg) and relative change (absolutechange divided by baseline value � 100; in %) in ASMM, FFM,and TLM was used as the study outcome. In the first model,adjustment was made for sex, race, study site, total body fat, andfollow-up time. When absolute change in ASMM (or FFM orTLM) was used as the study outcome, additional adjustment wasmade for baseline ASMM (or FFM or TLM). In a second model,additional adjustment was made for physical activity, smokingstatus, alcohol consumption, chronic disease, serum creatinineconcentration, and antiinflammatory drug use. In a third model,the 2 inflammatory markers were additionally included, and in afinal model protein intake was included. To examine whether therelation could be explained by weight change, we also adjustedfor 5-y weight change. Potential sex or racial differences in therelation of albumin with change in ASMM, FFM, or TLM wereassessed in stratified analyses, and interactions were tested byusing product terms in additional analyses.
RESULTS
Compared with the 1882 participants included in the longitu-dinal analyses, those excluded (n � 1193) were older (x� � SD:74.0 � 2.9 y compared with 73.4 � 2.8 y), more likely to be black(52.1% compared with 35.1%), had a lower albumin concentra-tion (39.5 � 3.2 compared with 40.0 � 3.1 g/L), had higher IL-6(2.86 � 2.30 compared with 2.23 � 1.87 pg/mL) and CRP(3.67 � 5.89 compared with 2.58 � 3.71 mg/L) concentrations,and had a higher percentage of persons with a low protein intake(52.7% compared with 20.0%); P � 0.0001 for all differences.Sex (49.8% compared with 52.6% female), ASMM (20.7 � 5.1compared with 20.4 � 5.0 kg), FFM (50.0 � 10.5 compared with49.6 � 10.6 kg), and TLM (24.0 � 4.9 compared with 23.8 � 4.9kg) were not significantly different between those excluded andincluded from the longitudinal analyses.
A low serum albumin concentration (�38 g/L) was observedin 399 (21.2%) participants. Participants with low serum albumin
were more likely to be female or black, were less likely to live inPittsburgh and the surrounding areas, were less likely to havediabetes mellitus, had a lower number of prevalent chronic dis-eases, had more total body fat, had a relatively longer follow-uptime between the baseline and the 5-y follow-up examination,and had a lower serum creatinine concentration (Table 1). Al-bumin was not associated with baseline ASMM, FFM, or TLM.As expected, a strong association between serum albumin con-centration and inflammation status was observed. Low serumalbumin was related to higher CRP and higher IL-6 concentra-tions. Serum albumin concentration was not associated with alow protein intake.
Over 5 y, the mean (�SD) change in ASMM was �779 �1173 g, the mean change in FFM was �1108 � 2237 g, and themean change in TLM was �221 � 1320 g. Participants with lowserum albumin experienced a greater loss of ASMM and tendedto lose more FFM (Table 2). No association was observed forTLM.
The absolute changes in ASMM, FFM, and TLM per SDdecline in serum albumin concentration are shown in Table 3.After adjustment for all potential confounders, including theinflammatory markers and low protein intake (model 4), mean(�SE) ASMM changed by �82 � 26 g and FFM by �99 � 51)g per 3.0 g/L lower serum albumin concentration. No associationwas observed for TLM. The relations for ASMM and FFM per-sisted after the exclusion of participants with what would beconsidered clinically low serum albumin concentrations (�38g/L). After exclusion, ASMM changed by �83 � 37 g (P � 0.02)and FFM by �121 � 74 g (P � 0.10) per 3.0 g/L lower serumalbumin concentration.
After adjustment for sex, race, study site, age, follow-up time,total body fat, and baseline ASMM, a low albumin concentrationwas associated with greater absolute loss of ASMM (model 1;Table 4). The association did not markedly change afteradditional adjustment for health or lifestyle variables (model 2;Table 4), the inflammatory markers CRP and IL-6 (model 3;Table 4,), or low protein intake (model 4; Table 4). The calcu-lated annual change in ASMM after adjustment for all potentialconfounders was �188 � 11, �151 � 8, and �147 � 10 g/y forthe low, medium, and high albumin categories, respectively(P for trend � 0.01). A low albumin concentration was alsoassociated with a greater relative loss of ASMM (Figure 1).Albumin concentration was not associated with change in FFMor TLM (Table 4 and Figure 1).
Five-year weight change tended to be associated with albumincategories after adjustment for potential confounders. Thosewith low albumin concentrations lost �2.3 � 0.2 kg body weightduring follow-up, whereas those with medium and high albuminconcentrations lost �1.1 � 0.2 and �1.4 � 0.3 kg, respectively(P for trend � 0.02). To investigate whether these differences inweight change could explain the observed differences in body-composition change, we added weight change to the regressionmodel (model 5; Tables 3 and 4). Weight change partly explainedthe loss of ASMM and FFM but not that of TLM. However, evenafter adjustment for weight change, lower albumin concentra-tions remained associated with a greater loss of ASMM. Theobserved associations did not differ significantly by race (P �0.4) or sex (P � 0.7). Additional adjustment for weight training(yes or no) did not change the results.
ALBUMIN AND SARCOPENIA 533
DISCUSSION
The results of this study suggest that a lower serum albuminconcentration in older persons was associated with a greater lossof ASMM during a 5-y follow-up. Lower serum albumin con-centrations could have been caused by ongoing inflammation,poor health status, and malnutrition—factors that have also beenshown to be associated with low muscle mass or acceleratedmuscle loss. However, after careful adjustment for known healthfactors, including chronic disease, inflammation status, poor nu-tritional intake, and known lifestyle factors (including physicalactivity and smoking—factors that have been shown to be asso-ciated with lower albumin concentration and low muscle mass),the relation between lower albumin concentration and skeletalmuscle loss remained. The relation with change in ASMM even
persisted after additional adjustment for 5-y weight change,which suggests that the observed muscle loss was acceleratedbeyond what would be expected for weight loss.
A much weaker association was observed for the associationbetween lower albumin concentration and change in total-bodyFFM, whereas no association was observed for change in TLM.These results suggest that low serum albumin may increase theloss of ASMM with aging and that the major body organs, rep-resented by TLM, are relatively protected from this loss.
It is of interest that the association between serum albuminconcentration and change in ASMM was still observed afterexclusion of participants with clinically low (�38g/L) serumalbumin concentrations. An association between serum albuminand loss of grip strength in old age has also been reported in the
TABLE 1Baseline characteristics of the Health, Aging and Body Composition Study sample according to albumin categories1
Albumin category
P2�38 g/L
(n � 399)38–41.9 g/L
(n � 903)�42 g/L
(n � 580)
Women (%) 56.1 55.2 46.2 0.001Black (%) 41.1 34.2 32.2 0.013Pittsburgh study site (%) 41.6 45.0 64.7 � 0.0001Smoking (%)
Never 49.1 46.9 47.4 0.34Former 41.3 46.1 45.5 —Current 9.6 7.0 7.1 —
Alcohol (%)0 drinks/d 51.8 48.1 47.1 0.16�1 drink/d 43.2 44.9 43.9 —� 1 drink/d 5.1 7.0 9.0 —
Physical inactivity, �2500 kcal/wk (%) 20.3 16.8 16.6 0.71Low dietary protein intake (%)3 21.3 20.9 17.6 0.22Weight training (%) 6.5 8.8 9.7 0.22Antiinflammatory drug use (%) 54.4 52.1 52.8 0.75Cerebrovascular disease (%) 7.0 6.3 7.2 0.76Coronary heart disease (%) 16.8 18.2 20.2 0.38Peripheral arterial disease (%) 3.8 3.9 4.1 0.95Congestive heart failure (%) 1.5 1.8 2.1 0.80Symptomatic osteoarthritis (%) 10.0 9.3 11.0 0.55Pulmonary disease (%) 5.0 4.4 4.8 0.88Diabetes mellitus (%) 14.0 14.1 20.7 0.0014Depression (%) 5.8 6.1 3.6 0.10Total number of diseases 1.18 � 0.054 1.20 � 0.03 1.38 � 0.04 0.0017Total body fat (kg) 26.7 � 0.4 26.1 � 0.3 25.2 � 0.3 0.0031ASMM (kg) 20.4 � 0.2 20.2 � 0.2 20.6 � 0.2 0.48FFM (kg) 49.6 � 0.5 49.2 � 0.4 50.2 � 0.4 0.26TLM (kg) 23.7 � 0.2 23.6 � 0.2 24.2 � 0.2 0.10Follow-up time (d) 1809 � 2 1803 � 1 1801 � 2 0.0050Dietary protein intake (g/d) 64.9 � 1.3 66.1 � 0.8 65.6 � 1.0 0.72Serum creatinine (mg/dL) 1.0 (0.8–1.1)5 1.0 (0.9–1.1) 1.0 (0.9–1.2) 0.024C-reactive protein (mg/L)6 1.74 (1.04–3.04) 1.91 (1.36–2.76) 1.60 (0.96–2.91) 0.0002Interleukin 6 (pg/mL)6 1.71 (1.14–2.45) 1.39 (0.92–2.58) 1.63 (1.15–2.32) � 0.0001
1 ASMM, appendicular skeletal muscle mass; FFM, total-body fat-free mass; TLM, trunk lean mass.2 Differences in sample characteristics between albumin categories were tested by using chi-square statistics for categorical variables and linear regression
analysis for continuous variables.3 Lowest quintile of protein residual calculated from the linear regression of protein on energy intake (23).4 x� � SE (all such values).5 Median; interquartile range in parentheses (all such values).6 Missing values were imputed with the cohort median (C-reactive protein: n � 8, 0.4% of the study cohort; interleukin 6: n � 63, 3.3% of the study cohort).
534 VISSER ET AL
clinically normal range of �38 g/L (26). This suggests that sub-optimal albumin concentrations within the normal range couldstill increase the risk of sarcopenia.
The mechanisms explaining the observed relation betweenlower serum albumin concentration and loss of ASMM are notclear. Serum albumin concentration may be a marker of proteinstatus of the body, with lower values indicating a diminishedprotein reserve, stimulating catabolic processes leading to mus-cle breakdown. However, albumin concentration is well main-tained even in the presence of a negative nitrogen balance causedby a low-protein diet (20). Several other mechanisms can also behypothesized. Several studies have indicated the iron-bindingantioxidant properties of albumin (27) and albumin is a specificmodulator of cellular glutathione, one of the main body antioxi-dants (28). Oxidative damage may play a crucial role in thedecline of skeletal muscle with aging (29). In addition, increasedconcentrations of free cortisol have been observed in hypoalbu-minemic persons (30), which potentially stimulates musclebreakdown, especially in inactive persons (31). Albumin also hasbeen shown to activate the phosphatidyl-inositol 3-kinase path-way (32), thereby mediating muscle hypertrophy (33, 34). Be-cause free testosterone is a feedback regulator of plasma testos-terone, albumin may also affect serum testosterone (35). Last,serum albumin concentration could be a marker of underlying
disease, such as chronic renal failure, which has been shown to beassociated with muscle wasting (36). Future studies are needed toinvestigate the potential direct and indirect pathways throughwhich serum albumin could influence muscle mass and musclefunction.
The strengths of this study were its large study sample, whichincluded black and white men and women; the use of accurateregional body-composition measures by dual-energy X-ray ab-sorptiometry; and the long (5 y) follow-up. Moreover, carefuladjustment was made for important confounders of the associa-tion under study, including lifestyle variables, 2 inflammatorymarkers, and dietary intake. A limitation of the study is that norepeated measures of serum albumin concentration over timewere available and that information on dietary intake was ob-tained 1 y after the baseline examination, when serum albuminconcentrations were measured. Because of its half-life of 21 dand its response to acute inflammation, serum albumin may varyover time, and repeated measures would have allowed us to moreaccurately examine the association with ASMM. Our study wasobservational, and a causal relation between albumin and changein ASMM can only be inferred. Finally, selective loss offollow-up may have influenced our results. Persons not includedin the statistical analyses were older, had higher concentrationsof the inflammatory markers, had a lower albumin concentration,
TABLE 2Five-year body-composition changes according to albumin categories1
Albumin category
P fortrend
�38 g/L(n � 399)
38–41.9 g/L(n � 903)
�42 g/L(n � 580)
Absolute change (g)2
ASMM �973 � 563 �752 � 37 �688 � 46 0.0002FFM �1361 � 1104 �1014 � 73 �1080 � 91 0.09TLM �268 � 65 �158 � 43 �286 � 54 0.40
Relative change (%)ASMM �4.6 � 0.33 �3.5 � 0.2 �3.2 � 0.2 0.0004FFM �2.6 � 0.2 �1.8 � 0.1 �2.1 � 0.2 0.2TLM �0.9 � 0.3 �0.4 � 0.23 �1.1 � 0.2 0.37
1 All values are x� � SE. ASMM, appendicular skeletal muscle mass; FFM, total-body fat-free mass; TLM, trunk lean mass. Multiple linear regressionanalysis was used to test the association of albumin concentration with change in ASMM, FFM, or TLM.
2 Adjusted for baseline value.3,4 Significantly different from � 42 g/L category: 3P � 0.01, 4 P � 0.05.
TABLE 3Adjusted 5-y absolute change in appendicular skeletal muscle mass (ASMM), total-body fat-free mass (FFM), and trunk lean mass (TLM) per 3-g/L lowerserum albumin concentration1
Change in ASMM(n � 1866) P2
Change in FFM(n � 1784) P2
Change in TLM(n � 1849) P2
Model 1 �84 � 263 0.0011 �118 � 50 0.019 �19 � 30 0.53Model 2 �84 � 26 0.0011 �108 � 51 0.034 �21 � 29 0.47Model 3 �82 � 26 0.0015 �101 � 51 0.047 �16 � 29 0.58Model 4 �82 � 26 0.0016 �99 � 51 0.052 �15 � 29 0.61Model 5 �53 � 21 0.011 �26 � 37 0.48 17 � 24 0.48
1 Model 1: adjusted for sex, race, study site, age, follow-up time, total body fat, and baseline value; model 2: additionally adjusted for smoking status,alcohol consumption, physical activity, antiinflammatory drug use, chronic disease, depression, and serum creatinine concentration; model 3: additionallyadjusted for C-reactive protein and interleukin 6 concentrations; model 4: additionally adjusted for low protein intake; model 5: additionally adjusted for absoluteweight change.
2 Multiple linear regression analysis was used to test the association of albumin concentration with change in ASMM, FFM, or TLM.3 x� � SE (all such values).
ALBUMIN AND SARCOPENIA 535
and were more likely to have a low protein intake. Therefore, ourresults are likely an underestimation, which stresses the impor-tance of albumin as a risk factor for sarcopenia.
In conclusion, lower albumin concentrations, even those abovethe clinical cutoff of 38 g/L, are associated with a future loss ofASMM in older men and women. These results suggest that lowalbumin concentration may be a risk factor for sarcopenia.
MV, SBK, ABN, MCN, and TBH were responsible for the study conceptand design. MV was responsible for the data analysis and interpretation andthe draft of the manuscript. MV, SBK, ABN, BHG, FAT, MCN, and TBHwere responsible for the critical revision of the manuscript for importantintellectual content. None of the authors had a conflict of interest.
REFERENCES1. Sahyoun NR, Jacques PF, Dallal G, et al. Use of albumin as a predictor
of mortality in community-dwelling and institutionalized elderly popu-lations. J Clin Epidemiol 1996;49:981–8.
2. Fried LP, Kronmal RA, Newman AB, et al. Risk factors for 5-yearmortality in older adults. JAMA 1998;279:585–92.
3. Corti M, Guralnik JM, Salive ME, Sorkin JD. Serum albumin level andphysical disability as predictors of mortality in older persons. JAMA1994;272:1036–42.
4. Reuben DB, Ferrucci L, Wallace R, et al. The prognostic value of serumalbumin in healthy older persons with low and high serum interleukin-6(IL-6) levels. J Am Geriatr Soc 2000;48:1404–7.
5. Naber TH, Bree de A, Schermer TR, et al. Specificity of indexes ofmalnutrition when applied to apparently healthy people: the effect ofage. Am J Clin Nutr 1997;65:1721–5.
6. Gillum RF, Makuc DM. Serum albumin, coronary heart disease, anddeath. Am Heart J 1992;123:507–13.
7. Weijenberg MP, Feskens EJ, Souverijn JH, Kromhout D. Serum albu-min, coronary heart disease risk, and mortality in an elderly cohort.Epidemiology 1997;8:87–92.
8. Lauque S, Arnaud-Battandier F, Gillette S, et al. Improvement of weight
TABLE 4Adjusted 5-y absolute change in appendicular skeletal muscle mass (ASMM), total-body fat-free mass (FFM), and trunk lean mass (TLM) according toalbumin categories1
Albumin category
P2�38 g/L
(n � 399)38–41.9 g/L
(n � 903)�42 g/L
(n � 580)
Change in ASMM (g)Model 1 �936 � 563,4 �746 � 36 �724 � 47 0.007Model 2 �933 � 564 �747 � 37 �726 � 47 0.009Model 3 �930 � 564 �747 � 37 �728 � 47 0.011Model 4 �930 � 564 �747 � 37 �728 � 47 0.012Model 5 �844 � 455 �791 � 30 �718 � 38 0.033
Change in FFM (g)Model 1 �1331 � 110 �1029 � 73 �1077 � 93 0.12Model 2 �1314 � 111 �1030 � 73 �1091 � 93 0.18Model 3 �1300 � 111 �1032 � 73 �1097 � 93 0.23Model 4 �1299 � 111 �1031 � 73 �1100 � 93 0.24Model 5 �1101 � 80 �1125 � 53 �1090 � 67 0.89
Change in TLM (g)Model 1 �271 � 64 �179 � 42 �253 � 53 0.95Model 2 �263 � 64 �178 � 42 �261 � 54 0.89Model 3 �250 � 64 �180 � 42 �265 � 54 0.74Model 4 �250 � 64 �179 � 42 �267 � 54 0.73Model 5 �158 � 53 �226 � 35 �257 � 44 0.17
1 Model 1: adjusted for sex, race, study site, age, follow-up time, total body fat, and baseline value; model 2: additionally adjusted for smoking status,alcohol consumption, physical activity, antiinflammatory drug use, chronic disease, depression, and serum creatinine concentration; model 3: additionallyadjusted for C-reactive protein and interleukin 6 concentrations; model 4: additionally adjusted for low protein intake; model 5: additionally adjusted for absoluteweight change.
2 Multiple linear regression analysis was used to test the association of albumin concentration with change in ASMM, FFM, or TLM.3 x� � SE (all such values).4,5 Significantly different from � 42 g/L category: 4P � 0.01, 5 P � 0.05.
FIGURE 1. Adjusted mean (�SE) relative 5-y change in appendicularskeletal muscle mass (ASMM; n � 1866), total-body fat-free mass (FFM;n � 1784), and trunk lean mass (TLM; n � 1849) according to categories ofbaseline serum albumin concentration: ■ , low (�38 g/L); p, intermediate(38-41.9 g/L); and �, high (�42 g/L). Multiple linear regression analysis wasused to test the association of albumin concentration with change in ASMM,FFM, or TLM, adjusted for sex, race, study site, age, follow-up time, totalbody fat, smoking status, alcohol consumption, physical activity, antiinflam-matory drug use, chronic disease, depression, serum creatinine concentra-tion, C-reactive protein concentration, interleukin 6 concentration, and lowprotein intake. **Significantly different from �42 g/L category, P � 0.05.
536 VISSER ET AL
and fat-free mass with oral nutritional supplementation in patients withAlzheimer’s disease at risk of malnutrition: a prospective randomizedstudy. J Am Geriatr Soc 2004;52:1702–7.
9. Huang Y, Shinzawa H, Togashi H, et al. Interleukin-6 down-regulatesexpressions of the aldolase B and albumin genes through a pathwayinvolving the activation of tyrosine kinase. Arch Biochem Biophys1995;320:203–9.
10. Covinsky KE, Covinsky MH, Palmer RM, Sehgal AR. Serum albuminconcentration and clinical assessments of nutritional status in hospital-ized older people: different sides of different coins? J Am Geriatr Soc2002;5:631–7.
11. Wu AW, Yasui Y, Alzola C, et al. Predicting functional status outcomesin hospitalized patients aged 80 years and older. J Am Geriatr Soc2000;48(suppl):S6–15.
12. Jensen GL, Kita K, Fish J, Heydt D, Frey C. Nutrition risk screeningcharacteristics of rural older persons: relation to functional limitationsand health care charges. Am J Clin Nutr 1997;66:819–28.
13. Ferrucci L, Penninx BW, Leveille SG, et al. Characteristics of nondis-abled older persons who perform poorly in objective tests of lowerextremity function. J Am Geriatr Soc 2000;48:1102–10.
14. Zuliani G, Romagnoni F, Volpato S, et al. Nutritional parameters, bodycomposition, and progression of disability in older disabled residentsliving in nursing homes. J Gerontol A Biol Sci Med Sci 2001;56:M212–6.
15. Baumgartner RN, Koehler KM, Romero L, Garry PJ. Serum albumin isassociated with skeletal muscle in elderly men and women. Am J ClinNutr 1996;64:552–8.
16. Starling RD, Ades PA, Poehlman ET. Physical activity, protein intake,and appendicular skeletal muscle mass in older men. Am J Clin Nutr1999;70:91–6.
17. Valenti G, Denti L, Maggio M, et al. Effect of DHEAS on skeletal muscleover the life span: the InChianti Study. J Gerontol A Biol Med Sci2004;59A:466–72.
18. Visser M, Pahor M, Taaffe D, et al. Relationship of interleukin-6 andtumor necrosis factor-� with muscle mass and muscle strength in elderlymen and women: the Health ABC Study. J Gerontol A Biol Sci Med Sci2002;57:M326–32.
19. Campbell WW, Trappe TA, Wolfe RR, Evans WJ. The recommendeddietary allowance for protein may not be adequate for older people tomaintain skeletal muscle. J Gerontol A Biol Sci Med Sci 2001;56A:M373–80.
20. Castaneda C, Charnley JM, Evans WJ, Crim MC. Elderly women ac-commodate to a low-protein diet with losses of body cell mass, musclefunction, and immune response. Am J Clin Nutr 1995;62:30–9.
21. Visser M, Pahor M, Tylavsky F, et al. One- and two-year change in body
composition as measured by DXA in a population-based cohort of oldermen and women. J Appl Physiol 2003;94:2368–74.
22. Heymsfield SB, Smith R, Aulet M, et al. Appendicular skeletal musclemass: measurement by dual-photon absorptiometry. Am J Clin Nutr1990;52:214–8.
23. Kipnis V, Subar AF, Midthune D, et al. Structure of dietary measurementerror: results from the OPEN Biomarker Study. Am J Epidemiol 2003;158:14–21.
24. Ainsworth BE, Haskell WL, Leon AS, et al. Compendium of physicalactivities: classification of energy costs of human physical activities.Med Sci Sports Exerc 1993;25:71–80.
25. Reuben DB, Moore AA, Damesyn M, Keeler E, Harrison GG, GreendaleGA. Correlates of hypoalbuminemia in community-dwelling older per-sons. Am J Clin Nutr 1997;66:38–45.
26. Schalk BWM, Penninx BWJH, Bouter LM, Deeg DJH, Visser M. Serumalbumin and grip strength: a longitudinal study in older men and women.J Am Geriatr Soc 2005;53:1331–8.
27. Loban A, Kime R, Powers H. Iron-binding antioxidant potential ofplasma albumin. Clin Sci 1997;93:445–51.
28. Cantin AM, Paquette B, Richter M, Larivee P. Albumin-mediated reg-ulation of cellular glutathione and nuclear factor kappa B activation.Am J Respir Crit Care Med 2000;162:1539–46.
29. Pansarasa O, Castagna L, Colombo B, Vecchiet J, Felzani G, MarzaticoF. Age and sex differences in human skeletal muscle: role of reactiveoxygen species. Free Radic Res 2000;33:287–93.
30. Hamrahian AH, Seni TS, Arafah BM. Measurements of serum freecortisol in critically ill patients. N Engl J Med 2004;350:1629–38.
31. Ferrando AA, Stuart CA, Sheffield-Moore M, Wolfe RR. Inactivityamplifies the catabolic response of skeletal muscle to cortisol. J ClinEndocrinol Metab 1999;84:3515–21.
32. Jones DT, Ganeshaguru K, Anderson RJ, et al. Albumin activates theAKT signaling pathway and protects B-chronic lymphocytic leukemiacells from chlorambucil- and radiation-induced apoptosis. Blood 2003;101:3174–80.
33. Lai KV, Gonzalez M, Poueymirou WT, et al. Conditional activation ofAkt in adult skeletal muscle induces rapid hypertrophy. Mol Cell Biol2004;24:9295–304.
34. Glass DJ. Signalling pathways that mediate skeletal muscle hypertrophyand atrophy. Nat Cell Biol 2003;5:87–90.
35. Vermeulen A, Kaufman JM, Giagulli VA. Influence of some biologicalindexes on sex hormone-binding globulin and androgen levels in agingor obese males. J Clin Endocrinol Metab 1996;81:1821–6.
36. Adey D, Kumar R, McCarthy JT, Sreekumaran N. Reduced synthesis ofmuscle proteins in chronic renal failure. Am J Physiol Endocrinol Metab2000;278:E219–25.
ALBUMIN AND SARCOPENIA 537
Comparison of isotope dilution with bioimpedance spectroscopyand anthropometry for assessment of body composition inasymptomatic HIV-infected and HIV-uninfected breastfeedingmothers1–3
Peggy C Papathakis, Nigel C Rollins, Kenneth H Brown, Michael L Bennish, and Marta D Van Loan
ABSTRACTBackground: The effect of breastfeeding on the nutrition of HIV-infected (HIV�) mothers is unknown. Simple, valid methods areneeded for body-composition assessment of HIV� women.Objective: We compared the ability of bioimpedance spectroscopy(BIS) and anthropometry with that of isotope dilution (2H2O) tomeasure fat-free mass (FFM) and fat mass (FM) in HIV� and HIV-uninfected (HIV�) breastfeeding South African mothers.Design: Total body water (TBW) content of 68 lactating mothers (20HIV�, 48 HIV�) was measured 10 wk after delivery by using BISand 2H2O to measure FFM and FM. Anthropometric measurementsincluded body mass index (BMI; in kg/m2), midupper arm circum-ference (MUAC), and 4 skinfold thicknesses.Results: TBW, FFM, and FM measurements determined by BISwere correlated with 2H2O measurements in HIV� (r � 0.664,0.621, and 0.872, respectively; P � 0.01) and HIV� (r � 0.876,0.868, and 0.932, respectively; P � 0.001) mothers. TBW measuredby BIS was greater than that measured by the 2H2O method in bothHIV� (1.8 L) and HIV� (1.5 L) women; FM or FFM did not differsignificantly by method. BMI, MUAC, and all skinfold-thicknessmeasurements correlated strongly (r � 0.62, P � 0.001) with FMmeasured by 2H2O in both groups. BMI and MUAC correlated (r �0.64, P � 0.001) with FFM in HIV� mothers but not in HIV�mothers.Conclusions: In HIV� and HIV� breastfeeding mothers, BIS pro-vides an estimate of body composition comparable to that obtainedwith the 2H2O method. BMI and MUAC are useful in predicting FMin both groups but are not valid measures of FFM in HIV�mothers. Am J Clin Nutr 2005;82:538–46.
KEY WORDS HIV, breastfeeding, body composition, SouthAfrica, fat mass, fat-free mass, anthropometry, isotope dilution,women, AIDS, lactation, bioimpedance spectroscopy
INTRODUCTION
Despite concerns about the risk of transmitting HIV to infantsvia breastfeeding (1) and the unknown effect of breastfeeding onthe health and nutrition of HIV-infected [HIV-positive (HIV�)]mothers (2), the use of breast milk replacements is often consid-ered unacceptable, unaffordable, or unsafe (3–6). Because it islikely that breastfeeding will remain the norm among HIV�
mothers in most of sub-Saharan Africa, it is important to deter-mine whether breastfeeding may be detrimental to their nutritionand health. To assess nutritional status in these women, valid,inexpensive, and easily utilized field methods of measuring bodycomposition are needed.
The stable isotope deuterium oxide (2H2O) is a reference tech-nique for measuring total body water (TBW). After the ingestionand equilibration of a known dose of 2H2O in the body’s watercompartments, 2H2O concentration serves as a marker for TBWfrom which fat-free mass (FFM) and fat mass (FM) are derived.This technique is a safe and well-established standard method forassessing body water compartments even during pregnancy (7),but it is cumbersome to use in the field. Thus, validation of asimpler method is desirable.
Bioelectrical impedance analysis (BIA), using a single-frequency measurement of resistance and reactance, has beenshown to provide reliable estimates of FFM and FM in adults(8–10). It is an easy, reliable, and portable technique for mea-surement of body composition that is applicable for fieldworkand is less expensive than the 2H2O method. However, chronic
1 From the Africa Centre for Health and Population Studies, Somekele,South Africa (PCP, NCR, and MLB); the Program in International Nutrition,University of California, Davis, Davis, CA (PCP, KHB, and MVL); theDepartment of Paediatrics, Nelson R Mandela School of Medicine, Univer-sity of KwaZulu Natal, Durban, South Africa (NCR); the Division of Geo-graphic Medicine and Infectious Diseases, Tufts-New England Medical Cen-ter, Boston, MA (MLB); the Nuffield Department of Clinical Medicine,University of Oxford, Oxford, United Kingdom (MLB); and the WesternHuman Nutrition Research Center, United States Department of Agriculture,Davis, CA (MVL).
2 Supported by grants no. 063957 and 067181 from the Wellcome Trust (tothe Africa Centre for Health and Population Studies); a Fullbright Scholar-ship (to PP); Mid-Career grant no. 1 K24 AI/HDO1671-01 from the NationalInstitute of Allergy and Infectious Diseases, National Institutes of Health,and grant 62925 from the Wellcome Trust (both to MB); and grant 050524from the Wellcome Trust (to NR). The Western Human Nutrition ResearchCenter, United States Department of Agriculture, Davis, CA, provided theisotope, bioimpedance equipment, and technical assistance for deuteriummeasures of total body water.
3 Reprints not available. Address correspondence to PC Papathakis, De-partment of Pediatrics, University of California, Davis, Medical Center, 2516Stockton Blvd, Sacramento, CA 95817. E-mail: [email protected].
Received December 3, 2004.Accepted for publication June 2, 2005.
538 Am J Clin Nutr 2005;82:538–46. Printed in USA. © 2005 American Society for Clinical Nutrition
illness and infection can cause shifts in body water compartments(11, 12) thereby introducing error in the measurement of bodycell mass and making the use of single-frequency BIA in infectedpopulations potentially problematic. To overcome this concern,multiple-frequency bioimpedance, known as bioimpedancespectroscopy (BIS), is an alternative to BIA. TBW and extracel-lular water (ECW) measurements made by using BIS (BIS) maybe more accurate in populations in which there are potentialalterations in fluid distribution, as are seen with HIV infectionand during lactation (13, 14).
In healthy HIV-uninfected [HIV-negative (HIV�)] pregnantand lactating women in the United States, measurements ofTBWBIS correlated well with measurements of TBW made byusing isotope dilution (2H2O) (15). Multifrequency BIA has alsobeen used to monitor changes in body water compartments dur-ing pregnancy (16). It is recommended that the validity of im-pedance measures be confirmed as applicable for specific pop-ulations (10), and thus it is necessary to validate this method inHIV� breastfeeding African mothers.
The primary objective of this study was to determine the va-lidity of BIS and anthropometric measurements to measure bodycomposition in HIV� and HIV� women as compared with thevalues obtained with the reference stable isotope dilutionmethod. The second objective was to describe the body compo-sition of HIV� lactating women in rural South Africa.
SUBJECTS AND METHODS
Subjects
This study was conducted in government health clinics in thefield area of the Africa Centre for Health and Population Studiesin a rural, northern part of KwaZulu Natal Province, South Af-rica. Mothers were identified for the study when they came toclinic for their infants’ immunizations. Inclusion criteria weredelivery 4 to 20 wk previously, maternal age �15 y, currentbreastfeeding of the infant, and arrival at clinic by 0900 to allowsufficient time for the full range of measurements. Exclusioncriteria were current acute illness that would influence hydrationstatus (eg, diarrhea or fever) and admission to the hospital in theprevious 2 wk.
Mothers who were eligible and who agreed to participate pro-vided written informed consent and agreed to HIV counselingand testing. HIV testing was anonymous, and mothers returned in2 wk to obtain their results from the HIV counselor. Thus, at thetime of body-composition measurement, HIV status was notknown by subjects or study staff. Mothers were enrolled fromNovember 2001 to April 2002, and all measurements were madeon the day of enrollment.
The Ethics Committee of the Nelson R Mandela School ofMedicine at the University of KwaZulu Natal, Durban, SouthAfrica, and the Human Subjects Committee of the University ofCalifornia, Davis, Davis, CA, approved the study.
Measurements
Isotope dilution method
Ideally, the isotope dilution method is conducted in a con-trolled environment, but that was not possible in this rural setting.Most of the women attending the clinic walked, from varieddistances, to the clinic while carrying their infant. To ensure
adequate and consistent hydration status, all women were en-couraged to drink water ad libitum during the 30 min before the2H2O administration. The women then provided a baseline urinespecimen, after which they drank 20 g 2H2O mixed in 100 mLwater. The women were asked to void 2 h after consuming the2H2O dose; this urine was discarded, because the isotope is notequilibrated in the 2-h sample. Three hours after the 2H2O dose,a postequilibrium urine specimen was collected for measurementof the 2H2O concentration. A second urine collection 4 h after thedose was not possible in this setting, but, in other studies that wehave conducted in pregnant and postpartum women (15) and inAIDS patients receiving anabolic therapy (17), we found that 3-hpostdose samples were similar to 4-h postdose samples. Duringthe 3-h equilibration period, each subject drank 500 mL bottledwater but did not consume any other foods or fluids. Urine spec-imens were stored in screw-top containers with additional wrap-ping to prevent evaporation and leakage and maintained at�70 °C until they were processed at the Western Human Nutri-tion Research Center in Davis, CA. Urine was processed byvacuum sublimation to obtain a pure water sample. The 2H2Oconcentration was measured by fixed-filter infrared spectrome-try. The concentration of 2H2O in urine was calculated with thefollowing equation:
2H2O enrichment � 3-h 2H2O � baseline 2H2O (1)
That concentration was used to calculate the TBW by using thefollowing dilution formula:
TBW � 2H2O enrichment/ 2H2O dose
� 900 � 0.96 � 0.944 � 0.5 L (2)
Corrections were made for the molecular weight of 2H2O relativeto water (900), the nonaqueous hydrogen exchange (0.96), andfractionation of the isotope (0.944), as described by Wong (18),and for the 500 mL water consumed during the study period.Because �73% of FFM is water, FFM2H20 was calculated asTBW/0.732. FM2H20 was calculated as body weight � FFM2H20
(19).
Bioimpedance spectroscopy
BIS uses multiple measurements of resistance and reactancethrough a range of frequencies (5–1000 kHz) and is analyzed asa complex impedance plane from which the resistance of bothTBW and ECW can be ascertained (20, 21). Tissues containingwater and electrolytes are more conductive than are bone and fat,and the volume of conductive tissue can be estimated from itsresistance. BIS measures resistance at low and high frequenciesand provides estimates of intracellular water (ICW) and ECW.The BIS 4000 ANALYZER software (version 1.00d; XitronTechnologies, San Diego, CA) estimated the volume of ECWand ICW by measuring resistance and reactance at 25 frequencymeasurements between 5 and 1000 KHz. The spectra data werefitted to the Cole-Cole suspension model by using nonlinearcurve fitting. ECW and ICW were calculated by the softwarefrom each subject’s resistance with the use of equations based onthe Hanai mixture theory (22). More thorough theoretical dis-cussion of this method can be found in the report by De Lorenzoet al (23). The software’s proprietary, iterative, successive ap-proximation technique was used to obtain the best possible fit tothe standard cell-suspension model. The programmed resistance
BODY COMPOSITION OF HIV� LACTATING MOTHERS 539
coefficients provided by the manufacturer (ie, 206 for ECW, 797for ICW) were used. The BIS instrument was calibrated eachmorning before use. BIS measurements were taken �2.5 h afterconsumption of the isotope drink, immediately after the motheremptied her bladder, and as soon as possible after breastfeeding.All BIS measurements were taken �5 h after the last meal wasconsumed. The impedance electrode pads were placed on thedorsal surface of the left hand and foot at the distal metacarpalsand metatarsals, and the sensing electrodes were placed betweenthe distal prominence of the radius and ulna and the lateral andmedial malleoli of the ankle.
Anthropometric measurements
Height, weight, midupper arm circumference (MUAC), andskinfold-thickness measurements were obtained by 1 of 2 regis-tered dietitians who were crosstrained to ensure low interexam-iner variation. Maternal height without shoes was measured tothe nearest 0.1 cm by using a stadiometer (Scales 2000, Durban,South Africa), and weight without shoes and in light clothing wasmeasured to the nearest 100 g by using a frequently standardizedelectronic digital scale (Scales 2000). MUAC was measured witha fiberglass tape, and skinfold thickness measurements weretaken with Harpenden calipers (Harpenden, Trowbridge, UnitedKingdom) according to standardized methods at 4 body sites:triceps, biceps, subscapular, and suprailiac. Two independentmeasurements were taken at each body site on the left side, andif the difference between the 2 measurements was �3 mm, a thirdmeasurement was obtained. The mean measurements of each sitewere used in the analysis. If 3 measurements were taken, themean of the closest pair was used. BMI was calculated as bodyweight (kg)/height (m2). The sum of the skinfold-thicknessesmeasurements was calculated as the sum of the measurementstaken at all 4 body sites. Midupper arm muscle circumferencewas calculated as MUAC (cm) –[triceps skinfold thickness(mm) � 0.314]. The age-appropriate Durnin-Womersley equa-tion for females was used to estimate body composition for allmothers from skinfold-thickness measurements (24, 25).
HIV viral load and CD4 cell count
Fresh venous blood specimens were processed at the AfricaCentre virology laboratory. CD4� cell counts from venousblood were measured within 24 h by using a FACScan (BectonDickinson, Temse, Belgium) and a 3-color antibody cocktail ofCD3/CD4/CD8. Serologic HIV testing was performed with abroad-based HIV-1/HIV-2 whole lysate screening enzyme-linked immunosorbent assay (ELISA) (Vironostica; OrganonTeknika, Boxtel, Netherlands) to determine HIV status; this wasfollowed by a confirmatory multiple-peptide ELISA (MurexWellcozyme HIV 1 � 2 GAC ELISA; Murex Corporation, Dart-ford, United Kingdom) for all serologic test–positive mothers.Total HIV RNA was isolated from plasma by using guanidinium-silica methods (NucliSens Isolation Kit; Organon Teknika) andan automated extractor (Organon Teknika). The NucliSensHIV-1 QT assay has a quantitative range from 40 to �500 000copies/mL plasma.
Statistical analysis
For demographic and body-composition variables, differ-ences between HIV� and HIV� mothers were tested for signif-icance by using the chi-square test for categorical variables and
the Student’s t test for continuous variables. Before examiningthe relations between different measures of body composition,we examined each of the individual values to exclude extremeoutliers. With respect to the TBW measurement from any of themothers, if the difference between the 2H2O and BIS results was�3 SDs, that value was considered to be an outlier and wasremoved from further analysis.
Pearson product-moment correlations and paired t tests wereused to measure the bias, significance, and degree of correlationbetween 2H2O and BIS measurements of TBW, FFM, and FMin HIV� and HIV� mothers. Repeated-measures analysis ofvariance (ANOVA) was used to ascertain whether differencesbetween groups (HIV� and HIV�) and assessment methods(2H2O and BIS) were significant and whether the 2-factorgroup � method interaction for all body-composition variableswas significant. Agreement between results of the 2 methods inHIV� and HIV� mothers was evaluated by using the Bland-Altman model (26), in which the difference between the mea-surements obtained with the2H2O and BIS methods for eachwoman was plotted against the mean of the methods.
Pearson product-moment correlations were used to determinethe correlation between the 2H2O dilution measurement of FFMand FM (FFM2H2O and FM2H2O, respectively) and anthropomet-ric measurements in HIV� and HIV� mothers. To develop aregression equation to predict FFM2H2O and FM2H2O from an-thropometric measurements, measurements from 60% of boththe HIV� and HIV� mothers were randomly selected for use.All anthropometric measurements for these mothers were en-tered stepwise to determine the best equation, which was thencross-validated by using measurements from the remaining 40%of mothers. These results were then compared with FFM2H2O andFM2H2O by using regression and paired t tests. Because there wasgood agreement between the cross-validation groups when theanthropometric measurements of all mothers were used, we usedlinear regression models to develop equations to predictFFM2H2O and FM2H2O for HIV� and HIV� mothers separately.Height, weight, MUAC, and each skinfold-thickness measure-ment were the independent variables. All analyses were performedwith SPSS software (version 11.0; SPSS Inc, Chicago, IL).
RESULTS
Sixty-eight mothers were enrolled in the study, 20 of whomwere HIV�. Four of the 48 HIV� mothers were excluded fromanalysis because of implausible BIS measurement (negative val-ues) due to improper electrode placement (ie, the electrode place-ments were reversed). Two HIV� mothers were excluded be-cause of incomplete isotope dilution procedures (one could notdrink the full solution, and the other could not urinate at the 3-htime point), and one HIV� mother was removed as an outlier(2H2O method indicated 3.4 kg FM, which is incompatible withhuman physiology).
Study participants ranged in age from 15 to 40 y (median:24 y), had 1–8 previous pregnancies (median 2), and had deliv-ered between 4 and 19 wk previously (median: 10.1 wk). Lessthan half of the women had access to piped water or electricity intheir homes. HIV� mothers had more formal education than didHIV� mothers (8.5 3.4 and 6.1 3.0 y, respectively; P �0.009), but otherwise the 2 groups were not significantly differ-ent (Table 1).
540 PAPATHAKIS ET AL
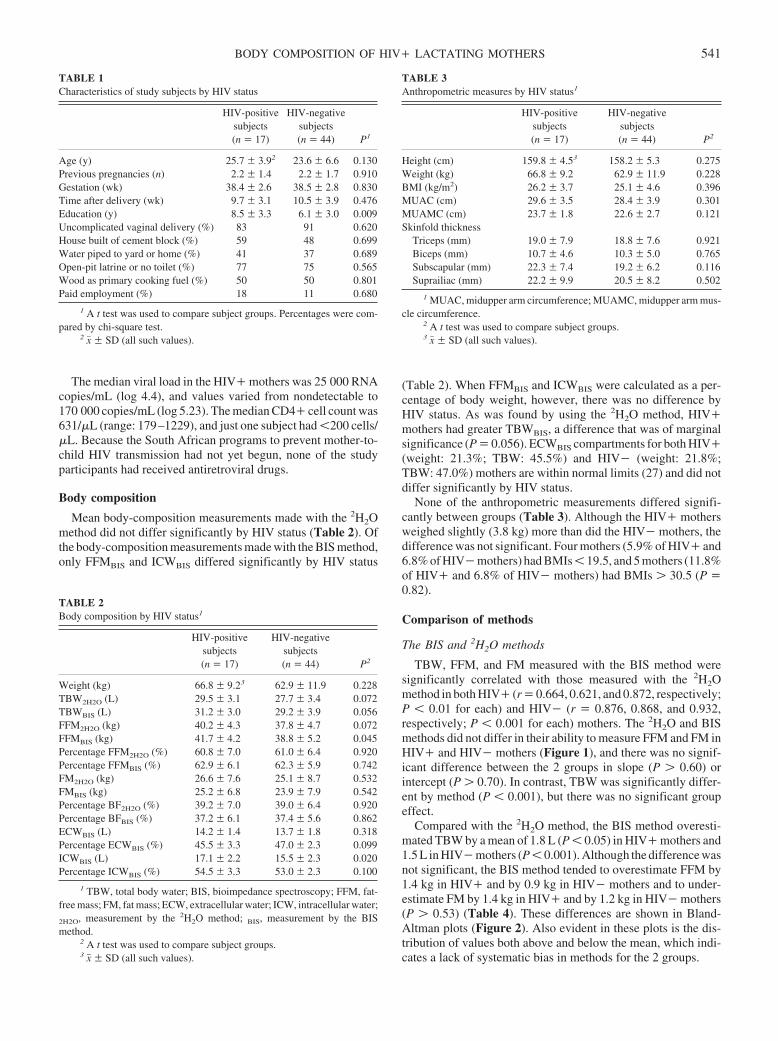
The median viral load in the HIV� mothers was 25 000 RNAcopies/mL (log 4.4), and values varied from nondetectable to170 000 copies/mL (log 5.23). The median CD4� cell count was631/�L (range: 179–1229), and just one subject had �200 cells/�L. Because the South African programs to prevent mother-to-child HIV transmission had not yet begun, none of the studyparticipants had received antiretroviral drugs.
Body composition
Mean body-composition measurements made with the 2H2Omethod did not differ significantly by HIV status (Table 2). Ofthe body-composition measurements made with the BIS method,only FFMBIS and ICWBIS differed significantly by HIV status
(Table 2). When FFMBIS and ICWBIS were calculated as a per-centage of body weight, however, there was no difference byHIV status. As was found by using the 2H2O method, HIV�mothers had greater TBWBIS, a difference that was of marginalsignificance (P � 0.056). ECWBIS compartments for both HIV�(weight: 21.3%; TBW: 45.5%) and HIV� (weight: 21.8%;TBW: 47.0%) mothers are within normal limits (27) and did notdiffer significantly by HIV status.
None of the anthropometric measurements differed signifi-cantly between groups (Table 3). Although the HIV� mothersweighed slightly (3.8 kg) more than did the HIV� mothers, thedifference was not significant. Four mothers (5.9% of HIV� and6.8% of HIV� mothers) had BMIs � 19.5, and 5 mothers (11.8%of HIV� and 6.8% of HIV� mothers) had BMIs � 30.5 (P �0.82).
Comparison of methods
The BIS and 2H2O methods
TBW, FFM, and FM measured with the BIS method weresignificantly correlated with those measured with the 2H2Omethod in both HIV� (r � 0.664, 0.621, and 0.872, respectively;P � 0.01 for each) and HIV� (r � 0.876, 0.868, and 0.932,respectively; P � 0.001 for each) mothers. The 2H2O and BISmethods did not differ in their ability to measure FFM and FM inHIV� and HIV� mothers (Figure 1), and there was no signif-icant difference between the 2 groups in slope (P � 0.60) orintercept (P � 0.70). In contrast, TBW was significantly differ-ent by method (P � 0.001), but there was no significant groupeffect.
Compared with the 2H2O method, the BIS method overesti-mated TBW by a mean of 1.8 L (P � 0.05) in HIV� mothers and1.5 L in HIV� mothers (P � 0.001). Although the difference wasnot significant, the BIS method tended to overestimate FFM by1.4 kg in HIV� and by 0.9 kg in HIV� mothers and to under-estimate FM by 1.4 kg in HIV� and by 1.2 kg in HIV� mothers(P � 0.53) (Table 4). These differences are shown in Bland-Altman plots (Figure 2). Also evident in these plots is the dis-tribution of values both above and below the mean, which indi-cates a lack of systematic bias in methods for the 2 groups.
TABLE 1Characteristics of study subjects by HIV status
HIV-positivesubjects(n � 17)
HIV-negativesubjects(n � 44) P1
Age (y) 25.7 3.92 23.6 6.6 0.130Previous pregnancies (n) 2.2 1.4 2.2 1.7 0.910Gestation (wk) 38.4 2.6 38.5 2.8 0.830Time after delivery (wk) 9.7 3.1 10.5 3.9 0.476Education (y) 8.5 3.3 6.1 3.0 0.009Uncomplicated vaginal delivery (%) 83 91 0.620House built of cement block (%) 59 48 0.699Water piped to yard or home (%) 41 37 0.689Open-pit latrine or no toilet (%) 77 75 0.565Wood as primary cooking fuel (%) 50 50 0.801Paid employment (%) 18 11 0.680
1 A t test was used to compare subject groups. Percentages were com-pared by chi-square test.
2 x� SD (all such values).
TABLE 2Body composition by HIV status1
HIV-positivesubjects(n � 17)
HIV-negativesubjects(n � 44) P2
Weight (kg) 66.8 9.23 62.9 11.9 0.228TBW2H2O (L) 29.5 3.1 27.7 3.4 0.072TBWBIS (L) 31.2 3.0 29.2 3.9 0.056FFM2H2O (kg) 40.2 4.3 37.8 4.7 0.072FFMBIS (kg) 41.7 4.2 38.8 5.2 0.045Percentage FFM2H2O (%) 60.8 7.0 61.0 6.4 0.920Percentage FFMBIS (%) 62.9 6.1 62.3 5.9 0.742FM2H2O (kg) 26.6 7.6 25.1 8.7 0.532FMBIS (kg) 25.2 6.8 23.9 7.9 0.542Percentage BF2H2O (%) 39.2 7.0 39.0 6.4 0.920Percentage BFBIS (%) 37.2 6.1 37.4 5.6 0.862ECWBIS (L) 14.2 1.4 13.7 1.8 0.318Percentage ECWBIS (%) 45.5 3.3 47.0 2.3 0.099ICWBIS (L) 17.1 2.2 15.5 2.3 0.020Percentage ICWBIS (%) 54.5 3.3 53.0 2.3 0.100
1 TBW, total body water; BIS, bioimpedance spectroscopy; FFM, fat-free mass; FM, fat mass; ECW, extracellular water; ICW, intracellular water;
2H2O, measurement by the 2H2O method; BIS, measurement by the BISmethod.
2 A t test was used to compare subject groups.3 x� SD (all such values).
TABLE 3Anthropometric measures by HIV status1
HIV-positivesubjects(n � 17)
HIV-negativesubjects(n � 44) P2
Height (cm) 159.8 4.53 158.2 5.3 0.275Weight (kg) 66.8 9.2 62.9 11.9 0.228BMI (kg/m2) 26.2 3.7 25.1 4.6 0.396MUAC (cm) 29.6 3.5 28.4 3.9 0.301MUAMC (cm) 23.7 1.8 22.6 2.7 0.121Skinfold thickness
Triceps (mm) 19.0 7.9 18.8 7.6 0.921Biceps (mm) 10.7 4.6 10.3 5.0 0.765Subscapular (mm) 22.3 7.4 19.2 6.2 0.116Suprailiac (mm) 22.2 9.9 20.5 8.2 0.502
1 MUAC, midupper arm circumference; MUAMC, midupper arm mus-cle circumference.
2 A t test was used to compare subject groups.3 x� SD (all such values).
BODY COMPOSITION OF HIV� LACTATING MOTHERS 541
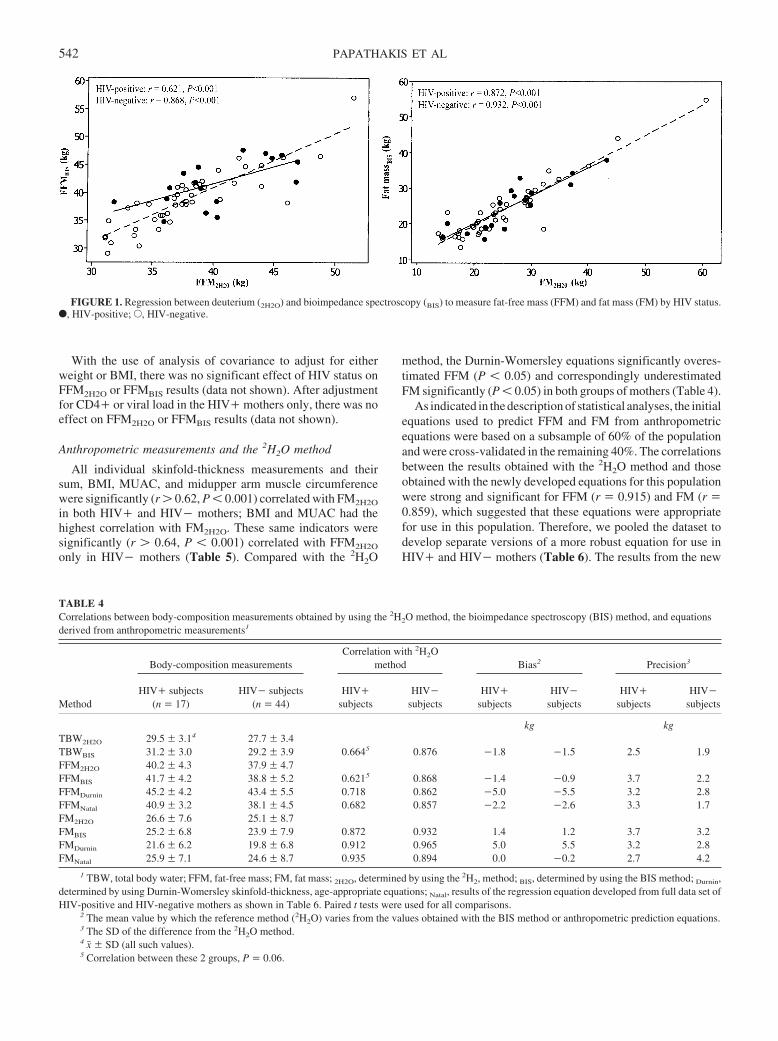
With the use of analysis of covariance to adjust for eitherweight or BMI, there was no significant effect of HIV status onFFM2H2O or FFMBIS results (data not shown). After adjustmentfor CD4� or viral load in the HIV� mothers only, there was noeffect on FFM2H2O or FFMBIS results (data not shown).
Anthropometric measurements and the 2H2O method
All individual skinfold-thickness measurements and theirsum, BMI, MUAC, and midupper arm muscle circumferencewere significantly (r � 0.62, P � 0.001) correlated with FM2H2O
in both HIV� and HIV� mothers; BMI and MUAC had thehighest correlation with FM2H2O. These same indicators weresignificantly (r � 0.64, P � 0.001) correlated with FFM2H2O
only in HIV� mothers (Table 5). Compared with the 2H2O
method, the Durnin-Womersley equations significantly overes-timated FFM (P � 0.05) and correspondingly underestimatedFM significantly (P � 0.05) in both groups of mothers (Table 4).
As indicated in the description of statistical analyses, the initialequations used to predict FFM and FM from anthropometricequations were based on a subsample of 60% of the populationand were cross-validated in the remaining 40%. The correlationsbetween the results obtained with the 2H2O method and thoseobtained with the newly developed equations for this populationwere strong and significant for FFM (r � 0.915) and FM (r �0.859), which suggested that these equations were appropriatefor use in this population. Therefore, we pooled the dataset todevelop separate versions of a more robust equation for use inHIV� and HIV� mothers (Table 6). The results from the new
FIGURE 1. Regression between deuterium (2H2O) and bioimpedance spectroscopy (BIS) to measure fat-free mass (FFM) and fat mass (FM) by HIV status.F, HIV-positive; E, HIV-negative.
TABLE 4Correlations between body-composition measurements obtained by using the 2H2O method, the bioimpedance spectroscopy (BIS) method, and equationsderived from anthropometric measurements1
Method
Body-composition measurementsCorrelation with 2H2O
method Bias2 Precision3
HIV� subjects(n � 17)
HIV� subjects(n � 44)
HIV�subjects
HIV�subjects
HIV�subjects
HIV�subjects
HIV�subjects
HIV�subjects
kg kgTBW2H2O 29.5 3.14 27.7 3.4TBWBIS 31.2 3.0 29.2 3.9 0.6645 0.876 �1.8 �1.5 2.5 1.9FFM2H2O 40.2 4.3 37.9 4.7FFMBIS 41.7 4.2 38.8 5.2 0.6215 0.868 �1.4 �0.9 3.7 2.2FFMDurnin 45.2 4.2 43.4 5.5 0.718 0.862 �5.0 �5.5 3.2 2.8FFMNatal 40.9 3.2 38.1 4.5 0.682 0.857 �2.2 �2.6 3.3 1.7FM2H2O 26.6 7.6 25.1 8.7FMBIS 25.2 6.8 23.9 7.9 0.872 0.932 1.4 1.2 3.7 3.2FMDurnin 21.6 6.2 19.8 6.8 0.912 0.965 5.0 5.5 3.2 2.8FMNatal 25.9 7.1 24.6 8.7 0.935 0.894 0.0 �0.2 2.7 4.2
1 TBW, total body water; FFM, fat-free mass; FM, fat mass; 2H2O, determined by using the 2H2, method; BIS, determined by using the BIS method; Durnin,determined by using Durnin-Womersley skinfold-thickness, age-appropriate equations; Natal, results of the regression equation developed from full data set ofHIV-positive and HIV-negative mothers as shown in Table 6. Paired t tests were used for all comparisons.
2 The mean value by which the reference method (2H2O) varies from the values obtained with the BIS method or anthropometric prediction equations.3 The SD of the difference from the 2H2O method.4 x� SD (all such values).5 Correlation between these 2 groups, P � 0.06.
542 PAPATHAKIS ET AL
equations were well correlated with those obtained with the 2H2Omethod, but the bias between methods (or the difference betweenthe results from the anthropometric equation and from the refer-ence standard) was much smaller than when the Durnin-Womersley equations were used.
DISCUSSION
We have shown that BIS provides a reliable estimate of bodycomposition in HIV� and HIV� breastfeeding mothers. Resultsobtained with the BIS method correlated well with those obtainedwith the 2H2O method. There was no significant difference be-tween methods in the measurement of FFM or FM. Although theTBW estimate obtained with BIS was larger than that obtainedwith the 2H2O method in both HIV� and HIV� mothers, thedifference was fairly small (5–6%) and was considered accept-able. It is difficult to ascertain which of the methods is the correctestimate in this field setting.
Comparison of methods
The BIS and 2H2O methods
Correlations between the BIS and 2H2O methods were signif-icant in both groups but stronger in the HIV� mothers. Thedifference between HIV� and HIV� mothers in this study may
FIGURE 2. Bland-Altman comparisons of total body water, fat mass, andfat-free mass by HIV status. �, HIV-positive; E, HIV-negative. Limits ofagreement: 2 SD.
TABLE 5Correlations between body-composition results determined by the 2H2Omethod and individual anthropometric measurements and by HIV status1
2H2O method
FFM FM %BF
BMIHIV� 0.413 0.9002 0.7252
HIV� 0.6672 0.9142 0.7152
MUACHIV� 0.309 0.9162 0.6802
HIV� 0.6422 0.8542 0.6982
MUAMCHIV� 0.441 0.6613 0.461HIV� 0.6602 0.6232 0.4033
Skinfold thicknessTriceps
HIV� 0.131 0.8262 0.6192
HIV� 0.3103 0.6912 0.6832
BicepsHIV� 0.256 0.7592 0.328HIV� 0.4952 0.8392 0.7072
SubscapularHIV� 0.097 0.8202 0.481HIV� 0.4302 0.7442 0.6802
SuprailiacHIV� 0.157 0.6552 0.396HIV� 0.3643 0.7953 0.7572
Sum of skinfold thicknessesHIV pos 0.126 0.8302 0.7352
HIV neg 0.4513 0.8692 0.8262
1 FFM, fat-free mass; FM, fat mass; % BF, percentage body fat; MUAC,midupper arm circumference; MUAMC, midupper arm muscle circumfer-ence. BMI, in kg/m2.
2 P � 0.001.3 P � 0.05.
BODY COMPOSITION OF HIV� LACTATING MOTHERS 543

be due to differences in the women’s body composition, or theymay be an artifact of the larger sample size and broader range ofvalues in the HIV� group. Grinspoon et al (28) found that thecorrelation of FFM results obtained with dual-energy X-ray ab-sorptiometry and BIA was greater (but not significantly so) inHIV� women than in HIV� women. One explanation for thisdifference maybe that the quality of FFM in HIV� persons islikely to be different from that in the HIV� persons who areusually studied for the development of body-composition refer-ence values (ie, by the 2H2O method) (29). Although the HIV�mothers in this study were asymptomatic and most were notimmunocompromised, it is possible that some of these womenmay have had changes in body water compartments, and, thus,more time was needed for the 2H2O to equilibrate into TBW intheir bodies.
The difference between the results from 2H2O and BIS meth-ods to measure TBW in all mothers may be partially due to theless-than-full equilibration of the 2H2O at the 3-h time point forthe postdose urine sample from lactating women. In previousstudies of pregnant and postpartum women in our laboratory andof AIDS patients, we found that 3-h postdose samples weresimilar to 4-h postdose samples and that they provided reason-able estimates of TBW in a 4-compartment model. Therefore, webelieved the 3-h postdose time point for a urine sample wasappropriate. Each woman was encouraged to breastfeed beforethe TBWBIS measurement, but the larger effect may have been onthe TBW2H2O estimate. It was not possible to repeatedly weighthe infant to adjust the TBW2H2O estimate for milk production onthe basis of infant weight gain. The possible lack of full equili-bration of 2H2O would result in TBW results that were lower thanthe BIS results, as was found in this study. In retrospect, becauseof lactation, a longer time may be needed for equilibration ofisotopic tracers. Wong et al (30) suggested that an equilibrationtime of �6 h is needed in lactating women. Such a long equili-bration time will also result in a greater nonaqueous H� ex-change, greater insensible losses through respiration and urineproduction, and the need to keep the lactating subject hydrated.Therefore, trade-offs between benefits and detriments must bemade when designing study procedures in a field setting.
The reasonable intermethod difference (26) for each groupincreased our confidence that BIS accurately measured FFM andFM in both groups of mothers. The bias and precision betweenmethods in our study were comparable to those found in otherstudies that compared methods of assessing body composition(29, 31).
Maintenance of FFM and FM is considered important forhealth and for the attenuation of HIV disease progression (11,
32). Accurate measurements of FFM and FM are therefore im-portant in the clinical assessment of HIV� persons. The 2H2Omethod is not possible for routine use in poor areas of Africa formethodologic and technical reasons. In contrast, BIS is simple toperform with adequate operator training, can be operated onbattery power in almost any setting, is quick and without patientdiscomfort, and requires only one person to take the measure-ment. The major initial cost is the BIS instrument; the recurrentcost of the gel electrode pads and alcohol wipes is minimalcompared with the costs of other laboratory-based methods.
Anthropometric measurements and the 2H2O method
Circumference and skinfold-thickness measurements are in-expensive, noninvasive techniques for measuring subcutaneousfat depots and estimating total body fat in this population. How-ever, accurate measurements are dependent on appropriatelytrained observers whose measurements are standardized againsteach other, as was done in this study. In addition, given therelation between lipodystrophy and antiretroviral therapy, theanthropometric measurements have the advantage of measuringchanges in the location of body fat stores. Our study found that allskinfold-thickness measurements, BMI, and MUAC were wellcorrelated with FM2H2O in both HIV� and HIV� mothers. It isinteresting that none of the anthropometric measures was corre-lated with FFM2H2O in HIV� mothers, whereas they were socorrelated in HIV� mothers but less well than with FM. This isa finding similar to that of Grinspoon et al (28), who noted thatBMI was not significantly correlated with FFM determined bydual-energy X-ray absorptiometry in 33 HIV-infected womenand that skinfold-thickness measurements correlated least wellto FFM.
In our study population, the Durnin-Womersley equation forestimating body composition tended to overestimate FFM andunderestimate FM in both HIV� and HIV� mothers; this find-ing is similar to that from a study of HIV� men in Australia (33).Unfortunately, the race or ethnicity of the subjects used to de-velop the Durnin-Womersley equation is not reported. If most ofthe subjects were white, that may partially explain this differencebetween methods. Wagner and Heyward (34) reviewed studiesof ethnic patterns of body composition and found that blackshave less subcutaneous fat in the limbs than in the trunk, and thatthey tend to carry more fat on the back and lateral portions of thetrunk than do whites. Kotler et al (35) found that FM was signif-icantly higher in HIV� African American women than in HIV�white American women, but the it did not differ significantlyfrom that in HIV� African women from Zaire. This is consistent
TABLE 6Anthropometric measurement equations as predictors of fat-free mass (FFM) and fat mass (FM)1
Equation r P
FFM2H2O
HIV� mothers 32.227 � 0.714 body wt (kg) � 1.32 MUAC (cm) 0.749 0.003HIV� mothers 12.678 � 0.546 body wt (kg) � 0.237 suprailiac skinfold thickness (mm) � 0.352 biceps skinfold
thickness (mm)0.863 � 0.001
FM2H2O
HIV� mothers �25.150 � 0.312 body wt (kg) � 0.850 MUAC � 0.228 subscapular skinfold thickness 0.935 � 0.001HIV� mothers �12.678 � 0.454 body wt (kg) � 0.237 suprailiac skinfold thickness (mm) � 0.352 biceps skinfold
thickness (mm)0.963 � 0.001
1 FM2H2O, FM as measured by the deuterium method; FFM2H2O, FFM as measured by the deuterium method; MUAC, midupper arm circumference.
544 PAPATHAKIS ET AL
with our finding in this study that black mothers in KwaZulu-Natal have more FM than do mainly white breastfeeding mothersfrom the northern hemisphere (36–38). These ethnic or racialdifferences could produce systematic errors in the use of refer-ences of body composition that do not take ethnicity and race intoconsideration. Further studies are needed to investigate the in-fluence of ethnicity and race on body composition, to validateanthropometric equations for predicting FFM and FM in Africanwomen, and to ascertain the best methods for accurately mea-suring FFM in HIV� women.
Effect of HIV on body composition
Our study found no evidence of wasting in either HIV� orHIV� breastfeeding mothers living in this region of South Af-rica. Indeed, the mean percentage body fat (37%) is higher thanthat in lactating women in other countries (28, 39). Comparedwith 46 HIV� women (breastfeeding status unknown) in Zairewho were measured with BIA, the HIV� mothers in the currentstudy weighed �20 kg more and had �2 kg more FFM and 18 kgmore FM (35). This difference may be partially explained by thegeneral good health of the mothers we enrolled. None of themothers were acutely ill, and only one had advanced immuno-suppression (CD4 cell count: �200/�L). In contrast, mostmother-to-child transmission prevention trials report that 12–15% of enrolled HIV� women have CD4� cell counts � 200/�L. Thus, we are unable to assess the effect of more advanceddisease on the validity of the BIS method.
We are not aware of any studies describing the nutritionalstatus of either HIV� or HIV� breastfeeding mothers in SouthAfrica. It is therefore difficult to ascertain whether the mothersmeasured in this study are representative. However, the studymothers were socioeconomically representative of the locationand had demographic surveillance information consistent withthat obtained from the Africa Centre Demographic InformationSystem.
In summary, we have shown that BIS provides an estimate ofbody composition that is 105% to 106% of the estimate obtainedwith the 2H2O method, as measured under our study conditions.This is a reasonable approximation of the values obtained withthe reference method, and, given our study conditions, we are notsure which method provides the truest estimation. Regardless ofthe true value, the relation does not vary for HIV� and HIV�mothers. BIS is a simple field technique that is useful for assess-ing body composition and for comparing groups of HIV� andHIV� women in this location. Breastfeeding mothers living inour study area appear to be adequately nourished in terms of bodycomposition and anthropometry. Studies of women with ad-vanced HIV disease are needed to more fully test the limits of theBIS method for accurate assessment of body composition.
We thank the Maternal Nutrition Study staff for subject recruitment;Carina Herbst and Ruth Bland for study management support; the AfricaCentre Vertical Transmission Study HIV counselors, clinic assistants, andstaff for study organization and data collection; the mothers who generouslygave of their time and participated in this study; and the nursing staff atMadwaleni and KwaMsane clinics. The skillful laboratory guidance of Man-ual Tengonciang of the Western Human Nutrition Research Center is grate-fully acknowledged. This paper is written on behalf of the Child HealthGroup of the Africa Centre for Health and Population studies: HM Coovadia,RM Bland, and A Coutsoudis of that group reviewed and approved the studydesign and the submitted manuscript.
PCP was responsible for the study concept and design, field supervision,analysis and interpretation of results, and drafting of the manuscript. KHB,NCR, MDVL, and MLB contributed to the study design, interpretation ofresults, and manuscript revisions. MVL was also responsible for the super-vision of 2H2O analysis. The manuscript was reviewed and approved by allauthors. None of the authors had a personal or financial conflict of interest.
REFERENCES1. World Health Organization. New data on the prevention of mother-to-
child transmission of HIV and their policy implications: conclusions andrecommendations. Technical Consultation on Behalf of the UNFPA/WHO/UNAIDS Inter-Agency Task Team on Mother-to-Child Trans-mission of HIV. Geneva, Switzerland: WHO, 2001.
2. Nduati R, Richardson BA, John G, et al. Effect of breastfeeding onmortality among HIV-1 infected women: a randomised trial. Lancet2001;357:1651–5.
3. Coutsoudis A, Goga AE, Rollins N, Coovadia HM. Free formula milk forinfants of HIV-infected women: blessing or curse? Health Policy Plan2002;17:154–60.
4. Papathakis P, Rollins N. Are WHO/UNAIDS/UNICEF–recommendedreplacement milks for infants of HIV-infected mothers appropriate in theSouth African context? Bull World Health Organ 2004;82:164–71.
5. Latham MC, Preble EA. Appropriate feeding methods for infants of HIVinfected mothers in sub-Saharan Africa. BMJ 2000;320:1656–60.
6. Phadke MA, Gadgil B, Bharucha KE, et al. Replacement-fed infantsborn to HIV-infected mothers in India have a high early postpartum rateof hospitalization. J Nutr 2003;133:3153–7.
7. Hopkinson JM, Butte NF, Ellis KJ, Wong WW, Puyau MR, Smith EO.Body fat estimation in late pregnancy and early postpartum: comparisonof two-, three-, and four-component models. Am J Clin Nutr 1997;65:432–8.
8. Segal KR, Van Loan M, Fitzgerald PI, Hodgdon JA, Van Itallie TB. Leanbody mass estimation by bioelectrical impedance analysis: a four-sitecross-validation study. Am J Clin Nutr 1988;47:7–14.
9. Kotler DP, Burastero S, Wang J, Pierson RN Jr. Prediction of body cellmass, fat-free mass, and total body water with bioelectrical impedanceanalysis: effects of race, sex, and disease. Am J Clin Nutr 1996;64(suppl):489S–97S.
10. Bioelectrical impedance analysis in body composition measurement:National Institutes of Health Technology Assessment Conference State-ment. Am J Clin Nutr 1996;64(suppl):524S–32S.
11. Kotler DP, Tierney AR, Wang J, Pierson RN Jr. Magnitude of body-cell-mass depletion and the timing of death from wasting in AIDS. Am JClin Nutr 1989;50:444–7.
12. Paton NI, Castello-Branco LR, Jennings G, et al. Impact of tuberculosison the body composition of HIV-infected men in Brazil. J Acquir Im-mune Defic Syndr Hum Retrovirol 1999;20:265–71.
13. Cornish BH, Ward LC. Data analysis in multiple-frequency bioelectricalimpedance analysis. Physiol Meas 1998;19:275–83.
14. Cornish BH, Ward LC, Thomas BJ, Jebb SA, Elia M. Evaluation ofmultiple frequency bioelectrical impedance and Cole-Cole analysis forthe assessment of body water volumes in healthy humans. Eur J Clin Nutr1996;50:159–64.
15. Van Loan MD, Kopp LE, King JC, Wong WW, Mayclin PL. Fluidchanges during pregnancy: use of bioimpedance spectroscopy. J ApplPhysiol 1995;78:1037–42.
16. Valensise H, Andreoli A, Lello S, Magnani F, Romanini C, De LorenzoA. Multifrequency bioelectrical impedance analysis in women with anormal and hypertensive pregnancy. Am J Clin Nutr 2000;72:780–3.
17. Van Loan MD, Strawford A, Jacob M, Hellerstein M. Monitoringchanges in fat-free mass in HIV-positive men with hypotestosteronemiaand AIDS wasting syndrome treated with gonadal hormone replacementtherapy. Aids 1999;13:241–8.
18. Wong WW, Cochran WJ, Klish WJ, et al. Body fat in normal adultsestimated by oxygen-18- and deuterium-dilution and by anthropometry:a comparison. Eur J Clin Nutr 1988;42:233–42.
19. Forbes G. Body composition. In: Zeigler EE, Filer LJ, eds. Presentknowledge in nutrition. 7th ed. Washington, DC: ILSI Press, 1996:7–12.
20. Van Loan MD, Mayclin PL. Use of multi-frequency bioelectrical im-pedance analysis for the estimation of extracellular fluid. Eur J Clin Nutr1992;46:117–24.
21. van Marken Lichtenbelt WD, Westerterp KR, Wouters L, Luijendijk SC.
BODY COMPOSITION OF HIV� LACTATING MOTHERS 545
Validation of bioelectrical-impedance measurements as a method toestimate body-water compartments. Am J Clin Nutr 1994;60:159–66.
22. Sherman P. Emulsion science. London: Academic Press, 1968.23. De Lorenzo A, Andreoli A, Matthie J, Withers P. Predicting body cell
mass with bioimpedance by using theoretical methods: a technologicalreview. J Appl Physiol 1997;82:1542–58.
24. Durnin JV, Rahaman MM. The assessment of the amount of fat in thehuman body from measurements of skinfold thickness. Br J Nutr 1967;21:681–9.
25. Durnin JV, Womersley J. Body fat assessed from total body density andits estimation from skinfold thickness: measurements on 481 men andwomen aged from 16 to 72 years. Br J Nutr 1974;32:77–97.
26. Bland JM, Altman DG. Statistical methods for assessing agreementbetween two methods of clinical measurement. Lancet 1986;1:307–10.
27. Metheny NM. Quick reference to fluid balance. Philadelphia, PA: Lip-pincott, 1984.
28. Grinspoon S, Corcoran C, Miller K, et al. Determinants of increasedenergy expenditure in HIV-infected women. Am J Clin Nutr 1998;68:720–5.
29. Paton NI, Macallan DC, Jebb SA, et al. Longitudinal changes in bodycomposition measured with a variety of methods in patients with AIDS.J Acquir Immune Defic Syndr Hum Retrovirol 1997;14:119–27.
30. Wong WW, Butte NF, Smith EO, Garza C, Klein PD. Body compositionof lactating women determined by anthropometry and deuterium dilu-tion. Br J Nutr 1989;61:25–33.
31. Paton NI, Elia M, Jennings G, Ward LC, Griffin GE. Bioelectrical
impedance analysis in human immunodeficiency virus-infected pa-tients: comparison of single frequency with multifrequency, spectros-copy, and other novel approaches. Nutrition 1998;14:658–66.
32. Jones CY, Hogan JW, Snyder B, et al. Overweight and human immu-nodeficiency virus (HIV) progression in women: associations of HIVdisease progression and changes in body mass index in women in theHIV Epidemiology Research Study cohort. Clin Infect Dis 2003;37(suppl):S69–80.
33. Batterham MJ, Garsia R, Greenop P. Measurement of body compositionin people with HIV/AIDS: a comparison of bioelectrical impedance andskinfold anthropometry with dual-energy x-ray absorptiometry. J AmDiet Assoc 1999;99:1109–11.
34. Wagner DR, Heyward VH. Measures of body composition in blacks andwhites: a comparative review. Am J Clin Nutr 2000;71:1392–402.
35. Kotler DP, Thea DM, Heo M, et al. Relative influences of sex, race,environment, and HIV infection on body composition in adults. Am JClin Nutr 1999;69:432–9.
36. Butte NF, Hopkinson JM, Mehta N, Moon JK, Smith EO. Adjustmentsin energy expenditure and substrate utilization during late pregnancy andlactation. Am J Clin Nutr 1999;69:299–307.
37. Motil KJ, Sheng HP, Kertz BL, Montandon CM, Ellis KJ. Lean bodymass of well-nourished women is preserved during lactation. Am J ClinNutr 1998;67:292–300.
38. Lovelady CA, Garner KE, Moreno KL, Williams JP. The effect ofweight loss in overweight, lactating women on the growth of their in-fants. N Engl J Med 2000;342:449–53.
39. Butte NF, Hopkinson JM. Body composition changes during lactationare highly variable among women. J Nutr 1998;128:381S–5S.
546 PAPATHAKIS ET AL
Dietary glycemic index and load, measures of glucose metabolism,and body fat distribution in older adults1–3
Nadine R Sahyoun, Amy L Anderson, Alka M Kanaya, Pauline Koh-Banerjee, Stephen B Kritchevsky,Nathalie de Rekeneire, Frances A Tylavsky, Ann V Schwartz, Jung Sun Lee, and Tamara B Harris
ABSTRACTBackground: Recent evidence suggests that the rate of carbohy-drate digestion and absorption may influence the development oftype 2 diabetes.Objective: The aim of this study was to examine associations ofdietary glycemic index and glycemic load with predictors of type 2diabetes in older adults.Design: This study evaluated cross-sectional relations of dietaryglycemic index and glycemic load with measures of glucose metab-olism and body fat distribution in participants of the Health, Agingand Body Composition Study, a prospective cohort study of adultsaged 70–80 y (n � 2248).Results: In men, dietary glycemic index was positively associatedwith 2-h glucose (P for trend � 0.04) and fasting insulin (P for trend �0.004), inversely associated with thigh intramuscular fat (P for trend �0.02), and not significantly associated with fasting glucose, glycatedhemoglobin, or visceral abdominal fat. Dietary glycemic load was in-versely associated in men with visceral abdominal fat (P for trend �0.02) and not significantly associated with fasting glucose, 2-h glucose,glycated hemoglobin, fasting insulin, or thigh intramuscular fat. Inwomen, although dietary glycemic index and load were not signif-icantly related to any measures of glucose metabolism or body fatdistribution, the association between dietary glycemic index and 2-hglucose was nearly significant (P for trend � 0.06).Conclusion: The findings of this cross-sectional study indicate anassociation between dietary glycemic index and selected predictorsof type 2 diabetes in older adults, particularly in men. Am J ClinNutr 2005;82:547–52.
KEY WORDS Glycemic index, glycemic load, glucose me-tabolism, insulin resistance, body composition, older adults
INTRODUCTION
In the past 2 decades, the prevalence of type 2 diabetes in theUnited States has more than doubled (1). Although both healthbehaviors and genetic factors have been associated with risk oftype 2 diabetes, a condition characterized by disordered carbo-hydrate metabolism, the role of dietary carbohydrate is debated.Most large-scale epidemiologic studies have found little relationbetween intake of total carbohydrate and development of type 2diabetes (2). To determine whether the rate of carbohydrate di-gestion and absorption influences health, studies have examinedthe glycemic index (GI) and glycemic load (GL), which classifycarbohydrate-containing foods according to their effects on post-prandial blood glucose concentrations (3, 4). Whether dietary GI
or GL is implicated in the development of type 2 diabetes remainsunclear.
The GI is included in dietary recommendations for preventionand management of diabetes in Europe as well as in Australia andCanada, but its use is not fully endorsed by the American Dia-betes Association (5, 6). As suggested by Foster-Powell et al (5),methodologic differences in different laboratories can producediscrepant GI values for the same foods, which casts doubt onpublished GI estimates. It is also debated whether GI values ofindividual foods can be pooled to accurately predict the glycemicresponse to mixed meals (7, 8).
A report of the Institute of Medicine, Dietary Reference In-takes for Energy, Carbohydrate, Fiber, Fat, Fatty Acids, Cho-lesterol, Protein, and Amino Acids, stated “a need for moreresearch to elucidate the metabolic and long-term health differ-ences resulting from the ingestion of high compared with low GIcarbohydrates using larger, diverse samples” (8). Also, although�40% of persons with type 2 diabetes are �65 y, few studieshave examined relations of dietary GI or GL with predictors oftype 2 diabetes in this age group. The objective of the currentstudy was thus to examine the associations of dietary GI and GLwith predictors of type 2 diabetes, including measures of glucosemetabolism and body fat distribution, in a relatively large, bira-cial cohort of older adults.
SUBJECTS AND METHODS
Subjects
The Health, Aging and Body Composition (Health ABC)Study is a prospective cohort study to investigate relations
1 From the Department of Nutrition and Food Science, University of Mary-land, College Park, MD (NRS and ALA); the Division of General InternalMedicine (AMK) and Department of Epidemiology (AVS and JSL), Uni-versity of California, San Francisco, San Francisco, CA; the Department ofNutrition, Harvard School of Public Health, Boston, MA (PK-B); the J PaulSticht Center on Aging, Wake Forest University, Winston-Salem, NC(SBK); the Social and Scientific Systems, Silver Spring, MD (NdR); theDepartment of Preventive Medicine, University of Tennessee, Memphis, TN(FAT); and the National Institutes on Aging, Bethesda, MD (TBH).
2 Supported by the National Institute on Aging (contracts N01-AG-6-2106, N01-AG-6-2102, and N01-AG-6-2103).
3 Reprints not available. Address correspondence to NR Sahyoun, Uni-versity of Maryland Department of Nutrition and Food Science, 0112 SkinnerBuilding, College Park, MD 20742. E-mail: [email protected].
Received March 8, 2005.Accepted for publication May 16, 2005.
547Am J Clin Nutr 2005;82:547–52. Printed in USA. © 2005 American Society for Clinical Nutrition
among health conditions, body composition, behavioral and so-cial factors, and physical function in older adults. The 3075participants aged 70–79 y were recruited from a random sampleof white Medicare beneficiaries and all age-eligible black com-munity residents in designated ZIP code areas of Pittsburgh, PA,and Memphis, TN. Individuals were eligible if they reported nolife-threatening cancers; had no difficulty walking one-quartermile, climbing 10 steps, performing basic activities of daily liv-ing, or getting around without assistive devices; were not partic-ipating in any research studies that involved medications or mod-ification of eating or exercise habits; and planned to remain in thearea for at least 3 y. Protocols were approved by institutionalreview boards at both study sites, and participants provided writ-ten, informed consent.
An interview on demographic and socioeconomic factors andhealth behaviors and health status plus a clinical examination ofbody composition, biochemical variables, weight-related healthconditions, and physical function were administered between1997 and 1998, with annual follow-up assessments. Results frombaseline and year 2 of the Health ABC study were used in thecurrent analyses. Participants were excluded from these analysesif they reported following a special diabetic diet (n � 45), usingmedication for diabetes (n � 363), or had incomplete dietary data(n � 13) or sociodemographic and lifestyle information (n � 47).In each analysis, those with missing values for the outcomevariable were also excluded, and final sample sizes ranged from2152 for the analysis of glucose tolerance to 2248 for that offasting glucose.
Assessment of diet and calculation of dietary glycemicindex and load
Food intake was measured in the second year of the HealthABC study with a 108-item food-frequency questionnaire(FFQ). This FFQ was designed specifically for the Health ABCstudy by Block Dietary Data Systems (Berkeley, CA), based onreported intakes of non-Hispanic white and black residents of theNortheast and South aged �65 y in the third National Health andNutrition Examination Survey. The FFQ was administered by atrained dietary interviewer, and intakes of nutrients and foodgroups were estimated by Block Dietary Data Systems.
The GI of a food is defined as the 2-h incremental area underthe blood glucose curve after consumption of a food portion thatcontains a specific amount, usually 50 g, of available carbohy-drate, divided by the corresponding area after consumption of aportion of a reference food, usually glucose or white bread, whichcontains the same amount of available carbohydrate, and multi-plied by 100 to be expressed as a percentage. GI values for foodsin FFQ of the Health ABC study were compiled from the liter-ature by the Clinical Nutrition Research Center of the Universityof North Carolina, and modified if necessary to better match FFQfoods (5). A computer program was written with the use of SAS(SAS Institute Inc, Cary, NC) to calculate the dietary GI and GLfor each participant. The program first determined the amount ofavailable carbohydrate in one serving of each food by subtractingthe amount of fiber from the amount of total carbohydrate perserving. To obtain the GL of a serving of the food, the amount ofavailable carbohydrate per serving was multiplied by the GIvalue of the food and divided by 100. To determine the dietaryGL of each subject, each food’s GL was multiplied by the dailyfrequency of consumption of the food, and these products weresummed over all foods. The dietary GI of each subject was
computed by dividing dietary GL by daily intake of total avail-able carbohydrate and multiplying by 100. These methods ofcalculating dietary GI and GL are endorsed by a joint report of theFood and Agriculture Organization (FAO) and the World HealthOrganization (WHO), and by the International Table of Glyce-mic Index and Glycemic Load Values: 2002 (5, 9).
Measures of glucose metabolism
Fasting glucose was assessed at baseline and year 2, and gly-cated hemoglobin and fasting insulin were assessed at baseline ofthe Health ABC study, from blood drawn through venipunctureafter an overnight fast and stored at �70 °C. Plasma glucose wasmeasured by an automated glucose oxidase reaction (YSI 2300Glucose Analyzer; Yellow Springs Instruments, Yellow Springs,OH), glycated hemoglobin by HPLC (Biorad Diamat, Rich-mond, CA), and serum insulin with a commercially availableradioimmunoassay kit (Pharmacia, Uppsala, Sweden). To eval-uate glucose tolerance, an oral glucose tolerance test was admin-istered at baseline to participants without diagnosed type 2 dia-betes. After blood was drawn for glucose and insulinmeasurements, participants ingested 75 g glucose in solution(glucola), and another blood sample was drawn after 2 h. Bio-logical specimens were processed according to standardized pro-tocols by the Laboratory of Clinical Biochemistry at the Univer-sity of Vermont (10).
Measures of body composition
At baseline of the Health ABC study, participants underwentaxial computed tomography scanning of the abdomen and thigh.Visceral abdominal fat and intramuscular fat from the right andleft thighs were quantified from scans performed on a GeneralElectric 9800 Advantage (Milwaukee, WI) in Pittsburgh and aSiemens Somatom (Iselin, NJ) and Picker PQ2000S (Cleveland,OH) in Memphis. All data from computed tomography scanswere analyzed at the University of Colorado Health SciencesCenter according to a standardized protocol (11). Total fat masswas assessed at baseline and year 2 by dual-energy X-ray ab-sorptiometry (Hologic QDR 4500A, software version 8.21; Ho-logic, Waltham, MA). Weight in kilograms was measured annu-ally with a standard balance beam scale, and height in meters wasmeasured twice at baseline with a Harpenden stadiometer (Hol-tain Ltd, Crosswell, United Kingdom). After averaging the 2height measurements, body mass index (BMI; in kg/m2) wascalculated.
Sociodemographic and lifestyle variables
Sociodemographic variables, including age, sex, self-identified racial group, and level of education, and lifestyle vari-ables, including smoking status, alcohol consumption, and levelof physical activity, were assessed at baseline of the Health ABCstudy. Lifetime pack-years of cigarette smoking were calculatedby multiplying cigarette packs smoked per day by the number ofyears of smoking. Level of physical activity was ascertained bya standardized questionnaire specifically designed for the HealthABC study. This questionnaire was derived from the LeisureTime Physical Activity Questionnaire and included additionalactivities commonly performed by older adults (12). The fre-quency, duration, and intensity level of specific activities weredetermined, and approximate metabolic equivalent unit values
548 SAHYOUN ET AL
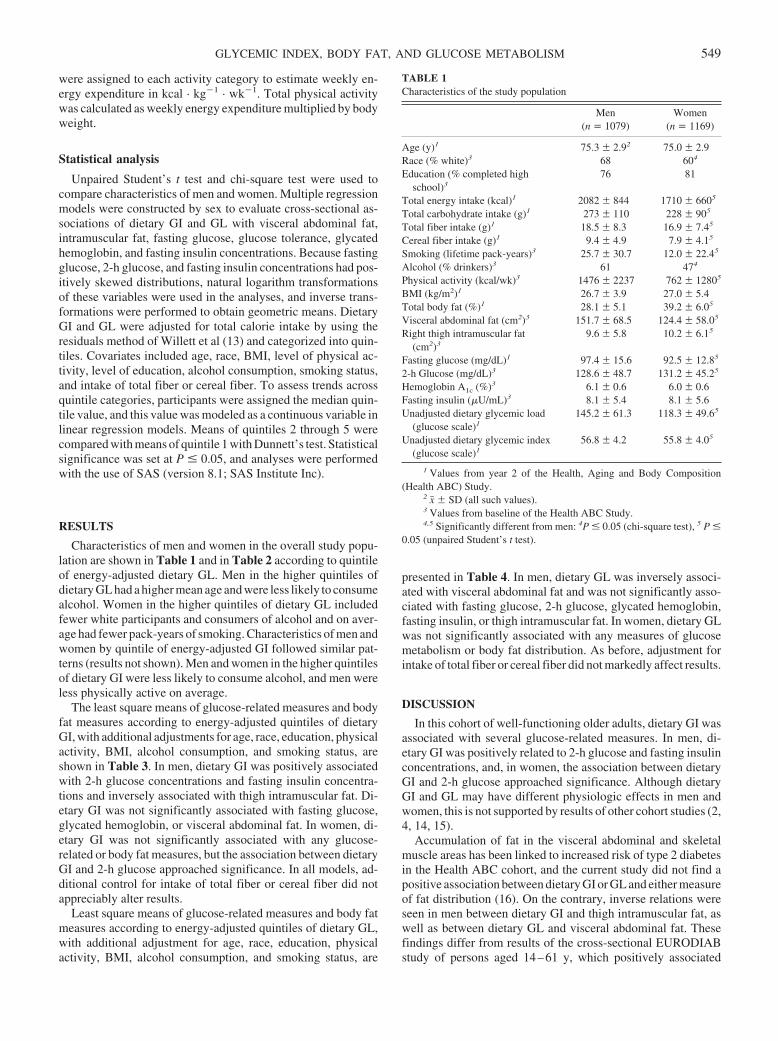
were assigned to each activity category to estimate weekly en-ergy expenditure in kcal · kg�1 · wk�1. Total physical activitywas calculated as weekly energy expenditure multiplied by bodyweight.
Statistical analysis
Unpaired Student’s t test and chi-square test were used tocompare characteristics of men and women. Multiple regressionmodels were constructed by sex to evaluate cross-sectional as-sociations of dietary GI and GL with visceral abdominal fat,intramuscular fat, fasting glucose, glucose tolerance, glycatedhemoglobin, and fasting insulin concentrations. Because fastingglucose, 2-h glucose, and fasting insulin concentrations had pos-itively skewed distributions, natural logarithm transformationsof these variables were used in the analyses, and inverse trans-formations were performed to obtain geometric means. DietaryGI and GL were adjusted for total calorie intake by using theresiduals method of Willett et al (13) and categorized into quin-tiles. Covariates included age, race, BMI, level of physical ac-tivity, level of education, alcohol consumption, smoking status,and intake of total fiber or cereal fiber. To assess trends acrossquintile categories, participants were assigned the median quin-tile value, and this value was modeled as a continuous variable inlinear regression models. Means of quintiles 2 through 5 werecompared with means of quintile 1 with Dunnett’s test. Statisticalsignificance was set at P � 0.05, and analyses were performedwith the use of SAS (version 8.1; SAS Institute Inc).
RESULTS
Characteristics of men and women in the overall study popu-lation are shown in Table 1 and in Table 2 according to quintileof energy-adjusted dietary GL. Men in the higher quintiles ofdietary GL had a higher mean age and were less likely to consumealcohol. Women in the higher quintiles of dietary GL includedfewer white participants and consumers of alcohol and on aver-age had fewer pack-years of smoking. Characteristics of men andwomen by quintile of energy-adjusted GI followed similar pat-terns (results not shown). Men and women in the higher quintilesof dietary GI were less likely to consume alcohol, and men wereless physically active on average.
The least square means of glucose-related measures and bodyfat measures according to energy-adjusted quintiles of dietaryGI, with additional adjustments for age, race, education, physicalactivity, BMI, alcohol consumption, and smoking status, areshown in Table 3. In men, dietary GI was positively associatedwith 2-h glucose concentrations and fasting insulin concentra-tions and inversely associated with thigh intramuscular fat. Di-etary GI was not significantly associated with fasting glucose,glycated hemoglobin, or visceral abdominal fat. In women, di-etary GI was not significantly associated with any glucose-related or body fat measures, but the association between dietaryGI and 2-h glucose approached significance. In all models, ad-ditional control for intake of total fiber or cereal fiber did notappreciably alter results.
Least square means of glucose-related measures and body fatmeasures according to energy-adjusted quintiles of dietary GL,with additional adjustment for age, race, education, physicalactivity, BMI, alcohol consumption, and smoking status, are
presented in Table 4. In men, dietary GL was inversely associ-ated with visceral abdominal fat and was not significantly asso-ciated with fasting glucose, 2-h glucose, glycated hemoglobin,fasting insulin, or thigh intramuscular fat. In women, dietary GLwas not significantly associated with any measures of glucosemetabolism or body fat distribution. As before, adjustment forintake of total fiber or cereal fiber did not markedly affect results.
DISCUSSION
In this cohort of well-functioning older adults, dietary GI wasassociated with several glucose-related measures. In men, di-etary GI was positively related to 2-h glucose and fasting insulinconcentrations, and, in women, the association between dietaryGI and 2-h glucose approached significance. Although dietaryGI and GL may have different physiologic effects in men andwomen, this is not supported by results of other cohort studies (2,4, 14, 15).
Accumulation of fat in the visceral abdominal and skeletalmuscle areas has been linked to increased risk of type 2 diabetesin the Health ABC cohort, and the current study did not find apositive association between dietary GI or GL and either measureof fat distribution (16). On the contrary, inverse relations wereseen in men between dietary GI and thigh intramuscular fat, aswell as between dietary GL and visceral abdominal fat. Thesefindings differ from results of the cross-sectional EURODIABstudy of persons aged 14–61 y, which positively associated
TABLE 1Characteristics of the study population
Men(n � 1079)
Women(n � 1169)
Age (y)1 75.3 � 2.92 75.0 � 2.9Race (% white)3 68 604
Education (% completed highschool)3
76 81
Total energy intake (kcal)1 2082 � 844 1710 � 6605
Total carbohydrate intake (g)1 273 � 110 228 � 905
Total fiber intake (g)1 18.5 � 8.3 16.9 � 7.45
Cereal fiber intake (g)1 9.4 � 4.9 7.9 � 4.15
Smoking (lifetime pack-years)3 25.7 � 30.7 12.0 � 22.45
Alcohol (% drinkers)3 61 474
Physical activity (kcal/wk)3 1476 � 2237 762 � 12805
BMI (kg/m2)1 26.7 � 3.9 27.0 � 5.4Total body fat (%)1 28.1 � 5.1 39.2 � 6.05
Visceral abdominal fat (cm2)3 151.7 � 68.5 124.4 � 58.05
Right thigh intramuscular fat(cm2)3
9.6 � 5.8 10.2 � 6.15
Fasting glucose (mg/dL)1 97.4 � 15.6 92.5 � 12.85
2-h Glucose (mg/dL)3 128.6 � 48.7 131.2 � 45.25
Hemoglobin A1c (%)3 6.1 � 0.6 6.0 � 0.6Fasting insulin (�U/mL)3 8.1 � 5.4 8.1 � 5.6Unadjusted dietary glycemic load
(glucose scale)1145.2 � 61.3 118.3 � 49.65
Unadjusted dietary glycemic index(glucose scale)1
56.8 � 4.2 55.8 � 4.05
1 Values from year 2 of the Health, Aging and Body Composition(Health ABC) Study.
2 x� � SD (all such values).3 Values from baseline of the Health ABC Study.4,5 Significantly different from men: 4P � 0.05 (chi-square test), 5 P �
0.05 (unpaired Student’s t test).
GLYCEMIC INDEX, BODY FAT, AND GLUCOSE METABOLISM 549
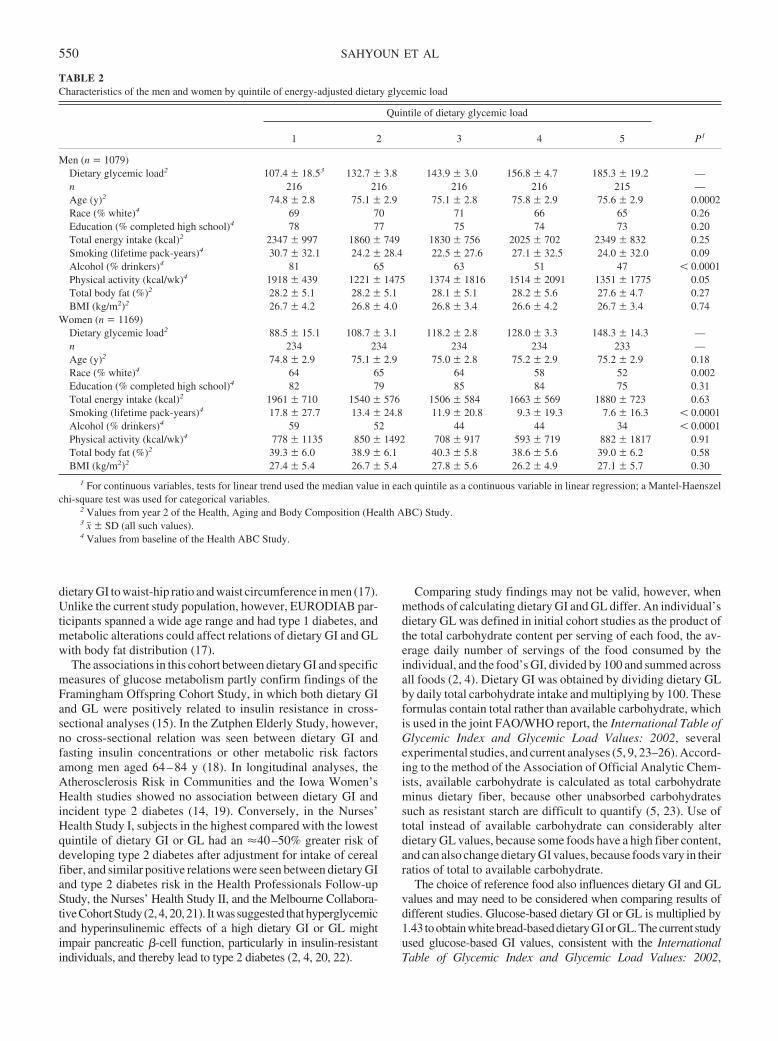
dietary GI to waist-hip ratio and waist circumference in men (17).Unlike the current study population, however, EURODIAB par-ticipants spanned a wide age range and had type 1 diabetes, andmetabolic alterations could affect relations of dietary GI and GLwith body fat distribution (17).
The associations in this cohort between dietary GI and specificmeasures of glucose metabolism partly confirm findings of theFramingham Offspring Cohort Study, in which both dietary GIand GL were positively related to insulin resistance in cross-sectional analyses (15). In the Zutphen Elderly Study, however,no cross-sectional relation was seen between dietary GI andfasting insulin concentrations or other metabolic risk factorsamong men aged 64–84 y (18). In longitudinal analyses, theAtherosclerosis Risk in Communities and the Iowa Women’sHealth studies showed no association between dietary GI andincident type 2 diabetes (14, 19). Conversely, in the Nurses’Health Study I, subjects in the highest compared with the lowestquintile of dietary GI or GL had an �40–50% greater risk ofdeveloping type 2 diabetes after adjustment for intake of cerealfiber, and similar positive relations were seen between dietary GIand type 2 diabetes risk in the Health Professionals Follow-upStudy, the Nurses’ Health Study II, and the Melbourne Collabora-tiveCohortStudy(2,4,20,21). Itwassuggested thathyperglycemicand hyperinsulinemic effects of a high dietary GI or GL mightimpair pancreatic �-cell function, particularly in insulin-resistantindividuals, and thereby lead to type 2 diabetes (2, 4, 20, 22).
Comparing study findings may not be valid, however, whenmethods of calculating dietary GI and GL differ. An individual’sdietary GL was defined in initial cohort studies as the product ofthe total carbohydrate content per serving of each food, the av-erage daily number of servings of the food consumed by theindividual, and the food’s GI, divided by 100 and summed acrossall foods (2, 4). Dietary GI was obtained by dividing dietary GLby daily total carbohydrate intake and multiplying by 100. Theseformulas contain total rather than available carbohydrate, whichis used in the joint FAO/WHO report, the International Table ofGlycemic Index and Glycemic Load Values: 2002, severalexperimental studies, and current analyses (5, 9, 23–26). Accord-ing to the method of the Association of Official Analytic Chem-ists, available carbohydrate is calculated as total carbohydrateminus dietary fiber, because other unabsorbed carbohydratessuch as resistant starch are difficult to quantify (5, 23). Use oftotal instead of available carbohydrate can considerably alterdietary GL values, because some foods have a high fiber content,and can also change dietary GI values, because foods vary in theirratios of total to available carbohydrate.
The choice of reference food also influences dietary GI and GLvalues and may need to be considered when comparing results ofdifferent studies. Glucose-based dietary GI or GL is multiplied by1.43 toobtainwhitebread-baseddietaryGIorGL.Thecurrent studyused glucose-based GI values, consistent with the InternationalTable of Glycemic Index and Glycemic Load Values: 2002,
TABLE 2Characteristics of the men and women by quintile of energy-adjusted dietary glycemic load
Quintile of dietary glycemic load
P11 2 3 4 5
Men (n � 1079)Dietary glycemic load2 107.4 � 18.53 132.7 � 3.8 143.9 � 3.0 156.8 � 4.7 185.3 � 19.2 —n 216 216 216 216 215 —Age (y)2 74.8 � 2.8 75.1 � 2.9 75.1 � 2.8 75.8 � 2.9 75.6 � 2.9 0.0002Race (% white)4 69 70 71 66 65 0.26Education (% completed high school)4 78 77 75 74 73 0.20Total energy intake (kcal)2 2347 � 997 1860 � 749 1830 � 756 2025 � 702 2349 � 832 0.25Smoking (lifetime pack-years)4 30.7 � 32.1 24.2 � 28.4 22.5 � 27.6 27.1 � 32.5 24.0 � 32.0 0.09Alcohol (% drinkers)4 81 65 63 51 47 � 0.0001Physical activity (kcal/wk)4 1918 � 439 1221 � 1475 1374 � 1816 1514 � 2091 1351 � 1775 0.05Total body fat (%)2 28.2 � 5.1 28.2 � 5.1 28.1 � 5.1 28.2 � 5.6 27.6 � 4.7 0.27BMI (kg/m2)2 26.7 � 4.2 26.8 � 4.0 26.8 � 3.4 26.6 � 4.2 26.7 � 3.4 0.74
Women (n � 1169)Dietary glycemic load2 88.5 � 15.1 108.7 � 3.1 118.2 � 2.8 128.0 � 3.3 148.3 � 14.3 —n 234 234 234 234 233 —Age (y)2 74.8 � 2.9 75.1 � 2.9 75.0 � 2.8 75.2 � 2.9 75.2 � 2.9 0.18Race (% white)4 64 65 64 58 52 0.002Education (% completed high school)4 82 79 85 84 75 0.31Total energy intake (kcal)2 1961 � 710 1540 � 576 1506 � 584 1663 � 569 1880 � 723 0.63Smoking (lifetime pack-years)4 17.8 � 27.7 13.4 � 24.8 11.9 � 20.8 9.3 � 19.3 7.6 � 16.3 � 0.0001Alcohol (% drinkers)4 59 52 44 44 34 � 0.0001Physical activity (kcal/wk)4 778 � 1135 850 � 1492 708 � 917 593 � 719 882 � 1817 0.91Total body fat (%)2 39.3 � 6.0 38.9 � 6.1 40.3 � 5.8 38.6 � 5.6 39.0 � 6.2 0.58BMI (kg/m2)2 27.4 � 5.4 26.7 � 5.4 27.8 � 5.6 26.2 � 4.9 27.1 � 5.7 0.30
1 For continuous variables, tests for linear trend used the median value in each quintile as a continuous variable in linear regression; a Mantel-Haenszelchi-square test was used for categorical variables.
2 Values from year 2 of the Health, Aging and Body Composition (Health ABC) Study.3 x� � SD (all such values).4 Values from baseline of the Health ABC Study.
550 SAHYOUN ET AL
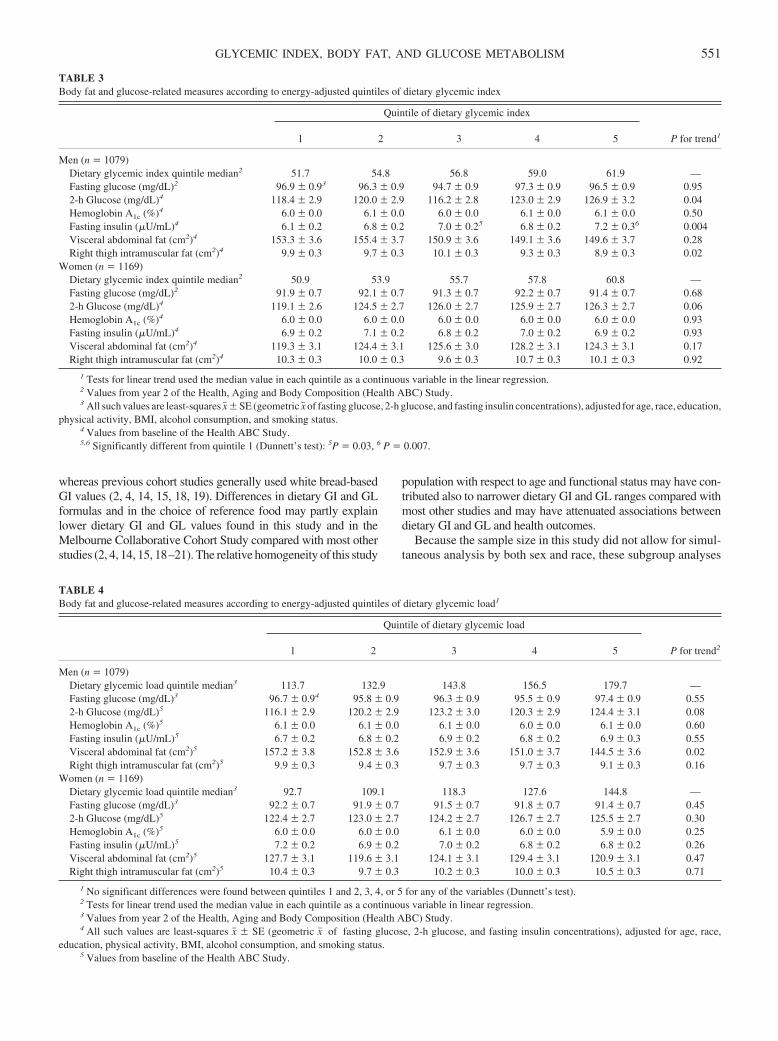
whereas previous cohort studies generally used white bread-basedGI values (2, 4, 14, 15, 18, 19). Differences in dietary GI and GLformulas and in the choice of reference food may partly explainlower dietary GI and GL values found in this study and in theMelbourne Collaborative Cohort Study compared with most otherstudies (2, 4, 14, 15, 18–21). The relative homogeneity of this study
population with respect to age and functional status may have con-tributed also to narrower dietary GI and GL ranges compared withmost other studies and may have attenuated associations betweendietary GI and GL and health outcomes.
Because the sample size in this study did not allow for simul-taneous analysis by both sex and race, these subgroup analyses
TABLE 3Body fat and glucose-related measures according to energy-adjusted quintiles of dietary glycemic index
Quintile of dietary glycemic index
P for trend11 2 3 4 5
Men (n � 1079)Dietary glycemic index quintile median2 51.7 54.8 56.8 59.0 61.9 —Fasting glucose (mg/dL)2 96.9 � 0.93 96.3 � 0.9 94.7 � 0.9 97.3 � 0.9 96.5 � 0.9 0.952-h Glucose (mg/dL)4 118.4 � 2.9 120.0 � 2.9 116.2 � 2.8 123.0 � 2.9 126.9 � 3.2 0.04Hemoglobin A1c (%)4 6.0 � 0.0 6.1 � 0.0 6.0 � 0.0 6.1 � 0.0 6.1 � 0.0 0.50Fasting insulin (�U/mL)4 6.1 � 0.2 6.8 � 0.2 7.0 � 0.25 6.8 � 0.2 7.2 � 0.36 0.004Visceral abdominal fat (cm2)4 153.3 � 3.6 155.4 � 3.7 150.9 � 3.6 149.1 � 3.6 149.6 � 3.7 0.28Right thigh intramuscular fat (cm2)4 9.9 � 0.3 9.7 � 0.3 10.1 � 0.3 9.3 � 0.3 8.9 � 0.3 0.02
Women (n � 1169)Dietary glycemic index quintile median2 50.9 53.9 55.7 57.8 60.8 —Fasting glucose (mg/dL)2 91.9 � 0.7 92.1 � 0.7 91.3 � 0.7 92.2 � 0.7 91.4 � 0.7 0.682-h Glucose (mg/dL)4 119.1 � 2.6 124.5 � 2.7 126.0 � 2.7 125.9 � 2.7 126.3 � 2.7 0.06Hemoglobin A1c (%)4 6.0 � 0.0 6.0 � 0.0 6.0 � 0.0 6.0 � 0.0 6.0 � 0.0 0.93Fasting insulin (�U/mL)4 6.9 � 0.2 7.1 � 0.2 6.8 � 0.2 7.0 � 0.2 6.9 � 0.2 0.93Visceral abdominal fat (cm2)4 119.3 � 3.1 124.4 � 3.1 125.6 � 3.0 128.2 � 3.1 124.3 � 3.1 0.17Right thigh intramuscular fat (cm2)4 10.3 � 0.3 10.0 � 0.3 9.6 � 0.3 10.7 � 0.3 10.1 � 0.3 0.92
1 Tests for linear trend used the median value in each quintile as a continuous variable in the linear regression.2 Values from year 2 of the Health, Aging and Body Composition (Health ABC) Study.3 All such values are least-squares x� � SE (geometric x� of fasting glucose, 2-h glucose, and fasting insulin concentrations), adjusted for age, race, education,
physical activity, BMI, alcohol consumption, and smoking status.4 Values from baseline of the Health ABC Study.5,6 Significantly different from quintile 1 (Dunnett’s test): 5P � 0.03, 6 P � 0.007.
TABLE 4Body fat and glucose-related measures according to energy-adjusted quintiles of dietary glycemic load1
Quintile of dietary glycemic load
P for trend21 2 3 4 5
Men (n � 1079)Dietary glycemic load quintile median3 113.7 132.9 143.8 156.5 179.7 —Fasting glucose (mg/dL)3 96.7 � 0.94 95.8 � 0.9 96.3 � 0.9 95.5 � 0.9 97.4 � 0.9 0.552-h Glucose (mg/dL)5 116.1 � 2.9 120.2 � 2.9 123.2 � 3.0 120.3 � 2.9 124.4 � 3.1 0.08Hemoglobin A1c (%)5 6.1 � 0.0 6.1 � 0.0 6.1 � 0.0 6.0 � 0.0 6.1 � 0.0 0.60Fasting insulin (�U/mL)5 6.7 � 0.2 6.8 � 0.2 6.9 � 0.2 6.8 � 0.2 6.9 � 0.3 0.55Visceral abdominal fat (cm2)5 157.2 � 3.8 152.8 � 3.6 152.9 � 3.6 151.0 � 3.7 144.5 � 3.6 0.02Right thigh intramuscular fat (cm2)5 9.9 � 0.3 9.4 � 0.3 9.7 � 0.3 9.7 � 0.3 9.1 � 0.3 0.16
Women (n � 1169)Dietary glycemic load quintile median3 92.7 109.1 118.3 127.6 144.8 —Fasting glucose (mg/dL)3 92.2 � 0.7 91.9 � 0.7 91.5 � 0.7 91.8 � 0.7 91.4 � 0.7 0.452-h Glucose (mg/dL)5 122.4 � 2.7 123.0 � 2.7 124.2 � 2.7 126.7 � 2.7 125.5 � 2.7 0.30Hemoglobin A1c (%)5 6.0 � 0.0 6.0 � 0.0 6.1 � 0.0 6.0 � 0.0 5.9 � 0.0 0.25Fasting insulin (�U/mL)5 7.2 � 0.2 6.9 � 0.2 7.0 � 0.2 6.8 � 0.2 6.8 � 0.2 0.26Visceral abdominal fat (cm2)5 127.7 � 3.1 119.6 � 3.1 124.1 � 3.1 129.4 � 3.1 120.9 � 3.1 0.47Right thigh intramuscular fat (cm2)5 10.4 � 0.3 9.7 � 0.3 10.2 � 0.3 10.0 � 0.3 10.5 � 0.3 0.71
1 No significant differences were found between quintiles 1 and 2, 3, 4, or 5 for any of the variables (Dunnett’s test).2 Tests for linear trend used the median value in each quintile as a continuous variable in linear regression.3 Values from year 2 of the Health, Aging and Body Composition (Health ABC) Study.4 All such values are least-squares x� � SE (geometric x� of fasting glucose, 2-h glucose, and fasting insulin concentrations), adjusted for age, race,
education, physical activity, BMI, alcohol consumption, and smoking status.5 Values from baseline of the Health ABC Study.
GLYCEMIC INDEX, BODY FAT, AND GLUCOSE METABOLISM 551
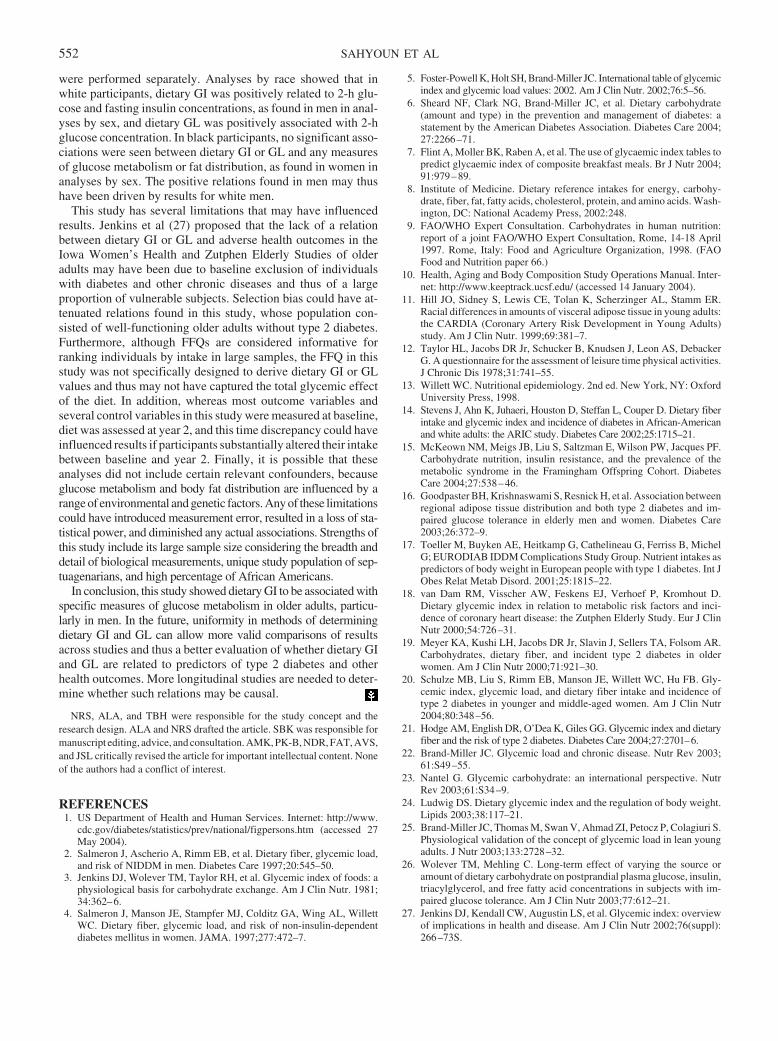
were performed separately. Analyses by race showed that inwhite participants, dietary GI was positively related to 2-h glu-cose and fasting insulin concentrations, as found in men in anal-yses by sex, and dietary GL was positively associated with 2-hglucose concentration. In black participants, no significant asso-ciations were seen between dietary GI or GL and any measuresof glucose metabolism or fat distribution, as found in women inanalyses by sex. The positive relations found in men may thushave been driven by results for white men.
This study has several limitations that may have influencedresults. Jenkins et al (27) proposed that the lack of a relationbetween dietary GI or GL and adverse health outcomes in theIowa Women’s Health and Zutphen Elderly Studies of olderadults may have been due to baseline exclusion of individualswith diabetes and other chronic diseases and thus of a largeproportion of vulnerable subjects. Selection bias could have at-tenuated relations found in this study, whose population con-sisted of well-functioning older adults without type 2 diabetes.Furthermore, although FFQs are considered informative forranking individuals by intake in large samples, the FFQ in thisstudy was not specifically designed to derive dietary GI or GLvalues and thus may not have captured the total glycemic effectof the diet. In addition, whereas most outcome variables andseveral control variables in this study were measured at baseline,diet was assessed at year 2, and this time discrepancy could haveinfluenced results if participants substantially altered their intakebetween baseline and year 2. Finally, it is possible that theseanalyses did not include certain relevant confounders, becauseglucose metabolism and body fat distribution are influenced by arange of environmental and genetic factors. Any of these limitationscould have introduced measurement error, resulted in a loss of sta-tistical power, and diminished any actual associations. Strengths ofthis study include its large sample size considering the breadth anddetail of biological measurements, unique study population of sep-tuagenarians, and high percentage of African Americans.
In conclusion, this study showed dietary GI to be associated withspecific measures of glucose metabolism in older adults, particu-larly in men. In the future, uniformity in methods of determiningdietary GI and GL can allow more valid comparisons of resultsacross studies and thus a better evaluation of whether dietary GIand GL are related to predictors of type 2 diabetes and otherhealth outcomes. More longitudinal studies are needed to deter-mine whether such relations may be causal.
NRS, ALA, and TBH were responsible for the study concept and theresearch design. ALA and NRS drafted the article. SBK was responsible formanuscript editing, advice, and consultation. AMK, PK-B, NDR, FAT, AVS,and JSL critically revised the article for important intellectual content. Noneof the authors had a conflict of interest.
REFERENCES1. US Department of Health and Human Services. Internet: http://www.
cdc.gov/diabetes/statistics/prev/national/figpersons.htm (accessed 27May 2004).
2. Salmeron J, Ascherio A, Rimm EB, et al. Dietary fiber, glycemic load,and risk of NIDDM in men. Diabetes Care 1997;20:545–50.
3. Jenkins DJ, Wolever TM, Taylor RH, et al. Glycemic index of foods: aphysiological basis for carbohydrate exchange. Am J Clin Nutr. 1981;34:362–6.
4. Salmeron J, Manson JE, Stampfer MJ, Colditz GA, Wing AL, WillettWC. Dietary fiber, glycemic load, and risk of non-insulin-dependentdiabetes mellitus in women. JAMA. 1997;277:472–7.
5. Foster-Powell K, Holt SH, Brand-Miller JC. International table of glycemicindex and glycemic load values: 2002. Am J Clin Nutr. 2002;76:5–56.
6. Sheard NF, Clark NG, Brand-Miller JC, et al. Dietary carbohydrate(amount and type) in the prevention and management of diabetes: astatement by the American Diabetes Association. Diabetes Care 2004;27:2266–71.
7. Flint A, Moller BK, Raben A, et al. The use of glycaemic index tables topredict glycaemic index of composite breakfast meals. Br J Nutr 2004;91:979–89.
8. Institute of Medicine. Dietary reference intakes for energy, carbohy-drate, fiber, fat, fatty acids, cholesterol, protein, and amino acids. Wash-ington, DC: National Academy Press, 2002:248.
9. FAO/WHO Expert Consultation. Carbohydrates in human nutrition:report of a joint FAO/WHO Expert Consultation, Rome, 14-18 April1997. Rome, Italy: Food and Agriculture Organization, 1998. (FAOFood and Nutrition paper 66.)
10. Health, Aging and Body Composition Study Operations Manual. Inter-net: http://www.keeptrack.ucsf.edu/ (accessed 14 January 2004).
11. Hill JO, Sidney S, Lewis CE, Tolan K, Scherzinger AL, Stamm ER.Racial differences in amounts of visceral adipose tissue in young adults:the CARDIA (Coronary Artery Risk Development in Young Adults)study. Am J Clin Nutr. 1999;69:381–7.
12. Taylor HL, Jacobs DR Jr, Schucker B, Knudsen J, Leon AS, DebackerG. A questionnaire for the assessment of leisure time physical activities.J Chronic Dis 1978;31:741–55.
13. Willett WC. Nutritional epidemiology. 2nd ed. New York, NY: OxfordUniversity Press, 1998.
14. Stevens J, Ahn K, Juhaeri, Houston D, Steffan L, Couper D. Dietary fiberintake and glycemic index and incidence of diabetes in African-Americanand white adults: the ARIC study. Diabetes Care 2002;25:1715–21.
15. McKeown NM, Meigs JB, Liu S, Saltzman E, Wilson PW, Jacques PF.Carbohydrate nutrition, insulin resistance, and the prevalence of themetabolic syndrome in the Framingham Offspring Cohort. DiabetesCare 2004;27:538–46.
16. Goodpaster BH, Krishnaswami S, Resnick H, et al. Association betweenregional adipose tissue distribution and both type 2 diabetes and im-paired glucose tolerance in elderly men and women. Diabetes Care2003;26:372–9.
17. Toeller M, Buyken AE, Heitkamp G, Cathelineau G, Ferriss B, MichelG; EURODIAB IDDM Complications Study Group. Nutrient intakes aspredictors of body weight in European people with type 1 diabetes. Int JObes Relat Metab Disord. 2001;25:1815–22.
18. van Dam RM, Visscher AW, Feskens EJ, Verhoef P, Kromhout D.Dietary glycemic index in relation to metabolic risk factors and inci-dence of coronary heart disease: the Zutphen Elderly Study. Eur J ClinNutr 2000;54:726–31.
19. Meyer KA, Kushi LH, Jacobs DR Jr, Slavin J, Sellers TA, Folsom AR.Carbohydrates, dietary fiber, and incident type 2 diabetes in olderwomen. Am J Clin Nutr 2000;71:921–30.
20. Schulze MB, Liu S, Rimm EB, Manson JE, Willett WC, Hu FB. Gly-cemic index, glycemic load, and dietary fiber intake and incidence oftype 2 diabetes in younger and middle-aged women. Am J Clin Nutr2004;80:348–56.
21. Hodge AM, English DR, O’Dea K, Giles GG. Glycemic index and dietaryfiber and the risk of type 2 diabetes. Diabetes Care 2004;27:2701–6.
22. Brand-Miller JC. Glycemic load and chronic disease. Nutr Rev 2003;61:S49–55.
23. Nantel G. Glycemic carbohydrate: an international perspective. NutrRev 2003;61:S34–9.
24. Ludwig DS. Dietary glycemic index and the regulation of body weight.Lipids 2003;38:117–21.
25. Brand-Miller JC, Thomas M, Swan V, Ahmad ZI, Petocz P, Colagiuri S.Physiological validation of the concept of glycemic load in lean youngadults. J Nutr 2003;133:2728–32.
26. Wolever TM, Mehling C. Long-term effect of varying the source oramount of dietary carbohydrate on postprandial plasma glucose, insulin,triacylglycerol, and free fatty acid concentrations in subjects with im-paired glucose tolerance. Am J Clin Nutr 2003;77:612–21.
27. Jenkins DJ, Kendall CW, Augustin LS, et al. Glycemic index: overviewof implications in health and disease. Am J Clin Nutr 2002;76(suppl):266–73S.
552 SAHYOUN ET AL
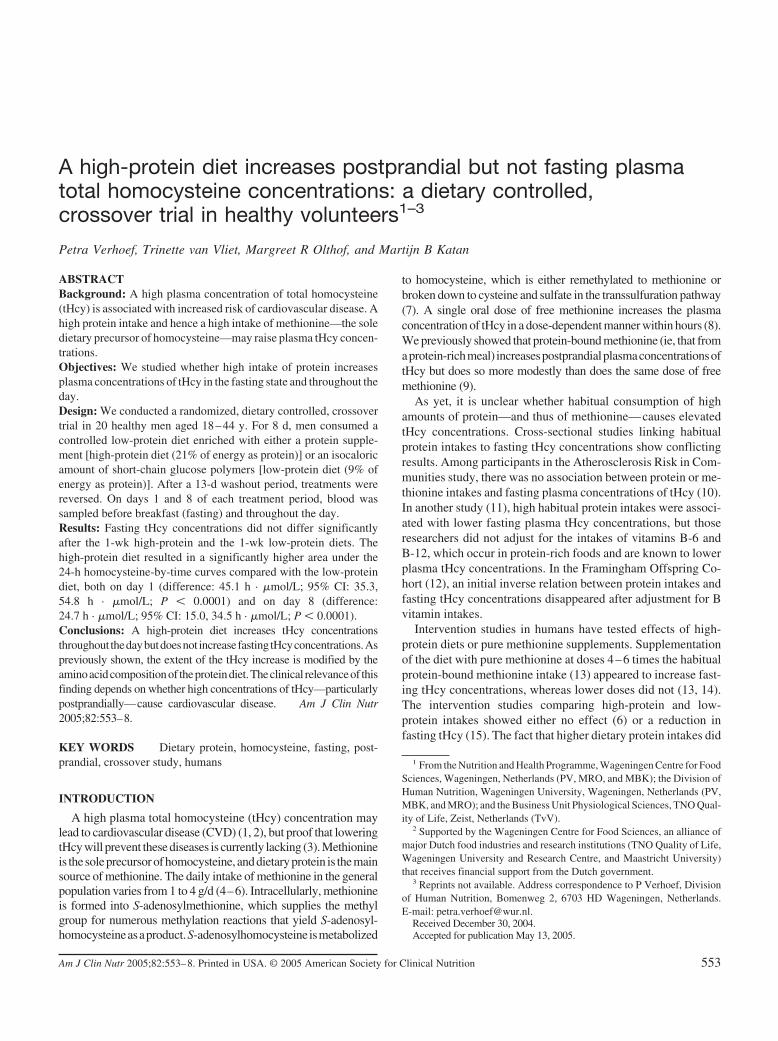
A high-protein diet increases postprandial but not fasting plasmatotal homocysteine concentrations: a dietary controlled,crossover trial in healthy volunteers1–3
Petra Verhoef, Trinette van Vliet, Margreet R Olthof, and Martijn B Katan
ABSTRACTBackground: A high plasma concentration of total homocysteine(tHcy) is associated with increased risk of cardiovascular disease. Ahigh protein intake and hence a high intake of methionine—the soledietary precursor of homocysteine—may raise plasma tHcy concen-trations.Objectives: We studied whether high intake of protein increasesplasma concentrations of tHcy in the fasting state and throughout theday.Design: We conducted a randomized, dietary controlled, crossovertrial in 20 healthy men aged 18–44 y. For 8 d, men consumed acontrolled low-protein diet enriched with either a protein supple-ment [high-protein diet (21% of energy as protein)] or an isocaloricamount of short-chain glucose polymers [low-protein diet (9% ofenergy as protein)]. After a 13-d washout period, treatments werereversed. On days 1 and 8 of each treatment period, blood wassampled before breakfast (fasting) and throughout the day.Results: Fasting tHcy concentrations did not differ significantlyafter the 1-wk high-protein and the 1-wk low-protein diets. Thehigh-protein diet resulted in a significantly higher area under the24-h homocysteine-by-time curves compared with the low-proteindiet, both on day 1 (difference: 45.1 h · �mol/L; 95% CI: 35.3,54.8 h · �mol/L; P � 0.0001) and on day 8 (difference:24.7 h · �mol/L; 95% CI: 15.0, 34.5 h · �mol/L; P � 0.0001).Conclusions: A high-protein diet increases tHcy concentrationsthroughout thedaybutdoesnot increasefastingtHcyconcentrations.Aspreviously shown, the extent of the tHcy increase is modified by theaminoacidcompositionof theproteindiet.Theclinical relevanceof thisfinding depends on whether high concentrations of tHcy—particularlypostprandially—cause cardiovascular disease. Am J Clin Nutr2005;82:553–8.
KEY WORDS Dietary protein, homocysteine, fasting, post-prandial, crossover study, humans
INTRODUCTION
A high plasma total homocysteine (tHcy) concentration maylead to cardiovascular disease (CVD) (1, 2), but proof that loweringtHcy will prevent these diseases is currently lacking (3). Methionineis thesoleprecursorofhomocysteine, anddietaryprotein is themainsource of methionine. The daily intake of methionine in the generalpopulation varies from 1 to 4 g/d (4–6). Intracellularly, methionineis formed into S-adenosylmethionine, which supplies the methylgroup for numerous methylation reactions that yield S-adenosyl-homocysteineasaproduct.S-adenosylhomocysteineismetabolized
to homocysteine, which is either remethylated to methionine orbroken down to cysteine and sulfate in the transsulfuration pathway(7). A single oral dose of free methionine increases the plasmaconcentration of tHcy in a dose-dependent manner within hours (8).We previously showed that protein-bound methionine (ie, that fromaprotein-richmeal) increasespostprandialplasmaconcentrationsoftHcy but does so more modestly than does the same dose of freemethionine (9).
As yet, it is unclear whether habitual consumption of highamounts of protein—and thus of methionine—causes elevatedtHcy concentrations. Cross-sectional studies linking habitualprotein intakes to fasting tHcy concentrations show conflictingresults. Among participants in the Atherosclerosis Risk in Com-munities study, there was no association between protein or me-thionine intakes and fasting plasma concentrations of tHcy (10).In another study (11), high habitual protein intakes were associ-ated with lower fasting plasma tHcy concentrations, but thoseresearchers did not adjust for the intakes of vitamins B-6 andB-12, which occur in protein-rich foods and are known to lowerplasma tHcy concentrations. In the Framingham Offspring Co-hort (12), an initial inverse relation between protein intakes andfasting tHcy concentrations disappeared after adjustment for Bvitamin intakes.
Intervention studies in humans have tested effects of high-protein diets or pure methionine supplements. Supplementationof the diet with pure methionine at doses 4–6 times the habitualprotein-bound methionine intake (13) appeared to increase fast-ing tHcy concentrations, whereas lower doses did not (13, 14).The intervention studies comparing high-protein and low-protein intakes showed either no effect (6) or a reduction infasting tHcy (15). The fact that higher dietary protein intakes did
1 From the Nutrition and Health Programme, Wageningen Centre for FoodSciences, Wageningen, Netherlands (PV, MRO, and MBK); the Division ofHuman Nutrition, Wageningen University, Wageningen, Netherlands (PV,MBK, and MRO); and the Business Unit Physiological Sciences, TNO Qual-ity of Life, Zeist, Netherlands (TvV).
2 Supported by the Wageningen Centre for Food Sciences, an alliance ofmajor Dutch food industries and research institutions (TNO Quality of Life,Wageningen University and Research Centre, and Maastricht University)that receives financial support from the Dutch government.
3 Reprints not available. Address correspondence to P Verhoef, Divisionof Human Nutrition, Bomenweg 2, 6703 HD Wageningen, Netherlands.E-mail: [email protected].
Received December 30, 2004.Accepted for publication May 13, 2005.
553Am J Clin Nutr 2005;82:553–8. Printed in USA. © 2005 American Society for Clinical Nutrition
not increase plasma concentrations of fasting tHcy in these stud-ies can be interpreted in several ways. First, like rats (16), humansmay adapt to increased methionine intakes by improved homo-cysteine catabolism, and hence tHcy is completely removedovernight. Second, a protein composition with a high ratio ofserine to methionine or of cysteine to methionine may temper thepostprandial tHcy rise and hence leave fasting tHcy unaffected(9). Third, the extra intake of B vitamins associated with highprotein intakes may counterbalance the tHcy-raising effect ofmethionine. Therefore, we investigated whether high habitualintake of protein affects the fasting tHcy concentration when theintake of B vitamins and other nutrients is kept constant byconsumption of supplements of protein powder instead of con-sumption of protein-rich foods. We also investigated whetherhigh intakes of protein affect postprandial tHcy concentrations.Like high fasting tHcy concentrations, high tHcy responses aftermethionine intake are a risk factor for CVD and impaired reac-tivity of the vascular endothelium (8, 17, 18).
SUBJECTS AND METHODS
Subjects
Twenty men aged 18–44 y (x� � SD age: 29 � 8 y) participatedin the study. They were recruited from the pool of volunteers atTNO Quality of Life and by advertisements in local newspapers.On the basis of a screening examination, which took place 4–6wk before the start of the study, they were judged healthy. Theexamination included a health and lifestyle questionnaire, phys-ical examination, blood pressure measurement, and hematologicanalyses of blood, liver enzymes, creatinine, glucose, and lipids;the men had no glucose or protein in the urine and had a normalbody mass index [(in kg/m2) �30], normal dietary habits, and aplasma tHcy concentration �20 �mol/L.
All volunteers gave written informed consent. The study wasconducted according to Good Clinical Practice guidelines at theBusiness unit Physiologic Sciences, TNO Quality of Life (Zeist,Netherlands). The protocol was approved by the local medicalethics committee.
Design
The study was designed as a randomized, open, dietary con-trolled, crossover study in free-living volunteers. Each man un-derwent 2 dietary treatments: a high-protein diet and a low-protein diet. Each treatment period lasted 8 d, and the interveningwashout period, during which the men consumed their habitualdiet, lasted 13 d. After the washout period, the treatments werereversed. Half of the men started with the low-protein diet andhalf with the high-protein diet.
On days 1 and 8 of each treatment period, volunteers stayed inthe metabolic ward from early in the morning until �12 h later.On those days, a fasting blood sample was taken just beforebreakfast (t � 0), and samples were also taken at 2, 4, 6, 8, 10, and12 h after breakfast. Lunch and dinner were eaten 30 min before theblood samplings at 4 and 10 h, respectively. The next morning (days2 and 9 of each treatment period), volunteers returned to the instituteto provide another fasting blood sample at t � 24 h. On all othertreatment days, volunteers consumed only the hot lunch at the re-search institute and received drinks and foods for a period of �24 h.
The daily diet consisted of the following meals and snacks: abreakfast of bread, diet margarine, jam, ham, colored sprinkles,
and a yogurt drink; a morning snack consisting of a glass of cocoaand a biscuit; a lunch consisting of soup, a hot meal (eithermacaroni with ham and cheese, potatoes with chicken cordonbleu and cauliflower and broccoli, or potatoes with turkey filletand apples and raisins), custard, and a soft drink; an afternoonsnack consisting of a piece of fruit, a candy bar, and another softdrink; a dinner consisting of soup, bread, diet margarine, low-protein toppings (eg, jam and colored sprinkles), orange juice,and custard; and an evening snack consisting of potato chips anda soft drink. The supplements of protein and dextrin-maltose (seeComposition of the diet, below) were added to the yogurt drink,cocoa, soup, hot meal, and custard. The protein supplementclearly thickened these drinks and foods, but the dextrine-maltose did not. Consequently, the study was not blinded, as themen had tried a protein-enriched product during the screeningvisit. The men were not allowed to eat or drink additional foodexcept tap water, coffee, and tea. On the study days in the ward,consumption of coffee and tea was limited to 1 cup (ie, �150 mL)every 2 h and was kept the same on all 4 in-ward study days.
Compliance was measured in several ways. The men regis-tered their consumption of provided foods in a structured diary ona daily basis, recording if, when, and how much they consumedof each item. They were asked to return remains (if any) of thedrinks and foods containing the supplements, and the weight ofthese was registered at the institute. On the 4 whole-day visits tothe institute (ie, days 1 and 8 of each treatment period), thepersonnel checked and registered compliance.
Composition of the diet
Usual energy requirement was estimated from the basal met-abolic rate (BMR) and an individual physical activity index(PAI) by the equation
Energy requirement � BMR � PAI (1)
The BMR was calculated by using the formula of Schofield (19)for men: 0.0486 � body weight (in kg) � 3.653. PAI was mea-sured by using the Baecke questionnaire (20). For pragmaticreasons, volunteers were then grouped into 2 energy groups: 13.2MJ or 14.4 MJ. We considered this acceptable for treatmentperiods of 8 d. We aimed to create a large contrast between thelow-protein and high-protein treatments, by choosing the 5th and95th percentiles of the percentage of energy derived from totalprotein in Dutch men aged 22–50 y (based on data of the thirdDutch National Food Consumption Survey, conducted in 1997–1998) (21).
High-protein diet
We added a protein supplement to a controlled low-proteindiet containing �73 g protein (1.6 g methionine/d) for the low-energy group and �79 g protein (1.7 g methionine/d) for thehigh-energy group. The protein supplement was based on de-creamed milk proteins (Protifar plus; Nutricia BV, Zoetermeer,Netherlands) and consisted of 88.5 g protein or 2.7 g methionineper 100 g. The amounts of protein supplement that we added tothe diet were 105 g/d and 116 g/d for the low- and high-energygroup, respectively. Hence, this high-protein diet resulted in totaldaily intakes of �166 g protein (4.1 g methionine) among themen in the low-energy group and �182 g protein (4.5 g methi-onine) among the men in the high-energy group.
554 VERHOEF ET AL
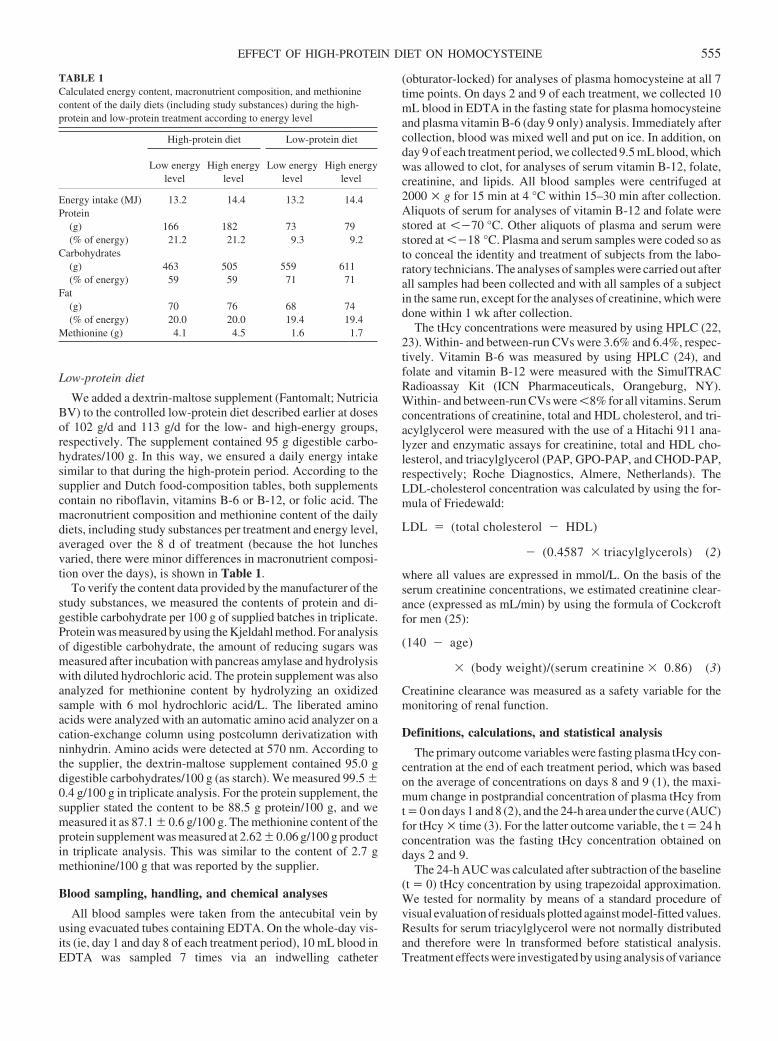
Low-protein diet
We added a dextrin-maltose supplement (Fantomalt; NutriciaBV) to the controlled low-protein diet described earlier at dosesof 102 g/d and 113 g/d for the low- and high-energy groups,respectively. The supplement contained 95 g digestible carbo-hydrates/100 g. In this way, we ensured a daily energy intakesimilar to that during the high-protein period. According to thesupplier and Dutch food-composition tables, both supplementscontain no riboflavin, vitamins B-6 or B-12, or folic acid. Themacronutrient composition and methionine content of the dailydiets, including study substances per treatment and energy level,averaged over the 8 d of treatment (because the hot lunchesvaried, there were minor differences in macronutrient composi-tion over the days), is shown in Table 1.
To verify the content data provided by the manufacturer of thestudy substances, we measured the contents of protein and di-gestible carbohydrate per 100 g of supplied batches in triplicate.Protein was measured by using the Kjeldahl method. For analysisof digestible carbohydrate, the amount of reducing sugars wasmeasured after incubation with pancreas amylase and hydrolysiswith diluted hydrochloric acid. The protein supplement was alsoanalyzed for methionine content by hydrolyzing an oxidizedsample with 6 mol hydrochloric acid/L. The liberated aminoacids were analyzed with an automatic amino acid analyzer on acation-exchange column using postcolumn derivatization withninhydrin. Amino acids were detected at 570 nm. According tothe supplier, the dextrin-maltose supplement contained 95.0 gdigestible carbohydrates/100 g (as starch). We measured 99.5 �0.4 g/100 g in triplicate analysis. For the protein supplement, thesupplier stated the content to be 88.5 g protein/100 g, and wemeasured it as 87.1 � 0.6 g/100 g. The methionine content of theprotein supplement was measured at 2.62 � 0.06 g/100 g productin triplicate analysis. This was similar to the content of 2.7 gmethionine/100 g that was reported by the supplier.
Blood sampling, handling, and chemical analyses
All blood samples were taken from the antecubital vein byusing evacuated tubes containing EDTA. On the whole-day vis-its (ie, day 1 and day 8 of each treatment period), 10 mL blood inEDTA was sampled 7 times via an indwelling catheter
(obturator-locked) for analyses of plasma homocysteine at all 7time points. On days 2 and 9 of each treatment, we collected 10mL blood in EDTA in the fasting state for plasma homocysteineand plasma vitamin B-6 (day 9 only) analysis. Immediately aftercollection, blood was mixed well and put on ice. In addition, onday 9 of each treatment period, we collected 9.5 mL blood, whichwas allowed to clot, for analyses of serum vitamin B-12, folate,creatinine, and lipids. All blood samples were centrifuged at2000 � g for 15 min at 4 °C within 15–30 min after collection.Aliquots of serum for analyses of vitamin B-12 and folate werestored at ��70 °C. Other aliquots of plasma and serum werestored at ��18 °C. Plasma and serum samples were coded so asto conceal the identity and treatment of subjects from the labo-ratory technicians. The analyses of samples were carried out afterall samples had been collected and with all samples of a subjectin the same run, except for the analyses of creatinine, which weredone within 1 wk after collection.
The tHcy concentrations were measured by using HPLC (22,23). Within- and between-run CVs were 3.6% and 6.4%, respec-tively. Vitamin B-6 was measured by using HPLC (24), andfolate and vitamin B-12 were measured with the SimulTRACRadioassay Kit (ICN Pharmaceuticals, Orangeburg, NY).Within- and between-run CVs were �8% for all vitamins. Serumconcentrations of creatinine, total and HDL cholesterol, and tri-acylglycerol were measured with the use of a Hitachi 911 ana-lyzer and enzymatic assays for creatinine, total and HDL cho-lesterol, and triacylglycerol (PAP, GPO-PAP, and CHOD-PAP,respectively; Roche Diagnostics, Almere, Netherlands). TheLDL-cholesterol concentration was calculated by using the for-mula of Friedewald:
LDL � (total cholesterol � HDL)
� (0.4587 � triacylglycerols) (2)
where all values are expressed in mmol/L. On the basis of theserum creatinine concentrations, we estimated creatinine clear-ance (expressed as mL/min) by using the formula of Cockcroftfor men (25):
(140 � age)
� (body weight)/(serum creatinine � 0.86) (3)
Creatinine clearance was measured as a safety variable for themonitoring of renal function.
Definitions, calculations, and statistical analysis
The primary outcome variables were fasting plasma tHcy con-centration at the end of each treatment period, which was basedon the average of concentrations on days 8 and 9 (1), the maxi-mum change in postprandial concentration of plasma tHcy fromt � 0 on days 1 and 8 (2), and the 24-h area under the curve (AUC)for tHcy � time (3). For the latter outcome variable, the t � 24 hconcentration was the fasting tHcy concentration obtained ondays 2 and 9.
The 24-h AUC was calculated after subtraction of the baseline(t � 0) tHcy concentration by using trapezoidal approximation.We tested for normality by means of a standard procedure ofvisual evaluation of residuals plotted against model-fitted values.Results for serum triacylglycerol were not normally distributedand therefore were ln transformed before statistical analysis.Treatment effects were investigated by using analysis of variance
TABLE 1Calculated energy content, macronutrient composition, and methioninecontent of the daily diets (including study substances) during the high-protein and low-protein treatment according to energy level
High-protein diet Low-protein diet
Low energylevel
High energylevel
Low energylevel
High energylevel
Energy intake (MJ) 13.2 14.4 13.2 14.4Protein
(g) 166 182 73 79(% of energy) 21.2 21.2 9.3 9.2
Carbohydrates(g) 463 505 559 611(% of energy) 59 59 71 71
Fat(g) 70 76 68 74(% of energy) 20.0 20.0 19.4 19.4
Methionine (g) 4.1 4.5 1.6 1.7
EFFECT OF HIGH-PROTEIN DIET ON HOMOCYSTEINE 555
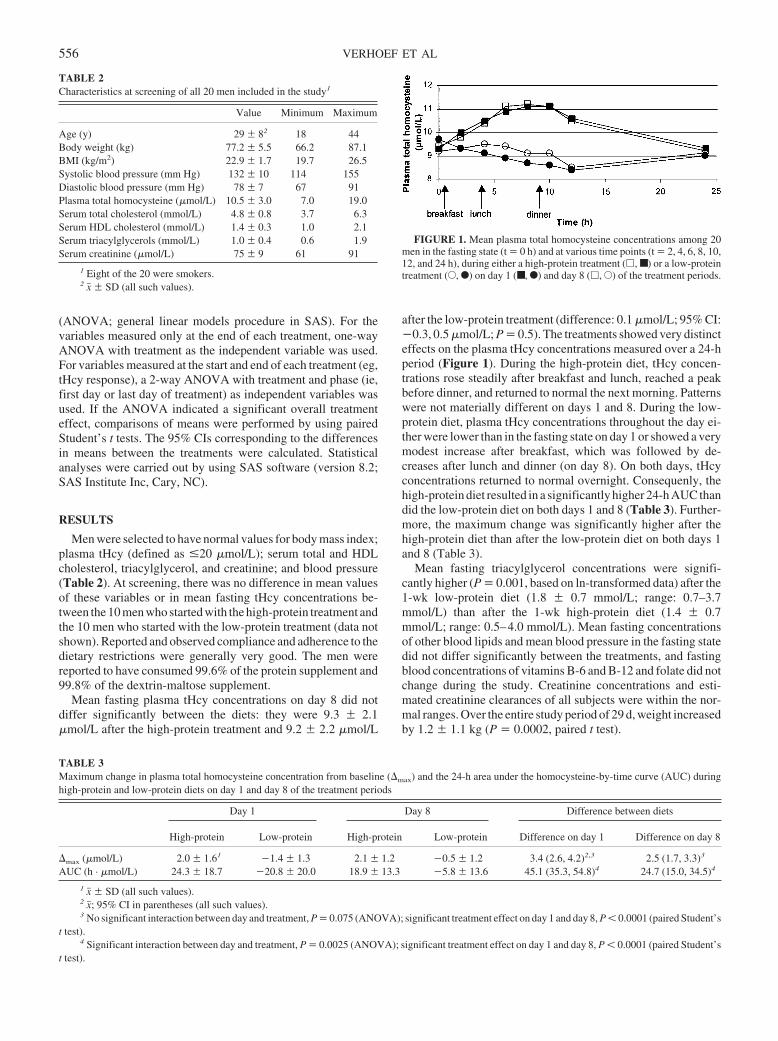
(ANOVA; general linear models procedure in SAS). For thevariables measured only at the end of each treatment, one-wayANOVA with treatment as the independent variable was used.For variables measured at the start and end of each treatment (eg,tHcy response), a 2-way ANOVA with treatment and phase (ie,first day or last day of treatment) as independent variables wasused. If the ANOVA indicated a significant overall treatmenteffect, comparisons of means were performed by using pairedStudent’s t tests. The 95% CIs corresponding to the differencesin means between the treatments were calculated. Statisticalanalyses were carried out by using SAS software (version 8.2;SAS Institute Inc, Cary, NC).
RESULTS
Men were selected to have normal values for body mass index;plasma tHcy (defined as �20 �mol/L); serum total and HDLcholesterol, triacylglycerol, and creatinine; and blood pressure(Table 2). At screening, there was no difference in mean valuesof these variables or in mean fasting tHcy concentrations be-tween the 10 men who started with the high-protein treatment andthe 10 men who started with the low-protein treatment (data notshown). Reported and observed compliance and adherence to thedietary restrictions were generally very good. The men werereported to have consumed 99.6% of the protein supplement and99.8% of the dextrin-maltose supplement.
Mean fasting plasma tHcy concentrations on day 8 did notdiffer significantly between the diets: they were 9.3 � 2.1�mol/L after the high-protein treatment and 9.2 � 2.2 �mol/L
after the low-protein treatment (difference: 0.1 �mol/L; 95% CI:�0.3, 0.5 �mol/L; P � 0.5). The treatments showed very distincteffects on the plasma tHcy concentrations measured over a 24-hperiod (Figure 1). During the high-protein diet, tHcy concen-trations rose steadily after breakfast and lunch, reached a peakbefore dinner, and returned to normal the next morning. Patternswere not materially different on days 1 and 8. During the low-protein diet, plasma tHcy concentrations throughout the day ei-ther were lower than in the fasting state on day 1 or showed a verymodest increase after breakfast, which was followed by de-creases after lunch and dinner (on day 8). On both days, tHcyconcentrations returned to normal overnight. Consequenly, thehigh-protein diet resulted in a significantly higher 24-h AUC thandid the low-protein diet on both days 1 and 8 (Table 3). Further-more, the maximum change was significantly higher after thehigh-protein diet than after the low-protein diet on both days 1and 8 (Table 3).
Mean fasting triacylglycerol concentrations were signifi-cantly higher (P � 0.001, based on ln-transformed data) after the1-wk low-protein diet (1.8 � 0.7 mmol/L; range: 0.7–3.7mmol/L) than after the 1-wk high-protein diet (1.4 � 0.7mmol/L; range: 0.5–4.0 mmol/L). Mean fasting concentrationsof other blood lipids and mean blood pressure in the fasting statedid not differ significantly between the treatments, and fastingblood concentrations of vitamins B-6 and B-12 and folate did notchange during the study. Creatinine concentrations and esti-mated creatinine clearances of all subjects were within the nor-mal ranges. Over the entire study period of 29 d, weight increasedby 1.2 � 1.1 kg (P � 0.0002, paired t test).
TABLE 3Maximum change in plasma total homocysteine concentration from baseline (�max) and the 24-h area under the homocysteine-by-time curve (AUC) duringhigh-protein and low-protein diets on day 1 and day 8 of the treatment periods
Day 1 Day 8 Difference between diets
High-protein Low-protein High-protein Low-protein Difference on day 1 Difference on day 8
�max (�mol/L) 2.0 � 1.61 �1.4 � 1.3 2.1 � 1.2 �0.5 � 1.2 3.4 (2.6, 4.2)2,3 2.5 (1.7, 3.3)3
AUC (h · �mol/L) 24.3 � 18.7 �20.8 � 20.0 18.9 � 13.3 �5.8 � 13.6 45.1 (35.3, 54.8)4 24.7 (15.0, 34.5)4
1 x� � SD (all such values).2 x�; 95% CI in parentheses (all such values).3 No significant interaction between day and treatment, P � 0.075 (ANOVA); significant treatment effect on day 1 and day 8, P � 0.0001 (paired Student’s
t test).4 Significant interaction between day and treatment, P � 0.0025 (ANOVA); significant treatment effect on day 1 and day 8, P � 0.0001 (paired Student’s
t test).
TABLE 2Characteristics at screening of all 20 men included in the study1
Value Minimum Maximum
Age (y) 29 � 82 18 44Body weight (kg) 77.2 � 5.5 66.2 87.1BMI (kg/m2) 22.9 � 1.7 19.7 26.5Systolic blood pressure (mm Hg) 132 � 10 114 155Diastolic blood pressure (mm Hg) 78 � 7 67 91Plasma total homocysteine (�mol/L) 10.5 � 3.0 7.0 19.0Serum total cholesterol (mmol/L) 4.8 � 0.8 3.7 6.3Serum HDL cholesterol (mmol/L) 1.4 � 0.3 1.0 2.1Serum triacylglycerols (mmol/L) 1.0 � 0.4 0.6 1.9Serum creatinine (�mol/L) 75 � 9 61 91
1 Eight of the 20 were smokers.2 x� � SD (all such values).
FIGURE 1. Mean plasma total homocysteine concentrations among 20men in the fasting state (t � 0 h) and at various time points (t � 2, 4, 6, 8, 10,12, and 24 h), during either a high-protein treatment (�, ■ ) or a low-proteintreatment (E, F) on day 1 (■ , F) and day 8 (�, E) of the treatment periods.
556 VERHOEF ET AL
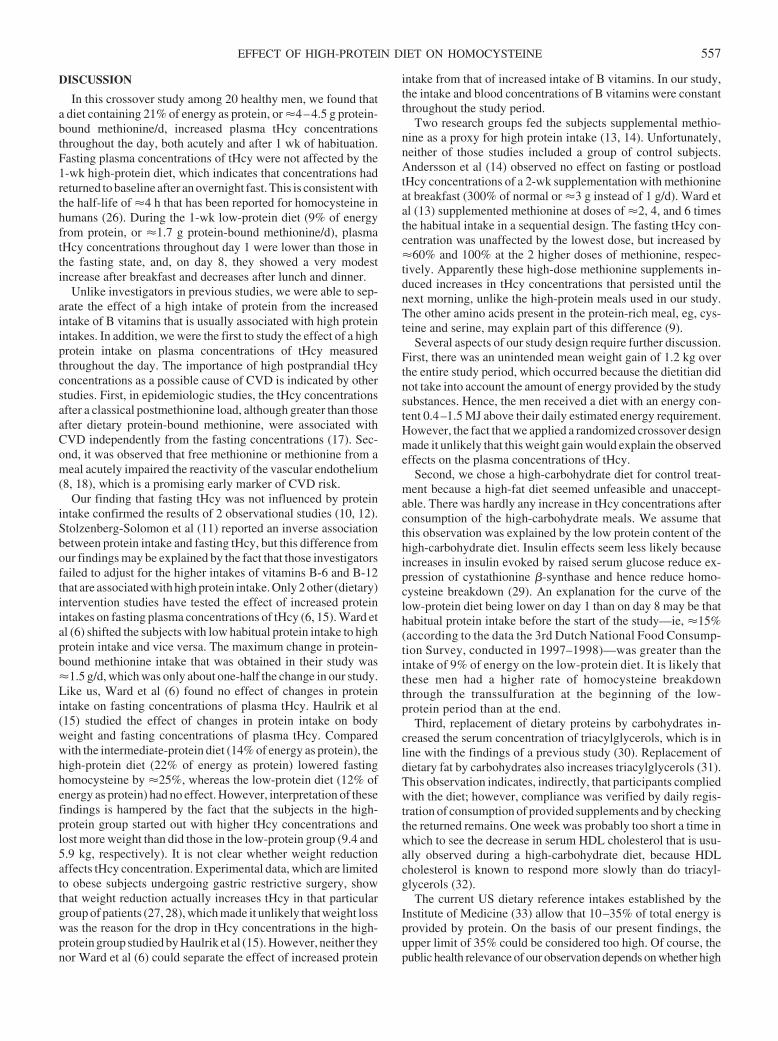
DISCUSSION
In this crossover study among 20 healthy men, we found thata diet containing 21% of energy as protein, or �4–4.5 g protein-bound methionine/d, increased plasma tHcy concentrationsthroughout the day, both acutely and after 1 wk of habituation.Fasting plasma concentrations of tHcy were not affected by the1-wk high-protein diet, which indicates that concentrations hadreturned to baseline after an overnight fast. This is consistent withthe half-life of �4 h that has been reported for homocysteine inhumans (26). During the 1-wk low-protein diet (9% of energyfrom protein, or �1.7 g protein-bound methionine/d), plasmatHcy concentrations throughout day 1 were lower than those inthe fasting state, and, on day 8, they showed a very modestincrease after breakfast and decreases after lunch and dinner.
Unlike investigators in previous studies, we were able to sep-arate the effect of a high intake of protein from the increasedintake of B vitamins that is usually associated with high proteinintakes. In addition, we were the first to study the effect of a highprotein intake on plasma concentrations of tHcy measuredthroughout the day. The importance of high postprandial tHcyconcentrations as a possible cause of CVD is indicated by otherstudies. First, in epidemiologic studies, the tHcy concentrationsafter a classical postmethionine load, although greater than thoseafter dietary protein-bound methionine, were associated withCVD independently from the fasting concentrations (17). Sec-ond, it was observed that free methionine or methionine from ameal acutely impaired the reactivity of the vascular endothelium(8, 18), which is a promising early marker of CVD risk.
Our finding that fasting tHcy was not influenced by proteinintake confirmed the results of 2 observational studies (10, 12).Stolzenberg-Solomon et al (11) reported an inverse associationbetween protein intake and fasting tHcy, but this difference fromour findings may be explained by the fact that those investigatorsfailed to adjust for the higher intakes of vitamins B-6 and B-12that are associated with high protein intake. Only 2 other (dietary)intervention studies have tested the effect of increased proteinintakes on fasting plasma concentrations of tHcy (6, 15). Ward etal (6) shifted the subjects with low habitual protein intake to highprotein intake and vice versa. The maximum change in protein-bound methionine intake that was obtained in their study was�1.5 g/d, which was only about one-half the change in our study.Like us, Ward et al (6) found no effect of changes in proteinintake on fasting concentrations of plasma tHcy. Haulrik et al(15) studied the effect of changes in protein intake on bodyweight and fasting concentrations of plasma tHcy. Comparedwith the intermediate-protein diet (14% of energy as protein), thehigh-protein diet (22% of energy as protein) lowered fastinghomocysteine by �25%, whereas the low-protein diet (12% ofenergy as protein) had no effect. However, interpretation of thesefindings is hampered by the fact that the subjects in the high-protein group started out with higher tHcy concentrations andlost more weight than did those in the low-protein group (9.4 and5.9 kg, respectively). It is not clear whether weight reductionaffects tHcy concentration. Experimental data, which are limitedto obese subjects undergoing gastric restrictive surgery, showthat weight reduction actually increases tHcy in that particulargroup of patients (27, 28), which made it unlikely that weight losswas the reason for the drop in tHcy concentrations in the high-protein group studied by Haulrik et al (15). However, neither theynor Ward et al (6) could separate the effect of increased protein
intake from that of increased intake of B vitamins. In our study,the intake and blood concentrations of B vitamins were constantthroughout the study period.
Two research groups fed the subjects supplemental methio-nine as a proxy for high protein intake (13, 14). Unfortunately,neither of those studies included a group of control subjects.Andersson et al (14) observed no effect on fasting or postloadtHcy concentrations of a 2-wk supplementation with methionineat breakfast (300% of normal or �3 g instead of 1 g/d). Ward etal (13) supplemented methionine at doses of �2, 4, and 6 timesthe habitual intake in a sequential design. The fasting tHcy con-centration was unaffected by the lowest dose, but increased by�60% and 100% at the 2 higher doses of methionine, respec-tively. Apparently these high-dose methionine supplements in-duced increases in tHcy concentrations that persisted until thenext morning, unlike the high-protein meals used in our study.The other amino acids present in the protein-rich meal, eg, cys-teine and serine, may explain part of this difference (9).
Several aspects of our study design require further discussion.First, there was an unintended mean weight gain of 1.2 kg overthe entire study period, which occurred because the dietitian didnot take into account the amount of energy provided by the studysubstances. Hence, the men received a diet with an energy con-tent 0.4–1.5 MJ above their daily estimated energy requirement.However, the fact that we applied a randomized crossover designmade it unlikely that this weight gain would explain the observedeffects on the plasma concentrations of tHcy.
Second, we chose a high-carbohydrate diet for control treat-ment because a high-fat diet seemed unfeasible and unaccept-able. There was hardly any increase in tHcy concentrations afterconsumption of the high-carbohydrate meals. We assume thatthis observation was explained by the low protein content of thehigh-carbohydrate diet. Insulin effects seem less likely becauseincreases in insulin evoked by raised serum glucose reduce ex-pression of cystathionine �-synthase and hence reduce homo-cysteine breakdown (29). An explanation for the curve of thelow-protein diet being lower on day 1 than on day 8 may be thathabitual protein intake before the start of the study—ie, �15%(according to the data the 3rd Dutch National Food Consump-tion Survey, conducted in 1997–1998)—was greater than theintake of 9% of energy on the low-protein diet. It is likely thatthese men had a higher rate of homocysteine breakdownthrough the transsulfuration at the beginning of the low-protein period than at the end.
Third, replacement of dietary proteins by carbohydrates in-creased the serum concentration of triacylglycerols, which is inline with the findings of a previous study (30). Replacement ofdietary fat by carbohydrates also increases triacylglycerols (31).This observation indicates, indirectly, that participants compliedwith the diet; however, compliance was verified by daily regis-tration of consumption of provided supplements and by checkingthe returned remains. One week was probably too short a time inwhich to see the decrease in serum HDL cholesterol that is usu-ally observed during a high-carbohydrate diet, because HDLcholesterol is known to respond more slowly than do triacyl-glycerols (32).
The current US dietary reference intakes established by theInstitute of Medicine (33) allow that 10–35% of total energy isprovided by protein. On the basis of our present findings, theupper limit of 35% could be considered too high. Of course, thepublic health relevance of our observation depends on whether high
EFFECT OF HIGH-PROTEIN DIET ON HOMOCYSTEINE 557
plasma tHcy is a cause of CVD and other chronic diseases. Twosecondary prevention trials showed no reduction in coronary heartdiseaseorstrokeafter�2yof tHcy-lowering treatment (34,35),but,in a few years, data will be available from �50 000 patients whowere allocated to receive B vitamins or placebo (36).
In conclusion, compared with a high-carbohydrate diet, ahigh-protein diet raises tHcy concentrations throughout the day,both acutely and after 1 wk of habituation. Fasting tHcy concen-trations are not affected by a high-protein diet. As we previouslyshowed, the extent of the postprandial rise in tHcy is likely to bemodified by the amino acid composition of the protein diet. Theclinical relevance of our finding depends on whether high con-centrations of tHcy—in particular, high postprandial concentra-tions—do indeed cause CVD. If so, it might be important toavoid excessive protein intake.
We thank the volunteers for their participation, all those involved in theconduct of the experiment at Business Unit Physiologic Sciences, TNOQuality of Life (Zeist, Netherlands), for their dedication, and the laboratorystaff at Wageningen University and TNO Quality of Life for careful analyses.Furthermore, we thank the Department of Chronic Disease Epidemiology,National Institute of Public Health and the Environment, Bilthoven, Neth-erlands, for data on the amino acid composition of foods.
All authors were responsible for the design of the study. TvV was in chargeof the conduct of the experiment, including selection of subjects, planning,and implementation. PV prepared several drafts of the manuscript. All otherauthors critically revised the manuscript. None of the authors had a financialor personal conflict of interest.
REFERENCES1. The Homocysteine Studies Collaboration. Homocysteine and risk of
ischemic heart disease and stroke. JAMA 2002;288:2015–22.2. Klerk M, Verhoef P, Clarke R, Blom HJ, Kok FJ, Schouten EG, and the
MTHFRStudiesCollaboration.MTHFR677C3Tpolymorphismandriskof coronary heart disease: a meta-analysis. JAMA 2002;288:2023–31.
3. Verhoef P, Katan MB. A healthy lifestyle lowers homocysteine, butshould we care? Am J Clin Nutr 2004;79:713–4.
4. Verhoef P, Stampfer MJ, Buring JE, et al. Homocysteine metabolism andrisk of myocardial infarction: relation with vitamins B6, B12, and folate.Am J Epidemiol 1996;143:845–59.
5. Mann NJ, Li D, Sinclair AJ, et al. The effect of diet on plasma homo-cysteine concentrations in healthy male subjects. Eur J Clin Nutr 1999;53:895–9.
6. Ward M, McNulty H, Pentieva K, et al. Fluctuations in dietary methio-nine intake do not alter plasma homocysteine concentration in healthymen. J Nutr 2000;130:2653–7.
7. Finkelstein JD, Martin JJ. Homocysteine. Int J Biochem Cell Biol 2000;32:385–9.
8. Chambers JC, Obeid OA, Kooner JS. Physiological increments inplasma homocysteine induce vascular endothelial dysfunction in normalhuman subjects. Arterioscler Thromb Vasc Biol 1999;19:2922–7.
9. Verhoef P, Steenge GR, Boelsma E, van Vliet T, Olthof MR, Katan MB.Dietary serine and cystine attenuate the homocysteine-raising effect ofdietary methionine: a randomized, crossover study in humans. Am J ClinNutr 2004;80:674–9.
10. Shimakawa T, Nieto FJ, Malinow MR, Chamless LE, Schreiner PJ,Szklo M. Vitamin intake: a possible determinant of plasma homocys-teine among middle-aged adults. Ann Epidemiol 1997;7:285–93.
11. Stolzenberg SR, Miller ER, Maguire MG, Selhub J, Appel LJ. Associationof dietary protein intake and coffee consumption with serum homocysteineconcentrations in an older population. Am J Clin Nutr 1999;69:467–75.
12. Jacques PF, Bostom AG, Wilson PWF, Rich S, Rosenberg IH, Selhub J.Determinants of plasma total homocysteine concentration in the Fra-mingham Offspring cohort. Am J Clin Nutr 2001;73:613–21.
13. Ward M, McNulty H, McPartlin J, Strain JJ, Weir DG, Scott JM. Effectof supplemental methionine on plasma homocysteine concentrations inhealthy men: a preliminary study. Int J Vitam Nutr Res 2001;71:82–6.
14. Andersson A, Brattstrom L, Israelsson B, Isaksson A, Hultberg B. The
effect of excess daily methionine intake on plasma homocysteine after amethionine loading test in humans. Clin Chim Acta 1990;192:69–76.
15. Haulrik N, Toubro S, Dyerberg J, Stender S, Skov AR, Astrup A. Effectof protein and methionine intakes on plasma homocysteine concentra-tions: a 6-mo randomized controlled trial in overweight subjects. Am JClin Nutr 2002;76:1202–6.
16. Finkelstein JD, Martin JJ. Methionine metabolism in mammals. Adap-tation to methionine excess. J Biol Chem 1986;261:1582–7.
17. Graham IH, Daly LE, Refsum HM, et al. Plasma homocysteine as a riskfactor for vascular disease: the European Concerted Action Project.JAMA 1997;277:1775–81.
18. Chambers JC, McGregor A, Jean MJ, Obeid OA, Kooner JS. Demon-stration of rapid onset vascular endothelial dysfunction after hyperho-mocysteinemia: an effect reversible with vitamin C therapy. Circulation1999;99:1156–60.
19. Schofield WN. Predicting basal metabolic rate, new standards and re-view of previous work. Hum Nutr Clin Nutr 1985;39(suppl):5–41.
20. Baecke JAH, Burema J, Frijters JER. A short questionnaire for themeasurement of habitual physical activity in epidemiological studies.Am J Clin Nutr 1982;36:936–42.
21. Results of the 3rd Dutch National Food Consumption Survey, 1998. TheHague, Netherlands: Netherlands Nutrition Centre, 1998 (in Dutch).
22. Ubbink JB, Vermaak WJH, Bissbort S. Rapid HPLC assay for totalhomocysteine levels in human serum. J Chromatogr 1991;565:441–6.
23. Ueland PM, Refsum H, Stabler SP, Malinow MR, Andersson A, AllenRH. Total homocysteine in plasma or serum: methods and clinical ap-plications. Clin Chem 1993;39:1764–79.
24. Schrijver J, Speek AJ, Schreurs WH. Semi-automated fluorometric de-termination of pyridoxal-5'-phosphate (vitamin B6) in whole blood byhigh-performance liquid chromatography (HPLC). Int J Vitam Nutr Res1981;51:216–22.
25. Cockcroft DW, Gault MH. Prediction of creatinine clearance from se-rum creatinine. Nephron 1976;16:31–41.
26. Refsum H, Guttormsen AB, Fiskerstrand T, Ueland PM. Hyperhomo-cysteinemia in terms of steady-state kinetics. Eur J Pediatr 1998;157(suppl):S45–9.
27. Dixon JB, Dixon ME, O’Brien PE. Elevated homocysteine levels withweight loss after Lap-Band surgery: higher folate and vitamin B12 levelsrequired to maintain homocysteine level. Int J Obes Relat Metab Disord2001;25:219–27.
28. Sheu WH, Wu HS, Wang CW, Wan CJ, Lee WJ. Elevated plasmahomocysteine concentrations six months after gastroplasty in morbidlyobese subjects. Intern Med 2001;40:548–8.
29. McCarty MF. Insulin secretion as a potential determinant of homocys-teine levels. Med Hypotheses 2000;55:454–5.
30. Lithell H, Karlstrom B, Selinus I, et al. Is muscle lipoprotein lipaseinactivated by ordinary amounts of dietary carbohydrates? Hum NutrClin Nutr 1985;39C:289–95.
31. Mensink RP, Zock PL, Kester AD, Katan MB. Effects of dietary fattyacids and carbohydrates on the ratio of serum total to HDL cholesteroland on serum lipids and apolipoproteins: a meta-analysis of 60 controlledtrials. Am J Clin Nutr 2003;77:1146–55.
32. Mensink RP, Katan MB. Effect of monounsaturated fatty acids versuscomplex carbohydrates on high-density lipoproteins in healthy men andwomen. Lancet 1987;1:122–5.
33. Institute of Medicine of the National Academies of Science. Panel onMacronutrients, Panel on the Definition of Dietary Fiber, Subcommitteeon Interpretation and Uses of Dietary Reference Intakes, and the Stand-ing Committee on the Scientific Evaluation of Dietary Reference In-takes. Dietary reference intakes for energy, carbohydrate, fiber, fat, fattyacids, cholesterol, protein, and amino acids. Washington, DC: NationalAcademies Press, 2002.
34. Baker F, Picton D, Blackwood S, et al. Blinded comparison of folic acidand placebo in patients with ischemic heart disease: an outcome trial.Circulation 2002;106:3642 (abstr).
35. Toole JF, Malinow MR, Chambless LE, et al. Lowering homocysteine inpatients with ischemic stroke to prevent recurrent stroke, myocardialinfarction, and death. The Vitamin Intervention for Stroke Prevention(VISP) randomized controlled trial. JAMA 2004;291:565–75.
36. Clarke R, Armitage J. Vitamin supplements and cardiovascular risk:review of the randomized trials of homocysteine-lowering vitamin sup-plements. Semin Thromb Haemost 2000;26:341–8.
558 VERHOEF ET AL
Insulin-sensitizing effects of dietary resistant starch and effects onskeletal muscle and adipose tissue metabolism1–3
M Denise Robertson, Alex S Bickerton, A Louise Dennis, Hubert Vidal, and Keith N Frayn
ABSTRACTBackground: Resistant starch may modulate insulin sensitivity,although the precise mechanism of this action is unknown.Objective: We studied the effects of resistant starch on insulinsensitivity and tissue metabolism.Design: We used a 4-wk supplementation period with 30 g resistantstarch/d, compared with placebo, in 10 healthy subjects and assessedthe results by using arteriovenous difference methods.Results: When assessed by euglycemic-hyperinsulinemic clamp,insulin sensitivity was higher after resistant starch supplementationthan after placebo treatment (9.7 and 8.5 � 10�2 mg glucose · kg�1 ·min�1 · (mU insulin/L)�1, respectively; P � 0.03); insulin sensitiv-ity during the meal tolerance test (MTT) was 33% higher (P � 0.05).Forearm muscle glucose clearance during the MTT was also higherafter resistant starch supplementation (P � 0.03) despite lower in-sulin concentrations (P � 0.02); glucose clearance adjusted for in-sulin was 44% higher. Subcutaneous abdominal adipose tissue non-esterified fatty acid (NEFA; P � 0.02) and glycerol (P � 0.05)release were lower with resistant starch supplementation, althoughsystemic NEFA concentrations were not significantly altered. Short-chain fatty acid concentrations (acetate and propionate) were higherduring the MTT (P � 0.05 and 0.01, respectively), as was acetateuptake by adipose tissue (P � 0.03). Fasting plasma ghrelin con-centrations were higher with resistant starch supplementation (2769compared with 2062 pg/mL; P � 0.03), although postprandial sup-pression (40–44%) did not differ significantly. Measurements ofgene expression in adipose tissue and muscle were uninformative,which suggests effects at a metabolic level. The resistant starchsupplement was well tolerated.Conclusion: These results suggest that dietary supplementationwith resistant starch has the potential to improve insulin sensitivity.Further studies in insulin-resistant persons are needed. Am JClin Nutr 2005;82:559–67.
KEY WORDS Ghrelin, lipolysis, short-chain fatty acids, skel-etal muscle, insulin sensitivity
INTRODUCTION
Type 2 diabetes affects �8% of adults in the United States (1),and this figure is likely to increase with the growing incidence ofchildhood obesity. Although treatments exist to alleviate some ofthe complications of diabetes, the preferable long-term strategyis still to increase tissue insulin sensitivity and thus prevent thedevelopment of overt type 2 diabetes. Recent large-scale studiesclearly showed that lifestyle intervention (diet and exercise) can
be highly effective in delaying the onset of type 2 diabetes (2),even when compared with pharmacologic agents (3). The resultsof controlled intervention studies suggest that certain nutritionalfactors are consistently linked to a reduction in insulin sensitiv-ity: low dietary fiber intake, high trans fatty acid intake; and highsaturated fat intake (4). The potential metabolic effects of dietaryfatty acids on insulin sensitivity have been extensively studiedboth from observational (5) and mechanistic viewpoints (6). Theeffects of dietary fiber, however, remain underdocumented.
Dietary fibers can be classified chemically as either soluble orinsoluble. Soluble fibers have viscous properties within the gas-trointestinal tract and cause a well-documented reduction in therate of glucose absorption (7) and thus reduce the glycemic ex-cursion after carbohydrate intake. Insoluble fibers, such as resis-tant starch (RS), are nonviscous and thus have no effect onglucose absorption, yet they have been shown in short-term hu-man studies (8) to increase insulin sensitivity. Despite epidemi-ologic evidence linking insoluble fiber intake to a reduced inci-dence of type 2 diabetes (9–11), the metabolic link betweenchronic RS ingestion and insulin sensitivity has yet to be provenin humans.
One possible mechanism by which dietary RS intake mightmodulate insulin sensitivity is through alterations in fatty acidflux. Fatty acid metabolism is a key feature in determining tissueinsulin sensitivity. Abnormalities in fatty acid storage and lipol-ysis in insulin-sensitive tissues with increased flux from adiposeto nonadipose tissues such as skeletal muscle may be a criticalevent in the development of insulin resistance (12). The directeffect of RS consumption on fatty acid flux is unknown beyondstudies that have measured fasting triacylglycerol and choles-terol concentrations after RS intervention (7). In isolation, short-chain fatty acids (SCFAs), which are produced during colonicfermentation of RS, inhibit adipose tissue lipolysis (13), but an invivo effect of dietary RS intake has yet to be shown.
1 From the Oxford Centre for Diabetes, Endocrinology and Metabolism,University of Oxford, Oxford, United Kingdom (MDR, ASB, ALD, andKNF) and INSERM U-449/INRA-1235, Lyon, France (HV).
2 Supported by the Biotechnology and Biological Sciences ResearchCouncil (BBSRC), United Kingdom. All test starches were supplied by theNational Starch and Chemical Company.
3 Address reprint requests to KN Frayn, Oxford Centre for Diabetes, En-docrinology and Metabolism, Churchill Hospital, Oxford, OX3 7LJ, UnitedKingdom. E-mail: [email protected].
Received February 28, 2005.Accepted for publication May 19, 2005.
559Am J Clin Nutr 2005;82:559–67. Printed in USA. © 2005 American Society for Clinical Nutrition
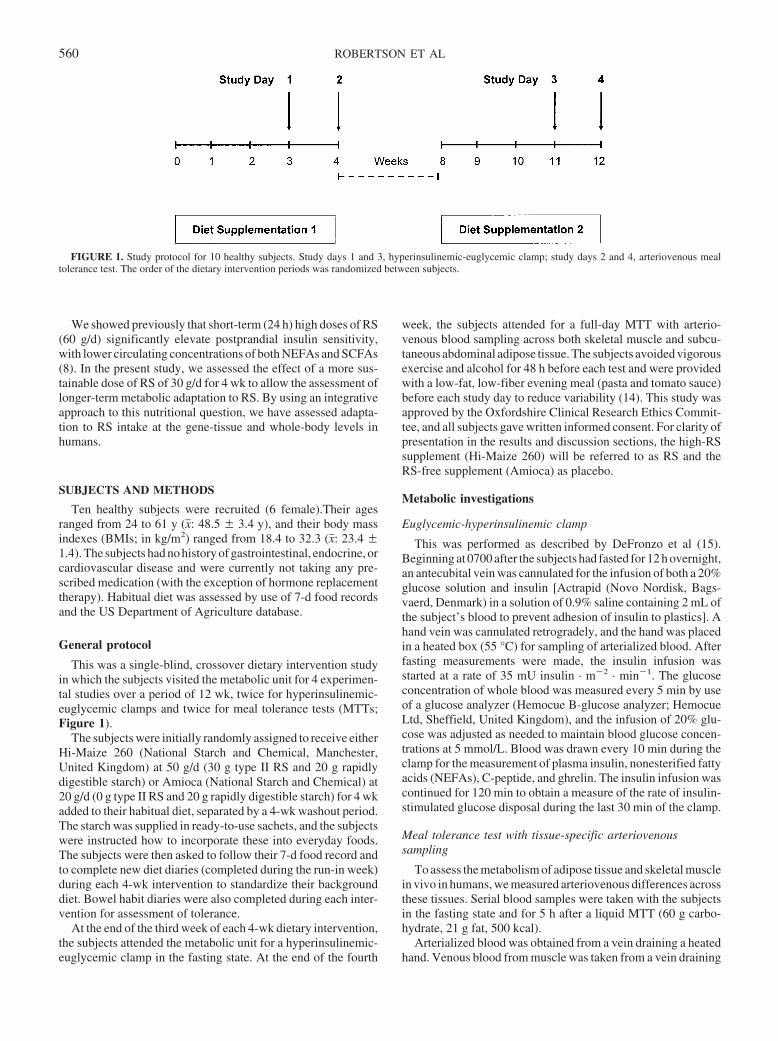
We showed previously that short-term (24 h) high doses of RS(60 g/d) significantly elevate postprandial insulin sensitivity,with lower circulating concentrations of both NEFAs and SCFAs(8). In the present study, we assessed the effect of a more sus-tainable dose of RS of 30 g/d for 4 wk to allow the assessment oflonger-term metabolic adaptation to RS. By using an integrativeapproach to this nutritional question, we have assessed adapta-tion to RS intake at the gene-tissue and whole-body levels inhumans.
SUBJECTS AND METHODS
Ten healthy subjects were recruited (6 female).Their agesranged from 24 to 61 y (x�: 48.5 � 3.4 y), and their body massindexes (BMIs; in kg/m2) ranged from 18.4 to 32.3 (x�: 23.4 �1.4). The subjects had no history of gastrointestinal, endocrine, orcardiovascular disease and were currently not taking any pre-scribed medication (with the exception of hormone replacementtherapy). Habitual diet was assessed by use of 7-d food recordsand the US Department of Agriculture database.
General protocol
This was a single-blind, crossover dietary intervention studyin which the subjects visited the metabolic unit for 4 experimen-tal studies over a period of 12 wk, twice for hyperinsulinemic-euglycemic clamps and twice for meal tolerance tests (MTTs;Figure 1).
The subjects were initially randomly assigned to receive eitherHi-Maize 260 (National Starch and Chemical, Manchester,United Kingdom) at 50 g/d (30 g type II RS and 20 g rapidlydigestible starch) or Amioca (National Starch and Chemical) at20 g/d (0 g type II RS and 20 g rapidly digestible starch) for 4 wkadded to their habitual diet, separated by a 4-wk washout period.The starch was supplied in ready-to-use sachets, and the subjectswere instructed how to incorporate these into everyday foods.The subjects were then asked to follow their 7-d food record andto complete new diet diaries (completed during the run-in week)during each 4-wk intervention to standardize their backgrounddiet. Bowel habit diaries were also completed during each inter-vention for assessment of tolerance.
At the end of the third week of each 4-wk dietary intervention,the subjects attended the metabolic unit for a hyperinsulinemic-euglycemic clamp in the fasting state. At the end of the fourth
week, the subjects attended for a full-day MTT with arterio-venous blood sampling across both skeletal muscle and subcu-taneous abdominal adipose tissue. The subjects avoided vigorousexercise and alcohol for 48 h before each test and were providedwith a low-fat, low-fiber evening meal (pasta and tomato sauce)before each study day to reduce variability (14). This study wasapproved by the Oxfordshire Clinical Research Ethics Commit-tee, and all subjects gave written informed consent. For clarity ofpresentation in the results and discussion sections, the high-RSsupplement (Hi-Maize 260) will be referred to as RS and theRS-free supplement (Amioca) as placebo.
Metabolic investigations
Euglycemic-hyperinsulinemic clamp
This was performed as described by DeFronzo et al (15).Beginning at 0700 after the subjects had fasted for 12 h overnight,an antecubital vein was cannulated for the infusion of both a 20%glucose solution and insulin [Actrapid (Novo Nordisk, Bags-vaerd, Denmark) in a solution of 0.9% saline containing 2 mL ofthe subject’s blood to prevent adhesion of insulin to plastics]. Ahand vein was cannulated retrogradely, and the hand was placedin a heated box (55 °C) for sampling of arterialized blood. Afterfasting measurements were made, the insulin infusion wasstarted at a rate of 35 mU insulin · m�2 · min�1. The glucoseconcentration of whole blood was measured every 5 min by useof a glucose analyzer (Hemocue B-glucose analyzer; HemocueLtd, Sheffield, United Kingdom), and the infusion of 20% glu-cose was adjusted as needed to maintain blood glucose concen-trations at 5 mmol/L. Blood was drawn every 10 min during theclamp for the measurement of plasma insulin, nonesterified fattyacids (NEFAs), C-peptide, and ghrelin. The insulin infusion wascontinued for 120 min to obtain a measure of the rate of insulin-stimulated glucose disposal during the last 30 min of the clamp.
Meal tolerance test with tissue-specific arteriovenoussampling
To assess the metabolism of adipose tissue and skeletal musclein vivo in humans, we measured arteriovenous differences acrossthese tissues. Serial blood samples were taken with the subjectsin the fasting state and for 5 h after a liquid MTT (60 g carbo-hydrate, 21 g fat, 500 kcal).
Arterialized blood was obtained from a vein draining a heatedhand. Venous blood from muscle was taken from a vein draining
FIGURE 1. Study protocol for 10 healthy subjects. Study days 1 and 3, hyperinsulinemic-euglycemic clamp; study days 2 and 4, arteriovenous mealtolerance test. The order of the dietary intervention periods was randomized between subjects.
560 ROBERTSON ET AL
the deep tissues of the contralateral forearm. To prevent contam-ination of the blood from the forearm vein with blood from thehand, a wrist cuff was inflated to 200 mm Hg for 3 min before thesamples were taken. Venous blood from adipose tissue was ob-tained from the superficial epigastric vein (16). This vein drainssubcutaneous abdominal adipose tissue with negligible contri-bution from other tissues (17). Oxygen saturation and ultrasoundwere used to assess correct positioning of the cannulae. Simul-taneous sampling from 3 sites began at 0700 after the subjects hadfasted for 12 h overnight. Two sets of baseline samples weretaken 30 min apart. Subjects then ingested the test meal as de-scribed previously (8), and further blood samples were taken for5 h after the meal.
Subcutaneous abdominal adipose tissue blood flow was mea-sured by 133Xe washout (18). Forearm muscle blood flow wasassessed by occlusion strain-gauge plethysmography (19).
Skeletal muscle and adipose tissue biopsies were performedunder local anesthesia (1% lignocaine) 5.5 h after the meal.Subcutaneous abdominal adipose tissue was biopsied with a 12-gauge needle, and muscle biopsy samples were taken from thevastus lateralis muscle by using a percutaneous needle technique.Samples were snap frozen in liquid nitrogen and stored at �70 °Cfor later RNA quantification. Total RNA was prepared from thefrozen tissue according to an established procedure (20), withtotal RNA solutions stored at �80 °C.
Biochemistry
Whole blood for metabolite and insulin measurement wascollected into heparin-containing syringes (Sarstedt, Leicester,United Kingdom). Plasma glucose, triacylglycerol (Instrumen-tation Laboratory, Warrington, United Kingdom), and NEFAconcentrations (Wako Chemicals, Neuss, Germany) were mea-sured enzymatically with an Instrumentation Laboratory Mon-arch automated analyzer. Whole blood for 3-hydroxybutyrateand glycerol measurement was deproteinized with 7% (wt:vol)perchloric acid, and concentrations were measured enzymati-cally. Metabolites from the placebo and the RS study arms wereanalyzed together, and the intra-assay variation was �2.5%.Concentrations of insulin, C-peptide, and leptin were measuredby radioimmunoassay with commercially available kits (Linco,St Louis, MO). Blood for total ghrelin analysis was collected intopotassium-EDTA containing 200 Kallikrein inhibiting unitsaprotinin/mL (Bayer, Newbury, United Kingdom). For the gh-relin radioimmunoassay (Linco), antibodies were raised againstthe C-terminal region (acylated and des-acylated ghrelin) andshowed no detectable cross-reactivity with motilin-related pep-tide. The sensitivity of this assay was 10 pg/mL. Glucagon-likepeptide 1 (GLP-1) was assayed as described previously (21). TheGLP-1 radioimmunoassay detected changes of 7.5 pmol/L, withan intraassay CV of 6.1%. The GLP-1 antibody was specific forthe N-terminal amidated GLP-1.
SCFAs were analyzed by gas-liquid chromatography.Heparin-treated plasma was deproteinized with 16% metaphos-phoric acid and denatured for 30 min at 60 °C before splitlessinjection of 1 �L of the supernatant portion onto an FFAP column(Agilent Technologies, Palo Alto, CA) (22). Measurements weremade with a flame ionization detector, and isovaleric acid wasused as the internal standard.
Quantitation of messenger RNAs
Concentrations of the messenger RNAs (mRNAs) corre-sponding to the genes of interest were measured by reverse tran-scription (RT) followed by real-time polymerase chain reaction(PCR) with a light cycler (Roche Diagnostics, Meylan, France).First-strand complementary DNAs (cDNAs) were first synthe-sized from 500 ng of total RNA in the presence of 100 units ofSuperscript II (Invitrogen, Eragny, France) using both randomhexamers and oligo (dT) primers (Promega, Charbonnières,France). The real-time PCR was performed in a final volume of20 �L containing 5 �L of a 60-fold dilution of the RT reactionmedium, 15 �L of reaction buffer from the FastStart DNA masterSYBR Green kit (Roche Diagnostics), and 10.5 pmol of thespecific forward and reverse primers (Eurobio, Ler Ulis, France).Primers were selected to amplify small fragments (80 to 200 bp)and to hybridize in different exons of the target sequences. Forquantification, a standard curve was systematically generatedwith 6 different amounts (150 to 30 000 molecules/tube) of pu-rified target cDNA cloned in the pGEM plasmid (Promega).Each assay was performed in duplicate. The results are presentedin absolute concentrations, in amol/�g of total RNA. CyclophilinmRNA levels were measured as the internal standard.
Calculations and statistical analysis
Insulin sensitivity and �-cell function were assessed by ho-meostatic model assessment (HOMA %S and HOMA %B, re-spectively; 23), hyperinsulinemic-euglycemic clamp [equal tothe glucose infusion rate during steady state (M) divided by theprevailing plasma insulin concentration (I)], and in the postpran-dial state during the MTT with the use of a minimal modelapproach (24). This approach uses cumulative integrated areaunder the curve (AUC) measures of both insulin and glucoseconcentrations assuming that the total glucose disposal from thesystem after 120 min (or when basal values have been reached)equals the glucose entering the peripheral circulation, allowingfor first-pass extraction by the liver. The incremental ratio ofC-peptide to insulin over the first 2 h of the study, which is anindex of hepatic insulin extraction, was calculated with the trap-ezoid method.
During the MTT, adipose tissue blood flow was calculated asdescribed previously (18). Arteriovenous and venoarterial dif-ferences in metabolite concentrations were calculated. Absoluteflux was calculated as the product of the arteriovenous or veno-arterial difference and tissue blood or plasma flow as appropriate.The rate of action of lipoprotein lipase in adipose tissue in vivowas calculated from triacylglycerol extraction. The rate of actionof hormone-sensitive lipase in adipose tissue in vivo was calcu-lated from the total adipose tissue glycerol release after subtrac-tion of the lipoprotein lipase rate of action (16). Total fatty aciduptake into muscle was calculated from the rate of triacylglyceroland NEFA removal across the tissue (16).
All statistical analyses were carried out with SPSS version12.0.1 for WINDOWS (SPSS Inc, Chicago, IL). Time-coursedata were analyzed by repeated-measures analysis of variancewhen normally distributed. Postprandial data are also presentedin the tables, text, and figures in summary form, ie, fasting andAUC [AUC values were calculated by using the trapezoid rule(25)]. Summary data were analyzed by paired Student’s t tests.Partial correlations (controlled for subject) were also performedbetween metabolites by using Pearson’s correlation. Values of
RESISTANT STARCH AND INSULIN SENSITIVITY 561
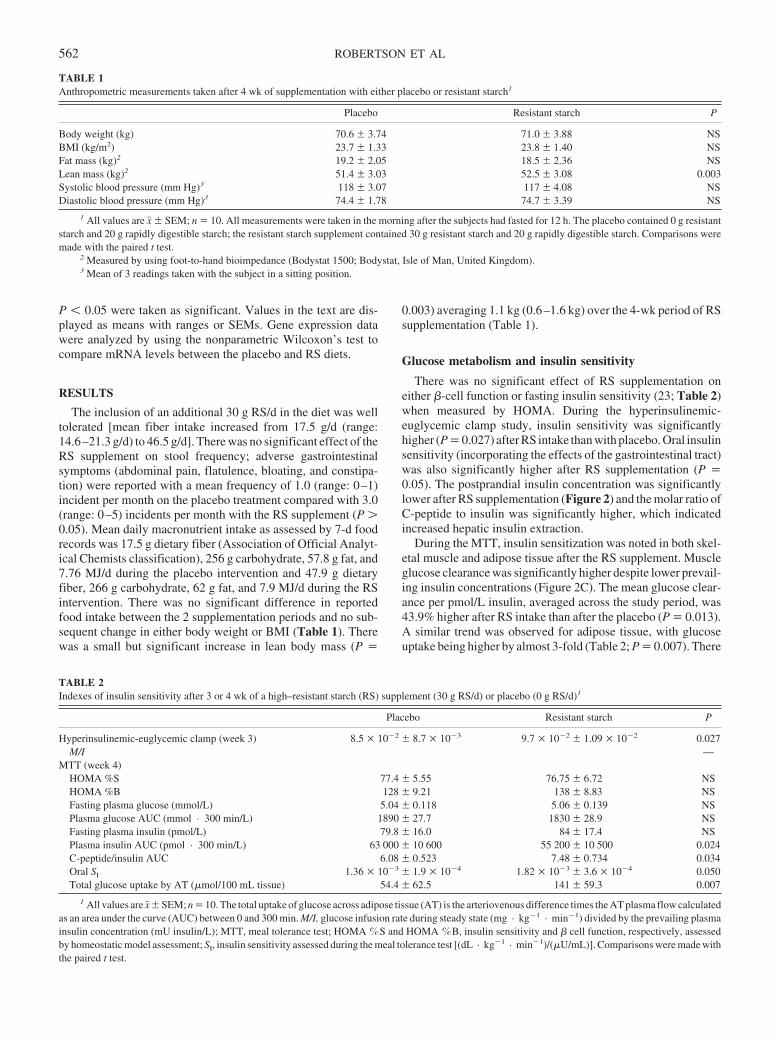
P � 0.05 were taken as significant. Values in the text are dis-played as means with ranges or SEMs. Gene expression datawere analyzed by using the nonparametric Wilcoxon’s test tocompare mRNA levels between the placebo and RS diets.
RESULTS
The inclusion of an additional 30 g RS/d in the diet was welltolerated [mean fiber intake increased from 17.5 g/d (range:14.6–21.3 g/d) to 46.5 g/d]. There was no significant effect of theRS supplement on stool frequency; adverse gastrointestinalsymptoms (abdominal pain, flatulence, bloating, and constipa-tion) were reported with a mean frequency of 1.0 (range: 0–1)incident per month on the placebo treatment compared with 3.0(range: 0–5) incidents per month with the RS supplement (P �0.05). Mean daily macronutrient intake as assessed by 7-d foodrecords was 17.5 g dietary fiber (Association of Official Analyt-ical Chemists classification), 256 g carbohydrate, 57.8 g fat, and7.76 MJ/d during the placebo intervention and 47.9 g dietaryfiber, 266 g carbohydrate, 62 g fat, and 7.9 MJ/d during the RSintervention. There was no significant difference in reportedfood intake between the 2 supplementation periods and no sub-sequent change in either body weight or BMI (Table 1). Therewas a small but significant increase in lean body mass (P �
0.003) averaging 1.1 kg (0.6–1.6 kg) over the 4-wk period of RSsupplementation (Table 1).
Glucose metabolism and insulin sensitivity
There was no significant effect of RS supplementation oneither �-cell function or fasting insulin sensitivity (23; Table 2)when measured by HOMA. During the hyperinsulinemic-euglycemic clamp study, insulin sensitivity was significantlyhigher (P � 0.027) after RS intake than with placebo. Oral insulinsensitivity (incorporating the effects of the gastrointestinal tract)was also significantly higher after RS supplementation (P �0.05). The postprandial insulin concentration was significantlylower after RS supplementation (Figure 2) and the molar ratio ofC-peptide to insulin was significantly higher, which indicatedincreased hepatic insulin extraction.
During the MTT, insulin sensitization was noted in both skel-etal muscle and adipose tissue after the RS supplement. Muscleglucose clearance was significantly higher despite lower prevail-ing insulin concentrations (Figure 2C). The mean glucose clear-ance per pmol/L insulin, averaged across the study period, was43.9% higher after RS intake than after the placebo (P � 0.013).A similar trend was observed for adipose tissue, with glucoseuptake being higher by almost 3-fold (Table 2; P � 0.007). There
TABLE 1Anthropometric measurements taken after 4 wk of supplementation with either placebo or resistant starch1
Placebo Resistant starch P
Body weight (kg) 70.6 � 3.74 71.0 � 3.88 NSBMI (kg/m2) 23.7 � 1.33 23.8 � 1.40 NSFat mass (kg)2 19.2 � 2.05 18.5 � 2.36 NSLean mass (kg)2 51.4 � 3.03 52.5 � 3.08 0.003Systolic blood pressure (mm Hg)3 118 � 3.07 117 � 4.08 NSDiastolic blood pressure (mm Hg)3 74.4 � 1.78 74.7 � 3.39 NS
1 All values are x� � SEM; n � 10. All measurements were taken in the morning after the subjects had fasted for 12 h. The placebo contained 0 g resistantstarch and 20 g rapidly digestible starch; the resistant starch supplement contained 30 g resistant starch and 20 g rapidly digestible starch. Comparisons weremade with the paired t test.
2 Measured by using foot-to-hand bioimpedance (Bodystat 1500; Bodystat, Isle of Man, United Kingdom).3 Mean of 3 readings taken with the subject in a sitting position.
TABLE 2Indexes of insulin sensitivity after 3 or 4 wk of a high–resistant starch (RS) supplement (30 g RS/d) or placebo (0 g RS/d)1
Placebo Resistant starch P
Hyperinsulinemic-euglycemic clamp (week 3) 8.5 � 10�2 � 8.7 � 10�3 9.7 � 10�2 � 1.09 � 10�2 0.027M/I —
MTT (week 4)HOMA %S 77.4 � 5.55 76.75 � 6.72 NSHOMA %B 128 � 9.21 138 � 8.83 NSFasting plasma glucose (mmol/L) 5.04 � 0.118 5.06 � 0.139 NSPlasma glucose AUC (mmol · 300 min/L) 1890 � 27.7 1830 � 28.9 NSFasting plasma insulin (pmol/L) 79.8 � 16.0 84 � 17.4 NSPlasma insulin AUC (pmol · 300 min/L) 63 000 � 10 600 55 200 � 10 500 0.024C-peptide/insulin AUC 6.08 � 0.523 7.48 � 0.734 0.034Oral SI 1.36 � 10�3 � 1.9 � 10�4 1.82 � 10�3 � 3.6 � 10�4 0.050Total glucose uptake by AT (�mol/100 mL tissue) 54.4 � 62.5 141 � 59.3 0.007
1 All values are x� � SEM; n � 10. The total uptake of glucose across adipose tissue (AT) is the arteriovenous difference times the AT plasma flow calculatedas an area under the curve (AUC) between 0 and 300 min. M/I, glucose infusion rate during steady state (mg · kg�1 · min�1) divided by the prevailing plasmainsulin concentration (mU insulin/L); MTT, meal tolerance test; HOMA �S and HOMA �B, insulin sensitivity and � cell function, respectively, assessedby homeostatic model assessment; SI, insulin sensitivity assessed during the meal tolerance test [(dL · kg�1 · min�1)/(�U/mL)]. Comparisons were made withthe paired t test.
562 ROBERTSON ET AL
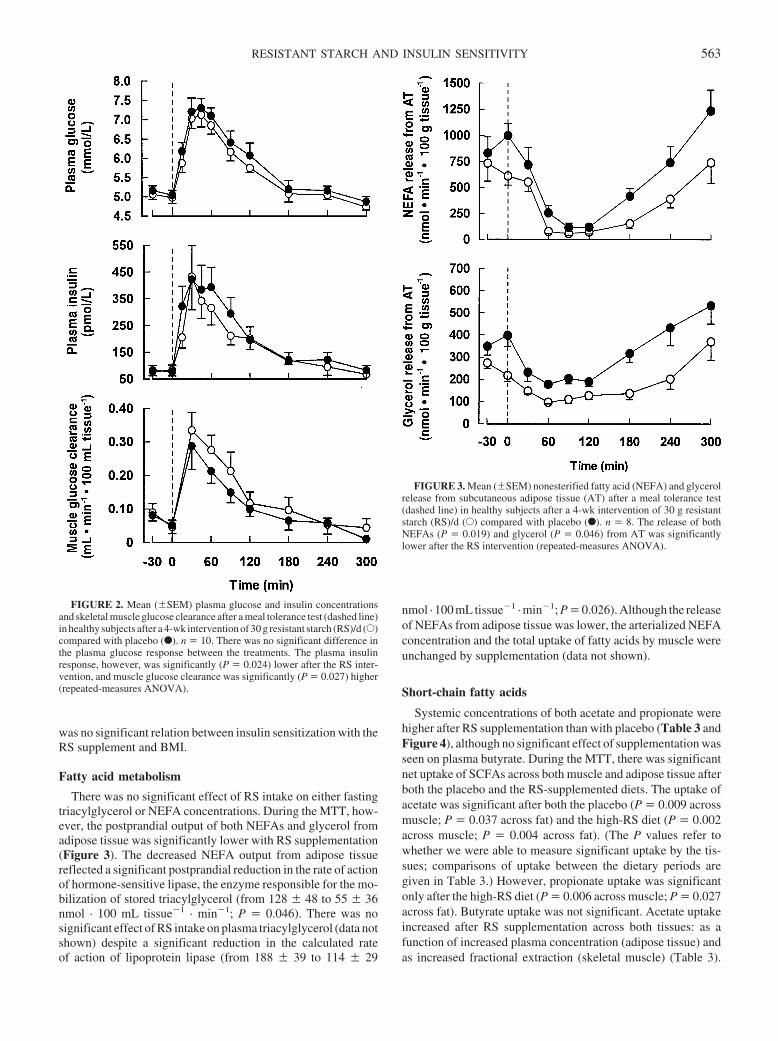
was no significant relation between insulin sensitization with theRS supplement and BMI.
Fatty acid metabolism
There was no significant effect of RS intake on either fastingtriacylglycerol or NEFA concentrations. During the MTT, how-ever, the postprandial output of both NEFAs and glycerol fromadipose tissue was significantly lower with RS supplementation(Figure 3). The decreased NEFA output from adipose tissuereflected a significant postprandial reduction in the rate of actionof hormone-sensitive lipase, the enzyme responsible for the mo-bilization of stored triacylglycerol (from 128 � 48 to 55 � 36nmol · 100 mL tissue�1 · min�1; P � 0.046). There was nosignificant effect of RS intake on plasma triacylglycerol (data notshown) despite a significant reduction in the calculated rateof action of lipoprotein lipase (from 188 � 39 to 114 � 29
nmol · 100 mL tissue�1 · min�1; P � 0.026). Although the releaseof NEFAs from adipose tissue was lower, the arterialized NEFAconcentration and the total uptake of fatty acids by muscle wereunchanged by supplementation (data not shown).
Short-chain fatty acids
Systemic concentrations of both acetate and propionate werehigher after RS supplementation than with placebo (Table 3 andFigure 4), although no significant effect of supplementation wasseen on plasma butyrate. During the MTT, there was significantnet uptake of SCFAs across both muscle and adipose tissue afterboth the placebo and the RS-supplemented diets. The uptake ofacetate was significant after both the placebo (P � 0.009 acrossmuscle; P � 0.037 across fat) and the high-RS diet (P � 0.002across muscle; P � 0.004 across fat). (The P values refer towhether we were able to measure significant uptake by the tis-sues; comparisons of uptake between the dietary periods aregiven in Table 3.) However, propionate uptake was significantonly after the high-RS diet (P � 0.006 across muscle; P � 0.027across fat). Butyrate uptake was not significant. Acetate uptakeincreased after RS supplementation across both tissues: as afunction of increased plasma concentration (adipose tissue) andas increased fractional extraction (skeletal muscle) (Table 3).
FIGURE 2. Mean (�SEM) plasma glucose and insulin concentrationsand skeletal muscle glucose clearance after a meal tolerance test (dashed line)in healthy subjects after a 4-wk intervention of 30 g resistant starch (RS)/d (E)compared with placebo (F). n � 10. There was no significant difference inthe plasma glucose response between the treatments. The plasma insulinresponse, however, was significantly (P � 0.024) lower after the RS inter-vention, and muscle glucose clearance was significantly (P � 0.027) higher(repeated-measures ANOVA).
FIGURE 3. Mean (�SEM) nonesterified fatty acid (NEFA) and glycerolrelease from subcutaneous adipose tissue (AT) after a meal tolerance test(dashed line) in healthy subjects after a 4-wk intervention of 30 g resistantstarch (RS)/d (E) compared with placebo (F). n � 8. The release of bothNEFAs (P � 0.019) and glycerol (P � 0.046) from AT was significantlylower after the RS intervention (repeated-measures ANOVA).
RESISTANT STARCH AND INSULIN SENSITIVITY 563
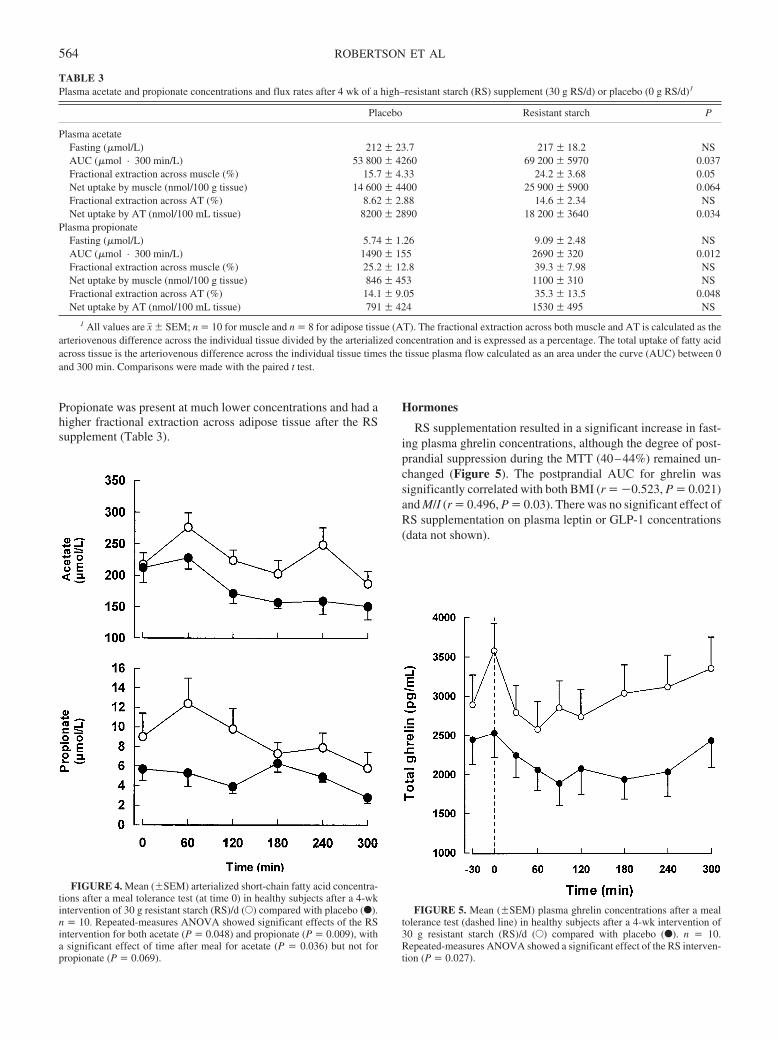
Propionate was present at much lower concentrations and had ahigher fractional extraction across adipose tissue after the RSsupplement (Table 3).
Hormones
RS supplementation resulted in a significant increase in fast-ing plasma ghrelin concentrations, although the degree of post-prandial suppression during the MTT (40–44%) remained un-changed (Figure 5). The postprandial AUC for ghrelin wassignificantly correlated with both BMI (r � �0.523, P � 0.021)and M/I (r � 0.496, P � 0.03). There was no significant effect ofRS supplementation on plasma leptin or GLP-1 concentrations(data not shown).
TABLE 3Plasma acetate and propionate concentrations and flux rates after 4 wk of a high–resistant starch (RS) supplement (30 g RS/d) or placebo (0 g RS/d)1
Placebo Resistant starch P
Plasma acetateFasting (�mol/L) 212 � 23.7 217 � 18.2 NSAUC (�mol · 300 min/L) 53 800 � 4260 69 200 � 5970 0.037Fractional extraction across muscle (%) 15.7 � 4.33 24.2 � 3.68 0.05Net uptake by muscle (nmol/100 g tissue) 14 600 � 4400 25 900 � 5900 0.064Fractional extraction across AT (%) 8.62 � 2.88 14.6 � 2.34 NSNet uptake by AT (nmol/100 mL tissue) 8200 � 2890 18 200 � 3640 0.034
Plasma propionateFasting (�mol/L) 5.74 � 1.26 9.09 � 2.48 NSAUC (�mol · 300 min/L) 1490 � 155 2690 � 320 0.012Fractional extraction across muscle (%) 25.2 � 12.8 39.3 � 7.98 NSNet uptake by muscle (nmol/100 g tissue) 846 � 453 1100 � 310 NSFractional extraction across AT (%) 14.1 � 9.05 35.3 � 13.5 0.048Net uptake by AT (nmol/100 mL tissue) 791 � 424 1530 � 495 NS
1 All values are x� � SEM; n � 10 for muscle and n � 8 for adipose tissue (AT). The fractional extraction across both muscle and AT is calculated as thearteriovenous difference across the individual tissue divided by the arterialized concentration and is expressed as a percentage. The total uptake of fatty acidacross tissue is the arteriovenous difference across the individual tissue times the tissue plasma flow calculated as an area under the curve (AUC) between 0and 300 min. Comparisons were made with the paired t test.
FIGURE 4. Mean (�SEM) arterialized short-chain fatty acid concentra-tions after a meal tolerance test (at time 0) in healthy subjects after a 4-wkintervention of 30 g resistant starch (RS)/d (E) compared with placebo (F).n � 10. Repeated-measures ANOVA showed significant effects of the RSintervention for both acetate (P � 0.048) and propionate (P � 0.009), witha significant effect of time after meal for acetate (P � 0.036) but not forpropionate (P � 0.069).
FIGURE 5. Mean (�SEM) plasma ghrelin concentrations after a mealtolerance test (dashed line) in healthy subjects after a 4-wk intervention of30 g resistant starch (RS)/d (E) compared with placebo (F). n � 10.Repeated-measures ANOVA showed a significant effect of the RS interven-tion (P � 0.027).
564 ROBERTSON ET AL
Gene expression
In adipose tissue, there was no significant change in the ex-pression of the following genes after RS supplementation: hex-okinase II, CD36, lipoprotein lipase, peroxisome proliferatoractivated receptor �, phosphatidyl-inositol-3 kinase, glucosetransporter 4, or leptin. There was, however, significantly greaterexpression of hormone-sensitive lipase (35.7 � 5.5 to 45.8 � 7.7amol/�g total RNA; P � 0.036) and lower expression of insulinreceptor substrate 1 (11.2 � 1.5 to 8.8 � 1.4 amol/�g total RNA;P � 0.016) after RS supplementation than with placebo. In skel-etal muscle samples, however, there was no significant effect ofdietary period on the expression of any of the genes measured(hexokinase II, CD36, lipoprotein lipase, insulin receptor sub-strate 1, phosphatidyl-inositol-3 kinase, or glucose transporter 4;data not shown).
DISCUSSION
We used an integrative approach to study the metabolic effectsof RS intake and obtained novel data concerning the function ofindividual tissues (adipose tissue and skeletal muscle) in vivo inhumans after a period of dietary supplementation. In an earliershort-term study (60 g RS for 24 h) (8), we found RS intake toincrease insulin sensitivity at the whole-body level and to in-crease hepatic insulin clearance, a finding that was corroboratedin the present study when RS was included in the diet at morephysiologic levels (30 g RS/d for 4 wk). We have now showninsulin sensitization at the whole-body level assessed by both thehyperinsulinemic-euglycemic clamp and the MTT methods. Inaddition, we showed a reduction in adipose tissue lipolysis and anincrease in the insulin sensitivity of skeletal muscle glucoseclearance. These effects of RS may be due to changes in theperipheral metabolism of SCFAs or in the secretion of ghrelin.
The concept that dietary fibers induce insulin sensitization byreducing the plasma NEFA concentration (26–28) and thus thatthey serve as a signal between adipose tissue and muscle has notbeen supported by conclusive in vivo data. Through direct mea-surement of tissue metabolic flux rates, we have been able toshow the metabolic changes induced by fermentable fiber at boththe whole-body and the tissue level.
Adipose tissue lipolysis, as assessed by the calculated rate ofaction of hormone-sensitive lipase, was significantly lower afterRS supplementation than with placebo. Hormone-sensitivelipase is suppressed by insulin after meals, yet we observed lowerinsulin during the RS study, and thus the results are not consistentwith adipose tissue simply responding to concentrations of in-sulin. To suppress lipolysis, only small excursions in the plasmainsulin concentration are required, and this may explain why themaximal effects of RS supplementation were not evident until thelate postprandial period when insulin concentrations were low.Insulin-mediated skeletal muscle glucose clearance (glucoseclearance/plasma insulin concentration) was significantly higherafter RS supplementation. However, we found no direct linkbetween a reduced rate of fatty acid release from adipose tissueand the increased muscle insulin sensitivity, because the skeletalmuscle uptake of total fatty acids was unchanged. We cannot,however, exclude the possibility that changes in NEFA flux mayinfluence insulin sensitization in other organs, such as the liver(29). Adipose tissue itself is also an important site for maintain-ing glucose homeostasis, with total glucose removal increasing
by 200% after RS supplementation. The metabolic fate of thisadditional glucose is at present unclear.
A novel aspect of the present study was the direct measure-ment of SCFA uptake into both skeletal muscle and adiposetissue. After RS supplementation, the peripheral concentrationsof both acetate and propionate were increased, as was the rate ofuptake into the specific tissues. SCFAs were recently shown tobind to the G protein–coupled receptors GPR41 and GPR43,which have been isolated from both adipose tissue (30) andskeletal muscle (31). The function of these receptors is at presentill defined, but they have been proposed to trigger leptin releasefrom adipocytes. Despite significantly higher SCFA concentra-tions, no significant change in plasma leptin or leptin mRNA wasfound after RS supplementation. SCFAs have been shown toinhibit adipose tissue lipolysis in vivo (13, 32) and thus maycontribute to the observed reduction in lipolysis. However, thishas never been reported physiologically after fiber intake. Wefound no relation between NEFA release from adipose tissue andSCFA concentrations, so additional mechanisms may be in-volved. The fate of the SCFAs taken up into skeletal muscle islikely to be rapid oxidation (33). The accumulation of acetyl CoAfrom acetate may result in acetylation of the carnitine pool, thuslimiting the availability of free carnitine (34) and potentiallyreducing fatty acid transport into the mitochondria for oxidation.Increased muscle insulin sensitivity could therefore be partlyexplained by the increased muscle uptake of SCFAs.
An interesting observation was the increase in the circulatingconcentration of total ghrelin after RS supplementation. Thisresult is counterintuitive from what we know about the satiatingeffects of RS (35, 36) and the appetite-stimulating effects ofghrelin (37). Perhaps the systemic concentration of ghrelin ismore relevant in determining its peripheral actions, independentof those induced within the hypothalamus. Elevations in plasmaghrelin have been linked to increased insulin sensitivity in nu-merous studies (38–40), although debate still exists as to themechanism. It is hypothesized that the hyperinsulinemia of in-sulin resistance down-regulates ghrelin release and thus that el-evated ghrelin is merely a consequence of the low insulin con-centrations. In the present study, fasting ghrelin concentrationswere significantly elevated with no significant change in fastinginsulin concentrations, and thus it is doubtful that this mechanismis in place. Ghrelin has been shown to inhibit lipolysis, stimulatelipogenesis, and stimulate the expression of peroxisome prolif-erator activated receptor � in vitro (41), which potentially influ-ence insulin sensitivity in vivo. The lack of a change in fatty aciduptake into muscle in our study implies that any insulin-sensitizing effects of ghrelin are independent of those induced inadipose tissue. Ghrelin may have direct insulin-sensitizing ef-fects on skeletal muscle. Muscle expresses the putative ghrelinreceptor GHS-R1b (42), although a function for this receptorremains to be described. It is perhaps more likely that the skeletalmuscle ghrelin receptor is a protein independent of either GHS-R1a or 1b (43), such as the fatty acid translocase protein CD36/FAT, as has been shown in cardiac muscle (44). If elevatedplasma ghrelin concentrations are partly responsible for theinsulin-sensitizing effects of RS, then the link between fermen-tation in the colon and ghrelin production from the stomachwarrants further investigation.
Increases in systematic SCFA concentrations have beenshown to augment the expression of functional proteins withinthe intestine (45), potentially because of the ability of SCFAs to
RESISTANT STARCH AND INSULIN SENSITIVITY 565
mediate the release of glucagon-like peptide 2 (GLP-2) (46) orgastrin (47). We suggest that increased peripheral concentrationsof SCFA [not colonic SCFAs (48)], either directly or indirectlyvia GLP-2 or gastrin, are linked to ghrelin release. However,more work is needed to clarify the link between colonic fermen-tation and gastric ghrelin. In contrast with the results of animalstudies, the present RS intervention did not increase plasma con-centrations of GLP-1. In terms of systemic effects, GLP-1 is animportant incretin; however, tissue-specific studies in humanshave clearly shown that GLP-1 does not directly inhibit adiposetissue lipolysis when measured by microdialysis (49) and so thechange observed in adipose tissue function would not be pre-dicted to be dependent on GLP-1. The measurement of generegulation after RS intake is novel, yet, unlike pharmacologicinterventions (50), the increased uptake of glucose into skeletalmuscle could not be explained by changes in expression of thekey genes involved in either insulin signaling or glucose uptake.This does not, however, exclude the possibility that gene expres-sion in other tissues such as the gastrointestinal tract contributesto the metabolic changes observed.
In conclusion, RS intake increases insulin sensitivity in non-insulin-resistant subjects by changing both adipose tissue andskeletal muscle metabolism. This is potentially due to elevationsin the systemic concentrations of both ghrelin and SCFAs. RSintake at this dose (30 g/d) was well tolerated and thus could havebeneficial effects for the treatment of insulin-resistant persons orthose with type 2 diabetes. This would require further investiga-tion.
We thank Jenny Currie and Sandra Ellis for technical assistance and all thevolunteers for giving their time so freely.
MDR was involved in designing the protocol, recruiting volunteers, con-ducting much of the practical work, and writing the first draft of the paper.ASB and ALD were involved in managing the clinical studies; HV conductedthe studies of gene expression; and KNF helped to design the study and writethe paper. All authors helped to refine the paper. None of the authors hadpersonal or financial conflicts of interest.
REFERENCES1. Harris MI. Diabetes in America: epidemiology and scope of the problem.
Diabetes Care 1998;suppl 3:C11–4.2. Tuomilehto J, Lindstrom J, Eriksson JG, et al. Prevention of type 2
diabetes mellitus by changes in lifestyle among subjects with impairedglucose tolerance. N Engl J Med 2001;344:1343–50.
3. Knowler WC, Barrett-Connor E, Fowler SE, et al. Reduction in theincidence of type 2 diabetes with lifestyle intervention or metformin.N Engl J Med 2002;346:393–403.
4. Parillo M, Riccardi G. Diet composition and the risk of type 2 diabetes:epidemiological and clinical evidence. Br J Nutr 2004;92:7–19.
5. Rivellese AA, Lilli S. Quality of dietary fatty acids, insulin sensitivityand type 2 diabetes. Biomed Pharmacother 2003;57:84–87.
6. McGarry JD, Dobbins RL. Fatty acids, lipotoxicity and insulin secretion.Diabetologia 1999;42:128–38.
7. Jenkins DJA, Kendall CWC, Axelsen M, Augustin LSA, Vuksan V.Viscous and nonviscous fibres, nonabsorbable and low glycaemic indexcarbohydrates, blood lipids and coronary heart disease. Curr Opin Lipi-dol 2000;11:49–56.
8. Robertson MD, Currie JM, Morgan LM, Jewell DP, Frayn KN. Priorshort-term consumption of resistant starch enhances postprandial insulinsensitivity in healthy subjects. Diabetologia 2003;46:659–65.
9. Salmeron J, Ascherio A, Rimm EB. Dietary fiber, glycaemic load, andrisk of NIDDM in men. Diabetes Care 1997;20:545–50.
10. Salmeron J, Manson JE, Stampfer MJ, Colditz GA, Wing AL, WillettWC. Dietary fiber, glycaemic load and risk of non-insulin dependentdiabetes mellitus in women. JAMA 1997;277:472–7.
11. Ylonen K, Saloranta C, Kronberg-Kippila C, Groop L, Aro A, Virtanen
SM. Associations of dietary fiber with glucose metabolism in nondia-betic relatives of subjects with type 2 diabetes; the Botnia Dietary Study.Diabetes Care 2003;26:1979–85.
12. McGarry JD. Banting Lecture 2001: dysregulation of fatty acid metab-olism in the etiology of type 2 diabetes. Diabetes 2002;51:7–18.
13. Crouse JR, Gerson CD, DeCarli LM, Lieber CS. Role of acetate in thereduction of plasma free fatty acids produced by ethanol in man. J LipidRes 1968;9:509–12.
14. Robertson MD, Henderson RA, Vist GE, Rumsey RDE. Extended effectof evening meal carbohydrate-to-fat ratio on fasting and postprandialsubstrate metabolism. Am J Clin Nutr 2002;75:505–10.
15. DeFronzo RA, Tobin J, Andres R. Glucose clamp technique: a methodfor quantifying insulin secretion and resistance. Am J Physiol 1979;237:E214–23.
16. Frayn KN, Coppack SW. Assessment of white adipose tissue metabo-lism by measurement of arteriovenous differences. Methods Mol Biol2001;155:269–79.
17. Frayn KN, Coppack SW, Humphreys SM, Whyte PL. Metabolic char-acteristics of human adipose tissue in vivo. Clin Sci 1989;76:509–16.
18. Larsen OA, Lassen NA, Quaade F. Blood flow through human adiposetissue determined with radioactive xenon. Acta Physiol Scand 1966;66:337–45.
19. Rådegran G. Limb and skeletal muscle blood flow measurements at restand during exercise in human subjects. Proc Nutr Soc 1999;58:887–98.
20. Chomczynski P, Sacchi N. Single-step method of RNA isolation by acidguanidinium-thiocyanate-phenol-chloroform extraction. Ann Biochem1987;162:156–9.
21. Kreyman B, Williams G, Ghatei MA, Bloom SR. Glucagon-like peptide1: a physiological incretin in man. Lancet 1987;8571:1300–4.
22. Brighenti F. Simple method for quantitative analysis of short chain fattyacids in serum by gas-liquid chromatography. In: Guillon F, Abraham G,Amado R, et al, eds. Plant polysaccharides in human nutrition: structure,function, digestive fate and metabolic affects. Nantes, France: INRA,1997:114–9.
23. Matthews DR, Hosker JP, Rudenski AS, Naylor BA, Treacher DF,Turner RC. Homeostasis model assessment: insulin resistance and �-cellfunction from fasting plasma glucose and insulin concentrations in man.Diabetologia 1985;28:412–9.
24. Caumo A, Bergman RN, Cobelli C. Insulin sensitivity from meal toler-ance tests in normal subjects: a minimal model index. J Clin EndocrinolMetab 2000;85:4396–402.
25. Matthews JNS, Altman DG, Campbell MJ, Royston P. Analysis of serialmeasurements in medical research. BMJ 1990;300:230–5.
26. Wolever TM, Brighenti F, Royall D, Jenkins AL, Jenkins DJ. Effect ofrectal infusion of short chain fatty acids in human subjects. Am J Gas-troenterol 1989;84:1027–33.
27. Venter CS, Vorster HH. Possible metabolic consequence of fermenta-tion in the colon for humans. Med Hypotheses 1989;29:161–66.
28. Anderson JW, Bridges SR. Short-chain fatty acid fermentation productsof plant fiber affect glucose metabolism of isolated rat hepatocytes. ProcSoc Exp Biol Med 1984;177:372–6.
29. Kim SP, Ellmerer M, Van Citters GW, Bergman RN. Primacy ofhepatic insulin resistance in the development of the metabolic syn-drome induced by an isocaloric moderate-fat diet in the dog. Diabetes2003;52:2453– 60.
30. Xiong Y, Miyamoto N, Shibata K, et al. Short chain fatty acids stimulateleptin production in adipocytes through the G protein-coupled receptorGPR41. Proc Natl Acad Sci U S A 2004;100:1045–50.
31. Bonini JA, Andersen SM, Steiner DF. Molecular cloning and tissueexpression of a novel orphan G protein-coupled receptor from rat lung.Biochem Biophys Res Commun 1997;234:190–3.
32. Yki-Jarvinen H, Koivisto VA, Ylinkahri R, Taskinen MR. Acute effectsof ethanol and acetate on glucose kinetics in normal subjects. Am JPhysiol 1988;254:E175–80.
33. Akanji AO, Bruce MA, Frayn KN. Effect of acetate infusion on energyexpenditure and substrate oxidation rates in non-diabetic and diabeticsubjects. Eur J Clin Nutr 1989;43:107–15.
34. Randle PJ, Garland PB, Hales CN, Newsholme EA. The glucose fatty-acid cycle. Its role in insulin sensitivity and the metabolic disturbancesof diabetes mellitus. Lancet 1963;1:785–9.
35. Jenkins DJA, Vuksan V, Kendall CWC, et al. Physiological effects ofresistant starches on fecal bulk, short chain fatty acids, blood lipids andglycemic index. J Am Coll Nutr 1998;17:609–16.
566 ROBERTSON ET AL
36. Tapsell. Diet and the metabolic syndrome: where does resistant starch fitin? J AOAC Int 2004;87:756–60.
37. Halford JC, Cooper GD, Dovey TM. The pharmacology of human ap-petite suppression. Curr Drug Targets 2004;5:221–40.
38. Ikezaki A, Hosada H, Ito K, et al. Fasting ghrelin levels are negativelycorrelated with insulin resistance and PAI-1 but not with leptin in obesechildren and adolescents. Diabetes 2002;51:3408–11.
39. Poykko S, Ukkola O, Kauma H, Savolainin MJ, Kesaniemi YA. GhrelinArg51Gln mutation is a risk factor for type 2 diabetes and hypertensionin a random sample of middle aged subjects. Diabetologia 2003;46:455–8.
40. Pagotto U, Gambineri A, Vicennati V, Heiman ML, Tschop M, PasqualiR. Plasma ghrelin, obesity and the polycystic ovary syndrome: correla-tion with insulin resistance and androgen levels. J Clin Endocrinol Metab2002;87:5625–9.
41. Choi K, Roh SG, Hong YH, et al. The role of ghrelin and growth hormonesecretagogues receptor on rat adipogenesis. Endocrinology 2003;144:754–9.
42. Gnanapavan S, Kola B, Bustin SA, et al. The tissue distribution of themRNA of ghrelin and subtypes of its receptor, GHS-R in humans. J ClinEndocrinol Metab 2002;87:2988–91.
43. Pierno S, de Luca A, Desaphy JF, et al. Growth hormone secretagogues
modulate the electrical and contractile properties of rat skeletal musclethrough a ghrelin-specific receptor. Br J Pharmacol 2003;139:575–84.
44. Bodart V, Febbraio M, Demers A, et al. CD36 mediates the cardiovas-cular action of growth hormone-releasing peptides in the heart. Circ Res2002;90:844–9.
45. Tappenden KA, Albin DM, Bartholome AL, Mangian HF. Glucagon-like peptide 2 and short chain fatty acids: a new twist on an old story. JNutr 2003;133:3713–20.
46. Tappenden KA, McBurney MI. Systemic short chain fatty acids rapidlyalter gastrointestinal structure, function and expression of early responsegenes. Dig Dis Sci 1998;43:1526–36.
47. Reilly KJ, Frankel WL, Bain AM. Colonic short chain fatty acids me-diate jejunal growth by increasing gastrin. Gut 1995;37:81–6.
48. Anini Y, Fu-Cheng X, Cuber JC, Kervran A, Chariot J, Roz C. Com-parison of the postprandial release of peptide YY and proglucagon-derived peptides in the rat. Pflugers Arch 1999;438:299–306.
49. Bertin E, Arner P, Bolinder J, Hagstrom-Toft E. Action on glucagon andglucagon-like peptide 1 (7–36) amide on lipolysis in human subcutane-ous adipose tissue. J Clin Endocrinol Metab 2001;86:1229–34.
50. Sreekumar R, Halvatsiotis P, Schimke JC, Nair KS. Gene expressionprofile in skeletal muscle of type 2 diabetes and the effect of insulintreatment. Diabetes 2002;51:1913–20.
RESISTANT STARCH AND INSULIN SENSITIVITY 567
Effect of supplementation with cobalamin carried either by a milkproduct or a capsule in mildly cobalamin-deficient elderly Dutchpersons1–3
Rosalie AM Dhonukshe-Rutten, Moniek van Zutphen, Lisette CPGM de Groot, Simone JPM Eussen, Henk J Blom, andWija A van Staveren
ABSTRACTBackground: A high prevalence of cobalamin deficiency occurs inthe elderly population, which may be treated orally or with injec-tions. Little is known about the relative bioavailability of crystallinecobalamin added to food products.Objective: The objective was to assess the effect of supplementationwith 1000 �g crystalline cobalamin, carried either by a milk productor a capsule, on cobalamin status in mildly cobalamin-deficientelderly Dutch persons.Design: Two double-blind randomized controlled intervention stud-ies, each covering a 12-wk supplementation period, were carried outin parallel. Mildly cobalamin-deficient elderly persons (n � 112)were separately recruited for the milk and capsule trials. Mild co-balamin deficiency was defined as a cobalamin concentration be-tween 100 and 300 pmol/L and a plasma methylmalonic acid(MMA) concentration �0.30 �mol/L. Allocation to the placebo orcobalamin carrier was carried out independently in both trials.Results: In the fortified-milk group, the mean (�SD) increase inserum cobalamin was 250 � 96 pmol/L, the median (5th and 95thpercentiles) decrease in plasma MMA was 0.19 (�0.76, �0.04)�mol/L, and the median decrease in plasma homocysteine was 4.0(�7.3, 3.0) �mol/L. All changes were significantly different fromthose in the placebo milk group (P � 0.01). Likewise, in thecobalamin-capsule group, the mean increase in serum cobalaminwas 281 � 136 pmol/L, the median decrease in plasma MMA was0.18 (�2.95, 0.14) �mol/L, and the median decrease in plasmahomocysteine was 1.8 (�10.6, 2.4) �mol/L; all changes were sig-nificantly different from those in the placebo capsule group (P �0.01). No significant differences were observed between thefortified-milk and capsule groups (P � 0.40).Conclusion: Crystalline cobalamin added to milk is an effectivealternative to cobalamin capsules for improving cobalaminstatus. Am J Clin Nutr 2005;82:568–74.
KEY WORDS Vitamin B-12, elderly people, fortified milk,oral cobalamin treatment
INTRODUCTION
Many studies have shown a high prevalence of cobalamindeficiency in elderly populations, ranging from 12% to 40%(1–4). This deficiency may cause neuropsychiatric damage, in-cluding cognitive impairment, and hematologic abnormalities,even in cases of mild cobalamin deficiency (1, 2, 5). Therefore,
cobalamin deficiency in old age is considered to be a substantialproblem for public health, which needs to be managed ade-quately.
Different indicators and cutoffs have been used to define mildcobalamin deficiency. Currently, plasma methylmalonic acid(MMA) and homocysteine concentrations are used along withserum cobalamin concentrations to assess cobalamin deficiency.However, homocysteine is also elevated in folate and vitaminB-6 deficiency. Therefore, MMA is the preferred indicator be-cause of its higher sensitivity and specificity (6).
High doses of cobalamin, eg, from intramuscular injections ororal supplements, are needed to treat cobalamin deficiency (7–9).Unfortunately, injections may be painful and are difficult to admin-ister in persons with a tendency to bleed or who are thin. Moreover,injections are costly when given by health professionals (10, 11).Supplements of 1000 �g vitamin B-12/d may be an alternative toinjections, because only high doses produce successful long-termresults, as indicated by Elia (10) and by Lane and Rojas-Fernandez(12). Such high doses cannot be derived from the diet alone, whichprovides an average of �5.5 �g/d (13). This amount (4) meets theAmerican and Dutch recommended daily allowance (2.4 and 2.8�g/d, respectively). A dose of 1000 �g cobalamin/d is generallyconsideredtobesafe.Asafeupper level forcobalaminintakehasnotyet been set, but a supplemental intake of 2000 �g/d is considered asafe upper limit (14). No treatment-related adverse events afterdoses of 1000-2000 �g/d for periods ranging from 6 wk to 12 mohave been reported (8, 9, 15). Although supplements may be ad-vised, an extra pill every day may affect compliance with regularmedication use, especially in the elderly, who already use a lot ofmedicines daily (16). An alternative would be to add cobalamin tothe food. Such fortified foods may have other benefits, such asproviding energy and other nutrients that may be low in the diets ofelderly persons (17).
1 From the Department of Human Nutrition, Wageningen University,Wageningen, Netherlands (RAMD-R, MvZ, LCPGMdG, SJPME, andWAvS), and the Laboratory of Pediatrics and Neurology, University MedicalCenter Wageningen, Wageningen, Netherlands (HJB).
2 Supported by The Dutch Dairy Association.3 Reprints not available. Address correspondence to LCPGM de Groot,
Department of Human Nutrition, Wageningen University, PO Box 8129,NL-6700 EV Wageningen, Netherlands. E-mail: [email protected].
Received June 30, 2004.Accepted for publication May 11, 2005.
568 Am J Clin Nutr 2005;82:568–74. Printed in USA. © 2005 American Society for Clinical Nutrition
In light of cereal fortification with folate, which has beenmandatory in the United States since January of 1998, foodfortification with cobalamin has gained interest (18, 19) becausefolate fortification alone may lead to an increased risk of maskedcobalamin deficiency, particularly in the elderly (20–22). How-ever, little is known about the bioavailability of crystalline co-balamin that has been added to a food product. Only Russell et al(23) have studied the absorption of 0.25 �g cobalamin fromwater (55%), milk (65%), and bread (55%) in non-cobalamin-deficient older adults. The effect that high doses of crystallinecobalamin in fortified foods would have on the cobalamin statusof elderly Dutch people with a mild cobalamin deficiency is notyet clear. Therefore, the aim of our study was to assess the effectof supplementation with 1000 �g crystalline cobalamin for 12wk, carried either by a milk product or by a capsule, on cobalaminstatus in mildly deficient elderly Dutch persons compared withthat in a placebo group.
SUBJECTS AND METHODS
We carried out 2 double-blind, independent, randomized con-trolled trials, each of which lasted 12 wk. In one of these trials, amilk product carried the high cobalamin dose; in the other trial,a capsule carried it. In both trials, a placebo group consumedeither a milk drink or a placebo capsule without cobalamin.Neither the subjects nor the investigators knew which supple-ments served as the placebo or intervention. The 2 capsule groupswere part of a larger study in which 3 capsule groups werestudied: placebo, vitamin B-12, or vitamin B-12 plus folic acid.The improvement in cobalamin status was assessed after 12 wkon the basis of the change in plasma MMA and serum cobalaminconcentrations, which were the primary outcome measures.Plasma homocysteine and red blood cell (RBC) folate were eval-uated as secondary outcome measures.
Subjects
For both trials, men and women aged �70 y were enrolledvoluntarily by mail with the consent of the staff of their shelteredhousing residence. Subjects with a history of cobalamin defi-ciency, of high-cobalamin (�50 �g/d) or -folate (�200 �g/d)supplementation or injections, gastrointestinal surgery, renaldysfunction (serum creatinine �120 �mol/L), anemia, or cancerwere excluded on the basis of self-reports. Only subjects withmild cobalamin deficiency were included in the trials; their se-rum cobalamin concentrations ranged from 100 to 300 pmol/L(6) and their plasma MMA concentrations were �0.30 �mol/L(1); these variables were checked in a blood sample drawn �1 hafter a light breakfast was eaten. All of the subjects gave theirwritten informed consent. The medical ethics committee ofWageningen University approved the research protocols.
Study design
Before the trials began, all eligible subjects participated in a2-wk run-in period in which they received a placebo milk drinkor capsule. The subjects were matched by sex, MMA concentra-tion, and age for random distribution of the placebo or the co-balamin carrier. In the matching procedure, priority was given toMMA. In most cases, the MMA concentration of the matchedpairs did not differ by �0.02 �mol/L. Consequently, an agedifference of 10 y occurred within one matched pair. Allocationof the placebo or cobalamin carrier was carried out independently
in both trials. After the run-in period, baseline blood samples andanthropometric data were collected after the subjects fasted over-night (no food eaten after 20:00); the subjects were allowed aprescribed light breakfast (toast, bread, jam or other sweetspread, cheese, yogurt, milk, coffee or tea; no peanut butter,juice, meat, or products rich in vitamin B-12 were allowed) thenext morning until 1 h before blood was drawn. After the bloodsamples were collected, the subjects received either the placeboor the cobalamin carrier. The milk was provided in 500-mLcontainers along with 125-mL cups. Every morning, the subjectshad to consume 125 mL milk. The capsules were provided inmedicine boxes on which the days and week were indicated, soeach box contained 7 capsules. One capsule was taken each day,and each subject had a diary in which he or she indicated whetherthe milk or capsule was consumed. Compliance was assessed byreviewing the diary contents and by counting any remainingcapsules. The diary of the subjects who received the milk drinkcontained an additional column for reporting, after every 4 d,approximately how much milk was left in the container. Wecalculated noncompliance as the amount of milk that was notconsumed or the number of capsules that were not consumed. Inboth trials, compliance (%) was calculated by using the followingformula:
Compliance � 100 � (noncompliance/total
amount of milk or capsules to be consumed) � 100 (1)
During the 12-wk period, the participants were asked to maintaintheir regular diet and also to avoid consumption of cobalamin-rich food products. A list of products rich in cobalamin, mainlyliver products, was provided to participants of the milk trial.After 12 wk, a second blood sample was collected from eachsubject, again with allowance for a light breakfast until 1 h beforeblood sampling.
Cobalamin carrier
The milk was manufactured by NIZO food research (Ede,Netherlands). Either 8000 �g/L of crystalline cyanocobalamin(fortified product) or 25 �g/L carmine extract with E-numberE120 (placebo product) was added to semi-skim milk. Subse-quently the products were homogenized at 150/30 bar, sterilizedat 140 °C for 5 s, and aseptically filled in 500-mL polyethylenecontainers. The containers were closed with an aluminum seal.The carmine extract was added to the placebo milk to achieve acolor similar to that of the fortified milk. Carmine extract isknown not to have any flavor characteristics. Therefore, no dif-ferences in flavor and color between the 2 milk products wereobserved. The energy content of both milk types was 194 kJ/100mL. During the study, a cobalamin assay was performed on eachmilk type. The cobalamin-fortified milk contained 7000 �g/L,whereas the placebo milk contained 3.7 �g cobalamin/L.
The capsules were manufactured by Dutch BioFarmaceutics(Helmond, Netherlands) and contained AVICEL PH102 as afiller (placebo; Medipulp GmbH, Germany) and 1000 �g crys-talline cyanocobalamin. The capsules had identical appearances,smells, and tastes. A cobalamin assay of several of the capsuleswas performed; the mean concentration was 936 � 34 �g. Themilk containers and the capsules were coded so that neither theinvestigator nor the participants were aware of the contents.
COBALAMIN-FORTIFIED MILK AND COBALAMIN CAPSULES 569
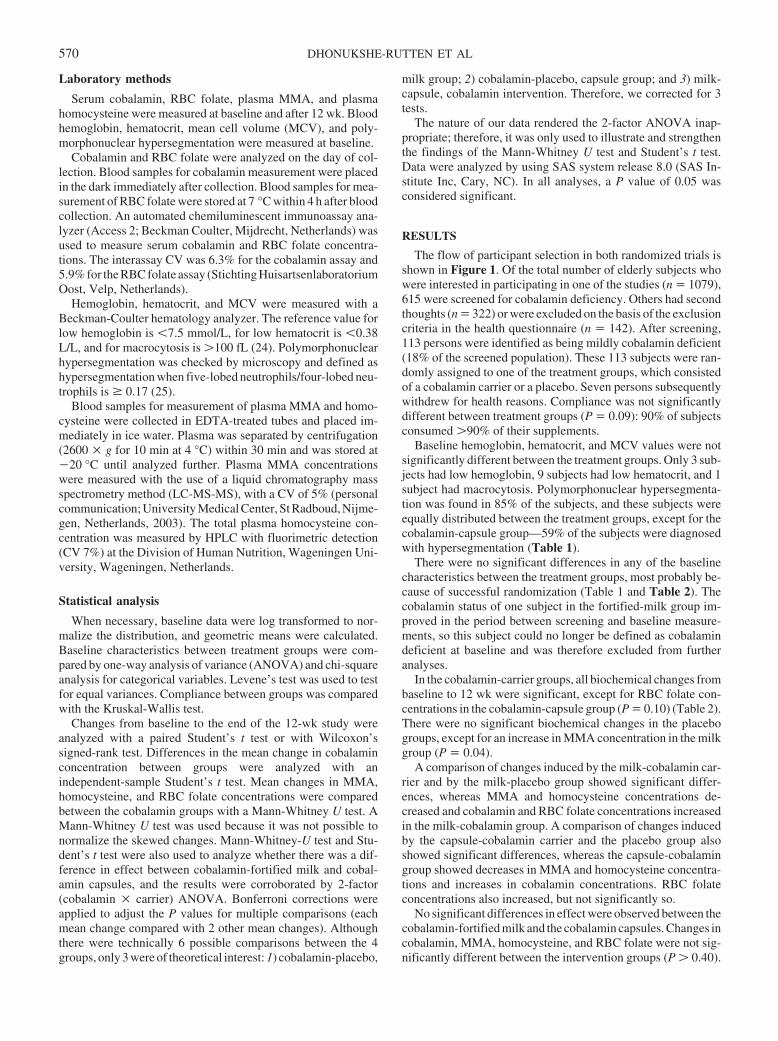
Laboratory methods
Serum cobalamin, RBC folate, plasma MMA, and plasmahomocysteine were measured at baseline and after 12 wk. Bloodhemoglobin, hematocrit, mean cell volume (MCV), and poly-morphonuclear hypersegmentation were measured at baseline.
Cobalamin and RBC folate were analyzed on the day of col-lection. Blood samples for cobalamin measurement were placedin the dark immediately after collection. Blood samples for mea-surement of RBC folate were stored at 7 °C within 4 h after bloodcollection. An automated chemiluminescent immunoassay ana-lyzer (Access 2; Beckman Coulter, Mijdrecht, Netherlands) wasused to measure serum cobalamin and RBC folate concentra-tions. The interassay CV was 6.3% for the cobalamin assay and5.9% for the RBC folate assay (Stichting HuisartsenlaboratoriumOost, Velp, Netherlands).
Hemoglobin, hematocrit, and MCV were measured with aBeckman-Coulter hematology analyzer. The reference value forlow hemoglobin is �7.5 mmol/L, for low hematocrit is �0.38L/L, and for macrocytosis is �100 fL (24). Polymorphonuclearhypersegmentation was checked by microscopy and defined ashypersegmentation when five-lobed neutrophils/four-lobed neu-trophils is � 0.17 (25).
Blood samples for measurement of plasma MMA and homo-cysteine were collected in EDTA-treated tubes and placed im-mediately in ice water. Plasma was separated by centrifugation(2600 � g for 10 min at 4 °C) within 30 min and was stored at�20 °C until analyzed further. Plasma MMA concentrationswere measured with the use of a liquid chromatography massspectrometry method (LC-MS-MS), with a CV of 5% (personalcommunication; University Medical Center, St Radboud, Nijme-gen, Netherlands, 2003). The total plasma homocysteine con-centration was measured by HPLC with fluorimetric detection(CV 7%) at the Division of Human Nutrition, Wageningen Uni-versity, Wageningen, Netherlands.
Statistical analysis
When necessary, baseline data were log transformed to nor-malize the distribution, and geometric means were calculated.Baseline characteristics between treatment groups were com-pared by one-way analysis of variance (ANOVA) and chi-squareanalysis for categorical variables. Levene’s test was used to testfor equal variances. Compliance between groups was comparedwith the Kruskal-Wallis test.
Changes from baseline to the end of the 12-wk study wereanalyzed with a paired Student’s t test or with Wilcoxon’ssigned-rank test. Differences in the mean change in cobalaminconcentration between groups were analyzed with anindependent-sample Student’s t test. Mean changes in MMA,homocysteine, and RBC folate concentrations were comparedbetween the cobalamin groups with a Mann-Whitney U test. AMann-Whitney U test was used because it was not possible tonormalize the skewed changes. Mann-Whitney-U test and Stu-dent’s t test were also used to analyze whether there was a dif-ference in effect between cobalamin-fortified milk and cobal-amin capsules, and the results were corroborated by 2-factor(cobalamin � carrier) ANOVA. Bonferroni corrections wereapplied to adjust the P values for multiple comparisons (eachmean change compared with 2 other mean changes). Althoughthere were technically 6 possible comparisons between the 4groups, only 3 were of theoretical interest: 1) cobalamin-placebo,
milk group; 2) cobalamin-placebo, capsule group; and 3) milk-capsule, cobalamin intervention. Therefore, we corrected for 3tests.
The nature of our data rendered the 2-factor ANOVA inap-propriate; therefore, it was only used to illustrate and strengthenthe findings of the Mann-Whitney U test and Student’s t test.Data were analyzed by using SAS system release 8.0 (SAS In-stitute Inc, Cary, NC). In all analyses, a P value of 0.05 wasconsidered significant.
RESULTS
The flow of participant selection in both randomized trials isshown in Figure 1. Of the total number of elderly subjects whowere interested in participating in one of the studies (n � 1079),615 were screened for cobalamin deficiency. Others had secondthoughts (n � 322) or were excluded on the basis of the exclusioncriteria in the health questionnaire (n � 142). After screening,113 persons were identified as being mildly cobalamin deficient(18% of the screened population). These 113 subjects were ran-domly assigned to one of the treatment groups, which consistedof a cobalamin carrier or a placebo. Seven persons subsequentlywithdrew for health reasons. Compliance was not significantlydifferent between treatment groups (P � 0.09): 90% of subjectsconsumed �90% of their supplements.
Baseline hemoglobin, hematocrit, and MCV values were notsignificantly different between the treatment groups. Only 3 sub-jects had low hemoglobin, 9 subjects had low hematocrit, and 1subject had macrocytosis. Polymorphonuclear hypersegmenta-tion was found in 85% of the subjects, and these subjects wereequally distributed between the treatment groups, except for thecobalamin-capsule group—59% of the subjects were diagnosedwith hypersegmentation (Table 1).
There were no significant differences in any of the baselinecharacteristics between the treatment groups, most probably be-cause of successful randomization (Table 1 and Table 2). Thecobalamin status of one subject in the fortified-milk group im-proved in the period between screening and baseline measure-ments, so this subject could no longer be defined as cobalamindeficient at baseline and was therefore excluded from furtheranalyses.
In the cobalamin-carrier groups, all biochemical changes frombaseline to 12 wk were significant, except for RBC folate con-centrations in the cobalamin-capsule group (P � 0.10) (Table 2).There were no significant biochemical changes in the placebogroups, except for an increase in MMA concentration in the milkgroup (P � 0.04).
A comparison of changes induced by the milk-cobalamin car-rier and by the milk-placebo group showed significant differ-ences, whereas MMA and homocysteine concentrations de-creased and cobalamin and RBC folate concentrations increasedin the milk-cobalamin group. A comparison of changes inducedby the capsule-cobalamin carrier and the placebo group alsoshowed significant differences, whereas the capsule-cobalamingroup showed decreases in MMA and homocysteine concentra-tions and increases in cobalamin concentrations. RBC folateconcentrations also increased, but not significantly so.
No significant differences in effect were observed between thecobalamin-fortified milk and the cobalamin capsules. Changes incobalamin, MMA, homocysteine, and RBC folate were not sig-nificantly different between the intervention groups (P � 0.40).
570 DHONUKSHE-RUTTEN ET AL
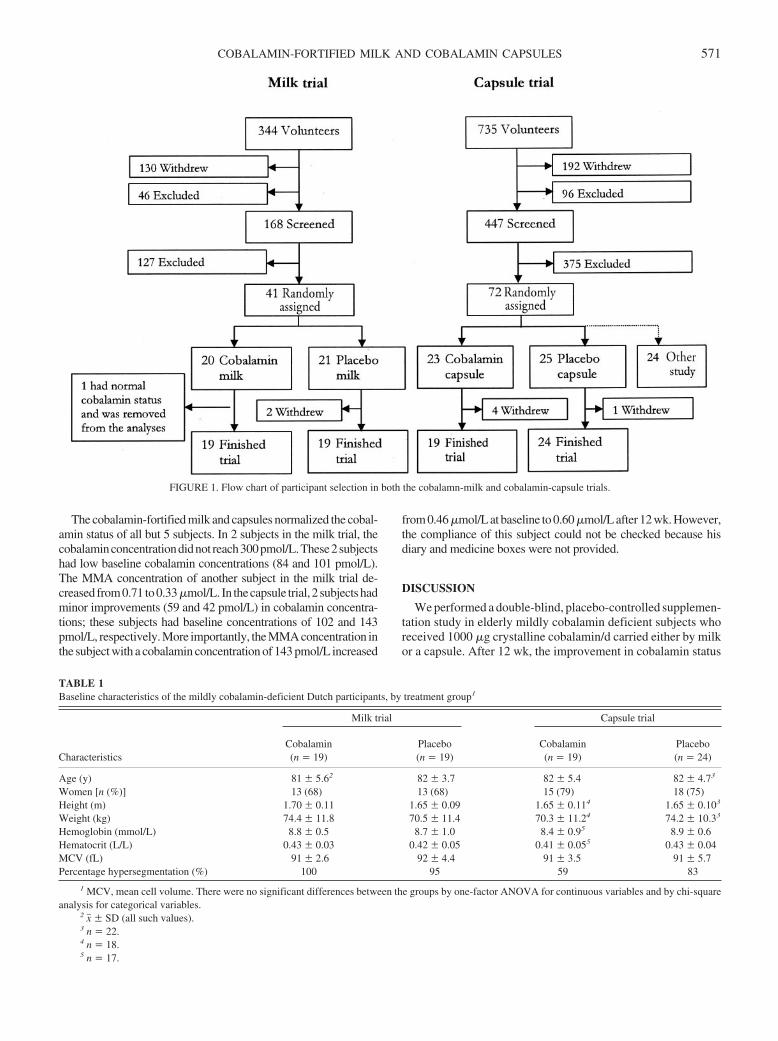
The cobalamin-fortified milk and capsules normalized the cobal-amin status of all but 5 subjects. In 2 subjects in the milk trial, thecobalaminconcentrationdidnot reach300pmol/L.These2subjectshad low baseline cobalamin concentrations (84 and 101 pmol/L).The MMA concentration of another subject in the milk trial de-creased from0.71 to0.33�mol/L. In thecapsule trial, 2 subjectshadminor improvements (59 and 42 pmol/L) in cobalamin concentra-tions; these subjects had baseline concentrations of 102 and 143pmol/L, respectively. More importantly, the MMA concentration inthe subject with a cobalamin concentration of 143 pmol/L increased
from 0.46 �mol/L at baseline to 0.60 �mol/L after 12 wk. However,the compliance of this subject could not be checked because hisdiary and medicine boxes were not provided.
DISCUSSION
We performed a double-blind, placebo-controlled supplemen-tation study in elderly mildly cobalamin deficient subjects whoreceived 1000 �g crystalline cobalamin/d carried either by milkor a capsule. After 12 wk, the improvement in cobalamin status
FIGURE 1. Flow chart of participant selection in both the cobalamn-milk and cobalamin-capsule trials.
TABLE 1Baseline characteristics of the mildly cobalamin-deficient Dutch participants, by treatment group1
Characteristics
Milk trial Capsule trial
Cobalamin(n � 19)
Placebo(n � 19)
Cobalamin(n � 19)
Placebo(n � 24)
Age (y) 81 � 5.62 82 � 3.7 82 � 5.4 82 � 4.73
Women [n (%)] 13 (68) 13 (68) 15 (79) 18 (75)Height (m) 1.70 � 0.11 1.65 � 0.09 1.65 � 0.114 1.65 � 0.103
Weight (kg) 74.4 � 11.8 70.5 � 11.4 70.3 � 11.24 74.2 � 10.33
Hemoglobin (mmol/L) 8.8 � 0.5 8.7 � 1.0 8.4 � 0.95 8.9 � 0.6Hematocrit (L/L) 0.43 � 0.03 0.42 � 0.05 0.41 � 0.055 0.43 � 0.04MCV (fL) 91 � 2.6 92 � 4.4 91 � 3.5 91 � 5.7Percentage hypersegmentation (%) 100 95 59 83
1 MCV, mean cell volume. There were no significant differences between the groups by one-factor ANOVA for continuous variables and by chi-squareanalysis for categorical variables.
2 x� � SD (all such values).3 n � 22.4 n � 18.5 n � 17.
COBALAMIN-FORTIFIED MILK AND COBALAMIN CAPSULES 571
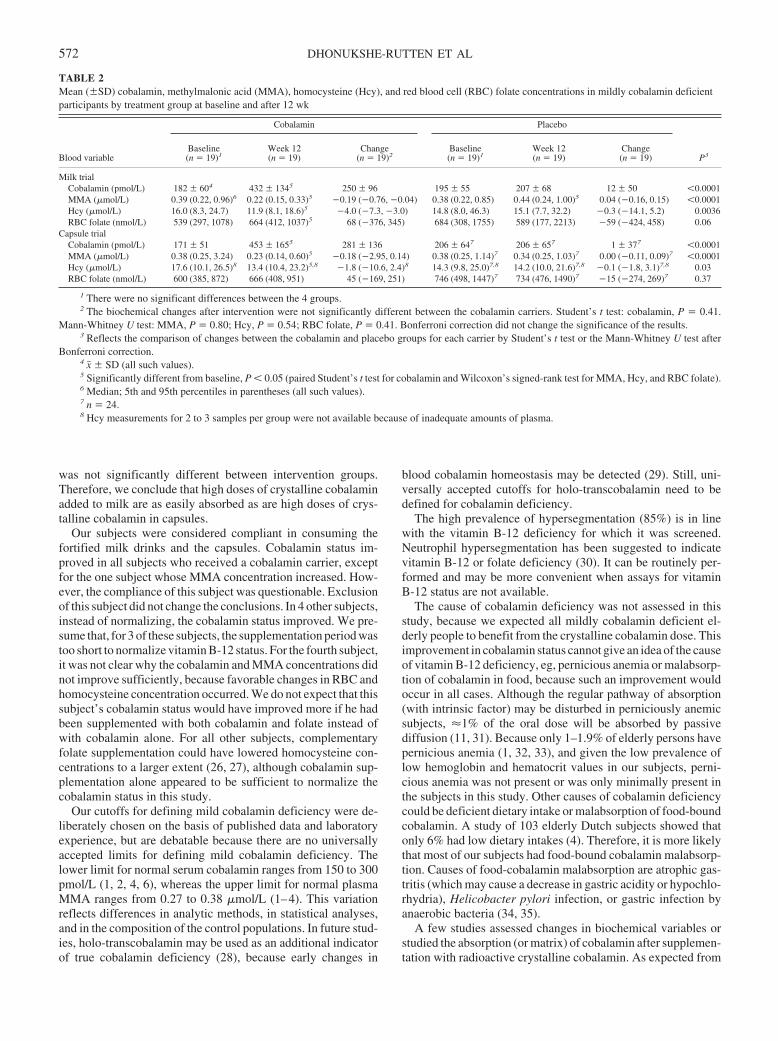
was not significantly different between intervention groups.Therefore, we conclude that high doses of crystalline cobalaminadded to milk are as easily absorbed as are high doses of crys-talline cobalamin in capsules.
Our subjects were considered compliant in consuming thefortified milk drinks and the capsules. Cobalamin status im-proved in all subjects who received a cobalamin carrier, exceptfor the one subject whose MMA concentration increased. How-ever, the compliance of this subject was questionable. Exclusionof this subject did not change the conclusions. In 4 other subjects,instead of normalizing, the cobalamin status improved. We pre-sume that, for 3 of these subjects, the supplementation period wastoo short to normalize vitamin B-12 status. For the fourth subject,it was not clear why the cobalamin and MMA concentrations didnot improve sufficiently, because favorable changes in RBC andhomocysteine concentration occurred. We do not expect that thissubject’s cobalamin status would have improved more if he hadbeen supplemented with both cobalamin and folate instead ofwith cobalamin alone. For all other subjects, complementaryfolate supplementation could have lowered homocysteine con-centrations to a larger extent (26, 27), although cobalamin sup-plementation alone appeared to be sufficient to normalize thecobalamin status in this study.
Our cutoffs for defining mild cobalamin deficiency were de-liberately chosen on the basis of published data and laboratoryexperience, but are debatable because there are no universallyaccepted limits for defining mild cobalamin deficiency. Thelower limit for normal serum cobalamin ranges from 150 to 300pmol/L (1, 2, 4, 6), whereas the upper limit for normal plasmaMMA ranges from 0.27 to 0.38 �mol/L (1–4). This variationreflects differences in analytic methods, in statistical analyses,and in the composition of the control populations. In future stud-ies, holo-transcobalamin may be used as an additional indicatorof true cobalamin deficiency (28), because early changes in
blood cobalamin homeostasis may be detected (29). Still, uni-versally accepted cutoffs for holo-transcobalamin need to bedefined for cobalamin deficiency.
The high prevalence of hypersegmentation (85%) is in linewith the vitamin B-12 deficiency for which it was screened.Neutrophil hypersegmentation has been suggested to indicatevitamin B-12 or folate deficiency (30). It can be routinely per-formed and may be more convenient when assays for vitaminB-12 status are not available.
The cause of cobalamin deficiency was not assessed in thisstudy, because we expected all mildly cobalamin deficient el-derly people to benefit from the crystalline cobalamin dose. Thisimprovement in cobalamin status cannot give an idea of the causeof vitamin B-12 deficiency, eg, pernicious anemia or malabsorp-tion of cobalamin in food, because such an improvement wouldoccur in all cases. Although the regular pathway of absorption(with intrinsic factor) may be disturbed in perniciously anemicsubjects, �1% of the oral dose will be absorbed by passivediffusion (11, 31). Because only 1–1.9% of elderly persons havepernicious anemia (1, 32, 33), and given the low prevalence oflow hemoglobin and hematocrit values in our subjects, perni-cious anemia was not present or was only minimally present inthe subjects in this study. Other causes of cobalamin deficiencycould be deficient dietary intake or malabsorption of food-boundcobalamin. A study of 103 elderly Dutch subjects showed thatonly 6% had low dietary intakes (4). Therefore, it is more likelythat most of our subjects had food-bound cobalamin malabsorp-tion. Causes of food-cobalamin malabsorption are atrophic gas-tritis (which may cause a decrease in gastric acidity or hypochlo-rhydria), Helicobacter pylori infection, or gastric infection byanaerobic bacteria (34, 35).
A few studies assessed changes in biochemical variables orstudied the absorption (or matrix) of cobalamin after supplemen-tation with radioactive crystalline cobalamin. As expected from
TABLE 2Mean (�SD) cobalamin, methylmalonic acid (MMA), homocysteine (Hcy), and red blood cell (RBC) folate concentrations in mildly cobalamin deficientparticipants by treatment group at baseline and after 12 wk
Blood variable
Cobalamin Placebo
P3Baseline(n � 19)1
Week 12(n � 19)
Change(n � 19)2
Baseline(n � 19)1
Week 12(n � 19)
Change(n � 19)
Milk trialCobalamin (pmol/L) 182 � 604 432 � 1345 250 � 96 195 � 55 207 � 68 12 � 50 �0.0001MMA (�mol/L) 0.39 (0.22, 0.96)6 0.22 (0.15, 0.33)5 �0.19 (�0.76, �0.04) 0.38 (0.22, 0.85) 0.44 (0.24, 1.00)5 0.04 (�0.16, 0.15) �0.0001Hcy (�mol/L) 16.0 (8.3, 24.7) 11.9 (8.1, 18.6)5 �4.0 (�7.3, �3.0) 14.8 (8.0, 46.3) 15.1 (7.7, 32.2) �0.3 (�14.1, 5.2) 0.0036RBC folate (nmol/L) 539 (297, 1078) 664 (412, 1037)5 68 (�376, 345) 684 (308, 1755) 589 (177, 2213) �59 (�424, 458) 0.06
Capsule trialCobalamin (pmol/L) 171 � 51 453 � 1655 281 � 136 206 � 647 206 � 657 1 � 377 �0.0001MMA (�mol/L) 0.38 (0.25, 3.24) 0.23 (0.14, 0.60)5 �0.18 (�2.95, 0.14) 0.38 (0.25, 1.14)7 0.34 (0.25, 1.03)7 0.00 (�0.11, 0.09)7 �0.0001Hcy (�mol/L) 17.6 (10.1, 26.5)8 13.4 (10.4, 23.2)5,8 �1.8 (�10.6, 2.4)8 14.3 (9.8, 25.0)7,8 14.2 (10.0, 21.6)7,8 �0.1 (�1.8, 3.1)7,8 0.03RBC folate (nmol/L) 600 (385, 872) 666 (408, 951) 45 (�169, 251) 746 (498, 1447)7 734 (476, 1490)7 �15 (�274, 269)7 0.37
1 There were no significant differences between the 4 groups.2 The biochemical changes after intervention were not significantly different between the cobalamin carriers. Student’s t test: cobalamin, P � 0.41.
Mann-Whitney U test: MMA, P � 0.80; Hcy, P � 0.54; RBC folate, P � 0.41. Bonferroni correction did not change the significance of the results.3 Reflects the comparison of changes between the cobalamin and placebo groups for each carrier by Student’s t test or the Mann-Whitney U test after
Bonferroni correction.4 x� � SD (all such values).5 Significantly different from baseline, P � 0.05 (paired Student’s t test for cobalamin and Wilcoxon’s signed-rank test for MMA, Hcy, and RBC folate).6 Median; 5th and 95th percentiles in parentheses (all such values).7 n � 24.8 Hcy measurements for 2 to 3 samples per group were not available because of inadequate amounts of plasma.
572 DHONUKSHE-RUTTEN ET AL
these biochemical studies in elderly people (7–9, 36), the cobal-amin status improved after 12 wk of supplementation with co-balamin capsules. All studies that assessed the absorption ofcrystalline cobalamin used very low doses. Therefore, sufficientpassive diffusion was minor. It appeared that the carrier of co-balamin was important because the absorption of 0.56 �g crys-talline cobalamin was inhibited by egg white and egg yolk, whenmeasured with fecal and urinary excretion in a healthy volunteer(37). In a more recent study, 0.25 �g crystalline cobalamin wasadministered in 3 different carriers to 16 non-cobalamin deficientolder adults. Here, similar absorption percentages (measuredwith a whole-body �-ray counter spectrophotometer) were ob-served for the carriers: 55% in water, 65% in milk, and 55% inbread (23). The results of these absorption studies are difficult tocompare with the results of our study. Instead of studying theabsorption of one low crystalline cobalamin dose with a radio-active marker, we administered a high crystalline cobalamindose in milk and capsules. The improvement in cobalamin statusin our study was not different between carriers, although thecontent of cobalamin in milk was somewhat lower (60 �g) thanthat in the capsules.
As mentioned before, compliance with both products wasgood. However, the compliance of a person voluntarily enrolledin a clinical trial may not reflect the compliance of a personreceiving routine medical care. A cobalamin-fortified food couldbe helpful and could replace the capsule. The amount of milkprovided in the present study, 125 mL/d, is in line with the dietarypattern of many elderly Dutch. The mean consumption of milkand milk products by the elderly Dutch population is �350 mL/d,and 97% of them consume these products (38). Thus, fortifiedmilk may be a good alternative carrier for cobalamin capsulesbecause it additionally supplies energy and other nutrients. Ad-ditional studies are required to assess whether lower-dosecobalamin-fortified foods may prevent cobalamin deficiency,especially in the elderly.
We thank the participants for their enthusiastic involvement and interest.We acknowledge the directors and staff of the participating residences fortheir willingness to let their inhabitants participate and for their hospitality.Wilma Staring and Lucy Okma are acknowledged for their practical assis-tance and Arno van Rooij for his technical assistance.
RAMD-R designed the study, developed the research study protocol,recruited the subjects, coordinated the study, comanaged the research assis-tants, collected the data, interpreted and directed the data analysis, and wrotethe manuscript. MvZ recruited the subjects, co-coordinated the researchstudy, collected and interpreted the data, and wrote the manuscript. LCPG-MdG designed the study, developed the research study protocol, directed thedata analysis and interpretation, supervised the research, and assisted with themanuscript preparation. SJPME developed the research study protocol, re-cruited the subjects, coordinated the study, comanaged the research assis-tants, collected the data, and assisted with the manuscript preparation. HJBassisted with the manuscript preparation. WAvS designed the study, super-vised the research and manuscript preparation, and was the primary investi-gator. None of the authors had a conflict of interest.
REFERENCES1. Lindenbaum J, Rosenberg IH, Wilson PW, Stabler SP, Allen RH. Prev-
alence of cobalamin deficiency in the Framingham elderly population.Am J Clin Nutr 1994;60:2–11.
2. Pennypacker LC, Allen RH, Kelly JP, et al. High prevalence of cobal-amin deficiency in elderly outpatients. J Am Geriatr Soc 1992;40:1197–204.
3. Rajan S, Wallace JI, Beresford SA, Brodkin KI, Allen RA, Stabler SP.Screening for cobalamin deficiency in geriatric outpatients: prevalence
and influence of synthetic cobalamin intake. J Am Geriatr Soc 2002;50:624–30.
4. Van Asselt DZ, de Groot LC, Van Staveren WA, et al. Role of cobalaminintake and atrophic gastritis in mild cobalamin deficiency in older Dutchsubjects. Am J Clin Nutr 1998;68:328–34.
5. Lindenbaum J, Healton EB, Savage DG, et al. Neuropsychiatric disor-ders caused by cobalamin deficiency in the absence of anemia or mac-rocytosis. N Engl J Med 1988;318:1720–8.
6. Bolann BJ, Solli JD, Schneede J, et al. Evaluation of indicators of co-balamin deficiency defined as cobalamin-induced reduction in increasedserum methylmalonic acid. Clin Chem 2000;46:1744–50.
7. Andres E, Kurtz JE, Perrin AE, et al. Oral cobalamin therapy for thetreatment of patients with food-cobalamin malabsorption. Am J Med2001;111:126–9.
8. Kuzminski AM, Del Giacco EJ, Allen RH, Stabler SP, Lindenbaum J.Effective treatment of cobalamin deficiency with oral cobalamin. Blood1998;92:1191–8.
9. Rajan S, Wallace JI, Brodkin KI, Beresford SA, Allen RH, Stabler SP.Response of elevated methylmalonic acid to three dose levels of oralcobalamin in older adults. J Am Geriatr Soc 2002;50:1789–95.
10. Elia M. Oral or parenteral therapy for B12 deficiency. Lancet 1998;352:1721–2.
11. Lederle FA. Oral cobalamin for pernicious anemia. Medicine’s best keptsecret? JAMA 1991;265:94–5.
12. Lane LA, Rojas-Fernandez C. Treatment of vitamin B(12)-deficiencyanemia: oral versus parenteral therapy. Ann Pharmacother 2002;36:1268–72.
13. Howard JM, Azen C, Jacobsen DW, Green R, Carmel R. Dietary intakeof cobalamin in elderly people who have abnormal serum cobalamin,methylmalonic acid and homocysteine levels. Eur J Clin Nutr 1998;52:582–7.
14. Expert Group on Vitamins and Minerals. Safe upper levels of vitaminsand minerals. May 2003. 93-99. 2003. Crown Copyright. Published byFood Standards Agency. ISBN 1-904026-11-7. Internet: http://www.food.gov.uk/multimedia/pdfs/vitmin2003.pdf (accessed 1 July 2003).
15. Juhlin L, Olsson MJ. Improvement of vitiligo after oral treatment withvitamin B12 and folic acid and the importance of sun exposure. ActaDerm Venereol 1997;77:460–2.
16. Ryan AA. Medication compliance and older people: a review of theliterature. Int J Nurs Stud 1999;36:153–62.
17. de Groot CP, van den Broek T, van Staveren W. Energy intake andmicronutrient intake in elderly Europeans: seeking the minimum re-quirement in the SENECA study. Age Aging 1999;28:469–74.
18. Herbert V, Bigaouette J. Call for endorsement of a petition to the Foodand Drug Administration to always add vitamin B-12 to any folatefortification or supplement. Am J Clin Nutr 1997;65:572–3.
19. Oakley GPJ. Let’s increase folic acid fortification and include vitaminB-12. Am J Clin Nutr 1997;65:1889–90.
20. Hirsch S, de la Maza P, Barrera G, Gattas V, Petermann M, Bunout D.The Chilean flour folic acid fortification program reduces serum homo-cysteine levels and masks vitamin B-12 deficiency in elderly people. JNutr 2002;132:289–91.
21. Ray JG, Cole DE, Boss SC. An Ontario-wide study of vitamin B12,serum folate, and red cell folate levels in relation to plasma homocys-teine: is a preventable public health issue on the rise? Clin Biochem2000;33:337–43.
22. Ray JG, Vermeulen MJ, Langman LJ, Boss SC, Cole DE. Persistence ofvitamin B12 insufficiency among elderly women after folic acid foodfortification. Clin Biochem 2003;36:387–91.
23. Russell RM, Baik HW, Kehayias JJ. Older men and women efficientlyabsorb B-12 from milk and fortified bread. J Nutr 2001;131:291–3.
24. George-Gay B, Parker K. Understanding the complete blood count withdifferential. J Perianesth Nurs 2003;18:96–114.
25. Helleman PW, De Nooij EH, Overbeeke MAM, Akkerman JWN, Nieu-wenhuis HK. Hematologie. (Hematology.) Houten, Netherlands: BohnStafleu Van Loghum, 1991(in Dutch).
26. Homocysteine Lowering Trialists’ Collaboration. Lowering blood ho-mocysteine with folic acid based supplements: meta-analysis of random-ised trials. BMJ 1998;316:894–8.
27. Quinlivan EP, McPartlin J, McNulty H, et al. Importance of both folic
COBALAMIN-FORTIFIED MILK AND COBALAMIN CAPSULES 573

acid and vitamin B12 in reduction of risk of vascular disease. Lancet2002;359:227–8.
28. Loikas S, Lopponen M, Suominen P, et al. RIA for serum holo-transco-balamin: method evaluation in the clinical laboratory and referenceinterval. Clin Chem 2003;49:455–62.
29. Nexo E, Hvas AM, Bleie O, et al. Holo-transcobalamin is an early markerof changes in cobalamin homeostasis. A randomized placebo-controlledstudy. Clin Chem 2002;48:1768–71.
30. Hattersley PG, Engels JL. Neutrophilic hypersegmentation withoutmacrocytic anemia. West J Med 1974;121:179–84.
31. Hathcock JN, Troendle GJ. Oral cobalamin for treatment of perniciousanemia? JAMA 1991;265:96–7.
32. Carmel R. Prevalence of undiagnosed pernicious anemia in the elderly.Arch Intern Med 1996;156:1097–100.
33. Nexo E, Christensen AL, Petersen TE, Fedosov SN. Measurement oftranscobalamin by ELISA. Clin Chem 2000;46:1643–9.
34. Baik HW, Russell RM. Vitamin B12 deficiency in the elderly. Annu RevNutr 1999;19:357–77.
35. Carmel R. Cobalamin, the stomach, and aging. Am J Clin Nutr 1997;66:750–9.
36. Andres E, Kaltenbach G, Noel E, et al. Efficacy of short-term oralcobalamin therapy for the treatment of cobalamin deficiencies related tofood-cobalamin malabsorption: a study of 30 patients. Clin Lab Haema-tol 2003;25:161–6.
37. Doscherholmen A. Inhibition by raw eggs of vitamin B12 absorption.JAMA 1978;240:2045.
38. Resultaten van de Voedselconsumptie peiling 1997-1998. Den Haag,Netherlands: Voedingscentrum 1998 (in Dutch).
574 DHONUKSHE-RUTTEN ET AL
Association between serum concentrations of 25-hydroxyvitamin Dand gingival inflammation1–3
Thomas Dietrich, Martha Nunn, Bess Dawson-Hughes, and Heike A Bischoff-Ferrari
ABSTRACTBackground: Vitamin D has been shown to have immunomodula-tory effects in in vitro and in animal studies. However, data fromclinical studies of inflammatory diseases are scarce.Objective: The purpose of this study was to evaluate the associationbetween serum concentrations of 25-hydroxyvitamin D [25(OH)D]and gingival inflammation.Design: We analyzed data from 77 503 gingival units (teeth) in 6700never smokers aged 13 to �90 y from the third National Health andNutrition Examination Survey. Multiple logistic regression modelsadjusted for subject- and site-specific covariates included age, sex,race-ethnicity, income, body mass index, diabetes, use of oral con-traceptives and hormone replacement therapy among women, intakeof vitamin C, missing teeth, full crown coverage, presence of calcu-lus, frequency of dental visits, and dental examiner and survey phase.Generalized estimating equations were used to account for corre-lated observations within subjects.Results: Compared with sites in subjects in the lowest 25(OH)Dquintile, sites in subjects in the highest 25(OH)D quintile were 20%(95% CI: 8%, 31%) less likely to bleed on gingival probing (P fortrend � 0.001). The association appeared to be linear over the entire25(OH)D range, was consistent across racial or ethnic groups, andwas similar among men and women as well as among users andnonusers of vitamin and mineral supplements.Conclusions: Vitamin D may reduce susceptibility to gingival in-flammation through its antiinflammatory effects. Gingivitis may bea useful clinical model to evaluate the antiinflammatory effects ofvitamin D. Am J Clin Nutr 2005;82:575–80.
KEY WORDS 25-Hydroxyvitamin D, inflammatory disease,gingivitis, periodontal disease
INTRODUCTION
Vitamin D plays an important role in calcium homeostasis andis essential for bone growth and preservation. More recently,antiinflammatory effects of vitamin D have been described. 1,25-Dihydroxyvitamin D3 [1,25(OH)2D3] was shown to inhibitantigen-induced T cell proliferation and cytokine production (1,2). In animal studies, beneficial effects of vitamin D and itsanalogues were found for various autoimmune diseases (3). Inepidemiologic studies inverse associations between intake ofvitamin D and incidence of multiple sclerosis (4) and type 1diabetes (5) have been documented. However, evidence for theantiinflammatory effect of vitamin D from clinical studies inhumans is scarce (6, 7). Consequently, it is unknown whether
vitamin D exerts antiinflammatory effects relevant to humandisease. Furthermore, little is known about the range of serumconcentrations of 25-hydroxyvitamin D [25(OH)D] that mayhave antiinflammatory effects in humans.
Some studies have suggested that vitamin D may have bene-ficial effects on periodontal disease and tooth loss, possibly be-cause of its antiinflammatory effects (8, 9). Another commondental health problem, prevalent across all ages, is chronic mar-ginal gingivitis, a chronic inflammation of the gingival tissuesthat is induced by bacterial dental plaque. In susceptible patients,this gingival inflammation may eventually lead to the destructionof periodontal ligament and alveolar bone and may thus evolveinto periodontal disease. However, the development of marginalgingivitis itself is unrelated to the underlying bone, and anyassociation between vitamin D status and marginal gingivitismust, therefore, be unrelated to the effects of vitamin D on bone.The susceptibility to gingivitis shows considerable interindi-vidual variation and can be readily assessed with the use of anexperimental gingivitis model (10, 11). Thus, marginal gingivitiscould be a useful model to evaluate specifically the antiinflam-matory effects of vitamin D in humans. However, whether25(OH)D serum concentrations are associated with gingivitissusceptibility has not been investigated.
The purpose of the present study was to evaluate whether anassociation exists between serum concentrations of 25(OH)Dand gingival inflammation in a large sample of the civilian,noninstitutionalized US population [third National Health andNutrition Examination Survey (NHANES III)] aged 13 to �90 y.If so, we evaluated whether an identifiable threshold concentra-tion exists above which no association can be observed.
1 From the Department of Health Policy and Health Services Research,Boston University Goldman School of Dental Medicine, Boston, MA (TDand MN); the Jean Mayer US Department of Agriculture Human NutritionResearch Center on Aging, Tufts University, Boston, MA (BD-H); and theDivisions of Aging and Rheumatology, Immunology, and Allergy, Brighamand Women’s Hospital, Boston, MA (HAB-F).
2 Supported by grants K24 DE00419 and U54 DE14264 from the NationalInstitutes of Health.
3 Reprints not available. Address correspondence to T Dietrich, Depart-ment of Health Policy and Health Services Research, Department of Peri-odontology and Oral Biology, Boston University Goldman School of DentalMedicine, 715 Albany Street, 560, Boston, MA 02118. E-mail:[email protected]
Received January 27, 2005.Accepted for publication May 18, 2005.
575Am J Clin Nutr 2005;82:575–80. Printed in USA. © 2005 American Society for Clinical Nutrition
SUBJECTS AND METHODS
Data source
Data were derived from NHANES III, which was conductedbetween 1988 and 1994 to assess the health and nutrition of alarge representative sample of the civilian, noninstitutionalizedUS population. The survey was designed as a complex, multi-stage, stratified, clustered sample survey. A detailed descriptionof the survey and the oral health component can be found else-where (12). Furthermore, detailed analyses on the periodontalhealth of the NHANES III population have been previously pub-lished (13, 14).
Assessment of 25-hydroxyvitamin D status
Venous blood samples were taken in a standardized fashion.Serum concentrations of 25(OH)D were assayed with a radio-immunoassay kit (Dia-Sorin, Stillwater, MN) (15). The refer-ence range for the assay is 22.5–94 nmol/L and was establishedin healthy, predominantly white volunteers in the midwesternUnited States in October, when 25(OH)D concentrations areexpected to be lower than those reported in the present study.
Dental assessments
Periodontal indexes were assessed in 2 randomly selectedupper and lower quadrants on fully erupted teeth other thanwisdom teeth by trained examiners in subjects aged �13 y. Forassessment of gingival inflammation, a periodontal probe wasinserted �2 mm into the gingival sulcus and then gently movedinto the mesial interproximal area. Gingival bleeding on thisstimulus (ie, bleeding on probing) was scored as a dichotomousvariable at each site (bleeding present or absent). Bleeding fromthe gingival sulcus on gentle probing with a periodontal probe(bleeding on probing) is a specific symptom of chronic gingivitisand widely used in clinical dental practice and dental research(16). In addition, the examiner recorded calculus (yes or no),probing pocket depth (in mm), clinical attachment level (in mm),full artificial crown coverage (yes or no), and number of teeth.Details of the extensive quality-control and quality-assuranceprotocol in the oral component of NHANES III, including reli-ability statistics for selected periodontal indexes, have been pub-lished previously (12, 17).
Data on covariates
Participants were administered several structured interviews,both at home and in the mobile examination center. Respondentswere classified as never smokers if they had smoked �100 cig-arettes in their lifetime. Furthermore, serum cotinine concentra-tions were determined with the use of an enzyme immunoassayand a liquid chromatography mass spectrometry method (15).
The poverty-to-income ratio was computed as the ratio offamily income compared with the poverty threshold as publishedannually by the Census Bureau. Missing values for the poverty-to-income ratio were coded as missing.
Furthermore, subjects were classified according to any use ofmultivitamin and mineral supplements in the preceding month(aged �17 y only), diabetes, and frequency of visits to the dentistor dental hygienist. In addition, female respondents were classi-fied according to use of oral contraceptives, hormone replace-ment therapy, or both. Vitamin C intake was calculated from a
24-h dietary recall. Finally, body mass index (BMI) was calcu-lated from measured height and weight.
Statistical analysis
We conducted a tooth-specific analysis with mesiobuccal sitesas the unit of analysis. This approach allowed us to adjust forimportant site-specific covariates that are strong predictors ofgingival bleeding (calculus and full crown coverage). To restrictthe analysis to sites with marginal gingivitis, we excluded siteswith clinical attachment loss � 2 mm (ie, bone loss resultingfrom periodontal disease). Furthermore, because smokingsuppresses the bleeding response of the gingival tissues (18,19), the analysis was restricted to subjects who reported to benever smokers and who had serum cotinine concentrations �15 ng/mL.
Descriptive statistics for covariates by quintiles of 25(OH)Dconcentrations were calculated with the subject as the unit ofanalysis. As suggested by a reviewer, P values for crude associ-ations between covariates and 25(OH)D quintiles were calcu-lated with the use of analysis of variance and chi-square statistics.
A multiple logistic regression model was fit to examine theassociation between gingival bleeding and serum concentrationsof 25(OH)D . To account for the dependence of observations(sites) within subjects, generalized estimating equation marginalmodels with an exchangeable working correlation were used.Serum concentrations of 25(OH)D were categorized accordingto quintiles. In addition, 25(OH)D concentration was entered asa continuous variable to perform trend tests. The final modeladjusted for age (continuous), sex, race-ethnicity (non-Hispanicwhites, non-Hispanic blacks, Mexican Americans, other),poverty-to-income ratio (continuous), BMI (continuous), diabe-tes (yes or no), use of oral contraceptives or hormone replace-ment therapy among women (never, former, current, missing),intake of vitamin C (continuous), number of missing teeth (con-tinuous), calculus (yes or no), full crown coverage (yes or no),and frequency of dental visits (less than once per year, at leastonce per year, missing). These variables were adjusted to accountfor known predictors of gingivitis (eg, calculus) and known mod-ulators of gingivitis expression [eg, estrogens (20), diabetes (21,22), intake of vitamin C (23)]. We further adjusted for dentalexaminer and survey phase (24).
Race or ethnicity, sex, and age were a priori considered aspotentially important effect measure modifiers. We conductedformal tests of interaction by entering interaction terms in themodel and also compared effect estimates from stratified analy-ses. We also compared effect estimates in supplement users andnonusers. Finally, deciles of 25(OH)D concentrations were en-tered into the main model to explore the dose-response relationmore closely. All analyses were performed with the use ofSTATA 7.0 (Stata Corp, College Station, TX).
RESULTS
There was a total of 6809 never smokers aged 13 to �90 yearswith 25(OH)D serum concentrations and periodontal data avail-able with complete data on covariates. Of them, 109 subjects hadno teeth with attachment loss � 2 mm. Thus, the final sampleconsisted of 77 503 mesiobuccal sites (teeth) in 6700 subjects(2448 men and 4252 women). Women are overrepresented in thissample because of the restriction to never smokers.
576 DIETRICH ET AL
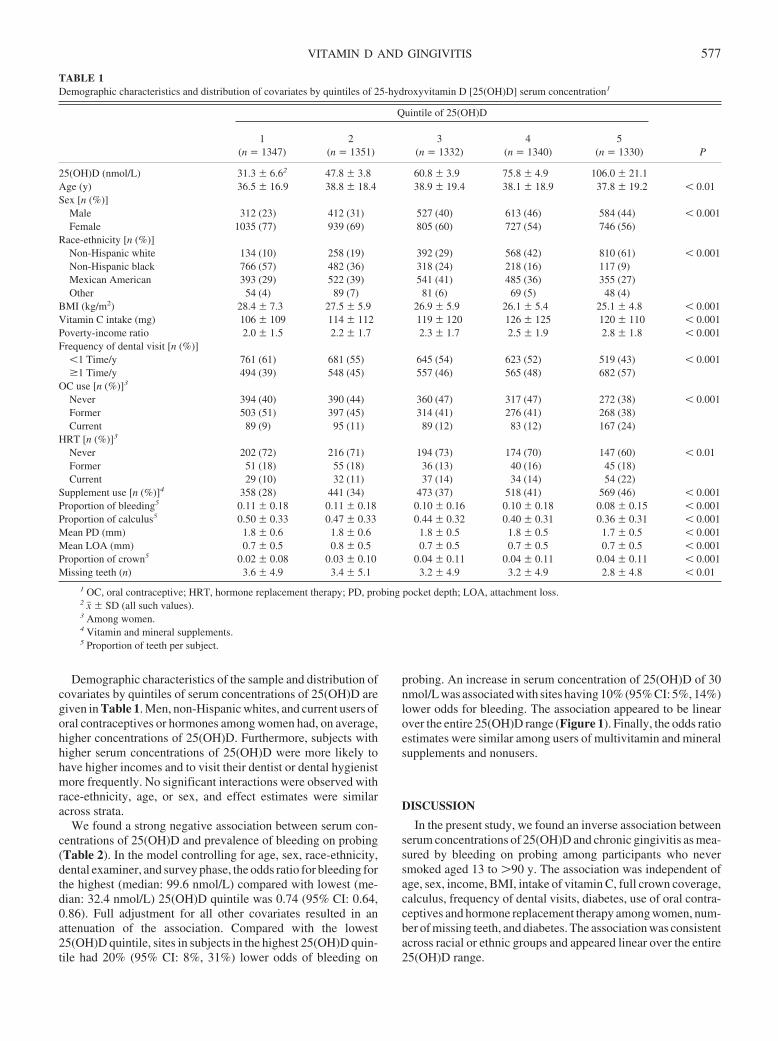
Demographic characteristics of the sample and distribution ofcovariates by quintiles of serum concentrations of 25(OH)D aregiven in Table 1. Men, non-Hispanic whites, and current users oforal contraceptives or hormones among women had, on average,higher concentrations of 25(OH)D. Furthermore, subjects withhigher serum concentrations of 25(OH)D were more likely tohave higher incomes and to visit their dentist or dental hygienistmore frequently. No significant interactions were observed withrace-ethnicity, age, or sex, and effect estimates were similaracross strata.
We found a strong negative association between serum con-centrations of 25(OH)D and prevalence of bleeding on probing(Table 2). In the model controlling for age, sex, race-ethnicity,dental examiner, and survey phase, the odds ratio for bleeding forthe highest (median: 99.6 nmol/L) compared with lowest (me-dian: 32.4 nmol/L) 25(OH)D quintile was 0.74 (95% CI: 0.64,0.86). Full adjustment for all other covariates resulted in anattenuation of the association. Compared with the lowest25(OH)D quintile, sites in subjects in the highest 25(OH)D quin-tile had 20% (95% CI: 8%, 31%) lower odds of bleeding on
probing. An increase in serum concentration of 25(OH)D of 30nmol/L was associated with sites having 10% (95% CI: 5%, 14%)lower odds for bleeding. The association appeared to be linearover the entire 25(OH)D range (Figure 1). Finally, the odds ratioestimates were similar among users of multivitamin and mineralsupplements and nonusers.
DISCUSSION
In the present study, we found an inverse association betweenserum concentrations of 25(OH)D and chronic gingivitis as mea-sured by bleeding on probing among participants who neversmoked aged 13 to �90 y. The association was independent ofage, sex, income, BMI, intake of vitamin C, full crown coverage,calculus, frequency of dental visits, diabetes, use of oral contra-ceptives and hormone replacement therapy among women, num-ber of missing teeth, and diabetes. The association was consistentacross racial or ethnic groups and appeared linear over the entire25(OH)D range.
TABLE 1Demographic characteristics and distribution of covariates by quintiles of 25-hydroxyvitamin D [25(OH)D] serum concentration1
Quintile of 25(OH)D
P1
(n � 1347)2
(n � 1351)3
(n � 1332)4
(n � 1340)5
(n � 1330)
25(OH)D (nmol/L) 31.3 � 6.62 47.8 � 3.8 60.8 � 3.9 75.8 � 4.9 106.0 � 21.1Age (y) 36.5 � 16.9 38.8 � 18.4 38.9 � 19.4 38.1 � 18.9 37.8 � 19.2 � 0.01Sex [n (%)]
Male 312 (23) 412 (31) 527 (40) 613 (46) 584 (44) � 0.001Female 1035 (77) 939 (69) 805 (60) 727 (54) 746 (56)
Race-ethnicity [n (%)]Non-Hispanic white 134 (10) 258 (19) 392 (29) 568 (42) 810 (61) � 0.001Non-Hispanic black 766 (57) 482 (36) 318 (24) 218 (16) 117 (9)Mexican American 393 (29) 522 (39) 541 (41) 485 (36) 355 (27)Other 54 (4) 89 (7) 81 (6) 69 (5) 48 (4)
BMI (kg/m2) 28.4 � 7.3 27.5 � 5.9 26.9 � 5.9 26.1 � 5.4 25.1 � 4.8 � 0.001Vitamin C intake (mg) 106 � 109 114 � 112 119 � 120 126 � 125 120 � 110 � 0.001Poverty-income ratio 2.0 � 1.5 2.2 � 1.7 2.3 � 1.7 2.5 � 1.9 2.8 � 1.8 � 0.001Frequency of dental visit [n (%)]
�1 Time/y 761 (61) 681 (55) 645 (54) 623 (52) 519 (43) � 0.001�1 Time/y 494 (39) 548 (45) 557 (46) 565 (48) 682 (57)
OC use [n (%)]3
Never 394 (40) 390 (44) 360 (47) 317 (47) 272 (38) � 0.001Former 503 (51) 397 (45) 314 (41) 276 (41) 268 (38)Current 89 (9) 95 (11) 89 (12) 83 (12) 167 (24)
HRT [n (%)]3
Never 202 (72) 216 (71) 194 (73) 174 (70) 147 (60) � 0.01Former 51 (18) 55 (18) 36 (13) 40 (16) 45 (18)Current 29 (10) 32 (11) 37 (14) 34 (14) 54 (22)
Supplement use [n (%)]4 358 (28) 441 (34) 473 (37) 518 (41) 569 (46) � 0.001Proportion of bleeding5 0.11 � 0.18 0.11 � 0.18 0.10 � 0.16 0.10 � 0.18 0.08 � 0.15 � 0.001Proportion of calculus5 0.50 � 0.33 0.47 � 0.33 0.44 � 0.32 0.40 � 0.31 0.36 � 0.31 � 0.001Mean PD (mm) 1.8 � 0.6 1.8 � 0.6 1.8 � 0.5 1.8 � 0.5 1.7 � 0.5 � 0.001Mean LOA (mm) 0.7 � 0.5 0.8 � 0.5 0.7 � 0.5 0.7 � 0.5 0.7 � 0.5 � 0.001Proportion of crown5 0.02 � 0.08 0.03 � 0.10 0.04 � 0.11 0.04 � 0.11 0.04 � 0.11 � 0.001Missing teeth (n) 3.6 � 4.9 3.4 � 5.1 3.2 � 4.9 3.2 � 4.9 2.8 � 4.8 � 0.01
1 OC, oral contraceptive; HRT, hormone replacement therapy; PD, probing pocket depth; LOA, attachment loss.2 x� � SD (all such values).3 Among women.4 Vitamin and mineral supplements.5 Proportion of teeth per subject.
VITAMIN D AND GINGIVITIS 577
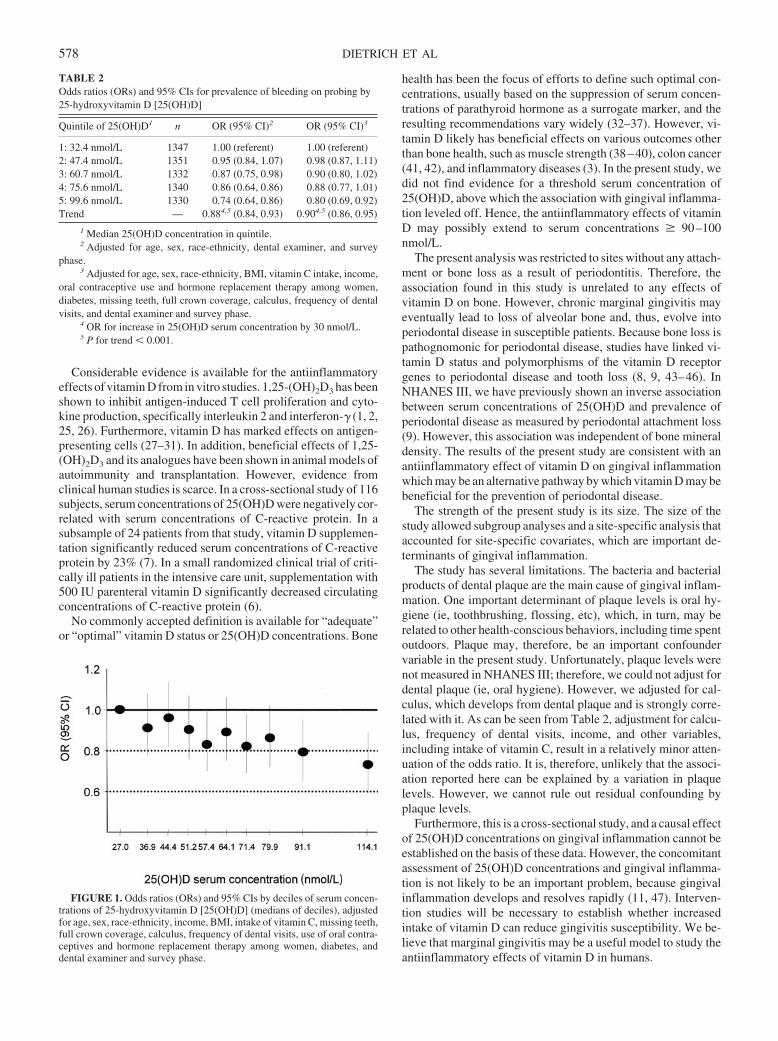
Considerable evidence is available for the antiinflammatoryeffects of vitamin D from in vitro studies. 1,25-(OH)2D3 has beenshown to inhibit antigen-induced T cell proliferation and cyto-kine production, specifically interleukin 2 and interferon-� (1, 2,25, 26). Furthermore, vitamin D has marked effects on antigen-presenting cells (27–31). In addition, beneficial effects of 1,25-(OH)2D3 and its analogues have been shown in animal models ofautoimmunity and transplantation. However, evidence fromclinical human studies is scarce. In a cross-sectional study of 116subjects, serum concentrations of 25(OH)D were negatively cor-related with serum concentrations of C-reactive protein. In asubsample of 24 patients from that study, vitamin D supplemen-tation significantly reduced serum concentrations of C-reactiveprotein by 23% (7). In a small randomized clinical trial of criti-cally ill patients in the intensive care unit, supplementation with500 IU parenteral vitamin D significantly decreased circulatingconcentrations of C-reactive protein (6).
No commonly accepted definition is available for “adequate”or “optimal” vitamin D status or 25(OH)D concentrations. Bone
health has been the focus of efforts to define such optimal con-centrations, usually based on the suppression of serum concen-trations of parathyroid hormone as a surrogate marker, and theresulting recommendations vary widely (32–37). However, vi-tamin D likely has beneficial effects on various outcomes otherthan bone health, such as muscle strength (38–40), colon cancer(41, 42), and inflammatory diseases (3). In the present study, wedid not find evidence for a threshold serum concentration of25(OH)D, above which the association with gingival inflamma-tion leveled off. Hence, the antiinflammatory effects of vitaminD may possibly extend to serum concentrations � 90–100nmol/L.
The present analysis was restricted to sites without any attach-ment or bone loss as a result of periodontitis. Therefore, theassociation found in this study is unrelated to any effects ofvitamin D on bone. However, chronic marginal gingivitis mayeventually lead to loss of alveolar bone and, thus, evolve intoperiodontal disease in susceptible patients. Because bone loss ispathognomonic for periodontal disease, studies have linked vi-tamin D status and polymorphisms of the vitamin D receptorgenes to periodontal disease and tooth loss (8, 9, 43–46). InNHANES III, we have previously shown an inverse associationbetween serum concentrations of 25(OH)D and prevalence ofperiodontal disease as measured by periodontal attachment loss(9). However, this association was independent of bone mineraldensity. The results of the present study are consistent with anantiinflammatory effect of vitamin D on gingival inflammationwhich may be an alternative pathway by which vitamin D may bebeneficial for the prevention of periodontal disease.
The strength of the present study is its size. The size of thestudy allowed subgroup analyses and a site-specific analysis thataccounted for site-specific covariates, which are important de-terminants of gingival inflammation.
The study has several limitations. The bacteria and bacterialproducts of dental plaque are the main cause of gingival inflam-mation. One important determinant of plaque levels is oral hy-giene (ie, toothbrushing, flossing, etc), which, in turn, may berelated to other health-conscious behaviors, including time spentoutdoors. Plaque may, therefore, be an important confoundervariable in the present study. Unfortunately, plaque levels werenot measured in NHANES III; therefore, we could not adjust fordental plaque (ie, oral hygiene). However, we adjusted for cal-culus, which develops from dental plaque and is strongly corre-lated with it. As can be seen from Table 2, adjustment for calcu-lus, frequency of dental visits, income, and other variables,including intake of vitamin C, result in a relatively minor atten-uation of the odds ratio. It is, therefore, unlikely that the associ-ation reported here can be explained by a variation in plaquelevels. However, we cannot rule out residual confounding byplaque levels.
Furthermore, this is a cross-sectional study, and a causal effectof 25(OH)D concentrations on gingival inflammation cannot beestablished on the basis of these data. However, the concomitantassessment of 25(OH)D concentrations and gingival inflamma-tion is not likely to be an important problem, because gingivalinflammation develops and resolves rapidly (11, 47). Interven-tion studies will be necessary to establish whether increasedintake of vitamin D can reduce gingivitis susceptibility. We be-lieve that marginal gingivitis may be a useful model to study theantiinflammatory effects of vitamin D in humans.
FIGURE 1. Odds ratios (ORs) and 95% CIs by deciles of serum concen-trations of 25-hydroxyvitamin D [25(OH)D] (medians of deciles), adjustedfor age, sex, race-ethnicity, income, BMI, intake of vitamin C, missing teeth,full crown coverage, calculus, frequency of dental visits, use of oral contra-ceptives and hormone replacement therapy among women, diabetes, anddental examiner and survey phase.
TABLE 2Odds ratios (ORs) and 95% CIs for prevalence of bleeding on probing by25-hydroxyvitamin D [25(OH)D]
Quintile of 25(OH)D1 n OR (95% CI)2 OR (95% CI)3
1: 32.4 nmol/L 1347 1.00 (referent) 1.00 (referent)2: 47.4 nmol/L 1351 0.95 (0.84, 1.07) 0.98 (0.87, 1.11)3: 60.7 nmol/L 1332 0.87 (0.75, 0.98) 0.90 (0.80, 1.02)4: 75.6 nmol/L 1340 0.86 (0.64, 0.86) 0.88 (0.77, 1.01)5: 99.6 nmol/L 1330 0.74 (0.64, 0.86) 0.80 (0.69, 0.92)Trend — 0.884,5 (0.84, 0.93) 0.904,5 (0.86, 0.95)
1 Median 25(OH)D concentration in quintile.2 Adjusted for age, sex, race-ethnicity, dental examiner, and survey
phase.3 Adjusted for age, sex, race-ethnicity, BMI, vitamin C intake, income,
oral contraceptive use and hormone replacement therapy among women,diabetes, missing teeth, full crown coverage, calculus, frequency of dentalvisits, and dental examiner and survey phase.
4 OR for increase in 25(OH)D serum concentration by 30 nmol/L.5 P for trend � 0.001.
578 DIETRICH ET AL
The results of the present study suggest that increased serumconcentrations of vitamin D may be beneficial in regard to gin-givitis susceptibility. This inverse association may be due to theantiinflammatory effect of vitamin D, which may be present inserum concentrations of 25(OH)D � 90–100 nmol/L.
The analysis was planned by TD. TD conducted the analysis with contri-butions by MN. All authors evaluated the results and contributed to theirinterpretation. TD wrote the manuscript with input from all other authors.None of the authors had a conflict of interest.
REFERENCES1. Bhalla AK, Amento EP, Serog B, Glimcher LH. 1,25-Dihydroxyvitamin
D3 inhibits antigen-induced T cell activation. J Immunol 1984;133:1748–54.
2. Rigby WF, Denome S, Fanger MW. Regulation of lymphokine produc-tion and human T lymphocyte activation by 1,25-dihydroxyvitamin D3.Specific inhibition at the level of messenger RNA. J Clin Invest 1987;79:1659–64.
3. Mathieu C, Adorini L. The coming of age of 1,25-dihydroxyvitaminD(3) analogs as immunomodulatory agents. Trends Mol Med 2002;8:174–9.
4. Munger KL, Zhang SM, O’Reilly E, et al. Vitamin D intake and inci-dence of multiple sclerosis. Neurology 2004;62:60–5.
5. Hypponen E, Laara E, Reunanen A, Jarvelin MR, Virtanen SM. Intakeof vitamin D and risk of type 1 diabetes: a birth-cohort study. Lancet2001;358:1500–3.
6. Van den Berghe G, Van Roosbroeck D, Vanhove P, Wouters PJ, DePourcq L, Bouillon R. Bone turnover in prolonged critical illness: effectof vitamin D. J Clin Endocrinol Metab 2003;88:4623–32.
7. Timms PM, Mannan N, Hitman GA, et al. Circulating MMP9, vitaminD and variation in the TIMP-1 response with VDR genotype: mecha-nisms for inflammatory damage in chronic disorders? Q J Med 2002;95:787–96.
8. Krall EA, Wehler C, Garcia RI, Harris SS, Dawson-Hughes B. Calciumand vitamin D supplements reduce tooth loss in the elderly. Am J Med2001;111:452–6.
9. Dietrich T, Joshipura KJ, Dawson-Hughes B, Bischoff-Ferrari HA. As-sociation between serum concentrations of 25-hydroxyvitamin D3 andperiodontal disease in the US population. Am J Clin Nutr 2004;80:108–13.
10. Loe H, Theilade E, Jensen SB. Experimental gingivitis in man. J Peri-odontol 1965;36:177–87.
11. Trombelli L, Tatakis DN, Scapoli C, Bottega S, Orlandini E, Tosi M.Modulation of clinical expression of plaque-induced gingivitis. II. Iden-tification of “high-responder” and “low-responder” subjects. J Clin Peri-odontol 2004;31:239–52.
12. Drury TF, Winn DM, Snowden CB, Kingman A, Kleinman DV, LewisB. An overview of the oral health component of the 1988–1991 NationalHealth and Nutrition Examination Survey (NHANES III-Phase 1). JDent Res 1996;75 Spec No:620–30.
13. Albandar JM, Kingman A. Gingival recession, gingival bleeding, anddental calculus in adults 30 years of age and older in the United States,1988–1994. J Periodontol 1999;70:30–43.
14. Tomar SL, Asma S. Smoking-attributable periodontitis in the UnitedStates: findings from NHANES III. National Health and Nutrition Ex-amination Survey. J Periodontol 2000;71:743–51.
15. Gunter EW, Lewis BL, Konkikowski SM. Laboratory methods used forthe third National Health and Nutrition Examination Survey (NHANESII), 1988-1994 (CD-ROM). Hyattsville, MD: Centers for Disease Con-trol and Prevention, 1996.
16. Newbrun E. Indices to measure gingival bleeding. J Periodontol 1996;67:555–61.
17. Brown LJ, Brunelle JA, Kingman A. Periodontal status in the UnitedStates, 1988–1991: prevalence, extent, and demographic variation. JDent Res 1996;75 Spec No:672–83.
18. Bergstrom J, Preber H. The influence of cigarette smoking on thedevelopment of experimental gingivitis. J Periodontal Res 1986;21:668 –76.
19. Dietrich T, Bernimoulin J-P, Glynn RJ. The effect of smoking on gin-gival bleeding. J Periodontol 2004;75:10–6.
20. Sooriyamoorthy M, Gower DB. Hormonal influences on gingivaltissue: relationship to periodontal disease. J Clin Periodontol 1989;16:201– 8.
21. Hugoson A, Thorstensson H, Falk H, Kuylenstierna J. Periodontalconditions in insulin-dependent diabetics. J Clin Periodontol 1989;16:215–23.
22. Cutler CW, Machen RL, Jotwani R, Iacopino AM. Heightened gingivalinflammation and attachment loss in type 2 diabetics with hyperlipid-emia. J Periodontol 1999;70:1313–21.
23. Leggott PJ, Robertson PB, Jacob RA, Zambon JJ, Walsh M, ArmitageGC. Effects of ascorbic acid depletion and supplementation on periodon-tal health and subgingival microflora in humans. J Dent Res 1991;70:1531–6.
24. Slade GD, Beck JD. Plausibility of periodontal disease estimates fromNHANES III. J Public Health Dent 1999;59:67–72.
25. Takeuchi A, Reddy GS, Kobayashi T, Okano T, Park J, Sharma S.Nuclear factor of activated T cells (NFAT) as a molecular target for1alpha,25-dihydroxyvitamin D3-mediated effects. J Immunol1998;160:209–18.
26. Alroy I, Towers TL, Freedman LP. Transcriptional repression of theinterleukin-2 gene by vitamin D3: direct inhibition of NFATp/AP-1complex formation by a nuclear hormone receptor. Mol Cell Biol 1995;15:5789–99.
27. Piemonti L, Monti P, Sironi M, et al. Vitamin D3 affects differentiation,maturation, and function of human monocyte-derived dendritic cells.J Immunol 2000;164:4443–51.
28. Penna G, Adorini L. 1 Alpha,25-dihydroxyvitamin D3 inhibits differ-entiation, maturation, activation, and survival of dendritic cells leadingto impaired alloreactive T cell activation. J Immunol 2000;164:2405–11.
29. Griffin MD, Lutz WH, Phan VA, et al. Potent inhibition of dendritic celldifferentiation and maturation by vitamin D analogs. Biochem BiophysRes Commun 2000;270:701–8.
30. D’Ambrosio D, Cippitelli M, Cocciolo MG, et al. Inhibition of IL-12production by 1,25-dihydroxyvitamin D3. Involvement of NF-kappaBdownregulation in transcriptional repression of the p40 gene. J ClinInvest 1998;101:252–62.
31. Berer A, Stockl J, Majdic O, et al. 1,25-Dihydroxyvitamin D(3) inhibitsdendritic cell differentiation and maturation in vitro. Exp Hematol 2000;28:575–83.
32. Lips P, Wiersinga A, van Ginkel FC, et al. The effect of vitamin Dsupplementation on vitamin D status and parathyroid function in elderlysubjects. J Clin Endocrinol Metab 1988;67:644–50.
33. Malabanan A, Veronikis IE, Holick MF. Redefining vitamin D insuffi-ciency. Lancet 1998;351:805–6.
34. Peacock M. Effects of calcium and vitamin D insufficiency on the skel-eton. Osteoporos Int 1998;8:S45–51.
35. Chapuy MC, Preziosi P, Maamer M, et al. Prevalence of vitamin Dinsufficiency in an adult normal population. Osteoporos Int 1997;7:439 – 43.
36. Dawson-Hughes B, Harris SS, Dallal GE. Plasma calcidiol, season, andserum parathyroid hormone concentrations in healthy elderly men andwomen. Am J Clin Nutr 1997;65:67–71.
37. Krall EA, Sahyoun N, Tannenbaum S, Dallal GE, Dawson-Hughes B.Effect of vitamin D intake on seasonal variations in parathyroid hormonesecretion in postmenopausal women. N Engl J Med 1989;321:1777–83.
38. Boland R. Role of vitamin D in skeletal muscle function. Endocr Rev1986;7:434–47.
39. Glerup H, Mikkelsen K, Poulsen L, et al. Hypovitaminosis D myopathywithout biochemical signs of osteomalacic bone involvement. CalcifTissue Int 2000;66:419–24.
40. Visser M, Deeg DJ, Lips P. Low vitamin D and high parathyroid hor-mone levels as determinants of loss of muscle strength and muscle mass(sarcopenia): the Longitudinal Aging Study Amsterdam. J Clin Endo-crinol Metab 2003;88:5766–72.
41. Grau MV, Baron JA, Sandler RS, et al. Vitamin D, calcium supplemen-tation, and colorectal adenomas: results of a randomized trial. J NatlCancer Inst 2003;95:1765–71.
42. McCullough ML, Robertson AS, Rodriguez C, et al. Calcium, vita
VITAMIN D AND GINGIVITIS 579

min D, dairy products, and risk of colorectal cancer in the CancerPrevention Study II Nutrition Cohort (United States). Cancer CausesControl 2003;14:1–12.
43. Yoshihara A, Sugita N, Yamamoto K, Kobayashi T, Miyazaki H, Yo-shiH. Analysis of vitamin D and Fcgamma receptor polymorphisms inJapanese patients with generalized early-onset periodontitis. J Dent Res2001;80:2051–4.
44. Hennig BJ, Parkhill JM, Chapple IL, Heasman PA, Taylor JJ. Associa-tion of a vitamin D receptor gene polymorphism with localized early-onset periodontal diseases. J Periodontol 1999;70:1032–8.
45. Sun JL, Meng HX, Cao CF, et al. Relationship between vitamin Dreceptor gene polymorphism and periodontitis. J Periodontal Res 2002;37:263–7.
46. Inagaki K, Krall EA, Fleet JC, Garcia RI. Vitamin D receptor alleles,periodontal disease progression, and tooth loss in the VA dental longi-tudinal study. J Dent Res 2003;74:161–7.
47. Trombelli L, Scapoli C, Orlandini E, Tosi M, Bottega S, Tatakis DN.Modulation of clinical expression of plaque-induced gingivitis. III. Re-sponse of “high responders” and “low responders” to therapy. J ClinPeriodontol 2004;31:253–9.
580 DIETRICH ET AL
Lack of a relation between vitamin and mineral antioxidants andbone mineral density: results from the Women’s Health Initiative1–3
Randi L Wolf, Jane A Cauley, Mary Pettinger, Rebecca Jackson, Andrea Lacroix, Meryl S Leboff, Cora E Lewis,Michael C Nevitt, Joel A Simon, Katie L Stone, and Jean Wactawski-Wende
ABSTRACTBackground: Antioxidant defenses are one possible mechanism fordecreasing oxidative damage and its potentially negative effects onage-related bone mass.Objective: This study cross-sectionally examined whether higherdietary intakes, total intakes, and serum concentrations of antioxi-dants may be associated with higher bone mineral density (BMD).Design: Total hip (and subregions), spine, and total-body BMDswere measured in 11 068 women aged 50–79 y enrolled in theWomen’s Health Initiative Observational Study and Clinical Trial at3 clinics. Antioxidant intakes from diet (vitamin A, retinol,�-carotene, vitamin C, vitamin E, and selenium) were estimated byusing a self-reported food-frequency questionnaire. Antioxidantsfrom supplements were estimated with an interviewer-administeredquestionnaire. A random subset (n � 379) had serum concentrationsof retinol, carotenoids, and tocopherols measured.Results: After adjustment for important BMD-related covariates,increasing intakes of antioxidants were not independently associatedwith BMD. A significant interaction effect was observed betweenintake of total vitamin C (lower three-fourths compared with highestone-fourth) and use of hormone therapy (HT) (P � 0.01). The ben-eficial effect of current HT use on femoral neck BMD appeared to begreater in women with higher concentrations of total vitamin C. Thisinteraction was also significant for total-body (P � 0.045), spine(P � 0.03), and total-hip BMDs (P � 0.029).Conclusions: Our results do not support independent associationsbetween dietary intake, total intake, or serum concentrations of an-tioxidants and BMD in women participating in the Women’s HealthInitiative. The extent to which HT use may interact with vitamin Cintake and BMD warrants further exploration. Am J Clin Nutr2005;82:581–8.
KEY WORDS Antioxidants, diet, serum, bone mineral den-sity, osteoporosis, Women’s Health Initiative
INTRODUCTION
Osteoporosis, and its associated fractures, is a serious publichealth problem that affects the entire aging US population (1).More than 44 million women and men in the United States arenow estimated to have osteoporosis or low bone mass and thusare at risk of clinical fractures (2). Several dietary factors havebeen identified as being associated with bone mineral density(BMD), but most studies have focused attention on calcium in-take. Sufficient evidence exists that calcium is important for bone
health (3–13). However, the cause of osteoporosis is multifac-torial (14). Other dietary factors could be important in preventingosteoporosis.
Intake of antioxidants may influence BMD by acting as freeradical scavengers, possibly by reducing the effects of oxidativestress that may be associated with bone loss. To date, studies ofthe relation between antioxidants and BMD have received littleattention. If such relations exist, it may suggest alternative linesof investigation about the potential causes of, and ways to pre-vent, osteoporosis.
The purpose of this study was to investigate whether specificantioxidants were associated with BMD in women participatingin the Women’s Health Initiative (WHI). Shikany et al (15)reported that antioxidant supplements were widely consumed inWHI participants mostly through multivitamins. Use of singlesupplements of vitamin C and vitamin E were also popular inWHI participants, although the use of �-carotene supplementswas not. We were specifically interested in whether women withthe highest dietary intake, total intake (diet plus supplements), orserum concentrations of antioxidants were associated with thehighest BMD measurement. We considered hip, spine, and total-body bone mass. Because other investigations have describedpossible interactions among various antioxidants and calciumintake (16), smoking (17), and postmenopausal estrogen therapy(18) on BMD or fracture, we also were interested in exploringwhether these factors modified the association between antioxi-dants and BMD.
1 From the Program in Nutrition, Department of Health and BehaviorStudies, Teachers College, Columbia University, New York, NY (RLW); theDepartment of Epidemiology, Graduate School of Public Health, Universityof Pittsburgh, Pittsburgh, PA (JAC); the Fred Hutchinson Cancer ResearchCenter, Seattle, WA (MP and AL); The Ohio State University; Columbus,OH (RJ); the Department of Internal Medicine, Brigham and Women’sHospital, Boston, MA (MSL); the Division of Preventive Medicine, Depart-ment of Medicine, University of Alabama at Birmingham, Birmingham, AL(CEL); the Department of Epidemiology and Biostatistics, University ofCalifornia at San Francisco, San Francisco, CA (MCN, JAS, and KLS); theGeneral Internal Medicine Section, San Francisco VA Medical Center, SanFrancisco, CA (JAS); and the University of Buffalo, Buffalo, NY (JWW).
2 Supported by training grant no. 5T32AG000181-15 from the NationalInstitutes of Health.
3 Reprints not available. Address correspondence to RL Wolf, Departmentof Health and Behavior Studies, Teachers College, Columbia University, 525West 120th Street, Box 137, New York, NY 10027. E-mail: [email protected].
Received December 28, 2004.Accepted for publication May 27, 2005.
581Am J Clin Nutr 2005;82:581–8. Printed in USA. © 2005 American Society for Clinical Nutrition
SUBJECTS AND METHODS
Study population
The WHI is a multisite observational study and prevention trialthat focuses on reducing some of the most common causes ofmorbidity and mortality among postmenopausal women, includ-ing coronary artery disease, breast and colorectal cancers, andosteoporotic fractures. Participants were recruited at 40 US clin-ical centers into 3 randomized clinical trials and a longitudinalobservational study. Specifics of the study design and methodshave been described elsewhere (19). Here, we report baselinedata on a subsample of women enrolled in both the observationaland clinical trial studies at the 3 clinic sites (Pittsburgh, PA;Birmingham, AL; Tucson, AZ) that measured BMD. The BMDcenters were chosen to provide maximum racial diversity. Allprocedures were approved by the Institutional Review Board ateach center.
Sample selection
Our sample included 11 393 women aged 50–79 y recruitedfrom 1993 to 1997. All women had data collected as part of theWHI baseline procedures (ie, interviewer and self-administeredquestionnaires, physical measurements, and a fasting blooddraw). For this analysis, we excluded women taking oral glu-cocorticoids (n � 99), bisphosphonates (n � 155), calcitonin(n � 25), and tamoxifen (n � 53), leaving 11 068 participants.
Questionnaire and clinical measures
Baseline questionnaire data from the WHI included self-reported age, race, education, income, and health habits. Healthhabits included history of smoking (categorized as neversmoked, past smoker, and current smoker). Past smokers werethose who had smoked �100 cigarettes but were not currentlysmoking. History of alcohol intake was categorized as non-drinker, past drinker, and current drinker. Past drinkers werethose who had consumed �12 alcoholic beverages in their lifebut did not currently drink. Current drinkers were further clas-sified by current intake based on the sum of intake of beer, wine,and liquor, adjusted for portion size from the food-frequencyquestionnaire (FFQ). Coffee consumption was categorized bycurrent number of cups consumed per day. Current use of thia-zide diuretics and thyroid medications were categorized as yes orno. Use of postmenopausal hormone therapy (HT) (estrogen withor without progesterone) was categorized as current user andnever or former user. Total expenditure from physical activitywas assessed by questions on frequency and duration of 4 speedsof walking and of 3 other types of recreational activity classifiedby intensity (strenuous, moderate, or mild). Energy costs of thephysical activities were assigned with the use of a standardizedclassification (20) and were expressed as total metabolic equiv-alents per week (in kcal/wk � kg).
Diet intake was based on self-report with the use of a semi-quantitative FFQ that asked about frequency of consumptionover the past 3 mo and portion size of 122 foods or food groups.The FFQ also covered food preparation practices and added fats.Nutrients were calculated with the use of a database derived fromthe University of Minnesota Nutrition Coding Center (MINNE-SOTA NUTRITION DATA SYSTEM, version 30; Minneapo-lis, MN). Nutrients of interest for this analysis included vitaminA, retinol, �-carotene, vitamin C, vitamin E, and selenium. From
previously published studies (16–18, 21–23), covariates of in-terest from the FFQ were total energy intake, dietary fat, satu-rated fat, protein, magnesium, calcium, and vitamin D. Dietarysupplements were estimated by an interviewer-administered,computer-driven inventory of all nutritional supplements takenby the participant. Information was recorded on the nutrientsfrom multivitamin supplements and from individual supple-ments. Total intake of antioxidants was obtained by summing theintakes from diet plus supplements.
Clinical measures included weight and height. Weight wasmeasured in indoor clothes to the nearest 0.1 kg with the use ofa balance-beam scale. Height was recorded to the nearest 0.1 cmwith the use of a wall-mounted stadiometer and a standard ex-piration technique. Body mass index (BMI; in kg/m2) was cal-culated. Waist circumference was measured at the natural waistor narrowest part of the torso.
BMD of the total body, lumbar spine (L2–L4), and total hipwith subregions of the femoral neck and trochanter was measuredby dual X-ray absorptiometry (QDR 2000, 2000�, or 4500W;Hologic, Inc, Bedford, MA). Standard protocols for positioningand analysis were used by technologists who were trained andcertified by the bone densitometry reading center of the Univer-sity of California at San Francisco. The ongoing quality assur-ance program was similar to that used in other studies (24).
Blood measures
Serum antioxidant concentrations of retinol, �- and�-carotene, �- and �-tocopherol, �-cryptoxanthin, lycopene, lu-tein, and zeaxanthin were collected on a random subset of womenat baseline. Covariates of interest were total serum cholesteroland triacylglycerols because adjustment for these factors aresuggested as the appropriate measure of biologic status of vita-mins E and A (25). Six percent of women who enrolled in theclinical trial components of the WHI, and 1% of the observationalstudy participants (n � 379) were randomly selected to have theirblood analyzed for micronutrients. The random sampling proce-dure was stratified by clinical center, age, hysterectomy status,and ethnicity to oversample minority women. The methods andquality-control procedures for each blood measure are describedelsewhere (26).
Statistical methods
Descriptive statistics were conducted on all variables to eval-uate range, variance, frequencies, and normality of data. Exam-ination of skewness of the data, as well as the histograms, deter-mined which variables were to be mathematically transformed.Means and SDs are shown for continuous data. Frequencies andproportions are shown for categorical data. Correlation coeffi-cients (parametric or nonparametric) were calculated to deter-mine the direction and magnitude of the relations among dietaryintake, total intake, and serum concentrations of antioxidants.Scatterplots were evaluated for threshold effects between BMDand antioxidant concentrations.
Multiple linear regression analysis was used to examine therelation between dietary intake, total intake, and serum concen-trations of antioxidants as a continuous variable and BMD at thevarious sites. For analyses of dietary antioxidants from foodalone, we excluded participants who reported using supplemen-tal antioxidants, either from single supplements or multivitamins(�50% of subjects, n � 5607). Dietary intake and total intake
582 WOLF ET AL
were entered into multivariate models as continuous data andthen adjusted for age, BMI, waist circumference, race, education,income, alcohol consumption, coffee consumption, smoking sta-tus, clinic site, hormone use, thiazide use, thyroid medicationuse, physical activity, total caloric energy, dietary fat, dietarysaturated fat, dietary protein, dietary magnesium, total calcium,total vitamin D, and other antioxidants. Serum antioxidant con-centrations were entered into multivariate models as continuousdata and then adjusted for age, BMI, waist circumference, race,education, income, alcohol consumption, coffee consumption,smoking status, clinic, hormone use, thiazide use, thyroid med-ication use, physical activity, total caloric energy, and total serumcholesterol and triacylglycerol concentrations. In addition, wecreated 2 composite variables to study the relation of total serumcarotenoids (�- and �-carotene, �-cryptoxanthin, lycopene, lu-tein, and zeaxanthin) and total serum tocopherols (�-tocopherolplus �-tocopherol) to BMD.
Examination of select interactions between dietary intake, to-tal intake, and serum concentrations of antioxidants (mean forlower 3 quartiles compared with mean for upper quartile) andBMD were performed in 1) women reporting high (�500 mg/d)compared with low (�500 mg/d) intakes of calcium, 2) currentsmokers compared with never and past smokers, and 3) currentHT users compared with never and former HT users. We testedfor interactions between calcium intake, smoking status, andhormone therapy use by including cross-product terms in regres-sion models. Adjusted means are presented for BMD within eachcategory along with nominal P values for the interaction term.
Dietary and serum variables outside of plausible range weredeemed unreliable and treated as missing data. FFQ data wereexcluded from the analysis for participants with FFQ energyestimates of �600 kcal (n � 338) or �3500 kcal (n � 271) andfor participants with missing data (n � 27). All dietary nutrients(alone or with supplements) have been log-transformed. Tablespresent back-transformed values by using a standard approxima-tion formula for the SD.
All analyses were completed for each skeletal site for eachantioxidant for dietary intake, total intake, and serum concentra-tions. Results were similar, so we present only the results fromthe femoral neck BMD. Nominal two-sided P values are reportedfor all statistical tests. Because 22 statistical tests were performedfor each skeletal site, one test would be expected to be significantat the 0.05 level by chance. Analyses were performed by usingSAS (version 8.2; SAS Institute, Cary, NC).
RESULTS
Characteristics of the 11 068 women with data available forthese analyses are presented in Table 1. Women ranged in agefrom 50 to 79 y (x�: 63.2 y) with an average BMI of 28.3. Amongthe women, 4.8% were osteoporotic at the total hip because of aBMD t score � 2.5 SD below young normal (27). Participantswere from the WHI clinic sites in Pittsburgh, PA (31.7%), Bir-mingham, AL (33.2%), and Tucson, AZ (35.1%). The samplewas ethnically diverse with approximately one-fourth from mi-nority subgroups. Of the sample, 68.3% had education beyondhigh school. About one-fourth (25.9%) had family incomes�$50 000/y. The majority of women consumed �1 alcoholicdrink/wk (71.5%) and �1 cup coffee/d (57.1%). A low percent-age was current smokers or users of thiazide diuretics and thyroidmedications, whereas approximately one-third were currently
using postmenopausal HT. Average total intake of calcium (dietplus supplements) was 900.1 mg/d. On average, supplementalantioxidant users had mean total intakes that ranged 9.6% (sele-nium) to 272% (vitamin E) higher than mean dietary intakes ofnonsupplement users.
In analyses adjusted only for age, a significant and positiveassociation was observed among dietary intake of vitamin A(P � 0.0001), �-carotene (P � 0.003), retinol (P � 0.0001),vitamin C (P � 0.0007), vitamin E (P � 0.002), and selenium(P � 0.0001) and femoral neck BMD (Table 2). A significantand positive association was also observed among total intake ofvitamin A (P � 0.004), retinol (P � 0.002), and selenium (P �0.0001) and femoral neck BMD. A significant and negative as-sociation was observed among total intake of �-carotene (P �0.01), vitamin C (P � 0.0001), and vitamin E (P � 0.0001). Afteradjustment for important BMD-related covariates, we found nosignificant association at any of the BMD sites with vitamin A,retinol, vitamin C, vitamin E, or selenium when measuring di-etary intake alone or with total intake (Table 2). One exceptionwas a significant association that remained between total intakeof �-carotene and femoral neck BMD (P � 0.03) even aftermultiple adjustments. This finding was inconsistent and not sig-nificant for dietary intake alone (or serum concentration), and foronly 2 of the 5 BMD sites (femoral neck and total body). Inserum, after multiple adjustments, we found no significant asso-ciation at any of the BMD sites with serum antioxidant concen-trations for retinol, the carotenoids (�- and �-carotene,�-cryptoxanthin, lycopene, lutein, and zeaxanthin), or for thetocopherols (� and �) (Table 3). Results were similar for theother BMD sites (data not shown).
The relation between total intake and femoral neck BMD forselect interactions is shown in Table 4. We tested for, but did notfind, an interaction among calcium intake (�500 mg/d comparedwith �500 mg/d), hormone use (current compared with neverand former user), or smoking status (current compared withnever and past) for all but one of the antioxidants. A significantinteraction effect was observed between intake of total vitamin C(low compared with high) and HT use (P � 0.004). The benefi-cial effect of HT use on femoral neck BMD appears to be greateramong women with higher total intakes of vitamin C. In thegroup with low total intake of vitamin C, differences in meanBMD between the current user group and the never and formeruser group was 0.27 g/cm2, whereas in the group with high totalintake of vitamin C the difference was 0.42 g/cm2. This interac-tion was also significant for total body (P � 0.045), spine (P �0.030), and total hip (P � 0.029) BMDs. Several other interac-tions were found to be significant (P � 0.05) for various dietaryintake, total intake, and serum concentrations of antioxidants, butthe effects were inconsistent across the various BMD sites (datanot shown).
DISCUSSION
Our main findings were 1) that higher dietary intake, totalintake, and serum concentrations of antioxidants were not inde-pendently associated with higher findings of BMD at the spine,hip (total and subregions), and total body; and 2) that a significantinteraction effect was observed between total intake of vitamin C(lowest three-fourths compared with highest one-fourth) and HTuse (current compared with never or former). The findings weresuch that beneficial effects of current HT use on the various BMD
ANTIOXIDANTS AND BONE MINERAL DENSITY 583
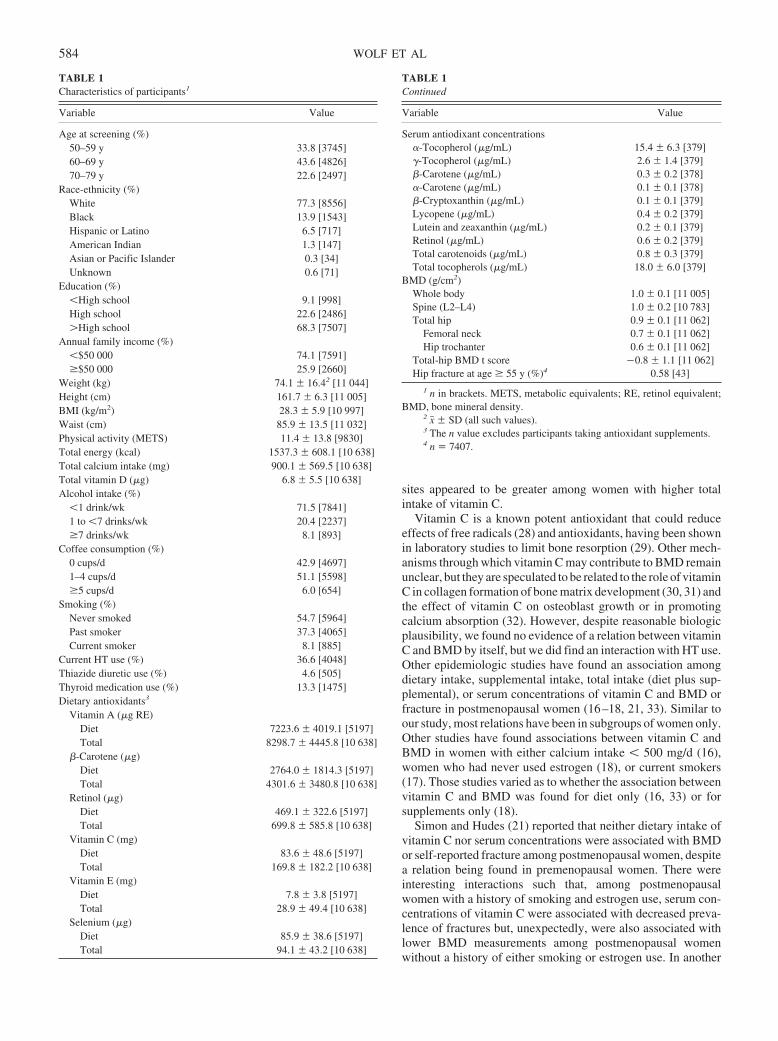
sites appeared to be greater among women with higher totalintake of vitamin C.
Vitamin C is a known potent antioxidant that could reduceeffects of free radicals (28) and antioxidants, having been shownin laboratory studies to limit bone resorption (29). Other mech-anisms through which vitamin C may contribute to BMD remainunclear, but they are speculated to be related to the role of vitaminC in collagen formation of bone matrix development (30, 31) andthe effect of vitamin C on osteoblast growth or in promotingcalcium absorption (32). However, despite reasonable biologicplausibility, we found no evidence of a relation between vitaminC and BMD by itself, but we did find an interaction with HT use.Other epidemiologic studies have found an association amongdietary intake, supplemental intake, total intake (diet plus sup-plemental), or serum concentrations of vitamin C and BMD orfracture in postmenopausal women (16–18, 21, 33). Similar toour study, most relations have been in subgroups of women only.Other studies have found associations between vitamin C andBMD in women with either calcium intake � 500 mg/d (16),women who had never used estrogen (18), or current smokers(17). Those studies varied as to whether the association betweenvitamin C and BMD was found for diet only (16, 33) or forsupplements only (18).
Simon and Hudes (21) reported that neither dietary intake ofvitamin C nor serum concentrations were associated with BMDor self-reported fracture among postmenopausal women, despitea relation being found in premenopausal women. There wereinteresting interactions such that, among postmenopausalwomen with a history of smoking and estrogen use, serum con-centrations of vitamin C were associated with decreased preva-lence of fractures but, unexpectedly, were also associated withlower BMD measurements among postmenopausal womenwithout a history of either smoking or estrogen use. In another
TABLE 1Characteristics of participants1
Variable Value
Age at screening (%)50–59 y 33.8 [3745]60–69 y 43.6 [4826]70–79 y 22.6 [2497]
Race-ethnicity (%)White 77.3 [8556]Black 13.9 [1543]Hispanic or Latino 6.5 [717]American Indian 1.3 [147]Asian or Pacific Islander 0.3 [34]Unknown 0.6 [71]
Education (%)�High school 9.1 [998]High school 22.6 [2486]�High school 68.3 [7507]
Annual family income (%)�$50 000 74.1 [7591]�$50 000 25.9 [2660]
Weight (kg) 74.1 16.42 [11 044]Height (cm) 161.7 6.3 [11 005]BMI (kg/m2) 28.3 5.9 [10 997]Waist (cm) 85.9 13.5 [11 032]Physical activity (METS) 11.4 13.8 [9830]Total energy (kcal) 1537.3 608.1 [10 638]Total calcium intake (mg) 900.1 569.5 [10 638]Total vitamin D (�g) 6.8 5.5 [10 638]Alcohol intake (%)
�1 drink/wk 71.5 [7841]1 to �7 drinks/wk 20.4 [2237]�7 drinks/wk 8.1 [893]
Coffee consumption (%)0 cups/d 42.9 [4697]1–4 cups/d 51.1 [5598]�5 cups/d 6.0 [654]
Smoking (%)Never smoked 54.7 [5964]Past smoker 37.3 [4065]Current smoker 8.1 [885]
Current HT use (%) 36.6 [4048]Thiazide diuretic use (%) 4.6 [505]Thyroid medication use (%) 13.3 [1475]Dietary antioxidants3
Vitamin A (�g RE)Diet 7223.6 4019.1 [5197]Total 8298.7 4445.8 [10 638]
�-Carotene (�g)Diet 2764.0 1814.3 [5197]Total 4301.6 3480.8 [10 638]
Retinol (�g)Diet 469.1 322.6 [5197]Total 699.8 585.8 [10 638]
Vitamin C (mg)Diet 83.6 48.6 [5197]Total 169.8 182.2 [10 638]
Vitamin E (mg)Diet 7.8 3.8 [5197]Total 28.9 49.4 [10 638]
Selenium (�g)Diet 85.9 38.6 [5197]Total 94.1 43.2 [10 638]
TABLE 1Continued
Variable Value
Serum antiodixant concentrations�-Tocopherol (�g/mL) 15.4 6.3 [379]�-Tocopherol (�g/mL) 2.6 1.4 [379]�-Carotene (�g/mL) 0.3 0.2 [378]�-Carotene (�g/mL) 0.1 0.1 [378]�-Cryptoxanthin (�g/mL) 0.1 0.1 [379]Lycopene (�g/mL) 0.4 0.2 [379]Lutein and zeaxanthin (�g/mL) 0.2 0.1 [379]Retinol (�g/mL) 0.6 0.2 [379]Total carotenoids (�g/mL) 0.8 0.3 [379]Total tocopherols (�g/mL) 18.0 6.0 [379]
BMD (g/cm2)Whole body 1.0 0.1 [11 005]Spine (L2–L4) 1.0 0.2 [10 783]Total hip 0.9 0.1 [11 062]
Femoral neck 0.7 0.1 [11 062]Hip trochanter 0.6 0.1 [11 062]
Total-hip BMD t score 0.8 1.1 [11 062]Hip fracture at age � 55 y (%)4 0.58 [43]
1 n in brackets. METS, metabolic equivalents; RE, retinol equivalent;BMD, bone mineral density.
2 x� SD (all such values).3 The n value excludes participants taking antioxidant supplements.4 n � 7407.
584 WOLF ET AL
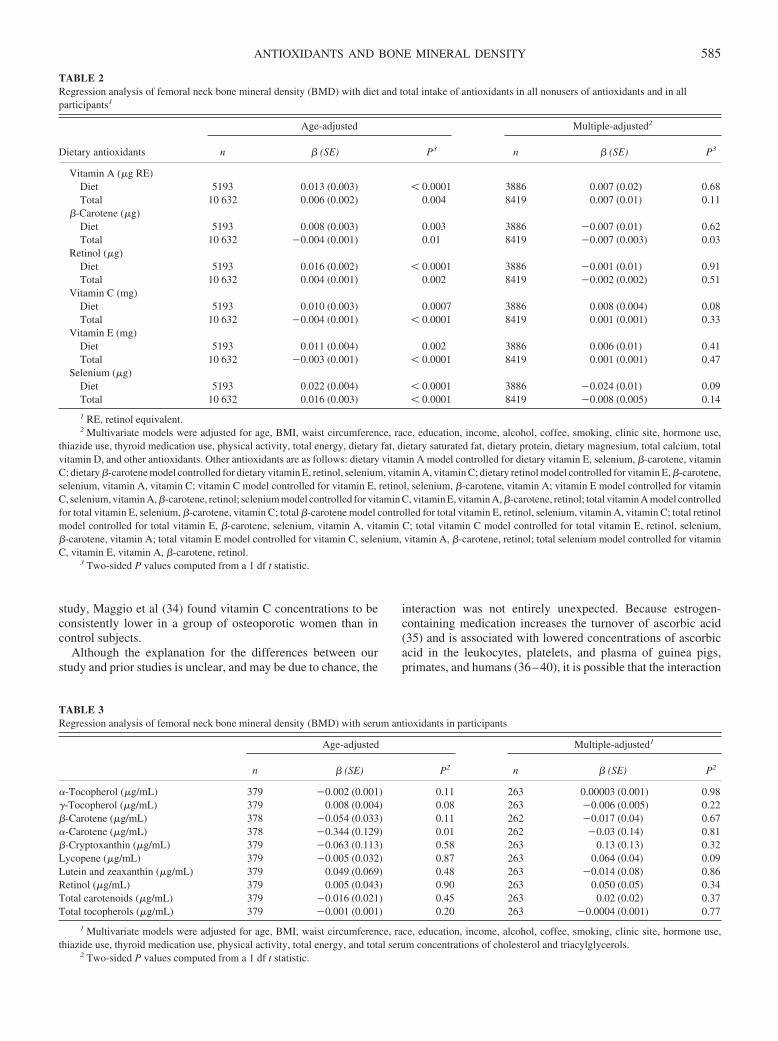
study, Maggio et al (34) found vitamin C concentrations to beconsistently lower in a group of osteoporotic women than incontrol subjects.
Although the explanation for the differences between ourstudy and prior studies is unclear, and may be due to chance, the
interaction was not entirely unexpected. Because estrogen-containing medication increases the turnover of ascorbic acid(35) and is associated with lowered concentrations of ascorbicacid in the leukocytes, platelets, and plasma of guinea pigs,primates, and humans (36–40), it is possible that the interaction
TABLE 2Regression analysis of femoral neck bone mineral density (BMD) with diet and total intake of antioxidants in all nonusers of antioxidants and in allparticipants1
Dietary antioxidants
Age-adjusted Multiple-adjusted2
n � (SE) P3 n � (SE) P3
Vitamin A (�g RE)Diet 5193 0.013 (0.003) � 0.0001 3886 0.007 (0.02) 0.68Total 10 632 0.006 (0.002) 0.004 8419 0.007 (0.01) 0.11
�-Carotene (�g)Diet 5193 0.008 (0.003) 0.003 3886 0.007 (0.01) 0.62Total 10 632 0.004 (0.001) 0.01 8419 0.007 (0.003) 0.03
Retinol (�g)Diet 5193 0.016 (0.002) � 0.0001 3886 0.001 (0.01) 0.91Total 10 632 0.004 (0.001) 0.002 8419 0.002 (0.002) 0.51
Vitamin C (mg)Diet 5193 0.010 (0.003) 0.0007 3886 0.008 (0.004) 0.08Total 10 632 0.004 (0.001) � 0.0001 8419 0.001 (0.001) 0.33
Vitamin E (mg)Diet 5193 0.011 (0.004) 0.002 3886 0.006 (0.01) 0.41Total 10 632 0.003 (0.001) � 0.0001 8419 0.001 (0.001) 0.47
Selenium (�g)Diet 5193 0.022 (0.004) � 0.0001 3886 0.024 (0.01) 0.09Total 10 632 0.016 (0.003) � 0.0001 8419 0.008 (0.005) 0.14
1 RE, retinol equivalent.2 Multivariate models were adjusted for age, BMI, waist circumference, race, education, income, alcohol, coffee, smoking, clinic site, hormone use,
thiazide use, thyroid medication use, physical activity, total energy, dietary fat, dietary saturated fat, dietary protein, dietary magnesium, total calcium, totalvitamin D, and other antioxidants. Other antioxidants are as follows: dietary vitamin A model controlled for dietary vitamin E, selenium, �-carotene, vitaminC; dietary �-carotene model controlled for dietary vitamin E, retinol, selenium, vitamin A, vitamin C; dietary retinol model controlled for vitamin E, �-carotene,selenium, vitamin A, vitamin C; vitamin C model controlled for vitamin E, retinol, selenium, �-carotene, vitamin A; vitamin E model controlled for vitaminC, selenium, vitamin A, �-carotene, retinol; selenium model controlled for vitamin C, vitamin E, vitamin A, �-carotene, retinol; total vitamin A model controlledfor total vitamin E, selenium, �-carotene, vitamin C; total �-carotene model controlled for total vitamin E, retinol, selenium, vitamin A, vitamin C; total retinolmodel controlled for total vitamin E, �-carotene, selenium, vitamin A, vitamin C; total vitamin C model controlled for total vitamin E, retinol, selenium,�-carotene, vitamin A; total vitamin E model controlled for vitamin C, selenium, vitamin A, �-carotene, retinol; total selenium model controlled for vitaminC, vitamin E, vitamin A, �-carotene, retinol.
3 Two-sided P values computed from a 1 df t statistic.
TABLE 3Regression analysis of femoral neck bone mineral density (BMD) with serum antioxidants in participants
Age-adjusted Multiple-adjusted1
n � (SE) P2 n � (SE) P2
�-Tocopherol (�g/mL) 379 0.002 (0.001) 0.11 263 0.00003 (0.001) 0.98�-Tocopherol (�g/mL) 379 0.008 (0.004) 0.08 263 0.006 (0.005) 0.22�-Carotene (�g/mL) 378 0.054 (0.033) 0.11 262 0.017 (0.04) 0.67�-Carotene (�g/mL) 378 0.344 (0.129) 0.01 262 0.03 (0.14) 0.81�-Cryptoxanthin (�g/mL) 379 0.063 (0.113) 0.58 263 0.13 (0.13) 0.32Lycopene (�g/mL) 379 0.005 (0.032) 0.87 263 0.064 (0.04) 0.09Lutein and zeaxanthin (�g/mL) 379 0.049 (0.069) 0.48 263 0.014 (0.08) 0.86Retinol (�g/mL) 379 0.005 (0.043) 0.90 263 0.050 (0.05) 0.34Total carotenoids (�g/mL) 379 0.016 (0.021) 0.45 263 0.02 (0.02) 0.37Total tocopherols (�g/mL) 379 0.001 (0.001) 0.20 263 0.0004 (0.001) 0.77
1 Multivariate models were adjusted for age, BMI, waist circumference, race, education, income, alcohol, coffee, smoking, clinic site, hormone use,thiazide use, thyroid medication use, physical activity, total energy, and total serum concentrations of cholesterol and triacylglycerols.
2 Two-sided P values computed from a 1 df t statistic.
ANTIOXIDANTS AND BONE MINERAL DENSITY 585
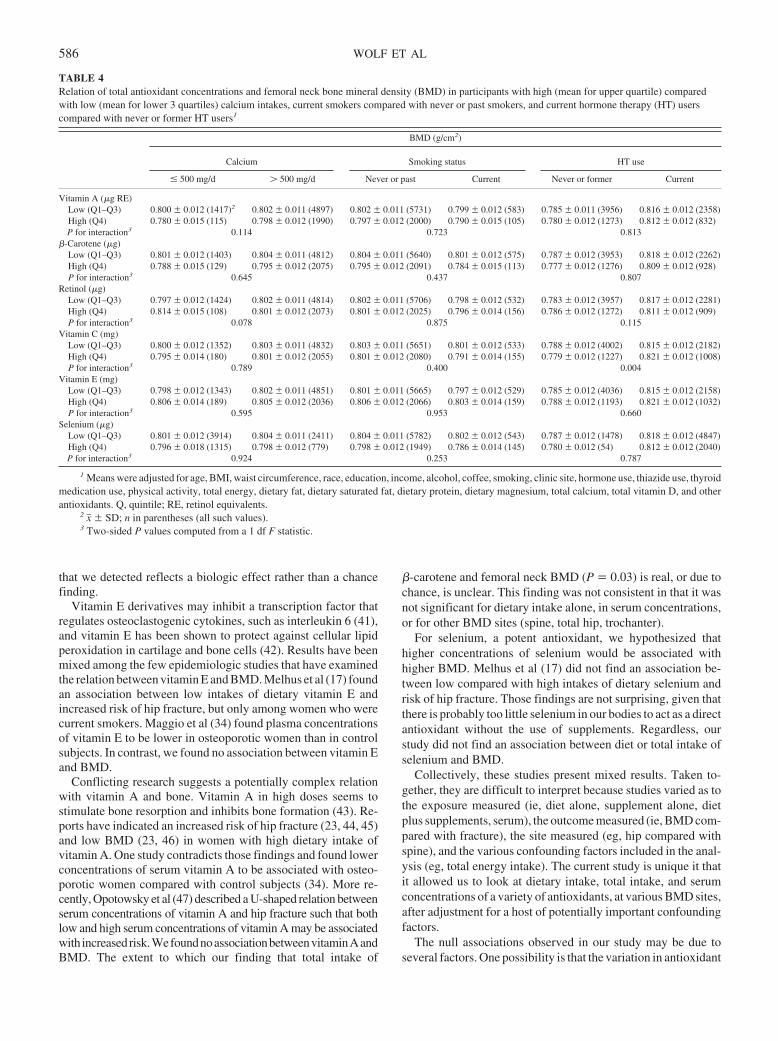
that we detected reflects a biologic effect rather than a chancefinding.
Vitamin E derivatives may inhibit a transcription factor thatregulates osteoclastogenic cytokines, such as interleukin 6 (41),and vitamin E has been shown to protect against cellular lipidperoxidation in cartilage and bone cells (42). Results have beenmixed among the few epidemiologic studies that have examinedthe relation between vitamin E and BMD. Melhus et al (17) foundan association between low intakes of dietary vitamin E andincreased risk of hip fracture, but only among women who werecurrent smokers. Maggio et al (34) found plasma concentrationsof vitamin E to be lower in osteoporotic women than in controlsubjects. In contrast, we found no association between vitamin Eand BMD.
Conflicting research suggests a potentially complex relationwith vitamin A and bone. Vitamin A in high doses seems tostimulate bone resorption and inhibits bone formation (43). Re-ports have indicated an increased risk of hip fracture (23, 44, 45)and low BMD (23, 46) in women with high dietary intake ofvitamin A. One study contradicts those findings and found lowerconcentrations of serum vitamin A to be associated with osteo-porotic women compared with control subjects (34). More re-cently, Opotowsky et al (47) described a U-shaped relation betweenserum concentrations of vitamin A and hip fracture such that bothlow and high serum concentrations of vitamin A may be associatedwith increasedrisk.WefoundnoassociationbetweenvitaminAandBMD. The extent to which our finding that total intake of
�-carotene and femoral neck BMD (P � 0.03) is real, or due tochance, is unclear. This finding was not consistent in that it wasnot significant for dietary intake alone, in serum concentrations,or for other BMD sites (spine, total hip, trochanter).
For selenium, a potent antioxidant, we hypothesized thathigher concentrations of selenium would be associated withhigher BMD. Melhus et al (17) did not find an association be-tween low compared with high intakes of dietary selenium andrisk of hip fracture. Those findings are not surprising, given thatthere is probably too little selenium in our bodies to act as a directantioxidant without the use of supplements. Regardless, ourstudy did not find an association between diet or total intake ofselenium and BMD.
Collectively, these studies present mixed results. Taken to-gether, they are difficult to interpret because studies varied as tothe exposure measured (ie, diet alone, supplement alone, dietplus supplements, serum), the outcome measured (ie, BMD com-pared with fracture), the site measured (eg, hip compared withspine), and the various confounding factors included in the anal-ysis (eg, total energy intake). The current study is unique it thatit allowed us to look at dietary intake, total intake, and serumconcentrations of a variety of antioxidants, at various BMD sites,after adjustment for a host of potentially important confoundingfactors.
The null associations observed in our study may be due toseveral factors. One possibility is that the variation in antioxidant
TABLE 4Relation of total antioxidant concentrations and femoral neck bone mineral density (BMD) in participants with high (mean for upper quartile) comparedwith low (mean for lower 3 quartiles) calcium intakes, current smokers compared with never or past smokers, and current hormone therapy (HT) userscompared with never or former HT users1
BMD (g/cm2)
Calcium Smoking status HT use
� 500 mg/d � 500 mg/d Never or past Current Never or former Current
Vitamin A (�g RE)Low (Q1–Q3) 0.800 0.012 (1417)2 0.802 0.011 (4897) 0.802 0.011 (5731) 0.799 0.012 (583) 0.785 0.011 (3956) 0.816 0.012 (2358)High (Q4) 0.780 0.015 (115) 0.798 0.012 (1990) 0.797 0.012 (2000) 0.790 0.015 (105) 0.780 0.012 (1273) 0.812 0.012 (832)P for interaction3 0.114 0.723 0.813
�-Carotene (�g)Low (Q1–Q3) 0.801 0.012 (1403) 0.804 0.011 (4812) 0.804 0.011 (5640) 0.801 0.012 (575) 0.787 0.012 (3953) 0.818 0.012 (2262)High (Q4) 0.788 0.015 (129) 0.795 0.012 (2075) 0.795 0.012 (2091) 0.784 0.015 (113) 0.777 0.012 (1276) 0.809 0.012 (928)P for interaction3 0.645 0.437 0.807
Retinol (�g)Low (Q1–Q3) 0.797 0.012 (1424) 0.802 0.011 (4814) 0.802 0.011 (5706) 0.798 0.012 (532) 0.783 0.012 (3957) 0.817 0.012 (2281)High (Q4) 0.814 0.015 (108) 0.801 0.012 (2073) 0.801 0.012 (2025) 0.796 0.014 (156) 0.786 0.012 (1272) 0.811 0.012 (909)P for interaction3 0.078 0.875 0.115
Vitamin C (mg)Low (Q1–Q3) 0.800 0.012 (1352) 0.803 0.011 (4832) 0.803 0.011 (5651) 0.801 0.012 (533) 0.788 0.012 (4002) 0.815 0.012 (2182)High (Q4) 0.795 0.014 (180) 0.801 0.012 (2055) 0.801 0.012 (2080) 0.791 0.014 (155) 0.779 0.012 (1227) 0.821 0.012 (1008)P for interaction3 0.789 0.400 0.004
Vitamin E (mg)Low (Q1–Q3) 0.798 0.012 (1343) 0.802 0.011 (4851) 0.801 0.011 (5665) 0.797 0.012 (529) 0.785 0.012 (4036) 0.815 0.012 (2158)High (Q4) 0.806 0.014 (189) 0.805 0.012 (2036) 0.806 0.012 (2066) 0.803 0.014 (159) 0.788 0.012 (1193) 0.821 0.012 (1032)P for interaction3 0.595 0.953 0.660
Selenium (�g)Low (Q1–Q3) 0.801 0.012 (3914) 0.804 0.011 (2411) 0.804 0.011 (5782) 0.802 0.012 (543) 0.787 0.012 (1478) 0.818 0.012 (4847)High (Q4) 0.796 0.018 (1315) 0.798 0.012 (779) 0.798 0.012 (1949) 0.786 0.014 (145) 0.780 0.012 (54) 0.812 0.012 (2040)P for interaction3 0.924 0.253 0.787
1 Means were adjusted for age, BMI, waist circumference, race, education, income, alcohol, coffee, smoking, clinic site, hormone use, thiazide use, thyroidmedication use, physical activity, total energy, dietary fat, dietary saturated fat, dietary protein, dietary magnesium, total calcium, total vitamin D, and otherantioxidants. Q, quintile; RE, retinol equivalents.
2 x� SD; n in parentheses (all such values).3 Two-sided P values computed from a 1 df F statistic.
586 WOLF ET AL
concentrations was insufficient to see an association. WHI par-ticipants were healthy subjects who were clearly well nourished.Future studies should consider investigating the relation betweenantioxidants and BMD in populations with lower ranges of an-tioxidant concentrations. Second, a relation could be undetectedbecause of the temporal relation between the measured exposureand the outcome did not encompass the true latent period. Ofinterest, Shikany et al (15) recently reported that most antioxi-dant use in WHI participants has been recent, within the past 1–4y before enrollment into the study. It will be interesting to seewhether changes in dietary and supplemental antioxidant useover time reflect changes in BMD and fracture risk. Third, theremay be unmeasured variables that we did not control for influ-encing the association between antioxidants and BMD. Fourth,only several selected antioxidants were evaluated in these anal-yses, and not all dietary estimates had serum equivalents. In thecase of vitamin C, for which serum concentrations were notavailable, we were trying to identify associations with the use ofa FFQ at baseline that we assumed provided an estimation ofusual vitamin C intake over previous years during which bonedensity developed. The correlation between FFQ estimates ofvitamin C intake and serum concentrations are �0.55–0.58 (48),so there will be some misclassification, which, if nondifferential,will result in decreased statistical power to detect an association.Fifth, our participants were mostly women with normal rangeBMD. If associations are present primarily in osteoporoticwomen or women with low BMD, we might have missed theseassociations. Finally, our hypotheses were primarily based on theassumption that women with lower BMD may be in a state ofoxidative stress, which may be ameliorated by increased anti-oxidants. A recent study by Maggio et al (34) found antioxidantconcentrations to be lower in osteoporotic women than in controlsubjects; however, markers of oxidative stress (ie, malondialde-hyde) were not different in osteoporotic women than in controlsubjects. These findings imply that there may be other potentialmechanisms by which antioxidant nutrients may have an effecton bone.
We believe our study had several important strengths. First,this study investigated a broad spectrum of antioxidants; mea-sured several BMD sites; included dietary intake, total intake,and serum concentrations of antioxidants; and controlled for awide range of potential confounders, including energy intake.Measurements of dual-energy X-ray absorptiometry were stateof the art with good quality control. Our sample size was largeand allowed us to examine several interactions. Although oursample of women in the WHI study were volunteers and, thus,may not be representative of the general population of postmeno-pausal women, our sample was ethnically diverse, including USwomen from 3 geographic regions. Most other studies were con-ducted in primarily white samples.
Our results do not support an association between dietaryintake, total intake, or serum concentrations of select antioxi-dants and BMD at any of the skeletal sites measured. Whether thebeneficial effect of HT use on BMD among women with higherthan with lower total concentrations of vitamin C is real, or dueto chance, needs further exploration. The WHI participants con-tinue to be followed prospectively, making it possible to exploredietary intake, total intake, and serum concentrations of antioxi-dants on changes in BMD and, ultimately, fracture risk. Re-searchers should consider exploring the relation of specificwhole foods and food groups (eg, fruit, vegetables, or both) and
their relation with BMD, instead of continuing to focus on indi-vidual antioxidants.
RLW was the lead author for this manuscript and contributed to theconception of the study question, the design, the data interpretation, and thewriting of the manuscript. MP conducted all of the statistical analyses. JAC,MP, AL, RJ, MSL, CEL, MCN, JAS, KLS, and JWW contributed signifi-cantly to the interpretation of the study findings and to the writing and editingof the manuscript. None of the authors had a conflict of interest.
REFERENCES1. NIH Consensus Development Panel on Osteoporosis Prevention, Diag-
nosis, and Therapy. Osteoporosis prevention, diagnosis, and therapy.JAMA 2001;285:785–95.
2. National Osteoporosis Foundation Report 2002. Internet: http://www.nog.org/osteoporosis/diseasefacts.htm (accessed 24 August 2004).
3. Heaney RP. Calcium, dairy products and osteoporosis. J Am Coll Nutr2000;19:83–99S.
4. Dawson-Hughes B, Dallal GE, Krall EA, Sadowski L, Sahyoun N,Tannenbaum S. A controlled trial of the effect of calcium supplemen-tation on bone mineral density in postmenopausal women. N Engl J Med1990;323:878–83.
5. Chapuy MC, Arlot ME, Duboeuf F, et al. Vitamin D3 and calcium toprevent hip fractures in elderly women. N Engl J Med 1992;327:1637– 42.
6. Reid IR, Ames RW, Evans MC, Gamble GD, Sharpe SJ. Effect ofcalcium supplementation on bone loss in postmenopausal women.N Engl J Med 1993;328:460–4.
7. Johnston CC Jr, Miller JZ, Slemenda CW, et al. Calcium supplementa-tion and increases in bone mineral density in children. N Engl J Med1992;327:82–7.
8. Lloyd T, Andon MB, Rollings N, et al. Calcium supplementation andbone mineral density in adolescent girls. JAMA 1993;270:841–4.
9. Chevalley T, Rizzoli R, Nydegger V, et al. Effects of calcium supple-ments on femoral bone mineral density and vertebral fracture rate invitamin D-replete elderly patients. Osteoporos Int 1994;4:256–2.
10. Recker RR, Hinders S, Davies KM, et al. Correcting calcium nutritionaldeficiency prevents spine fractures in elderly women. J Bone Miner Res1996;11:1961–6.
11. Dawson-Hughes B, Harris SS, Krall EA, Dallal GE. Effects of calciumand vitamin D supplementation on bone density in men and women 65years of age or older. N Engl J Med 1997;337:670–6.
12. Reid IR, Ames RW, Evans MC, Sharpe SJ, Gamble GD. Determinantsof the rate of bone loss in normal postmenopausal women. J Clin Endo-crinol Metab 1994;79:950–4.
13. Aloia JF, Vaswani A, Yeh JK, Ross PL, Flaster E, Dilmanian FA.Calcium supplementation with and without hormone replacement ther-apy to prevent post-menopausal bone loss. Ann Intern Med 1994;120:97–103.
14. Riggs BL, Melton LJ, eds. Osteoporosis: etiology, diagnosis, and man-agement. New York, NY: Raven Press, 1988.
15. Shikany JM, Patterson RE, Agurs-Collins T, Anderson G. Antioxidantsupplement use in Women’s Health Initiative participants. Prev Med2003;36:379–87.
16. Hall SL, Greendale GA. The relation of dietary vitamin C intake to bonemineral density: results from the PEPI Study. Calcif Tissue Int 1998;63:183–9.
17. Melhus H, Michaelsson K, Holmberg L, Wolk A, Ljunghall S. Smoking,antioxidant vitamins, and the risk of hip fractures. J Bone Miner Res1999;14:129–35.
18. Leveille SG, La Croix AZ, Koepsell TD, Beresford SA, VanBelle G,Buchner DM. Dietary vitamin C and bone mineral density in postmeno-pausal women in Washington State, USA. J Epidemiol CommunityHealth 1997;51:479–85.
19. The Women’s Health Initiative Study Group. Design of the Women’sHealth Initiative clinical trial and observational study. Control ClinTrials 1998;19:61–109.
20. Ainsworth BE, Haskell WL, Whitt MC, et al. Compendium of physicalactivities: an update of activity codes and MET intensities. Med SciSports Exerc 2000;32(9 suppl):S498–504.
21. Simon JA, Hudes ES. Relation of ascorbic acid to bone mineral density
ANTIOXIDANTS AND BONE MINERAL DENSITY 587
and self-reported fractures among US adults. Am J Epidemiol 2001;154:427–33.
22. Feskanich D, Willett W, Stampfter MJ, Colditz GA. Milk, dietary cal-cium, and bone fractures in women: a 12-year prospective study. Am JPublic Health 1997;87:992–7.
23. Melhus H, Michaelsson K, Kindmark A, et al. Excessive dietary intakeof vitamin A is associated with reduced bone mineral density and in-creased risk for hip fracture. Ann Intern Med 1998;129:770–8.
24. Ensrud KE, Palermo L, Black DM, et al. Hip and calcaneal bone lossincrease with advancing age: longitudinal results from the study ofosteoporotic fractures. J Bone Miner Res 1995;10:1778–87.
25. Jordan P, Brubucher D, Moser U, Stahelin HB, Gey KF. Vitamin E andvitamin A concentrations in plasma adjusted for cholesterol and triglyc-erides by multiple regression. Clin Chem 1995;41:924–7.
26. Anderson GL, Manson J, Wallace R, et al. Implementation of the Wom-en’s Health Initiative study design. Ann Epidemiol 2003;13(9 suppl):S5–17.
27. Kanis JA, Melton LJ III, Christiansen C, Johnston CC, Khaltaev N. Thediagnosis of osteoporosis. J Bone Miner Res 1994;9:1137–41.
28. Diplock AT. Antioxidant nutrients and disease prevention: an overview.Am J Clin Nutri 1991;53(1 suppl):189–93S.
29. Garrett IR, Boyce BF, Oreffo RO, Bonewald L, Poser J, Mundy GR.Oxygen-derived free radicals stimulate osteoclastic bone resorption inrodent bone in vitro and in vivo. J Clin Invest 1990;85:632–639.
30. Roughead ZK, Kunkel ME. Effect of diet on bone matrix constituents.J Am Coll Nutr 1991;10:242–6.
31. Franceschi RT. The role of ascorbic acid in mesenchymal differentia-tion. Nutr Rev 1992;50:65–70.
32. Freudenheim JL, Johnson NE, Smith EL. Relationships betweenusual nutrient intake and bone-mineral content of women 35– 65years of age: longitudinal and cross-sectional analysis. Am J ClinNutr 1986;44:863–76.
33. Wang MC, Luz Villa ML, Marcus R, Kelsey JL. Associations of vitaminC, calcium, and protein with bone mass in postmenopausal MexicanAmerican women. Osteoporos Int 1997;7:533–8.
34. Maggio D, Barabani M, Pierandrei M, et al. Marked decrease in plasmaantioxidants in aged osteoporotic women: results of a cross-sectionalstudy. J Clin Endocrinol Metab 2003;88:1523–7.
35. Weininger J, King JC. Effect of oral contraceptive agents on ascorbicacid metabolism in the rhesus monkey. Am J Clin Nutr 1982;35:1408 –16.
36. Kalesh DG, Mallikarjuneswara VR, Clemetson CAB. Effect of estrogencontaining contraceptives on platelet and plasma ascorbic acid concen-trations. Contraception 1971;4:183–92.
37. Briggs M, Briggs M. Vitamin C requirements and oral contraceptives.Nature 1972;238:277 (letter).
38. Rivers JM, Devine MM. Plasma ascorbic acid concentrations and oralcontraceptives. Am J Clin Nutr 1972;25:684–9.
39. McLeroy VJ, Schendel HE. Influence of oral contraceptives on ascorbicacid concentrations in healthy, sexually mature women. Am J Clin Nutr1973;26:191–6.
40. Saroja N, Mallikarjuneswara VR, Clemetson CAB. Effect of estrogenson ascorbic acid in the plasma and blood vessels of guinea pigs. Con-traception 1971;3:269–77.
41. Manolagas SC, Jilka RL. Bone marrow, cytokines, and bone remodeling.Emerging insights into the pathophysiology of osteoporosis. N EnglJ Med 1995;332:305–11.
42. Xu H, Watkins BA, Seifert MF. Vitamin E stimulates trabecular boneformation and alters epiphyseal cartilage morphometry. Calcif Tissu Int1995;57:293–300.
43. Binkley N, Krueger D. Hypervitaminosis A and bone. Nutr Rev 2000;58:138–44.
44. Feskanich D, Singh V, Willett WC, Colditz GA. Vitamin A intake andhip fractures among postmenopausal women. JAMA 2002;287:47–54.
45. Michaelsson K, Lithell H, Vessby B, Melhus H. Serum retinol levels andthe risk of fracture. N Engl J Med 2003;348:287–94.
46. Promislow JH, Goodman-Gruen D, Slymen DJ, Barrett-Conner E. Ret-inol intake and bone mineral density in the elderly: the Rancho BernardoStudy. J Bone Miner Res 2002;17:1349–58.
47. Opotowsky AR, Bilezikian JP; NHANES I follow-up study. Serumvitamin A concentration and the risk of hip fracture among women 50 to74 years old in the United States: a prospective analysis of NHANES Ifollow-up study. Am J Med 2004;117:169–74.
48. Willett W. Nutritional epidemiology. 2nd ed. New York, NY: OxfordUniversity Press, 1998.
588 WOLF ET AL
Inhibitory effects of dietary calcium on the initial uptake andsubsequent retention of heme and nonheme iron in humans:comparisons using an intestinal lavage method1–4
Zamzam K (Fariba) Roughead, Carol A Zito, and Janet R Hunt
ABSTRACTBackground: Calcium is the only reported dietary inhibitor of bothheme- and nonheme-iron absorption. It has been proposed that the 2forms of iron enter a common pool in the enterocyte and that calciuminhibits the serosal transfer of iron into blood.Objectives: We aimed to ascertain whether the inhibitory effect ofcalcium occurs during initial mucosal uptake or during serosal trans-fer and to compare the serosal transfer of heme and nonheme iron,which should not differ if the 2 forms have entered a commonmucosal iron pool.Design: Whole-gut lavage and whole-body counting were used tomeasure the initial uptake (8 h) and retention (2 wk) of heme andnonheme iron with and without a calcium supplement (450 mg).Two experiments tested basal meals with low iron bioavailabilityand 360 mg Ca (n � 15) or with high iron bioavailability and 60mg Ca (n � 12).Results: Added calcium reduced the initial uptake of heme iron by20%, from 49% to �40% from both meals (P � 0.02), and reducedthe total iron absorbed from the low- and high-bioavailability mealsby �25% [from 0.033 to 0.025 mg (P � 0.06) and from 0.55 to 0.40mg (P � 0.01), respectively]. Calcium did not affect the serosaltransfer of either form of iron.Conclusions: Calcium supplementation reduced heme and total ironwithout significantly affecting nonheme-iron absorption, regardlessof meal bioavailability. Calcium inhibited the initial mucosal uptakerather than the serosal transfer of heme iron. Differences in serosaltransfer indicate that heme and nonheme iron did not enter a commonabsorptive pool within 8 h after a meal. Am J Clin Nutr 2005;82:589–97.
KEY WORDS Heme iron, nonheme iron, whole-body count-ing, whole-gut lavage, mucosal uptake, absorption, retention, sero-sal transfer, humans, calcium, bioavailability
INTRODUCTION
It has been known since the 1940s that calcium inhibits ironabsorption (1). In fact, calcium is the only dietary factor found toinhibit the absorption of both heme and nonheme iron (2–5).Maximal inhibition of nonheme-iron absorption (�50%) hasbeen shown to occur at a 300-mg dose of calcium (3). Thisinhibitory effect may present a public health problem becauserecommendations by the Institute of Medicine (6) and NationalInstitutes of Health (7, 8) for the prevention of osteoporosis haveled to widespread use of calcium supplements and fortificants.
These practices may exacerbate the effects of marginal iron in-takes (9, 10).
The mechanism for the inhibitory effect of calcium on ironabsorption is not known. It has been proposed that heme andnonheme iron enter a common mucosal pool and that the inhi-bition of iron absorption occurs during the serosal transfer pro-cess rather than during iron’s initial uptake into the enterocyte(4). However, a study showed that a modest amount of calcium(�120 mg, as cheese) added to a high-iron-bioavailability mealdid not reduce either the initial mucosal uptake of nonheme ironor its serosal transfer, as measured by a combination of whole-gutlavage and whole-body scintillation counting (11). It was notclear whether a higher dose of calcium or changes in the bio-availability of the accompanying meal, or both, would result in aninhibition of heme and nonheme forms of iron.
Whereas the initial uptake of nonheme iron was previouslyestimated by using discriminate analysis of a 59Fe radiotracer anda nonabsorbable radioactive marker excreted in the feces (12, 13)or retained in the body (as measured by whole-body counting)(14, 15), to date no measurement of the initial uptake of heme ironhas been reported. Here we describe 2 experiments conducted totest the hypothesis that calcium inhibition of the absorption ofheme and nonheme iron occurs during the initial uptake steprather than during the serosal transfer step of the absorptiveprocess. Additional objectives were to compare the 2-wk reten-tion of heme and nonheme iron after their initial entry into themucosal cell—with the expectation of no difference if the 2forms of iron have entered a common iron pool in the entero-cyte—and to ascertain the relation of serum ferritin to the sepa-rate components of iron absorption: mucosal uptake, serosaltransfer, and (for nonheme iron) erythrocyte incorporation. To
1 From the US Department of Agriculture, Agricultural Research Service,Grand Forks Human Nutrition Research Center, Grand Forks, ND.
2 Mention of a trademark or proprietary product does not constitute aguarantee or warranty of the product by the US Department of Agricultureand does not imply its approval to the exclusion of other products that mayalso be suitable. The US Department of Agriculture, Agricultural ResearchService, Northern Plains Area, is an equal opportunity/affirmative actionemployer, and all agency services are available without discrimination.
3 Supported by the US Department of Agriculture.4 Reprints not available. Address correspondence to JR Hunt, USDA,
ARS, GFHNRC, PO Box 9034, Grand Forks, ND 58202-9034. E-mail:[email protected].
Received December 20, 2004.Accepted for publication June 8, 2005.
589Am J Clin Nutr 2005;82:589–97. Printed in USA. © 2005 American Society for Clinical Nutrition
accomplish these objectives, we developed a new method toestimate the initial uptake and mucosal transfer of heme andnonheme iron by combining whole-gut lavage and whole-bodycounting procedures.
SUBJECTS AND METHODS
General protocol
The effect of supplemental calcium (450 mg as citrate) on theinitial mucosal uptake, subsequent serosal transfer, and retentionof heme and nonheme iron was measured in 2 experiments dif-fering in basal test meals. Experiment A tested a meal with lowiron bioavailability and moderate calcium content (n � 15), andExperiment B tested a basal meal with high iron bioavailabilityand low calcium content (n � 12). Healthy participants in eachexperiment consumed the respective test meal twice, once withand once without a calcium supplement (450 mg as citrate), inrandom order and separated by 6 wk. Each meal contained bothheme (55Fe, emitter of low-energy X-rays) and nonheme (59Fe,emitter of �-rays) radiotracers. The entire gut contents werepurged 8 h later with an orally administered lavage solution ofpolyethylene glycol. This 8-h period for initial uptake was cho-sen arbitrarily to allow for passage of chyme through the upperintestinal tract (16) with minimal sloughing of mucosal cells (lifespan: 2–3 d) (17). Initial mucosal uptake was estimated from theisotope retention at 8 h, and absorption was estimated from re-tention at 2 wk. The difference was taken to represent serosaltransfer of iron from the enterocyte. In this report, unless other-wise specified, the terms absorption and retention are used in-terchangeably to refer to the retention of the isotopes in the body2 wk after the test meal.
Subjects
Participants were recruited through public advertising. Thoseselected were aged �21 y, had no apparent underlying disease orroutine use of medications, had normal hemoglobin (�12 g/L forwomen, �14 g/L for men), had serum concentrations of ferritin� 450 �g/L, had not been pregnant in the past year, were notbreastfeeding, had not donated blood in the past 2 y, and had notused iron supplements in the past 6 mo. Participants agreed todiscontinue all nutrient supplements when they applied, gener-ally 6–12 wk before the study.
The participants gave written informed consent. The studywas approved for human subjects by the University of NorthDakota Radioactive Drug Research Committee and its Institu-tional Review Board and by the US Department of AgricultureHuman Studies Review and Radiological Safety Committee.Subject characteristics for both experiments are described inTable 1.
Test meals
For Experiment A, the test meal was low in iron bioavailabilityand had moderate calcium content; it consisted of a wheat muffin(60 g), eggs (50 g), Canadian bacon (15 g), shredded-wheatcereal (28 g), margarine (5 g), white sugar (5 g), milk (227 g, 2%fat), and tea (1 g dry instant powder). It contained 360 mg cal-cium, 0.04 mg heme iron, 3.9 mg total iron (by analysis), and1871 mg phytate, calculated (18).
For Experiment B, the test meal was high in iron bioavailabil-ity and had low calcium content; it was patterned after the meal
described by Lynch et al (19) and consisted of ground beef (90 g),a bun (53 g), French fries (68 g), apple juice (240 g), and tomatoketchup (40 g). It contained 60 mg calcium, 0.7 mg heme iron, 4.3mg total iron (by analysis), and 462 mg of phytate (calculatedfrom published analyses of similar foods; 18).
The participants consumed the weighed test meals quantitativelyat the research center. They fasted for �10 h before and 8 h after thetest meals. A carbonated, caffeine-free, sugar-containing beveragewas allowed at the midpoint of the 8-h fast to alleviate any discom-fort due to fasting. Water was also allowed.
The radio tracers 55Fe (19 kBq as rabbit hemoglobin) and 59Fe(37 kBq as FeCl3) and dysprosium (1.0 mg as DyCl30 · 6H2O;Sigma, St. Louis, MO), a poorly absorbed, rare earth metal usedas a fecal marker (20), were added to the meat portion of each testmeal. The meal was briefly reheated in a microwave oven beforeservice. The 55Fe and 59Fe isotopes were purchased from NENLife Science Products (Boston, MA). Radiolabeled hemoglobinwas obtained by intravenously injecting 74 MBq (2 mCi) of 55Feinto an iron-deficient, pathogen-free rabbit, exsanguinating theanimal 2 wk later, and removing Rollet’s stroma by lysing andcentrifugation (21). The specific activity of the final preparationwas 0.585 kBq/�g iron. The amounts of iron added to each testmeal as a result of labeling with 55Fe and 59Fe were �32 and �0.4�g, respectively.
Lavage procedure and isotope measurements
After each test meal and the subsequent 8-h fast, the partici-pants were admitted to a private room in a metabolic ward. Topurge their gastrointestinal contents, the participants drank 4 L ofan isomotic/isotonic polyethylene glycol solution at a rate of 240mL every 10 min (GoLYTELY; Braintree Laboratories Inc,Braintree, MA). They collected the entire lavage effluent in plas-tic bags until 1 h after completely drinking the lavage solution.
Retention of 59Fe was ascertained with the use of a custom-made whole-body counter, described elsewhere (22). Partici-pants underwent whole-body counting before the meals (back-ground), 1–3 h after the meals (initial dose), after the intestinallavage (initial mucosal uptake), and 2 wk later (absorption). Allhuman isotope measurements were corrected for backgroundmeasurements and physical decay.
For the isotope analyses of the stools, the lavage effluentsamples of each participant were lyophilized, weighed, and ho-mogenized, and all samples were pooled. From this pooled sam-ple, nine 1.5-g aliquots were weighed and placed into 50-mL
TABLE 1Subject characteristics by experiment
Experiment A(n � 8M, 7F)
Experiment B(n � 6M, 6F)
Age (y)1 38 � 12 (21–53) 37 � 10 (21–48)BMI (kg/m2)1 27 � 4 (20–34) 27 � 5 (22–35)Serum ferritin (�g/L)2 32 (4–195) [9, 112] 55 (13–219) [24, 125]Serum iron (�mol/L)1 66 � 28 (17–120) 65 � 25 (28–121)Total-iron-binding capacity
(�mol/L)1319 � 38 (254–378) 283 � 49 (245–418)
Transferrin saturation (%)1 21 � 10 (5–43) 24 � 11 (7–49)
1 x � SD; range in parentheses.2 Geometric x; range in parentheses; �SD and �SD in brackets.
590 ROUGHEAD ET AL
teflon digestion tubes (Cole Palmer Instrument Company, Ver-non Hills, IL). The influence of the stool matrix on isotope re-covery was assessed for each aliquotted stool sample, by adding19 kBq 55Fe to 3 aliquots and 37 kBq 59Fe to another 3 aliquots.Isotope recovery was further assessed by digesting triplicatesamples of each isotope without stools. The samples were di-gested under conditions of intermediate heating with nitric acid,followed by the addition of 30% hydrogen peroxide. Isotopeconcentrations were measured in a liquid scintillation counter(Tri-Carb 1600 TR; Packard, Meriden, CT) and expressed asfractions of the administered radioisotopes. Isotope recoveryfrom digested samples was 101 � 7% and 91 � 6% for 55Fe and59Fe, respectively.
The ratio of the isotopes measured in the lavage excreta, whichaccounted for nearly all of the gut solids (by inspection), washighly (R2 � 0.99; data not shown) correlated with the ratiomeasured in representative excreta samples after correction forrecovery of the unabsorbed dysprosium fecal marker. Althoughthis correlation suggests that a total stool collection would not benecessary in future investigations, the current investigation usedthe data from the total stool collection, without further using thedysprosium measurements.
On day 15 (2 wk) after the meals, we measured the radioiso-tope concentrations in blood (23). These measurements, togetherwith estimates of total blood volume based on sex, body height,and weight (24, 25), were used to determine the fraction ofadministered 55Fe and 59Fe in blood.
Calculations of initial mucosal uptake, absorption, serosaltransfer, and red blood cell incorporation of nonhemeiron
The mucosal uptake and absorption of nonheme iron weredetermined from whole-body counting of 59Fe after the lavageand 2 wk after the meal, respectively, according to the followingequations:
Fractional mucosal uptake of nonheme iron
� 59Fewbc,lavage/59Fewbc,dose (1)
Fractional absorption of nonheme iron
� 59Fewbc,2wk/59Fewbc,dose (2)
where: 59Fewbc,lavage � 59Fe by whole-body counting after thelavage procedure, 59Fewbc,dose � 59Fe by whole-body counting1–3 h after the test meal, and 59Fewbc,2wk � 59Fe by whole-bodycounting 2 wk after the test meal.
The mucosal uptake of heme iron was calculated by applyingthe ratios of the 2 isotopes in the dose and in the lavage excretato the whole-body count after the lavage according to the fol-lowing equation:
Fractional mucosal uptake of heme iron
� 1 � ��55Fe/59Fe�lavage � �59Fe/55Fe�dose
� �1 � 59Fewbc,lavage/59Fewbc,dose�� (3)
where: (55Fe/59Fe)lavage � the ratio of isotopes in the lavageexcreta, and (59Fe/55Fe)dose � the ratio of isotopes in the admin-istered dose. (See Appendix A for derivation of the equation.)
The absorption of heme iron was calculated by applying theratio of the 2 isotopes in the blood after 2 wk to the nonheme-ironabsorption measurement according to the following equation:
Fractional absorption of heme Fe
� frac55Feblood,2wk/frac59Feblood,2wk
� 59Fewbc,2wk/59Fewbc,dose (4)
where: frac55Feblood,2wk � the fraction of administered 55Fe inblood after 2 wk, and frac59Feblood,2wk � the fraction of admin-istered 59Fe in blood after 2 wk.
A serosal transfer index was calculated for each form of iron,respectively, as the fraction of the initial mucosal uptake that wasabsorbed, according to the following equation:
Serosal transfer index of each form of iron
� fractional absorption/fractional mucosal uptake (5)
Finally, the percentage of the absorbed nonheme iron that wasincorporated into blood was calculated from the blood andwhole-body 59Fe retention measurements 2 wk after the meals,according to the following equation:
RBC incorporation as percentage of
absorbed nonheme iron � frac59Feblood,2wk
� 59Fewbc,dose/59Fewbc,2wk � 100 (6)
Although the data are not presented in this report, iron absorp-tion can also be estimated by using only blood measurements,with the assumption that 80% of the newly absorbed isotope isincorporated into blood. For nonheme-iron absorption, resultsfrom blood isotope measurements were strongly and signifi-cantly correlated with those from the whole-body counting mea-surements in this study (R2 � 0.98, P � 0.0001) and in previousstudies (26, 27). For heme-iron absorption, the results were lessstrongly correlated (R2 � 0.56, P � 0.0001) when results fromblood isotope measurements were compared with those fromwhole-body counting (as in equation 4 above). The latter methodassumes that the heme- and nonheme-iron labels are similarlyincorporated into erythrocytes.
Diet analysis
The iron content of the test meals was measured after aciddigestion (28) by using inductively coupled argon plasma emis-sion spectrophotometry. Mean (�SD) analyses of standard ref-erence materials from the National Institute of Standards andTechnology were 95 � 9% of certified values. Nonheme iron inthe test meal was extracted to minimize pigment breakdown (29)and analyzed by the same digestion and inductively coupledargon plasma methods. Heme iron in the test meal was calculatedas the difference between total and nonheme iron. Our previousanalyses indicated that cooking procedures (baking and briefreheating by microwave) did not affect the heme-iron content ofmeat.
Other analyses
Hemoglobin and hematocrit were measured with the use of aCell-Dyne 3500 System (Abbott Laboratories, Abbott Park, IL).Serum iron was measured colorimetrically by using a Cobas Fara
EFFECTS OF CALCIUM ON INITIAL MUCOSAL UPTAKE AND IRON RETENTION 591
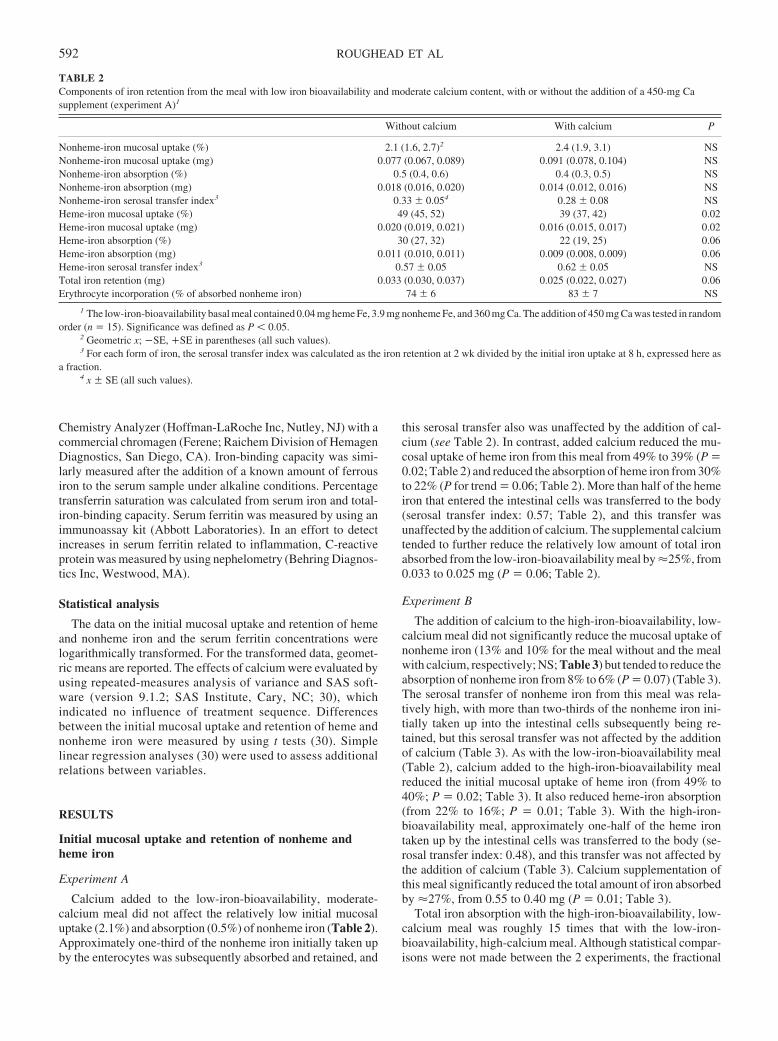
Chemistry Analyzer (Hoffman-LaRoche Inc, Nutley, NJ) with acommercial chromagen (Ferene; Raichem Division of HemagenDiagnostics, San Diego, CA). Iron-binding capacity was simi-larly measured after the addition of a known amount of ferrousiron to the serum sample under alkaline conditions. Percentagetransferrin saturation was calculated from serum iron and total-iron-binding capacity. Serum ferritin was measured by using animmunoassay kit (Abbott Laboratories). In an effort to detectincreases in serum ferritin related to inflammation, C-reactiveprotein was measured by using nephelometry (Behring Diagnos-tics Inc, Westwood, MA).
Statistical analysis
The data on the initial mucosal uptake and retention of hemeand nonheme iron and the serum ferritin concentrations werelogarithmically transformed. For the transformed data, geomet-ric means are reported. The effects of calcium were evaluated byusing repeated-measures analysis of variance and SAS soft-ware (version 9.1.2; SAS Institute, Cary, NC; 30), whichindicated no influence of treatment sequence. Differencesbetween the initial mucosal uptake and retention of heme andnonheme iron were measured by using t tests (30). Simplelinear regression analyses (30) were used to assess additionalrelations between variables.
RESULTS
Initial mucosal uptake and retention of nonheme andheme iron
Experiment A
Calcium added to the low-iron-bioavailability, moderate-calcium meal did not affect the relatively low initial mucosaluptake (2.1%) and absorption (0.5%) of nonheme iron (Table 2).Approximately one-third of the nonheme iron initially taken upby the enterocytes was subsequently absorbed and retained, and
this serosal transfer also was unaffected by the addition of cal-cium (see Table 2). In contrast, added calcium reduced the mu-cosal uptake of heme iron from this meal from 49% to 39% (P �0.02; Table 2) and reduced the absorption of heme iron from 30%to 22% (P for trend � 0.06; Table 2). More than half of the hemeiron that entered the intestinal cells was transferred to the body(serosal transfer index: 0.57; Table 2), and this transfer wasunaffected by the addition of calcium. The supplemental calciumtended to further reduce the relatively low amount of total ironabsorbed from the low-iron-bioavailability meal by �25%, from0.033 to 0.025 mg (P � 0.06; Table 2).
Experiment B
The addition of calcium to the high-iron-bioavailability, low-calcium meal did not significantly reduce the mucosal uptake ofnonheme iron (13% and 10% for the meal without and the mealwith calcium, respectively; NS; Table 3) but tended to reduce theabsorption of nonheme iron from 8% to 6% (P � 0.07) (Table 3).The serosal transfer of nonheme iron from this meal was rela-tively high, with more than two-thirds of the nonheme iron ini-tially taken up into the intestinal cells subsequently being re-tained, but this serosal transfer was not affected by the additionof calcium (Table 3). As with the low-iron-bioavailability meal(Table 2), calcium added to the high-iron-bioavailability mealreduced the initial mucosal uptake of heme iron (from 49% to40%; P � 0.02; Table 3). It also reduced heme-iron absorption(from 22% to 16%; P � 0.01; Table 3). With the high-iron-bioavailability meal, approximately one-half of the heme irontaken up by the intestinal cells was transferred to the body (se-rosal transfer index: 0.48), and this transfer was not affected bythe addition of calcium (Table 3). Calcium supplementation ofthis meal significantly reduced the total amount of iron absorbedby �27%, from 0.55 to 0.40 mg (P � 0.01; Table 3).
Total iron absorption with the high-iron-bioavailability, low-calcium meal was roughly 15 times that with the low-iron-bioavailability, high-calcium meal. Although statistical compar-isons were not made between the 2 experiments, the fractional
TABLE 2Components of iron retention from the meal with low iron bioavailability and moderate calcium content, with or without the addition of a 450-mg Casupplement (experiment A)1
Without calcium With calcium P
Nonheme-iron mucosal uptake (%) 2.1 (1.6, 2.7)2 2.4 (1.9, 3.1) NSNonheme-iron mucosal uptake (mg) 0.077 (0.067, 0.089) 0.091 (0.078, 0.104) NSNonheme-iron absorption (%) 0.5 (0.4, 0.6) 0.4 (0.3, 0.5) NSNonheme-iron absorption (mg) 0.018 (0.016, 0.020) 0.014 (0.012, 0.016) NSNonheme-iron serosal transfer index3 0.33 � 0.054 0.28 � 0.08 NSHeme-iron mucosal uptake (%) 49 (45, 52) 39 (37, 42) 0.02Heme-iron mucosal uptake (mg) 0.020 (0.019, 0.021) 0.016 (0.015, 0.017) 0.02Heme-iron absorption (%) 30 (27, 32) 22 (19, 25) 0.06Heme-iron absorption (mg) 0.011 (0.010, 0.011) 0.009 (0.008, 0.009) 0.06Heme-iron serosal transfer index3 0.57 � 0.05 0.62 � 0.05 NSTotal iron retention (mg) 0.033 (0.030, 0.037) 0.025 (0.022, 0.027) 0.06Erythrocyte incorporation (% of absorbed nonheme iron) 74 � 6 83 � 7 NS
1 The low-iron-bioavailability basal meal contained 0.04 mg heme Fe, 3.9 mg nonheme Fe, and 360 mg Ca. The addition of 450 mg Ca was tested in randomorder (n � 15). Significance was defined as P � 0.05.
2 Geometric x; �SE, �SE in parentheses (all such values).3 For each form of iron, the serosal transfer index was calculated as the iron retention at 2 wk divided by the initial iron uptake at 8 h, expressed here as
a fraction.4 x � SE (all such values).
592 ROUGHEAD ET AL
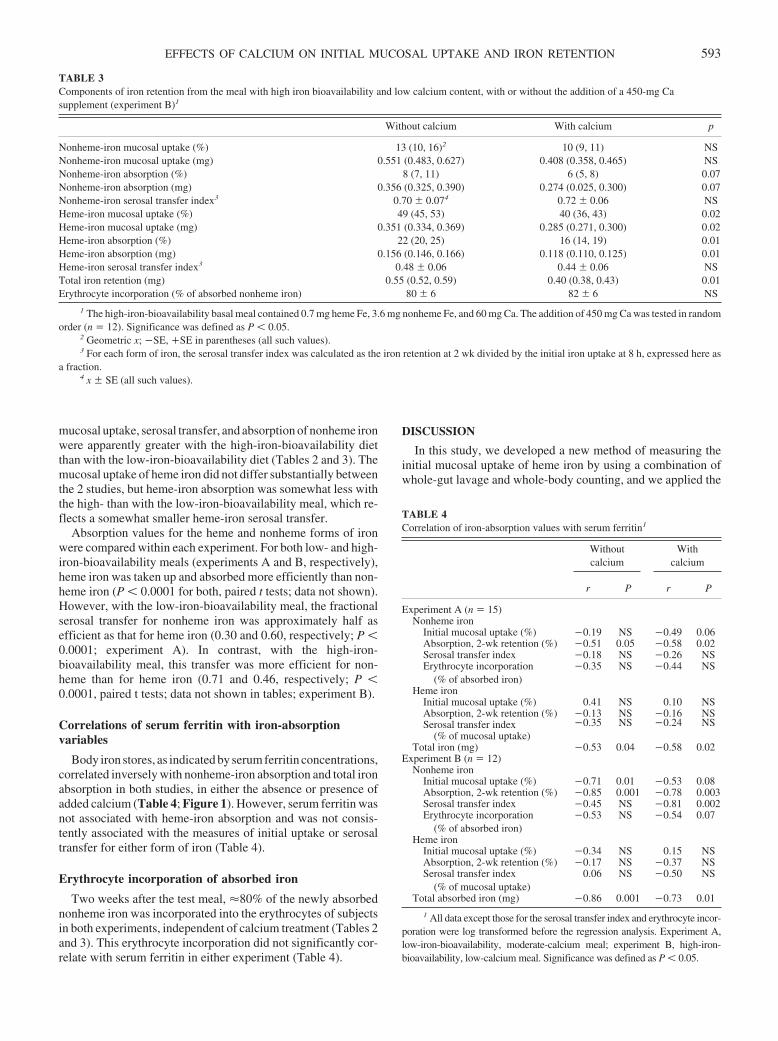
mucosal uptake, serosal transfer, and absorption of nonheme ironwere apparently greater with the high-iron-bioavailability dietthan with the low-iron-bioavailability diet (Tables 2 and 3). Themucosal uptake of heme iron did not differ substantially betweenthe 2 studies, but heme-iron absorption was somewhat less withthe high- than with the low-iron-bioavailability meal, which re-flects a somewhat smaller heme-iron serosal transfer.
Absorption values for the heme and nonheme forms of ironwere compared within each experiment. For both low- and high-iron-bioavailability meals (experiments A and B, respectively),heme iron was taken up and absorbed more efficiently than non-heme iron (P � 0.0001 for both, paired t tests; data not shown).However, with the low-iron-bioavailability meal, the fractionalserosal transfer for nonheme iron was approximately half asefficient as that for heme iron (0.30 and 0.60, respectively; P �0.0001; experiment A). In contrast, with the high-iron-bioavailability meal, this transfer was more efficient for non-heme than for heme iron (0.71 and 0.46, respectively; P �0.0001, paired t tests; data not shown in tables; experiment B).
Correlations of serum ferritin with iron-absorptionvariables
Body iron stores, as indicated by serum ferritin concentrations,correlated inversely with nonheme-iron absorption and total ironabsorption in both studies, in either the absence or presence ofadded calcium (Table 4; Figure 1). However, serum ferritin wasnot associated with heme-iron absorption and was not consis-tently associated with the measures of initial uptake or serosaltransfer for either form of iron (Table 4).
Erythrocyte incorporation of absorbed iron
Two weeks after the test meal, �80% of the newly absorbednonheme iron was incorporated into the erythrocytes of subjectsin both experiments, independent of calcium treatment (Tables 2and 3). This erythrocyte incorporation did not significantly cor-relate with serum ferritin in either experiment (Table 4).
DISCUSSION
In this study, we developed a new method of measuring theinitial mucosal uptake of heme iron by using a combination ofwhole-gut lavage and whole-body counting, and we applied the
TABLE 3Components of iron retention from the meal with high iron bioavailability and low calcium content, with or without the addition of a 450-mg Casupplement (experiment B)1
Without calcium With calcium p
Nonheme-iron mucosal uptake (%) 13 (10, 16)2 10 (9, 11) NSNonheme-iron mucosal uptake (mg) 0.551 (0.483, 0.627) 0.408 (0.358, 0.465) NSNonheme-iron absorption (%) 8 (7, 11) 6 (5, 8) 0.07Nonheme-iron absorption (mg) 0.356 (0.325, 0.390) 0.274 (0.025, 0.300) 0.07Nonheme-iron serosal transfer index3 0.70 � 0.074 0.72 � 0.06 NSHeme-iron mucosal uptake (%) 49 (45, 53) 40 (36, 43) 0.02Heme-iron mucosal uptake (mg) 0.351 (0.334, 0.369) 0.285 (0.271, 0.300) 0.02Heme-iron absorption (%) 22 (20, 25) 16 (14, 19) 0.01Heme-iron absorption (mg) 0.156 (0.146, 0.166) 0.118 (0.110, 0.125) 0.01Heme-iron serosal transfer index3 0.48 � 0.06 0.44 � 0.06 NSTotal iron retention (mg) 0.55 (0.52, 0.59) 0.40 (0.38, 0.43) 0.01Erythrocyte incorporation (% of absorbed nonheme iron) 80 � 6 82 � 6 NS
1 The high-iron-bioavailability basal meal contained 0.7 mg heme Fe, 3.6 mg nonheme Fe, and 60 mg Ca. The addition of 450 mg Ca was tested in randomorder (n � 12). Significance was defined as P � 0.05.
2 Geometric x; �SE, �SE in parentheses (all such values).3 For each form of iron, the serosal transfer index was calculated as the iron retention at 2 wk divided by the initial iron uptake at 8 h, expressed here as
a fraction.4 x � SE (all such values).
TABLE 4Correlation of iron-absorption values with serum ferritin1
Withoutcalcium
Withcalcium
r P r P
Experiment A (n � 15)Nonheme iron
Initial mucosal uptake (%) �0.19 NS �0.49 0.06Absorption, 2-wk retention (%) �0.51 0.05 �0.58 0.02Serosal transfer index �0.18 NS �0.26 NSErythrocyte incorporation
(% of absorbed iron)�0.35 NS �0.44 NS
Heme ironInitial mucosal uptake (%) 0.41 NS 0.10 NSAbsorption, 2-wk retention (%) �0.13 NS �0.16 NSSerosal transfer index
(% of mucosal uptake)�0.35 NS �0.24 NS
Total iron (mg) �0.53 0.04 �0.58 0.02Experiment B (n � 12)
Nonheme ironInitial mucosal uptake (%) �0.71 0.01 �0.53 0.08Absorption, 2-wk retention (%) �0.85 0.001 �0.78 0.003Serosal transfer index �0.45 NS �0.81 0.002Erythrocyte incorporation
(% of absorbed iron)�0.53 NS �0.54 0.07
Heme ironInitial mucosal uptake (%) �0.34 NS 0.15 NSAbsorption, 2-wk retention (%) �0.17 NS �0.37 NSSerosal transfer index
(% of mucosal uptake)0.06 NS �0.50 NS
Total absorbed iron (mg) �0.86 0.001 �0.73 0.01
1 All data except those for the serosal transfer index and erythrocyte incor-poration were log transformed before the regression analysis. Experiment A,low-iron-bioavailability, moderate-calcium meal; experiment B, high-iron-bioavailability, low-calcium meal. Significance was defined as P � 0.05.
EFFECTS OF CALCIUM ON INITIAL MUCOSAL UPTAKE AND IRON RETENTION 593
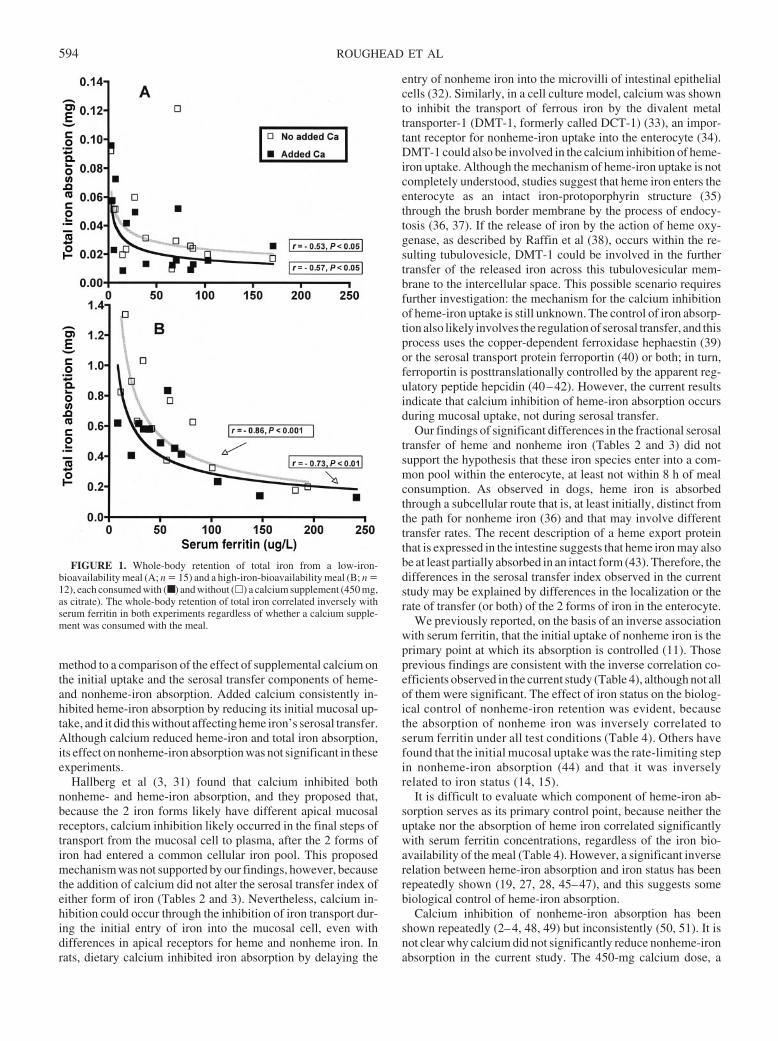
method to a comparison of the effect of supplemental calcium onthe initial uptake and the serosal transfer components of heme-and nonheme-iron absorption. Added calcium consistently in-hibited heme-iron absorption by reducing its initial mucosal up-take, and it did this without affecting heme iron’s serosal transfer.Although calcium reduced heme-iron and total iron absorption,its effect on nonheme-iron absorption was not significant in theseexperiments.
Hallberg et al (3, 31) found that calcium inhibited bothnonheme- and heme-iron absorption, and they proposed that,because the 2 iron forms likely have different apical mucosalreceptors, calcium inhibition likely occurred in the final steps oftransport from the mucosal cell to plasma, after the 2 forms ofiron had entered a common cellular iron pool. This proposedmechanism was not supported by our findings, however, becausethe addition of calcium did not alter the serosal transfer index ofeither form of iron (Tables 2 and 3). Nevertheless, calcium in-hibition could occur through the inhibition of iron transport dur-ing the initial entry of iron into the mucosal cell, even withdifferences in apical receptors for heme and nonheme iron. Inrats, dietary calcium inhibited iron absorption by delaying the
entry of nonheme iron into the microvilli of intestinal epithelialcells (32). Similarly, in a cell culture model, calcium was shownto inhibit the transport of ferrous iron by the divalent metaltransporter-1 (DMT-1, formerly called DCT-1) (33), an impor-tant receptor for nonheme-iron uptake into the enterocyte (34).DMT-1 could also be involved in the calcium inhibition of heme-iron uptake. Although the mechanism of heme-iron uptake is notcompletely understood, studies suggest that heme iron enters theenterocyte as an intact iron-protoporphyrin structure (35)through the brush border membrane by the process of endocy-tosis (36, 37). If the release of iron by the action of heme oxy-genase, as described by Raffin et al (38), occurs within the re-sulting tubulovesicle, DMT-1 could be involved in the furthertransfer of the released iron across this tubulovesicular mem-brane to the intercellular space. This possible scenario requiresfurther investigation: the mechanism for the calcium inhibitionof heme-iron uptake is still unknown. The control of iron absorp-tion also likely involves the regulation of serosal transfer, and thisprocess uses the copper-dependent ferroxidase hephaestin (39)or the serosal transport protein ferroportin (40) or both; in turn,ferroportin is posttranslationally controlled by the apparent reg-ulatory peptide hepcidin (40–42). However, the current resultsindicate that calcium inhibition of heme-iron absorption occursduring mucosal uptake, not during serosal transfer.
Our findings of significant differences in the fractional serosaltransfer of heme and nonheme iron (Tables 2 and 3) did notsupport the hypothesis that these iron species enter into a com-mon pool within the enterocyte, at least not within 8 h of mealconsumption. As observed in dogs, heme iron is absorbedthrough a subcellular route that is, at least initially, distinct fromthe path for nonheme iron (36) and that may involve differenttransfer rates. The recent description of a heme export proteinthat is expressed in the intestine suggests that heme iron may alsobe at least partially absorbed in an intact form (43). Therefore, thedifferences in the serosal transfer index observed in the currentstudy may be explained by differences in the localization or therate of transfer (or both) of the 2 forms of iron in the enterocyte.
We previously reported, on the basis of an inverse associationwith serum ferritin, that the initial uptake of nonheme iron is theprimary point at which its absorption is controlled (11). Thoseprevious findings are consistent with the inverse correlation co-efficients observed in the current study (Table 4), although not allof them were significant. The effect of iron status on the biolog-ical control of nonheme-iron retention was evident, becausethe absorption of nonheme iron was inversely correlated toserum ferritin under all test conditions (Table 4). Others havefound that the initial mucosal uptake was the rate-limiting stepin nonheme-iron absorption (44) and that it was inverselyrelated to iron status (14, 15).
It is difficult to evaluate which component of heme-iron ab-sorption serves as its primary control point, because neither theuptake nor the absorption of heme iron correlated significantlywith serum ferritin concentrations, regardless of the iron bio-availability of the meal (Table 4). However, a significant inverserelation between heme-iron absorption and iron status has beenrepeatedly shown (19, 27, 28, 45–47), and this suggests somebiological control of heme-iron absorption.
Calcium inhibition of nonheme-iron absorption has beenshown repeatedly (2–4, 48, 49) but inconsistently (50, 51). It isnot clear why calcium did not significantly reduce nonheme-ironabsorption in the current study. The 450-mg calcium dose, a
FIGURE 1. Whole-body retention of total iron from a low-iron-bioavailability meal (A; n � 15) and a high-iron-bioavailability meal (B; n �12), each consumed with (■ ) and without (�) a calcium supplement (450 mg,as citrate). The whole-body retention of total iron correlated inversely withserum ferritin in both experiments regardless of whether a calcium supple-ment was consumed with the meal.
594 ROUGHEAD ET AL
common dose in supplements, was chosen to be sufficient formaximal inhibition of nonheme-iron absorption. It has beenshown that calcium inhibits nonheme-iron absorption by 40–60% at doses between 165 and 300 mg, and that there is no furtherinhibition as the dose exceeds 300 mg (3). The relatively high(360 mg) basal calcium content of the current low-iron-bioavailability meal may have minimized any calcium inhibitionof nonheme iron that was already poorly absorbed (experimentA; Table 2). However, Cook et al (2) observed calcium inhibition(55%) of nonheme-iron absorption from a similar low-iron-bioavailability, high-calcium meal. In the current study, the useof calcium in the citrate form may have influenced the results; ina study by Cook et al (2), the citrate form was less inhibitory thanwas calcium carbonate or calcium phosphate when tested with ahigh-iron-bioavailability meal. However, the current results in-cluded a nonsignificant decrease (�20%, Table 2) in nonheme-iron absorption with the low-iron-bioavailability meal and anearly significant decrease (�25%; P � 0.07; Table 3) with thehigh-iron-bioavailability meal. Because these nonheme iron re-sults contributed to reductions in the total amount of iron ab-sorbed (0.008 and 0.15 mg for experiments A and B, respec-tively) that far exceeded the reductions observed with heme ironalone (0.002 and 0.038 mg), we concluded that the nonsignificantdecrease in nonheme-iron absorption also contributed to theoverall reduction in iron absorption.
The initial uptake of heme iron from the meals in the currentstudy was 49%, irrespective of iron bioavailability and basalcalcium content (Tables 2 and 3). The addition of 450 mg calciuminhibited this initial uptake by �20% and inhibited heme-ironabsorption by �27% with both meals (Tables 2 and 3). Thissuggests that the inhibiting effect of calcium on heme-iron ab-sorption was not influenced by the basal calcium concentration(360 mg in experiment A and 60 mg in experiment B). Themagnitude of calcium inhibition was similar for the 2 forms ofiron (a nonsignificant or marginally significant inhibition of 20–25% for nonheme and a significant inhibition of 27% for heme),which is consistent with another report of similar but greaterinhibition (�40–50%) with the 2 forms of iron (31).
Some have questioned the use of single test meals, rather thanwhole diets, in studies of iron absorption. The nonsignificanteffect of calcium on nonheme-iron absorption in one study ofwhole diets may have been the result of incomplete control of theexperimental diets (52). Much as was seen in the current single-meal study, when weighed diets were tested under controlledconditions, reductions of 10–31% with �800 mg calcium fromdifferent sources were not significant with a 4-d diet (51). Incontrast, another whole-diet study showed that a redistribution ofcalcium sources (milk and cheese) from breakfast and an eveningsnack only to all meals of a 10-d diet, including lunches anddinners with iron from meat, poultry, or fish, significantly re-duced total iron absorption by �25% (53).
The current study and most of those cited above evaluated onlythe short-term effect of calcium on iron absorption. Althoughnonheme-iron absorption partially adapts to changes in ironbioavailability (26, 54) and intake (27), differences in ironbioavailability do not change iron status within several weeks (26,54), and in fact it may require several years for the iron status tochange (50). Consistent with this possibility, calcium supplemen-tation for several months did not affect serum ferritin in premeno-pausal women (55, 56), lactating women (57), or healthy adults ofboth sexes (49). Nonetheless, the long-term use of dietary calcium
salts in supplements and fortificants may further increase the risk ofiron deficiency in women who are having difficulty in meeting theiriron requirements.
In summary, whole-gut lavage and whole-body counting pro-cedures were successfully used in a new method to provide thefirst estimates of the initial mucosal uptake of heme iron from 2test meals with different iron bioavailability. Consumption of acalcium supplement reduced the total iron absorbed, primarily byreducing the initial uptake of heme iron. Differences in the trans-fer of heme and nonheme iron from the mucosal cell into thebloodstream suggest that the 2 forms of iron did not join a com-mon pool immediately after uptake into the mucosal cells.
We gratefully acknowledge the invaluable assistance of Jennifer Hansonin performing the radioiron analyses. We thank Emily Nielsen, who managedthe recruitment and scheduling of the volunteers; Brenda Hanson, DebbieKrause, and Bonnie Hoverson, who supervised the service of test meals;Jackie Nelson, who performed the whole-body counting; Sandy Gallagher,who supervised the clinical laboratory analyses; Glenn Lykken, who pro-vided consultation on the use of the whole-body counter; and LuAnn John-son, who performed the statistical analyses. Finally, we are deeply indebtedto the participants for their willingness to take part in this study.
All coauthors contributed to the design and implementation of the re-search. CAZ planned and implemented the radioiron analyses of blood andurine and the related quality controls. Both ZKR and JRH critically inter-preted the data and revised the manuscript. ZKR wrote the original draft of themanuscript. The authors were employees of the US Department of Agricul-ture–Agricultural Research Service. None of the authors had any personal orfinancial conflict of interest.
REFERENCES1. Anderson H, McDonough K, Elvehjem C. Relation of the dietary
calcium-phosphorus ratio to iron assimilation. J Clin Med 1940;25:464 –71.
2. Cook JD, Dassenko SA, Whittaker P. Calcium supplementation: effecton iron absorption. Am J Clin Nutr 1991;53:106–11.
3. Hallberg L, Brune M, Erlandsson M, Sandberg AS, Rossander-Hulten L.Calcium: effect of different amounts on nonheme- and heme-iron ab-sorption in humans. Am J Clin Nutr 1991;53:112–9.
4. Hallberg L, Rossander-Hulten L, Brune M, Gleerup A. Calcium and ironabsorption: mechanism of action and nutritional importance. Eur J ClinNutr 1992;46:317–27.
5. Deehr MS, Dallal GE, Smith KT, Taulbee JD, Dawson-Hughes B. Ef-fects of different calcium sources on iron absorption in postmenopausalwomen. Am J Clin Nutr 1990;51:95–9.
6. Food and Nutrition Board, Institute of Medicine. Dietary reference in-takes for calcium, phosphorus, magnesium, vitamin D, and fluoride.Washington, DC: National Academy Press, 1999.
7. NIH Consensus Conference. Optimal calcium intake. NIH ConsensusDevelopment Panel on Optimal Calcium Intake. JAMA 1994;272:1942–8.
8. Marwick C. Consensus panel considers osteoporosis. JAMA 2000;283:2093–5.
9. Whiting SJ. The inhibitory effect of dietary calcium on iron bioavail-ability: a cause for concern? Nutr Rev 1995;53:77–80.
10. Lonnerdal B. Does a high dietary intake of calcium adversely affect ironstatus in humans? Scand J Nutr 1999;43:82–4.
11. Roughead ZK, Zito CA, Hunt JR. Initial uptake and absorption of non-heme iron and absorption of heme iron in humans are unaffected by theaddition of calcium as cheese to a meal with high iron bioavailability.Am J Clin Nutr 2002;76:419–25.
12. Najean Y, Ardaillou N. Technique de dosage de l’absorption digestivedu fer a l’aide d’un indicateur inerte radio-actif. (Assay technique of thedigestive absorption of iron using a radioactive inert indicator. ) NouvRev Fr Hematol 1963;3:82–3 (in French).
13. Boender CA, Verloop MC. Iron absorption, iron loss and iron retentionin man: studies after oral administration of a tracer dose of FeSO4 andBaSO4. Br J Haematol 1969;17:45–58.
14. Powell LW, Campbell CB, Wilson E. Intestinal mucosal uptake of iron
EFFECTS OF CALCIUM ON INITIAL MUCOSAL UPTAKE AND IRON RETENTION 595
and iron retention in idiopathic haemochromatosis as evidence for amucosal abnormality. Gut 1970;11:727–31.
15. Marx JJM. Mucosal uptake, mucosal transfer and retention of iron,measured by whole body counting. Scand J Haematol 1979;23:293–302.
16. Cummings JH, Jenkins DJA, Wiggins HS. Measurement of mean transittime of dietary residue through the human gut. Gut 1976;17:210–8.
17. Powell LA, Halliday JW. Iron absorption and iron overload. Clin Gas-troenterol 1981;10:707–35.
18. Harland BF, Oberleas D. Phytate in foods. World Rev Nutr Diet 1987;52:235–59.
19. Lynch SR, Skikne BS, Cook JD. Food iron absorption in idiopathichemochromatosis. Blood 1989;74:2187–93.
20. Schuette SA, Janghorbani M, Young VR, Weaver CM. Dysprosium as anonabsorbable marker for studies of mineral absorption with stable iso-tope tracers in human subjects. J Am Coll Nutr 1993;12:307–15.
21. Dawson RB, Rafal S, Weintraub LR. Absorption of hemoglobin iron: therole of xanthine oxidase in the intestinal heme-splitting reaction. Blood1970;35:94–103.
22. Lykken GI, Ong HS, Alkhatib HA, Harris TR, Momcilovic B, Pen-land JG. Perquisite spin-off from twenty-two years of measuringbackground in the whole body counter steel room. Ann N Y Acad Sci2000;904:267–70.
23. Bothwell TH, Charlton RW, Cook JD, Finch CA. Iron metabolism inman. London, United Kingdom: Blackwell Scientific Publications,1979.
24. Wennesland R, Brown E, Hopper J, et al. Red cell, plasma and bloodvolume in healthy men measured by radiochromium (Cr51) cell taggingand hematocrit: influence of age, somatotype and habits of physicalactivity on variance after regression of volumes to height and weightcombined. J Clin Invest 1959;38:1065–77.
25. Brown E, Hopper J, Hodges JL, Bradley B, Wennesland R, Yamauchi H.Red cell, plasma, and blood volume in healthy women measured byradiochromium cell-labeling and hematocrit. J Clin Invest1962;41:2182–90.
26. Hunt JR, Roughead ZK. Adaptation of iron absorption in men consum-ing diets with high or low iron bioavailability. Am J Clin Nutr 2000;71:94–102.
27. Roughead ZK, Hunt JR. Adaptation in iron absorption: iron supplemen-tation reduces nonheme-iron but not heme-iron absorption from food.Am J Clin Nutr 2000;72:982–9.
28. Hallberg L, Hulten L, Gramatkovski E. Iron absorption from the wholediet in men: how effective is the regulation of iron absorption? Am J ClinNutr 1997;66:347–56.
29. Rhee KS, Ziprin YA. Modification of the Schricker nonheme ironmethod to minimize pigment effects for red meats. J Food Sci 1987;52:1174–6.
30. SAS Institute Inc. SAS Onlinedoc, version 9.1.2. Cary, NC: SAS Insti-tute, Inc, 2004.
31. Hallberg L, Rossander-Hulthen L, Brune M, Gleerup A. Inhibition ofhaem-iron absorption in man by calcium. Br J Nutr 1992;69:533–40.
32. Barton JC, Conrad ME, Parmley RT. Calcium inhibition of inorganiciron absorption in rats. Gastroenterology 1983;84:90–101.
33. Gunshin H, Mackenzie B, Berger UV, et al. Cloning and characterizationof a mammalian proton-coupled metal-ion transporter. Nature 1997;388:482–7.
34. Abboud S, Haile DJ. A novel mammalian iron-regulated proteininvolved in intracellular iron metabolism. J Biol Chem 2000;275:19906 –12.
35. Conrad ME, Benjamin BI, Williams HL, Foy AL. Human absorption ofhemoglobin-iron. Gastroenterology 1967;53:5–10.
36. Parmley RT, Barton JC, Conrad ME, Austin RL, Holland RM. Ultra-structural cytochemistry and radioautography of hemoglobin–iron ab-sorption. Exp Mol Pathol 1981;34:131–44.
37. Wyllie JC, Kaufman N. An electron microscopic study of heme uptakeby rat duodenum. Lab Invest 1982;47:471–6.
38. Raffin S, Woo C, Roost K, Price D, Schmid R. Intestinal absorption ofhemoglobin iron-heme cleavage by mucosal heme oxygenase. J ClinInvest 1974;54:1344–52.
39. Vulpe CD, Kuo YM, Murphy TL, et al. Hephaestin, a ceruloplasminhomologue implicated in intestinal iron transport, is defective in the slamouse. Nat Genet 1999;21:195–9.
40. Nemeth E, Tuttle MS, Powelson J, et al. Hepcidin regulates cellular ironefflux by binding to ferroportin and inducing its internalization. Science2004;306:2090–3.
41. Wessling-Resnick M. A possible link between hepcidin and regulationof dietary iron absorption. Nutr Rev 2002;60:371–4.
42. Leong WI, Lonnerdal B. Hepcidin, the recently identified peptide thatappears to regulate iron absorption. J Nutr 2004;134:1–4.
43. QuigleyJG,YangZ,WorthingtonMT,et al. Identificationofahumanhemeexporter that is essential for erythropoiesis. Cell 2004;118:757–66.
44. McLaren GA, Nathanson MH, Saidel GM. Compartmental analysis ofintestinal iron absorption and mucosal iron kinetics. In: Siva Subrama-nian KN, Wastney ME, eds. Models of trace elements and mineralmetabolism during development. Boca Raton, FL: CRC Press, 1995:187–203.
45. Hallberg L, Björn-Rasmussen E. Determination of iron absorption fromwhole diet. A new two-pool model using two radioiron isotopes given ashaem and non-haem iron. Scand J Haematol 1972;9:193–7.
46. Cook JD, Lipschitz DA, Miles LEM, Finch CA. Serum ferritin as ameasure of iron stores in normal subjects. Am J Clin Nutr 1974;27:681–7.
47. Taylor P, Martinez-Torres C, Leets I, Ramirez J, Garcia-Casal MN,Layrisse M. Relationships among iron absorption, percent saturation ofplasma transferrin and serum ferritin concentration in humans. J Nutr1988;118:1110–5.
48. Dawson-Hughes B, Seligson FH, Hughes VA. Effects of calcium car-bonate and hydroxyapatite on zinc and iron retention in postmenopausalwomen. Am J Clin Nutr 1986;44:83–8.
49. Minihane AM, Fairweather-Tait SJ. Effect of calcium supplementationon daily nonheme-iron absorption and long-term iron status. Am J ClinNutr 1998;68:96–102.
50. Hallberg L. Does calcium interfere with iron absorption? Am J Clin Nutr1998;68:3–4.
51. Grinder-Pedersen L, Bukhave K, Jensen M, Hojgaard L, Hansen M.Calcium from milk or calcium-fortified foods does not inhibit nonheme-iron absorption from a whole diet consumed over a 4-d period. Am J ClinNutr 2004;80:404–9.
52. Reddy MB, Cook JD. Effect of calcium intake on nonheme-iron absorp-tion from a complete diet. Am J Clin Nutr 1997;65:1820–5.
53. Gleerup A, Rossander-Hulthen L, Gramatkovski E, Hallberg L. Ironabsorption from the whole diet: comparison of the effect of two differentdistributions of daily calcium intake. Am J Clin Nutr 1995;61:97–104.
54. Hunt JR. High-, but not low-bioavailability diets enable substantial controlof women’s iron absorption in relation to body iron stores, with minimaladaptation within several weeks. Am J Clin Nutr 2003;78:1168–77.
55. Sokoll LJ, Dawson-Hughes B. Calcium supplementation and plasma fer-ritin concentrations in premenopausal women. Am J Clin Nutr 1992;56:1045–8.
56. Yan L, Prentice A, Dibba B, Jarjou LM, Stirling DM, Fairweather-TaitS. The effect of long-term calcium supplementation on indices of iron,zinc and magnesium status in lactating Gambian women. Br J Nutr1996;76:821–31.
57. Kalkwarf HJ, Harrast SD. Effects of calcium supplementation and lac-tation on iron status. Am J Clin Nutr 1998;67:1244–9.
APPENDIX A
The equations in this Appendix denote the calculation of thefractional mucosal uptake (MU) of heme iron (MU 55Fe) usingthe analyzed ratios of 55Fe and 59Fe in the administered doseand in the lavage excreta, as measured by digestion proce-dures, and the mucosal uptake of 59Fe, as measured by whole-body counting.
The ratio of isotopes in the lavage excreta may be written as theratio of the difference between the amount of administered doseand the amount taken up into the body (MU) for each isotope, asin the following equation:
�55Fe/59Fe�lavage � �55Fedose � 55Fedose �MU55Fe��
/�59Fedose � �59Fedose�MU59Fe�� (A1)
where: (55Fe/59Fe)lavage � the ratio of isotopes in the lavageexcreta, 55Fedose � the amount of 55Fe in the dose, 59Fedose � theamount of 59Fe in the dose, MU55Fe � the fractional mucosal
596 ROUGHEAD ET AL

uptake of 55Fe, 55Fedose(MU55Fe) � the amount of mucosal up-take of 55Fe, MU59Fe � the fractional mucosal uptake of 59Fe,and 59Fedose(MU59Fe) � the amount of mucosal uptake of 59Fe.The next step is solving equation A1 for MU55Fe:
MU55Fe � 1 � ��55Fe/59Fe�lavage � �59Fe/55Fe�dose
� �1 � MU59Fe�� (A2)
where: (59Fe/55Fe)dose � the ratio of isotopes in the admin-istered dose. The fractional MU of 59Fe (MU59Fe) may beestimated by the ratio of the 59Fe in the body immediatelyafter the lavage procedure (59Fewbc, lavage) to the 59Fe present
1–3 h after the test meal dosing (59Fewbc, dose), as shown inthe following equation:
MU59Fe � 59Fewbc,lavage/59Fewbc,dose (A3)
and, by substituting the last portion of equation A3 forMU59Fe in equation A2, the following equation is formed:
MU55Fe � 1 � ��55Fe/59Fe�lavage � �59Fe/55Fe�dose
� �1 � 59Fewbc,lavage/59Fewbc,dose�� (A4)
which is the same as equation 3, given earlier in the text.
EFFECTS OF CALCIUM ON INITIAL MUCOSAL UPTAKE AND IRON RETENTION 597
Congenital heart defects and maternal biomarkers of oxidativestress1–4
Charlotte A Hobbs, Mario A Cleves, Weizhi Zhao, Stepan Melnyk, and S Jill James
ABSTRACTBackground: Women who have had pregnancies that were affectedby nonsyndromic congenital heart defects have alterations in thehomocysteine-methionine pathway that may indicate increased ex-posure to oxidative stress or reduced antioxidant defense or both.Objective: Our goal was to establish a maternal metabolic riskprofile for nonsyndromic congenital heart defects that would en-hance current preventive strategies.Design: Using a case-control design, we measured biomarkers of thetranssulfuration pathway in a population-based sample of womenwhose pregnancies were affected by congenital heart defects (331cases) and in a control group of women (125 controls). Plasmaconcentrations of reduced and oxidized glutathione, vitamin B-6,homocysteine, cysteine, cysteinylglycine (CysGly), and glutamyl-cysteine (GluCys) were compared between cases and controls afteradjustment for lifestyle and sociodemographic variables.Results: After covariate adjustment, cases had significantly lowermean plasma concentrations of reduced glutathione (P � 0.0001),GluCys (P � 0.0001), and vitamin B-6 (P � 0.0023) and signifi-cantly higher mean concentrations of homocysteine (P � 0.0001)and oxidized glutathione (P � 0.0001) than did controls.Conclusions: Biomarkers of oxidative stress involved in the trans-sulfuration pathway were significantly higher in women with preg-nancies affected by congenital heart defects than in women withoutsuch a history. Further analysis of relevant biomarkers of oxidativestress and genetic and environmental factors is required to define thebasis for the observed alterations. Identifying the nature and extentof alterations in biomarkers of oxidative stress may suggest primaryintervention strategies and provide clues to a greater understandingof the pathogenesis of congenital heart defects. Am J Clin Nutr2005;82:598–604.
KEY WORDS Birth defects, congenital heart defects, oxida-tive stress, glutathione, homocysteine, folate
INTRODUCTION
Each year in the United States, �150 000 babies are born withbirth defects, the leading cause of infant mortality (1). Amongthese birth defects, congenital heart defects (CHDs) are amongthe most prevalent and the most serious; they occur in �8–10 ofevery 1000 live births (2). Approximately 40% of babies affectedby the most serious CHDs die in infancy (3). More than 85% ofCHDs are thought to result from a complex interaction betweenmaternal exposures and genetic susceptibilities (4).
Multiple studies have suggested that multivitamins containingfolic acid may reduce the risk of CHDs (5–8). Efforts to elucidate
the mechanism by which folic acid exerts a protective effect haveevaluated the metabolism of 3 folate-dependent pathways—DNA nucleotide synthesis pathway, homocysteine-methioninepathway, and glutathione-transsulfuration pathway (Figure 1).
To better understand the role of folate-dependent pathways inthe occurrence of CHDs, we measured plasma concentrations ofmetabolites of the homocysteine-methionine pathway in womenwho had pregnancies that were affected by CHD and in controls(9). We and others found that women with CHD-affected preg-nancies had higher plasma homocysteine concentrations than didwomen with unaffected pregnancies (9, 10). We postulated thatelevated homocysteine may either have a direct teratogeniceffect or exert a negative effect on the developing embryonicheart through alterations in remethylation or transsulfuration orboth (9).
The metabolic pathway from homocysteine to glutathione isreferred to as the transsulfuration pathway. Approximately 50%of homocysteine generated from methionine is metabolized tocystathionine. This is an irreversible reaction that permanentlyremoves homocysteine from the methionine cycle for the syn-thesis of cysteine and glutathione (11). Elevated homocysteine isassociated with alterations in the transsulfuration pathway thatlead to greater oxidative stress (12). Experimental models havesuggested that, in addition to evidence of a direct teratogeniceffect, elevated homocysteine may have an indirect embryotoxic
1 From the Department of Pediatrics, College of Medicine, University ofArkansas for Medical Sciences, Little Rock, AR, and the Arkansas Chil-dren’s Hospital Research Institute, Little Rock, AR.
2 The contents of this article are solely the responsibility of the authors anddo not necessarily represent the official views of the Centers for DiseaseControl and Prevention, the National Institutes of Health, or the ArkansasBiosciences Institute.
3 Supported by grants from the National Institute of Child Health andHuman Development (5RO1 HD39054-05) and the National Center for Re-search Resources (1C06 RR16517-01 and 3C06 RR16517-01S1); by Coop-erative Agreement No. U50/CCU613236-08 from the Centers for DiseaseControl and Prevention; and by the Arkansas Biosciences Institute, a part-nership of scientists from Arkansas Children’s Hospital, Arkansas StateUniversity, the University of Arkansas, Division of Agriculture, the Univer-sity of Arkansas, Fayetteville, and the University of Arkansas for MedicalSciences.
4 Reprints not available. Address correspondence to C Hobbs, Departmentof Pediatrics, University of Arkansas for Medical Sciences, College of Med-icine, 11219 Financial Centre Parkway, Suite 250, Little Rock, AR 72211.E-mail: [email protected].
Received January 14, 2005.Accepted for publication June 2, 2005.
598 Am J Clin Nutr 2005;82:598–604. Printed in USA. © 2005 American Society for Clinical Nutrition
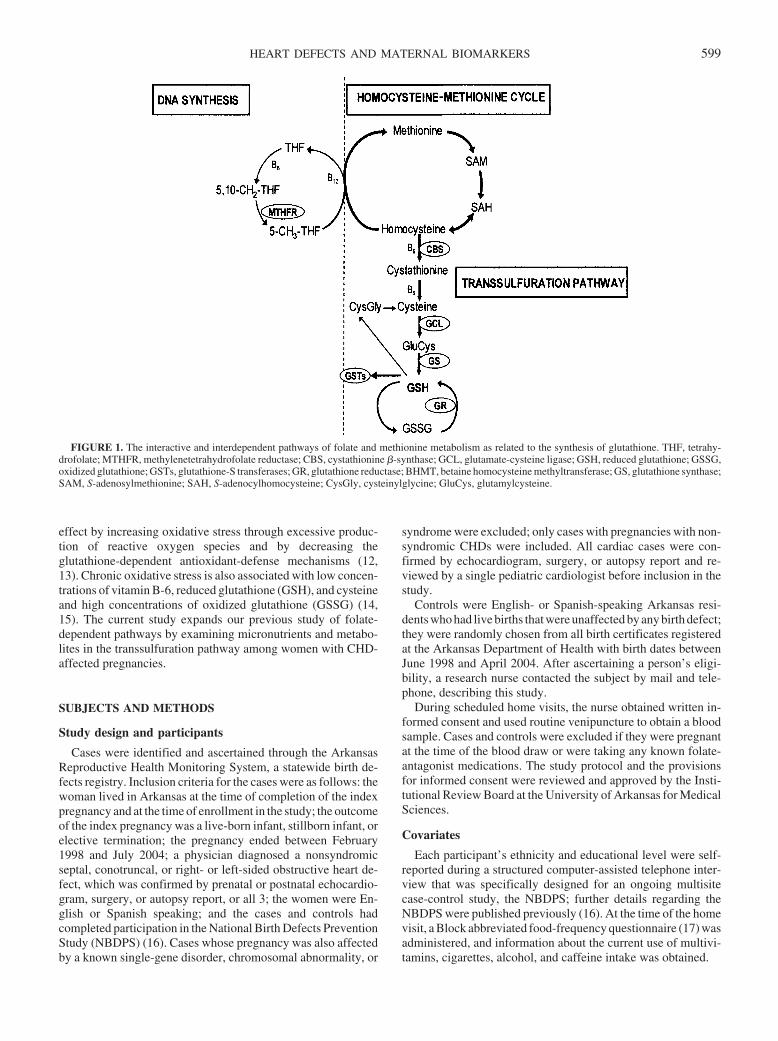
effect by increasing oxidative stress through excessive produc-tion of reactive oxygen species and by decreasing theglutathione-dependent antioxidant-defense mechanisms (12,13). Chronic oxidative stress is also associated with low concen-trations of vitamin B-6, reduced glutathione (GSH), and cysteineand high concentrations of oxidized glutathione (GSSG) (14,15). The current study expands our previous study of folate-dependent pathways by examining micronutrients and metabo-lites in the transsulfuration pathway among women with CHD-affected pregnancies.
SUBJECTS AND METHODS
Study design and participants
Cases were identified and ascertained through the ArkansasReproductive Health Monitoring System, a statewide birth de-fects registry. Inclusion criteria for the cases were as follows: thewoman lived in Arkansas at the time of completion of the indexpregnancy and at the time of enrollment in the study; the outcomeof the index pregnancy was a live-born infant, stillborn infant, orelective termination; the pregnancy ended between February1998 and July 2004; a physician diagnosed a nonsyndromicseptal, conotruncal, or right- or left-sided obstructive heart de-fect, which was confirmed by prenatal or postnatal echocardio-gram, surgery, or autopsy report, or all 3; the women were En-glish or Spanish speaking; and the cases and controls hadcompleted participation in the National Birth Defects PreventionStudy (NBDPS) (16). Cases whose pregnancy was also affectedby a known single-gene disorder, chromosomal abnormality, or
syndrome were excluded; only cases with pregnancies with non-syndromic CHDs were included. All cardiac cases were con-firmed by echocardiogram, surgery, or autopsy report and re-viewed by a single pediatric cardiologist before inclusion in thestudy.
Controls were English- or Spanish-speaking Arkansas resi-dents who had live births that were unaffected by any birth defect;they were randomly chosen from all birth certificates registeredat the Arkansas Department of Health with birth dates betweenJune 1998 and April 2004. After ascertaining a person’s eligi-bility, a research nurse contacted the subject by mail and tele-phone, describing this study.
During scheduled home visits, the nurse obtained written in-formed consent and used routine venipuncture to obtain a bloodsample. Cases and controls were excluded if they were pregnantat the time of the blood draw or were taking any known folate-antagonist medications. The study protocol and the provisionsfor informed consent were reviewed and approved by the Insti-tutional Review Board at the University of Arkansas for MedicalSciences.
Covariates
Each participant’s ethnicity and educational level were self-reported during a structured computer-assisted telephone inter-view that was specifically designed for an ongoing multisitecase-control study, the NBDPS; further details regarding theNBDPS were published previously (16). At the time of the homevisit, a Block abbreviated food-frequency questionnaire (17) wasadministered, and information about the current use of multivi-tamins, cigarettes, alcohol, and caffeine intake was obtained.
FIGURE 1. The interactive and interdependent pathways of folate and methionine metabolism as related to the synthesis of glutathione. THF, tetrahy-drofolate; MTHFR, methylenetetrahydrofolate reductase; CBS, cystathionine �-synthase; GCL, glutamate-cysteine ligase; GSH, reduced glutathione; GSSG,oxidized glutathione; GSTs, glutathione-S transferases; GR, glutathione reductase; BHMT, betaine homocysteine methyltransferase; GS, glutathione synthase;SAM, S-adenosylmethionine; SAH, S-adenocylhomocysteine; CysGly, cysteinylglycine; GluCys, glutamylcysteine.
HEART DEFECTS AND MATERNAL BIOMARKERS 599
Sample preparation and biomarker measurement
Blood samples were collected into evacuated tubes (B-D Bio-sciences, Dallas, TX) containing EDTA and immediately chilledon ice before being centrifuged at 4000 � g for 10 min at 4 °C.Plasma aliquots were transferred into cryostat tubes and stored at�80 °C until extraction and HPLC quantification.
To measure total homocysteine, cysteine, and GSH concen-trations, 50 �L of a freshly prepared solution to reduce all sulf-hydryl bonds (1.43 mmol sodium borohydride/L, 1.5 �molEDTA/L, 66 mmol NaOH/L, and 10 �L isoamyl alcohol wasadded to 200 �L plasma. The samples were incubated at 40 °C ina shaker for 30 min. To precipitate proteins, 250 �L ice-cold 10%metaphosphoric acid was added and mixed well, and samples wereincubated for an additional 10 min on ice. After centrifugation at18 000 � g for 15 min at 4 °C, the supernatant fluid was filteredthrough a 0.2-�m nylon membrane filter (PGC Scientific, Freder-ick, MD), and a 20-�L aliquot was injected into the HPLC system.
To measure oxidized glutathione (GSSG) concentrations, 100�L of 10% metaphosphoric acid was added to 200 �L plasma toprecipitate proteins; the solution was mixed well and incubatedon ice for 30 min. After centrifugation for 15 min at 18 000 � gat 4 °C, supernatant fluids were passed through a 0.2-�m nylonmembrane filter, and 20 �L was injected into the HPLC system.Plasma concentrations of pyridoxal-5�-phosphate (vitamin B-6)were measured by using an HPLC method developed by Lequeuet al (18) with slight modifications for the use of coulometricelectrochemical detection.
Details of the method for HPLC elution and electrochemicaldetection were described previously (19, 20). Separation of me-tabolites was performed by using HPLC with a Shimadzusolvent-delivery system (model 580; ESA Inc, Chelmsford, MA)and a reverse-phase 5-�m C18 column (4.6 � 150 mm; MCMInc, Tokyo, Japan) obtained from ESA Inc. A 20-�L aliquot ofplasma extract was directly injected onto the column by usingautosamplers from ESA Inc (model 542) or Beckman (model507E; Beckman Instruments, Irvine, CA). All plasma metabo-lites were quantified by using Coulochem II (model 5200A) andCoulArray (model 5600) electrochemical detection systemsequipped with a dual analytic cell (model 5010), a 4-channel ana-lytic cell (model 6210), and a guard cell (model 5020; all from ESAInc). The unknown concentrations of plasma metabolites were cal-culated from peak areas and standard calibration curves with the useof HPLC software.
Statistical analysis
Because of the skewed distribution of these measurements,Wilcoxon’s Mann-Whitney rank-sum test was used to comparealcohol consumption, cigarette smoking, caffeine intake, andinterval between pregnancy and participation. All plasma bi-omarkers exhibited positively skewed distributions; therefore, toachieve normality, biomarker data were log transformed (naturallog) before analysis. Mean log-transformed biomarker concen-trations of cases and controls were compared by using a Student’st test, whereas linear regression was used to adjust these com-parisons for age, race, education level, breastfeeding status, mul-tivitamin supplement intake, smoking, alcohol consumption,caffeine intake, and interval between the end of pregnancy andthe blood draw. Crude and adjusted odds ratios (ORs) and cor-responding 95% CIs for the association between plasma biomar-kers and case or control status were computed by using logistic
regression. Analyses were performed with SAS statistical soft-ware (version 9.1; SAS Institute, Cary, NC).
RESULTS
As shown in Table 1, of the 331 cases and 125 controlsincluded in this study, �77.0% were white. At the time of theblood draw, 63.7% of the cases were �30 y old, and less than half(45.0%) of the cases reported alcohol consumption. There was nosignificant difference between the percentage of cases (44.4%)and the percentage of controls (44.8%) who reported regularmultivitamin use at the time of the blood draw. Smoking wassignificantly (P � 0.0401) more prevalent among cases (28.1%)than among controls (18.4%), but caffeine intake did not varysignificantly between cases and controls (P � 0.2838).
We previously reported on the plasma concentrations of ho-mocysteine and folate among a subset of these women (9). In thecurrent study, we included homocysteine and folate and alsomeasured the plasma concentrations of GSH and GSSG, cys-teineylglycine (CysGly), glutamylcysteine (GluCys), and cys-teine (Table 2). We compared log-transformed mean concen-trations between cases and controls after adjustment for lifestyleand sociodemographic variables. Compared with controls, caseshad significantly lower mean plasma concentrations of GSH(P � 0.0001), GluCys (P � 0.0001), and vitamin B-6 (P �0.0023); significantly higher mean concentrations of homocys-teine (P � 0.0001) and GSSG (P � 0.0001); and a significantlyhigher ratio of GSSG to GSH (P � 0.0001).
The concentrations of homocysteine, GluCys, GSH, vitaminB-6, and GSSG and GSSG:GSH were further compared betweencases and controls by computing crude ORs at various cutoffs onthe basis of the percentile distribution of controls (Table 3). Ofthe 331 cases, 194 (58.6%) had homocysteine concentrationsabove the 70th percentile in controls, and 39.3% had concentra-tions above the 90th percentile in controls; 178 cases (54.1%) hadplasma concentrations of GSSG above the 70th percentile ofcontrols, and 151 cases (46.0%) had GSSG:GSH above the 90thpercentile of the ratio distribution among controls. More thanhalf of the cases had GSH concentrations that were below the30th percentile of GSH in controls. These distributional differencesremained important after covariate adjustment. The ORs for eachmetabolite increase or decrease in a dose-dependent manner, whichsuggests that risk increasesas themetabolitevaluemoves towardtheextremes. Specifically, the OR at the most extreme values of GSSG:GSH was 9.08 (95% CI: 4.6, 17.9). Thus, if a woman had GSSG:GSH � 0.055, she was 9 times as likely to have a CHD-affectedpregnancy as an unaffected pregnancy.
DISCUSSION
In a previous publication (9), evidence of impairment inremethylation of homocysteine was shown by lower methio-nine and S-adenosylmethionine concentrations and higherS-adenosylhomocysteine concentrations among women withCHD-affected pregnancies. Our current findings indicate that thehigher homocysteine observed among women with CHD-affected pregnancies may extend beyond impairments in re-methylation of homocysteine to impairments in the transsulfu-ration of homocysteine. Specifically, in comparison to controls,cases with CHD-affected pregnancies had significantly lowerconcentrations of vitamin B-6, GluCys, and GSH and signifi-cantly higher concentrations of GSSG.
600 HOBBS ET AL
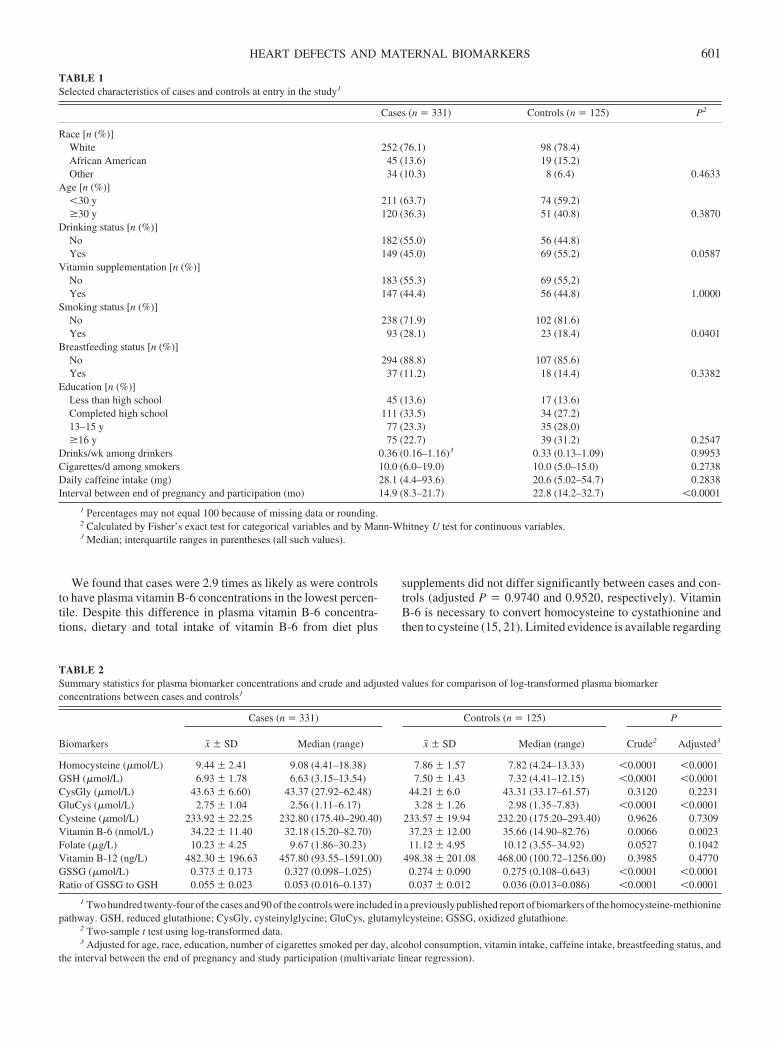
We found that cases were 2.9 times as likely as were controlsto have plasma vitamin B-6 concentrations in the lowest percen-tile. Despite this difference in plasma vitamin B-6 concentra-tions, dietary and total intake of vitamin B-6 from diet plus
supplements did not differ significantly between cases and con-trols (adjusted P � 0.9740 and 0.9520, respectively). VitaminB-6 is necessary to convert homocysteine to cystathionine andthen to cysteine (15, 21). Limited evidence is available regarding
TABLE 1Selected characteristics of cases and controls at entry in the study1
Cases (n � 331) Controls (n � 125) P2
Race [n (%)]White 252 (76.1) 98 (78.4)African American 45 (13.6) 19 (15.2)Other 34 (10.3) 8 (6.4) 0.4633
Age [n (%)]�30 y 211 (63.7) 74 (59.2)�30 y 120 (36.3) 51 (40.8) 0.3870
Drinking status [n (%)]No 182 (55.0) 56 (44.8)Yes 149 (45.0) 69 (55.2) 0.0587
Vitamin supplementation [n (%)]No 183 (55.3) 69 (55.2)Yes 147 (44.4) 56 (44.8) 1.0000
Smoking status [n (%)]No 238 (71.9) 102 (81.6)Yes 93 (28.1) 23 (18.4) 0.0401
Breastfeeding status [n (%)]No 294 (88.8) 107 (85.6)Yes 37 (11.2) 18 (14.4) 0.3382
Education [n (%)]Less than high school 45 (13.6) 17 (13.6)Completed high school 111 (33.5) 34 (27.2)13–15 y 77 (23.3) 35 (28.0)�16 y 75 (22.7) 39 (31.2) 0.2547
Drinks/wk among drinkers 0.36 (0.16–1.16)3 0.33 (0.13–1.09) 0.9953Cigarettes/d among smokers 10.0 (6.0–19.0) 10.0 (5.0–15.0) 0.2738Daily caffeine intake (mg) 28.1 (4.4–93.6) 20.6 (5.02–54.7) 0.2838Interval between end of pregnancy and participation (mo) 14.9 (8.3–21.7) 22.8 (14.2–32.7) �0.0001
1 Percentages may not equal 100 because of missing data or rounding.2 Calculated by Fisher’s exact test for categorical variables and by Mann-Whitney U test for continuous variables.3 Median; interquartile ranges in parentheses (all such values).
TABLE 2Summary statistics for plasma biomarker concentrations and crude and adjusted values for comparison of log-transformed plasma biomarkerconcentrations between cases and controls1
Biomarkers
Cases (n � 331) Controls (n � 125) P
x� � SD Median (range) x� � SD Median (range) Crude2 Adjusted3
Homocysteine (�mol/L) 9.44 � 2.41 9.08 (4.41–18.38) 7.86 � 1.57 7.82 (4.24–13.33) �0.0001 �0.0001GSH (�mol/L) 6.93 � 1.78 6.63 (3.15–13.54) 7.50 � 1.43 7.32 (4.41–12.15) �0.0001 �0.0001CysGly (�mol/L) 43.63 � 6.60) 43.37 (27.92–62.48) 44.21 � 6.0 43.31 (33.17–61.57) 0.3120 0.2231GluCys (�mol/L) 2.75 � 1.04 2.56 (1.11–6.17) 3.28 � 1.26 2.98 (1.35–7.83) �0.0001 �0.0001Cysteine (�mol/L) 233.92 � 22.25 232.80 (175.40–290.40) 233.57 � 19.94 232.20 (175.20–293.40) 0.9626 0.7309Vitamin B-6 (nmol/L) 34.22 � 11.40 32.18 (15.20–82.70) 37.23 � 12.00 35.66 (14.90–82.76) 0.0066 0.0023Folate (�g/L) 10.23 � 4.25 9.67 (1.86–30.23) 11.12 � 4.95 10.12 (3.55–34.92) 0.0527 0.1042Vitamin B-12 (ng/L) 482.30 � 196.63 457.80 (93.55–1591.00) 498.38 � 201.08 468.00 (100.72–1256.00) 0.3985 0.4770GSSG (�mol/L) 0.373 � 0.173 0.327 (0.098–1.025) 0.274 � 0.090 0.275 (0.108–0.643) �0.0001 �0.0001Ratio of GSSG to GSH 0.055 � 0.023 0.053 (0.016–0.137) 0.037 � 0.012 0.036 (0.013–0.086) �0.0001 �0.0001
1 Two hundred twenty-four of the cases and 90 of the controls were included in a previously published report of biomarkers of the homocysteine-methioninepathway. GSH, reduced glutathione; CysGly, cysteinylglycine; GluCys, glutamylcysteine; GSSG, oxidized glutathione.
2 Two-sample t test using log-transformed data.3 Adjusted for age, race, education, number of cigarettes smoked per day, alcohol consumption, vitamin intake, caffeine intake, breastfeeding status, and
the interval between the end of pregnancy and study participation (multivariate linear regression).
HEART DEFECTS AND MATERNAL BIOMARKERS 601
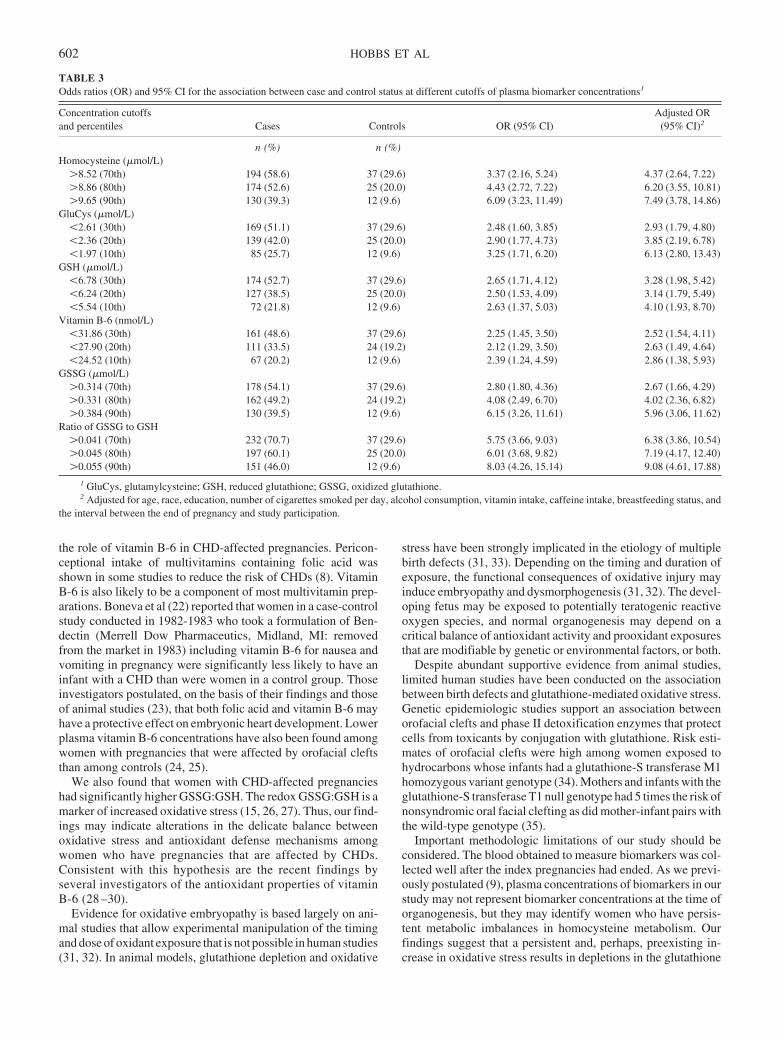
the role of vitamin B-6 in CHD-affected pregnancies. Pericon-ceptional intake of multivitamins containing folic acid wasshown in some studies to reduce the risk of CHDs (8). VitaminB-6 is also likely to be a component of most multivitamin prep-arations. Boneva et al (22) reported that women in a case-controlstudy conducted in 1982-1983 who took a formulation of Ben-dectin (Merrell Dow Pharmaceutics, Midland, MI: removedfrom the market in 1983) including vitamin B-6 for nausea andvomiting in pregnancy were significantly less likely to have aninfant with a CHD than were women in a control group. Thoseinvestigators postulated, on the basis of their findings and thoseof animal studies (23), that both folic acid and vitamin B-6 mayhave a protective effect on embryonic heart development. Lowerplasma vitamin B-6 concentrations have also been found amongwomen with pregnancies that were affected by orofacial cleftsthan among controls (24, 25).
We also found that women with CHD-affected pregnancieshad significantly higher GSSG:GSH. The redox GSSG:GSH is amarker of increased oxidative stress (15, 26, 27). Thus, our find-ings may indicate alterations in the delicate balance betweenoxidative stress and antioxidant defense mechanisms amongwomen who have pregnancies that are affected by CHDs.Consistent with this hypothesis are the recent findings byseveral investigators of the antioxidant properties of vitaminB-6 (28 –30).
Evidence for oxidative embryopathy is based largely on ani-mal studies that allow experimental manipulation of the timingand dose of oxidant exposure that is not possible in human studies(31, 32). In animal models, glutathione depletion and oxidative
stress have been strongly implicated in the etiology of multiplebirth defects (31, 33). Depending on the timing and duration ofexposure, the functional consequences of oxidative injury mayinduce embryopathy and dysmorphogenesis (31, 32). The devel-oping fetus may be exposed to potentially teratogenic reactiveoxygen species, and normal organogenesis may depend on acritical balance of antioxidant activity and prooxidant exposuresthat are modifiable by genetic or environmental factors, or both.
Despite abundant supportive evidence from animal studies,limited human studies have been conducted on the associationbetween birth defects and glutathione-mediated oxidative stress.Genetic epidemiologic studies support an association betweenorofacial clefts and phase II detoxification enzymes that protectcells from toxicants by conjugation with glutathione. Risk esti-mates of orofacial clefts were high among women exposed tohydrocarbons whose infants had a glutathione-S transferase M1homozygous variant genotype (34). Mothers and infants with theglutathione-S transferase T1 null genotype had 5 times the risk ofnonsyndromic oral facial clefting as did mother-infant pairs withthe wild-type genotype (35).
Important methodologic limitations of our study should beconsidered. The blood obtained to measure biomarkers was col-lected well after the index pregnancies had ended. As we previ-ously postulated (9), plasma concentrations of biomarkers in ourstudy may not represent biomarker concentrations at the time oforganogenesis, but they may identify women who have persis-tent metabolic imbalances in homocysteine metabolism. Ourfindings suggest that a persistent and, perhaps, preexisting in-crease in oxidative stress results in depletions in the glutathione
TABLE 3Odds ratios (OR) and 95% CI for the association between case and control status at different cutoffs of plasma biomarker concentrations1
Concentration cutoffsand percentiles Cases Controls OR (95% CI)
Adjusted OR(95% CI)2
n (%) n (%)Homocysteine (�mol/L)
�8.52 (70th) 194 (58.6) 37 (29.6) 3.37 (2.16, 5.24) 4.37 (2.64, 7.22)�8.86 (80th) 174 (52.6) 25 (20.0) 4.43 (2.72, 7.22) 6.20 (3.55, 10.81)�9.65 (90th) 130 (39.3) 12 (9.6) 6.09 (3.23, 11.49) 7.49 (3.78, 14.86)
GluCys (�mol/L)�2.61 (30th) 169 (51.1) 37 (29.6) 2.48 (1.60, 3.85) 2.93 (1.79, 4.80)�2.36 (20th) 139 (42.0) 25 (20.0) 2.90 (1.77, 4.73) 3.85 (2.19, 6.78)�1.97 (10th) 85 (25.7) 12 (9.6) 3.25 (1.71, 6.20) 6.13 (2.80, 13.43)
GSH (�mol/L)�6.78 (30th) 174 (52.7) 37 (29.6) 2.65 (1.71, 4.12) 3.28 (1.98, 5.42)�6.24 (20th) 127 (38.5) 25 (20.0) 2.50 (1.53, 4.09) 3.14 (1.79, 5.49)�5.54 (10th) 72 (21.8) 12 (9.6) 2.63 (1.37, 5.03) 4.10 (1.93, 8.70)
Vitamin B-6 (nmol/L)�31.86 (30th) 161 (48.6) 37 (29.6) 2.25 (1.45, 3.50) 2.52 (1.54, 4.11)�27.90 (20th) 111 (33.5) 24 (19.2) 2.12 (1.29, 3.50) 2.63 (1.49, 4.64)�24.52 (10th) 67 (20.2) 12 (9.6) 2.39 (1.24, 4.59) 2.86 (1.38, 5.93)
GSSG (�mol/L)�0.314 (70th) 178 (54.1) 37 (29.6) 2.80 (1.80, 4.36) 2.67 (1.66, 4.29)�0.331 (80th) 162 (49.2) 24 (19.2) 4.08 (2.49, 6.70) 4.02 (2.36, 6.82)�0.384 (90th) 130 (39.5) 12 (9.6) 6.15 (3.26, 11.61) 5.96 (3.06, 11.62)
Ratio of GSSG to GSH�0.041 (70th) 232 (70.7) 37 (29.6) 5.75 (3.66, 9.03) 6.38 (3.86, 10.54)�0.045 (80th) 197 (60.1) 25 (20.0) 6.01 (3.68, 9.82) 7.19 (4.17, 12.40)�0.055 (90th) 151 (46.0) 12 (9.6) 8.03 (4.26, 15.14) 9.08 (4.61, 17.88)
1 GluCys, glutamylcysteine; GSH, reduced glutathione; GSSG, oxidized glutathione.2 Adjusted for age, race, education, number of cigarettes smoked per day, alcohol consumption, vitamin intake, caffeine intake, breastfeeding status, and
the interval between the end of pregnancy and study participation.
602 HOBBS ET AL
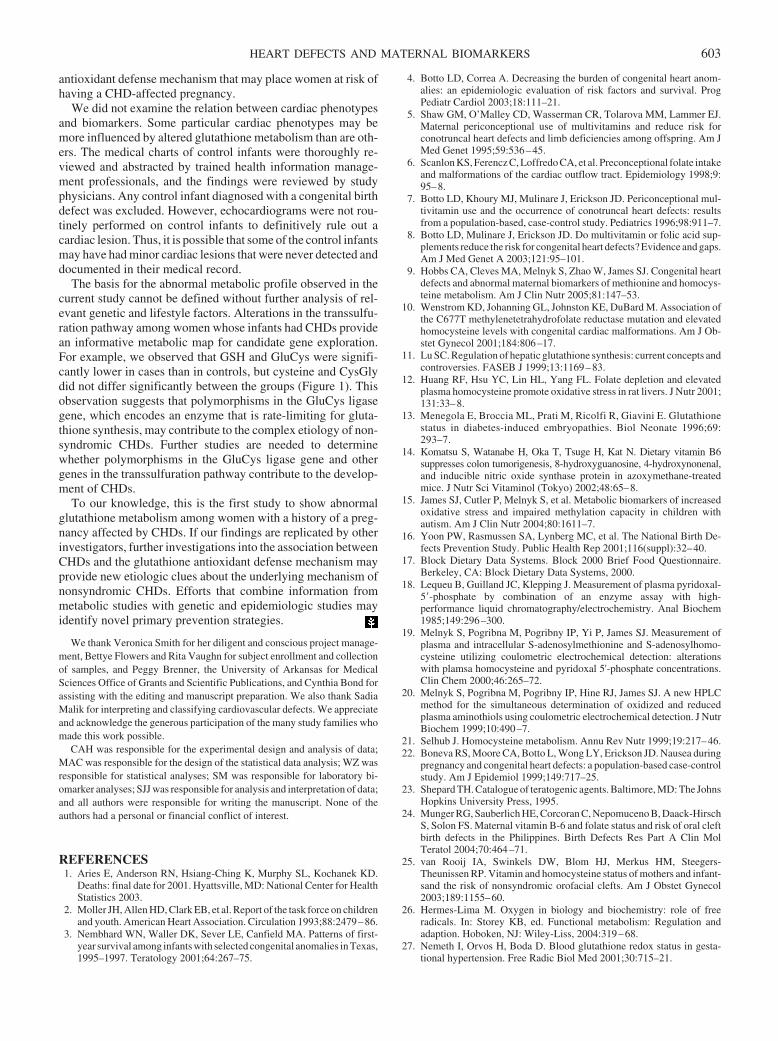
antioxidant defense mechanism that may place women at risk ofhaving a CHD-affected pregnancy.
We did not examine the relation between cardiac phenotypesand biomarkers. Some particular cardiac phenotypes may bemore influenced by altered glutathione metabolism than are oth-ers. The medical charts of control infants were thoroughly re-viewed and abstracted by trained health information manage-ment professionals, and the findings were reviewed by studyphysicians. Any control infant diagnosed with a congenital birthdefect was excluded. However, echocardiograms were not rou-tinely performed on control infants to definitively rule out acardiac lesion. Thus, it is possible that some of the control infantsmay have had minor cardiac lesions that were never detected anddocumented in their medical record.
The basis for the abnormal metabolic profile observed in thecurrent study cannot be defined without further analysis of rel-evant genetic and lifestyle factors. Alterations in the transsulfu-ration pathway among women whose infants had CHDs providean informative metabolic map for candidate gene exploration.For example, we observed that GSH and GluCys were signifi-cantly lower in cases than in controls, but cysteine and CysGlydid not differ significantly between the groups (Figure 1). Thisobservation suggests that polymorphisms in the GluCys ligasegene, which encodes an enzyme that is rate-limiting for gluta-thione synthesis, may contribute to the complex etiology of non-syndromic CHDs. Further studies are needed to determinewhether polymorphisms in the GluCys ligase gene and othergenes in the transsulfuration pathway contribute to the develop-ment of CHDs.
To our knowledge, this is the first study to show abnormalglutathione metabolism among women with a history of a preg-nancy affected by CHDs. If our findings are replicated by otherinvestigators, further investigations into the association betweenCHDs and the glutathione antioxidant defense mechanism mayprovide new etiologic clues about the underlying mechanism ofnonsyndromic CHDs. Efforts that combine information frommetabolic studies with genetic and epidemiologic studies mayidentify novel primary prevention strategies.
We thank Veronica Smith for her diligent and conscious project manage-ment, Bettye Flowers and Rita Vaughn for subject enrollment and collectionof samples, and Peggy Brenner, the University of Arkansas for MedicalSciences Office of Grants and Scientific Publications, and Cynthia Bond forassisting with the editing and manuscript preparation. We also thank SadiaMalik for interpreting and classifying cardiovascular defects. We appreciateand acknowledge the generous participation of the many study families whomade this work possible.
CAH was responsible for the experimental design and analysis of data;MAC was responsible for the design of the statistical data analysis; WZ wasresponsible for statistical analyses; SM was responsible for laboratory bi-omarker analyses; SJJ was responsible for analysis and interpretation of data;and all authors were responsible for writing the manuscript. None of theauthors had a personal or financial conflict of interest.
REFERENCES1. Aries E, Anderson RN, Hsiang-Ching K, Murphy SL, Kochanek KD.
Deaths: final date for 2001. Hyattsville, MD: National Center for HealthStatistics 2003.
2. Moller JH, Allen HD, Clark EB, et al. Report of the task force on childrenand youth. American Heart Association. Circulation 1993;88:2479–86.
3. Nembhard WN, Waller DK, Sever LE, Canfield MA. Patterns of first-year survival among infants with selected congenital anomalies in Texas,1995–1997. Teratology 2001;64:267–75.
4. Botto LD, Correa A. Decreasing the burden of congenital heart anom-alies: an epidemiologic evaluation of risk factors and survival. ProgPediatr Cardiol 2003;18:111–21.
5. Shaw GM, O’Malley CD, Wasserman CR, Tolarova MM, Lammer EJ.Maternal periconceptional use of multivitamins and reduce risk forconotruncal heart defects and limb deficiencies among offspring. Am JMed Genet 1995;59:536–45.
6. Scanlon KS, Ferencz C, Loffredo CA, et al. Preconceptional folate intakeand malformations of the cardiac outflow tract. Epidemiology 1998;9:95–8.
7. Botto LD, Khoury MJ, Mulinare J, Erickson JD. Periconceptional mul-tivitamin use and the occurrence of conotruncal heart defects: resultsfrom a population-based, case-control study. Pediatrics 1996;98:911–7.
8. Botto LD, Mulinare J, Erickson JD. Do multivitamin or folic acid sup-plements reduce the risk for congenital heart defects? Evidence and gaps.Am J Med Genet A 2003;121:95–101.
9. Hobbs CA, Cleves MA, Melnyk S, Zhao W, James SJ. Congenital heartdefects and abnormal maternal biomarkers of methionine and homocys-teine metabolism. Am J Clin Nutr 2005;81:147–53.
10. Wenstrom KD, Johanning GL, Johnston KE, DuBard M. Association ofthe C677T methylenetetrahydrofolate reductase mutation and elevatedhomocysteine levels with congenital cardiac malformations. Am J Ob-stet Gynecol 2001;184:806–17.
11. Lu SC. Regulation of hepatic glutathione synthesis: current concepts andcontroversies. FASEB J 1999;13:1169–83.
12. Huang RF, Hsu YC, Lin HL, Yang FL. Folate depletion and elevatedplasma homocysteine promote oxidative stress in rat livers. J Nutr 2001;131:33–8.
13. Menegola E, Broccia ML, Prati M, Ricolfi R, Giavini E. Glutathionestatus in diabetes-induced embryopathies. Biol Neonate 1996;69:293–7.
14. Komatsu S, Watanabe H, Oka T, Tsuge H, Kat N. Dietary vitamin B6suppresses colon tumorigenesis, 8-hydroxyguanosine, 4-hydroxynonenal,and inducible nitric oxide synthase protein in azoxymethane-treatedmice. J Nutr Sci Vitaminol (Tokyo) 2002;48:65–8.
15. James SJ, Cutler P, Melnyk S, et al. Metabolic biomarkers of increasedoxidative stress and impaired methylation capacity in children withautism. Am J Clin Nutr 2004;80:1611–7.
16. Yoon PW, Rasmussen SA, Lynberg MC, et al. The National Birth De-fects Prevention Study. Public Health Rep 2001;116(suppl):32–40.
17. Block Dietary Data Systems. Block 2000 Brief Food Questionnaire.Berkeley, CA: Block Dietary Data Systems, 2000.
18. Lequeu B, Guilland JC, Klepping J. Measurement of plasma pyridoxal-5�-phosphate by combination of an enzyme assay with high-performance liquid chromatography/electrochemistry. Anal Biochem1985;149:296–300.
19. Melnyk S, Pogribna M, Pogribny IP, Yi P, James SJ. Measurement ofplasma and intracellular S-adenosylmethionine and S-adenosylhomo-cysteine utilizing coulometric electrochemical detection: alterationswith plamsa homocysteine and pyridoxal 5'-phosphate concentrations.Clin Chem 2000;46:265–72.
20. Melnyk S, Pogribna M, Pogribny IP, Hine RJ, James SJ. A new HPLCmethod for the simultaneous determination of oxidized and reducedplasma aminothiols using coulometric electrochemical detection. J NutrBiochem 1999;10:490–7.
21. Selhub J. Homocysteine metabolism. Annu Rev Nutr 1999;19:217–46.22. Boneva RS, Moore CA, Botto L, Wong LY, Erickson JD. Nausea during
pregnancy and congenital heart defects: a population-based case-controlstudy. Am J Epidemiol 1999;149:717–25.
23. Shepard TH. Catalogue of teratogenic agents. Baltimore, MD: The JohnsHopkins University Press, 1995.
24. Munger RG, Sauberlich HE, Corcoran C, Nepomuceno B, Daack-HirschS, Solon FS. Maternal vitamin B-6 and folate status and risk of oral cleftbirth defects in the Philippines. Birth Defects Res Part A Clin MolTeratol 2004;70:464–71.
25. van Rooij IA, Swinkels DW, Blom HJ, Merkus HM, Steegers-Theunissen RP. Vitamin and homocysteine status of mothers and infant-sand the risk of nonsyndromic orofacial clefts. Am J Obstet Gynecol2003;189:1155–60.
26. Hermes-Lima M. Oxygen in biology and biochemistry: role of freeradicals. In: Storey KB, ed. Functional metabolism: Regulation andadaption. Hoboken, NJ: Wiley-Liss, 2004:319–68.
27. Nemeth I, Orvos H, Boda D. Blood glutathione redox status in gesta-tional hypertension. Free Radic Biol Med 2001;30:715–21.
HEART DEFECTS AND MATERNAL BIOMARKERS 603

28. Kannan K, Jain SK. Effect of vitamin B6 on oxygen radicals, mitochon-drial membrane potential, and lipid peroxidation in H2O2-treated U937monocytes. Free Radic Biol Med 2004;36:423–8.
29. Jain SK, Lim G. Pyridoxine and pyridoxamine inhibits superoxide rad-icals and prevents lipid peroxidation, protein glycosylation, and (Na K)-ATPase activity reduction in high glucose-treated human erythro-cytes. Free Radic Biol Med 2001;30:232–7.
30. Cabrini L, Bergami R, Fiorentini D, Marchetti M, Landi L, Tolomelli B.Vitamin B6 deficiency affects antioxidant defences in rat liver and heart.Biochem Mol Biol Int 1998;46:689–97.
31. Ishibashi M, Akazawa S, Sakamaki H, et al. Oxygen-induced embryop-athy and the significance of glutathione- dependent antioxidant systemin the rat embryo during early organogenesis. Free Radic Biol Med1997;22:447–54.
32. Sakamaki H, Akazawa S, Ishibashi M, et al. Significance of glutathione-dependent antioxidant system in diabetes-induced embryonic malfor-mations. Diabetes 1999;48:1138–44.
33. Trocino RA, Akazawa S, Ishibashi M, et al. Significance of glutathionedepletion and oxidative stress in early embryogenesis in glucose-induced rat embryo culture. Diabetes 1995;44:992–8.
34. Shaw GM, Nelson V, Iovannisci DM, Finnell RH, Lammer EJ. Maternaloccupational chemical exposures and biotransformation genotypes asrisk factors for selected congenital anomalies. Am J Epidemiol 2003;157:475–84.
35. van Rooij IA, Wegerif MJ, Roelofs HM, et al. Smoking, geneticpolymorphisms in biotransformation enzymes, and nonsyndromicoral clefting: a gene-environment interaction. Epidemiology 2001;12:502–7.
604 HOBBS ET AL
Efficacy of zinc in young infants with acute watery diarrhea1–3
W Abdullah Brooks, Mathuram Santosham, Swapan K Roy, Abu SG Faruque, M Abdu’l Wahed, Kamrun Nahar,Ashrafu’l I Khan, A Fazu’l Khan, George J Fuchs, and Robert E Black
ABSTRACTBackground: Recent studies reported that zinc significantly re-duced the duration and volume of acute watery diarrhea in childrenaged �4 mo, but there were no data specifically on infants aged �6mo.Objective: This study investigated the effect of zinc on the durationof illness and the stool quantity in acute watery diarrhea of infantsaged 1–6 mo by comparing a 20 mg Zn/d dose with a 5 mg Zn/d dose.Design: Infants hospitalized with at least some dehydration (byWorld Health Organization classification) were enrolled in a double-blind, randomized, placebo-controlled trial. Infants were randomlyassigned to receive 20 mg Zn (acetate)/d, 5 mg Zn/d, or placebo forthe duration of illness.Results: Two hundred seventy-five infants were enrolled between20 September 1998 and 18 December 2000. Neither diarrhea dura-tion nor mean stool volume differed between groups. There were nosignificant differences in fluid intake, the need for unscheduledintravenous fluid, weight gain, or vomiting rates between the groups.Conclusions: Zinc supplementation did not affect diarrhea durationor stool volume in young infants. Young infants tolerated both zincdoses. A beneficial effect on subsequent illness cannot be ruledout. Am J Clin Nutr 2005;82:605–10.
KEY WORDS Acute watery diarrhea, dehydration, zinc, in-fants, children, Bangladesh, International Center for Diarrhoeal Dis-eases Research, Bangladesh, ICDDR,B, hospitalized children
INTRODUCTION
Diarrhea is associated with 18% mortality among childrenaged �5 y, accounting for 1.9 million deaths (1), primarily indeveloping countries. Despite gains in the use of oral rehydrationtherapy, diarrhea-associated mortality has not declined in thepast few years in Bangladesh (2). The continued high mortalityunderscores a need for further improvements in case manage-ment and primary prevention.
Studies have shown that zinc is involved in epithelial barrierintegrity, tissue repair, and immune function (3–6). However,diarrhea can be associated with increases in fecal zinc loss (7).Thus, in cases of diarrhea, the very condition under which thebody needs optimum zinc balance, the disease itself accelerateszinc loss.
Studies have reported significant reductions in both the dura-tion of acute watery diarrhea (AWD) and the stool volume duringAWD with the administration of zinc in the acute phase of theillness (7–10). A pooled analysis showed a mean 15% (95% CI:5%, 24%) lower likelihood that diarrhea will continue on a given
day in zinc-supplemented children (8). Subgroup analysis by ageshowed significant effects for children aged �12 mo with AWD,but most of these studies were conducted on children aged �4mo. To date, there have been no reported studies specifically ininfants aged �6 mo. Concerns have been raised about toleranceto zinc among hospitalized children, because it was reported thatzinc-supplemented children have an increased tendency forvomiting (10).
Our study sought to determine the effect of zinc on the severityof AWD in infants aged 1–6 mo by using the standard 20 mg Zn/ddose used in other trials (9, 11) and also to ascertain whether theeffects were similar with a 5 mg Zn/d dose.
SUBJECTS AND METHODS
Subjects
This study was a double-blind, randomized, placebo-controlled clinical trial. All infants were admitted to the hospitalof the Centre for Health and Population Research of the Interna-tional Centre for Diarrhoeal Diseases Research, Bangladesh (IC-DDR,B) in Dhaka, Bangladesh. Patients were enrolled if theywere male infants aged 1–6 mo at the time of diarrheal illness, ifthe onset of illness was � 72 h before admission, and if they had� 3 watery stools in the preceding 24 h. Male patients wereselected to facilitate the separation of urine and stool. Patientswere enrolled if they had at least some dehydration, as defined bythe method of the World Health Organization (12), or had �100mL of watery stool within a 4-hobservation period, which madethe infant eligible for hospitalization according to ICDDR,Bcriteria.
1 From The Centre for Health & Population Research, International Centrefor Diarrhoeal Diseases Research, Bangladesh, Dhaka, Bangladesh (WAB,SKR, ASGF, MAW, KN, AIK, and AFK); the Department of InternationalHealth, Bloomberg School of Public Health, Johns Hopkins University,Baltimore, MD (WAB, MS, and REB); and the Department of Pediatrics,University of Arkansas for Medical Sciences, Little Rock, AR (GJF).
2 Supported by the Johns Hopkins Family Health and Child Survival Co-operative Agreement with the US Agency for International Development(AID), by a cooperative agreement between the International Centre forDiarrhoeal Diseases Research, Bangladesh (ICDDR,B), and US AID (HRN-A-00-96-90005-00) and by core donors to the ICDDR,B.
3 Reprints not available. Address correspondence to WA Brooks, Depart-ment of International Health, Bloomberg School of Public Health, JohnsHopkins University, 615 North Wolfe Street, Baltimore, MD 21205. E-mail:[email protected].
Received February 15, 2005.Accepted for publication June 2, 2005.
605Am J Clin Nutr 2005;82:605–10. Printed in USA. © 2005 American Society for Clinical Nutrition
A study health worker screened for eligible patients at theintake triage desk, and they were then brought to a senior teammember for consent and random assignment. A trained staffmember read the consent form in its entirety to the parent, andanswered any questions from a standardized set of key points foreach section of the consent form. If the parent indicated that he orshe understood the terms and agreed to let the child participate,then the parent was asked to sign the consent form or, if illiterate,to provide a thumb impression.
Infants were excluded if they had clinical signs of zinc defi-ciency (eg, acro-oral dermatitis or alopecia), kwashiorkor,weight-for-age �60% based on the National Center for HealthStatistics (NCHS) reference data (13), grossly bloody stool, orother comorbidity that required them to be managed in a differentward. Patients who had Vibrio cholerae in their stool or who weresuspected of having cholera because of persisting dehydrationwere also ineligible, because they required antimicrobial man-agement, and their responses to zinc might not be comparable tothose of infants who were not also receiving antibiotics. Allstools were tested before randomization.
Parents provided informed consent for all study participants.The Ethical Review Committee of ICDDR, B, approved thestudy in accordance with the standards of the Helsinki Declara-tion of 1975, as revised in 1983.
Methods
Patients’ dehydration was corrected before enrollment as fol-lows. Those with moderate (“some”) dehydration received 100mL/kg of a standard oral rehydration solution (ORS) over 4 h,with an interim evaluation at 2 h, and adjustments made to theORS volume as needed. This procedure was repeated every 2 hfor a maximum of 12 h. Patients who remained dehydrated after12 h were treated as presumed cholera patients, were given in-travenous fluid, and were managed according to hospital proto-col, but were not enrolled in the study.
Those with severe dehydration were initially rehydrated in-travenously. An intravenous solution (Dhaka solution) contain-ing 133 mmol sodium/mL, 13 mmol potassium/L, and 48 mmolsodium bicarbonate/L was administered at a rate of 40 mL ·kg�1 · h�1 over a period 2 h, until severe dehydration was cor-rected and the infant could tolerate oral rehydration. If severedehydration persisted after the first 2 h, the intravenous infusionwas repeated for a maximum of 3 attempts, after which those whoremained severely dehydrated were treated as cholera patients,were transferred to the general ward, and were not enrolled in thestudy.
Nude body weight was obtained after rehydration and thendaily until discharge from hospital. Length measurements weremade with the use of a wooden sliding board. The mean of 2consecutive measurements was recorded for all indexes. Mea-surements were compared with those from the reference popu-lation of the NCHS (13).
The zinc preparation was supplied by ACME Laboratories,Ltd (Dhamrai, Dhaka, Bangladesh), with the following specifi-cations: 20 mg zinc acetate/5 mL (group A), 5 mg zinc acetate/5mL (group B), and 5 mL placebo (group C). The zinc acetate wasdissolved in a base substance normally used for vitamins but wasvitamin free. The zinc and placebo were otherwise identical inappearance in color, taste, and smell.
After rehydration, patients were randomly assigned to 1 of the2 treatment groups or to the placebo group. Group assignments
were allocated by block randomization in permuted blocks ofvariable length between 3 and 12. The syrup was administeredwithin 2 h of randomization and, thereafter, every morning at0900. All study team members and patients were blind to groupassignment.
The total fluid intake (including ORS and water) and the stooland urine output were recorded every 3 h. Stool weight wasmeasured by using metabolic beds. Urine was collected in poly-ethylene urine bags adhesively attached to the patient’s groin.Vomitus weight was measured along with previously weighedtowels, and mass was converted to volume (1 g/mL). Food intakewas also recorded every 8 h. All mothers stayed with their chil-dren throughout hospitalization, and breastfeeding was encour-aged ad libitum, but measurement of breast milk intake was notattempted. If dehydration recurred during the maintenancephase, the calculated deficit was replaced with ORS over a periodof 6 h, and an interim evaluation was performed at 3 h. If signs ofdehydration persisted after 6 h of ORT, then intravenous fluidswere administered at a rate of 40 mL/kg/h over a period of 2 h, asdescribed above. Intravenous fluids were administered any timesigns of severe dehydration developed.
The following outcomes were evaluated: first, duration ofdiarrhea, calculated from the time of admission until the end ofdiarrhea, defined as the formation of 3 soft stools or the absenceof stool for �12 h, and, second, the total volume of the diarrheastools during hospitalization. Secondary outcomes included theneed for unscheduled intravenous fluids (defined as the need forintravenous fluids after preenrollment rehydration), frequency ofdiarrheal stools, total fluid intake, frequency and volume of vom-iting, serum zinc concentration, and weight gain.
The sample size calculation was based on a 365-d chart review,which gave a mean duration of AWD of 131 � 47.8 h and a stoolvolume of 121 � 65.9 mg · kg�1 · d�1. All calculations werebased on a 5% chance of a Type I error and a 10% chance of aType II error. We wanted to be able to detect a 20% reduction induration of diarrhea and 30% reduction in stool volume, whichrequired a sample size of 70 infants per group for both diarrheaduration and stool volume. To allow for 20% attrition, we re-quired 84 children per group, or a total sample size of 252.
Two 1-mL blood specimens were collected, one at the time ofrandomization and one just before discharge, for measurement ofbaseline and postsupplementation serum zinc concentrations,respectively. Serum samples (150 �L) in polypropylene tubeswere diluted 1 in 12 with nitric acid and 30% (wt:vol) polyoxy-ethylene 23 lauryl ether (Brij-35; Sigma Diagnostics, St. Louis,MO), a nonionic detergent. Zinc concentration was determinedby flame atomic absorption spectrophotometry (AAS), as de-scribed previously (14).
The duration of illness was also compared between groups. ACox proportional hazards model (15) was used to compare therelative hazard of the duration outcome in each zinc group withthat in the placebo group and to explore associations betweenbaseline covariates and outcome. Results are reported as relativehazard (RH) and 95% CIs. We also used the Cox hazard modelto detect interactions between covariates and outcome for the 2treatment groups. Because age and nutritional status, as ascer-tained by anthropometry and serum zinc concentrations, werebiologically plausible explanatory variables, we developed a fi-nal model by using age, baseline and end-of-illness anthropo-metric indicators (ie, weight and weight-for-age), and serum zincconcentrations as continuous variables. Tied scores for duration
606 BROOKS ET AL
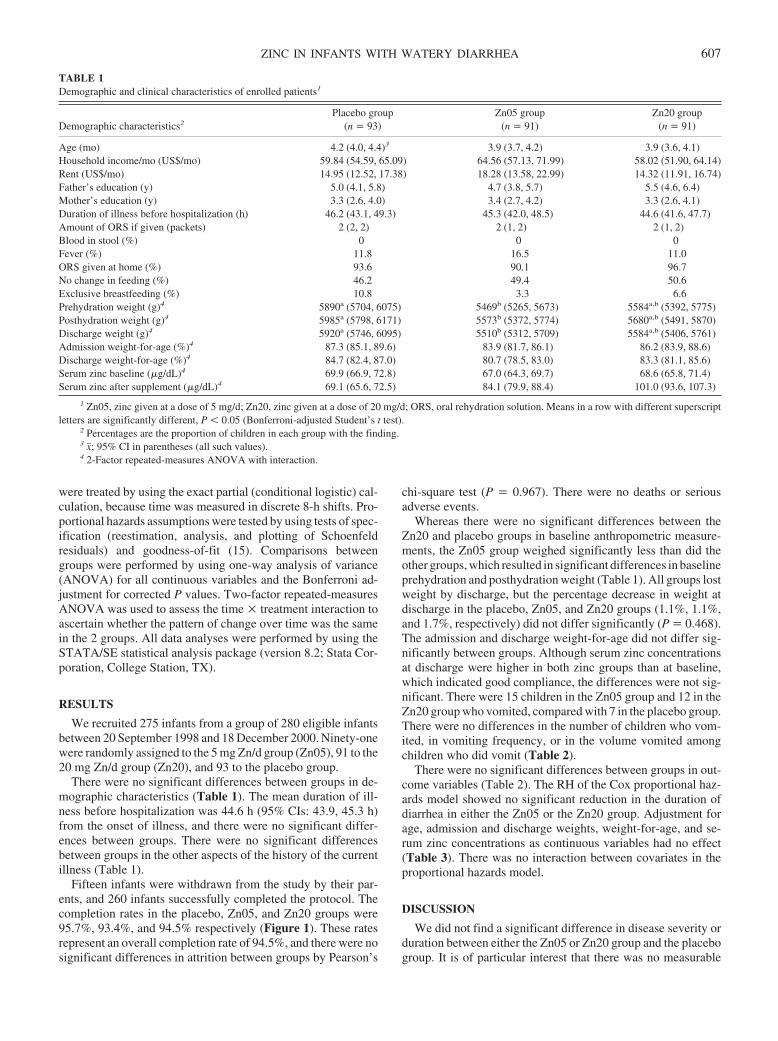
were treated by using the exact partial (conditional logistic) cal-culation, because time was measured in discrete 8-h shifts. Pro-portional hazards assumptions were tested by using tests of spec-ification (reestimation, analysis, and plotting of Schoenfeldresiduals) and goodness-of-fit (15). Comparisons betweengroups were performed by using one-way analysis of variance(ANOVA) for all continuous variables and the Bonferroni ad-justment for corrected P values. Two-factor repeated-measuresANOVA was used to assess the time � treatment interaction toascertain whether the pattern of change over time was the samein the 2 groups. All data analyses were performed by using theSTATA/SE statistical analysis package (version 8.2; Stata Cor-poration, College Station, TX).
RESULTS
We recruited 275 infants from a group of 280 eligible infantsbetween 20 September 1998 and 18 December 2000. Ninety-onewere randomly assigned to the 5 mg Zn/d group (Zn05), 91 to the20 mg Zn/d group (Zn20), and 93 to the placebo group.
There were no significant differences between groups in de-mographic characteristics (Table 1). The mean duration of ill-ness before hospitalization was 44.6 h (95% CIs: 43.9, 45.3 h)from the onset of illness, and there were no significant differ-ences between groups. There were no significant differencesbetween groups in the other aspects of the history of the currentillness (Table 1).
Fifteen infants were withdrawn from the study by their par-ents, and 260 infants successfully completed the protocol. Thecompletion rates in the placebo, Zn05, and Zn20 groups were95.7%, 93.4%, and 94.5% respectively (Figure 1). These ratesrepresent an overall completion rate of 94.5%, and there were nosignificant differences in attrition between groups by Pearson’s
chi-square test (P � 0.967). There were no deaths or seriousadverse events.
Whereas there were no significant differences between theZn20 and placebo groups in baseline anthropometric measure-ments, the Zn05 group weighed significantly less than did theother groups, which resulted in significant differences in baselineprehydration and posthydration weight (Table 1). All groups lostweight by discharge, but the percentage decrease in weight atdischarge in the placebo, Zn05, and Zn20 groups (1.1%, 1.1%,and 1.7%, respectively) did not differ significantly (P � 0.468).The admission and discharge weight-for-age did not differ sig-nificantly between groups. Although serum zinc concentrationsat discharge were higher in both zinc groups than at baseline,which indicated good compliance, the differences were not sig-nificant. There were 15 children in the Zn05 group and 12 in theZn20 group who vomited, compared with 7 in the placebo group.There were no differences in the number of children who vom-ited, in vomiting frequency, or in the volume vomited amongchildren who did vomit (Table 2).
There were no significant differences between groups in out-come variables (Table 2). The RH of the Cox proportional haz-ards model showed no significant reduction in the duration ofdiarrhea in either the Zn05 or the Zn20 group. Adjustment forage, admission and discharge weights, weight-for-age, and se-rum zinc concentrations as continuous variables had no effect(Table 3). There was no interaction between covariates in theproportional hazards model.
DISCUSSION
We did not find a significant difference in disease severity orduration between either the Zn05 or Zn20 group and the placebogroup. It is of particular interest that there was no measurable
TABLE 1Demographic and clinical characteristics of enrolled patients1
Demographic characteristics2Placebo group
(n � 93)Zn05 group
(n � 91)Zn20 group
(n � 91)
Age (mo) 4.2 (4.0, 4.4)3 3.9 (3.7, 4.2) 3.9 (3.6, 4.1)Household income/mo (US$/mo) 59.84 (54.59, 65.09) 64.56 (57.13, 71.99) 58.02 (51.90, 64.14)Rent (US$/mo) 14.95 (12.52, 17.38) 18.28 (13.58, 22.99) 14.32 (11.91, 16.74)Father’s education (y) 5.0 (4.1, 5.8) 4.7 (3.8, 5.7) 5.5 (4.6, 6.4)Mother’s education (y) 3.3 (2.6, 4.0) 3.4 (2.7, 4.2) 3.3 (2.6, 4.1)Duration of illness before hospitalization (h) 46.2 (43.1, 49.3) 45.3 (42.0, 48.5) 44.6 (41.6, 47.7)Amount of ORS if given (packets) 2 (2, 2) 2 (1, 2) 2 (1, 2)Blood in stool (%) 0 0 0Fever (%) 11.8 16.5 11.0ORS given at home (%) 93.6 90.1 96.7No change in feeding (%) 46.2 49.4 50.6Exclusive breastfeeding (%) 10.8 3.3 6.6Prehydration weight (g)4 5890a (5704, 6075) 5469b (5265, 5673) 5584a,b (5392, 5775)Posthydration weight (g)4 5985a (5798, 6171) 5573b (5372, 5774) 5680a,b (5491, 5870)Discharge weight (g)4 5920a (5746, 6095) 5510b (5312, 5709) 5584a,b (5406, 5761)Admission weight-for-age (%)4 87.3 (85.1, 89.6) 83.9 (81.7, 86.1) 86.2 (83.9, 88.6)Discharge weight-for-age (%)4 84.7 (82.4, 87.0) 80.7 (78.5, 83.0) 83.3 (81.1, 85.6)Serum zinc baseline (�g/dL)4 69.9 (66.9, 72.8) 67.0 (64.3, 69.7) 68.6 (65.8, 71.4)Serum zinc after supplement (�g/dL)4 69.1 (65.6, 72.5) 84.1 (79.9, 88.4) 101.0 (93.6, 107.3)
1 Zn05, zinc given at a dose of 5 mg/d; Zn20, zinc given at a dose of 20 mg/d; ORS, oral rehydration solution. Means in a row with different superscriptletters are significantly different, P � 0.05 (Bonferroni-adjusted Student’s t test).
2 Percentages are the proportion of children in each group with the finding.3 x�; 95% CI in parentheses (all such values).4 2-Factor repeated-measures ANOVA with interaction.
ZINC IN INFANTS WITH WATERY DIARRHEA 607
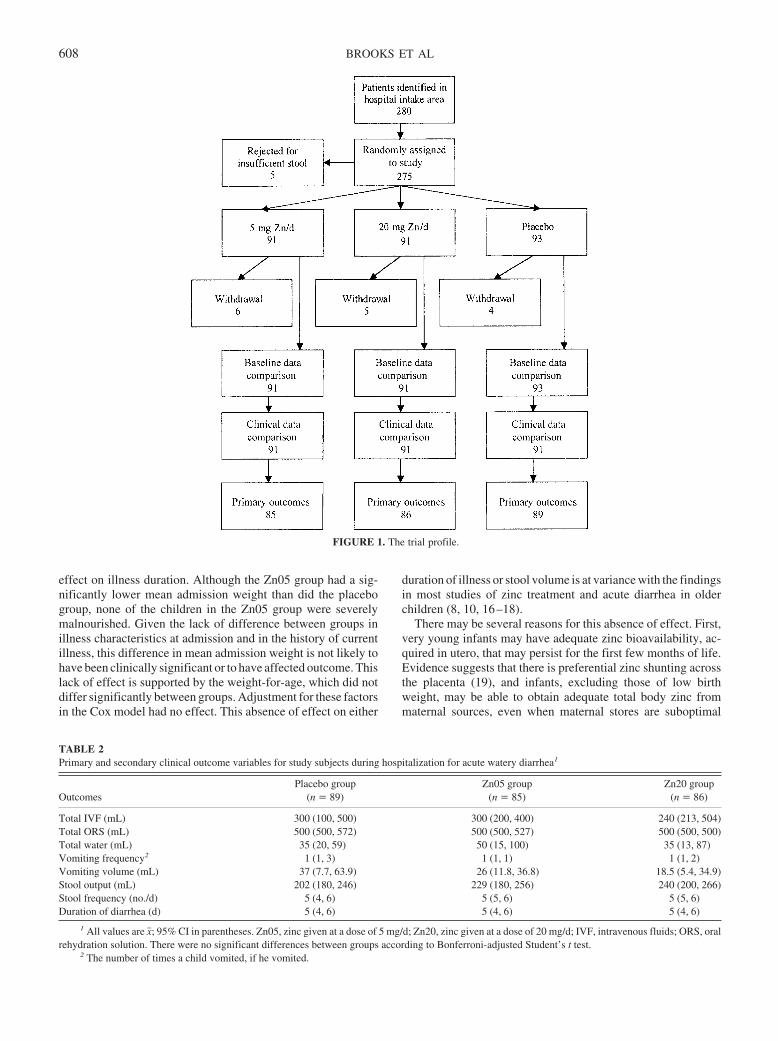
effect on illness duration. Although the Zn05 group had a sig-nificantly lower mean admission weight than did the placebogroup, none of the children in the Zn05 group were severelymalnourished. Given the lack of difference between groups inillness characteristics at admission and in the history of currentillness, this difference in mean admission weight is not likely tohave been clinically significant or to have affected outcome. Thislack of effect is supported by the weight-for-age, which did notdiffer significantly between groups. Adjustment for these factorsin the Cox model had no effect. This absence of effect on either
duration of illness or stool volume is at variance with the findingsin most studies of zinc treatment and acute diarrhea in olderchildren (8, 10, 16–18).
There may be several reasons for this absence of effect. First,very young infants may have adequate zinc bioavailability, ac-quired in utero, that may persist for the first few months of life.Evidence suggests that there is preferential zinc shunting acrossthe placenta (19), and infants, excluding those of low birthweight, may be able to obtain adequate total body zinc frommaternal sources, even when maternal stores are suboptimal
FIGURE 1. The trial profile.
TABLE 2Primary and secondary clinical outcome variables for study subjects during hospitalization for acute watery diarrhea1
OutcomesPlacebo group
(n � 89)Zn05 group
(n � 85)Zn20 group
(n � 86)
Total IVF (mL) 300 (100, 500) 300 (200, 400) 240 (213, 504)Total ORS (mL) 500 (500, 572) 500 (500, 527) 500 (500, 500)Total water (mL) 35 (20, 59) 50 (15, 100) 35 (13, 87)Vomiting frequency2 1 (1, 3) 1 (1, 1) 1 (1, 2)Vomiting volume (mL) 37 (7.7, 63.9) 26 (11.8, 36.8) 18.5 (5.4, 34.9)Stool output (mL) 202 (180, 246) 229 (180, 256) 240 (200, 266)Stool frequency (no./d) 5 (4, 6) 5 (5, 6) 5 (5, 6)Duration of diarrhea (d) 5 (4, 6) 5 (4, 6) 5 (4, 6)
1 All values are x�; 95% CI in parentheses. Zn05, zinc given at a dose of 5 mg/d; Zn20, zinc given at a dose of 20 mg/d; IVF, intravenous fluids; ORS, oralrehydration solution. There were no significant differences between groups according to Bonferroni-adjusted Student’s t test.
2 The number of times a child vomited, if he vomited.
608 BROOKS ET AL
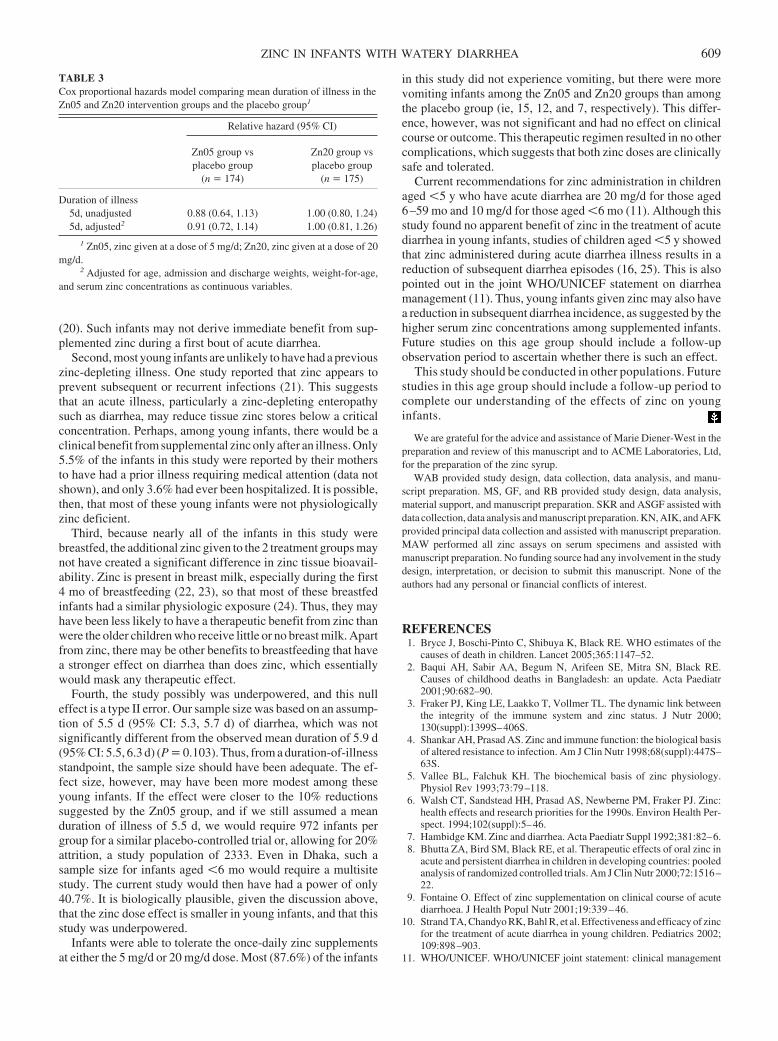
(20). Such infants may not derive immediate benefit from sup-plemented zinc during a first bout of acute diarrhea.
Second, most young infants are unlikely to have had a previouszinc-depleting illness. One study reported that zinc appears toprevent subsequent or recurrent infections (21). This suggeststhat an acute illness, particularly a zinc-depleting enteropathysuch as diarrhea, may reduce tissue zinc stores below a criticalconcentration. Perhaps, among young infants, there would be aclinical benefit from supplemental zinc only after an illness. Only5.5% of the infants in this study were reported by their mothersto have had a prior illness requiring medical attention (data notshown), and only 3.6% had ever been hospitalized. It is possible,then, that most of these young infants were not physiologicallyzinc deficient.
Third, because nearly all of the infants in this study werebreastfed, the additional zinc given to the 2 treatment groups maynot have created a significant difference in zinc tissue bioavail-ability. Zinc is present in breast milk, especially during the first4 mo of breastfeeding (22, 23), so that most of these breastfedinfants had a similar physiologic exposure (24). Thus, they mayhave been less likely to have a therapeutic benefit from zinc thanwere the older children who receive little or no breast milk. Apartfrom zinc, there may be other benefits to breastfeeding that havea stronger effect on diarrhea than does zinc, which essentiallywould mask any therapeutic effect.
Fourth, the study possibly was underpowered, and this nulleffect is a type II error. Our sample size was based on an assump-tion of 5.5 d (95% CI: 5.3, 5.7 d) of diarrhea, which was notsignificantly different from the observed mean duration of 5.9 d(95% CI: 5.5, 6.3 d) (P � 0.103). Thus, from a duration-of-illnessstandpoint, the sample size should have been adequate. The ef-fect size, however, may have been more modest among theseyoung infants. If the effect were closer to the 10% reductionssuggested by the Zn05 group, and if we still assumed a meanduration of illness of 5.5 d, we would require 972 infants pergroup for a similar placebo-controlled trial or, allowing for 20%attrition, a study population of 2333. Even in Dhaka, such asample size for infants aged �6 mo would require a multisitestudy. The current study would then have had a power of only40.7%. It is biologically plausible, given the discussion above,that the zinc dose effect is smaller in young infants, and that thisstudy was underpowered.
Infants were able to tolerate the once-daily zinc supplementsat either the 5 mg/d or 20 mg/d dose. Most (87.6%) of the infants
in this study did not experience vomiting, but there were morevomiting infants among the Zn05 and Zn20 groups than amongthe placebo group (ie, 15, 12, and 7, respectively). This differ-ence, however, was not significant and had no effect on clinicalcourse or outcome. This therapeutic regimen resulted in no othercomplications, which suggests that both zinc doses are clinicallysafe and tolerated.
Current recommendations for zinc administration in childrenaged �5 y who have acute diarrhea are 20 mg/d for those aged6–59 mo and 10 mg/d for those aged �6 mo (11). Although thisstudy found no apparent benefit of zinc in the treatment of acutediarrhea in young infants, studies of children aged �5 y showedthat zinc administered during acute diarrhea illness results in areduction of subsequent diarrhea episodes (16, 25). This is alsopointed out in the joint WHO/UNICEF statement on diarrheamanagement (11). Thus, young infants given zinc may also havea reduction in subsequent diarrhea incidence, as suggested by thehigher serum zinc concentrations among supplemented infants.Future studies on this age group should include a follow-upobservation period to ascertain whether there is such an effect.
This study should be conducted in other populations. Futurestudies in this age group should include a follow-up period tocomplete our understanding of the effects of zinc on younginfants.
We are grateful for the advice and assistance of Marie Diener-West in thepreparation and review of this manuscript and to ACME Laboratories, Ltd,for the preparation of the zinc syrup.
WAB provided study design, data collection, data analysis, and manu-script preparation. MS, GF, and RB provided study design, data analysis,material support, and manuscript preparation. SKR and ASGF assisted withdata collection, data analysis and manuscript preparation. KN, AIK, and AFKprovided principal data collection and assisted with manuscript preparation.MAW performed all zinc assays on serum specimens and assisted withmanuscript preparation. No funding source had any involvement in the studydesign, interpretation, or decision to submit this manuscript. None of theauthors had any personal or financial conflicts of interest.
REFERENCES1. Bryce J, Boschi-Pinto C, Shibuya K, Black RE. WHO estimates of the
causes of death in children. Lancet 2005;365:1147–52.2. Baqui AH, Sabir AA, Begum N, Arifeen SE, Mitra SN, Black RE.
Causes of childhood deaths in Bangladesh: an update. Acta Paediatr2001;90:682–90.
3. Fraker PJ, King LE, Laakko T, Vollmer TL. The dynamic link betweenthe integrity of the immune system and zinc status. J Nutr 2000;130(suppl):1399S–406S.
4. Shankar AH, Prasad AS. Zinc and immune function: the biological basisof altered resistance to infection. Am J Clin Nutr 1998;68(suppl):447S–63S.
5. Vallee BL, Falchuk KH. The biochemical basis of zinc physiology.Physiol Rev 1993;73:79–118.
6. Walsh CT, Sandstead HH, Prasad AS, Newberne PM, Fraker PJ. Zinc:health effects and research priorities for the 1990s. Environ Health Per-spect. 1994;102(suppl):5–46.
7. Hambidge KM. Zinc and diarrhea. Acta Paediatr Suppl 1992;381:82–6.8. Bhutta ZA, Bird SM, Black RE, et al. Therapeutic effects of oral zinc in
acute and persistent diarrhea in children in developing countries: pooledanalysis of randomized controlled trials. Am J Clin Nutr 2000;72:1516–22.
9. Fontaine O. Effect of zinc supplementation on clinical course of acutediarrhoea. J Health Popul Nutr 2001;19:339–46.
10. Strand TA, Chandyo RK, Bahl R, et al. Effectiveness and efficacy of zincfor the treatment of acute diarrhea in young children. Pediatrics 2002;109:898–903.
11. WHO/UNICEF. WHO/UNICEF joint statement: clinical management
TABLE 3Cox proportional hazards model comparing mean duration of illness in theZn05 and Zn20 intervention groups and the placebo group1
Relative hazard (95% CI)
Zn05 group vsplacebo group
(n � 174)
Zn20 group vsplacebo group
(n � 175)
Duration of illness5d, unadjusted 0.88 (0.64, 1.13) 1.00 (0.80, 1.24)5d, adjusted2 0.91 (0.72, 1.14) 1.00 (0.81, 1.26)
1 Zn05, zinc given at a dose of 5 mg/d; Zn20, zinc given at a dose of 20mg/d.
2 Adjusted for age, admission and discharge weights, weight-for-age,and serum zinc concentrations as continuous variables.
ZINC IN INFANTS WITH WATERY DIARRHEA 609
of acute diarrhoea. New York, NY, and Geneva, Switzerland: TheUnited Nations Children’s Fund/World Health Organization, 2004:1–8.
12. World Health Organization Department of Child and Adolescent Healthand Development and UNICEF. Management of the child with a seriousinfection or severe malnutrition: guidelines for care at the first-referrallevel in developing countries. Geneva, Switzerland, and New York:World Health Organization Department of Child and Adolescent Healthand Development and UNICEF, 2000:23–24.
13. Hamil PVV, Drizd TA, Johnson CL, Reed RB, Roche AF, Moore WM.Physical growth: National Center for Health Statistics percentiles. Am JClin Nutr 1979;32:607–29.
14. Brooks WA, Yunus M, Santosham M, et al. Zinc for severe pneumoniain very young children: double-blind placebo-controlled trial. Lancet2004;363:1683–8.
15. Selvin S. Statistical analysis of epidemiological data. 2nd ed. Mono-graphs in epidemiology and biostatistics, vol. 25. New York: OxfordUniversity Press, Inc, 1996:467.
16. Roy SK, Tomkins AM, Akramuzzaman SM, et al. Randomised con-trolled trial of zinc supplementation in malnourished Bangladeshi chil-dren with acute diarrhoea. Arch Dis Child 1997;77:196–200.
17. Sachdev HP, Mittal NK, Mittal SK, Yadav HS. A controlled trial onutility of oral zinc supplementation in acute dehydrating diarrhea ininfants. J Pediatr Gastroenterol Nutr 1988;7:877–81.
18. Sazawal S, Black RE, Bhan MK, Bhandari N, Sinha A, Jalla S. Zinc
supplementation in young children with acute diarrhea in India. N EnglJ Med 1995;333:839–44.
19. Iqbal AS, Shahidullah M, Islam MN, Akhter S, Banu S. Serum zinc andcopper levels in the maternal blood and cord blood of neonates. IndianJ Pediatr 2001;68:523–6.
20. Osendarp SJ, van Raaij JM, Darmstadt GL, Baqui AH, Hautvast JG,Fuchs GJ. Zinc supplementation during pregnancy and effects on growthand morbidity in low birthweight infants: a randomised placebo con-trolled trial. Lancet 2001;357:1080–5.
21. Roy SK, Tomkins AM, Haider R, et al. Impact of zinc supplementationon subsequent growth and morbidity in Bangladeshi children with acutediarrhoea. Eur J Clin Nutr 1999;53:529–34.
22. Hemalatha P, Bhaskaram P, Kumar PA, Khan MM, Islam MA. Zincstatus of breastfed and formula-fed infants of different gestational ages.J Trop Pediatr 1997;43:52–4.
23. Lamounier JA, Danelluzzi JC, Vannucchi H. Zinc concentrations inhuman milk during lactation: a 6-month longitudinal study in southernBrazil. J Trop Pediatr 1989;35:31–4.
24. Hussain M, Sikder ZU, Wahed MA, Haque AT, Jahan F. Zinc concen-tration of breast milk and its diurnal variation in Bangladeshi mothers.Bangladesh Med Res Counc Bull 1996;22:70–3.
25. Baqui AH, Black RE, El Arifeen S, et al. Effect of zinc supple-mentation started during diarrhoea on morbidity and mortality inBangladeshi children: community randomised trial. BMJ 2002;325:1059.
610 BROOKS ET AL
Systematic review of the effects of n�3 fatty acids in inflammatorybowel disease1–4
Catherine H MacLean, Walter A Mojica, Sydne J Newberry, James Pencharz, Rena Hasenfeld Garland, Wenli Tu,Lara G Hilton, Ian M Gralnek, Shannon Rhodes, Puja Khanna, and Sally C Morton
ABSTRACTBackground: n�3 Fatty acids are purported to have health effectsin patients with inflammatory bowel disease (IBD), but studies havereported mixed results.Objective: We aimed to synthesize published and unpublished ev-idence to determine estimates of the effect of n�3 fatty acids onclinical outcomes in IBD and whether n�3 fatty acids modify theeffects of or need for treatment with other agents.Design: Computerized databases were searched for studies of n�3fatty acids in immune-mediated diseases from 1966 to 2003. We alsocontacted experts in the nutraceutical industry to identify unpub-lished studies; however, none were identified.Results: Reviewers identified 13 controlled trials that assessed theeffects of n�3 fatty acids on clinical, sigmoidoscopic, or histologicscores; rates of induced remission or relapse; or requirements forsteroids and other immunosuppressive agents in Crohn disease orulcerative colitis. Most clinical trials were of good quality. Fewerthan 6 were identified that assessed the effects of n�3 fatty acids onany single outcome of clinical, endoscopic, or histologic scores orremission or relapse rates. Consistent across 3 studies was the find-ing that n�3 fatty acids reduce corticosteroid requirements, al-though statistical significance was shown in only 1 of these studies.Conclusion: The available data are insufficient to draw conclusionsabout the effects of n�3 fatty acids on clinical, endoscopic, orhistologic scores or remission or relapse rates. Am J Clin Nutr2005;82:611–9.
KEY WORDS n�3 Fatty acids, inflammatory bowel disease
INTRODUCTION
n�3 Fatty acids have been promoted as conferring broadhealth benefits by preventing and treating a wide variety of dis-eases (1–3). In cell culture and animal studies, these essentialfatty acids have potent immunomodulatory effects that appear tobe mediated both through modulation of eicosanoid synthesisand through an eicosanoid-independent inhibitory effect on theproinflammatory cytokine interleukin 1 (IL-1). Thus, it has beenproposed that supplemental n�3 fatty acids might be beneficialin treating or preventing relapse in chronic inflammatory dis-eases.
The inflammatory bowel diseases (IBDs), Crohn disease andulcerative colitis, are diseases of altered immunity that affect�3.5 million persons in the United States and Europe and areassociated with substantial morbidity (4–7). Population-based
epidemiologic studies suggest that fatty acids may play a role inIBD (8, 9). Studies that have examined fatty acid profiles haveshown decreased total serum polyunsaturated fatty acids in IBDpatients as well as deficiencies specifically in n�3 fatty acids inCrohn disease patients (10, 11). Moreover, evidence exists that aproportion of IBD patients have essential fatty acid deficiency,which can contribute to the pathology of IBD (12). At the cellularlevel, IBD is characterized by elevated concentrations of IL-1and proinflammatory leukotriene B (synthesized from n�6 fattyacids). Immunomodulatory mechanisms proposed for n�3 fattyacids in IBD include altering eicosanoid synthesis, cell mem-brane fluidity, cell signal transduction, intraluminal bacterialcontent, and gene expression (13).
Several clinical trials have been conducted to test the effects ofn�3 fatty acid supplements on clinical outcomes in IBD. How-ever, these studies have reported mixed results. We performed asystematic review of the literature to assess the benefits of n�3fatty acid supplements in IBD. Our objective was to summarizewhat is known about the effects of n�3 fatty acids on clinicaloutcomes in IBD and to identify gaps in knowledge that willsuggest the most fruitful direction for future research.
METHODS
The study on which this report is based is part of a largersystematic review of the medical literature regarding the effectsof n�3 fatty acid supplementation on immune-mediated dis-eases. Consequently, our initial search was broad and sought
1 From the Southern California Evidence-Based Practice Center, whichincludes RAND Health, Santa Monica, CA (CHM, WAM, SJN, RHG, WT,LGH, IMG, SR, PK, and SCM); the Greater Los Angeles VA HealthcareSystem Divisions of Rheumatology (CHM) and Gastroenterology (IMG),Los Angeles, CA; Clinical Decision Making and Healthcare, Toronto Gen-eral Research Institute, Toronto General Hospital, Toronto, Ontario, Canada(JP); and the Institute of Medical Science, Faculty of Medicine, University ofToronto, Toronto, Ontario, Canada (JP).
2 The views expressed in this article are those of the authors and do notnecessarily reflect those of the Agency for Healthcare Research and Quality(AHRQ) or the US Department of Health and Human Services.
3 Supported by AHRQ contract 290-02-0003. CHM and IMG are VeteransAdministration Health Services Research and Development Career Devel-opment Awardees.
4 Address reprint requests to CH MacLean, RAND, 1700 Main Street,M23-C, Santa Monica, CA 90407-2138. E-mail: [email protected].
Received January 12, 2005.Accepted for publication May 26, 2005.
611Am J Clin Nutr 2005;82:611–9. Printed in USA. © 2005 American Society for Clinical Nutrition
data on the effects of n�3 fatty acids on IBD and several otherimmune-mediated diseases. The present report deals onlywith IBD.
Identification of the literature
Our search for studies that described the effects of n�3 fattyacids on IBD was combined with a search for studies of immune-mediated renal disease. The search terms we used were broad andwere designed to identify any relevant human study (these areavailable from the authors on request). We did not restrict oursearches by language or study design. The following databaseswere searched: MEDLINE (National Library of Medicine, Be-thesda, MD; January 1966 through July 2003), PREMEDLINE(National Library of Medicine; searched on 8 July 2003), EM-BASE (Elsevier, New York, NY; January 1980 through June2003), the Cochrane Central Register of Controlled Trials (TheCochrane Collaboration, Oxford, United Kingdom; searched2nd Quarter Volume 2003), CAB Health (CAB International,Cambridge, MA; January 1973 through June 2003), and Disser-tation Abstracts (Proquest, Ann Arbor, MI; January 1961through December 2002). We identified additional literature byscanning the references of the relevant literature and by contact-ing industry experts for unpublished data.
Evaluation of the literature
We transferred the citations identified in our electronic liter-ature search to a secured Internet-based software system thatenabled us to view article titles and abstracts electronically. Tworeviewers independently evaluated the citations and abstracts. Atthis stage, our goal was to identify articles that described studiesof the effects of n�3 fatty acids on IBD in humans. Only titlesthat clearly did not meet these criteria were rejected; articles forwhich relevance was unclear from the title or abstract were con-sidered to be relevant. All articles that were flagged as beingrelevant by at least one reviewer were obtained for further re-view. Language was not a barrier to inclusion.
Two reviewers independently reviewed each article by usinga structured screening form. Studies were accepted for furtherreview if they met the following predefined inclusion criteria:description of an intervention with n�3 fatty acids, human studypopulation with IBD, and randomized controlled trial or con-trolled clinical trial, ie, experiments in which the use of n�3 fattyacids was under the control of the investigator, although trialparticipants might not have been randomly assigned to treatmentgroups. The reviewers resolved any disagreements by consensus.
Data extraction
For the articles that passed our screening criteria, 2 reviewersindependently abstracted detailed data about the outcomes ofinterest; the number and characteristics of the patients; details onthe intervention, such as the dose, frequency, and duration; thetypes of outcome measures; adverse events; and the elapsed timebetween the intervention and outcome measurements. To eval-uate the quality of the design and execution of trials, we alsocollected information about the study design, appropriateness ofrandomization, blinding, description of withdrawals and drop-outs, and concealment of allocation. All of these parameters havebeen validated as markers of methodologic quality either whenused alone (14, 15) or when used in combination (14, 16).
All stages of the review were performed independently by 2reviewers trained in health services research and the principles ofcritical appraisal; at least one reviewer was a physician. Thereviewers resolved differences through consensus, and a seniorphysician researcher resolved any disagreements. Foreign lan-guage articles in languages in which one of our reviewers wasfluent were reviewed by that reviewer alone. Other foreign lan-guage articles were reviewed by a physician fluent in the lan-guage of the article with the assistance of a study group member.We did not have interpreters available for 2 foreign languagestudies.
Outcomes of interest
The primary outcomes of interest were clinical, endoscopic, orhistologic scores; rates of induced remission or relapse; or re-quirements for steroids or immunosuppressive agents. We in-cluded only articles that reported one or more of the outcomes ofinterest. For these outcomes, we assessed whether data werereported about the effects of n�3 fatty acids on subpopulations.We also assessed whether data were reported about the effects ofsource, dose, and exposure duration of n�3 fatty acids on theoutcomes of interest.
Data analysis
For each of the studies identified, uniform data elements weresummarized in evidence tables. For each study, the point esti-mates or magnitude of effect for each outcome of interest wassummarized with a notation of the reported statistical signifi-cance of the result.
We calculated a quality score from 0 to 5 for each trial by usinga system developed by Jadad et al (16). Studies with scores of �3on this scale are considered high quality and tend to reportsmaller differences between treatment groups than studies withlower scores (14, 16). For our purposes, if the results of a trialwere reported in more than one article, the quality score for thattrial was the maximum score calculated across the various arti-cles in which the study was described.
RESULTS
Literature search
The results of our literature search are detailed in Figure 1. Wereviewed 366 citations and abstracts obtained from our comput-erized literature searches. We subsequently reviewed 6 addi-tional titles identified by hand-searching the reference lists ofaccepted articles. We did not receive any unpublished data re-garding IBD and n�3 fatty acids in response to our requests toindustry experts. Our 2 reviewers considered 180 of the articletitles to be relevant. We were able to retrieve all but one of the 180titles as full-text articles.
Of the 179 articles retrieved, 114 pertained to the use of n�3fatty acids in the treatment of IBD in humans; among these 114articles, 24 reported on randomized controlled trials or controlledclinical trials and underwent a more detailed review. On detailedreview, 3 of the 24 articles did not define a difference in n�3content across study arms, 6 did not study outcomes of interest,1 was a duplicate report of information included in another arti-cle, and 1 did not report the data separately for each study arm.Each of the remaining 13 articles described outcomes of interest
612 MACLEAN ET AL
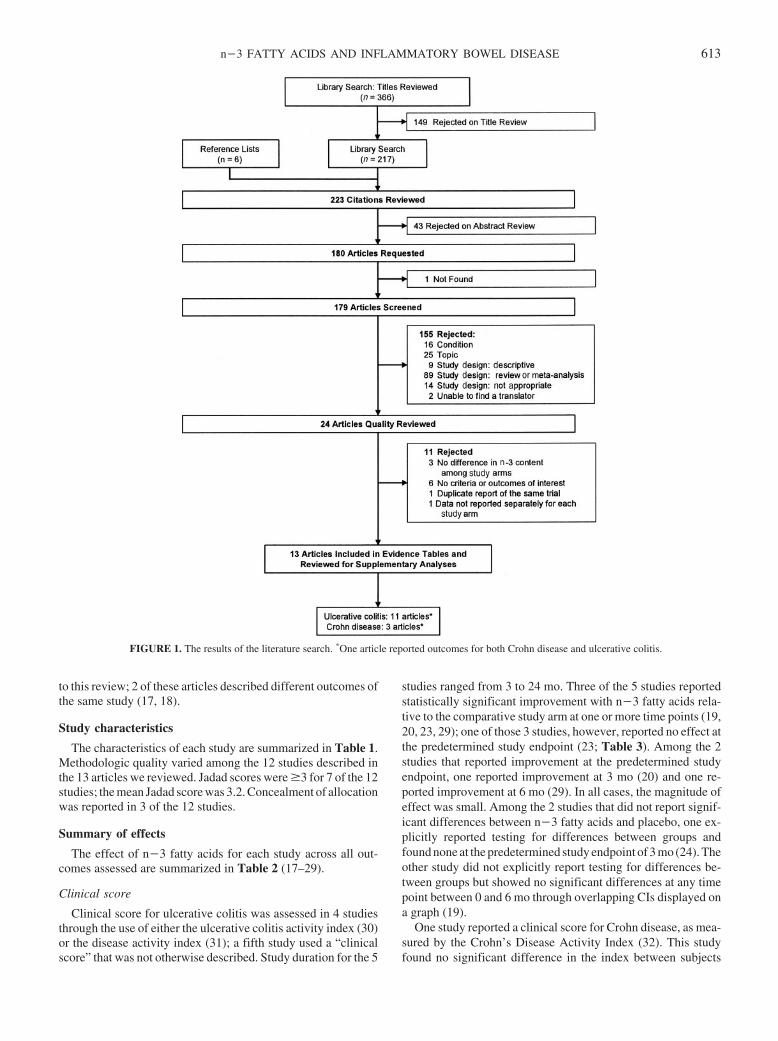
to this review; 2 of these articles described different outcomes ofthe same study (17, 18).
Study characteristics
The characteristics of each study are summarized in Table 1.Methodologic quality varied among the 12 studies described inthe 13 articles we reviewed. Jadad scores were �3 for 7 of the 12studies; the mean Jadad score was 3.2. Concealment of allocationwas reported in 3 of the 12 studies.
Summary of effects
The effect of n�3 fatty acids for each study across all out-comes assessed are summarized in Table 2 (17–29).
Clinical score
Clinical score for ulcerative colitis was assessed in 4 studiesthrough the use of either the ulcerative colitis activity index (30)or the disease activity index (31); a fifth study used a “clinicalscore” that was not otherwise described. Study duration for the 5
studies ranged from 3 to 24 mo. Three of the 5 studies reportedstatistically significant improvement with n�3 fatty acids rela-tive to the comparative study arm at one or more time points (19,20, 23, 29); one of those 3 studies, however, reported no effect atthe predetermined study endpoint (23; Table 3). Among the 2studies that reported improvement at the predetermined studyendpoint, one reported improvement at 3 mo (20) and one re-ported improvement at 6 mo (29). In all cases, the magnitude ofeffect was small. Among the 2 studies that did not report signif-icant differences between n�3 fatty acids and placebo, one ex-plicitly reported testing for differences between groups andfound none at the predetermined study endpoint of 3 mo (24). Theother study did not explicitly report testing for differences be-tween groups but showed no significant differences at any timepoint between 0 and 6 mo through overlapping CIs displayed ona graph (19).
One study reported a clinical score for Crohn disease, as mea-sured by the Crohn’s Disease Activity Index (32). This studyfound no significant difference in the index between subjects
FIGURE 1. The results of the literature search. *One article reported outcomes for both Crohn disease and ulcerative colitis.
n�3 FATTY ACIDS AND INFLAMMATORY BOWEL DISEASE 613
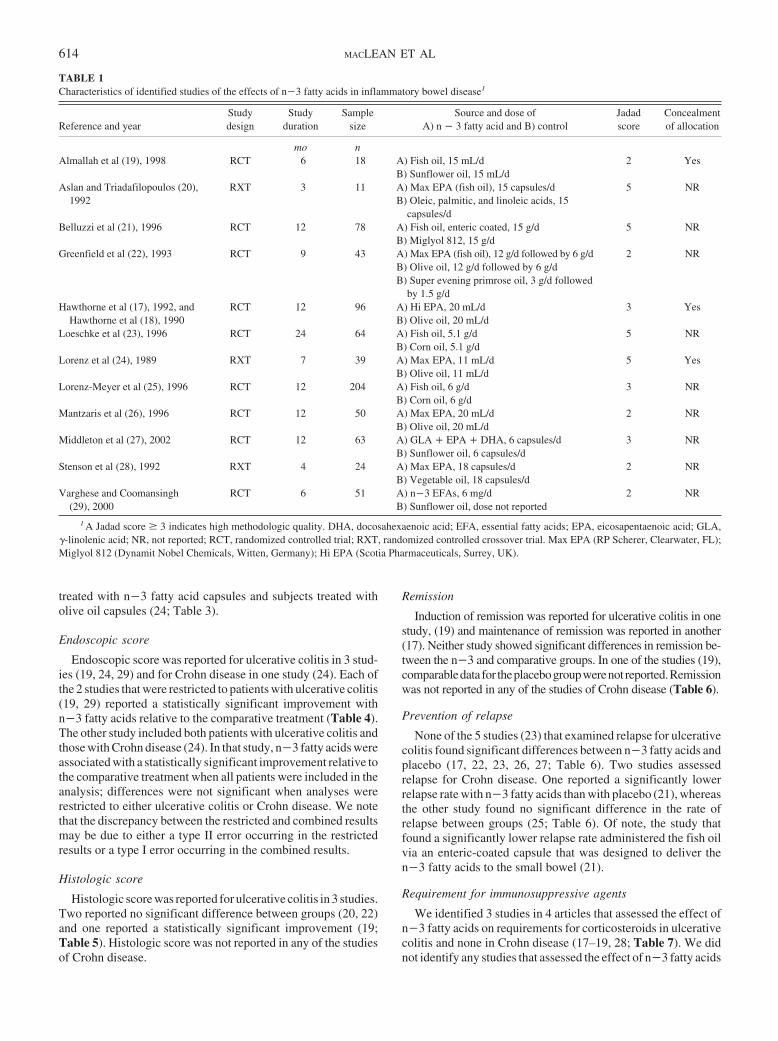
treated with n�3 fatty acid capsules and subjects treated witholive oil capsules (24; Table 3).
Endoscopic score
Endoscopic score was reported for ulcerative colitis in 3 stud-ies (19, 24, 29) and for Crohn disease in one study (24). Each ofthe 2 studies that were restricted to patients with ulcerative colitis(19, 29) reported a statistically significant improvement withn�3 fatty acids relative to the comparative treatment (Table 4).The other study included both patients with ulcerative colitis andthose with Crohn disease (24). In that study, n�3 fatty acids wereassociated with a statistically significant improvement relative tothe comparative treatment when all patients were included in theanalysis; differences were not significant when analyses wererestricted to either ulcerative colitis or Crohn disease. We notethat the discrepancy between the restricted and combined resultsmay be due to either a type II error occurring in the restrictedresults or a type I error occurring in the combined results.
Histologic score
Histologic score was reported for ulcerative colitis in 3 studies.Two reported no significant difference between groups (20, 22)and one reported a statistically significant improvement (19;Table 5). Histologic score was not reported in any of the studiesof Crohn disease.
Remission
Induction of remission was reported for ulcerative colitis in onestudy, (19) and maintenance of remission was reported in another(17). Neither study showed significant differences in remission be-tween the n�3 and comparative groups. In one of the studies (19),comparabledata for theplacebogroupwerenot reported.Remissionwas not reported in any of the studies of Crohn disease (Table 6).
Prevention of relapse
None of the 5 studies (23) that examined relapse for ulcerativecolitis found significant differences between n�3 fatty acids andplacebo (17, 22, 23, 26, 27; Table 6). Two studies assessedrelapse for Crohn disease. One reported a significantly lowerrelapse rate with n�3 fatty acids than with placebo (21), whereasthe other study found no significant difference in the rate ofrelapse between groups (25; Table 6). Of note, the study thatfound a significantly lower relapse rate administered the fish oilvia an enteric-coated capsule that was designed to deliver then�3 fatty acids to the small bowel (21).
Requirement for immunosuppressive agents
We identified 3 studies in 4 articles that assessed the effect ofn�3 fatty acids on requirements for corticosteroids in ulcerativecolitis and none in Crohn disease (17–19, 28; Table 7). We didnot identify any studies that assessed the effect of n�3 fatty acids
TABLE 1Characteristics of identified studies of the effects of n�3 fatty acids in inflammatory bowel disease1
Reference and yearStudydesign
Studyduration
Samplesize
Source and dose ofA) n � 3 fatty acid and B) control
Jadadscore
Concealmentof allocation
mo nAlmallah et al (19), 1998 RCT 6 18 A) Fish oil, 15 mL/d 2 Yes
B) Sunflower oil, 15 mL/dAslan and Triadafilopoulos (20), RXT 3 11 A) Max EPA (fish oil), 15 capsules/d 5 NR
1992 B) Oleic, palmitic, and linoleic acids, 15capsules/d
Belluzzi et al (21), 1996 RCT 12 78 A) Fish oil, enteric coated, 15 g/d 5 NRB) Miglyol 812, 15 g/d
Greenfield et al (22), 1993 RCT 9 43 A) Max EPA (fish oil), 12 g/d followed by 6 g/d 2 NRB) Olive oil, 12 g/d followed by 6 g/dB) Super evening primrose oil, 3 g/d followed
by 1.5 g/dHawthorne et al (17), 1992, and RCT 12 96 A) Hi EPA, 20 mL/d 3 Yes
Hawthorne et al (18), 1990 B) Olive oil, 20 mL/dLoeschke et al (23), 1996 RCT 24 64 A) Fish oil, 5.1 g/d 5 NR
B) Corn oil, 5.1 g/dLorenz et al (24), 1989 RXT 7 39 A) Max EPA, 11 mL/d 5 Yes
B) Olive oil, 11 mL/dLorenz-Meyer et al (25), 1996 RCT 12 204 A) Fish oil, 6 g/d 3 NR
B) Corn oil, 6 g/dMantzaris et al (26), 1996 RCT 12 50 A) Max EPA, 20 mL/d 2 NR
B) Olive oil, 20 mL/dMiddleton et al (27), 2002 RCT 12 63 A) GLA � EPA � DHA, 6 capsules/d 3 NR
B) Sunflower oil, 6 capsules/dStenson et al (28), 1992 RXT 4 24 A) Max EPA, 18 capsules/d 2 NR
B) Vegetable oil, 18 capsules/dVarghese and Coomansingh RCT 6 51 A) n�3 EFAs, 6 mg/d 2 NR
(29), 2000 B) Sunflower oil, dose not reported
1 A Jadad score � 3 indicates high methodologic quality. DHA, docosahexaenoic acid; EFA, essential fatty acids; EPA, eicosapentaenoic acid; GLA,�-linolenic acid; NR, not reported; RCT, randomized controlled trial; RXT, randomized controlled crossover trial. Max EPA (RP Scherer, Clearwater, FL);Miglyol 812 (Dynamit Nobel Chemicals, Witten, Germany); Hi EPA (Scotia Pharmaceuticals, Surrey, UK).
614 MACLEAN ET AL
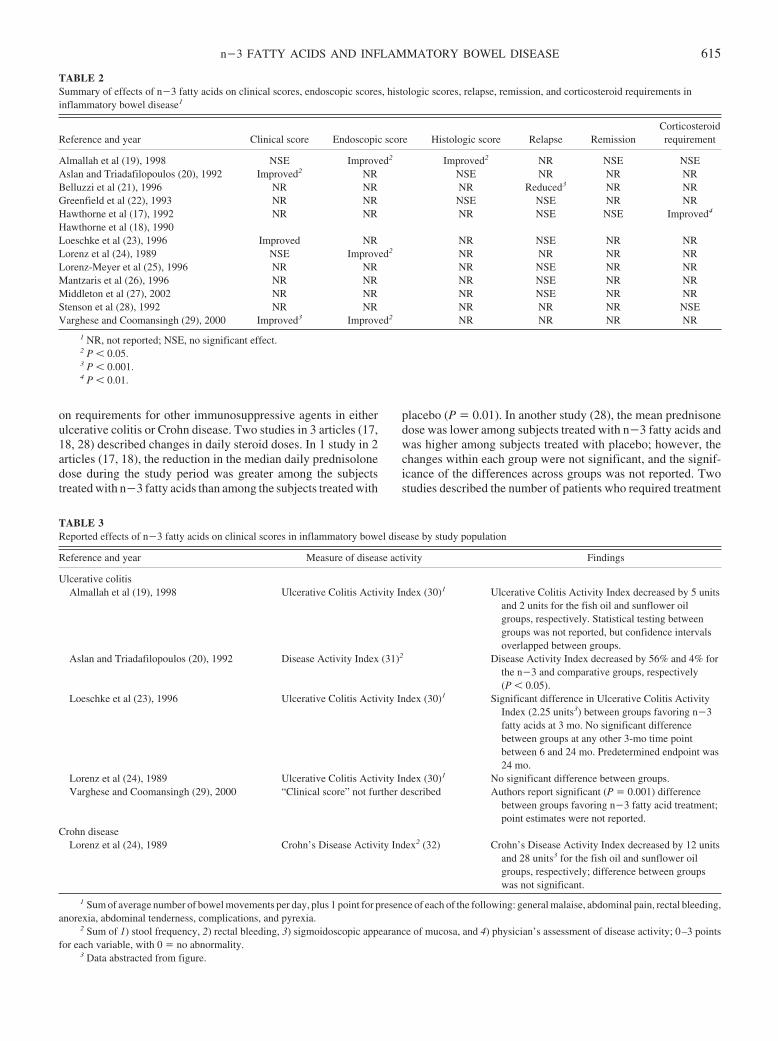
on requirements for other immunosuppressive agents in eitherulcerative colitis or Crohn disease. Two studies in 3 articles (17,18, 28) described changes in daily steroid doses. In 1 study in 2articles (17, 18), the reduction in the median daily prednisolonedose during the study period was greater among the subjectstreated with n�3 fatty acids than among the subjects treated with
placebo (P � 0.01). In another study (28), the mean prednisonedose was lower among subjects treated with n�3 fatty acids andwas higher among subjects treated with placebo; however, thechanges within each group were not significant, and the signif-icance of the differences across groups was not reported. Twostudies described the number of patients who required treatment
TABLE 2Summary of effects of n�3 fatty acids on clinical scores, endoscopic scores, histologic scores, relapse, remission, and corticosteroid requirements ininflammatory bowel disease1
Reference and year Clinical score Endoscopic score Histologic score Relapse RemissionCorticosteroidrequirement
Almallah et al (19), 1998 NSE Improved2 Improved2 NR NSE NSEAslan and Triadafilopoulos (20), 1992 Improved2 NR NSE NR NR NRBelluzzi et al (21), 1996 NR NR NR Reduced3 NR NRGreenfield et al (22), 1993 NR NR NSE NSE NR NRHawthorne et al (17), 1992 NR NR NR NSE NSE Improved4
Hawthorne et al (18), 1990Loeschke et al (23), 1996 Improved NR NR NSE NR NRLorenz et al (24), 1989 NSE Improved2 NR NR NR NRLorenz-Meyer et al (25), 1996 NR NR NR NSE NR NRMantzaris et al (26), 1996 NR NR NR NSE NR NRMiddleton et al (27), 2002 NR NR NR NSE NR NRStenson et al (28), 1992 NR NR NR NR NR NSEVarghese and Coomansingh (29), 2000 Improved3 Improved2 NR NR NR NR
1 NR, not reported; NSE, no significant effect.2 P � 0.05.3 P � 0.001.4 P � 0.01.
TABLE 3Reported effects of n�3 fatty acids on clinical scores in inflammatory bowel disease by study population
Reference and year Measure of disease activity Findings
Ulcerative colitisAlmallah et al (19), 1998 Ulcerative Colitis Activity Index (30)1 Ulcerative Colitis Activity Index decreased by 5 units
and 2 units for the fish oil and sunflower oilgroups, respectively. Statistical testing betweengroups was not reported, but confidence intervalsoverlapped between groups.
Aslan and Triadafilopoulos (20), 1992 Disease Activity Index (31)2 Disease Activity Index decreased by 56% and 4% forthe n�3 and comparative groups, respectively(P � 0.05).
Loeschke et al (23), 1996 Ulcerative Colitis Activity Index (30)1 Significant difference in Ulcerative Colitis ActivityIndex (2.25 units3) between groups favoring n�3fatty acids at 3 mo. No significant differencebetween groups at any other 3-mo time pointbetween 6 and 24 mo. Predetermined endpoint was24 mo.
Lorenz et al (24), 1989 Ulcerative Colitis Activity Index (30)1 No significant difference between groups.Varghese and Coomansingh (29), 2000 “Clinical score” not further described Authors report significant (P � 0.001) difference
between groups favoring n�3 fatty acid treatment;point estimates were not reported.
Crohn diseaseLorenz et al (24), 1989 Crohn’s Disease Activity Index2 (32) Crohn’s Disease Activity Index decreased by 12 units
and 28 units3 for the fish oil and sunflower oilgroups, respectively; difference between groupswas not significant.
1 Sum of average number of bowel movements per day, plus 1 point for presence of each of the following: general malaise, abdominal pain, rectal bleeding,anorexia, abdominal tenderness, complications, and pyrexia.
2 Sum of 1) stool frequency, 2) rectal bleeding, 3) sigmoidoscopic appearance of mucosa, and 4) physician’s assessment of disease activity; 0–3 pointsfor each variable, with 0 � no abnormality.
3 Data abstracted from figure.
n�3 FATTY ACIDS AND INFLAMMATORY BOWEL DISEASE 615
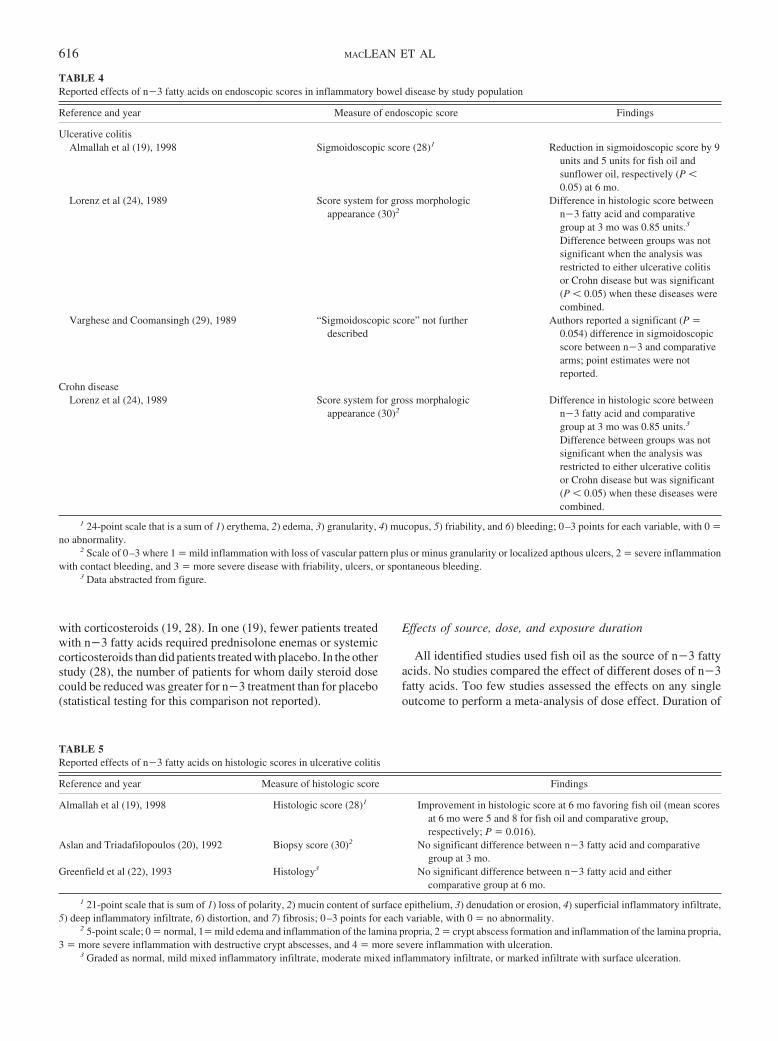
with corticosteroids (19, 28). In one (19), fewer patients treatedwith n�3 fatty acids required prednisolone enemas or systemiccorticosteroids than did patients treated with placebo. In the otherstudy (28), the number of patients for whom daily steroid dosecould be reduced was greater for n�3 treatment than for placebo(statistical testing for this comparison not reported).
Effects of source, dose, and exposure duration
All identified studies used fish oil as the source of n�3 fattyacids. No studies compared the effect of different doses of n�3fatty acids. Too few studies assessed the effects on any singleoutcome to perform a meta-analysis of dose effect. Duration of
TABLE 4Reported effects of n�3 fatty acids on endoscopic scores in inflammatory bowel disease by study population
Reference and year Measure of endoscopic score Findings
Ulcerative colitisAlmallah et al (19), 1998 Sigmoidoscopic score (28)1 Reduction in sigmoidoscopic score by 9
units and 5 units for fish oil andsunflower oil, respectively (P �0.05) at 6 mo.
Lorenz et al (24), 1989 Score system for gross morphologicappearance (30)2
Difference in histologic score betweenn�3 fatty acid and comparativegroup at 3 mo was 0.85 units.3
Difference between groups was notsignificant when the analysis wasrestricted to either ulcerative colitisor Crohn disease but was significant(P � 0.05) when these diseases werecombined.
Varghese and Coomansingh (29), 1989 “Sigmoidoscopic score” not furtherdescribed
Authors reported a significant (P �0.054) difference in sigmoidoscopicscore between n�3 and comparativearms; point estimates were notreported.
Crohn diseaseLorenz et al (24), 1989 Score system for gross morphalogic
appearance (30)2Difference in histologic score between
n�3 fatty acid and comparativegroup at 3 mo was 0.85 units.3
Difference between groups was notsignificant when the analysis wasrestricted to either ulcerative colitisor Crohn disease but was significant(P � 0.05) when these diseases werecombined.
1 24-point scale that is a sum of 1) erythema, 2) edema, 3) granularity, 4) mucopus, 5) friability, and 6) bleeding; 0–3 points for each variable, with 0 �no abnormality.
2 Scale of 0–3 where 1 � mild inflammation with loss of vascular pattern plus or minus granularity or localized apthous ulcers, 2 � severe inflammationwith contact bleeding, and 3 � more severe disease with friability, ulcers, or spontaneous bleeding.
3 Data abstracted from figure.
TABLE 5Reported effects of n�3 fatty acids on histologic scores in ulcerative colitis
Reference and year Measure of histologic score Findings
Almallah et al (19), 1998 Histologic score (28)1 Improvement in histologic score at 6 mo favoring fish oil (mean scoresat 6 mo were 5 and 8 for fish oil and comparative group,respectively; P � 0.016).
Aslan and Triadafilopoulos (20), 1992 Biopsy score (30)2 No significant difference between n�3 fatty acid and comparativegroup at 3 mo.
Greenfield et al (22), 1993 Histology3 No significant difference between n�3 fatty acid and eithercomparative group at 6 mo.
1 21-point scale that is sum of 1) loss of polarity, 2) mucin content of surface epithelium, 3) denudation or erosion, 4) superficial inflammatory infiltrate,5) deep inflammatory infiltrate, 6) distortion, and 7) fibrosis; 0–3 points for each variable, with 0 � no abnormality.
2 5-point scale; 0 � normal, 1� mild edema and inflammation of the lamina propria, 2 � crypt abscess formation and inflammation of the lamina propria,3 � more severe inflammation with destructive crypt abscesses, and 4 � more severe inflammation with ulceration.
3 Graded as normal, mild mixed inflammatory infiltrate, moderate mixed inflammatory infiltrate, or marked infiltrate with surface ulceration.
616 MACLEAN ET AL
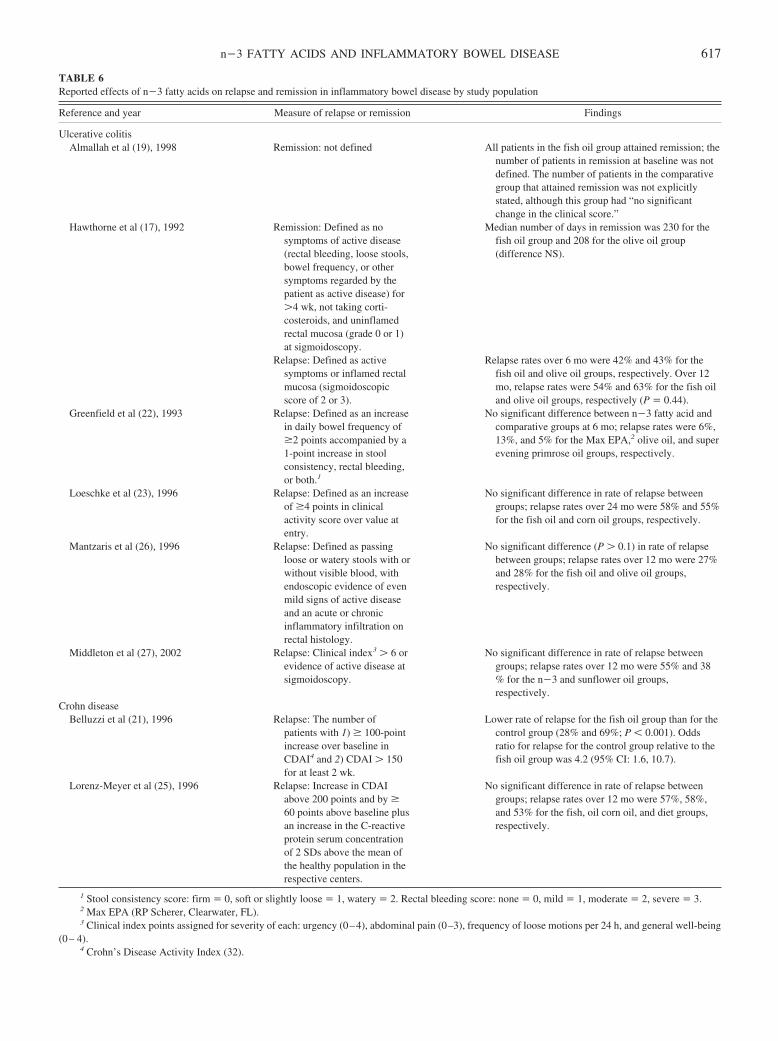
TABLE 6Reported effects of n�3 fatty acids on relapse and remission in inflammatory bowel disease by study population
Reference and year Measure of relapse or remission Findings
Ulcerative colitisAlmallah et al (19), 1998 Remission: not defined All patients in the fish oil group attained remission; the
number of patients in remission at baseline was notdefined. The number of patients in the comparativegroup that attained remission was not explicitlystated, although this group had “no significantchange in the clinical score.”
Hawthorne et al (17), 1992 Remission: Defined as nosymptoms of active disease(rectal bleeding, loose stools,bowel frequency, or othersymptoms regarded by thepatient as active disease) for�4 wk, not taking corti-costeroids, and uninflamedrectal mucosa (grade 0 or 1)at sigmoidoscopy.
Median number of days in remission was 230 for thefish oil group and 208 for the olive oil group(difference NS).
Relapse: Defined as activesymptoms or inflamed rectalmucosa (sigmoidoscopicscore of 2 or 3).
Relapse rates over 6 mo were 42% and 43% for thefish oil and olive oil groups, respectively. Over 12mo, relapse rates were 54% and 63% for the fish oiland olive oil groups, respectively (P � 0.44).
Greenfield et al (22), 1993 Relapse: Defined as an increasein daily bowel frequency of�2 points accompanied by a1-point increase in stoolconsistency, rectal bleeding,or both.1
No significant difference between n�3 fatty acid andcomparative groups at 6 mo; relapse rates were 6%,13%, and 5% for the Max EPA,2 olive oil, and superevening primrose oil groups, respectively.
Loeschke et al (23), 1996 Relapse: Defined as an increaseof �4 points in clinicalactivity score over value atentry.
No significant difference in rate of relapse betweengroups; relapse rates over 24 mo were 58% and 55%for the fish oil and corn oil groups, respectively.
Mantzaris et al (26), 1996 Relapse: Defined as passingloose or watery stools with orwithout visible blood, withendoscopic evidence of evenmild signs of active diseaseand an acute or chronicinflammatory infiltration onrectal histology.
No significant difference (P � 0.1) in rate of relapsebetween groups; relapse rates over 12 mo were 27%and 28% for the fish oil and olive oil groups,respectively.
Middleton et al (27), 2002 Relapse: Clinical index3 � 6 orevidence of active disease atsigmoidoscopy.
No significant difference in rate of relapse betweengroups; relapse rates over 12 mo were 55% and 38% for the n�3 and sunflower oil groups,respectively.
Crohn diseaseBelluzzi et al (21), 1996 Relapse: The number of
patients with 1) � 100-pointincrease over baseline inCDAI4 and 2) CDAI � 150for at least 2 wk.
Lower rate of relapse for the fish oil group than for thecontrol group (28% and 69%; P � 0.001). Oddsratio for relapse for the control group relative to thefish oil group was 4.2 (95% CI: 1.6, 10.7).
Lorenz-Meyer et al (25), 1996 Relapse: Increase in CDAIabove 200 points and by �60 points above baseline plusan increase in the C-reactiveprotein serum concentrationof 2 SDs above the mean ofthe healthy population in therespective centers.
No significant difference in rate of relapse betweengroups; relapse rates over 12 mo were 57%, 58%,and 53% for the fish, oil corn oil, and diet groups,respectively.
1 Stool consistency score: firm � 0, soft or slightly loose � 1, watery � 2. Rectal bleeding score: none � 0, mild � 1, moderate � 2, severe � 3.2 Max EPA (RP Scherer, Clearwater, FL).3 Clinical index points assigned for severity of each: urgency (0–4), abdominal pain (0–3), frequency of loose motions per 24 h, and general well-being
(0– 4).4 Crohn’s Disease Activity Index (32).
n�3 FATTY ACIDS AND INFLAMMATORY BOWEL DISEASE 617
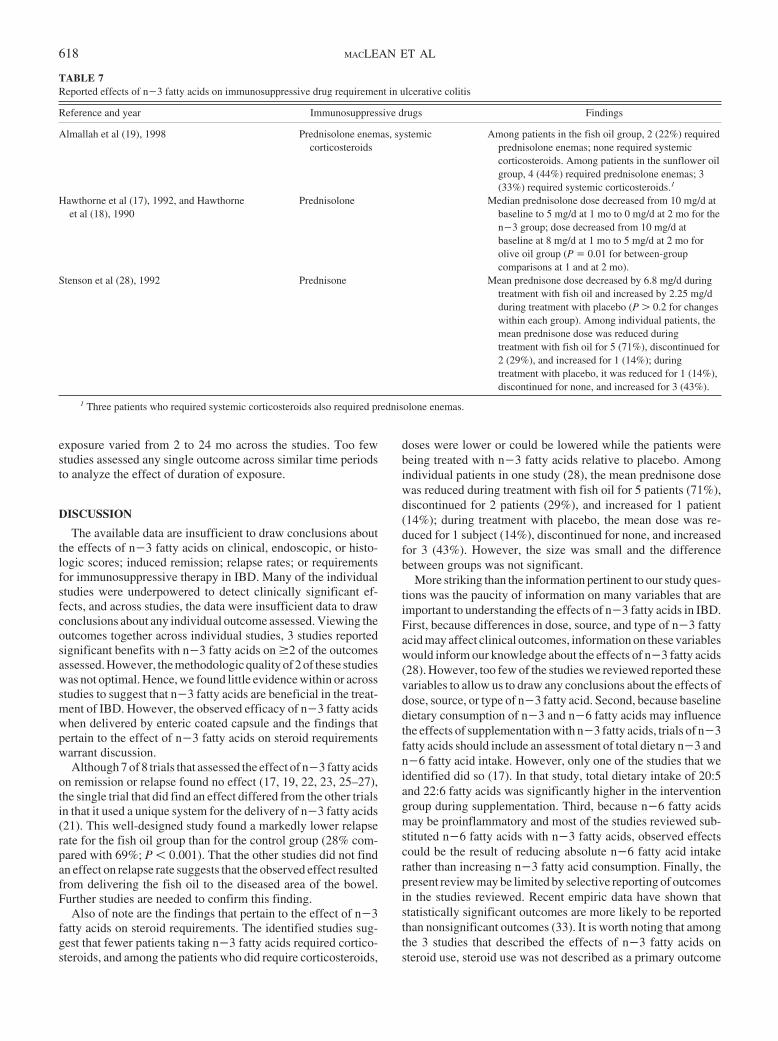
exposure varied from 2 to 24 mo across the studies. Too fewstudies assessed any single outcome across similar time periodsto analyze the effect of duration of exposure.
DISCUSSION
The available data are insufficient to draw conclusions aboutthe effects of n�3 fatty acids on clinical, endoscopic, or histo-logic scores; induced remission; relapse rates; or requirementsfor immunosuppressive therapy in IBD. Many of the individualstudies were underpowered to detect clinically significant ef-fects, and across studies, the data were insufficient data to drawconclusions about any individual outcome assessed. Viewing theoutcomes together across individual studies, 3 studies reportedsignificant benefits with n�3 fatty acids on �2 of the outcomesassessed. However, the methodologic quality of 2 of these studieswas not optimal. Hence, we found little evidence within or acrossstudies to suggest that n�3 fatty acids are beneficial in the treat-ment of IBD. However, the observed efficacy of n�3 fatty acidswhen delivered by enteric coated capsule and the findings thatpertain to the effect of n�3 fatty acids on steroid requirementswarrant discussion.
Although 7 of 8 trials that assessed the effect of n�3 fatty acidson remission or relapse found no effect (17, 19, 22, 23, 25–27),the single trial that did find an effect differed from the other trialsin that it used a unique system for the delivery of n�3 fatty acids(21). This well-designed study found a markedly lower relapserate for the fish oil group than for the control group (28% com-pared with 69%; P � 0.001). That the other studies did not findan effect on relapse rate suggests that the observed effect resultedfrom delivering the fish oil to the diseased area of the bowel.Further studies are needed to confirm this finding.
Also of note are the findings that pertain to the effect of n�3fatty acids on steroid requirements. The identified studies sug-gest that fewer patients taking n�3 fatty acids required cortico-steroids, and among the patients who did require corticosteroids,
doses were lower or could be lowered while the patients werebeing treated with n�3 fatty acids relative to placebo. Amongindividual patients in one study (28), the mean prednisone dosewas reduced during treatment with fish oil for 5 patients (71%),discontinued for 2 patients (29%), and increased for 1 patient(14%); during treatment with placebo, the mean dose was re-duced for 1 subject (14%), discontinued for none, and increasedfor 3 (43%). However, the size was small and the differencebetween groups was not significant.
More striking than the information pertinent to our study ques-tions was the paucity of information on many variables that areimportant to understanding the effects of n�3 fatty acids in IBD.First, because differences in dose, source, and type of n�3 fattyacid may affect clinical outcomes, information on these variableswould inform our knowledge about the effects of n�3 fatty acids(28). However, too few of the studies we reviewed reported thesevariables to allow us to draw any conclusions about the effects ofdose, source, or type of n�3 fatty acid. Second, because baselinedietary consumption of n�3 and n�6 fatty acids may influencethe effects of supplementation with n�3 fatty acids, trials of n�3fatty acids should include an assessment of total dietary n�3 andn�6 fatty acid intake. However, only one of the studies that weidentified did so (17). In that study, total dietary intake of 20:5and 22:6 fatty acids was significantly higher in the interventiongroup during supplementation. Third, because n�6 fatty acidsmay be proinflammatory and most of the studies reviewed sub-stituted n�6 fatty acids with n�3 fatty acids, observed effectscould be the result of reducing absolute n�6 fatty acid intakerather than increasing n�3 fatty acid consumption. Finally, thepresent review may be limited by selective reporting of outcomesin the studies reviewed. Recent empiric data have shown thatstatistically significant outcomes are more likely to be reportedthan nonsignificant outcomes (33). It is worth noting that amongthe 3 studies that described the effects of n�3 fatty acids onsteroid use, steroid use was not described as a primary outcome
TABLE 7Reported effects of n�3 fatty acids on immunosuppressive drug requirement in ulcerative colitis
Reference and year Immunosuppressive drugs Findings
Almallah et al (19), 1998 Prednisolone enemas, systemiccorticosteroids
Among patients in the fish oil group, 2 (22%) requiredprednisolone enemas; none required systemiccorticosteroids. Among patients in the sunflower oilgroup, 4 (44%) required prednisolone enemas; 3(33%) required systemic corticosteroids.1
Hawthorne et al (17), 1992, and Hawthorneet al (18), 1990
Prednisolone Median prednisolone dose decreased from 10 mg/d atbaseline to 5 mg/d at 1 mo to 0 mg/d at 2 mo for then�3 group; dose decreased from 10 mg/d atbaseline at 8 mg/d at 1 mo to 5 mg/d at 2 mo forolive oil group (P � 0.01 for between-groupcomparisons at 1 and at 2 mo).
Stenson et al (28), 1992 Prednisone Mean prednisone dose decreased by 6.8 mg/d duringtreatment with fish oil and increased by 2.25 mg/dduring treatment with placebo (P � 0.2 for changeswithin each group). Among individual patients, themean prednisone dose was reduced duringtreatment with fish oil for 5 (71%), discontinued for2 (29%), and increased for 1 (14%); duringtreatment with placebo, it was reduced for 1 (14%),discontinued for none, and increased for 3 (43%).
1 Three patients who required systemic corticosteroids also required prednisolone enemas.
618 MACLEAN ET AL
in any. It is not known whether secondary analyses of steroid usethat identified only insignificant results were not reported.
The conclusions that can be drawn from the present review arelimited by the paucity of literature that we identified that de-scribed the effects of n�3 fatty acids on IBD. Because our searchmethods were comprehensive, this apparent lack of publishedliterature likely represents an actual paucity of research on thistopic.
On the basis of a comprehensive literature review, the avail-able data are insufficient to draw conclusions about the effects ofn�3 fatty acids on clinical, endoscopic, or histologic scores orinduced remission or relapse rates. However, the data that pertainto the effects of n�3 fatty acids on steroid requirements suggestthat n�3 fatty acids may reduce the need for or effective dose ofcorticosteroids among patients with IBD. Future studies shouldassess the effects of n�3 fatty acids on clinical outcomes in IBD,including requirements for corticosteroids.
We thank Paul Shekelle for his review of the manuscript and Shana Trainafor her help in preparing the manuscript.
CHM was the principal investigator, conceived the study design, super-vised data collection and abstraction, and drafted the manuscript. WAMprovided critical input for the design of this study and reviewed and ab-stracted articles. SJN provided critical input on interpretation of data and thewriting of the manuscript. JP provided critical input for the design of thisstudy and reviewed and abstracted articles. RHG oversaw the collection ofdata. WT abstracted study data. LGH produced and maintained the study datafiles. IMG provided critical input on the interpretation of studies and the earlyversions of the manuscript. SR helped to collect and track data. PK providedcritical input on the design of this study, reviewed and abstracted articles.SCM provided critical input on the design of this study and interpretation ofdata. All authors took part in the discussion of the results and approved thefinal version of the manuscript. None of the authors had any conflicts ofinterest.
REFERENCES1. Jones PJH, Papamandjaris AA. Lipids: cellular metabolism. In: Bow-
man BA, Russell RM, eds. Chapter 10. Present knowledge in nutrition.Washington, DC: ILSI Press, 2001:111.
2. James MJ, Gibson RA, Cleland LG. Dietary polyunsaturated fattyacids and inflammatory mediator production. Am J Clin Nutr 2000;71:343S– 8S.
3. Simopoulos AP. The importance of the ratio of omega-6/omega-3 es-sential fatty acids. Biomed Pharmacother 2002;56:365–79.
4. Loftus EV Jr. Clinical epidemiology of inflammatory bowel disease:incidence, prevalence, and environmental influences. Gastroenterology2004;126:1504–17.
5. Whelan G. Epidemiology of inflam bowel diseases. Med Clin North Am1990;74:1–12.
6. Casati J, Toner BB. Psychosocial aspects of inflammatory bowel dis-ease. Biomed Pharmacother 2000;54:388–93.
7. Andres PG, Friedman LS. Epidemiology and the natural course ofinflammatory bowel disease. Gastroenterol Clin North Am 1999;28:255– 81.
8. Kromann N, Green A. Epidemiological studies in the Upernavik district,Greenland. Incidence of some chronic diseases 1950–1974. Acta MedScand 1980;208:401–6.
9. Shoda R, Matsueda K, Yamato S, Umeda N, Shanahan F. Epidemiologicanalysis of Crohn disease in Japan: increased dietary intake of n�6polyunsaturated fatty acids and animal protein relates to the increasedincidence of Crohn disease in Japan. Am J Clin Nutr 1996;63:741–5.
10. Kuroki F, Iida M, Matsumoto T, Aoyagi K, Kanamoto K, Fujishima M.Serum n�3 polyunsaturated fatty acids are depleted in Crohn’s disease.Dig Dis Sci 1997;42:1137–41.
11. Holman RT. Control of polyunsaturated fatty acids in tissue lipids. J AmCol Nutr 1986;5:183–211.
12. Siguel EN, Lerman RH. Prevalence of essential fatty acid deficiency inpatients with chronic gastrointestinal disorders. Metab Clin Exp 1996;45:12–23.
13. Teitelbaum JE, Walker WA. Review: the role of omega 3 fatty acids inintestinal inflammation. J Nutr Biochem 2001;12:21–32.
14. Moher D, Pham B, Jones A, et al. Does quality of reports of randomisedtrials affect estimates of intervention efficacy reported in meta-analyses?Lancet 1998;352:609–13.
15. Schulz KF, Chalmers I, Hayes RJ, et al. Dimensions of methodologicalquality associated with estimates of treatment effects in controlled trials.JAMA 1995;273:408–41.
16. Jadad A, Moore A, Carrol D, et al. Assessing the quality of reports ofrandomized clinical trials: is blinding necessary? Control Clin Trials1996;17:1–12.
17. Hawthorne AB, Daneshmend TK, Hawkey CJ, et al. Treatment of ul-cerative colitis with fish oil supplementation: a prospective 12 monthrandomised controlled trial. Gut 1992;33:922–8.
18. Hawthorne AB, Daneshmend TK, Hawkey CJ, et al. Fish oil in ulcerativecolitis: final results of a controlled clinical trial. Gastroenterology 1990;98:A174(abstr).
19. Almallah YZ, Richardson S, O’Hanrahan T, et al. Distal procto-colitis,natural cytotoxicity, and essential fatty acids. Am J Gastroenterol 1998;93:804–9.
20. Aslan A, Triadafilopoulos G. Fish oil fatty acid supplementation inactive ulcerative colitis: a double-blind, placebo-controlled, crossoverstudy. Am J Gastroenterol 1992;87:432–7.
21. Belluzzi A, Brignola C, Campieri M, Pera A, Boschi S, Miglioli M.Effect of an enteric-coated fish-oil preparation on relapses in Crohn’sdisease. N Engl J Med 1996;334:1557–60.
22. Greenfield SM, Green AT, Teare JP, et al. A randomized controlledstudy of evening primrose oil and fish oil in ulcerative colitis. AlimentPharmacol Ther 1993;7:159–66.
23. Loeschke K, Ueberschaer B, Pietsch A, et al. N-3 fatty acids only delayearly relapse of ulcerative colitis in remission. Dig Dis Sci 1996;41:2087–94.
24. Lorenz R, Weber PC, Szimnau P, Heldwein W, Strasser T, Loeschke K.Supplementation with n-3 fatty acids from fish oil in chronic inflamma-tory bowel disease–a randomized, placebo-controlled, double-blindcross-over trial. J Intern Med Suppl 1989;225:225–32.
25. Lorenz-Meyer H, Bauer P, Nicolay C, et al. Omega-3 fatty acids and lowcarbohydrate diet for maintenance of remission in Crohn’s disease. Arandomized controlled multicenter trial. Study Group Members (Ger-man Crohn’s Disease Study Group). Scand J Gastroenterol 1996;31:778–85.
26. Mantzaris GJ, Archavlis E, Zografos C, Petraki K, Spiliades C, Tri-antafyllou G. A prospective, randomized, placebo-controlled study offish oil in ulcerative colitis. Hellen J Gastroenterol 1996;9:138–41.
27. Middleton SJ, Naylor S, Woolner J, Hunter JO. A double-blind, ran-domized, placebo-controlled trial of essential fatty acid supplementationin the maintenance of remission of ulcerative colitis. Aliment PharmacolTher 2002;16:1131–5.
28. Stenson WF, Cort D, Rodgers J, et al. Dietary supplementation with fishoil in ulcerative colitis. Ann Intern Med 1992;116:609–14.
29. Varghese TJ, Coomansingh D. Clinical response of ulcerative colitiswith dietary omega-3 fatty acids: a double-blind randomized study. Br JSurg 2000;87(suppl):73(abstr).
30. Gomes P, Du Boulay C, Smith CL, Holdstock G. Relationship betweendisease activity indices and colonoscopic findings in patients with co-lonic inflammatory bowel disease. Gut 1986;27:92–5.
31. Sutherland LR, Martin F, Greer S, et al. 5-Amniosalicylic acid enema inthe treatment of distal ulcerative colitis, proctosigmoiditis, and proctitis.Gastroenterology 1987;92:1894–8.
32. Best WR, Becktel JM, Singleton JW, Kern F. Development of a Crohn’sdisease activity index. Gastroenterology 1976;70:439–44.
33. Chan AW, Hrobjartsson A, Haahr MT, Gotzsche PC, Altman DG.Empirical evidence for selective reporting of outcomes in random-ized trials: comparison of protocols to published articles. JAMA2004;291:2457– 65.
n�3 FATTY ACIDS AND INFLAMMATORY BOWEL DISEASE 619
Soy protein containing isoflavones does not decrease colorectalepithelial cell proliferation in a randomized controlled trial1–3
Kenneth F Adams, Paul D Lampe, Katherine M Newton, J Thomas Ylvisaker, Andrew Feld, David Myerson,Scott S Emerson, Emily White, John D Potter, and Johanna W Lampe
ABSTRACTBackground: Soy isoflavones have numerous biological propertiesthat suggest that they may protect against colorectal cancer. Colo-rectal epithelial cell proliferation has been used extensively as anintermediate endpoint biomarker for colorectal neoplasia.Objective: We tested the hypothesis that supplementation with soyprotein containing isoflavones decreases colorectal epithelial cellproliferation.Design: A 12-mo randomized intervention was conducted in menand women aged 50–80 y with recently diagnosed adenomatouspolyps. One hundred fifty participants were enrolled and randomlyassigned to an active treatment group (58 g protein powder/d con-taining 83 mg isoflavones/d; �ISO) or a control group (ethanol-extracted soy-protein powder containing 3 mg isoflavones; –ISO).Biopsy specimens from the cecum, sigmoid colon, and rectum werecollected at baseline and at the 12-mo follow-up. Ki-67 antibodyimmunohistostaining was used to detect cell proliferation. One hun-dred twenty-five participants completed the study, and proliferationwas measured in the first 91 who completed the study.Results: In the sigmoid colon, cell proliferation increased by 0.9(95% CI: 0.09, 1.9) labeled nuclei per crypt more (11%) in the �ISOgroup than in the –ISO group over the 12-mo intervention, whichwas opposite the direction predicted. The number of labeled nucleiper 100 �m crypt height also increased more in the �ISO than in the–ISO group. In the cecum and sigmoid colon, but not in the rectum,the proliferation count increased as the serum genistein concentra-tion increased. Proliferation distribution and crypt height were notchanged by treatment at any site.Conclusions: Supplementation with soy protein containing isofla-vones does not reduce colorectal epithelial cell proliferation or theaverage height of proliferating cells in the cecum, sigmoid colon, andrectum and increases cell proliferation measures in the sigmoidcolon. Am J Clin Nutr 2005;82:620–6.
KEY WORDS Soy isoflavone, genestein, randomized con-trolled trial, colon, epithelial cell proliferation, Ki-67 antibody
INTRODUCTION
Dietary intake of soy is substantially higher and the incidenceof colorectal cancer, with the recent exception of Japan, is muchlower (1) in Asia than in the United States (2). Soy contains manybiologically active compounds, including isoflavones, and it hasbeen proposed that a high intake of these soy phytochemicalscontributes in part to the lower incidence of colorectal cancer in
Asia (3). In men and postmenopausal women, who have lowendogenous estrogen concentrations, isoflavones are hypothe-sized to have estrogenic effects (4). Given that exogenous estro-gen use has been associated with a decreased risk of colon cancer(5, 6), isoflavones may similarly influence colon cancer riskthrough their estrogenic action. Soy isoflavones have severalanticarcinogenic properties in vitro (7) and genistein, one of thepredominant isoflavones in soy, inhibits proliferation of culturedcells, including normal and transformed intestinal epithelial cells(8). However, epidemiologic (7, 9–11) and animal studies (7, 12) ofeffects of soy or isoflavones on colon cancer or its precursors haveyielded mixed results. One human intervention trial providingeither a soy or casein supplement for 12 mo reported reductionsin colon epithelial cell proliferation in the soy group (13).
Colorectal epithelial cell proliferation has been used as anintermediate endpoint in several dietary intervention studies(14). It is controversial whether proliferation in itself is sufficientto cause colorectal cancer (15); however, for stem cells alreadyhaving a colon cancer–related mutation, an increased rate of celldivision results in a larger accumulation of mutations over time,which increases the likelihood of other colon cancer–relatedmutations occurring (16–18). Studies in humans show increasedcell proliferation in the normal mucosa of patients with adenomasor colorectal cancer and increased proliferation in persons atgreater risk of colorectal cancer because of age, family history,previous polyps, or genetic predispositions (reviewed in 19),although many of the findings have been inconsistent (14, 20,21). Recently, Ki-67 antibody immunohistostaining has becomeavailable for labeling proliferation in preserved tissues. Ki-67 isan endogenous nuclear protein associated with the cell cycle. TheKi-67 antibody identifies cells in the cycling phases but not in theresting phase (G0) or early phase (G1) (22, 23). Ki-67 labeling is
1 From the Fred Hutchinson Cancer Research Center, Seattle, WA (KFA,PDL, DM, EW, JDP, and JWL); the University of Washington (KFA, PDL,DM, SSE, EW, JDP, and JWL), Seattle, WA; the Center for Health Studies,Group Health Cooperative, Seattle, WA (KMN); and the Gastroenterology,Group Health Cooperative, Seattle, WA (JTY and AF).
2 Supported by NIH grants U01 CA72035, R03 CA92772, and T32ES07262 (to KFA) and FHCRC Core grant CA15704.
3 Reprints not available. Address correspondence to JW Lampe, FredHutchinson Cancer Research Center, 1100 Fairview Avenue North, MP-900,Seattle, WA. E-mail: [email protected].
Received March 21, 2005.Accepted for publication April 28, 2005.
620 Am J Clin Nutr 2005;82:620–6. Printed in USA. © 2005 American Society for Clinical Nutrition
considered to have several advantages over other commonlyused assays for proliferation (24).
Our objective was to evaluate whether isoflavones in soy pro-tein modulate colorectal epithelial cell proliferation, measuredby Ki-67. We hypothesized that a 12-mo dietary interventionproviding 83 mg isoflavones/d in a soy-protein matrix wouldreduce cell proliferation measures in the cecum, sigmoid colon,and rectum.
SUBJECTS AND METHODS
Study design
The study design was described previously (25). The SoyIsoflavone Prevention Study was a 12-month randomized,double-blinded, placebo-controlled dietary intervention evalu-ating the effects of soy isoflavones on colonic epithelial cellproliferation and other potential markers of colon cancer risk.Participants were recruited among patients who were undergoingcolonoscopy at 2 gastroenterology clinics at Group Health Co-operative (GHC) a large managed-care organization. Recruit-ment began January 1998 and was completed March 2001. Menand women were eligible if they were between the ages of 50 to80 y and had adenomatous colorectal polyps found on colonos-copy. Persons with previous adenomas were eligible. Exclusionsincluded recent hormone use (testosterone in men, estrogen inwomen), certain medical conditions (medical history of chronicbleeding disorders, liver or digestive diseases, cancer, laxative orenema dependence, familial polyposis, alcohol or drug depen-dence, cancer, inflammatory bowel disease, and ulcerative coli-tis), and soy intake � 4 servings/wk. Initially, participants wereexcluded if they used non-steroidal antiinflammatory drugs(NSAIDs) regularly, but this exclusion was lifted after the firstyear to increase enrollment. Similarly, the restriction on hormonetherapy was revised to allow women to participate who had notused hormone therapy in the past 6 mo. The study activities wereapproved by the Institutional Review Boards of the FredHutchinson Cancer Research Center, Seattle, WA and GHC,Seattle, WA, and informed, written consent was obtained fromall study participants.
Subjects
Participants were recruited in a two-phase process. In the firstphase, a GHC survey team screened patients scheduled forcolonoscopy at 2 GHC gastroenterology clinics and requestedinterviews at the clinic with age-eligible patients. Age-eligiblehealth plan enrollees scheduled for colonoscopy were contactedby telephone, and permission was requested to discuss the studywith the patient at the clinic before the procedure. Of 4085 pa-tients screened, 1513 were eligible based on screening criteria(eg, hormone use, diseases or GI surgeries, NSAID use beforecriteria change), and 749 consented to have biopsies collected inthe event that polyps were found during colonoscopy. The studystaff of the Soy Isoflavone Prevention Study attended 648colonoscopies. GHC pathologists analyzed polyp histology.Two hundred twenty-eight patients were eligible for the dietaryintervention on the basis of having adenomatous polyps and nothaving cancer or other gastrointestinal conditions. Of this group,150 consented to the dietary intervention. A 1-wk run-in wasconducted with the use of an ethanol-extracted soy-protein drinkthat was low in isoflavones. All patients successfully completed
the run-in by consuming �80% of the soy-protein packets andtolerating the soy.
One hundred fifty participants were randomly allocated to 1 of2 treatment groups and stratified by sex and clinic. From January1998 onward, participants were also randomly allocated accord-ing to NSAID use. One group was provided 58 g/d of soy-drinkpowder (2 packets/d, 29 g/packet; The Solae Co, formerly Du-pont Protein Technologies, St Louis, MO) to consume for 12 mo(�ISO group). A daily serving of soy-drink powder contained�40 g protein, 200 kcal energy, and 1400 mg Ca and provided45.6 mg genistein, 31.7 mg daidzein, and 5.5 mg glycitein (ag-lycone units). The other group was provided an ethanol extract ofthe �ISO powder that provided only small quantities (3 mg totalisoflavones; 4% of the isoflavones provided by the �ISO pow-der) of these isoflavones (�ISO group). The participants weregiven extensive instruction on how to incorporate the soy drinkinto their typical diet. Participants who returned �20% of thepackets over the 12-mo intervention were considered to be com-pliant. The participants, investigators, and staff were blinded tothe participants’ isoflavone treatment.
Ki-67 labeling of colonic epithelial cell proliferation
Colonic epithelial cell biopsy specimens were collected dur-ing the initial colonoscopy, before potential participants wereenrolled in the dietary intervention, and at the end of the 12-mointervention. Before the colonoscopy was performed, 136 par-ticipants received a standard preparation of Fleet Phospho-Soda(CB Fleet Co, Inc, Lynchburg, VA), whereas 14 received Colyte(Scharz Pharma, Milwaukee, WI). The participants received thesame bowel preparation during the follow-up procedure as theyreceived during the initial colonoscopy. During the colonoscopy,1-mm thick biopsy specimens were collected by physicianstrained in the procedure. Fifteen biopsy specimens were col-lected from each participant with the use of jumbo biopsy forceps(Olympus FB-50U1-1; Olympus America Inc, Melville, NY).Nine specimens were processed for the analysis of proliferation;3 each from the cecum, the sigmoid colon (10–25 cm from thelevel of the external anal aperture), and the rectum (up to 10 cmfrom the level of the external anal aperture).
The biopsy specimens were oriented and placed in 10% neutralbuffered formalin for 2–3 h and then transferred to 70% ethanol.Eight to 12 sections, �50 microns apart, were cut from eachspecimen and mounted with positive control (human tonsil) andnegative control (colon biopsy tissue from the same participantwith all reagents except primary antibody) tissues. Sections weredeparaffinized with the use of xylene, ethanol, and water. Allslides from a single participant (baseline and follow-up, for all 3sites) were stained in the same run to minimize the effect ofrun-to-run variability in staining intensity inherent in the proce-dure. Slides were placed in either boiling Antigen RetrievalBuffer (DAKO Corp, Carpenteria, CA) or in boiling citratebuffer (10 mmol/L; pH 6.0) and steamed for 30 min. After beingcooled for 20 min, the slides were stained on a Techmate 1000Staining System automatic immunostainer (Ventana MedicalSystems Inc, Tucson, AZ) with the use of detection reagents fromthe Vectastain Elite Standard ABC Kit (Vector Laboratories, Inc,Burlingame, CA). Slides were blocked for 5 min with 4% normalhorse serum in phosphate-buffered saline (PBS) with Tween-20and then buffer-washed. The biopsy specimens were stained withthe Ki-67 (MIB-1) monoclonal antibody (Immunotech Inc, Mi-ami, FL) at a 1:500 dilution for 1 h in PBS plus 1% bovine serum
SOY ISOFLAVONES AND COLORECTAL PROLIFERATION 621
albumin (BSA) and Tween-20 and then buffer-washed. Theywere immersed in the secondary antibody, biotinylated rabbitanti-mouse immunoglobulin G (Jackson ImmunoResearch,West Grove, PA), at a dilution of 1:2000 or biotinylated horseanti-mouse immunoglobulin G (Vector Laboratories Inc) at adilution of 1:200 for 30 min in PBS with 1% BSA with Tween-20and then buffer-washed. Endogenous peroxidases were inacti-vated by treatment with hydrogen peroxide for 5 min. Slides werethen washed and immersed in Avidin-Biotin Complex reagentfor 30 min. After being washed, the slides were developed byusing diaminobenzidine tetrahydrochloride solution at a concen-tration of 0.5 mg/mL in PBS with 0.01% hydrogen peroxide. Thestained slides were then dehydrated, and cover slips were applied.
The biopsy specimens were scanned under a Nikon E400microscope (Nikon Inc, Melville, NY) with a 4� objective toidentify acceptable colon crypts. Acceptable crypts were definedas being midaxial, with U-shaped sections extending from themuscularis to the lumen with an intact structure. Images of thecrypts were captured by using a digital camera (HamamatsuPhotonics KK, Hamamatsu City, Japan) attached to the micro-scope with 20� objective and set at constant illumination andexposure settings. Nuclei were counted if they were positionedon the edge of the crypt cell columns and fully darkened. Partiallydarkened nuclei were not counted to exclude nuclei lying belowthe plane of the cell column. Macros developed for the NIHImage software program (available on the Internet: http://rsb.info.nih.gov/nih-image) allowed us to collect and analyzeimages. Biopsy tissue was stained generally in the order thatfollow-up biopsy specimens were collected from the partici-pants, and the slides were scored generally in the order that theybecame available. We aimed to capture �3 crypts for each com-bination of person, time, and site. A sequential sampling plan wasused that could potentially allow scoring fewer than the totalnumber of samples if the results allowed hypotheses to be ad-dressed conclusively.
Five outcome variables were defined, including 2 measures ofproliferation count, 2 measures of proliferation distribution, andcrypt height. Cell proliferation count (number of proliferatingcells per crypt) was measured in absolute and relative scales asthe number of labeled (stained) nuclei per crypt and as the num-ber of labeled nuclei per 100 �m crypt height. The distribution oflabeled nuclei (height of proliferating cells within a crypt) wasmeasured in absolute and relative (proportional) scales as theaverage height of a labeled nucleus in the crypt and the averageheight of a labeled nucleus divided by the height of the crypt.Crypt height, the distance from base to lumen, was also analyzedas an outcome variable.
Serum isoflavones
We measured serum genistein concentrations in fasting morn-ing blood samples collected at baseline and at 4, 8, and 12 mowith the use of a gas chromatography–mass spectrometrymethod that was described previously (25). Most of the sampleswere collected between 0700 and 1200.
Statistical analysis
Measurements for each crypt were averaged to obtain singlevalues at the level of participant, site, and time. The statisticalanalysis involved a comparison of mean changes in Ki-67 countand mean height between the �ISO and –ISO groups after a
12-mo intervention with the use of a linear regression model withrobust SE estimates to account for unequal variances (Stata 8.0;Stata Corp, College Park, TX). After proliferation was measuredin the first 91 participants for whom biopsy specimens wereavailable, the data were analyzed and a level 0.025 one-sidedsymmetric stopping rule with O’Brien-Fleming boundaries (26)was applied to assess whether additional biopsy specimens wereneeded to be scored. During this analysis it was determined thatthe data were sufficiently precise to be highly confident in thedecision to stop scoring. For the primary analysis we adjustedtreatment-effect means, CIs, and P values by using group se-quential methods (27) to account for the fact that we stoppedstaining and scoring biopsy specimens after performing such forthe first 91 participants with available biopsy specimens(S�SeqTrial; Insightful Corp, Seattle, WA). We used a one-sided � of 0.025 to test the null hypothesis that the interventiondid not reduce proliferation. A one-sided test was used becauseour intention was to stop staining and scoring crypts if we did notfind a reduction in proliferation. The primary analysis was byintention-to-treat, based on comparisons between groups as de-fined at randomization. We adjusted for baseline values of theresponse variable. We did not adjust � for multiple comparisons.In secondary analyses, which are exploratory, we did not usegroup sequential methods because the results had no potential toaffect our decision of whether to stain and score the remainingbiopsy samples. We used 2-sided tests (overall � of 0.05) becausewe were interested in exploring changes in proliferation in eitherdirection.
RESULTS
We conducted an analysis using measurements obtained fromthe first 91 participants from whom biopsy specimens were avail-able. Of 150 participants who were randomly assigned to treat-ment and began the study, 125 completed the dietary interventionand underwent the follow-up colonoscopy. Because women whoreceived hormone therapy were excluded (�60% of the womenscreened), the study population was mostly men (Table 1). Al-though randomization was blocked on treatment allocation, sex,clinic, and NSAID use in this interim analysis, the 2 groups weresomewhat unbalanced in terms of treatment allocation, sex, andthe proportion of NSAID users. By chance, the 91 participants weanalyzed included fewer participants from the �ISO group thanfrom the –ISO group (40 compared with 51). The �ISO groupcontained more women (20.0% compared with 5.9%) and fewerNSAID users (30.0% compared with 39.2%). The proportion ofparticipants who consumed any soy outside the study at baselinewas also lower in the �ISO group (7.5% compared with 21.6%).On the basis of packet counts, our primary measure of compli-ance, 31 (77.5%) of the 40 �ISO participants and 44 (86.3%) ofthe 51 –ISO group participants (P � 0.3) were compliant over the12-mo intervention. Participants who adhered to the study tendedto be highly compliant, and consumed �94% of their soy over theentire 12 mo. However, the proportion of participants who werecompliant decreased as the study progressed: from 88.5% in the�ISO group in the first 4 mo to 72.5% from 5 to 12 mo.
Serum genistein concentration, a secondary measure of com-pliance, was similar in the �ISO and –ISO groups at baseline andincreased substantially in the �ISO group at 4, 8, and 12 mo(Figure 1), whereas genistein concentration in the –ISO group
622 ADAMS ET AL
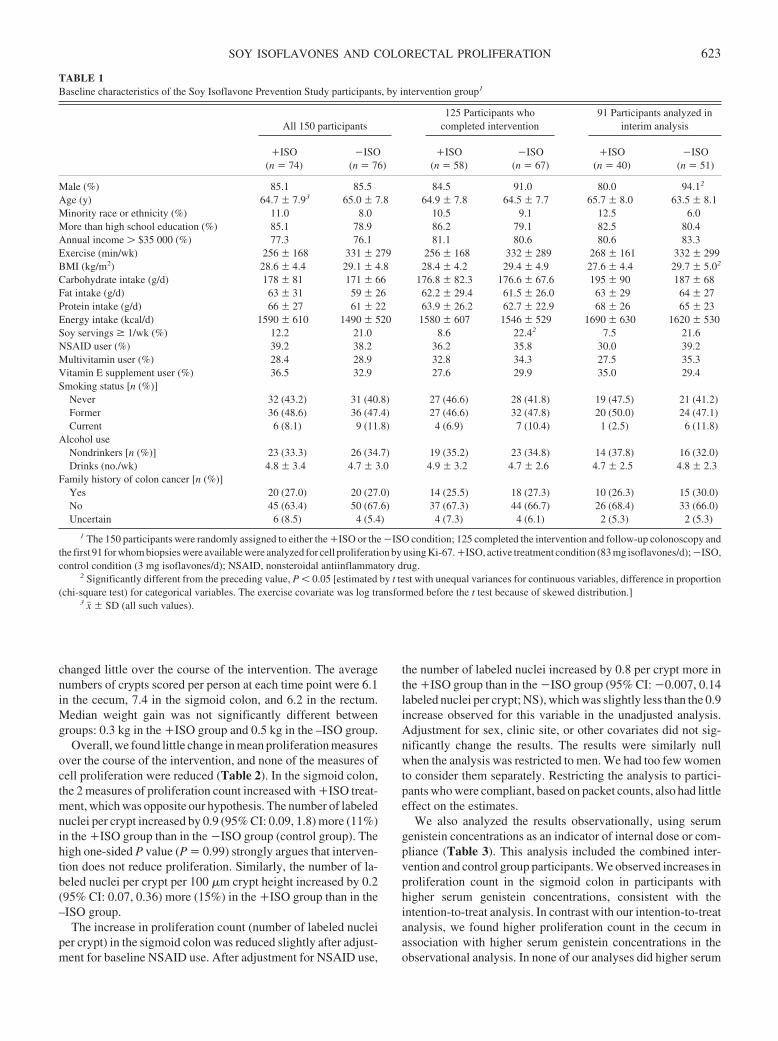
changed little over the course of the intervention. The averagenumbers of crypts scored per person at each time point were 6.1in the cecum, 7.4 in the sigmoid colon, and 6.2 in the rectum.Median weight gain was not significantly different betweengroups: 0.3 kg in the �ISO group and 0.5 kg in the –ISO group.
Overall, we found little change in mean proliferation measuresover the course of the intervention, and none of the measures ofcell proliferation were reduced (Table 2). In the sigmoid colon,the 2 measures of proliferation count increased with �ISO treat-ment, which was opposite our hypothesis. The number of labelednuclei per crypt increased by 0.9 (95% CI: 0.09, 1.8) more (11%)in the �ISO group than in the �ISO group (control group). Thehigh one-sided P value (P � 0.99) strongly argues that interven-tion does not reduce proliferation. Similarly, the number of la-beled nuclei per crypt per 100 �m crypt height increased by 0.2(95% CI: 0.07, 0.36) more (15%) in the �ISO group than in the–ISO group.
The increase in proliferation count (number of labeled nucleiper crypt) in the sigmoid colon was reduced slightly after adjust-ment for baseline NSAID use. After adjustment for NSAID use,
the number of labeled nuclei increased by 0.8 per crypt more inthe �ISO group than in the �ISO group (95% CI: �0.007, 0.14labeled nuclei per crypt; NS), which was slightly less than the 0.9increase observed for this variable in the unadjusted analysis.Adjustment for sex, clinic site, or other covariates did not sig-nificantly change the results. The results were similarly nullwhen the analysis was restricted to men. We had too few womento consider them separately. Restricting the analysis to partici-pants who were compliant, based on packet counts, also had littleeffect on the estimates.
We also analyzed the results observationally, using serumgenistein concentrations as an indicator of internal dose or com-pliance (Table 3). This analysis included the combined inter-vention and control group participants. We observed increases inproliferation count in the sigmoid colon in participants withhigher serum genistein concentrations, consistent with theintention-to-treat analysis. In contrast with our intention-to-treatanalysis, we found higher proliferation count in the cecum inassociation with higher serum genistein concentrations in theobservational analysis. In none of our analyses did higher serum
TABLE 1Baseline characteristics of the Soy Isoflavone Prevention Study participants, by intervention group1
All 150 participants125 Participants who
completed intervention91 Participants analyzed in
interim analysis
�ISO(n � 74)
�ISO(n � 76)
�ISO(n � 58)
�ISO(n � 67)
�ISO(n � 40)
�ISO(n � 51)
Male (%) 85.1 85.5 84.5 91.0 80.0 94.12
Age (y) 64.7 � 7.93 65.0 � 7.8 64.9 � 7.8 64.5 � 7.7 65.7 � 8.0 63.5 � 8.1Minority race or ethnicity (%) 11.0 8.0 10.5 9.1 12.5 6.0More than high school education (%) 85.1 78.9 86.2 79.1 82.5 80.4Annual income $35 000 (%) 77.3 76.1 81.1 80.6 80.6 83.3Exercise (min/wk) 256 � 168 331 � 279 256 � 168 332 � 289 268 � 161 332 � 299BMI (kg/m2) 28.6 � 4.4 29.1 � 4.8 28.4 � 4.2 29.4 � 4.9 27.6 � 4.4 29.7 � 5.02
Carbohydrate intake (g/d) 178 � 81 171 � 66 176.8 � 82.3 176.6 � 67.6 195 � 90 187 � 68Fat intake (g/d) 63 � 31 59 � 26 62.2 � 29.4 61.5 � 26.0 63 � 29 64 � 27Protein intake (g/d) 66 � 27 61 � 22 63.9 � 26.2 62.7 � 22.9 68 � 26 65 � 23Energy intake (kcal/d) 1590 � 610 1490 � 520 1580 � 607 1546 � 529 1690 � 630 1620 � 530Soy servings � 1/wk (%) 12.2 21.0 8.6 22.42 7.5 21.6NSAID user (%) 39.2 38.2 36.2 35.8 30.0 39.2Multivitamin user (%) 28.4 28.9 32.8 34.3 27.5 35.3Vitamin E supplement user (%) 36.5 32.9 27.6 29.9 35.0 29.4Smoking status [n (%)]
Never 32 (43.2) 31 (40.8) 27 (46.6) 28 (41.8) 19 (47.5) 21 (41.2)Former 36 (48.6) 36 (47.4) 27 (46.6) 32 (47.8) 20 (50.0) 24 (47.1)Current 6 (8.1) 9 (11.8) 4 (6.9) 7 (10.4) 1 (2.5) 6 (11.8)
Alcohol useNondrinkers [n (%)] 23 (33.3) 26 (34.7) 19 (35.2) 23 (34.8) 14 (37.8) 16 (32.0)Drinks (no./wk) 4.8 � 3.4 4.7 � 3.0 4.9 � 3.2 4.7 � 2.6 4.7 � 2.5 4.8 � 2.3
Family history of colon cancer [n (%)]Yes 20 (27.0) 20 (27.0) 14 (25.5) 18 (27.3) 10 (26.3) 15 (30.0)No 45 (63.4) 50 (67.6) 37 (67.3) 44 (66.7) 26 (68.4) 33 (66.0)Uncertain 6 (8.5) 4 (5.4) 4 (7.3) 4 (6.1) 2 (5.3) 2 (5.3)
1 The 150 participants were randomly assigned to either the �ISO or the �ISO condition; 125 completed the intervention and follow-up colonoscopy andthe first 91 for whom biopsies were available were analyzed for cell proliferation by using Ki-67. �ISO, active treatment condition (83 mg isoflavones/d); �ISO,control condition (3 mg isoflavones/d); NSAID, nonsteroidal antiinflammatory drug.
2 Significantly different from the preceding value, P � 0.05 [estimated by t test with unequal variances for continuous variables, difference in proportion(chi-square test) for categorical variables. The exercise covariate was log transformed before the t test because of skewed distribution.]
3 x� � SD (all such values).
SOY ISOFLAVONES AND COLORECTAL PROLIFERATION 623
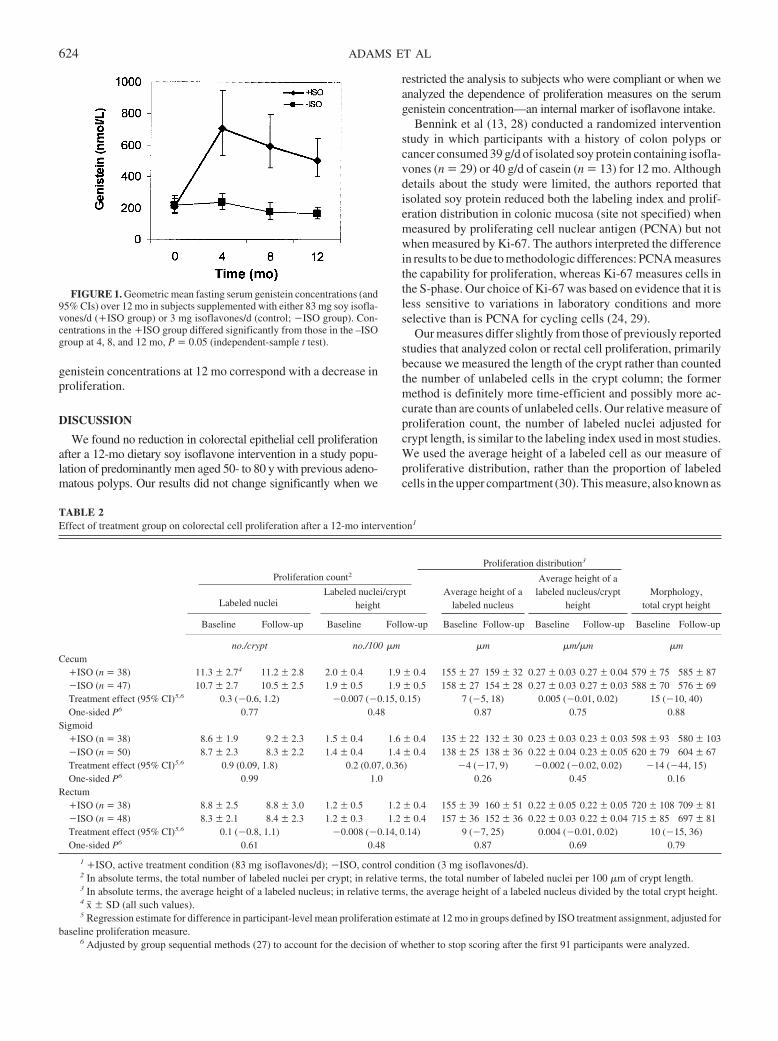
genistein concentrations at 12 mo correspond with a decrease inproliferation.
DISCUSSION
We found no reduction in colorectal epithelial cell proliferationafter a 12-mo dietary soy isoflavone intervention in a study popu-lation of predominantly men aged 50- to 80 y with previous adeno-matous polyps. Our results did not change significantly when we
restricted the analysis to subjects who were compliant or when weanalyzed the dependence of proliferation measures on the serumgenistein concentration—an internal marker of isoflavone intake.
Bennink et al (13, 28) conducted a randomized interventionstudy in which participants with a history of colon polyps orcancer consumed 39 g/d of isolated soy protein containing isofla-vones (n � 29) or 40 g/d of casein (n � 13) for 12 mo. Althoughdetails about the study were limited, the authors reported thatisolated soy protein reduced both the labeling index and prolif-eration distribution in colonic mucosa (site not specified) whenmeasured by proliferating cell nuclear antigen (PCNA) but notwhen measured by Ki-67. The authors interpreted the differencein results to be due to methodologic differences: PCNA measuresthe capability for proliferation, whereas Ki-67 measures cells inthe S-phase. Our choice of Ki-67 was based on evidence that it isless sensitive to variations in laboratory conditions and moreselective than is PCNA for cycling cells (24, 29).
Our measures differ slightly from those of previously reportedstudies that analyzed colon or rectal cell proliferation, primarilybecause we measured the length of the crypt rather than countedthe number of unlabeled cells in the crypt column; the formermethod is definitely more time-efficient and possibly more ac-curate than are counts of unlabeled cells. Our relative measure ofproliferation count, the number of labeled nuclei adjusted forcrypt length, is similar to the labeling index used in most studies.We used the average height of a labeled cell as our measure ofproliferative distribution, rather than the proportion of labeledcells in the upper compartment (30). This measure, also known as
FIGURE 1. Geometric mean fasting serum genistein concentrations (and95% CIs) over 12 mo in subjects supplemented with either 83 mg soy isofla-vones/d (�ISO group) or 3 mg isoflavones/d (control; �ISO group). Con-centrations in the �ISO group differed significantly from those in the –ISOgroup at 4, 8, and 12 mo, P � 0.05 (independent-sample t test).
TABLE 2Effect of treatment group on colorectal cell proliferation after a 12-mo intervention1
Proliferation distribution3
Morphology,total crypt height
Proliferation count2
Labeled nucleiLabeled nuclei/crypt
heightAverage height of a
labeled nucleus
Average height of alabeled nucleus/crypt
height
Baseline Follow-up Baseline Follow-up Baseline Follow-up Baseline Follow-up Baseline Follow-up
no./crypt no./100 �m �m �m/�m �mCecum
�ISO (n � 38) 11.3 � 2.74 11.2 � 2.8 2.0 � 0.4 1.9 � 0.4 155 � 27 159 � 32 0.27 � 0.03 0.27 � 0.04 579 � 75 585 � 87�ISO (n � 47) 10.7 � 2.7 10.5 � 2.5 1.9 � 0.5 1.9 � 0.5 158 � 27 154 � 28 0.27 � 0.03 0.27 � 0.03 588 � 70 576 � 69Treatment effect (95% CI)5,6 0.3 (�0.6, 1.2) �0.007 (�0.15, 0.15) 7 (�5, 18) 0.005 (�0.01, 0.02) 15 (�10, 40)One-sided P6 0.77 0.48 0.87 0.75 0.88
Sigmoid�ISO (n � 38) 8.6 � 1.9 9.2 � 2.3 1.5 � 0.4 1.6 � 0.4 135 � 22 132 � 30 0.23 � 0.03 0.23 � 0.03 598 � 93 580 � 103�ISO (n � 50) 8.7 � 2.3 8.3 � 2.2 1.4 � 0.4 1.4 � 0.4 138 � 25 138 � 36 0.22 � 0.04 0.23 � 0.05 620 � 79 604 � 67Treatment effect (95% CI)5,6 0.9 (0.09, 1.8) 0.2 (0.07, 0.36) �4 (�17, 9) �0.002 (�0.02, 0.02) �14 (�44, 15)One-sided P6 0.99 1.0 0.26 0.45 0.16
Rectum�ISO (n � 38) 8.8 � 2.5 8.8 � 3.0 1.2 � 0.5 1.2 � 0.4 155 � 39 160 � 51 0.22 � 0.05 0.22 � 0.05 720 � 108 709 � 81�ISO (n � 48) 8.3 � 2.1 8.4 � 2.3 1.2 � 0.3 1.2 � 0.4 157 � 36 152 � 36 0.22 � 0.03 0.22 � 0.04 715 � 85 697 � 81Treatment effect (95% CI)5,6 0.1 (�0.8, 1.1) �0.008 (�0.14, 0.14) 9 (�7, 25) 0.004 (�0.01, 0.02) 10 (�15, 36)One-sided P6 0.61 0.48 0.87 0.69 0.79
1 �ISO, active treatment condition (83 mg isoflavones/d); �ISO, control condition (3 mg isoflavones/d).2 In absolute terms, the total number of labeled nuclei per crypt; in relative terms, the total number of labeled nuclei per 100 �m of crypt length.3 In absolute terms, the average height of a labeled nucleus; in relative terms, the average height of a labeled nucleus divided by the total crypt height.4 x� � SD (all such values).5 Regression estimate for difference in participant-level mean proliferation estimate at 12 mo in groups defined by ISO treatment assignment, adjusted for
baseline proliferation measure.6 Adjusted by group sequential methods (27) to account for the decision of whether to stop scoring after the first 91 participants were analyzed.
624 ADAMS ET AL
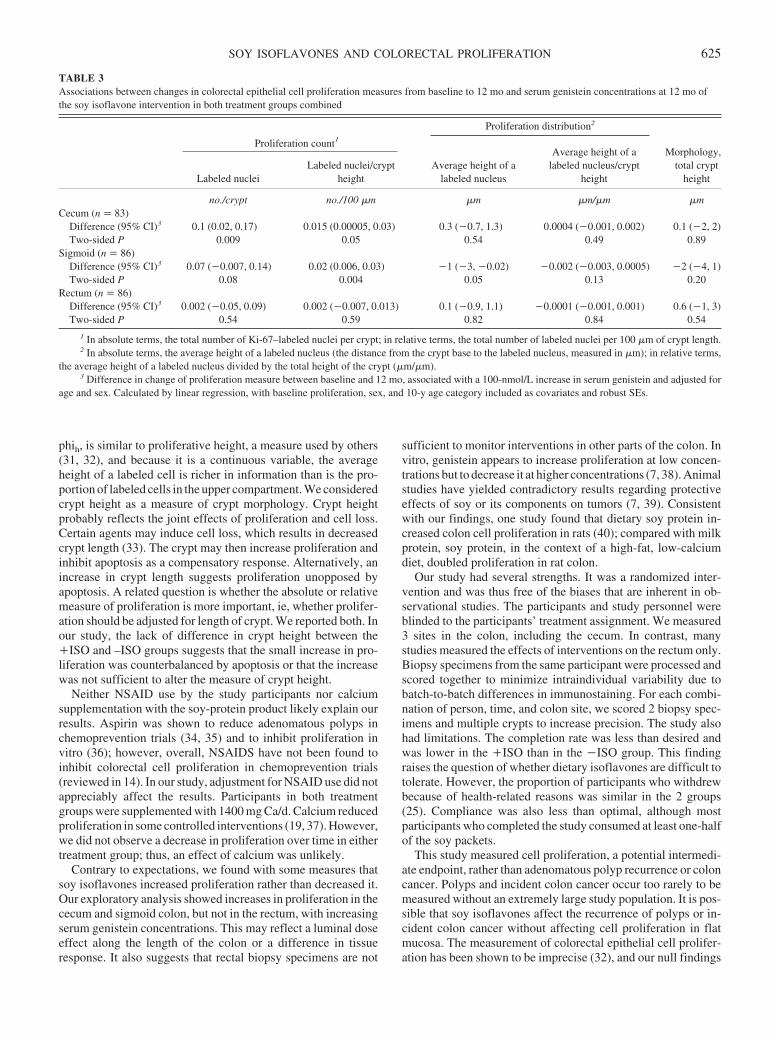
phih, is similar to proliferative height, a measure used by others(31, 32), and because it is a continuous variable, the averageheight of a labeled cell is richer in information than is the pro-portion of labeled cells in the upper compartment. We consideredcrypt height as a measure of crypt morphology. Crypt heightprobably reflects the joint effects of proliferation and cell loss.Certain agents may induce cell loss, which results in decreasedcrypt length (33). The crypt may then increase proliferation andinhibit apoptosis as a compensatory response. Alternatively, anincrease in crypt length suggests proliferation unopposed byapoptosis. A related question is whether the absolute or relativemeasure of proliferation is more important, ie, whether prolifer-ation should be adjusted for length of crypt. We reported both. Inour study, the lack of difference in crypt height between the�ISO and –ISO groups suggests that the small increase in pro-liferation was counterbalanced by apoptosis or that the increasewas not sufficient to alter the measure of crypt height.
Neither NSAID use by the study participants nor calciumsupplementation with the soy-protein product likely explain ourresults. Aspirin was shown to reduce adenomatous polyps inchemoprevention trials (34, 35) and to inhibit proliferation invitro (36); however, overall, NSAIDS have not been found toinhibit colorectal cell proliferation in chemoprevention trials(reviewed in 14). In our study, adjustment for NSAID use did notappreciably affect the results. Participants in both treatmentgroups were supplemented with 1400 mg Ca/d. Calcium reducedproliferation in some controlled interventions (19, 37). However,we did not observe a decrease in proliferation over time in eithertreatment group; thus, an effect of calcium was unlikely.
Contrary to expectations, we found with some measures thatsoy isoflavones increased proliferation rather than decreased it.Our exploratory analysis showed increases in proliferation in thececum and sigmoid colon, but not in the rectum, with increasingserum genistein concentrations. This may reflect a luminal doseeffect along the length of the colon or a difference in tissueresponse. It also suggests that rectal biopsy specimens are not
sufficient to monitor interventions in other parts of the colon. Invitro, genistein appears to increase proliferation at low concen-trations but to decrease it at higher concentrations (7, 38). Animalstudies have yielded contradictory results regarding protectiveeffects of soy or its components on tumors (7, 39). Consistentwith our findings, one study found that dietary soy protein in-creased colon cell proliferation in rats (40); compared with milkprotein, soy protein, in the context of a high-fat, low-calciumdiet, doubled proliferation in rat colon.
Our study had several strengths. It was a randomized inter-vention and was thus free of the biases that are inherent in ob-servational studies. The participants and study personnel wereblinded to the participants’ treatment assignment. We measured3 sites in the colon, including the cecum. In contrast, manystudies measured the effects of interventions on the rectum only.Biopsy specimens from the same participant were processed andscored together to minimize intraindividual variability due tobatch-to-batch differences in immunostaining. For each combi-nation of person, time, and colon site, we scored 2 biopsy spec-imens and multiple crypts to increase precision. The study alsohad limitations. The completion rate was less than desired andwas lower in the �ISO than in the �ISO group. This findingraises the question of whether dietary isoflavones are difficult totolerate. However, the proportion of participants who withdrewbecause of health-related reasons was similar in the 2 groups(25). Compliance was also less than optimal, although mostparticipants who completed the study consumed at least one-halfof the soy packets.
This study measured cell proliferation, a potential intermedi-ate endpoint, rather than adenomatous polyp recurrence or coloncancer. Polyps and incident colon cancer occur too rarely to bemeasured without an extremely large study population. It is pos-sible that soy isoflavones affect the recurrence of polyps or in-cident colon cancer without affecting cell proliferation in flatmucosa. The measurement of colorectal epithelial cell prolifer-ation has been shown to be imprecise (32), and our null findings
TABLE 3Associations between changes in colorectal epithelial cell proliferation measures from baseline to 12 mo and serum genistein concentrations at 12 mo ofthe soy isoflavone intervention in both treatment groups combined
Proliferation count1Proliferation distribution2
Morphology,total crypt
heightLabeled nucleiLabeled nuclei/crypt
heightAverage height of a
labeled nucleus
Average height of alabeled nucleus/crypt
height
no./crypt no./100 �m �m �m/�m �mCecum (n � 83)
Difference (95% CI)3 0.1 (0.02, 0.17) 0.015 (0.00005, 0.03) 0.3 (�0.7, 1.3) 0.0004 (�0.001, 0.002) 0.1 (�2, 2)Two-sided P 0.009 0.05 0.54 0.49 0.89
Sigmoid (n � 86)Difference (95% CI)3 0.07 (�0.007, 0.14) 0.02 (0.006, 0.03) �1 (�3, �0.02) �0.002 (�0.003, 0.0005) �2 (�4, 1)Two-sided P 0.08 0.004 0.05 0.13 0.20
Rectum (n � 86)Difference (95% CI)3 0.002 (�0.05, 0.09) 0.002 (�0.007, 0.013) 0.1 (�0.9, 1.1) �0.0001 (�0.001, 0.001) 0.6 (�1, 3)Two-sided P 0.54 0.59 0.82 0.84 0.54
1 In absolute terms, the total number of Ki-67–labeled nuclei per crypt; in relative terms, the total number of labeled nuclei per 100 �m of crypt length.2 In absolute terms, the average height of a labeled nucleus (the distance from the crypt base to the labeled nucleus, measured in �m); in relative terms,
the average height of a labeled nucleus divided by the total height of the crypt (�m/�m).3 Difference in change of proliferation measure between baseline and 12 mo, associated with a 100-nmol/L increase in serum genistein and adjusted for
age and sex. Calculated by linear regression, with baseline proliferation, sex, and 10-y age category included as covariates and robust SEs.
SOY ISOFLAVONES AND COLORECTAL PROLIFERATION 625
may have been due to measurement error. However, given the smalleffectsweobserved,weconclude thatsoyisoflavoneshavenoeffecton proliferation, at least as measured by the methods used.
In conclusion, we analyzed the effect of a soy isoflavoneintervention on 3 sites in the colon on the basis of 5 differentmeasurements. We found no evidence that a 12-mo dietary soyisoflavone intervention decreases colorectal epithelial cell pro-liferation in a study population of mostly men aged 50–80 y withprevious adenomatous polyps.
We thank the study staff of the GHC (Kelly Ehrlich, Linda Palmer, andTina Stroh) and the clinic staff and physicians of the Central (Lanie Belic,Rubeela Malik, Venkatchala Mohan, David Perera, Shie-Pon Tzung, andHerbert Weisberg) and Eastside (Janet Chu, Charles Janeway, and FlavioManela) GHC gastroenterology clinics, without whom this study would nothave been possible. We also thank Elizabeth Levy, JoAnn Prunty, HeidiWarner, Vivian Li, and the staff of the Research Pathology Shared Resourceat the Fred Hutchinson Cancer Research Center.
None of the authors had a conflict of interest.
REFERENCES1. IARC. Cancer incidence in five continents. Lyon, France: IARC, 1997.
(Scientific publications no. 143.)2. Setchell KD. Soy isoflavones—benefits and risks from nature’s selec-
tive estrogen receptor modulators (SERMs). J Am Coll Nutr 2001;20:354S–62S; discussion 381S–3S.
3. Adlercreutz H. Phytoestrogens: epidemiology and a possible role incancer protection. Environ Health Perspect 1995;103(suppl):103–12.
4. Setchell KD, Cassidy A. Dietary isoflavones: biological effects andrelevance to human health. J Nutr 1999;129:758S–67S.
5. McMichael AJ, Potter JD. Reproduction, endogenous and exogenoussex hormones, and colon cancer: a review and hypothesis. J Natl CancerInst 1980;65:1201–7.
6. Rossouw JE, Anderson GL, Prentice RL, et al. Risks and benefits ofestrogen plus progestin in healthy postmenopausal women: principalresults from the Women’s Health Initiative randomized controlled trial.JAMA 2002;288:321–33.
7. Messina M, Bennink M. Soyfoods, isoflavones and risk of colonic can-cer: a review of the in vitro and in vivo data. Baillieres Clin EndocrinolMetab 1998;12:707–28.
8. Booth C, Hargreaves DF, Hadfield JA, McGown AT, Potten CS. Isofla-vones inhibit intestinal epithelial cell proliferation and induce apoptosisin vitro. Br J Cancer 1999;80:1550–7.
9. LeMarchandL,HankinJH,WilkensLR,KolonelLN,EnglystHN,LyuLC.Dietary fiber and colorectal cancer risk. Epidemiology 1997;8:658–65.
10. Seow A, Quah SR, Nyam D, Straughan PT, Chua T, Aw TC. Food groupsand the risk of colorectal carcinoma in an Asian population. Cancer2002;95:2390–6.
11. Nagata C. Ecological study of the association between soy productintake and mortality from cancer and heart disease in Japan. Int J Epi-demiol 2000;29:832–6.
12. AdlercreutzH.Phyto-oestrogensandcancer.LancetOncol2002;3:364–73.13. Bennink MR. Dietary soy reduces colon carcinogenesis in human and
rats. Soy and colon cancer. Adv Exp Med Biol 2001;492:11–7.14. Baron JA. Intermediate effect markers for colorectal cancer. IARC Sci
Publ 2001;154:113–29.15. Farber E. Cell proliferation as a major risk factor for cancer: a concept of
doubtful validity. Cancer Res 1995;55:3759–62.16. Fearon ER, Vogelstein B. A genetic model for colorectal tumorigenesis.
Cell 1990;61:759–67.17. Stemmermann GN, Noffsinger A, Fenoglio-Preiser CM. Re: E. Farber,
Cell proliferation as a major risk factor for cancer: a concept of doubtfulvalidity. Cancer Res, 55: 3759–3762, 1995. Cancer Res 1996;56:4267–9;author reply 4272–4.
18. Giovannucci E. Insulin, insulin-like growth factors and colon cancer: areview of the evidence. J Nutr 2001;131:3109S–20S.
19. Bostick RM, Fosdick L, Lillemoe TJ, et al. Methodological findings andconsiderations in measuring colorectal epithelial cell proliferation inhumans. Cancer Epidemiol Biomarkers Prev 1997;6:931–42.
20. Jass JR, Ajioka Y, Radojkovic M, Allison LJ, Lane MR. Failure to detectcolonic mucosal hyperproliferation in mutation positive members of afamily with hereditary non-polyposis colorectal cancer. Histopathology1997;30:201–7.
21. Sandler RS, Baron JA, Tosteson TD, Mandel JS, Haile RW. Rectalmucosal proliferation and risk of colorectal adenomas: results from arandomized controlled trial. Cancer Epidemiol Biomarkers Prev 2000;9:653–6.
22. Gerdes J, Lemke H, Baisch H, Wacker HH, Schwab U, Stein H. Cellcycle analysis of a cell proliferation-associated human nuclear antigen de-fined by the monoclonal antibody Ki-67. J Immunol 1984;133:1710–5.
23. Gilliland R, Williamson KE, Wilson RH, Anderson NH, Hamilton PW.Colorectal cell kinetics. Br J Surg 1996;83:739–49.
24. Holt PR, Moss SF, Kapetanakis AM, Petrotos A, Wang S. Is Ki-67 abetter proliferative marker in the colon than proliferating cell nuclearantigen? Cancer Epidemiol Biomarkers Prev 1997;6:131–5.
25. Adams KF, Newton KM, Chen C, et al. Soy isoflavones do not modulatecirculating insulin-like growth factor concentrations in an older popu-lation in an intervention trial. J Nutr 2003;133:1316–9.
26. Emerson SS, Fleming TR. Symmetric group sequential test designs.Biometrics 1989;45:905–23.
27. Emerson SS, Flemming TR. Parameter estimation following group se-quential hypothesis testing. Biometrika 1990;77:875–892.
28. Thiagarajan DG, Bennink M, Bourquin LD, Mayle JE. Effect of soyprotein consumption on colonic cell proliferation in humans. FASEB J1999;13:A370.
29. Elias JM. Cell proliferation indexes: a biomarker in solid tumors. Bio-tech Histochem 1997;72:78–85.
30. Lipkin M, Blattner WE, Fraumeni JF Jr, Lynch HT, Deschner E,Winawer S. Tritiated thymidine (phi p, phi h) labeling distribution as amarker for hereditary predisposition to colon cancer. Cancer Res 1983;43:1899–904.
31. Baron JA, Tosteson TD, Wargovich MJ, et al. Calcium supplementationand rectal mucosal proliferation: a randomized controlled trial. J NatlCancer Inst 1995;87:1303–7.
32. McShane LM, Kulldorff M, Wargovich MJ, et al. An evaluation of rectalmucosal proliferation measure variability sources in the polyp preven-tion trial: can we detect informative differences among individuals’proliferation measures amid the noise? Cancer Epidemiol BiomarkersPrev 1998;7:605–12.
33. van Gorkom BA, Karrenbeld A, van Der Sluis T, Koudstaal J, de VriesEG, Kleibeuker JH. Influence of a highly purified senna extract oncolonic epithelium. Digestion 2000;61:113–20.
34. Sandler RS, Halabi S, Baron JA, et al. A randomized trial of aspirin toprevent colorectal adenomas in patients with previous colorectal cancer.N Engl J Med 2003;348:883–90.
35. Baron JA, Cole BF, Sandler RS, et al. A randomized trial of aspirin toprevent colorectal adenomas. N Engl J Med 2003;348:891–9.
36. Gostner A, Dusel G, Kelber E, Scheppach W, Bartram HP. Comparisonsof the anti-proliferative effects of butyrate and aspirin on human colonicmucosa in vitro. Eur J Cancer Prev 2000;9:205–11.
37. Bostick RM, Fosdick L, Wood JR, et al. Calcium and colorectal epithe-lial cell proliferation in sporadic adenoma patients: a randomized,double-blinded, placebo-controlled clinical trial. J Natl Cancer Inst1995;87:1307–15.
38. Chen AC, Donovan SM. Genistein at a concentration present in soyinfant formula inhibits Caco-2BBe cell proliferation by causing G2/Mcell cycle arrest. J Nutr 2004;134:1303–8.
39. Hakkak R, Korourian S, Ronis MJ, Johnston JM, Badger TM. Soyprotein isolate consumption protects against azoxymethane-induced co-lon tumors in male rats. Cancer Lett 2001;166:27–32.
40. Govers MJ, Lapre JA, De Vries HT, Van der Meer R. Dietary soybeanprotein compared with casein damages colonic epithelium and stimu-lates colonic epithelial proliferation in rats. J Nutr 1993;123:1709–13.
626 ADAMS ET AL
See corresponding editorial on page 493.
See corresponding CME exam on page 712.
High homocysteine and low B vitamins predict cognitive decline inaging men: the Veterans Affairs Normative Aging Study1–4
Katherine L Tucker, Ning Qiao, Tammy Scott, Irwin Rosenberg, and Avron Spiro III
ABSTRACTBackground: Elevated homocysteine concentrations may contrib-ute to cognitive impairment. Most elevations in homocysteine resultfrom inadequate folate, vitamin B-12, or vitamin B-6 intake. It is notclear whether the observed associations between homocysteine andcognitive measures are causal or whether they are due to homocys-teine, to independent actions of the B vitamins, or to both.Objective: We aimed to assess the individual and independent ef-fects of baseline plasma homocysteine, folate, vitamin B-12, andvitamin B-6 and of dietary B vitamin intakes on 3-y changes incognitive measures in 321 aging men.Design: Participants were from the Veterans Affairs NormativeAging Study. Cognitive function was assessed with the Mini-MentalState Examination and on the basis of measures of memory, verbalfluency, and constructional praxis, which were adapted from therevised Wechsler Adult Intelligence Scale and the Consortium toEstablish a Registry for Alzheimer’s Disease batteries at 2 timepoints. At baseline, dietary intakes were assessed with a food-frequency questionnaire, and blood was drawn for the measurementof B vitamins and homocysteine.Results: Over a mean 3-y follow-up, declines in constructionalpraxis, measured by spatial copying, were significantly associatedwith plasma homocysteine, folate, and vitamins B-6 and B-12 andwith the dietary intake of each vitamin. Folate (plasma and dietary)remained independently protective against a decline in spatial copy-ing score after adjustment for other vitamins and for plasma homo-cysteine. Dietary folate was also protective against a decline inverbal fluency. A high homocysteine concentration was associatedwith a decline in recall memory.Conclusions: Low B vitamin and high homocysteine concentrationspredict cognitive decline. Spatial copying measures appear to bemost sensitive to these effects in a general population of agingmen. Am J Clin Nutr 2005;82:627–35.
KEY WORDS Folate, vitamin B-6, vitamin B-12, homocys-teine, cognitive function
INTRODUCTION
It has long been known that a deficiency of several B vitamins,including vitamin B-12, can lead to neurologic deterioration andcognitive decline. However, there is increasing evidence to sug-gest that even moderately low or subclinical B vitamin concen-trations may be associated with cognitive impairment (1). Ho-mocysteine, an amino acid that becomes elevated in the presence
of inadequate folate, vitamin B-12, or vitamin B-6, is a risk factorfor cardiovascular disease (2). Several prospective studies haveshown positive risk associations with myocardial infarction andstroke (3–7), although some have reported null findings (8–10).
Several mechanisms for the effects of homocysteine on cog-nitive decline have been proposed (11–13). Because the effectson the vasculature that contribute to heart disease and stroke arealso likely to increase the risk of vascular dementia, it has beenhypothesized that inadequate B vitamin status and high homo-cysteine concentrations may contribute to cognitive declinethrough silent brain infarction (11, 14). Homocysteine may alsobe directly neurotoxic through overstimulation of N-methyl-D-aspartate receptors, which results in calcium influx and apoptosis(12, 13). However, a recent study suggests that the oxidizedforms of homocysteine, homocysteinesulfinic acid, and homo-cysteic acid, rather than homocysteine itself, are the toxic com-pounds (15). In addition, low concentrations of folate or vitaminB-12 may impair methylation reactions important to the main-tenance of brain tissue. Folate and vitamin B-12 are required formethionine synthesis and the subsequent formation ofS-adenosylmethionine, a universal methyl donor important to theformation of neurotransmitters, phospholipids, and myelin (1).
1 From the Jean Mayer US Department of Agriculture Human NutritionResearch Center on Aging at Tufts University, Boston, MA (KLT, NQ, andIR); the New England Medical Center Department of Psychiatry, Boston,MA (TS); and the Boston University School of Public Health and the Vet-erans Affairs Boston Healthcare System, Boston, MA (AS).
2 The views expressed in this article are those of the authors and do notnecessarily represent the views of the US Department of Veterans Affairs.
3 Supported in part by the USDA Agricultural Research Service, underagreement number 58-1950-9-001 and by NIA grant no. AG21790-01. TheCognition and Health in Aging Men Project (CHAMP) is supported by theResearch Services of the US Department of Veterans Affairs, the NationalInstitutes of Health (grants R01-AA08941, R01-AG13006, R01-AG14345,R01-AG18436, 5-P42-ES05947, and R01-ES05257), and the US Depart-ment of Agriculture, Agricultural Research Service (contract 53-K06-510).The VA Normative Aging Study is supported by the Cooperative StudiesProgram/Epidemiology Research and Information Center of the US Depart-ment of Veterans Affairs, and is a component of the Massachusetts VeteransEpidemiology Research and Information Center.
4 Reprints not available. Address correspondence to KL Tucker, Jean MayerUSDA Human Nutrition Research Center on Aging at Tufts University, 711Washington Street, Boston, MA 02111. E-mail: [email protected].
Received January 24, 2005.Accepted for publication March 21, 2005.
627Am J Clin Nutr 2005;82:627–35. Printed in USA. © 2005 American Society for Clinical Nutrition
Recent reviews of homocysteine, B vitamins, and cognitivefunction or decline have reached different conclusions. In2001, Calvaresi and Bryan (16) reviewed evidence from8cross-sectional, 2 longitudinal, and 4 experimental studies andconcluded that there was good evidence to suggest that B vita-mins are related to cognitive performance and decline. Morerecently, Ellinson et al (17) concluded that total homocysteine isnegatively associated but that folate or vitamin B-12 are incon-sistently associated with cognitive scores. Other reviews (18, 19)concluded that, with the exception of clear deficiency, the evi-dence for a role of B vitamins in preventing cognitive declineremains unclear. Most recently, reviews of clinical trials of folicacid, vitamin B-12, or vitamin B-6 noted no conclusive effect oftreatment on dementia (20–22). However, the authors identifiedonly 4 qualifying trials for folic acid, 2 for vitamin B-12, and 2 forvitamin B-6; sample sizes were small (n � 11–139) and thedurations short (1–5 mo). All of these reviews noted that moreresearch is needed to understand these relations.
We previously reported that homocysteine is negatively and Bvitamins positively associated with cross-sectional measures ofcognitive function in 68 male participants aged 54–81 y in theVA Normative Aging Study (NAS) (23). In this report we ex-amined the association between homocysteine and associated Bvitamins and cognitive decline in 321 men from the NAS over a3-y follow-up period.
SUBJECTS AND METHODS
Subjects
The NAS began in 1963 by recruiting men in the Boston areawho were originally free of heart disease or other major healthproblems. Participating men return every 3–5 y for a healthexamination, at which time they complete a series of question-naires. Since 1993, a brief cognitive examination was added tothese visits. Dietary intake data have been collected since 1987,and assessments of plasma B vitamins and homocysteine wereadded in 1993. In this analysis, we examined the relation betweenbaseline plasma homocysteine, folate, vitamin B-12, and vitaminB-6 and cognitive decline in 321 men who completed 2 cycles ofcognitive testing �3 y apart. This protocol was approved by theInstitutional Review Boards of both the Boston Veterans AffairsMedical Center and Tufts New England Medical Center. Allparticipants gave written informed consent.
Cognitive measures
We selected those tests that were significantly correlated withat least one of the B vitamins—folate, vitamin B-12, or vitaminB-6—in our earlier cross-sectional assessment of 68 men. Theseincluded measures of working memory (backward digit span),recall (word list memory test), language (verbal fluency), andspatial copying (constructional praxis). We also examinedchanges in Mini-Mental State Examination (MMSE) scores as aglobal measure of cognitive function (24).
The Backward Digit Span test is from the Revised WechslerAdult Intelligence Scale (25). Participants are read a list of digitsand asked to recall these in backward sequence. The score is thelongest span of digits recalled correctly in backward order, witha maximum of 8. The word list memory test is adapted from theConsortium to Establish a Registry for Alzheimer’s Disease(CERAD) battery (26). Ten words are presented on a computer
screen consecutively, for 2 s each, and participants are then askedto recall these words. Three consecutive trials are administered,and the score is the sum of words remembered; the maximumscore is 30. The verbal fluency test is also from the CERAD.Participants are asked to name as many animals as they canwithin 1 min.
In the spatial copying task, participants are asked to copy acircle, crossed rectangles, a vertical diamond, and a cube (fromthe CERAD battery) as well as tilted triangles, an 8-dot circle, ahorizontal diamond, and a tapered box (from the DevelopmentalTest of Visual-Motor Integration; VMI) (25, 27). The accuracy ofthe copied figures is scored by trained staff using criteria from theCERAD and VMI. The resulting score is the total number offigures drawn correctly; the maximum score is 9. A second scoreis weighted by the degree of difficulty of the figure, resulting ina maximum score of 26.
Plasma analysis
Fasting plasma samples were drawn at the VA field site andstored at �80 °C. Batches were transferred on dry ice to the JeanMayer US Department of Agriculture Human Nutrition Re-search Center on Aging, where they were again stored at �80 °Cand later analyzed for total homocysteine, vitamin B-12, folate,and vitamin B-6 (as pyridoxal-5'-phosphate; PLP). The timebetween blood draw and analysis averaged 1.7 � 1.2 y. Totalhomocysteine in plasma was measured by using an adaptation ofthe method described by Araki and Sako (28). The CV for thisassay in our laboratory is 4.0%. PLP was measured enzymati-cally, by using tyrosine decarboxylase, based on the principlesdescribed by Shin-Buehring et al (29). The CV for this assay inour laboratory is 5.0%. Plasma folate and vitamin B-12 concen-trations were measured by radioassay with the use of a commer-cially available kit from Bio-Rad (Hercules, CA). The CVs forthese assays in our laboratory are 4.7% for vitamin B-12 and4.3% for folate.
Dietary intake
Dietary intake was assessed with a version of the Willett semi-quantitative food- frequency questionnaire. This scannable form,which requests participants to record the number of times theyconsume each of 126 food items per month, week, or day wasmailed to NAS participants before their examination visit andchecked for completeness at the examination. Forms were pro-cessed through a nutrient database at the Channing Laboratory atHarvard University to obtain estimates of usual daily nutrientintake. Vitamin and mineral supplement use was also asked onthis questionnaire and was included in the total nutrient intakeestimates. Questionnaires with improbable intakes (�16.75 or�2.51 MJ) were excluded from further analysis.
Statistical analysis
Test scores (backward digit span, word list recall, verbal flu-ency, figure copying, and MMSE) at follow-up were regressed,on baseline total homocysteine, plasma vitamin B-12, plasmafolate, and PLP by using the regression procedure in SAS (ver-sion 9.1; SAS Institute Inc, Cary, NC). Because of skewness,homocysteine and all nutrient measures were log transformed.Models were adjusted for time (mo) between cognitive measuresas well as for respective baseline score, age, education level (y),body mass index (in kg/m2), smoking (current, past, or never),
628 TUCKER ET AL
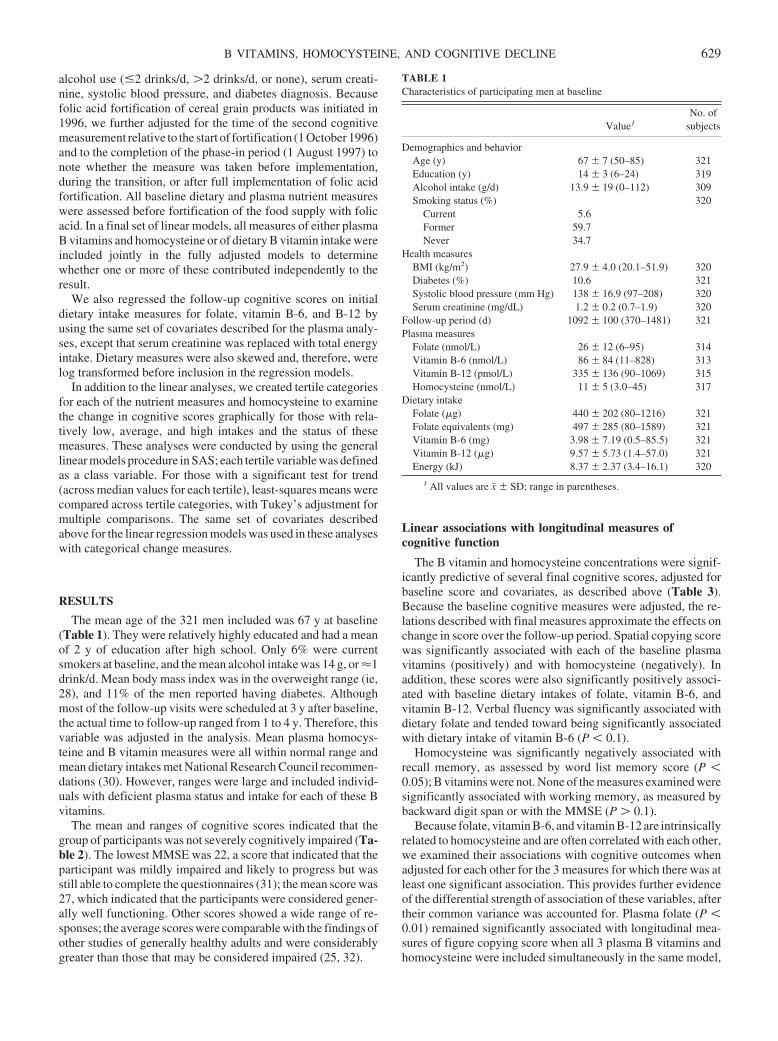
alcohol use (�2 drinks/d, �2 drinks/d, or none), serum creati-nine, systolic blood pressure, and diabetes diagnosis. Becausefolic acid fortification of cereal grain products was initiated in1996, we further adjusted for the time of the second cognitivemeasurement relative to the start of fortification (1 October 1996)and to the completion of the phase-in period (1 August 1997) tonote whether the measure was taken before implementation,during the transition, or after full implementation of folic acidfortification. All baseline dietary and plasma nutrient measureswere assessed before fortification of the food supply with folicacid. In a final set of linear models, all measures of either plasmaB vitamins and homocysteine or of dietary B vitamin intake wereincluded jointly in the fully adjusted models to determinewhether one or more of these contributed independently to theresult.
We also regressed the follow-up cognitive scores on initialdietary intake measures for folate, vitamin B-6, and B-12 byusing the same set of covariates described for the plasma analy-ses, except that serum creatinine was replaced with total energyintake. Dietary measures were also skewed and, therefore, werelog transformed before inclusion in the regression models.
In addition to the linear analyses, we created tertile categoriesfor each of the nutrient measures and homocysteine to examinethe change in cognitive scores graphically for those with rela-tively low, average, and high intakes and the status of thesemeasures. These analyses were conducted by using the generallinear models procedure in SAS; each tertile variable was definedas a class variable. For those with a significant test for trend(across median values for each tertile), least-squares means werecompared across tertile categories, with Tukey’s adjustment formultiple comparisons. The same set of covariates describedabove for the linear regression models was used in these analyseswith categorical change measures.
RESULTS
The mean age of the 321 men included was 67 y at baseline(Table 1). They were relatively highly educated and had a meanof 2 y of education after high school. Only 6% were currentsmokers at baseline, and the mean alcohol intake was 14 g, or �1drink/d. Mean body mass index was in the overweight range (ie,28), and 11% of the men reported having diabetes. Althoughmost of the follow-up visits were scheduled at 3 y after baseline,the actual time to follow-up ranged from 1 to 4 y. Therefore, thisvariable was adjusted in the analysis. Mean plasma homocys-teine and B vitamin measures were all within normal range andmean dietary intakes met National Research Council recommen-dations (30). However, ranges were large and included individ-uals with deficient plasma status and intake for each of these Bvitamins.
The mean and ranges of cognitive scores indicated that thegroup of participants was not severely cognitively impaired (Ta-ble 2). The lowest MMSE was 22, a score that indicated that theparticipant was mildly impaired and likely to progress but wasstill able to complete the questionnaires (31); the mean score was27, which indicated that the participants were considered gener-ally well functioning. Other scores showed a wide range of re-sponses; the average scores were comparable with the findings ofother studies of generally healthy adults and were considerablygreater than those that may be considered impaired (25, 32).
Linear associations with longitudinal measures ofcognitive function
The B vitamin and homocysteine concentrations were signif-icantly predictive of several final cognitive scores, adjusted forbaseline score and covariates, as described above (Table 3).Because the baseline cognitive measures were adjusted, the re-lations described with final measures approximate the effects onchange in score over the follow-up period. Spatial copying scorewas significantly associated with each of the baseline plasmavitamins (positively) and with homocysteine (negatively). Inaddition, these scores were also significantly positively associ-ated with baseline dietary intakes of folate, vitamin B-6, andvitamin B-12. Verbal fluency was significantly associated withdietary folate and tended toward being significantly associatedwith dietary intake of vitamin B-6 (P � 0.1).
Homocysteine was significantly negatively associated withrecall memory, as assessed by word list memory score (P �0.05); B vitamins were not. None of the measures examined weresignificantly associated with working memory, as measured bybackward digit span or with the MMSE (P � 0.1).
Because folate, vitamin B-6, and vitamin B-12 are intrinsicallyrelated to homocysteine and are often correlated with each other,we examined their associations with cognitive outcomes whenadjusted for each other for the 3 measures for which there was atleast one significant association. This provides further evidenceof the differential strength of association of these variables, aftertheir common variance was accounted for. Plasma folate (P �0.01) remained significantly associated with longitudinal mea-sures of figure copying score when all 3 plasma B vitamins andhomocysteine were included simultaneously in the same model,
TABLE 1Characteristics of participating men at baseline
Value1No. of
subjects
Demographics and behaviorAge (y) 67 � 7 (50–85) 321Education (y) 14 � 3 (6–24) 319Alcohol intake (g/d) 13.9 � 19 (0–112) 309Smoking status (%) 320
Current 5.6Former 59.7Never 34.7
Health measuresBMI (kg/m2) 27.9 � 4.0 (20.1–51.9) 320Diabetes (%) 10.6 321Systolic blood pressure (mm Hg) 138 � 16.9 (97–208) 320Serum creatinine (mg/dL) 1.2 � 0.2 (0.7–1.9) 320
Follow-up period (d) 1092 � 100 (370–1481) 321Plasma measures
Folate (nmol/L) 26 � 12 (6–95) 314Vitamin B-6 (nmol/L) 86 � 84 (11–828) 313Vitamin B-12 (pmol/L) 335 � 136 (90–1069) 315Homocysteine (nmol/L) 11 � 5 (3.0–45) 317
Dietary intakeFolate (�g) 440 � 202 (80–1216) 321Folate equivalents (mg) 497 � 285 (80–1589) 321Vitamin B-6 (mg) 3.98 � 7.19 (0.5–85.5) 321Vitamin B-12 (�g) 9.57 � 5.73 (1.4–57.0) 321Energy (kJ) 8.37 � 2.37 (3.4–16.1) 320
1 All values are x� � SD; range in parentheses.
B VITAMINS, HOMOCYSTEINE, AND COGNITIVE DECLINE 629
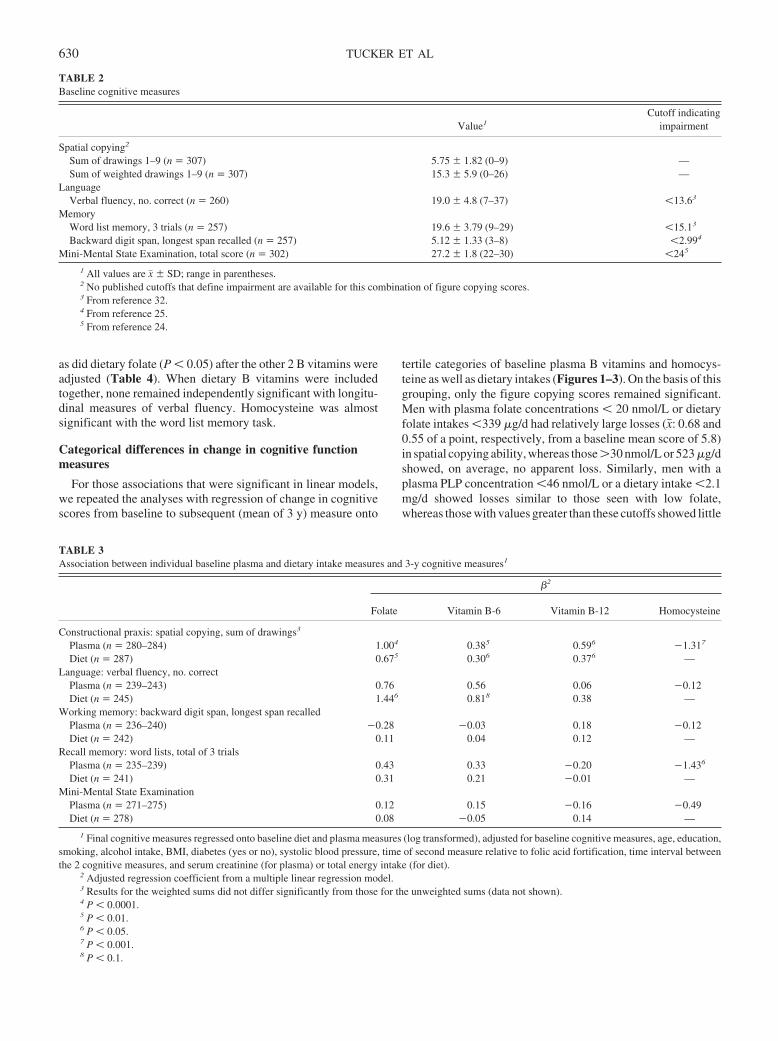
as did dietary folate (P � 0.05) after the other 2 B vitamins wereadjusted (Table 4). When dietary B vitamins were includedtogether, none remained independently significant with longitu-dinal measures of verbal fluency. Homocysteine was almostsignificant with the word list memory task.
Categorical differences in change in cognitive functionmeasures
For those associations that were significant in linear models,we repeated the analyses with regression of change in cognitivescores from baseline to subsequent (mean of 3 y) measure onto
tertile categories of baseline plasma B vitamins and homocys-teine as well as dietary intakes (Figures 1–3). On the basis of thisgrouping, only the figure copying scores remained significant.Men with plasma folate concentrations � 20 nmol/L or dietaryfolate intakes �339 �g/d had relatively large losses (x�: 0.68 and0.55 of a point, respectively, from a baseline mean score of 5.8)in spatial copying ability, whereas those �30 nmol/L or 523 �g/dshowed, on average, no apparent loss. Similarly, men with aplasma PLP concentration �46 nmol/L or a dietary intake �2.1mg/d showed losses similar to those seen with low folate,whereas those with values greater than these cutoffs showed little
TABLE 2Baseline cognitive measures
Value1Cutoff indicating
impairment
Spatial copying2
Sum of drawings 1–9 (n � 307) 5.75 � 1.82 (0–9) —Sum of weighted drawings 1–9 (n � 307) 15.3 � 5.9 (0–26) —
LanguageVerbal fluency, no. correct (n � 260) 19.0 � 4.8 (7–37) �13.63
MemoryWord list memory, 3 trials (n � 257) 19.6 � 3.79 (9–29) �15.13
Backward digit span, longest span recalled (n � 257) 5.12 � 1.33 (3–8) �2.994
Mini-Mental State Examination, total score (n � 302) 27.2 � 1.8 (22–30) �245
1 All values are x� � SD; range in parentheses.2 No published cutoffs that define impairment are available for this combination of figure copying scores.3 From reference 32.4 From reference 25.5 From reference 24.
TABLE 3Association between individual baseline plasma and dietary intake measures and 3-y cognitive measures1
�2
Folate Vitamin B-6 Vitamin B-12 Homocysteine
Constructional praxis: spatial copying, sum of drawings3
Plasma (n � 280–284) 1.004 0.385 0.596 �1.317
Diet (n � 287) 0.675 0.306 0.376 —Language: verbal fluency, no. correct
Plasma (n � 239–243) 0.76 0.56 0.06 �0.12Diet (n � 245) 1.446 0.818 0.38 —
Working memory: backward digit span, longest span recalledPlasma (n � 236–240) �0.28 �0.03 0.18 �0.12Diet (n � 242) 0.11 0.04 0.12 —
Recall memory: word lists, total of 3 trialsPlasma (n � 235–239) 0.43 0.33 �0.20 �1.436
Diet (n � 241) 0.31 0.21 �0.01 —Mini-Mental State Examination
Plasma (n � 271–275) 0.12 0.15 �0.16 �0.49Diet (n � 278) 0.08 �0.05 0.14 —
1 Final cognitive measures regressed onto baseline diet and plasma measures (log transformed), adjusted for baseline cognitive measures, age, education,smoking, alcohol intake, BMI, diabetes (yes or no), systolic blood pressure, time of second measure relative to folic acid fortification, time interval betweenthe 2 cognitive measures, and serum creatinine (for plasma) or total energy intake (for diet).
2 Adjusted regression coefficient from a multiple linear regression model.3 Results for the weighted sums did not differ significantly from those for the unweighted sums (data not shown).4 P � 0.0001.5 P � 0.01.6 P � 0.05.7 P � 0.001.8 P � 0.1.
630 TUCKER ET AL
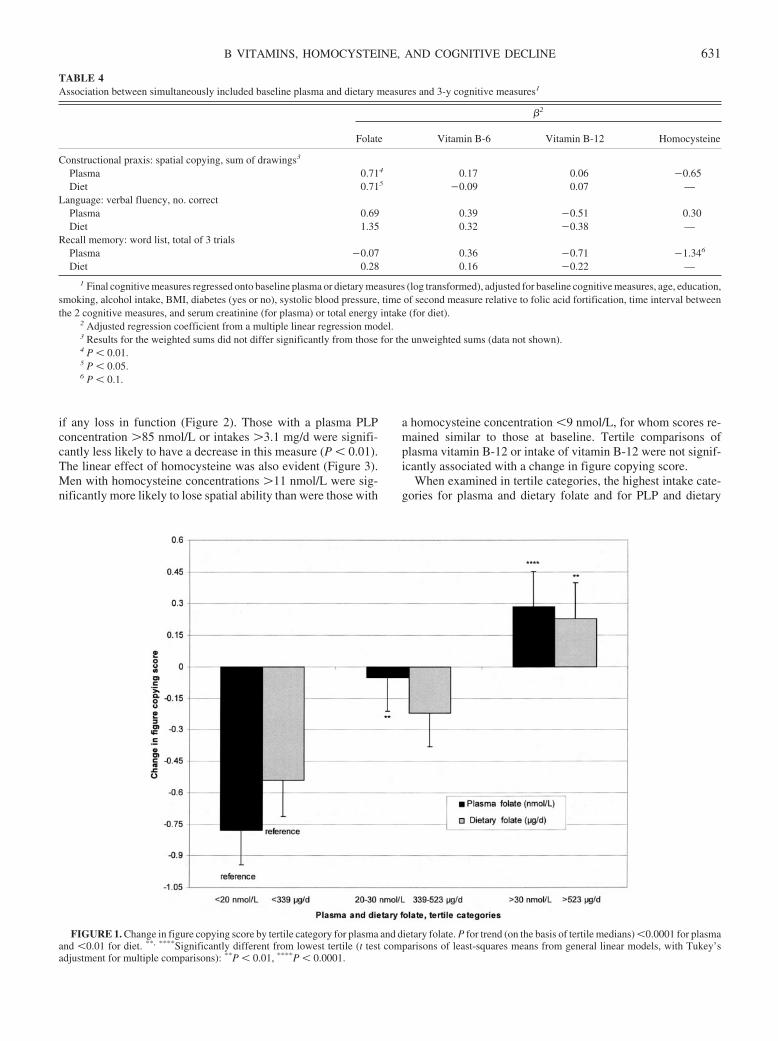
if any loss in function (Figure 2). Those with a plasma PLPconcentration �85 nmol/L or intakes �3.1 mg/d were signifi-cantly less likely to have a decrease in this measure (P � 0.01).The linear effect of homocysteine was also evident (Figure 3).Men with homocysteine concentrations �11 nmol/L were sig-nificantly more likely to lose spatial ability than were those with
a homocysteine concentration �9 nmol/L, for whom scores re-mained similar to those at baseline. Tertile comparisons ofplasma vitamin B-12 or intake of vitamin B-12 were not signif-icantly associated with a change in figure copying score.
When examined in tertile categories, the highest intake cate-gories for plasma and dietary folate and for PLP and dietary
TABLE 4Association between simultaneously included baseline plasma and dietary measures and 3-y cognitive measures1
�2
Folate Vitamin B-6 Vitamin B-12 Homocysteine
Constructional praxis: spatial copying, sum of drawings3
Plasma 0.714 0.17 0.06 �0.65Diet 0.715 �0.09 0.07 —
Language: verbal fluency, no. correctPlasma 0.69 0.39 �0.51 0.30Diet 1.35 0.32 �0.38 —
Recall memory: word list, total of 3 trialsPlasma �0.07 0.36 �0.71 �1.346
Diet 0.28 0.16 �0.22 —
1 Final cognitive measures regressed onto baseline plasma or dietary measures (log transformed), adjusted for baseline cognitive measures, age, education,smoking, alcohol intake, BMI, diabetes (yes or no), systolic blood pressure, time of second measure relative to folic acid fortification, time interval betweenthe 2 cognitive measures, and serum creatinine (for plasma) or total energy intake (for diet).
2 Adjusted regression coefficient from a multiple linear regression model.3 Results for the weighted sums did not differ significantly from those for the unweighted sums (data not shown).4 P � 0.01.5 P � 0.05.6 P � 0.1.
FIGURE 1. Change in figure copying score by tertile category for plasma and dietary folate. P for trend (on the basis of tertile medians) �0.0001 for plasmaand �0.01 for diet. **, ****Significantly different from lowest tertile (t test comparisons of least-squares means from general linear models, with Tukey’sadjustment for multiple comparisons): **P � 0.01, ****P � 0.0001.
B VITAMINS, HOMOCYSTEINE, AND COGNITIVE DECLINE 631
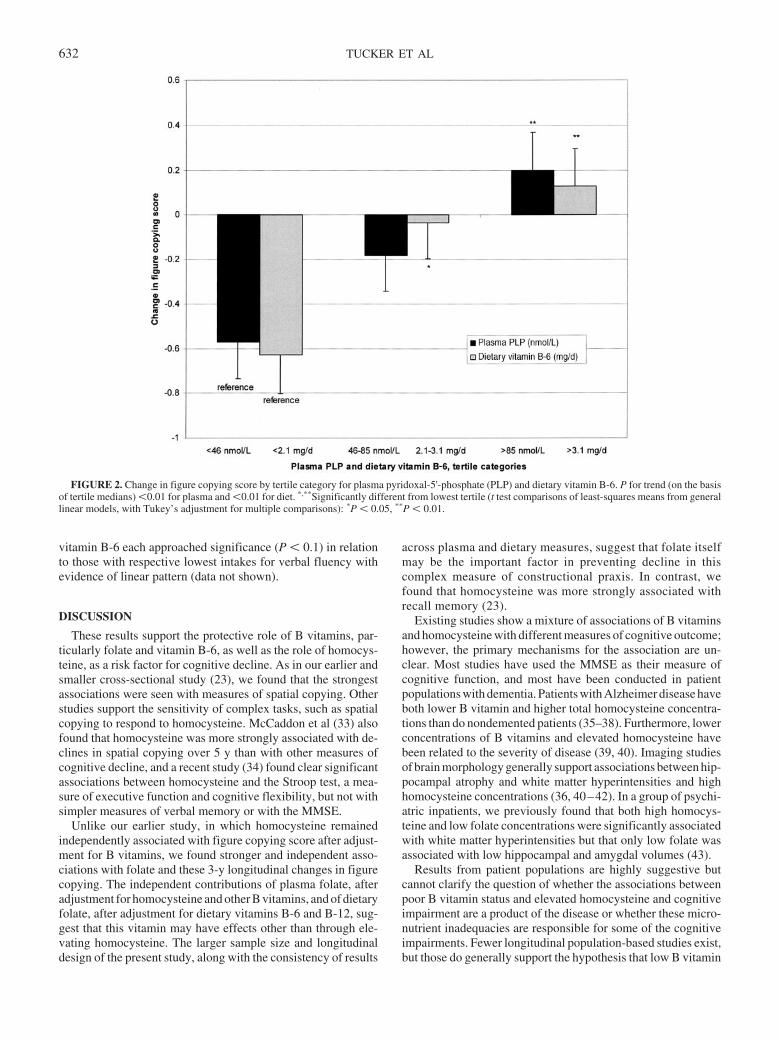
vitamin B-6 each approached significance (P � 0.1) in relationto those with respective lowest intakes for verbal fluency withevidence of linear pattern (data not shown).
DISCUSSION
These results support the protective role of B vitamins, par-ticularly folate and vitamin B-6, as well as the role of homocys-teine, as a risk factor for cognitive decline. As in our earlier andsmaller cross-sectional study (23), we found that the strongestassociations were seen with measures of spatial copying. Otherstudies support the sensitivity of complex tasks, such as spatialcopying to respond to homocysteine. McCaddon et al (33) alsofound that homocysteine was more strongly associated with de-clines in spatial copying over 5 y than with other measures ofcognitive decline, and a recent study (34) found clear significantassociations between homocysteine and the Stroop test, a mea-sure of executive function and cognitive flexibility, but not withsimpler measures of verbal memory or with the MMSE.
Unlike our earlier study, in which homocysteine remainedindependently associated with figure copying score after adjust-ment for B vitamins, we found stronger and independent asso-ciations with folate and these 3-y longitudinal changes in figurecopying. The independent contributions of plasma folate, afteradjustment for homocysteine and other B vitamins, and of dietaryfolate, after adjustment for dietary vitamins B-6 and B-12, sug-gest that this vitamin may have effects other than through ele-vating homocysteine. The larger sample size and longitudinaldesign of the present study, along with the consistency of results
across plasma and dietary measures, suggest that folate itselfmay be the important factor in preventing decline in thiscomplex measure of constructional praxis. In contrast, wefound that homocysteine was more strongly associated withrecall memory (23).
Existing studies show a mixture of associations of B vitaminsand homocysteine with different measures of cognitive outcome;however, the primary mechanisms for the association are un-clear. Most studies have used the MMSE as their measure ofcognitive function, and most have been conducted in patientpopulations with dementia. Patients with Alzheimer disease haveboth lower B vitamin and higher total homocysteine concentra-tions than do nondemented patients (35–38). Furthermore, lowerconcentrations of B vitamins and elevated homocysteine havebeen related to the severity of disease (39, 40). Imaging studiesof brain morphology generally support associations between hip-pocampal atrophy and white matter hyperintensities and highhomocysteine concentrations (36, 40–42). In a group of psychi-atric inpatients, we previously found that both high homocys-teine and low folate concentrations were significantly associatedwith white matter hyperintensities but that only low folate wasassociated with low hippocampal and amygdal volumes (43).
Results from patient populations are highly suggestive butcannot clarify the question of whether the associations betweenpoor B vitamin status and elevated homocysteine and cognitiveimpairment are a product of the disease or whether these micro-nutrient inadequacies are responsible for some of the cognitiveimpairments. Fewer longitudinal population-based studies exist,but those do generally support the hypothesis that low B vitamin
FIGURE 2. Change in figure copying score by tertile category for plasma pyridoxal-5'-phosphate (PLP) and dietary vitamin B-6. P for trend (on the basisof tertile medians) �0.01 for plasma and �0.01 for diet. *,**Significantly different from lowest tertile (t test comparisons of least-squares means from generallinear models, with Tukey’s adjustment for multiple comparisons): *P � 0.05, **P � 0.01.
632 TUCKER ET AL
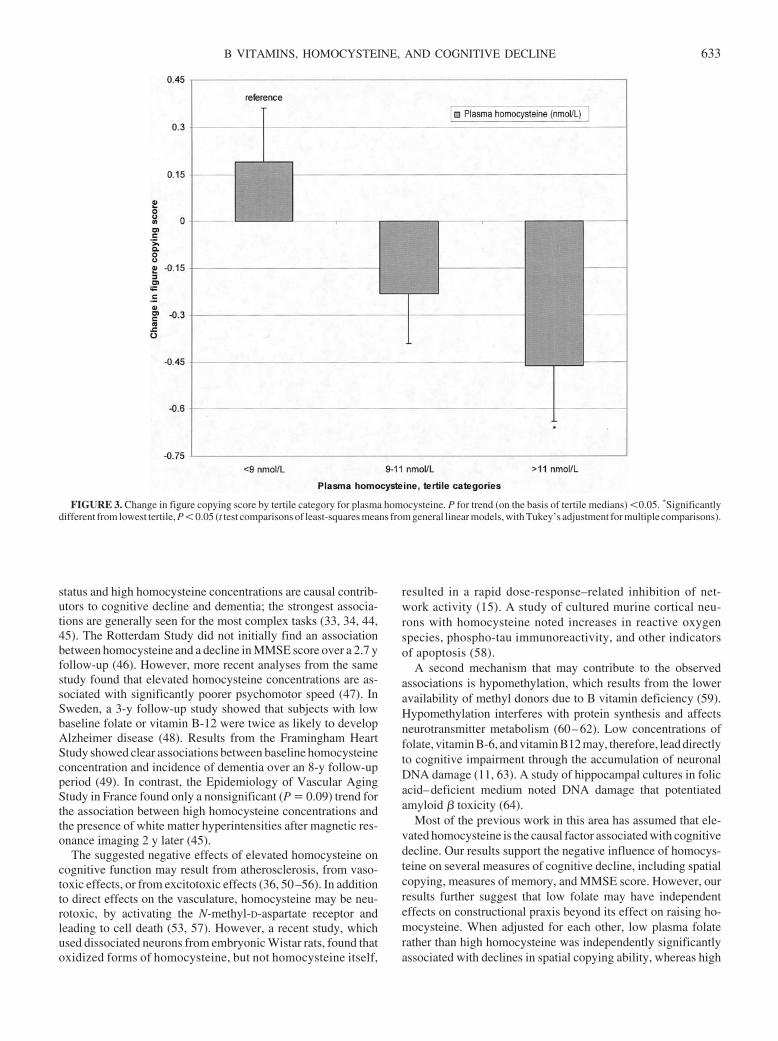
status and high homocysteine concentrations are causal contrib-utors to cognitive decline and dementia; the strongest associa-tions are generally seen for the most complex tasks (33, 34, 44,45). The Rotterdam Study did not initially find an associationbetween homocysteine and a decline in MMSE score over a 2.7 yfollow-up (46). However, more recent analyses from the samestudy found that elevated homocysteine concentrations are as-sociated with significantly poorer psychomotor speed (47). InSweden, a 3-y follow-up study showed that subjects with lowbaseline folate or vitamin B-12 were twice as likely to developAlzheimer disease (48). Results from the Framingham HeartStudy showed clear associations between baseline homocysteineconcentration and incidence of dementia over an 8-y follow-upperiod (49). In contrast, the Epidemiology of Vascular AgingStudy in France found only a nonsignificant (P � 0.09) trend forthe association between high homocysteine concentrations andthe presence of white matter hyperintensities after magnetic res-onance imaging 2 y later (45).
The suggested negative effects of elevated homocysteine oncognitive function may result from atherosclerosis, from vaso-toxic effects, or from excitotoxic effects (36, 50–56). In additionto direct effects on the vasculature, homocysteine may be neu-rotoxic, by activating the N-methyl-D-aspartate receptor andleading to cell death (53, 57). However, a recent study, whichused dissociated neurons from embryonic Wistar rats, found thatoxidized forms of homocysteine, but not homocysteine itself,
resulted in a rapid dose-response–related inhibition of net-work activity (15). A study of cultured murine cortical neu-rons with homocysteine noted increases in reactive oxygenspecies, phospho-tau immunoreactivity, and other indicatorsof apoptosis (58).
A second mechanism that may contribute to the observedassociations is hypomethylation, which results from the loweravailability of methyl donors due to B vitamin deficiency (59).Hypomethylation interferes with protein synthesis and affectsneurotransmitter metabolism (60–62). Low concentrations offolate, vitamin B-6, and vitamin B12 may, therefore, lead directlyto cognitive impairment through the accumulation of neuronalDNA damage (11, 63). A study of hippocampal cultures in folicacid–deficient medium noted DNA damage that potentiatedamyloid � toxicity (64).
Most of the previous work in this area has assumed that ele-vated homocysteine is the causal factor associated with cognitivedecline. Our results support the negative influence of homocys-teine on several measures of cognitive decline, including spatialcopying, measures of memory, and MMSE score. However, ourresults further suggest that low folate may have independenteffects on constructional praxis beyond its effect on raising ho-mocysteine. When adjusted for each other, low plasma folaterather than high homocysteine was independently significantlyassociated with declines in spatial copying ability, whereas high
FIGURE 3. Change in figure copying score by tertile category for plasma homocysteine. P for trend (on the basis of tertile medians) �0.05. *Significantlydifferent from lowest tertile, P � 0.05 (t test comparisons of least-squares means from general linear models, with Tukey’s adjustment for multiple comparisons).
B VITAMINS, HOMOCYSTEINE, AND COGNITIVE DECLINE 633
homocysteine remained more predictive of declines in memoryand overall MMSE score.
Despite the continuing concern that the observed associationsbetween homocysteine and cognitive function may indicate aresponse to cognitive decline or dementia rather than be a causeof such, more recent longitudinal studies support the likelihoodof a causal connection with either homocysteine or its associatedB vitamins. Our data suggest that the effects are complex andinvolve multiple pathways. Although homocysteine is likely toaffect vascular changes that contribute to cognitive decline, othermechanisms involving B vitamins, particularly folate, may alsobe contributory. The consistency of findings across plasma anddietary measures shown here also argues against the suggestionthat processes involved in cognitive decline also contribute tohigher homocysteine. Although one may argue that the reversecausality may be through poorer dietary intake (or less accuratereporting of intake) with cognitive decline, this is unlikely in apopulation with early decline, as this group of men represents.
Further studies to confirm and refine the observed associationsare needed along with long-term randomized trials to demon-strate the effect of vitamin supplementation in the general pop-ulation. Whether due to low vitamin availability, high homocys-teine concentrations, or both, B vitamin intakes and status appearto be important in reducing cognitive decline in men. Since thebaseline measures were taken for this study, the food supply hasbeen fortified with folic acid, which has led to reductions inhomocysteine concentrations in the US population. Further studyis needed to determine whether this change will translate toreductions in cognitive decline. More attention to B vitamin andhomocysteine status could have a major effect on the health andwell being of our aging population.
We acknowledge Gayle Petty, Director of the Nutrition Evaluation Lab-oratory at the Jean Mayer USDA Human Nutrition Research Center on Agingat Tufts University, for conducting the plasma analyses.
KLT designed the analysis and drafted the manuscript. NQ performed thestatistical analysis. TS assisted with the interpretation of cognitive measures.IR assisted with the discussion of potential mechanisms of action. AS wasresponsible for the data collection, coding, and definition of variables. Noneof the authors had a conflict of interest associated with this manuscript, andall authors contributed to the final version.
REFERENCES1. Selhub J, Bagley LC, Miller J, Rosenberg IH. B vitamins, homocysteine,
and neurocognitive function in the elderly. Am J Clin Nutr 2000;71(suppl):614S–20S.
2. Boushey CJ, Beresford SA, Omenn GS, Motulsky AG. A quantitativeassessment of plasma homocysteine as a risk factor for vascular disease.Probable benefits of increasing folic acid intakes. JAMA 1995;274:1049–57.
3. Perry IJ, Refsum H, Morris RW, Ebrahim SB, Ueland PM, Shaper AG.Prospective study of serum total homocysteine concentration and risk ofstroke in middle-aged British men. Lancet 1995;346:1395–8.
4. Ridker PM, Manson JE, Buring JE, Shih J, Matias M, Hennekens CH.Homocysteine and risk of cardiovascular disease among postmeno-pausal women. JAMA 1999;281:1817–21.
5. Bostom AG, Rosenberg IH, Silbershatz H, et al. Nonfasting plasma totalhomocysteine levels and stroke incidence in elderly persons: the Fra-mingham Study. Ann Intern Med 1999;131:352–5.
6. Bots ML, Launer LJ, Lindemans J, et al. Homocysteine and short-termrisk of myocardial infarction and stroke in the elderly: the RotterdamStudy. Arch Intern Med 1999;159:38–44.
7. Maxwell CJ, Hogan DB, Ebly EM. Serum folate levels and subsequentadverse cerebrovascular outcomes in elderly persons. Dement GeriatrCogn Disord 2002;13:225–34.
8. Evans RW, Shaten BJ, Hempel JD, Cutler JA, Kuller LH. Homocys-t(e)ine and risk of cardiovascular disease in the Multiple Risk FactorIntervention Trial. Arterioscler Thromb Vasc Biol 1997;17:1947–53.
9. Folsom AR, Nieto FJ, McGovern PG, et al. Prospective study of coro-nary heart disease incidence in relation to fasting total homocysteine,related genetic polymorphisms, and B vitamins: the AtherosclerosisRisk in Communities (ARIC) study. Circulation 1998;98:204–10.
10. Fallon UB, Elwood P, Ben-Shlomo Y, Ubbink JB, Greenwood R, SmithGD. Homocysteine and ischaemic stroke in men: the Caerphilly study. JEpidemiol Community Health 2001;55:91–6.
11. Rosenberg IH, Miller JW. Nutritional factors in physical and cognitivefunctions of elderly people. Am J Clin Nutr 1992;55(suppl):1237S–43S.
12. McCaddon A, Kelly CL. Alzheimer’s disease: a ‘cobalaminergic’ hy-pothesis. Med Hypotheses 1992;37:161–5.
13. Ho PI, Collins SC, Dhitavat S, et al. Homocysteine potentiates beta-amyloid neurotoxicity: role of oxidative stress. J Neurochem 2001;78:249–53.
14. Matsui T, Arai H, Yuzuriha T, et al. Elevated plasma homocysteinelevels and risk of silent brain infarction in elderly people. Stroke 2001;32:1116–9.
15. Gortz P, Hoinkes A, Fleischer W, et al. Implications for hyperhomocys-teinemia: not homocysteine but its oxidized forms strongly inhibit neu-ronal network activity. J Neurol Sci 2004;218:109–14.
16. Calvaresi E, Bryan J. B vitamins, cognition, and aging: a review. JGerontol B Psychol Sci Soc Sci 2001;56:P327–39.
17. Ellinson M, Thomas J, Patterson A. A critical evaluation of the relation-ship between serum vitamin B, folate and total homocysteine with cog-nitive impairment in the elderly. J Hum Nutr Diet 2004;17:371–83; quiz385–7.
18. Luchsinger JA, Mayeux R. Dietary factors and Alzheimer’s disease.Lancet Neurol 2004;3:579–87.
19. Moretti R, Torre P, Antonello RM, Cattaruzza T, Cazzato G, Bava A.Vitamin B12 and folate depletion in cognition: a review. Neurol India2004;52:310–8.
20. Malouf M, Grimley EJ, Areosa SA. Folic acid with or without vitaminB12 for cognition and dementia. Cochrane Database Syst Rev 2004;3.
21. Malouf R, Areosa SA. Vitamin B12 for cognition. Cochrane DatabaseSyst Rev 2004;3.
22. Malouf R, Grimley Evans J. Vitamin B6 for cognition. Cochrane Data-base Syst Rev 2004;3.
23. Riggs KM, Spiro A III, Tucker K, Rush D. Relations of vitamin B-12,vitamin B-6, folate, and homocysteine to cognitive performance in theNormative Aging Study. Am J Clin Nutr 1996;63:306–14.
24. Folstein MF, Folstein SE. “Mini-Mental State:” a practical method forgrading the cognitive state of patients for the clinician. J Psychiatr Res1975;12:189–98.
25. Wechsler D. Manual for the Wechsler Adult Intelligence Scale–revised.New York, NY: Psychological Corporation, 1981.
26. Morris JC, Heyman A, Mohs RC, et al. The Consortium to Establish aRegistry for Alzheimer’s Disease (CERAD). Part I. Clinical and neuro-psychological assessment of Alzheimer’s disease. Neurology 1989;39:1159–65.
27. Beery K. The Developmental Test of Visual-Motor Integration Manual,revised ed. Cleveland, OH: Modern Curriculum Press, 1989.
28. Araki A, Sako Y. Determination of free and total homocysteine in humanplasma by high-performance liquid chromatography with fluorescencedetection. J Chromatogr 1987;422:43–52.
29. Shin-Buehring Y, Rasshofer R, Endres W. A new enzymatic method forpyridoxal-5'-phosphate determination. J Inherit Metab Disord 1981;4:123–4.
30. Food and Nutrition Board, Institute of Medicine. Dietary reference in-takes for thiamin, riboflavin, niacin, vitamin B6, folate, vitamin B12,pantothenic acid, biotin, and choline. Washington, DC: National Acad-emy Press, 1998.
31. Feinberg LF, Whitlatch CJ. Are persons with cognitive impairment ableto state consistent choices? Gerontologist 2001;41:374–82.
32. Welsh KA, Butters N, Mohs RC, et al. The Consortium to Establish aRegistry for Alzheimer’s Disease (CERAD). Part V. A normative studyof the neuropsychological battery. Neurology 1994;44:609–14.
33. McCaddon A, Hudson P, Davies G, Hughes A, Williams JH, WilkinsonC. Homocysteine and cognitive decline in healthy elderly. Dement Geri-atr Cogn Disord 2001;12:309–13.
34. Garcia A, Haron Y, Pulman K, Hua L, Freedman M. Increases in ho-mocysteine are related to worsening of stroop scores in healthy elderly
634 TUCKER ET AL
persons: a prospective follow-up study. J Gerontol A Biol Sci Med Sci2004;59:1323–7.
35. Joosten E, Lesaffre E, Riezler R, et al. Is metabolic evidence for vitaminB-12 and folate deficiency more frequent in elderly patients with Alz-heimer’s disease? J Gerontol 1997;52A:M76–9.
36. Clarke R, Smith AD, Jobst KA, Refsum H, Sutton L, Ueland PM. Folate,vitamin B12, and serum total homocysteine levels in confirmed Alzhei-mer disease. Arch Neurol 1998;55:1449–55.
37. Gottfries CG, Lehmann W, Regland B. Early diagnosis of cognitiveimpairment in the elderly with the focus on Alzheimer’s disease. J NeuralTransm 1998;105:773–86.
38. Leblhuber F, Walli J, Widner B, Artner-Dworzak E, Fuchs D, Vrecko K.Homocysteine and B vitamins in dementia. Am J Clin Nutr 2001;73:127–8.
39. Sommer BR, Wolkowitz OM. RBC folic acid levels and cognitive per-formance in elderly patients: a preliminary report. Biol Psychiatry 1988;24:352–4.
40. Snowdon DA, Tully CL, Smith CD, Riley KP, Markesbery WR. Serumfolate and the severity of atrophy of the neocortex in Alzheimer disease:findings from the Nun study. Am J Clin Nutr 2000;71:993–8.
41. Williams JH, Pereira EA, Budge MM, Bradley KM. Minimal hippocam-pal width relates to plasma homocysteine in community—dwellingolder people. Age Aging 2002;31:440–4.
42. Hogervorst E, Ribeiro HM, Molyneux A, Budge M, Smith AD. Plasmahomocysteine levels, cerebrovascular risk factors, and cerebral whitematter changes (leukoaraiosis) in patients with Alzheimer disease. ArchNeurol 2002;59:787–93.
43. Scott TM, Tucker KL, Bhadelia A, et al. Homocysteine and B vitaminsrelate to brain volume and white-matter changes in geriatric patients withpsychiatric disorders. Am J Geriatr Psychiatry 2004;12:631–8.
44. Ebly EM, Schaefer JP, Campbell NR, Hogan DB. Folate status, vasculardisease and cognition in elderly Canadians. Age Ageing 1998;27:485–91.
45. Dufouil C, Alperovitch A, Ducros V, Tzourio C. Homocysteine, whitematter hyperintensities, and cognition in healthy elderly people. AnnNeurol 2003;53:214–21.
46. Kalmijn S, Launer LJ, Lindemans J, Bots ML, Hofman A, Breteler MM.Total homocysteine and cognitive decline in a community-based sampleof elderly subjects: the Rotterdam Study. Am J Epidemiol 1999;150:283–9.
47. Prins ND, Den Heijer T, Hofman A, et al. Homocysteine and cognitivefunction in the elderly: the Rotterdam Scan Study. Neurology 2002;59:1375–80.
48. Wang HX, Wahlin A, Basun H, Fastbom J, Winblad B, Fratiglioni L.Vitamin B(12) and folate in relation to the development of Alzheimer’sdisease. Neurology 2001;56:1188–94.
49. Seshadri S, Beiser A, Selhub J, et al. Plasma homocysteine as a risk factorfor dementia and Alzheimer’s disease. N Engl J Med 2002;346:476–83.
50. Beal MF, Kowall NW, Swartz KJ, Ferrante RJ. Homocysteic acid lesionsin rat striatum spare somatostatin-neuropeptide Y (NADPH-diaphorase)neurons. Neurosci Lett 1990;108:36–42.
51. Beal MF, Swartz KJ, Finn SF, Mazurek MF, Kowall NW. Neurochem-ical characterization of excitotoxin lesions in the cerebral cortex. J Neu-rosci 1991;11:147–58.
52. Fassbender K, Mielke O, Bertsch T, Nafe B, Froeschen S, Hennerici M.Homocysteine in cerebral macroangiography and microangiopathy.Lancet 1999;353:1586–7.
53. Lipton SA, Kim WK, Choi YB, et al. Neurotoxicity associated with dualactions of homocysteine at the N-methyl-D-aspartate receptor. Proc NatlAcad Sci U S A 1997;94:5923–8.
54. Yoo JH, Chung CS, Kang SS. Relation of plasma homocyst(e)ine tocerebral infarction and cerebral atherosclerosis. Stroke 1998;29:2478–83.
55. Brattstrom L, Lindgren A, Israelsson B, et al. Hyperhomocysteinaemiain stroke: prevalence, cause, and relationships to type of stroke andstroke risk factors. Eur J Clin Invest 1992;22:214–21.
56. Giles WH, Croft JB, Greenlund KJ, Ford ES, Kittner SJ. Total homo-cyst(e)ine concentration and the likelihood of nonfatal stroke: resultsfrom the Third National Health and Nutrition Examination Survey,1988–1994. Stroke 1998;29:2473–7.
57. Parnetti L, Bottiglieri T, Lowenthal D. Role of homocysteine in age-related vascular and non-vascular diseases. Aging (Milano) 1997;9:241–57.
58. Ho PI, Ortiz D, Rogers E, Shea TB. Multiple aspects of homocysteineneurotoxicity: glutamate excitotoxicity, kinase hyperactivation andDNA damage. J Neurosci Res 2002;70:694–702.
59. James SJ, Melnyk S, Pogribna M, Pogribny IP, Caudill MA. Elevation inS-adenosylhomocysteine and DNA hypomethylation: potential epige-netic mechanism for homocysteine-related pathology. J Nutr 2002;132:2361S–6S.
60. Bottiglieri T, Crellin RF, Reynolds EH. Folate and neuropsychiatry. In:Bailey LB, ed. Folate in health and disease. New York, NY: MarcelDekker, 1995:435–62.
61. Alpert JE, Fava M. Nutrition and depression: the role of folate. Nutr Rev1997;55:145–9.
62. Bailey LB, Gregory JF. Folate metabolism and requirements. J Nutr1999;129:779–82.
63. Mischoulon D. The role of folate in major depression: mechanisms andclinical implications. Am Soc Clin Psychopharmacol Prog Notes 1996;7:4–5.
64. Kruman II, Kumaravel TS, Lohani A, et al. Folic acid deficiency andhomocysteine impair DNA repair in hippocampal neurons and sensitizethem to amyloid toxicity in experimental models of Alzheimer’s disease.J Neurosci 2002;22:1752–62.
B VITAMINS, HOMOCYSTEINE, AND COGNITIVE DECLINE 635
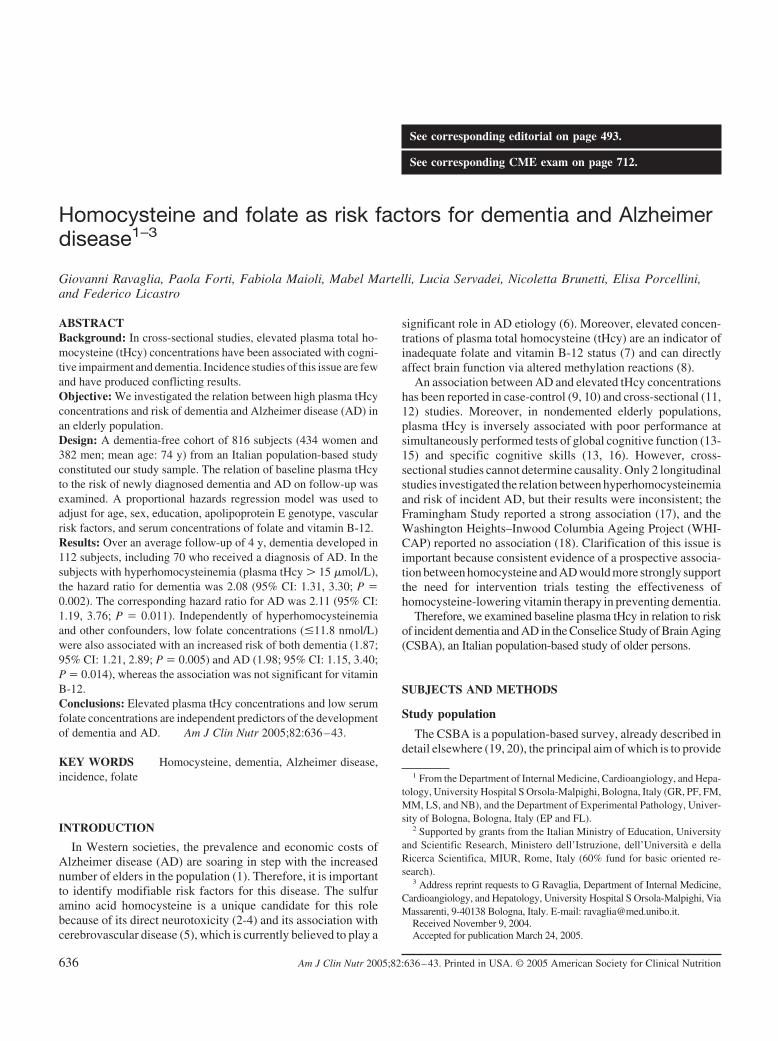
See corresponding editorial on page 493.
See corresponding CME exam on page 712.
Homocysteine and folate as risk factors for dementia and Alzheimerdisease1–3
Giovanni Ravaglia, Paola Forti, Fabiola Maioli, Mabel Martelli, Lucia Servadei, Nicoletta Brunetti, Elisa Porcellini,and Federico Licastro
ABSTRACTBackground: In cross-sectional studies, elevated plasma total ho-mocysteine (tHcy) concentrations have been associated with cogni-tive impairment and dementia. Incidence studies of this issue are fewand have produced conflicting results.Objective: We investigated the relation between high plasma tHcyconcentrations and risk of dementia and Alzheimer disease (AD) inan elderly population.Design: A dementia-free cohort of 816 subjects (434 women and382 men; mean age: 74 y) from an Italian population-based studyconstituted our study sample. The relation of baseline plasma tHcyto the risk of newly diagnosed dementia and AD on follow-up wasexamined. A proportional hazards regression model was used toadjust for age, sex, education, apolipoprotein E genotype, vascularrisk factors, and serum concentrations of folate and vitamin B-12.Results: Over an average follow-up of 4 y, dementia developed in112 subjects, including 70 who received a diagnosis of AD. In thesubjects with hyperhomocysteinemia (plasma tHcy � 15 �mol/L),the hazard ratio for dementia was 2.08 (95% CI: 1.31, 3.30; P �0.002). The corresponding hazard ratio for AD was 2.11 (95% CI:1.19, 3.76; P � 0.011). Independently of hyperhomocysteinemiaand other confounders, low folate concentrations (�11.8 nmol/L)were also associated with an increased risk of both dementia (1.87;95% CI: 1.21, 2.89; P � 0.005) and AD (1.98; 95% CI: 1.15, 3.40;P � 0.014), whereas the association was not significant for vitaminB-12.Conclusions: Elevated plasma tHcy concentrations and low serumfolate concentrations are independent predictors of the developmentof dementia and AD. Am J Clin Nutr 2005;82:636–43.
KEY WORDS Homocysteine, dementia, Alzheimer disease,incidence, folate
INTRODUCTION
In Western societies, the prevalence and economic costs ofAlzheimer disease (AD) are soaring in step with the increasednumber of elders in the population (1). Therefore, it is importantto identify modifiable risk factors for this disease. The sulfuramino acid homocysteine is a unique candidate for this rolebecause of its direct neurotoxicity (2-4) and its association withcerebrovascular disease (5), which is currently believed to play a
significant role in AD etiology (6). Moreover, elevated concen-trations of plasma total homocysteine (tHcy) are an indicator ofinadequate folate and vitamin B-12 status (7) and can directlyaffect brain function via altered methylation reactions (8).
An association between AD and elevated tHcy concentrationshas been reported in case-control (9, 10) and cross-sectional (11,12) studies. Moreover, in nondemented elderly populations,plasma tHcy is inversely associated with poor performance atsimultaneously performed tests of global cognitive function (13-15) and specific cognitive skills (13, 16). However, cross-sectional studies cannot determine causality. Only 2 longitudinalstudies investigated the relation between hyperhomocysteinemiaand risk of incident AD, but their results were inconsistent; theFramingham Study reported a strong association (17), and theWashington Heights–Inwood Columbia Ageing Project (WHI-CAP) reported no association (18). Clarification of this issue isimportant because consistent evidence of a prospective associa-tion between homocysteine and AD would more strongly supportthe need for intervention trials testing the effectiveness ofhomocysteine-lowering vitamin therapy in preventing dementia.
Therefore, we examined baseline plasma tHcy in relation to riskof incident dementia and AD in the Conselice Study of Brain Aging(CSBA), an Italian population-based study of older persons.
SUBJECTS AND METHODS
Study population
The CSBA is a population-based survey, already described indetail elsewhere (19, 20), the principal aim of which is to provide
1 From the Department of Internal Medicine, Cardioangiology, and Hepa-tology, University Hospital S Orsola-Malpighi, Bologna, Italy (GR, PF, FM,MM, LS, and NB), and the Department of Experimental Pathology, Univer-sity of Bologna, Bologna, Italy (EP and FL).
2 Supported by grants from the Italian Ministry of Education, Universityand Scientific Research, Ministero dell’Istruzione, dell’Universita e dellaRicerca Scientifica, MIUR, Rome, Italy (60% fund for basic oriented re-search).
3 Address reprint requests to G Ravaglia, Department of Internal Medicine,Cardioangiology, and Hepatology, University Hospital S Orsola-Malpighi, ViaMassarenti, 9-40138 Bologna, Italy. E-mail: [email protected].
Received November 9, 2004.Accepted for publication March 24, 2005.
636 Am J Clin Nutr 2005;82:636–43. Printed in USA. © 2005 American Society for Clinical Nutrition
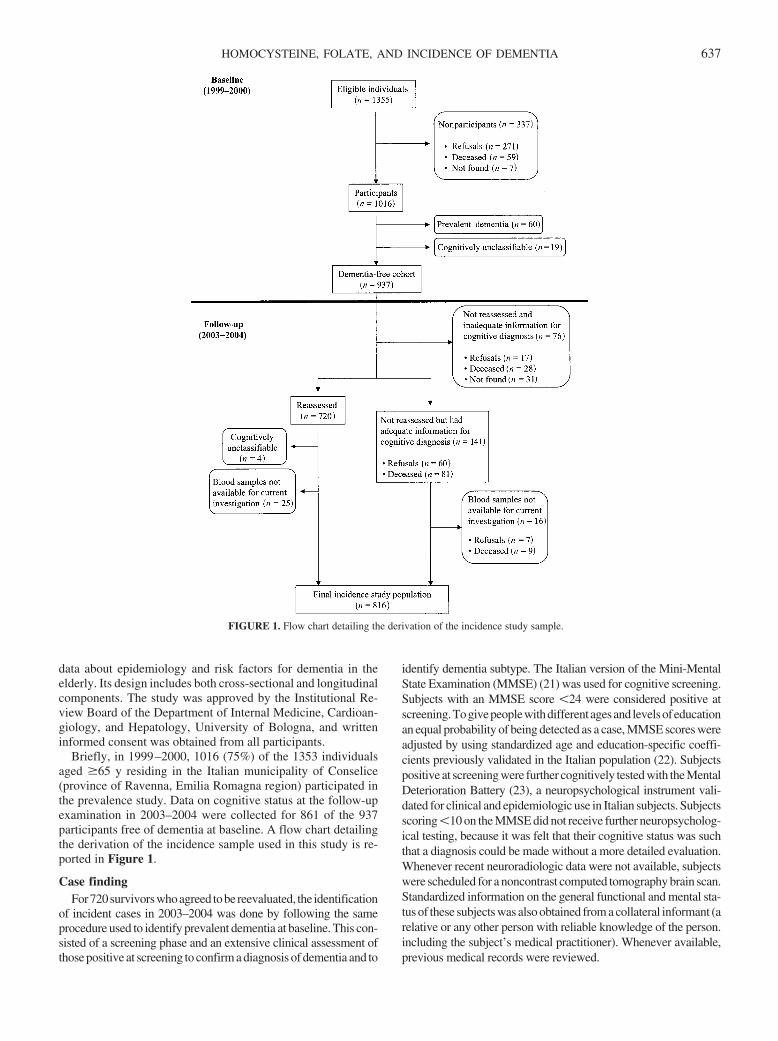
data about epidemiology and risk factors for dementia in theelderly. Its design includes both cross-sectional and longitudinalcomponents. The study was approved by the Institutional Re-view Board of the Department of Internal Medicine, Cardioan-giology, and Hepatology, University of Bologna, and writteninformed consent was obtained from all participants.
Briefly, in 1999–2000, 1016 (75%) of the 1353 individualsaged �65 y residing in the Italian municipality of Conselice(province of Ravenna, Emilia Romagna region) participated inthe prevalence study. Data on cognitive status at the follow-upexamination in 2003–2004 were collected for 861 of the 937participants free of dementia at baseline. A flow chart detailingthe derivation of the incidence sample used in this study is re-ported in Figure 1.
Case findingFor720survivorswhoagreed tobereevaluated, the identification
of incident cases in 2003–2004 was done by following the sameprocedure used to identify prevalent dementia at baseline. This con-sisted of a screening phase and an extensive clinical assessment ofthose positive at screening to confirm a diagnosis of dementia and to
identify dementia subtype. The Italian version of the Mini-MentalState Examination (MMSE) (21) was used for cognitive screening.Subjects with an MMSE score �24 were considered positive atscreening.Togivepeoplewithdifferentagesandlevelsofeducationan equal probability of being detected as a case, MMSE scores wereadjusted by using standardized age and education-specific coeffi-cients previously validated in the Italian population (22). Subjectspositive at screening were further cognitively tested with the MentalDeterioration Battery (23), a neuropsychological instrument vali-dated for clinical and epidemiologic use in Italian subjects. Subjectsscoring �10 on the MMSE did not receive further neuropsycholog-ical testing, because it was felt that their cognitive status was suchthat a diagnosis could be made without a more detailed evaluation.Whenever recent neuroradiologic data were not available, subjectswere scheduled for a noncontrast computed tomography brain scan.Standardized information on the general functional and mental sta-tus of these subjects was also obtained from a collateral informant (arelative or any other person with reliable knowledge of the person.including the subject’s medical practitioner). Whenever available,previous medical records were reviewed.
FIGURE 1. Flow chart detailing the derivation of the incidence study sample.
HOMOCYSTEINE, FOLATE, AND INCIDENCE OF DEMENTIA 637
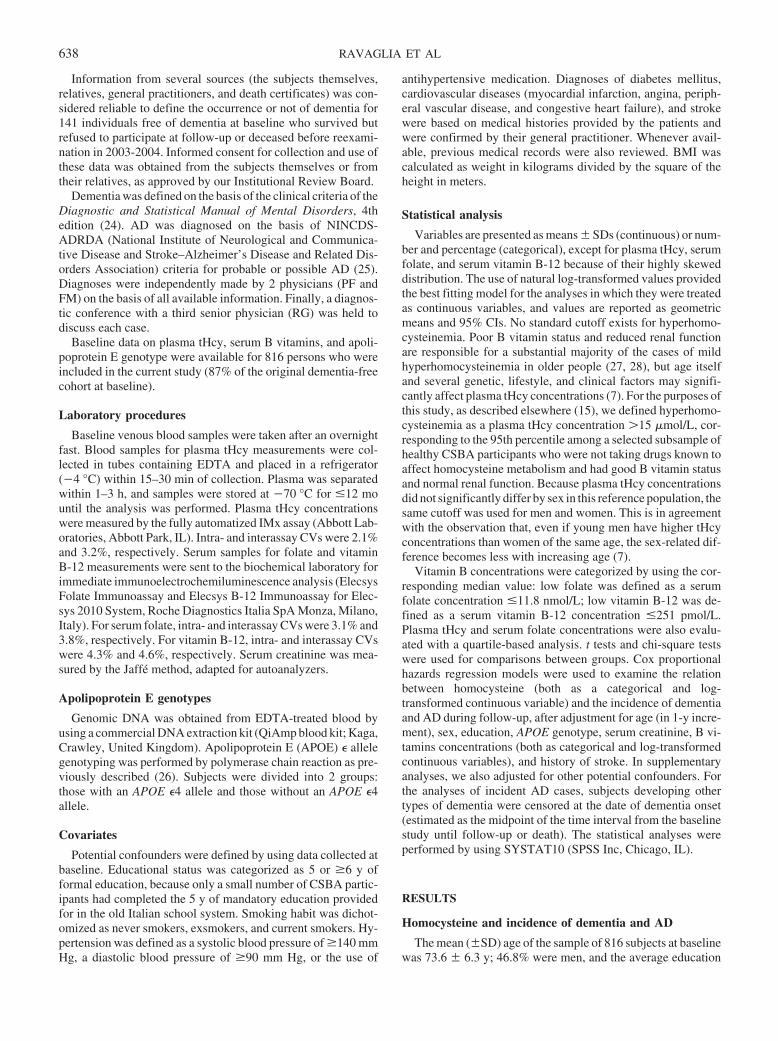
Information from several sources (the subjects themselves,relatives, general practitioners, and death certificates) was con-sidered reliable to define the occurrence or not of dementia for141 individuals free of dementia at baseline who survived butrefused to participate at follow-up or deceased before reexami-nation in 2003-2004. Informed consent for collection and use ofthese data was obtained from the subjects themselves or fromtheir relatives, as approved by our Institutional Review Board.
Dementia was defined on the basis of the clinical criteria of theDiagnostic and Statistical Manual of Mental Disorders, 4thedition (24). AD was diagnosed on the basis of NINCDS-ADRDA (National Institute of Neurological and Communica-tive Disease and Stroke–Alzheimer’s Disease and Related Dis-orders Association) criteria for probable or possible AD (25).Diagnoses were independently made by 2 physicians (PF andFM) on the basis of all available information. Finally, a diagnos-tic conference with a third senior physician (RG) was held todiscuss each case.
Baseline data on plasma tHcy, serum B vitamins, and apoli-poprotein E genotype were available for 816 persons who wereincluded in the current study (87% of the original dementia-freecohort at baseline).
Laboratory procedures
Baseline venous blood samples were taken after an overnightfast. Blood samples for plasma tHcy measurements were col-lected in tubes containing EDTA and placed in a refrigerator(�4 °C) within 15–30 min of collection. Plasma was separatedwithin 1–3 h, and samples were stored at �70 °C for �12 mountil the analysis was performed. Plasma tHcy concentrationswere measured by the fully automatized IMx assay (Abbott Lab-oratories, Abbott Park, IL). Intra- and interassay CVs were 2.1%and 3.2%, respectively. Serum samples for folate and vitaminB-12 measurements were sent to the biochemical laboratory forimmediate immunoelectrochemiluminescence analysis (ElecsysFolate Immunoassay and Elecsys B-12 Immunoassay for Elec-sys 2010 System, Roche Diagnostics Italia SpA Monza, Milano,Italy). For serum folate, intra- and interassay CVs were 3.1% and3.8%, respectively. For vitamin B-12, intra- and interassay CVswere 4.3% and 4.6%, respectively. Serum creatinine was mea-sured by the Jaffé method, adapted for autoanalyzers.
Apolipoprotein E genotypes
Genomic DNA was obtained from EDTA-treated blood byusing a commercial DNA extraction kit (QiAmp blood kit; Kaga,Crawley, United Kingdom). Apolipoprotein E (APOE) � allelegenotyping was performed by polymerase chain reaction as pre-viously described (26). Subjects were divided into 2 groups:those with an APOE �4 allele and those without an APOE �4allele.
Covariates
Potential confounders were defined by using data collected atbaseline. Educational status was categorized as 5 or �6 y offormal education, because only a small number of CSBA partic-ipants had completed the 5 y of mandatory education providedfor in the old Italian school system. Smoking habit was dichot-omized as never smokers, exsmokers, and current smokers. Hy-pertension was defined as a systolic blood pressure of �140 mmHg, a diastolic blood pressure of �90 mm Hg, or the use of
antihypertensive medication. Diagnoses of diabetes mellitus,cardiovascular diseases (myocardial infarction, angina, periph-eral vascular disease, and congestive heart failure), and strokewere based on medical histories provided by the patients andwere confirmed by their general practitioner. Whenever avail-able, previous medical records were also reviewed. BMI wascalculated as weight in kilograms divided by the square of theheight in meters.
Statistical analysis
Variables are presented as means � SDs (continuous) or num-ber and percentage (categorical), except for plasma tHcy, serumfolate, and serum vitamin B-12 because of their highly skeweddistribution. The use of natural log-transformed values providedthe best fitting model for the analyses in which they were treatedas continuous variables, and values are reported as geometricmeans and 95% CIs. No standard cutoff exists for hyperhomo-cysteinemia. Poor B vitamin status and reduced renal functionare responsible for a substantial majority of the cases of mildhyperhomocysteinemia in older people (27, 28), but age itselfand several genetic, lifestyle, and clinical factors may signifi-cantly affect plasma tHcy concentrations (7). For the purposes ofthis study, as described elsewhere (15), we defined hyperhomo-cysteinemia as a plasma tHcy concentration �15 �mol/L, cor-responding to the 95th percentile among a selected subsample ofhealthy CSBA participants who were not taking drugs known toaffect homocysteine metabolism and had good B vitamin statusand normal renal function. Because plasma tHcy concentrationsdid not significantly differ by sex in this reference population, thesame cutoff was used for men and women. This is in agreementwith the observation that, even if young men have higher tHcyconcentrations than women of the same age, the sex-related dif-ference becomes less with increasing age (7).
Vitamin B concentrations were categorized by using the cor-responding median value: low folate was defined as a serumfolate concentration �11.8 nmol/L; low vitamin B-12 was de-fined as a serum vitamin B-12 concentration �251 pmol/L.Plasma tHcy and serum folate concentrations were also evalu-ated with a quartile-based analysis. t tests and chi-square testswere used for comparisons between groups. Cox proportionalhazards regression models were used to examine the relationbetween homocysteine (both as a categorical and log-transformed continuous variable) and the incidence of dementiaand AD during follow-up, after adjustment for age (in 1-y incre-ment), sex, education, APOE genotype, serum creatinine, B vi-tamins concentrations (both as categorical and log-transformedcontinuous variables), and history of stroke. In supplementaryanalyses, we also adjusted for other potential confounders. Forthe analyses of incident AD cases, subjects developing othertypes of dementia were censored at the date of dementia onset(estimated as the midpoint of the time interval from the baselinestudy until follow-up or death). The statistical analyses wereperformed by using SYSTAT10 (SPSS Inc, Chicago, IL).
RESULTS
Homocysteine and incidence of dementia and AD
The mean (�SD) age of the sample of 816 subjects at baselinewas 73.6 � 6.3 y; 46.8% were men, and the average education
638 RAVAGLIA ET AL
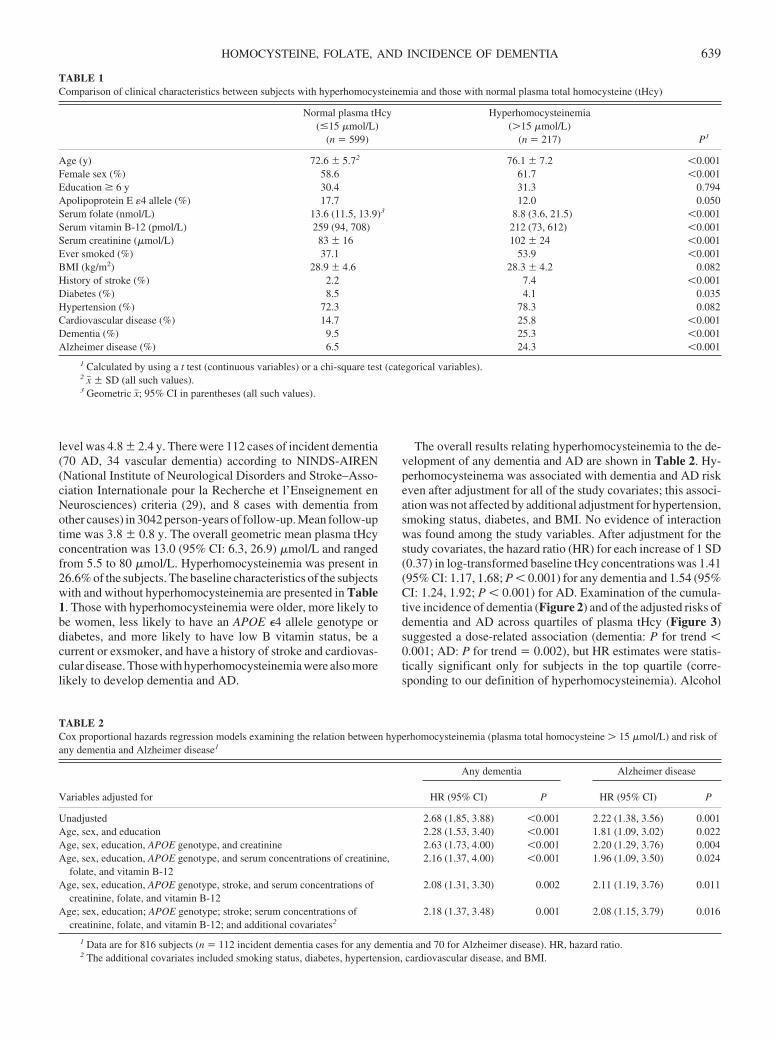
level was 4.8 � 2.4 y. There were 112 cases of incident dementia(70 AD, 34 vascular dementia) according to NINDS-AIREN(National Institute of Neurological Disorders and Stroke–Asso-ciation Internationale pour la Recherche et l’Enseignement enNeurosciences) criteria (29), and 8 cases with dementia fromother causes) in 3042 person-years of follow-up. Mean follow-uptime was 3.8 � 0.8 y. The overall geometric mean plasma tHcyconcentration was 13.0 (95% CI: 6.3, 26.9) �mol/L and rangedfrom 5.5 to 80 �mol/L. Hyperhomocysteinemia was present in26.6% of the subjects. The baseline characteristics of the subjectswith and without hyperhomocysteinemia are presented in Table1. Those with hyperhomocysteinemia were older, more likely tobe women, less likely to have an APOE �4 allele genotype ordiabetes, and more likely to have low B vitamin status, be acurrent or exsmoker, and have a history of stroke and cardiovas-cular disease. Those with hyperhomocysteinemia were also morelikely to develop dementia and AD.
The overall results relating hyperhomocysteinemia to the de-velopment of any dementia and AD are shown in Table 2. Hy-perhomocysteinema was associated with dementia and AD riskeven after adjustment for all of the study covariates; this associ-ation was not affected by additional adjustment for hypertension,smoking status, diabetes, and BMI. No evidence of interactionwas found among the study variables. After adjustment for thestudy covariates, the hazard ratio (HR) for each increase of 1 SD(0.37) in log-transformed baseline tHcy concentrations was 1.41(95% CI: 1.17, 1.68; P � 0.001) for any dementia and 1.54 (95%CI: 1.24, 1.92; P � 0.001) for AD. Examination of the cumula-tive incidence of dementia (Figure 2) and of the adjusted risks ofdementia and AD across quartiles of plasma tHcy (Figure 3)suggested a dose-related association (dementia: P for trend �0.001; AD: P for trend � 0.002), but HR estimates were statis-tically significant only for subjects in the top quartile (corre-sponding to our definition of hyperhomocysteinemia). Alcohol
TABLE 1Comparison of clinical characteristics between subjects with hyperhomocysteinemia and those with normal plasma total homocysteine (tHcy)
Normal plasma tHcy(�15 �mol/L)
(n � 599)
Hyperhomocysteinemia(�15 �mol/L)
(n � 217) P1
Age (y) 72.6 � 5.72 76.1 � 7.2 �0.001Female sex (%) 58.6 61.7 �0.001Education � 6 y 30.4 31.3 0.794Apolipoprotein E �4 allele (%) 17.7 12.0 0.050Serum folate (nmol/L) 13.6 (11.5, 13.9)3 8.8 (3.6, 21.5) �0.001Serum vitamin B-12 (pmol/L) 259 (94, 708) 212 (73, 612) �0.001Serum creatinine (�mol/L) 83 � 16 102 � 24 �0.001Ever smoked (%) 37.1 53.9 �0.001BMI (kg/m2) 28.9 � 4.6 28.3 � 4.2 0.082History of stroke (%) 2.2 7.4 �0.001Diabetes (%) 8.5 4.1 0.035Hypertension (%) 72.3 78.3 0.082Cardiovascular disease (%) 14.7 25.8 �0.001Dementia (%) 9.5 25.3 �0.001Alzheimer disease (%) 6.5 24.3 �0.001
1 Calculated by using a t test (continuous variables) or a chi-square test (categorical variables).2 x� � SD (all such values).3 Geometric x�; 95% CI in parentheses (all such values).
TABLE 2Cox proportional hazards regression models examining the relation between hyperhomocysteinemia (plasma total homocysteine � 15 �mol/L) and risk ofany dementia and Alzheimer disease1
Variables adjusted for
Any dementia Alzheimer disease
HR (95% CI) P HR (95% CI) P
Unadjusted 2.68 (1.85, 3.88) �0.001 2.22 (1.38, 3.56) 0.001Age, sex, and education 2.28 (1.53, 3.40) �0.001 1.81 (1.09, 3.02) 0.022Age, sex, education, APOE genotype, and creatinine 2.63 (1.73, 4.00) �0.001 2.20 (1.29, 3.76) 0.004Age, sex, education, APOE genotype, and serum concentrations of creatinine,
folate, and vitamin B-122.16 (1.37, 4.00) �0.001 1.96 (1.09, 3.50) 0.024
Age, sex, education, APOE genotype, stroke, and serum concentrations ofcreatinine, folate, and vitamin B-12
2.08 (1.31, 3.30) 0.002 2.11 (1.19, 3.76) 0.011
Age; sex, education; APOE genotype; stroke; serum concentrations ofcreatinine, folate, and vitamin B-12; and additional covariates2
2.18 (1.37, 3.48) 0.001 2.08 (1.15, 3.79) 0.016
1 Data are for 816 subjects (n � 112 incident dementia cases for any dementia and 70 for Alzheimer disease). HR, hazard ratio.2 The additional covariates included smoking status, diabetes, hypertension, cardiovascular disease, and BMI.
HOMOCYSTEINE, FOLATE, AND INCIDENCE OF DEMENTIA 639
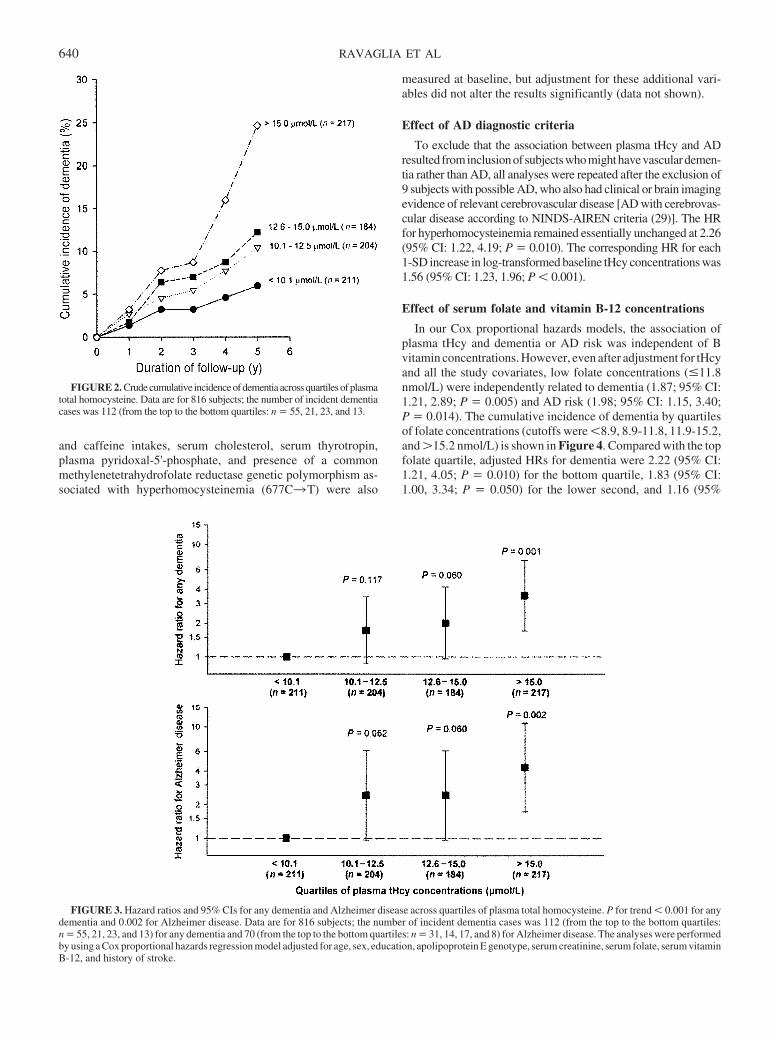
and caffeine intakes, serum cholesterol, serum thyrotropin,plasma pyridoxal-5'-phosphate, and presence of a commonmethylenetetrahydrofolate reductase genetic polymorphism as-sociated with hyperhomocysteinemia (677C3T) were also
measured at baseline, but adjustment for these additional vari-ables did not alter the results significantly (data not shown).
Effect of AD diagnostic criteria
To exclude that the association between plasma tHcy and ADresulted frominclusionof subjectswhomighthavevasculardemen-tia rather than AD, all analyses were repeated after the exclusion of9 subjects with possible AD, who also had clinical or brain imagingevidence of relevant cerebrovascular disease [AD with cerebrovas-cular disease according to NINDS-AIREN criteria (29)]. The HRfor hyperhomocysteinemia remained essentially unchanged at 2.26(95% CI: 1.22, 4.19; P � 0.010). The corresponding HR for each1-SD increase in log-transformed baseline tHcy concentrations was1.56 (95% CI: 1.23, 1.96; P � 0.001).
Effect of serum folate and vitamin B-12 concentrations
In our Cox proportional hazards models, the association ofplasma tHcy and dementia or AD risk was independent of Bvitamin concentrations. However, even after adjustment for tHcyand all the study covariates, low folate concentrations (�11.8nmol/L) were independently related to dementia (1.87; 95% CI:1.21, 2.89; P � 0.005) and AD risk (1.98; 95% CI: 1.15, 3.40;P � 0.014). The cumulative incidence of dementia by quartilesof folate concentrations (cutoffs were �8.9, 8.9-11.8, 11.9-15.2,and �15.2 nmol/L) is shown in Figure 4. Compared with the topfolate quartile, adjusted HRs for dementia were 2.22 (95% CI:1.21, 4.05; P � 0.010) for the bottom quartile, 1.83 (95% CI:1.00, 3.34; P � 0.050) for the lower second, and 1.16 (95%
FIGURE 2. Crudecumulative incidenceofdementiaacrossquartilesofplasmatotal homocysteine. Data are for 816 subjects; the number of incident dementiacases was 112 (from the top to the bottom quartiles: n � 55, 21, 23, and 13.
FIGURE 3. Hazard ratios and 95% CIs for any dementia and Alzheimer disease across quartiles of plasma total homocysteine. P for trend � 0.001 for anydementia and 0.002 for Alzheimer disease. Data are for 816 subjects; the number of incident dementia cases was 112 (from the top to the bottom quartiles:n � 55, 21, 23, and 13) for any dementia and 70 (from the top to the bottom quartiles: n � 31, 14, 17, and 8) for Alzheimer disease. The analyses were performedby using a Cox proportional hazards regression model adjusted for age, sex, education, apolipoprotein E genotype, serum creatinine, serum folate, serum vitaminB-12, and history of stroke.
640 RAVAGLIA ET AL
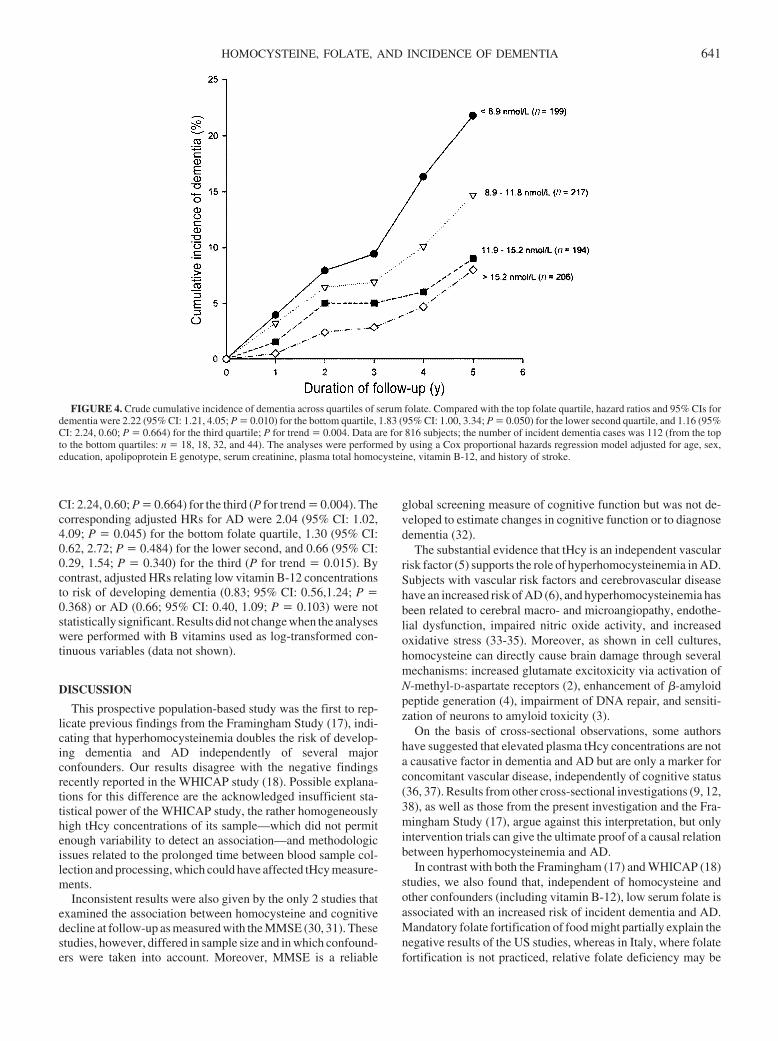
CI: 2.24, 0.60; P � 0.664) for the third (P for trend � 0.004). Thecorresponding adjusted HRs for AD were 2.04 (95% CI: 1.02,4.09; P � 0.045) for the bottom folate quartile, 1.30 (95% CI:0.62, 2.72; P � 0.484) for the lower second, and 0.66 (95% CI:0.29, 1.54; P � 0.340) for the third (P for trend � 0.015). Bycontrast, adjusted HRs relating low vitamin B-12 concentrationsto risk of developing dementia (0.83; 95% CI: 0.56,1.24; P �0.368) or AD (0.66; 95% CI: 0.40, 1.09; P � 0.103) were notstatistically significant. Results did not change when the analyseswere performed with B vitamins used as log-transformed con-tinuous variables (data not shown).
DISCUSSION
This prospective population-based study was the first to rep-licate previous findings from the Framingham Study (17), indi-cating that hyperhomocysteinemia doubles the risk of develop-ing dementia and AD independently of several majorconfounders. Our results disagree with the negative findingsrecently reported in the WHICAP study (18). Possible explana-tions for this difference are the acknowledged insufficient sta-tistical power of the WHICAP study, the rather homogeneouslyhigh tHcy concentrations of its sample—which did not permitenough variability to detect an association—and methodologicissues related to the prolonged time between blood sample col-lection and processing, which could have affected tHcy measure-ments.
Inconsistent results were also given by the only 2 studies thatexamined the association between homocysteine and cognitivedecline at follow-up as measured with the MMSE (30, 31). Thesestudies, however, differed in sample size and in which confound-ers were taken into account. Moreover, MMSE is a reliable
global screening measure of cognitive function but was not de-veloped to estimate changes in cognitive function or to diagnosedementia (32).
The substantial evidence that tHcy is an independent vascularrisk factor (5) supports the role of hyperhomocysteinemia in AD.Subjects with vascular risk factors and cerebrovascular diseasehave an increased risk of AD (6), and hyperhomocysteinemia hasbeen related to cerebral macro- and microangiopathy, endothe-lial dysfunction, impaired nitric oxide activity, and increasedoxidative stress (33-35). Moreover, as shown in cell cultures,homocysteine can directly cause brain damage through severalmechanisms: increased glutamate excitoxicity via activation ofN-methyl-D-aspartate receptors (2), enhancement of �-amyloidpeptide generation (4), impairment of DNA repair, and sensiti-zation of neurons to amyloid toxicity (3).
On the basis of cross-sectional observations, some authorshave suggested that elevated plasma tHcy concentrations are nota causative factor in dementia and AD but are only a marker forconcomitant vascular disease, independently of cognitive status(36, 37). Results from other cross-sectional investigations (9, 12,38), as well as those from the present investigation and the Fra-mingham Study (17), argue against this interpretation, but onlyintervention trials can give the ultimate proof of a causal relationbetween hyperhomocysteinemia and AD.
In contrast with both the Framingham (17) and WHICAP (18)studies, we also found that, independent of homocysteine andother confounders (including vitamin B-12), low serum folate isassociated with an increased risk of incident dementia and AD.Mandatory folate fortification of food might partially explain thenegative results of the US studies, whereas in Italy, where folatefortification is not practiced, relative folate deficiency may be
FIGURE 4. Crude cumulative incidence of dementia across quartiles of serum folate. Compared with the top folate quartile, hazard ratios and 95% CIs fordementia were 2.22 (95% CI: 1.21, 4.05; P � 0.010) for the bottom quartile, 1.83 (95% CI: 1.00, 3.34; P � 0.050) for the lower second quartile, and 1.16 (95%CI: 2.24, 0.60; P � 0.664) for the third quartile; P for trend � 0.004. Data are for 816 subjects; the number of incident dementia cases was 112 (from the topto the bottom quartiles: n � 18, 18, 32, and 44). The analyses were performed by using a Cox proportional hazards regression model adjusted for age, sex,education, apolipoprotein E genotype, serum creatinine, plasma total homocysteine, vitamin B-12, and history of stroke.
HOMOCYSTEINE, FOLATE, AND INCIDENCE OF DEMENTIA 641
endemic among the elderly population. Nondemented patientswith poor cognitive performance and AD patients often exhibitpoor folate status (reviewed in 8), but only one study specificallyexamined B vitamins in relation to incident dementia. In a se-lected sample of nondemented Swedish elderly participants inthe Kungsholmen Study, low serum folate and vitamin B-12were predictive of AD at 3 y of follow-up (39). The sample,however, was small (370 subjects), and a clear association wasdetected only when both vitamins were taken into account.
Biologic explanatory mechanisms relating folate deficiency todementia include impaired methylation reactions in the centralnervous system, with a consequent insufficient supply of methylgroups, which are required for the synthesis of myelin, neuro-transmitters, membrane phospholipids, and DNA (8). However,because of the study design and the relatively short follow-uptime, we cannot definitely establish whether the independentassociation between low folate and dementia risk indicates anactual effect of folate status on cognitive function or, on thecontrary, that subtle functional alterations may affect the dietaryintake of folate in the early preclinical stages of dementia.
This study has several strengths. The CSBA is a prospectivepopulation study specifically designed for the diagnosis of de-mentia and AD, follow-up was relatively long, and complete dataon laboratory and cognitive status at follow-up was available for87% of the cohort that was dementia-free at baseline.
This study also had several limitations. First, the lack of stan-dardized cutoffs for hyperhomocysteinemia forced us to calcu-late our own reference intervals using a subsample of presumedhealthy CSBA participants (15) that was not large enough toestablish reliable age- and sex-specific limits. However, both ageand sex were taken into account into multivariable analyses, andresults for hyperhomocysteinemia were similar to those obtainedwhen considering tHcy as a continuous variable. Therefore, it isunlikely that our results were biased by our choice of cutoff forhyperhomocysteinemia. Other limitations include the singletime measurement of tHcy and the evaluation of B vitamin statusas serum concentrations. Moreover, although B vitamin supple-mentation is recognized as the most effective means for loweringhomocysteine concentrations (40), there have been no prospec-tive trials of the effect of vitamin supplementation on the inci-dence of dementia. Therefore, our findings cannot be used as abasis for treatment recommendations. However, they emphasizethe need for clinical trials in humans to verify whether interven-tions that restore folate status and reduce plasma tHcy concen-trations can reduce the risk of dementia and AD in the Italianpopulation.
Research was facilitated by collaboration with Conselice Municipal Ad-ministration and the Local Health Unit of Ravenna, Emilia Romagna region.We are especially indebted to Edoardo Dalmonte (head physician of theDivision of Geriatric Medicine at the Ravenna Hospital), Marisa Bianchin(general manager of the Lugo Medical District), and the general practitionersof Conselice for their invaluable help in organizing the study. We also expressour sincerest gratitude to the population of Conselice for their enthusiasm andparticipation in the study.
GR was the main contributor to the study design. PF and FM contributedsubstantially to the data collection, data analysis, and preparation of themanuscript. MM, LS, and NB contributed to the data collection and inter-pretation. EP and FL contributed expert methodologic advice and edited themanuscript. None of the authors had a financial or personal interest in anyorganization sponsoring the research or advisory board affiliations.
REFERENCES1. Leifer B. Early diagnosis of Alzheimer’s disease: clinical and economic
benefits. J Am Geriatr Soc 2003;51:S281–8.2. Lipton Sa, Kim WK, Choi YB, et al. Neurotoxicity associated with dual
actions of homocysteine at the N-methyl-D-aspartate receptor. Proc NatlAcad Sci U S A 1997;94:5923–8.
3. Krugman II, Kumaravel TS, Lohani A, et al. Folic acid deficiency andhomocysteine impair DNA repair in hippocampal neurons and sensitizethem to amyloid toxicity in experimental models of Alzheimer’s disease.J Neurosci 2002;22:1752–62.
4. Sai X, Kawamura Y, Kokame K, Yamaguchi H, et al. Endoplasmicreticulum stress-inducible protein, Herp, enhances presenilin-mediatedgeneration of amyloid beta-protein. J Biol Chem 2002;277:12915–20.
5. The Homocysteine Studies Collaboration. Homocysteine and risk ofischemic heart disease and stroke. A meta-analysis. JAMA 2002;288:2015–22.
6. Kalaria R. Similarities between Alzheimer’s disease and vascular de-mentia. J Neurol Sci 2002;203–204:29–34.
7. Refsum H, Smith AD, Ueland PM, et al. Facts and recommendationsabout total homocysteine determinations: an expert opinion. Clin Chem2004;50:3–32.
8. Calvaresi E, Bryan J. B vitamins, cognition, and aging: a review. JGerontol Psychol Sci Soc Sci 2001;56:P327–39.
9. Clarke R, Smith AD, Jobst KA, Refsum H, Sutton L, Ueland PM. Folate,vitamin B12, and serum total homocysteine levels in confirmed Alzhei-mer Disease. Arch Neurol 1998;55:1449–55.
10. McCaddon A, Davies G, Hudson P, Tandy S, Cattell H. Total serumhomocysteine in senile dementia of Alzheimer type. Int J Geriatr Psy-chiatry 1998;13:235–9.
11. Lehman M, Gottfries CG, Regland B. Identification of cognitive impair-ment in the elderly: homocysteine is an early marker. Dement GeriatrCogn Disord 1999;10:12–20.
12. Quadri P, Fragiacomo C, Pezzati R, et al. Homocysteine, folate, andvitamin B12 in mild cognitive impairment, Alzheimer disease, and vas-cular dementia. Am J Clin Nutr 2004;80:114–22.
13. Prins ND, den Heijer T, Hofman A, et al. Homocysteine and cognitivefunction in the elderly. The Rotterdam Scan Study. Neurology 2002;1375–80.
14. Budge M, Johnston C, Hogervorst E, et al. Plasma total homocysteineand cognitive performance in a volunteer elderly population. Ann N YAcad Sci 2000;903:407–10.
15. Ravaglia G, Forti P, Maioli F, et al. Homocysteine and cognitive functionin healthy elderly community dwellers in Italy. Am J Clin Nutr 2003;77:668–73.
16. Riggs KM, Spiro A, Tucker K, Rush D. Relations of vitamin B-12,vitamin B-6, folate, and homocysteine to cognitive performance in theNormative Aging Study. Am J Clin Nutr 1996;63:306–14.
17. Seshadri S, Beiser A, Selhub J, et al. Plasma homocysteine as a risk factorfor dementia and Alzheimer’s disease. N Engl J Med 2002;346:476–83.
18. Luchsinger JA, Tang MX, Shea S, Miller J, Green R, Mayeux R. Plasmahomocysteine levels and risk of Alzheimer disease. Neurology 2004;62:1972–6.
19. Ravaglia G, Forti P, Maioli F, et al. Education, occupation, and preva-lence of dementia: findings from the Conselice study. Dement GeriatrCogn Disord 2002;14:90–100.
20. Ravaglia G, Forti P, Maioli F, et al. Conselice study: a population basedsurvey of brain aging in a municipality of the Emilia Romagna region(A.U.S.L. Ravenna). Design and methods Arch Gerontol Geriatr 2001;33(suppl):313–24.
21. Valente C, Maione P, Lippi A, et al. Validation of the Mini-Mental StateExamination (MMSE) as a screening instrument for dementia in anItalian population. Giorn Gerontol 1992;40:161–5.
22. Magni E, Binetti G, Bianchetti A, Rozzini R, Trabucchi M. Mini-MentalState Examination: a normative study in an Italian elderly population.Eur J Neurol 1996;3:1–5.
23. Carlesimo GA, Caltagirone C, Gainotti G. The Mental DeteriorationBattery: normative data, diagnostic reliability and qualitative analyses ofcognitive impairment. The Group for the Standardization of the MentalDeterioration Battery. Eur Neurol 1996;36:378–84.
24. American Psychiatric Association. Diagnostic and statistical manual ofmental disorders. 4th ed. Washington, DC: American Psychiatric Asso-ciation, 1994.
25. McKhann G, Drachman D, Folstein M, et al. Clinical diagnosis of Alz-heimer’s disease: report of the NINCDS-ADRDA Work Group under
642 RAVAGLIA ET AL
the auspices of Department of Health and Human Services Task Force onAlzhimer’s Disease. Neurology 1984;34:939–44.
26. Licastro F, Pedrini S, Ferri C, et al. Gene polymorphism affecting �1-antichymotrypsin and interleukin-1 plasma levels increases Alzheimer’sdisease risk. Ann Neurol 2000;48:388–91.
27. Selhub J, Jacques PF, Wilson PWF, Rush D, Rosenberg IH. Vitaminstatus and intake as primary determinants of homocysteinemia in anelderly population. JAMA 1993;270:2693–8.
28. Herrmann W, Quast S, Ullrich M, Schultze H, Bodis M, Geisel J. Hy-perhomocysteinemia in high-aged subjects: relation of B-vitamins, folicacid, renal function and the methylenetetrahydrofolate reductase muta-tion. Atherosclerosis 1999;144:91–100.
29. Roman GC, Tatemichi TK, Erkinjuntti T, et al. Vascular dementia:diagnostic criteria for research studies. Report of the NINDS-AIRENInternational Workshop. Neurology 1993;43:250–60.
30. McCaddon A, Hudson P, Davies G, Hughes A, Williams JHH, Wilkin-son C. Homocysteine and cognitive decline in healthy elderly. DementGeriatr Cogn Disord 2001;12:309–13.
31. Kalmjin S, Launer LJ, Lindemans J, Bots ML, Hofman A, BretelerMMB. Total homocysteine and cognitive decline in a community-basedsample of elderly subjects. The Rotterdam Study. Am J Epidemiol 1999;150:283–9.
32. Tombaugh TN, McIntyre NJ. The Mini-Mental State Examination: acomprehensive review. J Am Geriatr Soc 1992;40:922–35.
33. Welch GN, Loscalzo J. Homocysteine and atherothrombosis. N EnglJ Med 1998;338:1042–50.
34. Fassbender K, Mielke O, Bertsch T, Nafe B, Froschen S, Hennerici M.Homocysteine in cerebral macroangiopathy and microangiopathy. Lan-cet 1999;353:1586–7.
35. Hajjar K. Homocysteine: a sulph’rous fire. J Clin Invest 2001;107:663–4.
36. Miller JW, Green R, Mungas DM, Reed BR, Jagust WJ. Homocysteine,vitamin B6, and vascular disease in AD patients. Neurology 2002;58:1471–5.
37. Borroni B, Agosti C, Panzali AF, Di Luca M, Padovani A. Homocys-teine, vitamin B6, and vascular disease in patients with AD. Neurology2002;59:1475–6.
38. Storey SG, Suryadevara V, Aronow WS, Ahn C. Association of plasmahomocysteine in elderly persons with atherosclerotic vascular diseaseand dementia, atherosclerotic vascular disease without dementia, de-mentia without atherosclerotic vascular disease, and no dementia oratherosclerotic vascular disease. J Gerontol Med Sci 2003;58:M1135–6.
39. Wang HX, Wahlin A, Basun H, Fastbom J, Winblad B, Fratiglioni L.Vitamin B12 and folate in relation to the development of Alzheimer’sdisease. Neurology 2001;56:1188–94.
40. Malinow MR, Bostom AG, Krauss RM. Homocyst(e)ine, diet and car-diovascular diseases. A statement for healthcare professionals from theNutrition Committee, American Heart Association. Circulation 1999;99:178–82.
HOMOCYSTEINE, FOLATE, AND INCIDENCE OF DEMENTIA 643
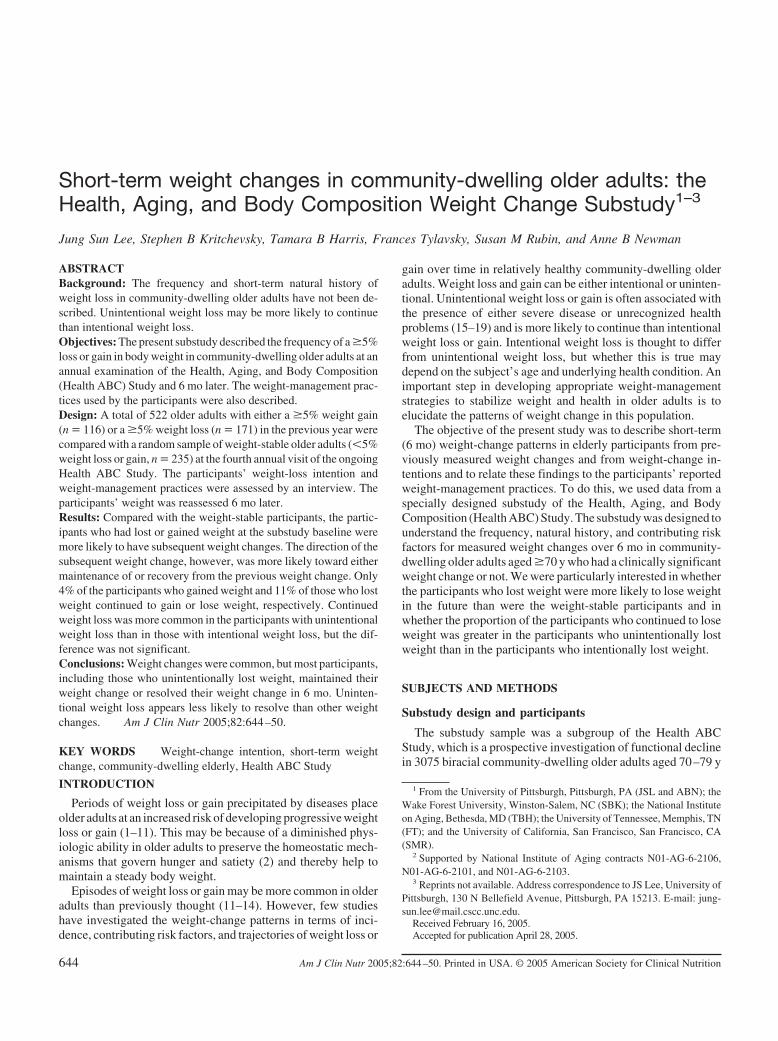
Short-term weight changes in community-dwelling older adults: theHealth, Aging, and Body Composition Weight Change Substudy1–3
Jung Sun Lee, Stephen B Kritchevsky, Tamara B Harris, Frances Tylavsky, Susan M Rubin, and Anne B Newman
ABSTRACTBackground: The frequency and short-term natural history ofweight loss in community-dwelling older adults have not been de-scribed. Unintentional weight loss may be more likely to continuethan intentional weight loss.Objectives: The present substudy described the frequency of a �5%loss or gain in body weight in community-dwelling older adults at anannual examination of the Health, Aging, and Body Composition(Health ABC) Study and 6 mo later. The weight-management prac-tices used by the participants were also described.Design: A total of 522 older adults with either a �5% weight gain(n � 116) or a �5% weight loss (n � 171) in the previous year werecompared with a random sample of weight-stable older adults (�5%weight loss or gain, n � 235) at the fourth annual visit of the ongoingHealth ABC Study. The participants’ weight-loss intention andweight-management practices were assessed by an interview. Theparticipants’ weight was reassessed 6 mo later.Results: Compared with the weight-stable participants, the partic-ipants who had lost or gained weight at the substudy baseline weremore likely to have subsequent weight changes. The direction of thesubsequent weight change, however, was more likely toward eithermaintenance of or recovery from the previous weight change. Only4% of the participants who gained weight and 11% of those who lostweight continued to gain or lose weight, respectively. Continuedweight loss was more common in the participants with unintentionalweight loss than in those with intentional weight loss, but the dif-ference was not significant.Conclusions: Weight changes were common, but most participants,including those who unintentionally lost weight, maintained theirweight change or resolved their weight change in 6 mo. Uninten-tional weight loss appears less likely to resolve than other weightchanges. Am J Clin Nutr 2005;82:644–50.
KEY WORDS Weight-change intention, short-term weightchange, community-dwelling elderly, Health ABC Study
INTRODUCTION
Periods of weight loss or gain precipitated by diseases placeolder adults at an increased risk of developing progressive weightloss or gain (1–11). This may be because of a diminished phys-iologic ability in older adults to preserve the homeostatic mech-anisms that govern hunger and satiety (2) and thereby help tomaintain a steady body weight.
Episodes of weight loss or gain may be more common in olderadults than previously thought (11–14). However, few studieshave investigated the weight-change patterns in terms of inci-dence, contributing risk factors, and trajectories of weight loss or
gain over time in relatively healthy community-dwelling olderadults. Weight loss and gain can be either intentional or uninten-tional. Unintentional weight loss or gain is often associated withthe presence of either severe disease or unrecognized healthproblems (15–19) and is more likely to continue than intentionalweight loss or gain. Intentional weight loss is thought to differfrom unintentional weight loss, but whether this is true maydepend on the subject’s age and underlying health condition. Animportant step in developing appropriate weight-managementstrategies to stabilize weight and health in older adults is toelucidate the patterns of weight change in this population.
The objective of the present study was to describe short-term(6 mo) weight-change patterns in elderly participants from pre-viously measured weight changes and from weight-change in-tentions and to relate these findings to the participants’ reportedweight-management practices. To do this, we used data from aspecially designed substudy of the Health, Aging, and BodyComposition (Health ABC) Study. The substudy was designed tounderstand the frequency, natural history, and contributing riskfactors for measured weight changes over 6 mo in community-dwelling older adults aged �70 y who had a clinically significantweight change or not. We were particularly interested in whetherthe participants who lost weight were more likely to lose weightin the future than were the weight-stable participants and inwhether the proportion of the participants who continued to loseweight was greater in the participants who unintentionally lostweight than in the participants who intentionally lost weight.
SUBJECTS AND METHODS
Substudy design and participants
The substudy sample was a subgroup of the Health ABCStudy, which is a prospective investigation of functional declinein 3075 biracial community-dwelling older adults aged 70–79 y
1 From the University of Pittsburgh, Pittsburgh, PA (JSL and ABN); theWake Forest University, Winston-Salem, NC (SBK); the National Instituteon Aging, Bethesda, MD (TBH); the University of Tennessee, Memphis, TN(FT); and the University of California, San Francisco, San Francisco, CA(SMR).
2 Supported by National Institute of Aging contracts N01-AG-6-2106,N01-AG-6-2101, and N01-AG-6-2103.
3 Reprints not available. Address correspondence to JS Lee, University ofPittsburgh, 130 N Bellefield Avenue, Pittsburgh, PA 15213. E-mail: [email protected].
Received February 16, 2005.Accepted for publication April 28, 2005.
644 Am J Clin Nutr 2005;82:644–50. Printed in USA. © 2005 American Society for Clinical Nutrition
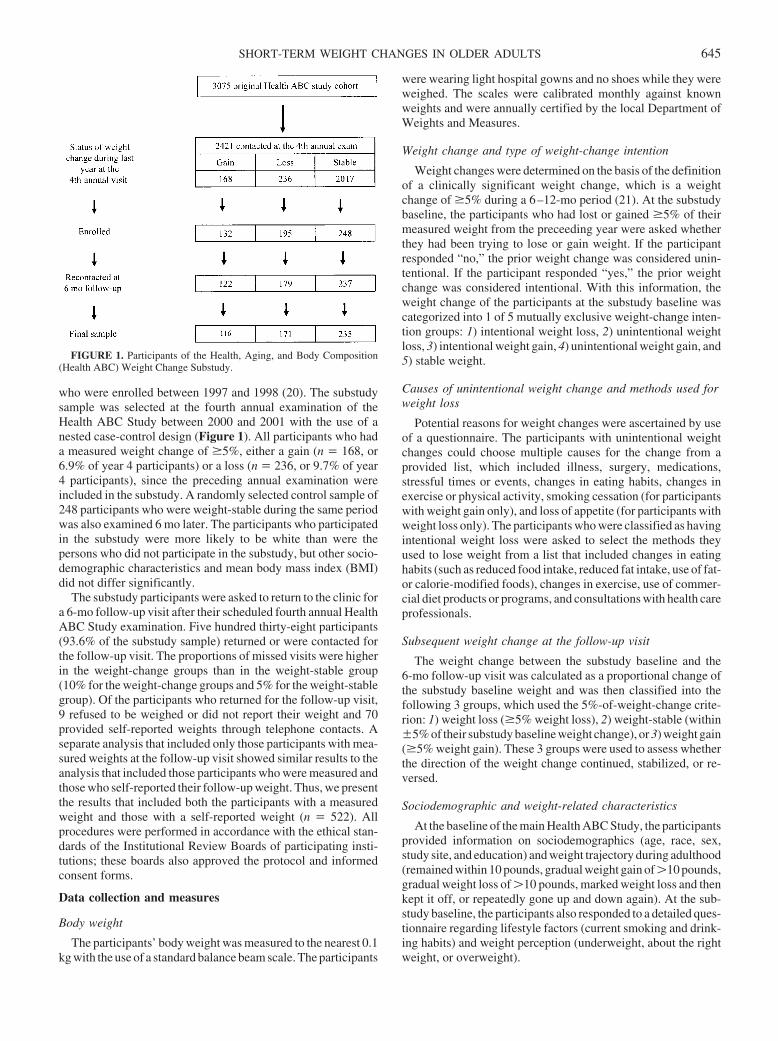
who were enrolled between 1997 and 1998 (20). The substudysample was selected at the fourth annual examination of theHealth ABC Study between 2000 and 2001 with the use of anested case-control design (Figure 1). All participants who hada measured weight change of �5%, either a gain (n � 168, or6.9% of year 4 participants) or a loss (n � 236, or 9.7% of year4 participants), since the preceding annual examination wereincluded in the substudy. A randomly selected control sample of248 participants who were weight-stable during the same periodwas also examined 6 mo later. The participants who participatedin the substudy were more likely to be white than were thepersons who did not participate in the substudy, but other socio-demographic characteristics and mean body mass index (BMI)did not differ significantly.
The substudy participants were asked to return to the clinic fora 6-mo follow-up visit after their scheduled fourth annual HealthABC Study examination. Five hundred thirty-eight participants(93.6% of the substudy sample) returned or were contacted forthe follow-up visit. The proportions of missed visits were higherin the weight-change groups than in the weight-stable group(10% for the weight-change groups and 5% for the weight-stablegroup). Of the participants who returned for the follow-up visit,9 refused to be weighed or did not report their weight and 70provided self-reported weights through telephone contacts. Aseparate analysis that included only those participants with mea-sured weights at the follow-up visit showed similar results to theanalysis that included those participants who were measured andthose who self-reported their follow-up weight. Thus, we presentthe results that included both the participants with a measuredweight and those with a self-reported weight (n � 522). Allprocedures were performed in accordance with the ethical stan-dards of the Institutional Review Boards of participating insti-tutions; these boards also approved the protocol and informedconsent forms.
Data collection and measures
Body weight
The participants’ body weight was measured to the nearest 0.1kg with the use of a standard balance beam scale. The participants
were wearing light hospital gowns and no shoes while they wereweighed. The scales were calibrated monthly against knownweights and were annually certified by the local Department ofWeights and Measures.
Weight change and type of weight-change intention
Weight changes were determined on the basis of the definitionof a clinically significant weight change, which is a weightchange of �5% during a 6–12-mo period (21). At the substudybaseline, the participants who had lost or gained �5% of theirmeasured weight from the preceeding year were asked whetherthey had been trying to lose or gain weight. If the participantresponded “no,” the prior weight change was considered unin-tentional. If the participant responded “yes,” the prior weightchange was considered intentional. With this information, theweight change of the participants at the substudy baseline wascategorized into 1 of 5 mutually exclusive weight-change inten-tion groups: 1) intentional weight loss, 2) unintentional weightloss, 3) intentional weight gain, 4) unintentional weight gain, and5) stable weight.
Causes of unintentional weight change and methods used forweight loss
Potential reasons for weight changes were ascertained by useof a questionnaire. The participants with unintentional weightchanges could choose multiple causes for the change from aprovided list, which included illness, surgery, medications,stressful times or events, changes in eating habits, changes inexercise or physical activity, smoking cessation (for participantswith weight gain only), and loss of appetite (for participants withweight loss only). The participants who were classified as havingintentional weight loss were asked to select the methods theyused to lose weight from a list that included changes in eatinghabits (such as reduced food intake, reduced fat intake, use of fat-or calorie-modified foods), changes in exercise, use of commer-cial diet products or programs, and consultations with health careprofessionals.
Subsequent weight change at the follow-up visit
The weight change between the substudy baseline and the6-mo follow-up visit was calculated as a proportional change ofthe substudy baseline weight and was then classified into thefollowing 3 groups, which used the 5%-of-weight-change crite-rion: 1) weight loss (�5% weight loss), 2) weight-stable (within�5% of their substudy baseline weight change), or 3) weight gain(�5% weight gain). These 3 groups were used to assess whetherthe direction of the weight change continued, stabilized, or re-versed.
Sociodemographic and weight-related characteristics
At the baseline of the main Health ABC Study, the participantsprovided information on sociodemographics (age, race, sex,study site, and education) and weight trajectory during adulthood(remained within 10 pounds, gradual weight gain of �10 pounds,gradual weight loss of �10 pounds, marked weight loss and thenkept it off, or repeatedly gone up and down again). At the sub-study baseline, the participants also responded to a detailed ques-tionnaire regarding lifestyle factors (current smoking and drink-ing habits) and weight perception (underweight, about the rightweight, or overweight).
FIGURE 1. Participants of the Health, Aging, and Body Composition(Health ABC) Weight Change Substudy.
SHORT-TERM WEIGHT CHANGES IN OLDER ADULTS 645
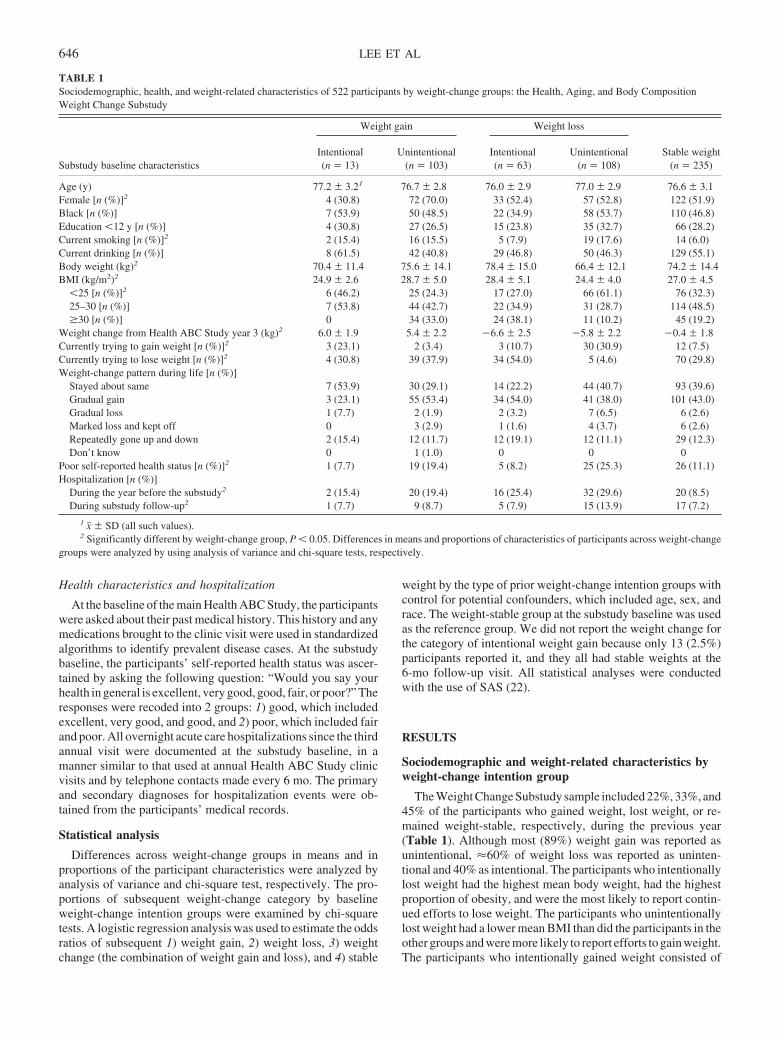
Health characteristics and hospitalization
At the baseline of the main Health ABC Study, the participantswere asked about their past medical history. This history and anymedications brought to the clinic visit were used in standardizedalgorithms to identify prevalent disease cases. At the substudybaseline, the participants’ self-reported health status was ascer-tained by asking the following question: “Would you say yourhealth in general is excellent, very good, good, fair, or poor?” Theresponses were recoded into 2 groups: 1) good, which includedexcellent, very good, and good, and 2) poor, which included fairand poor. All overnight acute care hospitalizations since the thirdannual visit were documented at the substudy baseline, in amanner similar to that used at annual Health ABC Study clinicvisits and by telephone contacts made every 6 mo. The primaryand secondary diagnoses for hospitalization events were ob-tained from the participants’ medical records.
Statistical analysis
Differences across weight-change groups in means and inproportions of the participant characteristics were analyzed byanalysis of variance and chi-square test, respectively. The pro-portions of subsequent weight-change category by baselineweight-change intention groups were examined by chi-squaretests. A logistic regression analysis was used to estimate the oddsratios of subsequent 1) weight gain, 2) weight loss, 3) weightchange (the combination of weight gain and loss), and 4) stable
weight by the type of prior weight-change intention groups withcontrol for potential confounders, which included age, sex, andrace. The weight-stable group at the substudy baseline was usedas the reference group. We did not report the weight change forthe category of intentional weight gain because only 13 (2.5%)participants reported it, and they all had stable weights at the6-mo follow-up visit. All statistical analyses were conductedwith the use of SAS (22).
RESULTS
Sociodemographic and weight-related characteristics byweight-change intention group
The Weight Change Substudy sample included 22%, 33%, and45% of the participants who gained weight, lost weight, or re-mained weight-stable, respectively, during the previous year(Table 1). Although most (89%) weight gain was reported asunintentional, �60% of weight loss was reported as uninten-tional and 40% as intentional. The participants who intentionallylost weight had the highest mean body weight, had the highestproportion of obesity, and were the most likely to report contin-ued efforts to lose weight. The participants who unintentionallylost weight had a lower mean BMI than did the participants in theother groups and were more likely to report efforts to gain weight.The participants who intentionally gained weight consisted of
TABLE 1Sociodemographic, health, and weight-related characteristics of 522 participants by weight-change groups: the Health, Aging, and Body CompositionWeight Change Substudy
Substudy baseline characteristics
Weight gain Weight loss
Stable weight(n � 235)
Intentional(n � 13)
Unintentional(n � 103)
Intentional(n � 63)
Unintentional(n � 108)
Age (y) 77.2 � 3.21 76.7 � 2.8 76.0 � 2.9 77.0 � 2.9 76.6 � 3.1Female [n (%)]2 4 (30.8) 72 (70.0) 33 (52.4) 57 (52.8) 122 (51.9)Black [n (%)] 7 (53.9) 50 (48.5) 22 (34.9) 58 (53.7) 110 (46.8)Education �12 y [n (%)] 4 (30.8) 27 (26.5) 15 (23.8) 35 (32.7) 66 (28.2)Current smoking [n (%)]2 2 (15.4) 16 (15.5) 5 (7.9) 19 (17.6) 14 (6.0)Current drinking [n (%)] 8 (61.5) 42 (40.8) 29 (46.8) 50 (46.3) 129 (55.1)Body weight (kg)2 70.4 � 11.4 75.6 � 14.1 78.4 � 15.0 66.4 � 12.1 74.2 � 14.4BMI (kg/m2)2 24.9 � 2.6 28.7 � 5.0 28.4 � 5.1 24.4 � 4.0 27.0 � 4.5
�25 [n (%)]2 6 (46.2) 25 (24.3) 17 (27.0) 66 (61.1) 76 (32.3)25–30 [n (%)] 7 (53.8) 44 (42.7) 22 (34.9) 31 (28.7) 114 (48.5)�30 [n (%)] 0 34 (33.0) 24 (38.1) 11 (10.2) 45 (19.2)
Weight change from Health ABC Study year 3 (kg)2 6.0 � 1.9 5.4 � 2.2 �6.6 � 2.5 �5.8 � 2.2 �0.4 � 1.8Currently trying to gain weight [n (%)]2 3 (23.1) 2 (3.4) 3 (10.7) 30 (30.9) 12 (7.5)Currently trying to lose weight [n (%)]2 4 (30.8) 39 (37.9) 34 (54.0) 5 (4.6) 70 (29.8)Weight-change pattern during life [n (%)]
Stayed about same 7 (53.9) 30 (29.1) 14 (22.2) 44 (40.7) 93 (39.6)Gradual gain 3 (23.1) 55 (53.4) 34 (54.0) 41 (38.0) 101 (43.0)Gradual loss 1 (7.7) 2 (1.9) 2 (3.2) 7 (6.5) 6 (2.6)Marked loss and kept off 0 3 (2.9) 1 (1.6) 4 (3.7) 6 (2.6)Repeatedly gone up and down 2 (15.4) 12 (11.7) 12 (19.1) 12 (11.1) 29 (12.3)Don’t know 0 1 (1.0) 0 0 0
Poor self-reported health status [n (%)]2 1 (7.7) 19 (19.4) 5 (8.2) 25 (25.3) 26 (11.1)Hospitalization [n (%)]
During the year before the substudy2 2 (15.4) 20 (19.4) 16 (25.4) 32 (29.6) 20 (8.5)During substudy follow-up2 1 (7.7) 9 (8.7) 5 (7.9) 15 (13.9) 17 (7.2)
1 x� � SD (all such values).2 Significantly different by weight-change group, P � 0.05. Differences in means and proportions of characteristics of participants across weight-change
groups were analyzed by using analysis of variance and chi-square tests, respectively.
646 LEE ET AL
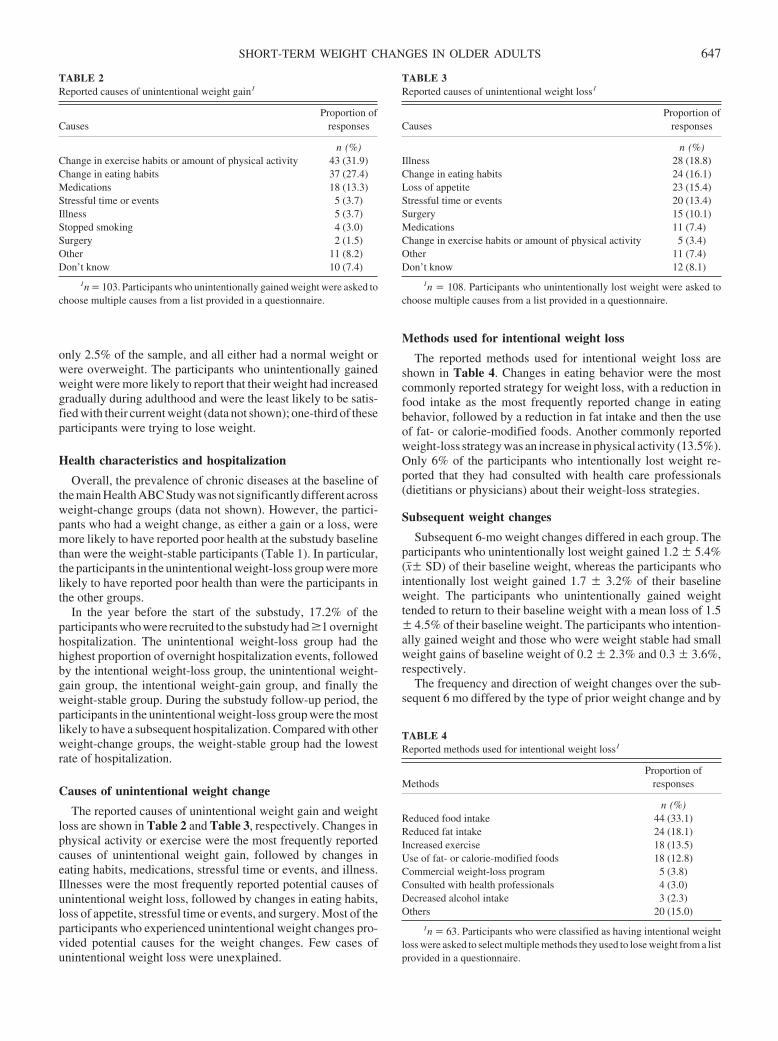
only 2.5% of the sample, and all either had a normal weight orwere overweight. The participants who unintentionally gainedweight were more likely to report that their weight had increasedgradually during adulthood and were the least likely to be satis-fied with their current weight (data not shown); one-third of theseparticipants were trying to lose weight.
Health characteristics and hospitalization
Overall, the prevalence of chronic diseases at the baseline ofthe main Health ABC Study was not significantly different acrossweight-change groups (data not shown). However, the partici-pants who had a weight change, as either a gain or a loss, weremore likely to have reported poor health at the substudy baselinethan were the weight-stable participants (Table 1). In particular,the participants in the unintentional weight-loss group were morelikely to have reported poor health than were the participants inthe other groups.
In the year before the start of the substudy, 17.2% of theparticipants who were recruited to the substudy had �1 overnighthospitalization. The unintentional weight-loss group had thehighest proportion of overnight hospitalization events, followedby the intentional weight-loss group, the unintentional weight-gain group, the intentional weight-gain group, and finally theweight-stable group. During the substudy follow-up period, theparticipants in the unintentional weight-loss group were the mostlikely to have a subsequent hospitalization. Compared with otherweight-change groups, the weight-stable group had the lowestrate of hospitalization.
Causes of unintentional weight change
The reported causes of unintentional weight gain and weightloss are shown in Table 2 and Table 3, respectively. Changes inphysical activity or exercise were the most frequently reportedcauses of unintentional weight gain, followed by changes ineating habits, medications, stressful time or events, and illness.Illnesses were the most frequently reported potential causes ofunintentional weight loss, followed by changes in eating habits,loss of appetite, stressful time or events, and surgery. Most of theparticipants who experienced unintentional weight changes pro-vided potential causes for the weight changes. Few cases ofunintentional weight loss were unexplained.
Methods used for intentional weight loss
The reported methods used for intentional weight loss areshown in Table 4. Changes in eating behavior were the mostcommonly reported strategy for weight loss, with a reduction infood intake as the most frequently reported change in eatingbehavior, followed by a reduction in fat intake and then the useof fat- or calorie-modified foods. Another commonly reportedweight-loss strategy was an increase in physical activity (13.5%).Only 6% of the participants who intentionally lost weight re-ported that they had consulted with health care professionals(dietitians or physicians) about their weight-loss strategies.
Subsequent weight changes
Subsequent 6-mo weight changes differed in each group. Theparticipants who unintentionally lost weight gained 1.2 � 5.4%(x�� SD) of their baseline weight, whereas the participants whointentionally lost weight gained 1.7 � 3.2% of their baselineweight. The participants who unintentionally gained weighttended to return to their baseline weight with a mean loss of 1.5� 4.5% of their baseline weight. The participants who intention-ally gained weight and those who were weight stable had smallweight gains of baseline weight of 0.2 � 2.3% and 0.3 � 3.6%,respectively.
The frequency and direction of weight changes over the sub-sequent 6 mo differed by the type of prior weight change and by
TABLE 2Reported causes of unintentional weight gain1
CausesProportion of
responses
n (%)Change in exercise habits or amount of physical activity 43 (31.9)Change in eating habits 37 (27.4)Medications 18 (13.3)Stressful time or events 5 (3.7)Illness 5 (3.7)Stopped smoking 4 (3.0)Surgery 2 (1.5)Other 11 (8.2)Don’t know 10 (7.4)
1n � 103. Participants who unintentionally gained weight were asked tochoose multiple causes from a list provided in a questionnaire.
TABLE 3Reported causes of unintentional weight loss1
CausesProportion of
responses
n (%)Illness 28 (18.8)Change in eating habits 24 (16.1)Loss of appetite 23 (15.4)Stressful time or events 20 (13.4)Surgery 15 (10.1)Medications 11 (7.4)Change in exercise habits or amount of physical activity 5 (3.4)Other 11 (7.4)Don’t know 12 (8.1)
1n � 108. Participants who unintentionally lost weight were asked tochoose multiple causes from a list provided in a questionnaire.
TABLE 4Reported methods used for intentional weight loss1
MethodsProportion of
responses
n (%)Reduced food intake 44 (33.1)Reduced fat intake 24 (18.1)Increased exercise 18 (13.5)Use of fat- or calorie-modified foods 18 (12.8)Commercial weight-loss program 5 (3.8)Consulted with health professionals 4 (3.0)Decreased alcohol intake 3 (2.3)Others 20 (15.0)
1n � 63. Participants who were classified as having intentional weightloss were asked to select multiple methods they used to lose weight from a listprovided in a questionnaire.
SHORT-TERM WEIGHT CHANGES IN OLDER ADULTS 647
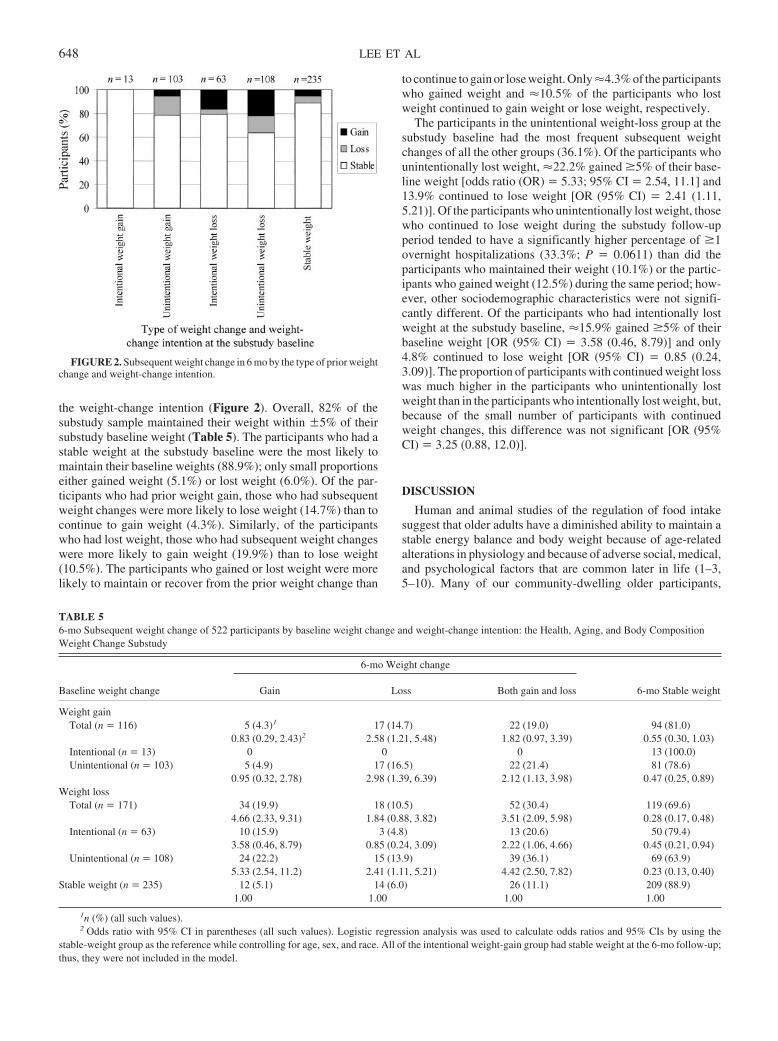
the weight-change intention (Figure 2). Overall, 82% of thesubstudy sample maintained their weight within �5% of theirsubstudy baseline weight (Table 5). The participants who had astable weight at the substudy baseline were the most likely tomaintain their baseline weights (88.9%); only small proportionseither gained weight (5.1%) or lost weight (6.0%). Of the par-ticipants who had prior weight gain, those who had subsequentweight changes were more likely to lose weight (14.7%) than tocontinue to gain weight (4.3%). Similarly, of the participantswho had lost weight, those who had subsequent weight changeswere more likely to gain weight (19.9%) than to lose weight(10.5%). The participants who gained or lost weight were morelikely to maintain or recover from the prior weight change than
to continue to gain or lose weight. Only �4.3% of the participantswho gained weight and �10.5% of the participants who lostweight continued to gain weight or lose weight, respectively.
The participants in the unintentional weight-loss group at thesubstudy baseline had the most frequent subsequent weightchanges of all the other groups (36.1%). Of the participants whounintentionally lost weight, �22.2% gained �5% of their base-line weight [odds ratio (OR) � 5.33; 95% CI � 2.54, 11.1] and13.9% continued to lose weight [OR (95% CI) � 2.41 (1.11,5.21)]. Of the participants who unintentionally lost weight, thosewho continued to lose weight during the substudy follow-upperiod tended to have a significantly higher percentage of �1overnight hospitalizations (33.3%; P � 0.0611) than did theparticipants who maintained their weight (10.1%) or the partic-ipants who gained weight (12.5%) during the same period; how-ever, other sociodemographic characteristics were not signifi-cantly different. Of the participants who had intentionally lostweight at the substudy baseline, �15.9% gained �5% of theirbaseline weight [OR (95% CI) � 3.58 (0.46, 8.79)] and only4.8% continued to lose weight [OR (95% CI) � 0.85 (0.24,3.09)]. The proportion of participants with continued weight losswas much higher in the participants who unintentionally lostweight than in the participants who intentionally lost weight, but,because of the small number of participants with continuedweight changes, this difference was not significant [OR (95%CI) � 3.25 (0.88, 12.0)].
DISCUSSION
Human and animal studies of the regulation of food intakesuggest that older adults have a diminished ability to maintain astable energy balance and body weight because of age-relatedalterations in physiology and because of adverse social, medical,and psychological factors that are common later in life (1–3,5–10). Many of our community-dwelling older participants,
FIGURE 2. Subsequent weight change in 6 mo by the type of prior weightchange and weight-change intention.
TABLE 56-mo Subsequent weight change of 522 participants by baseline weight change and weight-change intention: the Health, Aging, and Body CompositionWeight Change Substudy
Baseline weight change
6-mo Weight change
6-mo Stable weightGain Loss Both gain and loss
Weight gainTotal (n � 116) 5 (4.3)1 17 (14.7) 22 (19.0) 94 (81.0)
0.83 (0.29, 2.43)2 2.58 (1.21, 5.48) 1.82 (0.97, 3.39) 0.55 (0.30, 1.03)Intentional (n � 13) 0 0 0 13 (100.0)Unintentional (n � 103) 5 (4.9) 17 (16.5) 22 (21.4) 81 (78.6)
0.95 (0.32, 2.78) 2.98 (1.39, 6.39) 2.12 (1.13, 3.98) 0.47 (0.25, 0.89)Weight loss
Total (n � 171) 34 (19.9) 18 (10.5) 52 (30.4) 119 (69.6)4.66 (2.33, 9.31) 1.84 (0.88, 3.82) 3.51 (2.09, 5.98) 0.28 (0.17, 0.48)
Intentional (n � 63) 10 (15.9) 3 (4.8) 13 (20.6) 50 (79.4)3.58 (0.46, 8.79) 0.85 (0.24, 3.09) 2.22 (1.06, 4.66) 0.45 (0.21, 0.94)
Unintentional (n � 108) 24 (22.2) 15 (13.9) 39 (36.1) 69 (63.9)5.33 (2.54, 11.2) 2.41 (1.11, 5.21) 4.42 (2.50, 7.82) 0.23 (0.13, 0.40)
Stable weight (n � 235) 12 (5.1) 14 (6.0) 26 (11.1) 209 (88.9)1.00 1.00 1.00 1.00
1n (%) (all such values).2 Odds ratio with 95% CI in parentheses (all such values). Logistic regression analysis was used to calculate odds ratios and 95% CIs by using the
stable-weight group as the reference while controlling for age, sex, and race. All of the intentional weight-gain group had stable weight at the 6-mo follow-up;thus, they were not included in the model.
648 LEE ET AL
however, maintained a stable weight. Furthermore, a significantproportion of the participants who had weight loss or gain atbaseline were more likely to maintain the baseline weight orresolve their weight change than to continue to lose or gainweight over the subsequent 6-mo period. Only �3% of our totalsubstudy sample continued to lose weight and only 1% continuedto gain weight. Compared with the participants who either hadstable weights or intentionally lost weight, the participants whounintentionally lost weight were more likely to continue to loseweight; however, only 14% of the participants who lost weight atbaseline did so. This finding suggests that older adults who ex-perience weight loss, even if the weight loss is unintentional, arelikely to resolve the weight loss, and the few elderly persons withcontinued weight loss can be detected with a 6-mo follow-upweight reassessment.
Of note, the participants who had short-term weight fluctua-tions or instability were more likely to report or to experiencepoor health status, regardless of their ability to resolve theirprevious weight changes, than were the participants with stableweights or with no short-term weight changes. This observationwarrants continued attention because it suggests that weight fluc-tuation or instability could be a useful indicator of detrimentalmetabolic consequences or health problems in older adults.
These findings are similar to the findings reported in smallclinical populations, including findings in nursing home patients.In these small clinical studies, most of the surviving older pa-tients who unintentionally lost weight either did not lose anymore weight or subsequently gained the weight back after thecauses of the observed weight loss were diagnosed and treatmentwas started (21, 23–26).
In clinical practice, the absence of a single identifiable causeof weight loss is more common in elderly patients than in youngerpatients, and, when evaluated specifically for weight loss, a sig-nificant proportion of elderly patients remain undiagnosed (21).In the present substudy, the reported causes of unintentionalweight loss, which included illness, changes in eating habits andloss of appetite, and stressful life events, were similar to thecauses reported in previous studies (21, 27). Unrecognized orunexplained weight loss was rare in the present substudy.
Managing older patients with unintentional weight loss re-mains a challenging task for health care providers. A rationalstepwise approach has been suggested for use in clinical practiceto establish a diagnosis and to determine management ap-proaches for older patients with unintentional weight loss (23,24). The guidelines suggest that if the initial basic evaluationdoes not successfully uncover a diagnosis for the weight loss,then the clinician should establish a management plan that in-cludes a predetermined follow-up in the subsequent 3–6 mo,because some causes of weight loss can be subtle and could berevealed with time (21, 23). We showed that a large proportion ofweight loss that occurs in relatively healthy community-dwellingolder adults can be resolved in 6 mo, which suggests that aweight-loss management plan for community-dwelling olderadults may also need to include a 6-mo waiting period, rather thanpursue more expensive and invasive undirected testing as wassuggested by Wallace et al (21).
Many of the participants in the present substudy were inter-ested in their weight and were attempting to recover from ormaintain their substudy baseline weight change. Older adults
who continued trying to lose weight, however, were not success-ful either in maintaining their baseline weight loss or in continu-ing to lose weight over the subsequent 6 mo. This finding issimilar to the findings of previous epidemiologic studies (28–31), which include a prior report on the Health ABC Study cohort(32). In the Health ABC Study, despite adopting healthier eatingbehaviors and more active lifestyles, older adults who tried tolose weight did not lose weight; rather, they maintained a stableweight in a 1-y period compared with participants with noweight-loss intention (32). In middle-aged and older men andwomen, a history of either intentional weight loss or weight lossattempts was a significant predictor of weight gain (28, 30, 31).The intention to change one’s weight has been suggested toreflect an overall healthy lifestyle (32, 33); thus, attention toone’s weight, regardless of the success of the intended weightchange, may foster a healthier lifestyle that helps older adultsmaintain a stable weight, maintain physical function, maintain agood quality of life, and live longer. It is not yet clear whetherattempted weight loss or successful weight loss in older adults isassociated with lowered mortality in older adults.
To our knowledge, this is the first study to describe the causesand the natural history of 6-mo weight changes in older adultswho were selected specifically because of their weight loss orgain over the prior year. Generalization of these findings to theolder population, however, is limited, because the substudy par-ticipants were initially selected to have no problems in perform-ing the activities of daily living and to be free from mobilityimpairment at the time of their enrollment in the Health ABCStudy, which was 3 y before the present substudy began. Ourparticipants may have had a better ability to maintain a stablebody weight or energy balance than did the persons who wereexcluded. Also, as with any study that deals with the intent tochange weight, the measure of weight-change intention relied onthe participants’ self-reports, and therefore may be biased. Be-cause older adults who attempt to lose weight are more likely tohave weight-related health conditions, caution may be warrantedin interpreting the self-reported intent to lose weight (32). Theselimitations may partly explain why our findings differ from thefindings of previous studies that showed that, compared withyounger adults, healthy older adults have an altered ability toaccurately control their energy balance and to maintain a stableweight after deliberate changes in their diet (1–9).
Notwithstanding, most of the participants in the present sub-study had a stable weight or recovered from the baseline weightchanges; few of the participants experienced progressive weightloss. As expected, the participants who unintentionally lostweight reported and experienced more health problems and alsohad a greater risk of progressive weight loss than did the partic-ipants in the other groups. These participants were easily iden-tified at an annual exam and with a subsequent 6-mo follow-up.
Older adults who intentionally lost weight reported that theyconsumed fewer calories and adopted a more active lifestyle tolose weight, which is currently recommended in clinical weight-loss guidelines for adults (34). Although controversy continuesas to who should lose weight, who would benefit from weightloss, and how to maximize the benefit from weight loss in olderadults, more older adults are trying to lose weight now than everbefore (32, 35). Few of the participants in our substudy pursuedguidance from their health care providers. In this era of obesityepidemics and ever-expanding diet and weight-loss programs,health care providers should provide appropriate weight-loss
SHORT-TERM WEIGHT CHANGES IN OLDER ADULTS 649
guidelines for older adults. Such efforts will help community-dwelling older adults make informed and appropriate decisionson how to control their weight to maximize health benefits and toreduce health problems. More research is needed to better un-derstand the dynamic changes in body weight with relation toweight-change intention and how these weight-change patternscan affect the nutritional and health status of older adults.
JSL and ABN were responsible for the study design. JSL analyzed the dataand drafted the manuscript. ABN, TBH, FT, and SBK provided criticalrevisions of the manuscript for important intellectual content. SMR providedadministrative, technical, and logistic support. None of authors had anyconflicts of interest.
REFERENCES1. Roberts SB, Dallal GE. Effects of age on energy balance. Am J Clin Nutr
1998;68(suppl):975S–9.2. Roberts SB, Fuss P, Heyman MB, et al. Control of food intake in older
men. JAMA 1994;272:1601–6.3. Moriguti JC, Das SK, Saltzman E, et al. Effects of a 6-week hypocaloric
diet on changes in body composition, hunger, and subsequent weightregain in healthy young and older adults. J Gerontol A Biol Sci Med Sci2000;55:B580–7.
4. Roberts SB. A review of age-related changes in energy regulation andsuggested mechanisms. Mech Aging Dev 2000;116:157–67.
5. Morley JE. Anorexia of aging: physiologic and pathologic. Am J ClinNutr 1997;66:760–73.
6. MacIntosh C, Morley JE, Chapman IM. The anorexia of aging. Nutrition2000;16:983–95.
7. Morley JE. Anorexia and weight loss in older persons. J Gerontol A BiolSci Med Sci 2003;58:131–7.
8. Rolls BJ, Dimeo KA, Shide DJ. Age-related impairments in the regula-tion of food intake. Am J Clin Nutr 1995;62:923–31.
9. Rolls BJ. Appetite and satiety in the elderly. Nutr Rev 1994;52:S9–10.10. Horwitz BA, Blanton CA, McDonald RB. Physiologic determinants of
the anorexia of aging: insights from animal studies. Annu Rev Nutr2002;22:417–38.
11. Sullivan DH, Johnson LE, Bopp MM, Roberson PK. Prognostic signif-icance of monthly weight fluctuations among older nursing home resi-dents. J Gerontol A Biol Sci Med Sci 2004;59:M633–9.
12. Newman AB, Yanez D, Harris T, Duxbury A, Enright PL, Fried LP.Weight change in old age and its association with mortality. J Am GeriatrSoc 2001;49:1309–18.
13. Launer LJ, Harris T, Rumpel C, Madans J. Body mass index, weightchange, and risk of mobility disability in middle-aged and older women.The epidemiologic follow-up study of NHANES I. JAMA 1994;271:1093–8.
14. Lee JS, Kritchevsky SB, Tylavsky FA, et al. Weight change, weightchange intention, and the incidence of mobility limitation in well-functioning elderly. J Gerontol A Biol Sci Med Sci (in press).
15. Willett WC. Weight loss in the elderly: cause or effect of poor health?Am J Clin Nutr 1997;66:737–8.
16. Wannamethee SG, Shaper AG, Whincup PH, Walker M. Characteristicsof older men who lose weight intentionally or unintentionally. Am JEpidemiol 2000;151:667–75.
17. Wallace JI, Schwartz RS. Involuntary weight loss in elderly outpatients:recognition, etiologies, and treatment. Clin Geriatr Med 1997;13:717–35.
18. Kuller LH. Invited commentary on “Prospective study of intentionalityof weight loss and mortality in older women: the Iowa Women’s HealthStudy” and “Prospective study of intentional weight loss and mortality inoverweight white men aged 40–64 years. ” Am J Epidemiol 1999;149:515–6; discussion 517–20.
19. Meltzer AA, Everhart JE. Unintentional weight loss in the United States.Am J Epidemiol 1995;142:1039–46.
20. Rooks RN, Simonsick EM, Miles T, et al. The association of race andsocioeconomic status with cardiovascular disease indicators amongolder adults in the health, aging, and body composition study. J GerontolB Psychol Sci Soc Sci 2002;57:S247–56.
21. Wallace JI, Schwartz RS. Epidemiology of weight loss in humans withspecial reference to wasting in the elderly. Int J Cardiol 2002;85:15–21.
22. SAS Institute Inc. SAS/STAT user’s guide, version 8. Cary, NC: SASInstitute Inc, 2001.
23. Bouras EP, Lange SM, Scolapio JS. Rational approach to patients withunintentional weight loss. Mayo Clin Proc 2001;76:923–9.
24. Gazewood JD, Mehr DR. Diagnosis and management of weight loss inthe elderly. J Fam Pract 1998;47:19–25.
25. Lankisch P, Gerzmann M, Gerzmann JF, Lehnick D. Unintentionalweight loss: diagnosis and prognosis. The first prospective follow-upstudy from a secondary referral centre. J Intern Med 2001;249:41–6.
26. Marton KI, Sox HC Jr, Krupp JR. Involuntary weight loss: diagnosticand prognostic significance. Ann Intern Med 1981;95:568–74.
27. Morley JE, Kraenzle D. Causes of weight loss in a community nursinghome. J Am Geriatr Soc 1994;42:583–5.
28. Coakley EH, Rimm EB, Colditz G, Kawachi I, Willett W. Predictors ofweight change in men: results from the Health Professionals Follow-upStudy. Int J Obes Relat Metab Disord 1998;22:89–96.
29. Kroke A, Liese AD, Schulz M, et al. Recent weight changes and weightcycling as predictors of subsequent two year weight change in a middle-aged cohort. Int J Obes Relat Metab Disord 2002;26:403–9.
30. Sherwood NE, Jeffery RW, French SA, Hannan PJ, Murray DM. Pre-dictors of weight gain in the Pound of Prevention study. Int J Obes RelatMetab Disord 2000;24:395–403.
31. French SA, Jeffery RW, Forster JL, McGovern PG, Kelder SH, BaxterJE. Predictors of weight change over two years among a population ofworking adults: the Healthy Worker Project. Int J Obes Relat MetabDisord 1994;18:145–54.
32. Lee JS, Kritchevsky SB, Tylavsky FA, et al. Weight-loss intention in thewell-functioning, community-dwelling elderly: associations with dietquality, physical activity, and weight change. Am J Clin Nutr 2004;80:466–74.
33. Gregg EW, Gerzoff RB, Thompson TJ, Williamson DF. Intentionalweight loss and death in overweight and obese U.S. adults 35 years of ageand older. Ann Intern Med 2003;138:383–9.
34. National Institutes of Health. The practical guide: identification, evalu-ation, and treatment of overweight and obesity in adults. Rockville, MD:National Institutes of Health, National Heart, Lung, and Blood Institute,1998.
35. Centers for Disease Control and Prevention. Behavioral Risk FactorSurveillance System. Version current 2002. Internet: http://apps.nccd.cdc.gov/brfss/Trends/agechart.asp?qkey�10010&state�US (accessed25 June 2002).
650 LEE ET AL
Postmenopausal hormone therapy and body composition—a substudyof the estrogen plus progestin trial of the Women’s Health Initiative1–3
Zhao Chen, Tamsen Bassford, Sylvan B Green, Jane A Cauley, Rebecca D Jackson, Andrea Z LaCroix, Meryl Leboff,Marcia L Stefanick, and Karen L Margolis
ABSTRACTBackground: It has been suggested that hormone therapy may helpcounter undesirable changes in body composition in older women.Objective: This study was designed to test whether estrogen plusprogestin (E�P) therapy favorably affects age-related changes inbody composition in postmenopausal women.Design: The substudy was composed of 835 women from the es-trogen plus progestin trial of the Women’s Health Initiative whowere randomly assigned to receive either E�P therapy (n � 437) orplacebo (n � 398). The women had a mean age of 63.1 y and, onaverage, were 13.8 y past menopause. More than 17% of the partic-ipants were from an ethnic minority. No significant differences inbaseline body composition (measured with dual-energy X-ray ab-sorptiometry) by intervention assignment were observed.Results: After 3 y of intervention, the women who received activeE�P therapy lost less lean soft tissue mass (�0.04 kg) than did thewomen who received placebo (�0.44 kg; P � 0.001). Additionally,the women in the E�P group had less upper-body fat distributionthan did the women in the placebo group (change in ratio of trunk toleg fat mass: �0.025 for the E�P group and 0.004 for the placebogroup; P � 0.003). A sensitivity analysis, which was conducted onthe women who took �80% of the study medication during theintervention period, corroborated the findings from the intent-to-treat analysis.Conclusions: A 3-y E�P intervention significantly reduced boththe loss of lean soft tissue mass and the ratio of trunk to leg fat massin postmenopausal women. However, the effect sizes were small,and whether these changes in body composition lead to significanthealth benefits remains to be confirmed. Am J Clin Nutr 2005;82:651–6.
KEY WORDS Estrogen plus progestin, body composition,Women’s Health Initiative, dual-energy X-ray absoptiometry,postmenopausal women
INTRODUCTION
Older women may experience increases in body fat mass andredistribution of fat mass from the limbs to a more central orandroid location (1). These changes can increase the risk ofdiabetes and cardiovascular diseases in older women. Meno-pausal therapy may help counter these changes in body compo-sition in postmenopausal women (1–3). Most of the previousstudies investigating the effects of menopausal therapy on bodycomposition were limited either to observational studies or to
clinical trials with small sample sizes or short intervention periods.The techniques used for assessing body composition have variedwidely across these studies; many studies have not used direct mea-surements of body composition but have instead relied on anthro-pometric measurements, such as body mass index (BMI) or hip andwaist circumferences, as proxies for obesity, lean soft tissuemass, and body fat distribution. These limitations highlight theneed for a better understanding of the relation between bodycomposition and hormone therapy in postmenopausal women.
The estrogen plus progestin (E�P) randomized controlledclinical trial of the Women’s Health Initiative (WHI) provides aunique opportunity to investigate the effect of hormone therapyon body composition. All the women in the WHI substudy un-derwent body-composition assessment by dual-energy X-ray ab-sorptiometry (DXA) scans serially throughout the trial. Becauseof the advantages of the randomized controlled clinical trial, thepresent substudy had the unique ability to test whether the E�Pintervention had positive effects on body composition, includingpreventing the loss of lean soft tissue mass, reducing the gain inbody fat mass, and reducing the redistribution of fat from thelimbs to a central or android location.
SUBJECTS AND METHODS
Subjects
Between 1993 and 1998, a total of 16 608 postmenopausalwomen who had not previously undergone a hysterectomy wererecruited and enrolled into the WHI E�P trial at 40 WHI clinical
1 From the University of Arizona, Tucson, AZ (ZC, TB, and SBG); theUniversity of Pittsburgh, Pittsburgh, PA (JAC); the Ohio State University,Columbus, OH (RDJ); the Fred Hutchinson Cancer Research Center, Seattle,WA (AZL); the Brigham and Women’s Hospital, Harvard University, Bos-ton, MA (ML); the Stanford University, Stanford, CA (MLS); and the Uni-versity of Minnesota, Minneapolis, MN (KLM).
2 Supported by the National Heart, Lung, and Blood Institute, US Depart-ment of Health and Human Services (the Women’s Health Initiative Pro-gram) and the National Institute of Arthritis, Musculoskeletal, and SkinDiseases (grant R01-AR049411 to ZC).
3 Reprints not available. Address correspondence to Z Chen, PO Box245203, Division of Epidemiology and Biostatistics, Mel and Enid Zucker-man College of Public Health, University of Arizona, 1540 E Drachman,Tucson, AZ 85724. E-mail: [email protected].
Received March 1, 2005.Accepted for publication May 6, 2005.
651Am J Clin Nutr 2005;82:651–6. Printed in USA. © 2005 American Society for Clinical Nutrition
centers in the United States. The inclusion criteria were as fol-lows: age of 50-79 y, postmenopausal status, likelihood of resi-dence in the area for 3 y, and provision of written informedconsent. All the women were stratified by age and randomlyallocated (block randomization by clinical center) into either theE�P group (0.625 mg conjugated equine estrogen combinedwith 2.5 mg medroxyprogesterone acetate per day) or the placebogroup. Women who were taking estrogen therapy at the initialscreening were asked to go through a 3-mo washout period be-fore starting E�P therapy. The protocol and consent forms wereapproved by the review boards of all participating institutions.Details regarding inclusion and exclusion criteria, recruitmentprocedures, participant characteristics, randomization, blinding,and follow-up for the entire E�P cohort can be found in previ-ously published articles (4, 5).
At 3 WHI clinical centers (Pittsburgh, PA; Birmingham, AL;and Tucson-Phoenix, AZ), body composition was assessed withthe use of a DXA scanner at baseline and every 3 y thereafter. Theparticipants who completed the baseline and year 3 DXA scanmeasurements were included in the substudy. The characteristicsof the substudy participants differed from those of the entire WHIcohort in that recruitment was aimed at yielding maximum race-ethnicity and age diversity at the WHI clinical centers whereDXA measurements were conducted.
Body-composition measurements
Body-composition measurements, which included measure-ments of lean soft tissue mass, fat mass, percentage of lean softtissue mass, and percentage of fat mass, were assessed fromwhole-body DXA scans (QDR 2000, 2000�, or 4500W; HologicInc, Bedford, MA). Both regional and total body-compositionmeasurements were generated from total-body DXA scans. Theratio of trunk to leg fat mass (trunk:leg fat mass), which indicatesfat distribution, was calculated by dividing the fat mass of thetrunk region by the fat mass of the leg region. The DXA scanswere conducted at baseline and every 3 y during the intervention.Because the E�P trial stopped on 7 July 2002, when the meanfollow-up time was 5.6 y, few participants had year 6 scans donebefore the trial ended. Therefore, the present substudy only ex-amined changes in body composition between the measurementsmade at baseline and those made at year 3.
Standard protocols for positioning and analysis were used bytechnicians who were trained and certified by the DXA manu-facturer and the WHI DXA coordination center at the Universityof California, San Francisco. The quality assurance programincluded monitoring of phantom scans; reviewing random sam-ples of all scans and flagging scans with specific problems; con-trolling changes in hardware and software, which included invitro and in vivo cross-calibration; and scanning of calibrationphantoms across instruments and clinical sites.
Other covariates
Information on age, years since menopause, race and ethnic-ity, smoking history, recreational physical activities, use ofmenopausal hormone therapy, energy intake, and alcohol usewere assessed with baseline questionnaires. Age at menopausewas defined as the age at which the participant last reported anymenstrual bleeding, had a bilateral oophorectomy, or began re-ceiving menopausal hormone therapy. Caloric intake was as-sessed with the use of a validated food-frequency questionnaire,
which was based on instruments that were previously used inlarge-scale dietary intervention trials (6, 7). Recreational phys-ical activity was assessed by questions on the frequency andduration of several types of recreational activities, and metabolicequivalent task scores (defined as the ratio of work metabolic rateto a standard resting metabolic rate, with one metabolic equiva-lent task roughly equivalent to the resting metabolism whilesitting quietly) were computed as the product of days per week,minutes per day, and metabolic equivalent task value for eachactivity (8). Physical function was measured with the use of the10-item Medical Outcomes Study Scale (9); a higher score indi-cates better physical function. Weight was measured to the near-est 0.1 kg on a balance-beam scale while the participant woreindoor clothing and no shoes. Each participant’s height was mea-sured to the nearest 0.1 cm with the use of a wall-mountedstadiometer. BMI was calculated as weight (in kg)/height2 (in m).Waist and hip circumferences of the participants were measuredwith the use of measurement tapes at baseline and a year after therandomization for all the E�P participants from the 3 WHIcenters where the DXA measurements were conducted. After thefirst annual visit, the WHI trial only collected waist and hipcircumferences in a subcohort of E�P trial participants. In thepresent WHI substudy, the waist and hip circumference mea-surements as well as waist-to-hip ratios (WHRs) were repeated inyear 3 for only 214 women in the E�P group and 198 women inthe placebo group.
Statistical analysis
The analysis was performed on 835 women who had DXAscans done at both baseline and year 3. Because of the replace-ment of an older DXA machine with a new DXA model, 135 ofthe women from the Tucson WHI clinic (16% of the 835 womenin the present substudy) had their baseline scans done with theQDR2000 model and their year 3 scans with the QDR4500Wmodel. With the use of DXA calibration data from an indepen-dent group of 50 women who were scanned with both DXAmachines on the same day, linear regression equations weredeveloped for the total and regional body-composition assess-ments, which predicted QDR2000 values from QDR4500Wmeasurements. These equations were used to correct the mea-surements from the participants who switched scanners. Threeadditional women who had different scanner models for their 2evaluations were eliminated from the analysis because no cor-rection was possible.
An intent-to-treat analysis was used for the primary compar-isons between the E�P group and the placebo group. Because theeffects of E�P therapy might have been adversely affected by areduced adherence to the study medication, a sensitivity analysiswas conducted in the participants who completed �80% of theintervention assignments. All analyses were conducted with JMPversion 5 (SAS Institute, Cary, NC) for Macintosh computers.Descriptive statistics were used for baseline data, and t tests wereused for comparisons of body-composition measurements be-tween the 2 intervention groups. All P values were 2-tailed.
RESULTS
Descriptive analysis of baseline covariates by intervention
The baseline characteristics of the women by interventiongroup are shown in Table 1. In this subsample, 398 women were
652 CHEN ET AL
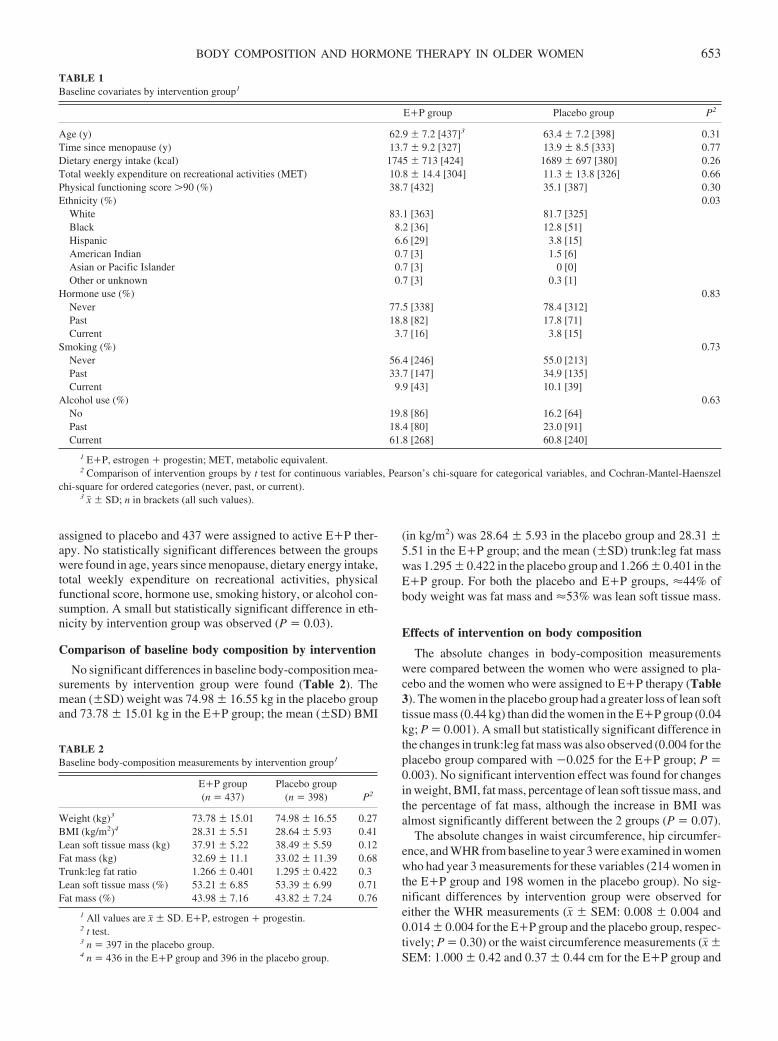
assigned to placebo and 437 were assigned to active E�P ther-apy. No statistically significant differences between the groupswere found in age, years since menopause, dietary energy intake,total weekly expenditure on recreational activities, physicalfunctional score, hormone use, smoking history, or alcohol con-sumption. A small but statistically significant difference in eth-nicity by intervention group was observed (P � 0.03).
Comparison of baseline body composition by intervention
No significant differences in baseline body-composition mea-surements by intervention group were found (Table 2). Themean (�SD) weight was 74.98 � 16.55 kg in the placebo groupand 73.78 � 15.01 kg in the E�P group; the mean (�SD) BMI
(in kg/m2) was 28.64 � 5.93 in the placebo group and 28.31 �5.51 in the E�P group; and the mean (�SD) trunk:leg fat masswas 1.295 � 0.422 in the placebo group and 1.266 � 0.401 in theE�P group. For both the placebo and E�P groups, �44% ofbody weight was fat mass and �53% was lean soft tissue mass.
Effects of intervention on body composition
The absolute changes in body-composition measurementswere compared between the women who were assigned to pla-cebo and the women who were assigned to E�P therapy (Table3). The women in the placebo group had a greater loss of lean softtissue mass (0.44 kg) than did the women in the E�P group (0.04kg; P � 0.001). A small but statistically significant difference inthe changes in trunk:leg fat mass was also observed (0.004 for theplacebo group compared with �0.025 for the E�P group; P �0.003). No significant intervention effect was found for changesin weight, BMI, fat mass, percentage of lean soft tissue mass, andthe percentage of fat mass, although the increase in BMI wasalmost significantly different between the 2 groups (P � 0.07).
The absolute changes in waist circumference, hip circumfer-ence, and WHR from baseline to year 3 were examined in womenwho had year 3 measurements for these variables (214 women inthe E�P group and 198 women in the placebo group). No sig-nificant differences by intervention group were observed foreither the WHR measurements (x� � SEM: 0.008 � 0.004 and0.014 � 0.004 for the E�P group and the placebo group, respec-tively; P � 0.30) or the waist circumference measurements (x� �SEM: 1.000 � 0.42 and 0.37 � 0.44 cm for the E�P group and
TABLE 1Baseline covariates by intervention group1
E�P group Placebo group P2
Age (y) 62.9 � 7.2 [437]3 63.4 � 7.2 [398] 0.31Time since menopause (y) 13.7 � 9.2 [327] 13.9 � 8.5 [333] 0.77Dietary energy intake (kcal) 1745 � 713 [424] 1689 � 697 [380] 0.26Total weekly expenditure on recreational activities (MET) 10.8 � 14.4 [304] 11.3 � 13.8 [326] 0.66Physical functioning score �90 (%) 38.7 [432] 35.1 [387] 0.30Ethnicity (%) 0.03
White 83.1 [363] 81.7 [325]Black 8.2 [36] 12.8 [51]Hispanic 6.6 [29] 3.8 [15]American Indian 0.7 [3] 1.5 [6]Asian or Pacific Islander 0.7 [3] 0 [0]Other or unknown 0.7 [3] 0.3 [1]
Hormone use (%) 0.83Never 77.5 [338] 78.4 [312]Past 18.8 [82] 17.8 [71]Current 3.7 [16] 3.8 [15]
Smoking (%) 0.73Never 56.4 [246] 55.0 [213]Past 33.7 [147] 34.9 [135]Current 9.9 [43] 10.1 [39]
Alcohol use (%) 0.63No 19.8 [86] 16.2 [64]Past 18.4 [80] 23.0 [91]Current 61.8 [268] 60.8 [240]
1 E�P, estrogen � progestin; MET, metabolic equivalent.2 Comparison of intervention groups by t test for continuous variables, Pearson’s chi-square for categorical variables, and Cochran-Mantel-Haenszel
chi-square for ordered categories (never, past, or current).3 x� � SD; n in brackets (all such values).
TABLE 2Baseline body-composition measurements by intervention group1
E�P group(n � 437)
Placebo group(n � 398) P2
Weight (kg)3 73.78 � 15.01 74.98 � 16.55 0.27BMI (kg/m2)4 28.31 � 5.51 28.64 � 5.93 0.41Lean soft tissue mass (kg) 37.91 � 5.22 38.49 � 5.59 0.12Fat mass (kg) 32.69 � 11.1 33.02 � 11.39 0.68Trunk:leg fat ratio 1.266 � 0.401 1.295 � 0.422 0.3Lean soft tissue mass (%) 53.21 � 6.85 53.39 � 6.99 0.71Fat mass (%) 43.98 � 7.16 43.82 � 7.24 0.76
1 All values are x� � SD. E�P, estrogen � progestin.2 t test.3 n � 397 in the placebo group.4 n � 436 in the E�P group and 396 in the placebo group.
BODY COMPOSITION AND HORMONE THERAPY IN OLDER WOMEN 653
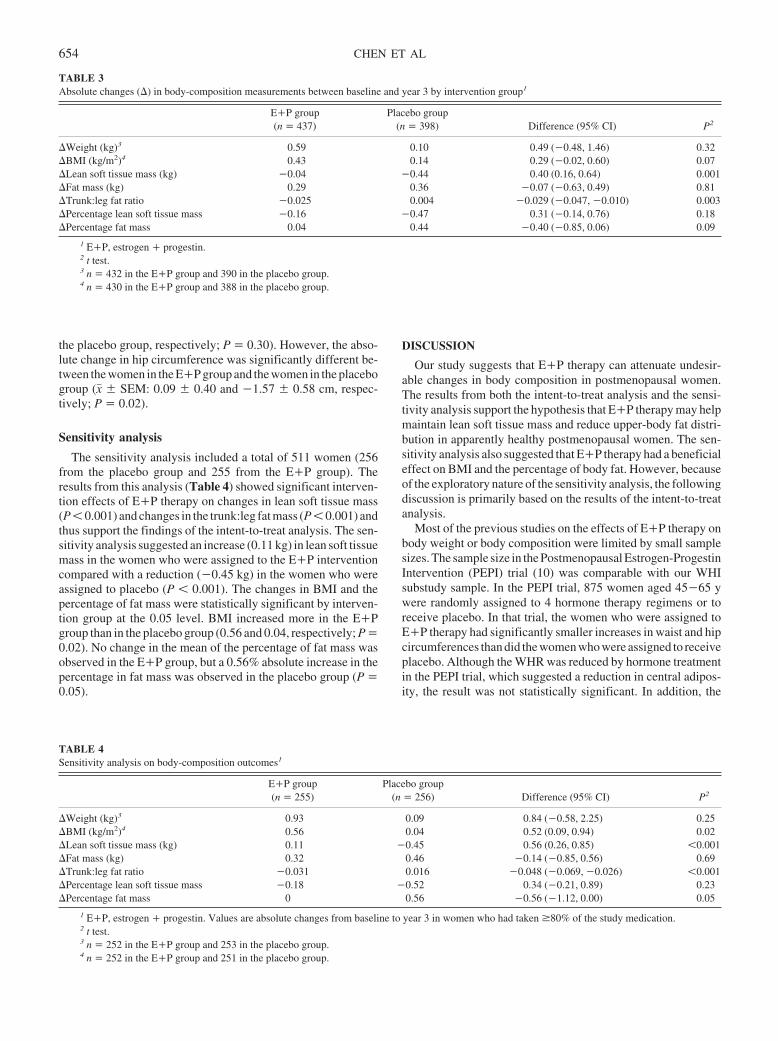
the placebo group, respectively; P � 0.30). However, the abso-lute change in hip circumference was significantly different be-tween the women in the E�P group and the women in the placebogroup (x� � SEM: 0.09 � 0.40 and �1.57 � 0.58 cm, respec-tively; P � 0.02).
Sensitivity analysis
The sensitivity analysis included a total of 511 women (256from the placebo group and 255 from the E�P group). Theresults from this analysis (Table 4) showed significant interven-tion effects of E�P therapy on changes in lean soft tissue mass(P � 0.001) and changes in the trunk:leg fat mass (P � 0.001) andthus support the findings of the intent-to-treat analysis. The sen-sitivity analysis suggested an increase (0.11 kg) in lean soft tissuemass in the women who were assigned to the E�P interventioncompared with a reduction (�0.45 kg) in the women who wereassigned to placebo (P � 0.001). The changes in BMI and thepercentage of fat mass were statistically significant by interven-tion group at the 0.05 level. BMI increased more in the E�Pgroup than in the placebo group (0.56 and 0.04, respectively; P �0.02). No change in the mean of the percentage of fat mass wasobserved in the E�P group, but a 0.56% absolute increase in thepercentage in fat mass was observed in the placebo group (P �0.05).
DISCUSSION
Our study suggests that E�P therapy can attenuate undesir-able changes in body composition in postmenopausal women.The results from both the intent-to-treat analysis and the sensi-tivity analysis support the hypothesis that E�P therapy may helpmaintain lean soft tissue mass and reduce upper-body fat distri-bution in apparently healthy postmenopausal women. The sen-sitivity analysis also suggested that E�P therapy had a beneficialeffect on BMI and the percentage of body fat. However, becauseof the exploratory nature of the sensitivity analysis, the followingdiscussion is primarily based on the results of the intent-to-treatanalysis.
Most of the previous studies on the effects of E�P therapy onbody weight or body composition were limited by small samplesizes. The sample size in the Postmenopausal Estrogen-ProgestinIntervention (PEPI) trial (10) was comparable with our WHIsubstudy sample. In the PEPI trial, 875 women aged 45�65 ywere randomly assigned to 4 hormone therapy regimens or toreceive placebo. In that trial, the women who were assigned toE�P therapy had significantly smaller increases in waist and hipcircumferences than did the women who were assigned to receiveplacebo. Although the WHR was reduced by hormone treatmentin the PEPI trial, which suggested a reduction in central adipos-ity, the result was not statistically significant. In addition, the
TABLE 3Absolute changes (�) in body-composition measurements between baseline and year 3 by intervention group1
E�P group(n � 437)
Placebo group(n � 398) Difference (95% CI) P2
�Weight (kg)3 0.59 0.10 0.49 (�0.48, 1.46) 0.32�BMI (kg/m2)4 0.43 0.14 0.29 (�0.02, 0.60) 0.07�Lean soft tissue mass (kg) �0.04 �0.44 0.40 (0.16, 0.64) 0.001�Fat mass (kg) 0.29 0.36 �0.07 (�0.63, 0.49) 0.81�Trunk:leg fat ratio �0.025 0.004 �0.029 (�0.047, �0.010) 0.003�Percentage lean soft tissue mass �0.16 �0.47 0.31 (�0.14, 0.76) 0.18�Percentage fat mass 0.04 0.44 �0.40 (�0.85, 0.06) 0.09
1 E�P, estrogen � progestin.2 t test.3 n � 432 in the E�P group and 390 in the placebo group.4 n � 430 in the E�P group and 388 in the placebo group.
TABLE 4Sensitivity analysis on body-composition outcomes1
E�P group(n � 255)
Placebo group(n � 256) Difference (95% CI) P2
�Weight (kg)3 0.93 0.09 0.84 (�0.58, 2.25) 0.25�BMI (kg/m2)4 0.56 0.04 0.52 (0.09, 0.94) 0.02�Lean soft tissue mass (kg) 0.11 �0.45 0.56 (0.26, 0.85) �0.001�Fat mass (kg) 0.32 0.46 �0.14 (�0.85, 0.56) 0.69�Trunk:leg fat ratio �0.031 0.016 �0.048 (�0.069, �0.026) �0.001�Percentage lean soft tissue mass �0.18 �0.52 0.34 (�0.21, 0.89) 0.23�Percentage fat mass 0 0.56 �0.56 (�1.12, 0.00) 0.05
1 E�P, estrogen � progestin. Values are absolute changes from baseline to year 3 in women who had taken �80% of the study medication.2 t test.3 n � 252 in the E�P group and 253 in the placebo group.4 n � 252 in the E�P group and 251 in the placebo group.
654 CHEN ET AL
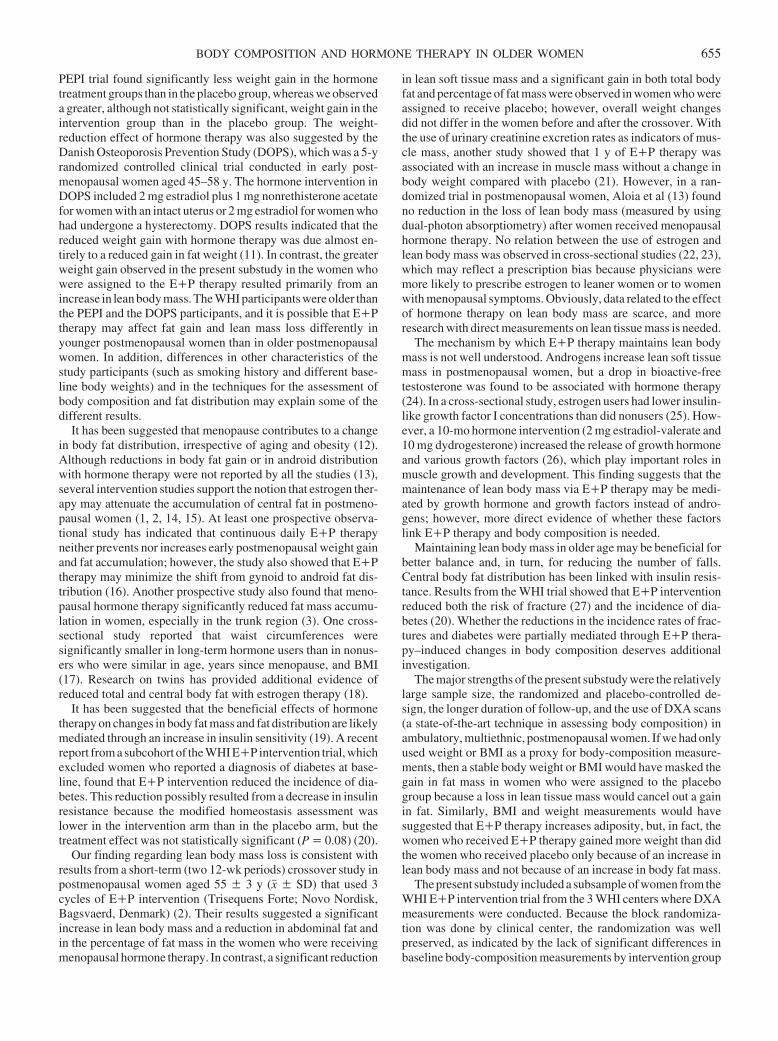
PEPI trial found significantly less weight gain in the hormonetreatment groups than in the placebo group, whereas we observeda greater, although not statistically significant, weight gain in theintervention group than in the placebo group. The weight-reduction effect of hormone therapy was also suggested by theDanish Osteoporosis Prevention Study (DOPS), which was a 5-yrandomized controlled clinical trial conducted in early post-menopausal women aged 45–58 y. The hormone intervention inDOPS included 2 mg estradiol plus 1 mg nonrethisterone acetatefor women with an intact uterus or 2 mg estradiol for women whohad undergone a hysterectomy. DOPS results indicated that thereduced weight gain with hormone therapy was due almost en-tirely to a reduced gain in fat weight (11). In contrast, the greaterweight gain observed in the present substudy in the women whowere assigned to the E�P therapy resulted primarily from anincrease in lean body mass. The WHI participants were older thanthe PEPI and the DOPS participants, and it is possible that E�Ptherapy may affect fat gain and lean mass loss differently inyounger postmenopausal women than in older postmenopausalwomen. In addition, differences in other characteristics of thestudy participants (such as smoking history and different base-line body weights) and in the techniques for the assessment ofbody composition and fat distribution may explain some of thedifferent results.
It has been suggested that menopause contributes to a changein body fat distribution, irrespective of aging and obesity (12).Although reductions in body fat gain or in android distributionwith hormone therapy were not reported by all the studies (13),several intervention studies support the notion that estrogen ther-apy may attenuate the accumulation of central fat in postmeno-pausal women (1, 2, 14, 15). At least one prospective observa-tional study has indicated that continuous daily E�P therapyneither prevents nor increases early postmenopausal weight gainand fat accumulation; however, the study also showed that E�Ptherapy may minimize the shift from gynoid to android fat dis-tribution (16). Another prospective study also found that meno-pausal hormone therapy significantly reduced fat mass accumu-lation in women, especially in the trunk region (3). One cross-sectional study reported that waist circumferences weresignificantly smaller in long-term hormone users than in nonus-ers who were similar in age, years since menopause, and BMI(17). Research on twins has provided additional evidence ofreduced total and central body fat with estrogen therapy (18).
It has been suggested that the beneficial effects of hormonetherapy on changes in body fat mass and fat distribution are likelymediated through an increase in insulin sensitivity (19). A recentreport from a subcohort of the WHI E�P intervention trial, whichexcluded women who reported a diagnosis of diabetes at base-line, found that E�P intervention reduced the incidence of dia-betes. This reduction possibly resulted from a decrease in insulinresistance because the modified homeostasis assessment waslower in the intervention arm than in the placebo arm, but thetreatment effect was not statistically significant (P � 0.08) (20).
Our finding regarding lean body mass loss is consistent withresults from a short-term (two 12-wk periods) crossover study inpostmenopausal women aged 55 � 3 y (x� � SD) that used 3cycles of E�P intervention (Trisequens Forte; Novo Nordisk,Bagsvaerd, Denmark) (2). Their results suggested a significantincrease in lean body mass and a reduction in abdominal fat andin the percentage of fat mass in the women who were receivingmenopausal hormone therapy. In contrast, a significant reduction
in lean soft tissue mass and a significant gain in both total bodyfat and percentage of fat mass were observed in women who wereassigned to receive placebo; however, overall weight changesdid not differ in the women before and after the crossover. Withthe use of urinary creatinine excretion rates as indicators of mus-cle mass, another study showed that 1 y of E�P therapy wasassociated with an increase in muscle mass without a change inbody weight compared with placebo (21). However, in a ran-domized trial in postmenopausal women, Aloia et al (13) foundno reduction in the loss of lean body mass (measured by usingdual-photon absorptiometry) after women received menopausalhormone therapy. No relation between the use of estrogen andlean body mass was observed in cross-sectional studies (22, 23),which may reflect a prescription bias because physicians weremore likely to prescribe estrogen to leaner women or to womenwith menopausal symptoms. Obviously, data related to the effectof hormone therapy on lean body mass are scarce, and moreresearch with direct measurements on lean tissue mass is needed.
The mechanism by which E�P therapy maintains lean bodymass is not well understood. Androgens increase lean soft tissuemass in postmenopausal women, but a drop in bioactive-freetestosterone was found to be associated with hormone therapy(24). In a cross-sectional study, estrogen users had lower insulin-like growth factor I concentrations than did nonusers (25). How-ever, a 10-mo hormone intervention (2 mg estradiol-valerate and10 mg dydrogesterone) increased the release of growth hormoneand various growth factors (26), which play important roles inmuscle growth and development. This finding suggests that themaintenance of lean body mass via E�P therapy may be medi-ated by growth hormone and growth factors instead of andro-gens; however, more direct evidence of whether these factorslink E�P therapy and body composition is needed.
Maintaining lean body mass in older age may be beneficial forbetter balance and, in turn, for reducing the number of falls.Central body fat distribution has been linked with insulin resis-tance. Results from the WHI trial showed that E�P interventionreduced both the risk of fracture (27) and the incidence of dia-betes (20). Whether the reductions in the incidence rates of frac-tures and diabetes were partially mediated through E�P thera-py–induced changes in body composition deserves additionalinvestigation.
The major strengths of the present substudy were the relativelylarge sample size, the randomized and placebo-controlled de-sign, the longer duration of follow-up, and the use of DXA scans(a state-of-the-art technique in assessing body composition) inambulatory, multiethnic, postmenopausal women. If we had onlyused weight or BMI as a proxy for body-composition measure-ments, then a stable body weight or BMI would have masked thegain in fat mass in women who were assigned to the placebogroup because a loss in lean tissue mass would cancel out a gainin fat. Similarly, BMI and weight measurements would havesuggested that E�P therapy increases adiposity, but, in fact, thewomen who received E�P therapy gained more weight than didthe women who received placebo only because of an increase inlean body mass and not because of an increase in body fat mass.
The present substudy included a subsample of women from theWHI E�P intervention trial from the 3 WHI centers where DXAmeasurements were conducted. Because the block randomiza-tion was done by clinical center, the randomization was wellpreserved, as indicated by the lack of significant differences inbaseline body-composition measurements by intervention group
BODY COMPOSITION AND HORMONE THERAPY IN OLDER WOMEN 655
in the subsample. The mean BMI and mean age in the subsamplewere similar to the mean BMI and mean age of the entire WHIE�P cohort by intervention assignments at baseline (4). Al-though the subsample differed slightly from the entire E�P co-hort in race and ethnicity composition, hormone use, and smok-ing history, the findings from this substudy would probably besimilar if the analyses were done on the entire WHI E�P cohort.In the present substudy, body-composition data were availablefor only 2 time points: baseline and year 3. This prevented usfrom assessing any trends in the changes in body compositionand also limited the investigation to the effects of E�P therapyon body composition for only the first 3 y of intervention. Theeffect sizes of E�P therapy on body composition might be largerfor the entire average 5.6-y intervention period.
In conclusion, we found that E�P intervention maintains leanbody mass and reduces upper-body fat distribution in postmeno-pausal women. However, the effect sizes observed in this studywere small, and the clinical implications of these changes in bodycomposition remain to be investigated.
We thank the WHI investigators and staff at the clinical centers, clinicalcoordinating center, and project office (Internet: www.whi.org/about) fortheir contributions.
ZC developed the manuscript and all other authors contributed to thewriting of the manuscript. TB provided the resources and participated in thestudy design. SBG conducted the statistical analyses and helped to interpretthe results. JAC contributed to the data collection. RDJ and ML contributedto the study design. AZL contributed to the study design and to the analysisplan. MLS contributed to the interpretation of the study results. KLM con-tributed to the study design, the analysis plan, and the interpretation of thestudy results. None of the authors had any conflicts of interest.
REFERENCES1. Gambacciani M, Ciaponi M, Cappagli B, De Simone L, Orlandi R,
Genazzani AR. Prospective evaluation of body weight and body fatdistribution in early postmenopausal women with and without hormonalreplacement therapy. Maturitas 2001;39:125–32.
2. Sorensen MB, Rosenfalck AM, Hojgaard L, Ottesen B. Obesity andsarcopenia after menopause are reversed by sex hormone replacementtherapy. Obes Res 2001;9:622–6.
3. Kristensen K, Pedersen SB, Vestergaard P, Mosekilde L, Richelsen B.Hormone replacement therapy affects body composition and leptin dif-ferently in obese and non-obese postmenopausal women. J Endocrinol1999;163:55–62.
4. Rossouw JE, Anderson GL, Prentice RL, et al. Risks and benefits ofestrogen plus progestin in healthy postmenopausal women: principalresults from the Women’s Health Initiative randomized controlled trial.JAMA 2002;288:321–33.
5. The Women’s Health Initiative Study Group. Design of the Women’sHealth Initiative clinical trial and observational study. Control ClinTrials 1998;19:61–109.
6. Block G, Woods M, Potosky A, Clifford C. Validation of a self-administered diet history questionnaire using multiple diet records.J Clin Epidemiol 1990;43:1327–35.
7. Patterson RE, Kristal AR, Coates RJ, et al. Low-fat diet practices of olderwomen: prevalence and implications for dietary assessment. J Am DietAssoc 1996;96:670–9.
8. Ainsworth BE, Haskell WL, Leon AS, et al. Compendium of physicalactivities: classification of energy costs of human physical activities.Med Sci Sports Exerc 1993;25:71–80.
9. Ware JE Jr, Sherbourne CD. The MOS 36-item short-form health survey
(SF-36). I. Conceptual framework and item selection. Med Care 1992;30:473–83.
10. Espeland MA, Stefanick ML, Kritz-Silverstein D, et al. Effect of post-menopausal hormone therapy on body weight and waist and hip girths.J Clin Endocrinol Metab 1997;82:1549–56.
11. Jensen LB, Vestergaard P, Hermann AP, et al. Hormone replacementtherapy dissociates fat mass and bone mass, and tends to reduce weightgain in early postmenopausal women: a randomized controlled 5-yearclinical trial of the Danish Osteoporosis Prevention Study. J Bone MinerRes 2003;18:333–42.
12. Ijuin H, Douchi T, Oki T, Maruta K, Nagata Y. The contribution ofmenopause to changes in body-fat distribution. J Obstet Gynaecol Res1999;25:367–72.
13. Aloia JF, Vaswani A, Russo L, Sheehan M, Flaster E. The influence ofmenopause and hormonal replacement therapy on body cell mass andbody fat mass. Am J Obstet Gynecol 1995;172:896–900.
14. Gambacciani M, Ciaponi M, Cappagli B, et al. Body weight, body fatdistribution, and hormonal replacement therapy in early postmenopausalwomen. J Clin Endocrinol Metab 1997;82:414–7.
15. Davis SR, Walker KZ, Strauss BJ. Effects of estradiol with and withouttestosterone on body composition and relationships with lipids in post-menopausal women. Menopause 2000;7:395–401.
16. Reubinoff BE, Wurtman J, Rojansky N, et al. Effects of hormone re-placement therapy on weight, body composition, fat distribution, andfood intake in early postmenopausal women: a prospective study. FertilSteril 1995;64:963–8.
17. Perrone G, Liu Y, Capri O, et al. Evaluation of the body composition andfat distribution in long-term users of hormone replacement therapy.Gynecol Obstet Invest 1999;48:52–5.
18. Samaras K, Kelly PJ, Spector TD, Chiano MN, Campbell LV. Tobaccosmoking and oestrogen replacement are associated with lower total andcentral fat in monozygotic twins. Int J Obes Relat Metab Disord 1998;22:149–56.
19. Greenfield JR, Samaras K, Jenkins AB, Kelly PJ, Spector TD, CampbellLV. Moderate alcohol consumption, estrogen replacement therapy, andphysical activity are associated with increased insulin sensitivity: isabdominal adiposity the mediator? Diabetes Care 2003;26:2734–40.
20. Margolis KL, Bonds DE, Rodabough RJ, et al. Effect of oestrogen plusprogestin on the incidence of diabetes in postmenopausal women: resultsfrom the Women’s Health Initiative Hormone Trial. Diabetologia 2004;47:1175–87.
21. Jensen J, Christiansen C, Rodbro P. Oestrogen-progestogen replacementtherapy changes body composition in early post-menopausal women.Maturitas 1986;8:209–16.
22. Dittmar M. Comparison of soft tissue body composition in postmeno-pausal women with or without hormone replacement therapy consider-ing the influence of reproductive history and lifestyle. Ann Hum Biol2001;28:207–21.
23. Bemben DA, Langdon DB. Relationship between estrogen use and mus-culoskeletal function in postmenopausal women. Maturitas 2002;42:119–27.
24. Sarrel P, Dobay B, Wiita B. Estrogen and estrogen-androgen replace-ment in postmenopausal women dissatisfied with estrogen-only therapy.Sexual behavior and neuroendocrine responses. J Reprod Med 1998;43:847–56.
25. Chang S, Wu X, Yu H, Spitz MR. Plasma concentrations of insulin-likegrowth factors among healthy adult men and postmenopausal women:associations with body composition, lifestyle, and reproductive factors.Cancer Epidemiol Biomarkers Prev 2002;11:758–66.
26. Hartmann B, Kirchengast S, Albrecht A, Laml T, Bikas D, Huber J.Effects of hormone replacement therapy on growth hormone secretionpatterns in correlation to somatometric parameters in healthy postmeno-pausal women. Maturitas 1995;22:239–46.
27. Cauley JA, Robbins J, Chen Z, et al. Effects of estrogen plus progestinon risk of fracture and bone mineral density: the Women’s Health Ini-tiative randomized trial. JAMA 2003;290:1729–38.
656 CHEN ET AL
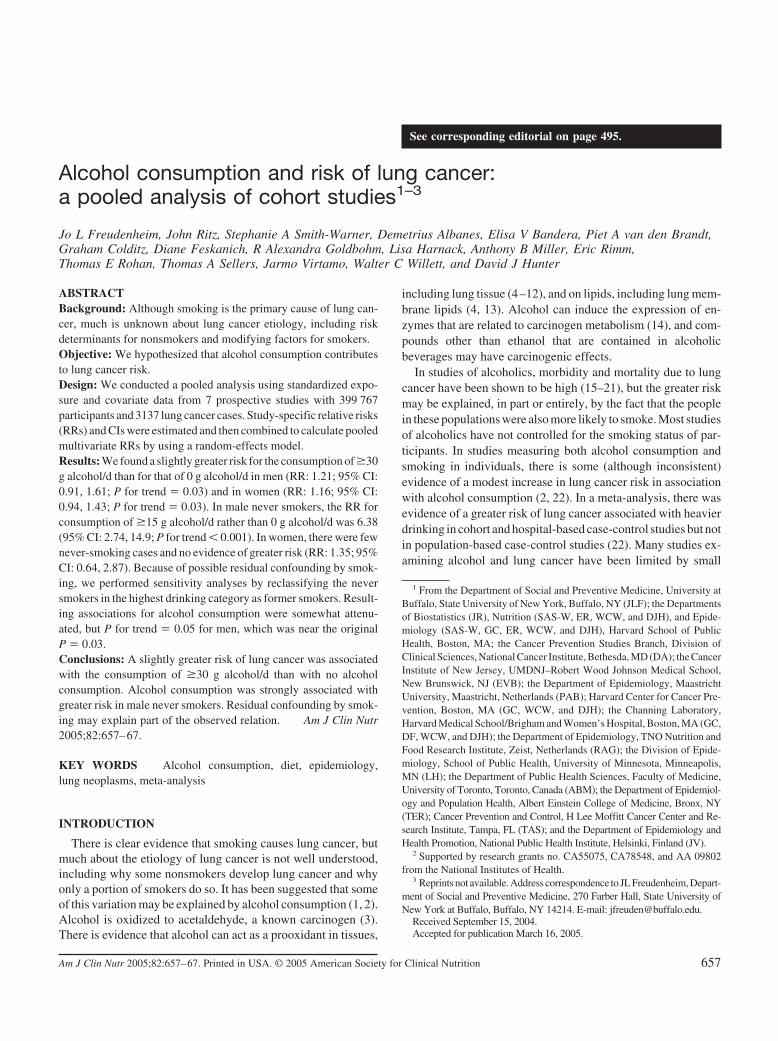
See corresponding editorial on page 495.
Alcohol consumption and risk of lung cancer:a pooled analysis of cohort studies1–3
Jo L Freudenheim, John Ritz, Stephanie A Smith-Warner, Demetrius Albanes, Elisa V Bandera, Piet A van den Brandt,Graham Colditz, Diane Feskanich, R Alexandra Goldbohm, Lisa Harnack, Anthony B Miller, Eric Rimm,Thomas E Rohan, Thomas A Sellers, Jarmo Virtamo, Walter C Willett, and David J Hunter
ABSTRACTBackground: Although smoking is the primary cause of lung can-cer, much is unknown about lung cancer etiology, including riskdeterminants for nonsmokers and modifying factors for smokers.Objective: We hypothesized that alcohol consumption contributesto lung cancer risk.Design: We conducted a pooled analysis using standardized expo-sure and covariate data from 7 prospective studies with 399 767participants and 3137 lung cancer cases. Study-specific relative risks(RRs) and CIs were estimated and then combined to calculate pooledmultivariate RRs by using a random-effects model.Results: We found a slightly greater risk for the consumption of �30g alcohol/d than for that of 0 g alcohol/d in men (RR: 1.21; 95% CI:0.91, 1.61; P for trend � 0.03) and in women (RR: 1.16; 95% CI:0.94, 1.43; P for trend � 0.03). In male never smokers, the RR forconsumption of �15 g alcohol/d rather than 0 g alcohol/d was 6.38(95% CI: 2.74, 14.9; P for trend � 0.001). In women, there were fewnever-smoking cases and no evidence of greater risk (RR: 1.35; 95%CI: 0.64, 2.87). Because of possible residual confounding by smok-ing, we performed sensitivity analyses by reclassifying the neversmokers in the highest drinking category as former smokers. Result-ing associations for alcohol consumption were somewhat attenu-ated, but P for trend � 0.05 for men, which was near the originalP � 0.03.Conclusions: A slightly greater risk of lung cancer was associatedwith the consumption of �30 g alcohol/d than with no alcoholconsumption. Alcohol consumption was strongly associated withgreater risk in male never smokers. Residual confounding by smok-ing may explain part of the observed relation. Am J Clin Nutr2005;82:657–67.
KEY WORDS Alcohol consumption, diet, epidemiology,lung neoplasms, meta-analysis
INTRODUCTION
There is clear evidence that smoking causes lung cancer, butmuch about the etiology of lung cancer is not well understood,including why some nonsmokers develop lung cancer and whyonly a portion of smokers do so. It has been suggested that someof this variation may be explained by alcohol consumption (1, 2).Alcohol is oxidized to acetaldehyde, a known carcinogen (3).There is evidence that alcohol can act as a prooxidant in tissues,
including lung tissue (4–12), and on lipids, including lung mem-brane lipids (4, 13). Alcohol can induce the expression of en-zymes that are related to carcinogen metabolism (14), and com-pounds other than ethanol that are contained in alcoholicbeverages may have carcinogenic effects.
In studies of alcoholics, morbidity and mortality due to lungcancer have been shown to be high (15–21), but the greater riskmay be explained, in part or entirely, by the fact that the peoplein these populations were also more likely to smoke. Most studiesof alcoholics have not controlled for the smoking status of par-ticipants. In studies measuring both alcohol consumption andsmoking in individuals, there is some (although inconsistent)evidence of a modest increase in lung cancer risk in associationwith alcohol consumption (2, 22). In a meta-analysis, there wasevidence of a greater risk of lung cancer associated with heavierdrinking in cohort and hospital-based case-control studies but notin population-based case-control studies (22). Many studies ex-amining alcohol and lung cancer have been limited by small
1 From the Department of Social and Preventive Medicine, University atBuffalo, State University of New York, Buffalo, NY (JLF); the Departmentsof Biostatistics (JR), Nutrition (SAS-W, ER, WCW, and DJH), and Epide-miology (SAS-W, GC, ER, WCW, and DJH), Harvard School of PublicHealth, Boston, MA; the Cancer Prevention Studies Branch, Division ofClinical Sciences, National Cancer Institute, Bethesda, MD (DA); the CancerInstitute of New Jersey, UMDNJ–Robert Wood Johnson Medical School,New Brunswick, NJ (EVB); the Department of Epidemiology, MaastrichtUniversity, Maastricht, Netherlands (PAB); Harvard Center for Cancer Pre-vention, Boston, MA (GC, WCW, and DJH); the Channing Laboratory,Harvard Medical School/Brigham and Women’s Hospital, Boston, MA (GC,DF, WCW, and DJH); the Department of Epidemiology, TNO Nutrition andFood Research Institute, Zeist, Netherlands (RAG); the Division of Epide-miology, School of Public Health, University of Minnesota, Minneapolis,MN (LH); the Department of Public Health Sciences, Faculty of Medicine,University of Toronto, Toronto, Canada (ABM); the Department of Epidemiol-ogy and Population Health, Albert Einstein College of Medicine, Bronx, NY(TER); Cancer Prevention and Control, H Lee Moffitt Cancer Center and Re-search Institute, Tampa, FL (TAS); and the Department of Epidemiology andHealth Promotion, National Public Health Institute, Helsinki, Finland (JV).
2 Supported by research grants no. CA55075, CA78548, and AA 09802from the National Institutes of Health.
3 Reprints not available. Address correspondence to JL Freudenheim, Depart-ment of Social and Preventive Medicine, 270 Farber Hall, State University ofNew York at Buffalo, Buffalo, NY 14214. E-mail: [email protected].
Received September 15, 2004.Accepted for publication March 16, 2005.
657Am J Clin Nutr 2005;82:657–67. Printed in USA. © 2005 American Society for Clinical Nutrition
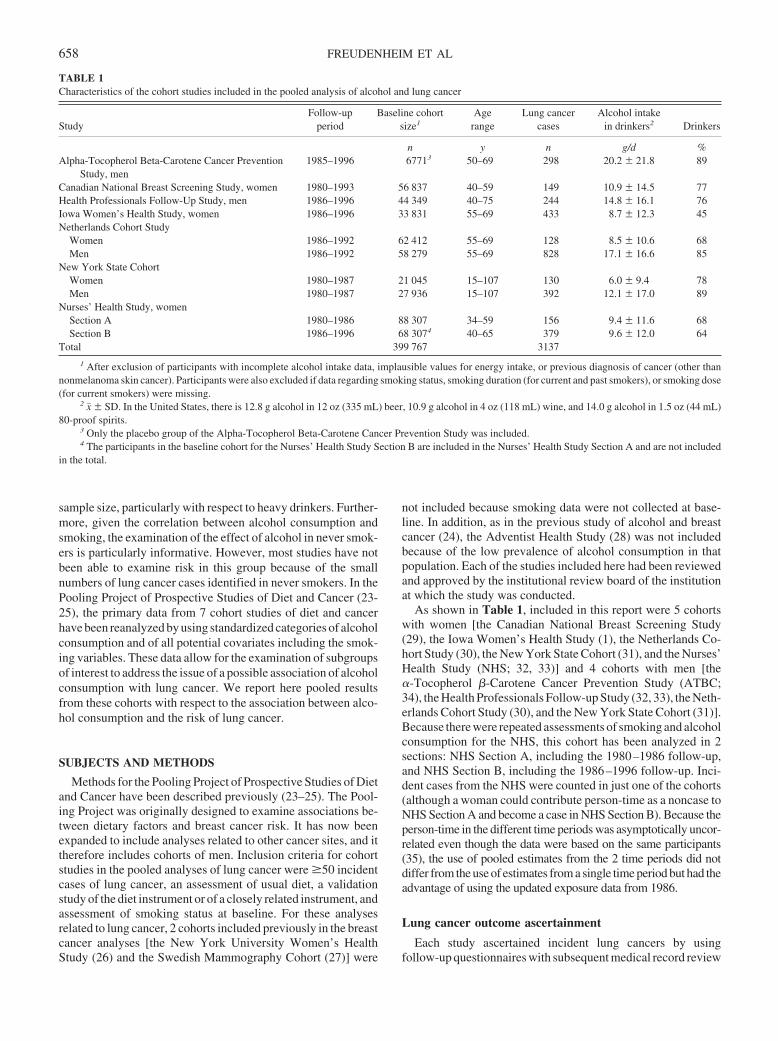
sample size, particularly with respect to heavy drinkers. Further-more, given the correlation between alcohol consumption andsmoking, the examination of the effect of alcohol in never smok-ers is particularly informative. However, most studies have notbeen able to examine risk in this group because of the smallnumbers of lung cancer cases identified in never smokers. In thePooling Project of Prospective Studies of Diet and Cancer (23-25), the primary data from 7 cohort studies of diet and cancerhave been reanalyzed by using standardized categories of alcoholconsumption and of all potential covariates including the smok-ing variables. These data allow for the examination of subgroupsof interest to address the issue of a possible association of alcoholconsumption with lung cancer. We report here pooled resultsfrom these cohorts with respect to the association between alco-hol consumption and the risk of lung cancer.
SUBJECTS AND METHODS
Methods for the Pooling Project of Prospective Studies of Dietand Cancer have been described previously (23–25). The Pool-ing Project was originally designed to examine associations be-tween dietary factors and breast cancer risk. It has now beenexpanded to include analyses related to other cancer sites, and ittherefore includes cohorts of men. Inclusion criteria for cohortstudies in the pooled analyses of lung cancer were �50 incidentcases of lung cancer, an assessment of usual diet, a validationstudy of the diet instrument or of a closely related instrument, andassessment of smoking status at baseline. For these analysesrelated to lung cancer, 2 cohorts included previously in the breastcancer analyses [the New York University Women’s HealthStudy (26) and the Swedish Mammography Cohort (27)] were
not included because smoking data were not collected at base-line. In addition, as in the previous study of alcohol and breastcancer (24), the Adventist Health Study (28) was not includedbecause of the low prevalence of alcohol consumption in thatpopulation. Each of the studies included here had been reviewedand approved by the institutional review board of the institutionat which the study was conducted.
As shown in Table 1, included in this report were 5 cohortswith women [the Canadian National Breast Screening Study(29), the Iowa Women’s Health Study (1), the Netherlands Co-hort Study (30), the New York State Cohort (31), and the Nurses’Health Study (NHS; 32, 33)] and 4 cohorts with men [the�-Tocopherol �-Carotene Cancer Prevention Study (ATBC;34), the Health Professionals Follow-up Study (32, 33), the Neth-erlands Cohort Study (30), and the New York State Cohort (31)].Because there were repeated assessments of smoking and alcoholconsumption for the NHS, this cohort has been analyzed in 2sections: NHS Section A, including the 1980–1986 follow-up,and NHS Section B, including the 1986–1996 follow-up. Inci-dent cases from the NHS were counted in just one of the cohorts(although a woman could contribute person-time as a noncase toNHS Section A and become a case in NHS Section B). Because theperson-time in the different time periods was asymptotically uncor-related even though the data were based on the same participants(35), the use of pooled estimates from the 2 time periods did notdiffer from the use of estimates from a single time period but had theadvantage of using the updated exposure data from 1986.
Lung cancer outcome ascertainment
Each study ascertained incident lung cancers by usingfollow-up questionnaires with subsequent medical record review
TABLE 1Characteristics of the cohort studies included in the pooled analysis of alcohol and lung cancer
StudyFollow-up
periodBaseline cohort
size1Age
rangeLung cancer
casesAlcohol intake
in drinkers2 Drinkers
n y n g/d %Alpha-Tocopherol Beta-Carotene Cancer Prevention
Study, men1985–1996 67713 50–69 298 20.2 � 21.8 89
Canadian National Breast Screening Study, women 1980–1993 56 837 40–59 149 10.9 � 14.5 77Health Professionals Follow-Up Study, men 1986–1996 44 349 40–75 244 14.8 � 16.1 76Iowa Women’s Health Study, women 1986–1996 33 831 55–69 433 8.7 � 12.3 45Netherlands Cohort Study
Women 1986–1992 62 412 55–69 128 8.5 � 10.6 68Men 1986–1992 58 279 55–69 828 17.1 � 16.6 85
New York State CohortWomen 1980–1987 21 045 15–107 130 6.0 � 9.4 78Men 1980–1987 27 936 15–107 392 12.1 � 17.0 89
Nurses’ Health Study, womenSection A 1980–1986 88 307 34–59 156 9.4 � 11.6 68Section B 1986–1996 68 3074 40–65 379 9.6 � 12.0 64
Total 399 767 3137
1 After exclusion of participants with incomplete alcohol intake data, implausible values for energy intake, or previous diagnosis of cancer (other thannonmelanoma skin cancer). Participants were also excluded if data regarding smoking status, smoking duration (for current and past smokers), or smoking dose(for current smokers) were missing.
2 x� � SD. In the United States, there is 12.8 g alcohol in 12 oz (335 mL) beer, 10.9 g alcohol in 4 oz (118 mL) wine, and 14.0 g alcohol in 1.5 oz (44 mL)80-proof spirits.
3 Only the placebo group of the Alpha-Tocopherol Beta-Carotene Cancer Prevention Study was included.4 The participants in the baseline cohort for the Nurses’ Health Study Section B are included in the Nurses’ Health Study Section A and are not included
in the total.
658 FREUDENHEIM ET AL
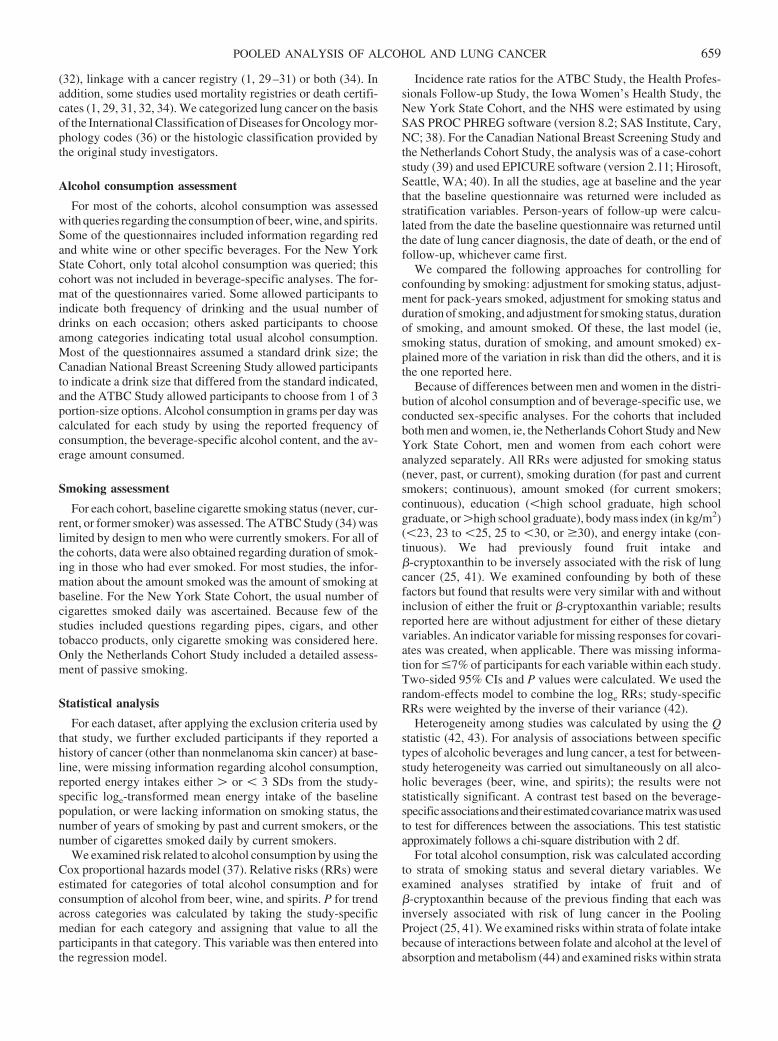
(32), linkage with a cancer registry (1, 29–31) or both (34). Inaddition, some studies used mortality registries or death certifi-cates (1, 29, 31, 32, 34). We categorized lung cancer on the basisof the International Classification of Diseases for Oncology mor-phology codes (36) or the histologic classification provided bythe original study investigators.
Alcohol consumption assessment
For most of the cohorts, alcohol consumption was assessedwith queries regarding the consumption of beer, wine, and spirits.Some of the questionnaires included information regarding redand white wine or other specific beverages. For the New YorkState Cohort, only total alcohol consumption was queried; thiscohort was not included in beverage-specific analyses. The for-mat of the questionnaires varied. Some allowed participants toindicate both frequency of drinking and the usual number ofdrinks on each occasion; others asked participants to chooseamong categories indicating total usual alcohol consumption.Most of the questionnaires assumed a standard drink size; theCanadian National Breast Screening Study allowed participantsto indicate a drink size that differed from the standard indicated,and the ATBC Study allowed participants to choose from 1 of 3portion-size options. Alcohol consumption in grams per day wascalculated for each study by using the reported frequency ofconsumption, the beverage-specific alcohol content, and the av-erage amount consumed.
Smoking assessment
For each cohort, baseline cigarette smoking status (never, cur-rent, or former smoker) was assessed. The ATBC Study (34) waslimited by design to men who were currently smokers. For all ofthe cohorts, data were also obtained regarding duration of smok-ing in those who had ever smoked. For most studies, the infor-mation about the amount smoked was the amount of smoking atbaseline. For the New York State Cohort, the usual number ofcigarettes smoked daily was ascertained. Because few of thestudies included questions regarding pipes, cigars, and othertobacco products, only cigarette smoking was considered here.Only the Netherlands Cohort Study included a detailed assess-ment of passive smoking.
Statistical analysis
For each dataset, after applying the exclusion criteria used bythat study, we further excluded participants if they reported ahistory of cancer (other than nonmelanoma skin cancer) at base-line, were missing information regarding alcohol consumption,reported energy intakes either � or � 3 SDs from the study-specific loge-transformed mean energy intake of the baselinepopulation, or were lacking information on smoking status, thenumber of years of smoking by past and current smokers, or thenumber of cigarettes smoked daily by current smokers.
We examined risk related to alcohol consumption by using theCox proportional hazards model (37). Relative risks (RRs) wereestimated for categories of total alcohol consumption and forconsumption of alcohol from beer, wine, and spirits. P for trendacross categories was calculated by taking the study-specificmedian for each category and assigning that value to all theparticipants in that category. This variable was then entered intothe regression model.
Incidence rate ratios for the ATBC Study, the Health Profes-sionals Follow-up Study, the Iowa Women’s Health Study, theNew York State Cohort, and the NHS were estimated by usingSAS PROC PHREG software (version 8.2; SAS Institute, Cary,NC; 38). For the Canadian National Breast Screening Study andthe Netherlands Cohort Study, the analysis was of a case-cohortstudy (39) and used EPICURE software (version 2.11; Hirosoft,Seattle, WA; 40). In all the studies, age at baseline and the yearthat the baseline questionnaire was returned were included asstratification variables. Person-years of follow-up were calcu-lated from the date the baseline questionnaire was returned untilthe date of lung cancer diagnosis, the date of death, or the end offollow-up, whichever came first.
We compared the following approaches for controlling forconfounding by smoking: adjustment for smoking status, adjust-ment for pack-years smoked, adjustment for smoking status andduration of smoking, and adjustment for smoking status, durationof smoking, and amount smoked. Of these, the last model (ie,smoking status, duration of smoking, and amount smoked) ex-plained more of the variation in risk than did the others, and it isthe one reported here.
Because of differences between men and women in the distri-bution of alcohol consumption and of beverage-specific use, weconducted sex-specific analyses. For the cohorts that includedboth men and women, ie, the Netherlands Cohort Study and NewYork State Cohort, men and women from each cohort wereanalyzed separately. All RRs were adjusted for smoking status(never, past, or current), smoking duration (for past and currentsmokers; continuous), amount smoked (for current smokers;continuous), education (�high school graduate, high schoolgraduate, or �high school graduate), body mass index (in kg/m2)(�23, 23 to �25, 25 to �30, or �30), and energy intake (con-tinuous). We had previously found fruit intake and�-cryptoxanthin to be inversely associated with the risk of lungcancer (25, 41). We examined confounding by both of thesefactors but found that results were very similar with and withoutinclusion of either the fruit or �-cryptoxanthin variable; resultsreported here are without adjustment for either of these dietaryvariables. An indicator variable for missing responses for covari-ates was created, when applicable. There was missing informa-tion for �7% of participants for each variable within each study.Two-sided 95% CIs and P values were calculated. We used therandom-effects model to combine the loge RRs; study-specificRRs were weighted by the inverse of their variance (42).
Heterogeneity among studies was calculated by using the Qstatistic (42, 43). For analysis of associations between specifictypes of alcoholic beverages and lung cancer, a test for between-study heterogeneity was carried out simultaneously on all alco-holic beverages (beer, wine, and spirits); the results were notstatistically significant. A contrast test based on the beverage-specificassociationsandtheirestimatedcovariancematrixwasusedto test for differences between the associations. This test statisticapproximately follows a chi-square distribution with 2 df.
For total alcohol consumption, risk was calculated accordingto strata of smoking status and several dietary variables. Weexamined analyses stratified by intake of fruit and of�-cryptoxanthin because of the previous finding that each wasinversely associated with risk of lung cancer in the PoolingProject (25, 41). We examined risks within strata of folate intakebecause of interactions between folate and alcohol at the level ofabsorption and metabolism (44) and examined risks within strata
POOLED ANALYSIS OF ALCOHOL AND LUNG CANCER 659
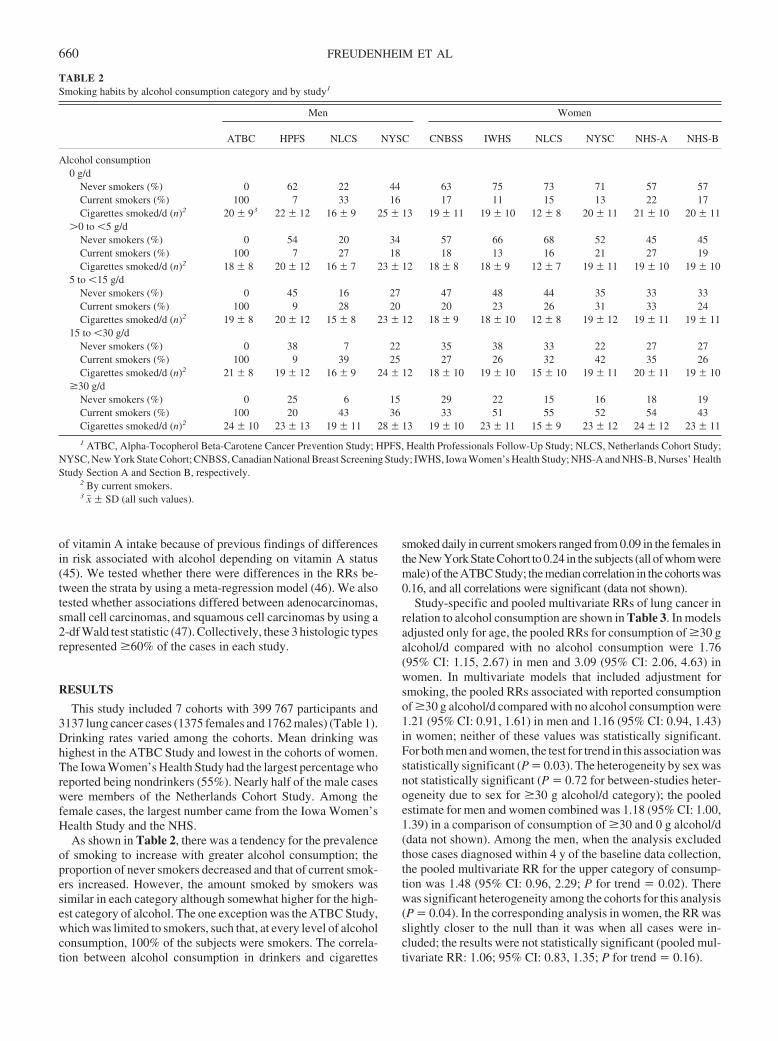
of vitamin A intake because of previous findings of differencesin risk associated with alcohol depending on vitamin A status(45). We tested whether there were differences in the RRs be-tween the strata by using a meta-regression model (46). We alsotested whether associations differed between adenocarcinomas,small cell carcinomas, and squamous cell carcinomas by using a2-df Wald test statistic (47). Collectively, these 3 histologic typesrepresented �60% of the cases in each study.
RESULTS
This study included 7 cohorts with 399 767 participants and3137 lung cancer cases (1375 females and 1762 males) (Table 1).Drinking rates varied among the cohorts. Mean drinking washighest in the ATBC Study and lowest in the cohorts of women.The Iowa Women’s Health Study had the largest percentage whoreported being nondrinkers (55%). Nearly half of the male caseswere members of the Netherlands Cohort Study. Among thefemale cases, the largest number came from the Iowa Women’sHealth Study and the NHS.
As shown in Table 2, there was a tendency for the prevalenceof smoking to increase with greater alcohol consumption; theproportion of never smokers decreased and that of current smok-ers increased. However, the amount smoked by smokers wassimilar in each category although somewhat higher for the high-est category of alcohol. The one exception was the ATBC Study,which was limited to smokers, such that, at every level of alcoholconsumption, 100% of the subjects were smokers. The correla-tion between alcohol consumption in drinkers and cigarettes
smoked daily in current smokers ranged from 0.09 in the females inthe New York State Cohort to 0.24 in the subjects (all of whom weremale) of the ATBC Study; the median correlation in the cohorts was0.16, and all correlations were significant (data not shown).
Study-specific and pooled multivariate RRs of lung cancer inrelation to alcohol consumption are shown in Table 3. In modelsadjusted only for age, the pooled RRs for consumption of �30 galcohol/d compared with no alcohol consumption were 1.76(95% CI: 1.15, 2.67) in men and 3.09 (95% CI: 2.06, 4.63) inwomen. In multivariate models that included adjustment forsmoking, the pooled RRs associated with reported consumptionof �30 g alcohol/d compared with no alcohol consumption were1.21 (95% CI: 0.91, 1.61) in men and 1.16 (95% CI: 0.94, 1.43)in women; neither of these values was statistically significant.For both men and women, the test for trend in this association wasstatistically significant (P � 0.03). The heterogeneity by sex wasnot statistically significant (P � 0.72 for between-studies heter-ogeneity due to sex for �30 g alcohol/d category); the pooledestimate for men and women combined was 1.18 (95% CI: 1.00,1.39) in a comparison of consumption of �30 and 0 g alcohol/d(data not shown). Among the men, when the analysis excludedthose cases diagnosed within 4 y of the baseline data collection,the pooled multivariate RR for the upper category of consump-tion was 1.48 (95% CI: 0.96, 2.29; P for trend � 0.02). Therewas significant heterogeneity among the cohorts for this analysis(P � 0.04). In the corresponding analysis in women, the RR wasslightly closer to the null than it was when all cases were in-cluded; the results were not statistically significant (pooled mul-tivariate RR: 1.06; 95% CI: 0.83, 1.35; P for trend � 0.16).
TABLE 2Smoking habits by alcohol consumption category and by study1
Men Women
ATBC HPFS NLCS NYSC CNBSS IWHS NLCS NYSC NHS-A NHS-B
Alcohol consumption0 g/d
Never smokers (%) 0 62 22 44 63 75 73 71 57 57Current smokers (%) 100 7 33 16 17 11 15 13 22 17Cigarettes smoked/d (n)2 20 � 93 22 � 12 16 � 9 25 � 13 19 � 11 19 � 10 12 � 8 20 � 11 21 � 10 20 � 11
�0 to �5 g/dNever smokers (%) 0 54 20 34 57 66 68 52 45 45Current smokers (%) 100 7 27 18 18 13 16 21 27 19Cigarettes smoked/d (n)2 18 � 8 20 � 12 16 � 7 23 � 12 18 � 8 18 � 9 12 � 7 19 � 11 19 � 10 19 � 10
5 to �15 g/dNever smokers (%) 0 45 16 27 47 48 44 35 33 33Current smokers (%) 100 9 28 20 20 23 26 31 33 24Cigarettes smoked/d (n)2 19 � 8 20 � 12 15 � 8 23 � 12 18 � 9 18 � 10 12 � 8 19 � 12 19 � 11 19 � 11
15 to �30 g/dNever smokers (%) 0 38 7 22 35 38 33 22 27 27Current smokers (%) 100 9 39 25 27 26 32 42 35 26Cigarettes smoked/d (n)2 21 � 8 19 � 12 16 � 9 24 � 12 18 � 10 19 � 10 15 � 10 19 � 11 20 � 11 19 � 10
�30 g/dNever smokers (%) 0 25 6 15 29 22 15 16 18 19Current smokers (%) 100 20 43 36 33 51 55 52 54 43Cigarettes smoked/d (n)2 24 � 10 23 � 13 19 � 11 28 � 13 19 � 10 23 � 11 15 � 9 23 � 12 24 � 12 23 � 11
1 ATBC, Alpha-Tocopherol Beta-Carotene Cancer Prevention Study; HPFS, Health Professionals Follow-Up Study; NLCS, Netherlands Cohort Study;NYSC, New York State Cohort; CNBSS, Canadian National Breast Screening Study; IWHS, Iowa Women’s Health Study; NHS-A and NHS-B, Nurses’ HealthStudy Section A and Section B, respectively.
2 By current smokers.3 x� � SD (all such values).
660 FREUDENHEIM ET AL
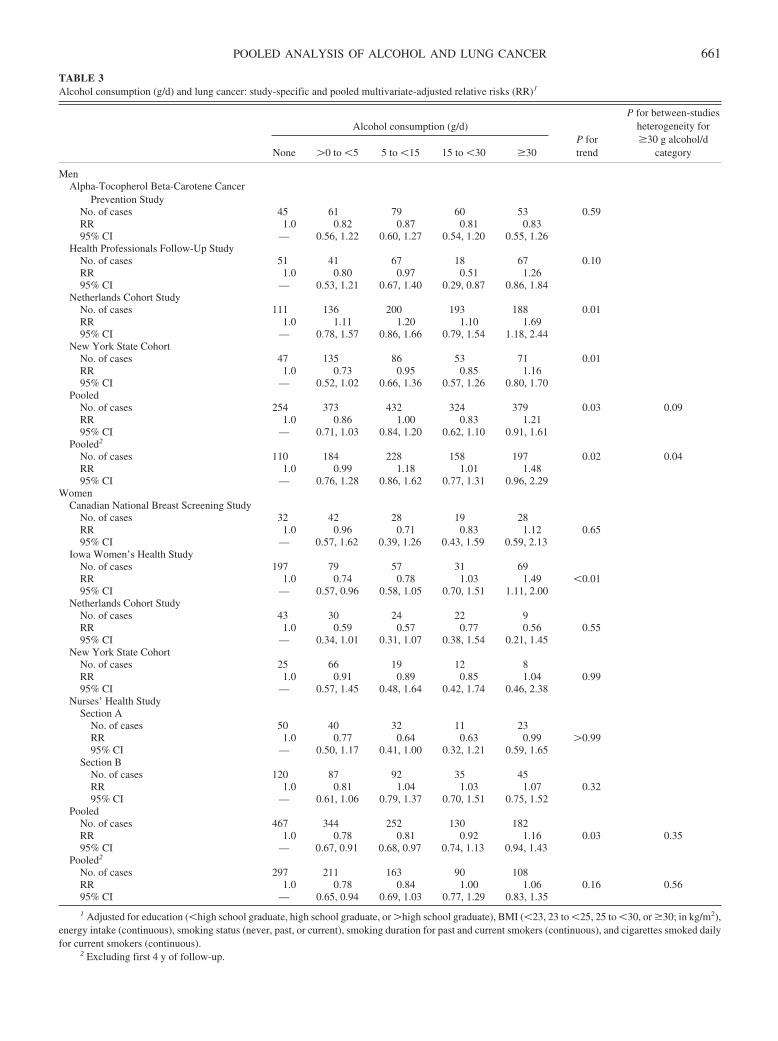
TABLE 3Alcohol consumption (g/d) and lung cancer: study-specific and pooled multivariate-adjusted relative risks (RR)1
Alcohol consumption (g/d)P fortrend
P for between-studiesheterogeneity for�30 g alcohol/d
categoryNone �0 to �5 5 to �15 15 to �30 �30
MenAlpha-Tocopherol Beta-Carotene Cancer
Prevention StudyNo. of cases 45 61 79 60 53 0.59RR 1.0 0.82 0.87 0.81 0.8395% CI — 0.56, 1.22 0.60, 1.27 0.54, 1.20 0.55, 1.26
Health Professionals Follow-Up StudyNo. of cases 51 41 67 18 67 0.10RR 1.0 0.80 0.97 0.51 1.2695% CI — 0.53, 1.21 0.67, 1.40 0.29, 0.87 0.86, 1.84
Netherlands Cohort StudyNo. of cases 111 136 200 193 188 0.01RR 1.0 1.11 1.20 1.10 1.6995% CI — 0.78, 1.57 0.86, 1.66 0.79, 1.54 1.18, 2.44
New York State CohortNo. of cases 47 135 86 53 71 0.01RR 1.0 0.73 0.95 0.85 1.1695% CI — 0.52, 1.02 0.66, 1.36 0.57, 1.26 0.80, 1.70
PooledNo. of cases 254 373 432 324 379 0.03 0.09RR 1.0 0.86 1.00 0.83 1.2195% CI — 0.71, 1.03 0.84, 1.20 0.62, 1.10 0.91, 1.61
Pooled2
No. of cases 110 184 228 158 197 0.02 0.04RR 1.0 0.99 1.18 1.01 1.4895% CI — 0.76, 1.28 0.86, 1.62 0.77, 1.31 0.96, 2.29
WomenCanadian National Breast Screening Study
No. of cases 32 42 28 19 28RR 1.0 0.96 0.71 0.83 1.12 0.6595% CI — 0.57, 1.62 0.39, 1.26 0.43, 1.59 0.59, 2.13
Iowa Women’s Health StudyNo. of cases 197 79 57 31 69RR 1.0 0.74 0.78 1.03 1.49 �0.0195% CI — 0.57, 0.96 0.58, 1.05 0.70, 1.51 1.11, 2.00
Netherlands Cohort StudyNo. of cases 43 30 24 22 9RR 1.0 0.59 0.57 0.77 0.56 0.5595% CI — 0.34, 1.01 0.31, 1.07 0.38, 1.54 0.21, 1.45
New York State CohortNo. of cases 25 66 19 12 8RR 1.0 0.91 0.89 0.85 1.04 0.9995% CI — 0.57, 1.45 0.48, 1.64 0.42, 1.74 0.46, 2.38
Nurses’ Health StudySection A
No. of cases 50 40 32 11 23RR 1.0 0.77 0.64 0.63 0.99 �0.9995% CI — 0.50, 1.17 0.41, 1.00 0.32, 1.21 0.59, 1.65
Section BNo. of cases 120 87 92 35 45RR 1.0 0.81 1.04 1.03 1.07 0.3295% CI — 0.61, 1.06 0.79, 1.37 0.70, 1.51 0.75, 1.52
PooledNo. of cases 467 344 252 130 182RR 1.0 0.78 0.81 0.92 1.16 0.03 0.3595% CI — 0.67, 0.91 0.68, 0.97 0.74, 1.13 0.94, 1.43
Pooled2
No. of cases 297 211 163 90 108RR 1.0 0.78 0.84 1.00 1.06 0.16 0.5695% CI — 0.65, 0.94 0.69, 1.03 0.77, 1.29 0.83, 1.35
1 Adjusted for education (�high school graduate, high school graduate, or �high school graduate), BMI (�23, 23 to �25, 25 to �30, or �30; in kg/m2),energy intake (continuous), smoking status (never, past, or current), smoking duration for past and current smokers (continuous), and cigarettes smoked dailyfor current smokers (continuous).
2 Excluding first 4 y of follow-up.
POOLED ANALYSIS OF ALCOHOL AND LUNG CANCER 661
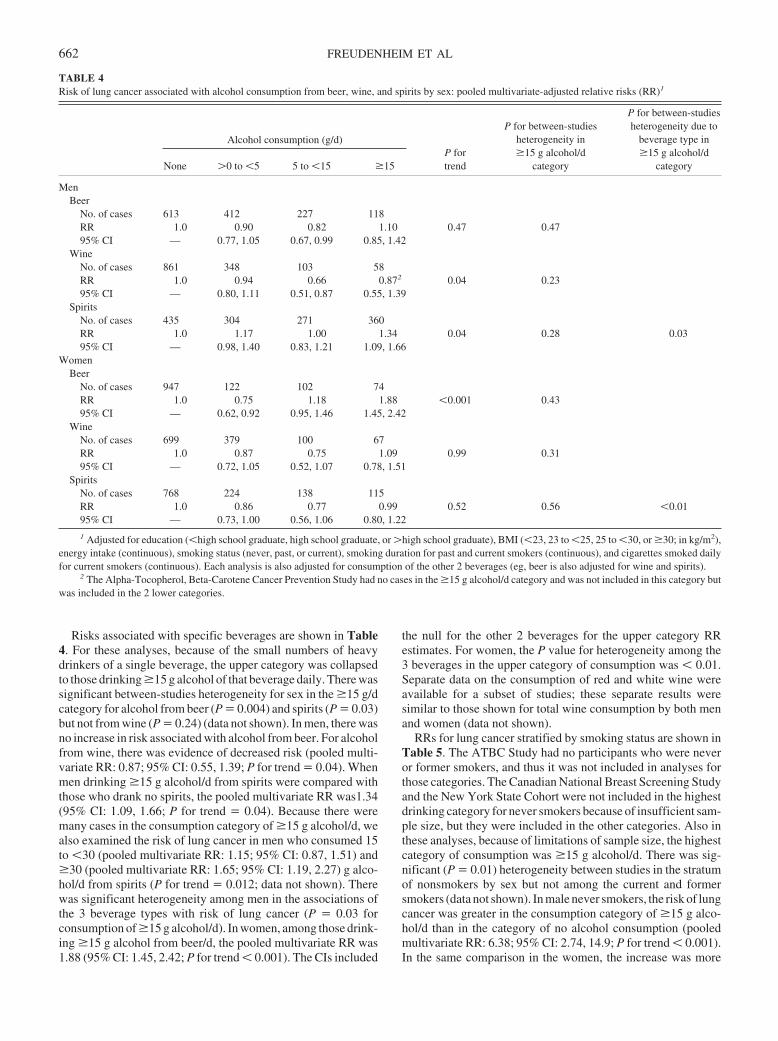
Risks associated with specific beverages are shown in Table4. For these analyses, because of the small numbers of heavydrinkers of a single beverage, the upper category was collapsedto those drinking �15 g alcohol of that beverage daily. There wassignificant between-studies heterogeneity for sex in the �15 g/dcategory for alcohol from beer (P � 0.004) and spirits (P � 0.03)but not from wine (P � 0.24) (data not shown). In men, there wasno increase in risk associated with alcohol from beer. For alcoholfrom wine, there was evidence of decreased risk (pooled multi-variate RR: 0.87; 95% CI: 0.55, 1.39; P for trend � 0.04). Whenmen drinking �15 g alcohol/d from spirits were compared withthose who drank no spirits, the pooled multivariate RR was1.34(95% CI: 1.09, 1.66; P for trend � 0.04). Because there weremany cases in the consumption category of �15 g alcohol/d, wealso examined the risk of lung cancer in men who consumed 15to �30 (pooled multivariate RR: 1.15; 95% CI: 0.87, 1.51) and�30 (pooled multivariate RR: 1.65; 95% CI: 1.19, 2.27) g alco-hol/d from spirits (P for trend � 0.012; data not shown). Therewas significant heterogeneity among men in the associations ofthe 3 beverage types with risk of lung cancer (P � 0.03 forconsumption of �15 g alcohol/d). In women, among those drink-ing �15 g alcohol from beer/d, the pooled multivariate RR was1.88 (95% CI: 1.45, 2.42; P for trend � 0.001). The CIs included
the null for the other 2 beverages for the upper category RRestimates. For women, the P value for heterogeneity among the3 beverages in the upper category of consumption was � 0.01.Separate data on the consumption of red and white wine wereavailable for a subset of studies; these separate results weresimilar to those shown for total wine consumption by both menand women (data not shown).
RRs for lung cancer stratified by smoking status are shown inTable 5. The ATBC Study had no participants who were neveror former smokers, and thus it was not included in analyses forthose categories. The Canadian National Breast Screening Studyand the New York State Cohort were not included in the highestdrinking category for never smokers because of insufficient sam-ple size, but they were included in the other categories. Also inthese analyses, because of limitations of sample size, the highestcategory of consumption was �15 g alcohol/d. There was sig-nificant (P � 0.01) heterogeneity between studies in the stratumof nonsmokers by sex but not among the current and formersmokers (data not shown). In male never smokers, the risk of lungcancer was greater in the consumption category of �15 g alco-hol/d than in the category of no alcohol consumption (pooledmultivariate RR: 6.38; 95% CI: 2.74, 14.9; P for trend � 0.001).In the same comparison in the women, the increase was more
TABLE 4Risk of lung cancer associated with alcohol consumption from beer, wine, and spirits by sex: pooled multivariate-adjusted relative risks (RR)1
Alcohol consumption (g/d)P fortrend
P for between-studiesheterogeneity in�15 g alcohol/d
category
P for between-studiesheterogeneity due to
beverage type in�15 g alcohol/d
categoryNone �0 to �5 5 to �15 �15
MenBeer
No. of cases 613 412 227 118RR 1.0 0.90 0.82 1.10 0.47 0.4795% CI — 0.77, 1.05 0.67, 0.99 0.85, 1.42
WineNo. of cases 861 348 103 58RR 1.0 0.94 0.66 0.872 0.04 0.2395% CI — 0.80, 1.11 0.51, 0.87 0.55, 1.39
SpiritsNo. of cases 435 304 271 360RR 1.0 1.17 1.00 1.34 0.04 0.28 0.0395% CI — 0.98, 1.40 0.83, 1.21 1.09, 1.66
WomenBeer
No. of cases 947 122 102 74RR 1.0 0.75 1.18 1.88 �0.001 0.4395% CI — 0.62, 0.92 0.95, 1.46 1.45, 2.42
WineNo. of cases 699 379 100 67RR 1.0 0.87 0.75 1.09 0.99 0.3195% CI — 0.72, 1.05 0.52, 1.07 0.78, 1.51
SpiritsNo. of cases 768 224 138 115RR 1.0 0.86 0.77 0.99 0.52 0.56 �0.0195% CI — 0.73, 1.00 0.56, 1.06 0.80, 1.22
1 Adjusted for education (�high school graduate, high school graduate, or �high school graduate), BMI (�23, 23 to �25, 25 to �30, or �30; in kg/m2),energy intake (continuous), smoking status (never, past, or current), smoking duration for past and current smokers (continuous), and cigarettes smoked dailyfor current smokers (continuous). Each analysis is also adjusted for consumption of the other 2 beverages (eg, beer is also adjusted for wine and spirits).
2 The Alpha-Tocopherol, Beta-Carotene Cancer Prevention Study had no cases in the �15 g alcohol/d category and was not included in this category butwas included in the 2 lower categories.
662 FREUDENHEIM ET AL
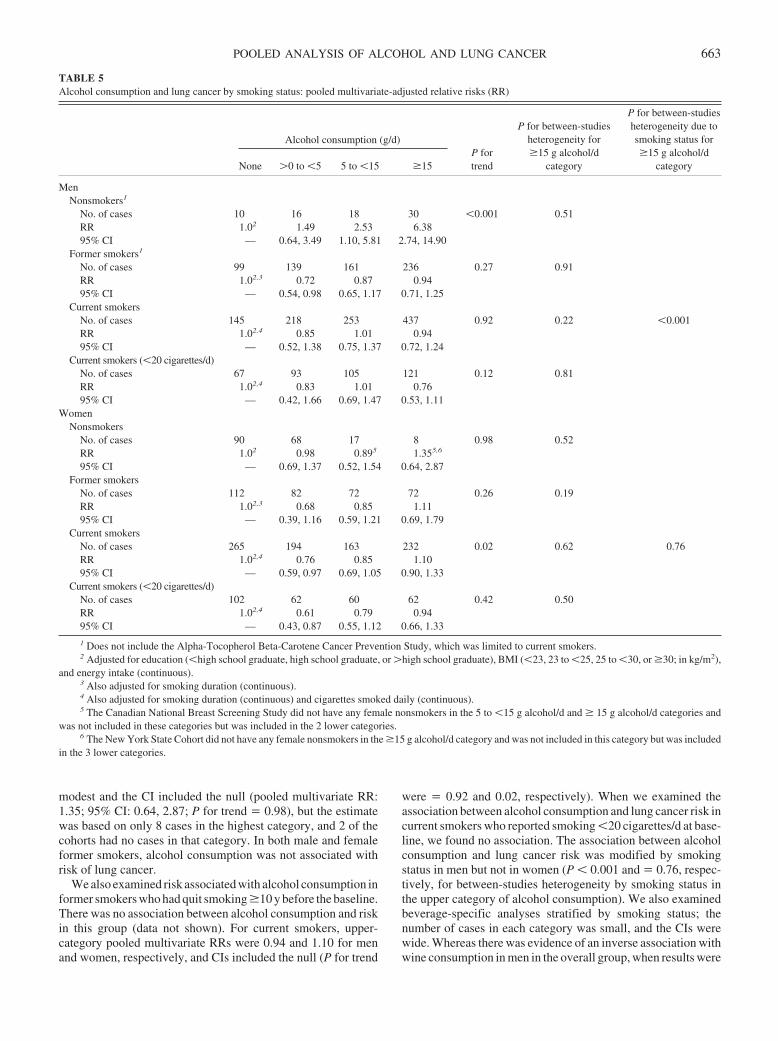
modest and the CI included the null (pooled multivariate RR:1.35; 95% CI: 0.64, 2.87; P for trend � 0.98), but the estimatewas based on only 8 cases in the highest category, and 2 of thecohorts had no cases in that category. In both male and femaleformer smokers, alcohol consumption was not associated withrisk of lung cancer.
We also examined risk associated with alcohol consumption informer smokers who had quit smoking �10 y before the baseline.There was no association between alcohol consumption and riskin this group (data not shown). For current smokers, upper-category pooled multivariate RRs were 0.94 and 1.10 for menand women, respectively, and CIs included the null (P for trend
were � 0.92 and 0.02, respectively). When we examined theassociation between alcohol consumption and lung cancer risk incurrent smokers who reported smoking �20 cigarettes/d at base-line, we found no association. The association between alcoholconsumption and lung cancer risk was modified by smokingstatus in men but not in women (P � 0.001 and � 0.76, respec-tively, for between-studies heterogeneity by smoking status inthe upper category of alcohol consumption). We also examinedbeverage-specific analyses stratified by smoking status; thenumber of cases in each category was small, and the CIs werewide. Whereas there was evidence of an inverse association withwine consumption in men in the overall group, when results were
TABLE 5Alcohol consumption and lung cancer by smoking status: pooled multivariate-adjusted relative risks (RR)
Alcohol consumption (g/d)P fortrend
P for between-studiesheterogeneity for�15 g alcohol/d
category
P for between-studiesheterogeneity due tosmoking status for�15 g alcohol/d
categoryNone �0 to �5 5 to �15 �15
MenNonsmokers1
No. of cases 10 16 18 30 �0.001 0.51RR 1.02 1.49 2.53 6.3895% CI — 0.64, 3.49 1.10, 5.81 2.74, 14.90
Former smokers1
No. of cases 99 139 161 236 0.27 0.91RR 1.02,3 0.72 0.87 0.9495% CI — 0.54, 0.98 0.65, 1.17 0.71, 1.25
Current smokersNo. of cases 145 218 253 437 0.92 0.22 �0.001RR 1.02,4 0.85 1.01 0.9495% CI — 0.52, 1.38 0.75, 1.37 0.72, 1.24
Current smokers (�20 cigarettes/d)No. of cases 67 93 105 121 0.12 0.81RR 1.02,4 0.83 1.01 0.7695% CI — 0.42, 1.66 0.69, 1.47 0.53, 1.11
WomenNonsmokers
No. of cases 90 68 17 8 0.98 0.52RR 1.02 0.98 0.895 1.355,6
95% CI — 0.69, 1.37 0.52, 1.54 0.64, 2.87Former smokers
No. of cases 112 82 72 72 0.26 0.19RR 1.02,3 0.68 0.85 1.1195% CI — 0.39, 1.16 0.59, 1.21 0.69, 1.79
Current smokersNo. of cases 265 194 163 232 0.02 0.62 0.76RR 1.02,4 0.76 0.85 1.1095% CI — 0.59, 0.97 0.69, 1.05 0.90, 1.33
Current smokers (�20 cigarettes/d)No. of cases 102 62 60 62 0.42 0.50RR 1.02,4 0.61 0.79 0.9495% CI — 0.43, 0.87 0.55, 1.12 0.66, 1.33
1 Does not include the Alpha-Tocopherol Beta-Carotene Cancer Prevention Study, which was limited to current smokers.2 Adjusted for education (�high school graduate, high school graduate, or �high school graduate), BMI (�23, 23 to �25, 25 to �30, or �30; in kg/m2),
and energy intake (continuous).3 Also adjusted for smoking duration (continuous).4 Also adjusted for smoking duration (continuous) and cigarettes smoked daily (continuous).5 The Canadian National Breast Screening Study did not have any female nonsmokers in the 5 to �15 g alcohol/d and � 15 g alcohol/d categories and
was not included in these categories but was included in the 2 lower categories.6 The New York State Cohort did not have any female nonsmokers in the �15 g alcohol/d category and was not included in this category but was included
in the 3 lower categories.
POOLED ANALYSIS OF ALCOHOL AND LUNG CANCER 663
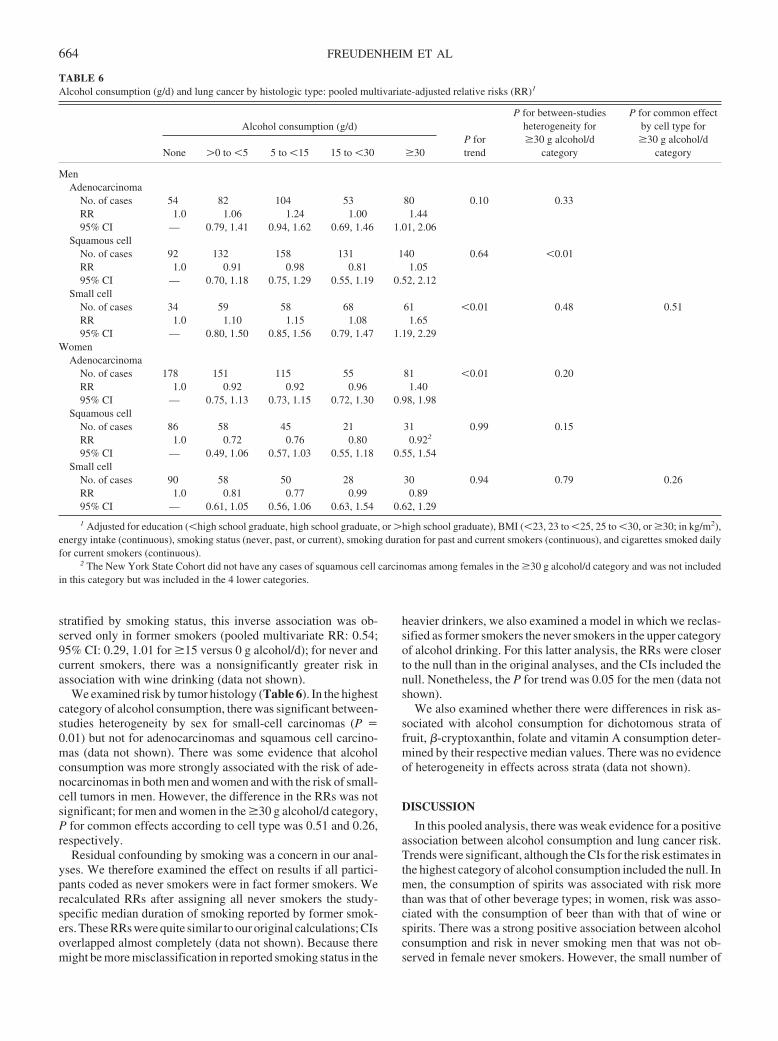
stratified by smoking status, this inverse association was ob-served only in former smokers (pooled multivariate RR: 0.54;95% CI: 0.29, 1.01 for �15 versus 0 g alcohol/d); for never andcurrent smokers, there was a nonsignificantly greater risk inassociation with wine drinking (data not shown).
We examined risk by tumor histology (Table 6). In the highestcategory of alcohol consumption, there was significant between-studies heterogeneity by sex for small-cell carcinomas (P �0.01) but not for adenocarcinomas and squamous cell carcino-mas (data not shown). There was some evidence that alcoholconsumption was more strongly associated with the risk of ade-nocarcinomas in both men and women and with the risk of small-cell tumors in men. However, the difference in the RRs was notsignificant; for men and women in the �30 g alcohol/d category,P for common effects according to cell type was 0.51 and 0.26,respectively.
Residual confounding by smoking was a concern in our anal-yses. We therefore examined the effect on results if all partici-pants coded as never smokers were in fact former smokers. Werecalculated RRs after assigning all never smokers the study-specific median duration of smoking reported by former smok-ers. These RRs were quite similar to our original calculations; CIsoverlapped almost completely (data not shown). Because theremight be more misclassification in reported smoking status in the
heavier drinkers, we also examined a model in which we reclas-sified as former smokers the never smokers in the upper categoryof alcohol drinking. For this latter analysis, the RRs were closerto the null than in the original analyses, and the CIs included thenull. Nonetheless, the P for trend was 0.05 for the men (data notshown).
We also examined whether there were differences in risk as-sociated with alcohol consumption for dichotomous strata offruit, �-cryptoxanthin, folate and vitamin A consumption deter-mined by their respective median values. There was no evidenceof heterogeneity in effects across strata (data not shown).
DISCUSSION
In this pooled analysis, there was weak evidence for a positiveassociation between alcohol consumption and lung cancer risk.Trends were significant, although the CIs for the risk estimates inthe highest category of alcohol consumption included the null. Inmen, the consumption of spirits was associated with risk morethan was that of other beverage types; in women, risk was asso-ciated with the consumption of beer than with that of wine orspirits. There was a strong positive association between alcoholconsumption and risk in never smoking men that was not ob-served in female never smokers. However, the small number of
TABLE 6Alcohol consumption (g/d) and lung cancer by histologic type: pooled multivariate-adjusted relative risks (RR)1
Alcohol consumption (g/d)P fortrend
P for between-studiesheterogeneity for�30 g alcohol/d
category
P for common effectby cell type for�30 g alcohol/d
categoryNone �0 to �5 5 to �15 15 to �30 �30
MenAdenocarcinoma
No. of cases 54 82 104 53 80 0.10 0.33RR 1.0 1.06 1.24 1.00 1.4495% CI — 0.79, 1.41 0.94, 1.62 0.69, 1.46 1.01, 2.06
Squamous cellNo. of cases 92 132 158 131 140 0.64 �0.01RR 1.0 0.91 0.98 0.81 1.0595% CI — 0.70, 1.18 0.75, 1.29 0.55, 1.19 0.52, 2.12
Small cellNo. of cases 34 59 58 68 61 �0.01 0.48 0.51RR 1.0 1.10 1.15 1.08 1.6595% CI — 0.80, 1.50 0.85, 1.56 0.79, 1.47 1.19, 2.29
WomenAdenocarcinoma
No. of cases 178 151 115 55 81 �0.01 0.20RR 1.0 0.92 0.92 0.96 1.4095% CI — 0.75, 1.13 0.73, 1.15 0.72, 1.30 0.98, 1.98
Squamous cellNo. of cases 86 58 45 21 31 0.99 0.15RR 1.0 0.72 0.76 0.80 0.922
95% CI — 0.49, 1.06 0.57, 1.03 0.55, 1.18 0.55, 1.54Small cell
No. of cases 90 58 50 28 30 0.94 0.79 0.26RR 1.0 0.81 0.77 0.99 0.8995% CI — 0.61, 1.05 0.56, 1.06 0.63, 1.54 0.62, 1.29
1 Adjusted for education (�high school graduate, high school graduate, or �high school graduate), BMI (�23, 23 to �25, 25 to �30, or �30; in kg/m2),energy intake (continuous), smoking status (never, past, or current), smoking duration for past and current smokers (continuous), and cigarettes smoked dailyfor current smokers (continuous).
2 The New York State Cohort did not have any cases of squamous cell carcinomas among females in the �30 g alcohol/d category and was not includedin this category but was included in the 4 lower categories.
664 FREUDENHEIM ET AL
female cases who were never smokers in the highest drinkingcategory limited our ability to examine associations in this group.There was no evidence of an association of alcohol consumptionwith risk in smokers, who constitute the largest portion of casesin these cohorts.
Several potential mechanisms have been proposed for an ef-fect of alcohol on lung cancer. These include carcinogenesis bythe alcohol metabolite acetaldehyde (3), oxidation by alcohol(4–12), and induction by alcohol of cytochrome p450 that affectsthe metabolism of other procarcinogens (4, 13). Other com-pounds in alcoholic beverages may also be relevant (2), whichcould explain the different associations we saw for beer andspirits than for wine. However, we saw differences in beverage-specific associations in both men and women; the observedbeverage-specific differences may not be biological. Further-more, it has been hypothesized that the mechanism of alcoholmay be to enhance carcinogenic effects of cigarette smoke ontissues (2); our findings were strongest for nonsmokers, how-ever, which would not be consistent with this explanation.
Many epidemiologic studies have examined the associationbetween alcohol consumption and lung cancer, and the resultshave been inconsistent (2), perhaps as a result of the strong effectof smoking on lung cancer risk, the likely weak effect (if any) ofalcohol, and the different sizes of the studies. In a meta-analysisof studies of alcohol consumption and lung cancer (22), pointestimates for combined findings in 13 cohorts [including 2 of thecohorts in our pooled analyses (31, 48)] were similar to those wereport here. These investigators also conducted a meta-analysisof 10 case-control studies; there was an increase in lung cancerrisk associated with alcohol consumption in hospital-based butnot population-based case-control studies (22). In 2 cohort stud-ies not included in our analysis (49, 50) and in several case-control studies (51–53) published since the publication of themeta-analysis, findings were also consistent with ours.
Because smoking is such a strong risk factor for lung cancerand because smoking is correlated with alcohol consumption, themajor concern in the examination of an association betweenalcohol consumption and lung cancer is failure to fully control forconfounding by smoking. Measurement error in measured as-pects of smoking (ie, smoking status, duration of smoking, andamount smoked) and variations in other unmeasured aspects (ie,depth of inhalation and length of time that smoke is held in thelungs) may have an effect on the estimation of the risk of lungcancer from other factors correlated with smoking, such as alco-hol (2, 22, 54). Itmaybethatourfindingsofdifferencesbybeveragetype may be the result of uncontrolled confounding. Of interest withrespect to residual confounding by smoking is our finding of a largeincrease inriskof lungcancer inmenwhoneversmoked.Therehavebeen several other studies of alcohol consumption and lung cancerin nonsmokers (22, 55–58). Most of these studies have found anincreased risk associated with alcohol consumption, albeit gen-erally at somewhat lower levels of alcohol consumption.
By contrast with the findings of increased risk in male neversmokers, we found little evidence of increased risk in former andcurrent smokers in our study, even in those who had quit smoking�10 y before or for current smokers of �20 cigarettes/d, groupsthat should be more similar to the never smokers with respect totheir lung cancer risk. There was some evidence that femalecurrent smokers in the highest category of alcohol consumptionwere at increased risk. Whereas the CI for the highest category
included the null, there was evidence of a significant trend in thedata. Other studies have reported increased risk with alcoholconsumption in heavy smokers (2, 59, 60).
Because of our finding of increased risk of lung cancer withalcohol consumption in men who reported never smoking, weinvestigated the possible effect of a misreporting of smokingstatus on the estimate of risk by recalculating risk estimates afterreclassifying never smokers as former smokers. Risk estimateschanged only somewhat. In contrast, in simulations regardingmisclassification by smoking status, Korte et al (22) found thatthe RR for their meta-analysis of cohort studies was consistentwith no true effect, 10% misclassification of smokers as non-smokers, and no misclassification of drinking status.
An additional potential source of residual confounding couldbe the effect of passive smoke exposure. In particular, the groupof nonsmokers who were included in the highest category ofalcohol consumption might have a heavier exposure to smoke ifthey drank in smoke-filled environments. We had limited or noinformation on passive smoke exposure in all but one of thecohorts. However, passive smoke exposure is unlikely to explainan association of the magnitude of that observed in nonsmokingmen. Furthermore, there may be some confounding due to thesmoking of pipes and cigars. Limited information was availableon the smoking of pipes and cigars in the current study.
Misclassification of drinking status—particularly the inclu-sion of former drinkers in those reporting that they are currentlynondrinkers—is another potential source of bias. Misclassifica-tion of this nature would attenuate risk estimates if alcohol con-sumption does increase lung cancer risk. In fact, there was someindication in both men and women that there was a lower risk ofcancer in those reporting moderate consumption than in non-drinkers. Our findings were also consistent with an alcohol effectlimited to heavier drinking. Because of smaller numbers ofheavier drinkers, we were not able to explore in detail the asso-ciations with heavy alcohol consumption.
We found some evidence of differences in the associationbetween different beverage types and the risk of lung cancer: astronger association for spirits in men and for beer in women.Other studies have found greater risk in association with con-sumption of beer and spirits but not wine (2). These differencesmay be related to compounds found in beer or spirits. When welooked at more closely defined categories of the consumption ofspirits by the men, the increased risk was again primarily con-fined to those drinking �30 g alcohol/d.
In this study, which entailed pooling data from the cohorts of7 studies with a total sample of nearly 400 000 participants and�3000 lung cancer cases, we found weak evidence of a positiveassociation between alcohol consumption and lung cancer risk.By pooling data from these large cohort studies, we were able toexamine risk in uniformly defined exposure groups and with aconsistent group of covariates. The observed risk appeared to beconfined to those subjects with consumption of �30 g alcohol/d,which corresponds to �2 drinks/d. However, we could not excludethe possibility, at least in the smokers, that this association could beexplained by uncontrolled confounding by smoking. The finding ofan increased RR in male never smokers is notable, although theabsolute risk of lung cancer in this group is, of course, small. Smok-ing remains the most important cause of this disease, which hasconsiderable effect on public health.
POOLED ANALYSIS OF ALCOHOL AND LUNG CANCER 665
Pooled data came from existing cohorts. Investigators for each study hadcontributed to the design of and data collection and analysis of their particularstudy.
When these analyses were initiated, DJH was the principal investigator forthe Pooling Project, leading the overall effort to conduct data analysis onexisting data sets. SAS-W (the current principal investigator for the PoolingProject) worked with JLF, DJH, and JR on management of the data and in allphases of data analysis and manuscript writing. The data analysis plan wasconceived by JLF. Data analyses were conducted by JR. All other authorscontributed to the data analysis plan. The manuscript was written by JLF withinput from all of the other authors. None of the authors had a personal orfinancial conflict of interest.
REFERENCES1. Potter JD, Sellers TA, Folsom AR, McGovern PG. Alcohol, beer, and
lung cancer in postmenopausal women: the Iowa Women’s HealthStudy. Ann Epidemiol 1992;2:587–95.
2. Bandera EV, Freudenheim JL, Vena JE. Alcohol consumption and lungcancer: a review of the epidemiologic evidence. Cancer Epidemiol Bi-omark Prev 2001;10:813–21.
3. Alcohol drinking. IARC monographs on the evaluation of carcinogenicrisks to humans, vol 44. Lyon, France: International Agency for Re-search on Cancer, 1988.
4. Nachiappan V, Mufti SI, Chakravarti A, Eskelson CD, Rajasekharan R.Lipid peroxidation and ethanol-related tumor promotion in Fischer-344rats treated with tobacco-specific nitrosamines. Alcohol Alcohol 1994;29:565–74.
5. Albano E, Clot P, Morimoto M, Tomasi A, Ingelman-Sundberg M,French SW. Role of cytochrome P4502E1-dependent formation of hy-droxyethyl free radical in the development of liver damage in rats intra-gastrically fed with ethanol. Hepatology 1996;23:155–63.
6. Knecht KT, Bradford BU, Mason RP, Thurman RG. In vivo formationof a free radical metabolite of ethanol. Mol Pharmacol 1990;38:26–30.
7. Thurman RG. Induction of hepatic microsomal reduced nicotinamideadenine dinucleotide phosphate-dependent production of hydrogen per-oxide by chronic prior treatment with ethanol. Mol Pharmacol 1973;9:670–5.
8. Kukielka E, Cederbaum AI. The effect of chronic ethanol consumptionon NADH- and NADPH-dependent generation of reactive oxygen in-termediates by isolated rat liver nuclei. Alcohol Alcohol 1992;27:233–9.
9. Ishii H, Kurose I, Kato S. Pathogenesis of alcoholic liver disease withparticular emphasis on oxidative stress. J Gastroenterol Hepatol 1997;12:S272–82.
10. Song BJ. Ethanol-inducible cytochrome P450 (CYP2E1): biochemistry,molecular biology and clinical relevance: 1996 update. Alcohol Clin ExpRes 1996;20:138A–46A.
11. Dupont I, Lucas D, Clot P, Menez C, Albano E. Cytochrome P4502E1inducibility and hydroxyethyl radical formation among alcoholics.J Hepatol 1998;28:564–71.
12. Yang M, Coles BF, Delongchanmp R, Lang NP, Kadlubar FF. Effects ofthe ADH3, CYP2E1, and GSTP1 genetic polymorphisms on their ex-pressions in Caucasian lung tissue. Lung Cancer 2002;38:15–21.
13. Manautou JE, Carlson GP. Ethanol-induced fatty acid ethyl ester for-mation in vivo and in vitro in rat lung. Toxicology 1991;70:303–12.
14. Seitz HK, Garro AJ, Lieber CS. Enhanced pulmonary and intestinalactivation of procarcinogens and mutagens after chronic ethanol con-sumption in the rat. Eur J Clin Invest 1981;11:33–8.
15. Schmidt W, Popham RE. The role of drinking and smoking in mor-tality from cancer and other causes in male alcoholics. Cancer 1981;47:1031– 41.
16. Pell S, D’Alonzo CA. A five-year mortality study of alcoholics. J OccupMed 1973;15:120–5.
17. Nicholls P, Edwards G, Kyle E. Alcoholics admitted to four hospitals inEngland. II. General and cause-specific mortality. Q J Stud Alcohol1974;35:841–55.
18. Hakulinen T, Lehtimaki L, Lehtonen M, Teppo L. Cancer morbidityamong two male cohorts with increased alcohol consumption in Finland.J Natl Cancer Inst 1974;52:1711–4.
19. Monson RR, Lyon JL. Proportional mortality among alcoholics. Cancer1975;36:1077–9.
20. Thorarinsson AA. Mortality among men alcoholics in Iceland, 1951–74.J Stud Alcohol 1979;40:704–18.
21. Robinette CD, Hrubec Z, Fraumeni JF Jr. Chronic alcoholism and sub-sequent mortality in World War II veterans. Am J Epidemiol 1979;109:687–700.
22. Korte JE, Brennan P, Henley SJ, Boffetta P. Dose-specific meta-analysisand sensitivity analysis of the relation between alcohol consumption andlung cancer risk. Am J Epidemiol 2002;155:496–506.
23. Hunter DJ, Spiegelman D, Adami H-O, et al. Cohort studies of fat intakeand the risk of breast cancer—a pooled analysis. N Engl J Med 1996;334:356–61.
24. Smith-Warner SA, Spiegelman D, Yaun S-S, et al. Alcohol and breastcancer in women: a pooled analysis of cohort studies. JAMA 1998;279:535–40.
25. Smith-Warner SA, Spiegelman D, Yaun S-S, et al. Fruits and vegetablesand lung cancer: a pooled analysis of cohort studies. Int J Cancer 2003;107:1001–11.
26. Toniolo P, Riboli E, Shore RE, Pasternack BS. Consumption of meat,animal products, protein, and fat and risk of breast cancer: a prospectivecohort study in New York. Epidemiology 1994;5:391–7.
27. Wolk A, Bergström R, Hunter D, et al. A prospective study of associationof monounsaturated fat and other types of fat with risk of breast cancer.Arch Intern Med 1998;158:41–5.
28. Fraser GE, Beeson WL, Phillips RL. Diet and lung cancer in CaliforniaSeventh-Day Adventists. Am J Epidemiol 1991;133:683–93.
29. Rohan TE, Jain M, Howe GR, Miller AB. A cohort study of dietarycarotenoids and lung cancer risk in women (Canada). Cancer CausesControl 2002;13:231–7.
30. Voorrips LE, Goldbohm A, Verhoeven DTH, et al. Vegetable and fruitconsumption and lung cancer risk in the Netherlands Cohort Study onDiet and Cancer. Cancer Causes Control 2000;11:101–15.
31. Bandera EV, Freudenheim JL, Marshall JR, et al. Diet and alcoholconsumption and lung cancer risk in the New York State Cohort (UnitedStates). Cancer Causes Control 1997;8:828–40.
32. Feskanich D, Ziegler RG, Michaud DS, et al. Prospective study of fruitand vegetable consumption and risk of lung cancer among men andwomen. J Natl Cancer Inst 2000;92:1812–23.
33. Michaud DS, Feskanich D, Rimm EB, et al. Intake of specific carote-noids and risk of lung cancer in two prospective U.S. cohorts. Am J ClinNutr 2000;72:990–7.
34. The Alpha-Tocopherol, Beta-Carotene Lung Cancer Prevention Study:design, methods, participant characteristics, and compliance. TheAlpha-Tocopherol Beta-Carotene Cancer Prevention Study Group. AnnEpidemiol 1994;4:1–10.
35. Rothman KJ, Greenland S. Modern epidemiology. 2nd ed. Philadelphia:Lippincott–Raven Publishers, 1998.
36. Percy C, Van Holten V, Muir C. International classification of diseasesfor oncology. Geneva, Switzerland: World Health Organization, 1990.
37. Cox DR. Regression models and life-tables. J Roy Stat Soc Series (B)1972;34:187–220.
38. SAS/STAT software: the PHREG procedure: preliminary documenta-tion. Cary, NC: SAS Institute, 1991.
39. Prentice RL. A case-cohort design for epidemiologic cohort studies anddisease prevention trials. Biometrika 1986;73:1–11.
40. EPICURE user’s guide: the PEANUTS program. Seattle: Hirosoft,1993.
41. Mannisto S, Smith-Warner S, Spiegelman D, et al. Dietary carotenoidsand risk of lung cancer in a pooled analysis of cohort studies. CancerEpidemiol Biomarkers Prev 2004;13:40–8.
42. DerSimonian R, Laird N. Meta-analysis in clinical trials. Control ClinTrials 1986;7:177–88.
43. Cochran WG. The combination of estimates from different experiments.Biometrics 1954;10:101–29.
44. Shils ME, Olson JA, Shike M. Modern nutrition in health and disease. 8thed. Philadelphia, PA: Lea and Febiger, 1994.
45. Kvåle G, Bjelke E, Gart JJ. Dietary habits and lung cancer risk. Int JCancer 1983;31:397–405.
46. Stram DO. Meta-analysis of published data using a linear mixed-effectsmodel. Biometrics 1996;52:536–44.
47. Prentice RL, Kalbfleisch JD, Peterson AV, Flavnoy N, Farewell YT,Breslow NE. The analysis of failure times in the presence of competingrisks. Biometrics 1978;34:541–54.
48. Woodson K, Albanes D, Tangrea JA, Rautalahti M, Virtamo J, TaylorPR. Association between alcohol and lung cancer in the alpha-tocopherol, beta-carotene cancer prevention study in Finland. CancerCauses Control 1999;10:219–26.
666 FREUDENHEIM ET AL

49. Djousse L, Dorgan JF, Zhang Y, et al. Alcohol consumption and riskof lung cancer: The Framingham Study. J Natl Cancer Inst 2002;94:1877– 82.
50. Prescott E, Gronbaek M, Becker U, Sorensen TI. Alcohol intake and therisk of lung cancer: influence of type of alcholic beverage. Am J Epide-miol 1999;149:463–70.
51. Freudenheim JL, Ram M, Nie J, et al. Lung cancer in humans is notassociated with lifetime alcohol consumption or with genetic variation inalcohol dehydrogenase 3 (ADH3). J Nutr 2003;133:3619–24.
52. De Stefani E, Correa P, Deneo-Pellegrini H, et al. Alcohol intake and riskof adenocarcinoma of the lung. A case-control study in Uruguay. LungCancer 2002;38:9–14.
53. Gajalakshmi V, Hung R, Mathew A, Varhese C, Brennan P, Boffetta P.Tobacco smoking and chewing, alcohol drinking and lung cancer riskamong men in southern India. Int J Cancer 2003;107:441–7.
54. Zang EA, Wynder EL. Reevaluation of the confounding effect of ciga-rette smoking on the relationship between alcohol use and lung cancer
risk, with larynx cancer used as a positive control. Prev Med 2001;32:359–70.
55. Kabat GC, Wynder EL. Lung cancer in nonsmokers. Cancer 1984;53:1214–21.
56. Koo LC. Dietary habits and lung cancer risk among Chinese females inHong Kong who never smoked. Nutr Cancer 1988;11:155–72.
57. Breslow R, Graubard BI, Sinha R, Subar AF. Response to Dr. Bandera.Cancer Causes Control 2001;12:578 (letter).
58. Breslow RA, Graubard BI, Sinha R, Subar AF. Diet and lung cancermortality: a 1987 National Health Interview Survey cohort study. CancerCauses Control 2000;11:419–31.
59. Bandera EV, Freudenheim JL, Graham S, et al. Alcohol consumptionand lung cancer in white males. Cancer Causes Control 1992;3:361–9.
60. Carpenter CL, Morgenstern H, London SJ. Alcoholic beverage con-sumption and lung cancer risk among residents of Los Angeles County.J Nutr 1998;128:694–700.
POOLED ANALYSIS OF ALCOHOL AND LUNG CANCER 667
Intake of n�6 and n�3 fatty acids and fish and risk of community-acquired pneumonia in US men1–3
Anwar T Merchant, Gary C Curhan, Eric B Rimm, Walter C Willett, and Wafaie W Fawzi
ABSTRACTBackground: Essential fatty acids modulate inflammation and glu-cose metabolism and may alter infection risk.Objective: We examined the association between intakes of n�6and n�3 fatty acids and fish and the risk of community-acquiredpneumonia.Design: We prospectively evaluated 38 378 male US health profes-sionals aged 44–79 y at the outset. We updated medical and lifestyleinformation biennially through questionnaires and diet every 4 ywith the use of a validated food-frequency questionnaire. We ex-cluded men who reported pneumonia, myocardial infarction, stroke,other heart disease, arterial surgery, cancer, or asthma before 1990 orthose with incomplete dietary data. Community-acquired pneumo-nia was determined by blinded medical record review of chest ra-diographs.Results: During 10 y of follow-up, there were 441 new cases ofnonfatal community-acquired pneumonia. Pneumonia risk waslower in men in the highest energy-adjusted quintiles of intake thanin men in the lowest quintiles of intake of linoleic acid [multivariaterelative risk (RR): 0.70; 95% CI: 0.51, 0.96; P for trend � 0.01] and�-linolenic acid (multivariate RR: 0.68; 95% CI: 0.50, 0.93; P fortrend � 0.01). Pneumonia risk decreased 4% for every 1-g/d increasein linoleic acid intake (multivariate RR: 0.96; 95% CI: 0.93, 0.99).Pneumonia risk was reduced by 31% for every 1-g/d increase in�-linolenic acid intake (multivariate RR: 0.69; 95% CI: 0.51, 0.93).Intakes of eicosapentaenoic acid and docosahexaenoic acid were notsignificantly related to pneumonia risk.Conclusion: Higher intakes of �-linolenic and linoleic acids andpossibly of fish may reduce the risk of pneumonia. Am J ClinNutr 2005;82:668–74.
KEY WORDS n�6 Fatty acids, n�3 fatty acids, fish, prospec-tive study, community-acquired pneumonia
INTRODUCTION
Pneumonia and influenza are the fifth leading causes of deathin the United States in men over the age of 65 y (1). Smoking,weight gain, physical activity (2), and alcohol use (3) are the onlyknown potentially modifiable risk factors for community-acquired pneumonia. Polyunsaturated fatty acids have been hy-pothesized to modulate inflammation and immunity (4), and theyconstitute 19–22% of the energy intake from fats in US adults(5). Between 84% and 89% of polyunsaturated fatty acid intakeconsists of linoleic acid, and 9–11% is �-linolenic acid; eicosa-pentaenoic acid (EPA) and docosahexaenoic acid (DHA), the
long chain n�3 fatty acids from fish, make up �1% of totalintake (5). Increasing intakes of n�3 fatty acids reduces inflam-mation associated with autoimmune diseases (6), and increasedintakes of n�3 and n�6 fatty acids decreases the incidence andduration of infections in children (7). Supplementation increasesthe n�6 and n�3 fatty acid content of the cell walls of leukocytesand results in enhanced immune function (8). Diets supple-mented with n�3 (ethyl-EPA) and n�6 (ethyl-gamma-linolenic) fatty acids reduced prostaglandin E2 production in ratsput under stress (9), and EPA and DHA were shown to reducelipopolysaccharide-induced inflammation through a pathwaydependent on peroxisome proliferator-activator receptor-� (10).We therefore prospectively examined the association betweenn�6 and n�3 fatty acids and fish intake and the risk ofcommunity-acquired pneumonia among men in the UnitedStates.
SUBJECTS AND METHODS
Study population
The Health Professionals Follow-up Study began in 1986when 51 529 male US health professionals aged 40–75 y re-turned questionnaires about their lifestyle and medical history(11). The men were then sent biennial follow-up questionnairesto update their lifestyle information and identify new major ill-nesses. Deaths were reported by family members or the US PostalService or were ascertained through state registries or the Na-tional Death Index. Information about pneumonia was first col-lected in 1992. We excluded men who reported pneumonia orconditions that may have prompted them to change their diet or
1 From the Department of Clinical Epidemiology and Biostatistics, Mc-Master University, Hamilton, Ontario, Canada (ATM); the Department ofOral Health Policy and Epidemiology, Harvard School of Dental Medicine,Boston, MA (ATM); the Departments of Epidemiology (GCC, EBR, WCW,and WWF) and Nutrition (EBR, WCW, and WWF), Harvard School ofPublic Health, Boston, MA; and The Channing Laboratory, Department ofMedicine, Brigham and Women’s Hospital, and Harvard Medical School,Boston, MA (GCC, EBR, and WCW).
2 Supported by National Institutes of Health research grants CA55075 andHL35464.
3 Address reprint requests to AT Merchant, McMaster University, ClinicalEpidemiology and Biostatistics, Population Health Research Institute, 237Barton Street East, Hamilton, ON L8L 2X2, Canada. E-mail:[email protected].
Received October 18, 2004.Accepted for publication May 13, 2005.
668 Am J Clin Nutr 2005;82:668–74. Printed in USA. © 2005 American Society for Clinical Nutrition
supplement use and that may have increased their risk of pneu-monia (myocardial infarction, stroke, other heart disease, arterialsurgery, cancer, or asthma) before 1990. Men who left 70 or moreitems blank on the food-frequency questionnaire and those whoreported food intakes that were deemed to be implausible werealso excluded. Data from 38 378 men were included in theseanalyses. Ascertainment of death was �98% complete (12). Thisstudy was approved by the Harvard School of Public Health’sHuman Subjects Committee.
Case ascertainment
The endpoint of this study was nonfatal, incident, community-acquired pneumonia occurring between 1990 and 2000. If a par-ticipant reported that he had pneumonia during this period, werequested permission to review his medical record to confirm thediagnosis and date of occurrence of disease. The person whoreviewed the medical records did not have knowledge ofthe exposure status of the participant. A case was consideredconfirmed if the medical record contained a diagnosis ofcommunity-acquired pneumonia by a physician on the basis of achest radiograph. We excluded cases of aspiration pneumoniaand hospital-acquired pneumonia in this analysis as determinedfrom medical records. We excluded fatal cases for whom thisinformation was not available. If a participant had more than oneepisode of pneumonia, we considered only the first one.
Diet ascertainment
The reproducibility and validity of the semi-quantitative food-frequency questionnaire used to assess diet in this study has beenreported elsewhere (13). To estimate intakes of fish and othernutrients, participants were asked how often on average in thepast year they ate a unit or portion size of each food (an egg or6–8 oz of fish, for example). There were 9 possible responsesranging from never or less than once per month to 6 or more timesper day. Nutrient intakes were estimated by multiplying the num-ber of times the food was eaten by the average nutrient content ofthe portion or unit of food. The nutrient content of foods wasestimated from the Harvard University Food Composition data-base, US Department of Agriculture sources (14), and informa-tion from manufacturers (15). We asked on the questionnairewhether the participants used fish oil supplements and took thisinformation into account when estimating total n�3 fatty acidintake. �-Linolenic acid intakes were corrected for gamma lin-olenic acid to reduce misclassification as described elsewhere(16). We adjusted nutrients for total energy by regression anal-ysis (17). For example, the energy-adjusted intake of linoleic acidis interpreted as the composition of this nutrient in the diet inde-pendent of the quantity of food eaten.
The correlation coefficients for comparing intake assessed bythe food-frequency questionnaire and fat aspirates was 0.50 forpolyunsaturated fats, 0.48 for linoleic acid, 0.47 for eicosapen-taenoic acid (18), and 0.34 for linolenic acid (19). For fish intakeassessed by the food-frequency questionnaire compared withdiet records, the correlations were 0.73 for canned tuna and 0.58for dark meat fish (20). Dietary variables were first measured in1986 and were updated in 1990 and 1994. If dietary data for 1990were missing, we used the value from the 1986 measurement. Werelated dietary data measured in 1990 to cases of pneumoniadeveloping between 1990 and 1994. For cases developing sub-sequently, we used diet measured in 1994.
Statistical analysis
Person-time of follow-up was calculated from the return of the1990 questionnaire to the first report of community-acquiredpneumonia, death, or 31 January 2000, whichever came first.Men who developed myocardial infarction, stroke, other heartdisease, arterial surgery, cancer (except nonmelanoma skin can-cer), or asthma were excluded from further follow-up.
Most recent dietary intake at the start of each 2-y follow-upinterval was related to subsequent pneumonia risk. We evaluatedlinoleic acid, �-linolenic acid, total fats, and polyunsaturated fatsin quintiles and as continuous variables. Because the main sourceof long-chain n�3 fatty acids in the diet is fish, we assessed fishintake in categories of �1 serving/mo, 1–3 servings/mo, 1 serv-ing/wk, 2–4 servings/wk, and �5 servings/wk. We classifiedintake of long-chain n�3 fatty acids (EPA and DHA) as �0.05,0.05 to �0.2, 0.2 to �0.4, 0.4 to �0.6, and �0.6 g/d to approx-imately correspond with these categories of fish intake as de-scribed elsewhere (21).
We used Cox proportional hazards models to estimate multi-variate relative risks (RRs) and CIs. Failure time was measuredas age in months, which allowed fine control of confounding byage. The Anderson-Gill data structure was used to handle time-varying covariates. Other variables in the model included smok-ing (never, past, and current smokers who smoked 1–14, 15–24,or �25 cigarettes/d), body mass index (BMI, in kg/m2: �21,21–22.9, 23–24.9, 25–29.9, and �30), alcohol use (never, 0.1–4.9, 5.0–14.9, 15.0–29.9, and �30 g/d), physical activity [quin-tiles of metabolic equivalents (METs)], diabetes (dichotomous),and total energy intake (continuous). We further evaluated thismultivariate association by additional adjustment for intakes ofsaturated fat, nuts, fruit, vegetables, and multivitamins to assesspossible confounding by other dietary or lifestyle variables. Weused the Mantel extension test to calculate tests for trend forcategorical variables by using their respective median values.
We assessed interaction by age (�65 versus �65 y), BMI(�25 versus � 25), current smoking, physical activity [inactive(reported METs less than median quintile) versus active (re-ported METs at the median quintile and higher)], use of vitaminE supplements (yes, no), and diabetes. To assess interaction, weclassified fish intake in 3 categories (�1 serving/mo, �1 serv-ing/mo to 4 servings/wk, and �5 servings/wk) and grouped�-linolenic acid and linoleic acid into tertiles in the mainanalyses. Tests for interaction were done by use of the Waldtest with multiplicative terms of intakes of fish and fatty acids.We used SAS version 8.2 (SAS Institute Inc, Cary, NC) for allthe analyses.
RESULTS
Men consuming more �-linolenic and linoleic acids drank lessalcohol and ate fewer carbohydrates and monounsaturated fatsand more polyunsaturated fat but otherwise were similar to thosewho consumed less of these fatty acids (Tables 1 and 2). Asdescribed elsewhere, men eating more fish and long-chain n�3fatty acids were less likely to be current smokers or overweightand were more likely to be physically active, eat more fruit andvegetables, and use multivitamin supplements (21).
During 10 y of follow-up (145 910 person-years), there were441 new cases of nonfatal community-acquired pneumonia. In-creased �-linolenic acid intake was associated with a reduced
n�6 AND n�3 FATTY ACID INTAKE AND PNEUMONIA RISK 669
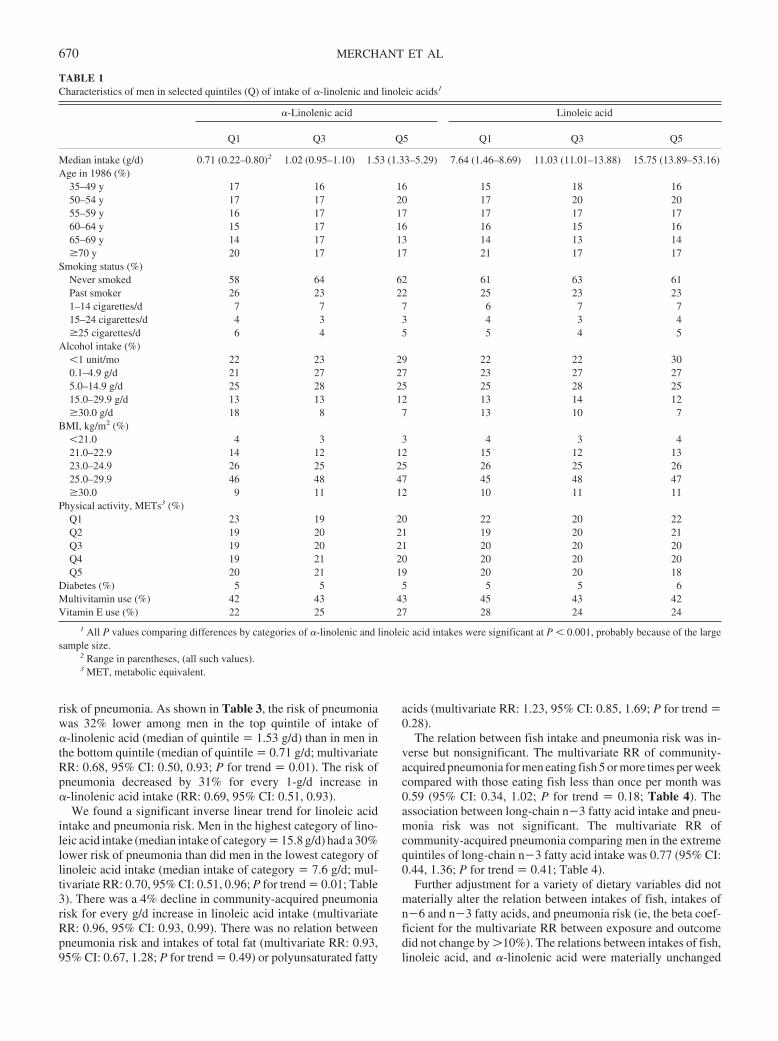
risk of pneumonia. As shown in Table 3, the risk of pneumoniawas 32% lower among men in the top quintile of intake of�-linolenic acid (median of quintile � 1.53 g/d) than in men inthe bottom quintile (median of quintile � 0.71 g/d; multivariateRR: 0.68, 95% CI: 0.50, 0.93; P for trend � 0.01). The risk ofpneumonia decreased by 31% for every 1-g/d increase in�-linolenic acid intake (RR: 0.69, 95% CI: 0.51, 0.93).
We found a significant inverse linear trend for linoleic acidintake and pneumonia risk. Men in the highest category of lino-leic acid intake (median intake of category � 15.8 g/d) had a 30%lower risk of pneumonia than did men in the lowest category oflinoleic acid intake (median intake of category � 7.6 g/d; mul-tivariate RR: 0.70, 95% CI: 0.51, 0.96; P for trend � 0.01; Table3). There was a 4% decline in community-acquired pneumoniarisk for every g/d increase in linoleic acid intake (multivariateRR: 0.96, 95% CI: 0.93, 0.99). There was no relation betweenpneumonia risk and intakes of total fat (multivariate RR: 0.93,95% CI: 0.67, 1.28; P for trend � 0.49) or polyunsaturated fatty
acids (multivariate RR: 1.23, 95% CI: 0.85, 1.69; P for trend �0.28).
The relation between fish intake and pneumonia risk was in-verse but nonsignificant. The multivariate RR of community-acquired pneumonia for men eating fish 5 or more times per weekcompared with those eating fish less than once per month was0.59 (95% CI: 0.34, 1.02; P for trend � 0.18; Table 4). Theassociation between long-chain n�3 fatty acid intake and pneu-monia risk was not significant. The multivariate RR ofcommunity-acquired pneumonia comparing men in the extremequintiles of long-chain n�3 fatty acid intake was 0.77 (95% CI:0.44, 1.36; P for trend � 0.41; Table 4).
Further adjustment for a variety of dietary variables did notmaterially alter the relation between intakes of fish, intakes ofn�6 and n�3 fatty acids, and pneumonia risk (ie, the beta coef-ficient for the multivariate RR between exposure and outcomedid not change by �10%). The relations between intakes of fish,linoleic acid, and �-linolenic acid were materially unchanged
TABLE 1Characteristics of men in selected quintiles (Q) of intake of �-linolenic and linoleic acids1
�-Linolenic acid Linoleic acid
Q1 Q3 Q5 Q1 Q3 Q5
Median intake (g/d) 0.71 (0.22–0.80)2 1.02 (0.95–1.10) 1.53 (1.33–5.29) 7.64 (1.46–8.69) 11.03 (11.01–13.88) 15.75 (13.89–53.16)Age in 1986 (%)
35–49 y 17 16 16 15 18 1650–54 y 17 17 20 17 20 2055–59 y 16 17 17 17 17 1760–64 y 15 17 16 16 15 1665–69 y 14 17 13 14 13 14�70 y 20 17 17 21 17 17
Smoking status (%)Never smoked 58 64 62 61 63 61Past smoker 26 23 22 25 23 231–14 cigarettes/d 7 7 7 6 7 715–24 cigarettes/d 4 3 3 4 3 4�25 cigarettes/d 6 4 5 5 4 5
Alcohol intake (%)�1 unit/mo 22 23 29 22 22 300.1–4.9 g/d 21 27 27 23 27 275.0–14.9 g/d 25 28 25 25 28 2515.0–29.9 g/d 13 13 12 13 14 12�30.0 g/d 18 8 7 13 10 7
BMI, kg/m2 (%)�21.0 4 3 3 4 3 421.0–22.9 14 12 12 15 12 1323.0–24.9 26 25 25 26 25 2625.0–29.9 46 48 47 45 48 47�30.0 9 11 12 10 11 11
Physical activity, METs3 (%)Q1 23 19 20 22 20 22Q2 19 20 21 19 20 21Q3 19 20 21 20 20 20Q4 19 21 20 20 20 20Q5 20 21 19 20 20 18
Diabetes (%) 5 5 5 5 5 6Multivitamin use (%) 42 43 43 45 43 42Vitamin E use (%) 22 25 27 28 24 24
1 All P values comparing differences by categories of �-linolenic and linoleic acid intakes were significant at P � 0.001, probably because of the largesample size.
2 Range in parentheses, (all such values).3 MET, metabolic equivalent.
670 MERCHANT ET AL
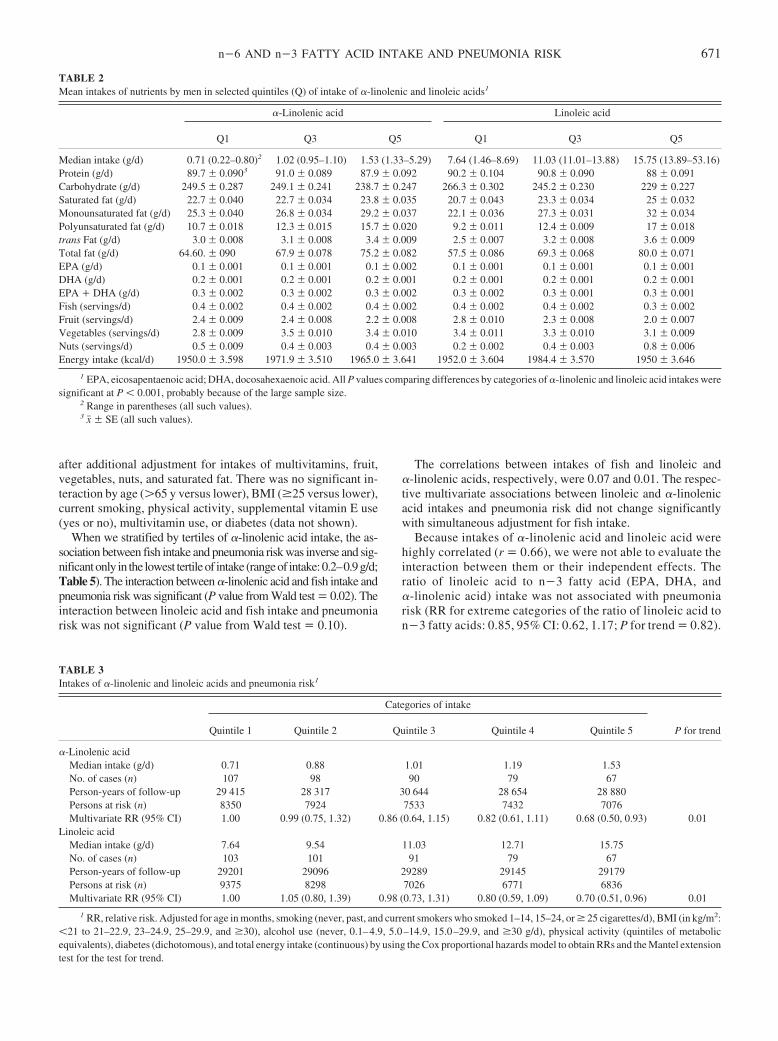
after additional adjustment for intakes of multivitamins, fruit,vegetables, nuts, and saturated fat. There was no significant in-teraction by age (�65 y versus lower), BMI (�25 versus lower),current smoking, physical activity, supplemental vitamin E use(yes or no), multivitamin use, or diabetes (data not shown).
When we stratified by tertiles of �-linolenic acid intake, the as-sociation between fish intake and pneumonia risk was inverse and sig-nificantonly in the lowest tertileof intake (rangeof intake:0.2–0.9g/d;Table 5). The interaction between �-linolenic acid and fish intake andpneumonia risk was significant (P value from Wald test � 0.02). Theinteraction between linoleic acid and fish intake and pneumoniarisk was not significant (P value from Wald test � 0.10).
The correlations between intakes of fish and linoleic and�-linolenic acids, respectively, were 0.07 and 0.01. The respec-tive multivariate associations between linoleic and �-linolenicacid intakes and pneumonia risk did not change significantlywith simultaneous adjustment for fish intake.
Because intakes of �-linolenic acid and linoleic acid werehighly correlated (r � 0.66), we were not able to evaluate theinteraction between them or their independent effects. Theratio of linoleic acid to n�3 fatty acid (EPA, DHA, and�-linolenic acid) intake was not associated with pneumoniarisk (RR for extreme categories of the ratio of linoleic acid ton�3 fatty acids: 0.85, 95% CI: 0.62, 1.17; P for trend � 0.82).
TABLE 2Mean intakes of nutrients by men in selected quintiles (Q) of intake of �-linolenic and linoleic acids1
�-Linolenic acid Linoleic acid
Q1 Q3 Q5 Q1 Q3 Q5
Median intake (g/d) 0.71 (0.22–0.80)2 1.02 (0.95–1.10) 1.53 (1.33–5.29) 7.64 (1.46–8.69) 11.03 (11.01–13.88) 15.75 (13.89–53.16)Protein (g/d) 89.7 � 0.0903 91.0 � 0.089 87.9 � 0.092 90.2 � 0.104 90.8 � 0.090 88 � 0.091Carbohydrate (g/d) 249.5 � 0.287 249.1 � 0.241 238.7 � 0.247 266.3 � 0.302 245.2 � 0.230 229 � 0.227Saturated fat (g/d) 22.7 � 0.040 22.7 � 0.034 23.8 � 0.035 20.7 � 0.043 23.3 � 0.034 25 � 0.032Monounsaturated fat (g/d) 25.3 � 0.040 26.8 � 0.034 29.2 � 0.037 22.1 � 0.036 27.3 � 0.031 32 � 0.034Polyunsaturated fat (g/d) 10.7 � 0.018 12.3 � 0.015 15.7 � 0.020 9.2 � 0.011 12.4 � 0.009 17 � 0.018trans Fat (g/d) 3.0 � 0.008 3.1 � 0.008 3.4 � 0.009 2.5 � 0.007 3.2 � 0.008 3.6 � 0.009Total fat (g/d) 64.60. � 090 67.9 � 0.078 75.2 � 0.082 57.5 � 0.086 69.3 � 0.068 80.0 � 0.071EPA (g/d) 0.1 � 0.001 0.1 � 0.001 0.1 � 0.002 0.1 � 0.001 0.1 � 0.001 0.1 � 0.001DHA (g/d) 0.2 � 0.001 0.2 � 0.001 0.2 � 0.001 0.2 � 0.001 0.2 � 0.001 0.2 � 0.001EPA � DHA (g/d) 0.3 � 0.002 0.3 � 0.002 0.3 � 0.002 0.3 � 0.002 0.3 � 0.001 0.3 � 0.001Fish (servings/d) 0.4 � 0.002 0.4 � 0.002 0.4 � 0.002 0.4 � 0.002 0.4 � 0.002 0.3 � 0.002Fruit (servings/d) 2.4 � 0.009 2.4 � 0.008 2.2 � 0.008 2.8 � 0.010 2.3 � 0.008 2.0 � 0.007Vegetables (servings/d) 2.8 � 0.009 3.5 � 0.010 3.4 � 0.010 3.4 � 0.011 3.3 � 0.010 3.1 � 0.009Nuts (servings/d) 0.5 � 0.009 0.4 � 0.003 0.4 � 0.003 0.2 � 0.002 0.4 � 0.003 0.8 � 0.006Energy intake (kcal/d) 1950.0 � 3.598 1971.9 � 3.510 1965.0 � 3.641 1952.0 � 3.604 1984.4 � 3.570 1950 � 3.646
1 EPA, eicosapentaenoic acid; DHA, docosahexaenoic acid. All P values comparing differences by categories of �-linolenic and linoleic acid intakes weresignificant at P � 0.001, probably because of the large sample size.
2 Range in parentheses (all such values).3 x� � SE (all such values).
TABLE 3Intakes of �-linolenic and linoleic acids and pneumonia risk1
Categories of intake
P for trendQuintile 1 Quintile 2 Quintile 3 Quintile 4 Quintile 5
�-Linolenic acidMedian intake (g/d) 0.71 0.88 1.01 1.19 1.53No. of cases (n) 107 98 90 79 67Person-years of follow-up 29 415 28 317 30 644 28 654 28 880Persons at risk (n) 8350 7924 7533 7432 7076Multivariate RR (95% CI) 1.00 0.99 (0.75, 1.32) 0.86 (0.64, 1.15) 0.82 (0.61, 1.11) 0.68 (0.50, 0.93) 0.01
Linoleic acidMedian intake (g/d) 7.64 9.54 11.03 12.71 15.75No. of cases (n) 103 101 91 79 67Person-years of follow-up 29201 29096 29289 29145 29179Persons at risk (n) 9375 8298 7026 6771 6836Multivariate RR (95% CI) 1.00 1.05 (0.80, 1.39) 0.98 (0.73, 1.31) 0.80 (0.59, 1.09) 0.70 (0.51, 0.96) 0.01
1 RR, relative risk. Adjusted for age in months, smoking (never, past, and current smokers who smoked 1–14, 15–24, or � 25 cigarettes/d), BMI (in kg/m2:�21 to 21–22.9, 23–24.9, 25–29.9, and �30), alcohol use (never, 0.1–4.9, 5.0–14.9, 15.0–29.9, and �30 g/d), physical activity (quintiles of metabolicequivalents), diabetes (dichotomous), and total energy intake (continuous) by using the Cox proportional hazards model to obtain RRs and the Mantel extensiontest for the test for trend.
n�6 AND n�3 FATTY ACID INTAKE AND PNEUMONIA RISK 671
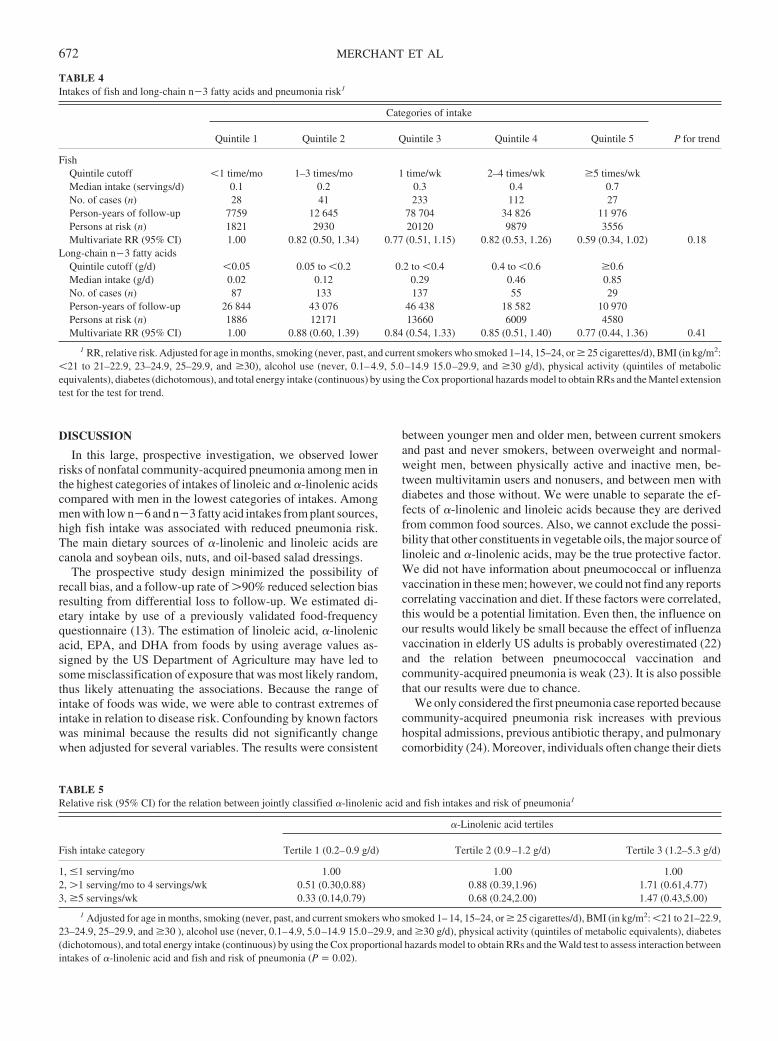
DISCUSSION
In this large, prospective investigation, we observed lowerrisks of nonfatal community-acquired pneumonia among men inthe highest categories of intakes of linoleic and �-linolenic acidscompared with men in the lowest categories of intakes. Amongmen with low n�6 and n�3 fatty acid intakes from plant sources,high fish intake was associated with reduced pneumonia risk.The main dietary sources of �-linolenic and linoleic acids arecanola and soybean oils, nuts, and oil-based salad dressings.
The prospective study design minimized the possibility ofrecall bias, and a follow-up rate of �90% reduced selection biasresulting from differential loss to follow-up. We estimated di-etary intake by use of a previously validated food-frequencyquestionnaire (13). The estimation of linoleic acid, �-linolenicacid, EPA, and DHA from foods by using average values as-signed by the US Department of Agriculture may have led tosome misclassification of exposure that was most likely random,thus likely attenuating the associations. Because the range ofintake of foods was wide, we were able to contrast extremes ofintake in relation to disease risk. Confounding by known factorswas minimal because the results did not significantly changewhen adjusted for several variables. The results were consistent
between younger men and older men, between current smokersand past and never smokers, between overweight and normal-weight men, between physically active and inactive men, be-tween multivitamin users and nonusers, and between men withdiabetes and those without. We were unable to separate the ef-fects of �-linolenic and linoleic acids because they are derivedfrom common food sources. Also, we cannot exclude the possi-bility that other constituents in vegetable oils, the major source oflinoleic and �-linolenic acids, may be the true protective factor.We did not have information about pneumococcal or influenzavaccination in these men; however, we could not find any reportscorrelating vaccination and diet. If these factors were correlated,this would be a potential limitation. Even then, the influence onour results would likely be small because the effect of influenzavaccination in elderly US adults is probably overestimated (22)and the relation between pneumococcal vaccination andcommunity-acquired pneumonia is weak (23). It is also possiblethat our results were due to chance.
We only considered the first pneumonia case reported becausecommunity-acquired pneumonia risk increases with previoushospital admissions, previous antibiotic therapy, and pulmonarycomorbidity (24). Moreover, individuals often change their diets
TABLE 4Intakes of fish and long-chain n�3 fatty acids and pneumonia risk1
Categories of intake
P for trendQuintile 1 Quintile 2 Quintile 3 Quintile 4 Quintile 5
FishQuintile cutoff �1 time/mo 1–3 times/mo 1 time/wk 2–4 times/wk �5 times/wkMedian intake (servings/d) 0.1 0.2 0.3 0.4 0.7No. of cases (n) 28 41 233 112 27Person-years of follow-up 7759 12 645 78 704 34 826 11 976Persons at risk (n) 1821 2930 20120 9879 3556Multivariate RR (95% CI) 1.00 0.82 (0.50, 1.34) 0.77 (0.51, 1.15) 0.82 (0.53, 1.26) 0.59 (0.34, 1.02) 0.18
Long-chain n�3 fatty acidsQuintile cutoff (g/d) �0.05 0.05 to �0.2 0.2 to �0.4 0.4 to �0.6 �0.6Median intake (g/d) 0.02 0.12 0.29 0.46 0.85No. of cases (n) 87 133 137 55 29Person-years of follow-up 26 844 43 076 46 438 18 582 10 970Persons at risk (n) 1886 12171 13660 6009 4580Multivariate RR (95% CI) 1.00 0.88 (0.60, 1.39) 0.84 (0.54, 1.33) 0.85 (0.51, 1.40) 0.77 (0.44, 1.36) 0.41
1 RR, relative risk. Adjusted for age in months, smoking (never, past, and current smokers who smoked 1–14, 15–24, or � 25 cigarettes/d), BMI (in kg/m2:�21 to 21–22.9, 23–24.9, 25–29.9, and �30), alcohol use (never, 0.1–4.9, 5.0–14.9 15.0–29.9, and �30 g/d), physical activity (quintiles of metabolicequivalents), diabetes (dichotomous), and total energy intake (continuous) by using the Cox proportional hazards model to obtain RRs and the Mantel extensiontest for the test for trend.
TABLE 5Relative risk (95% CI) for the relation between jointly classified �-linolenic acid and fish intakes and risk of pneumonia1
Fish intake category
�-Linolenic acid tertiles
Tertile 1 (0.2–0.9 g/d) Tertile 2 (0.9–1.2 g/d) Tertile 3 (1.2–5.3 g/d)
1, �1 serving/mo 1.00 1.00 1.002, �1 serving/mo to 4 servings/wk 0.51 (0.30,0.88) 0.88 (0.39,1.96) 1.71 (0.61,4.77)3, �5 servings/wk 0.33 (0.14,0.79) 0.68 (0.24,2.00) 1.47 (0.43,5.00)
1 Adjusted for age in months, smoking (never, past, and current smokers who smoked 1– 14, 15–24, or � 25 cigarettes/d), BMI (in kg/m2: �21 to 21–22.9,23–24.9, 25–29.9, and �30 ), alcohol use (never, 0.1–4.9, 5.0–14.9 15.0–29.9, and �30 g/d), physical activity (quintiles of metabolic equivalents), diabetes(dichotomous), and total energy intake (continuous) by using the Cox proportional hazards model to obtain RRs and the Wald test to assess interaction betweenintakes of �-linolenic acid and fish and risk of pneumonia (P � 0.02).
672 MERCHANT ET AL
after major illness. Including all episodes of pneumonia wouldhave increased our number of cases but would have raised con-cerns of possible biases because of the above-mentioned reasons.We therefore opted for the more conservative but valid approachof considering only the first report of disease. We restricted ouranalyses to pneumonia that had been diagnosed on the basis ofradiographic findings to minimize false-positive cases and in-crease internal validity. We therefore also excluded fatal pneu-monia cases, because the radiographic evidence of pneumoniawas often missing. It was particularly important to avoid mis-classification of outcome in the case of pneumonia because in arandomized clinical trial, vitamin E supplementation did nothave any effect on lower respiratory infections but was protectiveagainst upper respiratory infections (25). Even though the hy-pothesized mechanisms through which n�6 and n�3 fatty acidsmodulate pneumonia risk are likely the same in fatal and nonfatalpneumonia, we were unable to directly evaluate fatal pneumoniain this study. Our results should therefore be interpreted with thiscaveat.
Our results are consistent with other studies examining therelation between these fatty acids and risk of infection or immunesystem responsiveness. In a randomized, crossover double-blindstudy of 20 children aged 36–49 mo, supplementation with n�3and n�6 fatty acids reduced infective episodes, days with fever,and days absent from school compared with placebo (7). Inanother study, elderly patients undergoing surgery who receivedan immune-enhancing preparation that included polyunsaturatedfatty acids had better delayed-type hypersensitivity responsesthan did subjects who received placebo (26). In patients withacute respiratory distress syndrome caused by sepsis, pneumo-nia, trauma, or aspiration and requiring enteral nutrition, thosereceiving EPA and �-linolenic acid added to their diets had lessneed for artificial ventilators, shorter lengths of intensive careunit stay, and less organ failure than did control subjects (27).
Essential fatty acid intake may decrease infection risk by re-ducing inflammation (4) and improving insulin sensitivity (28).Plasma concentrations of inflammatory cytokines increase withthe severity of community-acquired pneumonia (29). Severepneumonia is more likely in individuals with a genetic predis-position for inflammation (30) and in those with a defect in heatshock protein production (31). Inflammatory cytokine concen-trations increase with hyperglycemia (32); hyperglycemia raisesinfection risk in both persons with diabetes (33) and those with-out diabetes (34).
n�6 Fatty acids have been hypothesized to increase inflam-mation because they are precursors of the proinflammatory ei-cosanoids (4). However, evidence is growing that intakes of n�6together with n�3 fatty acids may reduce inflammation morethan intakes of either essential fatty acid alone (9, 35). Habitualn�6 and n�3 fatty acid intakes were inversely associated withplasma inflammatory cytokines (35), and higher serum fattyacids from vegetable sources (eg, linoleic and �-linolenic acids)were associated with reduced risk of impaired fasting glycemiaand diabetes in middle-aged men (36). Essential fatty acids areligands of the peroxisome proliferator-activated receptor-� andhave been shown to increase insulin sensitivity (28). EPA andDHA have been shown to reduce lipopolysaccharide-inducedinflammation through the pathway activated by peroxisomeproliferator-activator receptor-� (10). Taken together, these factsare consistent with the hypothesis fatty acids may modulate
community-acquired pneumonia risk through reduced inflam-mation and improved glycemic control.
To the best of our knowledge, this is the first study to evaluatethe association between intakes of n�6 and n�3 fatty acids andrisk of community-acquired pneumonia in healthy adult men.Fish and nut intakes (high in polyunsaturated fats) have beenshown to be inversely associated with the risk of diabetes (37),stroke (21), and CHD (16, 38), leading to recommendations forhigher intakes (39). Our data on the inverse relations betweenn�6 and n�3 fatty acid intake and pneumonia risk providefurther support for recommendations to replace animal and par-tially hydrogenated fats with those foods and nonhydrogenatedvegetable oils in general.
We thank the participants of the Health Professionals Follow-up Study fortheir cooperation and participation.
ATM was responsible for data analysis. ATM, GCC, EBR, WCW, andWWF were responsible for drafting the manuscript. EBR and WCW wereresponsible for procuring funding. None of the authors had any conflict ofinterest.
REFERENCES1. Centers for Disease Control and Prevention, National Center for Injury
Prevention and Control. 10 Leading causes of death, United States 1999,all races, both sexes. Internet: http://webapp.cdc.gov/sasweb/ncipc/leadcaus.html (version current 6 August 2004). Accessed 25 June, 2005.
2. Baik I, Curhan GC, Rimm EB, Bendich A, Willett WC, Fawzi WW. Aprospective study of age and lifestyle factors in relation to community-acquired pneumonia in US men and women. Arch Intern Med 2000;160:3082–8.
3. Fernandez-Sola J, Junque A, Estruch R, Monforte R, Torres A, Urbano-Marquez A. High alcohol intake as a risk and prognostic factor forcommunity-acquired pneumonia. Arch Intern Med 1995;155:1649–54.
4. Calder PC, Grimble RF. Polyunsaturated fatty acids, inflammation andimmunity. Eur J Clin Nutr 2002;56(suppl):14–9.
5. Kris-Etherton PM, Taylor DS, Yu-Poth S, et al. Polyunsaturated fattyacids in the food chain in the United States. Am J Clin Nutr 2000;71(suppl):179S–88S.
6. Simopoulos AP. Omega-3 Fatty acids in inflammation and autoimmunediseases. J Am Coll Nutr 2002;21:495–505.
7. Venuta A, Spano C, Laudizi L, Bettelli F, Beverelli A, Turchetto E.Essential fatty acids: the effects of dietary supplementation among chil-dren with recurrent respiratory infections. J Int Med Res 1996;24:325–30.
8. Kew S, Banerjee T, Minihane AM, Finnegan YE, Williams CM, CalderPC. Relation between the fatty acid composition of peripheral bloodmononuclear cells and measures of immune cell function in healthy,free-living subjects aged 25–72 y. Am J Clin Nutr 2003;77:1278–86.
9. Song C, Li X, Leonard BE, Horrobin DF. Effects of dietary n�3 or n�6fatty acids on interleukin-1beta-induced anxiety, stress, and inflamma-tory responses in rats. J Lipid Res 2003;44:1984–91.
10. Li H, Ruan XZ, Powis SH, et al. EPA and DHA reduce LPS-inducedinflammation responses in HK-2 cells: evidence for a PPAR-gamma-dependent mechanism. Kidney Int 2005;67:867–74.
11. Rimm EB, Giovannucci EL, Willett WC, et al. Prospective study ofalcohol consumption and risk of coronary disease in men. Lancet 1991;338:464–8.
12. Stampfer MJ, Willett WC, Speizer FE, et al. Test of the National DeathIndex. Am J Epidemiol 1984;119:837–9.
13. Rimm EB, Giovannucci EL, Stampfer MJ, Colditz GA, Litin LB, WillettWC. Reproducibility and validity of an expanded self-administeredsemiquantitative food frequency questionnaire among male health pro-fessionals. Am J Epidemiol 1992;135:1114–26.
14. Haytowitz DB. Information from USDA’s Nutrient Data Bank. J Nutr1995;125:1952–5.
15. Willett WC, Sampson L, Stampfer MJ, et al. Reproducibility and validityof a semiquantitative food frequency questionnaire. Am J Epidemiol1985;122:51–65.
16. Hu FB, Stampfer MJ, Manson JE, et al. Dietary intake of alpha-linolenic
n�6 AND n�3 FATTY ACID INTAKE AND PNEUMONIA RISK 673
acid and risk of fatal ischemic heart disease among women. Am J ClinNutr 1999;69:890–7.
17. Willett WC, Howe GR, Kushi LH. Adjustment for total energy intake inepidemiologic studies. Am J Clin Nutr 1997;65(suppl):1220S–8S.
18. Hunter DJ, Rimm EB, Sacks FM, et al. Comparison of measures of fattyacid intake by subcutaneous fat aspirate, food frequency questionnaire,and diet records in a free-living population of US men. Am J Epidemiol1992;135:418–27.
19. Garland M, Sacks FM, Colditz GA, et al. The relation between dietaryintake and adipose tissue composition of selected fatty acids in USwomen. Am J Clin Nutr 1998;67:25–30.
20. Feskanich D, Rimm EB, Giovannucci EL, et al. Reproducibility andvalidity of food intake measurements from a semiquantitative food fre-quency questionnaire. J Am Diet Assoc 1993;93:790–6.
21. He K, Rimm EB, Merchant A, et al. Fish consumption and risk of strokein men. JAMA 2002;288:3130–6.
22. Simonsen L, Reichert TA, Viboud C, Blackwelder WC, Taylor RJ,Miller MA. Impact of influenza vaccination on seasonal mortality in theUS elderly population. Arch Intern Med 2005;165:265–72.
23. Jackson LA, Neuzil KM, Yu O, et al. Effectiveness of pneumococcalpolysaccharide vaccine in older adults. N Engl J Med 2003;348:1747–55.
24. Arancibia F, Bauer TT, Ewig S, et al. Community-acquired pneumoniadue to gram-negative bacteria and Pseudomonas aeruginosa: incidence,risk, and prognosis. Arch Intern Med 2002;162:1849–58.
25. Meydani SN, Leka LS, Fine BC, et al. Vitamin E and respiratory tractinfections in elderly nursing home residents: a randomized controlledtrial. JAMA 2004;292:828–36.
26. Tepaske R, Velthuis H, Oudemans-van Straaten HM, et al. Effect ofpreoperative oral immune-enhancing nutritional supplement on patientsat high risk of infection after cardiac surgery: a randomised placebo-controlled trial. Lancet 2001;358:696–701.
27. Gadek JE, DeMichele SJ, Karlstad MD, et al. Effect of enteral feedingwith eicosapentaenoic acid, gamma-linolenic acid, and antioxidants inpatients with acute respiratory distress syndrome. Enteral Nutrition inARDS Study Group. Crit Care Med 1999;27:1409–20.
28. Kliewer SA, Sundseth SS, Jones SA, et al. Fatty acids and eicosanoids
regulate gene expression through direct interactions with peroxisomeproliferator-activated receptors alpha and gamma. Proc Natl Acad Sci US A 1997;94:4318–23.
29. Fernandez-Serrano S, Dorca J, Coromines M, Carratala J, Gudiol F,Manresa F. Molecular inflammatory responses measured in blood ofpatients with severe community-acquired pneumonia. Clin Diagn LabImmunol 2003;10:813–20.
30. Gallagher PM, Lowe G, Fitzgerald T, et al. Association of IL-10 poly-morphism with severity of illness in community acquired pneumonia.Thorax 2003;58:154–6.
31. Waterer GW, El Bahlawan L, Quasney MW, Zhang Q, Kessler LA,Wunderink RG. Heat shock protein 70–2�1267 AA homozygotes havean increased risk of septic shock in adults with community-acquiredpneumonia. Crit Care Med 2003;31:1367–72.
32. Esposito K, Nappo F, Marfella R, et al. Inflammatory cytokine concen-trations are acutely increased by hyperglycemia in humans: role of ox-idative stress. Circulation 2002;106:2067–72.
33. Golden SH, Peart-Vigilance C, Kao WH, Brancati FL. Perioperativeglycemic control and the risk of infectious complications in a cohort ofadults with diabetes. Diabetes Care 1999;22:1408–14.
34. Van den Berghe G. Beyond diabetes: saving lives with insulin in the ICU.Int J Obes Relat Metab Disord 2002;26(suppl):3–8.
35. Pischon T, Hankinson SE, Hotamisligil GS, Rifai N, Willett W, RimmEB. Habitual dietary intake of n�3 and n�6-fatty acids in relation toinflammatory markers among US men and women. Circulation 2003;108:155–60.
36. Laaksonen DE, Lakka TA, Lakka HM, et al. Serum fatty acid compo-sition predicts development of impaired fasting glycaemia and diabetesin middle-aged men. Diabet Med 2002;19:456–64.
37. van Dam RM, Rimm EB, Willett WC, Stampfer MJ, Hu FB. Dietarypatterns and risk for type 2 diabetes mellitus in U.S. men. Ann Intern Med2002;136:201–9.
38. Hu FB, Bronner L, Willett WC, et al. Fish and omega-3 fatty acid intakeand risk of coronary heart disease in women. JAMA 2002;287:1815–21.
39. Willett WC, Stampfer MJ. Rebuilding the food pyramid. Sci Am 2003;288:64–71.
674 MERCHANT ET AL
See corresponding CME exam on page 714.
Dietary pattern, inflammation, and incidence of type 2 diabetes inwomen1–3
Matthias B Schulze, Kurt Hoffmann, JoAnn E Manson, Walter C Willett, James B Meigs, Cornelia Weikert,Christin Heidemann, Graham A Colditz, and Frank B Hu
ABSTRACTBackground: Inflammation is considered a key mechanism leadingto type 2 diabetes, but dietary exposures that lead to inflammationand diabetes are largely unknown.Objective: Our objective was to investigate the relation between adietary pattern associated with biomarkers of inflammation and theincidence of type 2 diabetes.Design: We conducted a nested case-control study of 656 cases oftype 2 diabetes and 694 controls among women in the Nurses’ HealthStudy and 2 prospective cohort studies of 35 340 women in theNurses’ Health Study and 89 311 women in the Nurses’ HealthStudy II who were followed for incident diabetes.Results: Through the use of reduced rank regression, we identifieda dietary pattern that was strongly related to inflammatory markersin the nested case-control study. This pattern, which was high insugar-sweetened soft drinks, refined grains, diet soft drinks, andprocessed meat but low in wine, coffee, cruciferous vegetables, andyellow vegetables, was associated with an increased risk of diabetes(multivariate-adjusted odds ratio comparing extreme quintiles: 3.09;95% CI: 1.99, 4.79). We identified 1517 incident cases of confirmedtype 2 diabetes in the Nurses’ Health Study (458 991 person-years)and 724 incident cases in the Nurses’ Health Study II (701 155person-years). After adjustment for body mass index and other po-tential lifestyle confounders, the relative risks comparing extremequintiles of the pattern were 2.56 (95% CI: 2.10, 3.12; P for trend �0.001) in the Nurses’ Health Study and 2.93 (95% CI: 2.18, 3.92; Pfor trend � 0.001) in the Nurses’ Health Study II.Conclusion: The dietary pattern identified may increase chronic in-flammation and raise the risk of developing type 2 diabetes. Am JClin Nutr 2005;82:675–84.
KEY WORDS Body mass index, diet pattern, incidence, in-flammation, non-insulin-dependent diabetes mellitus, type 2 diabe-tes, prospective studies, questionnaires, reduced rank regression,risk factors
INTRODUCTION
Accumulating evidence supports the hypothesis that chroniclow-grade inflammation and activation of the innate immunesystem are closely involved in the pathogenesis of type 2 diabe-tes. Since this hypothesis was first proposed in 1997 (1), manystudies have shown that circulating markers of inflammation arestrong predictors of the development of type 2 diabetes (2).
Dietary factors may have effects on inflammation and endothe-lial function independent of smoking, hypercholesterolemia, hy-perhomocysteinemia, and hypertension (3). Several dietary fac-tors have also been identified to be associated with diabetes risk,including types of carbohydrate and fat, magnesium and cerealfiber intakes, and consumption of coffee, meats, and sugar-sweetened beverages (4). Dietary patterns, which reflect differ-ent combinations of food intake, have also been associated withdiabetes risk (5–8) and with markers of inflammation (9, 10).However, previous attempts to derive food patterns were largelydetermined by variation in food choices among individuals andcould not incorporate biomarkers into the analyses on the basis ofa priori hypotheses. We therefore derived a dietary pattern thatwas strongly associated with markers of inflammation and en-dothelial dysfunction and evaluated the association between thispattern and the risk of developing type 2 diabetes in 2 large cohortstudies of women.
SUBJECTS AND METHODS
Study populations
The Nurses’ Health Study (NHS) cohort was established in1976 when 121 700 female registered nurses aged 30–55 y andresiding in 11 US states responded to mailed questionnairesregarding their medical history and health practices. The respon-dents reflect the racial composition of women trained as regis-tered nurses at that time; 97% were white (11). Since 1976,
1 From the Department of Epidemiology, German Institute of HumanNutrition Potsdam-Rehbruecke, Nuthetal, Germany (MBS, KH, CW, andCH); the Division of Preventive Medicine (JEM) and the Channing Labora-tory (JEM, WCW, GAC, and FBH), Department of Medicine, Brigham andWomen’s Hospital and Harvard Medical School, Boston, MA; the Depart-ments of Epidemiology (JEM, WCW, GAC, and FBH) and Nutrition (WCWand FBH), Harvard School of Public Health, Boston, MA; and the GeneralMedicine Division, Massachusetts General Hospital, Boston, MA (JBM).
2 Supported by research grants (CA50385, CA87969, HL60712, andDK58845) from the National Institutes of Health. MBS is supported by agrant from the Deutsche Krebshilfe. JBM is supported in part by an AmericanDiabetes Association Career Development Award. FBH is the recipient of anAmerican Heart Association Established Investigator Award.
3 Reprints not available. Address correspondence to MB Schulze, GermanInstitute of Human Nutrition Potsdam-Rehbruecke, Department of Epide-miology, Arthur-Scheunert-Allee 114-116, 14558 Nuthetal, Germany. E-mail: [email protected].
Received March 2, 2005.Accepted for publication May 13, 2005.
675Am J Clin Nutr 2005;82:675–84. Printed in USA. © 2005 American Society for Clinical Nutrition
questionnaires have been administered biennially to updatehealth information and to identify new cases of disease. During1989 through 1990, 32 826 women free of diagnosed diabetes,ischemic heart disease, stroke, or cancer provided blood samples.By 2000, 737 of these women had developed definite diabetes.Control women providing baseline blood samples were matchedto diabetes cases by year of birth, date of blood draw, race, andfasting status (at least 8 h overnight) at the time of the blood draw.In addition, to improve statistical control for obesity at the upperextreme of the distribution, control subjects were also matchedby body mass index (BMI) for case subjects in the top 10% of theBMI distribution, giving a sample of 785 control women. A totalof 656 cases and 694 controls completed a dietary questionnairein 1986, 1990, or both and had complete information on bodyweight, height, physical activity, smoking, and biomarkers.
Among those NHS participants who did not provide blood,51 895 women completed a dietary questionnaire in 1984. Afterthe exclusion of women with a history of diabetes, cancer (exceptnonmelanoma skin cancer), or cardiovascular disease; with im-plausible energy intakes (eg, �500 or �3500 kcal/d); or withoutinformation on physical activity or body weight, 35 340 womenremained for cohort analyses separate from the nested case-control analysis.
The Nurses’ Health Study II (NHS-II) is a prospective cohortstudy of 116 671 female US nurses. Participants were aged24–44 y at the study start in 1989. As with the NHS cohort, theNHS-II cohort is followed up through the use of biennial mailedquestionnaires. The follow-up rate exceeds 90% for every 2-yperiod, and we estimate nearly complete (98%) ascertainment ofmortality. For the analyses presented here, women were ex-cluded from the baseline population if they did not complete adietary questionnaire in 1991; if the reported dietary intake wasimplausible with regard to total energy intake; if they had ahistory of diabetes, cancer (except nonmelanoma skin cancer), orcardiovascular disease reported on either the 1989 or 1991 ques-tionnaire; or if they had not provided data on body weight andphysical activity in 1991. These exclusions left a total of 89 311women for the analyses.
Both studies were approved by the Human Research Commit-tees at the Harvard School of Public Health and the Brigham andWomen’s Hospital. Completion of the self-administered ques-tionnaire was considered to imply informed consent.
Dietary assessment
Dietary intake information was collected through semiquan-titative food-frequency questionnaires (FFQs). Women wereasked how often they had consumed a commonly used unit orportion size of each food on average during the previous year,with 9 possible frequency responses ranging from “never” to“more than 6 times a day.” For this analysis, we used informationcollected through the 1984, 1986, 1990, and 1994 FFQs in theNHS and the 1991 and 1995 FFQs in the NHS-II, respectively.Foods were classified into 39 food groups on the basis of nutrientprofiles and culinary usage (12). Nutrient intakes were computedby multiplying the frequency response by the nutrient content ofthe specified portion sizes. Values for nutrients were derivedfrom US Department of Agriculture sources (13) supplementedwith information from manufacturers and biochemical analyses
at Harvard School of Public Health. Intakes of cereal fiber, mag-nesium, and caffeine and the glycemic index were energy ad-justed by using the residuals method (14). Intakes of carbohy-drates and trans fatty acids were expressed as nutrient density (%of total energy intake) (14). The validity and reliability of theFFQ used in the NHS have been described elsewhere (15, 16).Briefly, the mean correlation coefficient between frequencies ofintake of 55 foods from 2 FFQs administered 12 mo apart was0.57, and the mean corrected correlation coefficient betweendietary records and a subsequent FFQ was 0.66 in the NHS (15).
Ascertainment of type 2 diabetes
Women reporting a new diagnosis of diabetes on any of thebiennial questionnaires were sent supplementary questionnairesasking about diagnostic tests and treatment of their diabetes andhistory of ketoacidosis or ketosis to distinguish between type 1and type 2 diabetes. In accordance with the criteria of the Na-tional Diabetes Data Group (17), confirmation of diabetes re-quired at least one of the following: 1) an elevated plasma glucoseconcentration [fasting plasma glucose � 7.8 mmol/L (140 mg/dL), random plasma glucose � 11.1 mmol/L (200 mg/dL), orplasma glucose � 11.1 mmol/L (200 mg/dL) after � 2 h duringan oral-glucose-tolerance test] plus at least one classic symptom(excessive thirst, polyuria, weight loss, or hunger); 2) no symp-toms, but at least 2 elevated plasma glucose concentrations (bythe above criteria) on different occasions; or 3) treatment withhypoglycemic medication (insulin or oral hypoglycemic agent).The diagnostic criteria for type 2 diabetes were changed in 1997(18) such that lower fasting glucose levels (�7 mmol/L, or 126mg/dL) would now be considered diagnostic. Thus, we used theAmerican Diabetes Association criteria for diagnosis of diabetesafter 1998. In a substudy of the NHS, 98% of the self-reporteddiabetes cases documented by the same supplementary question-naire were confirmed by medical record review (19, 20).
Assessment of nondietary exposures
Information on age, weight, smoking status, contraceptiveuse, and postmenopausal hormone therapy was collected throughbiennial questionnaires. We calculated BMI as the ratio of weight(in kg) to squared height (in m2), the latter being assessed atbaseline only. Self-reports of body weight have been highlycorrelated with technician-measured weights (r � 0.96) in theNHS (21). Waist and hip circumferences were self-reported in1986 and 1996 in the NHS and in 1993 in the NHS-II. Physicalactivity, assessed in 1986, 1988, 1992, 1994, and 1996 in theNHS and in 1991 and 1997 in the NHS-II, was computed asmetabolic equivalents (MET) per week by using the duration perweek of various forms of exercise, with each activity weighted byits intensity level. Physical activity reported on the questionnairewas highly correlated with activity recorded in diaries or by 24-hrecall in the NHS-II (0.79 and 0.62) (22).
Laboratory procedures
Women in the NHS willing to provide blood specimens weresent instructions and a phlebotomy kit (including sodium heparinblood tubes, needles, and a tourniquet). Blood specimens werereturned by overnight mail in a frozen water bottle. On arrival, thesamples were centrifuged to separate plasma from the buffy coatand red cells and were frozen in liquid nitrogen until analyzed.
676 SCHULZE ET AL
Ninety-seven percent of samples arrived within 26 h of phlebot-omy.
Frozen plasma samples from case and control subjects wereselected for simultaneous analysis. C-reactive protein (CRP)concentrations were measured by use of a high-sensitivity latex-enhanced immunonephelometric assay on a BN II analyzer(Dade Behring, Newark, DE). Interleukin 6 (IL-6) was measuredby a quantitative sandwich enzyme immunoassay technique(Quantikine HS Immunoassay kit; R&D Systems, Minneapolis),and plasma concentrations of soluble fractions of tumor necrosisfactor � receptor 2 (sTNFR2) were measured by use of anenzyme-linked immunosorbent assay (ELISA) kit using immo-bilized monoclonal antibody to human sTNFR2 (Genzyme,Cambridge, MA). Concentrations of E-selectin, soluble intracel-lular cell adhesion molecule 1 (sICAM-1), and soluble vascularcell adhesion molecule 1 (sVCAM-1) were measured by com-mercial ELISA (R & D Systems). The interassay CVs for eachanalyte were as follows: 3.4–3.8% for CRP, 5.8–8.2% for IL-6,6.2% for sTNFR2, 6.4–6.6% for E-selectin, 6.1–10.1% forsICAM-1, and 8.5–10.2% for sVCAM-1.
Statistical analysis
In the nested case-control sample of the NHS, we calculatedthe mean intake from the 1986 and 1990 FFQs for the 39 foodgroups to reduce within-subject variation and best representlong-term diet (23). We subsequently applied reduced rank re-gression (RRR) to derive a dietary pattern predictive of diabetesrisk. RRR identifies linear functions of predictors (eg, foodgroups) that explain as much response (eg, biomarker) variationas possible. RRR can be interpreted as a principal componentanalysis applied to responses and a subsequent linear regressionof principal components on predictors, although it is somewhatmore sophisticated and efficient than this 2-step procedure. Thus,we calculated linear functions of food group intake (dietary pat-terns) that explain as much variation in inflammatory biomarkersas possible. The first factor obtained by RRR was retained forsubsequent analyses because it explains the largest amount ofvariation among the biomarkers. A more detailed description ofthe method, including the SAS code and its application in nutri-tional epidemiology, can be found elsewhere (24). Results of theRRR analysis based on food intakes expressed as energy densi-ties were similar and are not reported here.
Pearson correlation coefficients were used to evaluate associ-ations between the derived pattern and inflammatory biomarkersin the nested case-control sample of the NHS. We divided thedistributions of the derived dietary pattern into quintiles based onthe control subjects and calculated the geometric mean biomar-ker concentrations across pattern quintiles with adjustment foranthropometric and lifestyle characteristics. We used uncondi-tional logistic regression models to estimate the odds ratio (OR)of diabetes in each quintile by using the lowest quintile as thereference category and to estimate the significance of trend inORs across increasing biomarker quintiles. Multivariate modelswere adjusted for age (5-y groups), BMI (�21.0, 21.0–22.9,23.0–24.9, 25.0–26.9, 27.0–28.9, 29.0–30.9, 31.0–32.9, 33.0–34.9, and �35.0), physical activity (MET score in quintiles),family history of diabetes in a first-degree relative (yes or no),smoking (missing, never, past, or current), postmenopausal hor-mone use (missing, never, or ever), total energy intake (quin-tiles), and fasting status. The results of conditional logistic re-gression with conditioning on matching factors, such as age,
fasting status, and race, were similar to the unconditional regres-sion models and are not reported here.
To cross-validate the results from the nested case-controlstudy, we first identified the important component foods of theRRR pattern by stepwise linear regression with a significancelevel of P � 0.05 for entry into and staying in the model with thebiomarker response score as the dependent variable and foodgroups as independent variables. A diet pattern score was thencalculated among women in the NHS who did not provide bloodas well as in the NHS-II as the linear combination of thesestandardized component food items (25). We estimated the rel-ative risk (RR) for each quintile of pattern score compared withthe lowest quintile by using Cox proportional hazards analysisstratified by 5-y age categories and 2-y intervals. Duration offollow-up was calculated as the interval between the return of the1984 questionnaire (NHS) and the 1991 questionnaire (NHS-II),respectively, and the diagnosis of diabetes (type 1 or type 2),death, or June 1, 1998 (NHS) or 1999 (NHS-II), respectively. Wecumulatively updated food intake information with subsequentquestionnaires, except for those individuals who reported a di-agnosis of cancer (except nonmelanoma skin cancer) or cardio-vascular disease during follow-up, because changes in diet afterdevelopment of these conditions may confound the relation be-tween dietary intake and diabetes (23).
We used information on covariates obtained from the baselineor subsequent questionnaires in multivariate analyses, includingBMI (9 categories), physical activity (MET score in quintiles),family history of diabetes in a first-degree relative (yes or no),smoking (missing, never, past, or current), postmenopausal hor-mone use (missing, never, or ever), and total energy intake (quin-tiles). We further adjusted for nutrient intake, in particular, mag-nesium intake (quintiles), caffeine intake (quintiles), cereal fiberintake (quintiles), trans fatty acid intake (quintiles), alcohol in-take (0, 0.1–4.9, 5.0–9.9, and �10 g/d), the glycemic index(quintiles), and the ratio of polyunsaturated to saturated fat (quin-tiles) to evaluate whether these nutrients may mediate the dietarypattern–disease association. Nondietary covariates were up-dated during follow-up by using the most recent data for each 2-yfollow-up interval. The significance of linear trends across quin-tiles of the pattern score was tested by assigning each participant themedian value for the quintile and modeling this value as a continu-ous variable. We also tested for effect modification by BMI, phys-ical activity, and family history of diabetes by performing analysesstratified by these variables and by evaluating interaction terms. Allstatistical analyses were performed by using SAS statistical soft-ware (version 8.0; SAS Institute Inc, Cary, NC).
RESULTS
Women in the NHS nested case-control population who sub-sequently developed type 2 diabetes were significantly less phys-ically active (x� � SD: 12.0 � 14.8 METs) and had greater BMIs(x� � SD: 30.2 � 5.6) at baseline than did women who remaineddiabetes free (15.8 � 28.1 METs; BMI: 26.1 � 5.1). The age ofthe participants did not differ significantly between the cases andthe controls (x� � SD: 56.2 � 6.9 y; range: 43–69 y). In addition,although the proportion of ex-smokers (41.1% and 42.4%) andcurrent smokers (13.4% and 13.2%) did not differ significantlybetween the cases and the controls, women who developed dia-betes were more likely to have had a family relative with a historyof diabetes (47.6% compared with 20.8%).
DIETARY PATTERN, INFLAMMATION, AND DIABETES 677
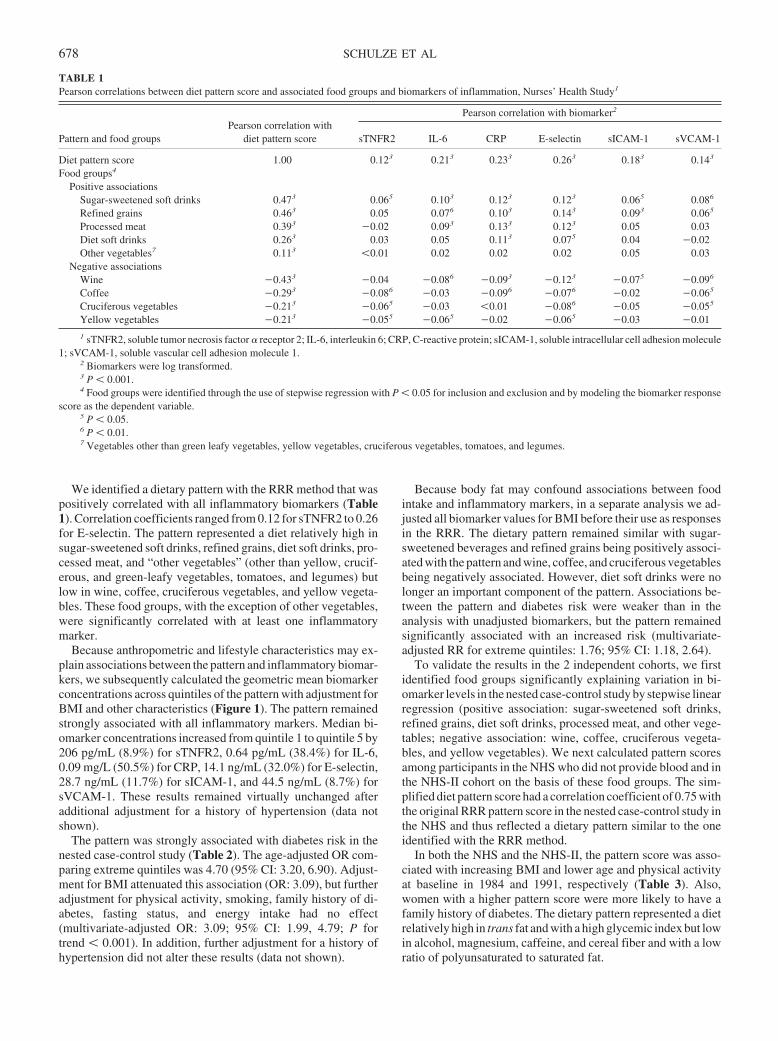
We identified a dietary pattern with the RRR method that waspositively correlated with all inflammatory biomarkers (Table1). Correlation coefficients ranged from 0.12 for sTNFR2 to 0.26for E-selectin. The pattern represented a diet relatively high insugar-sweetened soft drinks, refined grains, diet soft drinks, pro-cessed meat, and “other vegetables” (other than yellow, crucif-erous, and green-leafy vegetables, tomatoes, and legumes) butlow in wine, coffee, cruciferous vegetables, and yellow vegeta-bles. These food groups, with the exception of other vegetables,were significantly correlated with at least one inflammatorymarker.
Because anthropometric and lifestyle characteristics may ex-plain associations between the pattern and inflammatory biomar-kers, we subsequently calculated the geometric mean biomarkerconcentrations across quintiles of the pattern with adjustment forBMI and other characteristics (Figure 1). The pattern remainedstrongly associated with all inflammatory markers. Median bi-omarker concentrations increased from quintile 1 to quintile 5 by206 pg/mL (8.9%) for sTNFR2, 0.64 pg/mL (38.4%) for IL-6,0.09 mg/L (50.5%) for CRP, 14.1 ng/mL (32.0%) for E-selectin,28.7 ng/mL (11.7%) for sICAM-1, and 44.5 ng/mL (8.7%) forsVCAM-1. These results remained virtually unchanged afteradditional adjustment for a history of hypertension (data notshown).
The pattern was strongly associated with diabetes risk in thenested case-control study (Table 2). The age-adjusted OR com-paring extreme quintiles was 4.70 (95% CI: 3.20, 6.90). Adjust-ment for BMI attenuated this association (OR: 3.09), but furtheradjustment for physical activity, smoking, family history of di-abetes, fasting status, and energy intake had no effect(multivariate-adjusted OR: 3.09; 95% CI: 1.99, 4.79; P fortrend � 0.001). In addition, further adjustment for a history ofhypertension did not alter these results (data not shown).
Because body fat may confound associations between foodintake and inflammatory markers, in a separate analysis we ad-justed all biomarker values for BMI before their use as responsesin the RRR. The dietary pattern remained similar with sugar-sweetened beverages and refined grains being positively associ-ated with the pattern and wine, coffee, and cruciferous vegetablesbeing negatively associated. However, diet soft drinks were nolonger an important component of the pattern. Associations be-tween the pattern and diabetes risk were weaker than in theanalysis with unadjusted biomarkers, but the pattern remainedsignificantly associated with an increased risk (multivariate-adjusted RR for extreme quintiles: 1.76; 95% CI: 1.18, 2.64).
To validate the results in the 2 independent cohorts, we firstidentified food groups significantly explaining variation in bi-omarker levels in the nested case-control study by stepwise linearregression (positive association: sugar-sweetened soft drinks,refined grains, diet soft drinks, processed meat, and other vege-tables; negative association: wine, coffee, cruciferous vegeta-bles, and yellow vegetables). We next calculated pattern scoresamong participants in the NHS who did not provide blood and inthe NHS-II cohort on the basis of these food groups. The sim-plified diet pattern score had a correlation coefficient of 0.75 withthe original RRR pattern score in the nested case-control study inthe NHS and thus reflected a dietary pattern similar to the oneidentified with the RRR method.
In both the NHS and the NHS-II, the pattern score was asso-ciated with increasing BMI and lower age and physical activityat baseline in 1984 and 1991, respectively (Table 3). Also,women with a higher pattern score were more likely to have afamily history of diabetes. The dietary pattern represented a dietrelatively high in trans fat and with a high glycemic index but lowin alcohol, magnesium, caffeine, and cereal fiber and with a lowratio of polyunsaturated to saturated fat.
TABLE 1Pearson correlations between diet pattern score and associated food groups and biomarkers of inflammation, Nurses’ Health Study1
Pattern and food groupsPearson correlation with
diet pattern score
Pearson correlation with biomarker2
sTNFR2 IL-6 CRP E-selectin sICAM-1 sVCAM-1
Diet pattern score 1.00 0.123 0.213 0.233 0.263 0.183 0.143
Food groups4
Positive associationsSugar-sweetened soft drinks 0.473 0.065 0.103 0.123 0.123 0.065 0.086
Refined grains 0.463 0.05 0.076 0.103 0.143 0.093 0.065
Processed meat 0.393 �0.02 0.093 0.133 0.123 0.05 0.03Diet soft drinks 0.263 0.03 0.05 0.113 0.075 0.04 �0.02Other vegetables7 0.113 �0.01 0.02 0.02 0.02 0.05 0.03
Negative associationsWine �0.433 �0.04 �0.086 �0.093 �0.123 �0.075 �0.096
Coffee �0.293 �0.086 �0.03 �0.096 �0.076 �0.02 �0.065
Cruciferous vegetables �0.213 �0.065 �0.03 �0.01 �0.086 �0.05 �0.055
Yellow vegetables �0.213 �0.055 �0.065 �0.02 �0.065 �0.03 �0.01
1 sTNFR2, soluble tumor necrosis factor � receptor 2; IL-6, interleukin 6; CRP, C-reactive protein; sICAM-1, soluble intracellular cell adhesion molecule1; sVCAM-1, soluble vascular cell adhesion molecule 1.
2 Biomarkers were log transformed.3 P � 0.001.4 Food groups were identified through the use of stepwise regression with P � 0.05 for inclusion and exclusion and by modeling the biomarker response
score as the dependent variable.5 P � 0.05.6 P � 0.01.7 Vegetables other than green leafy vegetables, yellow vegetables, cruciferous vegetables, tomatoes, and legumes.
678 SCHULZE ET AL
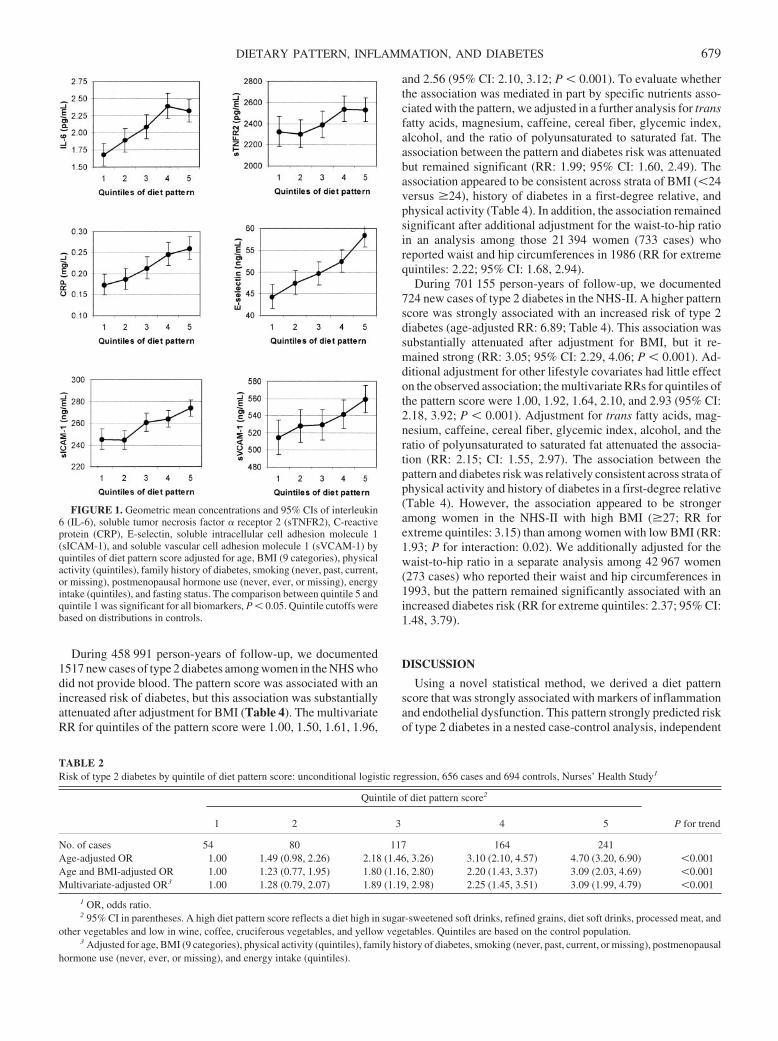
During 458 991 person-years of follow-up, we documented1517 new cases of type 2 diabetes among women in the NHS whodid not provide blood. The pattern score was associated with anincreased risk of diabetes, but this association was substantiallyattenuated after adjustment for BMI (Table 4). The multivariateRR for quintiles of the pattern score were 1.00, 1.50, 1.61, 1.96,
and 2.56 (95% CI: 2.10, 3.12; P � 0.001). To evaluate whetherthe association was mediated in part by specific nutrients asso-ciated with the pattern, we adjusted in a further analysis for transfatty acids, magnesium, caffeine, cereal fiber, glycemic index,alcohol, and the ratio of polyunsaturated to saturated fat. Theassociation between the pattern and diabetes risk was attenuatedbut remained significant (RR: 1.99; 95% CI: 1.60, 2.49). Theassociation appeared to be consistent across strata of BMI (�24versus �24), history of diabetes in a first-degree relative, andphysical activity (Table 4). In addition, the association remainedsignificant after additional adjustment for the waist-to-hip ratioin an analysis among those 21 394 women (733 cases) whoreported waist and hip circumferences in 1986 (RR for extremequintiles: 2.22; 95% CI: 1.68, 2.94).
During 701 155 person-years of follow-up, we documented724 new cases of type 2 diabetes in the NHS-II. A higher patternscore was strongly associated with an increased risk of type 2diabetes (age-adjusted RR: 6.89; Table 4). This association wassubstantially attenuated after adjustment for BMI, but it re-mained strong (RR: 3.05; 95% CI: 2.29, 4.06; P � 0.001). Ad-ditional adjustment for other lifestyle covariates had little effecton the observed association; the multivariate RRs for quintiles ofthe pattern score were 1.00, 1.92, 1.64, 2.10, and 2.93 (95% CI:2.18, 3.92; P � 0.001). Adjustment for trans fatty acids, mag-nesium, caffeine, cereal fiber, glycemic index, alcohol, and theratio of polyunsaturated to saturated fat attenuated the associa-tion (RR: 2.15; CI: 1.55, 2.97). The association between thepattern and diabetes risk was relatively consistent across strata ofphysical activity and history of diabetes in a first-degree relative(Table 4). However, the association appeared to be strongeramong women in the NHS-II with high BMI (�27; RR forextreme quintiles: 3.15) than among women with low BMI (RR:1.93; P for interaction: 0.02). We additionally adjusted for thewaist-to-hip ratio in a separate analysis among 42 967 women(273 cases) who reported their waist and hip circumferences in1993, but the pattern remained significantly associated with anincreased diabetes risk (RR for extreme quintiles: 2.37; 95% CI:1.48, 3.79).
DISCUSSION
Using a novel statistical method, we derived a diet patternscore that was strongly associated with markers of inflammationand endothelial dysfunction. This pattern strongly predicted riskof type 2 diabetes in a nested case-control analysis, independent
FIGURE 1. Geometric mean concentrations and 95% CIs of interleukin6 (IL-6), soluble tumor necrosis factor � receptor 2 (sTNFR2), C-reactiveprotein (CRP), E-selectin, soluble intracellular cell adhesion molecule 1(sICAM-1), and soluble vascular cell adhesion molecule 1 (sVCAM-1) byquintiles of diet pattern score adjusted for age, BMI (9 categories), physicalactivity (quintiles), family history of diabetes, smoking (never, past, current,or missing), postmenopausal hormone use (never, ever, or missing), energyintake (quintiles), and fasting status. The comparison between quintile 5 andquintile 1 was significant for all biomarkers, P � 0.05. Quintile cutoffs werebased on distributions in controls.
TABLE 2Risk of type 2 diabetes by quintile of diet pattern score: unconditional logistic regression, 656 cases and 694 controls, Nurses’ Health Study1
Quintile of diet pattern score2
P for trend1 2 3 4 5
No. of cases 54 80 117 164 241Age-adjusted OR 1.00 1.49 (0.98, 2.26) 2.18 (1.46, 3.26) 3.10 (2.10, 4.57) 4.70 (3.20, 6.90) �0.001Age and BMI-adjusted OR 1.00 1.23 (0.77, 1.95) 1.80 (1.16, 2.80) 2.20 (1.43, 3.37) 3.09 (2.03, 4.69) �0.001Multivariate-adjusted OR3 1.00 1.28 (0.79, 2.07) 1.89 (1.19, 2.98) 2.25 (1.45, 3.51) 3.09 (1.99, 4.79) �0.001
1 OR, odds ratio.2 95% CI in parentheses. A high diet pattern score reflects a diet high in sugar-sweetened soft drinks, refined grains, diet soft drinks, processed meat, and
other vegetables and low in wine, coffee, cruciferous vegetables, and yellow vegetables. Quintiles are based on the control population.3 Adjusted for age, BMI (9 categories), physical activity (quintiles), family history of diabetes, smoking (never, past, current, or missing), postmenopausal
hormone use (never, ever, or missing), and energy intake (quintiles).
DIETARY PATTERN, INFLAMMATION, AND DIABETES 679
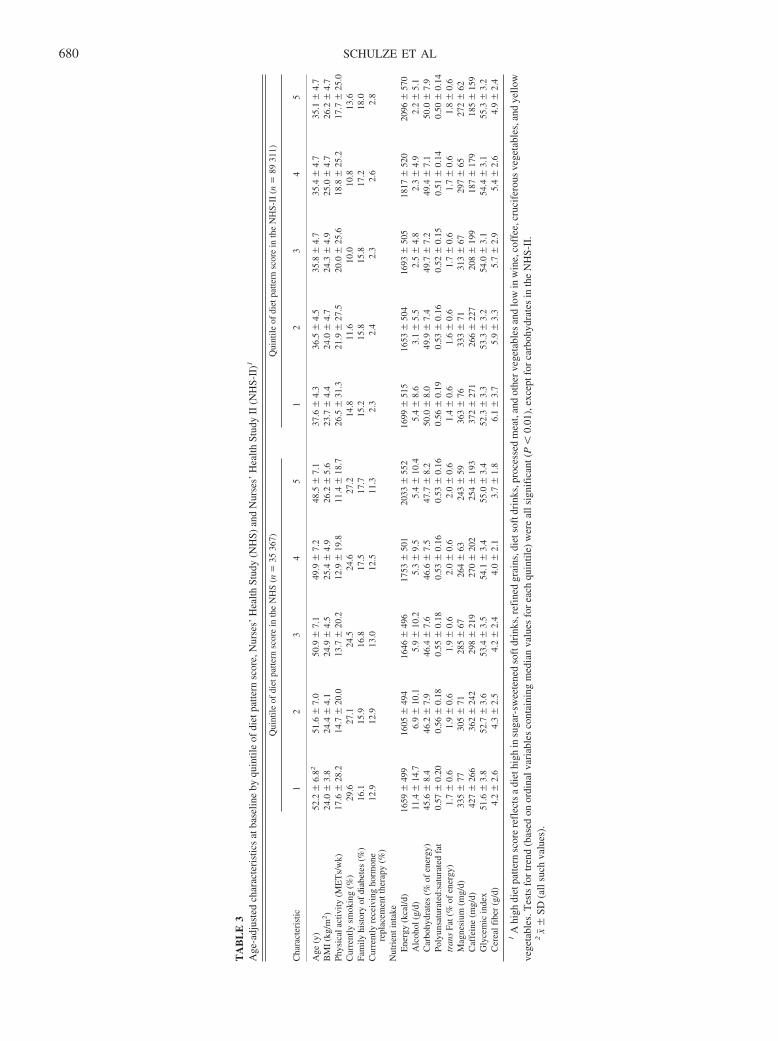
TA
BL
E3
Age
-adj
uste
dch
arac
teri
stic
sat
base
line
byqu
intil
eof
diet
patte
rnsc
ore,
Nur
ses’
Hea
lthSt
udy
(NH
S)an
dN
urse
s’H
ealth
Stud
yII
(NH
S-II
)1
Cha
ract
eris
tic
Qui
ntile
ofdi
etpa
ttern
scor
ein
the
NH
S(n
�35
367)
Qui
ntile
ofdi
etpa
ttern
scor
ein
the
NH
S-II
(n�
8931
1)
12
34
51
23
45
Age
(y)
52.2
�6.
8251
.6�
7.0
50.9
�7.
149
.9�
7.2
48.5
�7.
137
.6�
4.3
36.5
�4.
535
.8�
4.7
35.4
�4.
735
.1�
4.7
BM
I(k
g/m
2)
24.0
�3.
824
.4�
4.1
24.9
�4.
525
.4�
4.9
26.2
�5.
623
.7�
4.4
24.0
�4.
724
.3�
4.9
25.0
�4.
726
.2�
4.7
Phys
ical
activ
ity(M
ET
s/w
k)17
.6�
28.2
14.7
�20
.013
.7�
20.2
12.9
�19
.811
.4�
18.7
26.5
�31
.321
.9�
27.5
20.0
�25
.618
.8�
25.2
17.7
�25
.0C
urre
ntly
smok
ing
(%)
29.6
27.1
24.5
24.6
27.2
14.8
11.6
10.0
10.8
13.6
Fam
ilyhi
stor
yof
diab
etes
(%)
16.1
15.9
16.8
17.5
17.7
15.2
15.8
15.8
17.2
18.0
Cur
rent
lyre
ceiv
ing
horm
one
repl
acem
entt
hera
py(%
)12
.912
.913
.012
.511
.32.
32.
42.
32.
62.
8
Nut
rien
tint
ake
Ene
rgy
(kca
l/d)
1659
�49
916
05�
494
1646
�49
617
53�
501
2033
�55
216
99�
515
1653
�50
416
93�
505
1817
�52
020
96�
570
Alc
ohol
(g/d
)11
.4�
14.7
6.9
�10
.15.
9�
10.2
5.3
�9.
55.
4�
10.4
5.4
�8.
63.
1�
5.5
2.5
�4.
82.
3�
4.9
2.2
�5.
1C
arbo
hydr
ates
(%of
ener
gy)
45.6
�8.
446
.2�
7.9
46.4
�7.
646
.6�
7.5
47.7
�8.
250
.0�
8.0
49.9
�7.
449
.7�
7.2
49.4
�7.
150
.0�
7.9
Poly
unsa
tura
ted:
satu
rate
dfa
t0.
57�
0.20
0.56
�0.
180.
55�
0.18
0.53
�0.
160.
53�
0.16
0.56
�0.
190.
53�
0.16
0.52
�0.
150.
51�
0.14
0.50
�0.
14tr
ans
Fat(
%of
ener
gy)
1.7
�0.
61.
9�
0.6
1.9
�0.
62.
0�
0.6
2.0
�0.
61.
4�
0.6
1.6
�0.
61.
7�
0.6
1.7
�0.
61.
8�
0.6
Mag
nesi
um(m
g/d)
335
�77
305
�71
285
�67
264
�63
243
�59
363
�76
333
�71
313
�67
297
�65
272
�62
Caf
fein
e(m
g/d)
427
�26
636
2�
242
298
�21
927
0�
202
254
�19
337
2�
271
266
�22
720
8�
199
187
�17
918
5�
159
Gly
cem
icin
dex
51.6
�3.
852
.7�
3.6
53.4
�3.
554
.1�
3.4
55.0
�3.
452
.3�
3.3
53.3
�3.
254
.0�
3.1
54.4
�3.
155
.3�
3.2
Cer
ealf
iber
(g/d
)4.
2�
2.6
4.3
�2.
54.
2�
2.4
4.0
�2.
13.
7�
1.8
6.1
�3.
75.
9�
3.3
5.7
�2.
95.
4�
2.6
4.9
�2.
4
1A
high
diet
patte
rnsc
ore
refl
ects
adi
ethi
ghin
suga
r-sw
eete
ned
soft
drin
ks,r
efin
edgr
ains
,die
tsof
tdri
nks,
proc
esse
dm
eat,
and
othe
rveg
etab
les
and
low
inw
ine,
coff
ee,c
ruci
fero
usve
geta
bles
,and
yello
wve
geta
bles
.Tes
tsfo
rtr
end
(bas
edon
ordi
nalv
aria
bles
cont
aini
ngm
edia
nva
lues
for
each
quin
tile)
wer
eal
lsig
nifi
cant
(P�
0.01
),ex
cept
for
carb
ohyd
rate
sin
the
NH
S-II
.2
x��
SD(a
llsu
chva
lues
).
680 SCHULZE ET AL
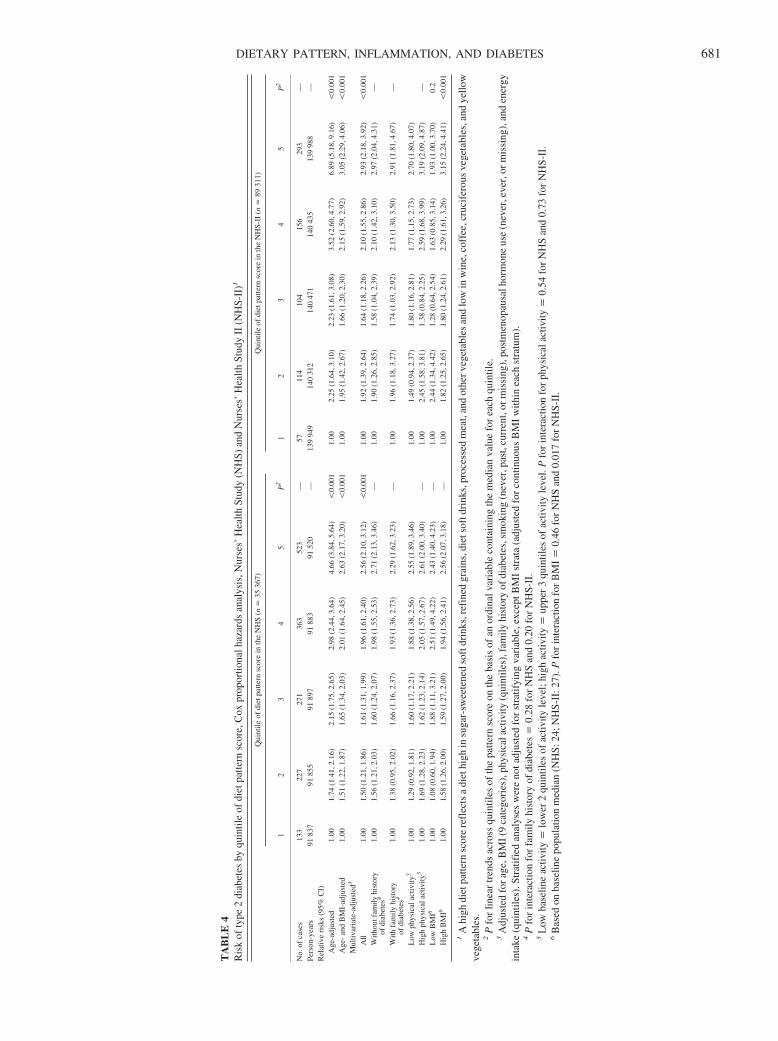
TA
BL
E4
Ris
kof
type
2di
abet
esby
quin
tile
ofdi
etpa
ttern
scor
e,C
oxpr
opor
tiona
lhaz
ards
anal
ysis
,Nur
ses’
Hea
lthSt
udy
(NH
S)an
dN
urse
s’H
ealth
Stud
yII
(NH
S-II
)1
Qui
ntile
ofdi
etpa
ttern
scor
ein
the
NH
S(n
�35
367)
Qui
ntile
ofdi
etpa
ttern
scor
ein
the
NH
S-II
(n�
8931
1)
12
34
5P
21
23
45
P2
No.
ofca
ses
133
227
271
363
523
—57
114
104
156
293
—Pe
rson
-yea
rs91
837
9185
591
897
9188
391
520
—13
994
914
031
214
047
114
043
513
998
8—
Rel
ativ
eri
sks
(95%
CI)
Age
-adj
uste
d1.
001.
74(1
.41,
2.16
)2.
15(1
.75,
2.65
)2.
98(2
.44,
3.64
)4.
66(3
.84,
5.64
)�
0.00
11.
002.
25(1
.64,
3.10
)2.
23(1
.61,
3.08
)3.
52(2
.60,
4.77
)6.
89(5
.18,
9.16
)�
0.00
1A
ge-
and
BM
I-ad
just
ed1.
001.
51(1
.22,
1.87
)1.
65(1
.34,
2.03
)2.
01(1
.64,
2.45
)2.
63(2
.17,
3.20
)�
0.00
11.
001.
95(1
.42,
2.67
)1.
66(1
.20,
2.30
)2.
15(1
.59,
2.92
)3.
05(2
.29,
4.06
)�
0.00
1M
ultiv
aria
te-a
djus
ted3
All
1.00
1.50
(1.2
1,1.
86)
1.61
(1.3
1,1.
99)
1.96
(1.6
1,2.
40)
2.56
(2.1
0,3.
12)
�0.
001
1.00
1.92
(1.3
9,2.
64)
1.64
(1.1
8,2.
26)
2.10
(1.5
5,2.
86)
2.93
(2.1
8,3.
92)
�0.
001
With
outf
amily
hist
ory
ofdi
abet
es4
1.00
1.56
(1.2
1,2.
03)
1.60
(1.2
4,2.
07)
1.98
(1.5
5,2.
53)
2.71
(2.1
3,3.
46)
—1.
001.
90(1
.26,
2.85
)1.
58(1
.04,
2.39
)2.
10(1
.42,
3.10
)2.
97(2
.04,
4.31
)—
With
fam
ilyhi
stor
yof
diab
etes
41.
001.
38(0
.95,
2.02
)1.
66(1
.16,
2.37
)1.
93(1
.36,
2.73
)2.
29(1
.62,
3.23
)—
1.00
1.96
(1.1
8,3.
27)
1.74
(1.0
3,2.
92)
2.13
(1.3
0,3.
50)
2.91
(1.8
1,4.
67)
—
Low
phys
ical
activ
ity5
1.00
1.29
(0.9
2,1.
81)
1.60
(1.1
7,2.
21)
1.88
(1.3
8,2.
56)
2.55
(1.8
9,3.
46)
1.00
1.49
(0.9
4,2.
37)
1.80
(1.1
6,2.
81)
1.77
(1.1
5,2.
73)
2.70
(1.8
0,4.
07)
Hig
hph
ysic
alac
tivity
51.
001.
69(1
.28,
2.23
)1.
62(1
.23,
2.14
)2.
05(1
.57,
2.67
)2.
61(2
.00,
3.40
)—
1.00
2.45
(1.5
8,3.
81)
1.38
(0.8
4,2.
25)
2.59
(1.6
8,3.
99)
3.19
(2.0
9,4.
87)
—L
owB
MI6
1.00
1.08
(0.6
0,1.
94)
1.88
(1.1
1,3.
21)
2.51
(1.4
9,4.
22)
2.43
(1.4
0,4.
23)
—1.
002.
44(1
.34,
4.42
)1.
28(0
.64,
2.54
)1.
63(0
.85,
3.14
)1.
93(1
.00,
3.70
)0.
2H
igh
BM
I61.
001.
58(1
.26,
2.00
)1.
59(1
.27,
2.00
)1.
94(1
.56,
2.41
)2.
56(2
.07,
3.18
)—
1.00
1.82
(1.2
5,2.
65)
1.80
(1.2
4,2.
61)
2.29
(1.6
1,3.
26)
3.15
(2.2
4,4.
41)
�0.
001
1A
high
diet
patte
rnsc
ore
refl
ects
adi
ethi
ghin
suga
r-sw
eete
ned
soft
drin
ks,r
efin
edgr
ains
,die
tsof
tdri
nks,
proc
esse
dm
eat,
and
othe
rveg
etab
les
and
low
inw
ine,
coff
ee,c
ruci
fero
usve
geta
bles
,and
yello
wve
geta
bles
.2
Pfo
rlin
ear
tren
dsac
ross
quin
tiles
ofth
epa
ttern
scor
eon
the
basi
sof
anor
dina
lvar
iabl
eco
ntai
ning
the
med
ian
valu
efo
rea
chqu
intil
e.3
Adj
uste
dfo
rage
,BM
I(9
cate
gori
es),
phys
ical
activ
ity(q
uint
iles)
,fam
ilyhi
stor
yof
diab
etes
,sm
okin
g(n
ever
,pas
t,cu
rren
t,or
mis
sing
),po
stm
enop
ausa
lhor
mon
eus
e(n
ever
,eve
r,or
mis
sing
),an
den
ergy
inta
ke(q
uint
iles)
.Str
atif
ied
anal
yses
wer
eno
tadj
uste
dfo
rst
ratif
ying
vari
able
,exc
eptB
MI
stra
ta(a
djus
ted
for
cont
inuo
usB
MI
with
inea
chst
ratu
m).
4P
for
inte
ract
ion
for
fam
ilyhi
stor
yof
diab
etes
�0.
28fo
rN
HS
and
0.20
for
NH
S-II
.5
Low
base
line
activ
ity�
low
er2
quin
tiles
ofac
tivity
leve
l;hi
ghac
tivity
�up
per
3qu
intil
esof
activ
ityle
vel.
Pfo
rin
tera
ctio
nfo
rph
ysic
alac
tivity
�0.
54fo
rN
HS
and
0.73
for
NH
S-II
.6
Bas
edon
base
line
popu
latio
nm
edia
n(N
HS:
24;N
HS-
II:2
7).P
for
inte
ract
ion
for
BM
I�
0.46
for
NH
San
d0.
017
for
NH
S-II
.
DIETARY PATTERN, INFLAMMATION, AND DIABETES 681
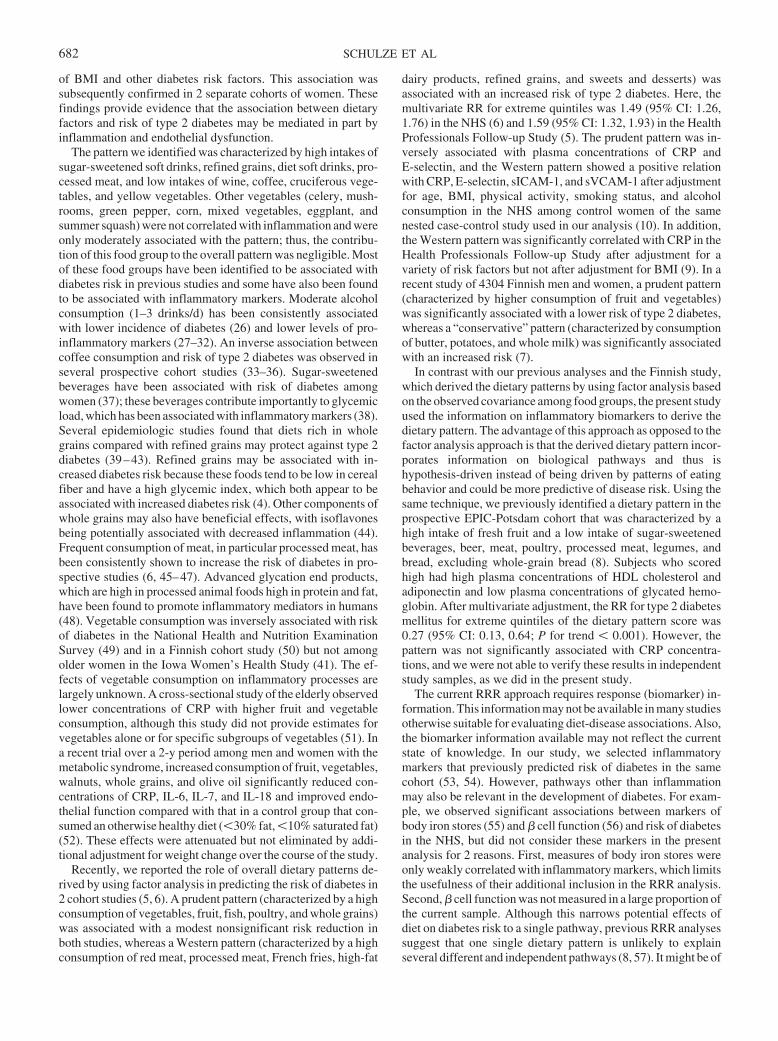
of BMI and other diabetes risk factors. This association wassubsequently confirmed in 2 separate cohorts of women. Thesefindings provide evidence that the association between dietaryfactors and risk of type 2 diabetes may be mediated in part byinflammation and endothelial dysfunction.
The pattern we identified was characterized by high intakes ofsugar-sweetened soft drinks, refined grains, diet soft drinks, pro-cessed meat, and low intakes of wine, coffee, cruciferous vege-tables, and yellow vegetables. Other vegetables (celery, mush-rooms, green pepper, corn, mixed vegetables, eggplant, andsummer squash) were not correlated with inflammation and wereonly moderately associated with the pattern; thus, the contribu-tion of this food group to the overall pattern was negligible. Mostof these food groups have been identified to be associated withdiabetes risk in previous studies and some have also been foundto be associated with inflammatory markers. Moderate alcoholconsumption (1–3 drinks/d) has been consistently associatedwith lower incidence of diabetes (26) and lower levels of pro-inflammatory markers (27–32). An inverse association betweencoffee consumption and risk of type 2 diabetes was observed inseveral prospective cohort studies (33–36). Sugar-sweetenedbeverages have been associated with risk of diabetes amongwomen (37); these beverages contribute importantly to glycemicload, which has been associated with inflammatory markers (38).Several epidemiologic studies found that diets rich in wholegrains compared with refined grains may protect against type 2diabetes (39–43). Refined grains may be associated with in-creased diabetes risk because these foods tend to be low in cerealfiber and have a high glycemic index, which both appear to beassociated with increased diabetes risk (4). Other components ofwhole grains may also have beneficial effects, with isoflavonesbeing potentially associated with decreased inflammation (44).Frequent consumption of meat, in particular processed meat, hasbeen consistently shown to increase the risk of diabetes in pro-spective studies (6, 45–47). Advanced glycation end products,which are high in processed animal foods high in protein and fat,have been found to promote inflammatory mediators in humans(48). Vegetable consumption was inversely associated with riskof diabetes in the National Health and Nutrition ExaminationSurvey (49) and in a Finnish cohort study (50) but not amongolder women in the Iowa Women’s Health Study (41). The ef-fects of vegetable consumption on inflammatory processes arelargely unknown. A cross-sectional study of the elderly observedlower concentrations of CRP with higher fruit and vegetableconsumption, although this study did not provide estimates forvegetables alone or for specific subgroups of vegetables (51). Ina recent trial over a 2-y period among men and women with themetabolic syndrome, increased consumption of fruit, vegetables,walnuts, whole grains, and olive oil significantly reduced con-centrations of CRP, IL-6, IL-7, and IL-18 and improved endo-thelial function compared with that in a control group that con-sumed an otherwise healthy diet (�30% fat, �10% saturated fat)(52). These effects were attenuated but not eliminated by addi-tional adjustment for weight change over the course of the study.
Recently, we reported the role of overall dietary patterns de-rived by using factor analysis in predicting the risk of diabetes in2 cohort studies (5, 6). A prudent pattern (characterized by a highconsumption of vegetables, fruit, fish, poultry, and whole grains)was associated with a modest nonsignificant risk reduction inboth studies, whereas a Western pattern (characterized by a highconsumption of red meat, processed meat, French fries, high-fat
dairy products, refined grains, and sweets and desserts) wasassociated with an increased risk of type 2 diabetes. Here, themultivariate RR for extreme quintiles was 1.49 (95% CI: 1.26,1.76) in the NHS (6) and 1.59 (95% CI: 1.32, 1.93) in the HealthProfessionals Follow-up Study (5). The prudent pattern was in-versely associated with plasma concentrations of CRP andE-selectin, and the Western pattern showed a positive relationwith CRP, E-selectin, sICAM-1, and sVCAM-1 after adjustmentfor age, BMI, physical activity, smoking status, and alcoholconsumption in the NHS among control women of the samenested case-control study used in our analysis (10). In addition,the Western pattern was significantly correlated with CRP in theHealth Professionals Follow-up Study after adjustment for avariety of risk factors but not after adjustment for BMI (9). In arecent study of 4304 Finnish men and women, a prudent pattern(characterized by higher consumption of fruit and vegetables)was significantly associated with a lower risk of type 2 diabetes,whereas a “conservative” pattern (characterized by consumptionof butter, potatoes, and whole milk) was significantly associatedwith an increased risk (7).
In contrast with our previous analyses and the Finnish study,which derived the dietary patterns by using factor analysis basedon the observed covariance among food groups, the present studyused the information on inflammatory biomarkers to derive thedietary pattern. The advantage of this approach as opposed to thefactor analysis approach is that the derived dietary pattern incor-porates information on biological pathways and thus ishypothesis-driven instead of being driven by patterns of eatingbehavior and could be more predictive of disease risk. Using thesame technique, we previously identified a dietary pattern in theprospective EPIC-Potsdam cohort that was characterized by ahigh intake of fresh fruit and a low intake of sugar-sweetenedbeverages, beer, meat, poultry, processed meat, legumes, andbread, excluding whole-grain bread (8). Subjects who scoredhigh had high plasma concentrations of HDL cholesterol andadiponectin and low plasma concentrations of glycated hemo-globin. After multivariate adjustment, the RR for type 2 diabetesmellitus for extreme quintiles of the dietary pattern score was0.27 (95% CI: 0.13, 0.64; P for trend � 0.001). However, thepattern was not significantly associated with CRP concentra-tions, and we were not able to verify these results in independentstudy samples, as we did in the present study.
The current RRR approach requires response (biomarker) in-formation. This information may not be available in many studiesotherwise suitable for evaluating diet-disease associations. Also,the biomarker information available may not reflect the currentstate of knowledge. In our study, we selected inflammatorymarkers that previously predicted risk of diabetes in the samecohort (53, 54). However, pathways other than inflammationmay also be relevant in the development of diabetes. For exam-ple, we observed significant associations between markers ofbody iron stores (55) and � cell function (56) and risk of diabetesin the NHS, but did not consider these markers in the presentanalysis for 2 reasons. First, measures of body iron stores wereonly weakly correlated with inflammatory markers, which limitsthe usefulness of their additional inclusion in the RRR analysis.Second, � cell function was not measured in a large proportion ofthe current sample. Although this narrows potential effects ofdiet on diabetes risk to a single pathway, previous RRR analysessuggest that one single dietary pattern is unlikely to explainseveral different and independent pathways (8, 57). It might be of
682 SCHULZE ET AL
interest to evaluate whether other biomarkers play a role in me-diating effects of the dietary pattern on inflammatory markers,for example, lipoproteins. Unfortunately, we did not have li-poprotein markers available for our nested case-control studypopulation.
Obesity induces a state of chronic low-grade inflammation(58), and excess body fat may therefore also explain associationsbetween those food groups identified to be components of thedietary pattern and inflammatory markers. For example, diet softdrinks were directly associated with BMI cross-sectionally in theNHS-II (37), although this association most likely represents areverse causation because the use of diet soft drinks instead ofregular soft drinks is the most frequently reported diet interven-tion to lose weight in US adults (59). Although diet soft drinkswere identified as a component of the RRR pattern, associationsbetween diet soft drinks and inflammatory markers may be con-founded by BMI. With use of the BMI-adjusted biomarker levelsas responses in RRR, the pattern remained similar with sugar-sweetened beverages and refined grains being positively associ-ated with the pattern and wine, coffee, and cruciferous vegetablesbeing negatively associated. However, diet soft drinks were nolonger an important component of the pattern. Adjustment forBMI also partly attenuated the age-adjusted associations be-tween the dietary pattern and risk of diabetes. However, it is alsopossible that weight gain is one potential pathway by which thedietary pattern is associated with inflammation and diabetes risk.Adjustment for BMI may therefore lead to an underestimation ofthe true effect of the diet. To determine whether BMI is a con-founder or mediator is not possible with our study design, be-cause associations between the dietary pattern, BMI, and inflam-matory markers were analyzed cross-sectionally. Nevertheless,component foods such as sugar-sweetened soft drinks, refinedgrains, wine, coffee, and vegetables appear to relate to inflam-matory markers independent of BMI, and the association be-tween the dietary pattern and diabetes risk remained strong afteradjustment for BMI and the waist-to-hip ratio. Our data alsosuggest that the diet pattern score may be more strongly associ-ated with diabetes risk among obese women than among leanwomen.
The repeated dietary measurements used in this study wereadvantageous because they dampened measurement errors andtook into account changes in eating behaviors over time (23).Compared with the traditional approach of examining the effectsof individual nutrients or foods, the dietary pattern approach hasthe advantage of representing the cumulative effects of overalldiet.
The NHS and NHS-II cohorts are study populations of USfemale nurses and therefore are not representative of the generalUS female population. Thus, our results should be replicated inother populations. Another potential limitation of our study is thereliance on self-reported confounder information. For example,smoking has been related to inflammation (60) and diabetes risk(4), and smoking cessation has effects on body weight (61).Because smoking and poor diet may also be part of an unhealthylifestyle, residual confounding due to measurement error in as-sessing smoking history or due to insufficient control in statisti-cal models might have biased our observations, but it is unlikelythat such a bias would explain the strong relation between thedietary pattern and diabetes risk. Similarly, a history of hyper-tension may influence dietary behavior and is associated withinflammation (62). Although adjustment for hypertension did
not alter our observations, residual confounding might still bepresent.
In conclusion, our data suggest that a diet high in sugar-sweetened soft drinks, refined grains, diet soft drinks, and pro-cessed meat and low in wine, coffee, cruciferous vegetables, andyellow vegetables may increase the risk of developing type 2 dia-betes, possibly by exacerbating inflammatory processes.
MBS contributed to the development of the analysis plan, conducted thestatistical analyses, collaborated on the interpretation of the results, and wrotethe manuscript. KH, JEM, WCW, CH, and FBH provided significant con-sultation on the statistical analysis plan, interpretation of results, and writingof the manuscript. CW, GAC, and JBM provided significant consultation onthe interpretation of results and writing of the manuscript. None of the authorshad any financial or personal interest in any company or organization spon-soring this research, including advisory board affiliations.
REFERENCES1. Pickup JC, Mattock MB, Chusney GD, Burt D. NIDDM as a disease of
the innate immune system: association of acute-phase reactants andinterleukin-6 with metabolic syndrome X. Diabetologia 1997;40:1286–92.
2. Pickup JC. Inflammation and activated innate immunity in the patho-genesis of type 2 diabetes. Diabetes Care 2004;27:813–23.
3. Brown AA, Hu FB. Dietary modulation of endothelial function: impli-cations for cardiovascular disease. Am J Clin Nutr 2001;73:673–86.
4. Schulze MB, Hu FB. Primary prevention of diabetes: what can be doneand how much can be prevented? Annu Rev Public Health 2005;26:445–67.
5. van Dam RM, Rimm EB, Willett WC, Stampfer MJ, Hu FB. Dietarypatterns and risk for type 2 diabetes mellitus in U.S. men. Ann Intern Med2002;136:201–9.
6. Fung TT, Schulze M, Manson JE, Willett WC, Hu FB. Dietary patterns,meat intake, and the risk of type 2 diabetes in women. Arch Intern Med2004;164:2235–40.
7. Montonen J, Knekt P, Harkanen T, et al. Dietary patterns and the inci-dence of type 2 diabetes. Am J Epidemiol 2005;161:219–27.
8. Heidemann C, Hoffmann K, Spranger J, et al. A dietary pattern protec-tive for type 2 diabetes mellitus in the European Prospective Investiga-tion into Cancer and Nutrition (EPIC)-Potsdam Study cohort. Diabeto-logia 2005;48:1126–34.
9. Fung TT, Rimm EB, Spiegelman D, et al. Association between dietarypatterns and plasma biomarkers of obesity and cardiovascular diseaserisk. Am J Clin Nutr 2001;73:61–7.
10. Lopez-Garcia E, Schulze MB, Fung TT, et al. Major dietary patterns arerelated to plasma concentrations of markers of inflammation and endo-thelial dysfunction. Am J Clin Nutr 2004;80:1029–35.
11. Colditz GA, Hankinson SE. The Nurses’ Health Study: lifestyle andhealth among women. Nat Rev Cancer 2005;5:388–96.
12. Hu FB, Rimm E, Smith-Warner SA, et al. Reproducibility and validityof dietary patterns assessed with a food-frequency questionnaire. Am JClin Nutr 1999;69:243–9.
13. US Department of Agriculture. Composition of foods: raw, processed,prepared, 1963-1991. Washington, DC: US Government Printing Of-fice, 1992.
14. Willett W, Stampfer MJ. Total energy intake: implications for epidemi-ologic analyses. Am J Epidemiol 1986;124:17–27.
15. Salvini S, Hunter DJ, Sampson L, et al. Food-based validation of adietary questionnaire: the effects of week-to-week variation in foodconsumption. Int J Epidemiol 1989;18:858–67.
16. Willett WC, Lenart E. Reproducibility and validity of food-frequencyquestionnaires. In: Willett WC, ed. Nutritional epidemiology. NewYork: Oxford University Press, 1998:101–56.
17. National Diabetes Data Group. Classification and diagnosis of diabetesmellitus and other categories of glucose intolerance. Diabetes 1979;28:1039–57.
18. Report of the Expert Committee on the Diagnosis and Classification ofDiabetes Mellitus. Diabetes Care 1997;20:1183–97.
19. Manson JE, Rimm EB, Stampfer MJ, et al. Physical activity and inci-dence of non-insulin-dependent diabetes mellitus in women. Lancet1991;338:774–8.
DIETARY PATTERN, INFLAMMATION, AND DIABETES 683
20. Hu FB, Leitzmann MF, Stampfer MJ, Colditz GA, Willett WC, RimmEB. Physical activity and television watching in relation to risk for type2 diabetes mellitus in men. Arch Intern Med 2001;161:1542–8.
21. Willett W, Stampfer MJ, Bain C, et al. Cigarette smoking, relativeweight, and menopause. Am J Epidemiol 1983;117:651–8.
22. Wolf AM, Hunter DJ, Colditz GA, et al. Reproducibility and validity ofa self-administered physical activity questionnaire. Int J Epidemiol1994;23:991–9.
23. Hu FB, Stampfer MJ, Rimm E, et al. Dietary fat and coronary heartdisease: a comparison of approaches for adjusting for total energy intakeand modeling repeated dietary measurements. Am J Epidemiol 1999;149:531–40.
24. Hoffmann K, Schulze MB, Schienkiewitz A, Nothlings U, Boeing H.Application of a new statistical method to derive dietary patterns innutritional epidemiology. Am J Epidemiol 2004;159:935–44.
25. Schulze MB, Hoffmann K, Kroke A, Boeing H. An approach to constructsimplified measures of dietary patterns from exploratory factor analysis.Br J Nutr 2003;89:409–19.
26. Howard AA, Arnsten JH, Gourevitch MN. Effect of alcohol consump-tion on diabetes mellitus: a systematic review. Ann Intern Med 2004;140:211–9.
27. Volpato S, Pahor M, Ferrucci L, et al. Relationship of alcohol intake withinflammatory markers and plasminogen activator inhibitor-1 in well-functioning older adults: the Health, Aging, and Body Compositionstudy. Circulation 2004;109:607–12.
28. Mukamal KJ, Cushman M, Mittleman MA, Tracy RP, Siscovick DS.Alcohol consumption and inflammatory markers in older adults: theCardiovascular Health Study. Atherosclerosis 2004;173:79–87.
29. Imhof A, Froehlich M, Brenner H, Boeing H, Pepys MB, Koenig W.Effect of alcohol consumption on systemic markers of inflammation.Lancet 2001;357:763–7.
30. Imhof A, Woodward M, Doering A, et al. Overall alcohol intake, beer,wine, and systemic markers of inflammation in western Europe: resultsfrom three MONICA samples (Augsburg, Glasgow, Lille). Eur Heart J2004;25:2092–100.
31. Shai I, Rimm EB, Schulze MB, Rifai N, Stampfer MJ, Hu FB. Moderatealcohol intake and markers of inflammation and endothelial dysfunctionamong diabetic men. Diabetologia 2004;47:1760–7.
32. Estruch R, Sacanella E, Badia E, et al. Different effects of red wine andgin consumption on inflammatory biomarkers of atherosclerosis: a pro-spective randomized crossover trial. Effects of wine on inflammatorymarkers. Atherosclerosis 2004;175:117–23.
33. Rosengren A, Dotevall A, Wilhelmsen L, Thelle D, Johansson S. Coffeeand incidence of diabetes in Swedish women: a prospective 18-yearfollow-up study. J Intern Med 2004;255:89–95.
34. Salazar-Martinez E, Willett WC, Ascherio A, et al. Coffee consumptionand risk for type 2 diabetes mellitus. Ann Intern Med 2004;140:1–8.
35. Tuomilehto J, Hu G, Bidel S, Lindstrom J, Jousilahti P. Coffee con-sumption and risk of type 2 diabetes mellitus among middle-aged Finn-ish men and women. JAMA 2004;291:1213–9.
36. van Dam RM, Feskens EJ. Coffee consumption and risk of type 2 dia-betes mellitus. Lancet 2002;360:1477–8.
37. Schulze MB, Manson JE, Ludwig DS, et al. Sugar-sweetened beverages,weight gain, and incidence of type 2 diabetes in young and middle-agedwomen. JAMA 2004;292:927–34.
38. Liu S, Manson JE, Buring JE, Stampfer MJ, Willett WC, Ridker PM.Relation between a diet with a high glycemic load and plasma concen-trations of high-sensitivity C-reactive protein in middle-aged women.Am J Clin Nutr 2002;75:492–8.
39. Fung TT, Hu FB, Pereira MA, et al. Whole-grain intake and the risk oftype 2 diabetes: a prospective study in men. Am J Clin Nutr 2002;76:535–40.
40. Liu S, Manson JE, Stampfer MJ, et al. A prospective study of whole-grain intake and risk of type 2 diabetes mellitus in US women. Am JPublic Health 2000;90:1409–15.
41. Meyer KA, Kushi LH, Jacobs DR Jr, Slavin J, Sellers TA, Folsom AR.Carbohydrates, dietary fiber, and incident type 2 diabetes in olderwomen. Am J Clin Nutr 2000;71:921–30.
42. Montonen J, Knekt P, Jarvinen R, Aromaa A, Reunanen A. Whole-grainand fiber intake and the incidence of type 2 diabetes. Am J Clin Nutr2003;77:622–9.
43. McKeown NM, Meigs JB, Liu S, Wilson PW, Jacques PF. Whole-grainintake is favorably associated with metabolic risk factors for type 2diabetes and cardiovascular disease in the Framingham Offspring Study.Am J Clin Nutr 2002;76:390–8.
44. Anderson JW. Whole grains protect against atherosclerotic cardiovas-cular disease. Proc Nutr Soc 2003;62:135–42.
45. Schulze MB, Manson JE, Willett WC, Hu FB. Processed meat intake andincidence of Type 2 diabetes in younger and middle-aged women. Dia-betologia 2003;46:1465–73.
46. van Dam RM, Willett WC, Rimm EB, Stampfer MJ, Hu FB. Dietary fatand meat intake in relation to risk of type 2 diabetes in men. DiabetesCare 2002;25:417–24.
47. Song Y, Manson JE, Buring JE, Liu S. A prospective study of red meatconsumption and type 2 diabetes in middle-aged and elderly women: TheWomen’s Health Study. Diabetes Care 2004;27:2108–15.
48. Vlassara H, Cai W, Crandall J, et al. Inflammatory mediators are inducedby dietary glycotoxins, a major risk factor for diabetic angiopathy. ProcNatl Acad Sci U S A 2002;99:15596–601.
49. Ford ES, Mokdad AH. Fruit and vegetable consumption and diabetesmellitus incidence among U.S. adults. Prev Med 2001;32:33–9.
50. Montonen J, Jarvinen R, Heliovaara M, Reunanen A, Aromaa A, KnektP. Food consumption and the incidence of type II diabetes mellitus. EurJ Clin Nutr 2005;59:441–8.
51. Gao X, Bermudez OI, Tucker KL. Plasma C-reactive protein and ho-mocysteine concentrations are related to frequent fruit and vegetableintake in Hispanic and non-Hispanic white elders. J Nutr 2004;134:913–8.
52. Esposito K, Marfella R, Ciotola M, et al. Effect of a Mediterranean-stylediet on endothelial dysfunction and markers of vascular inflammation inthe metabolic syndrome: a randomized trial. JAMA 2004;292:1440–6.
53. Meigs JB, Hu FB, Rifai N, Manson JE. Biomarkers of endothelial dys-function and risk of type 2 diabetes mellitus. JAMA 2004;291:1978–86.
54. Hu FB, Meigs JB, Li TY, Rifai N, Manson JE. Inflammatory markers andrisk of developing type 2 diabetes in women. Diabetes 2004;53:693–700.
55. Jiang R, Manson JE, Meigs JB, Ma J, Rifai N, Hu FB. Body iron storesin relation to risk of type 2 diabetes in apparently healthy women. JAMA2004;291:711–7.
56. Schulze MB, Solomon CG, Rifai N, et al. Hyperproinsulinemia and riskof type 2 diabetes in women. Diabet Med 2005; Mar 2 [Epub ahead ofprint; DOI: 10.1111/j.1464-5491.2005.01585.x].
57. Hoffmann K, Zyriax BC, Boeing H, Windler E. A dietary pattern derivedto explain biomarker variation is strongly associated with the risk ofcoronary artery disease. Am J Clin Nutr 2004;80:633–40.
58. Trayhurn P, Wood IS. Adipokines: inflammation and the pleiotropic roleof white adipose tissue. Br J Nutr 2004;92:347–55.
59. Levy AS, Heaton AW. Weight control practices of U.S. adults trying tolose weight. Ann Intern Med 1993;119:661–6.
60. Wannamethee SG, Lowe GD, Shaper AG, Rumley A, Lennon L, Whin-cup PH. Associations between cigarette smoking, pipe/cigar smoking,and smoking cessation, and haemostatic and inflammatory markers forcardiovascular disease. Eur Heart J 2005;Apr 7 [Epub ahead of print;DOI:10.1093/eurheartj/ehi183].
61. Filozof C, Fernandez Pinilla MC, Fernandez-Cruz A. Smoking cessationand weight gain. Obes Rev 2004;5:95–103.
62. Virdis A, Schiffrin EL. Vascular inflammation: a role in vascular diseasein hypertension? Curr Opin Nephrol Hypertens 2003;12:181–7.
684 SCHULZE ET AL
Diabetes mellitus and serum carotenoids: findings of apopulation-based study in Queensland, Australia1–3
Terry Coyne, Torukiri I Ibiebele, Peter D Baade, Annette Dobson, Christine McClintock, Sophie Dunn,Dympna Leonard, and Jonathan Shaw
ABSTRACTBackground: Epidemiologic evidence suggests that serum carote-noids are potent antioxidants and may play a protective role in thedevelopment of chronic diseases including cancers, cardiovasculardisease, and inflammatory diseases. The role of these antioxidants inthe pathogenesis of diabetes mellitus remains unclear.Objective: This study examined data from a cross-sectional surveyto investigate the association between serum carotenoids and type 2diabetes.Design: Study participants were adults aged �25 y (n � 1597) from6 randomly selected cities and towns in Queensland, Australia.Study examinations conducted between October and December2000 included fasting plasma glucose, an oral-glucose-tolerancetest, and measurement of the serum concentrations of 5 carotenoidcompounds.Results: Mean 2-h postload plasma glucose and fasting insulinconcentrations decreased significantly with increasing quintiles ofthe 5 serum carotenoids—�-carotene, �-carotene, �-cryptoxanthin,lutein/zeaxanthin, and lycopene. Geometric mean concentrations forall serum carotenoids decreased (all decreases were significant ex-cept that of lycopene) with declining glucose tolerance status.�-Carotene had the greatest decrease, to geometric means of 0.59,0.50, and 0.42 �mol/L in persons with normal glucose tolerance,impaired glucose metabolism, and type 2 diabetes, respectively (P �0.01 for linear trend), after control for potential confounders.Conclusions: Serum carotenoids are inversely associated with type2 diabetes and impaired glucose metabolism. Randomized trials ofdiets high in carotenoid-rich vegetables and fruit are needed to con-firm these results and those from other observational studies. Suchevidence would have very important implications for the preventionof diabetes. Am J Clin Nutr 2005;82:685–93.
KEY WORDS Type 2 diabetes, diabetes mellitus, impairedglucose tolerance, serum carotenoids, �-carotene, �-carotene,�-cryptoxanthin, lutein/zeaxanthin, lycopene, antioxidant vitamins,diet, cross-sectional surveys, health surveys, nutrition
INTRODUCTION
Carotenoids are a wide range of compounds derived solelyfrom plants; the major ones found in serum are �-carotene,�-carotene, �-cryptoxanthin, lutein/zeaxanthin, and lycopene.Considerable epidemiologic evidence exists that some carote-noids are potent antioxidants and may play a protective role
against the development of chronic diseases such as atheroscle-rosis (1, 2), stroke (3), certain cancers (4), and inflammatorydiseases (5). Although obesity and physical inactivity are knownto be major risk factors for type 2 diabetes, evidence suggests thatoxidative stress also may contribute to the pathophysiology oftype 2 diabetes (6). Multiple factors have been associated withincreased oxidative stress in diabetes mellitus. These factorsinclude glucose autoxidation that results in the production of freeradicals, an increase in protein glycation (glucooxidation), and adecrease in antioxidant defenses. Enhanced oxidative stress isconsidered an underlying condition that is responsible for someof the complications of diabetes (7).
Serum or dietary vitamin A, E, and C concentrations have beenhypothesized to be lower in persons with impaired glucose tol-erance (IGT) or with type 2 diabetes than in those who havenormal glucose tolerance (8, 9); nevertheless, there is conflictingevidence concerning these relations (10, 11). Several cross-sectional epidemiologic studies have reported an inverse relationbetween serum carotenoids and diabetes status (12–15), and yetintervention studies providing supplements of antioxidantvitamins have shown conflicting results (7, 16). In this study,we investigated the relations between the major serumcarotenoids—�-carotene, �-carotene, �-cryptoxanthin, lutein/zeaxanthin, and lycopene—and type 2 diabetes status in a cross-sectional population-based study in Queensland, Australia.
1 From the School of Population Health, University of Queensland, Bris-bane, Australia (TC and AD); the Epidemiology Services Unit, Health In-formation Branch, Queensland Health, Brisbane, Australia (TC, TII, andCM); the Viertel Center for Research in Cancer Control, Queensland CancerFund, Brisbane, Australia (PDB); Oxfam, Oxford (SD) Tropical PublicHealth Unit, Queensland Health, Cairns, Australia (DL); and the Interna-tional Diabetes Institute, Melbourne, Australia (JS).
2 Supported by the Australian Department of Health and Ageing, state andterritory governments, and pharmaceutical companies: Eli Lilly (Aust) PtyLtd, Janssen - Cilag (Aust) Pty Ltd, Knoll Australia Pty Ltd, Merck Lipha s.a.Alphapharm Pty Ltd, Merck Sharp & Dohme (Aust), Pharmacia and UpjohnPty Ltd, Roche Diagnostics, Servier Laboratories (Aust) Pty Ltd, SmithKlineBeecham International, BioRad Laboratories Pty Ltd and HITECH Pathol-ogy Pty Ltd; Qantas Airways Ltd and the Australian Kidney Foundation. TheQueensland phase of the study was partially funded by Queensland Health.
3 Reprints not available. Address correspondence to T Coyne, School ofPopulation Health, The University of Queensland, Public Health Building,Herston 4029, Queensland, Australia. E-mail: [email protected].
Received December 8, 2004.Accepted for publication June 3, 2005.
685Am J Clin Nutr 2005;82:685–93. Printed in USA. © 2005 American Society for Clinical Nutrition
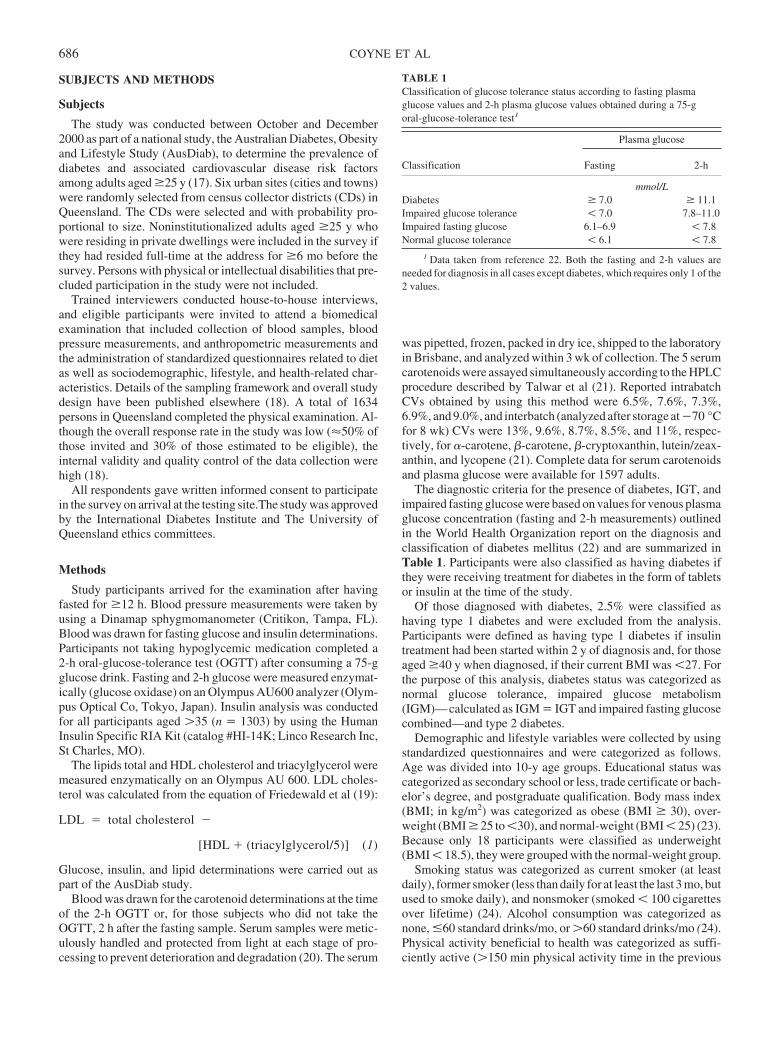
SUBJECTS AND METHODS
Subjects
The study was conducted between October and December2000 as part of a national study, the Australian Diabetes, Obesityand Lifestyle Study (AusDiab), to determine the prevalence ofdiabetes and associated cardiovascular disease risk factorsamong adults aged �25 y (17). Six urban sites (cities and towns)were randomly selected from census collector districts (CDs) inQueensland. The CDs were selected and with probability pro-portional to size. Noninstitutionalized adults aged �25 y whowere residing in private dwellings were included in the survey ifthey had resided full-time at the address for �6 mo before thesurvey. Persons with physical or intellectual disabilities that pre-cluded participation in the study were not included.
Trained interviewers conducted house-to-house interviews,and eligible participants were invited to attend a biomedicalexamination that included collection of blood samples, bloodpressure measurements, and anthropometric measurements andthe administration of standardized questionnaires related to dietas well as sociodemographic, lifestyle, and health-related char-acteristics. Details of the sampling framework and overall studydesign have been published elsewhere (18). A total of 1634persons in Queensland completed the physical examination. Al-though the overall response rate in the study was low (�50% ofthose invited and 30% of those estimated to be eligible), theinternal validity and quality control of the data collection werehigh (18).
All respondents gave written informed consent to participatein the survey on arrival at the testing site.The study was approvedby the International Diabetes Institute and The University ofQueensland ethics committees.
Methods
Study participants arrived for the examination after havingfasted for �12 h. Blood pressure measurements were taken byusing a Dinamap sphygmomanometer (Critikon, Tampa, FL).Blood was drawn for fasting glucose and insulin determinations.Participants not taking hypoglycemic medication completed a2-h oral-glucose-tolerance test (OGTT) after consuming a 75-gglucose drink. Fasting and 2-h glucose were measured enzymat-ically (glucose oxidase) on an Olympus AU600 analyzer (Olym-pus Optical Co, Tokyo, Japan). Insulin analysis was conductedfor all participants aged �35 (n � 1303) by using the HumanInsulin Specific RIA Kit (catalog #HI-14K; Linco Research Inc,St Charles, MO).
The lipids total and HDL cholesterol and triacylglycerol weremeasured enzymatically on an Olympus AU 600. LDL choles-terol was calculated from the equation of Friedewald et al (19):
LDL � total cholesterol �
[HDL � (triacylglycerol/5)] (1)
Glucose, insulin, and lipid determinations were carried out aspart of the AusDiab study.
Blood was drawn for the carotenoid determinations at the timeof the 2-h OGTT or, for those subjects who did not take theOGTT, 2 h after the fasting sample. Serum samples were metic-ulously handled and protected from light at each stage of pro-cessing to prevent deterioration and degradation (20). The serum
was pipetted, frozen, packed in dry ice, shipped to the laboratoryin Brisbane, and analyzed within 3 wk of collection. The 5 serumcarotenoids were assayed simultaneously according to the HPLCprocedure described by Talwar et al (21). Reported intrabatchCVs obtained by using this method were 6.5%, 7.6%, 7.3%,6.9%, and 9.0%, and interbatch (analyzed after storage at �70 °Cfor 8 wk) CVs were 13%, 9.6%, 8.7%, 8.5%, and 11%, respec-tively, for �-carotene, �-carotene, �-cryptoxanthin, lutein/zeax-anthin, and lycopene (21). Complete data for serum carotenoidsand plasma glucose were available for 1597 adults.
The diagnostic criteria for the presence of diabetes, IGT, andimpaired fasting glucose were based on values for venous plasmaglucose concentration (fasting and 2-h measurements) outlinedin the World Health Organization report on the diagnosis andclassification of diabetes mellitus (22) and are summarized inTable 1. Participants were also classified as having diabetes ifthey were receiving treatment for diabetes in the form of tabletsor insulin at the time of the study.
Of those diagnosed with diabetes, 2.5% were classified ashaving type 1 diabetes and were excluded from the analysis.Participants were defined as having type 1 diabetes if insulintreatment had been started within 2 y of diagnosis and, for thoseaged �40 y when diagnosed, if their current BMI was �27. Forthe purpose of this analysis, diabetes status was categorized asnormal glucose tolerance, impaired glucose metabolism(IGM)—calculated as IGM � IGT and impaired fasting glucosecombined—and type 2 diabetes.
Demographic and lifestyle variables were collected by usingstandardized questionnaires and were categorized as follows.Age was divided into 10-y age groups. Educational status wascategorized as secondary school or less, trade certificate or bach-elor’s degree, and postgraduate qualification. Body mass index(BMI; in kg/m2) was categorized as obese (BMI � 30), over-weight (BMI � 25 to �30), and normal-weight (BMI � 25) (23).Because only 18 participants were classified as underweight(BMI � 18.5), they were grouped with the normal-weight group.
Smoking status was categorized as current smoker (at leastdaily), former smoker (less than daily for at least the last 3 mo, butused to smoke daily), and nonsmoker (smoked � 100 cigarettesover lifetime) (24). Alcohol consumption was categorized asnone, �60 standard drinks/mo, or �60 standard drinks/mo (24).Physical activity beneficial to health was categorized as suffi-ciently active (�150 min physical activity time in the previous
TABLE 1Classification of glucose tolerance status according to fasting plasmaglucose values and 2-h plasma glucose values obtained during a 75-goral-glucose-tolerance test1
Classification
Plasma glucose
Fasting 2-h
mmol/LDiabetes � 7.0 � 11.1Impaired glucose tolerance � 7.0 7.8–11.0Impaired fasting glucose 6.1–6.9 � 7.8Normal glucose tolerance � 6.1 � 7.8
1 Data taken from reference 22. Both the fasting and 2-h values areneeded for diagnosis in all cases except diabetes, which requires only 1 of the2 values.
686 COYNE ET AL
week), insufficiently active but not sedentary (�150 min phys-ical activity time in the previous week), and sedentary (no par-ticipation in physical activity in the previous week). Physicalactivity time was calculated as the sum of the time spent walkingor performing moderate activity plus double the time spent invigorous activity (to reflect its greater intensity) (25). Vitaminsupplement use during the previous 24 h was categorized as yesfor respondents who indicated that they took any vitamin ormineral supplements on the previous day and no for respondentswho indicated they did not do so.
Plasma lipids were categorized by using the criteria for abnor-mal lipid concentrations that were based on recommendationsfrom the National Heart Foundation (26) and the AustralianDiabetes Society (27). The presence or absence of hypertensionwas determined for each participant in accordance with WorldHealth Organization guidelines (28).
Intakes of vegetables and fruit were approximated by asking 2questions. Participants were asked, “How many serves [ie, serv-ings] of vegetables do you usually eat each day? Including fresh,frozen or tinned vegetables (a serve � 1⁄2 cup [ie, 75 g] cookedvegetables or 1 cup [ie, �130 g] salad vegetables).” Usual con-sumption of fruit was assessed by the question, “How manyserves of fruit do you usually eat each day? Including fresh,frozen, or canned fruit (a serve � 1 medium piece or 2 smallpieces of fruit or 1 cup [ie, 150 g] diced pieces of fruit.).” Par-ticipants were categorized into 3 groups (ie, � 1 serving, 2–3servings, and �4 servings) according to their responses to bothquestions.
Statistical analysis
Data were analyzed by using the survey commands in STATAstatistical software (version 8; Stata Corp, College Station, TX;29). These commands take into account the complex surveydesign in the calculation of estimates, variance, SEs, and CIs.Pearson’s chi-square statistic was used to assess the relationbetween diabetes status and selected categorical variables. Stu-dent’s t test was used to compare differences in means between2 groups; analysis of variance was used to assess overall differ-ences in means between serum carotenoids and the variables with�2 groups.
Mean fasting plasma glucose, 2-h postload glucose, andplasma insulin concentrations were estimated for quintiles ofeach serum carotenoid after adjustment for age, and P for trendwas calculated by using multiple linear regression. Distributionsof serum carotenoids were skewed and therefore were naturallogarithmically transformed to better approximate the normaldistribution for regression analyses. Associations between serumcarotenoids as dependent variables and diabetes status (as anordinal variable) were assessed by using multiple linear regres-sion analysis, and P for trend was estimated. The adjust com-mand in STATA was used to provide adjusted predictions ofmean serum carotenoid concentrations for each level of diabetesstatus. Results are reported as back-transformed geometricmeans. Analysis was performed separately for each serum ca-rotenoid, after adjustment for the potential confounders age; sex;BMI; physical activity; education; vitamin use; smoking status;alcohol intake; systolic and diastolic blood pressures; total, HDL,and LDL cholesterol; and triacylglycerol. The confounders wereput into the model simultaneously as categorical variables. Be-cause of missing values, the sample size is not the same for allanalyses.
RESULTS
The prevalence of diabetes and IGM according to demo-graphic and health-related characteristics is shown in Table 2.There was no significant difference in diabetes status betweenmales and females. Significant differences in diabetes statuswere evident for subjects by age, BMI, physical activity status,total and HDL cholesterol, triacylglycerol, and systolic bloodpressure.
The relations between the 5 serum carotenoids and the varioussociodemographic, anthropometric, and health-related variablesare shown in Table 3. Although there were significant differ-ences in mean serum carotenoids within many of these catego-ries, age group, BMI, alcohol intake, and HDL and LDL choles-terol had significant relations with all the serum carotenoids.Apart from educational status, all the other variables in Table 3were related to some but not all carotenoids.
The mean fasting plasma glucose, 2-h postload glucose, andfasting insulin by quintiles of each serum carotenoid are shownin Table 4. The median of each of the carotenoids is provided foreach quintile. Mean 2-h postload glucose and fasting insulinconcentrations decreased significantly with increasing quintilesof each serum carotenoid (P for trend � 0.05). Fasting glucoseconcentrations also decreased significantly with increasing quin-tiles of �-carotene and �-carotene (P � 0.01).
After adjustment for the potential confounders age; sex; BMI;physical activity; educational status; smoking; alcohol intake;vitamin use; total, HDL, and LDL cholesterol; triacylglycerol;and systolic and diastolic blood pressures, significant lineartrends in serum carotenoid concentrations (except lycopene) bydiabetes status were evident (Table 5). �-Carotene showed themost decline; its geometric means were 0.59, 0.50, and 0.42�mol/L in persons with normal glucose tolerance, IGM, and type2 diabetes, respectively (P � 0.01 for linear trend).
DISCUSSION
The data from the current population study suggest that serumcarotenoids are associated with diabetes status. Our studyshowed an increasing trend in 2-h postload plasma glucose andfasting insulin concentrations with decreasing quintiles of all ofthe carotenoids tested. A decreasing trend in fasting plasma glu-cose concentrations was observed with increasing quintiles of�-carotene and �-carotene. In addition, serum carotenoid con-centrations showed a linear decrease with the degree of glucosetolerance abnormality. This decrease was significant for all of thecarotenoids except lycopene. These findings are consistent withdata reported by Ford et al (12) from the third National Health andNutrition Examination Survey (NHANES III; 12). In NHANESIII, Ford et al reported a significant linear decrease in �-caroteneand lycopene in persons with IGT and in persons with newlydiagnosed diabetes compared with persons with normal glucoseconcentrations, after adjustment for confounding factors similarto those in our study. The association between serum carotenoidconcentrations and diabetes status observed in our study was alsoconsistent with associations reported in studies from severalother countries (13–15, 30, 31).
Because of the cross-sectional design of our study, however, itis not possible to draw inferences as to whether the lower serumcarotenoid concentrations found in participants with diabetes arethe result of increased utilization of these antioxidants due to the
DIABETES AND SERUM CAROTENOIDS 687
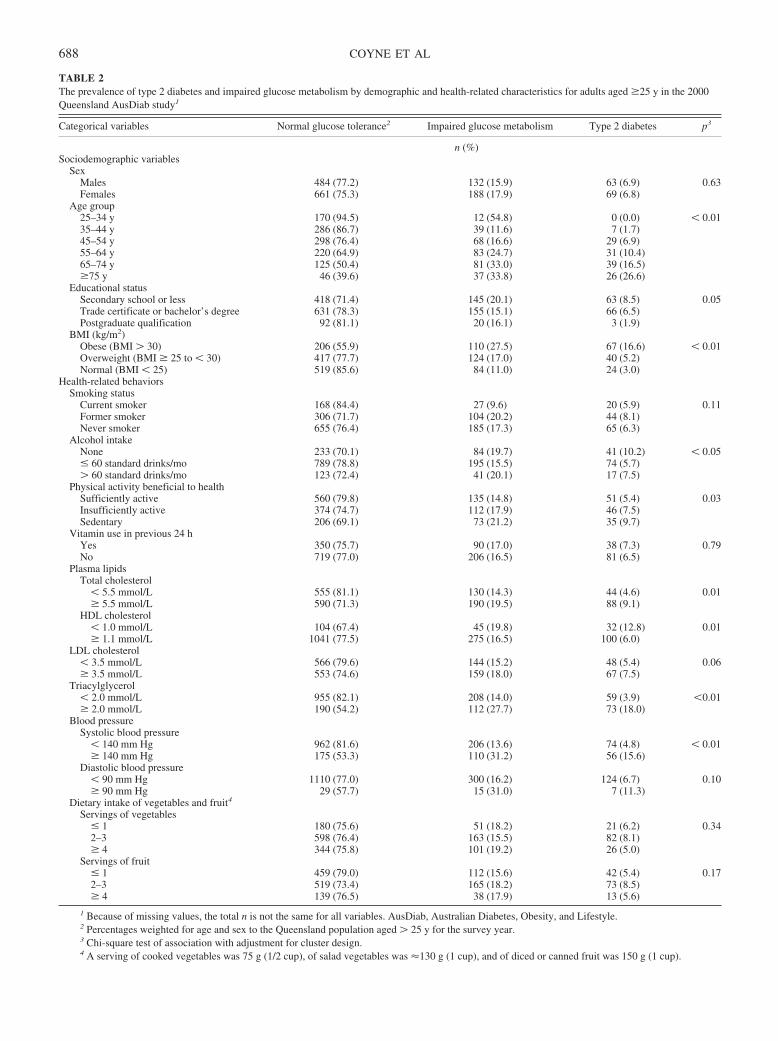
TABLE 2The prevalence of type 2 diabetes and impaired glucose metabolism by demographic and health-related characteristics for adults aged �25 y in the 2000Queensland AusDiab study1
Categorical variables Normal glucose tolerance2 Impaired glucose metabolism Type 2 diabetes p3
n (%)Sociodemographic variables
SexMales 484 (77.2) 132 (15.9) 63 (6.9) 0.63Females 661 (75.3) 188 (17.9) 69 (6.8)
Age group25–34 y 170 (94.5) 12 (54.8) 0 (0.0) � 0.0135–44 y 286 (86.7) 39 (11.6) 7 (1.7)45–54 y 298 (76.4) 68 (16.6) 29 (6.9)55–64 y 220 (64.9) 83 (24.7) 31 (10.4)65–74 y 125 (50.4) 81 (33.0) 39 (16.5)�75 y 46 (39.6) 37 (33.8) 26 (26.6)
Educational statusSecondary school or less 418 (71.4) 145 (20.1) 63 (8.5) 0.05Trade certificate or bachelor’s degree 631 (78.3) 155 (15.1) 66 (6.5)Postgraduate qualification 92 (81.1) 20 (16.1) 3 (1.9)
BMI (kg/m2)Obese (BMI � 30) 206 (55.9) 110 (27.5) 67 (16.6) � 0.01Overweight (BMI � 25 to � 30) 417 (77.7) 124 (17.0) 40 (5.2)Normal (BMI � 25) 519 (85.6) 84 (11.0) 24 (3.0)
Health-related behaviorsSmoking status
Current smoker 168 (84.4) 27 (9.6) 20 (5.9) 0.11Former smoker 306 (71.7) 104 (20.2) 44 (8.1)Never smoker 655 (76.4) 185 (17.3) 65 (6.3)
Alcohol intakeNone 233 (70.1) 84 (19.7) 41 (10.2) � 0.05� 60 standard drinks/mo 789 (78.8) 195 (15.5) 74 (5.7)� 60 standard drinks/mo 123 (72.4) 41 (20.1) 17 (7.5)
Physical activity beneficial to healthSufficiently active 560 (79.8) 135 (14.8) 51 (5.4) 0.03Insufficiently active 374 (74.7) 112 (17.9) 46 (7.5)Sedentary 206 (69.1) 73 (21.2) 35 (9.7)
Vitamin use in previous 24 hYes 350 (75.7) 90 (17.0) 38 (7.3) 0.79No 719 (77.0) 206 (16.5) 81 (6.5)
Plasma lipidsTotal cholesterol
� 5.5 mmol/L 555 (81.1) 130 (14.3) 44 (4.6) 0.01� 5.5 mmol/L 590 (71.3) 190 (19.5) 88 (9.1)
HDL cholesterol� 1.0 mmol/L 104 (67.4) 45 (19.8) 32 (12.8) 0.01� 1.1 mmol/L 1041 (77.5) 275 (16.5) 100 (6.0)
LDL cholesterol� 3.5 mmol/L 566 (79.6) 144 (15.2) 48 (5.4) 0.06� 3.5 mmol/L 553 (74.6) 159 (18.0) 67 (7.5)
Triacylglycerol� 2.0 mmol/L 955 (82.1) 208 (14.0) 59 (3.9) �0.01� 2.0 mmol/L 190 (54.2) 112 (27.7) 73 (18.0)
Blood pressureSystolic blood pressure
� 140 mm Hg 962 (81.6) 206 (13.6) 74 (4.8) � 0.01� 140 mm Hg 175 (53.3) 110 (31.2) 56 (15.6)
Diastolic blood pressure� 90 mm Hg 1110 (77.0) 300 (16.2) 124 (6.7) 0.10� 90 mm Hg 29 (57.7) 15 (31.0) 7 (11.3)
Dietary intake of vegetables and fruit4
Servings of vegetables� 1 180 (75.6) 51 (18.2) 21 (6.2) 0.342–3 598 (76.4) 163 (15.5) 82 (8.1)� 4 344 (75.8) 101 (19.2) 26 (5.0)
Servings of fruit� 1 459 (79.0) 112 (15.6) 42 (5.4) 0.172–3 519 (73.4) 165 (18.2) 73 (8.5)� 4 139 (76.5) 38 (17.9) 13 (5.6)
1 Because of missing values, the total n is not the same for all variables. AusDiab, Australian Diabetes, Obesity, and Lifestyle.2 Percentages weighted for age and sex to the Queensland population aged � 25 y for the survey year.3 Chi-square test of association with adjustment for cluster design.4 A serving of cooked vegetables was 75 g (1/2 cup), of salad vegetables was �130 g (1 cup), and of diced or canned fruit was 150 g (1 cup).
688 COYNE ET AL
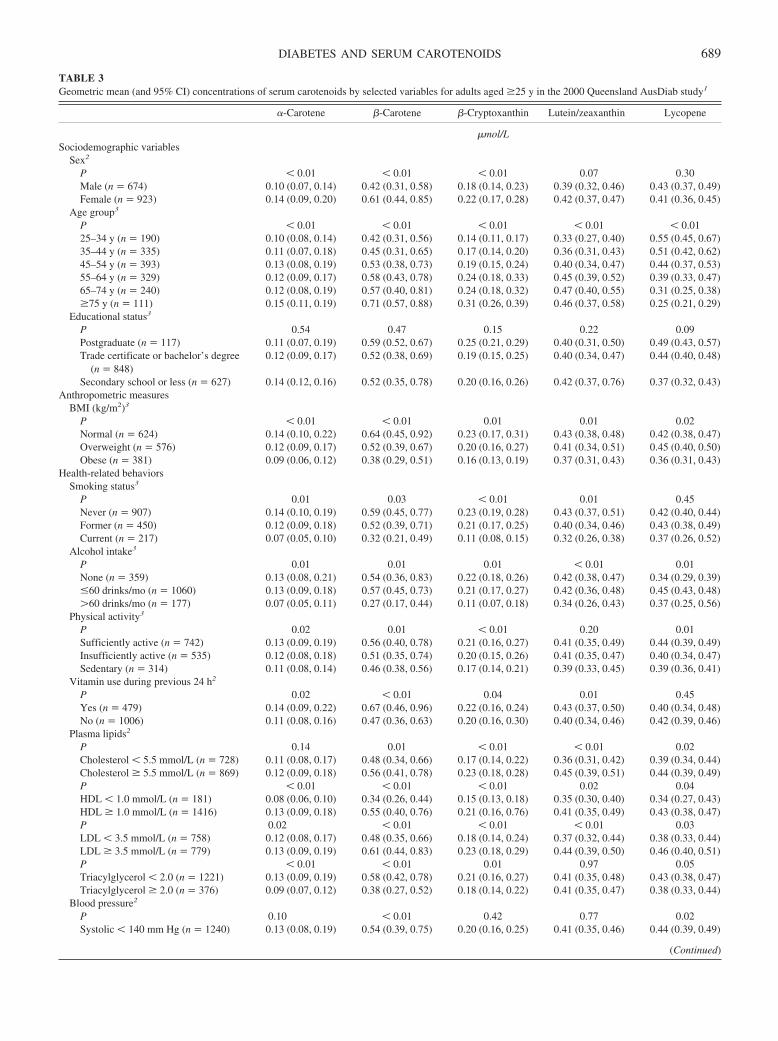
TABLE 3Geometric mean (and 95% CI) concentrations of serum carotenoids by selected variables for adults aged �25 y in the 2000 Queensland AusDiab study1
�-Carotene �-Carotene �-Cryptoxanthin Lutein/zeaxanthin Lycopene
�mol/LSociodemographic variables
Sex2
P � 0.01 � 0.01 � 0.01 0.07 0.30Male (n � 674) 0.10 (0.07, 0.14) 0.42 (0.31, 0.58) 0.18 (0.14, 0.23) 0.39 (0.32, 0.46) 0.43 (0.37, 0.49)Female (n � 923) 0.14 (0.09, 0.20) 0.61 (0.44, 0.85) 0.22 (0.17, 0.28) 0.42 (0.37, 0.47) 0.41 (0.36, 0.45)
Age group3
P � 0.01 � 0.01 � 0.01 � 0.01 � 0.0125–34 y (n � 190) 0.10 (0.08, 0.14) 0.42 (0.31, 0.56) 0.14 (0.11, 0.17) 0.33 (0.27, 0.40) 0.55 (0.45, 0.67)35–44 y (n � 335) 0.11 (0.07, 0.18) 0.45 (0.31, 0.65) 0.17 (0.14, 0.20) 0.36 (0.31, 0.43) 0.51 (0.42, 0.62)45–54 y (n � 393) 0.13 (0.08, 0.19) 0.53 (0.38, 0.73) 0.19 (0.15, 0.24) 0.40 (0.34, 0.47) 0.44 (0.37, 0.53)55–64 y (n � 329) 0.12 (0.09, 0.17) 0.58 (0.43, 0.78) 0.24 (0.18, 0.33) 0.45 (0.39, 0.52) 0.39 (0.33, 0.47)65–74 y (n � 240) 0.12 (0.08, 0.19) 0.57 (0.40, 0.81) 0.24 (0.18, 0.32) 0.47 (0.40, 0.55) 0.31 (0.25, 0.38)�75 y (n � 111) 0.15 (0.11, 0.19) 0.71 (0.57, 0.88) 0.31 (0.26, 0.39) 0.46 (0.37, 0.58) 0.25 (0.21, 0.29)
Educational status3
P 0.54 0.47 0.15 0.22 0.09Postgraduate (n � 117) 0.11 (0.07, 0.19) 0.59 (0.52, 0.67) 0.25 (0.21, 0.29) 0.40 (0.31, 0.50) 0.49 (0.43, 0.57)Trade certificate or bachelor’s degree
(n � 848)0.12 (0.09, 0.17) 0.52 (0.38, 0.69) 0.19 (0.15, 0.25) 0.40 (0.34, 0.47) 0.44 (0.40, 0.48)
Secondary school or less (n � 627) 0.14 (0.12, 0.16) 0.52 (0.35, 0.78) 0.20 (0.16, 0.26) 0.42 (0.37, 0.76) 0.37 (0.32, 0.43)Anthropometric measures
BMI (kg/m2)3
P � 0.01 � 0.01 0.01 0.01 0.02Normal (n � 624) 0.14 (0.10, 0.22) 0.64 (0.45, 0.92) 0.23 (0.17, 0.31) 0.43 (0.38, 0.48) 0.42 (0.38, 0.47)Overweight (n � 576) 0.12 (0.09, 0.17) 0.52 (0.39, 0.67) 0.20 (0.16, 0.27) 0.41 (0.34, 0.51) 0.45 (0.40, 0.50)Obese (n � 381) 0.09 (0.06, 0.12) 0.38 (0.29, 0.51) 0.16 (0.13, 0.19) 0.37 (0.31, 0.43) 0.36 (0.31, 0.43)
Health-related behaviorsSmoking status3
P 0.01 0.03 � 0.01 0.01 0.45Never (n � 907) 0.14 (0.10, 0.19) 0.59 (0.45, 0.77) 0.23 (0.19, 0.28) 0.43 (0.37, 0.51) 0.42 (0.40, 0.44)Former (n � 450) 0.12 (0.09, 0.18) 0.52 (0.39, 0.71) 0.21 (0.17, 0.25) 0.40 (0.34, 0.46) 0.43 (0.38, 0.49)Current (n � 217) 0.07 (0.05, 0.10) 0.32 (0.21, 0.49) 0.11 (0.08, 0.15) 0.32 (0.26, 0.38) 0.37 (0.26, 0.52)
Alcohol intake3
P 0.01 0.01 0.01 � 0.01 0.01None (n � 359) 0.13 (0.08, 0.21) 0.54 (0.36, 0.83) 0.22 (0.18, 0.26) 0.42 (0.38, 0.47) 0.34 (0.29, 0.39)�60 drinks/mo (n � 1060) 0.13 (0.09, 0.18) 0.57 (0.45, 0.73) 0.21 (0.17, 0.27) 0.42 (0.36, 0.48) 0.45 (0.43, 0.48)�60 drinks/mo (n � 177) 0.07 (0.05, 0.11) 0.27 (0.17, 0.44) 0.11 (0.07, 0.18) 0.34 (0.26, 0.43) 0.37 (0.25, 0.56)
Physical activity3
P 0.02 0.01 � 0.01 0.20 0.01Sufficiently active (n � 742) 0.13 (0.09, 0.19) 0.56 (0.40, 0.78) 0.21 (0.16, 0.27) 0.41 (0.35, 0.49) 0.44 (0.39, 0.49)Insufficiently active (n � 535) 0.12 (0.08, 0.18) 0.51 (0.35, 0.74) 0.20 (0.15, 0.26) 0.41 (0.35, 0.47) 0.40 (0.34, 0.47)Sedentary (n � 314) 0.11 (0.08, 0.14) 0.46 (0.38, 0.56) 0.17 (0.14, 0.21) 0.39 (0.33, 0.45) 0.39 (0.36, 0.41)
Vitamin use during previous 24 h2
P 0.02 � 0.01 0.04 0.01 0.45Yes (n � 479) 0.14 (0.09, 0.22) 0.67 (0.46, 0.96) 0.22 (0.16, 0.24) 0.43 (0.37, 0.50) 0.40 (0.34, 0.48)No (n � 1006) 0.11 (0.08, 0.16) 0.47 (0.36, 0.63) 0.20 (0.16, 0.30) 0.40 (0.34, 0.46) 0.42 (0.39, 0.46)
Plasma lipids2
P 0.14 0.01 � 0.01 � 0.01 0.02Cholesterol � 5.5 mmol/L (n � 728) 0.11 (0.08, 0.17) 0.48 (0.34, 0.66) 0.17 (0.14, 0.22) 0.36 (0.31, 0.42) 0.39 (0.34, 0.44)Cholesterol � 5.5 mmol/L (n � 869) 0.12 (0.09, 0.18) 0.56 (0.41, 0.78) 0.23 (0.18, 0.28) 0.45 (0.39, 0.51) 0.44 (0.39, 0.49)P � 0.01 � 0.01 � 0.01 0.02 0.04HDL � 1.0 mmol/L (n � 181) 0.08 (0.06, 0.10) 0.34 (0.26, 0.44) 0.15 (0.13, 0.18) 0.35 (0.30, 0.40) 0.34 (0.27, 0.43)HDL � 1.0 mmol/L (n � 1416) 0.13 (0.09, 0.18) 0.55 (0.40, 0.76) 0.21 (0.16, 0.76) 0.41 (0.35, 0.49) 0.43 (0.38, 0.47)P 0.02 � 0.01 � 0.01 � 0.01 0.03LDL � 3.5 mmol/L (n � 758) 0.12 (0.08, 0.17) 0.48 (0.35, 0.66) 0.18 (0.14, 0.24) 0.37 (0.32, 0.44) 0.38 (0.33, 0.44)LDL � 3.5 mmol/L (n � 779) 0.13 (0.09, 0.19) 0.61 (0.44, 0.83) 0.23 (0.18, 0.29) 0.44 (0.39, 0.50) 0.46 (0.40, 0.51)P � 0.01 � 0.01 0.01 0.97 0.05Triacylglycerol � 2.0 (n � 1221) 0.13 (0.09, 0.19) 0.58 (0.42, 0.78) 0.21 (0.16, 0.27) 0.41 (0.35, 0.48) 0.43 (0.38, 0.47)Triacylglycerol � 2.0 (n � 376) 0.09 (0.07, 0.12) 0.38 (0.27, 0.52) 0.18 (0.14, 0.22) 0.41 (0.35, 0.47) 0.38 (0.33, 0.44)
Blood pressure2
P 0.10 � 0.01 0.42 0.77 0.02Systolic � 140 mm Hg (n � 1240) 0.13 (0.08, 0.19) 0.54 (0.39, 0.75) 0.20 (0.16, 0.25) 0.41 (0.35, 0.46) 0.44 (0.39, 0.49)
(Continued)
DIABETES AND SERUM CAROTENOIDS 689
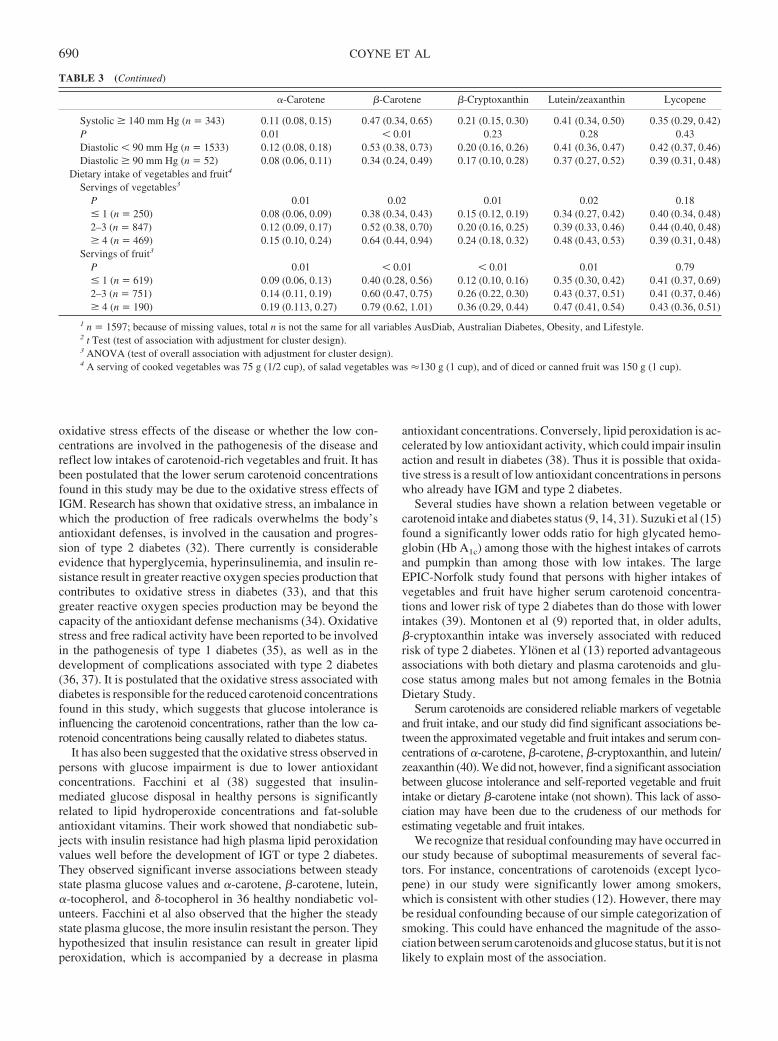
oxidative stress effects of the disease or whether the low con-centrations are involved in the pathogenesis of the disease andreflect low intakes of carotenoid-rich vegetables and fruit. It hasbeen postulated that the lower serum carotenoid concentrationsfound in this study may be due to the oxidative stress effects ofIGM. Research has shown that oxidative stress, an imbalance inwhich the production of free radicals overwhelms the body’santioxidant defenses, is involved in the causation and progres-sion of type 2 diabetes (32). There currently is considerableevidence that hyperglycemia, hyperinsulinemia, and insulin re-sistance result in greater reactive oxygen species production thatcontributes to oxidative stress in diabetes (33), and that thisgreater reactive oxygen species production may be beyond thecapacity of the antioxidant defense mechanisms (34). Oxidativestress and free radical activity have been reported to be involvedin the pathogenesis of type 1 diabetes (35), as well as in thedevelopment of complications associated with type 2 diabetes(36, 37). It is postulated that the oxidative stress associated withdiabetes is responsible for the reduced carotenoid concentrationsfound in this study, which suggests that glucose intolerance isinfluencing the carotenoid concentrations, rather than the low ca-rotenoid concentrations being causally related to diabetes status.
It has also been suggested that the oxidative stress observed inpersons with glucose impairment is due to lower antioxidantconcentrations. Facchini et al (38) suggested that insulin-mediated glucose disposal in healthy persons is significantlyrelated to lipid hydroperoxide concentrations and fat-solubleantioxidant vitamins. Their work showed that nondiabetic sub-jects with insulin resistance had high plasma lipid peroxidationvalues well before the development of IGT or type 2 diabetes.They observed significant inverse associations between steadystate plasma glucose values and �-carotene, �-carotene, lutein,�-tocopherol, and �-tocopherol in 36 healthy nondiabetic vol-unteers. Facchini et al also observed that the higher the steadystate plasma glucose, the more insulin resistant the person. Theyhypothesized that insulin resistance can result in greater lipidperoxidation, which is accompanied by a decrease in plasma
antioxidant concentrations. Conversely, lipid peroxidation is ac-celerated by low antioxidant activity, which could impair insulinaction and result in diabetes (38). Thus it is possible that oxida-tive stress is a result of low antioxidant concentrations in personswho already have IGM and type 2 diabetes.
Several studies have shown a relation between vegetable orcarotenoid intake and diabetes status (9, 14, 31). Suzuki et al (15)found a significantly lower odds ratio for high glycated hemo-globin (Hb A1c) among those with the highest intakes of carrotsand pumpkin than among those with low intakes. The largeEPIC-Norfolk study found that persons with higher intakes ofvegetables and fruit have higher serum carotenoid concentra-tions and lower risk of type 2 diabetes than do those with lowerintakes (39). Montonen et al (9) reported that, in older adults,�-cryptoxanthin intake was inversely associated with reducedrisk of type 2 diabetes. Ylönen et al (13) reported advantageousassociations with both dietary and plasma carotenoids and glu-cose status among males but not among females in the BotniaDietary Study.
Serum carotenoids are considered reliable markers of vegetableand fruit intake, and our study did find significant associations be-tween the approximated vegetable and fruit intakes and serum con-centrations of �-carotene, �-carotene, �-cryptoxanthin, and lutein/zeaxanthin (40). We did not, however, find a significant associationbetween glucose intolerance and self-reported vegetable and fruitintake or dietary �-carotene intake (not shown). This lack of asso-ciation may have been due to the crudeness of our methods forestimating vegetable and fruit intakes.
We recognize that residual confounding may have occurred inour study because of suboptimal measurements of several fac-tors. For instance, concentrations of carotenoids (except lyco-pene) in our study were significantly lower among smokers,which is consistent with other studies (12). However, there maybe residual confounding because of our simple categorization ofsmoking. This could have enhanced the magnitude of the asso-ciation between serum carotenoids and glucose status, but it is notlikely to explain most of the association.
TABLE 3 (Continued)
�-Carotene �-Carotene �-Cryptoxanthin Lutein/zeaxanthin Lycopene
Systolic � 140 mm Hg (n � 343) 0.11 (0.08, 0.15) 0.47 (0.34, 0.65) 0.21 (0.15, 0.30) 0.41 (0.34, 0.50) 0.35 (0.29, 0.42)P 0.01 � 0.01 0.23 0.28 0.43Diastolic � 90 mm Hg (n � 1533) 0.12 (0.08, 0.18) 0.53 (0.38, 0.73) 0.20 (0.16, 0.26) 0.41 (0.36, 0.47) 0.42 (0.37, 0.46)Diastolic � 90 mm Hg (n � 52) 0.08 (0.06, 0.11) 0.34 (0.24, 0.49) 0.17 (0.10, 0.28) 0.37 (0.27, 0.52) 0.39 (0.31, 0.48)
Dietary intake of vegetables and fruit4
Servings of vegetables3
P 0.01 0.02 0.01 0.02 0.18� 1 (n � 250) 0.08 (0.06, 0.09) 0.38 (0.34, 0.43) 0.15 (0.12, 0.19) 0.34 (0.27, 0.42) 0.40 (0.34, 0.48)2–3 (n � 847) 0.12 (0.09, 0.17) 0.52 (0.38, 0.70) 0.20 (0.16, 0.25) 0.39 (0.33, 0.46) 0.44 (0.40, 0.48)� 4 (n � 469) 0.15 (0.10, 0.24) 0.64 (0.44, 0.94) 0.24 (0.18, 0.32) 0.48 (0.43, 0.53) 0.39 (0.31, 0.48)
Servings of fruit3
P 0.01 � 0.01 � 0.01 0.01 0.79� 1 (n � 619) 0.09 (0.06, 0.13) 0.40 (0.28, 0.56) 0.12 (0.10, 0.16) 0.35 (0.30, 0.42) 0.41 (0.37, 0.69)2–3 (n � 751) 0.14 (0.11, 0.19) 0.60 (0.47, 0.75) 0.26 (0.22, 0.30) 0.43 (0.37, 0.51) 0.41 (0.37, 0.46)� 4 (n � 190) 0.19 (0.113, 0.27) 0.79 (0.62, 1.01) 0.36 (0.29, 0.44) 0.47 (0.41, 0.54) 0.43 (0.36, 0.51)
1 n � 1597; because of missing values, total n is not the same for all variables AusDiab, Australian Diabetes, Obesity, and Lifestyle.2 t Test (test of association with adjustment for cluster design).3 ANOVA (test of overall association with adjustment for cluster design).4 A serving of cooked vegetables was 75 g (1/2 cup), of salad vegetables was �130 g (1 cup), and of diced or canned fruit was 150 g (1 cup).
690 COYNE ET AL
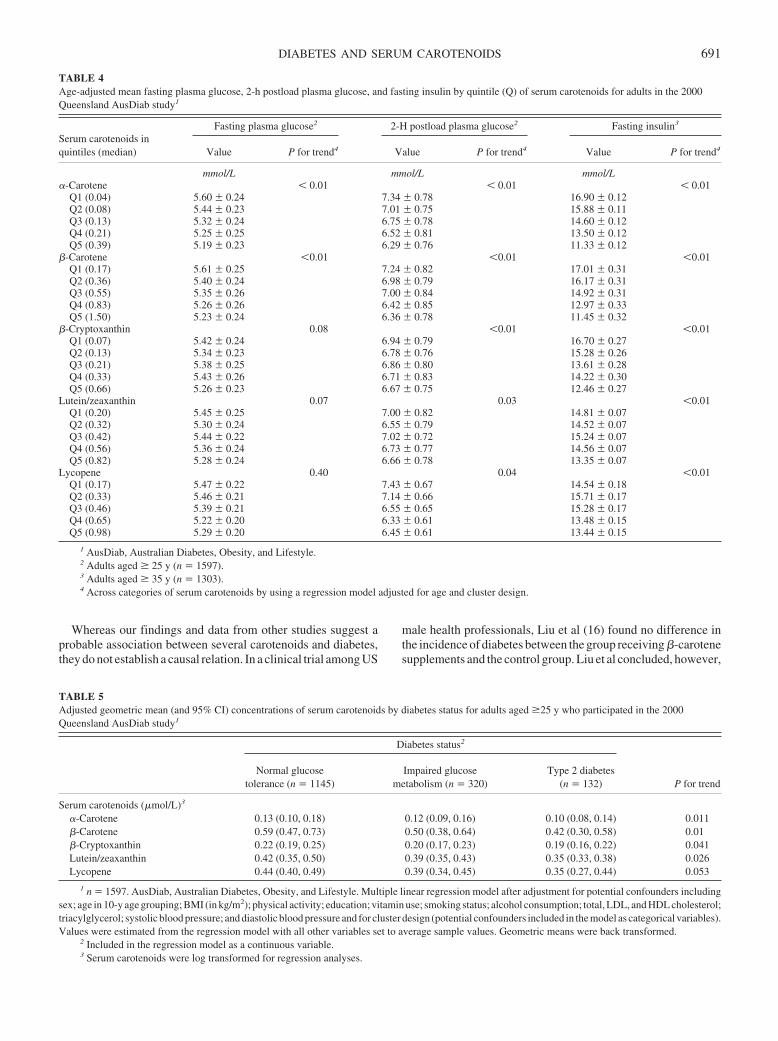
Whereas our findings and data from other studies suggest aprobable association between several carotenoids and diabetes,they do not establish a causal relation. In a clinical trial among US
male health professionals, Liu et al (16) found no difference inthe incidence of diabetes between the group receiving �-carotenesupplements and the control group. Liu et al concluded, however,
TABLE 4Age-adjusted mean fasting plasma glucose, 2-h postload plasma glucose, and fasting insulin by quintile (Q) of serum carotenoids for adults in the 2000Queensland AusDiab study1
Serum carotenoids inquintiles (median)
Fasting plasma glucose2 2-H postload plasma glucose2 Fasting insulin3
Value P for trend4 Value P for trend4 Value P for trend4
mmol/L mmol/L mmol/L�-Carotene � 0.01 � 0.01 � 0.01
Q1 (0.04) 5.60 � 0.24 7.34 � 0.78 16.90 � 0.12Q2 (0.08) 5.44 � 0.23 7.01 � 0.75 15.88 � 0.11Q3 (0.13) 5.32 � 0.24 6.75 � 0.78 14.60 � 0.12Q4 (0.21) 5.25 � 0.25 6.52 � 0.81 13.50 � 0.12Q5 (0.39) 5.19 � 0.23 6.29 � 0.76 11.33 � 0.12
�-Carotene �0.01 �0.01 �0.01Q1 (0.17) 5.61 � 0.25 7.24 � 0.82 17.01 � 0.31Q2 (0.36) 5.40 � 0.24 6.98 � 0.79 16.17 � 0.31Q3 (0.55) 5.35 � 0.26 7.00 � 0.84 14.92 � 0.31Q4 (0.83) 5.26 � 0.26 6.42 � 0.85 12.97 � 0.33Q5 (1.50) 5.23 � 0.24 6.36 � 0.78 11.45 � 0.32
�-Cryptoxanthin 0.08 �0.01 �0.01Q1 (0.07) 5.42 � 0.24 6.94 � 0.79 16.70 � 0.27Q2 (0.13) 5.34 � 0.23 6.78 � 0.76 15.28 � 0.26Q3 (0.21) 5.38 � 0.25 6.86 � 0.80 13.61 � 0.28Q4 (0.33) 5.43 � 0.26 6.71 � 0.83 14.22 � 0.30Q5 (0.66) 5.26 � 0.23 6.67 � 0.75 12.46 � 0.27
Lutein/zeaxanthin 0.07 0.03 �0.01Q1 (0.20) 5.45 � 0.25 7.00 � 0.82 14.81 � 0.07Q2 (0.32) 5.30 � 0.24 6.55 � 0.79 14.52 � 0.07Q3 (0.42) 5.44 � 0.22 7.02 � 0.72 15.24 � 0.07Q4 (0.56) 5.36 � 0.24 6.73 � 0.77 14.56 � 0.07Q5 (0.82) 5.28 � 0.24 6.66 � 0.78 13.35 � 0.07
Lycopene 0.40 0.04 �0.01Q1 (0.17) 5.47 � 0.22 7.43 � 0.67 14.54 � 0.18Q2 (0.33) 5.46 � 0.21 7.14 � 0.66 15.71 � 0.17Q3 (0.46) 5.39 � 0.21 6.55 � 0.65 15.28 � 0.17Q4 (0.65) 5.22 � 0.20 6.33 � 0.61 13.48 � 0.15Q5 (0.98) 5.29 � 0.20 6.45 � 0.61 13.44 � 0.15
1 AusDiab, Australian Diabetes, Obesity, and Lifestyle.2 Adults aged � 25 y (n � 1597).3 Adults aged � 35 y (n � 1303).4 Across categories of serum carotenoids by using a regression model adjusted for age and cluster design.
TABLE 5Adjusted geometric mean (and 95% CI) concentrations of serum carotenoids by diabetes status for adults aged �25 y who participated in the 2000Queensland AusDiab study1
Diabetes status2
P for trendNormal glucose
tolerance (n � 1145)Impaired glucose
metabolism (n � 320)Type 2 diabetes
(n � 132)
Serum carotenoids (�mol/L)3
�-Carotene 0.13 (0.10, 0.18) 0.12 (0.09, 0.16) 0.10 (0.08, 0.14) 0.011�-Carotene 0.59 (0.47, 0.73) 0.50 (0.38, 0.64) 0.42 (0.30, 0.58) 0.01�-Cryptoxanthin 0.22 (0.19, 0.25) 0.20 (0.17, 0.23) 0.19 (0.16, 0.22) 0.041Lutein/zeaxanthin 0.42 (0.35, 0.50) 0.39 (0.35, 0.43) 0.35 (0.33, 0.38) 0.026Lycopene 0.44 (0.40, 0.49) 0.39 (0.34, 0.45) 0.35 (0.27, 0.44) 0.053
1 n � 1597. AusDiab, Australian Diabetes, Obesity, and Lifestyle. Multiple linear regression model after adjustment for potential confounders includingsex; age in 10-y age grouping; BMI (in kg/m2); physical activity; education; vitamin use; smoking status; alcohol consumption; total, LDL, and HDL cholesterol;triacylglycerol; systolic blood pressure; and diastolic blood pressure and for cluster design (potential confounders included in the model as categorical variables).Values were estimated from the regression model with all other variables set to average sample values. Geometric means were back transformed.
2 Included in the regression model as a continuous variable.3 Serum carotenoids were log transformed for regression analyses.
DIABETES AND SERUM CAROTENOIDS 691
that the results of their trial of �-carotene supplementation“should not be interpreted as refuting the findings of observa-tional studies that suggest that increased intake of vegetables richin carotenoids and other antioxidants may decrease the risk oftype 2 diabetes” (16).
Diabetes is increasing in most countries of the world today andwill continue to increase (41). As populations continue to age andas overweight and obesity continue to escalate, especially amongchildren, diabetes will become an increasing burden on the healthsystem. Lifestyle interventions have shown a dramatic reductionin risk of diabetes among those with IGT (42, 43). However,strategies for both primary and secondary prevention will benecessary to reduce the burden of diabetes in future years andgenerations in both developed and developing countries. Clinicaltrials based on diets high in carotenoid-rich vegetables and fruitmay provide important insight in relation not only to the preven-tion of complications of diabetes, but also to reducing the risk ofdeveloping the disease, especially among those with IGT.
TC was responsible for the concept and conduct of the study and preparingthe manuscript. TII performed the statistical analysis and writing the resultssection. PDB and AD provided technical assistance on the data analysis. JS,SD, and CM provided details regarding the study methods. DL gave technicalassistance on writing and interpretation. None of the authors had a personalor financial conflict of interest.
REFERENCES1. Tavani A, Negri E, D’Avanzo B, et al. Beta-carotene intake and risk of
nonfatal acute myocardial infarction in women. Eur J Epidemiol 1997;13:631–7.
2. D’Odorico A, Martinez D, Kiechl S, et al. High plasma level of alpha-and beta-carotene are associated with a lower risk of atherosclerosis.Results from the Bruneck study. Atherosclerosis 2000;153:231–9.
3. Daviglus ML, Orencia AJ, Dyer AR, et al. Dietary vitamin C, beta-carotene and 30-year risk of stroke: results from the Western ElectricStudy. Neuroepidemiology 1997;16:69–77.
4. Giovannucci E, Rimm EB, Liu Y, Stampfer MJ, Willett WC. A prospec-tive study of tomato products, lycopene, and prostate cancer risk. J NatlCancer Inst 2002;94:391–8.
5. D’Odorico A, Bortolan S, Cardin R, et al. Reduced plasma antioxidantconcentrations and increased oxidative DNA damage in inflammatorybowel disease. Scand J Gastroenterol 2001;36:1289–94.
6. Laight DW, Carrier MJ, Anggard EE. Antioxidants, diabetes and endo-thelial dysfunction. Cardiovasc Res 2000;47:457–64.
7. Hasanain B, Arshag MD, Mooradian MD. Antioxidant vitamin and theirinfluence in diabetes mellitus. Curr Diabetes Rep 2002;2:448–56.
8. Feskens EJ, Virtanen SM, Rasanen L, et al. Dietary factors determiningdiabetes and impaired glucose tolerance. 20-year follow-up of the Finn-ish and Dutch cohorts of the Seven Countries Study. Diabetes Care1995;18:1104–12.
9. Montonen J, Knekt P, Jarvinen R, Reunanen A. Dietary antioxidantintake and risk of type 2 diabetes. Diabetes Care 2004;27:362–6.
10. Tavridou A, Unwin NC, Laker MF, White M, Alberti KG. Serum con-centrations of vitamins A and E in impaired glucose tolerance. Clin ChimActa 1997;266:129–40.
11. Armstrong AM, Chestnutt JE, Gormley MJ, Young IS. The effect ofdietary treatment on lipid peroxidation and antioxidant status in newlydiagnosed noninsulin dependent diabetes. Free Radic Biol Med 1996;21:719–26.
12. Ford ES, Will JC, Bowman BA, Narayan KM. Diabetes mellitus andserum carotenoids: findings from the third National Health and NutritionExamination Survey. Am J Epidemiol 1999;149:168–76.
13. Ylonen K, Alfathan G, Groop L, et al. Dietary intakes and plasmaconcentrations of carotenoids and tocopherols in relation to glucosemetabolism in subjects at high risk of type 2 diabetes: the Botnia DietaryStudy. Am J Clin Nutr 2003;77:1434–41.
14. Polidori MC, Mecocci P, Stahl W, et al. Plasma levels of lipophilicantioxidants in very old patients with type 2 diabetes. Diabetes MetabRes Rev 2000;16:15–9.
15. Suzuki K, Ito Y, Nakamura S, Ochiai J, Aoki K. Relationship betweenserum carotenoids and hyperglycemia: a population-based cross-sectional study. J Epidemiol 2002;12:357–66.
16. Liu S, Ajani U, Chae C, Hennekens C, Buring JE, Manson JE. Long-termbeta-carotene supplementation and risk of type 2 diabetes mellitus: arandomized controlled trial. JAMA 1999;282:1073–5.
17. Dunstan DW, Zimmet PZ, Welborn TA, et al. The rising prevalence ofdiabetes and impaired glucose tolerance: the Australian Diabetes, Obe-sity and Lifestyle Study. Diabetes Care 2002;25:829–34.
18. Dunstan DW, Zimmet PZ, Welborn TA, et al. The Australian Diabetes,Obesity and Lifestyle Study (AusDiab)—methods and response rates.Diabetes Res Clin Pract 2002;57:119–29.
19. Friedewald WT, Levy RI, Fredrickson DS. Estimation of the concen-tration of low-density lipoprotein cholesterol in plasma, without use ofthe preparative ultracentrifuge. Clin Chem 1972;18:499–502.
20. Su Q, Rowley KG, O’Dea K. Stability of individual carotenoids, retinoland tocopherols in human plasma during exposure to light and afterextraction. J Chromatogr B Biomed Sci Appl 1999;729:191–8.
21. Talwar D, Ha TK, Cooney J, et al. A routine method for the simultaneousmeasurement of retinol, alpha-tocopherol and five carotenoids in humanplasma by reverse phase HPLC. Clin Chim Acta 1998;270:85–100.
22. World Health Organization. Definition, diagnosis and classification ofdiabetes mellitus and its complications; part 1: diagnosis and classifica-tion of diabetes mellitus. Geneva, Switzerland: Department of Noncom-municable Disease Surveillance, World Health Organization, 1999.
23. World Health Organization. Obesity: preventing and managing theglobal epidemic. Geneva, Switzerland: World Health Organization,2000.
24. Dunstan D, Zimmet P, Welborn T, et al. Diabesity and associated dis-orders in Australia—2000. The accelerating epidemic. The AustralianDiabetes, Obesity and Lifestyle Study (AusDiab). Melbourne, Australia:International Diabetes Institute, 2001.
25. Armstrong T, Bauman A, Davies J. Physical activity patterns of Aus-tralian adults. Result of the 1999 National Physical Activity Survey.Canberra, Australia: Australian Institute of Health and Welfare, 2000.
26. National Heart Foundation and Australian Institute of Health. Risk factorprevalence study no. 3 1989. Canberra, Australia: National Heart Foun-dation & Australian Institute of Health, 1990.
27. Australian Diabetes Society. Diabetic dyslipidemia—Australian Diabe-tes Society position statement. Med J Aust 1995;162:91–3.
28. World Health Organization Guidelines Subcommittee. 1999 WorldHealth Organization–International Society of Hypertension guidelinesfor the management of hypertension. J Hypertens 1999;17:151–83.
29. StataCorp. Stata Statistical Software, release 8.0. College Station, TX:Stata Corporation, 2003.
30. Abahusain MA, Wright J, Dickerson JW, et al. Retinol, alpha-tocopheroland carotenoids in diabetes. Eur J Clin Nutr 1999;53:630–5.
31. Reunanen A, Knekt P, Aaran RK, et al. Serum antioxidants and risk ofnon-insulin dependent diabetes mellitus. Eur J Clin Nutr 1998;52:89–93.
32. Ruhe RC, McDonald RB. Use of antioxidant nutrients in the preventionand treatment of type 2 diabetes. J Am Coll Nutr 2001;20(suppl):363S–6S.
33. Paolisso G, Giugliano D. Oxidative stress and insulin action: is there arelationship? Diabetologia 1996;39:364–6.
34. Maxwell SR, Thomason H, Sandler D, et al. Poor glycaemic control isassociated with reduced serum free radical scavenging (antioxidant)activity in non-insulin-dependent diabetes mellitus. Ann Clin Biochem1997;34:638–44.
35. Giugliano D, Ceriello A, Paolisso G. Diabetes mellitus, hypertension,and cardiovascular disease: which role for oxidative stress? Metabolism1995;44:363–8.
36. Levy Y, Zaltsberg H, Ben-Amotz A, Kanter Y, Aviram M. Dietarysupplementation of a natural isomer mixture of beta-carotene inhibitsoxidation of LDL derived from patients with diabetes mellitus. Ann NutrMetab 2000;44:54–60.
37. Upritchard JE, Sutherland WH, Mann JI. Effect of supplementation withtomato juice, vitamin E, and vitamin C on LDL oxidation and productsof inflammatory activity in type 2 diabetes. Diabetes Care 2000;23:733–8.
38. Facchini FS, Humphreys MH, DoNascimento CA, Abbasi F, ReavenGM. Relation between insulin resistance and plasma concentrations oflipid hydroperoxides, carotenoids, and tocopherols. Am J Clin Nutr2000;72:776–9.
692 COYNE ET AL

39. Sargent L, Khaw K, Bingham S, et al. Fruit and vegetable intake andpopulation glycosylated haemoglobin levels: the EPIC-Norfolk Study.Eur J Clin Nutr 2001;55:342–8.
40. Coyne T, Ibiebele TI, McNaughton S, et al. Evaluation of brief dietaryquestions to estimate vegetable and fruit consumption— using serumcarotenoids and red cell folate. Public Health Nutr 2005;8:298 –308.
41. Wild S, Roglic G, Green A, Sicree R, King H. Global prevalence of
diabetes: estimates for the year 2000 and projections for 2030. DiabetesCare 2004;27:1047–53.
42. Tuomilehto J, Lindstrom J, Eriksson J, et al. Prevention of type 2 diabetesmellitus by changes in lifestyle among subjects with impaired glucosetolerance. N Engl J Med 2001;344:1343–50.
43. Diabetes Prevention Program Research Group. Reduction in the inci-dence of type 2 diabetes with lifestyle intervention or metformin. N EnglJ Med 2002;346:393–403.
DIABETES AND SERUM CAROTENOIDS 693
Adherence to the Mediterranean diet is associated with totalantioxidant capacity in healthy adults: the ATTICA study1–3
Christos Pitsavos, Demosthenes B Panagiotakos, Natalia Tzima, Christina Chrysohoou, Manolis Economou,Antonis Zampelas, and Christodoulos Stefanadis
ABSTRACTBackground: Greater adherence to the Mediterranean diet has beenassociated with a lower incidence of cardiovascular disease andcancer.Objective: We studied the effect of the Mediterranean diet on totalantioxidant capacity (TAC) in 3042 participants who had no clinicalevidence of cardiovascular disease.Design: During 2001–2002, a random sample of 1514 men and 1528women aged 18–89 y from the Attica area of Greece was selected.TAC was measured with an immune-diagnostic assay. Food con-sumption was evaluated with a validated food-frequency question-naire, and adherence to the Mediterranean diet was assessed on thebasis of a diet score that incorporated the inherent characteristics ofthis diet.Results: TAC was positively correlated with diet score. The partic-ipants in the highest tertile of the diet score had, on average, 11%higher TAC levels than did the participants in the lowest tertile, evenafter adjustment for relevant confounders (P � 0.01). On the otherhand, the participants in the highest tertile of the diet score had, onaverage, 19% lower oxidized LDL-cholesterol concentrations thandid the participants in the lowest tertile (P � 0.01). An additionalanalysis showed that TAC was positively correlated with the con-sumption of olive oil (� � 0.54, P � 0.002) and of fruit and vege-tables (� � 0.34 and � � 0.31, respectively; P � 0.001 for both),whereas it was inversely associated with the consumption of redmeat (� � �0.35, P � 0.02).Conclusion: Greater adherence to the Mediterranean diet is associ-ated with elevated TAC levels and low oxidized LDL-cholesterolconcentrations, which may explain the beneficial role of this diet onthe cardiovascular system. Am J Clin Nutr 2005;82:694–9.
KEY WORDS Mediterranean diet, antioxidant capacity, oxi-dized LDL cholesterol, cardiovascular disease
INTRODUCTION
Several observational studies and large-scale clinical trialshave provided scientific evidence that diets rich in fruit, vegeta-bles, legumes, whole grains, fish, and low-fat dairy products areassociated with a lowered incidence of various chronic diseases(1, 2). The dietary pattern that was found in the olive growingareas of the Mediterranean region (such as Greece, Spain, Italy,and France) in the late 1950s and early 1960s encompasses thesedietary characteristics and has been associated with a loweredincidence of cardiovascular diseases, metabolic disorders, andseveral types of cancer (3–10). Many investigators have already
underlined the beneficial role of this dietary pattern on lipidmetabolism, blood pressure levels (1, 6, 7), and body mass index(6, 8), as well as on inflammation and coagulation processes (9).
The determination of antioxidative capacity is now considereda tool in the medical diagnosis and treatment of several diseases,including cardiovascular disease, cancer, diabetes mellitus, andaging (11). Total antioxidant capacity (TAC) considers the cu-mulative action of all antioxidants that are present in plasma andbody fluids and provides an integrated measurement rather thanthe simple sum of measurable antioxidants. A wide range ofevidence indicates the importance of TAC in plasma and tissues,of its modification during the development of oxidative stress,and of its feasibility as a tool for investigating the associationbetween diet and oxidative stress (12). In addition, the oxidativeconversion of LDL cholesterol to oxidized LDL cholesterol isnow considered to be a key event in the initiation and accelerationof the development of the early atherosclerotic lesion, the fattystreak. Diet seems to play a fundamental role in LDL-cholesteroloxidation (13–15). In particular, high dietary intakes of�-carotene and of vitamins C and E and intakes of phenoliccompounds in red wine (16) have been associated in some studieswith low concentrations of oxidized LDL cholesterol. However,in most of these studies the approach has been to assess singlenutrients or food items instead of dietary patterns. Recently,Martinez-Gonzalez and Estruch (17) underlined the need forrandomized trials that use a whole-diet approach and not a simpleantioxidant supplement to evaluate the role of the Mediterraneandietary pattern in human health. Moreover, in a recent reviewarticle, Martinez-Gonzalez and Sanchez-Villegas (5) underlinedthat not all components of the Mediterranean diet are protective,or at least they may not provide equal levels of protection. Thus,because food items and nutrients could have a synergistic andantagonistic effect on health outcome, the study of overall dietarypatterns and not single nutrients has been suggested. In a recent
1 From the First Cardiology Clinic, School of Medicine, University ofAthens, Athens, Greece (CP, CC, ME, and CS), and the Department ofNutrition and Dietetics, Harokopio University, Athens, Greece (DBP, NT,and AZ).
2 The ATTICA study is supported by research grants from the HellenicCardiological Society (HCS2002).
3 Reprints not available. Address correspondence to DB Panagiotakos, 46Paleon Polemiston Street, 166 74, Attica, Greece. E-mail: [email protected].
Received March 8, 2005.Accepted for publication June 9, 2005.
694 Am J Clin Nutr 2005;82:694–9. Printed in USA. © 2005 American Society for Clinical Nutrition
editorial, Trichopoulos and Lagiou (3) suggested that the eval-uation of whole dietary patterns, and consequently the use of dietscores, seemed attractive because whole dietary patterns capturethe extremes of dietary habits, preempt nutritional confounding,capture possible effect modifications between nutritional vari-ables with the use of diet scores, and tend not to be biased.
To the best of our knowledge, the influence of the Mediterra-nean dietary pattern on the TAC of the human body has rarelybeen investigated. Because the Mediterranean diet has been sug-gested to protect against the development and progression ofcardiovascular disease, we sought to evaluate whether this rela-tion could be explained, at least in part, by its effect on the TACof apparently healthy men and women.
SUBJECTS AND METHODS
The ATTICA epidemiologic study (18) was carried out in theprovince of Attica (an area that is 78% urban and 22% rural) fromMay 2001 to December 2002. During this time, 4056 inhabitantsfrom Attica were randomly selected to enroll in the study. How-ever, only 3042 of them agreed to participate (75% participationrate). Trained personnel (cardiologists, general practitioners, di-etitians, and nurses) used standard questionnaires to interview allparticipants and evaluate their lifestyle habits and various socio-demographic, clinical, and biological characteristics. Five per-cent of men and 3% of women were excluded from the studybecause they had a history of cardiovascular disease, other ath-erosclerotic disease, or chronic viral infections, which was as-certained from their medical records. Moreover, the participantswho were included in the study did not have a cold or the flu,acute respiratory infections, or dental problems and had not un-dergone any type of surgery in the weeks before the beginning ofthe study.
A power analysis showed that the number of enrolled partic-ipants was adequate to evaluate 2-sided standardized differencesof �0.5 between diet subgroups and the investigated biochem-ical variables and could achieve statistical power �0.90 at the 5%probability level (P value). The study was approved by the Med-ical Research Ethics Committee of our Institution and was car-ried out in accordance with the Declaration of Helsinki (1983) ofthe World Medical Association.
Dietary assessment
Usual dietary intake of the participants over the year precedingenrollment was assessed with the use of a validated, semiquan-titative food-frequency questionnaire, which included 156 foodsand beverages that are commonly consumed in Greece (19).First, we asked all participants to report the daily or weeklyaverage intake of several food items that they consumed. Then,the frequency of consumption was approximately quantified interms of the number of times per month this food was consumed.Thus, daily consumption was multiplied by 30 and weekly con-sumption was multiplied by 4; a value of 0 was assigned to fooditems that were rarely or never consumed. Consumption of var-ious alcoholic beverages was measured with a unit of one drinkequivalent to a 100-mL glass of wine with a 12-g ethanol con-centration. A dietary pyramid was developed a few years ago todescribe the Mediterranean dietary pattern (20). This patternconsists of the following: 1) daily consumption of nonrefinedcereals and products (whole-grain bread, pasta, brown rice, etc),fruit (4-6 servings/d), vegetables (2–3 servings/d), olive oil (as
the main added lipid), and nonfat or low-fat dairy products (1–2servings/d); 2) weekly consumption of fish, poultry, potatoes,olives, and nuts (4–6 servings/wk for each) and of eggs andsweets (1–3 servings/wk); and 3) monthly consumption of redmeat and meat products (4–5 servings/mo). The Mediterraneandiet is also characterized by moderate consumption of wine (1–2glasses of wine/d), moderate consumption of fat, and a high ratio(�2) of monounsaturated to saturated fat. On the basis of food-composition tables, we also calculated the total energy intake (inkcal/d) of the participants.
The diet score
We calculated a special diet score for each participant accord-ing to the previous dietary pattern and the reported monthlyfrequency consumption of these food groups that assessed ad-herence to the Mediterranean diet. In particular, for the consump-tion of items presumed to be close to this pattern (ie, those that aresuggested on a daily basis or �4 servings/wk: nonrefined cereals,fruit, vegetables, potatoes, legumes, olive oil, and fish), we as-signed a score of 0 when a participant reported no consumption,a score of 1 when a participant reported consumption of 1–4times/mo, a score of 2 for 5–8 times/mo, a score of 3 for 9–12times/mo, a score of 4 for 13–18 times/mo, and a score of 5 for�18 times/mo. On the other hand, for the consumption of foodspresumed to not be part of this dietary pattern (ie, meat and meatproducts, poultry, and high-fat dairy products), we assigned theopposite scores (ie, a score of 0 when a participant reportedalmost daily consumption of the food to a score of 5 for rare or noconsumption). We did not use a monotonic function for alcoholconsumption, but we assigned a score of 5 for consumption of �3glasses of wine/d, a score of 0 for consumption of �7 glasses ofwine/d, and scores of 1, 2, 3, and 4 for consumption of 3, 4–5, 6,and 7 glasses of wine/d, respectively. Thus, 11 components wereused and a total score was then calculated (score range: 0-55).Higher values of this diet score indicate a greater adherence to theMediterranean diet, whereas lower values indicate adherence toa westernized diet. We also calculated the tertiles of this score.
Sociodemographic and lifestyle variables
We recorded both the mean annual income during the past 3 yand the educational level of the participants (in years of schoolcompleted) as proxies of social status. Current smokers weredefined as those who smoked �1 cigarette/d, former smokerswere defined as those participants who had stopped smoking for�1 y, and the rest of the participants were defined as nonsmokers.Occasional smokers (�7 cigarettes/wk) were recorded and com-bined with current smokers because of their small sample size.For a more accurate evaluation of smoking habits we calculatedthe pack-years of smoking (cigarette packs/d � years of smok-ing). To take into account various types of cigarettes consumed(ie, light or heavy), we used a unit of 1 cigarette with a 0.8-mgnicotine content for measurements. For the ascertainment ofphysical activity status, we developed an index of weekly energyexpenditure using frequency (times/wk), duration (in min/time),and intensity of sports or other habits related to physical activity.Intensity was gradated in qualitative terms, such as light (ex-pended calories: �4 kcal/min; ie, walking slowly, stationarycycling, light stretching, etc), moderate (expended calories: 4–7kcal/min; ie, walking briskly, cycling outdoors, swimming withmoderate effort, etc), and high (expended calories: �7 kcal/min;
MEDITERRANEAN DIET AND TOTAL ANTIOXIDANT CAPACITY 695
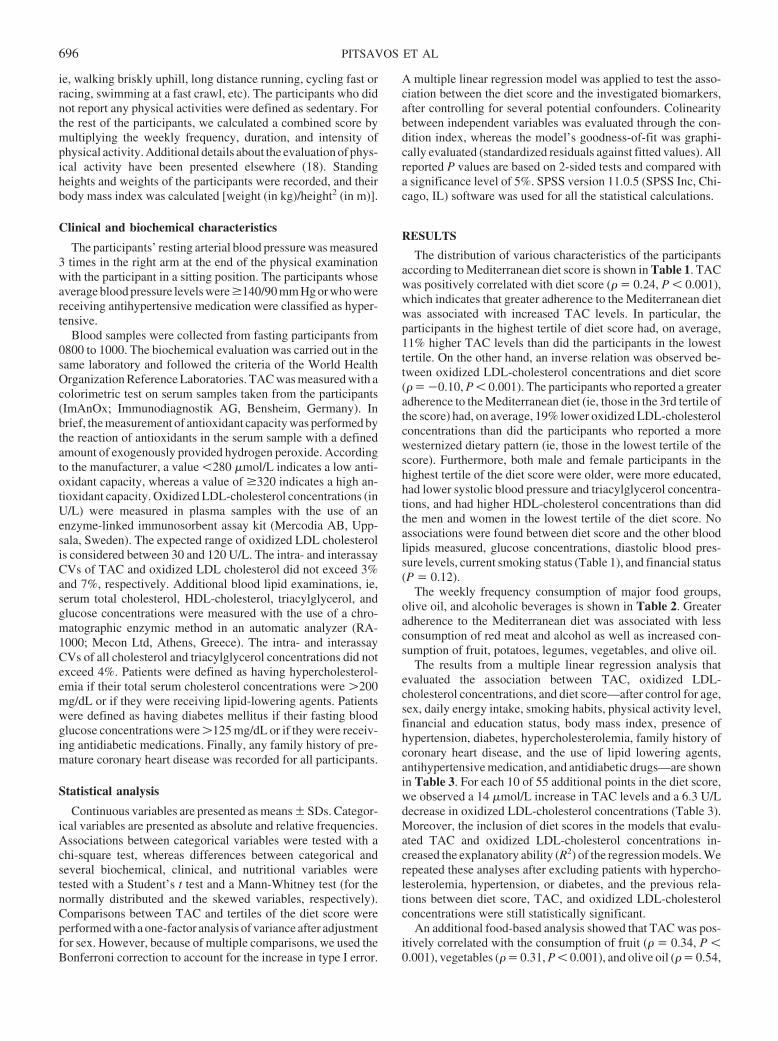
ie, walking briskly uphill, long distance running, cycling fast orracing, swimming at a fast crawl, etc). The participants who didnot report any physical activities were defined as sedentary. Forthe rest of the participants, we calculated a combined score bymultiplying the weekly frequency, duration, and intensity ofphysical activity. Additional details about the evaluation of phys-ical activity have been presented elsewhere (18). Standingheights and weights of the participants were recorded, and theirbody mass index was calculated [weight (in kg)/height2 (in m)].
Clinical and biochemical characteristics
The participants’ resting arterial blood pressure was measured3 times in the right arm at the end of the physical examinationwith the participant in a sitting position. The participants whoseaverage blood pressure levels were �140/90 mm Hg or who werereceiving antihypertensive medication were classified as hyper-tensive.
Blood samples were collected from fasting participants from0800 to 1000. The biochemical evaluation was carried out in thesame laboratory and followed the criteria of the World HealthOrganization Reference Laboratories. TAC was measured with acolorimetric test on serum samples taken from the participants(ImAnOx; Immunodiagnostik AG, Bensheim, Germany). Inbrief, the measurement of antioxidant capacity was performed bythe reaction of antioxidants in the serum sample with a definedamount of exogenously provided hydrogen peroxide. Accordingto the manufacturer, a value �280 �mol/L indicates a low anti-oxidant capacity, whereas a value of �320 indicates a high an-tioxidant capacity. Oxidized LDL-cholesterol concentrations (inU/L) were measured in plasma samples with the use of anenzyme-linked immunosorbent assay kit (Mercodia AB, Upp-sala, Sweden). The expected range of oxidized LDL cholesterolis considered between 30 and 120 U/L. The intra- and interassayCVs of TAC and oxidized LDL cholesterol did not exceed 3%and 7%, respectively. Additional blood lipid examinations, ie,serum total cholesterol, HDL-cholesterol, triacylglycerol, andglucose concentrations were measured with the use of a chro-matographic enzymic method in an automatic analyzer (RA-1000; Mecon Ltd, Athens, Greece). The intra- and interassayCVs of all cholesterol and triacylglycerol concentrations did notexceed 4%. Patients were defined as having hypercholesterol-emia if their total serum cholesterol concentrations were �200mg/dL or if they were receiving lipid-lowering agents. Patientswere defined as having diabetes mellitus if their fasting bloodglucose concentrations were �125 mg/dL or if they were receiv-ing antidiabetic medications. Finally, any family history of pre-mature coronary heart disease was recorded for all participants.
Statistical analysis
Continuous variables are presented as means � SDs. Categor-ical variables are presented as absolute and relative frequencies.Associations between categorical variables were tested with achi-square test, whereas differences between categorical andseveral biochemical, clinical, and nutritional variables weretested with a Student’s t test and a Mann-Whitney test (for thenormally distributed and the skewed variables, respectively).Comparisons between TAC and tertiles of the diet score wereperformed with a one-factor analysis of variance after adjustmentfor sex. However, because of multiple comparisons, we used theBonferroni correction to account for the increase in type I error.
A multiple linear regression model was applied to test the asso-ciation between the diet score and the investigated biomarkers,after controlling for several potential confounders. Colinearitybetween independent variables was evaluated through the con-dition index, whereas the model’s goodness-of-fit was graphi-cally evaluated (standardized residuals against fitted values). Allreported P values are based on 2-sided tests and compared witha significance level of 5%. SPSS version 11.0.5 (SPSS Inc, Chi-cago, IL) software was used for all the statistical calculations.
RESULTS
The distribution of various characteristics of the participantsaccording to Mediterranean diet score is shown in Table 1. TACwas positively correlated with diet score (� � 0.24, P � 0.001),which indicates that greater adherence to the Mediterranean dietwas associated with increased TAC levels. In particular, theparticipants in the highest tertile of diet score had, on average,11% higher TAC levels than did the participants in the lowesttertile. On the other hand, an inverse relation was observed be-tween oxidized LDL-cholesterol concentrations and diet score(� � �0.10, P � 0.001). The participants who reported a greateradherence to the Mediterranean diet (ie, those in the 3rd tertile ofthe score) had, on average, 19% lower oxidized LDL-cholesterolconcentrations than did the participants who reported a morewesternized dietary pattern (ie, those in the lowest tertile of thescore). Furthermore, both male and female participants in thehighest tertile of the diet score were older, were more educated,had lower systolic blood pressure and triacylglycerol concentra-tions, and had higher HDL-cholesterol concentrations than didthe men and women in the lowest tertile of the diet score. Noassociations were found between diet score and the other bloodlipids measured, glucose concentrations, diastolic blood pres-sure levels, current smoking status (Table 1), and financial status(P � 0.12).
The weekly frequency consumption of major food groups,olive oil, and alcoholic beverages is shown in Table 2. Greateradherence to the Mediterranean diet was associated with lessconsumption of red meat and alcohol as well as increased con-sumption of fruit, potatoes, legumes, vegetables, and olive oil.
The results from a multiple linear regression analysis thatevaluated the association between TAC, oxidized LDL-cholesterol concentrations, and diet score—after control for age,sex, daily energy intake, smoking habits, physical activity level,financial and education status, body mass index, presence ofhypertension, diabetes, hypercholesterolemia, family history ofcoronary heart disease, and the use of lipid lowering agents,antihypertensive medication, and antidiabetic drugs—are shownin Table 3. For each 10 of 55 additional points in the diet score,we observed a 14 �mol/L increase in TAC levels and a 6.3 U/Ldecrease in oxidized LDL-cholesterol concentrations (Table 3).Moreover, the inclusion of diet scores in the models that evalu-ated TAC and oxidized LDL-cholesterol concentrations in-creased the explanatory ability (R2) of the regression models. Werepeated these analyses after excluding patients with hypercho-lesterolemia, hypertension, or diabetes, and the previous rela-tions between diet score, TAC, and oxidized LDL-cholesterolconcentrations were still statistically significant.
An additional food-based analysis showed that TAC was pos-itively correlated with the consumption of fruit (� � 0.34, P �0.001), vegetables (� � 0.31, P � 0.001), and olive oil (� � 0.54,
696 PITSAVOS ET AL
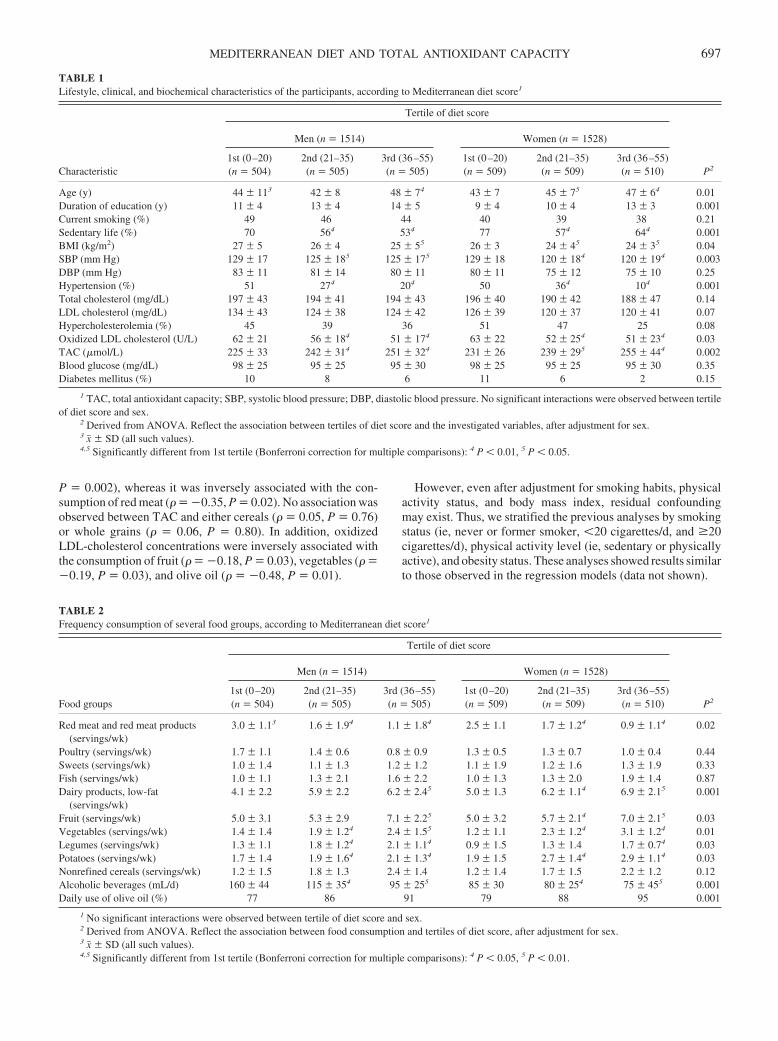
P � 0.002), whereas it was inversely associated with the con-sumption of red meat (� � �0.35, P � 0.02). No association wasobserved between TAC and either cereals (� � 0.05, P � 0.76)or whole grains (� � 0.06, P � 0.80). In addition, oxidizedLDL-cholesterol concentrations were inversely associated withthe consumption of fruit (� � �0.18, P � 0.03), vegetables (� ��0.19, P � 0.03), and olive oil (� � �0.48, P � 0.01).
However, even after adjustment for smoking habits, physicalactivity status, and body mass index, residual confoundingmay exist. Thus, we stratified the previous analyses by smokingstatus (ie, never or former smoker, �20 cigarettes/d, and �20cigarettes/d), physical activity level (ie, sedentary or physicallyactive), and obesity status. These analyses showed results similarto those observed in the regression models (data not shown).
TABLE 1Lifestyle, clinical, and biochemical characteristics of the participants, according to Mediterranean diet score1
Characteristic
Tertile of diet score
P2
Men (n � 1514) Women (n � 1528)
1st (0–20)(n � 504)
2nd (21–35)(n � 505)
3rd (36–55)(n � 505)
1st (0–20)(n � 509)
2nd (21–35)(n � 509)
3rd (36–55)(n � 510)
Age (y) 44 � 113 42 � 8 48 � 74 43 � 7 45 � 75 47 � 64 0.01Duration of education (y) 11 � 4 13 � 4 14 � 5 9 � 4 10 � 4 13 � 3 0.001Current smoking (%) 49 46 44 40 39 38 0.21Sedentary life (%) 70 564 534 77 574 644 0.001BMI (kg/m2) 27 � 5 26 � 4 25 � 55 26 � 3 24 � 45 24 � 35 0.04SBP (mm Hg) 129 � 17 125 � 185 125 � 175 129 � 18 120 � 184 120 � 194 0.003DBP (mm Hg) 83 � 11 81 � 14 80 � 11 80 � 11 75 � 12 75 � 10 0.25Hypertension (%) 51 274 204 50 364 104 0.001Total cholesterol (mg/dL) 197 � 43 194 � 41 194 � 43 196 � 40 190 � 42 188 � 47 0.14LDL cholesterol (mg/dL) 134 � 43 124 � 38 124 � 42 126 � 39 120 � 37 120 � 41 0.07Hypercholesterolemia (%) 45 39 36 51 47 25 0.08Oxidized LDL cholesterol (U/L) 62 � 21 56 � 184 51 � 174 63 � 22 52 � 254 51 � 234 0.03TAC (�mol/L) 225 � 33 242 � 314 251 � 324 231 � 26 239 � 295 255 � 444 0.002Blood glucose (mg/dL) 98 � 25 95 � 25 95 � 30 98 � 25 95 � 25 95 � 30 0.35Diabetes mellitus (%) 10 8 6 11 6 2 0.15
1 TAC, total antioxidant capacity; SBP, systolic blood pressure; DBP, diastolic blood pressure. No significant interactions were observed between tertileof diet score and sex.
2 Derived from ANOVA. Reflect the association between tertiles of diet score and the investigated variables, after adjustment for sex.3 x� � SD (all such values).4,5 Significantly different from 1st tertile (Bonferroni correction for multiple comparisons): 4 P � 0.01, 5 P � 0.05.
TABLE 2Frequency consumption of several food groups, according to Mediterranean diet score1
Food groups
Tertile of diet score
P2
Men (n � 1514) Women (n � 1528)
1st (0–20)(n � 504)
2nd (21–35)(n � 505)
3rd (36–55)(n � 505)
1st (0–20)(n � 509)
2nd (21–35)(n � 509)
3rd (36–55)(n � 510)
Red meat and red meat products(servings/wk)
3.0 � 1.13 1.6 � 1.94 1.1 � 1.84 2.5 � 1.1 1.7 � 1.24 0.9 � 1.14 0.02
Poultry (servings/wk) 1.7 � 1.1 1.4 � 0.6 0.8 � 0.9 1.3 � 0.5 1.3 � 0.7 1.0 � 0.4 0.44Sweets (servings/wk) 1.0 � 1.4 1.1 � 1.3 1.2 � 1.2 1.1 � 1.9 1.2 � 1.6 1.3 � 1.9 0.33Fish (servings/wk) 1.0 � 1.1 1.3 � 2.1 1.6 � 2.2 1.0 � 1.3 1.3 � 2.0 1.9 � 1.4 0.87Dairy products, low-fat
(servings/wk)4.1 � 2.2 5.9 � 2.2 6.2 � 2.45 5.0 � 1.3 6.2 � 1.14 6.9 � 2.15 0.001
Fruit (servings/wk) 5.0 � 3.1 5.3 � 2.9 7.1 � 2.25 5.0 � 3.2 5.7 � 2.14 7.0 � 2.15 0.03Vegetables (servings/wk) 1.4 � 1.4 1.9 � 1.24 2.4 � 1.55 1.2 � 1.1 2.3 � 1.24 3.1 � 1.24 0.01Legumes (servings/wk) 1.3 � 1.1 1.8 � 1.24 2.1 � 1.14 0.9 � 1.5 1.3 � 1.4 1.7 � 0.74 0.03Potatoes (servings/wk) 1.7 � 1.4 1.9 � 1.64 2.1 � 1.34 1.9 � 1.5 2.7 � 1.44 2.9 � 1.14 0.03Nonrefined cereals (servings/wk) 1.2 � 1.5 1.8 � 1.3 2.4 � 1.4 1.2 � 1.4 1.7 � 1.5 2.2 � 1.2 0.12Alcoholic beverages (mL/d) 160 � 44 115 � 354 95 � 255 85 � 30 80 � 254 75 � 455 0.001Daily use of olive oil (%) 77 86 91 79 88 95 0.001
1 No significant interactions were observed between tertile of diet score and sex.2 Derived from ANOVA. Reflect the association between food consumption and tertiles of diet score, after adjustment for sex.3 x� � SD (all such values).4,5 Significantly different from 1st tertile (Bonferroni correction for multiple comparisons): 4 P � 0.05, 5 P � 0.01.
MEDITERRANEAN DIET AND TOTAL ANTIOXIDANT CAPACITY 697
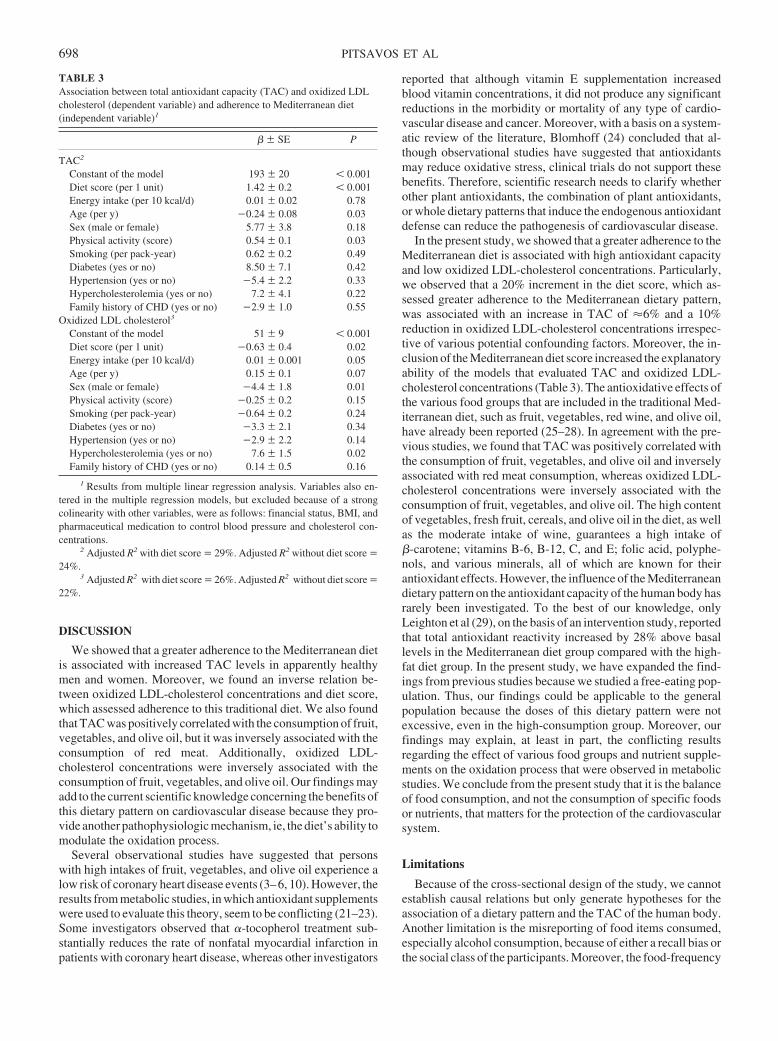
DISCUSSION
We showed that a greater adherence to the Mediterranean dietis associated with increased TAC levels in apparently healthymen and women. Moreover, we found an inverse relation be-tween oxidized LDL-cholesterol concentrations and diet score,which assessed adherence to this traditional diet. We also foundthat TAC was positively correlated with the consumption of fruit,vegetables, and olive oil, but it was inversely associated with theconsumption of red meat. Additionally, oxidized LDL-cholesterol concentrations were inversely associated with theconsumption of fruit, vegetables, and olive oil. Our findings mayadd to the current scientific knowledge concerning the benefits ofthis dietary pattern on cardiovascular disease because they pro-vide another pathophysiologic mechanism, ie, the diet’s ability tomodulate the oxidation process.
Several observational studies have suggested that personswith high intakes of fruit, vegetables, and olive oil experience alow risk of coronary heart disease events (3–6, 10). However, theresults from metabolic studies, in which antioxidant supplementswere used to evaluate this theory, seem to be conflicting (21–23).Some investigators observed that �-tocopherol treatment sub-stantially reduces the rate of nonfatal myocardial infarction inpatients with coronary heart disease, whereas other investigators
reported that although vitamin E supplementation increasedblood vitamin concentrations, it did not produce any significantreductions in the morbidity or mortality of any type of cardio-vascular disease and cancer. Moreover, with a basis on a system-atic review of the literature, Blomhoff (24) concluded that al-though observational studies have suggested that antioxidantsmay reduce oxidative stress, clinical trials do not support thesebenefits. Therefore, scientific research needs to clarify whetherother plant antioxidants, the combination of plant antioxidants,or whole dietary patterns that induce the endogenous antioxidantdefense can reduce the pathogenesis of cardiovascular disease.
In the present study, we showed that a greater adherence to theMediterranean diet is associated with high antioxidant capacityand low oxidized LDL-cholesterol concentrations. Particularly,we observed that a 20% increment in the diet score, which as-sessed greater adherence to the Mediterranean dietary pattern,was associated with an increase in TAC of �6% and a 10%reduction in oxidized LDL-cholesterol concentrations irrespec-tive of various potential confounding factors. Moreover, the in-clusion of the Mediterranean diet score increased the explanatoryability of the models that evaluated TAC and oxidized LDL-cholesterol concentrations (Table 3). The antioxidative effects ofthe various food groups that are included in the traditional Med-iterranean diet, such as fruit, vegetables, red wine, and olive oil,have already been reported (25–28). In agreement with the pre-vious studies, we found that TAC was positively correlated withthe consumption of fruit, vegetables, and olive oil and inverselyassociated with red meat consumption, whereas oxidized LDL-cholesterol concentrations were inversely associated with theconsumption of fruit, vegetables, and olive oil. The high contentof vegetables, fresh fruit, cereals, and olive oil in the diet, as wellas the moderate intake of wine, guarantees a high intake of�-carotene; vitamins B-6, B-12, C, and E; folic acid, polyphe-nols, and various minerals, all of which are known for theirantioxidant effects. However, the influence of the Mediterraneandietary pattern on the antioxidant capacity of the human body hasrarely been investigated. To the best of our knowledge, onlyLeighton et al (29), on the basis of an intervention study, reportedthat total antioxidant reactivity increased by 28% above basallevels in the Mediterranean diet group compared with the high-fat diet group. In the present study, we have expanded the find-ings from previous studies because we studied a free-eating pop-ulation. Thus, our findings could be applicable to the generalpopulation because the doses of this dietary pattern were notexcessive, even in the high-consumption group. Moreover, ourfindings may explain, at least in part, the conflicting resultsregarding the effect of various food groups and nutrient supple-ments on the oxidation process that were observed in metabolicstudies. We conclude from the present study that it is the balanceof food consumption, and not the consumption of specific foodsor nutrients, that matters for the protection of the cardiovascularsystem.
Limitations
Because of the cross-sectional design of the study, we cannotestablish causal relations but only generate hypotheses for theassociation of a dietary pattern and the TAC of the human body.Another limitation is the misreporting of food items consumed,especially alcohol consumption, because of either a recall bias orthe social class of the participants. Moreover, the food-frequency
TABLE 3Association between total antioxidant capacity (TAC) and oxidized LDLcholesterol (dependent variable) and adherence to Mediterranean diet(independent variable)1
� � SE P
TAC2
Constant of the model 193 � 20 � 0.001Diet score (per 1 unit) 1.42 � 0.2 � 0.001Energy intake (per 10 kcal/d) 0.01 � 0.02 0.78Age (per y) �0.24 � 0.08 0.03Sex (male or female) 5.77 � 3.8 0.18Physical activity (score) 0.54 � 0.1 0.03Smoking (per pack-year) 0.62 � 0.2 0.49Diabetes (yes or no) 8.50 � 7.1 0.42Hypertension (yes or no) �5.4 � 2.2 0.33Hypercholesterolemia (yes or no) 7.2 � 4.1 0.22Family history of CHD (yes or no) �2.9 � 1.0 0.55
Oxidized LDL cholesterol3
Constant of the model 51 � 9 � 0.001Diet score (per 1 unit) �0.63 � 0.4 0.02Energy intake (per 10 kcal/d) 0.01 � 0.001 0.05Age (per y) 0.15 � 0.1 0.07Sex (male or female) �4.4 � 1.8 0.01Physical activity (score) �0.25 � 0.2 0.15Smoking (per pack-year) �0.64 � 0.2 0.24Diabetes (yes or no) �3.3 � 2.1 0.34Hypertension (yes or no) �2.9 � 2.2 0.14Hypercholesterolemia (yes or no) 7.6 � 1.5 0.02Family history of CHD (yes or no) 0.14 � 0.5 0.16
1 Results from multiple linear regression analysis. Variables also en-tered in the multiple regression models, but excluded because of a strongcolinearity with other variables, were as follows: financial status, BMI, andpharmaceutical medication to control blood pressure and cholesterol con-centrations.
2 Adjusted R2 with diet score � 29%. Adjusted R2 without diet score �24%.
3 Adjusted R2 with diet score � 26%. Adjusted R2 without diet score �22%.
698 PITSAVOS ET AL
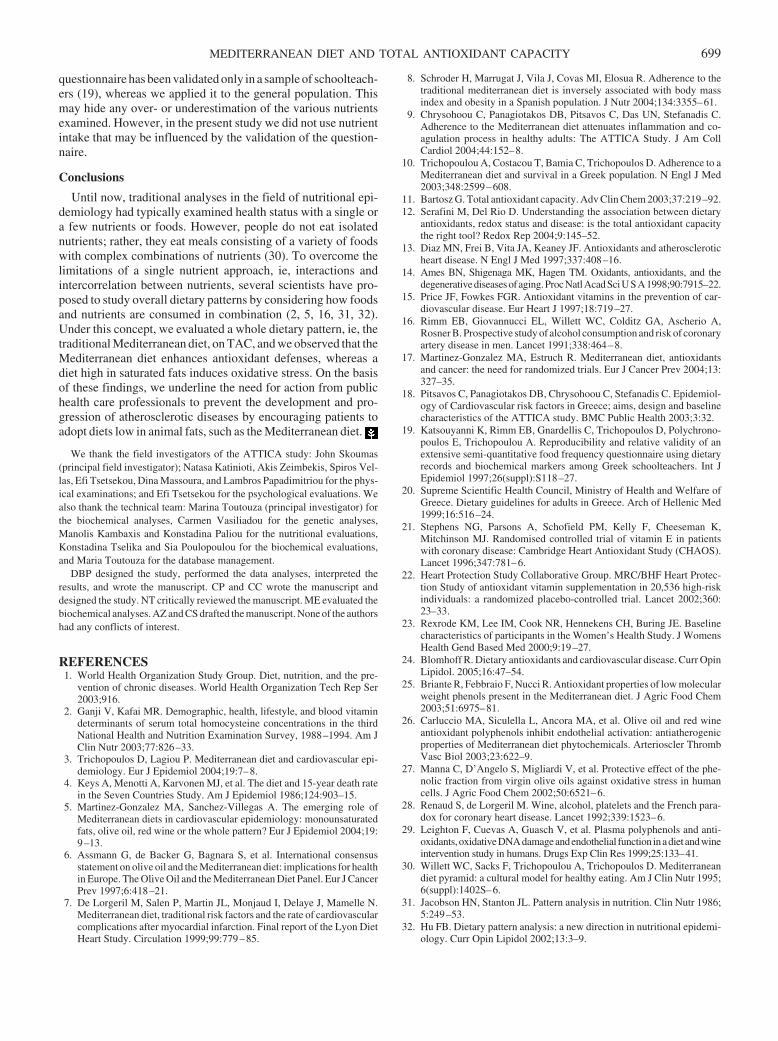
questionnaire has been validated only in a sample of schoolteach-ers (19), whereas we applied it to the general population. Thismay hide any over- or underestimation of the various nutrientsexamined. However, in the present study we did not use nutrientintake that may be influenced by the validation of the question-naire.
Conclusions
Until now, traditional analyses in the field of nutritional epi-demiology had typically examined health status with a single ora few nutrients or foods. However, people do not eat isolatednutrients; rather, they eat meals consisting of a variety of foodswith complex combinations of nutrients (30). To overcome thelimitations of a single nutrient approach, ie, interactions andintercorrelation between nutrients, several scientists have pro-posed to study overall dietary patterns by considering how foodsand nutrients are consumed in combination (2, 5, 16, 31, 32).Under this concept, we evaluated a whole dietary pattern, ie, thetraditional Mediterranean diet, on TAC, and we observed that theMediterranean diet enhances antioxidant defenses, whereas adiet high in saturated fats induces oxidative stress. On the basisof these findings, we underline the need for action from publichealth care professionals to prevent the development and pro-gression of atherosclerotic diseases by encouraging patients toadopt diets low in animal fats, such as the Mediterranean diet.
We thank the field investigators of the ATTICA study: John Skoumas(principal field investigator); Natasa Katinioti, Akis Zeimbekis, Spiros Vel-las, Efi Tsetsekou, Dina Massoura, and Lambros Papadimitriou for the phys-ical examinations; and Efi Tsetsekou for the psychological evaluations. Wealso thank the technical team: Marina Toutouza (principal investigator) forthe biochemical analyses, Carmen Vasiliadou for the genetic analyses,Manolis Kambaxis and Konstadina Paliou for the nutritional evaluations,Konstadina Tselika and Sia Poulopoulou for the biochemical evaluations,and Maria Toutouza for the database management.
DBP designed the study, performed the data analyses, interpreted theresults, and wrote the manuscript. CP and CC wrote the manuscript anddesigned the study. NT critically reviewed the manuscript. ME evaluated thebiochemical analyses. AZ and CS drafted the manuscript. None of the authorshad any conflicts of interest.
REFERENCES1. World Health Organization Study Group. Diet, nutrition, and the pre-
vention of chronic diseases. World Health Organization Tech Rep Ser2003;916.
2. Ganji V, Kafai MR. Demographic, health, lifestyle, and blood vitamindeterminants of serum total homocysteine concentrations in the thirdNational Health and Nutrition Examination Survey, 1988–1994. Am JClin Nutr 2003;77:826–33.
3. Trichopoulos D, Lagiou P. Mediterranean diet and cardiovascular epi-demiology. Eur J Epidemiol 2004;19:7–8.
4. Keys A, Menotti A, Karvonen MJ, et al. The diet and 15-year death ratein the Seven Countries Study. Am J Epidemiol 1986;124:903–15.
5. Martinez-Gonzalez MA, Sanchez-Villegas A. The emerging role ofMediterranean diets in cardiovascular epidemiology: monounsaturatedfats, olive oil, red wine or the whole pattern? Eur J Epidemiol 2004;19:9–13.
6. Assmann G, de Backer G, Bagnara S, et al. International consensusstatement on olive oil and the Mediterranean diet: implications for healthin Europe. The Olive Oil and the Mediterranean Diet Panel. Eur J CancerPrev 1997;6:418–21.
7. De Lorgeril M, Salen P, Martin JL, Monjaud I, Delaye J, Mamelle N.Mediterranean diet, traditional risk factors and the rate of cardiovascularcomplications after myocardial infarction. Final report of the Lyon DietHeart Study. Circulation 1999;99:779–85.
8. Schroder H, Marrugat J, Vila J, Covas MI, Elosua R. Adherence to thetraditional mediterranean diet is inversely associated with body massindex and obesity in a Spanish population. J Nutr 2004;134:3355–61.
9. Chrysohoou C, Panagiotakos DB, Pitsavos C, Das UN, Stefanadis C.Adherence to the Mediterranean diet attenuates inflammation and co-agulation process in healthy adults: The ATTICA Study. J Am CollCardiol 2004;44:152–8.
10. Trichopoulou A, Costacou T, Bamia C, Trichopoulos D. Adherence to aMediterranean diet and survival in a Greek population. N Engl J Med2003;348:2599–608.
11. Bartosz G. Total antioxidant capacity. Adv Clin Chem 2003;37:219–92.12. Serafini M, Del Rio D. Understanding the association between dietary
antioxidants, redox status and disease: is the total antioxidant capacitythe right tool? Redox Rep 2004;9:145–52.
13. Diaz MN, Frei B, Vita JA, Keaney JF. Antioxidants and atheroscleroticheart disease. N Engl J Med 1997;337:408–16.
14. Ames BN, Shigenaga MK, Hagen TM. Oxidants, antioxidants, and thedegenerativediseasesofaging.ProcNatlAcadSciUSA1998;90:7915–22.
15. Price JF, Fowkes FGR. Antioxidant vitamins in the prevention of car-diovascular disease. Eur Heart J 1997;18:719–27.
16. Rimm EB, Giovannucci EL, Willett WC, Colditz GA, Ascherio A,Rosner B. Prospective study of alcohol consumption and risk of coronaryartery disease in men. Lancet 1991;338:464–8.
17. Martinez-Gonzalez MA, Estruch R. Mediterranean diet, antioxidantsand cancer: the need for randomized trials. Eur J Cancer Prev 2004;13:327–35.
18. Pitsavos C, Panagiotakos DB, Chrysohoou C, Stefanadis C. Epidemiol-ogy of Cardiovascular risk factors in Greece; aims, design and baselinecharacteristics of the ATTICA study. BMC Public Health 2003;3:32.
19. Katsouyanni K, Rimm EB, Gnardellis C, Trichopoulos D, Polychrono-poulos E, Trichopoulou A. Reproducibility and relative validity of anextensive semi-quantitative food frequency questionnaire using dietaryrecords and biochemical markers among Greek schoolteachers. Int JEpidemiol 1997;26(suppl):S118–27.
20. Supreme Scientific Health Council, Ministry of Health and Welfare ofGreece. Dietary guidelines for adults in Greece. Arch of Hellenic Med1999;16:516–24.
21. Stephens NG, Parsons A, Schofield PM, Kelly F, Cheeseman K,Mitchinson MJ. Randomised controlled trial of vitamin E in patientswith coronary disease: Cambridge Heart Antioxidant Study (CHAOS).Lancet 1996;347:781–6.
22. Heart Protection Study Collaborative Group. MRC/BHF Heart Protec-tion Study of antioxidant vitamin supplementation in 20,536 high-riskindividuals: a randomized placebo-controlled trial. Lancet 2002;360:23–33.
23. Rexrode KM, Lee IM, Cook NR, Hennekens CH, Buring JE. Baselinecharacteristics of participants in the Women’s Health Study. J WomensHealth Gend Based Med 2000;9:19–27.
24. Blomhoff R. Dietary antioxidants and cardiovascular disease. Curr OpinLipidol. 2005;16:47–54.
25. Briante R, Febbraio F, Nucci R. Antioxidant properties of low molecularweight phenols present in the Mediterranean diet. J Agric Food Chem2003;51:6975–81.
26. Carluccio MA, Siculella L, Ancora MA, et al. Olive oil and red wineantioxidant polyphenols inhibit endothelial activation: antiatherogenicproperties of Mediterranean diet phytochemicals. Arterioscler ThrombVasc Biol 2003;23:622–9.
27. Manna C, D’Angelo S, Migliardi V, et al. Protective effect of the phe-nolic fraction from virgin olive oils against oxidative stress in humancells. J Agric Food Chem 2002;50:6521–6.
28. Renaud S, de Lorgeril M. Wine, alcohol, platelets and the French para-dox for coronary heart disease. Lancet 1992;339:1523–6.
29. Leighton F, Cuevas A, Guasch V, et al. Plasma polyphenols and anti-oxidants,oxidativeDNAdamageandendothelial function inadietandwineintervention study in humans. Drugs Exp Clin Res 1999;25:133–41.
30. Willett WC, Sacks F, Trichopoulou A, Trichopoulos D. Mediterraneandiet pyramid: a cultural model for healthy eating. Am J Clin Nutr 1995;6(suppl):1402S–6.
31. Jacobson HN, Stanton JL. Pattern analysis in nutrition. Clin Nutr 1986;5:249–53.
32. Hu FB. Dietary pattern analysis: a new direction in nutritional epidemi-ology. Curr Opin Lipidol 2002;13:3–9.
MEDITERRANEAN DIET AND TOTAL ANTIOXIDANT CAPACITY 699
Positive effects of vegetable and fruit consumption and calciumintake on bone mineral accrual in boys during growth fromchildhood to adolescence: the University of Saskatchewan PediatricBone Mineral Accrual Study1–3
Hassanali Vatanparast, Adam Baxter-Jones, Robert A Faulkner, Donald A Bailey, and Susan J Whiting
ABSTRACTBackground: Nutrition is an important modifiable factor in thedevelopment of bone mass during adolescence. Recent studies ofchildren and adolescents examined the effects of foods such as milkproducts and fruit and vegetables on bone growth; however, fewstudies included both boys and girls.Objective: The purpose was to ascertain the role of consumption ofmilk products and vegetables and fruit in the accrual of total-bodybone mineral content (TBBMC) in boys and girls from childhood tolate adolescence.Design: Seven-year longitudinal data were obtained from 85 boysand 67 girls aged 8–20 y. Biological maturity was defined by thenumber of years from the age at peak height velocity. Dietary intakewas assessed by serial 24-h recalls. Anthropometric measurementsand physical activity were assessed every 6 mo. TBBMC assessedwith dual-energy X-ray absorptiometry in the fall of each year wasthe indicator of bone mass.Results: Most boys (87.8%) met Canadian recommendations formilk product intake. Few subjects (�30%) consumed vegetables andfruit in recommended amounts. Using a multilevel modeling statis-tical approach containing important biological and environmentalfactors, we found that vegetable and fruit intakes, calcium intake,and physical activity were significant independent environmentalpredictors of TBBMC in boys but not in girls.Conclusions: In addition to adequate dietary calcium intake, appro-priate intakes of vegetables and fruit have a beneficial effect onTBBMC in boys aged 8–20 y. Underreporting of dietary intake bygirls may explain why this effect was not apparent in girls. AmJ Clin Nutr 2005;82:700–6.
KEY WORDS Milk products, vegetables and fruit, total-bodybone mineral content, adolescence, age at peak height velocity
INTRODUCTION
Nutrition is an important modifiable factor in the developmentand maintenance of bone mass. Approximately 80–90% of bonemineral content (BMC) is composed of calcium and phosphorus(1); protein is another important component of bone. Other di-etary components, such as magnesium, zinc, copper, iron, fluo-ride, and vitamins D, A, C, and K, are required for normal bonemetabolism (2). These nutrients occur together in foods, and their
intake can be detected by assessing dietary patterns and by mea-suring food group intake. We previously showed in a nonnation-ally representative study that, during adolescence, milk productswere the principal source of dietary calcium (61%), and that grainproducts (9%), vegetables and fruit (7%), meat and alternatives(2%), and other foods (21%) contributed smaller proportions (3).Food groups that contribute to calcium intake may also contrib-ute other important bone-forming nutrients; conversely, foodgroups other than those contributing calcium may be beneficialto bone growth for other reasons.
Although most studies have focused on the effect of calcium,the intake of milk products, or both on bone accrual (4–12), therole of dietary vegetables and fruit is emerging in the literature.Jones et al (13) first reported cross-sectional data that showed apositive link between the consumption of fruit and vegetablesand bone mineral density (BMD) in 10-y-old girls. Tylavsky et al(14) found, in a study of 56 girls aged 8–13 y, a positive relationof fruit and vegetable consumption with bone area and BMD.Their analysis indicated that the relation between intakes of fruitand vegetables and total-body BMD in these girls remained sig-nificant after adjustment for age, body mass index (BMI; inkg/m2), and physical activity. Recently, McGartland et al (15)examined whether usual intakes of fruit and vegetables influ-enced BMD in boys and girls aged 12 and 15 y. They found asignificantly higher heel BMD only in 12-y-old girls who con-sumed high amounts of fruit. Although more studies are needed,these preliminary data suggest a positive link between the con-sumption of fruit and vegetables and bone health in girls, as hasbeen seen in adults (16–20). No association in boys has beenreported.
The dramatic increase in bone mass during childhood andadolescence, measured as either BMC or BMD, results fromnormal growth and biological maturation (21). Change in BMCis a useful indicator of calcium retention in children. Because
1 From the College of Pharmacy and Nutrition (HV and SJW) and theCollege of Kinesiology (AB-J, RAF, and DAB), University of Saskatche-wan, Saskatoon, Canada.
2 Supported by the Canadian Institutes of Health Research.3 Address reprint requests to H Vatanparast, College of Pharmacy and
Nutrition, University of Saskatchewan, 110 Science Place, Saskatoon, SK,Canada S7N 5C9. E-mail: [email protected].
Received February 3, 2005.Accepted for publication May 18, 2005.
700 Am J Clin Nutr 2005;82:700–6. Printed in USA. © 2005 American Society for Clinical Nutrition
areal BMD can misrepresent bone mass changes in the growingskeleton, BMC is considered to be a better indicator of boneaccrual in growing children than is BMD (1). Children of thesame chronological age may differ by several years in their bi-ological maturity (22); therefore, assessment of biological ma-turity is critical to control for the effects of maturation on out-come variables in studies during adolescence. The age ofattainment of peak height velocity (PHV), a measure of somaticmaturity, is the most commonly used indicator of biologicalmaturity in longitudinal studies (23). Hence, subjects in thepresent study were aligned on a biological maturity age range (ie,the number of years from their age at PHV). The purpose of thisstudy was to ascertain the role of consumption of food groups,specifically milk products and vegetables and fruit, in the accrualof total-body BMC (TBBMC) in boys and girls from childhoodto late adolescence.
SUBJECTS AND METHODS
Study participants and design
Subjects were participants in the University of SaskatchewanPediatric Bone Mineral Accrual Study (PBMAS). PBMAS useda mixed-longitudinal study design that incorporated 8 age co-horts (aged 8–15 y at study entry). The initial phase of the studyran from 1991 to 1997, a time span during which the clusteringof the age cohorts remained the same; because the cohorts over-lapped, a developmental age range of 8–20 y was assessed. In1991, 228 boys and girls entered the study. They were selected asa population-based sample of children in Saskatoon (23). Most ofthe children were white and were attending 2 public schools in asocioeconomically middle-class area of the city. Eligible chil-dren had no history of chronic disease or chronic medication use,and they had no medical conditions, allergies, or medication useknown to influence bone metabolism or calcium balance.
Subjects and their parents provided written informed consentfor the children’s participation in the study. Ethical approval wasobtained from the University of Saskatchewan and the RoyalUniversity Hospital Advisory Committee on Ethics in HumanExperimentation.
According to the study protocol, data collection included an-thropometric and physical activity data every 6 mo, dietary data2–4 times a year in different seasons, and annual bone scans withthe use of dual-energy X-ray absorptiometry. In the current anal-ysis, 7-y longitudinal data from 85 boys and 67 girls were used.The sample represents an age range of 8 to 20 y.
Dietary analysis
Intake was assessed by serial 24-h recalls conducted both at theparticipating schools and at the hospital at the time of the bonescans. All days of the week except Friday and Saturday wereincluded. Food intake from the 24-h recalls was analyzed with theuse of NUTS nutritional assessment software (version 3.7;Quilchena Consulting Ltd, Victoria, Canada), which used the1988 Canadian Nutrient File information. This software catego-rized every food according to servings from the 1982 edition ofCanada’s Food Guide, which, with the exception of names andrecommended servings of the food groups and graphics to illus-trate the food guide, was similar to the current version of Cana-da’s Food Guide (24). For foods categorized as “other foods,” 2separate groups were used: 1) fats and oils and 2) sweets and
desserts. Use of nutrient supplements was included in nutrientintake data when supplement use was considered consistent (3).The same person coded and checked all the forms and analyzeddietary intake data according to procedures described elsewhere(25). To obtain the usual intake for the subjects, intakes of foodand nutrients from serial 24-h recalls were averaged for each yearof study.
Bone measurements
Bone measurements were obtained in the fall of each year byusing dual-energy X-ray absorptiometric (Hologic QDR 2000;Hologic, Waltham, MA) scans of the whole body, posterior-anterior lumbar spine, and proximal femur, performed by 1 of 2experienced operators across 7 y. Array mode was used for bonemineral acquisition and enhanced global scanning software (ver-sion 7.10; Hologic) was used for analysis. To minimize operator-related variability, the same person analyzed all total-body scanswith the use of analysis software (version 5.67A; Hologic).Short-term precision in vivo for TBBMC, expressed as CV (in%), was 0.60. An ion chamber survey meter (model 450p; Vic-toreen Inc, Cleveland, OH) measured entrance radiation dose.When this surface dose was corrected for body attenuation, sub-ject age, and type and volume of tissue undergoing irradiation,the effective dose equivalent was �1 mrem. TBBMC data wereused in this study (21, 24).
Anthropometric, physical activity, and maturityassessments
Height and weight were measured every 6 mo by trained studypersonnel who used the same scale and stadiometer. Subjectswore tee-shirts and shorts during measurement, and they hadremoved their shoes and jewelry. Height and weight were mea-sured twice and recorded to the nearest 0.1 cm and 0.1 kg, re-spectively.
General levels of physical activity of subjects were assessedwith the use of the Physical Activity Questionnaire for OlderChildren. Subjects rated their physical activity level during theirspare time in the previous 7 d, resulting in a rating from 1 to 5.Higher scores suggest higher levels of physical activity. Thequestionnaire was modified for high school students by omittingthe item about activity at recess.
Details about our derivation of PHV have been describedelsewhere (26, 27). In brief, a cubic spline procedure fitted acurve to each individual’s velocity data (in cm/y), and the age atPHV was extrapolated from the curve. Biological maturity wascalculated as measurement age minus age at PHV, and biologicalmaturity at age of PHV was equal to 0. Biological maturity agebefore the age at PHV is measured in negative years, and thatafter the age at PHV is measured in positive years. Subjects wereclustered into 1-y biological maturity age categories. By usingthis method, we fitted TBBMC distance curves at different foodgroup intakes by biological maturity age in boys and in girls.
Statistical analysis
Values are reported as means � SDs. Data analyses wereconducted with the use of Microsoft EXCEL software (version2000; Microsoft, Redmond, WA) and SPSS software (version11.5; SPSS Inc, Chicago, IL). GraphPad PRISM (version 4.0;GraphPad Software, San Diego, CA) was used to produce thedistance curves for TBBMC and for intakes of nutrients and food
VEGETABLE AND FRUIT INTAKE AND BONE MASS IN GROWTH 701
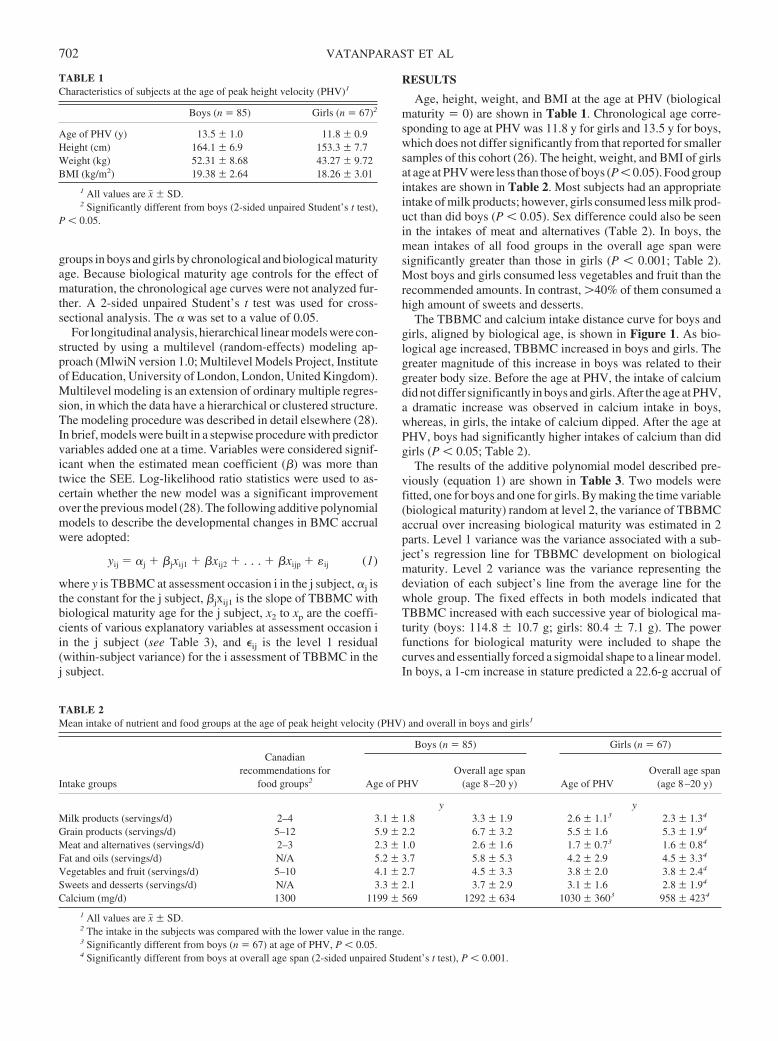
groups in boys and girls by chronological and biological maturityage. Because biological maturity age controls for the effect ofmaturation, the chronological age curves were not analyzed fur-ther. A 2-sided unpaired Student’s t test was used for cross-sectional analysis. The � was set to a value of 0.05.
For longitudinal analysis, hierarchical linear models were con-structed by using a multilevel (random-effects) modeling ap-proach (MlwiN version 1.0; Multilevel Models Project, Instituteof Education, University of London, London, United Kingdom).Multilevel modeling is an extension of ordinary multiple regres-sion, in which the data have a hierarchical or clustered structure.The modeling procedure was described in detail elsewhere (28).In brief, models were built in a stepwise procedure with predictorvariables added one at a time. Variables were considered signif-icant when the estimated mean coefficient (�) was more thantwice the SEE. Log-likelihood ratio statistics were used to as-certain whether the new model was a significant improvementover the previous model (28). The following additive polynomialmodels to describe the developmental changes in BMC accrualwere adopted:
yij � �j � �jxij1 � �xij2 � . . . � �xijp � �ij (1)
where y is TBBMC at assessment occasion i in the j subject, �j isthe constant for the j subject, �jxij1 is the slope of TBBMC withbiological maturity age for the j subject, x2 to xp are the coeffi-cients of various explanatory variables at assessment occasion iin the j subject (see Table 3), and �ij is the level 1 residual(within-subject variance) for the i assessment of TBBMC in thej subject.
RESULTS
Age, height, weight, and BMI at the age at PHV (biologicalmaturity � 0) are shown in Table 1. Chronological age corre-sponding to age at PHV was 11.8 y for girls and 13.5 y for boys,which does not differ significantly from that reported for smallersamples of this cohort (26). The height, weight, and BMI of girlsat age at PHV were less than those of boys (P � 0.05). Food groupintakes are shown in Table 2. Most subjects had an appropriateintake of milk products; however, girls consumed less milk prod-uct than did boys (P � 0.05). Sex difference could also be seenin the intakes of meat and alternatives (Table 2). In boys, themean intakes of all food groups in the overall age span weresignificantly greater than those in girls (P � 0.001; Table 2).Most boys and girls consumed less vegetables and fruit than therecommended amounts. In contrast, �40% of them consumed ahigh amount of sweets and desserts.
The TBBMC and calcium intake distance curve for boys andgirls, aligned by biological age, is shown in Figure 1. As bio-logical age increased, TBBMC increased in boys and girls. Thegreater magnitude of this increase in boys was related to theirgreater body size. Before the age at PHV, the intake of calciumdid not differ significantly in boys and girls. After the age at PHV,a dramatic increase was observed in calcium intake in boys,whereas, in girls, the intake of calcium dipped. After the age atPHV, boys had significantly higher intakes of calcium than didgirls (P � 0.05; Table 2).
The results of the additive polynomial model described pre-viously (equation 1) are shown in Table 3. Two models werefitted, one for boys and one for girls. By making the time variable(biological maturity) random at level 2, the variance of TBBMCaccrual over increasing biological maturity was estimated in 2parts. Level 1 variance was the variance associated with a sub-ject’s regression line for TBBMC development on biologicalmaturity. Level 2 variance was the variance representing thedeviation of each subject’s line from the average line for thewhole group. The fixed effects in both models indicated thatTBBMC increased with each successive year of biological ma-turity (boys: 114.8 � 10.7 g; girls: 80.4 � 7.1 g). The powerfunctions for biological maturity were included to shape thecurves and essentially forced a sigmoidal shape to a linear model.In boys, a 1-cm increase in stature predicted a 22.6-g accrual of
TABLE 1Characteristics of subjects at the age of peak height velocity (PHV)1
Boys (n � 85) Girls (n � 67)2
Age of PHV (y) 13.5 � 1.0 11.8 � 0.9Height (cm) 164.1 � 6.9 153.3 � 7.7Weight (kg) 52.31 � 8.68 43.27 � 9.72BMI (kg/m2) 19.38 � 2.64 18.26 � 3.01
1 All values are x� � SD.2 Significantly different from boys (2-sided unpaired Student’s t test),
P � 0.05.
TABLE 2Mean intake of nutrient and food groups at the age of peak height velocity (PHV) and overall in boys and girls1
Intake groups
Canadianrecommendations for
food groups2
Boys (n � 85) Girls (n � 67)
Age of PHVOverall age span
(age 8–20 y) Age of PHVOverall age span
(age 8–20 y)
y yMilk products (servings/d) 2–4 3.1 � 1.8 3.3 � 1.9 2.6 � 1.13 2.3 � 1.34
Grain products (servings/d) 5–12 5.9 � 2.2 6.7 � 3.2 5.5 � 1.6 5.3 � 1.94
Meat and alternatives (servings/d) 2–3 2.3 � 1.0 2.6 � 1.6 1.7 � 0.73 1.6 � 0.84
Fat and oils (servings/d) N/A 5.2 � 3.7 5.8 � 5.3 4.2 � 2.9 4.5 � 3.34
Vegetables and fruit (servings/d) 5–10 4.1 � 2.7 4.5 � 3.3 3.8 � 2.0 3.8 � 2.44
Sweets and desserts (servings/d) N/A 3.3 � 2.1 3.7 � 2.9 3.1 � 1.6 2.8 � 1.94
Calcium (mg/d) 1300 1199 � 569 1292 � 634 1030 � 3603 958 � 4234
1 All values are x� � SD.2 The intake in the subjects was compared with the lower value in the range.3 Significantly different from boys (n � 67) at age of PHV, P � 0.05.4 Significantly different from boys at overall age span (2-sided unpaired Student’s t test), P � 0.001.
702 VATANPARAST ET AL
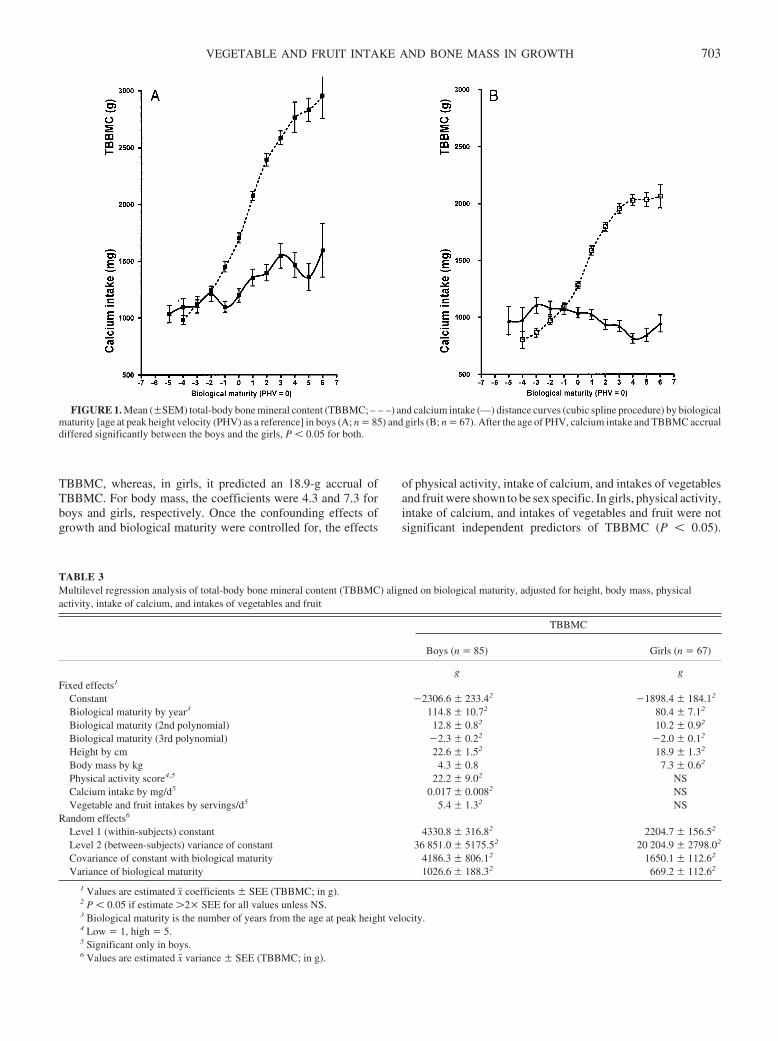
TBBMC, whereas, in girls, it predicted an 18.9-g accrual ofTBBMC. For body mass, the coefficients were 4.3 and 7.3 forboys and girls, respectively. Once the confounding effects ofgrowth and biological maturity were controlled for, the effects
of physical activity, intake of calcium, and intakes of vegetablesand fruit were shown to be sex specific. In girls, physical activity,intake of calcium, and intakes of vegetables and fruit were notsignificant independent predictors of TBBMC (P � 0.05).
FIGURE 1. Mean (�SEM) total-body bone mineral content (TBBMC; – – –) and calcium intake (—) distance curves (cubic spline procedure) by biologicalmaturity [age at peak height velocity (PHV) as a reference] in boys (A; n � 85) and girls (B; n � 67). After the age of PHV, calcium intake and TBBMC accrualdiffered significantly between the boys and the girls, P � 0.05 for both.
TABLE 3Multilevel regression analysis of total-body bone mineral content (TBBMC) aligned on biological maturity, adjusted for height, body mass, physicalactivity, intake of calcium, and intakes of vegetables and fruit
TBBMC
Boys (n � 85) Girls (n � 67)
g gFixed effects1
Constant �2306.6 � 233.42 �1898.4 � 184.12
Biological maturity by year3 114.8 � 10.72 80.4 � 7.12
Biological maturity (2nd polynomial) 12.8 � 0.82 10.2 � 0.92
Biological maturity (3rd polynomial) �2.3 � 0.22 �2.0 � 0.12
Height by cm 22.6 � 1.52 18.9 � 1.32
Body mass by kg 4.3 � 0.8 7.3 � 0.62
Physical activity score4,5 22.2 � 9.02 NSCalcium intake by mg/d5 0.017 � 0.0082 NSVegetable and fruit intakes by servings/d5 5.4 � 1.32 NS
Random effects6
Level 1 (within-subjects) constant 4330.8 � 316.82 2204.7 � 156.52
Level 2 (between-subjects) variance of constant 36 851.0 � 5175.52 20 204.9 � 2798.02
Covariance of constant with biological maturity 4186.3 � 806.12 1650.1 � 112.62
Variance of biological maturity 1026.6 � 188.32 669.2 � 112.62
1 Values are estimated x� coefficients � SEE (TBBMC; in g).2 P � 0.05 if estimate �2� SEE for all values unless NS.3 Biological maturity is the number of years from the age at peak height velocity.4 Low � 1, high � 5.5 Significant only in boys.6 Values are estimated x� variance � SEE (TBBMC; in g).
VEGETABLE AND FRUIT INTAKE AND BONE MASS IN GROWTH 703
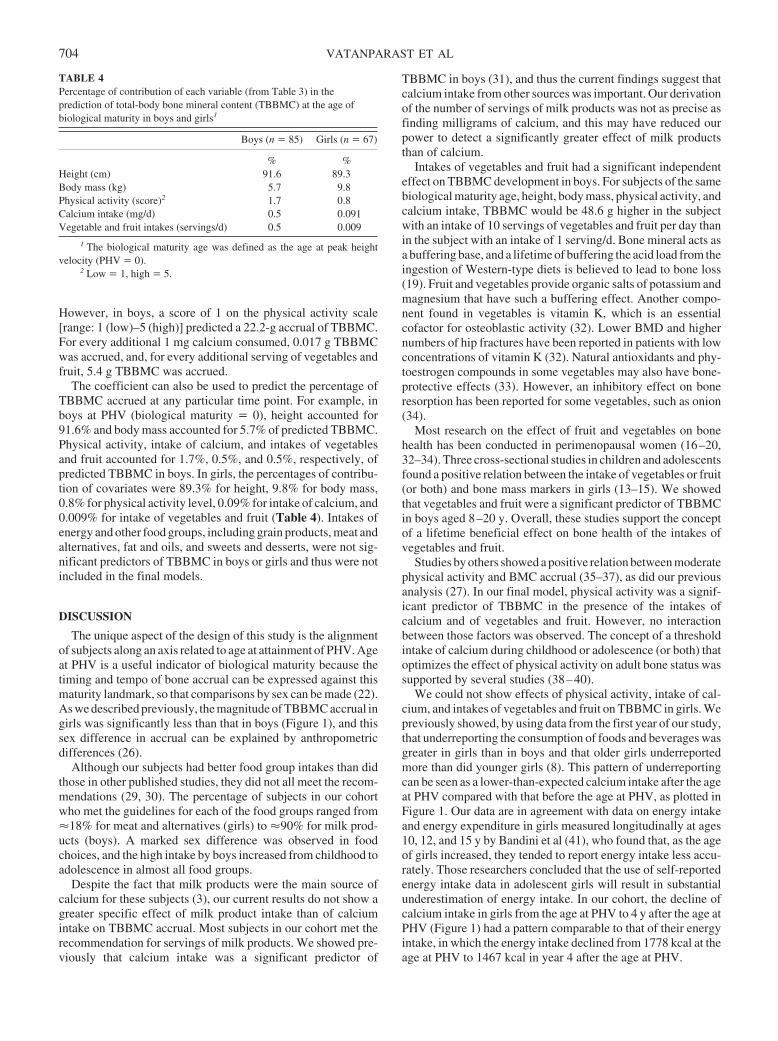
However, in boys, a score of 1 on the physical activity scale[range: 1 (low)–5 (high)] predicted a 22.2-g accrual of TBBMC.For every additional 1 mg calcium consumed, 0.017 g TBBMCwas accrued, and, for every additional serving of vegetables andfruit, 5.4 g TBBMC was accrued.
The coefficient can also be used to predict the percentage ofTBBMC accrued at any particular time point. For example, inboys at PHV (biological maturity � 0), height accounted for91.6% and body mass accounted for 5.7% of predicted TBBMC.Physical activity, intake of calcium, and intakes of vegetablesand fruit accounted for 1.7%, 0.5%, and 0.5%, respectively, ofpredicted TBBMC in boys. In girls, the percentages of contribu-tion of covariates were 89.3% for height, 9.8% for body mass,0.8% for physical activity level, 0.09% for intake of calcium, and0.009% for intake of vegetables and fruit (Table 4). Intakes ofenergy and other food groups, including grain products, meat andalternatives, fat and oils, and sweets and desserts, were not sig-nificant predictors of TBBMC in boys or girls and thus were notincluded in the final models.
DISCUSSION
The unique aspect of the design of this study is the alignmentof subjects along an axis related to age at attainment of PHV. Ageat PHV is a useful indicator of biological maturity because thetiming and tempo of bone accrual can be expressed against thismaturity landmark, so that comparisons by sex can be made (22).As we described previously, the magnitude of TBBMC accrual ingirls was significantly less than that in boys (Figure 1), and thissex difference in accrual can be explained by anthropometricdifferences (26).
Although our subjects had better food group intakes than didthose in other published studies, they did not all meet the recom-mendations (29, 30). The percentage of subjects in our cohortwho met the guidelines for each of the food groups ranged from�18% for meat and alternatives (girls) to �90% for milk prod-ucts (boys). A marked sex difference was observed in foodchoices, and the high intake by boys increased from childhood toadolescence in almost all food groups.
Despite the fact that milk products were the main source ofcalcium for these subjects (3), our current results do not show agreater specific effect of milk product intake than of calciumintake on TBBMC accrual. Most subjects in our cohort met therecommendation for servings of milk products. We showed pre-viously that calcium intake was a significant predictor of
TBBMC in boys (31), and thus the current findings suggest thatcalcium intake from other sources was important. Our derivationof the number of servings of milk products was not as precise asfinding milligrams of calcium, and this may have reduced ourpower to detect a significantly greater effect of milk productsthan of calcium.
Intakes of vegetables and fruit had a significant independenteffect on TBBMC development in boys. For subjects of the samebiological maturity age, height, body mass, physical activity, andcalcium intake, TBBMC would be 48.6 g higher in the subjectwith an intake of 10 servings of vegetables and fruit per day thanin the subject with an intake of 1 serving/d. Bone mineral acts asa buffering base, and a lifetime of buffering the acid load from theingestion of Western-type diets is believed to lead to bone loss(19). Fruit and vegetables provide organic salts of potassium andmagnesium that have such a buffering effect. Another compo-nent found in vegetables is vitamin K, which is an essentialcofactor for osteoblastic activity (32). Lower BMD and highernumbers of hip fractures have been reported in patients with lowconcentrations of vitamin K (32). Natural antioxidants and phy-toestrogen compounds in some vegetables may also have bone-protective effects (33). However, an inhibitory effect on boneresorption has been reported for some vegetables, such as onion(34).
Most research on the effect of fruit and vegetables on bonehealth has been conducted in perimenopausal women (16–20,32–34). Three cross-sectional studies in children and adolescentsfound a positive relation between the intake of vegetables or fruit(or both) and bone mass markers in girls (13–15). We showedthat vegetables and fruit were a significant predictor of TBBMCin boys aged 8–20 y. Overall, these studies support the conceptof a lifetime beneficial effect on bone health of the intakes ofvegetables and fruit.
Studies by others showed a positive relation between moderatephysical activity and BMC accrual (35–37), as did our previousanalysis (27). In our final model, physical activity was a signif-icant predictor of TBBMC in the presence of the intakes ofcalcium and of vegetables and fruit. However, no interactionbetween those factors was observed. The concept of a thresholdintake of calcium during childhood or adolescence (or both) thatoptimizes the effect of physical activity on adult bone status wassupported by several studies (38–40).
We could not show effects of physical activity, intake of cal-cium, and intakes of vegetables and fruit on TBBMC in girls. Wepreviously showed, by using data from the first year of our study,that underreporting the consumption of foods and beverages wasgreater in girls than in boys and that older girls underreportedmore than did younger girls (8). This pattern of underreportingcan be seen as a lower-than-expected calcium intake after the ageat PHV compared with that before the age at PHV, as plotted inFigure 1. Our data are in agreement with data on energy intakeand energy expenditure in girls measured longitudinally at ages10, 12, and 15 y by Bandini et al (41), who found that, as the ageof girls increased, they tended to report energy intake less accu-rately. Those researchers concluded that the use of self-reportedenergy intake data in adolescent girls will result in substantialunderestimation of energy intake. In our cohort, the decline ofcalcium intake in girls from the age at PHV to 4 y after the age atPHV (Figure 1) had a pattern comparable to that of their energyintake, in which the energy intake declined from 1778 kcal at theage at PHV to 1467 kcal in year 4 after the age at PHV.
TABLE 4Percentage of contribution of each variable (from Table 3) in theprediction of total-body bone mineral content (TBBMC) at the age ofbiological maturity in boys and girls1
Boys (n � 85) Girls (n � 67)
% %Height (cm) 91.6 89.3Body mass (kg) 5.7 9.8Physical activity (score)2 1.7 0.8Calcium intake (mg/d) 0.5 0.091Vegetable and fruit intakes (servings/d) 0.5 0.009
1 The biological maturity age was defined as the age at peak heightvelocity (PHV � 0).
2 Low � 1, high � 5.
704 VATANPARAST ET AL
The current study has some limitations. The subjects were notdrawn from a nationally representative sample. Dietary intakeswere self-reported, which can lead to underestimation because ofunderreporting. Physical activity was also self-reported and wasdetermined as the frequency of various activities, which wassubject to underreporting or overreporting. The longitudinal na-ture of the study and the determination of biological maturity age,however, are unique features of the study. Use of the multilevelmodeling method specifically developed for the analysis ofgrowth data permitted the determination of factors that affectTBBMC during biological maturation.
Important biological, psychological, social, and cognitivechanges occur during adolescence. These changes can affect thenutritional needs of teenagers (42). Although biological factorsplay the most important role in bone mineral accrual during thosecritical years, nutrition and physical activity are important fac-tors in the accrual of genetically designed potential peak bonemass. The beneficial effect of the intake of vegetables and fruit onbone mass in boys, measured as TBBMC in boys aged 8–20 y,adds to previous published reports of this effect in girls. Appro-priate intakes of vegetables and fruit, as well as of the dairyproducts that are the main sources of dietary calcium, are bene-ficial to bone health from childhood to late adolescence.
HV performed the statistical data analyses and wrote the manuscript. SJW,DAB, and RAF were involved in developing the Pediatric Bone MineralAccrual Study protocol and conducting the study. SJW was involved in thecritical revision of the manuscript for intellectual content and interpretationof results. ABJ, the current director of the longitudinal study of the PediatricBone Mineral Accrual Study, developed the specific model for analyzinggrowth data and supervised the data analysis. All authors contributed torevisions of the manuscript. None of the authors had a personal or financialconflict of interest.
REFERENCES1. Institute of Medicine of the National Academies. Dietary reference in-
takes: calcium, phosphorus, magnesium, vitamin D, and fluoride. Wash-ington, DC: The National Academy Press, 1997.
2. Ilich JZ, Kerstetter JE. Nutrition in bone health revisited: a story beyondcalcium. J Am Coll Nutr 2000;19:715–37.
3. Iuliano-Burns S, Whiting SJ, Faulkner RA, et al. Levels, sources, andseasonality of dietary calcium intake in children and adolescents en-rolled in the University of Saskatchewan Pediatric Bone Mineral Ac-crual Study. Nutr Res 1999;19:1471–83.
4. Chan GM. Dietary calcium and mineral statues of children and adoles-cents. Am J Dis Child 1992;145:631–4.
5. Gunnes M, Lehmann EH. Dietary calcium, saturated fat, fiber and vita-min C as predictors of forearm cortical and trabecular bone mineraldensity in healthy children and adolescents. Acta Paediatr 1995;84:388–92.
6. Kardinaal AF, Ando S, Charles P, et al. Dietary calcium and bone densityin adolescent girls and young women in Europe. J Bone Miner Res1999;14:583–92.
7. Molgaard C, Thomsen BL, Michaelsen KF. The Influence of calciumintake and physical activity on bone mineral content and bone size inhealthy children and adolescents. Osteoporos Int 2001;12:887–94.
8. Carter LM, Whiting SJ, Drinkwater DT, et al. Self-reported calciumintake and bone mineral content in children and adolescents. J Am CollNutr 2001;5:502–9.
9. Chan GM, Hoffman K, McMurry M. Effects of dietary product on boneand body composition in pubertal girls. J Pediatr 1995;125:551–6.
10. Cadogan J, Eastell R, Jones N, et al. Milk intake and bone mineralacquisition in adolescent girls: randomized, controlled intervention trial.Br Med J 1997;315:1255–60.
11. Merriless MJ, Smart EJ, Gilchrist NL, et al. Effects of diary food sup-plements on bone mineral density in teenage girls. Eur J Clin Nutr2000;39:256–62.
12. Du XQ, Greenfield H, Fraser DR, et al. Milk consumption and bonemineral content in Chinese adolescent girls. Bone 2002;30:521–8.
13. Jones G, Riley MD, Whiting SJ. Association between urinary potassium,urinary sodium, current diet, and bone density in prepubertal children.Am J Clin Nutr 2001;73:839–44.
14. Tylavsky FA, Holliday K, Danish RK, et al. Fruit and vegetable intakeis an independent predictor of bone mass in early-pubertal children. Am JClin Nutr 2004;79:311–7.
15. McGartland CP, Robson PJ, Murray LJ, et al. Fruit and vegetable con-sumption and bone mineral density: the Northern Ireland Young HeartsProject. Am J Clin Nutr 2004;80:1019–23.
16. New S, Robins SP, Campbell MK, et al. Dietary influences on bone massand bone metabolism: further evidence of a positive link between fruitand vegetable consumption and bone health. Am J Clin Nutr 2000;71:142–51.
17. Macdonald HM, New SA, Golden MHN, Campell MK, Raid DM. Nu-tritional associations with bone loss during the menopausal transition:evidence of a beneficial effect of calcium, alcohol, and fruit and vege-table nutrients and of a detrimental effect of fatty acids. Am J Clin Nutr2004;79:155–65.
18. New SA. Intake of fruit and vegetables: implications for bone health.Proc Nutr Soc 2003;62:P889–99.
19. Tucker KL, Chen H, Hannan MT, et al. Bone mineral density and dietarypatterns in older adults: the Framingham Osteoporosis Study. Am J ClinNutr 2002;79:245–52.
20. Tucker KL, Chen H, Hannan MT, et al. Potassium, magnesium, and fruitand vegetable intakes are associated with greater bone mineral density inelderly men and women. Am J Clin Nutr 1999;69:727–36.
21. Whiting SJ, Healey A, Psiuk S, et al. Relationship between carbonatedand other low nutrient dense beverages and bone mineral content ofadolescents. Nutr Res 2001;21:1107–15.
22. Malina RM, Bouchard C. Growth, maturation, and physical activity.Champaign, IL: Human Kinetics, 1991.
23. Bailey DA. The Saskatchewan Pediatric Bone Mineral Accrual Study:bone mineral acquisition during the growth years. J Sports Med 1997;18:S191–4.
24. Canada’s food guide to healthy eating. Ottawa, Canada: Health Canada,1992. Internet: http:/www.hc-sc.gc.ca/nutrition (accessed 14 June2003).
25. Whiting SJ, Colleaux C, Bacchetto T. Dietary intakes of children age 8to 15 years living in Saskatoon. J Can Diet Assoc 1995;56:119–25.
26. Baxter-Jones ADG, Mirwald RL, McKay HA, et al. A longitudinalanalysis of sex differences in bone mineral accrual in healthy 8–19-year-old boys and girls. Ann Hum Biol 2003;30:160–75.
27. Bailey DA, McKay HA, Mirwald RL, et al. A six-year longitudinal studyof the relationship of physical activity to bone mineral accrual in growingchildren: the University of Saskatchewan bone mineral accrual study.J Bone Miner Res 1999;14:1672–9.
28. Baxter-Jones A, Mirwald R. Multilevel modeling. In: Hauspie RC, Cam-eron N, Molinari L, eds. Methods in human growth research. Cambridge,United Kingdom: Cambridge University Press, 2004:306–30.
29. Munoz KA, Krebs-Smith SM, Ballard-Barbash R, et al. Food intake ofUS children and adolescents compared with recommendations. Pediat-rics 1997;100:323–9.
30. Starkey L, Johnson-Down L, Gray-Donald K. Food habits of Canadians:comparison of intakes in adults and adolescents to Canada’s Food Guideto Healthy Eating. Can J Diet Pract Res 2001;62:61–9.
31. Baxter-Jones A, Faulkner R, Whiting S. Interaction between nutrition,physical activity and skeletal health. In: New S, Bonjour JP, eds. Nutri-tional aspects of bone health. Cambridge, United Kingdom: The RoyalSociety of Chemistry, 2003:545–65.
32. Feskanich D, Weber P, Willett WC, et al. Vitamin K intake and hipfractures in women: a prospective study. Am J Clin Nutr 1999;69:74–9.
33. Wangen KE, Duncan AM, Merz-Demlow BE, et al. Effects of soyisoflavones on markers of bone turnover in premenopausal and post-menopausal women. J Clin Endocrinol Metab 2000;85:3043–8.
34. Muhlbauer RC, Lozano A, Reinli A. Onion and a mixture of vegetables,salads, and herbs affect bone resorption in the rat by a mechanismindependent of their base excess. J Bone Miner Res 2002;17:1230–6.
35. Scerpella TA, Davenport M, Morganti CM, et al. Dose related associa-tion of impact activity and bone mineral density in pre-pubertal girls.Osteoporos Int 2003;72:24–31.
VEGETABLE AND FRUIT INTAKE AND BONE MASS IN GROWTH 705

36. Sundberg M, Gardesell P, Johnell O, et al. Peripubertal moderate exer-cise increases bone mass in boys but not in girls: a population-basedintervention study. Osteoporos Int 2001;12:230–8.
37. Sundberg M, Gardesell P, Johnell O, et al. Physical activity increasesbone size in prepubertal boys and bone mass in prepubertal girls: acombined cross-sectional and 3-year longitudinal study. Calcif TissueInt 2002;71:406–15.
38. VandenBerg MF, DeMan SA, Witteman JC, Hofman A, TrouerbachWT, Grobbee DE. Physical activity, calcium intake, and bone mineralcontent in children in the Netherlands. J Epidemiol Community Health1995;49:299–304.
39. Tylavsky FA, Anderson JJ, Talmage VR, Taft TN. Are calciumintakes and physical activity patterns during adolescence related toradial bone mass of white college-age females? Osteoporos Int 1992;2:232– 40.
40. Wosje KS, Binkley TL, Fahrenwald NL, Specker BL. High bone mass ina female Hutterite population. J Bone Miner Res 2000;15:1429–36.
41. Bandini LG, Must A, Cyr H, Anderson SE, Spadano JL, Diets WH.Longitudinal changes in the accuracy of reported energy intake in girls10–15 y of age. Am J Clin Nutr 2003;78:480–4.
42. Heaney RP, Abrams S, Dawson-Hughes B, et al. Peak bone mass. Os-teoporos Int 2000;11:985–1009.
706 VATANPARAST ET AL
Letters to the Editor
Tanning and vitamin D status
Dear Sir:
We read with concern the article by Tangpricha et al (1) on tanningand vitamin D status in a recent issue of the Journal. They concluded,on the basis of their study, that “tanning beds may also provide somemedical benefit.” Our concern is based on several factors.
First, Tangpricha et al recruited a convenience sample via anonline bulletin board and newspaper advertisement. Hence, theirstudy population was likely not representative of the general popu-lation. As a consequence, their results could be biased by the self-selected nature of their study participants. Furthermore, their com-parison of vitamin D concentrations in tanners and nontanners mayhave been biased by their failure to account for differences in ethnicgroup, multivitamin consumption, or sunlight exposure between the2 groups—factors that may have led to spuriously low vitamin Dconcentrations in nontanners relative to tanners.
Second, patrons of commercial tanning parlors are unable to dis-tinguish whether the lamps to which they are exposed emit pureultraviolet (UV) A radiation (ie, wavelengths between 320 and 400nm), which will not result in the photosynthesis of vitamin D inhuman skin, or emit a mixture of UV B (ie, wavelengths between 280and 320 nm) and UVA radiation, which will result in the photosyn-thesis of vitamin D in human skin, nor can they tell how much UVBradiation is emitted by these lamps.
Third, the investigators imply that artificial tanning lamps may beuseful for improving vitamin D status, but they downplay theircarcinogenicity. Artificial tanning has been linked to multiple typesof skin cancers. Oral vitamin supplements are a safer, much lessexpensive, and more convenient method for improving vitamin Dstatus.
Fourth, the authors of the article acknowledge having receivedsupport from the UV Foundation for their work, and the senior authoris a consultant for this foundation. However, the authors failed tonote the close connection between the UV Foundation and the com-mercial tanning industry. Were the readers aware of this close con-nection, they might infer that the implicit endorsement of tanningparlors in this article is related to the authors’ financial connectionswith the commercial tanning industry.
MAW is a member of the American Academy of Dermatology, which hassupported more rigorous controls on tanning parlors. Neither MAW nor DLhad a conflict of interest to declare.
Martin A Weinstock
VA Medical Center ProvidenceDepartment of Dermatology and Community HealthBrown UniversityProvidence, RI 02912E-mail: [email protected]
DeAnn Lazovich
Division of Epidemiology and Community HealthUniversity of MinnesotaMinneapolis, MN
REFERENCE1. Tangpricha V, Turner A, Spina C, Decastro S, Chen TC, Holick MF.
Tanning is associated with optimal vitamin D status (serum 25-hydroxyvitamin D concentration) and higher bone mineral density. Am JClin Nutr 2004;80:1645–9.
Reply to MA Weinstock and D Lazovich
Dear Sir:
It is remarkable that some persons in the dermatology community,including Weinstock and Lazovich, are oblivious to the multitude ofpublications that have clearly shown vitamin D deficiency to beepidemic in the US population (1–4). The major reason for this is thatmost children and adults are unable to satisfy their vitamin D re-quirement from dietary sources (5). Sensible sun exposure is themajor source of vitamin D for both children and adults (6). Thesuggestion that there may have been bias by our failure to account fordifferences between tanners and nontanners, which may have led tospuriously low concentrations of vitamin D in nontanners, is un-founded. However, because Weinstock and Lazovich apparentlyconsider this to be important, we observed that 40% of the controlgroup was vitamin D deficient at the end of the winter. This obser-vation is consistent with what was previously published by us andothers regarding the prevalence of vitamin D deficiency in the adultpopulation in Boston. No statistically significant difference in theuse of multivitamins was observed between tanners and nontanners(40% compared with 54%, respectively). When we compared onlywhite nontanners with white tanners, the mean (�SEM) 25-hydroxyvitamin [25(OH)D] concentration was 26.9 � 2.0 ng/mL inthe nontanners and 48.5 � 3.0 ng/mL in the tanners (P � 0.0001).
Most tanning beds in the United States use lamps that emit be-tween 2% and 5% ultraviolet (UV) B radiation. This is the reasonwhy most subjects who frequented a tanning salon had robust con-centrations of 25(OH)D and why 25(OH)D concentrations did notincrease in one of the subjects, ie, the subject may have been exposedto a tanning bed that emitted only UVA radiation. We and otherinvestigators previously reported that UVB-emitting lamp sourcesare very effective at producing vitamin D3 in the skin and increasingblood concentrations of 25(OH)D (7–9).
One million adults frequent a tanning salon daily in the UnitedStates (10) for a variety of reasons, one of which is that it makes them
707Am J Clin Nutr 2005;82:707–9. Printed in USA. © 2005 American Society for Clinical Nutrition
feel better about themselves. Although we do not advocate tanningnor do we advocate frequenting a tanning salon for the sole purposeof enhancing vitamin D status, one of the benefits that tannersobtain from their activity is that they have healthy concentrationsof 25(OH)D. Because vitamin D deficiency has been linked to anincreased risk of many common deadly cancers, autoimmunediseases, and cardiovascular disease, tanners may benefit fromtheir tanning experience by decreasing their risk of many seriouschronic diseases (1). Patients with vitamin D deficiency are en-couraged to take pharmacologic doses of vitamin D. Typically,these patients receive 50 000 units of vitamin D once a week for8 wk and then once every 2 wk to maintain a healthy vitamin Dstatus (11). However, there are more than a million children andadults with various intestinal fat malabsorption syndromes whoare unable to obtain their vitamin D requirement from dietary orsupplemental oral sources (12). These patients clearly benefitfrom sensible exposure to sunlight or a lamp source that emitsUVB radiation (7).
The New Zealand Bone and Mineral Society and the AustralianCollege of Dermatologists and the Cancer Council of Australiarecommend that balance is required between avoiding an in-creased risk of skin cancer and achieving enough UV radiation tomaintain adequate vitamin D concentrations. This sensible rec-ommendation should serve as a model for the American Academyof Dermatology, which advocates abstinence from all sun expo-sure. Vitamin D deficiency is a major health problem in theUnited States. The American Academy of Dermatology’s recom-mendation that no one should ever be exposed to direct sunlightis putting the American public at great health risk.
MFH’s laboratory received a nonrestricted gift from the nonprofit UVFoundation to support research on the biologic effects of ultraviolet radiationon human health. MFH has not received any compensation from the UVFoundation as a consultant nor has he ever received financial compensationfrom the Indoor Tanning Association. VT had no conflict of interest.
Michael F HolickVin Tangpricha
Boston University School of Medicine715 Albany Street, M-1013Boston, MA 02118-2394E-mail: [email protected]
REFERENCES1. Holick MF. Sunlight and vitamin D for bone health and prevention of
autoimmune diseases, cancers, and cardiovascular disease. Am J ClinNutr 2004;80(suppl):1678S–88S.
2. Gordon CM, Kerrin C, DePeter KC, Feldman HA, Estherann G, EmansSJ. Prevalance of vitamin D deficiency among healthy adolescents. ArchPediatr Adolesc Med 2004;158:531–7.
3. Thomas KK, Lloyd-Jones DH, Thadhani RI, et al. Hypovitaminosis D inmedical inpatients. N Engl J Med 1998;338:777–83.
4. Vieth R, Cole DE, Hawker GA, Trang HM, Rubin LA. Wintertimevitamin D insufficiency is common in young Canadian women and theirvitamin D intake does not prevent it. Eur J Clin Nutr 2001;55:1091–7.
5. Moore C, Murphy MM, Keast DR, Holick MF. Vitamin D intake in theUnited States. J Am Diet Assoc 2004;151:190–5.
6. Holick MF. Vitamin D. The underappreciated D-lightful hormone that isimportant for skeletal and cellular health. Curr Opin Endocrinol Diabetes2002;9:87–98.
7. Koutkia P, Lu Z, Chen TC, Holick MF. Treatment of vitamin D defi-ciency due to Crohn’s disease with tanning bed ultraviolet B radiation.Gastroenterology 2001;121:1485–8.
8. Chel VGM, Ooms ME, Popp-Snijders C, et al. Ultraviolet irradiationcorrects vitamin D deficiency and suppresses secondary hyperparathy-roidism in the elderly. J Bone Miner Res 1998;13:1238–42.
9. Chuck A, Todd J, Diffey B. Subliminal ultraviolet-B irradiation for theprevention of vitamin D deficiency in the elderly: a feasibility study.Photochem Photoimmun Photomed 2001;17:168–71.
10. Levy JA. Potential tanning market in the United States. Tanning TrendsMagazine 1997 Sept:46.
11. Malabanan AO, Veronikis IE, Holick MF. Redefining vitamin D insuf-ficiency. Lancet 1998;351:805–6.
12. Lo C, Paris P, Clemens TL, Nolan J, Holick MF. Vitamin D absorptionin healthy subjects and in patients with intestinal malabsorption syn-dromes. Am J Clin Nutr 1985;42:644–9.
High thyroid volume in children with excessdietary iodine intakes
Dear Sir:
The recent article titled ‘‘High thyroid volume in children withexcess dietary iodine intakes’’ by Zimmermann et al (1) made in-teresting reading. The authors highlighted one of the possible risks(2) associated with excess dietary intake of iodine. The eventualityof adverse effects due to dietary excess of iodine is plausible in thecurrent scenario of universal salt iodization, particularly so whenmonitoring is poor (3).
The main finding of the close correlation between increase inthyroid volume and high iodine intake in children documented byZimmerman et al is based mainly on data from coastal Hokkaido.This association is not entirely new; endemic goiter due to dietaryexcess of iodine was recognized decades ago in coastal Hokkaido (4,5). However, despite the excessively high intake of iodine uni-versally in coastal Hokkaido, the prevalence of goiter has neverbeen documented to be �25% (6). Other factors may play a rolein the etiology of goiter in this region, and the drawing of con-clusions based on data from this region may not be appropriate. Inthe same context, it would be of interest to know the goiterprevalence rates in the subsample from coastal Hokkaido in studyby Zimmerman et al.
Whatever may be the deliberations to the issues raised above,it is hoped that the interest and research generated by this studyare directed toward strengthening the monitoring system of saltiodization programs rather than creating doubts in the minds ofhealth policy makers and thereby derailing successful pro-grams such as universal salt iodization, particularly in developingcountries.
Rajat Prakash
Department of Human NutritionAll India Institute of Medical SciencesNew Delhi 110029IndiaE-mail: [email protected]
REFERENCES1. Zimmermann MB, Ito Y, Hess SY, Fujieda K, Molinari L. High thyroid
volume in children with excess dietary iodine intakes. Am J Clin Nutr2005;81:840–4.
2. Pennington JAT. Iodine toxicity. Springfield, VA: National TechnicalInformation Service, US Department of Commerce, 1989.
708 LETTERS TO THE EDITOR

3. Delange F, de Benoist B, Pretell E, Dunn JT. Iodine deficiency in theworld: where do we stand at the turn of the century? Thyroid 2001;11:437–47.
4. Suzuki H, Higuchi T, Sawa K, Ohtaki S, Horiuchi Y. ‘‘Endemic coastgoiter’’ in Hokkaido, Japan. Acta Endocrinol (Copenh) 1965;50:161–76.
5. Wolff J. Iodine goiter and the pharmacological effects of excess iodide.Am J Med 1969;47:101–24.
6. Suzuki H. Etiology of endemic goiter and iodide excess. In: Stanbury JB,Hetzel BS, eds. Endemic goiter and endemic cretinism. Iodine nutritionin health and disease. New Delhi, India: Wiley Eastern Limited, 1985;237–53.
Erratum
Dahlman I, Linder K, Arvidsson Nordström E, Andersson I, Lidén J, Verdich C, Sørensen TIA, Arner P,NUGENOB. Changes in adipose tissue gene expression by energy-restricted diets in obese women. Am J ClinNutr 2005;81:1275–85.
The website given for NUGENOB in the footnotes to the title on page 1275 and at the top of page 1276 shouldbe www.nugenob.com (rather than .org).
LETTERS TO THE EDITOR 709
Book Reviews
Nutrition and Oral Medicine, edited by Riva Touger-Decker,David A Sirois, and Connie C Mobley, 2004, 379 pages,hardcover, $135. Humana Press, Totowa, NJ.
This text brings together the key elements of oral medicine andnutrition in an accessible form for the dental professional. This isan excellent reference text that promulgates the comprehensivemanagement of medically or nutritionally compromised patientsthroughout life. The editors gathered a diverse group of expertsin their field to provide an evidence-based approach to the nu-tritional aspects of oral health and oral medicine.
The editors have designed the book to help students to take aquestioning view of nutritional fads and to realize the complexityand uncertainty that, unfortunately, make up the actual state ofour knowledge of nutrition. Strategies for treatment, based on thelatest evidence, are given. The authors present populations athigh risk of poor oral health, such as the elderly or patients withcancer, HIV infection, autoimmune diseases, osteoporosis, anddiabetes, and discuss the strategies for tackling their oral healthproblems, on the basis of our current knowledge of nutrition andoral medicine. These high-risk populations are frequently over-looked by both the medical and dental professions, which resultsin poor oral and general health. Early intervention is critical. Inthis era of complementary and alternative medicines, the currentevidence as to the interplay of nutrition and oral health is brieflydiscussed, and sound advice is provided for the dental profes-sional with regard to what aids and what can interfere with dentaltherapy.
This book includes coverage of the expected topics (ie, dietand general heath, protein-energy malnutrition, maternal andchild health, aging, and the interrelations of medication, diet, andoral health). In addition, the book describes concise, elegantmethods for treating patients who are medically compromisedand details risk assessment tools, giving the dental and nutritionalmanagement for each condition according to the most currentliterature. The recognition of potential drug-nutrient interactionsis vital in modern dentistry, and these interactions are coveredcomprehensively in this book. The final chapter covers educa-tion, risk assessment, and oral medicine. It reports the risk as-sessment tools used at 2 different schools and provides a BMIchart and dietary reference tables that are current and very useful.Especially useful to the dental professional are the numeroustables and forms that can be used for clinical practice. The CDthat accompanies the book makes it easy for dental professionalsto download the forms to use in their practices.
The information on disease that this book provides is partic-ularly welcome because most dentists who are interested in nu-trition want to understand how nutrients affect oral health. Pa-tients often ask for advice when they have seen information in themedia or on the Internet. This book provides a quick way forhealth professionals to give educated answers. Although much
specific information did not make its way into these relativelybrief chapters, each chapter contains up-to-date information, in-cluding detailed references to published articles. The chapters inthis book contain concise summaries of the recent literature andgraphs and charts that are extremely useful.
The chapters are quite readable, which ensures that the infor-mation is accessible to the dental and nutrition community atlarge, and this book should provide an easy way for students, aswell as the rest of us, to be up-to-date on recent advances. AsDePaola stated in the foreword to the book, we are now at thepoint that proteomics and metabolomics are helping us under-stand the basic mechanisms of nutrition, oral disease, and cranio-facial development. The questions raised by proteomics andmetabolomics should help inspire a new generation to studynutrition and its relation to oral health.
I would wholeheartedly recommend this book to all dentalhealth professionals, nutritionists, and other health professionalsas a resource and reference text.
The author had no personal or financial conflicts of interest with regard tothis book or the authors or editors of the book.
Athena S Papas
Johansen Professor of Dental ResearchTufts School of Dental MedicineDHS-5, One Kneeland StreetBoston, MA 02115E-mail: [email protected]
Nutritional Ergogenic Aids, edited by Ira Wolinsky and JudyA Driskell, 2004, 536 pages, hardcover, $99.95. CRC Press,Boca Raton, FL.
Athletes of all levels, from elite and professional to ‘‘back ofthe pack’’ and recreational, strive for their best. Oftentimes, thisquest involves the use of ergogenic aids to boost work perfor-mance, because unaided effort is perceived to be insufficient forpursuing personal bests. Present-day nutritional ergogenic aidsrange from the common-place caffeine and amino acids to themore exotic lipoic acid and dihydroxyacetone. But the practice ofpursuing optimal performance through dietary supplements hasbeen around since the Olympic Games of antiquity more than2000 y ago. Athletes and warriors used dietary aids, such as deerliver and lion heart, to impart specific benefits, such as speed,bravery, and strength (1). The perceived benefits sought by theathletes of antiquity are no different from the striving by modern-day athletes for improved endurance, strength, and recovery.
710 Am J Clin Nutr 2005;82:710–1. Printed in USA. © 2005 American Society for Clinical Nutrition
Today’s athletes look for ergogenic aids that provide specificbenefits based on that aid’s role in exercise metabolism. Thus,practitioners in the area of sports nutrition and well-read athletes,researchers, and academicians would search out reference bookssuch as this one to aid them in the ever-changing arena of nutri-tional ergogenic aids. Wolinsky and Driskell have done an ex-cellent job of assembling a well-known cast of experts in the areaof nutritional ergogenic aids and have produced a well-organizedreferenced text.
Nutritional Ergogenic Aids is part of a collection of books onexercise edited by the authors and written for sports nutritionists,sports medicine professionals, students, and educated athletes.The 26 chapters are divided into 6 sections: an introduction thatincludes a discussion of the regulatory issues of supplements;sections that cover amino acid derivatives, lipid derivatives,other substances in foods not classified as essential, and theevaluation of effectiveness; and a summary that includes theimplications of using ergogenic aids. Each chapter is well orga-nized with a comprehensive list of references that will proveuseful to both researchers and clinicians. The basic format in-cludes the potential role of the dietary aid in physical perfor-mance and a review of the literature regarding performance ben-efits. In some cases, safety issues and use in sports are alsocovered. Although often a challenge with a multiple-authorbook, this reference text reads smoothly and provides well-researched information on each dietary aid.
The introductory chapter provides a working definition ofergogenic aids and a detailed overview of regulatory issues,including those involving sports-governing agencies. In part IIon amino acid derivatives, a total of 12 chapters give an excep-tional review of this popular category of supplements, such ascreatine and branched-chain amino acids. Glucosamine andchondroitin sulfate are also reviewed, which points to the signif-icance of potential ergogenic aids that may not benefit speed orstrength directly but rather promote healthy joints in an effort to
stave off injury or reduce wear and tear. This section may havebeen improved with a chapter on protein supplements, althoughthe point was made in chapter 1 to address micronutrients ratherthan macronutrients.
Parts III and IV detail lipids and other food substances, such ascaffeine and coenzyme Q10, as potential ergogenic aids. Thechapter on caffeine gives an excellent review of caffeine’s met-abolic and physiologic effects and its use in sports, which isrelevant because this is the most commonly used ergogenic aidamong various types of athletes. Part V summarizes which er-gogenic aids work and which do not in the 4 major areas ofergogenicity: long-term endurance performance, muscle massand strength, body fat loss, and sports skills and exercise-associated health. This section expertly ties together the previous24 chapters. A helpful addition to this chapter or perhaps tochapter 1 would have been an in-depth review of ergogenic aidcontamination, because this has profound implications for ath-letes being tested for substances banned for use in sports (chapter1 briefly touches on this important topic). In summary, this bookis an excellent resource for those involved in the field of sportsnutrition either as clinicians, students, educators, or researchersas well as for educated athletes.
Liz Applegate
Nutrition Department1 Shields AvenueUniversity of California, DavisDavis, CA 95616E-mail: [email protected]
REFERENCE1. Applegate E, Grivetti L. Search for the competitive edge: a history of
fads and supplements. J Nutr 1997;127(suppl):869S–73S.
BOOK REVIEWS 711
Continuing Medical Education
Objectives
After evaluating an article designated for Continuing Medical Education (CME) in the American Journal of Clinical Nutrition(AJCN), participants in the American Society for Clinical Nutrition (ASCN) CME program should be able to show that theirknowledge of clinical nutrition has increased. Participants should also be able to evaluate whether the clinical information providedin the CME-designated article is relevant to the provision of patient care.
Accreditation and credits
The ASCN is accredited by the Accreditation Council for Continuing Medical Education to provide continuing medical educationfor physicians. The ASCN designates each CME program for 1 hour of category 1 credit toward the American Medical Association(AMA) Physician’s Recognition Award. Each physician should claim only those hours of credit that he or she actually spent on theeducation program.
Instructions
Each issue of the AJCN will usually include at least 2 articles designated for CME credit. After reading the CME-designated article,select the best answer to each exam question listed below and complete the evaluation. To receive CME credit, you should return theexam and evaluation pages along with the CME Participant Response Form by August 31, 2006. Please fax the pages to the ASCN at301-634-7350 or mail them to the following address: American Society for Clinical Nutrition, CME Program, 9650 Rockville Pike,Bethesda, MD 20814. Note that all responses must be prepaid. Answers to the questions will be mailed to all participants, andcertificates of credit will be sent to participants who successfully complete each exam. Please be sure to make a photocopy of theexam for your records before submitting it to the ASCN.
Article: Tucker KL, Qiao N, Scott T, Rosenberg I, Spiro A III. High homocysteine and low B vitamins predict cognitive decline inaging men: the Veterans Affairs Normative Aging Study. Am J Clin Nutr 2005;82:627–35.
Article: Ravaglia G, Forti P, Maioli F, et al. Homocysteine and folate as risk factors for dementia and Alzheimer disease. Am J ClinNutr 2005;82:636–43.
One hour of category 1 credit will be issued for successful completion of this entire exam.
CME exam
1. Which one of the following statements best describes relations among homocysteine concentrations and dementia?a. Persons with elevated homocysteine concentrations of any cause are at no greater risk of development of dementia or
Alzheimer disease.b. An elevated homocysteine concentration in a healthy elderly person increases the likelihood of development of dementia
or Alzheimer disease with further aging.c. Lowering homocysteine concentrations with folate, vitamin B-12, or vitamin B-6 has been shown to prevent dementia in
aging persons.d. Fortification of the US diet with folic acid has been shown to have a positive effect on decreasing the incidence of dementia
in aging persons.
2. Which one of the following statements is most likely to be true regarding mechanisms of worsening brain function in agingpersons with elevated serum homocysteine concentrations?a. Subclinical cerebrovascular disease is widely accepted as the cause of dementia in aging persons with high homocysteine
concentrations.b. Elevated brain homocysteine concentrations may increase neurotoxicity through activation of N-methyl-D-aspartate
receptors.c. Low concentrations of vitamin B-12, vitamin B-6, and folate are proven causes of dementia regardless of homocysteine
concentrations.d. There is no evidence of an association of elevated serum homocysteine and risk of dementia.
CME exam evaluation
1. Were the CME program objectives successfully met?a. Yesb. No
712 Am J Clin Nutr 2005;82:712–3. Printed in USA. © 2005 American Society for Clinical Nutrition

c. Partially (please explain)
2. Did you find this article and its CME questions relevant to your practice?a. Yesb. Noc. Partially (please explain)
3. Will completion of this CME exam affect the way that you treat your patients?a. Yes (please explain)
b. No
4. Was the information presented in this article objective, balanced, and free of commercial bias?a. Yesb. NoComments
CME EXAM 713

Continuing Medical Education
Objectives
After evaluating an article designated for Continuing Medical Education (CME) in the American Journal of Clinical Nutrition(AJCN), participants in the American Society for Clinical Nutrition (ASCN) CME program should be able to show that theirknowledge of clinical nutrition has increased. Participants should also be able to evaluate whether the clinical information providedin the CME-designated article is relevant to the provision of patient care.
Accreditation and credits
The ASCN is accredited by the Accreditation Council for Continuing Medical Education to provide continuing medical educationfor physicians. The ASCN designates each CME program for 1 hour of category 1 credit toward the American Medical Association(AMA) Physician’s Recognition Award. Each physician should claim only those hours of credit that he or she actually spent on theeducation program.
Instructions
Each issue of the AJCN will usually include at least 2 articles designated for CME credit. After reading the CME-designated article,select the best answer to each exam question listed below and complete the evaluation. To receive CME credit, you should return theexam and evaluation pages along with the CME Participant Response Form by August 31, 2006. Please fax the pages to the ASCN at301-634-7350 or mail them to the following address: American Society for Clinical Nutrition, CME Program, 9650 Rockville Pike,Bethesda, MD 20814. Note that all responses must be prepaid. Answers to the questions will be mailed to all participants, andcertificates of credit will be sent to participants who successfully complete each exam. Please be sure to make a photocopy of theexam for your records before submitting it to the ASCN.
Article: Schulze MB, Hoffmann K, Manson JE, et al. Dietary pattern, inflammation, and incidence of type 2 diabetes in women. Am JClin Nutr 2005;82:675–84.
One hour of category 1 credit will be issued for successful completion of this entire exam.
CME exam
1. Which one of the following statements is true regarding risk of type 2 diabetes in middle-aged women?a. Development of obesity is conducive to diabetes regardless of diet pattern.b. Smoking is an independent risk factor for development of diabetes.c. Both body weight and diet pattern influence the risk of diabetes.d. None of the above.
2. Which one of the following statements is true regarding relations among diet, chronic vascular inflammation, and risk of type2 diabetes in middle-aged women?a. Diet influences risk of diabetes but is not associated with vascular inflammation.b. Women with type 2 diabetes are likely to exhibit markers of inflammation regardless of diet pattern.c. A diet pattern high in sugar-sweetened soft drinks, refined grains, and processed meats is strongly associated with risks
of both vascular inflammation and type 2 diabetes.d. None of the above.
CME exam evaluation
1. Were the CME program objectives successfully met?a. Yesb. Noc. Partially (please explain)
2. Did you find this article and its CME questions relevant to your practice?a. Yesb. Noc. Partially (please explain)
714 Am J Clin Nutr 2005;82:714–5. Printed in USA. © 2005 American Society for Clinical Nutrition

3. Will completion of this CME exam affect the way that you treat your patients?a. Yes (please explain)
b. No
4. Was the information presented in this article objective, balanced, and free of commercial bias?a. Yesb. NoComments
CME EXAM 715

AJCN CME Participant Response Form
Participant information
Name
Mailing address
City State or province Zip or postal code
Country (if other than United States)
E-mail address Fax
Medical specialty
Payment information
Responses must be prepaid.
□ AJCN subscriber/ASCN member:
Please provide your member or customer ID number
$10 per exam � □ exams � $
□ Nonsubscriber:
$15 per exam � □ exams � $
Payment must be made by credit card; checks will not be accepted.
Credit card information
□ Visa □ MasterCard □ American Express
Credit card number
Expiration date
Signature
Please fax this page along with the CME exam and evaluation pages to the ASCN at 301-634-7350 or mail the pagesto the following address: American Society for Clinical Nutrition, CME Program, 9650 Rockville Pike, Bethesda, MD20814.
716 Am J Clin Nutr 2005;82:716. Printed in USA. © 2005 American Society for Clinical Nutrition
Related Documents