Eye (2021) 35:2386–2405 https://doi.org/10.1038/s41433-021-01614-x REVIEW ARTICLE Clinical electrophysiology of the optic nerve and retinal ganglion cells Oliver R. Marmoy 1,2,3 ● Suresh Viswanathan 4 Received: 17 March 2021 / Revised: 11 May 2021 / Accepted: 19 May 2021 / Published online: 11 June 2021 © The Author(s) 2021. This article is published with open access, corrected publication 2021 Abstract Clinical electrophysiological assessment of optic nerve and retinal ganglion cell function can be performed using the Pattern Electroretinogram (PERG), Visual Evoked Potential (VEP) and the Photopic Negative Response (PhNR) amongst other more specialised techniques. In this review, we describe these electrophysiological techniques and their application in diseases affecting the optic nerve and retinal ganglion cells with the exception of glaucoma. The disease groups discussed include hereditary, compressive, toxic/nutritional, traumatic, vascular, inflammatory and intracranial causes for optic nerve or retinal ganglion cell dysfunction. The benefits of objective, electrophysiological measurement of the retinal ganglion cells and optic nerve are discussed, as are their applications in clinical diagnosis of disease, determining prognosis, monitoring progression and response to novel therapies. Introduction The optic nerve and retinal ganglion cells (RGCs) are essential in the transmission of visual information through the intracranial pathway to the striate/primary visual (V1) cortex. Diseases of the optic nerve and RGCs therefore can lead to significant visual impairment and may be a primary pathology or secondary consequence of other conditions. Whilst ophthalmic imaging and psychophysical tests can provide insight into structural and behavioural sequelae of optic nerve dysfunction, functional assessments through electrophysiology provide an objective and quantitative approach to characterise these deficits directly at the level of optic nerve and RGCs. The electrophysiology of the optic nerve and RGCs has been well established through the Visual Evoked Potential (VEP) and Pattern Electroretinogram (PERG), and more recently with the Photopic Negative Response (PhNR) alongside other specialised techniques like the multifocal electroretinogram, PERG and VEP (mfERG, mfPERG, mfVEP) to provide a more detailed evaluation of the retinal locus and spatial extent of cellular dysfunction. These prospects are promising in the phenotyping and character- isation of optic nerve disease where other clinical infor- mation may not provide sufficient information. In this review, we discuss the electrophysiological basis of optic nerve and RGC disease and its role in investigating the site and extent of dysfunction to complement structural and psychophysical findings in disease. We start by defining our search strategy, followed by a description of the main electrophysiological techniques used to assess the optic nerve and RGCs, including their stimulus and recording parameters. We then discuss the clinical applications of these techniques to diseases or conditions affecting the optic nerve and RGCs, lastly concluding with diagnostic aids and dilemmas commonly encountered in ophthalmic and neuro- ophthalmic practice. Methods A comprehensive search of literature on Medline (PubMed), ScienceDirect, the Cochrane Library was performed by the authors. Search terms included respective diagnostic tests and their related terms or abbreviations (i.e. Visual* evoked potential OR VEP OR Visual* evoked response) against the clinical condition of interest (i.e. Optic neuritis OR demyelin* OR papillitis OR multiple sclerosis). Broad * Oliver R. Marmoy [email protected] 1 Clinical and Academic Department of Ophthalmology, Great Ormond Street Hospital for Children, London, UK 2 UCL-GOS Institute for Child Health, University College London, London, UK 3 Manchester Metropolitan University, Manchester, UK 4 College of Optometry, State University of New York, New York, NY, USA 1234567890();,: 1234567890();,:

Welcome message from author
This document is posted to help you gain knowledge. Please leave a comment to let me know what you think about it! Share it to your friends and learn new things together.
Transcript
Eye (2021) 35:2386–2405https://doi.org/10.1038/s41433-021-01614-x
REVIEW ARTICLE
Clinical electrophysiology of the optic nerve and retinal ganglion cells
Oliver R. Marmoy 1,2,3● Suresh Viswanathan4
Received: 17 March 2021 / Revised: 11 May 2021 / Accepted: 19 May 2021 / Published online: 11 June 2021© The Author(s) 2021. This article is published with open access, corrected publication 2021
AbstractClinical electrophysiological assessment of optic nerve and retinal ganglion cell function can be performed using the PatternElectroretinogram (PERG), Visual Evoked Potential (VEP) and the Photopic Negative Response (PhNR) amongst othermore specialised techniques. In this review, we describe these electrophysiological techniques and their application indiseases affecting the optic nerve and retinal ganglion cells with the exception of glaucoma. The disease groups discussedinclude hereditary, compressive, toxic/nutritional, traumatic, vascular, inflammatory and intracranial causes for optic nerveor retinal ganglion cell dysfunction. The benefits of objective, electrophysiological measurement of the retinal ganglion cellsand optic nerve are discussed, as are their applications in clinical diagnosis of disease, determining prognosis, monitoringprogression and response to novel therapies.
Introduction
The optic nerve and retinal ganglion cells (RGCs) areessential in the transmission of visual information throughthe intracranial pathway to the striate/primary visual (V1)cortex. Diseases of the optic nerve and RGCs therefore canlead to significant visual impairment and may be a primarypathology or secondary consequence of other conditions.Whilst ophthalmic imaging and psychophysical tests canprovide insight into structural and behavioural sequelae ofoptic nerve dysfunction, functional assessments throughelectrophysiology provide an objective and quantitativeapproach to characterise these deficits directly at the level ofoptic nerve and RGCs.
The electrophysiology of the optic nerve and RGCs hasbeen well established through the Visual Evoked Potential(VEP) and Pattern Electroretinogram (PERG), and morerecently with the Photopic Negative Response (PhNR)
alongside other specialised techniques like the multifocalelectroretinogram, PERG and VEP (mfERG, mfPERG,mfVEP) to provide a more detailed evaluation of the retinallocus and spatial extent of cellular dysfunction. Theseprospects are promising in the phenotyping and character-isation of optic nerve disease where other clinical infor-mation may not provide sufficient information.
In this review, we discuss the electrophysiological basisof optic nerve and RGC disease and its role in investigatingthe site and extent of dysfunction to complement structuraland psychophysical findings in disease. We start by definingour search strategy, followed by a description of the mainelectrophysiological techniques used to assess the opticnerve and RGCs, including their stimulus and recordingparameters. We then discuss the clinical applications ofthese techniques to diseases or conditions affecting the opticnerve and RGCs, lastly concluding with diagnostic aids anddilemmas commonly encountered in ophthalmic and neuro-ophthalmic practice.
Methods
A comprehensive search of literature on Medline (PubMed),ScienceDirect, the Cochrane Library was performed by theauthors. Search terms included respective diagnostic testsand their related terms or abbreviations (i.e. Visual* evokedpotential OR VEP OR Visual* evoked response) against theclinical condition of interest (i.e. Optic neuritis ORdemyelin* OR papillitis OR multiple sclerosis). Broad
* Oliver R. [email protected]
1 Clinical and Academic Department of Ophthalmology, GreatOrmond Street Hospital for Children, London, UK
2 UCL-GOS Institute for Child Health, University College London,London, UK
3 Manchester Metropolitan University, Manchester, UK4 College of Optometry, State University of New York, New York,
NY, USA
1234
5678
90();,:
1234567890();,:
search terms were used to capture a wide range of literature.In circumstances where standard search terms retrieved fewresults, search terms were broadened to include more gen-eral electrophysiological terms (i.e. electrophysio* ORelectroret* or electrodiag*). No limits were applied inrelation to publication dates but only articles available in theEnglish language were reviewed. Each article had a full-textreview and was critically appraised by the authors. Addi-tional review of references within qualifying publicationswas also undertaken in search of any further publishedworks relevant to this review. The main interests to thisreview were studies employing electrophysiological tech-niques within the main clinical conditions, from which theauthors used their clinical experience to determine the mostrelevant and clinically useful findings to this review. Ani-mal studies were generally excluded unless of particularimportance to underpinning science or methodology.
Electrophysiological tests of optic nerve andretinal ganglion cell function
Visual evoked potential (VEP)
The VEP is an important clinical test for assessing thefunctional integrity of the visual pathway from the retina tothe striate cortex (primary visual cortex or V1). As such,this test has been extensively used in the evaluation ofophthalmic, neurological and systemic disease. The VEP isproduced from activation of cortical neurons in response toafferent pathway stimulation, which is recorded with elec-trodes placed over the occiput. Typically, VEPs are recor-ded to a high contrast pattern or diffuse flash stimuli. Forpattern VEPs, a checkerboard or grating stimulus isreversed in contrast over time whilst maintaining a constantmean luminance (PR-VEP), or alternatively the
checkerboard appears and disappears on a background withthe same mean luminance known as the pattern onset-offsetVEP (PO-VEP), which provide information regarding thefunction of the macular pathways. Flash VEPs (F-VEP) aretypically recorded to a strobe or LED flash stimulator and isuseful in the examination of the generalised visual pathwayfunction, particularly in eyes with poor optical qualitywhere retinal image contrast is degraded.
The typical PR-VEP waveform comprises a triphasicresponse, with components named according to their relativepolarity and peak-time. A major positive peak is seen around100ms (P100), with preceding and following negativitiesaround 75ms (N75) and 135ms (N135) respectively (Fig. 1).The PO-VEP waveform is more complex, with onset C1, C2and C3 components which are more variable between indivi-duals and change in shape during the normal lifespan [1], withoffset responses typically demonstrating a triphasic waveformsimilar to the PR-VEP (Fig. 1). The F-VEP waveform is alsocomplex comprising of multiple peaks and troughs named N1,P1, N2, P2, N3 and P3 respectively. The major positive peak(P2) and preceding negativity (N2) are most commonly used inclinical assessment as these waveforms are most robust. Theinterpretation of responses is performed by assessing theresponse amplitude (from the preceding negativity or baseline),peak-time/latency, morphology and transoccipital distribution.The amplitude and latency of responses should be compared toreference values, which are collected or validated to the locallaboratory environment as with all clinical visual electro-physiology techniques. Generally, different conditions of theoptic nerve or RGCs may affect response amplitude or latencypreferentially, the VEP has a large macular contribution andcan be affected by anything upstream in the visual pathway, forexample a maculopathy may degrade responses as well asprimary RGC disease. Abnormalities of the VEP shouldtherefore always be explored with the PERG to elaborate onthe site and extent of dysfunction.
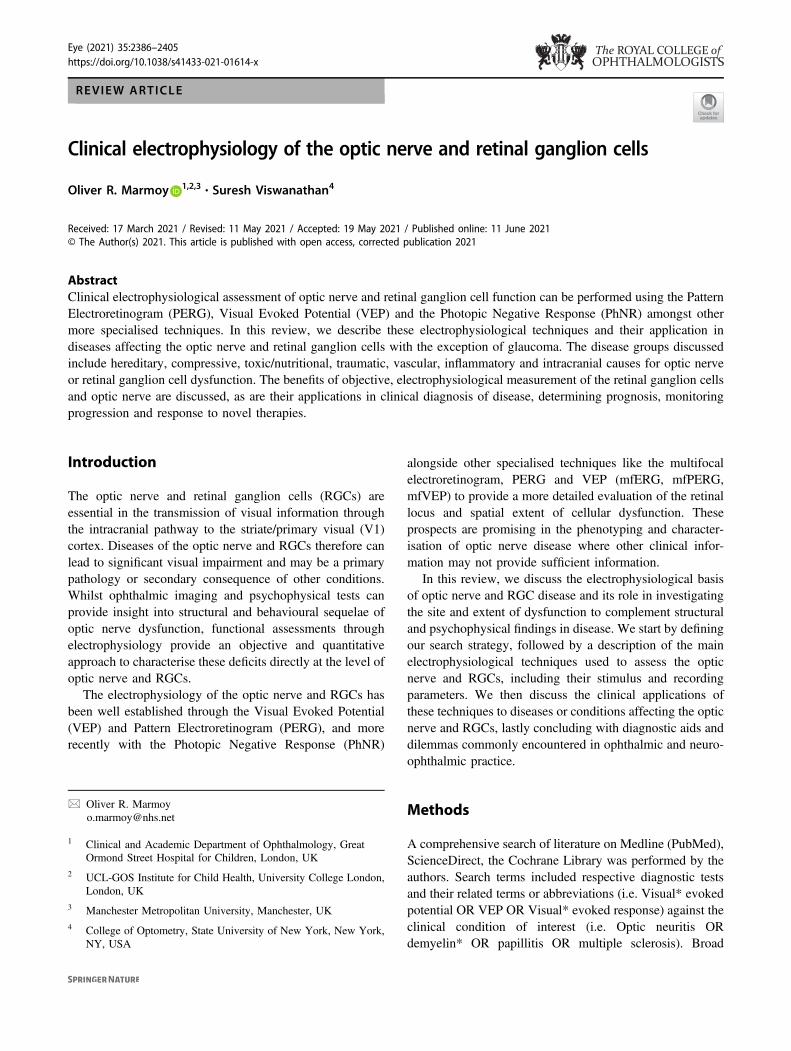
Fig. 1 Illustrative waveform examples for the major electro-physiological tests in the assessment of optic nerve and retinalganglion cell (RGC) function. In all panels, relative amplitudes areobserved in the top right, with timings seen on the X-axis. The leftmost panel shows the transient pattern electroretinogram (PERG),following the stimulus (red arrow) an initial N35 negativity is seenfollowed by the main positivity (P50) and large later negativity (N95).The photopic negative response (PhNR) is next seen, recorded to adiffuse flash stimulus (red arrow). The a- and b-waves of the ERG are
seen of the typical flash ERG, followed by the late negativity known asthe PhNR. In the central panel the pattern reversal VEP (PR-VEP) isseen, a triphasic response with N75, P100 and N135 peaks respec-tively. The pattern onset-offset VEP (PO-VEP) response is seen to alonger stimulus (red bar), the initial response comprises the onset VEPof C1-C3 components, later followed by the offset VEP C4-C6components. Lastly the flash VEP (F-VEP) is seen to a diffuse flashstimulus (red arrow), followed by a series of positive-negativedeflections, with the major N2 and P2 peaks observed.
Clinical electrophysiology of the optic nerve and retinal ganglion cells 2387

There are regularly reviewed international standards forperforming clinical VEPs [2]. Whilst these standards pro-vide the minimum recording requirements for performing aVEP, it is emphasised that these are a set of minimumstandards and those performing VEPs should expand onthese standards with additional protocols to address morecomplex clinical questions [3]. Interpretation of VEPsshould rarely be used in isolation as this could lead tomisdiagnosis. For example, even in suspected neurologicaldysfunction an abnormality of a P-VEP is not specific tooptic nerve disease, as the response is subject to goodmacular integrity and therefore assesses the visual pathwayfrom the macula to striate cortex and should be exploredwith the PERG where abnormal.
The PR-VEP has relatively low inter- and intra-subjectvariability which has facilitated its clinical use, whereas thePO-VEP and F-VEP can be more variable between indivi-duals and therefore limits their clinical applications [4–7].Nevertheless, these stimuli do have benefits in the assess-ment of patients with poor vision, low cooperation, detec-tion of intracranial pathway dysfunction and inter-oculardifferences. PR-VEPs are largely dominated by input fromthe macula, with expanded representation of the centralfield, which is scaled topographically known as corticalmagnification [8, 9]. As such, the PR-VEP shows a U-shaped spatial tuning function against check width, along-side being modulated by stimulus luminance, contrast andfield size [10]. These properties can be used to a greatadvantage in some circumstances to exceed ISCEVrecording standards, for example recording PR-VEPs to arange of check widths or to reduced stimulus contrast canincrease diagnostic sensitivity, with VEP abnormalitiessometimes preceding structural change in optic nerve dys-function, which will be discussed in more detail later in thisreview [11–15].
It should also be noted that the pattern VEP in clinicalpractice is typically recorded to an achromatic patternstimulus, but it is possible to use chromatic stimuli toassess parvocellular and koniocellular parallel pathwaysof the visual system using red-green or blue-yellow sti-muli respectively. Chromatic VEPs have been used toidentify colour processing dysfunction in demyelinatingdisease [16–18], LHON [19], Glaucoma [20], Parkinsonsdisease [21] and congenital colour blindness [22]. Theiruse is intriguing in conditions of the optic nerve andRGCs causing dyschromatopsia or more selective RGCpathway deficits. However, the stimuli required for testingare technically challenging to achieve, requiring repro-ducible spectral stimulus properties, isoluminance,alongside age- and ethnicity-controlled reference data toallow for macula pigment and the effects on cone funda-mentals which has overall limited their widespread clin-ical use [23].
Pattern electroretinogram (PERG)
The PERG provides information regarding macula andRGC function and thus has a role in the investigation ofboth ophthalmic and neurological disease. The PERG isable to delineate the site of dysfunction in those patientswith abnormal PVEPs, quantify the extent of dysfunction,and to provide spatial information regarding the functionalvisual field. The transient PERG is typically produced to areversing checkerboard or grating stimulus with a constantmean luminance presented at ~4 rev/sec, with the generatedresponse comprised of a sometimes ill-defined small initialnegativity (N35), followed by a major positivity around 50ms (P50) and large later negativity around 95 ms (N95)(Fig. 1). The P50 component has contributions from boththe outer- as well as inner-retinal neurons, including theRGCs. Conversely, the N95 component is solely generatedby spiking activity of RGCs and is sensitive to retinal nervefibre degeneration and RGC loss [24, 25].
The PERG is a small signal and typically recorded withcorneal electrodes, which do not affect the visual optics.Skin electrodes are not routinely used due to the poorsignal-to-noise ratio, but do have advantages in those unableto tolerate corneal electrodes such as children [26]. Sincethe PERG is elicited in response to contrast modulation of apattern stimuli, optimal refractive correction is necessary toensure that the retinal image contrast is not degraded. ThePERG is more sensitive to contrast changes and defocusthan the PVEP, likely due to the PERG being a reflection ofdirect retinal activity to pattern stimuli, whereas for thePVEP several post-retinal processes occur which have somemodulation and compensation for low contrast and defocus,alongside cortical magnification, making the PVEP morerobust than the PERG to these changes. The PERG istypically recorded to a standard 15° field size, but anadditional large field of 30° may also be used which canprovide further topographic information of paramacularfunction [27]. Furthermore, simultaneous recording along-side a PR-VEP allows control for fixation and defocus,therefore it can be useful in patients with functional visualloss. The PERG to high temporal frequencies (typically>10rev/sec) generates a steady-state response, which is notwidely used in clinical practice but does have some clinicalapplications in conditions like Glaucoma (reviewed else-where within this issue). As with the VEP, there are inter-national minimum standards for recording the clinicalPERG [28].
The interpretation of the PERG provides assessment of theoverall outer retinal and RGC/optic nerve pertaining to themacula. A reduction in amplitude of the P50 component withnormal or slightly delayed peak-time and preservation of theN95:P50 ratio is reflects dysfunction anterior to the RGCs (i.e.cone photoreceptors or bipolar cells) or reduced retinal image
2388 O. R. Marmoy, S. Viswanathan
contrast. Conversely, a predominant reduction in the N95amplitude with an intact P50, which reduces the N95:P50 ratio,is characteristic of RGC and optic nerve dysfunction (Fig. 1)[25]. Importantly however, in severe RGC disease there can bereduction in P50 amplitude and shortening of peak-time, as theP50 component has some contributions from RGCs [24]. TheP50 component should therefore not be extinguished unlessthere is concomitant dysfunction anterior to the RGCs (i.e.from a maculopathy). A normal PERG but abnormal PR-VEPlocalises dysfunction to outside of the central RGCs or pos-teriorly along the visual pathway.
Photopic negative response (PhNR)
The PhNR is a slow negative potential that follows the b-waveof the light-adapted flash ERG and originates as a consequenceof spiking activity of inner-retinal neurons, predominantly theRGCs [29]. While the PhNR can be elicited with the ERGstimuli used in standard clinical testing [30], the optimal sti-mulus that elicits the maximal amplitude reduction in RGCdysfunction is a red flash on a rod-saturating blue background[31, 32]. The PhNR amplitude is typically measured at itstrough (or at a fixed time in the range of 65–75ms after theonset of the test flash) from the baseline [33] (Fig. 1). Othermethods of evaluating the PhNR amplitude includes mea-surement from the trough to the peak of the preceding b-waveor expressing this value as a ratio of the b-wave amplitude[29, 34–36]. The PhNR is typically elicited with a full-fieldflash stimuli and consequently reflects the summed activity ofRGCs across the entire retina and cannot determine the spatiallocalisation of the RGC defect. Typical recording parametersare included in the ISCEV extended protocol [33]. However,having the responses of retinal bipolar cells and cone
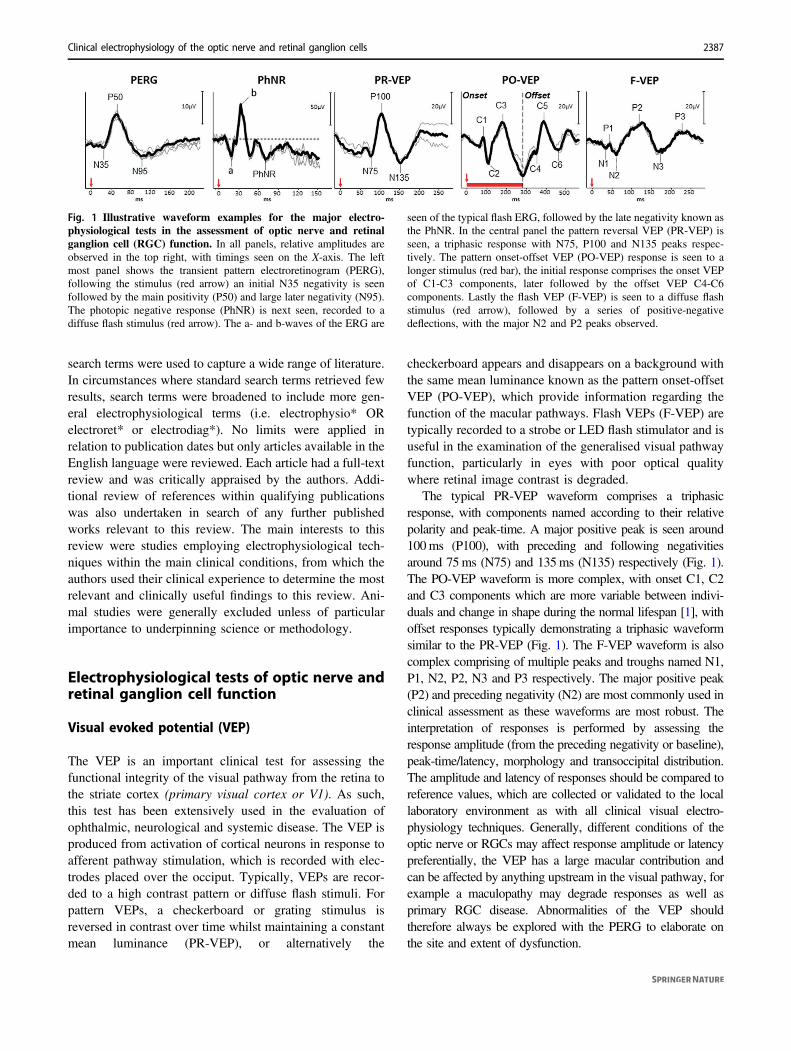
photoreceptors within the same ERG waveform is useful todiscern the functionality of the neurons that provide input to theRGCs. In addition, since the visual stimulus is diffuse, theresponses are not affected by optical defocus and thus refractivecorrection is not required, furthermore this may aid in theidentifying generalised RGC loss across the retina while thePERG is normally limited to the macula (Fig. 2).
Multifocal techniques
The mfERG employs computational techniques that allowobtaining sub-microvolt focal ERG responses simulta-neously from multiple retinal areas within a relatively shortrecording time [37]. The mfERG responses are organised inkernels with responses increasing in their degree of com-plexity with increasing kernel orders. The first-order kernelresponses that are typically analysed with standard clinicalmfERG testing [38] does not contain obvious RGCresponses. However, more sophisticated algorithms allowthe separation of an Optic Nerve Head Component from thefirst-order kernel responses which in turn is abolished ineyes with optic nerve abnormalities [39]. Variations fromstandard mfERG stimulation techniques can allow record-ing PhNRs from discrete retinal regions [40, 41].
The multifocal recording technique can be combinedwith the contrast reversal of pattern stimulus elements,scaled in size across the visual field to reflect the corticalmagnification factor, to enable recording focal VEPresponses from the visual cortex [42, 43]. This technique iscommonly referred to as the multifocal VEP (mfVEP) andallows topographical analysis of the VEP through thedetection of regional changes in amplitude and waveformdelay, that may not be reflected in the gross potentialsmeasured with conventional VEP recording.
Similarly, mfERG recordings to a contrast reversal ofpattern stimuli from discrete retinal regions termed themultifocal PERG (mfPERG) demonstrate second orderkernel responses with the waveform shape resembling thatof the conventional transient PERG for slower stimulationsequences [44]. There is compelling evidence to support thenotion that the mfPERG response originates from activity ofinner-retinal neurons and is likely generated at the opticnerve head [45, 46]. While multiple studies have demon-strated the reduction of mfPERG amplitude in several dis-ease conditions, its ability to detect focal defects as opposedto a generalised reduction may be disease specific [45, 47–52].
Other methods
Neuronal contributions to the full-field flash ERG can alsobe elicited under dark-adapted conditions. The ScotopicThreshold Response (STR) is an ERG response with
Fig. 2 Stimulus conditions for the pattern ERG (PERG) andPhotopic Negative Response (PhNR) relative to the retinal topo-graphy from an optomap image. This figure illustrates the full-fieldnature of the PhNR (red circle) being a pan-retinal response, whereasthe PERG is recorded to a central stimulus subtending 30° (grey box)or 15° (black box) of the central retina respectively.
Clinical electrophysiology of the optic nerve and retinal ganglion cells 2389
negative polarity and a slower time-course than the PhNRthat can be elicited with very dim flashes of light, close tothe absolute visual threshold under strictly dark-adaptedconditions [53, 54]. The STR reflects a combination ofRGC and amacrine cell responses mediated by the rodpathway. This ERG measure has not gained clinical utilitymainly due to dark-adaptation requirements.
The oscillatory potentials (OPs) are high frequencyresponses predominantly of amacrine cell origin [55, 56]typically measured in the range of 70–300 Hz in the stan-dard clinical ERG [30]. The OPs manifest as wavelets onthe ascending limb of the b-wave of the flash ERG that canbe seen for ERG measurements under both dark- and light-adapted conditions. While the OPs are generally associatedwith amacrine cells, the oscillations themselves are con-sidered to be modulations of bipolar cell responses byinhibitory feedback of amacrine cells [57] and is not furtherdiscussed in this review.
Clinical applications
Hereditary optic neuropathies and primary retinalganglion cell disease
Autosomal Dominant Optic Atrophy (ADOA) is a degen-erative condition of the optic nerve that affects both eyesand is characterised by gradual deterioration of vision,typically starting in early childhood [58–60]. Mutation ofthe OPA1, OPA3, genes that code for proteins associatedwith electron transport and ATP synthesis in the mito-chondrial inner membrane and three loci (OPA4, OPA5,OPA8) underlie the genetic defect in ADOA [58]. Inaddition, defects with other loci like OPA2, OPA6 andOPA7 genes underlie x-linked and recessive inheritance ofoptic atrophy [58].
The severity of visual impairment is variable from a mildreduction in visual acuity to blindness and around 20% ofpatients with ADOA also manifest neurological symptomsoutside the visual system [58]. ADOA patients developvisual field defects that typically arise as central or cen-trocecal scotomas, with commensurate peripapillary RNFLthinning on OCT measurements alongside optic disc pallor[61]. Visual rehabilitation with low vision aids and geneticcounselling currently remain the focus for management ofthis condition [61], although there is promise in animalmodels for gene therapy [62].
Visual electrodiagnostic techniques complement thebehavioural assessment of visual function in ADOA. Spe-cifically, it pinpoints the functional deficit to the level of theRGCs and the optic nerve and is also quite useful as areliable objective measure of visual function when beha-vioural testing is unreliable, for example in children. PR-
VEP waveforms are delayed with reduced amplitude inADOA patients with mild to moderate severity and can beextinguished in advanced cases [63–65]. Furthermore, thewaveform may become bifid or of a ‘p-n-p’ morphologydue to enhancement of paramacular PR-VEP componentswhich can occur with reduced central visual field sensitivity[66–68]. The N95 component of the PERG is reduced butthe P50 component is mostly normal or reduced in severecases where the N95 is extinguished. Analysis of the PR-VEP changes in combination with the alteration of the N95and P50 components of the PERG recordings can confirmthe locus of the functional deficit in ADOA to the level ofRGCs and the optic nerve. The PhNR of the flash ERG isreduced in ADOA with sparing of the a- and b-waves,reiterating the RGCs as the locus of the functional deficit[69, 70]. While the PhNR for both full-field and focal flashERG recordings are reduced in ADOA, the PhNR recordedto focal stimulation demonstrates a higher sensitivity fordetection of ADOA, approaching the sensitivity estimatesof the PERG [70]. These findings highlight the importanceof using focal stimulation for optimal electrophysiologicaltesting of ADOA patients who typically demonstrate centralvisual field defects.
Leber’s hereditary optic neuropathy (LHON) is anothercondition characterised by the selective degeneration ofRGCs due to mutations associated with genes encoding formitochondrial proteins involved in oxidative phosphoryla-tion [71]. In majority of the cases, the genetic defect inLHON is associated with the mutation of mitochondrialDNA 11778G>A, 14484T>C and 3460G>A [72]. Thecondition is characterised by bilateral painless reduction invisual acuity with development of centrocecal scotomaresulting from papillomacular nerve fibre bundle degen-eration and is typically seen in men in the second or thirddecade of life [60, 61]. Retinal and circumpapillary tel-angiectasia, increases in RNFL thickness and pseudo-oedema of the optic disc can be observed prior to sympto-matic vision loss [73–75]. Optic disc pallor can be observedsubsequently starting with the inferotemporal quadrant withprogressive RNFL thinning [75]. While visual prognosiswas generally considered to be poor in symptomatic LHONcases, newer treatments such as Idebenone have beendemonstrated to improve visual outcomes through stimu-lation of ATP synthesis and free radical scavenging inmitochondria [76]. Further, at the time of writing earlystudies of gene therapy appear promising in humans[77, 78].
In LHON cases with clinically distinct optic atrophy theP100 component of the PR-VEP, if not extinguished, isdelayed with reduced amplitude and the PERG demon-strates reduced amplitude of the N95 component [79–81].PR-VEP and PERG abnormalities can manifest in affectedeyes prior to clinically visible temporal pallor of the optic
2390 O. R. Marmoy, S. Viswanathan
disc, with PR-VEP alterations being more prevalent thanPERG alterations [81]. Interestingly, the amplitude of theN95 component of the PERG is selectively reduced in eyesof some patients classified as LHON carriers, based onincomplete penetrance in the absence of VEP abnormalities,leading to question whether the PERG amplitude reductionrepresents subclinical changes and could serve as a markerfor those who may convert to the acute phase [80]. Indi-cations of subclinical changes in some LHON carriers isalso supported by abnormal findings with specialised psy-chophysical testing [19, 82]. The PhNR amplitude is alsoreduced in LHON patients with sparing of the a- and b-waves localising the functional deficit to the RGCs withmeasurements from baseline as opposed to the peak of theb-wave being more sensitive [19, 83, 84]. As with thePERG, the PhNR amplitude is also reduced in the eyes ofsome LHON carriers with the amplitudes showing a gradedeffect with RNFL thickness [83, 84]. In addition to its use inthe assessment of RGC function at the time of diagnosis,visual electrophysiology techniques are also useful inassessing the efficacy new treatments for LHON [76]. Anillustrative case of a patient with LHON is seen in Fig. 3.
There are several rare inherited disorders that includevisual dysfunction where the PhNR is reduced and canassist in the simultaneous evaluation of optic nerve andretinal function. Hereditary Motor and Sensory NeuropathyType VI is a condition where the PhNR is reduced. It is asevere form of Charcot-Marie-Tooth disease type 2Aresulting from mutations in the MFN2 gene that codes forproteins in the outer mitochondrial membrane and thecondition is characterised by peripheral axonal neuropathywith up to 20% of patients with the severe form of thiscondition also manifesting optic atrophy [85, 86]. Patientswith late onset visual loss have a better chance of visualacuity improvement compared to patients with early onsetof visual loss [85]. However, even patients with late onsetvisual loss who regain near normal visual acuity candemonstrate a severe reduction in the PhNR amplitudewhen the a- and b-waves are in the normal range suggestingthe value of electrodiagnostic testing in understanding thefull extent of the optic nerve functional deficit [87]. Inter-estingly, PR-VEP abnormalities have also been observed inCharcot-Marie Tooth disease of other genotypes, somewithout optic atrophy [88–91].
EAST syndrome is another genetic disorder where thePhNR amplitude is reduced [92]. This syndrome char-acterised by Epilepsy, Ataxia, Sensorineural deafness, andTubulopathy resulting from a mutation of the KCNJ10 genecoding for Kir4.1, an inward rectifying potassium channelsin the brain, inner ear and kidney [93]. These inward rec-tifying potassium channels are also expressed on retinalglial cells, which play a role in the siphoning and redis-tribution of potassium ions in the extracellular space [94]. A
selective reduction in the PhNR amplitude in addition toproviding confirmation of a deficit in retinal function insymptomatic patients reiterates previous hypotheses of thePhNR ERG potential also reflecting a glial mediated currentsecondary to extracellular potassium, resulting from RGCactivity [29, 95]. Thus, in conditions such as EAST syn-drome when the PhNR amplitude reduction can be prone tomore than one interpretation, additional tests such as thePERG and VEP will be useful to assess the full extent ofRGC and optic nerve function.
Compressive, infiltrative, toxic andnutritional optic neuropathies
Compressive optic neuropathies or those secondary to spaceoccupying lesions can cause significant disruption to opticnerve and RGC physiology. Intracranial tumours may affectany portion of the visual pathway and, as such, the VEP iswell suited to provide assessment in localising the pathwaylesion and information of pathway integrity. Whilst thisreview focuses on conditions affecting the optic nerve andRGC’s, it is prudent to discuss lesions affecting the entirevisual pathway to the striate cortex which may later inflictdysfunction of the optic nerve or RGCs, for example due toretrograde degeneration of RGCs. As such, VEPs are auseful tool in the examination of the intracranial visualpathway especially when used in conjunction with thePERG and/or PhNR.
When utilising a transoccipital array of electrodes, onecan use the lateralising features of VEP distributions toidentify chiasmal and retrochiasmal pathway dysfunction.The lateralisation of the flash VEP has been demonstrated inboth chiasmic and retrochiasmic lesions. Seminal studiesusing F-VEP in patients with homonymous field defectshave demonstrated the major positive peak to becomealtered in lesions relating to the underlying field defect[96, 97]. As such, in lesions of the chiasm, one can observea ‘crossed’ asymmetry of pattern or F-VEPs, whereby thetransoccipital asymmetry will alter its lateralisation depen-dent on the eye stimulated [98]. These lateralising featureshave been adopted clinically to identify both chiasmalmisrouting and a paucity of functional crossing fibres at thechiasm resulting from developmental or lesion related def-icits of the chiasm [98–101]. The lateralising features of theVEP can be also used in retrochiasmic lesions using a flashor pattern stimulus to produce an ‘uncrossed’ asymmetry(i.e. a transoccipital asymmetry which remains staticregardless of the eye stimulated) [102–106]. However,hemifield PR-VEPs are a far more advantageous method forinvestigating these intracranial visual pathway abnormal-ities [107]. One must be aware that, with a large stimulusfield, large check size and a mid-frontal reference electrode,
Clinical electrophysiology of the optic nerve and retinal ganglion cells 2391
the paradoxical lateralisation phenomenon occurs with PR-VEPs, whereby the major positivity is observed over theocciput contralateral to the generating hemisphere [108].This phenomenon is not observed in the pattern onset VEP,but has been observed in the pattern offset VEP [109].Selective stimulation of the right- or left-hemifield canisolate the visual pathway contributions and allow locali-sation of the pathway dysfunction site, for example a bi-temporal hemifield loss in the PR-VEP would suggestchiasmal dysfunction, whereas a homonymous left hemi-field loss would indicate a right hemisphere dysfunction.Whilst beyond the scope of this review, the benefits ofmultichannel VEPs in the investigation of intracranialpathway abnormalities are encouraged and are discussed
elsewhere within this issue, particularly of benefits inpatients unable to undertake visual field examination.
Compression of the anterior visual pathway can be froma variety of causes, for example optic pathway glioma,craniopharyngioma, haemangiomas, pituitary adenoma,meningiomas or cerebral aneurysms near the visual pathwaywhich may exert pressure on the optic nerve, some of whichbeing infiltrative. The pattern of visual loss in anteriorvisual pathway lesions can affect both eyes, for examplewhere the chiasm or tracts are affected, or one eye, forexample where the globe or optic nerve are unilaterallyaffected. Several studies of VEPs have investigated thepattern and flash VEP in compressive lesions of the anteriorvisual pathways [106, 107, 110–113], including
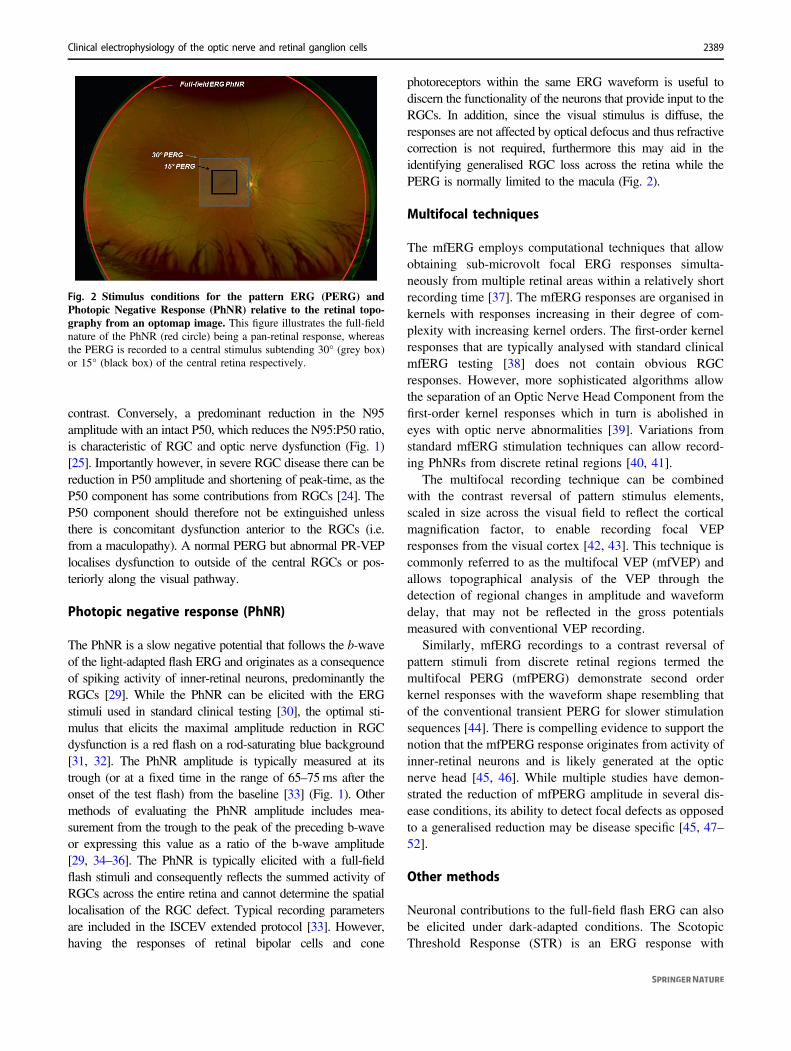
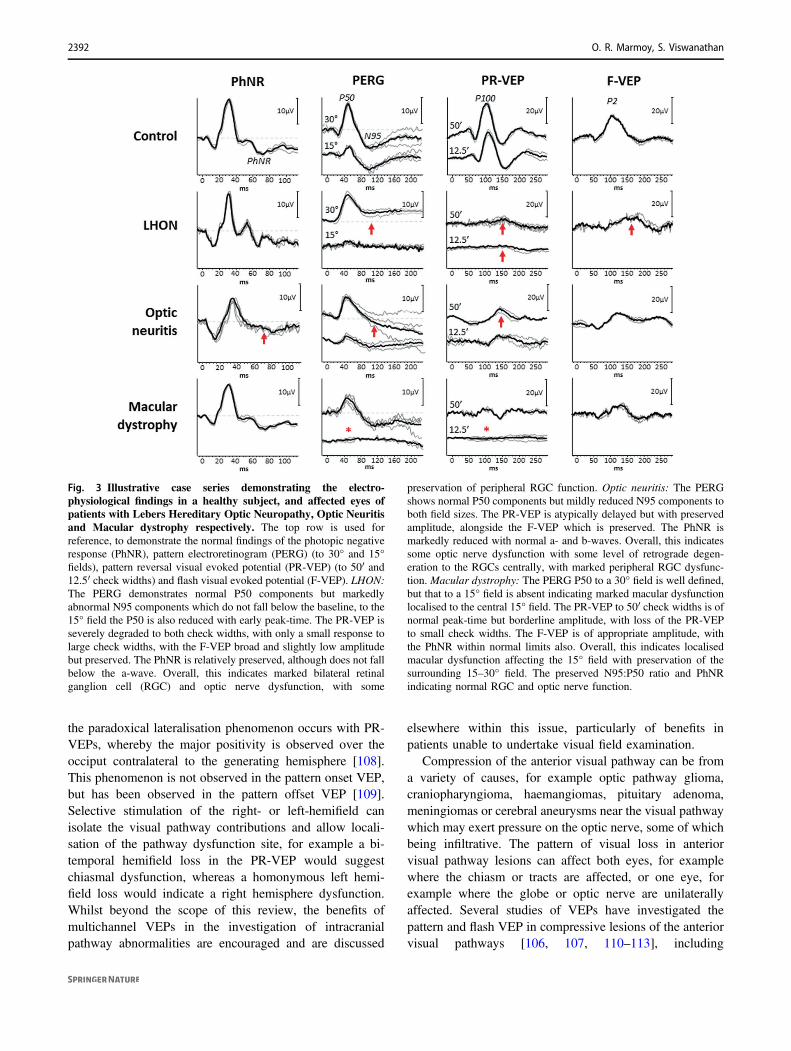
Fig. 3 Illustrative case series demonstrating the electro-physiological findings in a healthy subject, and affected eyes ofpatients with Lebers Hereditary Optic Neuropathy, Optic Neuritisand Macular dystrophy respectively. The top row is used forreference, to demonstrate the normal findings of the photopic negativeresponse (PhNR), pattern electroretinogram (PERG) (to 30° and 15°fields), pattern reversal visual evoked potential (PR-VEP) (to 50′ and12.5′ check widths) and flash visual evoked potential (F-VEP). LHON:The PERG demonstrates normal P50 components but markedlyabnormal N95 components which do not fall below the baseline, to the15° field the P50 is also reduced with early peak-time. The PR-VEP isseverely degraded to both check widths, with only a small response tolarge check widths, with the F-VEP broad and slightly low amplitudebut preserved. The PhNR is relatively preserved, although does not fallbelow the a-wave. Overall, this indicates marked bilateral retinalganglion cell (RGC) and optic nerve dysfunction, with some
preservation of peripheral RGC function. Optic neuritis: The PERGshows normal P50 components but mildly reduced N95 components toboth field sizes. The PR-VEP is atypically delayed but with preservedamplitude, alongside the F-VEP which is preserved. The PhNR ismarkedly reduced with normal a- and b-waves. Overall, this indicatessome optic nerve dysfunction with some level of retrograde degen-eration to the RGCs centrally, with marked peripheral RGC dysfunc-tion. Macular dystrophy: The PERG P50 to a 30° field is well defined,but that to a 15° field is absent indicating marked macular dysfunctionlocalised to the central 15° field. The PR-VEP to 50′ check widths is ofnormal peak-time but borderline amplitude, with loss of the PR-VEPto small check widths. The F-VEP is of appropriate amplitude, withthe PhNR within normal limits also. Overall, this indicates localisedmacular dysfunction affecting the 15° field with preservation of thesurrounding 15–30° field. The preserved N95:P50 ratio and PhNRindicating normal RGC and optic nerve function.
2392 O. R. Marmoy, S. Viswanathan
intraoperatively during surgical decompression [114]. Thesestudies overall demonstrate that in compressive lesions ofthe anterior visual pathway the PR-VEP will becomedelayed, with variable degrees of amplitude loss, alongsidemorphology changes in the waveform. Interestingly it hasalso been demonstrated that VEPs can be abnormal even inthe absence of a measurable visual field defect or reductionin high contrast visual acuity [111, 115–117]. Furthermore,particularly for optic pathway gliomas, VEPs have highsensitivity for detecting functional abnormality [118, 119],which is particularly advantageous in children for whombehavioural perimetric testing is unreliable [120, 121]although their ability to monitor progression is less certain.Perhaps most relevant in compressive lesions are theaforementioned transoccipital distribution of VEPs, ideallyusing half-field stimuli, which is particularly important inthe investigation of delayed VEPs, as chiasmal or retro-chiasmal lesions are much less frequently observed indemyelinating disease [98, 122] (Fig. 4). The mfVEP hasalso been studied in compressive anterior pathway lesionsand tends to show similar changes to behavioural perimetricfindings [123–126], but are of debatable clinical use overexisting techniques due to their demanding technicalrequirements. Interestingly, the mfPERG has been demon-strated to show good correlation between amplitude anddegree of VF defect in chiasmatic lesions [49, 50].
The PERG in compressive lesions predominantly showsreduction in the N95 component, although P50 amplitudereduction is seen where PR-VEPs are severely abnormal[79]. It has also been demonstrated that PERG abnormal-ities are associated with worse visual outcome post-surgi-cally, as this reflects retrograde degeneration to the RGCs
rather than any transient or reversible visual loss[79, 127, 128]. The PhNR in compressive optic neuropathywas demonstrated in five patients where amplitude wasfound to be reduced similar to patients with AION [129].Following this finding, a later study by Moon et al. [130]demonstrated in 18 patients with chiasmal compression thatPhNR was reduced relative to controls but importantly thatthis correlated significantly with post-operative visual fieldsensitivity recovery, suggesting the PhNR has prognosticvalue. Moon et al. [131] also showed in their accompanyingwork that the PhNR reduction persisted and had someimprovement by six months, albeit this did not reach sta-tistical significance. The prognostic value of the PhNRagainst the PERG in predicting the recovery of visualfunction following treatment of compressive optic neuro-pathy is yet to be determined. The PhNR has also beenreported to be significantly reduced in childhood opticpathway glioma, and demonstrated a strong relationshipwith the mean RNFL thickness [132]. These authors alsoremarked how the PhNR recording was achievable in allchildren, whereas OCT examination was not possible inone-third of their cohort due to motion artefacts or scanquality, which is a valuable concern for paediatric practice.
Endocrinological disorders of the thyroid, such as inGraves disease, can give rise to thyroid-associated orbito-pathy (TAO). In TAO, the retro-orbital space can becomereduced due to muscular fibrosis, inflammation and fataccumulation which causes compression of the optic nerve,known as dysthyroid optic neuropathy (DON). In DON, thePERG can show early optic nerve involvement [133, 134]with N95 amplitude loss, although P50 reductions have alsobeen reported [134, 135]. VEP findings tend show latency
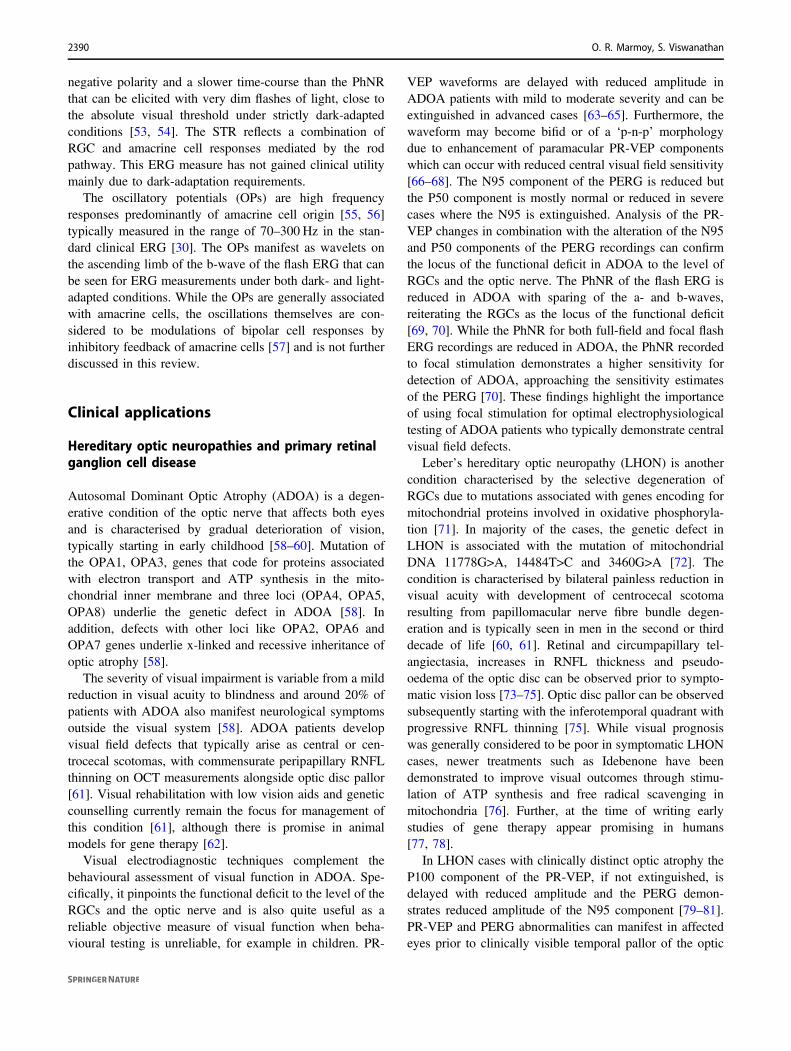
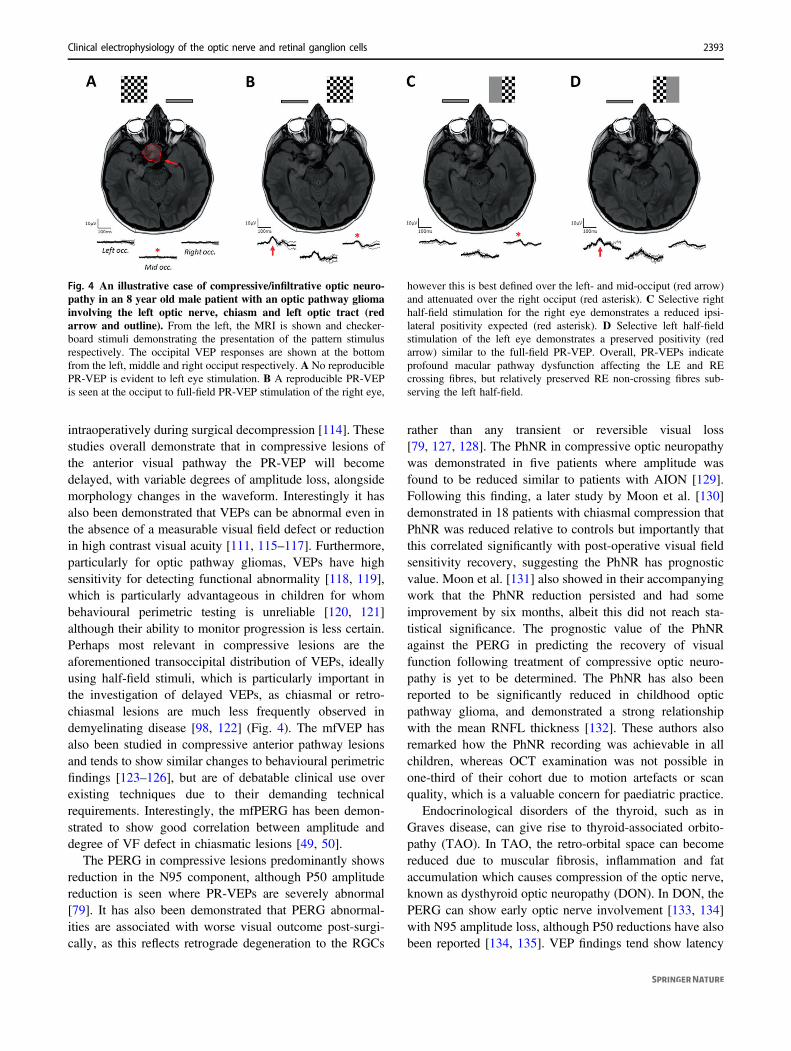
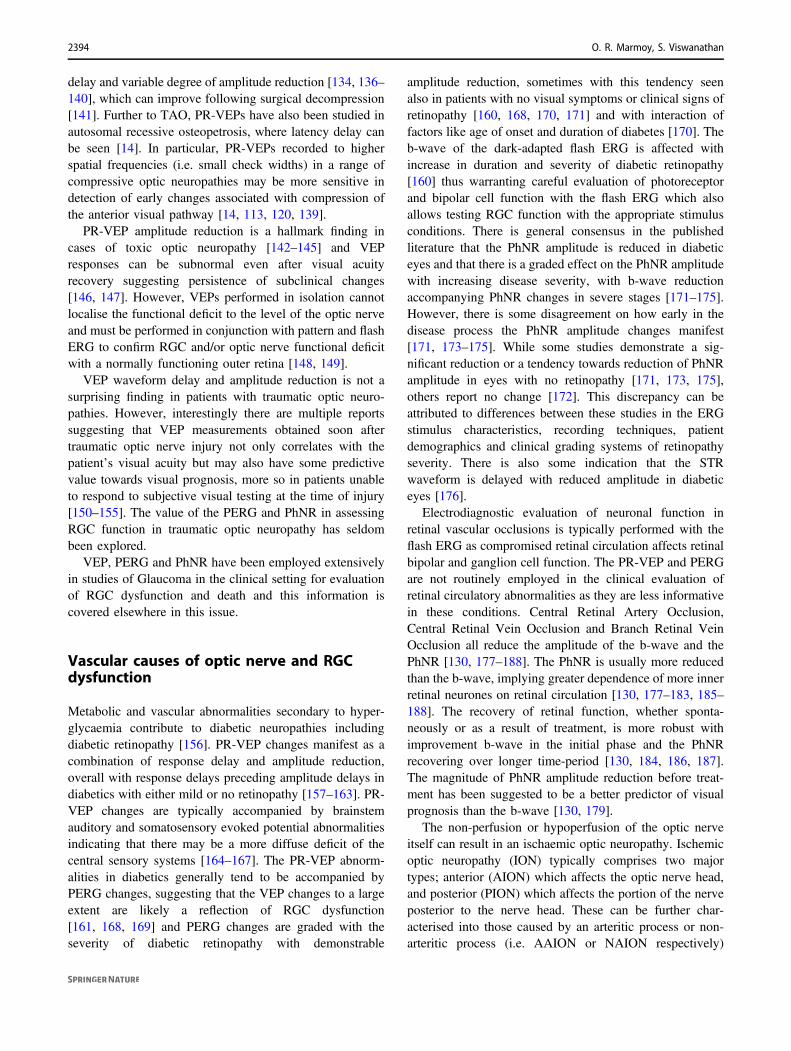
Fig. 4 An illustrative case of compressive/infiltrative optic neuro-pathy in an 8 year old male patient with an optic pathway gliomainvolving the left optic nerve, chiasm and left optic tract (redarrow and outline). From the left, the MRI is shown and checker-board stimuli demonstrating the presentation of the pattern stimulusrespectively. The occipital VEP responses are shown at the bottomfrom the left, middle and right occiput respectively. A No reproduciblePR-VEP is evident to left eye stimulation. B A reproducible PR-VEPis seen at the occiput to full-field PR-VEP stimulation of the right eye,
however this is best defined over the left- and mid-occiput (red arrow)and attenuated over the right occiput (red asterisk). C Selective righthalf-field stimulation for the right eye demonstrates a reduced ipsi-lateral positivity expected (red asterisk). D Selective left half-fieldstimulation of the left eye demonstrates a preserved positivity (redarrow) similar to the full-field PR-VEP. Overall, PR-VEPs indicateprofound macular pathway dysfunction affecting the LE and REcrossing fibres, but relatively preserved RE non-crossing fibres sub-serving the left half-field.
Clinical electrophysiology of the optic nerve and retinal ganglion cells 2393
delay and variable degree of amplitude reduction [134, 136–140], which can improve following surgical decompression[141]. Further to TAO, PR-VEPs have also been studied inautosomal recessive osteopetrosis, where latency delay canbe seen [14]. In particular, PR-VEPs recorded to higherspatial frequencies (i.e. small check widths) in a range ofcompressive optic neuropathies may be more sensitive indetection of early changes associated with compression ofthe anterior visual pathway [14, 113, 120, 139].
PR-VEP amplitude reduction is a hallmark finding incases of toxic optic neuropathy [142–145] and VEPresponses can be subnormal even after visual acuityrecovery suggesting persistence of subclinical changes[146, 147]. However, VEPs performed in isolation cannotlocalise the functional deficit to the level of the optic nerveand must be performed in conjunction with pattern and flashERG to confirm RGC and/or optic nerve functional deficitwith a normally functioning outer retina [148, 149].
VEP waveform delay and amplitude reduction is not asurprising finding in patients with traumatic optic neuro-pathies. However, interestingly there are multiple reportssuggesting that VEP measurements obtained soon aftertraumatic optic nerve injury not only correlates with thepatient’s visual acuity but may also have some predictivevalue towards visual prognosis, more so in patients unableto respond to subjective visual testing at the time of injury[150–155]. The value of the PERG and PhNR in assessingRGC function in traumatic optic neuropathy has seldombeen explored.
VEP, PERG and PhNR have been employed extensivelyin studies of Glaucoma in the clinical setting for evaluationof RGC dysfunction and death and this information iscovered elsewhere in this issue.
Vascular causes of optic nerve and RGCdysfunction
Metabolic and vascular abnormalities secondary to hyper-glycaemia contribute to diabetic neuropathies includingdiabetic retinopathy [156]. PR-VEP changes manifest as acombination of response delay and amplitude reduction,overall with response delays preceding amplitude delays indiabetics with either mild or no retinopathy [157–163]. PR-VEP changes are typically accompanied by brainstemauditory and somatosensory evoked potential abnormalitiesindicating that there may be a more diffuse deficit of thecentral sensory systems [164–167]. The PR-VEP abnorm-alities in diabetics generally tend to be accompanied byPERG changes, suggesting that the VEP changes to a largeextent are likely a reflection of RGC dysfunction[161, 168, 169] and PERG changes are graded with theseverity of diabetic retinopathy with demonstrable
amplitude reduction, sometimes with this tendency seenalso in patients with no visual symptoms or clinical signs ofretinopathy [160, 168, 170, 171] and with interaction offactors like age of onset and duration of diabetes [170]. Theb-wave of the dark-adapted flash ERG is affected withincrease in duration and severity of diabetic retinopathy[160] thus warranting careful evaluation of photoreceptorand bipolar cell function with the flash ERG which alsoallows testing RGC function with the appropriate stimulusconditions. There is general consensus in the publishedliterature that the PhNR amplitude is reduced in diabeticeyes and that there is a graded effect on the PhNR amplitudewith increasing disease severity, with b-wave reductionaccompanying PhNR changes in severe stages [171–175].However, there is some disagreement on how early in thedisease process the PhNR amplitude changes manifest[171, 173–175]. While some studies demonstrate a sig-nificant reduction or a tendency towards reduction of PhNRamplitude in eyes with no retinopathy [171, 173, 175],others report no change [172]. This discrepancy can beattributed to differences between these studies in the ERGstimulus characteristics, recording techniques, patientdemographics and clinical grading systems of retinopathyseverity. There is also some indication that the STRwaveform is delayed with reduced amplitude in diabeticeyes [176].
Electrodiagnostic evaluation of neuronal function inretinal vascular occlusions is typically performed with theflash ERG as compromised retinal circulation affects retinalbipolar and ganglion cell function. The PR-VEP and PERGare not routinely employed in the clinical evaluation ofretinal circulatory abnormalities as they are less informativein these conditions. Central Retinal Artery Occlusion,Central Retinal Vein Occlusion and Branch Retinal VeinOcclusion all reduce the amplitude of the b-wave and thePhNR [130, 177–188]. The PhNR is usually more reducedthan the b-wave, implying greater dependence of more innerretinal neurones on retinal circulation [130, 177–183, 185–188]. The recovery of retinal function, whether sponta-neously or as a result of treatment, is more robust withimprovement b-wave in the initial phase and the PhNRrecovering over longer time-period [130, 184, 186, 187].The magnitude of PhNR amplitude reduction before treat-ment has been suggested to be a better predictor of visualprognosis than the b-wave [130, 179].
The non-perfusion or hypoperfusion of the optic nerveitself can result in an ischaemic optic neuropathy. Ischemicoptic neuropathy (ION) typically comprises two majortypes; anterior (AION) which affects the optic nerve head,and posterior (PION) which affects the portion of the nerveposterior to the nerve head. These can be further char-acterised into those caused by an arteritic process or non-arteritic process (i.e. AAION or NAION respectively)
2394 O. R. Marmoy, S. Viswanathan

[189]. The management of ION and their subtypes candiffer, as can their visual prognosis [190].
The VEP abnormalities in ischaemic optic neuropathywere first formally introduced by Wilson [191] whodemonstrated the amplitude reduction of the PR-VEP,with small or no changes in latency seen. Other studiesare in general agreement with Wilson’s amplitude find-ings, but some studies report varying degrees of latencyabnormality, suggesting commensurate conduction delayis not an exclusion to VEP diagnosis of ION [192–195].Further, utilising a small check width PR-VEP was foundto have higher sensitivity in the detection of optic nervedysfunction [194]. There has been conflicting evidenceto whether latency delay is a truly a feature of ION.Some of this may arise around the heterogeneous cohortsrecruited within these early studies or consideration forthe timing of PR-VEPs after the acute event. Forexample, it has since been noted that within the acutephase of ION that latency can be more affected [196].Furthermore, it is unknown whether PR-VEP morphol-ogy changes or field defects were accounted for, as acentral scotoma or altitudinal field defects can reduce themacular derived P100 and enhance the paramacularcomponents of the VEP (i.e. producing a bifid or ‘p-n-p’waveform). This can mistakenly be construed as anatypically early or delayed P100 as demonstrated byThompson [197], therefore half-field PR-VEPs areessential to elaborate on the origins of the componentsobserved, as are PR-VEPs to a range of check widths[198]. Overall, a fair conclusion now is that ION pre-dominantly affects PR-VEP amplitude, but latencycan in some circumstances be affected, but is typicallyless marked than that observed in optic neuritis[194, 197–202]. The flash VEP is typically loweramplitude with latency changes [202].
While the PERG N95 amplitude reduction is a commonclinical feature in ischemic optic atrophy, this has beenstudied less frequently [194, 195, 201, 202]. Interestingly itwas proposed that in the acute phase of visual loss, if thePERG is recorded within 8–35 days from onset this showsrapid loss of the N95 component in AION, whereas in opticneuritis this not as frequently seen [195, 203], but thisfinding has not been validated. PERG abnormalities of theP50 component have also been reported, which may suggestsome incipient dysfunction upstream to the RGCs at themacular photoreceptors or bipolar cells, although this hasnot widely observed [195].
Rangaswamy et al. [129] demonstrated in 17 patientswith NAION that the PhNR amplitude is reduced and itsdecrease correlated to the reduction in visual field sensi-tivity. Including a control group, these authors demon-strated in their Receiver Operating Curve that the PhNR has96% diagnostic accuracy for AION. Interestingly it was also
found that the PhNR was reduced in some degree in theasymptomatic eyes, suggesting there may be subtle signs ofglobal RGC dysfunction before clinical signs of AION mayappear. Further studies of the PhNR have included hetero-genous cohorts of optic nerve disease, some includingischemic optic neuropathies, with variable degree of PhNRchange [204, 205]. Beyond the PhNR, it has been shownthat impairment of OPs can also occur in AION [206],which was observed particularly in OP2 and OP3 in a laterstudy [202], presumably secondary to ischemic changes atthe inner retina. The mfVEP can provide further informationregarding optic nerve integrity, particularly as theydemonstrate a close relationship between visual field lossand topographic mfVEP amplitude reduction, although thismay overlap with other optic neuropathies [207, 208].
Optic neuritis and demyelinating disease
Optic neuritis and other inflammatory disorders of the opticnerve can give rise to significant visual impairment, war-ranting early identification of aetiology which can facilitatediagnosis, prognosis and management. The use of electro-physiology in optic neuritis has been extensively studied inthe context of demyelinating disorders. As the PR-VEPassesses the integrity of the visual pathway from the maculato striate cortex, it can be used in the detection of opticnerve and intracranial pathway abnormalities but can lackspecificity for the underlying disease. For example, whilstoptic neuritis is most historically associated with MultipleSclerosis (MS), its presentation, history or PR-VEP changescan have wide differential diagnosis including infectious(i.e. Lyme disease, Herpes Zoster, toxoplasmosis), vascular(i.e. ION), toxic/nutritional (i.e. B12 deficiency, ethambutol,or tobacco-alcohol toxicity), Compressive (i.e. intracranialtumours), disseminated neurological disorder (i.e. Adreno-leukodystrophy, Neuromyelitis Optica Spectrum (NMO)disorder), hereditary optic neuropathies (i.e. LHON orADOA) or systemic disease (i.e. Systemic Lupis Erythe-matosus, Sjögrens syndrome or Sarcoid) [209]. The type ofPVEP abnormality may in some instances characterise someof these pathologies, but often demands the additional useof a PERG to further aid diagnosis.
Optic Neuritis can often be the first presentation of dis-ease in MS, occurring in 13–15% of patients [210]. Fur-thermore, many patients with MS can show optic nerve orPR-VEP abnormalities despite the absence of visualsymptoms or MRI abnormalities of the orbit [211–213]. Theearly works pioneering the clinical utility of the PR-VEP inoptic neuritis came from Halliday et al. who demonstratedan increased latency in the PR-VEP as characteristic forconduction delay associated with demyelination [211, 214].The PR-VEP in acute phase of optic neuritis is often
Clinical electrophysiology of the optic nerve and retinal ganglion cells 2395
unrecordable, significantly attenuated or delayed, likelysubsequent upon conduction block of the axonal volley[215]. After the acute phase, amplitude often improves butthe delay most commonly persists despite the resolution ofvisual acuity or field defects [211]. Over 6–36 months thelatency can slowly decrease presumably concordant withremyelination, sodium channel reorganisation or corticalreceptive field plasticity [216–218], but still remainsabnormal in the majority of cases [219]. Amplitude recov-ery is more quickly and closely related with the clinicalimprovement in visual acuity [220]. It is important to notethat in children normalisation of the PR-VEP ismore common than in adults, often occurring within12 months [221].
The abnormality of a PVEP should always be investi-gated with a PERG whenever possible to identify the locusof visual system dysfunction, as a PVEP abnormality maybe consequent upon either a maculopathy or RGC dys-function (Fig. 3). Holder [222] demonstrated that in 199eyes with abnormal PVEPs from optic nerve demyelination,39.2% of these demonstrated abnormality of the PERG, themajority of which affecting the N95 component. It was laterdemonstrated by Holder [79] in a large series that thereduction of the N95:P50 ratio of the PERG is closelyrelated to a greater severity of conduction delay in the PR-VEP. It may take up to 6 weeks for a PERG abnormality toappear after acute optic neuritis. This reflects the time takenfor retrograde degeneration to occur to RGC axons, whichthen predominantly affects the N95 component. It has beendemonstrated that N95 component loss following opticneuritis is associated with a worse visual prognosis, andcorrelates with structural measures of macular ganglion cellcomplex volume (GCCV) and nerve fibre layer thickness[223–226]. In cases of severe N95 reduction, the P50component may also reduce in amplitude and shorten inpeak-time. In the acute phase, the P50 component can alsobe reduced reflecting some central retinal dysfunction, butthis observation typically resolves within 4 weeks [79, 227].As the PERG N95 loss in optic neuritis typically occursafter the acute phase of vision loss, a reduced PERG N95during acute presentation suggests other primary RGCdisease such as LHOA or other optic nerve pathology.
There are only a few studies at the time of writing thathave investigated optic neuritis and demyelinating diseaseusing the PhNR. So far, these suggest that the PhNR may beuseful in the delineation between structural and functionalvisual measurements, where functional change can precedechanges in RNFL thickness. Wang et al. [228] found thatthe PhNR in MS has reduced amplitude across an entirestimulus-intensity range tested, interestingly in eyes withand without a history of optic neuritis. Furthermore, in thosewith a history of optic neuritis, a close correlation can beobserved to visual field changes and RNFL thickness. In
particular, the most marked change observed was in patientswith a history of optic neuritis longer than 6 months prior totesting, suggesting the PhNR is sensitive in detecting theretrograde degeneration of RGC cell axons. Whilst theremay be some concern regarding the PhNR discriminatoryability against visual fields the only study to address thisutilised reference data from two different populations andhence the verdict is inconclusive [228]. The PhNR duringthe acute phase of optic neuritis can also be abnormal,possibly secondary to neuronal swelling, inflammation orglial cell disruption which contribute to the PhNR [29, 92].It has also been demonstrated using the focal macula ERGs,that the a- and b-waves were significantly reduced in thecentral 15° field alongside the PhNR reduction, which maypersist following visual improvement [204]. It is interestingto note that the PhNR has shown earlier changes thanstructural measurements of RNFL thinning in severeinflammatory conditions causing optic atrophy, where thePhNR becomes abnormal after only 1 month whereasRNFL changes can take up to 3 months to manifest [229].An illustration of a patient with optic neuritis is presented inFig. 3 which shows the PERG, PR-VEP, F-VEP and PhNRwaveform alterations.
The mfVEP can assess the functional regions of the opticnerve and therefore may be of benefit in some cases of opticneuritis. For example, in mild forms of optic neuritis, wheretopographically only a small segment of nerve axons areaffected (i.e. causing a small scotoma or peripheral fielddefect), the conventional VEP may mask an underlying defectas it is produced from both normal and abnormally func-tioning axons, whereas the mfVEP may detect this focal loss[230, 231]. However, the technical demands of a mfVEP andits accessibility have limited its widespread use to date.
Papilloedema and raised intracranialpressure
Raised intracranial pressure (rICP) and papilloedema cancause significant visual impairment if left untreated. Themechanism of visual loss is likely a result of RGC dys-function secondary to mechanical or compressive effects onthe optic nerve which disrupt axoplasmic flow resulting innerve fibre swelling, clinically known as papilloedema[232]. As the effects of rICP impacts the RGCs, optic nerveand visual pathway, electrophysiology as an objectivefunctional measure of these neuronal components offersadvantages over existing methods such as visual acuity orpapilloedema grading, which can be insensitive to change inrICP [233]. In particular, differentiation of optic discoedema from rICP and from optic neuropathies, which iscrucial for ongoing management, may be achieved throughelectrophysiology.
2396 O. R. Marmoy, S. Viswanathan
Early publications reported high correlation between N2latency of the F-VEP and invasively recorded ICP,including reports that the F-VEP aided in the detection ofposterior visual pathway abnormalities associated withpaediatric rICP, such as ‘stretching’ the optic radiations orchiasmal dysfunction from ventricular enlargement oralteration [233–236]. However, the high inter-subjectvariability of the F-VEP has precluded any reliable abso-lute amplitude or latency measurements to indicate rICP andtherefore its use in rICP is limited. Conversely, the PERGand PR-VEP demonstrate relatively low intra- and inter-subject variability. Early studies of PR-VEPs in rICPdemonstrated P100 latency prolongation between patientswith Idiopathic Intracranial Hypertension (IIH) and con-trols, with modest correlation with ICP. These PR-VEPalterations in normalised when papilloedema and blind-spotareas resolved [237, 238]. However, PR-VEPs in IIH haveoverall demonstrated variable sensitivity and clinical utility[239–241]. Nevertheless, an abnormal PR-VEP at baselinedoes predict worse visual outcome and shares a closerelationship with visual field abnormalities [241, 242].Other studies have demonstrated a high prevalence of PR-VEP abnormality in paediatric craniosynostosis [243],including the use of serial PR-VEPs in longitudinal mon-itoring of rICP, some demonstrating a 71% sensitivity and100% specificity for rICP [244–246]. These were detectedthrough longitudinal study of PR-VEPs recorded to a rangeof spatial frequencies, which improves the sensitivity of
detecting rICP in craniosynostosis and IIH [247]. Thevariable sensitivity of PVEPs in these conditions likelyreflects a variance of methodological approaches, such asonly performing a PR-VEP to one spatial frequency or useof a small stimulus field size. The challenge with PR-VEPsas a marker of optic nerve and RGC dysfunction in IIH, isthe site of dysfunction in IIH as a ‘pure’ form of rICP (i.e.one where intracranial compliance is mostly unaffected,relative to Craniosynostosis or Hydrocephalus) is pre-dominantly at the RGCs, therefore the VEP as a measure ofthe entire visual pathway may conceal early changes, suchas from mechanisms of post-retinal contrast adaptation[248, 249].
The PERG and PhNR hold promise in the objectivemeasurement of visual function in patients with papilloe-dema and/or rICP. This can provide complementary topo-graphic information of functioning RGC populations, whichis of interest in rICP as the central visual field is often onlyaffected late in the disease course [233]. It has beendemonstrated that the steady state PERG can be abnormal in77.7% of patients with IIH, particularly to higher spatialfrequencies as observed in the PVEP [247]. The PERG N95has a close relationship with VF sensitivity and OCT GCCVand RNFL thickness [250]. More recently, the PhNR wasstudied in IIH where they found 60% of patients to havereduced amplitude that correlated significantly with theSAP-MD and macula GCCV volume [251]. For one case inthis cohort, aggressive ICP reducing treatment normalised
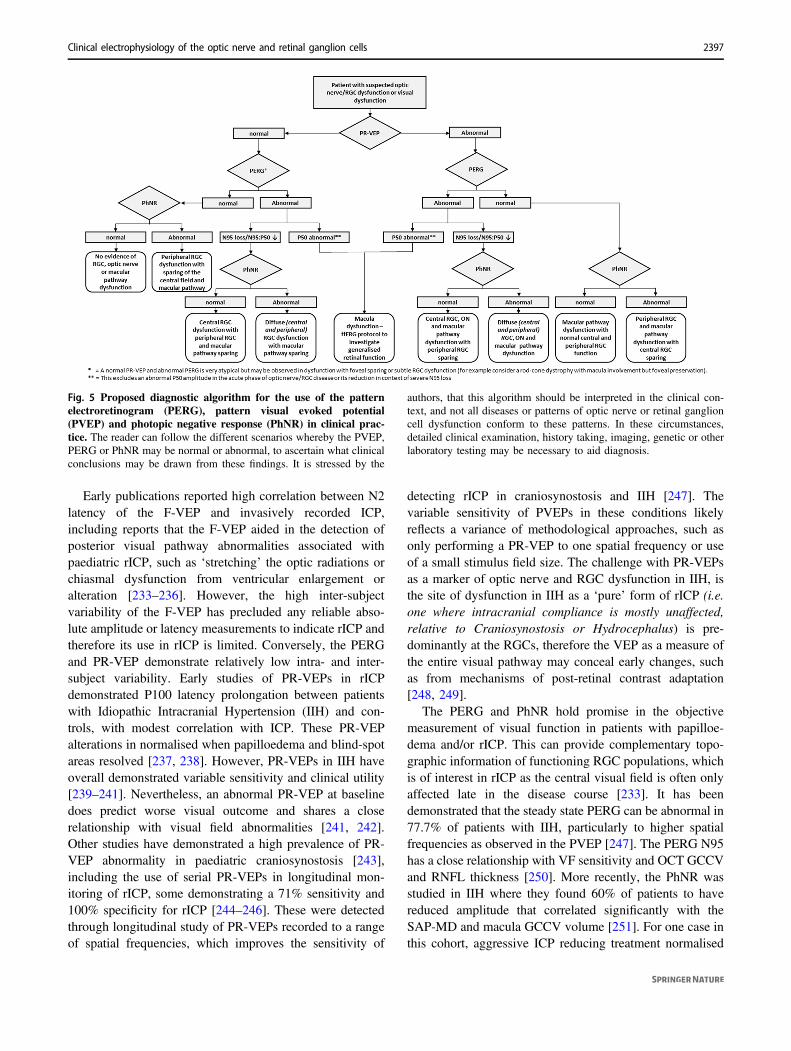
Fig. 5 Proposed diagnostic algorithm for the use of the patternelectroretinogram (PERG), pattern visual evoked potential(PVEP) and photopic negative response (PhNR) in clinical prac-tice. The reader can follow the different scenarios whereby the PVEP,PERG or PhNR may be normal or abnormal, to ascertain what clinicalconclusions may be drawn from these findings. It is stressed by the
authors, that this algorithm should be interpreted in the clinical con-text, and not all diseases or patterns of optic nerve or retinal ganglioncell dysfunction conform to these patterns. In these circumstances,detailed clinical examination, history taking, imaging, genetic or otherlaboratory testing may be necessary to aid diagnosis.
Clinical electrophysiology of the optic nerve and retinal ganglion cells 2397
the PhNR, improved the papilloedema grading, but did notalter the SAP-MD. This demonstrates some distinction fromoptic neuritis where the PhNR often remains abnormaldespite resolution of visual symptoms. A later study com-pared the focal and full-field PhNR and PERG in patientswith IIH, which corroborated their existing findings of anabnormal PhNR in IIH affecting the full-field more thanfocal PhNR, suggesting the topographic peripheral fieldabnormalities seen in IIH are concordant with the PhNRfindings [252]. However, the comparative normality of thefocal-PhNR compared to the abnormal PERG in the samepatients are curious, perhaps reflecting differences betweeneach stimulus modality and their relative origins. They did,however, find a relatively low sensitivity of the PERG inIIH (45.5%), perhaps reflecting differences between thetransient and steady-state PERG and the influence of dif-ferent spatial frequencies. These findings overall suggestthat the PhNR and PERG are useful indicators of opticnerve and RGC function in rICP, but to date have not beendirectly associated with ICP measurements as a surrogatemarker.
Visual electrophysiology in practice
In this review we have studied a variety of techniques, suchas the PERG, VEP and PhNR, in conditions affecting theoptic nerve and RGCs. The authors encourage thoseundertaking electrophysiological testing to meet the mini-mum standards for recording and exceed these where pos-sible, to further characterise the site of dysfunction. In theclinical interpretation of data, one may wish to interpretfindings of PERGs, VEPs and PhNR together to aid deci-sion making and analysis. As such, we propose a simpledecision flow-chart for the interested reader in how tointerpret these tests together, to aid clinical interpretation ofelectrophysiological tests (Fig. 5). It is important to considerthe clinical and technical factors which may influencefindings, such as test time after an acute event, co-morbidities or reduced compliance. The authors encouragerecording a PERG and PR-VEP simultaneously, wherepossible, to maximise the diagnostic value of electro-physiological tests alongside factoring in these variables.
Conclusion
Visual electrophysiology is a key diagnostic tool in theassessment of conditions affecting RGCs and the opticnerve. In this review we have discussed the role of thePERG, VEP, PhNR in characterising visual function inRGC and optic nerve disease. The benefits of electro-physiology are to provide functional data of the visual
system to complement structural data and the clinicalexamination. At the advent of the genomic era and begin-ning of new exciting therapies for optic nerve disease,functional measurements will be essential for measuringsafety, efficacy and outcome. Furthermore, the objectivenature of electrophysiology testing means information aboutthe visual system can be gained from patients unable tocomplete subjective tests. The ability to assess RGC andoptic nerve function quantitatively and through different butcomplementary tests builds a diagnostic platform for phe-notyping of disease, which can aid in clinical decisionmaking.
Author contributions Both OM and SV were responsible for design-ing the review strategy, conducting the search, screening of eligiblestudies, extraction and analysis of data, interpretation and collation offindings. OM and SV were responsible for writing of the study paperand generation of figures. Both authors approve to the final version ofthe paper.
Compliance with ethical standards
Conflict of interest The authors declare no competing interests.
Publisher’s note Springer Nature remains neutral with regard tojurisdictional claims in published maps and institutional affiliations.
Open Access This article is licensed under a Creative CommonsAttribution 4.0 International License, which permits use, sharing,adaptation, distribution and reproduction in any medium or format, aslong as you give appropriate credit to the original author(s) and thesource, provide a link to the Creative Commons license, and indicate ifchanges were made. The images or other third party material in thisarticle are included in the article’s Creative Commons license, unlessindicated otherwise in a credit line to the material. If material is notincluded in the article’s Creative Commons license and your intendeduse is not permitted by statutory regulation or exceeds the permitteduse, you will need to obtain permission directly from the copyrightholder. To view a copy of this license, visit http://creativecommons.org/licenses/by/4.0/.
References
1. Thompson DA, Fritsch DM, Hardy SE. The changing shape ofthe ISCEV standard pattern onset VEP. Doc Ophthalmol.2017;135:69–76.
2. Odom JV, Bach M, Brigell M, Holder GE, McCulloch DL,Mizota A, et al. ISCEV standard for clinical visual evokedpotentials: (2016 update). Doc Ophthal. 2016;133:1–9.
3. Carroll WM, Halliday AM, Kriss A. Improvements in theaccuracy of pattern visual evoked potentials in the diagnosis ofvisual pathway disease. Neuro-Ophthalmol. 1982;2:237–53.
4. Skuse NF, Burke D, Mckeon B. Reproducibility of the visualevoked potential using a light-emitting diode stimulator. J NeurolNeurosurg Psychiatry. 1984;47:623–9.
5. Sarnthein J, Andersson M, Zimmermann MB, Zumsteg D. Hightest-retest reliability of checkerboard reversal visual evokedpotentials (VEP) over 8 months. Clin Neurophysiol.2009;120:1835–40.
2398 O. R. Marmoy, S. Viswanathan

6. Mellow TB, Liasis A, Lyons R, Thompson DA. The reprodu-cibility of binocular pattern reversal visual evoked potentials: asingle subject design. Doc Ophthal. 2011;122:133–9.
7. Andersson L, Sjölund J, Nilsson J. Flash visual evoked potentialsare unreliable as markers of ICP due to high variability in normalsubjects. Acta Neurochir. 2012;154:121–7.
8. Meredith JT, Celesia GG. Pattern-reversal visual evoked poten-tials and retinal eccentricity. Electroencephalogr Clin Neuro-physiol. 1982;53:243–53.
9. Yiannikas C, Walsh JC. The variation of the pattern shift visualevoked response with the size of the stimulus field. Electro-encephalogr Clin Neurophysiol. 1983;55:427–35.
10. Celesia GG. Evoked potential techniques in the evaluation ofvisual function. J Clin Neurophysiol. 1984;1:55–76.
11. Oishi M, Yamada T, Dickins SS, Kimura J. Visual evokedpotentials by different check sizes in patients with multiplesclerosis. Neurology. 1985;35:1461–5.
12. Hughes JR, Stone JL, Fino JJ, Hart LA. Usefulness of differentstimuli in visual evoked potentials. Neurology. 1987;37:656–62.
13. Novak GP, Wiznitzer M, Kurtzberg D, Giesser BS, VaughanHG. Utility of visual evoked potentials using hemifield stimu-lation and several check sizes in the evaluation of suspectedmultiple sclerosis. Electroencephalogr Clin Neurophysiol.1988;71:1–9.
14. Thompson DA, Kriss A, Taylor D, Russell-Eggitt I, Hodgkins P,Morgan G, et al. Early VEP and ERG evidence of visual dys-function in autosomal recessive osteopetrosis. Neuropediatrics.1998;29:137–44.
15. Thurtell MJ, Bala E, Yaniglos SS, Rucker JC, Peachey NS,Leigh RJ. Evaluation of optic neuropathy in multiple sclerosisusing low-contrast visual evoked potentials. Neurology.2009;73:1849–57.
16. Sartucci F, Murri L, Orsini C, Porciatti V. Equiluminant red-green and blue-yellow VEPs in multiple sclerosis. J Clin Neu-rophysiol. 2001;18:583–91.
17. Tekavčič Pompe M, Perovšek D, Šuštar M. Chromatic visualevoked potentials indicate early dysfunction of color processingin young patients with demyelinating disease. Doc Ophthal.2020;141:157–68.
18. Porciatti V, Sartucci F. Retinal and cortical evoked responses tochromatic contrast stimuli. Specific losses in both eyes ofpatients with multiple sclerosis and unilateral optic neuritis.Brain. 1996;119:723–40.
19. Majander A, Robson AG, João C, Holder GE, Chinnery PF,Moore AT, et al. The pattern of retinal ganglion cell dysfunctionin Leber hereditary optic neuropathy. Mitochondrion.2017;36:138–49.
20. Fuest M, Kieckhoefel J, Mazinani B, Kuerten D, Koutsonas A,Koch E, et al. Blue–yellow and standard pattern visual evokedpotentials in phakic and pseudophakic glaucoma patients andcontrols. Graefes Arch Clin Exp Ophthalmol.2015;253:2255–61.
21. Sartucci F, Porciatti V. Visual-evoked potentials to onset ofchromatic red-green and blue-yellow gratings in Parkinson’sdisease never treated with L-dopa. J Clin Neurophysiol.2006;23:431–5.
22. Risuenho BBO, Miquilini L, Eliza EM, Silveira LCL, Souza GS.Cortical responses elicited by luminance and compound stimulimodulated by pseudo-random sequences: comparison betweennormal trichromats and congenital red-green color blinds. FrontPsychol. 2015;6:53.
23. Crognale MA, Page JW, Fuhrel A. Aging of the chromatic onsetvisual evoked potential. Optom Vis Sci. 2001;78:442–6.
24. Luo X, Frishman LJ. Retinal pathway origins of the patternelectroretinogram (PERG). Investig Ophthalmol Vis Sci.2011;52:8571–84.
25. Holder GE. Pattern electroretinography (PERG) and an inte-grated approach to visual pathway diagnosis. Prog Retin EyeRes. 2001;20:531–61.
26. Kakisu Y, Mizota A, Adachi E. Clinical application of the pat-tern electroretinogram with lid skin electrode. Doc Ophthal.1986;63:187–94.
27. Lenassi E, Robson AG, Hawlina M, Holder GE. The value oftwo-field pattern electroretinogram in routine clinical electro-physiologic practice. Retina. 2012;32:588–99.
28. Bach M, Brigell MG, Hawlina M, Holder GE, Johnson MA,McCulloch DL, et al. ISCEV standard for clinical pattern elec-troretinography (PERG): 2012 update. Doc Ophthal.2013;126:1–7.
29. Viswanathan S, Frishman LJ, Robson JG, Harwerth RS, SmithEL. The photopic negative response of the macaque electro-retinogram: reduction by experimental glaucoma. Investig Oph-thalmol Vis Sci. 1999;40:1124–36.
30. McCulloch DL, Marmor MF, Brigell MG, Hamilton R, HolderGE, Tzekov R, et al. ISCEV Standard for full-field clinicalelectroretinography (2015 update). Doc Ophthal. 2015;130:1–12.
31. Rangaswamy NV, Shirato S, Kaneko M, Digby BI, Robson JG,Frishman LJ. Effects of spectral characteristics of ganzfeld sti-muli on the photopic negative response (PhNR) of the ERG.Investig Ophthalmol Vis Sci. 2007;48:4818–28.
32. Sustar M, Cvenkel B, Brecelj J. The effect of broadband andmonochromatic stimuli on the photopic negative response of theelectroretinogram in normal subjects and in open-angle glau-coma patients. Doc Ophthal. 2009;118:167–77.
33. Frishman L, Sustar M, Kremers J, McAnany JJ, Sarossy M,Tzekov R, et al. ISCEV extended protocol for the photopicnegative response (PhNR) of the full-field electroretinogram.Doc Ophthal. 2018;136:207–11.
34. Binns AM, Mortlock KE, North R V. The relationship betweenstimulus intensity and response amplitude for the photopicnegative response of the flash electroretinogram. Doc Ophthal.2011;122:39–52.
35. Tang J, Edwards T, Crowston JG, Sarossy M. The Test–RetestReliability of the Photopic Negative Response (PhNR). TranslVis Sci Technol. 2014;3:1.
36. Joshi NR, Ly E, Viswanathan S. Intensity response function ofthe photopic negative response (PhNR): effect of age andtest–retest reliability. Doc Ophthal. 2017;135:1–16.
37. Sutter EE, Tran D. The field topography of ERG components inman - I. The photopic luminance response. Vis Res.1992;32:433–46.
38. Hoffmann MB, Bach M, Kondo M, Li S, Walker S, HolopigianK, et al. ISCEV standard for clinical multifocal electro-retinography (mfERG) (2021 update). Doc Ophthal.2021;142:5–16.
39. Sutter EE, Bearse MA. The optic nerve head component of thehuman ERG. Vis Res. 2000;39:419–36.
40. van Alstine AW, Viswanathan S. Test–retest reliability of themultifocal photopic negative response. Doc Ophthal.2017;134:25–36.
41. Al-Nosairy KO, Thieme H, Hoffmann MB. Diagnostic perfor-mance of multifocal photopic negative response, pattern elec-troretinogram and optical coherence tomography in glaucoma.Exp Eye Res. 2020;200:108242.
42. Baseler HA, Sutter EEM. M and P components of the VEP andtheir visual field distribution. Vis Res. 1997;37:675–90.
43. Baseler HA, Sutter EE, Klein SA, Carney T. The topography ofvisual evoked response properties across the visual field. Elec-troencephalogr Clin Neurophysiol. 1994;90:65–81.
44. Hoffmann MB, Flechner JJ. Slow pattern-reversal stimulationfacilitates the assessment of retinal function with multifocalrecordings. Clin Neurophysiol. 2008;119:409–17.
Clinical electrophysiology of the optic nerve and retinal ganglion cells 2399
45. Harrison WW, Viswanathan S, Malinovsky VE. Multifocalpattern electroretinogram: cellular origins and clinical implica-tions. Optom Vis Sci. 2006;83:473–85.
46. Bach M, Cuno AK, Hoffmann MB. Retinal conduction speedanalysis reveals different origins of the P50 and N95 componentsof the (multifocal) pattern electroretinogram. Exp Eye Res.2018;169:48–53.
47. Klistorner AI, Graham SL, Martins A. Multifocal pattern elec-troretinogram does not demonstrate localised field defects inglaucoma. Doc Ophthal. 2000;100:155–66.
48. Stiefelmeyer S, Neubauer AS, Berninger T, Arden GB, RudolphG. The multifocal pattern electroretinogram in glaucoma. VisRes. 2004;44:103–12.
49. Monteiro MLR, Hokazono K, Cunha LP, Oyamada MK. Mul-tifocal pattern electroretinography for the detection of neural lossin eyes with permanent temporal hemianopia or quadrantanopiafrom chiasmal compression. Br J Ophthalmol. 2012;96:104–9.
50. Monteiro MLR, Hokazono K, Cunha LP, Oyamada MK. Cor-relation between multifocal pattern electroretinography andFourier-domain OCT in eyes with temporal hemianopia fromchiasmal compression. Graefes Arch Clin Exp Ophthalmol.2013;251:903–15.
51. Kurtenbach A, Kernstock C, Zrenner E, Langrová H. Electro-physiology and colour: a comparison of methods to evaluateinner retinal function. Doc Ophthal. 2015;131:159–67.
52. Kreuz AC, de Moraes CG, Hatanaka M, Oyamada MK, Mon-teiro MLR. Macular and Multifocal PERG and FD-OCT inPreperimetric and Hemifield Loss Glaucoma. J Glaucoma.2018;27:121–32.
53. Sieving PA, Frishman LJ, Steinberg RH. Scotopic threshold responseof proximal retina in cat. J Neurophysiol. 1986;56:1049–61.
54. Wakabayashi K, Gieser J, Sieving PA. Aspartate separation ofthe scotopic threshold response (STR) from the photoreceptor a-wave of the cat and monkey ERG. Investig Ophthalmol Vis Sci.1988;29:1615–22.
55. Ogden TE. The oscillatory waves of the primate electro-retinogram. Vis Res. 1973;13:1059–74.
56. Heynen H, Wachtmeister L, van Norren D. Origin of the oscillatorypotentials in the primate retina. Vis Res. 1985;25:1365–73.
57. Wachtmeister L. Oscillatory potentials in the retina: what do theyreveal. Prog Retin Eye Res. 1998;17:485–521.
58. Lenaers G, Hamel C, Delettre C, Amati-Bonneau P, Procaccio V,Bonneau D, et al. Dominant optic atrophy. Orphanet J Rare Dis.2012;7:46.
59. Yu-Wai-Man P, Chinnery PF. Dominant optic atrophy: novelOPA1 mutations and revised prevalence estimates. Ophthal-mology. 2013;120:1712–1712.e1.
60. Yu-Wai-Man P, Chinnery PF, Adam MP, Ardinger HH, PagonRA, Wallace SE, et al. Leber Hereditary Optic Neuropathy. In:Adam MP, Ardinger HH, Pagon RA, Wallace SE, Bean LJH,Mirzaa G, et. al., editors. GeneReviews® [Internet]. Seatle:Uni-versity of Washington; 2000. p.1993–2021.
61. Chun BY, Rizzo JF. Dominant Optic Atrophy and Leber’sHereditary Optic Neuropathy: update on Clinical Features andCurrent Therapeutic Approaches. Semin Pediatr Neurol.2017;24:129–34.
62. Sarzi E, Seveno M, Piro-Mégy C, Elzière L, Quilès M,Péquignot M, et al. OPA1 gene therapy prevents retinal ganglioncell loss in a Dominant Optic Atrophy mouse model. Sci Rep.2018;8:2468.
63. Harding GF, Crews SJ, Pitts SM. Psychophysical and visualevoked potential findings in hereditary optic atrophy. TransOphthalmol Soc U K. 1979;99:96–102.
64. Berninger TA, Jaeger W, Krastel H. Electrophysiology andcolour perimetry in dominant infantile optic atrophy. Br J Oph-thalmol. 1991;75:49–52.
65. Holder GE, Votruba M, Carter AC, Bhattacharya SS, Fitzke FW,Moore AT. Electrophysiological findings in dominant opticatrophy (DOA) linking to the OPA1 locus on chromosome 3q28-qter. Doc Ophthalmol. 1998–1999; 95:217–28.
66. Marra TR. The Clinical Significance of the Bifid or “W” PatternReversal Visual Evoked Potential. Clin Electroencephalogr.1990;21:162–7.
67. Rousseff RT, Tzvetanov P, Rousseva MA. The bifid visualevoked potential - normal variant or a sign of demyelination?Clin Neurol Neurosurg. 2005;107:113–6.
68. Rinalduzzi S, Brusa A, Jones SJ. Variation of visual evokedpotential delay to stimulation of central, nasal, and temporalregions of the macula in optic neuritis. J Neurol NeurosurgPsychiatry. 2001;70:28–35.
69. Miyata K, Nakamura M, Kondo M, Lin J, Ueno S, Miyake Y,et al. Reduction of oscillatory potentials and photopic negativeresponse in patients with autosomal dominant optic atrophy withOPA1 mutations. Investig Ophthalmol Vis Sci. 2007;48:820–4.
70. Morny EKA, Margrain TH, Binns AM, Votruba M. Electro-physiological ON and OFF responses in autosomal dominantoptic atrophy. Investig Ophthalmol Vis Sci. 2015;56:7629–37.
71. Yen MY, Wang AG, Wei YH. Leber’s hereditary optic neuro-pathy: a multifactorial disease. Prog Retin Eye Res.2006;25:381–96.
72. Meyerson C, van Stavern G, McClelland C. Leber hereditaryoptic neuropathy: current perspectives. Clin Ophthalmol.2015;9:1165–76.
73. Nikoskelainen E, Hoyt WF. Ophthalmoscopic Findings inLeber’s Hereditary Optic Neuropathy: II. The Fundus Findingsin the Affected Family Members. Arch Ophthalmol.1983;101:1059–68.
74. Sadun AA, Salomao SR, Berezovsky A, Sadun F, DeNegri AM,Quiros PA, et al. Subclinical carriers and conversions in leberhereditary optic neuropathy: a prospective psychophysical study.Trans Am Ophthalmol Soc. 2006;104:51–61.
75. Hwang TJ, Karanjia R, Moraes-Filho MN, Gale J, Tran JS, ChuER, et al. Natural History of Conversion of Leber’s HereditaryOptic Neuropathy: a Prospective Case Series. Ophthalmology.2017;124:843–50.
76. Zhao X, Zhang Y, Lu L, Yang H. Therapeutic Effects of Ide-benone on Leber Hereditary Optic Neuropathy. Curr Eye Res.2020;45:1315–23.
77. Yang S, Ma SQI, Wan X, He H, Pei H, Zhao MJ, et al. Long-term outcomes of gene therapy for the treatment of Leber’shereditary optic neuropathy. EBioMedicine. 2016;10:258–68.
78. Zhang Y, Tian Z, Yuan J, Liu C, Liu HLI, Ma SQ, et al. TheProgress of Gene Therapy for Leber’s Optic Hereditary Neuro-pathy. Curr Gene Ther. 2017;17:320–6.
79. Holder GE. The pattern electroretinogram in anterior visualpathway dysfunction and its relationship to the pattern visualevoked potential: a personal clinical review of 743 eyes. Eye.1997;11:924–34.
80. Ziccardi L, Sadun F, de Negri AM, Barboni P, Savini G, BorrelliE, et al. Retinal function and neural conduction along the visualpathways in affected and unaffected carriers with Leber’s her-editary optic neuropathy. Investig ophthalmol Vis Sci.2013;54:6892–901.
81. Jarc-Vidmar M, Tajnik M, Brecelj J, Fakin A, Sustar M, Naji M,et al. Clinical and electrophysiology findings in Slovene patientswith Leber hereditary optic neuropathy. Doc Ophthalmol.2015;130:179–87.
82. Gualtieri M, Bandeira M, Hamer RD, Costa MF, Oliveira AGF,Moura ALA, et al. Psychophysical analysis of contrast proces-sing segregated into magnocellular and parvocellular systems inasymptomatic carriers of 11778 Leber’s hereditary optic neuro-pathy. Vis Neurosci. 2008;25:469–74.
2400 O. R. Marmoy, S. Viswanathan
83. Karanjia R, Berezovsky A, Sacai PY, Cavascan NN, Liu HY,Nazarali S, et al. The Photopic Negative Response: an ObjectiveMeasure of Retinal Ganglion Cell Function in Patients WithLeber’s Hereditary Optic Neuropathy. Investig Ophthalmol VisSci. 2017;58:BIO300–6.
84. Botelho GIS, Salomão SR, Tengan CH, Karanjia R, Moura FV,Rocha DM, et al. Impaired Ganglion Cell Function ObjectivelyAssessed by the Photopic Negative Response in Affected andAsymptomatic Members From Brazilian Families With Leber’sHereditary Optic Neuropathy. Front Neurol. 2021;11:628014.
85. Züchner S, Mersiyanova IV, Muglia M, Bissar-Tadmouri N,Rochelle J, Dadali EL, et al. Mutations in the mitochondrialGTPase mitofusin 2 cause Charcot-Marie-Tooth neuropathy type2A. Nat Genet. 2004;36:449–51.
86. Ouvrier R, Grew S. Mechanisms of disease and clinical featuresof mutations of the gene for mitofusin 2: An important cause ofhereditary peripheral neuropathy with striking clinical variabilityin children and adults. Dev Med Child Neurol. 2010;52:328–30.
87. Gowrisankaran S, Anastasakis A, Fishman GA, Alexander KR.Structural and functional measures of inner retinal integrity fol-lowing visual acuity improvement in a patient with hereditarymotor and sensory neuropathy type VI. Ophthalmic Genet.2011;32:188–92.
88. Carroll WM, Jones SJ, Halliday AM. Visual evoked potentialabnormalities in Charcot-Marie-Tooth disease and comparisonwith Friedreich’s ataxia. J Neurol Sci. 1983;61:123–33.
89. Triantafyllou N, Rombos A, Athanasopoulou H, Siafakas A,Loulakaki SM. Electrophysiological study (EEG, VEPs, BAEPs)in patients with Charcot Marie Tooth (type HMSN I) disease.Electromyogr Clin Neurophysiol. 1989;29:259–63.
90. Bähr M, Andres F, Timmerman V, Nelis ME, van BroeckhovenC, Dichgans J. Central visual, acoustic, and motor pathwayinvolvement in a Charcot-Marie-Tooth family with an Asn205-Ser mutation in the connexin 32 gene. J Neurol NeurosurgPsychiatry. 1999;66:202–6.
91. Botsford B, Vuong LN, Hedges TR, Mendoza-Santiesteban CE.Characterization of Charcot–Marie–Tooth optic neuropathy. JNeurol. 2017;264:2431–5.
92. Thompson DA, Feather S, Stanescu HC, Freudenthal B, ZdebikAA, Warth R, et al. Altered electroretinograms in patients withKCNJ10 mutations and EAST syndrome. J Physiol.2011;589:1681–9.
93. Bockenhauer D, Feather S, Stanescu HC, Bandulik S, ZdebikAA, Reichold M, et al. Epilepsy, Ataxia, Sensorineural Deafness,Tubulopathy, and KCNJ10 Mutations. N Engl J Med.2009;360:1960–70.
94. Kofuji P, Ceelen P, Zahs KR, Surbeck LW, Lester HA, NewmanEA. Genetic inactivation of an inwardly rectifying potassiumchannel (kir4.1 Subunit) in mice: Phenotypic impact in retina. JNeurosci. 2000;20:5733–40.
95. Raz-Prag D, Grimes WN, Fariss RN, Vijayasarathy C, CamposMM, Bush RA, et al. Probing potassium channel function in vivoby intracellular delivery of antibodies in a rat model of retinalneurodegeneration. Proc Natl Acad Sci USA.2010;107:12710–5.
96. Vaughan HG, Katzman R, Taylor J. Alterations of visual evokedresponse in the presence of homonymous visual defects. Elec-troencephalogr Clin Neurophysiol. 1963;15:737–46.
97. Kooi KA, Yamada T, Marshall RE. Field studies of monocularlyevoked cerebral potentials in bitemporal hemianopsia. Neurol-ogy. 1973;23:1217–25.
98. Holder GE. The effects of chiasmal compression on the patternvisual evoked potential. Electroencephalogr Clin Neurophysiol.1978;45:278–80.
99. Fisher NF, Jampolsky A, Scott AB, Morris A, Lehmann D,Alden J. Traumatic bitemporal hemianopsia. Part III. Nasal
versus temporal retinal function. Am J Ophthalmol.1968;65:578–81.
100. Kriss A, Russell-Eggitt I, Harris CM, Lloyd IC, Taylor D.Aspects of albinism. Ophthalmic Paediatr Genet.1992;13:89–100.
101. Dorey SE, Neveu MM, Burton LC, Sloper JJ, Holder GE. Theclinical features of albinism and their correlation with visualevoked potentials. Br J Ophthalmol. 2003;87:767–72.
102. Vaughan HG, Katzman R. Evoked response in visual disorders.Ann N Y Acad Sci. 2006;112:305–19.
103. Galkina NS, Gnezditskii VV, Aleksandrova AA, Kozlova AI.Investigation of evoked potentials to photic stimulation in manafter deafferentation of the visual cortex. Biull Eksp Biol Med.1975;79:371–4.
104. Blumhardt LD, Halliday AM. Cortical Abnormalities and theVisual Evoked Response. In: Spekreijse H, Apkarian PA, edi-tors. Visual Pathways. Doc Ophthalmol Proceedings Series. Vol.27. Dordrecht: Springer; 1981. p. 347–65.
105. Celesia GG, Meredith JT, Pluff K. Perimetry, visual evokedpotentials and visual evoked spectrum array in homonymoushemianopsia. Electroencephalogr Clin Neurophysiol.1983;56:16–30.
106. Halliday AM, Halliday E, Kriss A, Mcdonald WI, Mushin J. Thepattern-evoked potential in compression of the anterior visualpathways. Brain. 1976;99:357–74.
107. Brecelj JA. VEP study of the visual pathway function in com-pressive lesions of the optic chiasm. Full-field versus half-fieldstimulation. Electroencephalogr Clin Neurophysiol.1992;84:209–18.
108. Barrett G, Blumhardt L, Halliday AM, Halliday E, Kriss A. Aparadox in the lateralisation of the visual evoked response.Nature. 1976;261:253–5.
109. Marmoy OR, Handley SE, Thompson DA. Pattern-onset andOFFset visual evoked potentials in the diagnosis of hemianopicfield defects. Doc Ophthalmol. 2021;142:165–76.
110. Gott PS, Weiss MH, Apuzzo M, van der Meulen JP. Checker-board visual evoked response in evaluation and management ofpituitary tumors. Neurosurgery. 1979;5:553–8.
111. Müller-Jensen A, Zschocke S, Dannheim F. VER analysis of thechiasmal syndrome. J Neurol. 1981;225:33–40.
112. Groswasser Z, Kriss A, Halliday AM, McDonald WI. Pattern-and flash-evoked potentials in the assessment and managementof optic nerve gliomas. J Neurol Neurosurg Psychiatry.1985;48:1125–34.
113. Wenzel D, Brandl U, Beck JD, Cedzich C, Albert F. Visualevoked potentials in tumors from orbita to occipital lobe inchildhood. Neurosurg Rev. 1988;11:279–86.
114. Feinsod M, Selhorst JB, Hoyt WF, Wilson CB. Monitoring opticnerve function during craniotomy. J Neurosurg. 1976;44:29–31.
115. Flanagan JG, Harding GFA. Multi-channel visual evokedpotentials in early compressive lesions of the chiasm. DocOphthalmol. 1988;69:271–81.
116. Kupersmith MJ, Siegel IM, Carr RE, Ransohoff J, Flamm E,Shakin E. Visual Evoked Potentials in Chiasmal Gliomas in FourAdults. Arch Neurol. 1981;38:362–5.
117. Kelly JP, Leary S, Khanna P, Weiss AH. Longitudinal measuresof visual function, tumor volume, and prediction of visual out-comes after treatment of optic pathway gliomas. Ophthalmology.2012;119:1231–7.
118. van Mierlo C, Spileers W, Legius E, Casteels I, Cassiman C.Role of visual evoked potentials in the assessment and man-agement of optic pathway gliomas in children. Doc Ophthalmol.2013;127:177–90.
119. Dotto P, de F, Berezovsky A, Cappellano AM, da Silva NS,Sacai PY, Silva FAB, et al. Visual function assessed by visuallyevoked potentials in optic pathway low-grade gliomas with and
Clinical electrophysiology of the optic nerve and retinal ganglion cells 2401
without neurofibromatosis type 1. Doc Ophthalmol.2018;136:177–89.
120. Kelly JP, Weiss AH. Comparison of Pattern Visual-EvokedPotentials to Perimetry in the Detection of Visual Loss InChildren With Optic Pathway Gliomas. J AAPOS.2006;10:298–306.
121. Wolsey DH, Larson SA, Creel D, Hoffman R. Can Screening forOptic Nerve Gliomas in Patients With Neurofibromatosis Type IBe Performed With Visual-Evoked Potential Testing? J AAPOS.2006;10:307–11.
122. Holder GE. The pattern electroretinogram in anterior visualpathway dysfunction and its relationship to the pattern visualevoked potential: a personal clinical review of 743 eyes. Eye.1997;11:924–34.
123. Danesh-Meyer HV, Carroll SC, Gaskin BJ, Gao A, Gamble GD.Correlation of the multifocal visual evoked potential and stan-dard automated perimetry in compressive optic neuropathies.Investig Ophthalmol Vis Sci. 2006;47:1458–63.
124. Semela L, Yang EB, Hedges TR, Vuong L, Odel JG, Hood DC.Multifocal visual-evoked potential in unilateral compressiveoptic neuropathy. Br J Ophthalmol. 2007;91:445–8.
125. Jayaraman M, Ambika S, Gandhi RA, Bassi SR, Ravi P, Sen P.Multifocal visual evoked potential recordings in compressiveoptic neuropathy secondary to pituitary adenoma. Doc Oph-thalmol. 2010;121:197–204.
126. Sousa RM, Oyamada MK, Cunha LP, Monteiro MLR. Multi-focal visual evoked potential in eyes with temporal hemianopiafrom chiasmal compression: correlation with standard automatedperimetry and OCT findings. Investig Ophthalmol Vis Sci.2017;58:4436–46.
127. Parmar DN, Sofat A, Bowman R, Barlett JR, Holder GE. Visualprognostic value of the pattern electroretinogram in chiasmalcompression. Br J Ophthalmol. 2000;84:1024–6.
128. Rüther K, Ehlich P, Philipp A, Eckstein A, Zrenner E. Prognosticvalue of the pattern electroretinogram in cases of tumorsaffecting the optic pathway. Graefes Arch Clin Exp Ophthalmol.1998;236:259–63.
129. Rangaswamy NV, Frishman LJ, Dorotheo EU, Schiffman JS,Bahrani HM, Tang RA. Photopic ERGs in patients with opticneuropathies: comparison with primate ERGs after pharmaco-logic blockade of inner retina. Investig Ophthalmol Vis Sci.2004;45:3827–37.
130. Moon CH, Ahn S, il, Ohn YH, Kwak HW, Park TK. Visualprognostic value of photopic negative response and opticalcoherence tomography in central retinal vein occlusion after anti-VEGF treatment. Doc Ophthalmol. 2013;126:211–9.
131. Moon CH, Hwang SC, Ohn YH, Park TK. The time course ofvisual field recovery and changes of retinal ganglion cells afteroptic chiasmal decompression. Investig Ophthalmol Vis Sci.2011;52:7966–73.
132. Abed E, Piccardi M, Rizzo D, Chiaretti A, Ambrosio L, PetroniS, et al. Functional loss of the inner retina in childhood opticgliomas detected by photopic negative response. Investig Oph-thalmol Vis Sci. 2015; 56:2469–74.
133. Genovesi-Ebert F, di Bartolo E, Lepri A, Poggi V, Romani A,Nardi M. Standardized echography, pattern electroretinographyand visual-evoked potential and automated perimetry in the earlydiagnosis of Graves’ neuropathy. Ophthalmologica. 1998;212(supp 1):101–3.
134. Spadea L. Early detection of P-VEP and PERG changes inopthalmic Graves’ disease. Graefes Arch Clin Exp Ophthalmol.1997;235:501–5.
135. Przemysław P, Janusz M, Alina BL, Maria G. Pattern electro-retinogram (PERG) in the early diagnosis of optic nerve dys-function in the course of Graves’ orbitopathy. Klinika Ocz.2013;115:9–12.
136. Mitchell KW, Wood CM, Howe JW. Pattern visual evokedpotentials in hyperthyroidism. Br J Ophthalmol. 1988;72:534–7.
137. Wijngaarde R, van Lith GHM. Pattern EPs in endocrine orbi-topathy. Doc Ophthalmol. 1980;48:327–32.
138. Salvi M, Spaggiari E, Neri F, Macaluso C, Gardini E, Ferrozzi F,et al. The Study of Visual Evoked Potentials in Patients withThyroid-Associated Ophthalmopathy Identifies Asymptomatic OpticNerve Involvement. J Clin Endocrinol Metab. 1997;82:1027–30.
139. Ambrosio G, Ferrara G, Vitale R, de Marco R. Visual evokedpotentials in patients with Graves’ ophthalmopathy complicatedby ocular hypertension and suspect glaucoma or dysthyroid opticneuropathy. Doc Ophthalmol. 2003;106:99–104.
140. Iao TWU, Rong SS, Ling AN, Brelén ME, Young AL, ChongKKL. Electrophysiological Studies in Thyroid Associated Orbi-topathy: a Systematic Review. Sci Rep. 2017;7:12108.
141. Lipski A, Eckstein A, Esser J, Loesch C, Mann K, Mohr C, et al.Course of pattern-reversed visual evoked cortical potentials in 30eyes after bony orbital decompression in dysthyroid optic neu-ropathy. Br J Ophthalmol. 2011;95:222–6.
142. Kobayashi A, Ando A, Tagami N, Kitagawa M, Kawai E,Akioka M, et al. Severe optic neuropathy caused by dichlor-omethane inhalation. J Ocul Pharm Ther. 2008;24:607–12.
143. Allen D, Riordan-Eva P, Paterson RW, Hadden RDM. Subacuteperipheral and optic neuropathy syndrome with no evidence of atoxic or nutritional cause. Clin Neurol Neurosurg.2013;115:1389–93.
144. Grillo LM, Nguyen HV, Tsang SH, Hood DC, Odel JG. Cobalt-chromium metallosis with normal electroretinogram. J Neu-roophthalmol. 2016;36:383–8.
145. Mhéalóid ÁNí, Cunniffe G. Optic neuritis secondary to anti-androgen therapy. Ir J Med Sci. 2017;186:565–70.
146. Petrera JE, Fledelius HC, Trojaborg W. Serial pattern evokedpotential recording in a case of toxic optic neuropathy due toethambutol. Electroencephalogr Clin Neurophysiol.1988;71:146–9.
147. Nurieva O, Hubacek JA, Urban P, Hlusicka J, Diblik P, KuthanP, et al. Clinical and genetic determinants of chronic visualpathway changes after methanol - induced optic neuropathy:four-year follow-up study. Clin Toxicol. 2019;57:387–97.
148. Simmons IG, Good PA. Carbon monoxide poisoning causesoptic neuropathy. Eye. 1998;12:809–14.
149. Venkatramani DV, Goel S, Ratra V, Gandhi RA. Toxic opticneuropathy following ingestion of homeopathic medicationArnica-30. Cutan Ocul Toxicol. 2013;32:95–7.
150. Fabian RH, Norcross KA, Hancock MB. Surfer’s Neuropathy. NEngl J Med. 1987;316:555.
151. Mahapatra AK. Visual evoked potentials in optic nerve injury.Does it merit a mention? Acta Neurochir. 1991;112:47–9.
152. Mahapatra AK. Delayed recovery from indirect optic nerveinjury. A report of two unusual cases. J Neurosurg Sci.1992;36:151–3.
153. Agarwal A, Mahapatra AK. Visual outcome in optic nerve injurypatients without initial light perception. Indian J Ophthalmol.1999;47:233–6.
154. Tabatabaei SA, Soleimani M, Alizadeh M, Movasat M, Man-soori MR, Alami Z, et al. Predictive value of visual evokedpotentials, relative afferent pupillary defect, and orbital fracturesin patients with traumatic optic neuropathy. Clin Ophthalmol.2011;5:1021–6.
155. He Z, Li Q, Yuan J, Zhang X, Gao R, Han Y, et al. Evaluation oftranscranial surgical decompression of the optic canal as atreatment option for traumatic optic neuropathy. Clin NeurolNeurosurg. 2015;134:130–5.
156. Nukada H. Ischemia and diabetic neuropathy. In: Handbook ofClinical Neurology. Amsterdam, The Netherlands: Elsevier;2014. p. 469–87.
2402 O. R. Marmoy, S. Viswanathan

157. Anastasi M, Lauricella M, Giordano C, Galluzzo A. Visualevoked potentials in insulin-dependent diabetics. Acta DiabetolLat. 1985;22:343–9.
158. Algan M, Ziegler O, Gehin P, Got I, Raspiller A, Weber M, et al.Visual evoked potentials in diabetic patients. Diabetes Care.1989;12:227–9.
159. Parisi V, Uccioli L, Monticone G, Parisi L, Menzinger G, BucciMG. Visual evoked potentials after photostress in insulin-dependent diabetic patients with or without retinopathy. GraefesArch Clin Exp Ophthalmol. 1994;232:193–8.
160. Parisi V, Uccioli L. Visual electrophysiological responses inpersons with type 1 diabetes. Diabetes Metab Res Rev.2001;17:12–8.
161. Parisi V, Uccioli L, Parisi L, Colacino G, Manni G, MenzingerG, et al. Neural conduction in visual pathways in newly-diagnosed IDDM patients. Electroencephalogr Clin Neurophy-siol. 1998;108:490–6.
162. Parisi V, Uccioli L, Monticone G, Parisi L, Manni G, Ippoliti D,et al. Electrophysiological assessment of visual function inIDDM patients. Electroencephalogr Clin Neurophysiol.1997;104:171–9.
163. Deák K, Fejes I, Janáky M, Várkonyi T, Benedek G, BraunitzerG. Further Evidence for the Utility of ElectrophysiologicalMethods for the Detection of Subclinical Stage Retinal and OpticNerve Involvement in Diabetes. Med Princ Pr. 2016;25:282–5.
164. Pozzessere G, Rizzo PA, Valle E, Mollica MA, Sanarelli L,Morano S, et al. A longitudinal study of multimodal evokedpotentials in diabetes mellitus. Diabetes Res. 1989;10:17–20.
165. Mariani E, Moreo G, Colucci GB. Study of visual evokedpotentials in diabetics without retinopathy: correlations withclinical findings and polyneuropathy. Acta Neurol Scand.1990;81:337–40.
166. Pietravalle P, Morano S, Cristina G, Mancuso M, Valle E,Annulli MA, et al. Early complications in type 1 diabetes: centralnervous system alterations precede kidney abnormalities. Dia-betes Res Clin Pr. 1993;21:143–54.
167. Dolu H, Ulas UH, Bolu E, Ozkardes A, Odabasi Z, Ozata M,et al. Evaluation of central neuropathy in type II diabetes mellitusby multimodal evoked potentials. Acta Neurol Belg.2003;103:206–11.
168. Arden GB, Hamilton AMP, Wilson-Holt J, Ryan S, Yudkin JS,Kurtz A. Pattern electroretinograms become abnormal whenbackground diabetic retinopathy deteriorates to a preproliferativestage: possible use as a screening test. Br J Ophthalmol.1986;70:330–5.
169. Ryan S, Arden GB. Electrophysiological discrimination betweenretinal and optic nerve disorders. Doc Ophthalmol.1988;68:247–55.
170. Falsini B, Porciatti V, Scalia G, Caputo S, Minnella A, di LeoMAS, et al. Steady-state pattern electroretinogram in insulin-dependent diabetics with no or minimal retinopathy. Doc Oph-thalmol. 1989;73:193–200.
171. Park JC, Chau FY, Lim JI, McAnany JJ. Electrophysiologicaland pupillometric measures of inner retina function in non-proliferative diabetic retinopathy. Doc Ophthalmol.2019;139:99–111.
172. Kizawa J, Machida S, Kobayashi T, Gotoh Y, Kurosaka D.Changes of oscillatory potentials and photopic negative responsein patients with early diabetic retinopathy. Jpn J Ophthalmol.2006;50:367–73.
173. Chen H, Zhang M, Huang S, Wu D. The photopic negativeresponse of flash ERG in nonproliferative diabetic retinopathy.Doc Ophthalmol. 2008;117:129–35.
174. Kim HD, Park JY, Ohn YH. Clinical applications of photopicnegative response (PhNR) for the treatment of glaucoma anddiabetic retinopathy. Korean J Ophthalmol. 2010;24:89–95.
175. McFarlane M, Wright T, Stephens D, Nilsson J, Westall CA.Blue flash ERG PhNR changes associated with poor long-termglycemic control in adolescents with type 1 diabetes. InvestigOphthalmol Vis Sci. 2012;53:741–8.
176. Aylward GW. The scotopic threshold response in diabetic reti-nopathy. Eye. 1989;3:626–37.
177. Machida S, Gotoh Y, Tanaka M, Tazawa Y. Predominant loss ofthe photopic negative response in central retinal artery occlusion.Am J Ophthalmol. 2004;137:938–40.
178. Chen H, Wu D, Huang S, Yan H. The photopic negativeresponse of the flash electroretinogram in retinal vein occlusion.Doc Ophthalmol. 2006;113:53–9.
179. Shinoda K, Yamada K, Matsumoto CS, Kimoto K, Nakatsuka K.Changes in retinal thickness are correlated with alterations ofelectroretinogram in eyes with central retinal artery occlusion.Graefes Arch Clin Exp Ophthalmol. 2008;246:949–54.
180. Matsumoto CS, Shinoda K, Yamada K, Nakatsuka K. Photopicnegative response reflects severity of ocular circulatory damage aftercentral retinal artery occlusion. Ophthalmologica. 2009;223:362–9.
181. Matsumoto CS, Shinoda K, Nakatsuka K. High correlation ofscotopic and photopic electroretinogram components withseverity of central retinal artery occlusion. Clin Ophthalmol.2011;5:115–21.
182. Ogino K, Tsujikawa A, Nakamura H, Miyamoto K, Murakami T,Muraoka Y, et al. Focal macular electroretinogram in macularedema secondary to central retinal vein occlusion. InvestigOphthalmol Vis Sci. 2011;52:3514–20.
183. Ogino K, Tsujikawa A, Murakami T, Muraoka Y, Akagi-Kurashige Y, Ishihara K, et al. Evaluation of macular functionusing focal macular electroretinography in eyes with macularedema associated with branch retinal vein occlusion. InvestigOphthalmol Vis Sci. 2011;52:8047–55.
184. Gardašević Topčić I, Šuštar M, Brecelj J, Hawlina M, Jaki,Mekjavić P. Morphological and electrophysiological outcome inprospective intravitreal bevacizumab treatment of macular edemasecondary to central retinal vein occlusion. Doc Ophthalmol.2014;129:27–38.
185. Noma H, Mimura T, Kuse M, Yasuda K, Shimura M. Photopicnegative response in branch retinal vein occlusion with macularedema. Int Ophthalmol. 2015;35:19–26.
186. Nishimura T, Machida S, Tada A, Oshida E, Muto T. Macularfunction following intravitreal ranibizumab for macular edemaassociated with branch retinal vein occlusion: 12-month results.Doc Ophthalmol. 2020;141:127–36.
187. Nishimura T, Machida S, Tada A, Oshida E, Muto T. Macularfunction following intravitreal ranibizumab for macular edemaassociated with branch retinal vein occlusion. Doc Ophthalmol.2019;139:67–74.
188. Kim HM, Park KH, Woo SJ. Correlation of electroretinographycomponents with visual function and prognosis of central retinalartery occlusion. Sci Rep. 2020;10:12146.
189. Hayreh SS. Ischemic optic neuropathy. Prog Retin Eye Res.2009;28:34–62.
190. Hayreh SS. Management of ischemic optic neuropathies. Indian JOphthalmol. 2011;59:123–36.
191. Wilson WB. Visual-evoked response differentiation of ischemicoptic neuritis from the optic neuritis of multiple sclerosis. Am JOphthalmol. 1978;86:530–5.
192. Hennerici M, Wenzel D, Freund HJ. The comparison of small-size rectangle and checkerboard stimulation for the evaluation ofdelayed visual evoked responses in patients suspected of multiplesclerosis. Brain. 1977;100:119–36.
193. Ikeda H, Tremain KE, Sanders MD. Neurophysiological inves-tigation in optic nerve disease: combined assessment of thevisual evoked response and electroretinogram. Br J Ophthalmol.1978;62:227–39.
Clinical electrophysiology of the optic nerve and retinal ganglion cells 2403
194. Barbano L, Ziccardi L, Parisi V. Correlations between visualmorphological, electrophysiological, and acuity changes inchronic non-arteritic ischemic optic neuropathy. Graefes ArchClin Exp Ophthalmol. 2021;259:1297–308.
195. Parisi V, Gallinaro G, Ziccardi L, Coppola G. Electrophysiologicalassessment of visual function in patients with non-arteritic ischae-mic optic neuropathy. Eur J Neurol. 2008;15:839–45.
196. Brudet-Wickel CLM, van Lith GHM. Electrophysiology in acuteanterior ischaemic optic neuropathy. Ophthalmologica.1984;188:111–7.
197. Thompson PD, Mastaglia FL, Carroll WM. Anterior ischaemicoptic neuropathy. A correlative clinical and visual evokedpotential study of 18 patients. J Neurol Neurosurg Psychiatry.1986;49:128–35.
198. Wildberger H. Neuropathies of the optic nerve and visual evokedpotentials with special reference to color vision and differentiallight threshold measured with the computer perimeter OCTO-PUS. Doc Ophthalmol. 1984;58:147–227.
199. Holder GE. The Visual Evoked Potential in Ischaemic OpticNeuropathy. In: Spekreijse H, Apkarian PA, editors. VisualPathways. Documenta Ophthalmologica Proceedings Series.Vol. 27. Dordecht: Springer;1981. p. 123–9.
200. Cox TA, Stanley Thompson H, Hayreh SS, Snyder JE. VisualEvoked Potential and Pupillary Signs: a Comparison in OpticNerve Disease. Arch Ophthalmol. 1982;100:1603–7.
201. Atilla H, Tekeli O, Örnek K, Batioglu F, Elhan AH, Eryilmaz T.Pattern electroretinography and visual evoked potentials in opticnerve diseases. J Clin Neurosci. 2006;13:55–9.
202. Janáky M, Fülöp Z, Pálffy A, Benedek K, Benedek G. Electro-physiological findings in patients with nonarteritic anteriorischemic optic neuropathy. Clin Neurophysiol. 2006;117:1158–66.
203. Froehlich J, Kaufman DI. Use of pattern electroretinography todifferentiate acute optic neuritis from acute anterior ischemic opticneuropathy. Electroencephalogr Clin Neurophysiol. 1994;92:480–6.
204. Tamada K, MacHida S, Yokoyama D, Kurosaka D. Photopicnegative response of full-field and focal macular electro-retinograms in patients with optic nerve atrophy. Jpn J Oph-thalmol. 2009;53:608–14.
205. Okuno T, Kida T, Ikeda T, Oku H. Significant correlationsbetween photopic negative response, afferent pupillary defect, andmean defects of visual fields in asymmetric optic nerve disorders.Graefes Arch Clin Exp Ophthalmol. 2020;258:1821–7.
206. Tormene AP, Doro D. Electrophysiological findings in anteriorischemic optic neuropathy. Metab Pediatr Syst Ophthalmol.1985;12:76–9.
207. Hood DC, Greenstein VC, Odel JG, Zhang X, Ritch R, Lieb-mann JM, et al. Visual field defects and multifocal visual evokedpotentials: Evidence of a linear relationship. Arch Ophthalmol.2002;120:1672–81.
208. Jayaraman M, Gandhi RA, Ravi P, Sen P. Multifocal visualevoked potential in optic neuritis, ischemic optic neuropathy andcompressive optic neuropathy. Indian J Ophthalmol.2014;62:299–304.
209. Petzold A, Wattjes MP, Costello F, Flores-Rivera J, Fraser CL,Fujihara K, et al. The investigation of acute optic neuritis: areview and proposed protocol. Nat Rev Neurol. 2014;10:447–58.
210. Percy AK, Nobrega FT, Kurland LT. Optic Neuritis and MultipleSclerosis: an Epidemiologic Study. Arch Ophthalmol.1972;87:135–9.
211. Halliday AM, McDonald WI, Mushin J. Visual evoked responsein diagnosis of multiple sclerosis. Br Med J. 1973;4:661–4.
212. Sisto D, Trojano M, Vetrugno M, Trabucco T, Iliceto G, SborgiaC. Subclinical visual involvement in multiple sclerosis: a studyby MRI, VEPs, frequency-doubling perimetry, standard peri-metry, and contrast sensitivity. Investig Ophthalmol Vis Sci.2005;46:1264–8.
213. Janáky M, Jánossy, Horváth G, Benedek G, Braunitzer G. VEPand PERG in patients with multiple sclerosis, with and without ahistory of optic neuritis. Doc Ophthalmol. 2017;134:185–93.
214. Halliday AM, Mcdonald WI, Mushin J. Delayed visual evokedresponse in optic neuritis. Lancet. 1972;1:982–5.
215. Frederiksen JL, Petrera J. Serial visual evoked potentials in 90untreated patients with acute optic neuritis. Surv Ophthalmol.1999;44(supp 1):S54–62.
216. Brusa A, Jones SJ, Kapoor R, Miller DH, Plant GT. Long-termrecovery and fellow eye deterioration after optic neuritis, determinedby serial visual evoked potentials. J Neurol. 1999;246:776–82.
217. Brusa A, Jones SJ, Plant GT. Long-term remyelination afteroptic neuritis: a 2-year visual evoked potential and psychophy-sical serial study. Brain. 2001;124:468–79.
218. Yang EB, Hood DC, Rodarte C, Zhang X, Odel JG, BehrensMM. Improvement in conduction velocity after optic neuritismeasured with the multifocal VEP. Investig Ophthalmol Vis Sci.2007;48:692–8.
219. Hidajat RR, Goode DH. Normalisation of visual evoked poten-tials after optic neuritis. Doc Ophthalmol. 2003;106:305–9.
220. Celesia GG, Kaufman DI, Brigell M, Toleikis S, Kokinakis D,Lorance R, et al. Optic neuritis: a prospective study. Neurology.1990;40:919–23.
221. Tekavčič-Pompe M, Stirn-Kranjc B, Brecelj J. Optic neuritis inchildren - Clinical and electrophysiological follow-up. DocOphthalmol. 2003;107:261–70.
222. Holder GE. The incidence of abnormal pattern electro-retinography in optic nerve demyelination. ElectroencephalogrClin Neurophysiol. 1991;78:18–26.
223. Kaufman DI, Lorance RW, Woods M, Wray SH. The patternelectroretinogram: a long-term study in acute optic neuropathy.Neurology. 1988;38:1767–74.
224. Froehlich J, Kaufman DI. The pattern electroretinogram: N95amplitudes in normal subjects and optic neuritis patients. Elec-troencephalogr Clin Neurophysiol. 1993;88:83–91.
225. Parisi V, Manni G, Spadaro M, Colacino G, Restuccia R, MarchiS, et al. Correlation between Morphological and FunctionalRetinal Impairment in Multiple Sclerosis Patients. InvestigOphthalmol Vis Sci. 1999;40:2520–7.
226. Rodriguez-Mena D, Almarcegui C, Dolz I, Herrero R, BamboMP, Fernandez J, et al. Electrophysiologic evaluation of thevisual pathway in patients with multiple sclerosis. J Clin Neu-rophysiol. 2013;30:376–81.
227. Berninger TA, Heider W. Pattern electroretinograms in opticneuritis during the acute stage and after remission. Graefes ArchClin Exp Ophthalmol. 1990;228:410–4.
228. Wang J, Cheng H, Hu YS, Tang RA, Frishman LJ. The photopicnegative response of the flash electroretinogram in multiplesclerosis. Investig Ophthalmol Vis Sci. 2012;53:1315–23.
229. Gotoh Y, Machida S, Tazawa Y. Selective Loss of the PhotopicNegative Response in Patients with Optic Nerve Atrophy. ArchOphthalmol. 2004;122:341–6.
230. Klistorner A, Arvind H, Garrick R, Graham SL, Paine M,Yiannikas C. Interrelationship of optical coherence tomographyand multifocal visual-evoked potentials after optic neuritis.Investig Ophthalmol Vis Sci. 2010;51:2770–7.
231. Pihl-Jensen G, Schmidt MF, Frederiksen JL. Multifocal visualevoked potentials in optic neuritis and multiple sclerosis: areview. Clin Neurophysiol. 2017;128:1234–45.
232. Hayreh SS. Pathogenesis of optic disc edema in raised intra-cranial pressure. Vol. 50. Prog Retin Eye Res. 2016;50:108–44.
233. Rowe FJ. Assessment of visual function in idiopathic intracranialhypertension. Br J Neurosurg. 2011;25:45–54.
234. York D, Legan M, Benner S, Watts C. Further studies with anoninvasive method of intracranial pressure estimation. Neuro-surgery. 1984;14:456–61.
2404 O. R. Marmoy, S. Viswanathan
235. York DH, Pulliam MW, Rosenfeld JG, Watts C. Relationshipbetween visual evoked potentials and intracranial pressure. JNeurosurg. 1981;55:909–16.
236. Coupland SG, Cochrane DD. Visual evoked potentials, intra-cranial pressure and ventricular size in hydrocephalus. DocOphthalmol. 1987;66:321–9.
237. Krogsaa B, Sørensen PS, Seedorff HH, Trojaborg W, Gjerris F.Ophthalmologic prognosis in Benign Intracranial Hypertension.Acta Ophthalmol. 2009;63:62–4.
238. Sørensen PS, Trojaborg W, Gjerris F, Krogsaa B. Visual EvokedPotentials in Pseudotumor Cerebri. Arch Neurol. 1985;42:150–3.
239. Hamamci M, Tombul T. Visual evoked potentials follow-up inidiopathic intracranial hypertension. Neurosciences.2019;24:185–91.
240. Kesler A, Vakhapova V, Korczyn AD, Drory VE. Visual evokedpotentials in idiopathic intracranial hypertension. Clin NeurolNeurosurg. 2009;111:433–6.
241. Mustafa YH, Elbarbary H, El-Refaaey M, El-Azhary R. VisualEvoked Potential in Idiopathic Intracranial Hypertension. J ClinExp Ophthalmol. 2019;10:1–3.
242. Takkar A, Goyal MK, Bansal R, Lal V. Clinical and Neuro-ophthalmologic Predictors of Visual Outcome in IdiopathicIntracranial Hypertension. Neuroophthalmology.2018;42:201–8.
243. Thompson DA, Liasis A, Hardy S, Hagan R, Hayward RD,Evans RD, et al. Prevalence of abnormal pattern reversal visualevoked potentials in craniosynostosis. Plast Reconstr Surg.2006;118:184–92.
244. Haredy MM, Liasis A, Davis A, Koesarie K, Fu V, Losee JE,et al. Serial, Visually-Evoked Potentials for the Assessment of
Visual Function in Patients with Craniosynostosis. J Clin Med.2019;8:1555.
245. Haredy MM, Liasis A, Fu V, Davis A, Pollack IF, Losee JE,et al. Serial Visual Evoked Potentials in Patients with Cranio-synostosis and Invasive Intracranial Pressure Monitoring. PlastReconstr Surg. 2019;144:446e–52e.
246. Liasis A, Nischal KK, Walters B, Thompson D, Hardy S, TowellA, et al. Monitoring visual function in children with syndromiccraniosynostosis: a comparison of 3 methods. Arch Ophthalmol.2006;124:1119–26.
247. Falsini B, Tamburrelli C, Porciatti V, Anile C, Porrello G,Mangiola N. Pattern electroretinograms and visual evokedpotentials in idiopathic intracranial hypertension. Ophthalmolo-gica. 1992;205:194–203.
248. Solomon SG, Peirce JW, Dhruv NT, Lennie P. Profound contrastadaptation early in the visual pathway. Neuron. 2004;42:155–62.
249. Heinrich TS, Bach M. Contrast adaptation in human retina andcortex. Investig Ophthalmol Vis Sci. 2001;42:2721–7.
250. Afonso CL, Raza AS, Kreuz AC, Hokazono K, Cunha LP,Oyamada MK, et al. Relationship between pattern electro-retinogram, frequency-domain OCT, and automated perimetry inchronic papilledema from pseudotumor cerebri syndrome.Investig Ophthalmol Vis Sci. 2015;56:3656–65.
251. Moss HE, Park JC, McAnany JJ. The photopic negative responsein idiopathic intracranial hypertension. Investig Ophthalmol VisSci. 2015;56:3709–14.
252. Park JC, Moss HE, McAnany JJ. Electroretinography in idio-pathic intracranial hypertension: comparison of the pattern ERGand the photopic negative response. Doc Ophthalmol.2018;136:45–55.
Clinical electrophysiology of the optic nerve and retinal ganglion cells 2405
Related Documents


