1 Clinical Decision Support Tool for Cancer (CDS) Project Evaluation Report to the Department of Health Dr. Jodie Moffat Lucy Ironmonger Cancer Research UK Dr. Trish Green Hull York Medical School July 2014

Welcome message from author
This document is posted to help you gain knowledge. Please leave a comment to let me know what you think about it! Share it to your friends and learn new things together.
Transcript

1
Clinical Decision Support Tool for Cancer (CDS) Project
Evaluation Report to the Department of Health
Dr. Jodie Moffat
Lucy Ironmonger
Cancer Research UK
Dr. Trish Green
Hull York Medical School
July 2014
2
Executive summary
Macmillan Cancer Support, part-funded by the Department of Health, worked in
collaboration under the auspices of the National Awareness and Early Diagnosis
Initiative (NAEDI) on a project to further explore the use of cancer decision
support tools for use in general practice so as to inform next steps in this area.
Cancer Research UK has led the independent evaluation of this project.
The cancer risk algorithms developed by Professor Willie Hamilton (RAT) and
Professor Julia Hippisley-Cox (QCancer) were developed in electronic format on
the BMJ Informatica platform for colorectal, lung, oesophago-gastric (OG),
pancreatic and ovarian cancers. Three distinct functions within the tool (a
prompt, a symptom checker and a risk stratification list) presented the GP with a
risk score for a patient based on historic or inputted symptom and other data.
GPs from 439 participating practices from across England had access to, and
were encouraged to use, the tool between March and November 2013.
Evaluation of the project has focused on use of the tools in practice, impact on
practice and the management of patients, and considerations and implications
for further work in this area. It has not been possible through this evaluation to
investigate impact on clinical outcomes, such as the number of cancers
diagnosed or the stage of disease at diagnosis. On the basis of this project, or its
evaluation, it is therefore not possible to conclude that access to, or use of, the
CDS tools leads to increased or ‘improved’ cancer diagnosis or to finding cancers
at an earlier stage. The tools can, however, raise GPs’ awareness of cancer
symptoms and both alert and remind users to potential risk, as well as influence
the management of some patients, particularly with respect to prompting
investigations.
In considering the evaluation and findings it is important to bear in mind a
number of limitations and caveats, which includes the voluntary nature of
participation in the project and contribution to the evaluation (specifically GPs
completion of ‘Experience tab’ data and participation in interviews). Practices
and GPs opting to participate and contribute may reflect those most engaged in
cancer and interested in efforts to improve practice. Findings cannot therefore

3
necessarily be generalised to the wider GP community. Furthermore, it has not
been possible to collect comprehensive usage data for any of the functions within
the tool or for use of the tool overall.
The qualitative and quantitative evaluation data, do however, yield some
interesting findings:
Data from the interviews with GPs highlight the varying impact of the
tools on practice, ranging from no impact at all, to increasing knowledge,
to influencing the management, including referral or investigation, of
patients.
GPs were concerned about the level at which the prompt was set (i.e. at
what level of risk a prompt appeared on their screen) and the potential
for ‘prompt fatigue’
GPs were concerned about the reliance of functions within the tool on
Read-coded data and variation in Read-coding practices amongst GPs
Some GPs expressed concerns that a 10-minute consultation was a barrier
to use of the symptom checker function within the tool
From a patient perspective, participants were concerned about the impact
of electronic CDS tools on the quality of the GP/patient interaction
Based on non-mandatory completion of the ‘Experience tab’ associated
with use of the symptom checker:
o Of all patients on whom a checker was used and evaluation data
completed, a fifth (20%) were referred, 23% required
investigation, and no action was taken for 47%
o In 54% of cases the cancer risk perceived by the GP was the same
as that presented to the GP by the tool, while in 31% of cases the
calculated risk was higher than the GP had perceived and in 15% it
was lower

4
o Use of the tool did not influence the decision to investigate or refer
in the majority of cases (81%), but in 19% GPs indicated that they
would not have referred/investigated the patient had they not
used the tool
o Influence on decision making varied by cancer type and was
highest for lung (33%) and lowest for OG/pancreatic (9%)
o Analysis suggests that use of the symptom checker was more likely
to influence decisions to investigate than to refer
Based on the available data, across all scores the correlation coefficient
was 0.25 indicating there is a positive association between the scores
calculated by the different algorithms but it is not strong. There was,
however, some variation in the alignment of RAT and QCancer scores by
the different cancer types. The scores were least comparable for
colorectal, lung and pancreatic, and most closely associated for OG and
ovarian
There is no strong evidence that access to the tool increased urgent
referrals for suspected cancer for the relevant routes
The findings generated through this evaluation are distilled in a number of
recommendations in the following areas:
Quality assurance and ensuring that the scores presented by the tool
accurately reflects those generated by the algorithms
Ease of installation, use and ongoing technical and other support
Comprehensive and sustained training to ensure that GPs understand the
scores they are presented with and how they are calculated, including
inclusions and omissions in the symptoms/features they consider

5
Training and support on inclusive practice and ensuring that use of the
tools does not jeopardise the quality of the GP/patient interaction
Limiting potential for exacerbating inequalities
Acknowledging that CDS tools are not for everyone and do not negate the
need for other approaches to educate, inform and support GPs in
diagnosing cancer earlier. Indeed, one of the key contributions of the tool
would appear to be its educational value in increasing awareness of
cancer-related symptoms, symptom combinations and cancer risk factors
amongst GPs. Such shifts in knowledge could be achieved through other
means, channels and opportunities including, but not limited to, CDS.
In conclusion, the clinical decision support tools for cancer developed and
piloted through the course of this project have the potential to be a useful
addition to the resources available to GPs. However, there are a number of areas
that need further consideration and action in order to maximise the usability and
acceptability of the tools and ensure that they support the earlier diagnosis of
cancer agenda.
6
Acknowledgements
Ella Ohuma
Dr. Claire Knight
Monika Cuirej
Sara Hiom
Cancer Research UK
Laura McGuinness
Formerly Cancer Research UK
Professor Una Macleod
Hull York Medical School
James Austin
Phil Hall
Macmillan Cancer Support
David Collie and colleagues
BMJ Informatica
Carolynn Gildea
East Midlands Knowledge and Intelligence Team, PHE
Members of the Clinical Reference Group including Dr. Steven Beaven, Dr. Cathy
Burton, Dr. Bridget Gwynne, Professor Willie Hamilton, Professor Julia Hippisley-
Cox, Dr. Rosie Loftus, Professor Greg Rubin1
1 Members of the Clinical Reference Group had sight of, and opportunity to input into, the evaluation plan. Members also received updates on elements of the quantitative data analysis (descriptive stats relating to ‘Experience tab’ data) during the course of the project, the interim evaluation report in May 2014 (containing some of the ‘Experience tab’ and GP interview data) and an update on evaluation findings from all elements in July 2014. Feedback from the group was welcome but was only taken into account/acted on if it did not jeopardise the independent nature of the evaluation.

7
Project background and objectives
Macmillan Cancer Support, part-funded by the Department of Health (DH),
worked in collaboration under the auspices of the National Awareness and Early
Diagnosis Initiative (NAEDI) to promote cancer decision support (CDS) tools for
use in general practice. The overall aim of the project was to facilitate
development of useful tools so as to be in a position to inform a possible
wholesale rollout in the future. Cancer Research UK (CRUK) has led and
coordinated the independent evaluation of this project, within the confines of
what could be achieved with the software, data and resources available.
Identifying patients who should be referred for suspected cancer is challenging.
GPs are faced on a daily basis with patients displaying a variety of symptoms,
which may or may not be cancer. Effectively supporting GPs in the diagnosis of
cancer has been a key tenet of cancer policy in recent years. This extends to an
interest in clinical decision support tools for cancer and exploring their utility,
viability and effectiveness in primary care, building on the work of academics
working in the area of risk prediction, most notably Professor Willie Hamilton
and Professor Julia Hippisley-Cox.
The work of Professors Hamilton and Hippisley-Cox has led to the development
of cancer risk prediction algorithms, which calculate a risk based on specific
features, including, but not necessarily limited to, symptoms experienced by the
patient.
Professor Willie Hamilton – the Risk Assessment Tool (RAT)
The ‘RAT’ provides positive predictive values (PPVs) for symptoms of cancer. It
was developed through a series of population-based case-control studies in a
primary care setting. Data collection varied with early studies involving a manual
trawl of medical records to code all symptoms prior to diagnosis, and latter
studies utilising the GPRD (now CPRD) to extract relevant codes from patient
records. The RAT does not take into account other risk factors for cancer, for
8
example age, smoking history (except for lung), BMI etc. No validation of the RAT
models has been published, but their use in clinical practice has been evaluated.
Professor Julia Hippisley-Cox – QCancer
QCancer gives the absolute risk of cancer for a patient with potential cancer
symptoms. It was developed using the QResearch database (containing data from
754 UK general practices), in a series of prospective cohort studies. Initially
developed for discrete cancer types, the tool evolved into a combined symptoms-
led model for both sexes, presenting risk of relevant cancers depending on
patient features. QCancer incorporates a range of other risk factors including age,
BMI, smoking status, Townsend deprivation score, alcohol status and a range of
medical and family history factors. Papers describing model derivation and sub-
cohort validation have been published for some of the cancer types in QCancer,
and external validation has also been performed on some.
In recent years there have been several projects that present these risk
algorithms in forms that GPs can use in practice to inform their decision making.
Most notably, desk-based versions of RAT for bowel and lung cancer were
developed and made available to GPs by the former National Cancer Action
Team2 and Macmillan Cancer Support conducted a pilot of an electronic cancer
decision support tool based on RAT, for lung cancer (smokers and non-smokers)
and colorectal cancer, with a small number of practices in 20123. There also
exists an electronic, web-based version of QCancer4.
2 Hamilton W., Green T., Martins T., Elliott K., Rubin G., Macleod U. (2013) Evaluation of risk
assessment tools for suspected cancer in general practice: a cohort study. Br J Gen Pract DOI: 10.3399/bjgp13X660751 3 Dikomitis l., Green T., Macleod U. 2012. Dealing with uncertainty: a qualitative evaluation of the
usability and acceptability of an electronic risk assessment tool to aid cancer diagnosis in general practice. Report to Macmillan Cancer Support, September 2012 4 www.qcancer.org
9
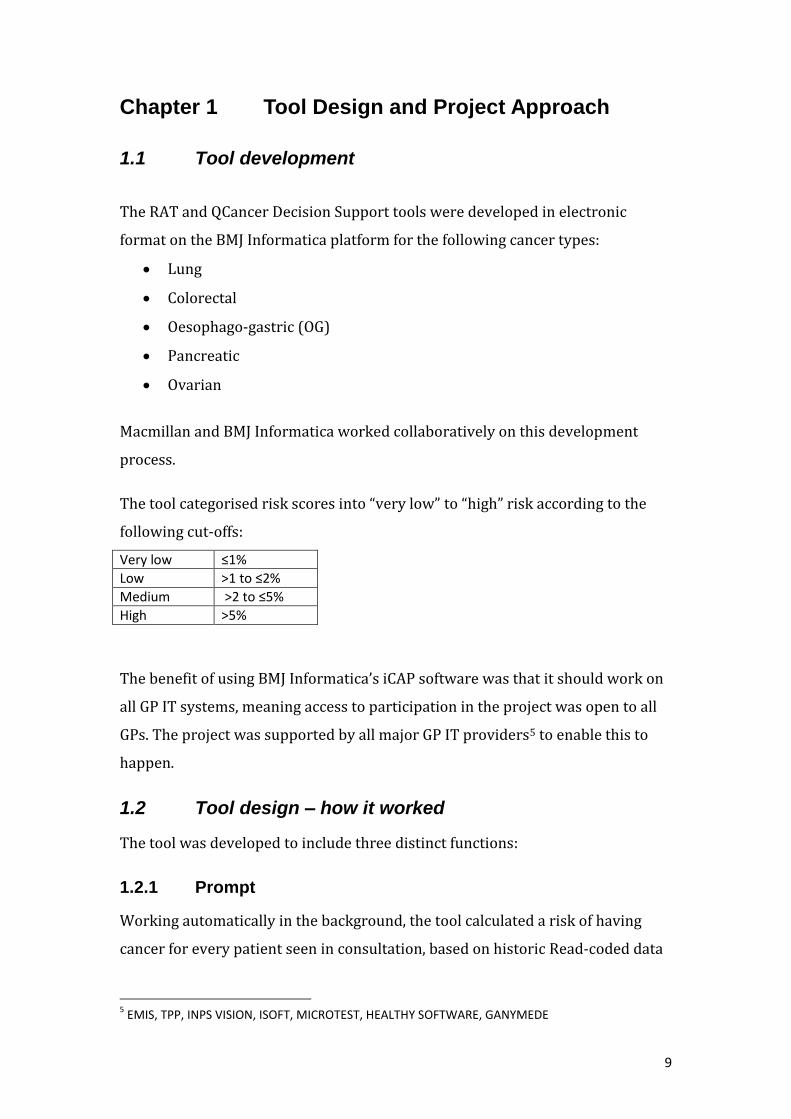
Chapter 1 Tool Design and Project Approach
1.1 Tool development
The RAT and QCancer Decision Support tools were developed in electronic
format on the BMJ Informatica platform for the following cancer types:
Lung
Colorectal
Oesophago-gastric (OG)
Pancreatic
Ovarian
Macmillan and BMJ Informatica worked collaboratively on this development
process.
The tool categorised risk scores into “very low” to “high” risk according to the
following cut-offs:
Very low ≤1%
Low >1 to ≤2%
Medium >2 to ≤5%
High >5%
The benefit of using BMJ Informatica’s iCAP software was that it should work on
all GP IT systems, meaning access to participation in the project was open to all
GPs. The project was supported by all major GP IT providers5 to enable this to
happen.
1.2 Tool design – how it worked
The tool was developed to include three distinct functions:
1.2.1 Prompt
Working automatically in the background, the tool calculated a risk of having
cancer for every patient seen in consultation, based on historic Read-coded data
5 EMIS, TPP, INPS VISION, ISOFT, MICROTEST, HEALTHY SOFTWARE, GANYMEDE
10
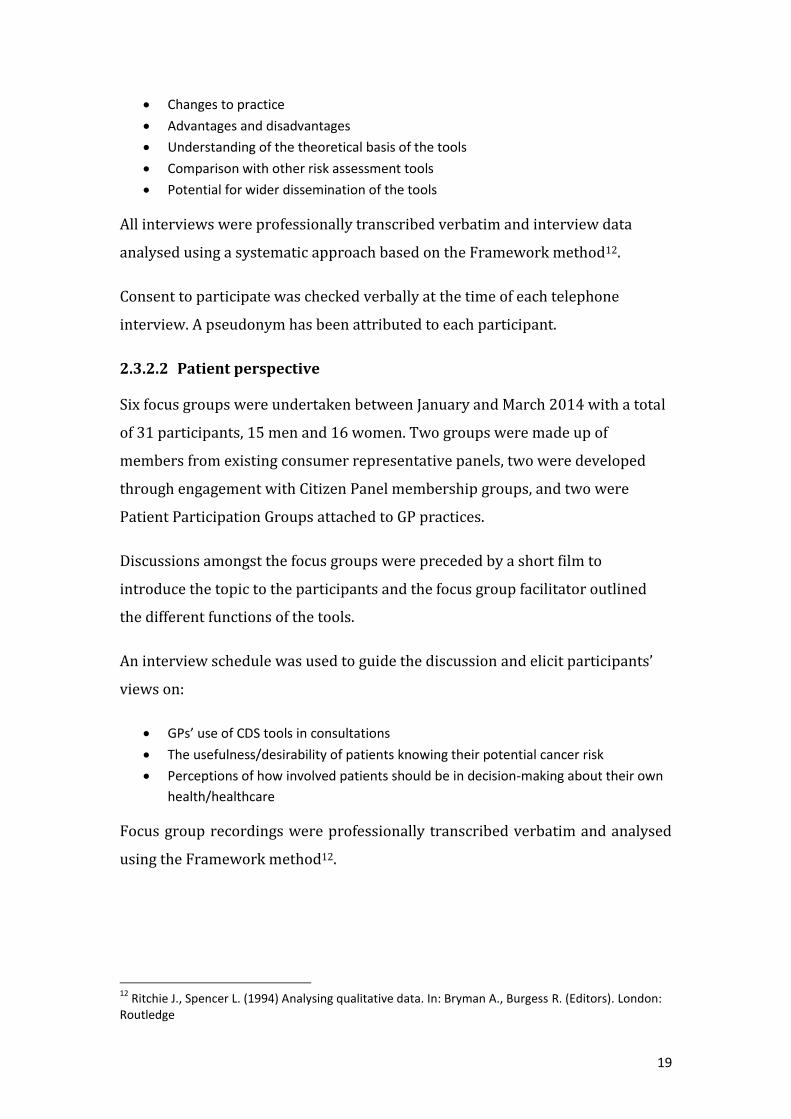
within the patient record. If the risk was 2% or above6, a prompt appeared on
screen letting the GP know that they might like to consider whether the patient
might warrant a referral or investigation for a suspected cancer. The prompt box
told the GP the type of cancer and the risk score. If the patient had a risk score
for more than one cancer type all scores were presented, with the highest at the
top. This prompt box could also then be expanded to show those factors which
drove the risk and there was also an option to access the symptom checker
function of the tool (see below).
6 Macmillan has confirmed that this was the level at which the prompt was set. It is not, however,
congruent with the risk categories, specifically, the inclusion of a risk of equal to or less than 2.0% (and greater than 1.0%) in the low category, and a value greater than 2.0% (to equal to or less than 5.0%) in the medium category

11
Once a GP had reviewed a prompt for a patient, if they felt their symptoms were
explicable due to a separate condition, it was possible for the prompt function to
be disabled for that patient by clicking this option within the prompt box.
1.2.2 Symptom checker
Used in consultation, a symptom checker could be called up, which allowed the
GP to enter relevant symptoms/risk factors based on what the patient was
presenting with, and calculate a risk score. The information used to generate a
score varied for RAT and QCancer but all GPs were asked to complete the same
‘superset’ of questions. This meant it was possible to capture two scores for the
same patient, though the GP was only presented with the score from one of the
algorithms (see 1.4 Project approach and allocation).
Each cancer site had a symptom checker, the exception being a merged symptom
checker for pancreatic and OG. This was merged due to commonality of
symptoms, and to allow exploration of GPs’ preference for single cancer site or
merged formats.

12
The symptom checker also contained an ‘Experience tab’, which allowed the GP
to enter information to be used in evaluation. Completion of the Experience tab
was optional, as there were concerns about not unduly burdening GPs with data
collection or deterring them from engaging with the tool.
1.2.3 Risk stratification function
Out of consultation, a risk stratification function could be used which showed
calculated risk levels of all registered patients on a practice’s list. This could be
sorted to show those calculated to have the highest risk, and then used to
consider whether any further action should be taken for these patients (refer to
illustrative example below).

13
Please note, the above example is for illustrative purposes only and does not contain real
data.
1.2.4 Data retained within the patient record
Due to concerns from the GP community about possible legal and litigation
implications, no permanent record of the risk score(s) was retained within the
patient record.
1.3 Project timings
A letter from Professor Sir Mike Richards, the then National Clinical Director for
Cancer, was sent to all Trust and Primary Care Trust Chief Executives in
December 2012 to notify them of the project and to ask for their support.
GPs in participating practices were encouraged to use the tools from March
2013. It was originally anticipated that it would run for six months (with an end
date of August 2013) but this was extended by an additional three months due to
technical difficulties with software installation on some GP systems. The
extension aimed to enable all participating practices to access the tool and allow

14
sufficient time to use it. Therefore the end date for the project was extended to
30th November 2013.
1.4 Project approach and allocation
All Cancer Networks were invited to participate. The timing coincided with
significant changes within the NHS, including the dissolution of the Cancer
Networks. Despite this, fifteen (of the former) Cancer Networks and one Clinical
Commissioning Group (CCG) supported the project by recruiting general
practices to participate and by providing administrative support, training and
aftercare support in the use of these tools.
The participating Networks/CCG were split into two groups7 with GPs in one
group being presented with scores from the Hamilton algorithm (RAT) for the
duration of the project, while GPs in the other group were presented with scores
from the Hippisley-Cox (QCancer) algorithm. Participating GPs knew which
algorithm was used in the calculation of the score they were presented with.
Table A: Allocation of participating areas
Group 1 RAT – Total: 8 Networks Group 2 QCancer– Total: 7 Networks
Network Location Network Location
Dorset Essex
Pan Birmingham Greater Manchester & Cheshire
Medway (CCG) Lancashire & South Cumbria
North of England North Trent
Merseyside & Cheshire East Midlands
North East Yorkshire and Humber South & West London
Sussex Isle Of Wight8 North Central / North East London
Each of the participating areas had a local project lead who acted as the main
liaison between practices and Macmillan and who drove/coordinated practice
participation and training.
7 Allocation of networks used a pragmatic approach by taking into consideration a number of factors.
These include the geography and socioeconomic factors of the participating Networks and the estimated number of participating practices within each Network area. Some Networks exercised a preference for a particular algorithm and this was also taken into account 8 Isle of Wight was part of Central South Coast Cancer Network

15
Some practices were paid to participate. This was at the discretion of the local
health economy, and typically any payment was a small amount to cover backfill
to enable practice staff to attend training on use of the tool.
1.5 Training
Macmillan developed a comprehensive suite of training materials to ensure that
participating GPs were confident in using the CDS. This included training videos,
how-to guides, FAQs, and ongoing access to ad-hoc advice.
Training sessions were delivered via a two hour demonstration of the software
and Q&A session with members of the Macmillan team. Two types of training
session were delivered – train the trainer sessions designed to upskill local
project leads and enable them to deliver training themselves, and full sessions
with participating GPs.
The decision about how to best deliver training locally was taken by the local
project lead based on their experience of practice engagement in their area.
Macmillan delivered ten train the trainer sessions with approximately 80
participants, and four full training sessions with approximately 140 participants.
This was also supplemented by a series of online one-hour interactive web
demonstrations for participating practices. Macmillan delivered 20 of these
between March and September 2013. Cancer Network staff tried to visit as many
practices as possible before the structure of Cancer Networks changed. Due to
these changes it was difficult to fully capture information on the number of
sessions and visits. However, it is estimated that between 120 and 150 training
sessions were held and 10 to 15 practice visits were carried out.
Chapter 2 Evaluation – approach, methods and
findings
2.1 What questions did the evaluation seek to address?
In line with the overall aim of the project, evaluation sought to address a number
of broad questions. A range of data sources were available utilising either
centrally held, routinely collected or bespoke quantitative and qualitative data.

16
Questions Data source(s)
How are the tools used in practice, including by whom and with whom?
•Experience tab data associated with use of symptom checker
•Qualitative data
How do the tools impact on clinical practice and the management/investigation/referral of patients?
•Experience tab data associated with use of ‘symptom checker’
•Qualitative data
What is the associated impact on urgent referrals for suspected cancer or diagnostic investigations?
•Cancer Waiting Times Database
•(Data on investigations provided by BMJ Informatica)
What is the impact on the primary care/secondary care interface?
How might the tools be improved, and any barriers to their use reduced?
•Qualitative data
In addition to the questions outlined above, part of the qualitative element of the
evaluation also sought to capture a patient perspective on GPs’ use of CDS tools
and their views on knowing their potential cancer risk.
2.2 Why are there no data on cancers diagnosed and
staging?
A previous evaluation of desk-based RATs had sought to investigate the impact
of access to the tools on cancers diagnosed and staging, using data collected
locally. Unfortunately, this project coincided with a time of great change within
the NHS and local teams were not in a position to facilitate collection of incidence
and staging data. Moreover, the timescales of the project, including delays in the
project starting and an extension to November 2013, and resource
considerations meant that it was not possible at the time to draw on centrally
held data on cancers diagnosed and staging data in order to assess impact on
outcomes. Furthermore, as outlined below, definitely linking any shifts in

17
outcomes to access to or use of the tool would be problematic given the
observational nature of the study and existence of other activities which also
have the potential to impact on the same metrics.
2.3 Methods
2.3.1 Experience tab data associated with use of the symptom
checker
Within the symptom checker function of the tool, there was a separate tab called
‘Experience’, which a GP could choose to complete. It sought to collect
information about the GP9 (gender, length of time practising, whether they were
trained on the tool and any area of special interest) and about any impact on
management of the patient. Each GP was allocated a unique identifier following
their first completion of the Experience tab. The questions contained within the
tab were aligned to those previously asked as part of the evaluation of the desk-
based RAT piloti
How did your perceived risk compare with the calculated risk?
o Drop-down list options: Lower, about the same as, higher
Was there any additional management of the patient?
o Drop-down list options: Admitted, referred, investigation required, other,
none
Would you have investigated or referred this case if you hadn’t used the tool?
o Drop-down list options: Yes, no
There was also a ‘tests ordered’ section for GPs to select any diagnostic tests
ordered relevant to the cancer type.
For each use of the symptom checker through to completion of the Experience
tab, a record of the age, sex, gender and deprivation (based on patient’s
residence) of the patient was also made, along with the signs, symptoms and
other factors on which the score was calculated. BMJ Informatica sent a monthly
download of (anonymised) Experience tab data to CRUK in a spreadsheet, for
March 2013 through to November 2013. A list of the variables available in the
dataset is provided in the Appendix.
9 A GP only needed to provide this information once

18
The monthly datasets were compiled and analysed using the statistical software
package, Stata version 13. Details of the assumptions required for the analysis
can be found in the Appendix. The two-sample test of proportions was used to
test whether differences, for instance between the RAT and QCancer algorithms
or between the cancer type symptom checkers, were statistically significant.
Other tests carried out included paired t-tests to compare average RAT and
QCancer scores and chi-squared tests to examine differences in age distributions.
P-values of less than 0.05 were considered significant.
2.3.2 Qualitative data
Professor Una Macleod and Dr. Trish Green, of the DH-funded Policy Research
Unit on cancer awareness, screening and early diagnosis led on the qualitative
element of the evaluation. This primarily sought to explore GPs’ experiences of
using the tools and their perceptions of the barriers and facilitators to a wider
dissemination and integration of the tools into routine general practice but it
also involved obtaining a patient perspective on GPs’ use of CDS tools.
2.3.2.1 GPs
Individual, semi-structured interviews were conducted with 28 GPs10 (10 female,
18 male) who had used the tools as part of this project. Interviews took place
between September 2013 and January 2014, which allowed for several months
of using the tools.
Interviewees were self-selecting; 12 were QCancer users (5 female, 7 male) and
16 were RAT users (4 female, 12 male). Respondents’ practices were located in
22 different areas of England, Scotland and Wales11 and served a mix of rural,
suburban and urban areas and a range of affluent/deprived patient populations
(see Appendix for demographic details of participants).
Specific areas addressed in the interviews were:
GPs’ experience of using the electronic CDS tools in practice
Types of consultations they were used in
10
This is a fairly typical number for qualitative research 11
With the exception of the qualitative data, all other data in this report are England only
19
Changes to practice
Advantages and disadvantages
Understanding of the theoretical basis of the tools
Comparison with other risk assessment tools
Potential for wider dissemination of the tools
All interviews were professionally transcribed verbatim and interview data
analysed using a systematic approach based on the Framework method12.
Consent to participate was checked verbally at the time of each telephone
interview. A pseudonym has been attributed to each participant.
2.3.2.2 Patient perspective
Six focus groups were undertaken between January and March 2014 with a total
of 31 participants, 15 men and 16 women. Two groups were made up of
members from existing consumer representative panels, two were developed
through engagement with Citizen Panel membership groups, and two were
Patient Participation Groups attached to GP practices.
Discussions amongst the focus groups were preceded by a short film to
introduce the topic to the participants and the focus group facilitator outlined
the different functions of the tools.
An interview schedule was used to guide the discussion and elicit participants’
views on:
GPs’ use of CDS tools in consultations
The usefulness/desirability of patients knowing their potential cancer risk
Perceptions of how involved patients should be in decision-making about their own
health/healthcare
Focus group recordings were professionally transcribed verbatim and analysed
using the Framework method12.
12
Ritchie J., Spencer L. (1994) Analysing qualitative data. In: Bryman A., Burgess R. (Editors). London: Routledge

20
2.3.3 Cancer Waiting Times Database
This element of the evaluation considered the impact of having access to the CDS
software on numbers of urgent referrals for suspected cancer and associated
conversion and detection rates, based on data recorded in the National Cancer
Waiting Times Monitoring Dataset.
The analysis of these data was guided by the following questions:
For each of the referral routes of interest (see below), were there any
differences in referrals, conversion or detection rates for practices
participating in the CDS project compared with practices that were not
involved (controls)?
Were there any differences in referrals for practices allocated to the RAT
algorithm compared with those allocated to the QCancer algorithm?
Was there any impact on referral activity by age, gender and deprivation?
Reflecting the cancers featured within the tools, and also allowing for a control
urgent referral route, the following routes were of interest:
i) suspected lower gastrointestinal (GI) cancers (includes colorectal
cancers);
ii) suspected lung cancer;
iii) suspected gynaecological cancers (includes ovarian cancers);
iv) suspected upper GI cancers (includes OG and pancreatic cancers) and;
v) as a control comparison route, suspected head and neck cancers.
Control practices were defined as practices not recruited to the project, or those
which were recruited but did not have the CDS software installed before
November 2013, which were in the same (former) Cancer Network (CN) areas
that the participating practices belonged to.13 Control practices were defined on
this basis to control for potential impacts of other local/regional activity such as
the Be Clear on Cancer (BCOC) campaigns and variable ‘supporting primary care’
activity conducted under the auspices of NAEDI. 13
For Medway CCG, control practices were taken from the former Kent and Medway CN area. For the Isle of Wight group of practices, control practices were taken from the Central South Coast CN

21
Practices withdrawing from the CDS project (31 practices) were excluded from
both the participating and control groups. Practices were also excluded if the
registered population size according to the Quality and Outcomes Framework
datasets had changed by 10% or more between 2012 and 2013, or if the
population size was missing (a total of 342 practices; 19 in the CDS group and
323 in the control group). Altogether, there was a total of 416 participating
practices and 4,189 control practices included in the analyses, see the table
below.
Table B: Numbers of participating and control practices by Cancer Network
Allocation Cancer Network group
Number of practices
Participating Control
RAT Dorset 13 87
Kent & Medway* 22 232
Merseyside & Cheshire 23 321
Humber & Yorkshire Coast 13 133
North Central London 15 250
North East London 22 275
North of England 68 363
Pan Birmingham 21 310
Sussex 14 172
TOTAL 211 2,143
QCancer East Midlands 27 527
Essex 19 209
Greater Manchester & Cheshire 36 471
Central South Coast** 16 199
Lancashire & South Cumbria 15 240
North Trent 26 207
South West London 66 193
TOTAL 205 2,046
Overall 416 4,189
* includes Medway CCG ** includes the ‘Isle of Wight’ group of practices
Data on urgent GP referrals, conversion and detection were extracted for the
participating and control practices from the National Cancer Waiting Times
Monitoring Dataset provided by NHS England and accessed via Public Health
England’s Knowledge and Intelligence team (East Midlands).

22
Monthly data from December 2010 until February 2014 for number of referrals
and detection rates, and until November 2013 for conversion rates (based on the
most up-to-date data available at the time of extraction) for the routes described
above were extracted.
The percent changes in number of referrals14 between the time periods (e.g.
quarters) in 2012 compared with the same time period in 2013 were calculated.
The changes were tested for statistical significance using a likelihood ratio test.
To test whether the percent changes in referrals for a time period in 2012
compared with 2013 were significantly different between participating practices
and control practices, confidence intervals for the percent changes were
calculated. Changes for participating and control practices were assumed to be
significantly different if their confidence intervals did not overlap. This required
the assumption that GP-registered populations were constant throughout 2012
and 2013.
For conversion and detection rates, changes between time periods in 2012 and
the same period in 2013 were calculated and tested using the two-sample
proportion test.
See Appendix for more details of the methods.
2.3.4 Data on investigations provided by BMJ Informatica
Data on the number of diagnostic tests associated with each of the cancer types
carried out per month between January 2011 and December 2013 were made
available by BMJ Informatica. However, data were only available for around half
of the 439 participating practices (n=220 practices) at the time the data were
extracted in June 2014. In light of this and general concerns about the robustness
of the data, a decision was made not to use this source for this evaluation.
Unfortunately, due to the late hour at which the shortfalls in these data were
14 The number of referrals, and not rates, have been analysed because GP-registered populations would need to be used as the denominator for which there are some inherent issues, for instance GP-registered populations can quickly change but they are not available by quarter for the time period considered in these analyses
23
apparent, it was not possible to secure investigation data from an alternative
source. Any further work in this area could seek to draw on the Diagnostic
Imaging Dataset.
2.4 Considerations and limitations
There are a number of considerations necessary when assessing this evaluation
and findings.
2.4.1 Lack of comprehensive usage data
For a variety of reasons, including software limitations and not wanting to
overburden GPs, it has not been possible to capture comprehensive usage data
across all functions of the tool and for every use of each function. This precludes
any conclusions to be drawn as to frequency of use or change in use over time.
Moreover, the data which are available stem from voluntary completion of the
‘Experience tab’ following use of the symptom checker function. It is not possible
to generalise these findings to the wider GP community given uncertainties as to
how GPs completing the tab differ to GPs who used the function but did not
complete the tab. More broadly, GP practices were invited to participate in this
project and those who agreed to do so may differ from those who chose not to,
again limiting the generalisability of findings.
2.4.2 No fixed start date
While the start of the project is considered to be March 2013, there was no fixed
launch date and variable installation of the software into practices over time.
2.4.3 Assumptions as to data accuracy
Analysis of the Experience tab data is reliant on the data provided by BMJ
Informatica, and assumptions have been made that data were inputted correctly
and are accurate in the first instance (such as the information provided by the
GPs about themselves or about the impact of the tools on their management of
the patient), and that the information captured in the spreadsheet accurately
reflects the data inputted and the data generated (i.e., the scores calculated by
the algorithms).
24
2.4.4 Qualitative element
The qualitative element of the evaluation is based on interview and focus group
discussions with a small number of participants who volunteered to participate
and cannot be assumed to be generalisable.
2.4.5 Variable histories and lack of true controls
In some of the analyses comparisons have been made to ‘control practices’;
practices which had not participated in this project. However, as mentioned
previously in this report, there have been efforts to disseminate desk-based
versions of lung and colorectal RATs in the past, and indeed QCancer is available
for anyone to access online, meaning that there is no true control. Related to this,
there is a variable history of awareness campaign activity across regions, most
notably BCOC campaigns, which further complicates the evaluation.
2.5 Findings
This section outlines the finding from all elements of the evaluation, broadly
structured so as to address the key evaluation questions outlined previously.
Data from the qualitative element has been incorporated throughout, and is
denoted by text and quotes extracted verbatim from the report and presented in
boxes. The full reports are available in the Appendix.
2.5.1 What do we know about the practices involved in the
project?
Initially, 510 GP practices in England were recruited to the project (259 assigned
to the RAT algorithm and 251 assigned to the QCancer algorithm). However, 23
practices withdrew (eight RAT and 15 QCancer) during the study period, 15 of
which withdrew before being installed with the CDS software, and the rest
withdrew before completing the symptom checker tool through to the
Experience tab. Various reasons were given by practices for their withdrawal,
varying from delays in software installation, changes to practice IT systems and
changes to the practice workforce/team. This left 487 practices.
Further to this, a tenth of these practices (29 RAT and 19 QCancer) did not have
the CDS software installed on their practice system by the end of the project

25
period (end of November 2013), leaving 439 “participating” practices (222 RAT
and 217 QCancer) able to use the tools during all or some of the study period.
The reasons some practices did not have the CDS software installed by the end of
the project were predominantly due to technical difficulties with IT systems and
gaining access to GP practices to install software.
Over half (54%) of the 439 participating practices had the CDS software installed
before the study period began (i.e. by March 1st 2013). By the beginning of June
this had increased to 95% and 100% were installed by the beginning of
November 2013, see Figure 1 (also Table 1 of the Appendix).
Technical difficulties experienced by some in getting the software onto practice
systems and up and running are reflected in the qualitative data:
The tools did not function well on several clinical systems and the majority of
interviews revealed technical hitches during and after installation.
The number of practices recruited, withdrawn and installed within each Cancer
Network (CN) are shown in Figure 2 below (see also Table 2 of the Appendix).
At least three-quarters of practices in each CN had the CDS software installed by
the end of the study period. The CNs with the greatest number of participating
practices were the North of England CN (70 practices, assigned to RAT) and
South & West London CN (72 practices, assigned to QCancer).

26
Fig 1: Proportion of practices installed with the CDS software by the beginning of each month during the study period (practices assigned to RAT and QCancer are combined)
Fig 2: Number of practices recruited, withdrawn and installed by Cancer Network, by practices assigned to RAT (blue) and practices assigned to QCancer (purple)
For the rest of the analysis, references to “practices” refer to those practices that did not withdraw and that were installed before the end of the study period.
Breakdowns of which GP systems the practices were using are available in the
Appendix.
installed (QCancer)

27
2.6 How were the tools used, including by whom and
with whom?
2.6.1 Use of the tool in the presence of a patient
Interview data revealed mixed preferences for use of the tool within the
consultation, and in conjunction with the patient. From the GPs, concerns about
taking focus away from patients and the potential for raising anxiety were
apparent, though these were not always barriers to their use.
‘Sometimes I hide it, just in case I cause an alarm, but I will start to cover it during
the consultation if there is any risk, yes. It depends because, you know, some
patients, if they’re anxious, when they see something like that, they become more
anxious’. (GP16/M/RAT)
‘[the patient] was actually consulting about something different and it did actually
guide the conversation, the patient looked [at the tool] for potential red flags which
might, sort of, indicate that actually further investigations or referral were
appropriate’. (GP28/F/QCancer)
Similar concerns about loss of focus were raised within the patient focus groups.
One of the greatest anxieties to emerge from the focus group data regarding GP
computer use during consultation was the loss of GP/patient interaction. Over-
reliance on the computer and a tendency to look at the screen rather than the
patient was identified as part of the consultation process in several participants’
present day experience. As such, they felt excluded from this interaction’.
However, when participants were asked about RAT and QCancer tools
specifically, the response was generally positive and patients were keen to be
involved.
The majority of focus group participants agreed that GPs should share their use of
CDS tools with patients and research findings highlight the importance of good
rapport between healthcare professional and patient.
The majority of focus group participants stated they would want to know their
potential risk of cancer.
28
2.6.2 Usage across functions
As discussed previously, it was not possible to capture comprehensive usage
data within and across tool functions. The qualitative data provide an indication
as to which function was most frequently encountered or used by GPs in this
project.
Of the three components of the tools, the one used most frequently was the prompt
function, which alerted GPs when a patient presented with a risk score of 2% or
above and urged further action on the part of the GP.
Furthermore, the interview data suggests that prompts for bowel and lung
cancer were the ones GPs were most likely to be served with.
‘Certainly we were getting a lot of colorectal, you know, kind of, flashing up. That
and lung. Didn't get much of anything else. Got the odd ovary flashing up’.
(GP3/F/QCancer)
‘The main ones that it seems to be flagging up are colorectal and lung. I haven't
really had any automatic pop-ups for ovarian or pancreatic’. (GP28/F/QCancer)
This is entirely in line with the nature of the prompt function which was based
on historic Read-coded data within the patient record and appeared without any
deliberate action on the part of the GP. The other elements of the tool, however,
required a GP’s conscious interaction with the tool.
The qualitative data suggest that the next most commonly encountered function
of the tool was the symptom checker. This is in line with interview data which
suggest that, for some GPs, the appearance of a prompt prompted manual
inputting of symptom and other data into the symptom checker:
‘I tend to use the prompts, and then if it’s prompting me something, I go and look at
the risk calculator, if you see what I mean. I haven’t yet gone in and asked it to
come up with the risk for me by tapping in other symptoms.’ (GP17/F/QCancer)

29
Completions of the ‘Experience tab’ support the assertion that the symptom
checker function was used at least 1,401 times within the study period (see
2.6.4).
2.6.3 How many practices had one or more GPs completing the
Experience tab of the symptom checker?
Overall, around four in ten practices (164/439 practices; 37%) completed the
Experience tab following use of the symptom checker tool at least once during
the study period; 34% of practices assigned to the RAT algorithm and 41%
assigned to the QCancer algorithm (see Table 3 in Appendix).
Figure 3 shows the number of practices from which GP(s) completed the
Experience tab at least once during the study period (out of total number
installed) by CN. The North of England and South & West London CNs had the
greatest number of practices completing the Experience tab at least once (25 and
31 practices, respectively). The CN with the greatest proportion of practices
completing the Experience tab at least once was Sussex CN (71%) and the CN
with the lowest proportion was Lancashire & South Cumbria (12%).
Fig 3: Number of practices completing the Experience tab at least once during the study period by Cancer Network, for those assigned to RAT (blue) and QCancer (purple).
≥1 use (QCancer)
30
2.6.4 How many GPs completed the Experience tab of the
symptom checker?
A total of 259 individual GPs completed the symptom checker tool through to the
Experience tab at least once during the study period; 110 GPs (42%) assigned to
RAT and 149 GPs (58%) assigned to QCancer. This is equivalent to nearly two
GPs completing the Experience tab at least once per practice of those practices in
which GPs collectively completed the Experience tab at least once (or equivalent
to 0.6 GPs per practice out of all participating practices).
The North of England and South & West London CNs had the greatest number of
GPs (40 GPs each) completing the Experience tab at least once (see Table 3). The
CNs with the greatest average number of GPs per practice completing the
Experience tab at least once was the Isle of Wight (2.6 GPs per practice) and
North Trent (2.4), and the CNs with the lowest were North Yorkshire and
Humber and Lancashire & South Cumbria (both 1.0 GPs per practice).
The Experience tab was completed a total of 1,401 times during the study period.
The tab was completed more often by practices allocated to the QCancer
algorithm (62% of the total completions) than by those allocated to RAT (38% of
the total [see Table 4]). On average, the Experience tab was completed over five
times by each GP out of those GPs completing it at least once (Table 5).
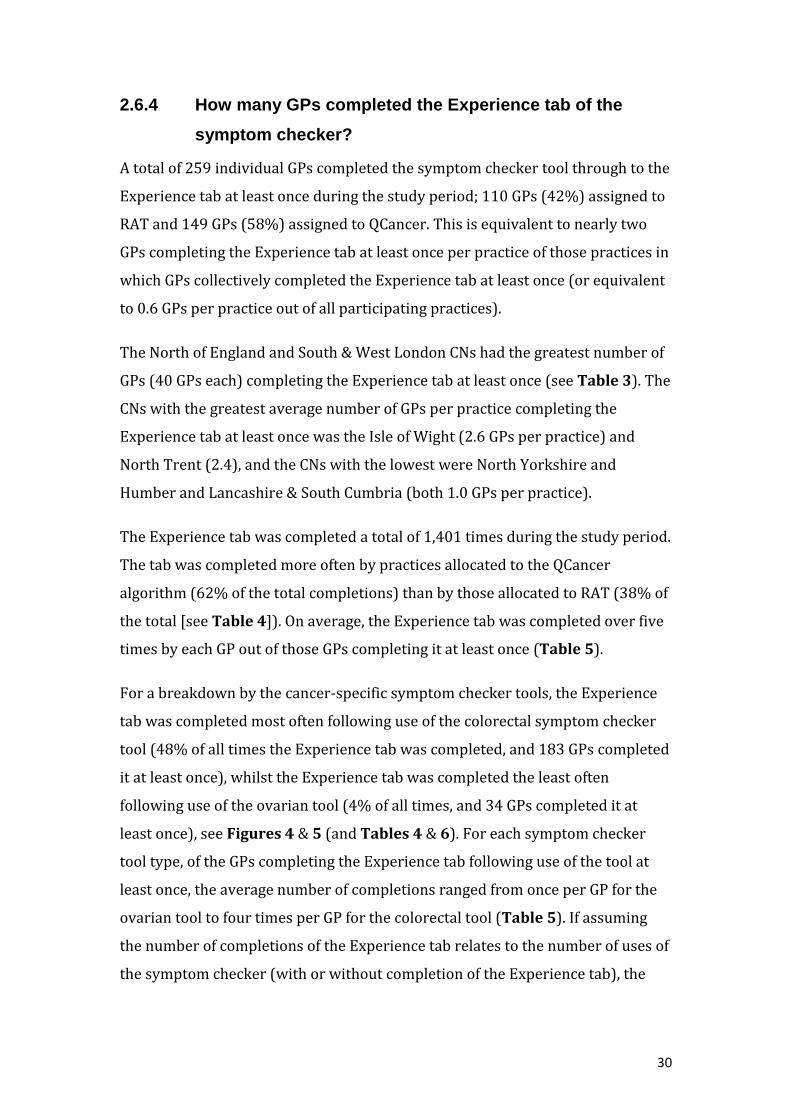
For a breakdown by the cancer-specific symptom checker tools, the Experience
tab was completed most often following use of the colorectal symptom checker
tool (48% of all times the Experience tab was completed, and 183 GPs completed
it at least once), whilst the Experience tab was completed the least often
following use of the ovarian tool (4% of all times, and 34 GPs completed it at
least once), see Figures 4 & 5 (and Tables 4 & 6). For each symptom checker
tool type, of the GPs completing the Experience tab following use of the tool at
least once, the average number of completions ranged from once per GP for the
ovarian tool to four times per GP for the colorectal tool (Table 5). If assuming
the number of completions of the Experience tab relates to the number of uses of
the symptom checker (with or without completion of the Experience tab), the
31
differences in use could merely be reflective of differences in the frequency of
cancer types, and their related symptoms, in the population.15
Fig 4: Overall number of times the Experience tab was completed following the use of each cancer-specific tool during the study period, by those assigned to RAT, QCancer and overall (i.e. RAT and QCancer groups combined)
Fig 5: Number of GPs completing the Experience tab at least once after using each cancer-specific symptom checker function during the study period, by those assigned to RAT, QCancer and overall (i.e. RAT and QCancer groups combined)
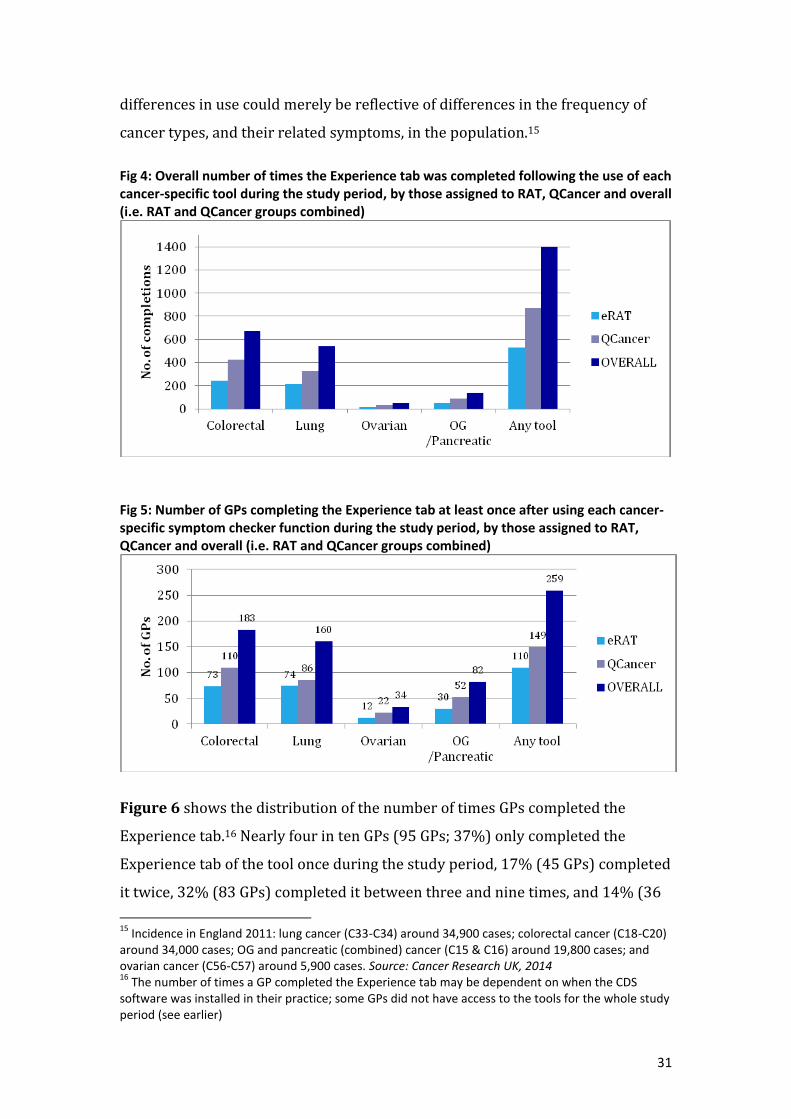
Figure 6 shows the distribution of the number of times GPs completed the
Experience tab.16 Nearly four in ten GPs (95 GPs; 37%) only completed the
Experience tab of the tool once during the study period, 17% (45 GPs) completed
it twice, 32% (83 GPs) completed it between three and nine times, and 14% (36
15
Incidence in England 2011: lung cancer (C33-C34) around 34,900 cases; colorectal cancer (C18-C20) around 34,000 cases; OG and pancreatic (combined) cancer (C15 & C16) around 19,800 cases; and ovarian cancer (C56-C57) around 5,900 cases. Source: Cancer Research UK, 2014 16
The number of times a GP completed the Experience tab may be dependent on when the CDS software was installed in their practice; some GPs did not have access to the tools for the whole study period (see earlier)
32
GPs) completed it at least ten times. The maximum number of times a GP
completed the tab was 54 times.
Fig 6: Distribution of the number of times GPs completed the Experience tab of the symptom checker function over the study period (RAT and QCancer groups combined)
Within the GP interviews, about half of participants were asked specifically about
completion of the Experience tab17. Most of the interviewees either had not
completed the tab at all, or not for every use of the symptom checker. One
participant’s response alluded to some of the challenges of collecting data from
GPs and suggested a mechanism which may have fostered greater completion.
‘If you want feedback, I would suggest having a feedback later button, if you see
what I mean. I know you can drop it down, but then you forget to go back to it at
the end of surgery or at the end of the consultation. So if you want feedback, I think
you possibly almost need to have a sort of remind me later button’.
GP17/F/QCancer
17
This question was introduced once data collected had started at the request of Macmillan

33
2.6.5 What do we know about the GPs who completed the
Experience tab?
GPs who completed the Experience tab were asked to provide some information
about themselves. They only needed to do this once even if they chose to
complete the Experience tab on more than one occasion.
Based on the information inputted, similar proportions of completers were male
and female, and with a mix of experience, based on length of time practising.
Table C: Gender of GPs completing the Experience tab at least once
User gender Number of users (% of known gender)
Female 111 (46%)
Male 129 (54%)
Unknown 19
Total 259
Table D: Length of time practising for GPs completing the Experience tab at least once
Time practising Number of users (%)
1-9 years 58 (22%)
10-19 years 60 (23%)
20-29 years 74 (29%)
30+ years 46 (18%)
0 years / unknown* 21 (8%)
Total 259 *not known whether the GP had just started practising or whether the field was not completed
GPs completing the tab were also asked whether they had received training in
use of the tool and based on information provided, the majority of GPs
completing the checker had received training, but over 15% had not.
Table E: Whether GPs were trained
Trained? Number of users (% of known)
Yes 206 (83%)
No 42 (17%)
Unknown 11
Total 259

34
2.6.6 How did completion of the Experience tab vary over time?
Completion of the Experience tab following use of the symptom checker tool
declined over the study period. Taking into account the number of practices that
were not yet installed each month,18 the proportion of installed practices
completing the Experience tab at least once each month steadily decreased
throughout the study period; from 26% in March to 5% in November, see Figure
7 (and Table 7). However, there were slight increases around May and
September.
Figure 7: Proportion of practices completing the Experience tab of the symptom checker function at least once for each month over the study period, adjusting for the number of practices installed (RAT and QCancer groups combined)
Similarly, the number of GPs completing the Experience tab at least once each
month overall declined during the study period. There were slight variations in
the trends between the cancer-specific tools, see Figure 8 (and Table 8).
Figure 8: Number of GPs completing the Experience tab of the symptom checker function at least once during each month, by cancer-specific tool (RAT and QCancer groups combined)
18
The proportion of practices completing the tab in one month is out of the cumulative number of practices installed by the beginning of that month (NB this does not include practices installed during that month)

35
Figure 9 (and Table 9) shows the number of GPs completing the Experience tab
for the first time over the study period. It shows that the number completing the
tab for the first time generally declined over the period, but there were still some
GPs completing the tab for the first time all the way through the study period
into November 2013.
Figure 9: Number of GPs completing the Experience tab of the symptom checker function for the first time, by month (RAT and QCancer groups combined)
As noted above, not all GPs completed the Experience tab or completed it for
every use of the symptom checker. It is therefore not possible to assess from the
data how use of the tool, or functions within it, changed over time.
2.6.7 What do we know about the patients with whom the
symptom checkers were used?
While not comprehensive, the Experience tab data provide some useful insights
regarding with whom the symptom checkers were used.
2.6.7.1 Gender profile of patients
Overall, the symptom checker function was completed through to the Experience
tab for a slightly, but significantly, higher proportion of female (54%) than male
patients (46%; p<0.01), even after exclusion of completions of the ovarian tool
(53% female compared with 47%, p<0.01).19 The same significant pattern was
seen for each of the cancer-specific tools except the lung cancer tool, which was
completed on a slightly higher proportion of male than female patients (53%
males; p<0.01), see Figure 10 (and Table 10).
19
Out of patients with a known gender (97% of all patients)

36
Fig 10: Proportion of patients by gender (of patients with known gender) that the cancer-specific symptom checker functions were completed on through to the Experience tab (RAT and QCancer groups combined)
2.6.7.2 Age profile of patients
Nearly nine in ten (86%) of the total records were for patients aged 55 and over.
This ranged from 68% for the ovarian tool to 93% for the OG/pancreatic tool.
Figure 11 shows the age distribution overall and by the cancer-specific tools
(see also Table 11).
Fig 11: Number of patients by age group on which the cancer-specific tools were completed to the Experience tab (RAT and QCancer groups combined)
excluding
ovarian

37
2.6.7.3 Deprivation profile of patients
Around four in five (79%) patients had a Townsend score20 recorded. Of those
with a known score, the average Townsend deprivation score was 2.1 (with
standard deviation of 1.3). The scores ranged from -0.1 to 4.3, which fall into the
third to fifth quintiles of Townsend deprivation scores for England and Wales
(where the fifth quintile has the highest scores and corresponds to the most
deprived).i The most common score was 2.3 (falling into the fourth quintile for
England and Wales), whilst a quarter of patients had a score of 1.2 or lower and a
quarter had a score of 3.2 or higher (see Table 12).
2.6.7.4 Signs, symptoms and other factors experienced by patients
The symptom checkers calculated risk scores on the basis of signs, symptoms
and other factors inputted at the time of consultation and reflecting the patient’s
presentation, situation and/or experience.
The inputted data most commonly used to calculate a score for each of the
symptom checkers are summarised below.
Colorectal cancer-specific symptom checker
Overall, the top three symptoms that the recorded patients presented with were
abdominal pain, low haemoglobin and diarrhoea (with 38%, 36% and 29%
patients presenting with these symptoms, respectively). When looking at the
combination of symptoms/risk factors a patient could present with, the most
common situation was for a patient to present with only very low haemoglobin
and no other reported symptom (11% of patients).
The top three symptoms were the same as above for those presenting to GPs
allocated to the RAT symptom checker and those for presenting to GPs
20
Based on LSOA of the patient's residence and using Office For National Statistics 2001 census data. Definition of Townsend score: “The Townsend Index was devised by Townsend et al in 1988 to provide a material measure of deprivation and disadvantage. The index is based on four different variables taken, originally from the 1991 Census. The four variables that comprise the Townsend Index are: unemployment as a percentage of those aged 16 and over who are economically active; non-car ownership as a percentage of all households; non-home ownership as a percentage of all households; and household overcrowding. The four variables combine to form an overall score. The higher the Townsend Index score, the more deprived and disadvantaged an area is thought to be. This allows different areas to be ranked in relation to one another”

38
allocated to the QCancer checker (with 39%, 37% and 30% patients
presenting with these symptoms respectively for RAT, and 37%, 36% and
29% respectively for QCancer).
Lung cancer-specific symptom checker
Overall, the top three symptoms that the recorded patients presented with were
abnormal spirometry, cough and dyspnoea (59%, 50% and 30% of patients
presented with these symptoms, respectively). When looking at the combination
of symptoms/risk factors a patient could present with, the most common
situation was for a patient to present with only abnormal spirometry and no
other reported symptom (11% of patients).
For those presenting to GPs allocated to RAT, the top three symptoms were
cough, abnormal spirometry and dyspnoea (57%, 49% and 35%,
respectively).
For those presenting to GPs allocated to QCancer, the top three symptoms
were abnormal spirometry, cough and chronic obstructive pulmonary
disease (COPD) (65%, 45% and 32%, respectively).
Ovarian cancer-specific symptom checker
Overall, the top three symptoms that the recorded patients presented with were
abdominal bloating, abdominal distension and abdominal pain (66%, 60%
and 46% of patients presented with these symptoms, respectively). When
looking at the combination of symptoms/risk factors a patient could present
with, the most common situation was for a patient to present with only
abdominal distension and no other reported symptoms (16% of patients).
For those presenting to GPs allocated to RAT, the top three symptoms
were abdominal bloating, abdominal pain and abdominal distension
(79%, 58% and 42% of patients presented with these symptoms,
respectively).
For those presenting to GPs allocated to QCancer, the top three
symptoms were abdominal distension, abdominal bloating and
abdominal pain (71%, 58% and 39% of patients presented with these
symptoms, respectively).

39
OG/Pancreatic combined cancer-specific symptom checker
Overall, the top three symptoms that the recorded patients presented with were
dysphagia, dyspepsia and nausea/vomiting (42%, 25% and 23% of patients
presented with these symptoms, respectively). When looking at the combination
of symptoms/risk factors a patient could present with, the most common
situation was for a patient to present with only dysphagia and no other reported
symptoms (24% of patients).
For those presenting to GPs allocated to RAT, the top three symptoms
were dysphagia, nausea/vomiting and dyspepsia (39%, 29% and 42%
of patients presented with these symptoms, respectively).
For those presenting to GPs allocated to QCancer, the top three
symptoms were dysphagia, dyspepsia and nausea/vomiting (44%,
26% and 19% of patients presented with these symptoms,
respectively).
Tables 13.1 to 13.4 in the Appendix list the proportion of patients presenting with
all symptoms for the cancer-specific tools.
2.7 How do the tools impact on clinical practice and the
management/investigation/referral of patients?
Data from the qualitative element of the evaluation suggest that the tools
impacted clinical practice to varying degrees, ranging from no reported impact at
all, to alerting to GPs to ‘think cancer’, to prompting further investigations or
other referrals.
The most significant function of the tools was that they raised GPs’ awareness of
cancer symptoms and both reminded and alerted users to potential risk. Adding to
the educational basis of their practice thus made the tools more acceptable to GPs.
In some instances, GPs reported that the tools helped them to consider that some
symptoms could be those of rarer cancers, as well encouraging them to focus on
vague or non-red flag symptoms.

40
‘It makes you think…it hasn’t so far actually changed my actions in any way, shape
or form’. (GP17/F/QCancer)
‘it’s probably made me more aware of symptoms which I may have not been as
aware of in the past’. (GP13/M/RAT)
‘Sometimes somebody’s coming with something else and because it prompts for
lung cancer, I start asking things about cough’. (GP16/M/RAT)
‘I felt obliged to have a quick look back through that patient’s recorded to just see
what was going on with them, yes’. (GP1/F/RAT)
‘It’s a good way of maintaining cancer at a higher level so although it might not
have helped me in a particular patient, it makes you more likely to ask for tests
maybe in other patients, so it keeps you thinking about cancer […] it’s helped
generally for me to, you know, refer more promptly and, you know, be aware not to
delay’. (GP14/F/RAT)
There are some examples reported within the interviews of potentially
expedited cancer diagnoses.
‘In two cases I probably made a referral that I either wouldn’t have made or made
it earlier than I might have done. So, it was useful. They’re the two that I can
remember’. (GP10/F/RAT)
‘I think I probably did pick up a lung cancer that I wouldn’t have done, I wouldn’t
have thought about it if I hadn’t had some of those prompts’. (GP14/F/RAT)
‘There was one patient that I referred that did prove to have a cancer that I might
have referred anyway, but possibly not so quickly, so it sped things up a little bit for
that person’. (GP28/F/QCancer)
Complementing the qualitative data, quantitative data from completions of the
Experience tab also provide insight into the impact of the tools on clinical
practice. Before those data are presented, it is first useful to consider the scores
generated by the algorithms and how they were perceived by the GPs.

41
2.7.1 What risk scores were calculated by the symptom
checkers?
Relevant to how the tools impacted on clinical practice are the scores calculated
by the algorithms. Scores from both algorithms were generated each time a
symptom checker was used, though the GP was only presented with one score
depending on the allocation of their CN/CCG. While the captured scores relate
only to uses of the symptom checker, the findings are also broadly relevant to the
other functions of the tool.
Based on the data provided by BMJ Informatica, of the patients recorded, the
average QCancer score was significantly lower than the average RAT score for
the colorectal, lung and pancreatic cancer-specific tools, whilst the average
QCancer score was significantly higher for the OG and ovarian tools (see Table
14 and Figures A-D in the Appendix).
The correlation coefficients for RAT scores compared with QCancer scores are
shown in the table below.
Table F: Correlation coefficients for RAT compared with QCancer scores Colorectal Lung Ovarian OG Pancreatic Any tool
Correlation coefficient (95% Confidence Interval)
0.30
(0.22-0.37)
0.25
(0.17-0.33)
0.62
(0.39-0.85)
0.71
(0.59-0.83)
0.11
(-0.06-0.28)
0.25
(0.20-0.30)
Interpretation of coefficients: 1=a strong positive association (as one score increases the other increases), 0=no association between the scores, and -1=an inverse association (as one score goes up, the other score goes down).
Across all the scores the correlation coefficient was 0.25 indicating there is a
positive association between the scores but it is not strong. However, there is
some variation in the alignment of RAT and QCancer scores by the different
cancer types. The scores were least comparable for colorectal, lung and
pancreatic, and most closely associated for OG and ovarian.
42
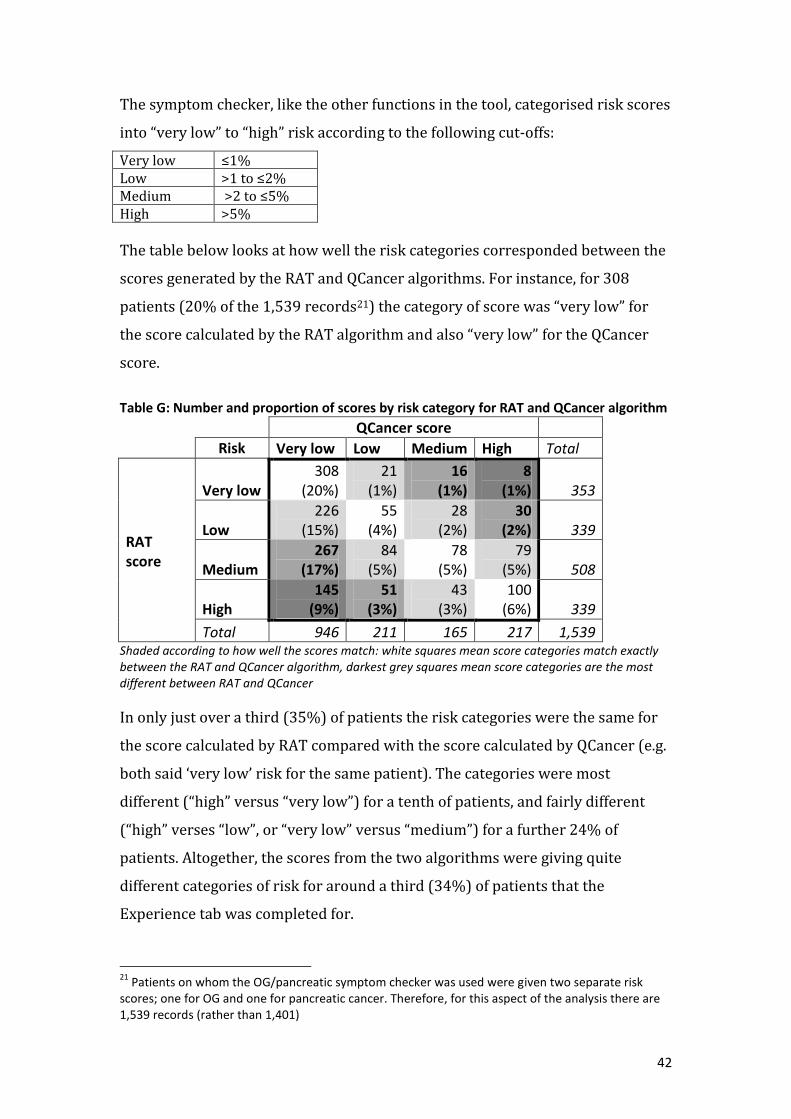
The symptom checker, like the other functions in the tool, categorised risk scores
into “very low” to “high” risk according to the following cut-offs:
Very low ≤1% Low >1 to ≤2% Medium >2 to ≤5% High >5%
The table below looks at how well the risk categories corresponded between the
scores generated by the RAT and QCancer algorithms. For instance, for 308
patients (20% of the 1,539 records21) the category of score was “very low” for
the score calculated by the RAT algorithm and also “very low” for the QCancer
score.
Table G: Number and proportion of scores by risk category for RAT and QCancer algorithm
QCancer score
Risk Very low Low Medium High Total
RAT score
Very low 308
(20%) 21
(1%) 16
(1%) 8
(1%) 353
Low 226
(15%) 55
(4%) 28
(2%) 30
(2%) 339
Medium 267
(17%) 84
(5%) 78
(5%) 79
(5%) 508
High 145
(9%) 51
(3%) 43
(3%) 100
(6%) 339
Total 946 211 165 217 1,539 Shaded according to how well the scores match: white squares mean score categories match exactly between the RAT and QCancer algorithm, darkest grey squares mean score categories are the most different between RAT and QCancer
In only just over a third (35%) of patients the risk categories were the same for
the score calculated by RAT compared with the score calculated by QCancer (e.g.
both said ‘very low’ risk for the same patient). The categories were most
different (“high” versus “very low”) for a tenth of patients, and fairly different
(“high” verses “low”, or “very low” versus “medium”) for a further 24% of
patients. Altogether, the scores from the two algorithms were giving quite
different categories of risk for around a third (34%) of patients that the
Experience tab was completed for.
21
Patients on whom the OG/pancreatic symptom checker was used were given two separate risk scores; one for OG and one for pancreatic cancer. Therefore, for this aspect of the analysis there are 1,539 records (rather than 1,401)

43
For the cancer specific symptom checkers, there were most discrepancies in
category of risk score for the lung cancer risk algorithm (47% were “high” versus
“very low” or “low”, or “very low” versus “medium) compared with the colorectal
(33%), OG (17%), pancreatic (12%) and ovarian (8%) versions.
Based on the data recorded, there were more instances where the RAT score was
‘high’ whilst the QCancer score was ‘very low’ (145 times) compared with vice
versa, i.e. when the QCancer score was ‘high’ and the RAT score was ‘very low’ (8
times). Further investigation of this could be helpful.
2.7.2 How did the calculated scores compare with the GP’s
perception of the patient’s risk?
Building on previous evaluation of desk-based risk assessment tools, one of the
questions on the Experience tab asked GPs if their perception of the patient’s risk
was higher, lower or the same as that presented by the score.
Overall, on more than half (54%) of recorded uses (when the symptom checker
was used with subsequent completion of the Experience tab), GPs said their
perceived risk was about the same as the risk calculated by the symptom checker
tool. The GP’s perceived risk was lower than the calculated risk for 31% of
recorded uses, whilst it was higher than the calculated risk for 15%.
The proportions varied slightly by whether GPs were assigned to the RAT or
QCancer algorithm (see Figure 12). For recorded uses by GPs assigned to RAT
there was a slight but significantly greater proportion where the GPs’ perceived
risk was higher than the calculated risk compared with recorded uses by GPs
assigned to QCancer (17% vs. 13%; p=0.03) and a smaller proportion of uses by
GPs assigned to RAT had a perceived risk that was significantly lower than the
calculated risk (25% vs. 34%; p<0.01). However, the proportion of uses that the
perceived risk was about the same as the calculated risk was similar for both
groups of GPs (58% RAT and 53% QCancer; p=0.06 [Table 15]).

44
There was also variation in these proportions by the cancer-specific tools, see
Figure 13 (and Table 15). Differences are outlined as follows for the GPs
assigned to RAT and QCancer algorithms combined:22
The proportion of times the GPs’ perceived risk was about the same as the
calculated risk was significantly lower for the lung tool (48%) compared with
the colorectal (58%; p<0.01), ovarian (64%; p=0.03) and OG/pancreatic
(62%; p<0.01) tools.
The proportion of times the perceived risk was higher than the calculated
risk was similar for each tool type (14% colorectal, 15% lung, 16% ovarian
and 16% OG/pancreatic).
The proportion of times the perceived risk was lower than the calculated risk
was significantly greater for the lung tool (37%) compared with the
colorectal tool (28%; p<0.01), ovarian (20%; p=0.02) and the OG/pancreatic
tool (22%; p<0.01).
Fig 12: Proportion of recorded uses in which the GPs’ perceived risk was about the same as, higher than, or lower than the calculated risk, for GPs assigned to RAT, QCancer and overall (RAT and QCancer groups combined).
Fig 13: Proportion of recorded uses in which the GPs’ perceived risk was the same as, higher than, or lower than the calculated risk, by cancer-specific tool (RAT and QCancer groups combined).
22
The numbers of completed uses of each cancer-specific tool for GPs assigned to RAT and QCancer separately were small so could not be meaningfully assessed for statistical significance
45
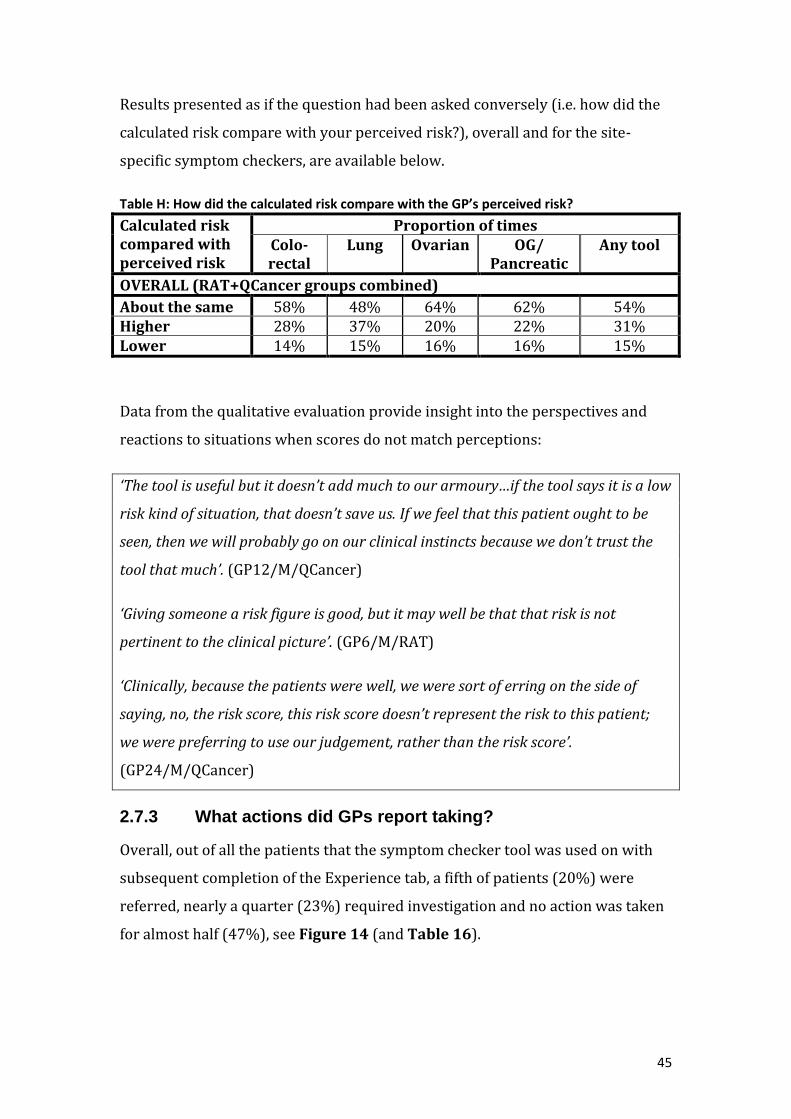
Results presented as if the question had been asked conversely (i.e. how did the
calculated risk compare with your perceived risk?), overall and for the site-
specific symptom checkers, are available below.
Table H: How did the calculated risk compare with the GP’s perceived risk?
Calculated risk compared with perceived risk
Proportion of times Colo-rectal
Lung Ovarian OG/ Pancreatic
Any tool
OVERALL (RAT+QCancer groups combined)
About the same 58% 48% 64% 62% 54% Higher 28% 37% 20% 22% 31% Lower 14% 15% 16% 16% 15%
Data from the qualitative evaluation provide insight into the perspectives and
reactions to situations when scores do not match perceptions:
‘The tool is useful but it doesn’t add much to our armoury…if the tool says it is a low
risk kind of situation, that doesn’t save us. If we feel that this patient ought to be
seen, then we will probably go on our clinical instincts because we don’t trust the
tool that much’. (GP12/M/QCancer)
‘Giving someone a risk figure is good, but it may well be that that risk is not
pertinent to the clinical picture’. (GP6/M/RAT)
‘Clinically, because the patients were well, we were sort of erring on the side of
saying, no, the risk score, this risk score doesn’t represent the risk to this patient;
we were preferring to use our judgement, rather than the risk score’.
(GP24/M/QCancer)
2.7.3 What actions did GPs report taking?
Overall, out of all the patients that the symptom checker tool was used on with
subsequent completion of the Experience tab, a fifth of patients (20%) were
referred, nearly a quarter (23%) required investigation and no action was taken
for almost half (47%), see Figure 14 (and Table 16).

46
Comparing the actions taken for the recorded patients according to whether they
were seen by GPs assigned to the RAT or QCancer algorithm (see Figure 14),
similar proportions were referred (22% and 20%, respectively; p=0.37), a
significantly greater proportion of RAT patients required investigation (30% vs.
18%; p<0.01) and no action was taken for a significantly smaller proportion of
RAT patients (38% vs. 53%; p<0.01).
There were some differences in the proportions of actions taken following use of
the different cancer-specific symptom checkers. Notably, a significantly greater
proportion of recorded patients were referred following the use of the colorectal
(26%; p<0.01) and OG/pancreatic tools (33%; p<0.01) compared with the lung
tool (11%), see Figure 15. Also, showing the reverse pattern, significantly more
patients were intended for investigation following the use of the lung cancer tool
(28%; p<0.01) compared with the colorectal tool.
Fig 14: Proportion of actions taken following recorded use of the symptom checker function for GPs assigned to RAT, QCancer and overall (RAT & QCancer groups combined)
Fig 15: Proportions of action taken following the recorded use of the symptom checker function, by cancer-specific tool (RAT & QCancer groups combined).

47
2.7.4 Would GPs have investigated or referred patients if they
had not used the symptom checker?
Out of the patients that GPs referred or intended for investigation after
completing the symptom checker along with the Experience tab, GPs reported
that they would not have acted (referred or investigated the patient) for around
a fifth (19%) of patients if they had not used the tool. The proportion was similar
for GPs allocated to the RAT algorithm and the QCancer algorithm (21% and
18%, respectively; p=0.37), see Figure 16 (and Table 17). However, there was
some variation in the proportion when broken down by the cancer-specific tools,
most notably, a larger proportion of patients that the lung tool was used would
not have been investigated or referred if the GP had not used the tool (33% of
patients referred or investigated) compared with the colorectal (12%; p<0.01)
and OG/pancreatic (9%; p<0.01) tools, see Figure 17 (and Table 17).
Fig 16: Proportion of times whether or not the GP would have referred or investigated a patient if they had not used the symptom checker (for all patients who were referred or investigated).
Fig 17: Proportion of times whether or not the GP would have referred or investigated a patient if they had not used the symptom checker (for all patients who were referred or investigated), by cancer-specific tool (RAT and QCancer groups combined).
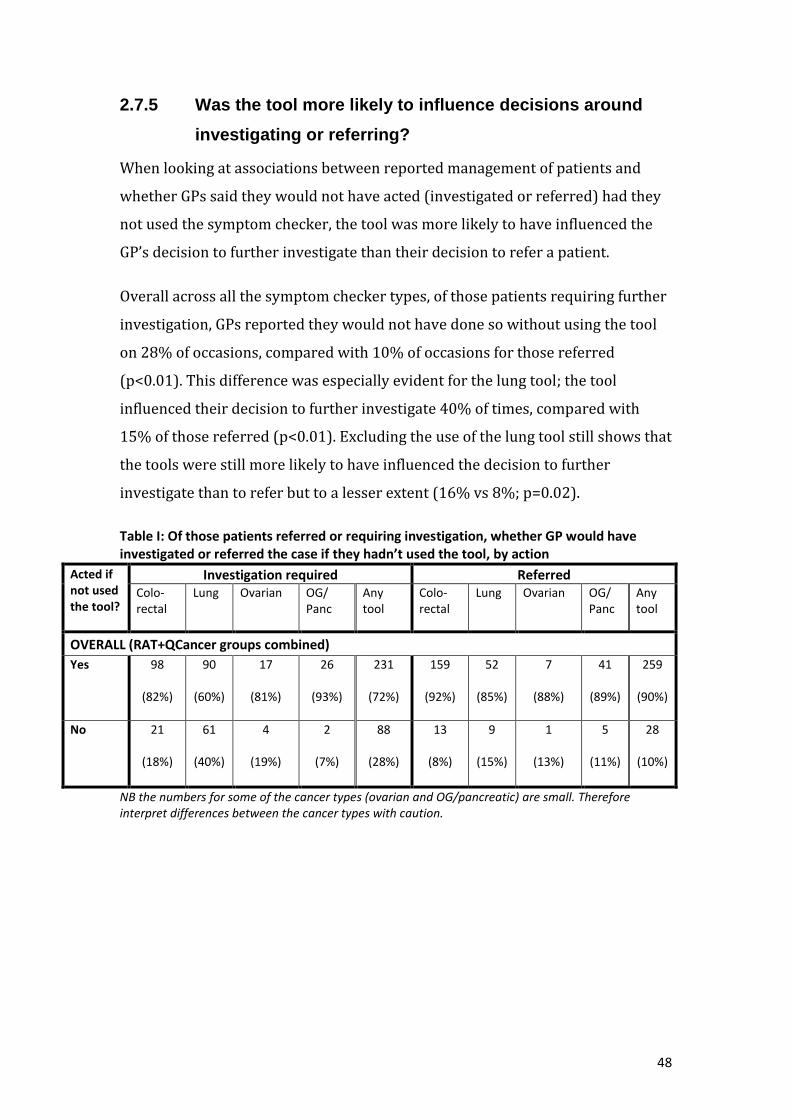
48
2.7.5 Was the tool more likely to influence decisions around
investigating or referring?
When looking at associations between reported management of patients and
whether GPs said they would not have acted (investigated or referred) had they
not used the symptom checker, the tool was more likely to have influenced the
GP’s decision to further investigate than their decision to refer a patient.
Overall across all the symptom checker types, of those patients requiring further
investigation, GPs reported they would not have done so without using the tool
on 28% of occasions, compared with 10% of occasions for those referred
(p<0.01). This difference was especially evident for the lung tool; the tool
influenced their decision to further investigate 40% of times, compared with
15% of those referred (p<0.01). Excluding the use of the lung tool still shows that
the tools were still more likely to have influenced the decision to further
investigate than to refer but to a lesser extent (16% vs 8%; p=0.02).
Table I: Of those patients referred or requiring investigation, whether GP would have investigated or referred the case if they hadn’t used the tool, by action
Acted if not used the tool?
Investigation required Referred Colo-rectal
Lung Ovarian OG/ Panc
Any tool
Colo-rectal
Lung Ovarian OG/ Panc
Any tool
OVERALL (RAT+QCancer groups combined)
Yes 98
(82%)
90
(60%)
17
(81%)
26
(93%)
231
(72%)
159
(92%)
52
(85%)
7
(88%)
41
(89%)
259
(90%)
No 21
(18%)
61
(40%)
4
(19%)
2
(7%)
88
(28%)
13
(8%)
9
(15%)
1
(13%)
5
(11%)
28
(10%)
NB the numbers for some of the cancer types (ovarian and OG/pancreatic) are small. Therefore interpret differences between the cancer types with caution.
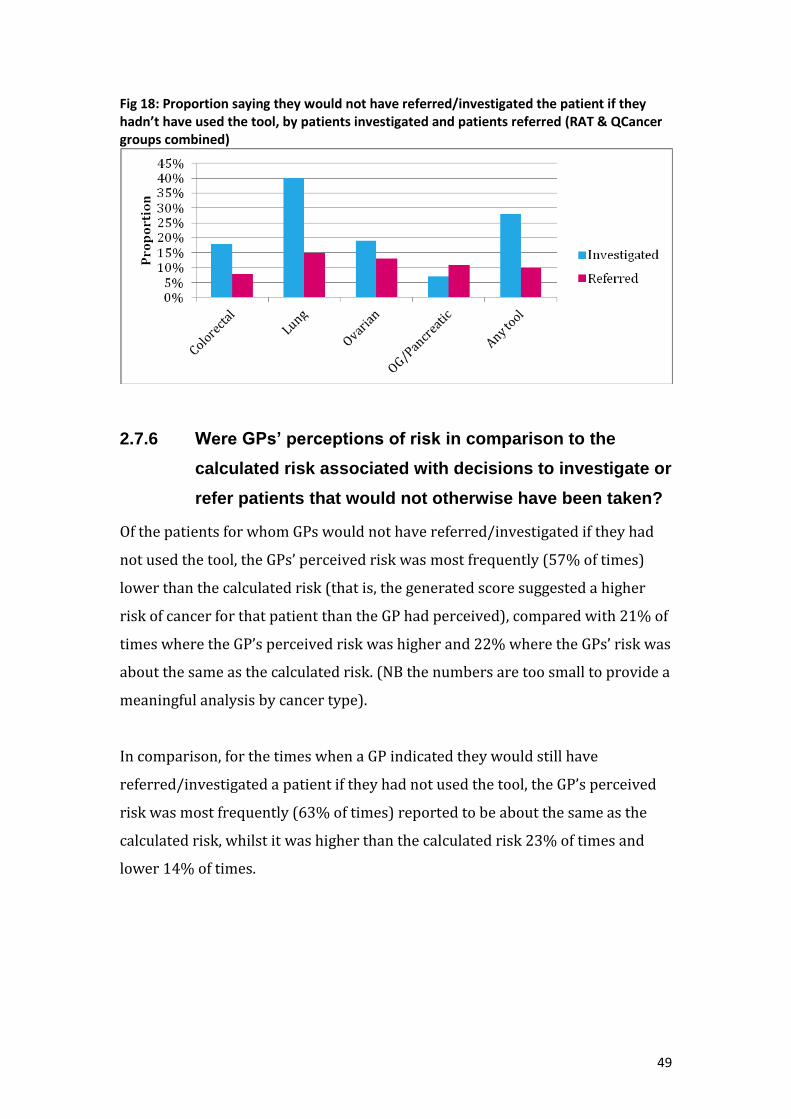
49
Fig 18: Proportion saying they would not have referred/investigated the patient if they hadn’t have used the tool, by patients investigated and patients referred (RAT & QCancer groups combined)
2.7.6 Were GPs’ perceptions of risk in comparison to the
calculated risk associated with decisions to investigate or
refer patients that would not otherwise have been taken?
Of the patients for whom GPs would not have referred/investigated if they had
not used the tool, the GPs’ perceived risk was most frequently (57% of times)
lower than the calculated risk (that is, the generated score suggested a higher
risk of cancer for that patient than the GP had perceived), compared with 21% of
times where the GP’s perceived risk was higher and 22% where the GPs’ risk was
about the same as the calculated risk. (NB the numbers are too small to provide a
meaningful analysis by cancer type).
In comparison, for the times when a GP indicated they would still have
referred/investigated a patient if they had not used the tool, the GP’s perceived
risk was most frequently (63% of times) reported to be about the same as the
calculated risk, whilst it was higher than the calculated risk 23% of times and
lower 14% of times.

50
Table J: GPs’ perceived risk of the patient compared with the calculated risk for those patients referred or requiring investigation, by whether GP would have investigated or referred the case if they hadn’t used the tool
Number (%) of times GPs’ perceived risk of the patient was the same, higher or lower than the calculated risk
Colorectal Lung Ovarian OG/Pancreatic^ Any tool
NO – GP would not have referred/investigated patient if hadn’t used the tool OVERALL (RAT+QCancer)
About the same
8 (24%)
12 (17%)
2 (40%)
4 (57%)
26 (22%)
Higher 8 (24%)
16 (23%)
0 (0%)
0 (0%)
24 (21%)
Lower 18 (53%)
42 (60%)
3 (60%)
3 (43%)
66 (57%)
Total 34 (100%)
70 (100%)
5 (100%)
7 (100%)
116 (100%)
YES– GP would have referred/investigated patient if hadn’t used the tool OVERALL (RAT+QCancer)
About the same
158 (61%)
91 (64%)
18 (75%)
44 (66%)
311 (63%)
Higher 61 (24%)
31 (22%)
5 (21%)
15 (22%)
112 (23%)
Lower 38 (15%)
20 (14%)
1 (4%)
8 (12%)
67 (14%)
Total 257 (100%)
142 (100%)
24 (100%)
67 (100%)
490 (100%)
NB the numbers by cancer type are small. Therefore interpret differences between the cancer types with caution.
2.7.7 Did patient characteristics differ by whether GPs would
not have acted without using the tool?
Whether a patient was male or female did not impact on whether GPs said they
would not have referred or investigated a patient if they had not used the tool.
The age distribution of referred or investigated patients for whom GPs said they
would not have referred or investigated a patient if they had not have used the
tool was different to the patients for whom they indicated they would have
referred or investigated anyway (p=0.004). This difference is mainly being
driven by the difference in proportions in the age groups 70-79 and 80+.

51
Table K: Age distribution of referred/investigated patients for whom GPs would not have referred or investigated if they hadn’t have used the tool, compared with the distribution of patients for whom GPs would have referred/investigated anyway.
Age group
All who would not have been referred/investigated
All who would have been referred/investigated anyway
Number Percentage Number Percentage
<40 0 0% 5 1%
40-49 9 8% 30 6%
50-59 23 20% 79 16%
60-69 31 27% 145 30%
70-79 43 37% 120 24%
80+ 10 9% 111 23%
Total 116 100% 490 100%
2.8 What is the associated impact on urgent referrals for
suspected cancer?
Overall, there is no strong evidence to suggest that having access to the CDS
software impacted on urgent GP referrals, conversion or detection rates for the
referral routes for cancers which can be directly linked to the CDS tool (i.e. those
routes associated with colorectal, lung, ovarian, OG or pancreatic cancers).
Compared with the same period in the previous year, there were slightly larger
increases in referrals for participating practices compared with the control
practices (for lower GI referrals there was a slightly smaller decrease compared
with the control) for the first few months of the CDS project (March-May), but
the differences between participating and control practices were not statistically
significant. Therefore, the increases may have been due to natural fluctuation. If
the increases were an impact of the electronic CDS tool, one could perhaps
expect to see the increases sustained for the rest of the study period, which they
were not. Also, there were greater increases for participating practices for the
months prior to the study starting (December-February). It could be speculated
that the increase in referrals before and during the early months of the pilot
might reflect heightened awareness of cancer amongst the GPs as a result of
being recruited to the project and receiving training. There was also a greater
increase in referrals for the control referral route, which it was assumed the CDS
software was unlikely to have impacted on, for March-May 2013 for participating
practices than for control practices.

52
There were no consistent differences in the changes in the number of referrals
compared with the previous year between practices allocated to RAT and those
allocated to QCancer.
Also, there were no clear patterns to suggest that having access to the CDS
software impacted on the distribution of referrals across age bands, gender or
levels of deprivation.
However, it should be noted that if there was an impact of the electronic CDS
tools, it may have been masked by other factors. For instance, there is lot of
background ‘noise’ for referral activity from other early diagnosis and awareness
initiatives that make trends difficult to interpret. Also, changes in populations
have not been accounted for in these analyses, but to our knowledge, there is no
reason to believe that changes in population sizes and structure would not
similarly impact on participating practices as they would control practices.
Furthermore, there was not a specific launch date for the pilot. Some practices
may have had the software before March 2013 (although it is assumed most GPs
would not have used the software without being trained), whilst others had not
received the CDS software and/or been trained on the software until after the
study period had started. However, logically this would imply that the impact of
the CDS software could be expected to be largest towards the end of the study
period when more GPs had access to it and had received training.
There may have been large variation in how often the tools were used across GP
practices. However, as there are no comprehensive usage data for the tools, it is
not possible to correlate use of the tool with referral activity.
See Appendix for more detailed results.
2.9 What is the impact on the primary care/secondary
care interface?
One of the areas which the qualitative evaluation sought to explore with GPs was
the (real or perceived) impact on the primary care/secondary care interface. As
mentioned previously, a letter had been sent to Trust and Primary Care Trust

53
Chief Executives ahead of the project launch in order to make them aware of
possible increases in demand and to garner their support for the initiative.
Many respondents expressed the contradictory pressures on GPs – a pressure not
to refer patients (driven by policy/CCGs) versus the drive to earlier diagnoses of
cancer.
Although some respondents felt that the CDS tools assisted them in making
decisions about potential cancer diagnoses, some data revealed apprehension
regarding how referrals based on the tools might be received by secondary care
colleagues. So, although the tool assisted in decision making in some instances, GPs
felt these might well be overridden because of the need to comply with extant
referral guidelines in order to meet the criteria for investigation.
‘Many times we can calculate until we go blue in the face, but if secondary care
thinks, actually, you know what, this wasn’t a two week wait target referral at all,
then this [tool] is a load of rubbish’ (GP2/M/RAT)
‘In one referral letter I did mention the risk calculation and it was totally ignored
at the secondary end, and they didn’t investigate the patient’. (GP20/F/RAT)
There was, however, also the view that the tools and associated scores could
legitimise referrals to secondary care and be used in communications to justify
decision-making:
‘There are criterion boxes often and very occasionally a patient doesn’t quite fit one
of the boxes and you tend to worry and just have to pen the truth anyway or do a
non-urgent referral but I think if you can justify whether actually they’ve got 38%
chance of colorectal cancer on this[tool] then I don’t think they would argue with
that’. (GP5/M/RAT)
54
2.10 How might the tools be improved, and any barriers to
their use reduced?
The qualitative element of the evaluation, particularly that involving GPs who
had been engaged in the project and used the tools, provides useful feedback on
how the tools were used and judged, and areas requiring further consideration.
2.10.1 Prompts
Stemming from the very nature of the function, the element of the tool most
commonly encountered by the GPs was the prompts. The majority of interview
participants drew attention to GPs’ concerns about prompt overload and fatigue,
and the possible implications of this.
The vast majority of interviewees, however, emphasized that during the course of
their working day they experience ‘information overload’, as pop-ups frequently flash
on their computer screens, in particular with relation to QOF. Data confirmed that
they began to ignore prompts, particularly when the calculated risk score was low.
‘I don’t know exactly how well that would be received by GPs in general. Because
we have all sorts of prompts coming at us, from QOF and all sorts of things. And it
gets a little bit distracting from the fact that somebody, generally, somebody has
come in with a problem that you’re trying to sort out and you’ve got all these
messages flashing up at you’. (GP/9/QCancer)
‘I’ve used it a few times but after that not anymore because, you know, it’s too much
and therefore not helpful. You start missing other things because there’s too much
of an overload of information showing on your screens’. (GP22/M/RAT)
‘I would say 90% of prompts I dismiss, for the very reason that I have other focuses
within the consultation’. (GP27/M/RAT)
2.10.2 Symptom checker
The GP interviews highlighted the various ways in which the symptom checker
function was used within primary care practice. Views on whether the checkers
should be completed alongside patients were mixed, and there were concerns

55
raised about the function not detracting focus from the patient and their needs.
Furthermore, the time pressure associated with a ten minute consultation was
raised by some as a barrier to GPs using this component, and uncertainties about
how to interpret the information presented was also raised.
2.10.3 Risk stratification list
Within the interviews with GPs, the risk stratification list was not referred to as
widely as the prompt or symptom checker and there were mixed views as to the
usefulness of the information, particularly relating to patients who were flagged
often being those already known to the GP. There were also concerns about the
feasibility of acting on the information.
‘Quite a few of the high risk actually were our cancer patients’. (GP3/F/QCancer)
‘Most of the time they were people with existing chest or heart problems who were
under the care of hospital and that was the only annoying bit because you began to
ignore it because these people were patients, known patients under investigations
who had, you know, most of them had had recent chest X-rays and everything
because they were, having ongoing health issues that were being checked out’.
(GP15/M/QCancer)
‘The list is so long that I just felt, I didn’t know where I was going to ever start with
it, you know, because it was so intensive, you know, it was pulling out, I don’t know,
it felt like about a quarter of our population and, you know, where do you start
with that?’ (GP1/F/RAT)
There was evidence, however, that this function of the tool could be used by GPs
and was not always perceived to be unduly burdensome.
‘In terms of identifying high-risk patients by auditing our records, that has proved
useful in that we’ve been looking at those high-risk lists and deciding within the
practice how to approach the patients and screen them for cancer…members of the
practice understand the importance of recognising these patients and welcome the
fact that there is some assistance there to identify potentially high-risk patients.
And we haven’t found it to increase our workload significantly’. (GP23/M/RAT)
56
2.10.4 Read codes
The prompt and risk stratification list functions within the tool relied on Read-
coded data within the patient record. However, the topic of Read codes received
much coverage within the interviews with GPs, particularly with respect to the
variation in practice and lack of consensus in approach. Moreover, participants
thought it unlikely that GPs would adapt their coding style in order to enhance
the validity of tools and the scores presented.
‘If you have to Read code every symptom a patient comes with, it’s quite a
cumbersome adventure, isn’t it, in the sense that you’ve only got ten minutes to
finish an appointment and then when the patient walks out you’ve got to think
about what are the different symptoms, or whatever. So there is often a multitude
of things. Then you’ve got to put that in different boxes. So we just do a
consultation, basically, and then we do free text’. (GP18/F/QCancer)
‘You spend a bit of time looking at someone thinking, gosh, have they got colorectal
cancer, and then realise, no, they haven’t or are unlikely to because it’s picked up on
these Read codes which aren’t accurate or this blood test which wasn’t right or
whatever’. (GP5/M/RAT)
‘Most people wouldn’t want to redesign their clinical practice just around coding
for a risk assessment’. (GP4/M/RAT)
‘Because Vision only Read codes whatever I feel is the most important symptom for
that consultation, then it means that it’s not as accurate so it’s partly the computer
system that we’re using to record notes’. (GP14/F/RAT)
2.10.5 Compatibility with clinical systems
The software was developed on the BMJ Informatica platform so that it would
operate on all GP IT systems, therefore making it possible for any GP/practice to
opt to participate in the project. Some GPs did, however, experience technical
hitches and glitches for a variety of reasons and contributing factors, including a
migration in many practices from EMIS LV to EMIS Web.

57
The tools did not function well on several clinical systems and the majority of
interviews revealed technical hitches during and after installation. Some GPs, for
example, discussed the ways in which the tools sat within an electronic system that
was separate from their clinical system, meaning that the software had to be opened
up separately, necessitating additional log-on. This was identified as a barrier to their
continued use of the tools.
2.10.6 Integration into practice
The findings and quotes presented in this section thus far inform future
development and roll-out plans. Data from the interviews with GPs also provide
useful insight into how the tools fit within practice, and work alongside clinical
judgement.
There was also consensus across the data that electronic tools do not suit all GPs’
ways of working, and not all of our respondents regarded the tools as preferable to
other forms of support for the earlier recognition of cancer symptoms.
‘You need a lot of different ways of doing things, if you see what I mean; there is no
one way of doing it. I think you need, I think the risk assessment tools are one
factor, I think education of lots of different forms, in lots of different ways, and in
small quantities frequently is another way […] We need to have a whole variety of
things, and we need to keep repeating it. Otherwise you will forget, because cancer
is, with the best will in the world, rare’. (GP17/F/QCancer)
‘A teaching session on the signs and symptoms of the various cancers would be
more useful, which would just refresh the memories of the doctors, rather than a
toolkit like this’. (GP7/M/RAT)
Chapter 3 Discussion
Effectively supporting GPs in the diagnosis of cancer has been a key tenet of
cancer policy in recent years. In line with this and under the auspices of the
National Awareness and Early Diagnosis Initiative (NAEDI), GPs from hundreds
of practices were given access to an electronic clinical decision support (CDS)
tool.
58
The tool was developed on the BMJ Informatica platform and presented cancer
risk scores derived from algorithms developed by Professor Willie Hamilton
(RAT) and Professor Julia Hippisley-Cox (QCancer). The tool, developed for
colorectal, lung, OG, pancreatic and ovarian cancers, included three functions; a
prompt, symptom checker, and risk stratification list.
Cancer Networks/CCGs and practices were recruited to the project at a time of
great upheaval within the NHS. This contributed to challenges in recruitment of
both and potentially some gaps in training provision. Challenges experienced by
some in getting the software onto GP systems were known at the time, and are
reflected in the qualitative data.
For various reasons, the early promise of what could be achieved in the
evaluation because of the electronic nature of the tool did not materialise.
Software and data limitations and concerns about not unduly burdening GPs has
led to gaps in the evaluation, most notably a lack of comprehensive usage data
across all functions of the tool. Furthermore, the voluntary nature of
participation in the project and contribution to evaluation (specifically
completion of the Experience tab and participation in interviews) limits the
generalisability of the findings; participating practices/GPs reflect those most
engaged in cancer and interested in efforts to improve practice and not
necessarily the wider GP community.
Importantly, it has not been possible through this evaluation to investigate
impact of access to, or use of, the CDS tool on clincal outcomes, such as the
number of cancers diagnosed or the stage of disease at diagnosis. This could be
an area of further work in the future but unless it is possible to track patient
records through the system, the observational nature of the enterprise, and
existence of other activities23 which have potential to impact on the same
metrics, would limit the conclusions which could be drawn.
The various elements of the evaluation as they stand do, however, provide
valuable insights into how the tool was used, reported impact on decision
23
Such as awareness campaigns
59
making and management of patients, and considerations and implications for
any further work in this area.
Within the qualitative element of the evaluation, there is evidence that the tools
impact GPs to varying degrees, ranging from no impact at all, to
increasing/shifting knowledge, to influencing the management, including
referral or investigation, of patients. Furthermore, there is anecdotal evidence
from the interviews with GPs that, for some patients, this may have translated
into an expedited cancer diagnosis.
Data collected through the Experience tab associated with completions of the
symptom checker reflects this spectrum, with no action taken for almost half of
patients (47%), and referral or investigation required reported for 20% and
23% of patients respectively. For those patients who were investigated or
referred, in the majority (81%) of cases GPs reported that they would have acted
in this way had they not used the tool but in 19% of cases, using the symptom
checker influenced the management of that patient. This varied across the cancer
types, with the tool more likely to influence the management of patients with
symptoms/features associated with lung cancer than the other cancer types
featured (33% for lung, 9% for OG/pancreatic).
Even when taking lung cancer out of the picture, further analyses suggested that
use of the symptom checker was more likely to influence decisions to investigate
than to refer, which may be why analysis of centrally held data relating to urgent
referrals for suspected cancer has not demonstrated any strong evidence as to
impact. This may also in part reflect the lack of clear controls and variable
histories of awareness and supporting primary care activity within and between
regions.
While not a concern of the evaluation initially, the nature of the tool
development has made it possible to collect scores derived from both of the
algorithms for the same patient. Assuming that the data captured by BMJ
Informatica on a monthly basis are correct, analysis of these data reveal a
positive, but not strong, association between the two scores. This may be
expected given the different bases of the tools and the different features they

60
take into account, but nevertheless is an important consideration should
widespread use of the tools or algorithms be pursued, particularly with respect
to training and ensuring that GPs are supported, and not confused, when faced
with scores which may be quite different.
Qualitative data captured through interviews with participating GPs, and focus
groups with patient representatives, have raised a number of issues which also
have implications for the future. These include ensuring that GPs understand the
scores that they are presented with, that the variability in Read-coding, and the
significance of this, is acknowledged, that the level at which the prompt function
is set does not act as a deterrent to GPs and that GPs continue to pursue inclusive
practice and high quality GP/patient interaction when using the tools.
These findings and insights generated through the evaluation of the CDS project
are distilled in the following recommendations.
3.1 Recommendations
3.1.1 Quality assurance
The scores provided by the tools have the potential to influence the management
of patients. It is therefore vital that there are quality assurance processes in place
to ensure that the scores presented to the GP accurately reflect the algorithms
from which they are derived.
3.1.2 Ease of use
Clinical decision support tools for cancer should be easy to install and to use,
with ongoing technical and other support available to GPs. Integration of the
tools into GP IT systems may help to mitigate technical difficulties in installation
but optimum working and ongoing support will still be considerations.
3.1.3 Training
Given the potential for the tools to educate and inform GPs, such as in
signs/symptoms associated with particular cancer types or the significance of
combinations of symptoms, as well as their potential for influencing the
management of patients, it is vital that users of the tools receive optimum and

61
ongoing training and support in the use of the tools and have a clear and
accurate understanding as to the basis of the tools, how the algorithms have
been derived, what they include/exclude, what the scores presented represent,
and subtleties between the RAT and QCancer algorithms. This will be
particularly important with a move towards allowing GPs to see scores derived
from both algorithms for the same patient.
Training should also support GPs in best practice with regards to use of
electronic, computer-based tools within the consultation and ensure that use of
the tools does not compromise the quality of the GP/patient interaction.
3.1.4 Read coding
Within the training and communications linked to any future use of the tool, the
reliance of the tools on Read-coded data within the patient record, and the
potential limitations associated with this, should be acknowledged. This may be a
particular consideration for GPs operating with certain GP systems, but is also
relevant across the board. Developments in the tool which help to improve
quality and consistency in Read coding are encouraged.
3.1.5 Prompt levels
The prompt function within the tool is appealing because it does not require the
GP to have first considered cancer as a possible diagnosis. In its current mode of
operation, however, the prompt function has the potential to deter GPs from
using the tool or specific functions within it on an ongoing basis and action to
address this is recommended.
3.1.6 Roll-out and any flexibility within the tool design
Steps should be taken to mitigate the potential for exacerbating or initiating
inequalities through variable uptake of the tool or flexibility incorporated into
the design of the tool (for example, being able to turn prompts off for certain
patients or any future developments around the setting of prompt levels).

62
3.1.7 Part of the armoury
Electronic clinical decision support tools for cancer are not for everyone and do
not negate the need for other approaches to educate, inform and support GPs in
diagnosing cancer earlier. Sufficient resource and support for these other
approaches is needed and justified. Indeed, one of the key contributions of the
tool would appear to be its educational value in increasing knowledge of
symptoms, symptom combinations and cancer risk factors amongst GPs. Such
shifts in knowledge could be achieved through other means, channels and
opportunities including, but not limited to, CDS.
3.2 In conclusion
The clinical decision support tools for cancer developed and piloted through the
course of this project have the potential to be a useful addition to the resources
available to GPs. However, there are a number of areas which need further
consideration and action in order to maximise the usability and acceptability of
the tools and ensure that they support the earlier diagnosis of cancer agenda.

63
Appendix
Appendix to 3.3.1 Data fields provided in spreadsheet data from BMJ Informatica:
Section Fields
User details
Unique code assigned to practice
Which cancer-specific tool was used
Unique ID assigned to user
Gender of user
What specific clinical interest does the user have
How long has the user been practising medicine
Was the user trained to use the tool
Patient details
Age of patient
Gender of patient
Date of patient presentation
Townsend score of patient (based on LSOA of the patient's residence) Did the patient have any of the following morbidities:
Obesity
Hypothyroidism
Palliative Care
History of Stroke
Asthma
Chronic kidney disease
Atrial fibrillation
Diabetes mellitus
Mental health
Dementia Cancer
Peripheral arterial disease
Depression
Blood pressure
Coronary heart disease
Coronary obstructive pulmonary disease (COPD)
Heart failure
Learning difficulties
Epilepsy Did the patient have any of the following symptoms/risk factors:
Loss of weight
Abdominal pain
Abdominal bloating
Urinary frequency
Reflux
Rectal bleeding
Loss of appetite
Family history of gastrointestinal cancer
Change in bowel habit
Haemoglobin low Heartburn
Abnormal spirometry
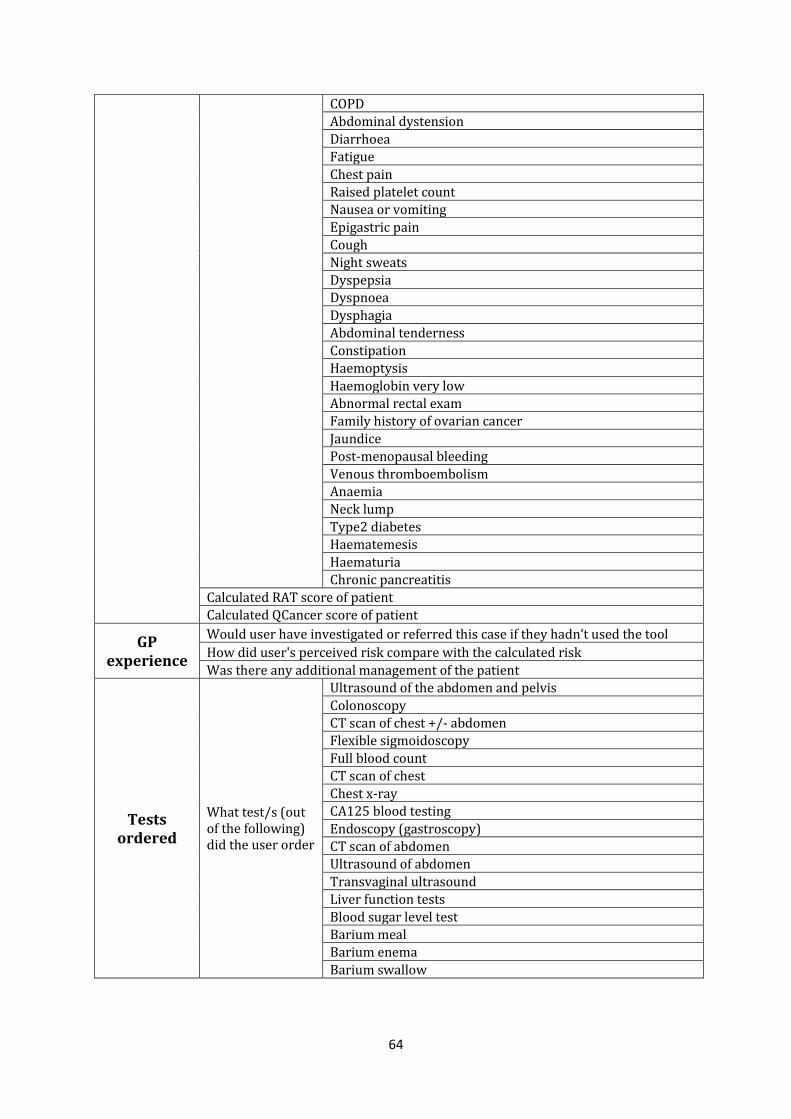
64
COPD
Abdominal dystension
Diarrhoea
Fatigue
Chest pain
Raised platelet count
Nausea or vomiting
Epigastric pain
Cough
Night sweats
Dyspepsia
Dyspnoea
Dysphagia Abdominal tenderness
Constipation
Haemoptysis
Haemoglobin very low
Abnormal rectal exam
Family history of ovarian cancer
Jaundice
Post-menopausal bleeding
Venous thromboembolism
Anaemia Neck lump
Type2 diabetes
Haematemesis
Haematuria Chronic pancreatitis
Calculated RAT score of patient
Calculated QCancer score of patient
GP experience
Would user have investigated or referred this case if they hadn’t used the tool
How did user's perceived risk compare with the calculated risk
Was there any additional management of the patient
Tests ordered
What test/s (out of the following) did the user order
Ultrasound of the abdomen and pelvis
Colonoscopy CT scan of chest +/- abdomen
Flexible sigmoidoscopy
Full blood count CT scan of chest
Chest x-ray CA125 blood testing
Endoscopy (gastroscopy)
CT scan of abdomen
Ultrasound of abdomen
Transvaginal ultrasound
Liver function tests
Blood sugar level test
Barium meal Barium enema
Barium swallow

65
Data issues and assumptions for Experience tab data analysis: The total number of practices initially recruited to the project was 510. This is one practice
less than the 511 reported in the monthly reports produced by CRUK. This is because it was subsequently found that one practice was included twice in the monthly data extracts from BMJ Informatica.
There were 44 practices in which the date of CDS software installation was recorded as “unknown”. With guidance from BMJ Informatica, it was assumed for the analysis that these practices had the CDS software installed before March 2013. However, there may be a small number of practices where the unknown date of installation could have corresponded to an installation date within March-November 2013 (herein referred to as “the study period”).
One practice was on a “trial” of the software prior to March 2013, of which the end date of
the trial is unknown and possibly ended during the study period. However, for purposes of this analysis it was assumed that the practice was set up for the whole study period.
One practice had no installation date recorded. However, this practice had entered patients
into the system with the first patient recorded as presenting on 14th October 2013. Therefore, for this analysis, a date of installation was estimated as 30th September 2013.
The composite oesophago-gastric (OG) and pancreatic cancer symptom checker tool only
recorded a patient’s symptoms and details once and provided a separate risk score for each cancer. It should be noted that there was one patient where there was a pancreatic cancer risk score but no OG cancer risk score. This OG score was treated as missing.
Appendix to 3.3.2 GP participants in the qualitative evaluation:
Interviewee: Pseudonym/Gender
Tool allocated ‡
Years in practice*
Single/ Multi GPs * #
Patient age distribution
Urban Suburban Rural * #
Deprivation decile # (based on National GP Profiles website, 1=most deprived, 10=least)
Ethnicity estimate #
GP1/F
RAT 18 Multiple Mainly elderly
Urban 7 2.5% Asian, 1.2% other non-white ethnic groups
GP2/M RAT 15 Multiple Mixed
Urban 3 Insufficient data
GP3/F QCancer - Multiple Mixed Urban 5 1.6% Asian GP4/M RAT - Single Mainly
elderly
Rural 8 0.0% non-white ethnic groups
GP5/M RAT - Multiple Mixed Urban 1 Insufficient data
GP6/M RAT 22 Multiple Mixed Urban 2 0.0% non-white ethnic groups

66
GP7/M RAT 5 Multiple Mainly younger
Suburban 7 6.7% Asian, 1.7% Black, 2.5% other non-white ethnic groups
GP8/F QCancer 8 Multiple Mainly younger
Urban 2 Insufficient data
GP9/M QCancer 25 Single Mainly elderly
Suburban 8 1.2% non-white ethnic groups
GP10/F RAT - Multiple Mixed Urban 3 1.7% Asian GP11/M RAT - Multiple Mixed Suburban 7
2.2% mixed, 1.5% other non-white ethnic groups
GP12/M QCancer 7 Multiple Mainly elderly
Rural 10 0.9% non-white ethnic groups
GP13/M RAT 17 Multiple Mixed
Suburban 5 1.3% non-white ethnic groups
GP14/F RAT 2 Multiple Mixed Suburban 7 6 % Asian, 1.7% other non-white ethnic groups
GP15/M QCancer 14 Multiple Mixed Urban 4 3.2% Asian, 0.8% other non-white ethnic groups
GP16/M RAT 24 Multiple Mixed Urban 2 0.0% non-white ethnic groups
GP17/F QCancer 26 Multiple Mixed Suburban 7 2.4% Asian, 2.4% other non-white ethnic groups
GP18/F
QCancer 10 Multiple Mixed Rural - -
GP19/M QCancer 4 Multiple Mixed Rural - -

67
GP20/F RAT 15 Multiple Mainly elderly
Rural 8 0.0% non-white ethnic groups
GP21/M RAT 29 Single Mixed Rural 10 1.3% Asian, 1.3% other non-white ethnic groups
GP22/M RAT 15 Multiple Mixed Suburban 9 0.6% non-white ethnic groups
GP23/M RAT 22 Multiple Mixed Suburban 1 Insufficient data
GP24/M QCancer 23 Multiple Mixed Rural 7 1.6% Asian, 1.6% other non-white ethnic groups
GP25/M QCancer - Single Mainly elderly
Suburban 7 3.3% mixed, 0.2% Asian, 5% black, 1.7% other non-white ethnic groups
GP26/M QCancer 2 Multiple Mixed Rural 5 0.0% non-white ethnic groups
GP27/M RAT 6 Multiple Mixed Urban 1 2.4% non-white ethnic groups
GP28/F QCancer - Multiple Mixed Rural 6 1.2% non-white ethnic groups
Key: * Interview transcripts # NGPP website ‡ Macmillan CDS database - No data Deprivation decile range: Ranges from 1 most deprived to 10 least deprived (NGPP website http://fingertips.phe.org.uk/profile/general-practice accessed 03/07/2014)

68
Appendix to 3.3.3 Further details of methods for analysis of Cancer Waiting Times Data
A conversion rate is the percentage of urgent GP referrals with a subsequent cancer diagnosis and a detection rate is the percentage of all Cancer Waiting Times Dataset recorded cancers that were diagnosed following an urgent GP referral.
Dates were based on “Date First Seen” for referral and conversion data, and on treatment start date for detection data, as recorded in the Cancer Waiting Times dataset. To avoid the use of potentially identifiable information, data were aggregated to totals of at least five referrals /cases per time period. Monthly data were aggregated for participating and control practices within each CN area, and were then further grouped into the RAT and QCancer allocations. When monthly numbers were less than five for these groupings, data were further aggregated for three month periods (quarters), or in some cases data were suppressed if less than five. To calculate confidence intervals around the percent changes in referrals, populations were assumed to be constant throughout 2012 and 2013 and confidence intervals were first calculated for the rate ratio (referrals in 2013 divided by referrals in 2012). From this the upper and lower confidence intervals for the percentage change were found by subtracting 1 from each confidence interval and multiplying by 100. Patient ages were grouped into the following categories: under 40, 40-49 (or under 50 when numbers were too small), 50-59, 60-69, 70-79, 80+. Deprivation was based on patients’ residence using the income domain of the Index of Multiple Deprivation 201024. Scores were categorised into the national quintiles of deprivation where the fifth quintile corresponds to the 20% most deprived of the population in England.
24
http://data.gov.uk/dataset/index-of-multiple-deprivation

69
Appendix to the Qualitative Evaluation element: full reports for the GP study and
Focus Group Study
Clinical Decision Support Project: Qualitative Evaluation
GP Study Final Report - July 2014
Trish Green & Una Macleod, Hull York Medical School, University of Hull
In this report we present our analysis of the data from 28 interviews with GPs who used
electronic clinical decision support (CDS) tools for cancer (eRATs and QCancer). The aim
of our study was to explore GPs’ experiences of using the tools and their perceptions of the
barriers and facilitators to a wider dissemination and integration of the tools into routine
general practice in primary care. The data were gathered from individual semi-structured
interviews conducted by telephone from September 2013 to January 2014, after the GPs
had used the tools for several months. Interviewers (Dr Julie Walabayeki and Dr Trish
Green) used a topic guide designed to enable the capture of focused relevant data through
specific questions. Open-ended questions were also asked in order to elicit experiential
responses regarding GPs’ use of the tools in consultation, the impact on their practice, and
their opinions on the dissemination of the tools to all GPs in the UK.
All of the practices involved in the pilot were emailed in August 2013 with an invitation to
GPs who were using the tools to participate in a telephone interview. An introductory
letter, participant information sheet and consent form were attached to the email. A second
‘reminder’ email was sent out in September 2013. In November 2013, Macmillan colleagues
also contacted some of the practices on our behalf. Further emails were sent and telephone
calls were made to participating practices, but response rates to our request remained low.
Eventually 36 individuals consented to interview however, although repeated attempts were
made to engage all 36 GPs, 28 interviews were undertaken (10 female and 18 male).
Recruitment was then halted due to the timescale of the study.
Purposive sampling was not possible as interviewees were self-selecting. 12 GPs were
QCancer users: 5 female; 7 male, and 16 GPs were eRAT users: 4 female; 12 male.
Respondents’ practices were located in 22 different areas of England, Scotland and Wales
and served a mix of rural, suburban and urban areas and a range of affluent/deprived patient
populations.
All interviews were professionally transcribed verbatim. Consent to participate was checked
verbally at the time of each telephone interview and participants were made aware that data
from their interviews would not be reported in a way that would identify them individually.
A pseudonym has been attributed to each transcript.
70
Specific areas addressed in the interviews were:
GPs’ experience of using the electronic CDS tools in practice
Types of consultations were they used in
Changes to practice
Advantages and disadvantages
Understandings of the theoretical basis of the tools
Comparison with other risk assessment tools
Potential for wider dissemination of the tools
The policy question the study addressed was:
Are clinical decision support tools acceptable to GPs and what are the barriers and
facilitators to their integration into routine practice?
Introduction
The purpose of this qualitative evaluation was to obtain views from the GPs who are
piloting the eRATs and QCancer Clinical Decision Support tools regarding their
acceptability and functionality and to identify facilitators and barriers to them being rolled
out throughout the UK. This evaluation is based on the analysis of telephone data and builds
on our previous work (Dikomitis et al 2012, Hamilton et al 2013). Once interviews had been
fully transcribed, a systematic qualitative methodology based on the Framework method of
analysis was applied to the data (Ritchie and Spencer 1994). The main themes to emerge
from our analysis were: (1) user acceptability and usability; (2) influences of the tools on GP
practice; (3) barriers and facilitators to a UK practice-wide dissemination. Below we report
our findings in relation to these three key themes.
1. Acceptability and usability
1.1 Raising Awareness
The most significant function of the tools was that they raised GPs’ awareness of cancer
symptoms and both reminded and alerted users to potential risk. Adding to the educational
basis of their practice thus made the tools more acceptable to GPs. In some instances, GPs
reported that the tools helped them to consider that some symptoms could be those of
rarer cancers, as well encouraging them to focus on vague or non-red flag symptoms.

71
Respondents perceived that the CDS tools fitted into other initiatives aimed at achieving
early cancer diagnosis. There was agreement that the tools were compatible with cancer
guidelines and that the tools added to these. Furthermore, some respondents reported that
using the tools was beneficial and instructive and that they highlighted certain symptoms or
confronted GPs with new combinations of symptoms not included in current guidelines. As
such, the tools were educational and assisted in raising GPs’ awareness of vague or complex
symptoms.
1.2 Components of the Tools
On-screen prompts: Of the three components of the tools, the one used most frequently
was the prompt function, which alerted GPs when a patient presented with a risk score of 2
or above and urged further action on the part of the GP.
‘It probably made us more aware than NICE guidance I think, it tends to, you probably wouldn’t have
considered, on the NICE guidance initially, but this just made us think a bit more deeply … it’s
probably made me more aware of symptoms which I may have not been as aware of in the past.’
(GP13/M/eRAT)
‘This is to help us to diagnose patients who don’t fit the NICE, well, the NICE criteria, so there are
much more symptoms than what we normally would ask for. So far I’ve not diagnosed anyone for the
first six months, yes, but I think it raises awareness of other symptoms, for example raised platelet
count we didn’t know that ... if it’s raised then you increase the patient getting lung cancer. So I think
that’s something which I learnt and then like for colorectal the daily alcohol intake does affect, so
normally we don’t actually take that into account. So there are things which I have learnt.’
(GP8/F/QCancer)
‘It’s a good way of maintaining cancer at a higher level so although it might not have helped me
in a particular patient, it makes you more likely to ask for tests maybe in other patients, so it
keeps you thinking about cancer […] it’s helped generally for me to, you know, refer more
promptly and, you know, be aware not to delay.’ (GP14/F/eRAT)
‘The toolkit will be useful for rare cancers, which is ovarian and so on, and pancreatic, because
those are the ones that people tend to miss because they never thought about it. It's so rare,
they don't see it that often.’ (GP16/M/eRAT)
‘It helps because it prompts you to think about something that you may miss … If you have tools
like these that prompt you about the different things that you may not be thinking at that time, it
does help you to focus a bit more.’ (GP26/M/QCancer)
‘I felt obliged to have a quick look back through that patient’s records to just see what was going on
with them, yes. So I did and, yes, so, you know, it did at the time [of consultation].’ (GP1/F/eRAT)
‘I tend to use the prompts, and then if it’s prompting me something, I go and look at the risk
calculator, if you see what I mean. I haven’t yet gone in and asked it to come up with the risk for me
by tapping in other symptoms.’ (GP17/F/QCancer)

72
The vast majority of interviewees, however, emphasized that during the course of their
working day they experience ‘information overload’, as pop-ups frequently flash on their
computer screens, in particular with relation to QOF. Data confirmed that they began to
ignore prompts, particularly when the calculated risk score was low.
GPs reactions to the on-screen prompts were influenced by different factors: the approach
of the doctor, their experience, their confidence with electronic software, and undoubtedly
time pressures; which are all important issues when considering wider dissemination.
However, a small number of GPs reported that the prompt mechanism alerted them to
make earlier referrals, which at times were based on symptoms that were non-red flag and
that in some instances led to earlier diagnosis of cancer.
‘In two cases I probably made a referral that I either wouldn’t have made or made it earlier than I
might have done. So, it was useful. They’re the two that I can remember.’ (GP10/F/eRAT)
‘It did open me up to a possibility that this patient may have cancer even with very strange, vague
symptoms. So I would say our referral rate has gone up a bit, which is a good thing because it
would mean that you’re not missing anything.’ (GP26/M/QCancer)
‘I think I probably did pick up a lung cancer that I wouldn’t have done, I wouldn’t have thought
about if I hadn’t had some of those prompts.’ (GP14/F/eRAT)
‘Definitely came up asymptomatically, and the risk score was high, so then you ask questions, and
then did turn up to have a particular cancer … I think just the fact that one patient’s caught is
good. He may have just completely missed, and come too late. So for me, in terms of has the
toolkit helped, in terms of numbers it may not have, but for that one patient it was obviously very
beneficial.’ (GP24/M/QCancer)
‘There was one patient that I referred that did prove to have a cancer that I might have referred
anyway, but possibly not so quickly, so it sped things up a little bit for that person.’
(GP28/F/QCancer)
‘I don’t know exactly how well that would be received by the GPs in general. Because we have all
sorts of prompts coming at us, you know, from QOF and all sorts of things. And it gets a little bit
distracting from the fact that somebody, generally, somebody has come in with a problem that
you’re trying to sort out and you’ve got all these messages flashing up at you.’ (GP9/M/QCancer)
‘I’ve used it a few times but after that not anymore because, you know, it’s too much and
therefore not helpful. You start missing other things because there’s too much of an overload of
information showing on your screen.’ (GP22/M/eRAT)
‘I would say 90% of prompts I dismiss, for the very reason that I have other focuses within the
consultation.’ (GP27/M/eRAT)

73
As interview data demonstrate, one of the drawbacks to the tools is the danger of ‘prompt
fatigue’; as qualitative findings indicate, what appears to be crucial is that the threshold levels
of all prompts are valid so that GPs are encouraged to persevere with their use of the tools.
This is pertinent for a roll out of the tool.
Alongside this, GPs need to be aware that full functionality of the CDS tools will rely on
them being willing to make some changes to their ways of practising. Such changes were
evident in some of our data.
Symptom checker: The second function of the tools, the symptom checker, was used in
various ways during consultation, in some instances it was not used until after patients had
left the consulting room and some GPs did not use this component at all. There was then a
mixed response as to whether the tools were suitable to use alongside patients and their
incorporation into these interactions was usually applied on a patient-specific basis.
Respondents, however, also articulated the need to focus on their patients and listen to the
problems they were presenting with, which were often not cancer-related. A connected
issue was also that of time pressure associated with 10-minute consultations, which was
raised across much of the data and perceived as a barrier to GPs’ willingness to use this
component. Additionally, some GPs were unsure of how to interpret the risk scores, which
is a training and ongoing support issue that needs to be addressed if the tools are to be
more widely disseminated.
‘Making sense of it was the difficult thing, because it presented you with a percentage chance of that
individual having a specific type of cancer [but] I don’t know what the background rate for cancer is
and therefore what the relative risk that the person sat in front of me has over his general
demographic risk … you kind of need two thresholds, in a sense – one which is the absolute risk,
and a second which is the relative risk.’ (GP27/M/eRAT)
‘Sometimes I hide it, just in case I cause an alarm, but I will start to cover it during the consultation
if there is any risk, yes. It depends because, you know, some patients, if they're anxious, when
they see something like that, they become more anxious.’ (GP16/M/eRAT)
‘[the patient] was actually consulting about something different and it did actually guide the
conversation, the patient looked [at the tool] for potential red flags which might, sort of, indicate
that actually further investigations or referral were appropriate.’ (GP28/F/QCancer)
‘It gives you something to focus on because the patient may have come for totally different
reasons, because it was flagging up and you were focused on it and I asked them the
questions that you would need to ask them and see that there is something that needs to be
done here.’ (GP26/M/QCancer)

74
Risk stratification list: The third function of the tools, the risk stratification list, was not
referred to as widely as the prompt or symptom checker and respondents reported varying
degrees of usefulness for this component. This was usually related to the numbers of high-
risk patients flagged up, as these were often patients GPs were aware of. It also produced
information practices were unable to act on due to time and resources.
However, this component did at times flag up patients in need of further investigation and
motivated proactive GP practice. Important to note here with regard to barriers to wider
dissemination is that this activity was not always perceived to add greatly to the GP/practice
workload.
2. Influence of CDS tools on GP practice
2.1 GPs’ perceptions of changes to practice
Respondents perceived that the tools initiated varying degrees of change to their practice,
these ranged from no change at all, through alerting GPs to ‘think cancer’, to prompting
further investigations.
‘In terms of identifying high-risk patients by auditing our records, that has proved useful
in that we’ve been looking at those high-risk lists and deciding within the practice how to
approach the patients and screen them for cancer … members of the practice
understand the importance of recognising these patients and welcome the fact that there
is some assistance there to identify potentially high-risk patients. And we haven’t found it
to increase our workload significantly.’ (GP23/M/eRAT)
Quite a few of the high risk actually were our cancer patients. (GP3/F/QCancer)
Most of the time they were people with existing chest or heart problems who were under the care
of hospital and that was the only annoying bit because you began to ignore it because these people
were patients, known patients under investigations who had, you know, most of them had had
recent chest X-rays and everything because they were, had ongoing health issues that were being
checked out. The ones, it's not so good at picking the ones that are purely in primary care.
(GP15/M/QCancer)
The list is so long that I just felt, I didn’t know where I was going to ever start with it, you know,
because it was so intensive, you know, it was pulling out, I don't know, it felt like about a quarter of
our population and, you know, where do you start with that? So, I didn’t. It would be very time-
consuming to go through all of those. (GP1/F/eRAT)

75
2.2 Clinical judgement
Respondents were comfortable with CDS tools in general and saw their usefulness in some
situations, but several queried the degree to which their full integration into general practice
might be possible. Several respondents, for example, commented they would prefer to rely
on their experience and clinical judgement rather than on the tools. It was also the case that
GPs considered the tools to be in the development stage and, as such, should not be relied
upon to assist with decision making. In most cases, the tools were perceived as additive, but
would not override GPs’ clinical expertise.
Clearly, GPs might decide to refer on the basis of a holistic approach and, as many data here
demonstrate, the attitude of the individual GP and his/her level of clinical experience also
plays a crucial part in the decision making process; these in turn will affect the acceptance of
the tools and full integration into everyday primary care practice.
‘The tool is useful but it doesn’t add much to our armoury … if the tool says it is a low risk kind
of situation, that doesn’t save us. If we feel that this patient ought to be seen, then we will
probably go on our clinical instincts because we don’t trust the tool that much.’
GP12/M/QCancer
‘Giving someone a risk figure is good, but it may well be that that risk is not pertinent to the
clinical picture.’ (GP6/M/eRAT)
‘Clinically, because the patients were well, we were sort of erring on the side of saying, no, the
risk score, this risk score doesn’t represent the risk to this patient; we were preferring to use our
judgement, rather than the risk score.’ (GP24/M/QCancer)
‘It makes you think … it hasn’t so far actually changed my actions in any way, shape or form.’
(GP17/F/QCancer)
‘I always think cancer, so I couldn’t use it as a reassuring tool, if you see what I mean? So, if
someone came in, I thought cancer, but the risk came back as very low on the scoring tool, I
wouldn’t let that change my management … So, every time I use the tool I always have a risk in
my head greater than or equal to what’s on the tool anyway, so it doesn’t really change what I do
very much.’ (GP19/M/QCancer)
‘I don't think it necessarily changed my clinical judgment, but it reminded me ... so that I could be
questioning myself that, am I happy with this or am I not happy with it?’ (GP3/F/QCancer)
‘Very often it just confirmed a little bit of my suspicion that maybe I need to do something’
(GP11/M/eRAT)
‘Sometimes somebody's coming with something else and because it prompts for lung cancer, I start
asking things about cough.’ (GP16/M/eRAT)

76
2.3 Referral thresholds
The CDS tools affected GPs’ referral thresholds and impacted their decision making to
varying degrees with regard to further investigation/secondary care referral. Again, this
varied from no impact on decision making to the reassurance that referral decisions GPs
made were accurate. Many respondents expressed the contradictory pressures on GPs – a
pressure not to refer patients (driven by policy/CCGs) versus the drive to earlier diagnoses
of cancer.
Although the majority of GPs expressed the opinion that the tools did not greatly influence
their referral decisions, it was using the tools that instigated their reflection on symptom
presentations, or prompted them to look over patients’ histories. Other respondents
articulated that their referral rates had risen, but this was not perceived as problematic.
3. Wider dissemination
3.1 Integration into practice
Throughout the report so far we have illustrated some of the facilitators as well as the
barriers to the integration of the CDS tools. There was also consensus across the data that
electronic tools do not suit all GPs’ ways of working, and not all of our respondents
regarded the tools as preferable to other forms of support for the earlier recognition of
cancer symptoms.
Moreover, the tools were perceived to be useful for GPs in group practices, but less useful
in single GP or smaller practices, where respondents expressed that they ‘knew’ their
patients and were able to provide a ‘continuity of care’ that larger practices might struggle
with, although strategies to overcome this latter assertion were also evident in the data.
‘I’m single-handed so I know all the patients; they always come back to me. So, I already know what I
said previously.’ (GP21/M/eRAT)
‘I’ve gone into the bit where you actually re-code symptoms and looked at how that alters risk … I’m
finding that quite helpful for a few patients. And the other thing I’ve done as a result of it is inform
some of my colleagues about their patients’ risks when I’ve come across them … I’ve passed on what
the tool is telling me about them.’ (GP28/F/QCancer)
You need a lot of different ways of doing things, if you see what I mean; there is no one way of
doing it. I think you need, I think the risk assessment tools are one factor, I think education of lots
of different forms, in lots of different ways, and in small quantities frequently is another way. […]
We need to have a whole variety of things, and we need to keep repeating it. Otherwise you will
forget, because cancer is, with the best will in the world, rare. (GP17/F/QCancer)
A teaching session on the signs and symptoms of the various cancers would be more useful, which
would just refresh the memories of the doctors, rather than a toolkit like this. (GP7/M/eRAT)

77
3.1 Secondary care
Although some respondents felt that the CDS tools assisted them in making decisions about
potential cancer diagnoses, some data revealed apprehension regarding how referrals based
on the tools might be received by secondary care colleagues. So, although the tool assisted
in decision making in some instances, GPs felt these might well be overridden because of the
need to comply with extant referral guidelines in order to meet the criteria for
investigation.
Data confirmed however that GPs would want to refer patients with suspected cancer
symptoms as early as possible. The CDS tools were, in that sense, perceived by some GPs
as useful in that they validated their decisions to refer and could be used as ‘back up’
information in dialogue with secondary care colleagues. The tools thus legitimized earlier
referrals in some instances where symptoms did not meet all of the two-week wait criteria.
Primary and secondary care interactions obviously differ across geographical locations. This
has implications for a wider dissemination of the tools.
3.2 Read Codes
The accuracy, and therefore, usefulness of the eRATs and QCancer CDS tools are
dependent on Read coding. However, variability in GPs’ use of Read codes emerged strongly
in the interviews, ranging from the use of free text only, to the inputting of codes once
patients had left the consulting room. There is no consensus in how to input Read codes
and their use very much depends on the consultation style of the individual GP. Such
variation is a limitation to the usefulness of the tools.
‘Many times we can calculate until we go blue in the face, but if secondary care thinks, actually,
you know what, this wasn't a two week wait target referral at all, then this [tool] is a load of
rubbish.’ (GP2/M/eRAT)
‘Only [recommend roll-out] if it had approval from secondary care and they were willing to change
their referral pathways to mean that this [tool] was incorporated into it.’ (GP19/M/Qcancer)
‘It just alerts, and then you have to go according to the cancer guidelines … you can’t send every
lady with a distention of abdomen for ovary screening.’ (GP25/M/QCancer)
‘In one referral letter I did mention the risk calculation and it was totally ignored at the secondary
end, and they didn’t investigate the patient.’ (GP20//F/eRAT)
‘There are criterion boxes often and very occasionally a patient doesn’t quite fit one of the boxes
and you tend to worry and just have to pen the truth anyway or do a non-urgent referral but I
think if you can justify whether actually they’ve got 38% chance of colorectal cancer on this [tool]
then I don’t think they would argue with that.’ (GP5/M/eRAT)
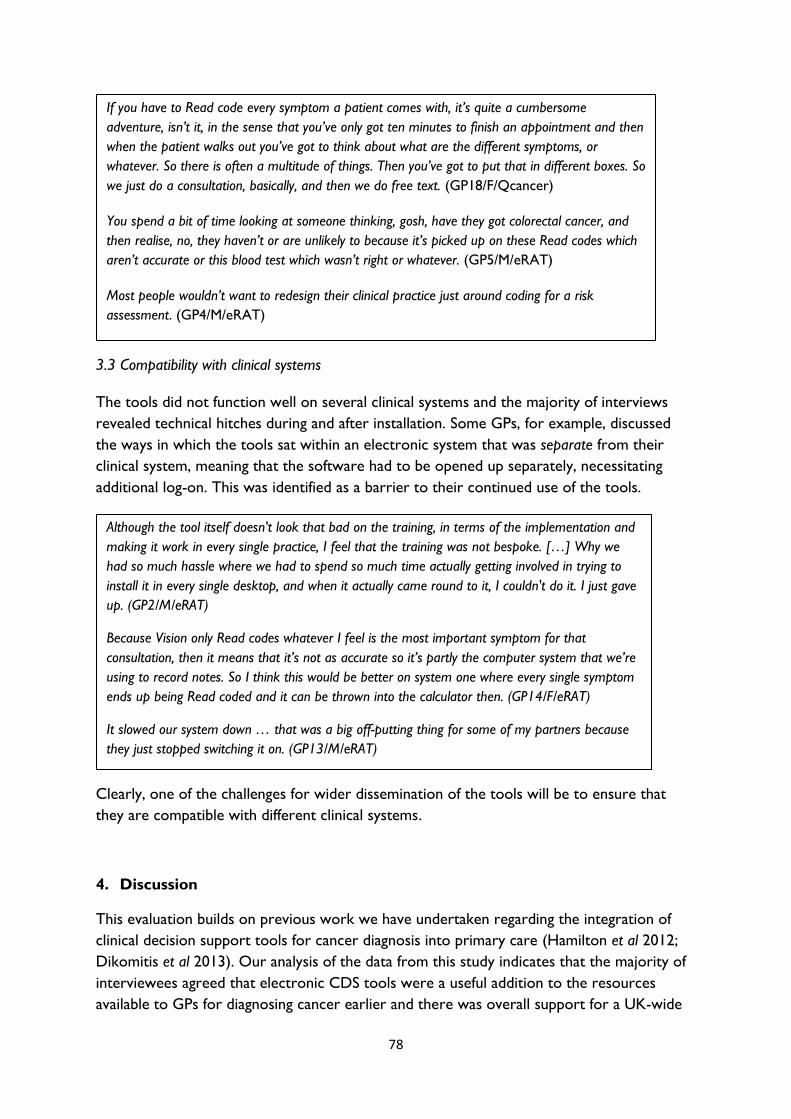
78
3.3 Compatibility with clinical systems
The tools did not function well on several clinical systems and the majority of interviews
revealed technical hitches during and after installation. Some GPs, for example, discussed
the ways in which the tools sat within an electronic system that was separate from their
clinical system, meaning that the software had to be opened up separately, necessitating
additional log-on. This was identified as a barrier to their continued use of the tools.
Clearly, one of the challenges for wider dissemination of the tools will be to ensure that
they are compatible with different clinical systems.
4. Discussion
This evaluation builds on previous work we have undertaken regarding the integration of
clinical decision support tools for cancer diagnosis into primary care (Hamilton et al 2012;
Dikomitis et al 2013). Our analysis of the data from this study indicates that the majority of
interviewees agreed that electronic CDS tools were a useful addition to the resources
available to GPs for diagnosing cancer earlier and there was overall support for a UK-wide
Although the tool itself doesn't look that bad on the training, in terms of the implementation and
making it work in every single practice, I feel that the training was not bespoke. […] Why we
had so much hassle where we had to spend so much time actually getting involved in trying to
install it in every single desktop, and when it actually came round to it, I couldn't do it. I just gave
up. (GP2/M/eRAT)
Because Vision only Read codes whatever I feel is the most important symptom for that
consultation, then it means that it’s not as accurate so it’s partly the computer system that we’re
using to record notes. So I think this would be better on system one where every single symptom
ends up being Read coded and it can be thrown into the calculator then. (GP14/F/eRAT)
It slowed our system down … that was a big off-putting thing for some of my partners because
they just stopped switching it on. (GP13/M/eRAT)
If you have to Read code every symptom a patient comes with, it’s quite a cumbersome
adventure, isn’t it, in the sense that you’ve only got ten minutes to finish an appointment and then
when the patient walks out you’ve got to think about what are the different symptoms, or
whatever. So there is often a multitude of things. Then you’ve got to put that in different boxes. So
we just do a consultation, basically, and then we do free text. (GP18/F/Qcancer)
You spend a bit of time looking at someone thinking, gosh, have they got colorectal cancer, and
then realise, no, they haven’t or are unlikely to because it’s picked up on these Read codes which
aren’t accurate or this blood test which wasn’t right or whatever. (GP5/M/eRAT)
Most people wouldn’t want to redesign their clinical practice just around coding for a risk
assessment. (GP4/M/eRAT)
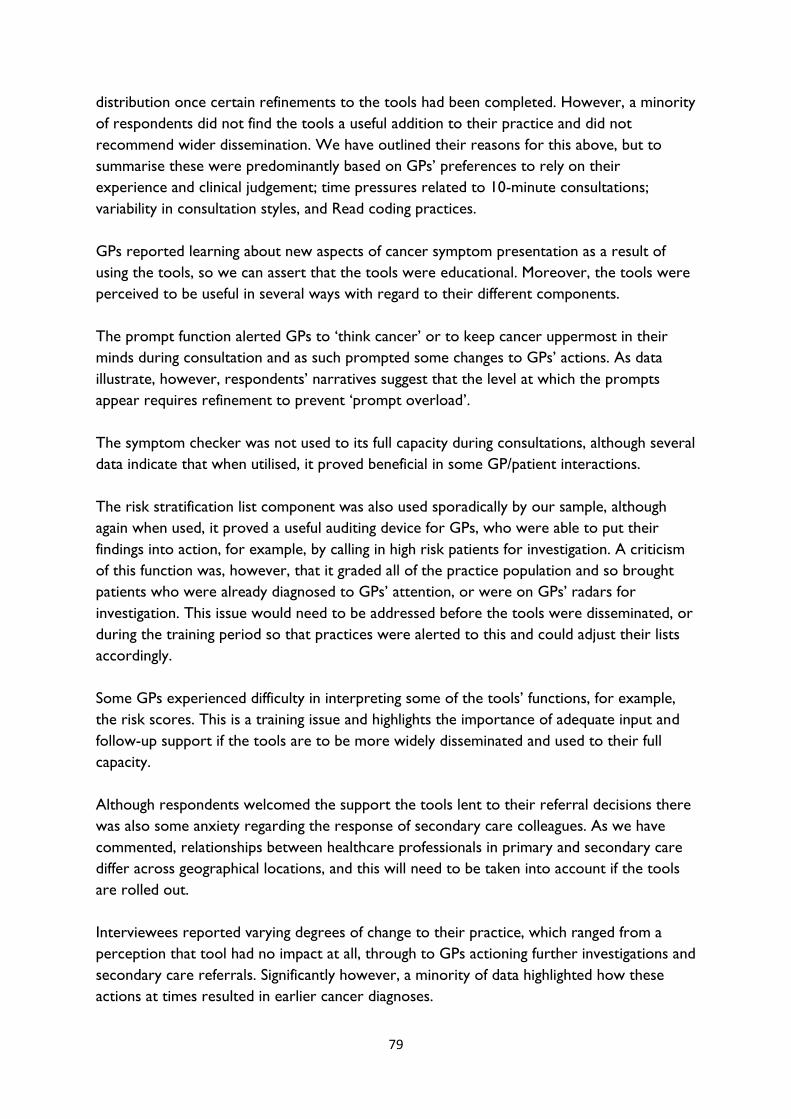
79
distribution once certain refinements to the tools had been completed. However, a minority
of respondents did not find the tools a useful addition to their practice and did not
recommend wider dissemination. We have outlined their reasons for this above, but to
summarise these were predominantly based on GPs’ preferences to rely on their
experience and clinical judgement; time pressures related to 10-minute consultations;
variability in consultation styles, and Read coding practices.
GPs reported learning about new aspects of cancer symptom presentation as a result of
using the tools, so we can assert that the tools were educational. Moreover, the tools were
perceived to be useful in several ways with regard to their different components.
The prompt function alerted GPs to ‘think cancer’ or to keep cancer uppermost in their
minds during consultation and as such prompted some changes to GPs’ actions. As data
illustrate, however, respondents’ narratives suggest that the level at which the prompts
appear requires refinement to prevent ‘prompt overload’.
The symptom checker was not used to its full capacity during consultations, although several
data indicate that when utilised, it proved beneficial in some GP/patient interactions.
The risk stratification list component was also used sporadically by our sample, although
again when used, it proved a useful auditing device for GPs, who were able to put their
findings into action, for example, by calling in high risk patients for investigation. A criticism
of this function was, however, that it graded all of the practice population and so brought
patients who were already diagnosed to GPs’ attention, or were on GPs’ radars for
investigation. This issue would need to be addressed before the tools were disseminated, or
during the training period so that practices were alerted to this and could adjust their lists
accordingly.
Some GPs experienced difficulty in interpreting some of the tools’ functions, for example,
the risk scores. This is a training issue and highlights the importance of adequate input and
follow-up support if the tools are to be more widely disseminated and used to their full
capacity.
Although respondents welcomed the support the tools lent to their referral decisions there
was also some anxiety regarding the response of secondary care colleagues. As we have
commented, relationships between healthcare professionals in primary and secondary care
differ across geographical locations, and this will need to be taken into account if the tools
are rolled out.
Interviewees reported varying degrees of change to their practice, which ranged from a
perception that tool had no impact at all, through to GPs actioning further investigations and
secondary care referrals. Significantly however, a minority of data highlighted how these
actions at times resulted in earlier cancer diagnoses.
80
Although a majority of responses demonstrated that the tools could prove useful additions
to GP practice, there was not an unequivocal ‘yes’ to this query. As we have outlined here,
GPs articulated that the tools would need several refinements to ensure their smooth
integration into practice, and these would need to be addressed prior to a wider
dissemination. A major issue would be that the variability in Read coding practices needs to
be considered quite urgently. On a practical level, there was much criticism of the
installation process and software incompatibility with practice systems, so further
development is required in this area in order to make the tools fit for purpose.
5. Conclusion
From the data presented in this report, the greatest overall value of the tools was their use
as interventions that increased users’ awareness of non-red flag symptoms so
complementing current guidelines and assisting GPs in dealing with the uncertainty that
underpins symptom recognition for some cancers.
A minority of instances were reported where the tools alerted GPs to patients who, as
respondents stated, might have received a later diagnosis without the intervention of the
tools.
Issues regarding the limitations of the tools that GPs discussed and which are pertinent to
their wider dissemination were: technical hitches; Read coding practices; training issues
regarding understanding all of the tools’ components; the prompt function setting;
secondary care responses.
The majority of participants in this study, however, perceived electronic CDS tools to be
useful, and data indicate that, once their limitations are addressed, the tools are likely to be
acceptable for wider dissemination.
6. Limitations of the qualitative evaluation
The limitations of the tools identified in this report are germane to the time at which the
interviews were undertaken and as such provide a ‘snapshot’ of GP respondents’
experiences of using CDS tools in practice. We acknowledge that the limitations discussed
are to be addressed, or were in the process of being addressed during the time of the pilot.
This evaluation is based on interview material with a relatively small number of GPs and, as
with all qualitative research, the findings are not generalizable. The research team discussed
the issue of data saturation (Cheek, 2011) and agreed that this had been achieved.

81
References
Cheek J. 2011. The politics and practices of funding qualitative inquiry. In Denzin NK and
Lincoln S. (Eds.) The Sage Handbook of Qualitative Research. London:Sage.
Dikomitis L, Green T, Macleod U. 2012. Dealing with uncertainty : a qualitative evaluation of
the usability and acceptability of an electronic risk assessment tool to aid cancer diagnosis in
general practice. Report to Macmillan Cancer Support, September 2012.
Hamilton W. 2009. The CAPER studies: five case-control studies aimed at identifying and
quantifying the risk of cancer in symptomatic primary care patients. British Journal of Cancer
101, S80–S86.
Hippisley-Cox J, Coupland C. 2011. Identifying patients with suspected gastro-oesophageal
cancer in primary care: derivation and validation of an algorithm. British Journal of General
Practice, 61, e707-e714.
Hamilton W, Macleod U, Martins T, Green T, Rubin G. 2012. Supporting earlier diagnosis of
cancer in primary care: assessing the usability and impact of a primary care cancer Risk
Assessment Tool. Report to the National Cancer Action Team, April 2012.
May, C. 2006. A rational model for assessing and evaluating complex interventions in health
care. BMC Health Services Research, 6:86.
May C, Finch T, Mair F, Ballini L, Dowrick C, Eccles M, et al. 2007. Understanding the
implementation of complex interventions in health care: the normalization process model.
BMC Health Services Research 7: 148.
Ritchie J, Spencer L. 1994. Analysing qualitative data. In: Bryman A, Burgess R, editors.
London: Routledge.

82
Clinical Decision Support Project: Qualitative Evaluation
Focus Group Study Final Report - July 2014
Trish Green and Una Macleod, Hull York Medical School, University of Hull
In this report we present our analysis of data gathered from six focus groups that we
conducted from January to March 2014 as part of the Clinical Decision Support Project
Qualitative Evaluation. The reasons for the inclusion of focus groups in our study was to
obtain a layperson perspective on GPs’ use of Clinical Decision Support (CDS) tools for
cancer (eRATs and QCancer) and to elicit a lay understanding on the usefulness and/or
desirability of patients’ knowing their potential cancer risk and, in turn, how this knowledge
might impact decision making around their own healthcare.
We used our links with academic networks, practice based colleagues, research networks
and GP practices to formulate six focus groups, with a total of 31 participants, 15 men and
16 women. Two groups comprised members from existing patient representative panels,
two were developed through engagement with a citizens’ panel and a further two were
members of Patient Participation Groups attached to GP practices (PPGs). In three
instances, focus group participants were acquainted with each other. Participants from the
remaining three met together for the first time at the focus group venues. TG travelled to
each of the venues and participants were remunerated for any travel and other expenses
they incurred. Refreshments for each group were kindly provided by the venue hosts. The
focus groups lasted between 60 and 90 minutes.
Participants in focus groups 1 and 6 were from inner city urban locations, participants of
groups 2 and 3 were from a suburban area of an affluent town in the north of England.
Focus group 4 participants were members of a patient representative group, who each
travelled to the focus group venue from various towns and cities in England. Participants
from group 5 were from an affluent rural location in Angus, Scotland. Two of the 31
participants had previously worked for the health service, so had some understanding of
healthcare from a workplace perspective. To our knowledge, none of the focus group
participants had experienced the use of the CDS tools in consultation with a GP.
Consent forms were completed at the time of the meeting and before the discussions
began. Participants were informed they could withdraw from the study at any time and were
also assured that the data would not be reported in any way that would identify them
individually nor, in the case of the PPGs, the practices where they were patients. All Focus
Groups were recorded and professionally transcribed verbatim. A pseudonym has been
attributed to each Focus Group participant. Where necessary, all references to GPs and/or
practices have been anonymised.
In order to introduce the topic and provide participants with some background to the
study, focus group participants watched a short film that explained the development of each
of the CDS tools. The group facilitator (TG) also provided brief information on the three

83
different components of the tools. During the sessions, TG referred to a topic sheet to
guide the discussion. These activities were in place to encourage interaction and engender
debate between participants (Kitzinger, 1994). Our incorporation of the focus group
technique thus enabled participants to work together and express their views on GPs’ use
of CDS tools. Once the focus groups were transcribed, a systematic qualitative
methodology based on the Framework method of analysis was applied to the data (Ritchie
and Spencer 1994). Comparative analysis across the data was undertaken and cross-cutting
themes identified. For the purposes of the report, we decided to provide representative
data from the participants of each group under three main discussion topics. Each of the
focus group participants is cited at least once and data that correspond to the eight sub-
themes are provided in data tables 1.1 – 3.2. The discussion is presented follows:
1: Participants’ perceptions of GPs’ use of CDS tools during consultation
o 1.1 GPs using IT
o 1.2 GP/patient interaction
o 1.3 GPs sharing the tools with patients
o 1.4 Understanding the components of the tools
2: Participants’ perceptions of the usefulness/desirability of patients knowing their potential
cancer risk
o 2.1 Understanding cancer risk
o 2.2 Benefits of knowing cancer risk
3: Participants’ perceptions of how involved patients should be in decision-making about
their own health/healthcare
o 3.1 Informed choice
o 3.2 Shared decision making
1. Participants’ perceptions of GPs’ use of CDS tools during consultation
1.1 GPs using IT
As can be seen from focus group extracts in data table 1.1, over-reliance on the computer
and a tendency to look at the screen rather than the patient was identified as part of the
consultation process in several focus group participants’ present-day experiences.
Discussions ranged between total exclusion of the patient, through to the patient having the
‘right’ to see what is on the screen, towards Betty’s experience of a shift towards more
inclusive consultations. As data highlight, GP computer usage was interpreted in several
ways, ranging from Edward and Cath’s (FG1) disquiet that their GPs were not always au fait
with computer technology, towards Daniel’s assertion of his general distrust that clearly
bordered on a breakdown of the doctor/patient relationship. Data raise several issues

84
regarding inclusive practice when considered alongside GPs’ use of computer-based CDS
tools, all of which could be managed through adequate training in the use of the tools and,
indeed, more general assistance with the incorporation of IT into GP practice.
1.2 GP/Patient interaction
One of the greatest anxieties to emerge from the focus group data regarding GP computer
use during consultation and which links to the previous discussion, was the loss of
GP/patient interaction. As each of the quotes in table 1.2 demonstrate, focus group
participants identified good rapport as key to a GP’s ability to explore their patients’ health
issues, which Linda (FG1) asserts are discovered through a process of probing and asking
appropriate questions. These data thus highlight a lay awareness that the tools need to be
used alongside the patient and in conjunction with GP knowledge and clinical expertise, as
well as the importance for GPs’ honed listening skills. Indeed, over-reliance on the tools to
the detriment of traditional practice emerged as a key concern for focus group participants.
Nick (FG4) identified the tools as ‘reminders’ to GPs because of their visual presence on the
computer screen, although Pam’s (FG4) concern was that the tool might not indicate a
potential cancer risk but that this might be at odds with GP and patient ‘gut instinct’.
Although. As other respondents commented, Jill (FG5) stipulated that the usefulness of the
tools is reliant upon their accurate usage by GPs.
1.3 GPs sharing the tools with patients
Discussions regarding GPs sharing the tools with patients raised various issues, which are
illustrated in data table 1.3. Sheila (FG6) who had multiple sclerosis, related she had regular
appointments at the surgery. The concern she voiced was related to the limitations of a 10-
minute consultation, an unease that emerged in all of the focus groups, and also in the GP
interview data for this study. Daniel’s (FG3) comment regarding ‘box-ticking’ is also worth
noting, as it highlights the importance of patients being informed why their GP is checking
the screen during consultation and further relates to points raised in sections 1.1 and 1.2.
Gregory (FG5) and Nick (FG4) both implied that GPs would need to consider sharing the
tools with their patients on an individual basis. This, in turn, is most likely reliant on GPs
having some knowledge and understanding of their patients in order to minimise anxiety, for
example. Nick (FG4) raised the notion that the prompt and interactive risk calculator could
prove to be ‘discussion points’ that might stimulate conversation between GP and patient
regarding potential cancer risk and discussions around the necessity (or otherwise) of
further investigation/referral. Nick’s observation presents the tool as a facilitator rather than
a barrier to GP/patient interaction. These data do however also relate to concerns around
the limitations of consultation times, noted earlier, and also to points raised in sections 1.1
and 1.2. All further compound participants’ concerns regarding the quality of GP/patient
communication.

85
1.4 Understanding the components of the tools
As aforementioned, focus group discussions were preceded by a short film that outlined the
development of the tools and an introductory talk by the focus group moderator on their
different components. Focus group extracts in data table 1.4 illustrate how from this brief
introduction, participants acquired some understandings of each of the tools’ elements.
Edward (FG1), for example, was particularly struck by how useful the risk stratification list
could prove to be as, in his opinion it would prevent people from ‘tucking under the radar’.
The usefulness of this component is dependent on the capacity of the practice to act on the
information generated, which was an issue discussed in the GP report for this evaluation.
Brian (FG3) emphasised how GP expertise alongside use of the prompts allows a focus on
potential cancer symptoms and, as Gregory (FG5) also notes the tool stimulates further
inquiry, both of which are perceived to ‘speed up’ the route to diagnosis; as Martin (FG4)
comments, the tool potentially ‘guides’ the GP. Liz and Mary, participants in focus group 1,
both commented on the tools’ ability to store symptoms recognising, as Liz puts it, that this
component could provide GPs with ‘a shove in the right direction’. Data thus indicate how
focus group participants perceived efficient use of the tools and their components could
enable GPs to be poised to take the necessary action for their patients. As Philip and Martin,
both participants in FG4, noted, however, electronic CDS tools are dependent upon the up-
-to-date and accurate input of information. This links to points raised in section 1.2 and also
the GP report discussion on Read coding.
2. Participants’ perceptions on the usefulness/desirability of patients knowing
their potential cancer risk
2.1 Understanding cancer risk
The majority of focus group participants stated they would want to know their potential risk
of cancer, as data in table 2.1 illustrate. Edward (FG1) for example, commented that if
patients were informed of their cancer risk they would be more able to monitor their
health and return to the GP if changes occurred. Hilary’s (FG5) suggested that GPs ‘know’
which patients are able to cope with knowing their cancer risk, and further emphasises
point 1.3. This is further compounded by Kim (FG5) and Nancy (FG6) who held opposing
views on the benefits of knowing. During our discussion, Nancy related how, from the age
of 7, she had cared for her mother until her death from cancer when Nancy was 11 years
old. Although Nancy later trained to become a nurse, it could be that her childhood
experiences influenced her decisions regarding her own healthcare. As Hilary (FG5) implied,
knowledge of a patient’s circumstances should inform the approach of the GP when
broaching the subject of potential cancer diagnosis. Kevin (FG6) and Jeff (FG2) provide
tentative opinions; both suggest that the type or stage of cancer or the prognosis of a
particular cancer could influence the value of a patient knowing their cancer risk.

86
2.2 Benefits of knowing cancer risk
As data in table 2.2 illustrate, some participants were unsure whether being given a risk
score by a GP would be adequate or beneficial. Several focus group participants commented
in a similar vein to Max and Brian, both FG3, who felt the majority of the lay public would
not understand the meaning of the score. Brian also commented that once the word
‘cancer’ was brought into the consultation, it was likely patients would not take on board
what the GP was explaining to them. Kim (FG5) noted that the risk score would form only
part of the information she received and stated she would require further clarification of her
cancer risk. Kevin (FG6), Linda (FG1) and Daniel (FG3) present the view that the risk of
cancer can be associated with lifestyle choices and speculated that changes to these might
impact a patient’s risk score. Kevin’s comments further highlight the importance of
healthcare advice being contextualised and patient specific, which links to earlier points
regarding GPs’ knowledge of individual patients.
3. Participants’ perceptions of how involved patients should be in decision-
making about their own health/healthcare
3.1 Informed choice
The majority of participants from the six focus groups stated they would want to be
involved in decision making around their health. Data also highlight participants’ awareness
of their rights to be given information pertaining to their own healthcare. Data table 3.1
provides extracts from focus group discussions that are underscored by the issue of
informed choice. Jill (FG5) and Daniel (FG3) perceived the GP as a source of information.
Both acknowledged the clinical expertise of the GP and displayed a reliance on them to use
such knowledge adequately and appropriately to inform their patients. Mavis (FG1)
commented that members of the public should be proactive in their search for health
information and that asking questions of healthcare professionals was key to becoming an
informed patient better able to make healthcare decisions. Joe (FG6) and Cath (FG1)
however, both implied that GPs might not always be forthcoming with information; patients
would thus be expected to make healthcare decisions based on incomplete facts. Cath
suggests limited time might affect a GP’s ability to impart adequate information to patients.
Limitations of time emerged across the study data overall. Gemma (FG4) had experienced a
serious illness and her narrative highlights how her GP passed on information in terms
Gemma was unable to understand. This emphasises the need for healthcare professionals to
respond to their patients in lay terminology to ensure understanding and render informed
choice and decision making a reality.

87
3.2 Shared decision making
Focus group data indicate that both informed choice and shared decision making are reliant
upon a good relationship between patient and healthcare professional. Data table 3.2
provides some of our participants’ views on shared decision making. Max (FG3) commented
that appropriate healthcare decisions can be facilitated by the interaction between fully
informed patients who are then able to work in partnership with their GPs. Like Gemma
(FG4) in 3.1 above, Brian (FG3) raised the need for lay terminology so that patients are able
to comprehend the facts of their illness, and emphasised that patient trust in the GP is key
to the success of shared decision making. Sheila (FG6) commented that being given the
option to make choices around treatment might be difficult for some patients and made the
case that ‘adequate guidance’ from the GP is essential for shared decision making between
patient and health professional. Finally Clare’s (FG4) comments highlight the value she found
in having her partner accompany her, which also links to Brian’s comments in section 2.2
above.
Conclusion
In this report we have presented our analysis of the data gathered from six focus groups we
conducted as part of the qualitative evaluation of the electronic CDS tools eRATs and
QCancer. Three overarching themes emerged from the data that the research team
deemed most relevant to the training and support package for GPs once CDS tools are
more widely disseminated: (1) Participants’ perceptions of GPs’ use of CDS tools during
consultation; (2) Participants’ perceptions of the usefulness/desirability of patients knowing
their potential cancer risk; and (3) Participants’ perceptions of how involved patients should
be in decision-making about their own health/healthcare.
Although focus group participants highlighted the advantages of having computerised
records in primary care, the main anxieties they raised regarding GPs’ use of electronic
tools was that this might result in the (further) loss of patient/doctor communication and
interaction, elements participants perceived were essential for a good relationship with the
GP that in turn would encourage patients to present to primary care with worrying
symptoms.
The majority of focus group participants agreed that GPs should share their use of CDS
tools with patients and research findings highlight the importance of good rapport between
healthcare professional and patient. Participants were aware of the advantages of early
recognition of cancer symptoms, both on the part of patients and GPs, and cognisant this
was reliant on patients presenting to their GPs and on GPs being primed to act.

88
Participants discussed the usefulness/desirability of knowing their potential cancer risk. As
Paling (2003) has commented, communicating health risks to patients is not easy. From the
perspective of tool usage, what our data would suggest overall is that training and ongoing
support for GPs to ensure understanding of the functionality of each of the tools’
components would help support a more productive dialogue between GP and patient and
facilitate patients’ understanding of a cancer risk calculated by the tools, thus enabling them
to make informed decisions around their healthcare and in the event of a potential cancer
diagnosis.
In summary, this report has presented a lay perspective on the integration of electronic
CDS tools into primary care. Our analysis of the thoughtful and thought-provoking
responses from our participants could assist in the development and wider dissemination of
the eRATs and QCancer tools.
Limitations of the report
This evaluation is based on focus group material with a relatively small number of
participants and, as with all qualitative research, the findings are not generalizable. The
research team discussed the issue of data saturation (Cheek, 2011) and agreed that this had
been achieved. The majority of focus group participants (n.29) were lay members of the
public with no professional medical knowledge. Their opinions on the CDS tools are
therefore made from a lay perspective.
References
Cheek, J. 2011. The politics and practices of funding qualitative inquiry. In Denzin NK and
Lincoln S, editors. The Sage Handbook of Qualitative Research. London:Sage.
Kitzinger, J. 1994. The methodology of Focus Groups: the importance of interaction
between research participants. Sociology of Health & Illness, 16(1):103-21.
Paling, J. 2003. Strategies to help patients understand risks. BMJ 327: 745-8.
Ritchie J, Spencer L. 1994. Analysing qualitative data. In: Bryman A, Burgess R, editors.
London: Routledge.

89
Data table 1.1 GPs using IT
1.1 Quotes
GPs using IT With doctors and computers that you can often go into a surgery and you don't get no eye contact whatsoever because
they've always got their head buried in that thing, you know, I mean it's alright using it as long as they can talk to you as well,
you know what I mean? (Edward FG1)
They aren't sort of, you know, computer literate and, you know, a lot of them, the older ones anyway. (Cath FG1)
He hides behind the screen. Instead of saying, this is what's on the screen and perhaps even trying to explain, you know, this
is what he's accessing, it's always hidden … it's the lack of communication. The computer screen comes between the doctor
and me, and the kind of secrecy … unfortunately it generates a general distrust in the whole procedure. (Daniel FG3)
With the GP, if they’re looking at the computer, I’m afraid I look at it as well. I think if they’ve got the right to look at that
then I’ll have a look at it at the same time. (Kevin FG6)
The doctor I have she, she will turn the screen and show me it on the screen. She’s talking about what’s on the screen and
showing me, it’s not all the time but in some instances she will show me. (Betty FG6)

90
Data table 1.2 GP/patient interaction
1.2 Quotes
GP/Patient
interaction
You've got to combine the two because a lot of people think that oh, he didn't take any notice, he just sat there with his
head down looking at his computer then wrote something, so you've got to have that interactive bit as well, you've got to
have the doctor who sort of listens to you and asks you things and then puts all the information in … so I think the system's
good but I think it's, it's got to be used alongside sort of human contact. (Sandra FG1)
You are dependent upon a GP having enough experience … and actually listening to things and doing something practical, I
think, you know, you can do so many tick lists … So I think, you know, give them the tools and the training, yeah, but then
you are really dependent upon human beings with, using their traditional skills, you know. (Mark FG2)
What this could be very helpful for, if it is a background thing, and little thing in the corner of the screen and it’s just a
reminder and it’s an extra little reminder that there could be something that needs discussing. (Nick FG4)
It's a tool, but can't be the be all and end all of it. It's got to be in consultation with other things, it's, but it can't be a bad
thing I don't think. But as long as doctors don't dismiss you … because it, nothing could show on there [the screen] but the
doctor saying right okay, I want something further, because a lot of it’s gut instinct isn't it? On, on the doctor's side and our
side because I think we said before, you know your own body, I've always been a great believer in that. (Pam FG4)
Well I think it's basically a good idea, but it's like all machinery isn't it? As long as it goes along with patient contact, you
know, they haven't got to stop talking to you have they? In favour of just, you know, you'll often pick things up by speaking
to people don't you? And they don't always tell you what they really mean, straightaway. Needs a bit more digging, well
needs a bit more fishing doesn't it sometimes? Doctor's got to speak to you for a bit longer before he maybe he gets the
nitty-gritty of what's wrong, and a computer doesn't give you that, that scope I suppose. (Linda FG1)
It's another useful tool in the armoury, it's just another useful tool, but you still have to have a GP who listens to patients
and who's, you know, picking up on symptoms and entering them in and that would be for anything that, you know,
anything that the GP, they use and if it's not used properly it's not any use to anybody is it? (Jill FG5)
We've got about six doctors on our practice and there's only one really that sits and listens. (George FG1)
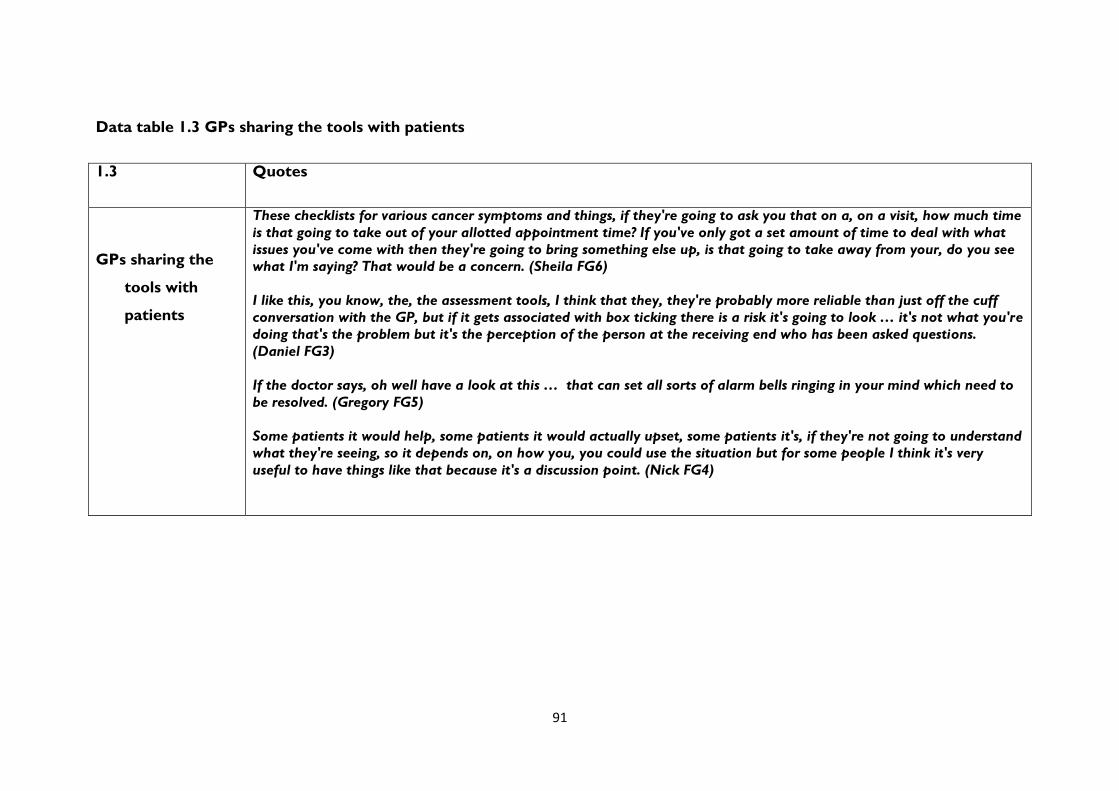
91
Data table 1.3 GPs sharing the tools with patients
1.3 Quotes
GPs sharing the
tools with
patients
These checklists for various cancer symptoms and things, if they're going to ask you that on a, on a visit, how much time
is that going to take out of your allotted appointment time? If you've only got a set amount of time to deal with what
issues you've come with then they're going to bring something else up, is that going to take away from your, do you see
what I'm saying? That would be a concern. (Sheila FG6)
I like this, you know, the, the assessment tools, I think that they, they're probably more reliable than just off the cuff
conversation with the GP, but if it gets associated with box ticking there is a risk it's going to look … it's not what you're
doing that's the problem but it's the perception of the person at the receiving end who has been asked questions.
(Daniel FG3)
If the doctor says, oh well have a look at this … that can set all sorts of alarm bells ringing in your mind which need to
be resolved. (Gregory FG5)
Some patients it would help, some patients it would actually upset, some patients it's, if they're not going to understand
what they're seeing, so it depends on, on how you, you could use the situation but for some people I think it's very
useful to have things like that because it's a discussion point. (Nick FG4)

92
Data table 1.4 Understanding the components of the tools
1.4 Quotes
Understanding
the
components
of the tools
The good thing about a system like this is it stops the people tucking under the radar, in a lot of ways, you know, a lot of
people don’t go to doctors for years … a system like this, if it’s checked out properly, it’d stop people like that slipping
away under the radar and just, you know, being out of the system, really. (Edward FG1)
If anything that [tool] speeds up the initial, maybe the initial analysis and give a little bit more time for conversation, it's
got to be beneficial hasn't it? … And I would see that, yes, I mean again you rely on his experience, it, when, the doctor,
GP brings experience to the, and presumably when, when this [tool] is used he will focus, he can focus possibly, it won't
be a kind of, I'll look at everything. So he'll focus won't he? (Brian FG3)
It's good that they've got all your history because if you've been going with, say like your friend with backache all the
time, there should come a point when they look at it, oh right, well we need to do something about this, you've been
complaining for two or three months now, we've got to take it further and sometimes they need a shove to point them in
the right direction. (Liz FG1)
It might flag something up as orange or red, that's only a potential indicator presumably ... it's good to know that there is
this sort of drop-down menu of additional questions and so on. (Gregory FG5)
They know it's there and they know that your symptom is there and they know you've got that and they can tell from
that what can become of what you've got. (Mary FG1)
If you got it at the beginning then they could do something. (Betty FG6)
Like everything, every database requires up to date information. (Philip FG4)
If it's going to guide the GP, particularly if they're not, not clued up, that's, that's going to be a fantastic tool, erm,
provided all the information's been fed into your records. (Martin FG4)
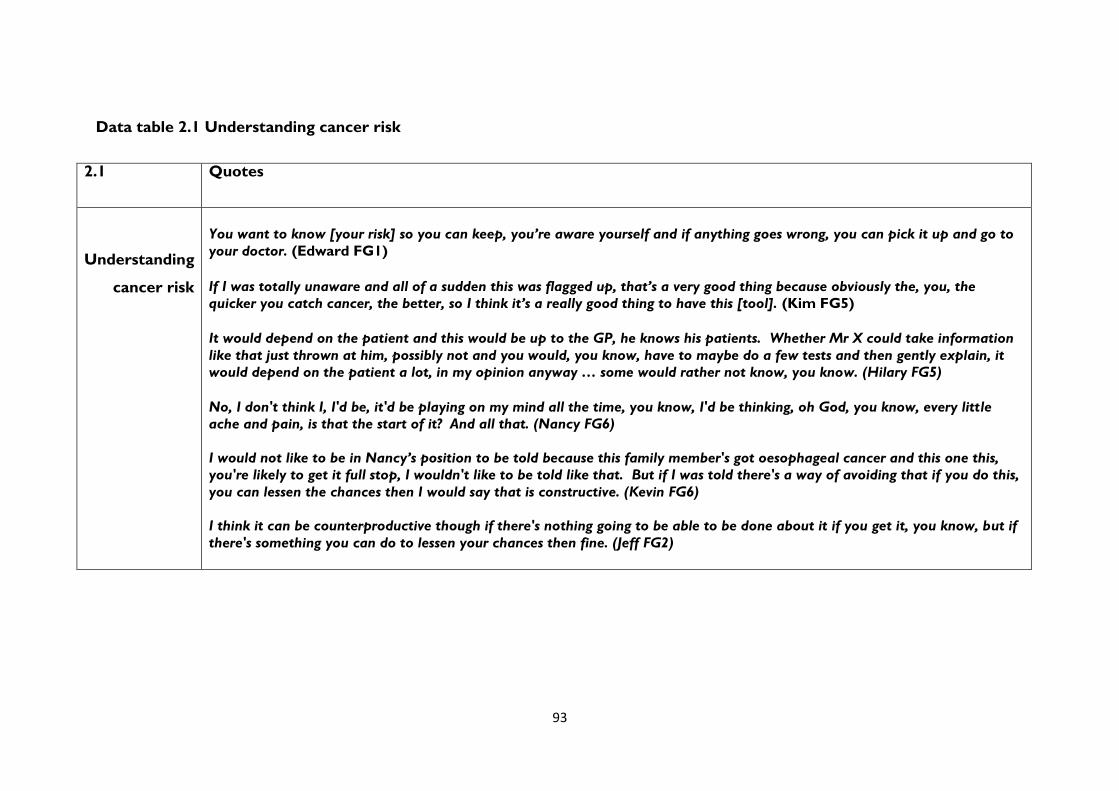
93
Data table 2.1 Understanding cancer risk
2.1 Quotes
Understanding
cancer risk
You want to know [your risk] so you can keep, you’re aware yourself and if anything goes wrong, you can pick it up and go to
your doctor. (Edward FG1) If I was totally unaware and all of a sudden this was flagged up, that’s a very good thing because obviously the, you, the
quicker you catch cancer, the better, so I think it’s a really good thing to have this [tool]. (Kim FG5)
It would depend on the patient and this would be up to the GP, he knows his patients. Whether Mr X could take information
like that just thrown at him, possibly not and you would, you know, have to maybe do a few tests and then gently explain, it
would depend on the patient a lot, in my opinion anyway … some would rather not know, you know. (Hilary FG5)
No, I don't think I, I'd be, it'd be playing on my mind all the time, you know, I'd be thinking, oh God, you know, every little
ache and pain, is that the start of it? And all that. (Nancy FG6)
I would not like to be in Nancy’s position to be told because this family member's got oesophageal cancer and this one this,
you're likely to get it full stop, I wouldn't like to be told like that. But if I was told there's a way of avoiding that if you do this,
you can lessen the chances then I would say that is constructive. (Kevin FG6)
I think it can be counterproductive though if there's nothing going to be able to be done about it if you get it, you know, but if
there's something you can do to lessen your chances then fine. (Jeff FG2)

94
Data table 2.2 Benefits of knowing cancer risk
2.2 Quotes
Benefits of knowing
cancer risk
If you just say five percent risk, I mean many people won't even begin to comprehend what five percent risk means.
(Max FG3)
Most people don't understand statistics, they’ll hear cancer, that's all they’ll hear is cancer and anything else around
it will disappear. (Brian FG3)
It's part of the information you would receive, I think I'd need more information than just a score. I would need to
know more then, I'd obviously be, be concerned but would want to know more and have more investigations. (Kim
FG5)
I do think it's a good thing to, erm, to know that it's being looked at, to say Kevin, you've got this risk of this cancer
but you can do something about it by losing weight, is the usual one for me, right, fair enough, you know, at least I
know. What I would like as a follow up then is how best to lose weight and keep it off, when, because of my ME I
can't exercise much. (Kevin FG6)
Well I think if you know what you're doing wrong, you can try not to do it can't you? So if, if you're not eating the
right food or something, you can alter, so if, if they know what risk you are because of, because you're eating too
much fat or you, whatever you're doing, you can change it. (Linda FG1)
I'd rather know that something I'm doing is contributing to my risk factor, even if I find it petrifies me. (Daniel FG3)

95
Data table 3.1 Informed choice
3.1 Quotes
Informed choice
If you've never had cancer before and you don't know anybody with cancer then you, you've only got a
limited knowledge but erm, I think they have, they have to speak to their patients now and give them
choices, they don't just decide for you. (Jill FG5)
I've also got a right to make an informed choice whether or not to do so [have treatment]. And it's
sufficient information to make that choice, depending on their knowledge and background. I mean it's up
to the doctor obviously to make a judgement of how much they're able to deal with it … I mean damn it
all if you've got cancer, I think the doctor's got to make a reasonable assumption you know what cancer
means. (Daniel FG3)
You never get to know anything if you don't ask the questions, that is important … If you're not sure, if
you don't know what the doctor's talking about you must ask the questions … you need to know don't
you? (Mavis FG1)
The doctors don't always give you the full information though. I suppose it's because they're that busy.
(Cath FG1)
I would like to, to know, you know, what's going on, erm, about my health, you know, more than the GP
telling me, you know, about my body, [laughs] yeah. Well, you're supposed to, you know, ask the GP, you
know, what about this and what about that? Sometimes he doesn't get you a straight answer. (Joe FG6)
Sitting listening to my own GP, it was as if she thought she was talking to somebody that knew exactly
what she was going on about, so it just used to go straight over your head anyway. (Gemma FG4)

96
Data table 3.2 Shared decision making
3.2 Quotes
Shared decision making
I'm all for more interaction between GP and patient and let the patient help, or help, let the GP guide
the patient as it were to where we go in the future for treatment but have input but it's, it's interaction
between GP and, and patient which is utterly important. (Max FG3)
If you're capable in the technical sense, capable of making a decision then you should be given all the
facts as far as this and if the facts have to be rendered in language which is understandable to the
laymen well that, that's how you'd render it and then the individual has to make the decision with the
advice of the doctor, if you trust the doctor of course, he will, hopefully he'll make a, a more informed
decision if you trust what the doctor tells him. (Brian FG3)
Where I think this gets a bit difficult is if they say to, if, erm, a doctor says to you, erm, what do you
want? Or where are you going with this? Or something like that. Well we don't have the sufficient
information and we're not the ones that are trained to be able to make those decisions, you still need
[…] adequate guidance from their experience and what they know. (Sheila FG6)
Well I think it always helps to have somebody else with you in those situations so, because it, it probably
will go straight over your head but, I mean my husband came with me to every meeting and took notes,
and sort of wrote a history of it really, of my treatment. (Clare FG4)

97
Appendix to sections 3.5 to 3.7: Data tables for Experience tab data associated with use of the symptom checker Clinical systems used by the practices involved in this project:
Clinical System No. of practices* Proportion of known practices EMIS 3 2%
EMIS LV 24 18%
EMIS PCS 7 5%
EMIS WEB 21 16%
iSoft 1 1%
iSoft Premiere 1 1%
iSoft Synergy 5 4%
CSC Synergy
v1.9
1 1%
SystmOne 32 24%
Vision 22 16%
Vision
Enterprise
1 1%
Vision INPS 15 11%
Vision VES 1 1%
Missing 30 -
Total 164 -
*which completed the Experience tab at least once Table 1: Cumulative number and proportion of practices installed by the beginning of each month (% of all those installed by end of study period), practices allocated to RAT and QCancer combined
Time period Number installed Proportion of final number installed (n=439)
By 1st March 2013 (start of study period) 239 54.4% By 1st April 2013 330 75.2% By 1st May 2013 386 87.9% By 1st June 2013 419 95.4% By 1st July 2013 422 96.1% By 1st Aug 2013 430 97.9% By 1st Sept 2013 433 98.6% By 1st Oct 2013 438 99.8% By 1st Nov 2013 439 100.0%

98
Table 2: Number of practices recruited, withdrawn and installed by the end of the study period, by Cancer Network/CCG
Cancer Network No. of practices recruited
No. withdrawals
No. remaining (after withdrawals)
No. installed
Proportion installed (of no. remaining)
RAT allocation Dorset 16 2 14 13 93% Medway CCG 25 0 25 23 92% Merseyside & Cheshire
30 1 29 25 86%
N.Yorks & Humber 18 1 17 13 76% NC London 22 1 21 18 86% NE London 26 0 26 24 92% North of England 78 1 77 70 91% Pan Birmingham 30 2 28 22 79% Sussex 14 0 14 14 100% TOTAL RAT 259 8 251 222 88%
QCancer allocation East Midlands 31 4 27 27 100% Essex 19 0 19 19 100% Greater Manch & Cheshire
45 3 42 40 95%
Isle of Wight 17 0 17 16 94% Lancs & S.Cumbria 26 4 22 17 77% North Trent 28 2 26 26 100% South & West London
85 2 83 72 87%
TOTAL QCancer 251 15 236 217 92%
OVERALL (RAT+QCancer)
510 23 487 439 90%
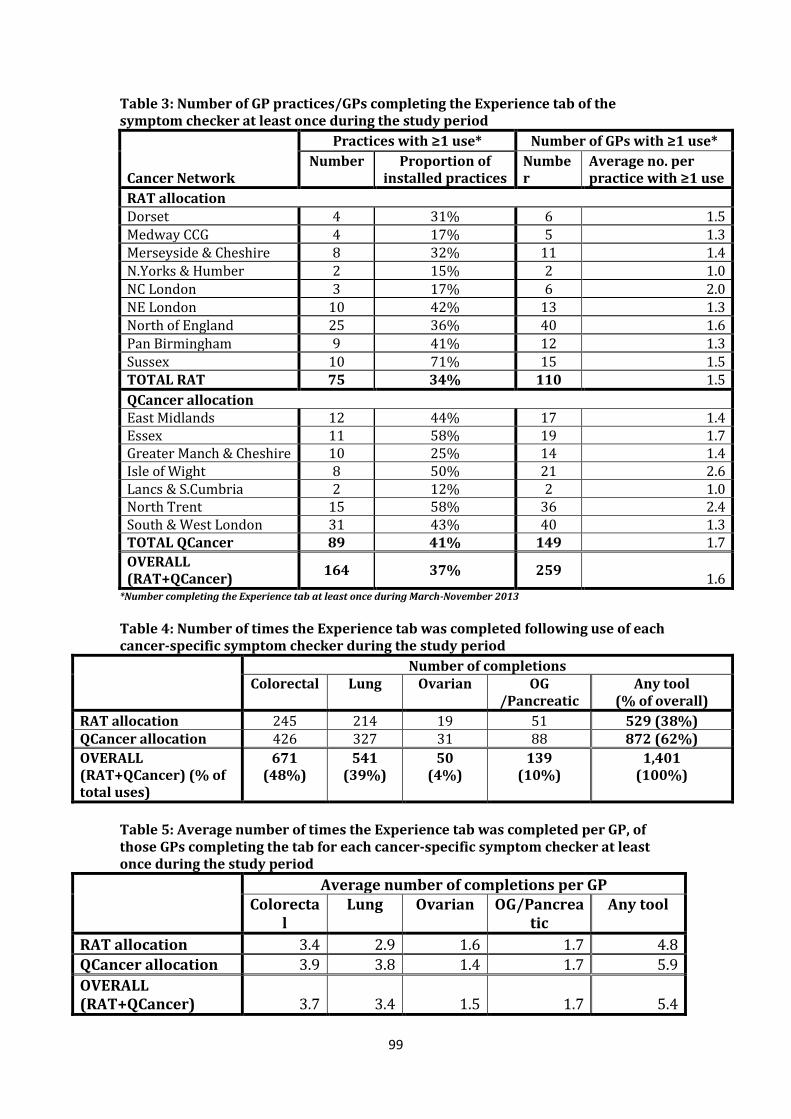
99
Table 3: Number of GP practices/GPs completing the Experience tab of the symptom checker at least once during the study period
Cancer Network
Practices with ≥1 use* Number of GPs with ≥1 use*
Number Proportion of installed practices
Number
Average no. per practice with ≥1 use
RAT allocation Dorset 4 31% 6 1.5 Medway CCG 4 17% 5 1.3 Merseyside & Cheshire 8 32% 11 1.4 N.Yorks & Humber 2 15% 2 1.0 NC London 3 17% 6 2.0 NE London 10 42% 13 1.3 North of England 25 36% 40 1.6 Pan Birmingham 9 41% 12 1.3 Sussex 10 71% 15 1.5 TOTAL RAT 75 34% 110 1.5
QCancer allocation East Midlands 12 44% 17 1.4 Essex 11 58% 19 1.7 Greater Manch & Cheshire 10 25% 14 1.4 Isle of Wight 8 50% 21 2.6 Lancs & S.Cumbria 2 12% 2 1.0 North Trent 15 58% 36 2.4 South & West London 31 43% 40 1.3 TOTAL QCancer 89 41% 149 1.7
OVERALL (RAT+QCancer)
164 37% 259 1.6
*Number completing the Experience tab at least once during March-November 2013
Table 4: Number of times the Experience tab was completed following use of each cancer-specific symptom checker during the study period
Number of completions Colorectal Lung Ovarian OG
/Pancreatic Any tool
(% of overall)
RAT allocation 245 214 19 51 529 (38%) QCancer allocation 426 327 31 88 872 (62%)
OVERALL (RAT+QCancer) (% of total uses)
671 (48%)
541 (39%)
50 (4%)
139 (10%)
1,401 (100%)
Table 5: Average number of times the Experience tab was completed per GP, of those GPs completing the tab for each cancer-specific symptom checker at least once during the study period
Average number of completions per GP Colorecta
l Lung Ovarian OG/Pancrea
tic Any tool
RAT allocation 3.4 2.9 1.6 1.7 4.8 QCancer allocation 3.9 3.8 1.4 1.7 5.9
OVERALL (RAT+QCancer) 3.7 3.4 1.5 1.7 5.4
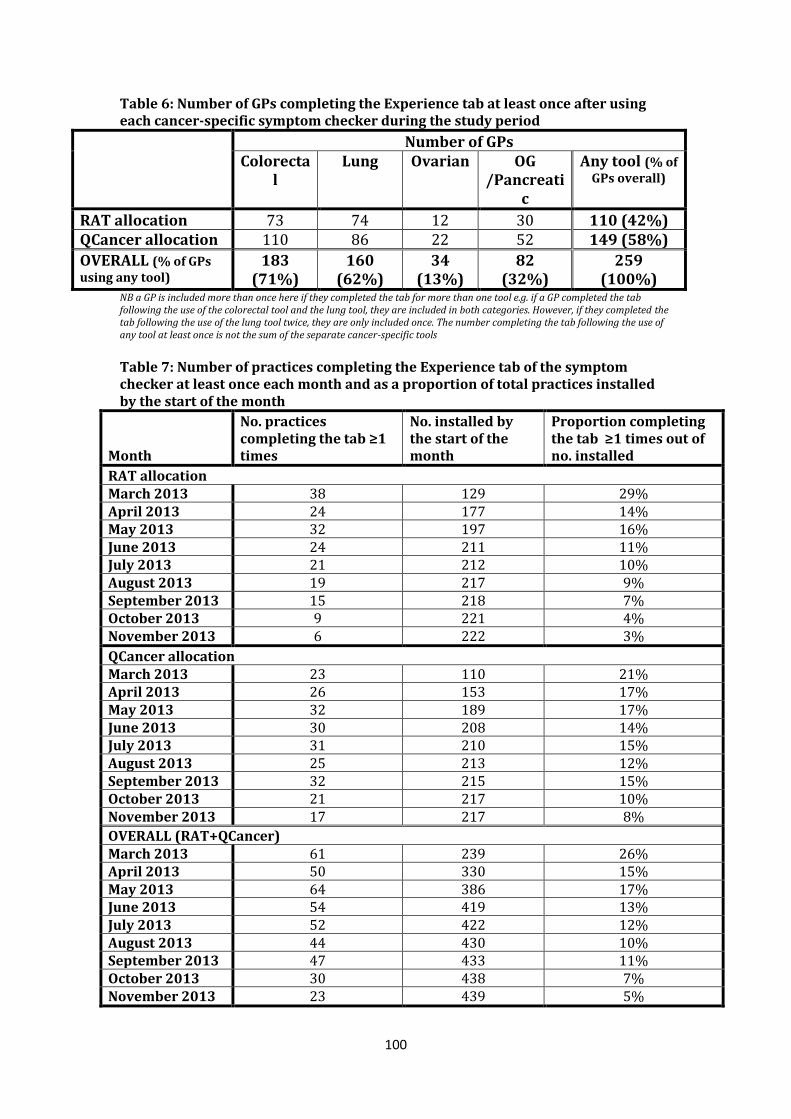
100
Table 6: Number of GPs completing the Experience tab at least once after using each cancer-specific symptom checker during the study period
Number of GPs Colorecta
l Lung Ovarian OG
/Pancreatic
Any tool (% of GPs overall)
RAT allocation 73 74 12 30 110 (42%) QCancer allocation 110 86 22 52 149 (58%)
OVERALL (% of GPs using any tool)
183 (71%)
160 (62%)
34 (13%)
82 (32%)
259 (100%)
NB a GP is included more than once here if they completed the tab for more than one tool e.g. if a GP completed the tab following the use of the colorectal tool and the lung tool, they are included in both categories. However, if they completed the tab following the use of the lung tool twice, they are only included once. The number completing the tab following the use of any tool at least once is not the sum of the separate cancer-specific tools
Table 7: Number of practices completing the Experience tab of the symptom checker at least once each month and as a proportion of total practices installed by the start of the month
Month
No. practices completing the tab ≥1 times
No. installed by the start of the month
Proportion completing the tab ≥1 times out of no. installed
RAT allocation March 2013 38 129 29% April 2013 24 177 14% May 2013 32 197 16% June 2013 24 211 11% July 2013 21 212 10% August 2013 19 217 9% September 2013 15 218 7% October 2013 9 221 4% November 2013 6 222 3%
QCancer allocation March 2013 23 110 21% April 2013 26 153 17% May 2013 32 189 17% June 2013 30 208 14% July 2013 31 210 15% August 2013 25 213 12% September 2013 32 215 15% October 2013 21 217 10% November 2013 17 217 8%
OVERALL (RAT+QCancer) March 2013 61 239 26% April 2013 50 330 15% May 2013 64 386 17% June 2013 54 419 13% July 2013 52 422 12% August 2013 44 430 10% September 2013 47 433 11% October 2013 30 438 7% November 2013 23 439 5%
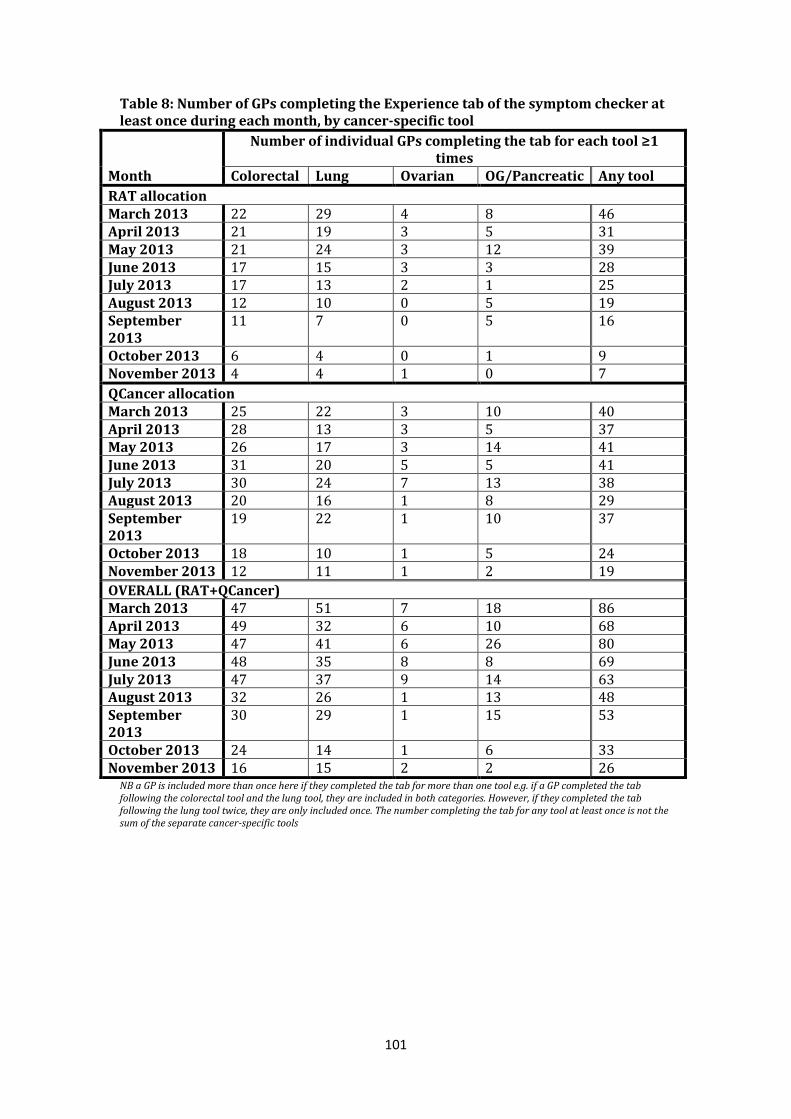
101
Table 8: Number of GPs completing the Experience tab of the symptom checker at least once during each month, by cancer-specific tool
Month
Number of individual GPs completing the tab for each tool ≥1 times
Colorectal Lung Ovarian OG/Pancreatic Any tool
RAT allocation March 2013 22 29 4 8 46 April 2013 21 19 3 5 31 May 2013 21 24 3 12 39 June 2013 17 15 3 3 28 July 2013 17 13 2 1 25 August 2013 12 10 0 5 19 September 2013
11 7 0 5 16
October 2013 6 4 0 1 9 November 2013 4 4 1 0 7
QCancer allocation March 2013 25 22 3 10 40 April 2013 28 13 3 5 37 May 2013 26 17 3 14 41 June 2013 31 20 5 5 41 July 2013 30 24 7 13 38 August 2013 20 16 1 8 29 September 2013
19 22 1 10 37
October 2013 18 10 1 5 24 November 2013 12 11 1 2 19
OVERALL (RAT+QCancer) March 2013 47 51 7 18 86 April 2013 49 32 6 10 68 May 2013 47 41 6 26 80 June 2013 48 35 8 8 69 July 2013 47 37 9 14 63 August 2013 32 26 1 13 48 September 2013
30 29 1 15 53
October 2013 24 14 1 6 33 November 2013 16 15 2 2 26
NB a GP is included more than once here if they completed the tab for more than one tool e.g. if a GP completed the tab following the colorectal tool and the lung tool, they are included in both categories. However, if they completed the tab following the lung tool twice, they are only included once. The number completing the tab for any tool at least once is not the sum of the separate cancer-specific tools

102
Table 9: GPs completing the Experience tab of the symptom checker for the first time each month
Month
GPs completing the tab*
GPs completing the tab for the 1st time that month
(N and % of all GPs completing the tab*) N N %
RAT allocation March 2013 46 46 100% April 2013 31 13 42% May 2013 39 26 67% June 2013 28 8 29% July 2013 25 7 28% August 2013 19 4 21% September 2013
16 3 19%
October 2013 9 1 11% November 2013 7 2 29% Total n/a 110 100%
QCancer allocation March 2013 40 40 100% April 2013 37 20 54% May 2013 41 23 56% June 2013 41 18 44% July 2013 38 19 50% August 2013 29 7 24% September 2013
37 10 27%
October 2013 24 9 38% November 2013 19 3 16% Total n/a 149 -
OVERALL (RAT+QCancer) March 2013 86 86 100% April 2013 68 33 49% May 2013 80 49 61% June 2013 69 26 38% July 2013 63 26 41% August 2013 48 11 23% September 2013
53 13 25%
October 2013 33 10 30% November 2013 26 5 19% Total n/a 259 100%
*completing the Experience tab at least once following any cancer-specific tool

103
Table 10: Number of patients by gender and proportion of all patients with known gender, for all patients that the symptom checker was completed to the Experience tab on during the study period (RAT and QCancer allocations combined)
Gender
Colorectal Lung Ovarian OG/Pancreatic
Any tool
N
% of know
n N
% of know
n N
% of know
n N % of
known N
% of know
n
Male 27
7 43%* 28
2 53%* 0 0% 60 45%* 619 46%*
Female 36
7 57%* 24
9 47%* 50 100% 72 55%* 738 54%*
Unknown 27 - 10 - 0 - 7 - 44 -
Total 67
1 - 54
1 - 50 - 139 -
1,401 -
*indicates a statistically significant difference in proportion of males compared with females for the tool (one-sample test of proportions p<0.05)
Table 11: Age of patients, for all patients that the symptom checker was completed to the Experience tab on during the study period (RAT and QCancer allocations combined)
Gender
Colorectal Lung Ovarian OG/Pancreatic Any tool
N % of
known N % of
known N % of
known N % of
known N % of
known
<40 7 1% 1 0% 2 4% 2 1% 12 1% 40-44 12 2% 32 6% 7 14% 0 0% 51 4% 45-49 14 2% 26 5% 2 4% 4 3% 46 3% 50-54 28 4% 54 10% 5 10% 4 3% 91 6% 55-59 42 6% 67 12% 3 6% 16 12% 128 9% 60-64 76 11% 60 11% 10 20% 23 17% 169 12% 65-69 51 8% 92 17% 2 4% 19 14% 164 12% 70-74 94 14% 79 15% 4 8% 14 10% 191 14% 75-79 123 18% 66 12% 4 8% 22 16% 215 15% 80-84 115 17% 38 7% 4 8% 21 15% 178 13% 85+ 109 16% 26 5% 7 14% 14 10% 156 11%
All 55+ 610 91%* 428 79%* 34 68%* 129 93%* 1201 86%
All ages 671 100% 541 100% 50 100% 139 100% 1401 100% *statistically significant differences in proportions aged 55+ between all the cancer-specific tools except there is no significant difference between the colorectal and OG/pancreatic tools (two-sample test of proportions p<0.05)
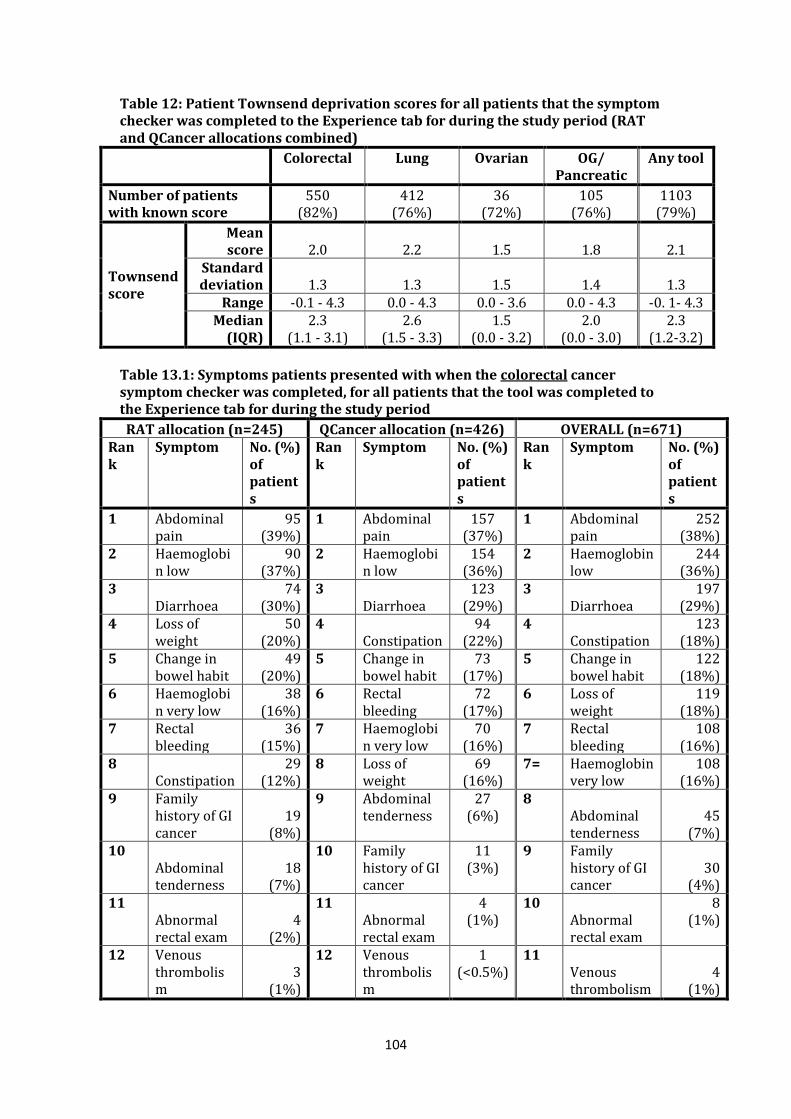
104
Table 12: Patient Townsend deprivation scores for all patients that the symptom checker was completed to the Experience tab for during the study period (RAT and QCancer allocations combined)
Colorectal Lung Ovarian OG/
Pancreatic Any tool
Number of patients with known score
550 (82%)
412 (76%)
36 (72%)
105 (76%)
1103 (79%)
Townsend score
Mean score 2.0 2.2 1.5 1.8 2.1
Standard deviation 1.3 1.3 1.5 1.4 1.3
Range -0.1 - 4.3 0.0 - 4.3 0.0 - 3.6 0.0 - 4.3 -0. 1- 4.3 Median
(IQR) 2.3
(1.1 - 3.1) 2.6
(1.5 - 3.3) 1.5
(0.0 - 3.2) 2.0
(0.0 - 3.0) 2.3
(1.2-3.2)
Table 13.1: Symptoms patients presented with when the colorectal cancer symptom checker was completed, for all patients that the tool was completed to the Experience tab for during the study period
RAT allocation (n=245) QCancer allocation (n=426) OVERALL (n=671) Rank
Symptom No. (%) of patients
Rank
Symptom No. (%) of patients
Rank
Symptom No. (%) of patients
1 Abdominal pain
95 (39%)
1 Abdominal pain
157 (37%)
1 Abdominal pain
252 (38%)
2 Haemoglobin low
90 (37%)
2 Haemoglobin low
154 (36%)
2 Haemoglobin low
244 (36%)
3 Diarrhoea
74 (30%)
3 Diarrhoea
123 (29%)
3 Diarrhoea
197 (29%)
4 Loss of weight
50 (20%)
4 Constipation
94 (22%)
4 Constipation
123 (18%)
5 Change in bowel habit
49 (20%)
5 Change in bowel habit
73 (17%)
5 Change in bowel habit
122 (18%)
6 Haemoglobin very low
38 (16%)
6 Rectal bleeding
72 (17%)
6 Loss of weight
119 (18%)
7 Rectal bleeding
36 (15%)
7 Haemoglobin very low
70 (16%)
7 Rectal bleeding
108 (16%)
8 Constipation
29 (12%)
8 Loss of weight
69 (16%)
7= Haemoglobin very low
108 (16%)
9 Family history of GI cancer
19 (8%)
9 Abdominal tenderness
27 (6%)
8 Abdominal tenderness
45 (7%)
10 Abdominal tenderness
18 (7%)
10 Family history of GI cancer
11 (3%)
9 Family history of GI cancer
30 (4%)
11 Abnormal rectal exam
4 (2%)
11 Abnormal rectal exam
4 (1%)
10 Abnormal rectal exam
8 (1%)
12 Venous
thrombolism
3 (1%)
12 Venous thrombolism
1 (<0.5%)
11 Venous thrombolism
4 (1%)

105
Table13.2: Symptoms/risk factors patients presented with when the lung cancer symptom checker was used, for all patients the tool was completed to the Experience tab for during the study period
RAT allocation (n=214) QCancer allocation (n=327) OVERALL (n=541) Rank Symptom No. (%)
of patients
Rank Symptom No. (%) of patients
Rank Symptom No. (%) of patients
1 Cough
121 (57%) 1
Abnormal spirometry
213 (65%) 1
Abnormal spirometry
318 (59%)
2 Abnormal spirometry
105 (49%) 2 Cough
147 (45%) 2 Cough
268 (50%)
3 Dyspnoea
74 (35%) 3 COPD
104 (32%) 3 Dyspnoea
163 (30%)
4 COPD
53 (25%) 4 Dyspnoea
89 (27%) 4 COPD
157 (29%)
5 Fatigue
45 (21%) 5 Fatigue
54 (17%) 5 Fatigue
99 (18%)
6 Loss of weight
40 (19%) 6 Chest pain
47 (14%) 6
Loss of weight
86 (16%)
7 Haemoptysis
34 (16%) 7
Loss of weight
46 (14%) 7 Chest pain
78 (14%)
8 Chest pain
31 (14%) 8=
Abdominal pain
22 (7%) 8 Haemoptysis
53 (10%)
9 Loss of appetite
14 (7%) 8=
Loss of appetite
22 (7%) 9
Loss of appetite
36 (7%)
10 Raised platelet count
12 (6%) 9
Raised platelet count
20 (6%) 10
Raised platelet count
32 (6%)
11 Abdominal pain
9 (4%) 10 Haemoptysis
19 (6%) 11
Abdominal pain
31 (6%)
12 Dyspepsia
8 (4%) 11 Dyspepsia
13 (4%) 12 Dyspepsia
21 (4%)
13 Night sweats
5 (2%) 12 Night sweats
7 (2%) 13 Night sweats
12 (2%)
14 Dysphagia
1 (0%) 13 Dysphagia
6 (2%) 14 Dysphagia
7 (1%)
15 Venous thrombolism
3 (1%) 14 Neck lump
3 (1%) 15
Venous thrombolism
5 (1%)
15 Venous thrombolism
2 (1%) 16 Neck lump
3 (1%)

106
Table 13.3: Symptoms/risk factors patients presented with when the ovarian cancer symptom checker was used, for all patients the tool was completed to the Experience tab for during the study period
RAT allocation (n=19) QCancer allocation (n=31) OVERALL (n=50) Rank Symptom No. (%)
of patients
Rank Symptom No. (%) of patients
Rank Symptom No. (%) of patients
1 Abdominal bloating
15 (79%) 1
Abdominal distension
22 (71%) 1
Abdominal bloating
33 (66%)
2 Abdominal pain
11 (58%) 2
Abdominal bloating
18 (58%) 2
Abdominal distension
30 (60%)
3 Abdominal distension
8 (42%) 3
Abdominal pain
12 (39%) 3
Abdominal pain
23 (46%)
4 Urinary frequency
7 (37%) 4
Change in bowel habit
8 (26%) 4
Urinary frequency
11 (22%)
5= Loss of appetite
3 (16%) 5=
Loss of appetite
5 (16%) 5
Change in bowel habit
10 (20%)
5= Dyspepsia 3
(16%) 5= Dyspepsia 5
(16%) 6= Loss of appetite
8 (16%)
6 Change in bowel habit
2 (11%) 6=
Loss of weight
4 (13%) 6= Dyspepsia
8 (16%)
7= Loss of weight
1 (5%) 6=
Urinary frequency
4 (13%) 7
Loss of weight
5 (10%)
7=
Family history of ovarian cancer
1 (5%) 7
Family history of ovarian cancer
3 (10%) 8
Family history of ovarian cancer
4 (8%)
7= Postmenopausal bleeding
1 (5%) 8=
Postmenopausal bleeding
1 (3%) 9
Postmenopausal bleeding
2 (4%)
8= Haematuria 1
(3%) 10 Haematuria 1
(2%)

107
Table 13.4: Symptoms/risk factors that patients presented with when the OG/pancreatic cancer symptom checker was used, for all patients the tool was completed to the Experience tab for during the study period
RAT allocation (n=51) QCancer allocation (n=88) OVERALL (n=139) Rank Symptom No. (%)
of patients
Rank Symptom No. (%) of patients
Rank Symptom No. (%) of patients
1 Dysphagia 20
(39%) 1 Dysphagia 39
(44%) 1 Dysphagia 59
(42%)
2 Nausea or vomiting
15 (29%) 2 Dyspepsia
23 (26%) 2 Dyspepsia
35 (25%)
3 Dyspepsia 12
(24%) 3 Nausea or vomiting
17 (19%) 3
Nausea or vomiting
32 (23%)
4= Reflux 11
(22%) 4 Anaemia 14
(16%) 4 Anaemia 20
4= Epigastric pain
11 (22%) 5= Reflux
13 (15%) 5= Reflux
24 (17%)
5 Heartburn 7
(14%) 5= Epigastric pain
13 (15%) 5=
Epigastric pain
24 (17%)
6 Aneamia 6
(12%) 6 Jaundice 10
(11%) 6 Heartburn 15
(11%)
7=
Change in bowel habit
2 (4%) 7 Heartburn
8 (9%) 7 Jaundice
12 (9%)
7= Jaundice 2
(4%) 8 Change in bowel habit
7 (8%) 8
Change in bowel habit
9 (6%)
7= Raised platelets
2 (4%) 9
Type 2 diabetes
4 (5%) 9
Type 2 diabetes
6 (4%)
7= Type 2 diabetes
2 (4%) 10= Neck lump
3 (3%) 10= Neck lump
3 (2%)
8 Haematemesis
1 (2%) 10=
Venous thrombolism
3 (3%) 10=
Venous thrombolism
3 (2%)
11 Chronic pancreatitis
1 (1%) 11
Raised platelets
2 (1%)
12= Haematemesis
1 (1%)
12=
Chronic pancreatitis
1 (1%)

108
Table 14: Patient RAT and QCancer scores, for all patients that the symptom checker was completed to the Experience tab for during the study period, by RAT/QCancer allocation and by cancer-specific symptom checker
Colorectal Lung OG* Ovarian Pancreatic* Any tool
RAT allocation RAT score
Mean 4.7 4.8 3.3 1.8 1.3 4.2
Median (IQR)
3 (2-5)
4 (2-10)
2 (1-5)
2 (1-3)
0 (0-1)
3 (1-5)
QCancer score
Mean 3.8 3.4 4.5 8.8 0.9 3.6
Median (IQR)
1 (1-3) 1 (0-3) 1 (0-5) 0 (0-8) 0 (0-0) 1 (0-3)
QCancer allocation RAT score
Mean 4.6 5.0 3.8 2.4 3.2 4.5
Median (IQR)
3 (2-5)
4 (2-10)
3 (1-5)
3 (2-3)
0 (0-2)
3 (2-5)
QCancer score
Mean 2.9 2.3 7.6 9.8 1.1 3.2
Median (IQR)
1 (1-2) 1 (0-2) 1 (0-9) 2 (1-3) 0 (0-1) 1 (0-2)
OVERALL (RAT+QCancer) RAT score
Mean 4.6** 4.9** 3.6** 2.2** 2.5** 4.4
Median (IQR)
3 (2-5)
4 (2-10)
3 (1-5)
2.5 (1-3)
0 (0-2)
3 (2-5)
QCancer score
Mean 3.2** 2.7** 6.4** 9.4** 1.0** 3.3 Median (IQR)
1 (1-3)
1 (0-2)
1 (0-7)
2 (0-3)
0 (0-1)
1 (0-2)
*NB Patients on whom the OG/pancreatic combined tool are used are given two separate scores, one for OG cancer and one for pancreatic cancer. Therefore, both scores are provided separately here. These patients are counted twice so there is a total of 1,539 records for this aspect of the analysis. **the difference in mean scores are statistically significantly different between the RAT score and the QCancer score for all the cancer-specific symptom checkers (paired t-test; p<0.05)

109
Figures A-D: RAT and QCancer scores calculated by the tool by cancer type and allocation to RAT or QCancer, and overall (RAT and QCancer combined), for patients seen during whole study period.
Scores by cancer type for those allocated to RAT A) RAT score B) QCancer
0 10 20 30 40 50Patient:eRAT Score
Pancreatic
Ovarian
Oesophago-Gastric
Lung
Colorectal
0 20 40 60 80 100
Patient:QCancer Score
Pancreatic
Ovarian
Oesophago-Gastric
Lung
Colorectal
Scores by cancer type for those allocated to QCancer
C) RAT score D) QCancer
0 10 20 30 40Patient:eRAT Score
Pancreatic
Ovarian
Oesophago-Gastric
Lung
Colorectal
0 20 40 60 80 100Patient:QCancer Score
Pancreatic
Ovarian
Oesophago-Gastric
Lung
Colorectal
Scores by cancer type OVERALL (RAT & QCancer combined)
E) RAT score F) QCancer
0 10 20 30 40 50Patient:eRAT Score
Pancreatic
Ovarian
Oesophago-Gastric
Lung
Colorectal
0 20 40 60 80 100Patient:QCancer Score
Pancreatic
Ovarian
Oesophago-Gastric
Lung
Colorectal
*patients on whom the OG/pancreatic combined tool are used are given two separate scores, one for OG cancer and one for pancreatic cancer. Therefore, the scores are provided separately here.
Interpretation of a box plot: The vertical line in the middle of the box represents the median. The box is drawn from the lower quartile (i.e. if there were 100 scores put in order, this would be the 25th score) to the upper quartile (i.e. if there were 100
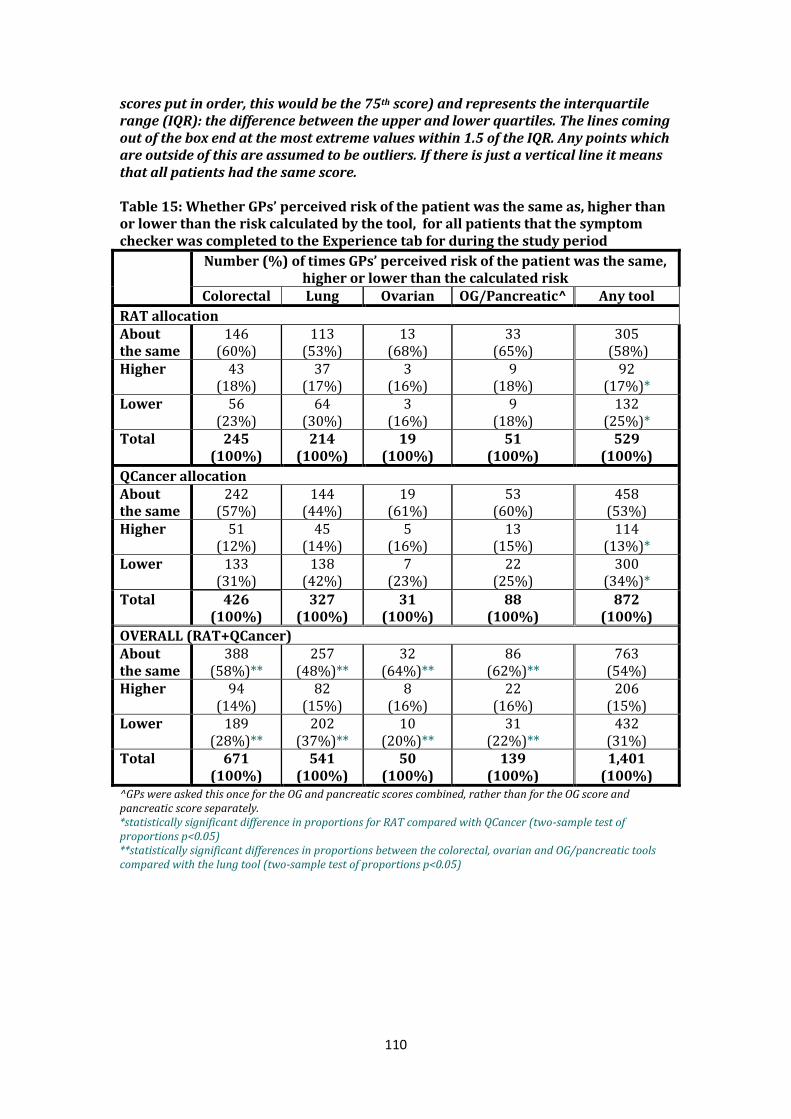
110
scores put in order, this would be the 75th score) and represents the interquartile range (IQR): the difference between the upper and lower quartiles. The lines coming out of the box end at the most extreme values within 1.5 of the IQR. Any points which are outside of this are assumed to be outliers. If there is just a vertical line it means that all patients had the same score. Table 15: Whether GPs’ perceived risk of the patient was the same as, higher than or lower than the risk calculated by the tool, for all patients that the symptom checker was completed to the Experience tab for during the study period
Number (%) of times GPs’ perceived risk of the patient was the same, higher or lower than the calculated risk
Colorectal Lung Ovarian OG/Pancreatic^ Any tool
RAT allocation About the same
146 (60%)
113 (53%)
13 (68%)
33 (65%)
305 (58%)
Higher 43 (18%)
37 (17%)
3 (16%)
9 (18%)
92 (17%)*
Lower 56 (23%)
64 (30%)
3 (16%)
9 (18%)
132 (25%)*
Total 245 (100%)
214 (100%)
19 (100%)
51 (100%)
529 (100%)
QCancer allocation About the same
242 (57%)
144 (44%)
19 (61%)
53 (60%)
458 (53%)
Higher 51 (12%)
45 (14%)
5 (16%)
13 (15%)
114 (13%)*
Lower 133 (31%)
138 (42%)
7 (23%)
22 (25%)
300 (34%)*
Total 426 (100%)
327 (100%)
31 (100%)
88 (100%)
872 (100%)
OVERALL (RAT+QCancer) About the same
388 (58%)**
257 (48%)**
32 (64%)**
86 (62%)**
763 (54%)
Higher 94 (14%)
82 (15%)
8 (16%)
22 (16%)
206 (15%)
Lower 189 (28%)**
202 (37%)**
10 (20%)**
31 (22%)**
432 (31%)
Total 671 (100%)
541 (100%)
50 (100%)
139 (100%)
1,401 (100%)
^GPs were asked this once for the OG and pancreatic scores combined, rather than for the OG score and pancreatic score separately. *statistically significant difference in proportions for RAT compared with QCancer (two-sample test of proportions p<0.05) **statistically significant differences in proportions between the colorectal, ovarian and OG/pancreatic tools compared with the lung tool (two-sample test of proportions p<0.05)

111
Table 16: Number (%) of times action was taken for all patients that the symptom checker was completed to the Experience tab for during the study period
Action
Number (%) of times each action was taken after completing the tool
Colorectal Lung Ovarian OG/Pancreatic* Any tool
RAT allocation Admitted 4
(2%) 2
(1%) 0
(0%) 0
(0%) 6
(1%) Referred 66
(27%) 28
(13%) 2
(11%) 19
(37%) 115
(22%) Investigation required
57 (23%)
74 (35%)
12 (63%)
17 (33%)
160 (30%)*
Other 24 (10%)
19 (9%)
0 (0%)
2 (4%)
45 (9%)
None 94 (38%)
91 (43%)
5 (26%)
13 (25%)
203 (38%)*
Total 245 (100%)
214 (100%)
19 (100%)
51 (100%)
529 (100%)
QCancer allocation Admitted 11
(3%) 2
(1%) 0
(0%) 1
(1%) 14
(2%) Referred 106
(25%) 33
(10%) 6
(19%) 27
(31%) 172
(20%) Investigation required
62 (15%)
77 (24%)
9 (29%)
11 (13%)
159 (18%)*
Other 27 (6%)
27 (8%)
1 (3%)
11 (13%)
66 (8%)
None 220 (52%)
188 (57%)
15 (48%)
38 (43%)
461 (53%)*
Total 426 (100%)
327 (100%)
31 (100%)
88 (100%)
872 (100%)
OVERALL (RAT+QCancer) Admitted 15
(2%)** 4
(1%)** 0
(0%) 1
(1%) 20
(1%) Referred 172
(26%)*** 61
(11%)*** 8
(16%) 46
(33%)*** 287
(20%) Investigation required
119 (18%)****
151 (28%)****
21 (42%)****
28 (20%)****
319 (23%)
Other 51 (8%)
46 (9%)
1 (2%)
13 (9%)
111 (8%)
None 314 (47%)*****
279 (52%)*****
20 (40%)
51 (37%)*****
664 (47%)
Total 671 (100%)
541 (100%)
50 (100%)
139 (100%)
1401 (100%)
*statistically significant difference in proportions for RAT compared with QCancer (two-sample test of proportions p<0.05) **statistically significant difference in proportions for the colorectal tool compared with the lung tool (two-sample test of proportions p<0.05) ***statistically significant difference in proportions for lung tool compared with the colorectal and OG/pancreatic tools (two-sample test of proportions p<0.05) ****statistically significant difference in proportions for the ovarian tool compared with the colorectal, lung and OG/pancreatic tools, and between the colorectal and lung tools (two-sample test of proportions p<0.05) *****statistically significant difference in proportions for OG/pancreatic compared with colorectal and with lung (two-sample test of proportions p<0.05)

112
Table 17: Whether the GP would have referred or investigated a patient if they had not used the symptom checker (number and % of times), for all patients that the symptom checker was completed to the Experience tab for during the study period
Would you have investigated or referred the case if you hadn’t used the tool?
Number (%) of times Colorectal Lung Ovarian OG/Pancreat
ic Any tool
RAT allocation Yes 104
(85%) 72
(71%) 11
(79%) 31
(86%) 218
(79%) No 19
(15%) 30
(29%) 3
(21%) 5
(14%) 57
(21%)
QCancer allocation Yes 153
(91%) 70
(64%) 13
(87%) 36
(95%) 272
(82%) No 15
(9%) 40
(36%) 2
(13%) 2
(5%) 59
(18%)
OVERALL (RAT+QCancer) Yes 257
(88%)* 142
(67%)* 24
(83%) 67
(91%)* 490
(81%) No 34
(12%)* 70
(33%)* 5
(17%) 7
(9%)* 116
(19%) NB There was not a statistically significant difference in proportions for RAT compared with QCancer (two-sample test of proportions p>0.05) *statistically significant differences in proportions between the lung tool compared with the colorectal and OG/pancreatic tools (two-sample test of proportions p<0.05).
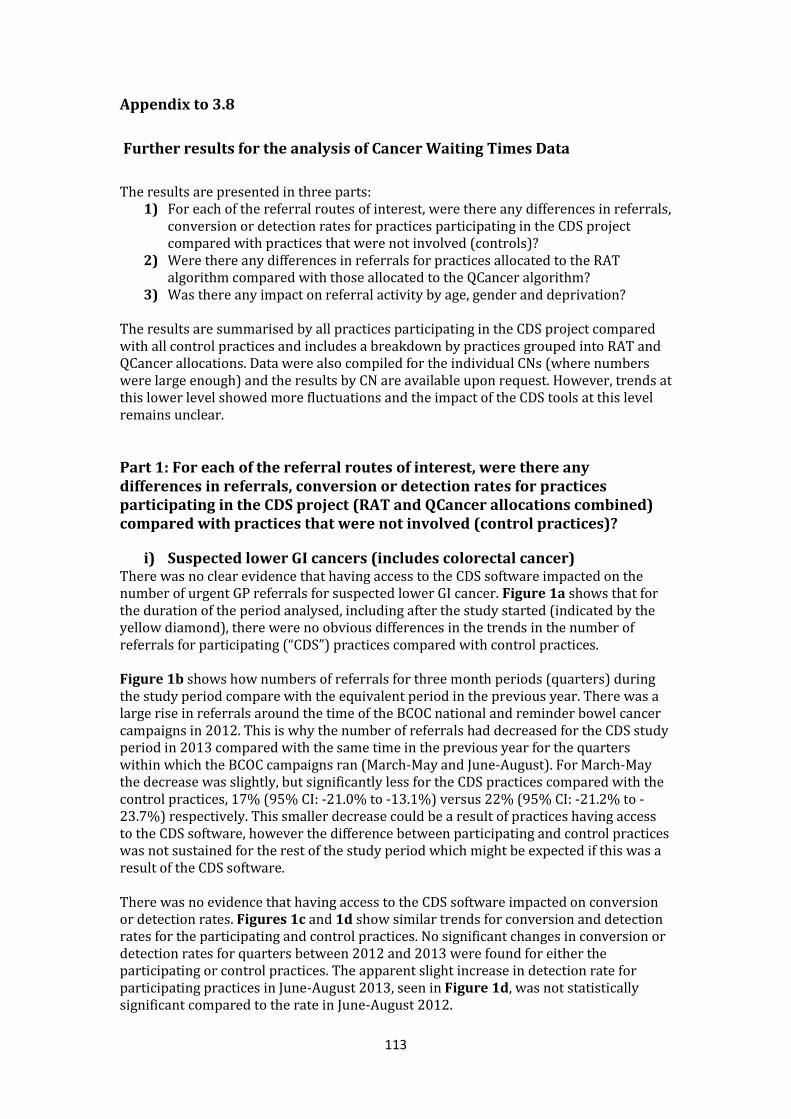
113
Appendix to 3.8
Further results for the analysis of Cancer Waiting Times Data
The results are presented in three parts: 1) For each of the referral routes of interest, were there any differences in referrals,
conversion or detection rates for practices participating in the CDS project compared with practices that were not involved (controls)?
2) Were there any differences in referrals for practices allocated to the RAT algorithm compared with those allocated to the QCancer algorithm?
3) Was there any impact on referral activity by age, gender and deprivation?
The results are summarised by all practices participating in the CDS project compared with all control practices and includes a breakdown by practices grouped into RAT and QCancer allocations. Data were also compiled for the individual CNs (where numbers were large enough) and the results by CN are available upon request. However, trends at this lower level showed more fluctuations and the impact of the CDS tools at this level remains unclear.
Part 1: For each of the referral routes of interest, were there any differences in referrals, conversion or detection rates for practices participating in the CDS project (RAT and QCancer allocations combined) compared with practices that were not involved (control practices)?
i) Suspected lower GI cancers (includes colorectal cancer) There was no clear evidence that having access to the CDS software impacted on the number of urgent GP referrals for suspected lower GI cancer. Figure 1a shows that for the duration of the period analysed, including after the study started (indicated by the yellow diamond), there were no obvious differences in the trends in the number of referrals for participating (“CDS”) practices compared with control practices. Figure 1b shows how numbers of referrals for three month periods (quarters) during the study period compare with the equivalent period in the previous year. There was a large rise in referrals around the time of the BCOC national and reminder bowel cancer campaigns in 2012. This is why the number of referrals had decreased for the CDS study period in 2013 compared with the same time in the previous year for the quarters within which the BCOC campaigns ran (March-May and June-August). For March-May the decrease was slightly, but significantly less for the CDS practices compared with the control practices, 17% (95% CI: -21.0% to -13.1%) versus 22% (95% CI: -21.2% to -23.7%) respectively. This smaller decrease could be a result of practices having access to the CDS software, however the difference between participating and control practices was not sustained for the rest of the study period which might be expected if this was a result of the CDS software. There was no evidence that having access to the CDS software impacted on conversion or detection rates. Figures 1c and 1d show similar trends for conversion and detection rates for the participating and control practices. No significant changes in conversion or detection rates for quarters between 2012 and 2013 were found for either the participating or control practices. The apparent slight increase in detection rate for participating practices in June-August 2013, seen in Figure 1d, was not statistically significant compared to the rate in June-August 2012.

114
Fig 1a: Number of suspected lower GI urgent cancer referrals between December 2010 and February 2014 by quarter (3 month period) for all practices participating in the CDS project and for all control practices.
NB The numbers of urgent GP referrals in CDS practices have been rescaled (by multiplying the actual number of referrals by seven) so that the number of referrals in CDS and control practices are on the same scale
Fig 1b: Percentage change for the number of suspected lower GI cancer urgent GP referrals compared with the same period in the previous year, for all practices participating in the CDS project and for control practices, for quarters (3 month periods) between December 2011 and February 2013 compared with quarters between December 2012 and February 2014.

115
Fig 1c: Conversion rates for suspected lower GI cancer urgent referrals between December 2010 and November 2013 by quarter (3 month period) for all practices participating in the CDS project and for all control practices.
Fig 1d: Detection rates of lower GI cancers diagnosed through the urgent GP referral route between December 2010 and February 2014 by quarter (3 month period) for all practices participating in the CDS project and for all control practices.
ii) Suspected lung cancer There was also no clear evidence that having access to the CDS software impacted on the number of urgent GP referrals for suspected lung cancer. Figure 2a shows that the trends were fairly similar for participating practices as for control practices for the whole period, including the CDS study period. Figure 2b suggests that, compared with the previous year, there was a greater increase in the number of referrals for the CDS practices for the first few months of the project (March-May) in comparison with the increase for the control practices. However, the difference was not statistically significant. Also, there was a larger percent change in referrals for the months prior to the study period (December-February) for the CDS practices compared with the control practices. Due to this increase it is difficult to solely attribute the difference for March-May to having the CDS software. There were no significant changes in the conversion or detection rates for the quarters during the study period compared with the previous year for either the participating or control practices. See Figures 2c and 2d for the trend over time in conversion and detection rates.

116
Fig 2a: Number of suspected lung cancer urgent referrals between December 2010 and February 2014 by quarter (3 month period) for all practices participating in the CDS project and for all control practices.
NB The numbers of urgent GP referrals in CDS practices have been rescaled (by multiplying the actual number of referrals by seven) so that the number of referrals in CDS and control practices are on the same scale
Fig 2b: Percentage change for the number of suspected lung cancer urgent GP referrals compared with the same period in the previous year, for all practices participating in the CDS project and for control practices, for quarters (3 month periods) between December 2011 and February 2013 compared with quarters between December 2012 and February 2014.

117
Fig 2c: Conversion rates for suspected lung cancer urgent referrals between December 2010 and November 2013 by quarter (3 month period) for all practices participating in the CDS project and for all control practices.
Fig 2d: Detection rates of lung cancers diagnosed through the urgent GP referral route between December 2010 and February 2014 by quarter (3 month period) for all practices participating in the CDS project and for all control practices.
iii) Suspected gynaecological cancers (includes ovarian cancer) Similarly, there is no clear indication that having access to the CDS software increased the number of suspected gynaecological cancer urgent GP referrals. Figure 3a shows similar trends between CDS practices and control practices before and after the CDS study started. Figure 3b shows no consistent differences in the percentage change for each quarter compared with the previous year between CDS and control practices. For March-May 2012 compared with March-May 2013, the increase for participating practices appears to be larger than the increase for control practices, but this was not statistically significant. Similar to the suspected lung cancer referrals, there was also a greater increase for participating practices for the quarter before the study start. There was a significant 2% decrease in conversion rate for participating practices for March-May 2013 compared with the same period in the previous year, whilst there was no change for control practices. However, Figure 3c shows that conversion rates for gynaecological cancer referrals have been fluctuating over time for the participating practices, so the small decrease for March-May may be in line with this natural fluctuation.

118
There were no significant changes in detection rates for gynaecological cancers diagnosed via the urgent GP referral route for the study period in comparison with the previous year for either the participating or control practices (see Figure 3d for trends in detection rates). Fig 3a: Number of suspected gynaecological cancer urgent referrals between December 2010 and February 2014 by quarter (3 month period) for all practices participating in the project and for all control practices.
NB The numbers of urgent GP referrals in CDS practices have been rescaled (by multiplying the actual number of referrals by seven) so that the number of referrals in CDS and control practices are on the same scale.
Fig 3b: Percentage change for the number of suspected gynaecological cancer urgent GP referrals compared with the same period in the previous year, for all practices participating in the CDS project and for control practices, for quarters (3 month periods) between December 2011 and February 2013 compared with quarters between December 2012 and February 2014.

119
Fig 3c: Conversion rates for suspected gynaecological cancer urgent referrals between December 2010 and November 2013 by quarter (3 month period) for all practices participating in the CDS project and for all control practices
Fig 3d: Detection rates of gynaecological cancers diagnosed through the urgent GP referral route between December 2010 and February 2014 by quarter (3 month period) for all practices participating in the CDS project and for all control practices.
iv) Suspected upper GI cancers (includes OG and pancreatic cancers) There is also no clear indication that having access to the CDS software impacted on the number of suspected upper GI cancer urgent GP referrals. Figure 3a shows that the trends in number of referrals were fairly similar between CDS practices and control practices over the time period analysed. Figure 3b shows no consistent differences in the percentage change for each quarter compared with the previous year between participating and control practices over the study period. For March-May 2012 compared with March-May 2013, the increase for participating practices appears to be greater than the increase for control practices, but this was not statistically significant. There were no significant changes in the conversion or detection rates over the study period compared with the previous year for either the participating or control practices (see Figures 4c and 4d for the trends in conversion and detection rates).
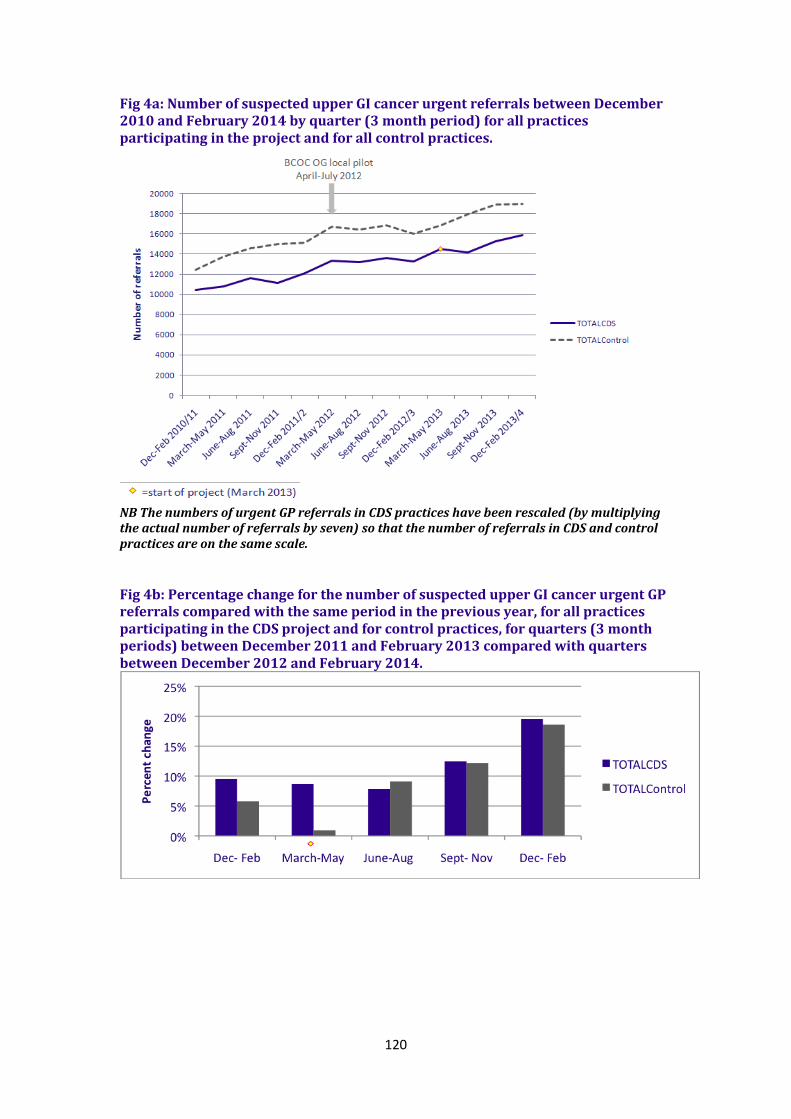
120
Fig 4a: Number of suspected upper GI cancer urgent referrals between December 2010 and February 2014 by quarter (3 month period) for all practices participating in the project and for all control practices.
NB The numbers of urgent GP referrals in CDS practices have been rescaled (by multiplying the actual number of referrals by seven) so that the number of referrals in CDS and control practices are on the same scale.
Fig 4b: Percentage change for the number of suspected upper GI cancer urgent GP referrals compared with the same period in the previous year, for all practices participating in the CDS project and for control practices, for quarters (3 month periods) between December 2011 and February 2013 compared with quarters between December 2012 and February 2014.
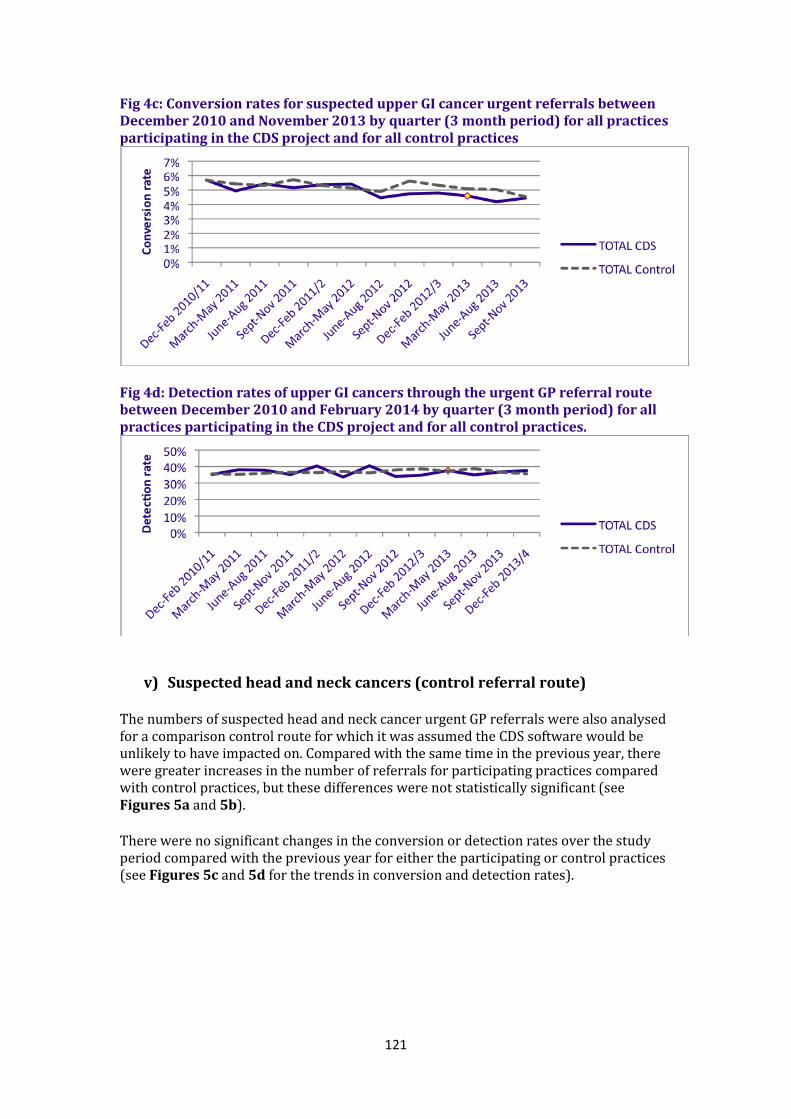
121
Fig 4c: Conversion rates for suspected upper GI cancer urgent referrals between December 2010 and November 2013 by quarter (3 month period) for all practices participating in the CDS project and for all control practices
Fig 4d: Detection rates of upper GI cancers through the urgent GP referral route between December 2010 and February 2014 by quarter (3 month period) for all practices participating in the CDS project and for all control practices.
v) Suspected head and neck cancers (control referral route)
The numbers of suspected head and neck cancer urgent GP referrals were also analysed for a comparison control route for which it was assumed the CDS software would be unlikely to have impacted on. Compared with the same time in the previous year, there were greater increases in the number of referrals for participating practices compared with control practices, but these differences were not statistically significant (see Figures 5a and 5b). There were no significant changes in the conversion or detection rates over the study period compared with the previous year for either the participating or control practices (see Figures 5c and 5d for the trends in conversion and detection rates).
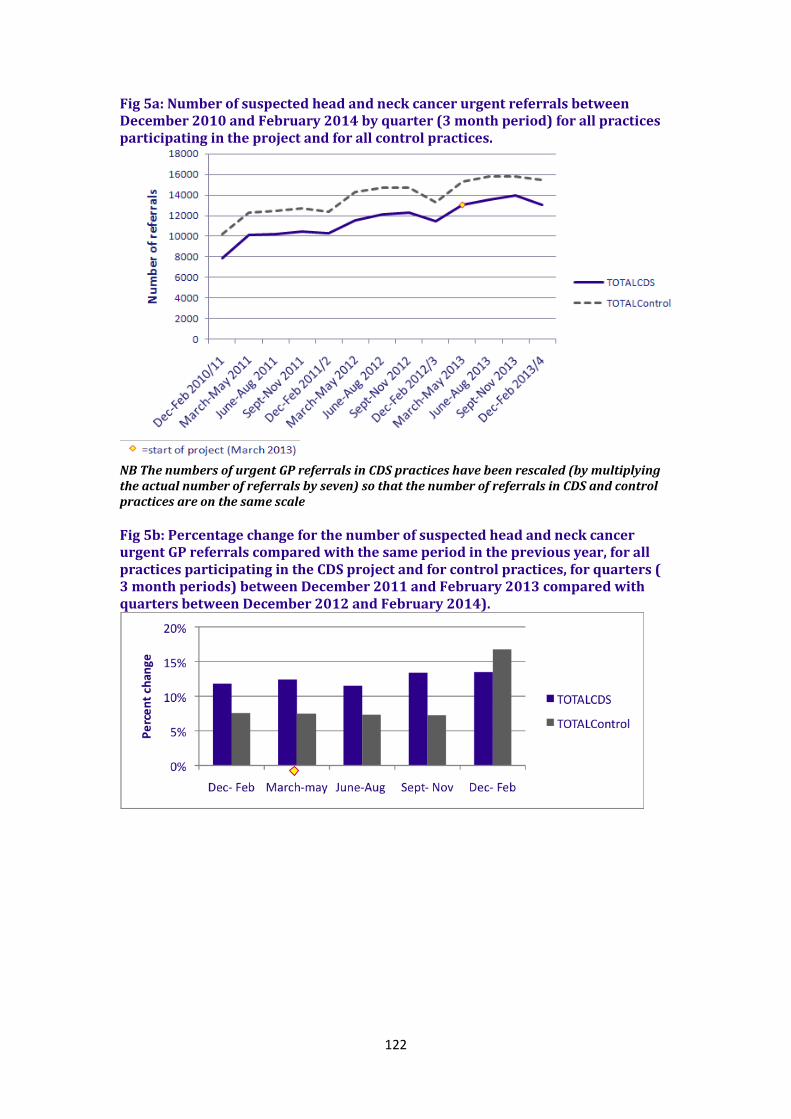
122
Fig 5a: Number of suspected head and neck cancer urgent referrals between December 2010 and February 2014 by quarter (3 month period) for all practices participating in the project and for all control practices.
NB The numbers of urgent GP referrals in CDS practices have been rescaled (by multiplying the actual number of referrals by seven) so that the number of referrals in CDS and control practices are on the same scale
Fig 5b: Percentage change for the number of suspected head and neck cancer urgent GP referrals compared with the same period in the previous year, for all practices participating in the CDS project and for control practices, for quarters ( 3 month periods) between December 2011 and February 2013 compared with quarters between December 2012 and February 2014).

123
Fig 5c: Conversion rates for suspected head and neck cancer urgent referrals between December 2010 and November 2013 by quarter (3 month period) for all practices participating in the CDS project and for all control practices
Fig 5d: Detection rates of head and neck cancers diagnosed through the urgent GP referral route between December 2010 and February 2014 by quarter (3 month period) for all practices participating in the CDS project and for all control practices.
Part 2: Were there any differences in referrals for all practices allocated to the RAT algorithm compared with the QCancer algorithm? The following figures 6 i)-v) show the percentage change in referrals compared with the same period the previous year for practices assigned to the RAT algorithm and the QCancer algorithm and their respective control practices. The changes for RAT and QCancer assigned practices should not be directly compared with each other without also considering the relative difference with their respective control practices. This is because of the potential regional variation in other awareness and early diagnosis activity. There were no consistent differences in the percent change between practices allocated to RAT and to QCancer for most of the referral routes over the study period. The change in referrals for suspected upper GI cancers appear larger for QCancer allocated practices than for RAT allocated practices during the study period. However, this difference was also apparent before the study started (December-February), and a similar pattern was seen for the control referral route (suspected head and neck cancers), so it is difficult to attribute the differences to the variation in impact of the different algorithms.
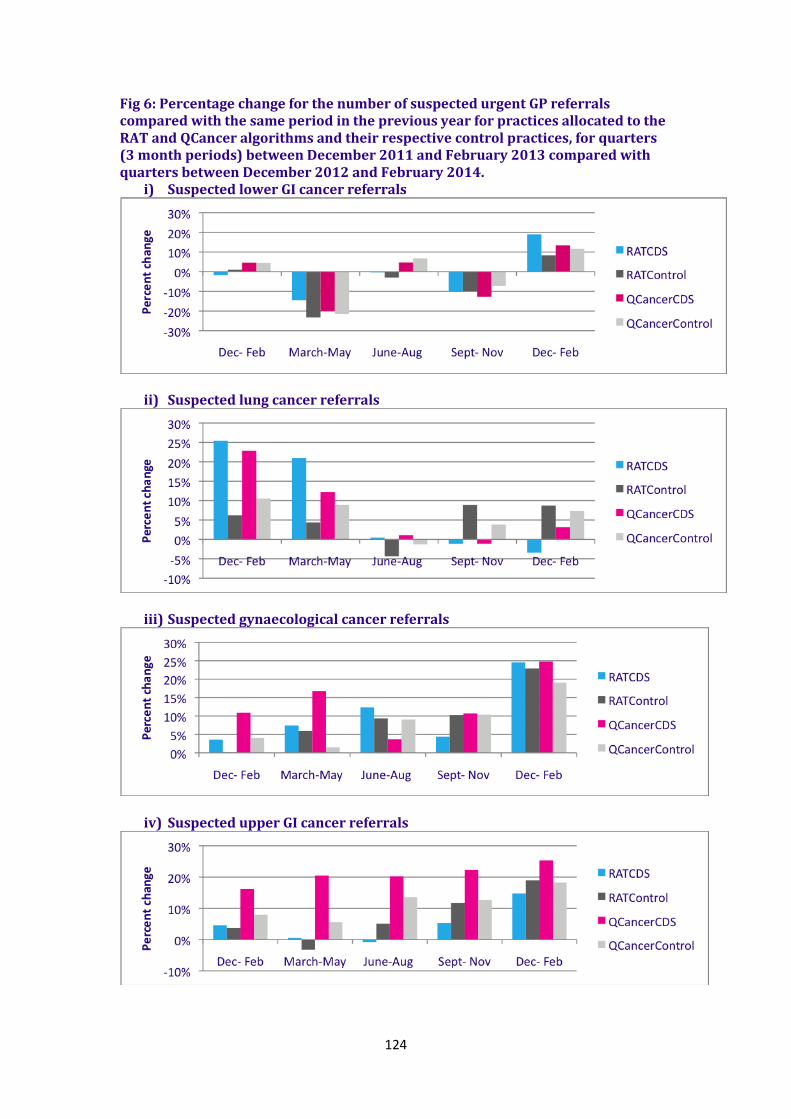
124
Fig 6: Percentage change for the number of suspected urgent GP referrals compared with the same period in the previous year for practices allocated to the RAT and QCancer algorithms and their respective control practices, for quarters (3 month periods) between December 2011 and February 2013 compared with quarters between December 2012 and February 2014.
i) Suspected lower GI cancer referrals
ii) Suspected lung cancer referrals
iii) Suspected gynaecological cancer referrals
iv) Suspected upper GI cancer referrals

125
v) Suspected head and neck cancer referrals (control route)
Part 3: Was there any impact on referral activity by age, gender and deprivation? There were no clear patterns to suggest that having access to the CDS tools impacted on the distribution of referrals across age bands, gender or levels of deprivation. See Figures 7 to 9 for graphs showing the trends in proportion of referrals by age, gender and deprivation. For referral activity by gender, for suspected lung cancers there was a slight increase in the proportion of referrals for females (and a corresponding decrease in the proportion for males) towards the end of the study period for participating practices which was not seen for control practices (see Figure 8 ii). It is difficult to interpret this as an impact of the CDS software because it occurred late on in the study period. It could be an impact of the BCOC campaign which, for some reason, impacted on participating practices more than control practices: there were increases in the proportion of female referrals following the BCOC campaign in 2012 and in 2013 for participating practices. Fig 7: BY AGE. The proportion of urgent GP referrals by age group for quarters (3 month periods) between December 2010 and February 2014, for all participating practices (solid lines), and for control practices (dashed lines).
i) Suspected lower GI cancer referrals

126
ii) Suspected lung cancer referrals
iii) Suspected gynaecological cancer referrals
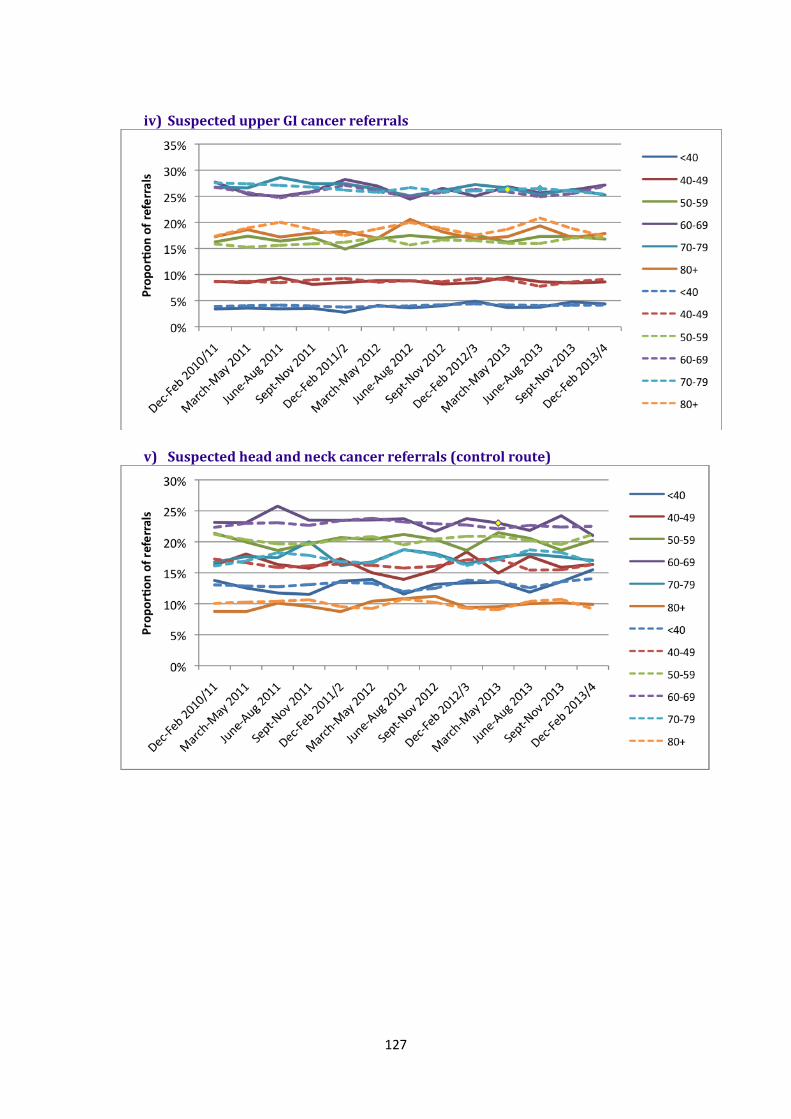
127
iv) Suspected upper GI cancer referrals
v) Suspected head and neck cancer referrals (control route)

128
Fig 8: REFERRALS BY GENDER. The proportion of urgent GP referrals by gender for quarters (3 month periods) between December 2010 and February 2014, for all participating practices (solid lines), and for control practices (dashed lines).
i) Suspected lower GI cancer referrals
ii) Suspected lung cancer referrals
iii) Suspected gynaecological cancer referrals Not applicable iv) Suspected upper GI cancer referrals

129
v) Suspected head and neck cancer referrals (control route)
Fig 9: REFERRALS BY DEPRIVTAITON. The proportion of urgent GP referrals by deprivation quintiles for quarters (3 month periods) between December 2010 and February 2014, for all participating practices (solid lines), and for control practices (dashed lines).
i) Suspected lower GI cancer referrals
ii) Suspected lung cancer referrals

130
iii) Suspected gynaecological cancer referrals
iv) Suspected upper GI cancer referrals
v) Suspected head and neck cancer referrals (control route)
Data tables for this analysis are available upon request.

131
-END-
Related Documents