February 1 2007, Volume 53, Issue 2 , pp. 159-374 Editorials: Lone Schejbel and Peter Garred Primary Immunodeficiency: Complex Genetic Disorders? Clin Chem 2007 53: 159-160. Jan T. Kielstein and John P. Cooke Should We Measure Asymmetric Dimethylarginine in Patients with Coronary Artery Disease? Clin Chem 2007 53: 161-163. Reviews: Mariska Leeflang, Johannes Reitsma, Rob Scholten, Anne Rutjes, Marcello Di Nisio, Jon Deeks, and Patrick Bossuyt Impact of Adjustment for Quality on Results of Metaanalyses of Diagnostic Accuracy Clin Chem 2007 53: 164-172. Published online December 21, 2006; 10.1373/clinchem.2006.076398 Molecular Diagnostics and Genetics: Sherry Sze Yee Ho, Samuel S. Chong, Evelyn S.C. Koay, Yiong Huak Chan, Ponnusamy Sukumar, Lily-Lily Chiu, Wen Wang, Ashim Roy, Mary Rauff, Lin Lin Su, Arijit Biswas, and Mahesh Choolani Microsatellite Markers within —SEA Breakpoints for Prenatal Diagnosis of HbBarts Hydrops Fetalis Clin Chem 2007 53: 173-179. Published online December 7, 2006; 10.1373/clinchem.2006.075085

Welcome message from author
This document is posted to help you gain knowledge. Please leave a comment to let me know what you think about it! Share it to your friends and learn new things together.
Transcript
February 1 2007, Volume 53, Issue 2 , pp. 159-374
Editorials: Lone Schejbel and Peter Garred
Primary Immunodeficiency: Complex Genetic Disorders? Clin Chem 2007 53: 159-160.
Jan T. Kielstein and John P. Cooke Should We Measure Asymmetric Dimethylarginine in Patients with Coronary Artery Disease? Clin Chem 2007 53: 161-163.
Reviews: Mariska Leeflang, Johannes Reitsma, Rob Scholten, Anne Rutjes, Marcello Di Nisio, Jon Deeks, and Patrick Bossuyt
Impact of Adjustment for Quality on Results of Metaanalyses of Diagnostic Accuracy Clin Chem 2007 53: 164-172. Published online December 21, 2006; 10.1373/clinchem.2006.076398
Molecular Diagnostics and Genetics: Sherry Sze Yee Ho, Samuel S. Chong, Evelyn S.C. Koay, Yiong Huak Chan, Ponnusamy Sukumar, Lily-Lily Chiu, Wen Wang, Ashim Roy, Mary Rauff, Lin Lin Su, Arijit Biswas, and Mahesh Choolani
Microsatellite Markers within —SEA Breakpoints for Prenatal Diagnosis of HbBarts Hydrops Fetalis Clin Chem 2007 53: 173-179. Published online December 7, 2006; 10.1373/clinchem.2006.075085
Suzan Wopereis, Stephanie Grünewald, Karin M.L.C. Huijben, Éva Morava, Rosella Mollicone, Baziel G.M. van Engelen, Dirk J. Lefeber, and Ron A. Wevers
Transferrin and Apolipoprotein C-III Isofocusing Are Complementary in the Diagnosis of N- and O-Glycan Biosynthesis Defects Clin Chem 2007 53: 180-187. Published online December 14, 2006; 10.1373/clinchem.2006.073940
Quanjun Liu, Yunfei Bai, Qinyu Ge, Shixin Zhou, Tian Wen, and Zuhong Lu Microarray-in-a-Tube for Detection of Multiple Viruses Clin Chem 2007 53: 188-194. Published online December 7, 2006; 10.1373/clinchem.2006.071720
Yun Jiang, Thomas A. Hall, Steven A. Hofstadler, and Robert K. Naviaux Mitochondrial DNA Mutation Detection by Electrospray Mass Spectrometry Clin Chem 2007 53: 195-203. Published online December 7, 2006; 10.1373/clinchem.2006.074823
Femke Van Bockstaele, Valerie Pede, Ann Janssens, Filip Callewaert, Fritz Offner, Bruno Verhasselt, and Jan Philippé
Lipoprotein Lipase mRNA Expression in Whole Blood Is a Prognostic Marker in B Cell Chronic Lymphocytic Leukemia Clin Chem 2007 53: 204-212. Published online December 7, 2006; 10.1373/clinchem.2006.076331
Evidence-Based Laboratory Medicine and Test Utilization: Marten J. Poley, Kyra I. Edelenbos, Mees Mosseveld, Marc A.M. van Wijk, Dinny H. de Bakker, Johan van der Lei, and Maureen P.M.H. Rutten-van Mölken
Cost Consequences of Implementing an Electronic Decision Support System for Ordering Laboratory Tests in Primary Care: Evidence from a Controlled Prospective Study in The Netherlands Clin Chem 2007 53: 213-219. Published online December 21, 2006; 10.1373/clinchem.2006.073908
Peter A. Kavsak, Alice M. Newman, Viliam Lustig, Andrew R. MacRae, Glenn E. Palomaki, Dennis T. Ko, Jack V. Tu, and Allan S. Jaffe
Long-Term Health Outcomes Associated with Detectable Troponin I Concentrations Clin Chem 2007 53: 220-227. Published online January 4, 2007; 10.1373/clinchem.2006.076885
Hemostasis and Thrombosis: Mark W. Gorman, Eric O. Feigl, and Charles W. Buffington
Human Plasma ATP Concentration Clin Chem 2007 53: 318-325. Published online December 21, 2006; 10.1373/clinchem.2006.076364
Proteomics and Protein Markers: Laura Sabatini, Michela Torricelli, Valentina Scaccia, Daniela Fineschi, Monica Pescaglini, Laura Gasparri, Pasquale Florio, and Felice Petraglia
Increased Plasma Concentrations of Antiprothrombin Antibodies in Women with Recurrent Spontaneous Abortions Clin Chem 2007 53: 228-232. Published online December 7, 2006; 10.1373/clinchem.2006.073098
Cancer Diagnostics: Thomas Steuber, Andrew J. Vickers, Angel M. Serio, Ville Vaisanen, Alexander Haese, Kim Pettersson, James A. Eastham, Peter T. Scardino, Hartwig Huland, and Hans Lilja
Comparison of Free and Total Forms of Serum Human Kallikrein 2 and Prostate-Specific Antigen for Prediction of Locally Advanced and Recurrent Prostate Cancer Clin Chem 2007 53: 233-240. Published online December 21, 2006; 10.1373/clinchem.2006.074963
William C.S. Cho, Timothy T.C. Yip, Roger K.C. Ngan, Tai-Tung Yip, Vladimir N. Podust, Christine Yip, Harry H.Y. Yiu, Victor Yip, Wai-Wai Cheng, Victor W.S. Ma, and Stephen C.K. Law
ProteinChip Array Profiling for Identification of Disease- and Chemotherapy-Associated Biomarkers of Nasopharyngeal Carcinoma Clin Chem 2007 53: 241-250. Published online January 2, 2007; 10.1373/clinchem.2005.065805
Lipids, Lipoproteins, and Cardiovascular Risk Factors: Debajit Sircar and Papasani V. Subbaiah
Isoprostane Measurement in Plasma and Urine by Liquid Chromatography–Mass Spectrometry with One-Step Sample Preparation Clin Chem 2007 53: 251-258. Published online January 2, 2007; 10.1373/clinchem.2006.074989
Hematology: Patricia Álvarez, Pilar Sáenz, David Arteta, Antonio Martínez, Miguel Pocoví, Laureano Simón, and Pilar Giraldo
Transcriptional Profiling of Hematologic Malignancies with a Low-Density DNA Microarray Clin Chem 2007 53: 259-267. Published online December 21, 2006; 10.1373/clinchem.2006.075887
Endocrinology and Metabolism: Jacques J. Willemsen, H. Alec Ross, Jacques W.M. Lenders, and Fred C.G.J. Sweep
Stability of Urinary Fractionated Metanephrines and Catecholamines during Collection, Shipment, and Storage of Samples Clin Chem 2007 53: 268-272. Published online December 7, 2006; 10.1373/clinchem.2006.075218
Andreas Meinitzer, Ursula Seelhorst, Britta Wellnitz, Gabriele Halwachs-Baumann, Bernhard O. Boehm, Bernhard R. Winkelmann, and Winfried März
Asymmetrical Dimethylarginine Independently Predicts Total and Cardiovascular Mortality in Individuals with Angiographic Coronary Artery Disease (The Ludwigshafen Risk and Cardiovascular Health Study) Clin Chem 2007 53: 273-283. Published online December 21, 2006; 10.1373/clinchem.2006.076711
Tibor Kempf, Rüdiger Horn-Wichmann, Georg Brabant, Timo Peter, Tim Allhoff, Gunnar Klein, Helmut Drexler, Nina Johnston, Lars Wallentin, and Kai C. Wollert
Circulating Concentrations of Growth-Differentiation Factor 15 in Apparently Healthy Elderly Individuals and Patients with Chronic Heart Failure as Assessed by a New Immunoradiometric Sandwich Assay Clin Chem 2007 53: 284-291. Published online December 21, 2006; 10.1373/clinchem.2006.076828
Automation and Analytical Techniques: Mireia Urpi-Sarda, Raul Zamora-Ros, Rosa Lamuela-Raventos, Antonio Cherubini, Olga Jauregui, Rafael de la Torre, Maria Isabel Covas, Ramon Estruch, Walter Jaeger, and Cristina Andres-Lacueva
HPLC–Tandem Mass Spectrometric Method to Characterize Resveratrol Metabolism in Humans Clin Chem 2007 53: 292-299. Published online December 14, 2006; 10.1373/clinchem.2006.071936
Elisabeth Leere Øiestad, Unni Johansen, and Asbjorg Solberg Christophersen Drug Screening of Preserved Oral Fluid by Liquid Chromatography–Tandem Mass Spectrometry Clin Chem 2007 53: 300-309. Published online December 7, 2006; 10.1373/clinchem.2006.074237
Richard W. Browne, Stephen T. Koury, Susan Marion, Gregory Wilding, Paola Muti, and Maurizio Trevisan
Accuracy and Biological Variation of Human Serum Paraoxonase 1 Activity and Polymorphism (Q192R) by Kinetic Enzyme Assay Clin Chem 2007 53: 310-317. Published online December 21, 2006; 10.1373/clinchem.2006.074559

General Clinical Chemistry: Rima Obeid, Panagiotis Kostopoulos, Jean-Pierre Knapp, Mariz Kasoha, George Becker, Klaus Fassbender, and Wolfgang Herrmann
Biomarkers of Folate and Vitamin B12 Are Related in Blood and Cerebrospinal Fluid Clin Chem 2007 53: 326-333. Published online January 2, 2007; 10.1373/clinchem.2006.076448
Clinical Immunology: Alexander Buhl, Jochen H. Metzger, Niels H. H. Heegaard, Philipp von Landenberg, Martin Fleck, and Peter B. Luppa
Novel Biosensor–Based Analytic Device for the Detection of Anti–Double-Stranded DNA Antibodies Clin Chem 2007 53: 334-341. Published online December 21, 2006; 10.1373/clinchem.2006.077339
Other Areas of Clinical Chemistry: Gerd Rundström, Ann Jonsson, Ola Mårtensson, Ib Mendel-Hartvig, and Per Venge
Lateral Flow Immunoassay Using Europium (III) Chelate Microparticles and Time-Resolved Fluorescence for Eosinophils and Neutrophils in Whole Blood Clin Chem 2007 53: 342-348. Published online December 21, 2006; 10.1373/clinchem.2006.074021
Technical Briefs: Marina L. Kennerson, Trent Warburton, Eva Nelis, Megan Brewer, Patsie Polly, Peter De Jonghe, Vincent Timmerman, and Garth A. Nicholson
Mutation Scanning the GJB1 Gene with High-Resolution Melting Analysis: Implications for Mutation Scanning of Genes for Charcot-Marie-Tooth Disease Clin Chem 2007 53: 349-352. Published online January 2, 2007; 10.1373/clinchem.2006.080010
Jacques W.M. Lenders, Jacques J. Willemsen, Graeme Eisenhofer, H. Alec Ross, Karel Pacak, Henri J.L.M. Timmers, and C.G.J. (Fred) Sweep
Is Supine Rest Necessary before Blood Sampling for Plasma Metanephrines? Clin Chem 2007 53: 352-354. Published online January 2, 2007; 10.1373/clinchem.2006.076489
Letters to the Editor: Esther Jensen, Ole Blaabjerg, Per Hyltoft Petersen, and Laszlo Hegedüs
Sampling Time Is Important but May Be Overlooked in Establishment and Use of Thyroid-Stimulating Hormone Reference Intervals Clin Chem 2007 53: 355-356.
Mayumi Saeki, Yoshiro Saito, Kimie Sai, Keiko Maekawa, Nahoko Kaniwa, Jun-ichi Sawada, Manabu Kawamoto, Akira Saito, and Naoyuki Kamatani
A Combinatorial Haplotype of the UDP-Glucuronosyltransferase 1A1 Gene (#60-#IB) Increases Total Bilirubin Concentrations in Japanese Volunteers Clin Chem 2007 53: 356-358.
Nicole Reisch, Martin Reincke, and Martin Bidlingmaier Preanalytical Stability of Adrenocorticotropic Hormone Depends on Time to Centrifugation Rather than Temperature Clin Chem 2007 53: 358-359.
Lorin M. Henrich, David E. Bruns, Doris M. Haverstick, Victoria G. Reynolds, and James C. Boyd
Indican Interference in Bilirubin Assays: A Classical Solution Still Applies Clin Chem 2007 53: 359-361.
Tom Teerlink and Peter G. Scheffer LDL Particles Are Nonspherical: Consequences for Size Determination and Phenotypic Classification Clin Chem 2007 53: 361-362.
Edmond S.K. Ma and Ernest T.K. Lee A Case of IgM Paraproteinemia in Which Serum Free Light Chain Values Were Within Reference Intervals Clin Chem 2007 53: 362-363.
Fidaa Ibrahim, Christine Parmentier, and Philippe Boudou Divergence in Classification of 25-Hydroxyvitamin D Status with Respect to Immunoassays Clin Chem 2007 53: 363-364.
Johannes M.W. van den Ouweland and Stephan Church High Total Protein Impairs Appropriate Gel Barrier Formation in BD Vacutainer Blood Collection Tubes Clin Chem 2007 53: 364-365.
Terho Lehtimäki, Antti Hervonen, Riikka Rontu, Pekka Karhunen, Marja Jylhä, and Mikko Hurme
Survival Related to Plasma C-Reactive-Protein in Nonagenarians Is Modified by Apolipoprotein E Genotype Clin Chem 2007 53: 365-367.
Ralph Carmel Haptocorrin (Transcobalamin I) and Cobalamin Deficiencies Clin Chem 2007 53: 367-368.
Anne L. Morkbak and Ebba Nexø The authors of the article cited above respond: Clin Chem 2007 53: 368-369.
Veronique Stove, Birgitte Wuyts, and Joris Delanghe Perchloric Acid Treatment To Stabilize Uric Acid Concentrations in Blood Samples of Patients Receiving Uric Acid Oxidase (Rasburicase) Therapy Clin Chem 2007 53: 369-370.
Laura J. Owen and Brian G. Keevil Does Bilirubin Cause Interference in Roche Creatinine Methods? Clin Chem 2007 53: 370-371.
Book, Software, and Web Site Reviews: Dede Haverstick
Pharmaceutical Toxicology. Gerald J. Mulder, Lennart Dencker, eds. London: Pharmaceutical Press, 2006, 280 pp., $49.95, paperback. ISBN 0-85369-593-8. Clin Chem 2007 53: 372.
Obituary: Steven H. Wong, Jonathan Sunshine, and Bradford R. Hepler
In Memoriam: Irving Sunshine, PhD DABFT, DABCC (1910–2006) Clin Chem 2007 53: 373-374.
Primary Immunodeficiency: Complex Genetic Disorders?
Classical primary immunodeficiencies (PIDs) are usu-ally monogenic (Mendelian) disorders affecting hostdefenses. More than 200 clinical phenotypes of PIDhave been described, and about 100 of them nowhave a well-defined molecular genetic basis (1 ). Theclassical example is X-linked agammaglobulinemia,in which disease-causing variants in the gene (BTK,Bruton agammaglobulinemia tyrosine kinase) codingfor Bruton’s tyrosine kinase lead to arrest of B-celldevelopment at the pre–B-cell stage (2 ). Identifica-tion and characterization of such monogenic diseasesare not only helpful for diagnosis and genetic coun-seling but will be valuable in development of mecha-nism-based therapies or gene therapy. Gene therapyhas been used to insert a functional gene in hemato-poietic stem cells in children with severe combinedimmunodeficiency, and it is hoped that this procedurewill supplement or even replace allogeneic bone mar-row transplantations as a treatment option in manydiseases in the future. Typically PIDs are rare, life-threatening recessive disorders of leukocytes. PIDs areassociated with recurrent infections that often appear inearly childhood and are caused by weakly virulentmicroorganisms.
In daily clinical practice we encounter a large groupof children with clinical manifestations of immuno-deficiency but without obvious molecular explana-tions or with only discrete paraclinical findings.Obviously, more and more single-gene diseases willbe discovered, but it has also become evident thatcommon variations in certain genes important forimmune defense may be associated with an increasedtendency to infection. The non-Mendelian inheritancepatterns of these conditions indicate that they arepart of a complex network of components, whichbecome clinically relevant only when two or more arepresent at the same time. One such component is adefect in mannose-binding lectin MBL. MBL is a liver-derived complement-activating opsonin that recog-nizes repetitive sugar structures present on a varietyof microorganisms. The MBL gene [MBL2, mannose-binding lectin (protein C) 2, soluble (opsonic defect)]harbors several common polymorphisms that affectthe concentration or function of the protein (3 ).Many studies have shown that MBL2 variants maybe weakly associated with increased risk of infec-tions.
Many immunodeficient children who do not have asingle-gene defect probably suffer from a complexdisease with a combination of two or more partialimmunodeficiencies. Indeed, this theory was stronglysupported by the study by Bossuyt et al. (4 ) in the
January issue of Clinical Chemistry. In that study, 55children with recurrent infections were evaluated forseveral factors of the immune system: IgG, IgA, IgM,and IgG subclass concentrations; MBL2 genotype;IgG2 subclass allotype (GM); partial C4 and C2 defi-ciency; FCGR2A [Fc fragment of IgG, low affinity IIa,receptor (CD32)] polymorphism; and the specificantibody response to the pneumococcal vaccine Pneu-movax. Deficiency of any one of these factors hasbeen described or suggested to increase susceptibilityto infection. A substantial fraction of healthy people,however, have a single partial immunodeficiencywithout any clinical symptoms of immunodeficiency.In the study by Bossuyt et al. (4 ), the most strikingresult was that the coexistence of two or more par-tial immunodeficiencies was significantly higher inthe patient group than among healthy controls, sug-gesting that the combination of partial deficiencies is astrong trigger of the clinical manifestations of immuno-deficiency.
Even in patients who have an immunodeficiencythat is, by itself, adequate to trigger disease, the co-existence of a partial immunodeficiency in anotherpathway of defense may worsen the clinical manifesta-tions of the disease. Indeed, among common variableimmunodeficiency patients, who by definition have amarked decrease (at least 2 SD below the mean for age)in one of the major isotypes (IgM, IgG, or IgA), thefraction of severe respiratory tract infections beforeimmunoglobulin substitution is higher among patientswith MBL2 deficiency (5 ).
For evaluation of immunodeficient patients, the sin-gle-gene or single-pathway approach is still applicablefor immunodeficient patients with a familial history ofimmunodeficiency and/or susceptibility to atypical in-fections as demonstrated recently by Picard et al. inpatients with mycobacterial disease (6 ), and we willundoubtedly learn more about the host defense sys-tem from these patients in the future. Yet the studyof Bossuyt et al. shows that by focusing on partialdeficiencies in different pathways of the host defense,we may be able to identify patients with combinationalimmunodeficiency and eventually keep them free ofsymptoms with medical correction of one of the partialdeficiencies.
References
1. Fleisher TA. Back to basics: primary immune deficiencies: windows into theimmune system. Pediatr Rev 2006;27:363–72.
2. Conley ME, Broides A, Hernandez-Trujillo V, Howard V, Kanegane H, MiyawakiT, et al. Genetic analysis of patients with defects in early B-cell development.Immunol Rev 2005;203:216–34.
3. Garred P, Larsen F, Seyfarth J, Fujita R, Madsen HO. Mannose-binding lectinand its genetic variants. Genes Immun 2006;7:85–94.
Editorial
Clinical Chemistry 53, No. 2, 2007 159
4. Bossuyt X, Moens L, Van Hoeyveld E, Jeurissen A, Bogaert G, Sauer K, et al.Coexistence of (Partial) Immune Defects and Risk of Recurrent RespiratoryInfections. Clin Chem 2007;53;124–30.
5. Andersen P, Permin H, Andersen V, Schejbel L, Garred P, Svejgaard A,et al. Deficiency of somatic hypermutation of the antibody light chainis associated with increased frequency of severe respiratory tractinfection in common variable immunodeficiency. Blood 2005;105:511–7.
6. Picard C, Casanova JL, Abel L. Mendelian traits that confer predisposition orresistance to specific infections in humans. Curr Opin Immunol 2006;18:383–90.
Lone Schejbel*
Peter Garred
Tissue Typing LaboratoryDepartment of Clinical Immunology
RigshospitaletUniversity of Copenhagen
Copenhagen, Denmark
* Address correspondence to this author at: Tissue TypingLaboratory–7631, Department of Clinical Immunology, Rigs-hospitalet, University of Copenhagen, Blegdamsvej 9, 2100Copenhagen Ø, Denmark. E-mail: [email protected].
DOI: 10.1373/clinchem.2006.081224
160 Schejbel and Garred: Primary Immunodeficiency: Complex Genetic Disorders?
Should We Measure Asymmetric Dimethylarginine in Patients withCoronary Artery Disease?
In this issue of Clinical Chemistry, Meinitzer et al. (1 )present data from The Ludwigshafen Risk and Cardiovas-cular Health Study in which they assess asymmetricdimethylarginine (ADMA) as a cardiovascular biomarkerin 3238 patients. Coronary angiography identified 2543patients with coronary artery disease as well as 695persons without significant disease. Study participantswere followed for more than 5 years. The major finding ofthe study was that plasma ADMA was an independentpredictor of total and cardiovascular mortality.
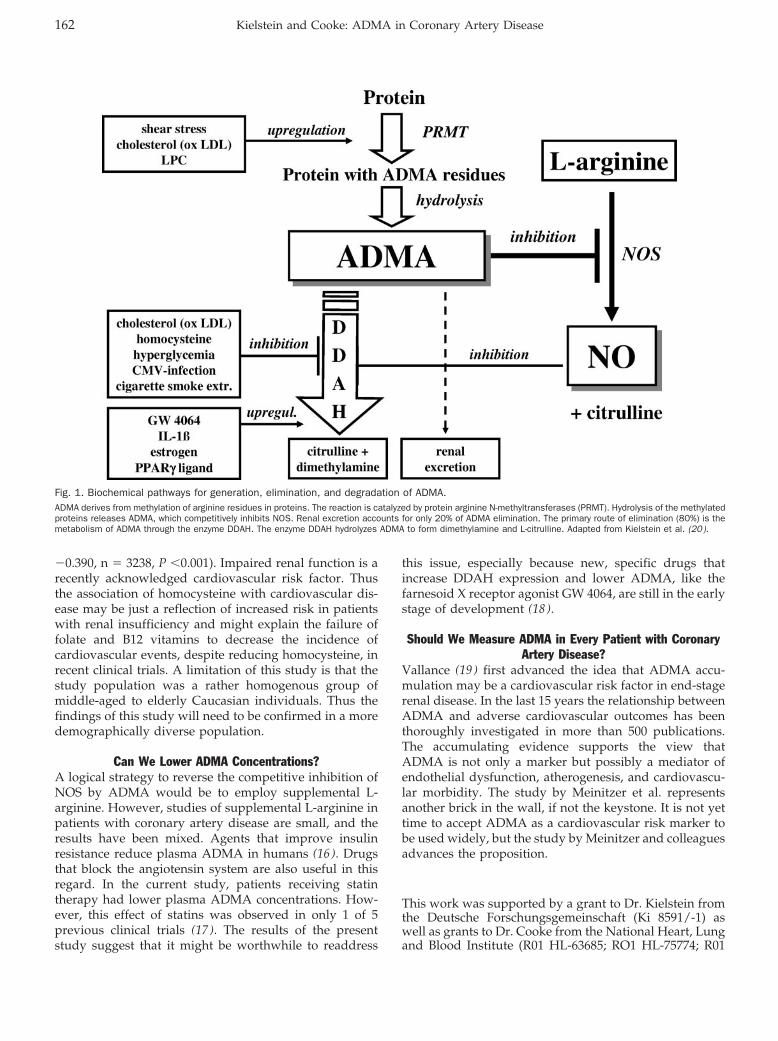
What Is ADMA?ADMA is a naturally occurring amino acid that has theinteresting property of competitively inhibiting the activ-ity of nitric oxide synthase (NOS). ADMA is produced bymethylation of arginine residues in intracellular proteinsvia protein arginine N-methyltransferases (PRMT). Whenthese proteins are hydrolyzed, ADMA is released. ADMAis excreted in the urine, and, not surprisingly, plasmaADMA is increased in patients with end-stage renaldisease (2 ). Parenthetically, patients with renal diseasehave an increased risk of cardiovascular morbidity andmortality, and in these patients plasma ADMA concentra-tions carry prognostic information (3 ). The primary routeof ADMA clearance, however, is by enzymatic degrada-tion (Fig. 1). Dimethylamine dimethylaminohydrolase(DDAH) converts ADMA to citrulline and dimethyl-amine. By regulating plasma and tissue concentrations ofADMA, DDAH protects NOS activity. Compelling evi-dence for the critical role of DDAH as an NOS regulatorwas demonstrated by studies of the transgenic DDAHmouse. These animals manifest increased DDAH activity,decreased plasma ADMA concentrations, increased plasmaand urinary nitrogen oxides, and decreased vascular resis-tance, presumably attributable to increased NO (4).
Why Is ADMA important?ADMA is an endogenous inhibitor of NO synthesis. In theblood vessel, NO relaxes vascular smooth muscle toincrease blood flow and suppresses processes involved invascular disease, including leukocyte adhesion, plateletaggregation, and vascular smooth muscle cell prolifera-tion (5 ). NO is important in vascular regeneration, medi-ating angiogenesis (6 ) and the number of circulatingendothelial progenitor cells. Therefore it seems logicalthat the endogenous NOS inhibitor ADMA would beassociated with vascular disease.
An increase in circulating ADMA is often observed inpatients with hypercholesterolemia, insulin resistance,diabetes mellitus, hypertension, and chronic renal disease(5, 7). These conditions are associated with vascular oxi-dative stress, which is known to impair DDAH activity(8 ). In humans, administration of ADMA causes an in-
crease in vascular resistance (9 ), a reduction in vascularcompliance, an attenuation of cerebral blood flow (10 ), anincrease in sodium retention, and a decrease in cardiacoutput (9 ). Furthermore, in humans, plasma ADMA cor-relates with abnormal thickening of the carotid artery(11 ). These abnormal changes in vascular function andstructure are harbingers of adverse cardiovascular events,as suggested by studies relating plasma ADMA to mor-tality in selected patient populations (3, 12).
Smaller previous studies in very selected patient pop-ulations had already suggested a role of ADMA in coro-nary artery disease. In a case-control study, nonsmokingmiddle-aged men in the highest quartile for ADMA(�0.62 �mol/L) had a 4-fold increased risk of acutecoronary events (12 ). Lenzen et al. (13 ) found that anincrease in the ADMA plasma concentration of 1 �mol/Lincreased risk of coronary heart disease 2.35-fold, a find-ing that was confirmed by Schnabel et al. (14 ), whostudied 1874 patients with coronary artery disease. Pa-tients with ADMA concentrations in the highest tertile atentry had a hazard ratio 2.5-fold higher than those in thelowest third. In a study of patients with unstable anginaundergoing percutaneous coronary intervention (15 ),those in whom the serum concentration of ADMA waspersistently increased 6 weeks after the intervention hadhigher cardiovascular event rates.
The study by Meinitzer et al. (1 ) extends the previousstudies. The size of the study is impressive: 3238 patientsunderwent coronary angiography and were followed formore than 5 years, with no patients lost to follow-up.Because there were few exclusion criteria, the findings arerelevant to the typical population of a cardiovascularpractice. Plasma ADMA concentrations correlated withage, female sex, diabetes mellitus, current smoking, andC-reactive protein. Most importantly, ADMA predictedfuture cardiovascular events in patients with coronaryartery disease. The predictive power of ADMA wasindependent of traditional cardiovascular risk factors, andpatients in the highest quartile of plasma ADMA concen-trations were at twice the risk of total and cardiovascularmortality.
Some other findings were notable in the current study.Although the relationship between ADMA and severalcardiovascular risk factors (age, hyperlipidemia, diabetesmellitus, and menopause) was confirmed in this study,the authors found no correlation between ADMA andhypertension. This relationship has also been elusive inprevious studies, possibly because blood pressure ismaintained by many mechanisms. Smokers had higherADMA concentrations than nonsmokers. Another inter-esting result was the confirmation of the associationbetween homocysteine and glomerular filtration rate (r �
Editorial
Clinical Chemistry 53, No. 2, 2007 161
�0.390, n � 3238, P �0.001). Impaired renal function is arecently acknowledged cardiovascular risk factor. Thusthe association of homocysteine with cardiovascular dis-ease may be just a reflection of increased risk in patientswith renal insufficiency and might explain the failure offolate and B12 vitamins to decrease the incidence ofcardiovascular events, despite reducing homocysteine, inrecent clinical trials. A limitation of this study is that thestudy population was a rather homogenous group ofmiddle-aged to elderly Caucasian individuals. Thus thefindings of this study will need to be confirmed in a moredemographically diverse population.
Can We Lower ADMA Concentrations?A logical strategy to reverse the competitive inhibition ofNOS by ADMA would be to employ supplemental L-arginine. However, studies of supplemental L-arginine inpatients with coronary artery disease are small, and theresults have been mixed. Agents that improve insulinresistance reduce plasma ADMA in humans (16 ). Drugsthat block the angiotensin system are also useful in thisregard. In the current study, patients receiving statintherapy had lower plasma ADMA concentrations. How-ever, this effect of statins was observed in only 1 of 5previous clinical trials (17 ). The results of the presentstudy suggest that it might be worthwhile to readdress
this issue, especially because new, specific drugs thatincrease DDAH expression and lower ADMA, like thefarnesoid X receptor agonist GW 4064, are still in the earlystage of development (18 ).
Should We Measure ADMA in Every Patient with CoronaryArtery Disease?
Vallance (19 ) first advanced the idea that ADMA accu-mulation may be a cardiovascular risk factor in end-stagerenal disease. In the last 15 years the relationship betweenADMA and adverse cardiovascular outcomes has beenthoroughly investigated in more than 500 publications.The accumulating evidence supports the view thatADMA is not only a marker but possibly a mediator ofendothelial dysfunction, atherogenesis, and cardiovascu-lar morbidity. The study by Meinitzer et al. representsanother brick in the wall, if not the keystone. It is not yettime to accept ADMA as a cardiovascular risk marker tobe used widely, but the study by Meinitzer and colleaguesadvances the proposition.
This work was supported by a grant to Dr. Kielstein fromthe Deutsche Forschungsgemeinschaft (Ki 8591/-1) aswell as grants to Dr. Cooke from the National Heart, Lungand Blood Institute (R01 HL-63685; RO1 HL-75774; R01
Fig. 1. Biochemical pathways for generation, elimination, and degradation of ADMA.ADMA derives from methylation of arginine residues in proteins. The reaction is catalyzed by protein arginine N-methyltransferases (PRMT). Hydrolysis of the methylatedproteins releases ADMA, which competitively inhibits NOS. Renal excretion accounts for only 20% of ADMA elimination. The primary route of elimination (80%) is themetabolism of ADMA through the enzyme DDAH. The enzyme DDAH hydrolyzes ADMA to form dimethylamine and L-citrulline. Adapted from Kielstein et al. (20).
162 Kielstein and Cooke: ADMA in Coronary Artery Disease
CA098303 and P01 AG18784; and PO1AI50153); PhilipMorris U S A Inc.; the Tobacco Related Disease ResearchProgram (11RT-0147); and Ajinomoto Inc.
Conflict of interest: Dr. Kielstein owns and hosts thewebsite www.adma.com. Dr. Cooke is the inventor ofpatents, owned by Stanford University, for diagnostic andtherapeutic applications of the NOS pathway from whichhe receives royalties.
References1. Meinitzer A, Seelhorst U, Wellnitz B, Halwachs-Baumann G, Boehm BO,
Winkelmann BR, et al. Asymmetrical dimethylarginine independently pre-dicts total and cardiovascular mortality in individuals with angiographiccoronary artery disease (The Ludwigshafen Risk and Cardiovascular HealthStudy). Clin Chem 2007;53:273–83.
2. Kielstein JT, Boger RH, Bode-Boger SM, Schaffer J, Barbey M, Koch KM, etal. Asymmetric dimethylarginine plasma concentrations differ in patientswith end-stage renal disease: relationship to treatment method and athero-sclerotic disease. J Am Soc Nephrol 1999;10:594–600.
3. Zoccali C, Bode-Boger S, Mallamaci F, Benedetto F, Tripepi G, Malatino L, etal. Plasma concentration of asymmetrical dimethylarginine and mortality inpatients with end-stage renal disease: a prospective study. Lancet 2001;358:2113–7.
4. Dayoub H, Achan V, Adimoolam S, Jacobi J, Stuehlinger MC, Wang BY, et al.Dimethylarginine dimethylaminohydrolase regulates nitric oxide synthesis:genetic and physiological evidence. Circulation 2003;108:3042–7.
5. Cooke JP. Asymmetrical dimethylarginine: the Uber marker? Circulation2004;109:1813–8.
6. Jacobi J, Sydow K, von Degenfeld G, Zhang Y, Dayoub H, Wang B, et al.Overexpression of dimethylarginine dimethylaminohydrolase reduces tissueasymmetric dimethylarginine levels and enhances angiogenesis. Circulation2005;111:1431–8.
7. Kielstein JT, Zoccali C. Asymmetric dimethylarginine: a cardiovascular riskfactor and a uremic toxin coming of age. Am J Kidney Dis 2005;46:186–202.
8. Ito A, Tsao PS, Adimoolam S, Kimoto M, Ogawa T, Cooke JP. Novelmechanism for endothelial dysfunction: dysregulation of dimethylargininedimethylaminohydrolase. Circulation 1999;99:3092–5.
9. Kielstein JT, Impraim B, Simmel S, Bode-Boger SM, Tsikas D, Frolich JC, etal. Cardiovascular effects of systemic nitric oxide synthase inhibition withasymmetrical dimethylarginine in humans. Circulation 2004;109:172–7.
10. Kielstein JT, Donnerstag F, Gasper S, Menne J, Kielstein A, Martens-Lobenhoffer J, et al. ADMA increases arterial stiffness and decreasescerebral blood flow in humans. Stroke 2006;37:2024–9.
11. Miyazaki H, Matsuoka H, Cooke JP, Usui M, Ueda S, Okuda S, et al.Endogenous nitric oxide synthase inhibitor: a novel marker of atherosclero-sis. Circulation 1999;99:1141–6.
12. Valkonen VP, Paiva H, Salonen JT, Lakka TA, Lehtimaki T, Laakso J, et al.Risk of acute coronary events and serum concentration of asymmetricaldimethylarginine. Lancet 2001;358:2127–8.
13. Lenzen H, Tsikas D, Boger RH. Asymmetric dimethylarginine (ADMA) and therisk for coronary heart disease: the multicenter CARDIAC study. Eur J ClinPharmacol 2006;62(Suppl 1):45–9.
14. Schnabel R, Blankenberg S, Lubos E, Lackner KJ, Rupprecht HJ, Espinola-Klein C, et al. Asymmetric dimethylarginine and the risk of cardiovascularevents and death in patients with coronary artery disease: results from theAtheroGene Study. Circ Res 2005;97:e53–e59.
15. Krempl TK, Maas R, Sydow K, Meinertz T, Boger RH, Kahler J. Elevation ofasymmetric dimethylarginine in patients with unstable angina and recurrentcardiovascular events. Eur Heart J 2005;26:1846–51.
16. Stuhlinger MC, Abbasi F, Chu JW, Lamendola C, McLaughlin TL, Cooke JP, etal. Relationship between insulin resistance and an endogenous nitric oxidesynthase inhibitor. JAMA 2002;287:1420–6.
17. Lu TM, Ding YA, Leu HB, Yin WH, Sheu WH, Chu KM. Effect of rosuvastatinon plasma levels of asymmetric dimethylarginine in patients with hypercho-lesterolemia. Am J Cardiol 2004;94:157–61.
18. Hu T, Chouinard M, Cox AL, Sipes P, Marcelo M, Ficorilli J, et al. FXR agonistreduces serum asymmetric dimethylarginine levels through hepatic dimethy-larginine dimethylaminohydrolase-1 gene regulation 2006 Oct 25; [Epubahead of print].
19. Vallance P, Leone A, Calver A, Collier J, Moncada S. Accumulation of anendogenous inhibitor of nitric oxide synthesis in chronic renal failure. Lancet1992;339:572–5.
20. Kielstein JT, Frolich JC, Haller H, Fliser D. ADMA (asymmetric dimethylargi-nine): an atherosclerotic disease mediating agent in patients with renaldisease. Nephrol Dial Transplant 2001;16:1742–5.
Jan T. KielsteinJohn P. Cooke*
Division of Cardiovascular MedicineStanford University Medical Center
Stanford, CA
* Address correspondence to this author at: Division of Car-diovascular Medicine, Stanford University School of Medicine,300 Pasteur Drive, Stanford, CA 94035 U S A. Fax 650-725-1599;e-mail [email protected].
DOI: 10.1373/clinchem.2006.078881
Clinical Chemistry 53, No. 2, 2007 163
Impact of Adjustment for Quality on Results ofMetaanalyses of Diagnostic Accuracy
Mariska Leeflang,1* Johannes Reitsma,1 Rob Scholten,2 Anne Rutjes,1
Marcello Di Nisio,3 Jon Deeks,4 and Patrick Bossuyt1
Background: We examined whether and to what extentdifferent strategies of defining and incorporating qual-ity of included studies affect the results of metaanalysesof diagnostic accuracy.Methods: We evaluated the methodological quality of487 diagnostic-accuracy studies in 30 systematic reviewswith the QUADAS (Quality Assessment of Diagnostic-Accuracy Studies) checklist. We applied 3 strategies thatvaried both in the definition of quality and in thestatistical approach to incorporate the quality-assess-ment results into metaanalyses. We compared magni-tudes of diagnostic odds ratios, widths of their confi-dence intervals, and changes in a hypothetical clinicaldecision between strategies.Results: Following 2 definitions of quality, we con-cluded that only 70 or 72 of 487 studies were of “highquality”. This small number was partly due to poorreporting of quality items. None of the strategies foraccounting for differences in quality led systematicallyto accuracy estimates that were less optimistic thanignoring quality in metaanalyses. Limiting the review tohigh-quality studies considerably reduced the numberof studies in all reviews, with wider confidence inter-vals as a result. In 18 reviews, the quality adjustmentwould have resulted in a different decision about theusefulness of the test.
Conclusions: Although reporting the results of qualityassessment of individual studies is necessary in system-atic reviews, reader wariness is warranted regardingclaims that differences in methodological quality havebeen accounted for. Obstacles for adjusting for qualityin metaanalyses are poor reporting of design featuresand patient characteristics and the relatively low num-ber of studies in most diagnostic reviews.© 2007 American Association for Clinical Chemistry
Healthcare professionals seeking the best informationabout diagnostic tests increasingly turn to systematicreviews of test-accuracy studies, yet a review’s summaryestimate can be biased if the studies in the review areflawed. An evaluation of the quality of the originalstudies, therefore, is an essential issue of any systematicreview.
The methodological quality of studies can be defined interms of their susceptibility to bias. Studies with method-ological shortcomings, such as inclusion of healthy con-trol individuals or selective use of multiple referencestandards to verify index test results, have produceddifferent measures of test accuracy (1–5). In most cases,such deficiencies have been associated with inflated esti-mates of diagnostic accuracy. The inclusion of lower-quality studies in a metaanalysis may therefore produceunrealistically high-accuracy estimates. Accounting forquality differences can be expected to produce less opti-mistic summary estimates of diagnostic accuracy.
Design feature variability and the presence of studieswith suboptimal designs in a systematic review may alsoincrease heterogeneity in results among studies (6–8).Given these considerations, one can expect strategies thataccount for quality in metaanalyses of diagnostic accuracyto lead to more homogeneous results and therefore tomore precise estimates, with narrower confidence inter-vals around the accuracy measures of interest than esti-mates without quality adjustment.
Quality assessment of individual studies in a reviewmay identify both design deficiencies that can lead to biasand sources of variation that can lead to heterogeneity.
1 Department of Clinical Epidemiology, Biostatistics and Bioinformatics.2 The Dutch Cochrane Centre, Academic Medical Center, University of
Amsterdam, The Netherlands.3 Department of Medicine and Aging, School of Medicine and Aging
Research Center, Ce.S.I., “Gabriele D’Annunzio” University Foundation,Chieti-Pescara, Italy.
4 Department of Public Health and Epidemiology, University of Birming-ham, Edgbaston, Birmingham, United Kingdom.
* Address correspondence to this author at: Department of Clinical Epide-miology, Biostatistics and Bioinformatics, Academic Medical Center, Univer-sity of Amsterdam, P.O. Box 22700, 1100 DE Amsterdam, The Netherlands. Fax0031-20-6912683; e-mail [email protected].
Received July 13, 2006; accepted November 27, 2006Previously published online at DOI: 10.1373/clinchem.2006.076398
Clinical Chemistry 53:2164–172 (2007) Review
164
Several quality-assessment tools, most of which use a“checklist” approach, have been developed for diagnos-tic-accuracy studies (5 ). A recently developed genericquality-assessment tool based on a modified Delphi pro-cedure (5, 9) has been recommended by the CochraneCollaboration as a starting point for quality assessment indiagnostic reviews (10 ).
Although quality appraisal has been recognized as anessential step of systematic reviews, how study qualityshould be addressed in metaanalyses of diagnostic-accu-racy studies is less clear (5, 11). Strategies to incorporatestudy quality into metaanalyses can be broadly dividedinto 3 categories: including all studies, irrespective ofquality; analyzing subgroups that differ in quality; andmultivariable regression analysis. The slightly differentrecommendations given in the guiding reports are allbased on sparse evidence (12–14).
To test the hypothesis that adjustment for qualityproduces less optimistic estimates of diagnostic accuracyand narrower confidence intervals, we compared 3 differ-ent strategies for incorporating quality in analyzing anumber of previously published systematic reviews ofdiagnostic-accuracy studies.
Materials and MethodsWe studied 3 alternative strategies for quality incorpora-tion in metaanalysis and comparing the results of analyz-ing all available studies irrespective of their quality, in aseries of systematic reviews of diagnostic accuracy stud-ies. Within each systematic review, we compared thesummary diagnostic odds ratios (DORs) and the widthsof the confidence intervals across these strategies.
study setTo include a broad sample of diagnostic studies thatexamined a variety of tests over time, we conducted asystematic electronic search for systematic reviews ofdiagnostic-accuracy studies published between January1999 and April 2002 (5 ). This search produced a set of28 reports of systematic reviews (see appendix in theData Supplement that accompanies the online version ofthis article at http://www.clinchem.org/content/vol53/issue2). Details of the search strategy are available fromthe authors. Inclusion criteria were (a) a systematic reviewof diagnostic test-accuracy studies, (b) inclusion of at least10 original studies, (c) no exclusion of primary studiesbased on design features, and (d) the ability to reproducethe 2 � 2 tables from the original studies. The 28 reportsyielded 30 systematic reviews. Details of the inclusionprocess are reported elsewhere (5 ).
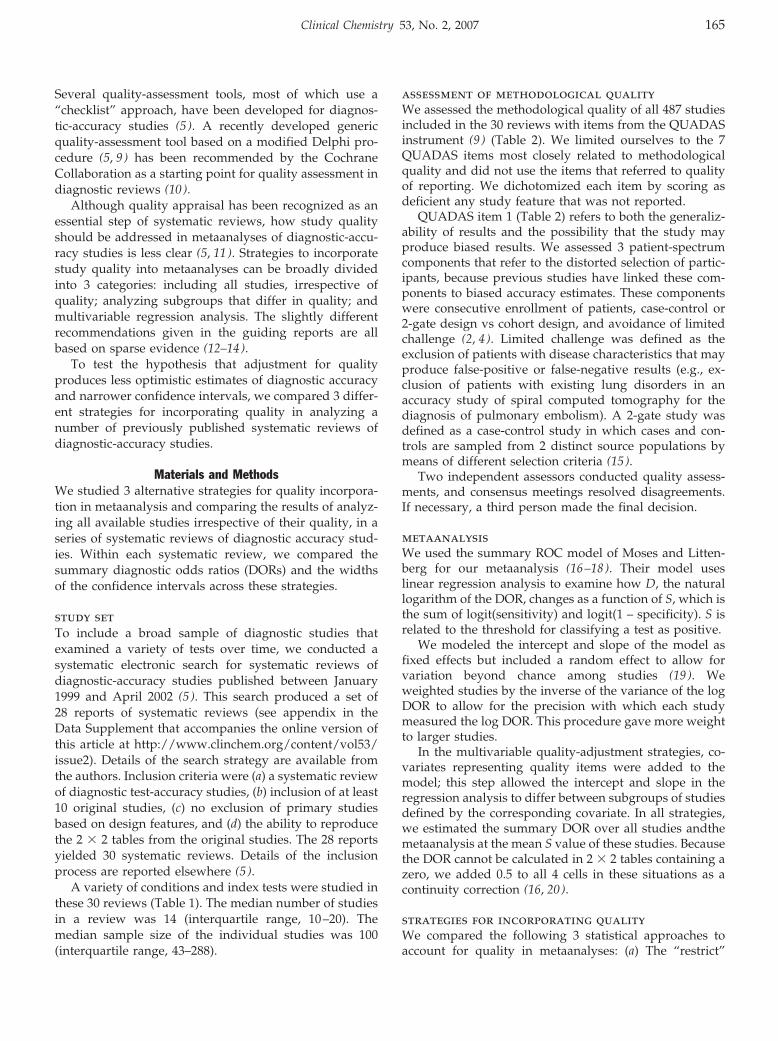
A variety of conditions and index tests were studied inthese 30 reviews (Table 1). The median number of studiesin a review was 14 (interquartile range, 10–20). Themedian sample size of the individual studies was 100(interquartile range, 43–288).
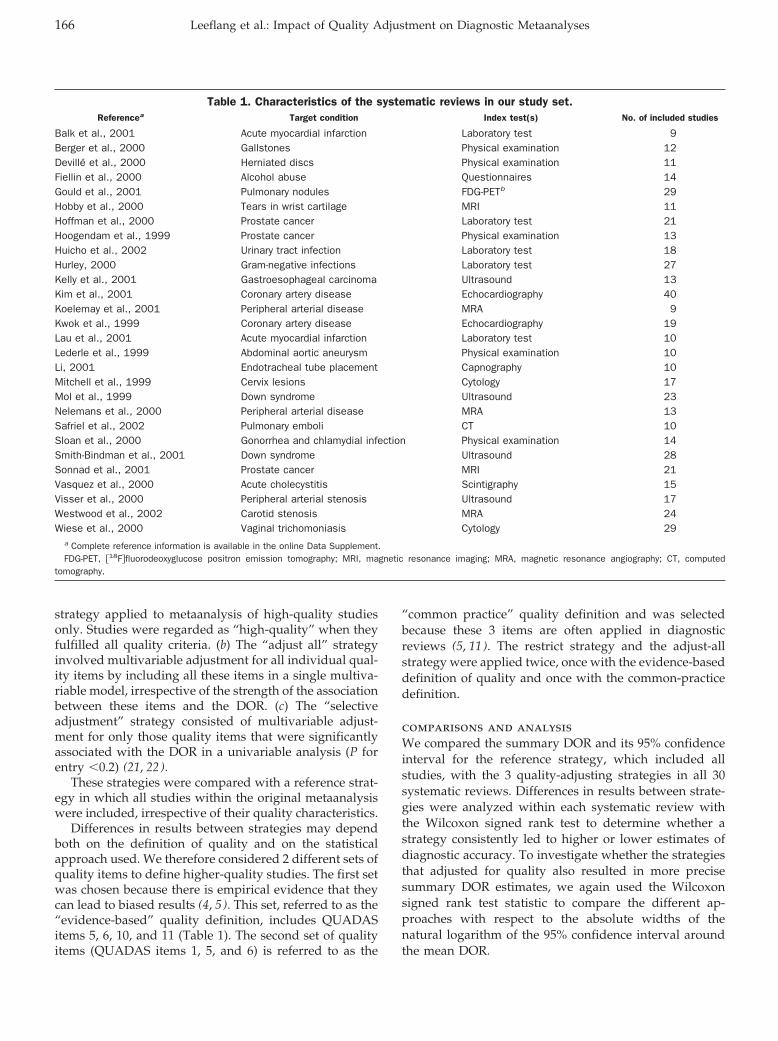
assessment of methodological qualityWe assessed the methodological quality of all 487 studiesincluded in the 30 reviews with items from the QUADASinstrument (9 ) (Table 2). We limited ourselves to the 7QUADAS items most closely related to methodologicalquality and did not use the items that referred to qualityof reporting. We dichotomized each item by scoring asdeficient any study feature that was not reported.
QUADAS item 1 (Table 2) refers to both the generaliz-ability of results and the possibility that the study mayproduce biased results. We assessed 3 patient-spectrumcomponents that refer to the distorted selection of partic-ipants, because previous studies have linked these com-ponents to biased accuracy estimates. These componentswere consecutive enrollment of patients, case-control or2-gate design vs cohort design, and avoidance of limitedchallenge (2, 4). Limited challenge was defined as theexclusion of patients with disease characteristics that mayproduce false-positive or false-negative results (e.g., ex-clusion of patients with existing lung disorders in anaccuracy study of spiral computed tomography for thediagnosis of pulmonary embolism). A 2-gate study wasdefined as a case-control study in which cases and con-trols are sampled from 2 distinct source populations bymeans of different selection criteria (15 ).
Two independent assessors conducted quality assess-ments, and consensus meetings resolved disagreements.If necessary, a third person made the final decision.
metaanalysisWe used the summary ROC model of Moses and Litten-berg for our metaanalysis (16–18). Their model useslinear regression analysis to examine how D, the naturallogarithm of the DOR, changes as a function of S, which isthe sum of logit(sensitivity) and logit(1 – specificity). S isrelated to the threshold for classifying a test as positive.
We modeled the intercept and slope of the model asfixed effects but included a random effect to allow forvariation beyond chance among studies (19 ). Weweighted studies by the inverse of the variance of the logDOR to allow for the precision with which each studymeasured the log DOR. This procedure gave more weightto larger studies.
In the multivariable quality-adjustment strategies, co-variates representing quality items were added to themodel; this step allowed the intercept and slope in theregression analysis to differ between subgroups of studiesdefined by the corresponding covariate. In all strategies,we estimated the summary DOR over all studies andthemetaanalysis at the mean S value of these studies. Becausethe DOR cannot be calculated in 2 � 2 tables containing azero, we added 0.5 to all 4 cells in these situations as acontinuity correction (16, 20).
strategies for incorporating qualityWe compared the following 3 statistical approaches toaccount for quality in metaanalyses: (a) The “restrict”
Clinical Chemistry 53, No. 2, 2007 165
strategy applied to metaanalysis of high-quality studiesonly. Studies were regarded as “high-quality” when theyfulfilled all quality criteria. (b) The “adjust all” strategyinvolved multivariable adjustment for all individual qual-ity items by including all these items in a single multiva-riable model, irrespective of the strength of the associationbetween these items and the DOR. (c) The “selectiveadjustment” strategy consisted of multivariable adjust-ment for only those quality items that were significantlyassociated with the DOR in a univariable analysis (P forentry �0.2) (21, 22).
These strategies were compared with a reference strat-egy in which all studies within the original metaanalysiswere included, irrespective of their quality characteristics.
Differences in results between strategies may dependboth on the definition of quality and on the statisticalapproach used. We therefore considered 2 different sets ofquality items to define higher-quality studies. The first setwas chosen because there is empirical evidence that theycan lead to biased results (4, 5). This set, referred to as the“evidence-based” quality definition, includes QUADASitems 5, 6, 10, and 11 (Table 1). The second set of qualityitems (QUADAS items 1, 5, and 6) is referred to as the
“common practice” quality definition and was selectedbecause these 3 items are often applied in diagnosticreviews (5, 11). The restrict strategy and the adjust-allstrategy were applied twice, once with the evidence-baseddefinition of quality and once with the common-practicedefinition.
comparisons and analysisWe compared the summary DOR and its 95% confidenceinterval for the reference strategy, which included allstudies, with the 3 quality-adjusting strategies in all 30systematic reviews. Differences in results between strate-gies were analyzed within each systematic review withthe Wilcoxon signed rank test to determine whether astrategy consistently led to higher or lower estimates ofdiagnostic accuracy. To investigate whether the strategiesthat adjusted for quality also resulted in more precisesummary DOR estimates, we again used the Wilcoxonsigned rank test statistic to compare the different ap-proaches with respect to the absolute widths of thenatural logarithm of the 95% confidence interval aroundthe mean DOR.
Table 1. Characteristics of the systematic reviews in our study set.Referencea Target condition Index test(s) No. of included studies
Balk et al., 2001 Acute myocardial infarction Laboratory test 9Berger et al., 2000 Gallstones Physical examination 12Devillé et al., 2000 Herniated discs Physical examination 11Fiellin et al., 2000 Alcohol abuse Questionnaires 14Gould et al., 2001 Pulmonary nodules FDG-PETb 29Hobby et al., 2000 Tears in wrist cartilage MRI 11Hoffman et al., 2000 Prostate cancer Laboratory test 21Hoogendam et al., 1999 Prostate cancer Physical examination 13Huicho et al., 2002 Urinary tract infection Laboratory test 18Hurley, 2000 Gram-negative infections Laboratory test 27Kelly et al., 2001 Gastroesophageal carcinoma Ultrasound 13Kim et al., 2001 Coronary artery disease Echocardiography 40Koelemay et al., 2001 Peripheral arterial disease MRA 9Kwok et al., 1999 Coronary artery disease Echocardiography 19Lau et al., 2001 Acute myocardial infarction Laboratory test 10Lederle et al., 1999 Abdominal aortic aneurysm Physical examination 10Li, 2001 Endotracheal tube placement Capnography 10Mitchell et al., 1999 Cervix lesions Cytology 17Mol et al., 1999 Down syndrome Ultrasound 23Nelemans et al., 2000 Peripheral arterial disease MRA 13Safriel et al., 2002 Pulmonary emboli CT 10Sloan et al., 2000 Gonorrhea and chlamydial infection Physical examination 14Smith-Bindman et al., 2001 Down syndrome Ultrasound 28Sonnad et al., 2001 Prostate cancer MRI 21Vasquez et al., 2000 Acute cholecystitis Scintigraphy 15Visser et al., 2000 Peripheral arterial stenosis Ultrasound 17Westwood et al., 2002 Carotid stenosis MRA 24Wiese et al., 2000 Vaginal trichomoniasis Cytology 29
a Complete reference information is available in the online Data Supplement.FDG-PET, �18F�fluorodeoxyglucose positron emission tomography; MRI, magnetic resonance imaging; MRA, magnetic resonance angiography; CT, computed
tomography.
166 Leeflang et al.: Impact of Quality Adjustment on Diagnostic Metaanalyses
To determine whether the change in summary DORwould affect clinical decisions, we used 4 arbitrary cate-gories, which were defined by the absolute size of thesummary DOR. If a metaanalysis resulted in a pointestimate of the DOR �16, the test was regarded as notuseful. We regarded a test with a DOR of 16–81 asmoderately useful, a test with a DOR of 81–361 as useful,and a test with a DOR �361 as very useful. The DORvalues of 16, 81, and 361 correspond to sensitivity-speci-
ficity pairs of 80%–80%, 90%–90%, and 95%–95%,respectively.
We used SAS for Windows, version 9.1.3 (SAS Insti-tute) for all analyses and the proc mixed procedure in SASto fit all models.
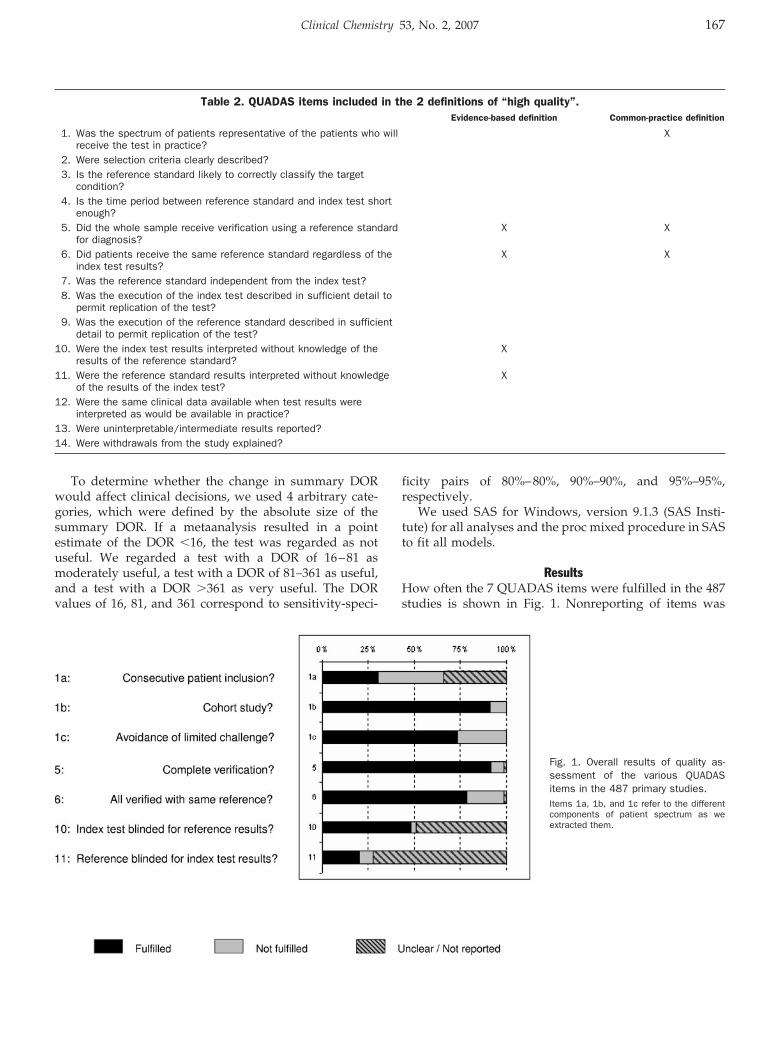
ResultsHow often the 7 QUADAS items were fulfilled in the 487studies is shown in Fig. 1. Nonreporting of items was
Table 2. QUADAS items included in the 2 definitions of “high quality”.Evidence-based definition Common-practice definition
1. Was the spectrum of patients representative of the patients who willreceive the test in practice?
X
2. Were selection criteria clearly described?3. Is the reference standard likely to correctly classify the target
condition?4. Is the time period between reference standard and index test short
enough?5. Did the whole sample receive verification using a reference standard
for diagnosis?X X
6. Did patients receive the same reference standard regardless of theindex test results?
X X
7. Was the reference standard independent from the index test?8. Was the execution of the index test described in sufficient detail to
permit replication of the test?9. Was the execution of the reference standard described in sufficient
detail to permit replication of the test?10. Were the index test results interpreted without knowledge of the
results of the reference standard?X
11. Were the reference standard results interpreted without knowledgeof the results of the index test?
X
12. Were the same clinical data available when test results wereinterpreted as would be available in practice?
13. Were uninterpretable/intermediate results reported?14. Were withdrawals from the study explained?
Fig. 1. Overall results of quality as-sessment of the various QUADASitems in the 487 primary studies.Items 1a, 1b, and 1c refer to the differentcomponents of patient spectrum as weextracted them.
Clinical Chemistry 53, No. 2, 2007 167
common, particularly for blinding of the index test (49%)and the reference test (72%), adequate time interval be-tween the index and reference standard (42%), andwhether patients were consecutively included (34%).
Studies of the case-control or 2-gate type were includedin 9 of the 30 reviews. Whether all patients had receivedthe reference standard and whether the reference stan-dard was the same for each patient were well reported(99% of the studies). In 3 reviews, the primary studiesused different reference standards to verify index testresults.
Applying the evidence-based definition of quality(items 5, 6, 10, and 11 of the QUADAS checklist) identified72 (15%) of the 487 primary studies as high quality. Withthis definition, 12 of the 30 systematic reviews had nohigh-quality studies, and 9 reviews included at least 3high-quality studies.
Applying the common-practice definition identified 70high-quality studies (14%). With this definition, 9 system-atic reviews contained no high-quality studies, and 11reviews had at least 3 high-quality studies. Use of bothdefinitions yielded only 3 reviews that contained �3high-quality studies.
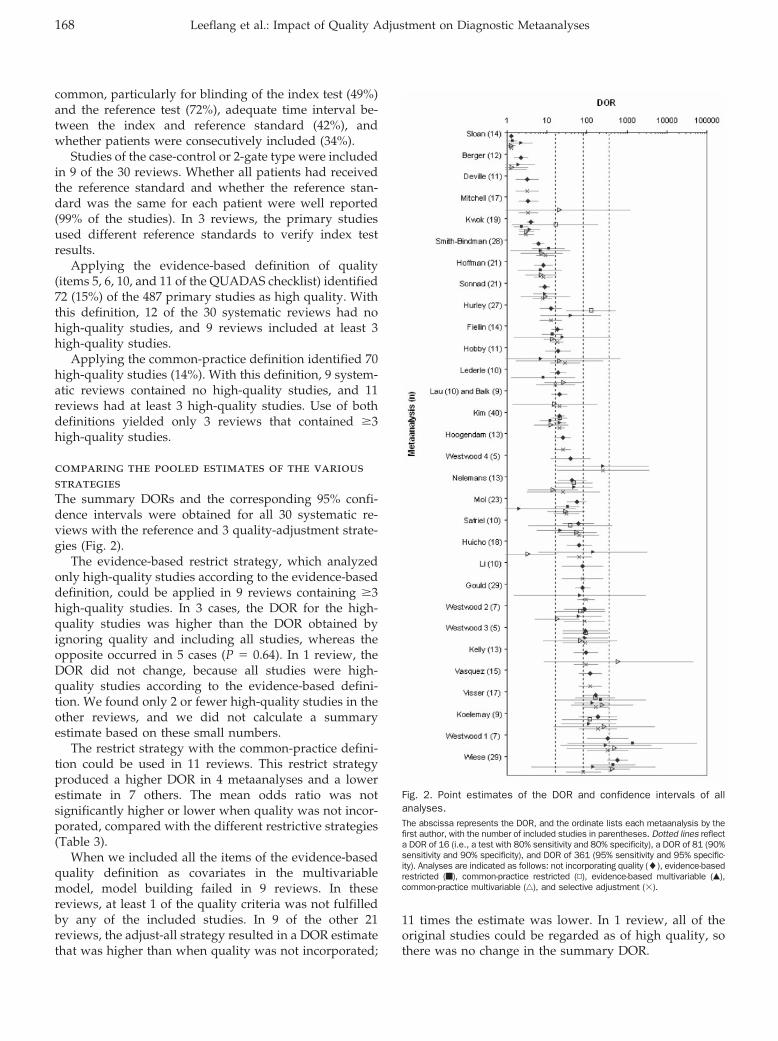
comparing the pooled estimates of the variousstrategiesThe summary DORs and the corresponding 95% confi-dence intervals were obtained for all 30 systematic re-views with the reference and 3 quality-adjustment strate-gies (Fig. 2).
The evidence-based restrict strategy, which analyzedonly high-quality studies according to the evidence-baseddefinition, could be applied in 9 reviews containing �3high-quality studies. In 3 cases, the DOR for the high-quality studies was higher than the DOR obtained byignoring quality and including all studies, whereas theopposite occurred in 5 cases (P � 0.64). In 1 review, theDOR did not change, because all studies were high-quality studies according to the evidence-based defini-tion. We found only 2 or fewer high-quality studies in theother reviews, and we did not calculate a summaryestimate based on these small numbers.
The restrict strategy with the common-practice defini-tion could be used in 11 reviews. This restrict strategyproduced a higher DOR in 4 metaanalyses and a lowerestimate in 7 others. The mean odds ratio was notsignificantly higher or lower when quality was not incor-porated, compared with the different restrictive strategies(Table 3).
When we included all the items of the evidence-basedquality definition as covariates in the multivariablemodel, model building failed in 9 reviews. In thesereviews, at least 1 of the quality criteria was not fulfilledby any of the included studies. In 9 of the other 21reviews, the adjust-all strategy resulted in a DOR estimatethat was higher than when quality was not incorporated;
11 times the estimate was lower. In 1 review, all of theoriginal studies could be regarded as of high quality, sothere was no change in the summary DOR.
Fig. 2. Point estimates of the DOR and confidence intervals of allanalyses.The abscissa represents the DOR, and the ordinate lists each metaanalysis by thefirst author, with the number of included studies in parentheses. Dotted lines reflecta DOR of 16 (i.e., a test with 80% sensitivity and 80% specificity), a DOR of 81 (90%sensitivity and 90% specificity), and DOR of 361 (95% sensitivity and 95% specific-ity). Analyses are indicated as follows: not incorporating quality (�), evidence-basedrestricted (f), common-practice restricted (▫), evidence-based multivariable (Œ),common-practice multivariable (‚), and selective adjustment (�).
168 Leeflang et al.: Impact of Quality Adjustment on Diagnostic Metaanalyses
With the common-practice definition, we were able tomake a multivariable adjust-all model in 23 reviews. Theestimated DOR was higher in 10 reviews and lower in 13.The differences between analyzing studies irrespective oftheir quality and analyses with the 2 multivariable strat-egies were not significant (Table 3).
The selective-adjustment strategy included only itemsthat were significantly associated with accuracy in aunivariable analysis (P �0.2). In 18 reviews, none of theQUADAS items was significantly associated with accu-racy, and the use of all original studies in a metaanalysisyielded the same summary DOR as when quality wasdisregarded. In 5 reviews, only one single QUADAS itemhad a significant effect, and in a further 5, 1, and 1metaanalyses respectively 2, 3, and 4 items were signifi-cant. The selective-adjustment strategy led to a higherestimate in 5 cases and to a lower estimate in 7 cases,compared with the metaanalysis in which quality was notincorporated.
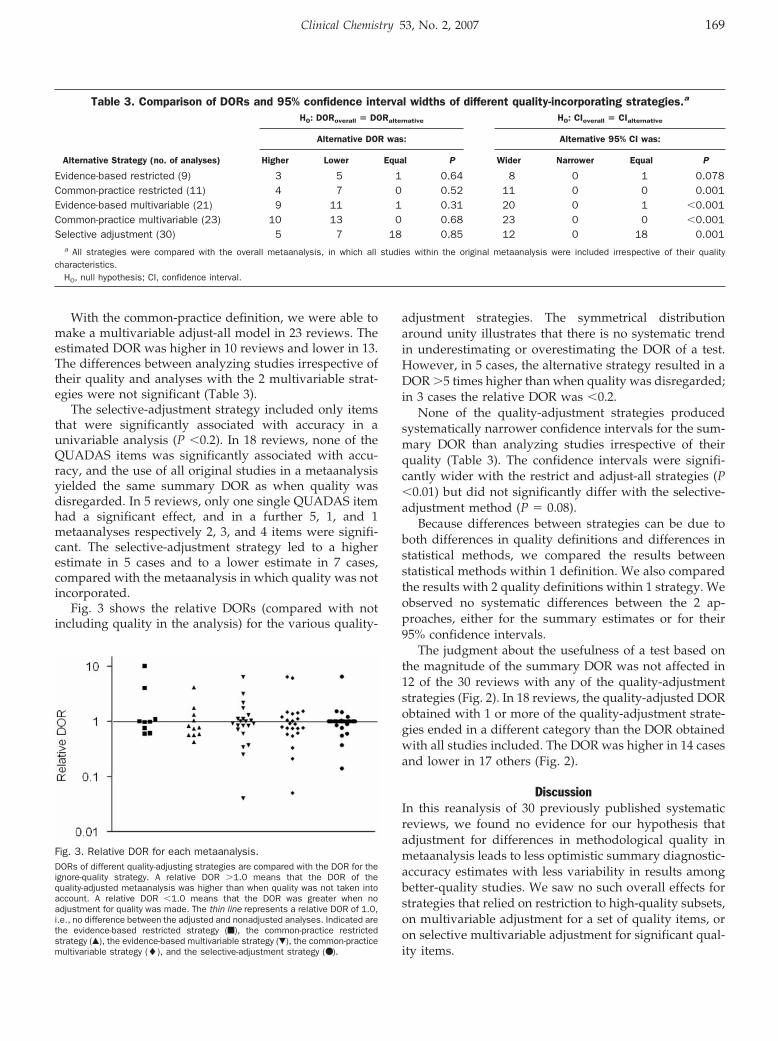
Fig. 3 shows the relative DORs (compared with notincluding quality in the analysis) for the various quality-
adjustment strategies. The symmetrical distributionaround unity illustrates that there is no systematic trendin underestimating or overestimating the DOR of a test.However, in 5 cases, the alternative strategy resulted in aDOR �5 times higher than when quality was disregarded;in 3 cases the relative DOR was �0.2.
None of the quality-adjustment strategies producedsystematically narrower confidence intervals for the sum-mary DOR than analyzing studies irrespective of theirquality (Table 3). The confidence intervals were signifi-cantly wider with the restrict and adjust-all strategies (P�0.01) but did not significantly differ with the selective-adjustment method (P � 0.08).
Because differences between strategies can be due toboth differences in quality definitions and differences instatistical methods, we compared the results betweenstatistical methods within 1 definition. We also comparedthe results with 2 quality definitions within 1 strategy. Weobserved no systematic differences between the 2 ap-proaches, either for the summary estimates or for their95% confidence intervals.
The judgment about the usefulness of a test based onthe magnitude of the summary DOR was not affected in12 of the 30 reviews with any of the quality-adjustmentstrategies (Fig. 2). In 18 reviews, the quality-adjusted DORobtained with 1 or more of the quality-adjustment strate-gies ended in a different category than the DOR obtainedwith all studies included. The DOR was higher in 14 casesand lower in 17 others (Fig. 2).
DiscussionIn this reanalysis of 30 previously published systematicreviews, we found no evidence for our hypothesis thatadjustment for differences in methodological quality inmetaanalysis leads to less optimistic summary diagnostic-accuracy estimates with less variability in results amongbetter-quality studies. We saw no such overall effects forstrategies that relied on restriction to high-quality subsets,on multivariable adjustment for a set of quality items, oron selective multivariable adjustment for significant qual-ity items.
Table 3. Comparison of DORs and 95% confidence interval widths of different quality-incorporating strategies.a
H0: DORoverall � DORalternative H0: CIoverall � CIalternative
Alternative DOR was: Alternative 95% CI was:
Alternative Strategy (no. of analyses) Higher Lower Equal P Wider Narrower Equal P
Evidence-based restricted (9) 3 5 1 0.64 8 0 1 0.078Common-practice restricted (11) 4 7 0 0.52 11 0 0 0.001Evidence-based multivariable (21) 9 11 1 0.31 20 0 1 �0.001Common-practice multivariable (23) 10 13 0 0.68 23 0 0 �0.001Selective adjustment (30) 5 7 18 0.85 12 0 18 0.001
a All strategies were compared with the overall metaanalysis, in which all studies within the original metaanalysis were included irrespective of their qualitycharacteristics.
H0, null hypothesis; CI, confidence interval.
Fig. 3. Relative DOR for each metaanalysis.DORs of different quality-adjusting strategies are compared with the DOR for theignore-quality strategy. A relative DOR �1.0 means that the DOR of thequality-adjusted metaanalysis was higher than when quality was not taken intoaccount. A relative DOR �1.0 means that the DOR was greater when noadjustment for quality was made. The thin line represents a relative DOR of 1.0,i.e., no difference between the adjusted and nonadjusted analyses. Indicated arethe evidence-based restricted strategy (f), the common-practice restrictedstrategy (Œ), the evidence-based multivariable strategy (�), the common-practicemultivariable strategy (�), and the selective-adjustment strategy (● ).
Clinical Chemistry 53, No. 2, 2007 169
A main problem that authors of systematic reviewsencounter is poor reporting of study characteristics, andour study was no exception (23 ). We scored any studyfeature that was not reported as deficient. DichotomizingQUADAS items into a simple “yes” or “no” can lead toloss of information, especially when many study charac-teristics are unreported. Some QUADAS items, such asthe use of an adequate reference standard and the gener-alizability of the patient spectrum, could not be assessedat all in our data set. Both of these items can have a largeeffect on the performance of a test under study, and aproper incorporation of these characteristics could haveresulted in a larger effect of the quality-adjustmentstrategies.
Because our analysis unit was the single metaanalysis,our sample size was only 30. Therefore, the power fordetecting significant trends between strategies was lim-ited, despite the inclusion of 487 individual studies. The30 systematic reviews covered a wide range of clinicaltopics and diagnostic tests, with a wide variability in themagnitude of the DOR. Our primary outcome variablewas the DOR, which is a single accuracy indicator thatincorporates both the sensitivity and specificity of a test.Such a single indicator is convenient in the analysis, but italso means that any given summary DOR can be pro-duced by innumerable sensitivity-specificity combina-tions. In practice, the value of 1 accuracy measure, saysensitivity, may be more critical than another if theimplications of false-positive and false-negative test re-sults differ in severity.
In our analysis, we refrained from calculating sum-mary quality scores for studies and labeling any studythat exceeded a certain threshold score as high quality.Such summary quality scores have been extensively stud-ied—and criticized—in systematic reviews of interventionstudies. Different shortcomings in study design maycause different forms of bias, making it almost impossibleto determine the weight that should be given to eachquality item in calculating such quality scores (24, 25). Wealso did not include a sequential analysis of the studiesbased on their quality ranking, which would have led toa quality-adjusted cumulative metaanalysis (26 ). Thisstrategy also requires a hierarchical approach to studyquality in that it assumes that some criteria are moreimportant than others and that studies fulfilling morecriteria are of higher quality.
Several previous studies have linked design features ofdiagnostic-accuracy studies to changes in accuracy esti-mates. One systematic review documented the theoreticaland empirical evidence for several sources of bias (4, 5).Two publications, which examined these effects in acollection of systematic reviews, both reported significanteffects for a number of features across metaanalyses (1, 2).We can only speculate why we failed to find any system-atic differences from incorporating these study features inthe metaanalysis process. These earlier studies analyzedthe impact of deficiencies in quality in a large number of
diagnostic-accuracy studies across a variety of systematicreviews, whereas our study assessed the impact of thesequality items on estimates of diagnostic accuracy withinsystematic reviews. Furthermore, the number of studieswith methodological deficiencies was small in a numberof the systematic reviews included in our analysis,whereas other reviews contained only studies with defi-ciencies. Many of these studies with a deficient studydesign had a small sample size (27 ). Because the weight ofan individual study depends on sample size, these studieshad only a minor impact on the summary estimate ofdiagnostic accuracy. Furthermore, if 2 or more qualityitems influence accuracy but in opposing directions, theoverall estimate obtained irrespective of quality may besimilar to the estimate based on high-quality studies only.It is also possible that incomplete reporting has led tomisclassification of design features in our project, whichmay have jeopardized our attempts to find differences inaccuracy.
There are other potential explanations for our failedattempts at quality adjustment. The effects of severalstudy-design features may not always be in the samepredictable direction. Whether partial verification, forexample, will lead to accuracy estimates that are un-changed, lower, or higher, depends on the pattern ofverification and the reference standards being used. Theratio of patients with unverified positive index test resultsand patients of unverified negative test results matters, inparticular when being verified or not is related to thepresence or absence of the target condition.
Similar remarks have been made in the field of inter-vention studies, where more metaepidemiologic studieslike ours have been performed (28, 29). The aim in meta-epidemiologic studies is to evaluate the importance of 1 ormore design features across a substantial number ofsystematic reviews. These studies have shown that meta-epidemiologic studies require substantial numbers of sys-tematic reviews with sufficient differences in method-ological quality among the included studies. Furthermore,if the effects of design features vary in direction amongreviews or even among studies within a single review,metaepidemiologic studies may produce summary esti-mates that suggest no effect at all (30, 32). Although wehave found no systematic trend in results among strate-gies, reviews in which adjusting for quality has led tosubstantially different results clearly exist. Because we donot know the true magnitude of accuracy, it is impossibleto tell whether the adjusted estimates were closer to thetruth.
Not only did we fail to find support for our hypothesisthat adjusting for quality will result in less optimisticestimates of test accuracy, we also found no evidence forthe hypothesis that adjusting for quality leads to lessheterogeneity in results and therefore to smaller confi-dence intervals. On the contrary, the alternative analysesgenerally produced broader confidence limits. The main
170 Leeflang et al.: Impact of Quality Adjustment on Diagnostic Metaanalyses
reason for this result is that the alternative strategies werebased on fewer studies.
Our study did not produce evidence for the superiorityof one type of adjustment over another. Low-qualitystudies can produce accuracy statistics that do not differfrom those obtained in high-quality studies. Althoughmethodological quality may influence the results of meta-analyses, a direct association with results is not necessar-ily present.
In any review, poor quality will affect the trustworthi-ness of the conclusions of that review. Our results indicatethat the strategy used to correct for quality may affect theestimated accuracy, but not in a predictable way. Ourresults also indicate that measuring and incorporatingquality in a diagnostic review is not a simple task ofroutinely scoring a few standard quality items and thenadjusting for these variables in a multivariable model.
There may be good reasons to identify some qualitycriteria as crucial for the credibility and applicability ofany systematic review. An example could be the selectionof the reference standard—QUADAS item 3. These crite-ria may then be used as inclusion criteria for the review,and authors of systematic reviews might want to reporthow many studies had to be excluded based on thatcriterion.
Quality-assessment results of the studies included in areview remains a necessity because it notifies readersabout the overall quality of the studies included in thereview and may point out differences in design that canhelp to explain some of the heterogeneity in results. TheQUADAS instrument can be used for that purpose. Wepropose to score “not reported” as a separate categorywhere applicable, and we hope that a more widespreadimplementation of the STARD statement will lead tobetter reporting in future reports of diagnostic-accuracystudies (33, 34).
We feel it necessary that quality-assessment results in asystematic review be summarized in a table or a figure. Atable can list the extent to which each of the studiesfulfilled the quality criteria. A figure, such as the stackedbar chart in Fig. 1, can then display the studies for whicheach of the respective criteria was fulfilled so that thereader can obtain an overview of the quality of the studiesincluded in the review. Plotting results for all of theincluded studies in ROC space and coding individualstudies by color or with symbols can help readers recog-nize the characteristics of individual studies.
In our view, whether quality is also to be incorporatedin a metaanalysis depends on several factors. In the firstplace, analyzing quality is not even an option if thenumber of included studies is too low. If the results arevery heterogeneous, quality differences can be used tosearch for an explanation for the heterogeneity, and sucha search can be accommodated by stratification or, ifappropriate, regression analysis. Caution is needed be-cause it is not unusual for the potential explanations forobserved differences to outnumber the studies in a sys-
tematic review. It is important to recognize the major limi-tations of metaepidemiologic approaches in metaanalysis.
Quality is a multidimensional concept, and the impor-tance of individual quality items will vary from oneresearch project to another. The goal of adjusting forquality differences in metaanalysis will remain attractivebut elusive until we have large-scale systematic reviewsand fully informative reporting in individual studies.
J.J.D. is supported in part by a Senior Scientist in EvidenceSynthesis Award from the UK Department of Health.
References1. Lijmer JG, Mol BW, Heisterkamp S, Bonsel GJ, Prins MH, van der
Meulen JH, et al. Empirical evidence of design-related bias instudies of diagnostic tests. JAMA 1999;282:1061–6.
2. Rutjes AW, Reitsma JB, Di Nisio M, Smidt N, Van Rijn JC, BossuytPM. Evidence of bias and variation in diagnostic accuracy studies.CMAJ 2006;174:469–76.
3. Westwood ME, Whiting PF, Kleijnen J. How does study qualityaffect the results of a diagnostic meta-analysis? BMC Med ResMethodol 2005;5:20.
4. Whiting P, Rutjes AW, Reitsma JB, Glas AS, Bossuyt PM, KleijnenJ. Sources of variation and bias in studies of diagnostic accuracy:a systematic review. Ann Intern Med 2004;140:189–202.
5. Whiting P, Rutjes AW, Dinnes J, Reitsma JB, Bossuyt PM, KleijnenJ. Development and validation of methods for assessing thequality of diagnostic accuracy studies. Health Technol Assess2004;8:1–234.
6. Dinnes J, Deeks J, Kirby J, Roderick P. A methodological review ofhow heterogeneity has been examined in systematic reviews ofdiagnostic test accuracy. Health Technol Assess 2005;9:1–128.
7. Lijmer JG, Bossuyt PM, Heisterkamp S. Exploring sources ofheterogeneity in systematic reviews of diagnostic tests. Stat Med2002;21:1525–37.
8. Irwig L, Bossuyt P, Glasziou P, Gatsonis C, Lijmer J. Designingstudies to ensure that estimates of test accuracy are transferable.BMJ 2002;324:669–71.
9. Whiting P, Rutjes AW, Reitsma JB, Bossuyt PM, Kleijnen J. Thedevelopment of QUADAS: a tool for the quality assessment ofstudies of diagnostic accuracy included in systematic reviews.BMC Med Res Methodol 2003;3:25.
10. Whiting PF, Westwood ME, Rutjes AW, Reitsma JB, Bossuyt PN,Kleijnen J. Evaluation of QUADAS, a tool for the quality assess-ment of diagnostic accuracy studies. BMC Med Res Methodol2006;6:9.
11. Whiting P, Rutjes AW, Dinnes J, Reitsma JB, Bossuyt PM, KleijnenJ. A systematic review finds that diagnostic reviews fail toincorporate quality despite available tools. J Clin Epidemiol 2005;58:1–12.
12. De Vet HC, van der WT, Muris JW, Heyrman J, Buntinx F,Knottnerus JA. Systematic reviews of diagnostic research. Con-siderations about assessment and incorporation of methodologi-cal quality. Eur J Epidemiol 2001;17:301–6.
13. Deville WL, Buntinx F, Bouter LM, Montori VM, de Vet HC, van derWindt DA, et al. Conducting systematic reviews of diagnosticstudies: didactic guidelines. BMC Med Res Methodol 2002;2:9.
14. Khan KS. Systematic reviews of diagnostic tests: a guide tomethods and application. Best Pract Res Clin Obstet Gynaecol2005;19:37–46.
Clinical Chemistry 53, No. 2, 2007 171
15. Rutjes AW, Reitsma JB, Vandenbroucke JP, Glas AS, Bossuyt PM.Case-control and two-gate designs in diagnostic accuracy studies.Clin Chem 2005;51:1335–41.
16. Littenberg B, Moses LE. Estimating diagnostic accuracy frommultiple conflicting reports: a new meta-analytic method. MedDecis Making 1993;13:313–21.
17. Moses LE, Shapiro D, Littenberg B. Combining independentstudies of a diagnostic test into a summary ROC curve: data-analytic approaches and some additional considerations. StatMed 1993;12:1293–316.
18. Irwig L, Macaskill P, Glasziou P, Fahey M. Meta-analytic methodsfor diagnostic test accuracy. J Clin Epidemiol 1995;48:119–30.
19. Van Houwelingen HC, Arends LR, Stijnen T. Advanced methods inmeta-analysis: multivariate approach and meta-regression. StatMed 2002;21:589–624.
20. Sweeting MJ, Sutton AJ, Lambert PC. What to add to nothing? Useand avoidance of continuity corrections in meta-analysis of sparsedata. Stat Med 2004;23:1351–75.
21. Steyerberg EW, Eijkemans MJ, Van Houwelingen JC, Lee KL,Habbema JD. Prognostic models based on literature and individ-ual patient data in logistic regression analysis. Stat Med 2000;19:141–60.
22. Steyerberg EW, Eijkemans MJ, Harrell FE Jr, Habbema JD. Prog-nostic modelling with logistic regression analysis: a comparison ofselection and estimation methods in small data sets. Stat Med2000;19:1059–79.
23. Smidt N, Rutjes AW, van der Windt DA, Ostelo RW, Reitsma JB,Bossuyt PM, et al. Quality of reporting of diagnostic accuracystudies. Radiology 2005;235:347–53.
24. Juni P, Witschi A, Bloch R, Egger M. The hazards of scoring thequality of clinical trials for meta-analysis. JAMA 1999;282:1054–60.
25. Whiting P, Harbord R, Kleijnen J. No role for quality scores insystematic reviews of diagnostic accuracy studies. BMC Med ResMethodol 2005;5:19.
26. Detsky AS, Naylor CD, O’Rourke K, McGeer AJ, L’Abbe KA.Incorporating variations in the quality of individual randomizedtrials into meta-analysis. J Clin Epidemiol 1992;45:255–65.
27. Kjaergard LL, Villumsen J, Gluud C. Reported methodologicalquality and discrepancies between large and small randomizedtrials in meta-analyses. Ann Intern Med 2001;135:982–9.
28. Deeks JJ, Dinnes J, D’Amico R, Sowden AJ, Sakarovitch C, Song F,et al. International Stroke Trial Collaborative Group; EuropeanCarotid Surgery Trial Collaborative Group. Evaluating non-random-ised intervention studies. Health Technol Assess 2003;7:9.
29. Sterne JA, Juni P, Schulz KF, Altman DG, Bartlett C, Egger M.Statistical methods for assessing the influence of study charac-teristics on treatment effects in ‘meta-epidemiological’ research.Stat Med 2002;21:1513–24.
30. Balk EM, Bonis PA, Moskowitz H, Schmid CH, Ioannidis JP, WangC, et al. Correlation of quality measures with estimates oftreatment effect in meta-analyses of randomized controlled trials.JAMA 2002;287:2973–82.
31. Moher D, Pham B, Jones A, Cook DJ, Jadad AR, Moher M, et al.Does quality of reports of randomised trials affect estimates ofintervention efficacy reported in meta-analyses? Lancet 1998;352:609–13.
32. Schulz KF, Chalmers I, Hayes RJ, Altman DG. Empirical evidenceof bias. Dimensions of methodological quality associated withestimates of treatment effects in controlled trials. JAMA 1995;273:408–12.
33. Bossuyt PM, Reitsma JB, Bruns DE, Gatsonis CA, Glasziou PP,Irwig LM, et al. Standards for Reporting of Diagnostic Accuracy.Towards complete and accurate reporting of studies of diagnosticaccuracy: the STARD initiative. BMJ 2003;326:41–4.
34. Smidt N, Rutjes AW, van der Windt DA, Ostelo RW, Bossuyt PM,Reitsma JB, et al. Reproducibility of the STARD checklist: aninstrument to assess the quality of reporting of diagnostic accu-racy studies. BMC Med Res Methodol 2006;6:12.
172 Leeflang et al.: Impact of Quality Adjustment on Diagnostic Metaanalyses
Microsatellite Markers within —SEA Breakpoints forPrenatal Diagnosis of HbBarts Hydrops Fetalis
Sherry Sze Yee Ho,1, Samuel S. Chong,2,4 Evelyn S.C. Koay,3,4 Yiong Huak Chan,5
Ponnusamy Sukumar,1 Lily-Lily Chiu,4 Wen Wang,2 Ashim Roy,1 Mary Rauff,1
Lin Lin Su,1 Arijit Biswas,1 and Mahesh Choolani1*
Background: We sought to develop a rapid prenataldiagnostic test for simultaneous detection of HbBartshydrops fetalis and exclusion of maternal contamination.Methods: We developed a multiplex quantitative fluo-rescent PCR (QF-PCR) test that detects the presence/absence of 2 microsatellite markers (16PTEL05/16PTEL06)located within breakpoints of the Southeast Asia (—SEA)deletion. HbBarts hydrops fetalis (—SEA/—SEA) is diagnosedby absence of both markers, and maternal contaminationof fetal DNA is excluded by absence of noninheritedmaternal alleles. Fetal and parental DNA samples from 50families were analyzed in a blinded clinical validationstudy, and QF-PCR results were compared with theirrespective molecular genotypes.Results: The multiplex QF-PCR results included correctdiagnoses of HbBarts hydrops fetalis in 11 of the fetusestested, correct verification as unaffected in 20 fetuses,and correct identification as either carriers (��/—SEA) orunaffected homozygotes in 18. Misidentification as un-affected occurred for 1 carrier. Sensitivity for diagnosisof HbBarts hydrops fetalis was 100% [lower 95% confi-dence interval, 76.2%], and specificity was 100% (lower95% confidence interval, 92.6%). None of the samplestested showed any traces of noninherited maternal al-leles; thus false-positives because of maternal contami-nation were eliminated.Conclusions: In this QF-PCR method, detection of ma-ternally and paternally inherited fetal alleles allowed
diagnosis of the double-deletion syndrome, and theability to differentiate between these alleles allowedsimultaneous exclusion of maternal contamination ofthe fetal genetic material. This novel strategy usingcell-free fetal DNA in maternal plasma could form thebasis for noninvasive testing for HbBarts hydropsfetalis.© 2007 American Association for Clinical Chemistry
�-Thalassemia (OMIM 141800 and 141850), an inheritedanemia syndrome, is the most common of the inheritedhemoglobin synthesis disorders, which are the most com-mon monogenic diseases (1, 2). �-Thalassemia is charac-terized by decreased or complete absence of �-globinchain synthesis (3–5), caused by deletion of or mutation(nondeletional) in the �-globin genes (1, 6). Clinically, 4variants of the syndrome are recognizable, with increas-ing severity of the disease manifestation depending onhow many normal �-globin genes are present (3, 2, 1 ornone) (7, 8). Retention of 3 normal �-globin genes resultsin a silent carrier state, with minimal complications.Individuals with 2 normal �-globin genes develop micro-cytosis (heterozygous �-thalassemia). Those with 1 nor-mal �-globin gene often have microcytosis and hemolysis(HbH disease). Loss of all 4 �-globin genes, as can occur inthe common Southeast Asian (—SEA)6 deletion, leads toHbBarts hydrops fetalis (9, 10). Affected fetuses developsevere intrauterine anemia and become hydropic, usuallyin the 2nd and 3rd trimesters. They die either in utero orsoon after birth. Maternal complications such as hyper-tension, preeclampsia, polyhydramnios, and severe post-partum hemorrhage can lead to fatal consequences in lategestation and at delivery (11 ). Of the many mutations thathave been described, deletions at the �-globin gene locus
Departments of 1 Obstetrics & Gynaecology, 2 Paediatrics, and 3 Pathology,Yong Loo Lin School of Medicine, National University of Singapore, Singa-pore.
4 Molecular Diagnosis Centre, National University Hospital, Singapore.5 Biostatistic Unit, Yong Loo Lin School of Medicine, National University
of Singapore, Singapore.* Address correspondence to this author at: Department of Obstetrics and
Gynaecology, National University of Singapore, 5 Lower Kent Ridge Road,Singapore 119074. Fax 65-6779-4753; e-mail [email protected].
Received June 15, 2006; accepted November 6, 2006.Previously published online at DOI: 10.1373/clinchem.2006.075085
6 Nonstandard abbreviations: —SEA, Southeast Asia; QF-PCR, quantitativefluorescent-PCR; AF, amniotic fluid; VNTR, variable number of tandem repeat;STR, short tandem repeat; PIC: polymorphism information content.
Clinical Chemistry 53:2173–179 (2007) Molecular Diagnostics
and Genetics
173
account for most �-thalassemia cases. In —SEA, the mostcommon �-globin gene deletions encountered are thesingle gene deletions, -�3.7 and -�4.2, and the double genedeletions in cis, —SEA, —FIL, and —THAI. The —MED and-(�)20.5 double-gene deletions are more prevalent in theMediterranean region. Because these deletions are region-ally specific (12 ), programs of screening, genetic counsel-ing, and prenatal diagnosis of specific mutations havebeen developed for individual regions (13, 14).
Carrier frequencies of the —SEA deletion in the generalpopulation range from 4.5% in Hong Kong to 14% innorthern Thailand (15 7). In Singapore, 5.6% of the pop-ulation carries �-thalassemia mutations, and of thesecarriers, 27% carry deletion (18 ). When both parents carrythe —SEA deletion, there is a 1 in 4 chance that the fetuswill inherit defective alleles from both parents and beaffected with HbBarts hydrops fetalis. Couples at riskshould be identified and offered genetic counseling andprenatal diagnosis so that they can make an informedchoice. A number of methods can be used to performprenatal diagnosis with DNA isolated from chorionic villi,amniocytes, or fetal blood samples.
Southern blot analysis (19, 20), formerly the standardmethod to detect gene deletions, is time-consuming, labo-rious, and technically demanding; with a limited detec-tion rate of 60%–80%, this method is not suitable forlarge-scale screening (21 ). DNA sequence analysis of eachdeletion breakpoint has now enabled PCR-based testing(22–26). Several techniques based on PCR amplification ofnormal and affected chromosomes (26–28) have beendeveloped to more rapidly identify globin gene muta-tions. These techniques include single-strand conforma-tion polymorphism analysis, denaturing gradient gelelectrophoresis (29, 30), direct sequencing, amplificationrefractory mutation system PCR (31 ), reverse dot-blotanalysis (32 ), and Gap-PCR, which is based on the mul-tiplex amplification of junctional segments of severaldifferent breakpoints (33–36). The latter technique enablesscreening and diagnosis of several common deletions in asingle test. The advantages of a multiplex-PCR test arereductions in cost and time. Although PCR-based tech-niques are highly sensitive and require only a smallamount of DNA to make a diagnosis, they are also proneto false-negative results from allele dropout (37 ) and tofalse-positive results due to amplification of contaminat-ing maternal DNA that may be present in the fetalsamples. Chan et al. (1997) reported a misdiagnosis rate of3.8% attributable to maternal DNA contamination (19 ).Current established PCR-based diagnostic tests require aseparate test to exclude maternal contamination.
We describe a novel technique that enables the simul-taneous diagnosis of HbBarts hydrops fetalis and exclu-sion of maternal contamination. Using multiplex quanti-tative fluorescent (QF)-PCR, we amplified polymorphicmicrosatellite markers within the —SEA deletion break-points. Complete absence of these markers suggests adeletion on both alleles, because these microsatellite markers
are located within the breakpoints. The polymorphicnature of these microsatellite markers enables differenti-ation between maternal and paternal alleles, enabling theexclusion of maternal contamination by confirming theabsence of noninherited maternal alleles within the fetalDNA samples. The additional cost and time required fora separate test to exclude maternal contamination areeliminated.
Materials and Methodssample collection and dna isolationControls. We used the Puregene DNA Purification Kit(Gentra Systems Inc) to isolate DNA from 3 cell linesobtained from the Coriell Cell Repositories (GM10799,GM03037, GM03433). GM10799 was initiated from theB-lymphocytes obtained from an �-thalassemia carrier(��/—SEA), and both GM03037 and GM03433 were initi-ated from fibroblasts obtained from patients with HbBartshydrops fetalis (—SEA/—SEA). DNA was also isolated fromEDTA-anticoagulated blood samples (3 mL each) from 2�-thalassemia carriers (carrier-1, carrier-2) with the geno-type ��/–SEA and 2 healthy volunteers (normal-1, normal-2). The buffy layer was separated from the plasma by a10-min centrifugation at 1600g and diluted (1:1) with 1�phosphate-buffered saline (137 mol/L NaCl, 10 mol/Lphosphate, 2.7 mol/L KCl, pH 7.4). DNA was isolatedfrom 200 �L of the diluted buffy layer with High PureTemplate DNA Purification Kit (Roche GmbH) accordingto the manufacturer’s recommendations. The �-globingenotypes were determined by the �-thalassemia 7-dele-tion multiplex PCR as previously described (38 ).
Paired Parental and Fetal Samples. In the blinded clinicalvalidation study, we analyzed 50 sets of stored DNAsamples consisting of maternal, paternal, and fetal DNAobtained from the DNA Bank of the Molecular DiagnosisCentre at the National University Hospital. Use of thebanked DNA samples for this study complied with theregulations set by our Institutional Review Board, includ-ing informed patient consent and anonymization ofsource. Sources were peripheral blood for parental DNAand amniotic fluid (AF), chorionic villi, or fetal blood forfetal DNA. Maternal contamination of the fetal DNAsamples was monitored by PCR amplification of theD1S80 variable number of tandem repeat (VNTR) poly-morphism (39 ). In all prenatal samples, parental and fetalsamples were haplotyped simultaneously to exclude ma-ternal contamination. As part of the routine diagnosticprotocol, the �-globin genotypes of these samples hadbeen previously determined according to the method ofTan et al. (38 ), but these results were not made known tothe analysts conducting the clinical validation study forthe new QF-PCR method.
Unpaired AF Samples. To evaluate the polymorphism ofthe microsatellite markers within the Singapore popula-tion, 100 AF samples obtained from patients undergoing
174 Ho et al.: Prenatal Diagnosis of HbBarts Hydrops Fetalis
routine prenatal diagnostic screening were used. Twomilliliters of AF were washed and resuspended in 2 mL of1 � PBS before DNA isolation with the QIAamp DNAMini Kit (Qiagen GmbH) according to the manufacturer’srecommendations. QF-PCR was performed with theprimer sequences for the microsatellite markers (seeTable 1 in the Data Supplement that accompanies theonline version of this article at http://www.clinchem.org/content/vol53/issue2).
primer design and analysis of microsatellitemarkersThe breakpoints of —SEA were described by Kutlar et al.(GenBank Accession AY207443) (40 ). These breakpointsequences correspond to nucleotide (nt) 155395 -174700 ofAE006462. Two microsatellite markers (16PTEL05 and16PTEL06) within this deleted region were found usingthe Marshfield Genetic Map Database (http://research.marshfieldclinic.org/genetics/home/index.asp); 16PTEL05is located within nt 160725–160915 and 16PTEL06 islocated within nt 171931–172078 (with reference toAE006462.1); 16PTEL05 contains 2 short tandem repeats(STR): an (AATA)n tetranucleotide repeat and a (CA)ndinucleotide repeat, and 16PTEL06 consists of only (CA)ndinucleotide repeats. Previous experiments had shownthat the polymorphic nature of the 16PTEL05 micro-satellite marker is derived from (CA)n repeats and not(AATA)n repeats (data not shown). Therefore, the primerpair 16PTEL05-F/R was designed to flank only the (CA)nrepeats. The other primer pair, 16PTEL06-F/R, was de-signed to flank the (CA)n repeats of the 16PTEL06 micro-satellite marker. All primers were designed by use ofPrimer Express Software v2.0 (Applied Biosystems) withthe downloaded DNA sequence from GenBank (Acces-sion AE006462). As a control, polymorphic microsatellitemarker D16S539 was used. D16S539 is located on 16q24-qter, which lies outside the �-globin gene cluster. There-fore, deletions and mutations of the �-globin gene clusterwill not affect the integrity of D16S539. The D16S539primer sequences (D16S539-F/R) were obtained fromthe STRBase (http://www.cstl.nist.gov/div831/strbase/)website. During capillary electrophoresis all forward (F)primers were fluorescent-tagged for the detection of theamplified PCR products (see Table 1 in the online DataSupplement).
Singleplex vs Multiplex QF-PCR. To calculate the heterozy-gosities of all 3 microsatellite markers for the determina-tion of polymorphism, we performed singleplex QF-PCRfor each of the primer pairs. For the rest of the samples,D16S539-F/R, 16PTEL05-F/R, and 16PTEL06-F/R, prim-ers were used together within a PCR reaction (single-tubemultiplex-QF-PCR). PCR was performed with 3 �L ofextracted DNA in a volume of 25 �L, with 1 � PCR buffer,2.0 mmol/L MgCl2, 0.8 mmol/L each of deoxynucleotidetriphosphates (PE Biosystems), and 1 Unit of AmpliTaqGold polymerase (Roche). We used 0.6 �mol/L of each
specific primer (Proligo Primers and Probes Pty) forsingleplex QF-PCR. For multiplex QF-PCR, we used0.2 �mol/L D16S539-F/R, 0.5 �mol/L 16PTEL05-F/R,and 1.5 �mol/L 16PTEL06-F/R. Thermal cycling wasperformed in a PTC-200 Thermal Cycler (MJ ResearchInc.,) with an initial 5-min denaturation at 95 °C, followedby 30 cycles of 95 °C for 30 s, 66 °C for 30 s, and 60 °C for30 s, with a final extension of 60 °C for 5 min, followed bya 1-h incubation at 60 °C. Two microliters of the amplifiedPCR products were mixed with 9.5 �L of deionizedformamide and 0.5 �L of GS-500 ROX standard (AppliedBiosystems). The mix was heated at 90 °C for 2 min,followed by 4 °C for 5 min before resolving on the ABIPRISM 310 Genetic Analyzer (Applied Biosystems). Theresulting peaks were analyzed with GeneScan analysissoftware (Applied Biosystems).
Sequencing of Microsatellite Markers. The isolated DNAfrom the 2 healthy samples (healthy-1, healthy-2) wereamplified with the same primer sequences (see Table 1 inthe online Data Supplement), except that the forwardprimers are nonfluorescent labeled. The amplified PCRproducts were purified using the QIAquick PCR Purifica-tion Kit (Qiagen GmbH, Hilden, Germany). Cycle se-quencing was performed using the BigDye Terminatorv3.1 Cycle Sequencing Kit (Applied Biosystems) accord-ing to the manufacturer’s recommendations. Nucleotide-nucleotide BLAST (blastn, http://www.ncbi.nlm.nih.gov/BLAST/) was used to ensure that all the targetsequences of the primers were correctly amplified.
statistical analysisSPSS 14.0 (SPSS Inc.) was used for the statistical analysis.
ResultscontrolsDNA sequences from the 2 healthy volunteers (normal-1,normal-2) were obtained and aligned with the referencesequence, AE006462, by use of the nucleotide-nucleotideBLAST (blastn, http://www.ncbi.nlm.nih.gov/BLAST/).BLAST results confirmed that all the amplified sequenceswere specific to their respective target primers (see Table1 in the online Data Supplement).
In DNA samples isolated from carriers with the�-thalassemia-1 trait (��/—SEA) (carrier-1, carrier-2, GM10799),D16S539 alleles were amplified but only 1 allele wasamplified for each of 16PTEL05 and 16PTEL06 (Fig. 1A).Both alleles of D16S539 in the HbBarts hydrops fetalis celllines (GM03037, GM03433) were amplified and detected,whereas none were detected for 16PTEL05 or 16PTEL06(Fig. 1B). The absence of both 16PTEL05 and 16PTEL06 insamples GM03037 and GM03433 suggested HbBarts hy-drops fetalis (—SEA/—SEA).
blinded studySamples were identified as HbBarts hydrops fetalis(—SEA/—SEA) when D16S539 was amplified in the absence
Clinical Chemistry 53, No. 2, 2007 175
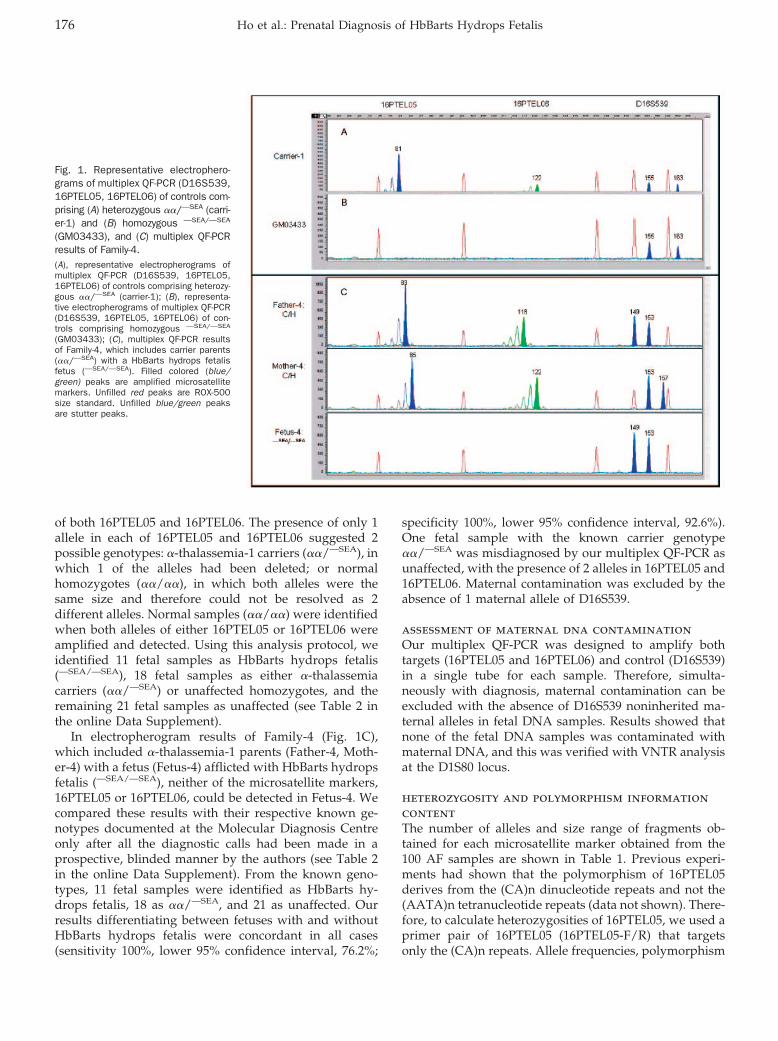
of both 16PTEL05 and 16PTEL06. The presence of only 1allele in each of 16PTEL05 and 16PTEL06 suggested 2possible genotypes: �-thalassemia-1 carriers (��/—SEA), inwhich 1 of the alleles had been deleted; or normalhomozygotes (��/��), in which both alleles were thesame size and therefore could not be resolved as 2different alleles. Normal samples (��/��) were identifiedwhen both alleles of either 16PTEL05 or 16PTEL06 wereamplified and detected. Using this analysis protocol, weidentified 11 fetal samples as HbBarts hydrops fetalis(—SEA/—SEA), 18 fetal samples as either �-thalassemiacarriers (��/—SEA) or unaffected homozygotes, and theremaining 21 fetal samples as unaffected (see Table 2 inthe online Data Supplement).
In electropherogram results of Family-4 (Fig. 1C),which included �-thalassemia-1 parents (Father-4, Moth-er-4) with a fetus (Fetus-4) afflicted with HbBarts hydropsfetalis (—SEA/—SEA), neither of the microsatellite markers,16PTEL05 or 16PTEL06, could be detected in Fetus-4. Wecompared these results with their respective known ge-notypes documented at the Molecular Diagnosis Centreonly after all the diagnostic calls had been made in aprospective, blinded manner by the authors (see Table 2in the online Data Supplement). From the known geno-types, 11 fetal samples were identified as HbBarts hy-drops fetalis, 18 as ��/—SEA, and 21 as unaffected. Ourresults differentiating between fetuses with and withoutHbBarts hydrops fetalis were concordant in all cases(sensitivity 100%, lower 95% confidence interval, 76.2%;
specificity 100%, lower 95% confidence interval, 92.6%).One fetal sample with the known carrier genotype��/—SEA was misdiagnosed by our multiplex QF-PCR asunaffected, with the presence of 2 alleles in 16PTEL05 and16PTEL06. Maternal contamination was excluded by theabsence of 1 maternal allele of D16S539.
assessment of maternal dna contaminationOur multiplex QF-PCR was designed to amplify bothtargets (16PTEL05 and 16PTEL06) and control (D16S539)in a single tube for each sample. Therefore, simulta-neously with diagnosis, maternal contamination can beexcluded with the absence of D16S539 noninherited ma-ternal alleles in fetal DNA samples. Results showed thatnone of the fetal DNA samples was contaminated withmaternal DNA, and this was verified with VNTR analysisat the D1S80 locus.
heterozygosity and polymorphism informationcontentThe number of alleles and size range of fragments ob-tained for each microsatellite marker obtained from the100 AF samples are shown in Table 1. Previous experi-ments had shown that the polymorphism of 16PTEL05derives from the (CA)n dinucleotide repeats and not the(AATA)n tetranucleotide repeats (data not shown). There-fore, to calculate heterozygosities of 16PTEL05, we used aprimer pair of 16PTEL05 (16PTEL05-F/R) that targetsonly the (CA)n repeats. Allele frequencies, polymorphism
Fig. 1. Representative electrophero-grams of multiplex QF-PCR (D16S539,16PTEL05, 16PTEL06) of controls com-prising (A) heterozygous ��/—SEA (carri-er-1) and (B) homozygous —SEA/—SEA
(GM03433), and (C) multiplex QF-PCRresults of Family-4.(A), representative electropherograms ofmultiplex QF-PCR (D16S539, 16PTEL05,16PTEL06) of controls comprising heterozy-gous ��/—SEA (carrier-1); (B), representa-tive electropherograms of multiplex QF-PCR(D16S539, 16PTEL05, 16PTEL06) of con-trols comprising homozygous —SEA/—SEA
(GM03433); (C), multiplex QF-PCR resultsof Family-4, which includes carrier parents(��/—SEA) with a HbBarts hydrops fetalisfetus (—SEA/—SEA). Filled colored (blue/green) peaks are amplified microsatellitemarkers. Unfilled red peaks are ROX-500size standard. Unfilled blue/green peaksare stutter peaks.
176 Ho et al.: Prenatal Diagnosis of HbBarts Hydrops Fetalis
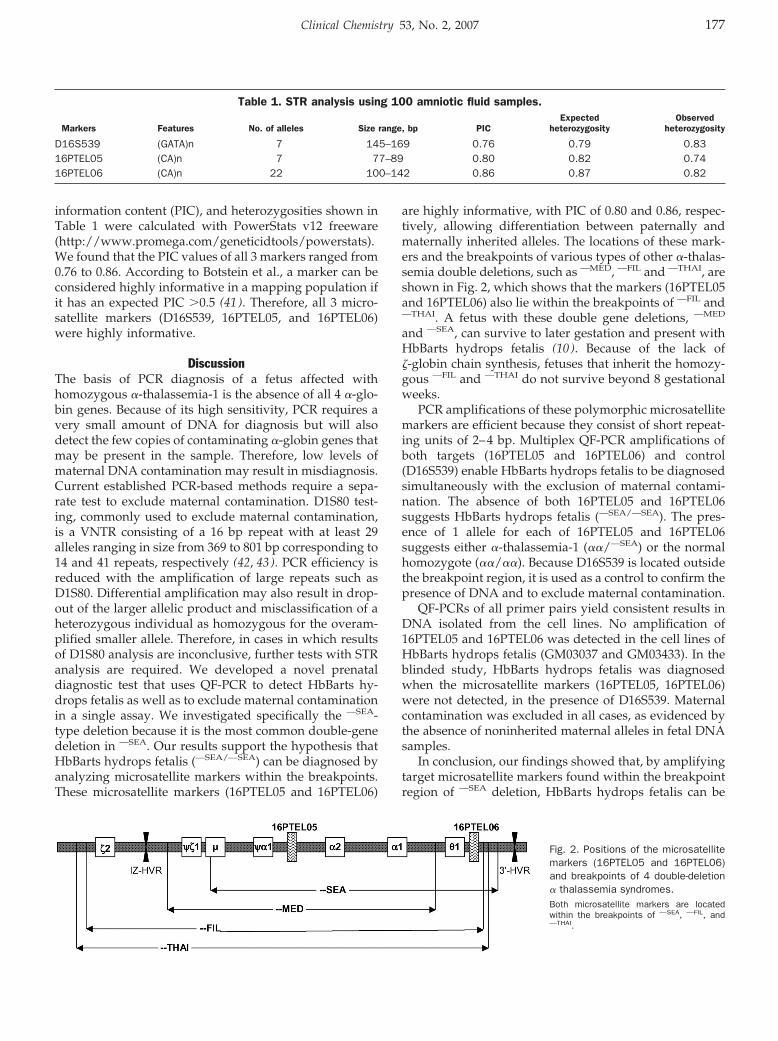
information content (PIC), and heterozygosities shown inTable 1 were calculated with PowerStats v12 freeware(http://www.promega.com/geneticidtools/powerstats).We found that the PIC values of all 3 markers ranged from0.76 to 0.86. According to Botstein et al., a marker can beconsidered highly informative in a mapping population ifit has an expected PIC �0.5 (41 ). Therefore, all 3 micro-satellite markers (D16S539, 16PTEL05, and 16PTEL06)were highly informative.
DiscussionThe basis of PCR diagnosis of a fetus affected withhomozygous �-thalassemia-1 is the absence of all 4 �-glo-bin genes. Because of its high sensitivity, PCR requires avery small amount of DNA for diagnosis but will alsodetect the few copies of contaminating �-globin genes thatmay be present in the sample. Therefore, low levels ofmaternal DNA contamination may result in misdiagnosis.Current established PCR-based methods require a sepa-rate test to exclude maternal contamination. D1S80 test-ing, commonly used to exclude maternal contamination,is a VNTR consisting of a 16 bp repeat with at least 29alleles ranging in size from 369 to 801 bp corresponding to14 and 41 repeats, respectively (42, 43). PCR efficiency isreduced with the amplification of large repeats such asD1S80. Differential amplification may also result in drop-out of the larger allelic product and misclassification of aheterozygous individual as homozygous for the overam-plified smaller allele. Therefore, in cases in which resultsof D1S80 analysis are inconclusive, further tests with STRanalysis are required. We developed a novel prenataldiagnostic test that uses QF-PCR to detect HbBarts hy-drops fetalis as well as to exclude maternal contaminationin a single assay. We investigated specifically the —SEA-type deletion because it is the most common double-genedeletion in —SEA. Our results support the hypothesis thatHbBarts hydrops fetalis (—SEA/—SEA) can be diagnosed byanalyzing microsatellite markers within the breakpoints.These microsatellite markers (16PTEL05 and 16PTEL06)
are highly informative, with PIC of 0.80 and 0.86, respec-tively, allowing differentiation between paternally andmaternally inherited alleles. The locations of these mark-ers and the breakpoints of various types of other �-thalas-semia double deletions, such as —MED, —FIL and —THAI, areshown in Fig. 2, which shows that the markers (16PTEL05and 16PTEL06) also lie within the breakpoints of —FIL and—THAI. A fetus with these double gene deletions, —MED
and —SEA, can survive to later gestation and present withHbBarts hydrops fetalis (10 ). Because of the lack of�-globin chain synthesis, fetuses that inherit the homozy-gous —FIL and —THAI do not survive beyond 8 gestationalweeks.
PCR amplifications of these polymorphic microsatellitemarkers are efficient because they consist of short repeat-ing units of 2–4 bp. Multiplex QF-PCR amplifications ofboth targets (16PTEL05 and 16PTEL06) and control(D16S539) enable HbBarts hydrops fetalis to be diagnosedsimultaneously with the exclusion of maternal contami-nation. The absence of both 16PTEL05 and 16PTEL06suggests HbBarts hydrops fetalis (—SEA/—SEA). The pres-ence of 1 allele for each of 16PTEL05 and 16PTEL06suggests either �-thalassemia-1 (��/—SEA) or the normalhomozygote (��/��). Because D16S539 is located outsidethe breakpoint region, it is used as a control to confirm thepresence of DNA and to exclude maternal contamination.
QF-PCRs of all primer pairs yield consistent results inDNA isolated from the cell lines. No amplification of16PTEL05 and 16PTEL06 was detected in the cell lines ofHbBarts hydrops fetalis (GM03037 and GM03433). In theblinded study, HbBarts hydrops fetalis was diagnosedwhen the microsatellite markers (16PTEL05, 16PTEL06)were not detected, in the presence of D16S539. Maternalcontamination was excluded in all cases, as evidenced bythe absence of noninherited maternal alleles in fetal DNAsamples.
In conclusion, our findings showed that, by amplifyingtarget microsatellite markers found within the breakpointregion of —SEA deletion, HbBarts hydrops fetalis can be
Table 1. STR analysis using 100 amniotic fluid samples.
Markers Features No. of alleles Size range, bp PICExpected
heterozygosityObserved
heterozygosity
D16S539 (GATA)n 7 145–169 0.76 0.79 0.8316PTEL05 (CA)n 7 77–89 0.80 0.82 0.7416PTEL06 (CA)n 22 100–142 0.86 0.87 0.82
Fig. 2. Positions of the microsatellitemarkers (16PTEL05 and 16PTEL06)and breakpoints of 4 double-deletion� thalassemia syndromes.Both microsatellite markers are locatedwithin the breakpoints of —SEA, —FIL, and—THAI.
Clinical Chemistry 53, No. 2, 2007 177
accurately identified. The target microsatellite markersare highly polymorphic, as demonstrated by the heterozy-gosity and PIC calculations of 100 AF samples. Becausethese microsatellite markers are highly polymorphic, ma-ternally and paternally inherited alleles can be differenti-ated and identified in fetal DNA samples. The ability ofour novel QF-PCR method to differentiate between ma-ternally and paternally inherited allele will also be usefulin the analysis of fetal DNA in maternal plasma. Thedetection and identification of the paternally inheritedfetal alleles in the maternal plasma may be useful toexclude HbBarts hydrops fetalis; we are currently explor-ing this strategy for noninvasive prenatal testing (44 ).
This research was supported by the National MedicalResearch Council (NMRC Grant No 0561/2001) and by theNational University Hospital (NUH Grant No 02003/021).
References1. Higgs DR, Vickers MA, Wilkie AO, Pretorius IM, Jarman AP,
Weatherall DJ. A review of the molecular genetics of the human�-globin gene cluster. Blood 1989;73:1081–104.
2. Weatherall DJ, Clegg JB. The Thalassaemia Syndromes. Oxford:Blackwell Science, 2001.
3. Weatherall DJ, Clegg JB, Naughton MA. Globin synthesis inthalassaemia: an in vitro study. Nature 1965;208:1061–5.
4. Weatherall DJ, Clegg JB. Disordered globin synthesis in thalasse-mia. Ann NY Acad Sci 1969;165:242–52.
5. Higgs DR, Thein SL, Wood WG. The biology of the thalassemias.In: Weatherall DJ, Clegg JB, eds. The Thalassemia Syndromes, 4thed. Oxford: Blackwell Science 2001;65–237.
6. Higgs DR, Wainscoat JS, Flint J, Hill AVS, Thein SL, Nicholls RD, etal. Analysis of the human �-globin gene cluster reveals a highlyinformative genetic locus. Proc Natl Acad Sci U S A 1986;83:5165–9.
7. Kan YW, Golbus MS, Dozy AM. Prenatal diagnosis of �-thalasse-mia: clinical application of molecular hybridization. N Engl J Med1976;295:1165–7.
8. Higgs DR. 1990 Mack Forster Prize lecture: the molecular geneticsof the �-globin gene family. Eur J Clin Invest 1990;20:340–7.
9. Ottolenghi S, Lanyon WG, Paul J, Williamson R, Weatherall DJ,Clegg JB, et al. Gene deletion as the cause of �-thalassaemia: thesevere form of �-thalassaemia is caused by a haemoglobin genedeletion. Nature 1974;251:389–92.
10. Chui DHK, Waye JS. Hydrops fetalis caused by �-thalassemia: anemerging health care problem. Blood 1998;91:2213–22.
11. Liang ST, Wong VC, So WW, Ma HK, Chan V, Todd D. Homozygous�-thalassaemia: clinical presentation, diagnosis and manage-ment: a review of 46 cases. Br J Obstet Gynaecol 1985;92:680–4.
12. Bernini LF. Geographic distribution of �-thalassemia. In: SteinbergMH, Forget BG, Higgs DR, Nagel RL, eds. Disorders of Hemoglo-bin: Genetics, Pathophysiology, and Clinical Management. Cam-bridge: Cambridge University Press 2001;878–94.
13. Higgs DR. Molecular mechanisms of �-thalassemia. In: SteinbergMH, Forget BG, Higgs DR, Nagel RL, eds. Disorders of Hemoglo-bin: Genetics, Pathophysiology, and Clinical Management. Cam-bridge: Cambridge University Press 2001;405–30.
14. Cao A, Rosatelli MC, Monni G, Galanello R. Screening for thalas-semia: a model of success. Obstet Gynecol Clin North Am2002;29:305–28.
15. Lau YL, Chan LC, Chan YYA, Ha SY, Yeung CY, Waye JS, et al.Prevalence and genotypes of �- and �-thalassemia carriers inHong Kong: implications for population screening. N Engl J Med1997;336:1298–301.
16. Lemmens-Zygulska M, Eigel A, Helbig B, Sanguansermsri T, HorstJ, Flatz G. Prevalence of �-thalassemias in northern Thailand. HumGenet 1996;98:345–7.
17. Chui DHK. Alpha thalassaemia and population health in South-east Asia. Ann Hum Biol 2005;32:123–30.
18. Kham SK, Quah TC, Loong AM, Tan PL, Fraser A, Chong SC, et al.A molecular epidemiologic study of thalassemia using newborns’cord blood in a multiracial Asian population in Singapore. J PediatrHematol Oncol 2004;26:817–9.
19. Chan V, Chan TK. Prenatal diagnosis of common single genedisorders by DNA technology. Hong Kong Med J 1997;3:173–8.
20. Chu DC, Lee CH, Lo MD, Cheng SW, Chen DP, Wu TL, et al.Non-radioactive Southern hybridization for early diagnosis of�-thalassemia with Southeast Asian-type deletion in Taiwan. Am JMed Genet 2000;95:332–5.
21. Embury SH, Miller JA, Dozy AM, Kan YW, Chan V, Todd D. Twodifferent molecular organizations account for the single �-globingene of the �-thalassemia-2 genotype. J Clin Invest 1980;66:1319–25.
22. Bowden DK, Vickers MA, Higgs DR. A PCR-based strategy todetect the common severe determinants of �-thalassaemia. Br JHaematol 1992;81:104–8.
23. Baysal E, Huisman THJ. Detection of common deletional �-thalas-saemia-2 determinants by PCR. Am J Hematol 1994;46:208–13.
24. Chang JG, Liu TC, Chiou SS, Chen JT, Chen TP, Lin CP. Rapiddetection of –�4.2 deletion of �-thalassemia-2 by polymerasechain reaction. Ann Hematol 1994;69:205–9.
25. Ko TM, Tseng LH, Kao CH, Lin YW, Hwa HL, Hsu PM, et al.Molecular characterization and PCR diagnosis of Thailand deletionof �-globin gene cluster. Am J Hematol 1998;57:124–30.
26. Ko TM, Tseng LH, Hsieh FJ, Hsu PM, Lee TY. Carrier detection andprenatal diagnosis of �-thalassemia of Southeast Asian deletionby polymerase chain reaction. Hum Genet 1992;88:245–8.
27. Chang JG, Lee LS, Lin CP, Chen PH, Chen CP. Rapid diagnosis of� thalassemia-1 of Southeast Asia type and hydrops fetalis bypolymerase chain reaction. Blood 1991;78:853–4.
28. Winichagoon P, Fucharoen S, Kanokpongsakdi S, Fukumaki Y.Detection of �-thalassemia-1 (Southeast Asian type) and itsapplication for prenatal diagnosis. Clin Genet 1995;47:318–20.
29. Harteveld KL, Heister AJ, Giordano PC, Losekoot M, Bernini LF.Rapid detection of point mutations and polymorphisms of the�-globin genes by DGGE and SSCA. Hum Mutat 1996;7:114–22.
30. Jorge SB, Meio MB, Costa FF, Sonati MF. Screening for mutationsin human �-globin genes by nonradioactive single-strand confor-mation polymorphism. Braz J Med Biol Res 2003;36:1471–4.
31. Old JM, Varawalla NY, Weatherall DJ. The rapid detection andprenatal diagnosis of �-thalassaemia: studies in the Asian Indianand Cypriot populations in the UK. Lancet 1990;336:834–7.
32. Foglietta E, Deidda G, Graziani B, Modiano G, Bianco I. Detectionof �-globin gene disorders by a simple PCR methodology [Erratumpublished in: Haematologica 1996;81:XVI]. Haematologica 1996;81:387–96.
33. Faa V, Rosatelli MC, Sardu R, Meloni A, Toffoli C, Cao A. A simpleelectrophoretic procedure for fetal diagnosis of �-thalassaemiadue to short deletions. Prenat Diagn 1992;12:903–8.
34. Waye JS, Eng B, Hunt JA, Chui DHK. Filipino �-thalassemia due toa large deletion: identification of the deletion end points andpolymerase chain reaction (PCR)-based diagnosis. Hum Genet1994;94:530–2.
178 Ho et al.: Prenatal Diagnosis of HbBarts Hydrops Fetalis
35. Chong SS, Boehm CD, Higgs DR, Cutting GR. Single-tube multi-plex-PCR screen for common deletional determinants of �-thalas-semia. Blood 2000;95:360–2.
36. Wang W, Ma ESK, Chan AYY, Prior J, Erber WN, Chan LC, et al.Single-tube multiplex-PCR screen for anti-3.7 and anti-4.2 �-globingene triplications. Clin Chem 2003;49:1679–82.
37. Ko TM, Tseng LH, Hwa HL, Hsu PM, Li SF, Chu JY, et al.Misdiagnosis of homozygous �-thalassaemia 1 may occur ifpolymerase chain reaction alone is used in prenatal diagnosis.Prenat Diagn 1997;17:505–9.
38. Tan ASC, Quah TC, Low PS, Chong SS. A rapid and reliable7-deletion multiplex polymerase chain reaction assay for �-thalas-semia. Blood 2001;98:250–1.
39. Budowle B, Chakraborty R, Giusti AM, Eisenberg AJ, Allen RC.Analysis of the VNTR locus D1S80 by the PCR followed by highresolution PAGE. Am J Hum Genet 1991;48:137–44.
40. Kutlar F, Reese AL, Hsia YE, Kleman KM, Huisman TH. The typesof hemoglobins and globin chains in hydrops fetalis. Hemoglobin1989;13:671–83.
41. Botstein D, White RL, Skolnick M, Davis RW. Construction of agenetic linkage map in man using restriction fragment lengthpolymorphisms. Am J Hum Genet 1980;32:314–31.
42. Cetus Corporation, Berkeley, CA. (1991) D1S80 User’s Guide.43. Kasai K, Nakamura Y, White R. amplification of a variable number
of tandem repeats (VNTR) locus (pMCT118) by the polymerasechain reaction (PCR) and its application to forensic science.J Forensic Sci 1990;35:1196–200.
44. Ho SSY, Chong SS, Koay ESC, Ponnusamy S, Chiu LL, Wang W, etal. Non-invasive prenatal exclusion of haemoglobin Bart’s hydropsfetalis (–SEA/–SEA) using fetal DNA from maternal plasma. Intl SocPrenat Diagn: 13th International Conference for Prenatal Diagno-sis and Therapy, Kyoto, Japan, May 28–31, 2006.
Clinical Chemistry 53, No. 2, 2007 179
Transferrin and Apolipoprotein C-III IsofocusingAre Complementary in the Diagnosis of N- and
O-Glycan Biosynthesis DefectsSuzan Wopereis,1 Stephanie Grunewald,2 Karin M.L.C. Huijben,1 Eva Morava,3
Rosella Mollicone,4 Baziel G.M. van Engelen,5 Dirk J. Lefeber,1 and Ron A. Wevers1*
Background: Apolipoprotein C-III (apoC-III) isoelectricfocusing (IEF) can be used to detect abnormalities in thebiosynthesis of core 1 mucin-type O-glycans.Methods: We studied plasma samples from 55 patientswith various primary defects in N- and/or O-glycosyla-tion, 21 patients with secondary N-glycosylation defects,and 6 patients with possible glycosylation abnormali-ties. Furthermore, we analyzed 500 plasma samples thatwere sent to our laboratory for selective screening forinborn errors of metabolism.Results: Plasma samples from patients with congenitaldisorders of glycosylation (CDG) types –IIe and –IIfshowed a hypoglycosylated apoC-III isoform profile, asdid plasma samples from 75% of the patients with anunspecified CDG type II. Hyposialylated O-glycan pro-files were also seen in plasma from 2 patients withhemolytic-uremic syndrome. In the 500 plasma samplesfrom the selective screening, 3 patients were identifiedwith a possible isolated defect in the biosynthesis ofcore 1 mucin-type O-glycans.Conclusions: To our knowledge this is the first study inwhich use of a plasma marker protein has identifiedpatients in whom only O-glycan biosynthesis might beaffected. The primary defect(s) remain as yet unknown.
Plasma apoC-III IEF is complementary to transferrinisofocusing. In conjunction both tests identify biosyn-thesis defects in N-glycan and mucin-type core 1 O-glycan biosynthesis. The apoC-III IEF assay is likely tohelp metabolic laboratories to identify and unravelfurther subtypes of inborn errors of glycan biosynthesis.© 2007 American Association for Clinical Chemistry
Hypoglycosylation of glycoproteins is characteristic forcongenital disorders of glycosylation6 (CDG). Transferrinisoelectric focusing (TIEF) is generally applied in thescreening for inborn errors in the biosynthesis of N-glycans, whereas apolipoprotein C-III (apoC-III) isoelec-tric focusing (IEF) can be used in the screening for inbornerrors in the biosynthesis of mucin-type core 1 O-glycans(1 ). Plasma transferrin contains 2 complex type N-glycanswith terminal sialic acid residues. The complex typeN-glycan has a common core structure containing 2N-acetylgalactosamine (GlcNAc) and 3 mannose residueswith heterogeneous antennae consisting of GlcNAc, ga-lactose and sialic acid (NeuAc) residues. Because theterminal residues and the branching of N-glycans arevariable, several isoforms of transferrin can be distin-guished. ApoC-III is a plasma protein containing 1 core 1mucin-type O-glycan. Three isoforms of apoC-III can bedistinguished, apoC-III0, apoC-III1 and apoC-III2, forwhich the isoform number, as in transferrin, is the num-
Departments of 1 Laboratory of Pediatrics and Neurology, 3 Pediatrics, and5 Neurology, Radboud University Nijmegen Medical Center, Nijmegen, TheNetherlands.
2 Department of Pediatric Metabolic Medicine and Institute for ChildHealth, Great Ormond Street Hospital, London, United Kingdom.
4 Institut National de la Sante et de la Recherche Medicale (INSERM U602),Groupement de Recherche, Paul Brousse Hospital, University of Paris Villejuif,France.
* Address correspondence to this author at: Laboratory of Pediatrics andNeurology (830), Radboud University Nijmegen Medical Center, Geert Groote-plein 10, 6525 GA Nijmegen, The Netherlands. Fax 31-24-3668754; [email protected].
Received May 27, 2006; accepted November 14, 2006.Previously published online at DOI: 10.1373/clinchem.2006.073940
6 Nonstandard abbreviations: CDG, congenital disorders of glycosylation;TIEF, transferrin isoelectric focusing; ApoC-III, apolipoprotein C-III; IEF,isoelectric focusing; GalNAc, N-acetylgalactosamine; NeuAc, sialic acid; FTC,familial tumoral calcinosis (MIM 211900); HIBM, hereditary inclusion bodymyopathy (MIM 600737); MEB, muscle-eye-brain disease (MIM 253280);HUS, hemolytic uremic syndrome; HGPS, Hutchinson Gilford progeria syn-drome (MIM 176670), F5F8D, a combined deficiency of factor V and factor VIII(MIM 227300); ER, endoplasmic reticulum; COG7, conserved oligomeric Golgicomplex; CMP-NeuAc: cytidine 5�monophospho-N-acetylneuraminic acid;GNE/MNK, uridine-5�-diphosphate-N-acetylglucosamine-2-epimerase/N-acetyl-mannosamine kinase; GALNT3, UDP-GalNAc transferase 3.
Clinical Chemistry 53:2180–187 (2007) Molecular Diagnostics
and Genetics
180
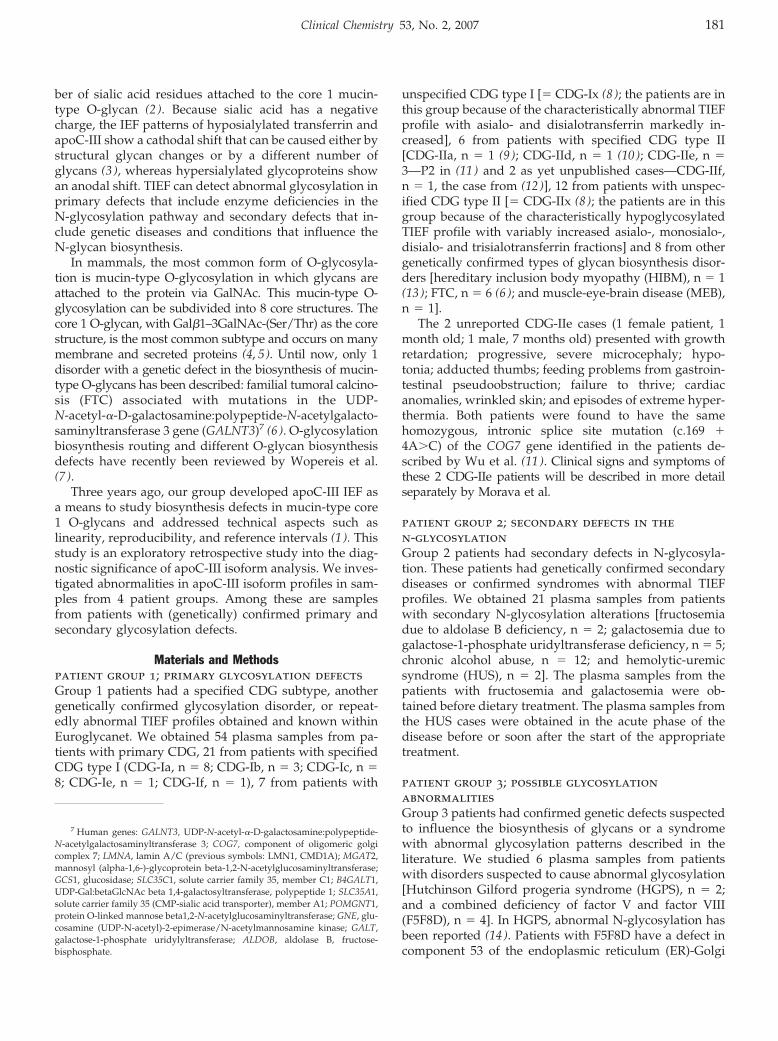
ber of sialic acid residues attached to the core 1 mucin-type O-glycan (2 ). Because sialic acid has a negativecharge, the IEF patterns of hyposialylated transferrin andapoC-III show a cathodal shift that can be caused either bystructural glycan changes or by a different number ofglycans (3 ), whereas hypersialylated glycoproteins showan anodal shift. TIEF can detect abnormal glycosylation inprimary defects that include enzyme deficiencies in theN-glycosylation pathway and secondary defects that in-clude genetic diseases and conditions that influence theN-glycan biosynthesis.
In mammals, the most common form of O-glycosyla-tion is mucin-type O-glycosylation in which glycans areattached to the protein via GalNAc. This mucin-type O-glycosylation can be subdivided into 8 core structures. Thecore 1 O-glycan, with Gal�1–3GalNAc-(Ser/Thr) as the corestructure, is the most common subtype and occurs on manymembrane and secreted proteins (4, 5). Until now, only 1disorder with a genetic defect in the biosynthesis of mucin-type O-glycans has been described: familial tumoral calcino-sis (FTC) associated with mutations in the UDP-N-acetyl-�-D-galactosamine:polypeptide-N-acetylgalacto-saminyltransferase 3 gene (GALNT3)7 (6 ). O-glycosylationbiosynthesis routing and different O-glycan biosynthesisdefects have recently been reviewed by Wopereis et al.(7 ).
Three years ago, our group developed apoC-III IEF asa means to study biosynthesis defects in mucin-type core1 O-glycans and addressed technical aspects such aslinearity, reproducibility, and reference intervals (1 ). Thisstudy is an exploratory retrospective study into the diag-nostic significance of apoC-III isoform analysis. We inves-tigated abnormalities in apoC-III isoform profiles in sam-ples from 4 patient groups. Among these are samplesfrom patients with (genetically) confirmed primary andsecondary glycosylation defects.
Materials and Methodspatient group 1; primary glycosylation defectsGroup 1 patients had a specified CDG subtype, anothergenetically confirmed glycosylation disorder, or repeat-edly abnormal TIEF profiles obtained and known withinEuroglycanet. We obtained 54 plasma samples from pa-tients with primary CDG, 21 from patients with specifiedCDG type I (CDG-Ia, n � 8; CDG-Ib, n � 3; CDG-Ic, n �8; CDG-Ie, n � 1; CDG-If, n � 1), 7 from patients with
unspecified CDG type I [� CDG-Ix (8 ); the patients are inthis group because of the characteristically abnormal TIEFprofile with asialo- and disialotransferrin markedly in-creased], 6 from patients with specified CDG type II[CDG-IIa, n � 1 (9 ); CDG-IId, n � 1 (10 ); CDG-IIe, n �3—P2 in (11 ) and 2 as yet unpublished cases—CDG-IIf,n � 1, the case from (12 )], 12 from patients with unspec-ified CDG type II [� CDG-IIx (8 ); the patients are in thisgroup because of the characteristically hypoglycosylatedTIEF profile with variably increased asialo-, monosialo-,disialo- and trisialotransferrin fractions] and 8 from othergenetically confirmed types of glycan biosynthesis disor-ders [hereditary inclusion body myopathy (HIBM), n � 1(13 ); FTC, n � 6 (6 ); and muscle-eye-brain disease (MEB),n � 1].
The 2 unreported CDG-IIe cases (1 female patient, 1month old; 1 male, 7 months old) presented with growthretardation; progressive, severe microcephaly; hypo-tonia; adducted thumbs; feeding problems from gastroin-testinal pseudoobstruction; failure to thrive; cardiacanomalies, wrinkled skin; and episodes of extreme hyper-thermia. Both patients were found to have the samehomozygous, intronic splice site mutation (c.169 �4A�C) of the COG7 gene identified in the patients de-scribed by Wu et al. (11 ). Clinical signs and symptoms ofthese 2 CDG-IIe patients will be described in more detailseparately by Morava et al.
patient group 2; secondary defects in then-glycosylationGroup 2 patients had secondary defects in N-glycosyla-tion. These patients had genetically confirmed secondarydiseases or confirmed syndromes with abnormal TIEFprofiles. We obtained 21 plasma samples from patientswith secondary N-glycosylation alterations [fructosemiadue to aldolase B deficiency, n � 2; galactosemia due togalactose-1-phosphate uridyltransferase deficiency, n � 5;chronic alcohol abuse, n � 12; and hemolytic-uremicsyndrome (HUS), n � 2]. The plasma samples from thepatients with fructosemia and galactosemia were ob-tained before dietary treatment. The plasma samples fromthe HUS cases were obtained in the acute phase of thedisease before or soon after the start of the appropriatetreatment.
patient group 3; possible glycosylationabnormalitiesGroup 3 patients had confirmed genetic defects suspectedto influence the biosynthesis of glycans or a syndromewith abnormal glycosylation patterns described in theliterature. We studied 6 plasma samples from patientswith disorders suspected to cause abnormal glycosylation[Hutchinson Gilford progeria syndrome (HGPS), n � 2;and a combined deficiency of factor V and factor VIII(F5F8D), n � 4]. In HGPS, abnormal N-glycosylation hasbeen reported (14 ). Patients with F5F8D have a defect incomponent 53 of the endoplasmic reticulum (ER)-Golgi
7 Human genes: GALNT3, UDP-N-acetyl-�-D-galactosamine:polypeptide-N-acetylgalactosaminyltransferase 3; COG7, component of oligomeric golgicomplex 7; LMNA, lamin A/C (previous symbols: LMN1, CMD1A); MGAT2,mannosyl (alpha-1,6-)-glycoprotein beta-1,2-N-acetylglucosaminyltransferase;GCS1, glucosidase; SLC35C1, solute carrier family 35, member C1; B4GALT1,UDP-Gal:betaGlcNAc beta 1,4-galactosyltransferase, polypeptide 1; SLC35A1,solute carrier family 35 (CMP-sialic acid transporter), member A1; POMGNT1,protein O-linked mannose beta1,2-N-acetylglucosaminyltransferase; GNE, glu-cosamine (UDP-N-acetyl)-2-epimerase/N-acetylmannosamine kinase; GALT,galactose-1-phosphate uridylyltransferase; ALDOB, aldolase B, fructose-bisphosphate.
Clinical Chemistry 53, No. 2, 2007 181
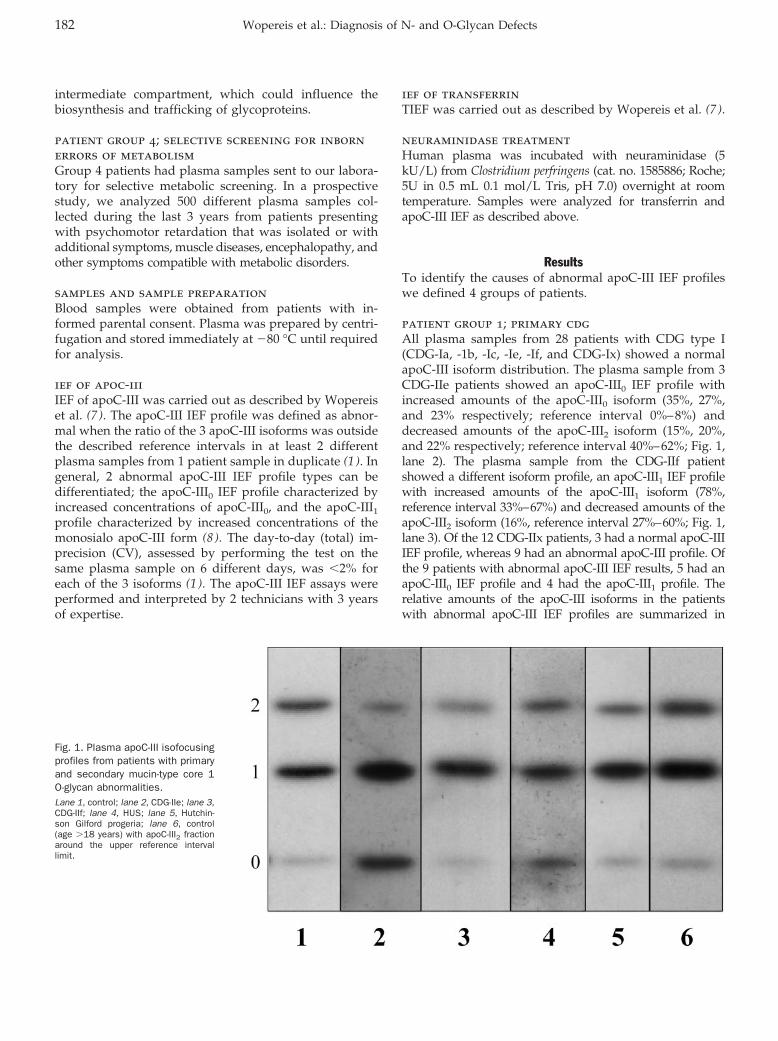
intermediate compartment, which could influence thebiosynthesis and trafficking of glycoproteins.
patient group 4; selective screening for inbornerrors of metabolismGroup 4 patients had plasma samples sent to our labora-tory for selective metabolic screening. In a prospectivestudy, we analyzed 500 different plasma samples col-lected during the last 3 years from patients presentingwith psychomotor retardation that was isolated or withadditional symptoms, muscle diseases, encephalopathy, andother symptoms compatible with metabolic disorders.
samples and sample preparationBlood samples were obtained from patients with in-formed parental consent. Plasma was prepared by centri-fugation and stored immediately at �80 °C until requiredfor analysis.
ief of apoc-iiiIEF of apoC-III was carried out as described by Wopereiset al. (7 ). The apoC-III IEF profile was defined as abnor-mal when the ratio of the 3 apoC-III isoforms was outsidethe described reference intervals in at least 2 differentplasma samples from 1 patient sample in duplicate (1 ). Ingeneral, 2 abnormal apoC-III IEF profile types can bedifferentiated; the apoC-III0 IEF profile characterized byincreased concentrations of apoC-III0, and the apoC-III1
profile characterized by increased concentrations of themonosialo apoC-III form (8 ). The day-to-day (total) im-precision (CV), assessed by performing the test on thesame plasma sample on 6 different days, was �2% foreach of the 3 isoforms (1 ). The apoC-III IEF assays wereperformed and interpreted by 2 technicians with 3 yearsof expertise.
ief of transferrinTIEF was carried out as described by Wopereis et al. (7 ).
neuraminidase treatmentHuman plasma was incubated with neuraminidase (5kU/L) from Clostridium perfringens (cat. no. 1585886; Roche;5U in 0.5 mL 0.1 mol/L Tris, pH 7.0) overnight at roomtemperature. Samples were analyzed for transferrin andapoC-III IEF as described above.
ResultsTo identify the causes of abnormal apoC-III IEF profileswe defined 4 groups of patients.
patient group 1; primary cdgAll plasma samples from 28 patients with CDG type I(CDG-Ia, -1b, -Ic, -Ie, -If, and CDG-Ix) showed a normalapoC-III isoform distribution. The plasma sample from 3CDG-IIe patients showed an apoC-III0 IEF profile withincreased amounts of the apoC-III0 isoform (35%, 27%,and 23% respectively; reference interval 0%–8%) anddecreased amounts of the apoC-III2 isoform (15%, 20%,and 22% respectively; reference interval 40%–62%; Fig. 1,lane 2). The plasma sample from the CDG-IIf patientshowed a different isoform profile, an apoC-III1 IEF profilewith increased amounts of the apoC-III1 isoform (78%,reference interval 33%–67%) and decreased amounts of theapoC-III2 isoform (16%, reference interval 27%–60%; Fig. 1,lane 3). Of the 12 CDG-IIx patients, 3 had a normal apoC-IIIIEF profile, whereas 9 had an abnormal apoC-III profile. Ofthe 9 patients with abnormal apoC-III IEF results, 5 had anapoC-III0 IEF profile and 4 had the apoC-III1 profile. Therelative amounts of the apoC-III isoforms in the patientswith abnormal apoC-III IEF profiles are summarized in
Fig. 1. Plasma apoC-III isofocusingprofiles from patients with primaryand secondary mucin-type core 1O-glycan abnormalities.Lane 1, control; lane 2, CDG-IIe; lane 3,CDG-IIf; lane 4, HUS; lane 5, Hutchin-son Gilford progeria; lane 6, control(age �18 years) with apoC-III2 fractionaround the upper reference intervallimit.
182 Wopereis et al.: Diagnosis of N- and O-Glycan Defects
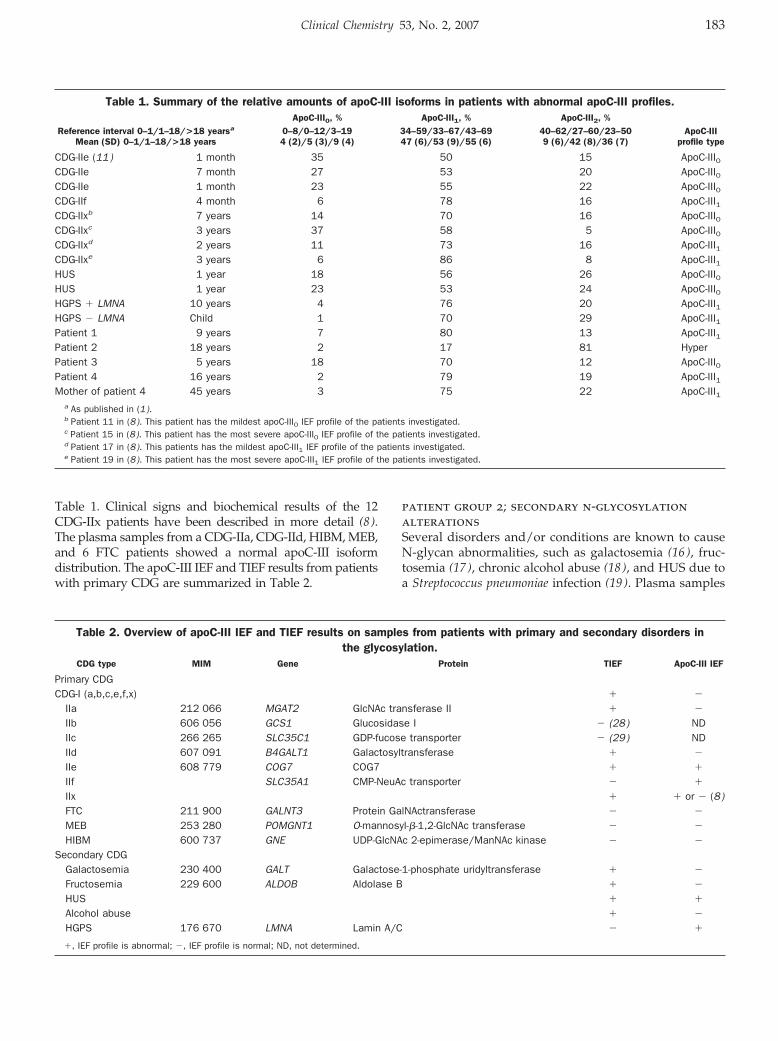
Table 1. Clinical signs and biochemical results of the 12CDG-IIx patients have been described in more detail (8).The plasma samples from a CDG-IIa, CDG-IId, HIBM, MEB,and 6 FTC patients showed a normal apoC-III isoformdistribution. The apoC-III IEF and TIEF results from patientswith primary CDG are summarized in Table 2.
patient group 2; secondary n-glycosylationalterationsSeveral disorders and/or conditions are known to causeN-glycan abnormalities, such as galactosemia (16 ), fruc-tosemia (17 ), chronic alcohol abuse (18 ), and HUS due toa Streptococcus pneumoniae infection (19 ). Plasma samples
Table 1. Summary of the relative amounts of apoC-III isoforms in patients with abnormal apoC-III profiles.
Reference interval 0–1/1–18/>18 yearsa
Mean (SD) 0–1/1–18/>18 years
ApoC-III0, % ApoC-III1, % ApoC-III2, %ApoC-III
profile type0–8/0–12/3–194 (2)/5 (3)/9 (4)
34–59/33–67/43–6947 (6)/53 (9)/55 (6)
40–62/27–60/23–509 (6)/42 (8)/36 (7)
CDG-IIe (11) 1 month 35 50 15 ApoC-III0CDG-IIe 7 month 27 53 20 ApoC-III0CDG-IIe 1 month 23 55 22 ApoC-III0CDG-IIf 4 month 6 78 16 ApoC-III1CDG-IIxb 7 years 14 70 16 ApoC-III0CDG-IIxc 3 years 37 58 5 ApoC-III0CDG-IIxd 2 years 11 73 16 ApoC-III1CDG-IIxe 3 years 6 86 8 ApoC-III1HUS 1 year 18 56 26 ApoC-III0HUS 1 year 23 53 24 ApoC-III0HGPS � LMNA 10 years 4 76 20 ApoC-III1HGPS � LMNA Child 1 70 29 ApoC-III1Patient 1 9 years 7 80 13 ApoC-III1Patient 2 18 years 2 17 81 HyperPatient 3 5 years 18 70 12 ApoC-III0Patient 4 16 years 2 79 19 ApoC-III1Mother of patient 4 45 years 3 75 22 ApoC-III1
a As published in (1).b Patient 11 in (8). This patient has the mildest apoC-III0 IEF profile of the patients investigated.c Patient 15 in (8). This patient has the most severe apoC-III0 IEF profile of the patients investigated.d Patient 17 in (8). This patients has the mildest apoC-III1 IEF profile of the patients investigated.e Patient 19 in (8). This patient has the most severe apoC-III1 IEF profile of the patients investigated.
Table 2. Overview of apoC-III IEF and TIEF results on samples from patients with primary and secondary disorders inthe glycosylation.
CDG type MIM Gene Protein TIEF ApoC-III IEF
Primary CDGCDG-I (a,b,c,e,f,x) � �
IIa 212 066 MGAT2 GlcNAc transferase II � �
IIb 606 056 GCS1 Glucosidase I � (28) NDIIc 266 265 SLC35C1 GDP-fucose transporter � (29) NDIId 607 091 B4GALT1 Galactosyltransferase � �
IIe 608 779 COG7 COG7 � �
IIf SLC35A1 CMP-NeuAc transporter � �
IIx � � or � (8)FTC 211 900 GALNT3 Protein GalNActransferase � �
MEB 253 280 POMGNT1 O-mannosyl-�-1,2-GlcNAc transferase � �
HIBM 600 737 GNE UDP-GlcNAc 2-epimerase/ManNAc kinase � �
Secondary CDGGalactosemia 230 400 GALT Galactose-1-phosphate uridyltransferase � �
Fructosemia 229 600 ALDOB Aldolase B � �
HUS � �
Alcohol abuse � �
HGPS 176 670 LMNA Lamin A/C � �
�, IEF profile is abnormal; �, IEF profile is normal; ND, not determined.
Clinical Chemistry 53, No. 2, 2007 183
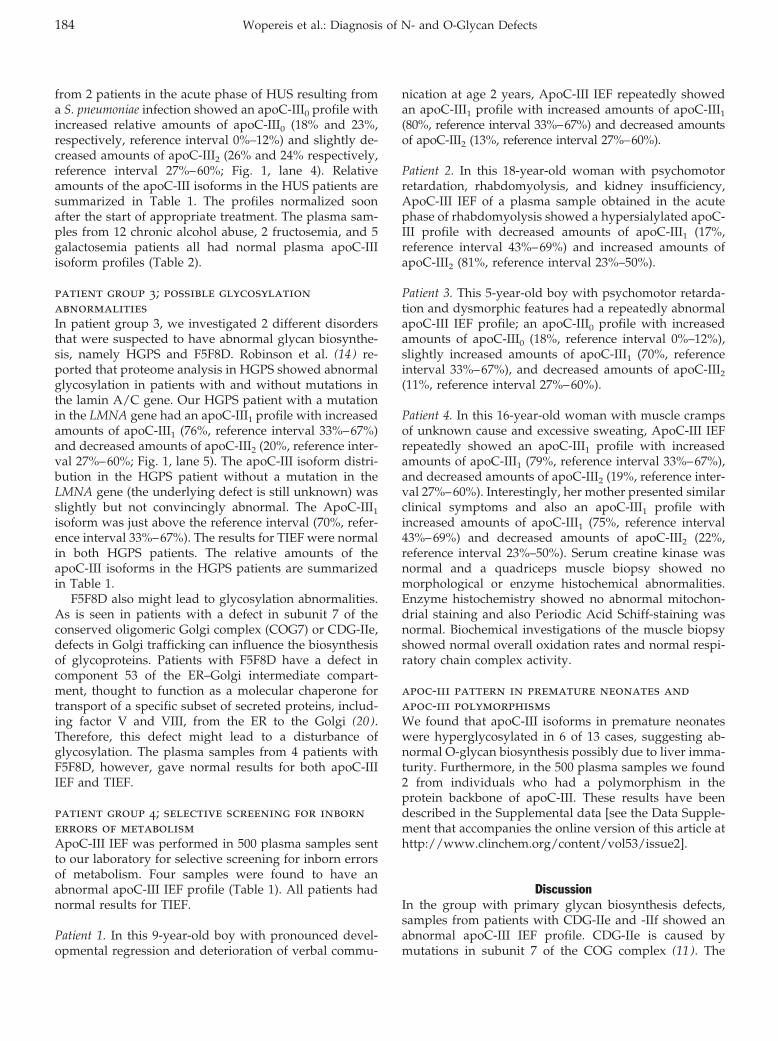
from 2 patients in the acute phase of HUS resulting froma S. pneumoniae infection showed an apoC-III0 profile withincreased relative amounts of apoC-III0 (18% and 23%,respectively, reference interval 0%–12%) and slightly de-creased amounts of apoC-III2 (26% and 24% respectively,reference interval 27%–60%; Fig. 1, lane 4). Relativeamounts of the apoC-III isoforms in the HUS patients aresummarized in Table 1. The profiles normalized soonafter the start of appropriate treatment. The plasma sam-ples from 12 chronic alcohol abuse, 2 fructosemia, and 5galactosemia patients all had normal plasma apoC-IIIisoform profiles (Table 2).
patient group 3; possible glycosylationabnormalitiesIn patient group 3, we investigated 2 different disordersthat were suspected to have abnormal glycan biosynthe-sis, namely HGPS and F5F8D. Robinson et al. (14 ) re-ported that proteome analysis in HGPS showed abnormalglycosylation in patients with and without mutations inthe lamin A/C gene. Our HGPS patient with a mutationin the LMNA gene had an apoC-III1 profile with increasedamounts of apoC-III1 (76%, reference interval 33%–67%)and decreased amounts of apoC-III2 (20%, reference inter-val 27%–60%; Fig. 1, lane 5). The apoC-III isoform distri-bution in the HGPS patient without a mutation in theLMNA gene (the underlying defect is still unknown) wasslightly but not convincingly abnormal. The ApoC-III1
isoform was just above the reference interval (70%, refer-ence interval 33%–67%). The results for TIEF were normalin both HGPS patients. The relative amounts of theapoC-III isoforms in the HGPS patients are summarizedin Table 1.
F5F8D also might lead to glycosylation abnormalities.As is seen in patients with a defect in subunit 7 of theconserved oligomeric Golgi complex (COG7) or CDG-IIe,defects in Golgi trafficking can influence the biosynthesisof glycoproteins. Patients with F5F8D have a defect incomponent 53 of the ER–Golgi intermediate compart-ment, thought to function as a molecular chaperone fortransport of a specific subset of secreted proteins, includ-ing factor V and VIII, from the ER to the Golgi (20 ).Therefore, this defect might lead to a disturbance ofglycosylation. The plasma samples from 4 patients withF5F8D, however, gave normal results for both apoC-IIIIEF and TIEF.
patient group 4; selective screening for inbornerrors of metabolismApoC-III IEF was performed in 500 plasma samples sentto our laboratory for selective screening for inborn errorsof metabolism. Four samples were found to have anabnormal apoC-III IEF profile (Table 1). All patients hadnormal results for TIEF.
Patient 1. In this 9-year-old boy with pronounced devel-opmental regression and deterioration of verbal commu-
nication at age 2 years, ApoC-III IEF repeatedly showedan apoC-III1 profile with increased amounts of apoC-III1
(80%, reference interval 33%–67%) and decreased amountsof apoC-III2 (13%, reference interval 27%–60%).
Patient 2. In this 18-year-old woman with psychomotorretardation, rhabdomyolysis, and kidney insufficiency,ApoC-III IEF of a plasma sample obtained in the acutephase of rhabdomyolysis showed a hypersialylated apoC-III profile with decreased amounts of apoC-III1 (17%,reference interval 43%–69%) and increased amounts ofapoC-III2 (81%, reference interval 23%–50%).
Patient 3. This 5-year-old boy with psychomotor retarda-tion and dysmorphic features had a repeatedly abnormalapoC-III IEF profile; an apoC-III0 profile with increasedamounts of apoC-III0 (18%, reference interval 0%–12%),slightly increased amounts of apoC-III1 (70%, referenceinterval 33%–67%), and decreased amounts of apoC-III2
(11%, reference interval 27%–60%).
Patient 4. In this 16-year-old woman with muscle crampsof unknown cause and excessive sweating, ApoC-III IEFrepeatedly showed an apoC-III1 profile with increasedamounts of apoC-III1 (79%, reference interval 33%–67%),and decreased amounts of apoC-III2 (19%, reference inter-val 27%–60%). Interestingly, her mother presented similarclinical symptoms and also an apoC-III1 profile withincreased amounts of apoC-III1 (75%, reference interval43%–69%) and decreased amounts of apoC-III2 (22%,reference interval 23%–50%). Serum creatine kinase wasnormal and a quadriceps muscle biopsy showed nomorphological or enzyme histochemical abnormalities.Enzyme histochemistry showed no abnormal mitochon-drial staining and also Periodic Acid Schiff-staining wasnormal. Biochemical investigations of the muscle biopsyshowed normal overall oxidation rates and normal respi-ratory chain complex activity.
apoc-iii pattern in premature neonates andapoc-iii polymorphismsWe found that apoC-III isoforms in premature neonateswere hyperglycosylated in 6 of 13 cases, suggesting ab-normal O-glycan biosynthesis possibly due to liver imma-turity. Furthermore, in the 500 plasma samples we found2 from individuals who had a polymorphism in theprotein backbone of apoC-III. These results have beendescribed in the Supplemental data [see the Data Supple-ment that accompanies the online version of this article athttp://www.clinchem.org/content/vol53/issue2].
DiscussionIn the group with primary glycan biosynthesis defects,samples from patients with CDG-IIe and -IIf showed anabnormal apoC-III IEF profile. CDG-IIe is caused bymutations in subunit 7 of the COG complex (11 ). The
184 Wopereis et al.: Diagnosis of N- and O-Glycan Defects
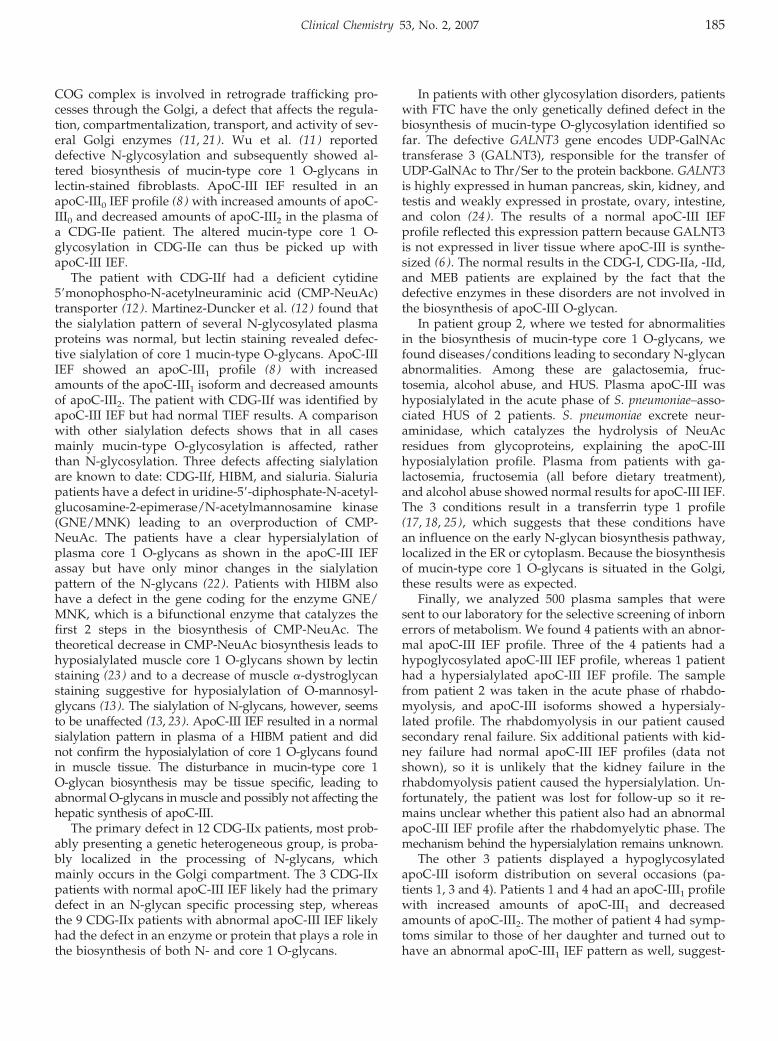
COG complex is involved in retrograde trafficking pro-cesses through the Golgi, a defect that affects the regula-tion, compartmentalization, transport, and activity of sev-eral Golgi enzymes (11, 21). Wu et al. (11 ) reporteddefective N-glycosylation and subsequently showed al-tered biosynthesis of mucin-type core 1 O-glycans inlectin-stained fibroblasts. ApoC-III IEF resulted in anapoC-III0 IEF profile (8 ) with increased amounts of apoC-III0 and decreased amounts of apoC-III2 in the plasma ofa CDG-IIe patient. The altered mucin-type core 1 O-glycosylation in CDG-IIe can thus be picked up withapoC-III IEF.
The patient with CDG-IIf had a deficient cytidine5�monophospho-N-acetylneuraminic acid (CMP-NeuAc)transporter (12 ). Martinez-Duncker et al. (12 ) found thatthe sialylation pattern of several N-glycosylated plasmaproteins was normal, but lectin staining revealed defec-tive sialylation of core 1 mucin-type O-glycans. ApoC-IIIIEF showed an apoC-III1 profile (8 ) with increasedamounts of the apoC-III1 isoform and decreased amountsof apoC-III2. The patient with CDG-IIf was identified byapoC-III IEF but had normal TIEF results. A comparisonwith other sialylation defects shows that in all casesmainly mucin-type O-glycosylation is affected, ratherthan N-glycosylation. Three defects affecting sialylationare known to date: CDG-IIf, HIBM, and sialuria. Sialuriapatients have a defect in uridine-5�-diphosphate-N-acetyl-glucosamine-2-epimerase/N-acetylmannosamine kinase(GNE/MNK) leading to an overproduction of CMP-NeuAc. The patients have a clear hypersialylation ofplasma core 1 O-glycans as shown in the apoC-III IEFassay but have only minor changes in the sialylationpattern of the N-glycans (22 ). Patients with HIBM alsohave a defect in the gene coding for the enzyme GNE/MNK, which is a bifunctional enzyme that catalyzes thefirst 2 steps in the biosynthesis of CMP-NeuAc. Thetheoretical decrease in CMP-NeuAc biosynthesis leads tohyposialylated muscle core 1 O-glycans shown by lectinstaining (23 ) and to a decrease of muscle �-dystroglycanstaining suggestive for hyposialylation of O-mannosyl-glycans (13). The sialylation of N-glycans, however, seemsto be unaffected (13, 23). ApoC-III IEF resulted in a normalsialylation pattern in plasma of a HIBM patient and didnot confirm the hyposialylation of core 1 O-glycans foundin muscle tissue. The disturbance in mucin-type core 1O-glycan biosynthesis may be tissue specific, leading toabnormal O-glycans in muscle and possibly not affecting thehepatic synthesis of apoC-III.
The primary defect in 12 CDG-IIx patients, most prob-ably presenting a genetic heterogeneous group, is proba-bly localized in the processing of N-glycans, whichmainly occurs in the Golgi compartment. The 3 CDG-IIxpatients with normal apoC-III IEF likely had the primarydefect in an N-glycan specific processing step, whereasthe 9 CDG-IIx patients with abnormal apoC-III IEF likelyhad the defect in an enzyme or protein that plays a role inthe biosynthesis of both N- and core 1 O-glycans.
In patients with other glycosylation disorders, patientswith FTC have the only genetically defined defect in thebiosynthesis of mucin-type O-glycosylation identified sofar. The defective GALNT3 gene encodes UDP-GalNActransferase 3 (GALNT3), responsible for the transfer ofUDP-GalNAc to Thr/Ser to the protein backbone. GALNT3is highly expressed in human pancreas, skin, kidney, andtestis and weakly expressed in prostate, ovary, intestine,and colon (24 ). The results of a normal apoC-III IEFprofile reflected this expression pattern because GALNT3is not expressed in liver tissue where apoC-III is synthe-sized (6 ). The normal results in the CDG-I, CDG-IIa, -IId,and MEB patients are explained by the fact that thedefective enzymes in these disorders are not involved inthe biosynthesis of apoC-III O-glycan.
In patient group 2, where we tested for abnormalitiesin the biosynthesis of mucin-type core 1 O-glycans, wefound diseases/conditions leading to secondary N-glycanabnormalities. Among these are galactosemia, fruc-tosemia, alcohol abuse, and HUS. Plasma apoC-III washyposialylated in the acute phase of S. pneumoniae–asso-ciated HUS of 2 patients. S. pneumoniae excrete neur-aminidase, which catalyzes the hydrolysis of NeuAcresidues from glycoproteins, explaining the apoC-IIIhyposialylation profile. Plasma from patients with ga-lactosemia, fructosemia (all before dietary treatment),and alcohol abuse showed normal results for apoC-III IEF.The 3 conditions result in a transferrin type 1 profile(17, 18, 25), which suggests that these conditions havean influence on the early N-glycan biosynthesis pathway,localized in the ER or cytoplasm. Because the biosynthesisof mucin-type core 1 O-glycans is situated in the Golgi,these results were as expected.
Finally, we analyzed 500 plasma samples that weresent to our laboratory for the selective screening of inbornerrors of metabolism. We found 4 patients with an abnor-mal apoC-III IEF profile. Three of the 4 patients had ahypoglycosylated apoC-III IEF profile, whereas 1 patienthad a hypersialylated apoC-III IEF profile. The samplefrom patient 2 was taken in the acute phase of rhabdo-myolysis, and apoC-III isoforms showed a hypersialy-lated profile. The rhabdomyolysis in our patient causedsecondary renal failure. Six additional patients with kid-ney failure had normal apoC-III IEF profiles (data notshown), so it is unlikely that the kidney failure in therhabdomyolysis patient caused the hypersialylation. Un-fortunately, the patient was lost for follow-up so it re-mains unclear whether this patient also had an abnormalapoC-III IEF profile after the rhabdomyelytic phase. Themechanism behind the hypersialylation remains unknown.
The other 3 patients displayed a hypoglycosylatedapoC-III isoform distribution on several occasions (pa-tients 1, 3 and 4). Patients 1 and 4 had an apoC-III1 profilewith increased amounts of apoC-III1 and decreasedamounts of apoC-III2. The mother of patient 4 had symp-toms similar to those of her daughter and turned out tohave an abnormal apoC-III1 IEF pattern as well, suggest-
Clinical Chemistry 53, No. 2, 2007 185
ing dominant or X-linked inheritance. Patient 3 had anapoC-III0 profile with increased apoC-III0 and apoC-III1
and decreased apoC-III2. The results for TIEF were normalin all 3 patients. We were unable to reach a classifyingdiagnosis in any of the 3 patients. They are likely to havethe primary defect situated in one of the steps involvedin the biosynthesis of mucin-type core 1 type O-glycans.To our knowledge this is the first time that patientshave been identified in which only the O-glycan biosyn-thesis might be affected while N-glycan biosynthesis ifunaffected.
In conclusion, the apoC-III IEF test is helpful, especially inpatients with CDG type II, and should be consideredcomplementary to selective screening with TIEF. TheapoC-III isoforms have a broad reference interval in allage cohorts. In some patients only slightly abnormalvalues are found for apoC-III isoforms (as in case CDG-IIx*1 in Table 1). When such slight abnormalities areconfirmed in a 2nd sample they may be meaningful, butas long as the primary defect in these patients has notbeen determined the significance of slight abnormalitiesremains uncertain. No alternative techniques for thescreening of O-glycan biosynthesis disorders are avail-able, although newly developed mass spectrometricapproaches are promising (27, 28 ). The apoC-III IEF testis pivotal to pick up inborn errors in mucin-type core 1O-glycan biosynthesis. The assay is likely to helpmetabolic screening laboratories to identify and un-ravel a further series of inborn errors of glycanbiosynthesis.
This work was supported by the European commis-sion, Euroglycan (contract no. QLG-CT2000-0047), andEuroglycanet (contract no. 512131). We thank M. Huizing,L. Spaapen, E. Sprecher, M. Adamowicz, A. Evangeliou,G. Damen, P. Clayton, and U. Seligsohn for allowing us toinvestigate their patients’ plasma samples.
References1. Wopereis S, Grunewald S, Morava E, Penzien JM, Briones P,
Garcia Silva MT, et al. Apolipoprotein C-III isofocusing in thediagnosis of genetic defects in O-glycan biosynthesis. Clin Chem2003;49:1839–45.
2. Vaith P, Assmann G, Uhlenbruck G. Characterization of the oligo-saccharide side chain of apolipoprotein C-III from human plasmavery low density proteins. Biochim Biophys Acta 1978;541:234–40.
3. Bergen HR, Lacey JM, O’Brien JF, Naylor S. Online single-stepanalysis of blood proteins: the transferrin story. Anal Biochem2001;296:122–9.
4. van den Steen P, Rudd P, Wormald M, Dwek R, Opdenakker G.O-linked glycosylation in focus [Review]. Trends Glycosci Gly-cotechnol 2000;63:35–49.
5. Hounsell EF, Davies MJ, Renouf DV. O-linked protein glycosylationstructure and function. Glycoconj J 1996;13:19–26.
6. Topaz O, Shurman DL, Bergman R, Indelman M, Ratajczak P,Mizrachi M, et al. Mutations in GALNT3, encoding a proteininvolved in O-linked glycosylation, cause familial tumoral calcino-sis. Nat Genet 2004;36:579–81.
7. Wopereis S, Lefeber DJ, Morava E, Wevers RA. Mechanisms inprotein O-glycan biosynthesis and clinical and molecular aspectsof protein O-glycan biosynthesis defects: a review. Clin Chem2006;52:574–600.
8. Wopereis S, Morava E, Grunewald S, Adamowicz M, Huijben K,Lefeber DJ, et al. Patients with unsolved congenital disorders ofglycosylation type II can be subdivided in six distinct biochemicalgroups. Glycobiology 2005;15:1312–9.
9. Jaeken J, Schachter H, Carchon H, De Cock P, Coddeville B, SpikG. Carbohydrate deficient glycoprotein syndrome type II: a defi-ciency in Golgi localised N-acetyl-glucosaminyltransferase II. ArchDis Child 1994;71:123–7.
10. Peters V, Penzien JM, Reiter G, Korner C, Hackler R, Assmann B,et al. Congenital disorder of glycosylation IId (CDG-IId) – a newentity: clinical presentation with Dandy-Walker malformation andmyopathy. Neuropediatrics 2002;33:27–32.
11. Wu X, Steet RA, Bohorov O, Bakker J, Newell J, Krieger M, et al.Mutation of the COG complex subunit gene COG7 causes a lethalcongenital disorder. Nat Med 2004;10:518–23.
12. Martinez Duncker I, Dupre T, Piller V, Piller F, Candelier JJ,Trichet C, et al. Genetic complementation reveals a novelhuman congenital disorder of glycosylation of type II, due toinactivation of the Golgi CMP-sialic acid transporter. Blood2005;105:2671–6.
13. Huizing M, Rakocevic G, Sparks SE, Mamali I, Shatunov A,Goldfarb L, et al. Hypoglycosylation of �-dystroglycan in patientswith hereditary IBM due to GNE mutations. Mol Genet Metab2004;81:196–202.
14. Robinson LJ, Karlsson NG, Weiss AS, Packer NH. Proteomicanalysis of the genetic premature aging disease HutchinsonGilford progeria syndrome reveals differential protein expressionand glycosylation. J Proteome Res 2003;2:556–7.
15. van Eijk HG, van Noort WL. The analysis of human serumtransferrins with the PhastSystem: quantitation of microheteroge-neity. Electrophoresis 1992;13:354–8.
16. Charlwood J, Clayton P, Keir G, Mian N, Winchester B. Defectivegalactosylation of serum transferrin in galactosemia. Glycobiology1998;8:351–7.
17. Jaeken J, Pirard M, Adamowicz M, Pronicka E, Van Schaftingen E.Inhibition of phosphomannose isomerase by fructose 1-phos-phate: an explanation for defective N-glycosylation in hereditaryfructose intolerance. Pediatr Res 1996;40:764–6.
18. Stibler H. Carbohydrate-deficient transferrin in serum: a newmarker of potentially harmful alcohol consumption reviewed. ClinChem 1991;37:2029–37.
19. de Loos F, Huijben KM, van der Kar NC, Monnens LA, van denHeuvel LP, Groener JE, et al. Hemolytic uremic syndrome attribut-able to Streptococcus pneumoniae infection: a novel cause forsecondary protein N-glycan abnormalities. Clin Chem 2002;48:781–4.
20. Nichols WC, Seligsohn U, Zivelin A, Terry VH, Hertel CE, WheatleyMA, et al. Mutations in the ER-Golgi intermediate compartmentprotein ERGIC-53 cause combined deficiency of coagulation fac-tors V and VIII. Cell 1998;93:61–70.
21. Oka T, Ungar D, Hughson FM, Krieger M. The COG and COPIcomplexes interact to control the abundance of GEARs, a subsetof Golgi integral membrane proteins. Mol Biol Cell 2004;15:2423–35.
22. Wopereis S, Abd Hamid UM, Critchley A, Royle L, Dwek RA, MoravaE, et al. Abnormal glycosylation with hypersialylated O-glycans in
186 Wopereis et al.: Diagnosis of N- and O-Glycan Defects

patients with Sialuria. Biochim Biophys Acta 2006;1762:598–607.
23. Tajima Y, Uyama E, Go S, Sato C, Tao N, Kotani M, et al. Distalmyopathy with rimmed vacuoles: impaired O-glycan formation inmuscular glycoproteins. Am J Pathol 2005;166:1121–30.
24. Bennett EP, Hassan H, Clausen H. cDNA cloning and expressionof a novel human UDP-N-acetyl-�-D-galactosamine. PolypeptideN-acetylgalactosaminyltransferase, GalNAc-t3. J Biol Chem 1996;271:17006–12.
25. Adamowicz M, Pronicka E. Carbohydrate deficient glycoproteinsyndrome–like transferrin isoelectric focusing pattern in untreatedfructosaemia. Eur J Pediatr 1996;155:347–8.
26. Hortin GL. The MALDI-TOF Mass Spectrometric View of the plasmaproteome and peptidome. Clin Chem 2006;52:1223–37.
27. Mills K, Mills P, Jackson M, Worthington V, Beesly C, Mann A,et al. Diagnosis of congenital disorders of glycosylation type-Iusing protein chip technology. Proteomics 2006;6:2295–304.
28. Volker C, De Praeter CM, Hardt B, Breuer W, Kalz Fuller B, VanCoster RN, et al. Processing of N-linked carbohydrate chains in apatient with glucosidase I deficiency (CDG type IIb). Glycobiology2002;12:473–83.
29. Grunewald S, Matthijs G, Jaeken J. Congenital disorders ofglycosylation: a review. Pediatr Res 2002;52:618–24.
Clinical Chemistry 53, No. 2, 2007 187
Microarray-in-a-Tube for Detection ofMultiple Viruses
Quanjun Liu, Yunfei Bai, Qinyu Ge, Shixin Zhou, Tian Wen, and Zuhong Lu*
Background: The detection of multiple viruses is im-portant for pathogenic diagnosis and disease control.Microarray detection is a good method, but requirescomplex procedures for multiple virus detection.Methods: We developed a novel PCR assay, the microar-ray-in-a-tube system, which integrates multiple PCRprocesses and DNA microarrays for multiple virus de-tection. A 5 � 5 oligonucleotide microarray for detecting4 respiratory tract viruses (severe acute respiratory syn-drome–associated coronavirus, influenza A virus, influ-enza B virus, and enterovirus) with inner controls wasarranged on the inner surface of a specially designedEppendorf cap with a flat, optically transparent window.Results: We were able to perform all detection processesin the encapsulated system without opening the cap.The 4 viruses were successfully amplified by one-stepreverse transcription–PCR in the encapsulated tube.After the PCR process, the microarray-in-a-tube wasinverted, and the fluorescence-labeled PCR productswere directly hybridized on the microarray. Hybridiza-tion signals were obtained with an ordinary fluorescentmicroscope. The sensitivity of the system for virusdetection reached 102 copies/�L. With the help of innercontrols, the system provided reliable results withoutfalse negatives and false positives.Conclusions: The microarray-in-a-tube system is arapid, labor-saving tool for multiple virus detectionwith several advantages, such as convenience, preven-tion of cross-contamination of the PCR products, andpotential for multiple-gene detection.© 2007 American Association for Clinical Chemistry
Miniaturization of DNA diagnostic assays and integrationfor multipathogen detection are advantageous features
for use in epidemiology, food safety, and antiterrorism.Two different microfluidic systems, continuous flow andfixed hole, were recently developed for use with PCR orreverse transcription (RT)1–PCR, with fluorescence andcapillary electrophoresis as the major detection systemsfor the integrated devices. Although these devices canperform many functions, all of them include high-costmicrofabrication techniques and complicated processingsteps (1–6).
Microarray techniques have great potential in high-throughput analysis for genomic screening. Current DNAmicroarray technology, however, involves the complexand strict execution of multiple experimental processes,and cross-contamination can lead to false results. Thecombination of microfluidics with a microarray in a singledevice is one reported method for solving these problems(7–9).
Severe acute respiratory syndrome (SARS) is a seriousinfectious disease with global impact (10 ). A virus, hu-man coronavirus, strain SARS (HCoV-SARS) has beenisolated from tissues of patients with SARS (10–12). Theearly stage of SARS infection is characterized by fever,dyspnea, lymphopenia, and rapid lung changes visibleon x-ray (10, 13), and thus it can be misdiagnosed asinfluenza. There are 2 prevailing serologic diagnosticmethods for SARS, ELISA (14–16) and indirect immuno-fluorescence assays (12 ), which are very suitable for theSARS diagnosis during the convalescent phase, when thevirus titer is relatively high (17 ). For early diagnosis ofSARS, which is critical for control of the spread of thedisease, nucleic acid testing is more sensitive than theabove assays (18 ). Many qualitative PCR assays havebeen reported (19–21), and electrochemical (22 ), electro-spray ionization mass spectrometry (23 ), and microarraytechniques (24 ) have been used for sequence-specificdetection.
State Key Laboratory of Bioelectronics, Southeast University, Nanjing,People’s Republic of China.
* Address correspondence to this author at: State Key Laboratory ofBioelectronics, Southeast University, Nanjing 210096, People’s Republic ofChina. Fax 086-25-83793779; e-mail [email protected].
Received April 13, 2006; accepted November 2, 2006.Previously published online at DOI: 10.1373/clinchem.2006.071720
1 Nonstandard abbreviations: RT, reverse transcription; SARS, severe acuterespiratory syndrome; HCoV-SARS, human coronavirus, strain SARS;NICPBP, National Institute for the Control of Pharmaceutical and BiologicalProducts.
Clinical Chemistry 53:2188–194 (2007) Molecular Diagnostics
and Genetics
188
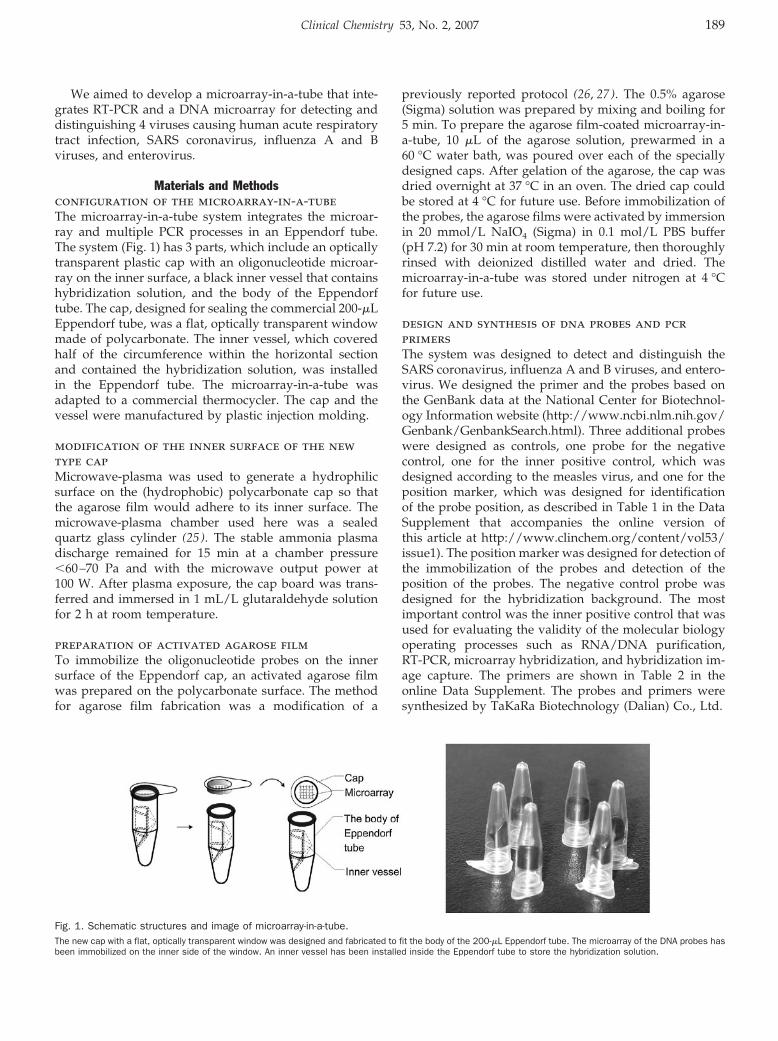
We aimed to develop a microarray-in-a-tube that inte-grates RT-PCR and a DNA microarray for detecting anddistinguishing 4 viruses causing human acute respiratorytract infection, SARS coronavirus, influenza A and Bviruses, and enterovirus.
Materials and Methodsconfiguration of the microarray-in-a-tubeThe microarray-in-a-tube system integrates the microar-ray and multiple PCR processes in an Eppendorf tube.The system (Fig. 1) has 3 parts, which include an opticallytransparent plastic cap with an oligonucleotide microar-ray on the inner surface, a black inner vessel that containshybridization solution, and the body of the Eppendorftube. The cap, designed for sealing the commercial 200-�LEppendorf tube, was a flat, optically transparent windowmade of polycarbonate. The inner vessel, which coveredhalf of the circumference within the horizontal sectionand contained the hybridization solution, was installedin the Eppendorf tube. The microarray-in-a-tube wasadapted to a commercial thermocycler. The cap and thevessel were manufactured by plastic injection molding.
modification of the inner surface of the newtype capMicrowave-plasma was used to generate a hydrophilicsurface on the (hydrophobic) polycarbonate cap so thatthe agarose film would adhere to its inner surface. Themicrowave-plasma chamber used here was a sealedquartz glass cylinder (25 ). The stable ammonia plasmadischarge remained for 15 min at a chamber pressure�60–70 Pa and with the microwave output power at100 W. After plasma exposure, the cap board was trans-ferred and immersed in 1 mL/L glutaraldehyde solutionfor 2 h at room temperature.
preparation of activated agarose filmTo immobilize the oligonucleotide probes on the innersurface of the Eppendorf cap, an activated agarose filmwas prepared on the polycarbonate surface. The methodfor agarose film fabrication was a modification of a
previously reported protocol (26, 27). The 0.5% agarose(Sigma) solution was prepared by mixing and boiling for5 min. To prepare the agarose film-coated microarray-in-a-tube, 10 �L of the agarose solution, prewarmed in a60 °C water bath, was poured over each of the speciallydesigned caps. After gelation of the agarose, the cap wasdried overnight at 37 °C in an oven. The dried cap couldbe stored at 4 °C for future use. Before immobilization ofthe probes, the agarose films were activated by immersionin 20 mmol/L NaIO4 (Sigma) in 0.1 mol/L PBS buffer(pH 7.2) for 30 min at room temperature, then thoroughlyrinsed with deionized distilled water and dried. Themicroarray-in-a-tube was stored under nitrogen at 4 °Cfor future use.
design and synthesis of dna probes and pcrprimersThe system was designed to detect and distinguish theSARS coronavirus, influenza A and B viruses, and entero-virus. We designed the primer and the probes based onthe GenBank data at the National Center for Biotechnol-ogy Information website (http://www.ncbi.nlm.nih.gov/Genbank/GenbankSearch.html). Three additional probeswere designed as controls, one probe for the negativecontrol, one for the inner positive control, which wasdesigned according to the measles virus, and one for theposition marker, which was designed for identificationof the probe position, as described in Table 1 in the DataSupplement that accompanies the online version ofthis article at http://www.clinchem.org/content/vol53/issue1). The position marker was designed for detection ofthe immobilization of the probes and detection of theposition of the probes. The negative control probe wasdesigned for the hybridization background. The mostimportant control was the inner positive control that wasused for evaluating the validity of the molecular biologyoperating processes such as RNA/DNA purification,RT-PCR, microarray hybridization, and hybridization im-age capture. The primers are shown in Table 2 in theonline Data Supplement. The probes and primers weresynthesized by TaKaRa Biotechnology (Dalian) Co., Ltd.
Fig. 1. Schematic structures and image of microarray-in-a-tube.The new cap with a flat, optically transparent window was designed and fabricated to fit the body of the 200-�L Eppendorf tube. The microarray of the DNA probes hasbeen immobilized on the inner side of the window. An inner vessel has been installed inside the Eppendorf tube to store the hybridization solution.
Clinical Chemistry 53, No. 2, 2007 189
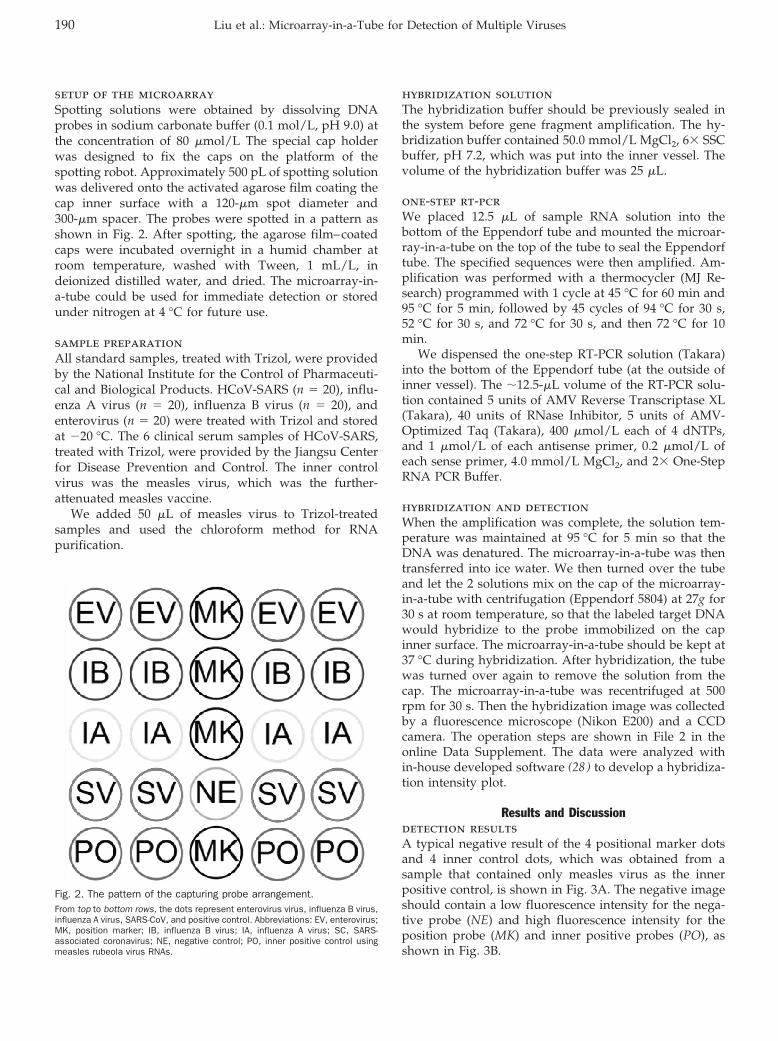
setup of the microarraySpotting solutions were obtained by dissolving DNAprobes in sodium carbonate buffer (0.1 mol/L, pH 9.0) atthe concentration of 80 �mol/L The special cap holderwas designed to fix the caps on the platform of thespotting robot. Approximately 500 pL of spotting solutionwas delivered onto the activated agarose film coating thecap inner surface with a 120-�m spot diameter and300-�m spacer. The probes were spotted in a pattern asshown in Fig. 2. After spotting, the agarose film–coatedcaps were incubated overnight in a humid chamber atroom temperature, washed with Tween, 1 mL/L, indeionized distilled water, and dried. The microarray-in-a-tube could be used for immediate detection or storedunder nitrogen at 4 °C for future use.
sample preparationAll standard samples, treated with Trizol, were providedby the National Institute for the Control of Pharmaceuti-cal and Biological Products. HCoV-SARS (n � 20), influ-enza A virus (n � 20), influenza B virus (n � 20), andenterovirus (n � 20) were treated with Trizol and storedat �20 °C. The 6 clinical serum samples of HCoV-SARS,treated with Trizol, were provided by the Jiangsu Centerfor Disease Prevention and Control. The inner controlvirus was the measles virus, which was the further-attenuated measles vaccine.
We added 50 �L of measles virus to Trizol-treatedsamples and used the chloroform method for RNApurification.
hybridization solutionThe hybridization buffer should be previously sealed inthe system before gene fragment amplification. The hy-bridization buffer contained 50.0 mmol/L MgCl2, 6� SSCbuffer, pH 7.2, which was put into the inner vessel. Thevolume of the hybridization buffer was 25 �L.
one-step rt-pcrWe placed 12.5 �L of sample RNA solution into thebottom of the Eppendorf tube and mounted the microar-ray-in-a-tube on the top of the tube to seal the Eppendorftube. The specified sequences were then amplified. Am-plification was performed with a thermocycler (MJ Re-search) programmed with 1 cycle at 45 °C for 60 min and95 °C for 5 min, followed by 45 cycles of 94 °C for 30 s,52 °C for 30 s, and 72 °C for 30 s, and then 72 °C for 10min.
We dispensed the one-step RT-PCR solution (Takara)into the bottom of the Eppendorf tube (at the outside ofinner vessel). The �12.5-�L volume of the RT-PCR solu-tion contained 5 units of AMV Reverse Transcriptase XL(Takara), 40 units of RNase Inhibitor, 5 units of AMV-Optimized Taq (Takara), 400 �mol/L each of 4 dNTPs,and 1 �mol/L of each antisense primer, 0.2 �mol/L ofeach sense primer, 4.0 mmol/L MgCl2, and 2� One-StepRNA PCR Buffer.
hybridization and detectionWhen the amplification was complete, the solution tem-perature was maintained at 95 °C for 5 min so that theDNA was denatured. The microarray-in-a-tube was thentransferred into ice water. We then turned over the tubeand let the 2 solutions mix on the cap of the microarray-in-a-tube with centrifugation (Eppendorf 5804) at 27g for30 s at room temperature, so that the labeled target DNAwould hybridize to the probe immobilized on the capinner surface. The microarray-in-a-tube should be kept at37 °C during hybridization. After hybridization, the tubewas turned over again to remove the solution from thecap. The microarray-in-a-tube was recentrifuged at 500rpm for 30 s. Then the hybridization image was collectedby a fluorescence microscope (Nikon E200) and a CCDcamera. The operation steps are shown in File 2 in theonline Data Supplement. The data were analyzed within-house developed software (28 ) to develop a hybridiza-tion intensity plot.
Results and Discussiondetection resultsA typical negative result of the 4 positional marker dotsand 4 inner control dots, which was obtained from asample that contained only measles virus as the innerpositive control, is shown in Fig. 3A. The negative imageshould contain a low fluorescence intensity for the nega-tive probe (NE) and high fluorescence intensity for theposition probe (MK) and inner positive probes (PO), asshown in Fig. 3B.
Fig. 2. The pattern of the capturing probe arrangement.From top to bottom rows, the dots represent enterovirus virus, influenza B virus,influenza A virus, SARS-CoV, and positive control. Abbreviations: EV, enterovirus;MK, position marker; IB, influenza B virus; IA, influenza A virus; SC, SARS-associated coronavirus; NE, negative control; PO, inner positive control usingmeasles rubeola virus RNAs.
190 Liu et al.: Microarray-in-a-Tube for Detection of Multiple Viruses
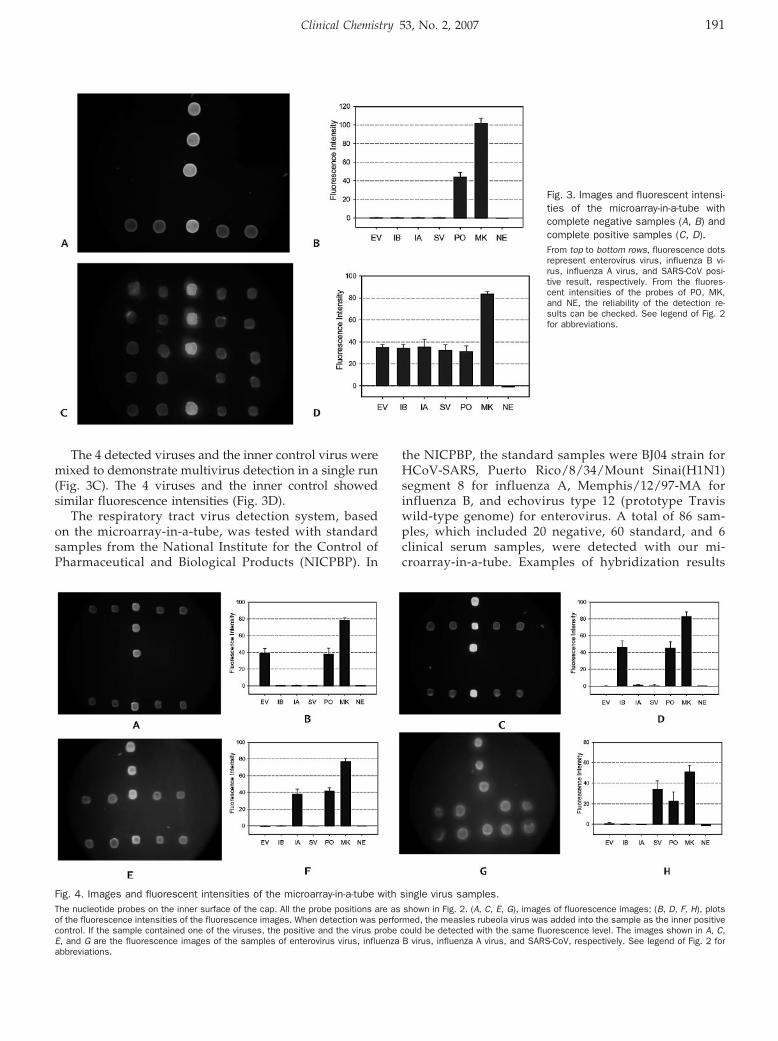
The 4 detected viruses and the inner control virus weremixed to demonstrate multivirus detection in a single run(Fig. 3C). The 4 viruses and the inner control showedsimilar fluorescence intensities (Fig. 3D).
The respiratory tract virus detection system, basedon the microarray-in-a-tube, was tested with standardsamples from the National Institute for the Control ofPharmaceutical and Biological Products (NICPBP). In
the NICPBP, the standard samples were BJ04 strain forHCoV-SARS, Puerto Rico/8/34/Mount Sinai(H1N1)segment 8 for influenza A, Memphis/12/97-MA forinfluenza B, and echovirus type 12 (prototype Traviswild-type genome) for enterovirus. A total of 86 sam-ples, which included 20 negative, 60 standard, and 6clinical serum samples, were detected with our mi-croarray-in-a-tube. Examples of hybridization results
Fig. 3. Images and fluorescent intensi-ties of the microarray-in-a-tube withcomplete negative samples (A, B) andcomplete positive samples (C, D).From top to bottom rows, fluorescence dotsrepresent enterovirus virus, influenza B vi-rus, influenza A virus, and SARS-CoV posi-tive result, respectively. From the fluores-cent intensities of the probes of PO, MK,and NE, the reliability of the detection re-sults can be checked. See legend of Fig. 2for abbreviations.
Fig. 4. Images and fluorescent intensities of the microarray-in-a-tube with single virus samples.The nucleotide probes on the inner surface of the cap. All the probe positions are as shown in Fig. 2. (A, C, E, G), images of fluorescence images; (B, D, F, H), plotsof the fluorescence intensities of the fluorescence images. When detection was performed, the measles rubeola virus was added into the sample as the inner positivecontrol. If the sample contained one of the viruses, the positive and the virus probe could be detected with the same fluorescence level. The images shown in A, C,E, and G are the fluorescence images of the samples of enterovirus virus, influenza B virus, influenza A virus, and SARS-CoV, respectively. See legend of Fig. 2 forabbreviations.
Clinical Chemistry 53, No. 2, 2007 191
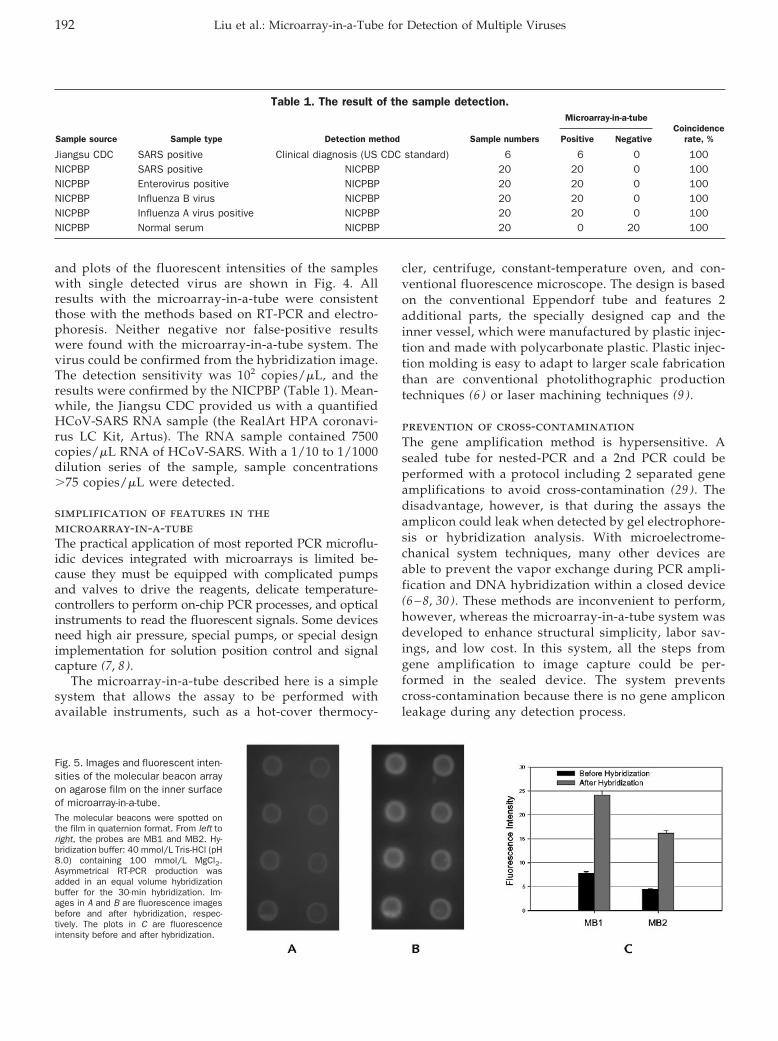
and plots of the fluorescent intensities of the sampleswith single detected virus are shown in Fig. 4. Allresults with the microarray-in-a-tube were consistentthose with the methods based on RT-PCR and electro-phoresis. Neither negative nor false-positive resultswere found with the microarray-in-a-tube system. Thevirus could be confirmed from the hybridization image.The detection sensitivity was 102 copies/�L, and theresults were confirmed by the NICPBP (Table 1). Mean-while, the Jiangsu CDC provided us with a quantifiedHCoV-SARS RNA sample (the RealArt HPA coronavi-rus LC Kit, Artus). The RNA sample contained 7500copies/�L RNA of HCoV-SARS. With a 1/10 to 1/1000dilution series of the sample, sample concentrations�75 copies/�L were detected.
simplification of features in themicroarray-in-a-tubeThe practical application of most reported PCR microflu-idic devices integrated with microarrays is limited be-cause they must be equipped with complicated pumpsand valves to drive the reagents, delicate temperature-controllers to perform on-chip PCR processes, and opticalinstruments to read the fluorescent signals. Some devicesneed high air pressure, special pumps, or special designimplementation for solution position control and signalcapture (7, 8).
The microarray-in-a-tube described here is a simplesystem that allows the assay to be performed withavailable instruments, such as a hot-cover thermocy-
cler, centrifuge, constant-temperature oven, and con-ventional fluorescence microscope. The design is basedon the conventional Eppendorf tube and features 2additional parts, the specially designed cap and theinner vessel, which were manufactured by plastic injec-tion and made with polycarbonate plastic. Plastic injec-tion molding is easy to adapt to larger scale fabricationthan are conventional photolithographic productiontechniques (6 ) or laser machining techniques (9 ).
prevention of cross-contaminationThe gene amplification method is hypersensitive. Asealed tube for nested-PCR and a 2nd PCR could beperformed with a protocol including 2 separated geneamplifications to avoid cross-contamination (29 ). Thedisadvantage, however, is that during the assays theamplicon could leak when detected by gel electrophore-sis or hybridization analysis. With microelectrome-chanical system techniques, many other devices areable to prevent the vapor exchange during PCR ampli-fication and DNA hybridization within a closed device(6 – 8, 30 ). These methods are inconvenient to perform,however, whereas the microarray-in-a-tube system wasdeveloped to enhance structural simplicity, labor sav-ings, and low cost. In this system, all the steps fromgene amplification to image capture could be per-formed in the sealed device. The system preventscross-contamination because there is no gene ampliconleakage during any detection process.
Fig. 5. Images and fluorescent inten-sities of the molecular beacon arrayon agarose film on the inner surfaceof microarray-in-a-tube.The molecular beacons were spotted onthe film in quaternion format. From left toright, the probes are MB1 and MB2. Hy-bridization buffer: 40 mmol/L Tris-HCl (pH8.0) containing 100 mmol/L MgCl2.Asymmetrical RT-PCR production wasadded in an equal volume hybridizationbuffer for the 30-min hybridization. Im-ages in A and B are fluorescence imagesbefore and after hybridization, respec-tively. The plots in C are fluorescenceintensity before and after hybridization.
Table 1. The result of the sample detection.
Sample source Sample type Detection method Sample numbers
Microarray-in-a-tubeCoincidence
rate, %Positive Negative
Jiangsu CDC SARS positive Clinical diagnosis (US CDC standard) 6 6 0 100NICPBP SARS positive NICPBP 20 20 0 100NICPBP Enterovirus positive NICPBP 20 20 0 100NICPBP Influenza B virus NICPBP 20 20 0 100NICPBP Influenza A virus positive NICPBP 20 20 0 100NICPBP Normal serum NICPBP 20 0 20 100
192 Liu et al.: Microarray-in-a-Tube for Detection of Multiple Viruses
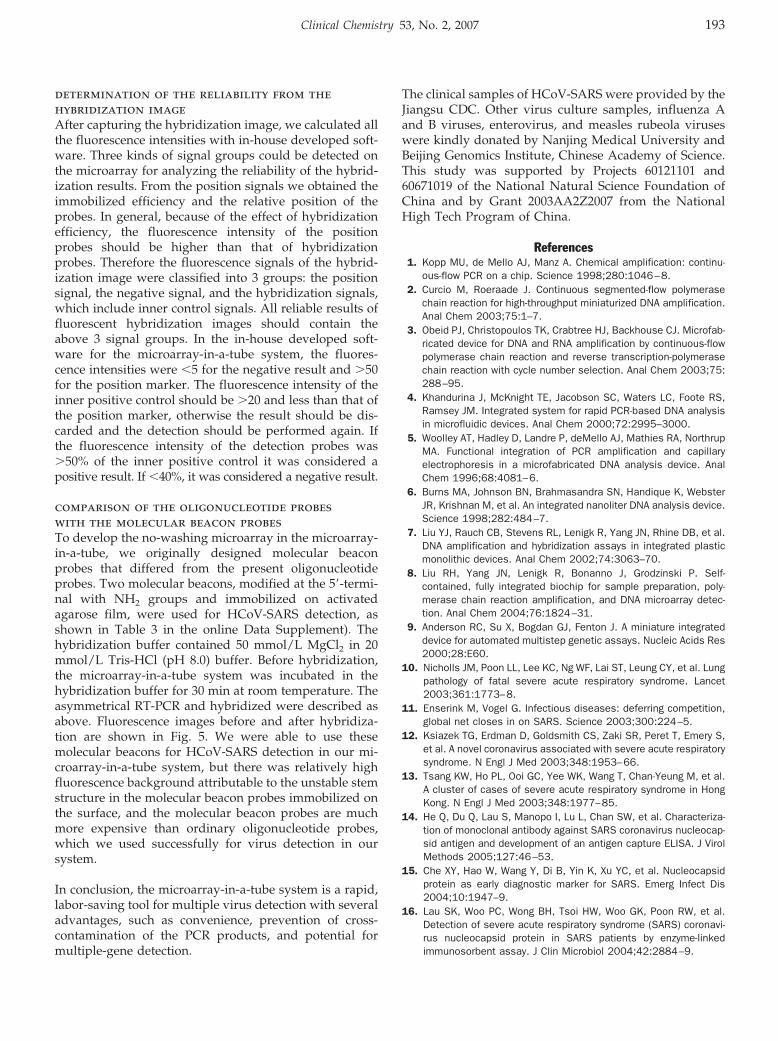
determination of the reliability from thehybridization imageAfter capturing the hybridization image, we calculated allthe fluorescence intensities with in-house developed soft-ware. Three kinds of signal groups could be detected onthe microarray for analyzing the reliability of the hybrid-ization results. From the position signals we obtained theimmobilized efficiency and the relative position of theprobes. In general, because of the effect of hybridizationefficiency, the fluorescence intensity of the positionprobes should be higher than that of hybridizationprobes. Therefore the fluorescence signals of the hybrid-ization image were classified into 3 groups: the positionsignal, the negative signal, and the hybridization signals,which include inner control signals. All reliable results offluorescent hybridization images should contain theabove 3 signal groups. In the in-house developed soft-ware for the microarray-in-a-tube system, the fluores-cence intensities were �5 for the negative result and �50for the position marker. The fluorescence intensity of theinner positive control should be �20 and less than that ofthe position marker, otherwise the result should be dis-carded and the detection should be performed again. Ifthe fluorescence intensity of the detection probes was�50% of the inner positive control it was considered apositive result. If �40%, it was considered a negative result.
comparison of the oligonucleotide probeswith the molecular beacon probesTo develop the no-washing microarray in the microarray-in-a-tube, we originally designed molecular beaconprobes that differed from the present oligonucleotideprobes. Two molecular beacons, modified at the 5�-termi-nal with NH2 groups and immobilized on activatedagarose film, were used for HCoV-SARS detection, asshown in Table 3 in the online Data Supplement). Thehybridization buffer contained 50 mmol/L MgCl2 in 20mmol/L Tris-HCl (pH 8.0) buffer. Before hybridization,the microarray-in-a-tube system was incubated in thehybridization buffer for 30 min at room temperature. Theasymmetrical RT-PCR and hybridized were described asabove. Fluorescence images before and after hybridiza-tion are shown in Fig. 5. We were able to use thesemolecular beacons for HCoV-SARS detection in our mi-croarray-in-a-tube system, but there was relatively highfluorescence background attributable to the unstable stemstructure in the molecular beacon probes immobilized onthe surface, and the molecular beacon probes are muchmore expensive than ordinary oligonucleotide probes,which we used successfully for virus detection in oursystem.
In conclusion, the microarray-in-a-tube system is a rapid,labor-saving tool for multiple virus detection with severaladvantages, such as convenience, prevention of cross-contamination of the PCR products, and potential formultiple-gene detection.
The clinical samples of HCoV-SARS were provided by theJiangsu CDC. Other virus culture samples, influenza Aand B viruses, enterovirus, and measles rubeola viruseswere kindly donated by Nanjing Medical University andBeijing Genomics Institute, Chinese Academy of Science.This study was supported by Projects 60121101 and60671019 of the National Natural Science Foundation ofChina and by Grant 2003AA2Z2007 from the NationalHigh Tech Program of China.
References1. Kopp MU, de Mello AJ, Manz A. Chemical amplification: continu-
ous-flow PCR on a chip. Science 1998;280:1046–8.2. Curcio M, Roeraade J. Continuous segmented-flow polymerase
chain reaction for high-throughput miniaturized DNA amplification.Anal Chem 2003;75:1–7.
3. Obeid PJ, Christopoulos TK, Crabtree HJ, Backhouse CJ. Microfab-ricated device for DNA and RNA amplification by continuous-flowpolymerase chain reaction and reverse transcription-polymerasechain reaction with cycle number selection. Anal Chem 2003;75:288–95.
4. Khandurina J, McKnight TE, Jacobson SC, Waters LC, Foote RS,Ramsey JM. Integrated system for rapid PCR-based DNA analysisin microfluidic devices. Anal Chem 2000;72:2995–3000.
5. Woolley AT, Hadley D, Landre P, deMello AJ, Mathies RA, NorthrupMA. Functional integration of PCR amplification and capillaryelectrophoresis in a microfabricated DNA analysis device. AnalChem 1996;68:4081–6.
6. Burns MA, Johnson BN, Brahmasandra SN, Handique K, WebsterJR, Krishnan M, et al. An integrated nanoliter DNA analysis device.Science 1998;282:484–7.
7. Liu YJ, Rauch CB, Stevens RL, Lenigk R, Yang JN, Rhine DB, et al.DNA amplification and hybridization assays in integrated plasticmonolithic devices. Anal Chem 2002;74:3063–70.
8. Liu RH, Yang JN, Lenigk R, Bonanno J, Grodzinski P. Self-contained, fully integrated biochip for sample preparation, poly-merase chain reaction amplification, and DNA microarray detec-tion. Anal Chem 2004;76:1824–31.
9. Anderson RC, Su X, Bogdan GJ, Fenton J. A miniature integrateddevice for automated multistep genetic assays. Nucleic Acids Res2000;28:E60.
10. Nicholls JM, Poon LL, Lee KC, Ng WF, Lai ST, Leung CY, et al. Lungpathology of fatal severe acute respiratory syndrome. Lancet2003;361:1773–8.
11. Enserink M, Vogel G. Infectious diseases: deferring competition,global net closes in on SARS. Science 2003;300:224–5.
12. Ksiazek TG, Erdman D, Goldsmith CS, Zaki SR, Peret T, Emery S,et al. A novel coronavirus associated with severe acute respiratorysyndrome. N Engl J Med 2003;348:1953–66.
13. Tsang KW, Ho PL, Ooi GC, Yee WK, Wang T, Chan-Yeung M, et al.A cluster of cases of severe acute respiratory syndrome in HongKong. N Engl J Med 2003;348:1977–85.
14. He Q, Du Q, Lau S, Manopo I, Lu L, Chan SW, et al. Characteriza-tion of monoclonal antibody against SARS coronavirus nucleocap-sid antigen and development of an antigen capture ELISA. J VirolMethods 2005;127:46–53.
15. Che XY, Hao W, Wang Y, Di B, Yin K, Xu YC, et al. Nucleocapsidprotein as early diagnostic marker for SARS. Emerg Infect Dis2004;10:1947–9.
16. Lau SK, Woo PC, Wong BH, Tsoi HW, Woo GK, Poon RW, et al.Detection of severe acute respiratory syndrome (SARS) coronavi-rus nucleocapsid protein in SARS patients by enzyme-linkedimmunosorbent assay. J Clin Microbiol 2004;42:2884–9.
Clinical Chemistry 53, No. 2, 2007 193
17. Yam WC, Chan KH, Poon LL, Guan Y, Yuen KY, Seto WH, et al.Evaluation of reverse transcription-PCR assays for rapid diagnosisof severe acute respiratory syndrome associated with a novelcoronavirus. J Clin Microbiol 2003;41:4521–4.
18. Yu AC, Lau LT, Fung YW. Boosting the sensitivity of real-timepolymerase-chain-reaction testing for SARS. N Engl J Med 2004;350:1577–9.
19. Poon LL, Wong OK, Chan KH, Luk W, Yuen KY, Peiris JS, et al.Rapid diagnosis of a coronavirus associated with severe acuterespiratory syndrome (SARS). Clin Chem 2003;49:953–5.
20. Poon LL, Wong BW, Chan KH, Ng SS, Yuen KY, Guan Y, et al.Evaluation of real-time reverse transcriptase PCR and real-timeloop-mediated amplification assays for severe acute respiratorysyndrome coronavirus detection. J Clin Microbiol 2005;43:3457–9.
21. Houng HS, Norwood D, Ludwig GV, Sun W, Lin M, Vaughn DW.Development and evaluation of an efficient 3�-noncoding regionbased SARS coronavirus (SARS-CoV) RT-PCR assay for detectionof SARS-CoV infections. J Virol Methods 2004;120:33–40.
22. Abad-Valle P, Fernandez-Abedul MT, Costa-Garcia A. Genosensoron gold films with enzymatic electrochemical detection of a SARSvirus sequence. Biosens Bioelectron 2005;20:2251–60.
23. Sampath R, Hofstadler SA, Blyn LB, Eshoo MW, Hall TA, MassireC, et al. Rapid identification of emerging pathogens: coronavirus.Emerg Infect Dis 2005;11:373–9.
24. Juang JL, Chen TC, Jiang SS, Hsiung CA, Chen WC, Chen GW, etal. Coupling multiplex RT-PCR to a gene chip assay for sensitiveand semiquantitative detection of severe acute respiratory syn-drome-coronavirus. Lab Invest 2004;84:1085–91.
25. He Q, Liu Z, Xiao P, Liang R, He N, Lu Z. Preparation of hydrophilicpoly (dimethylsiloxane) stamps by plasma-induced grafting. Lang-muir 2003;19:6982–6.
26. Wang H, Li J, Liu H, Liu Q, Mei Q, Wang Y, et al. Label-freehybridization detection of a single nucleotide mismatch by immo-bilization of molecular beacons on an agarose film. Nucleic AcidsRes 2002;30:e61.
27. Afanassiev V, Hanemann V, Wolfl S. Preparation of DNA andprotein micro arrays on glass slides coated with an agarose film.Nucleic Acids Res 2000;28:e66.
28. Liu Q, Zhou Q, Bai Y, Ge Q, Lu Z. Detection and analysis systemfor hybridization images of lab-in-a-tube microarray. Chinese SciBull 2005;50:2896–900.
29. Tao SC, Jiang D, Lu HL, Xing WL, Zhou YX, Cheng J. One-tubenested RT-PCR enabled by using a plastic film and its applicationfor the rapid detection of SARS-virus. Biotechnol Lett 2004;26:179–83.
30. Lenigk R, Liu RH, Athavale M, Chen Z, Ganser D, Yang J, et al.Plastic biochannel hybridization devices: a new concept for mi-crofluidic DNA arrays. Anal Biochem 2002;311:40–9.
194 Liu et al.: Microarray-in-a-Tube for Detection of Multiple Viruses
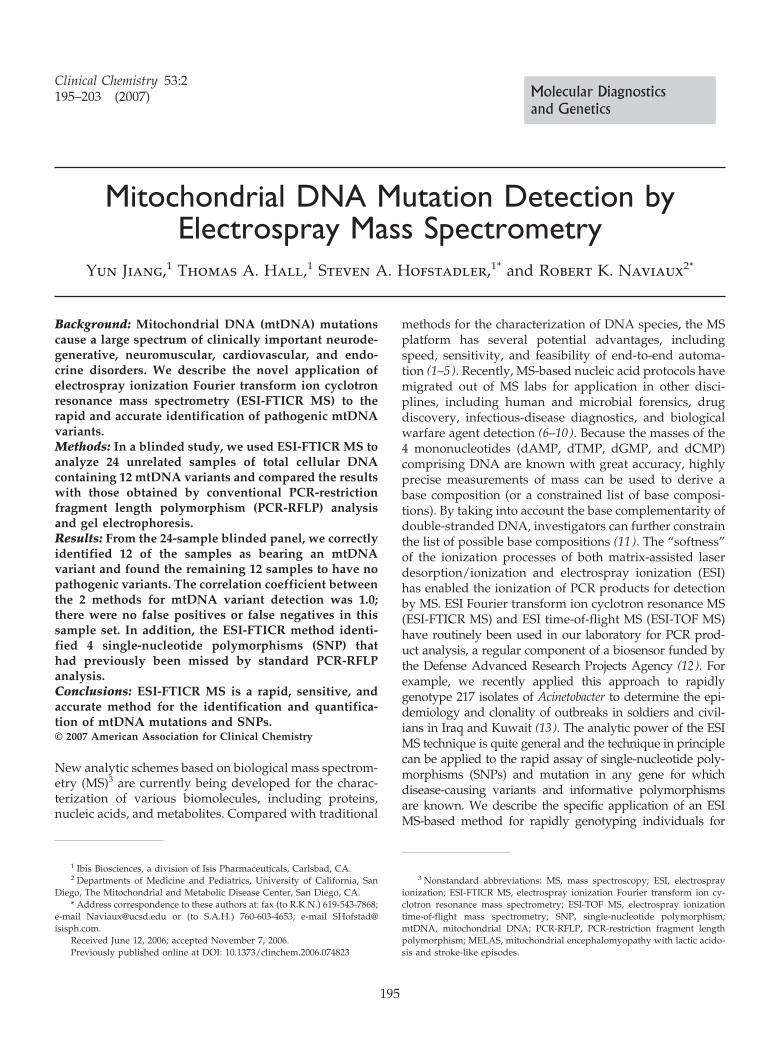
Mitochondrial DNA Mutation Detection byElectrospray Mass Spectrometry
Yun Jiang,1 Thomas A. Hall,1 Steven A. Hofstadler,1* and Robert K. Naviaux2*
Background: Mitochondrial DNA (mtDNA) mutationscause a large spectrum of clinically important neurode-generative, neuromuscular, cardiovascular, and endo-crine disorders. We describe the novel application ofelectrospray ionization Fourier transform ion cyclotronresonance mass spectrometry (ESI-FTICR MS) to therapid and accurate identification of pathogenic mtDNAvariants.Methods: In a blinded study, we used ESI-FTICR MS toanalyze 24 unrelated samples of total cellular DNAcontaining 12 mtDNA variants and compared the resultswith those obtained by conventional PCR-restrictionfragment length polymorphism (PCR-RFLP) analysisand gel electrophoresis.Results: From the 24-sample blinded panel, we correctlyidentified 12 of the samples as bearing an mtDNAvariant and found the remaining 12 samples to have nopathogenic variants. The correlation coefficient betweenthe 2 methods for mtDNA variant detection was 1.0;there were no false positives or false negatives in thissample set. In addition, the ESI-FTICR method identi-fied 4 single-nucleotide polymorphisms (SNP) thathad previously been missed by standard PCR-RFLPanalysis.Conclusions: ESI-FTICR MS is a rapid, sensitive, andaccurate method for the identification and quantifica-tion of mtDNA mutations and SNPs.© 2007 American Association for Clinical Chemistry
New analytic schemes based on biological mass spectrom-etry (MS)3 are currently being developed for the charac-terization of various biomolecules, including proteins,nucleic acids, and metabolites. Compared with traditional
methods for the characterization of DNA species, the MSplatform has several potential advantages, includingspeed, sensitivity, and feasibility of end-to-end automa-tion (1–5). Recently, MS-based nucleic acid protocols havemigrated out of MS labs for application in other disci-plines, including human and microbial forensics, drugdiscovery, infectious-disease diagnostics, and biologicalwarfare agent detection (6–10). Because the masses of the4 mononucleotides (dAMP, dTMP, dGMP, and dCMP)comprising DNA are known with great accuracy, highlyprecise measurements of mass can be used to derive abase composition (or a constrained list of base composi-tions). By taking into account the base complementarity ofdouble-stranded DNA, investigators can further constrainthe list of possible base compositions (11 ). The “softness”of the ionization processes of both matrix-assisted laserdesorption/ionization and electrospray ionization (ESI)has enabled the ionization of PCR products for detectionby MS. ESI Fourier transform ion cyclotron resonance MS(ESI-FTICR MS) and ESI time-of-flight MS (ESI-TOF MS)have routinely been used in our laboratory for PCR prod-uct analysis, a regular component of a biosensor funded bythe Defense Advanced Research Projects Agency (12). Forexample, we recently applied this approach to rapidlygenotype 217 isolates of Acinetobacter to determine the epi-demiology and clonality of outbreaks in soldiers and civil-ians in Iraq and Kuwait (13). The analytic power of the ESIMS technique is quite general and the technique in principlecan be applied to the rapid assay of single-nucleotide poly-morphisms (SNPs) and mutation in any gene for whichdisease-causing variants and informative polymorphismsare known. We describe the specific application of an ESIMS-based method for rapidly genotyping individuals for
1 Ibis Biosciences, a division of Isis Pharmaceuticals, Carlsbad, CA.2 Departments of Medicine and Pediatrics, University of California, San
Diego, The Mitochondrial and Metabolic Disease Center, San Diego, CA.* Address correspondence to these authors at: fax (to R.K.N.) 619-543-7868;
e-mail [email protected] or (to S.A.H.) 760-603-4653; e-mail [email protected].
Received June 12, 2006; accepted November 7, 2006.Previously published online at DOI: 10.1373/clinchem.2006.074823
3 Nonstandard abbreviations: MS, mass spectroscopy; ESI, electrosprayionization; ESI-FTICR MS, electrospray ionization Fourier transform ion cy-clotron resonance mass spectrometry; ESI-TOF MS, electrospray ionizationtime-of-flight mass spectrometry; SNP, single-nucleotide polymorphism;mtDNA, mitochondrial DNA; PCR-RFLP, PCR-restriction fragment lengthpolymorphism; MELAS, mitochondrial encephalomyopathy with lactic acido-sis and stroke-like episodes.
Clinical Chemistry 53:2195–203 (2007) Molecular Diagnostics
and Genetics
195
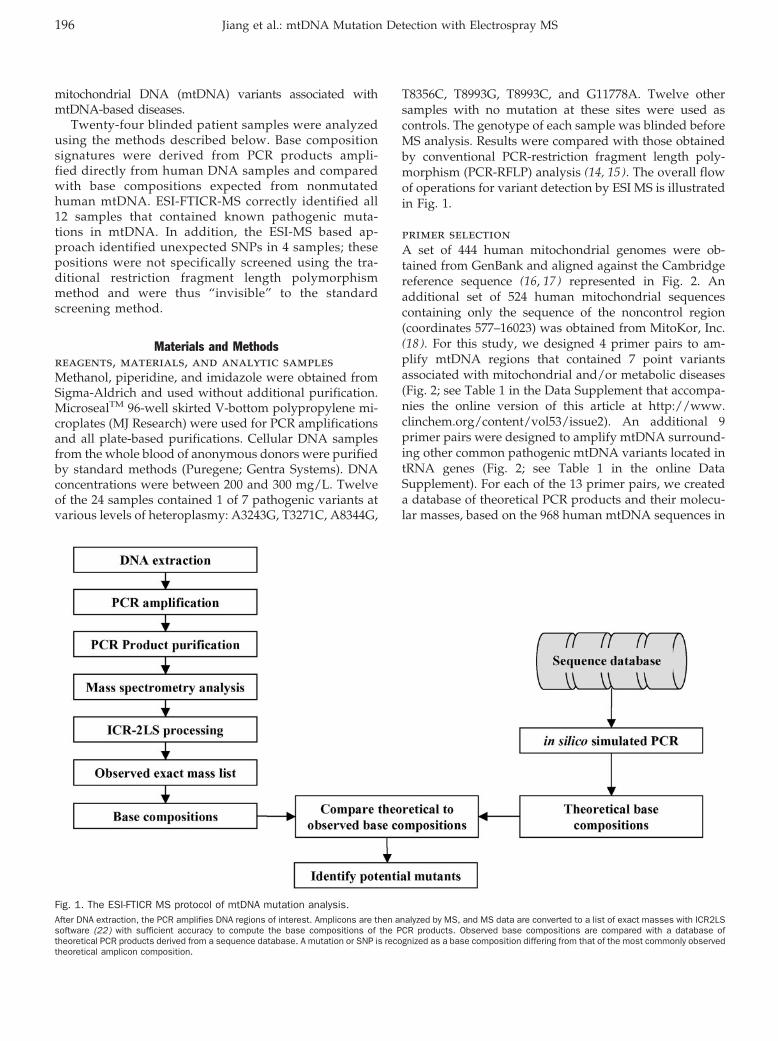
mitochondrial DNA (mtDNA) variants associated withmtDNA-based diseases.
Twenty-four blinded patient samples were analyzedusing the methods described below. Base compositionsignatures were derived from PCR products ampli-fied directly from human DNA samples and comparedwith base compositions expected from nonmutatedhuman mtDNA. ESI-FTICR-MS correctly identified all12 samples that contained known pathogenic muta-tions in mtDNA. In addition, the ESI-MS based ap-proach identified unexpected SNPs in 4 samples; thesepositions were not specifically screened using the tra-ditional restriction fragment length polymorphismmethod and were thus “invisible” to the standardscreening method.
Materials and Methodsreagents, materials, and analytic samplesMethanol, piperidine, and imidazole were obtained fromSigma-Aldrich and used without additional purification.MicrosealTM 96-well skirted V-bottom polypropylene mi-croplates (MJ Research) were used for PCR amplificationsand all plate-based purifications. Cellular DNA samplesfrom the whole blood of anonymous donors were purifiedby standard methods (Puregene; Gentra Systems). DNAconcentrations were between 200 and 300 mg/L. Twelveof the 24 samples contained 1 of 7 pathogenic variants atvarious levels of heteroplasmy: A3243G, T3271C, A8344G,
T8356C, T8993G, T8993C, and G11778A. Twelve othersamples with no mutation at these sites were used ascontrols. The genotype of each sample was blinded beforeMS analysis. Results were compared with those obtainedby conventional PCR-restriction fragment length poly-morphism (PCR-RFLP) analysis (14, 15 ). The overall flowof operations for variant detection by ESI MS is illustratedin Fig. 1.
primer selectionA set of 444 human mitochondrial genomes were ob-tained from GenBank and aligned against the Cambridgereference sequence (16, 17) represented in Fig. 2. Anadditional set of 524 human mitochondrial sequencescontaining only the sequence of the noncontrol region(coordinates 577–16023) was obtained from MitoKor, Inc.(18 ). For this study, we designed 4 primer pairs to am-plify mtDNA regions that contained 7 point variantsassociated with mitochondrial and/or metabolic diseases(Fig. 2; see Table 1 in the Data Supplement that accompa-nies the online version of this article at http://www.clinchem.org/content/vol53/issue2). An additional 9primer pairs were designed to amplify mtDNA surround-ing other common pathogenic mtDNA variants located intRNA genes (Fig. 2; see Table 1 in the online DataSupplement). For each of the 13 primer pairs, we createda database of theoretical PCR products and their molecu-lar masses, based on the 968 human mtDNA sequences in
Fig. 1. The ESI-FTICR MS protocol of mtDNA mutation analysis.After DNA extraction, the PCR amplifies DNA regions of interest. Amplicons are then analyzed by MS, and MS data are converted to a list of exact masses with ICR2LSsoftware (22) with sufficient accuracy to compute the base compositions of the PCR products. Observed base compositions are compared with a database oftheoretical PCR products derived from a sequence database. A mutation or SNP is recognized as a base composition differing from that of the most commonly observedtheoretical amplicon composition.
196 Jiang et al.: mtDNA Mutation Detection with Electrospray MS
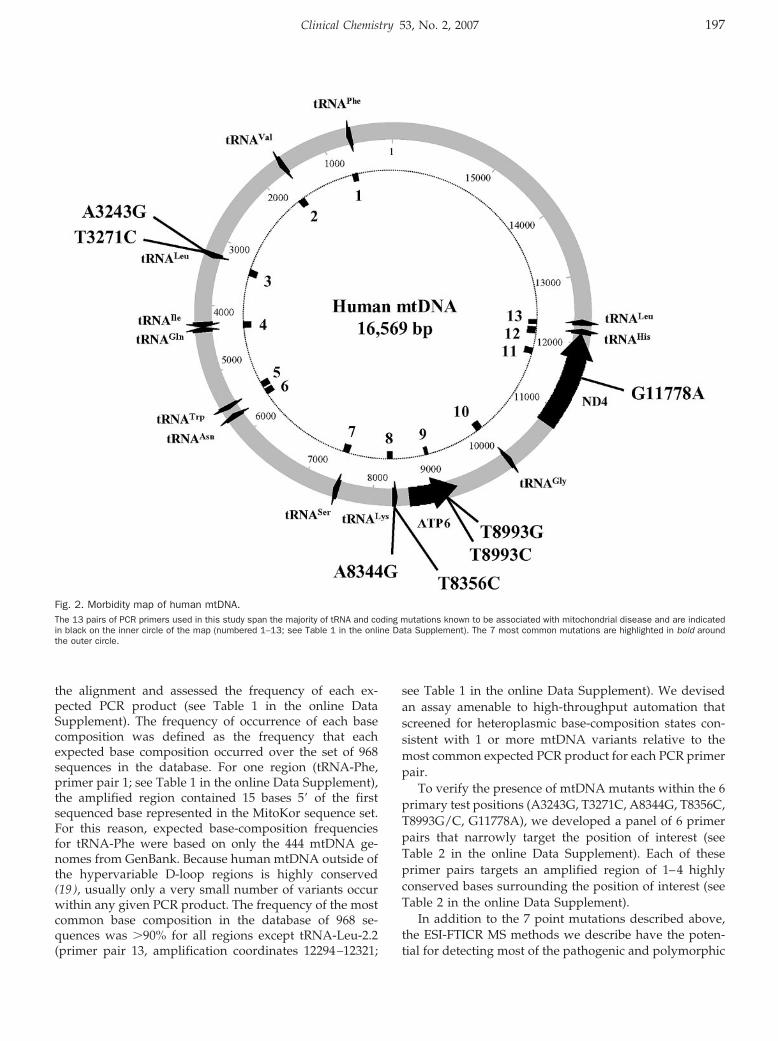
the alignment and assessed the frequency of each ex-pected PCR product (see Table 1 in the online DataSupplement). The frequency of occurrence of each basecomposition was defined as the frequency that eachexpected base composition occurred over the set of 968sequences in the database. For one region (tRNA-Phe,primer pair 1; see Table 1 in the online Data Supplement),the amplified region contained 15 bases 5� of the firstsequenced base represented in the MitoKor sequence set.For this reason, expected base-composition frequenciesfor tRNA-Phe were based on only the 444 mtDNA ge-nomes from GenBank. Because human mtDNA outside ofthe hypervariable D-loop regions is highly conserved(19 ), usually only a very small number of variants occurwithin any given PCR product. The frequency of the mostcommon base composition in the database of 968 se-quences was �90% for all regions except tRNA-Leu-2.2(primer pair 13, amplification coordinates 12294–12321;
see Table 1 in the online Data Supplement). We devisedan assay amenable to high-throughput automation thatscreened for heteroplasmic base-composition states con-sistent with 1 or more mtDNA variants relative to themost common expected PCR product for each PCR primerpair.
To verify the presence of mtDNA mutants within the 6primary test positions (A3243G, T3271C, A8344G, T8356C,T8993G/C, G11778A), we developed a panel of 6 primerpairs that narrowly target the position of interest (seeTable 2 in the online Data Supplement). Each of theseprimer pairs targets an amplified region of 1–4 highlyconserved bases surrounding the position of interest (seeTable 2 in the online Data Supplement).
In addition to the 7 point mutations described above,the ESI-FTICR MS methods we describe have the poten-tial for detecting most of the pathogenic and polymorphic
Fig. 2. Morbidity map of human mtDNA.The 13 pairs of PCR primers used in this study span the majority of tRNA and coding mutations known to be associated with mitochondrial disease and are indicatedin black on the inner circle of the map (numbered 1–13; see Table 1 in the online Data Supplement). The 7 most common mutations are highlighted in bold aroundthe outer circle.
Clinical Chemistry 53, No. 2, 2007 197
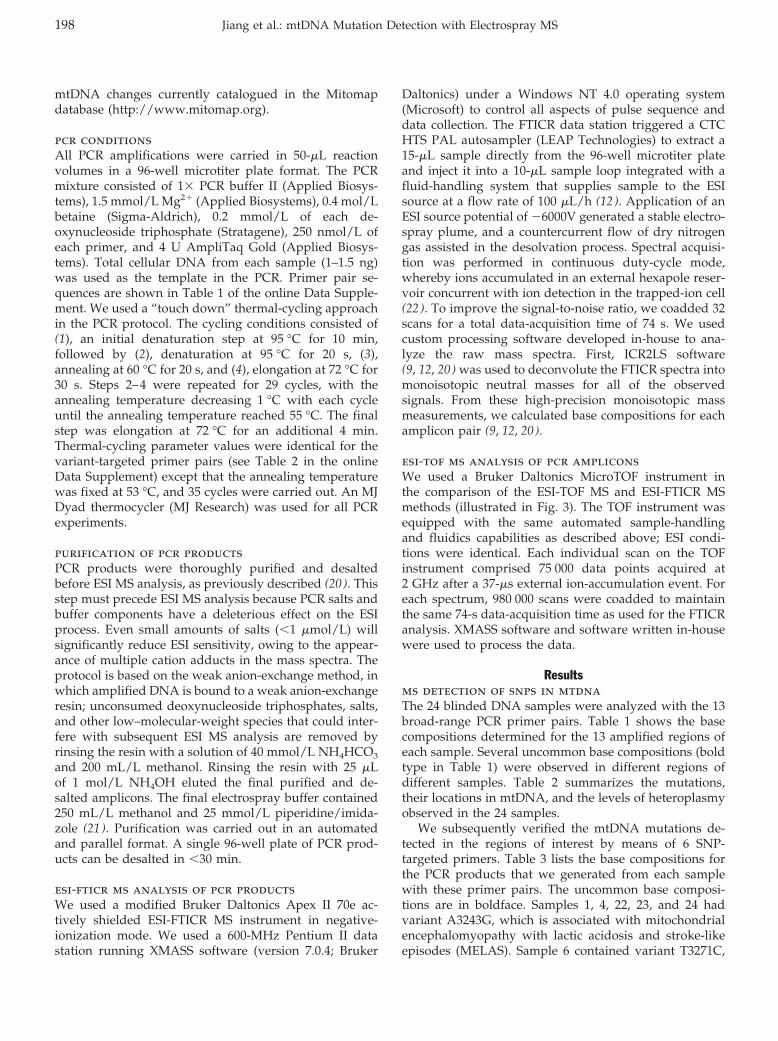
mtDNA changes currently catalogued in the Mitomapdatabase (http://www.mitomap.org).
pcr conditionsAll PCR amplifications were carried in 50-�L reactionvolumes in a 96-well microtiter plate format. The PCRmixture consisted of 1� PCR buffer II (Applied Biosys-tems), 1.5 mmol/L Mg2� (Applied Biosystems), 0.4 mol/Lbetaine (Sigma-Aldrich), 0.2 mmol/L of each de-oxynucleoside triphosphate (Stratagene), 250 nmol/L ofeach primer, and 4 U AmpliTaq Gold (Applied Biosys-tems). Total cellular DNA from each sample (1–1.5 ng)was used as the template in the PCR. Primer pair se-quences are shown in Table 1 of the online Data Supple-ment. We used a “touch down” thermal-cycling approachin the PCR protocol. The cycling conditions consisted of(1), an initial denaturation step at 95 °C for 10 min,followed by (2), denaturation at 95 °C for 20 s, (3),annealing at 60 °C for 20 s, and (4), elongation at 72 °C for30 s. Steps 2–4 were repeated for 29 cycles, with theannealing temperature decreasing 1 °C with each cycleuntil the annealing temperature reached 55 °C. The finalstep was elongation at 72 °C for an additional 4 min.Thermal-cycling parameter values were identical for thevariant-targeted primer pairs (see Table 2 in the onlineData Supplement) except that the annealing temperaturewas fixed at 53 °C, and 35 cycles were carried out. An MJDyad thermocycler (MJ Research) was used for all PCRexperiments.
purification of pcr productsPCR products were thoroughly purified and desaltedbefore ESI MS analysis, as previously described (20 ). Thisstep must precede ESI MS analysis because PCR salts andbuffer components have a deleterious effect on the ESIprocess. Even small amounts of salts (�1 �mol/L) willsignificantly reduce ESI sensitivity, owing to the appear-ance of multiple cation adducts in the mass spectra. Theprotocol is based on the weak anion-exchange method, inwhich amplified DNA is bound to a weak anion-exchangeresin; unconsumed deoxynucleoside triphosphates, salts,and other low–molecular-weight species that could inter-fere with subsequent ESI MS analysis are removed byrinsing the resin with a solution of 40 mmol/L NH4HCO3
and 200 mL/L methanol. Rinsing the resin with 25 �Lof 1 mol/L NH4OH eluted the final purified and de-salted amplicons. The final electrospray buffer contained250 mL/L methanol and 25 mmol/L piperidine/imida-zole (21 ). Purification was carried out in an automatedand parallel format. A single 96-well plate of PCR prod-ucts can be desalted in �30 min.
esi-fticr ms analysis of pcr productsWe used a modified Bruker Daltonics Apex II 70e ac-tively shielded ESI-FTICR MS instrument in negative-ionization mode. We used a 600-MHz Pentium II datastation running XMASS software (version 7.0.4; Bruker
Daltonics) under a Windows NT 4.0 operating system(Microsoft) to control all aspects of pulse sequence anddata collection. The FTICR data station triggered a CTCHTS PAL autosampler (LEAP Technologies) to extract a15-�L sample directly from the 96-well microtiter plateand inject it into a 10-�L sample loop integrated with afluid-handling system that supplies sample to the ESIsource at a flow rate of 100 �L/h (12 ). Application of anESI source potential of �6000V generated a stable electro-spray plume, and a countercurrent flow of dry nitrogengas assisted in the desolvation process. Spectral acquisi-tion was performed in continuous duty-cycle mode,whereby ions accumulated in an external hexapole reser-voir concurrent with ion detection in the trapped-ion cell(22 ). To improve the signal-to-noise ratio, we coadded 32scans for a total data-acquisition time of 74 s. We usedcustom processing software developed in-house to ana-lyze the raw mass spectra. First, ICR2LS software(9, 12, 20) was used to deconvolute the FTICR spectra intomonoisotopic neutral masses for all of the observedsignals. From these high-precision monoisotopic massmeasurements, we calculated base compositions for eachamplicon pair (9, 12, 20).
esi-tof ms analysis of pcr ampliconsWe used a Bruker Daltonics MicroTOF instrument inthe comparison of the ESI-TOF MS and ESI-FTICR MSmethods (illustrated in Fig. 3). The TOF instrument wasequipped with the same automated sample-handlingand fluidics capabilities as described above; ESI condi-tions were identical. Each individual scan on the TOFinstrument comprised 75 000 data points acquired at2 GHz after a 37-�s external ion-accumulation event. Foreach spectrum, 980 000 scans were coadded to maintainthe same 74-s data-acquisition time as used for the FTICRanalysis. XMASS software and software written in-housewere used to process the data.
Resultsms detection of snps in mtdnaThe 24 blinded DNA samples were analyzed with the 13broad-range PCR primer pairs. Table 1 shows the basecompositions determined for the 13 amplified regions ofeach sample. Several uncommon base compositions (boldtype in Table 1) were observed in different regions ofdifferent samples. Table 2 summarizes the mutations,their locations in mtDNA, and the levels of heteroplasmyobserved in the 24 samples.
We subsequently verified the mtDNA mutations de-tected in the regions of interest by means of 6 SNP-targeted primers. Table 3 lists the base compositions forthe PCR products that we generated from each samplewith these primer pairs. The uncommon base composi-tions are in boldface. Samples 1, 4, 22, 23, and 24 hadvariant A3243G, which is associated with mitochondrialencephalomyopathy with lactic acidosis and stroke-likeepisodes (MELAS). Sample 6 contained variant T3271C,
198 Jiang et al.: mtDNA Mutation Detection with Electrospray MS
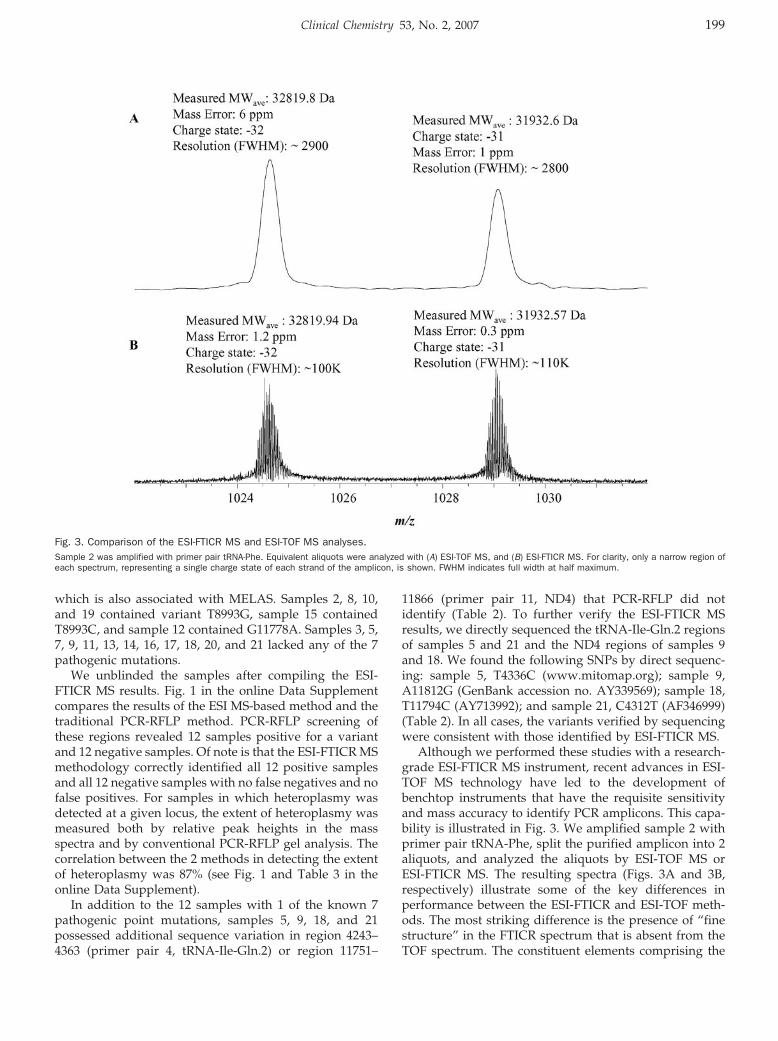
which is also associated with MELAS. Samples 2, 8, 10,and 19 contained variant T8993G, sample 15 containedT8993C, and sample 12 contained G11778A. Samples 3, 5,7, 9, 11, 13, 14, 16, 17, 18, 20, and 21 lacked any of the 7pathogenic mutations.
We unblinded the samples after compiling the ESI-FTICR MS results. Fig. 1 in the online Data Supplementcompares the results of the ESI MS-based method and thetraditional PCR-RFLP method. PCR-RFLP screening ofthese regions revealed 12 samples positive for a variantand 12 negative samples. Of note is that the ESI-FTICR MSmethodology correctly identified all 12 positive samplesand all 12 negative samples with no false negatives and nofalse positives. For samples in which heteroplasmy wasdetected at a given locus, the extent of heteroplasmy wasmeasured both by relative peak heights in the massspectra and by conventional PCR-RFLP gel analysis. Thecorrelation between the 2 methods in detecting the extentof heteroplasmy was 87% (see Fig. 1 and Table 3 in theonline Data Supplement).
In addition to the 12 samples with 1 of the known 7pathogenic point mutations, samples 5, 9, 18, and 21possessed additional sequence variation in region 4243–4363 (primer pair 4, tRNA-Ile-Gln.2) or region 11751–
11866 (primer pair 11, ND4) that PCR-RFLP did notidentify (Table 2). To further verify the ESI-FTICR MSresults, we directly sequenced the tRNA-Ile-Gln.2 regionsof samples 5 and 21 and the ND4 regions of samples 9and 18. We found the following SNPs by direct sequenc-ing: sample 5, T4336C (www.mitomap.org); sample 9,A11812G (GenBank accession no. AY339569); sample 18,T11794C (AY713992); and sample 21, C4312T (AF346999)(Table 2). In all cases, the variants verified by sequencingwere consistent with those identified by ESI-FTICR MS.
Although we performed these studies with a research-grade ESI-FTICR MS instrument, recent advances in ESI-TOF MS technology have led to the development ofbenchtop instruments that have the requisite sensitivityand mass accuracy to identify PCR amplicons. This capa-bility is illustrated in Fig. 3. We amplified sample 2 withprimer pair tRNA-Phe, split the purified amplicon into 2aliquots, and analyzed the aliquots by ESI-TOF MS orESI-FTICR MS. The resulting spectra (Figs. 3A and 3B,respectively) illustrate some of the key differences inperformance between the ESI-FTICR and ESI-TOF meth-ods. The most striking difference is the presence of “finestructure” in the FTICR spectrum that is absent from theTOF spectrum. The constituent elements comprising the
Fig. 3. Comparison of the ESI-FTICR MS and ESI-TOF MS analyses.Sample 2 was amplified with primer pair tRNA-Phe. Equivalent aliquots were analyzed with (A) ESI-TOF MS, and (B) ESI-FTICR MS. For clarity, only a narrow region ofeach spectrum, representing a single charge state of each strand of the amplicon, is shown. FWHM indicates full width at half maximum.
Clinical Chemistry 53, No. 2, 2007 199
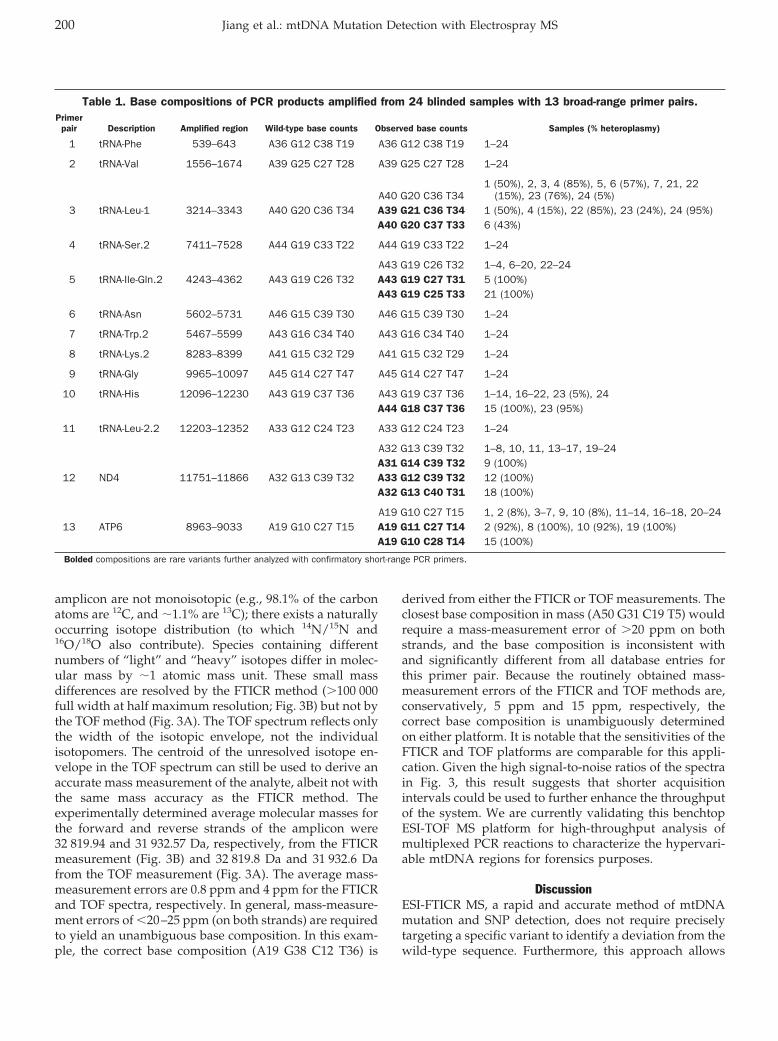
amplicon are not monoisotopic (e.g., 98.1% of the carbonatoms are 12C, and �1.1% are 13C); there exists a naturallyoccurring isotope distribution (to which 14N/15N and16O/18O also contribute). Species containing differentnumbers of “light” and “heavy” isotopes differ in molec-ular mass by �1 atomic mass unit. These small massdifferences are resolved by the FTICR method (�100 000full width at half maximum resolution; Fig. 3B) but not bythe TOF method (Fig. 3A). The TOF spectrum reflects onlythe width of the isotopic envelope, not the individualisotopomers. The centroid of the unresolved isotope en-velope in the TOF spectrum can still be used to derive anaccurate mass measurement of the analyte, albeit not withthe same mass accuracy as the FTICR method. Theexperimentally determined average molecular masses forthe forward and reverse strands of the amplicon were32 819.94 and 31 932.57 Da, respectively, from the FTICRmeasurement (Fig. 3B) and 32 819.8 Da and 31 932.6 Dafrom the TOF measurement (Fig. 3A). The average mass-measurement errors are 0.8 ppm and 4 ppm for the FTICRand TOF spectra, respectively. In general, mass-measure-ment errors of �20–25 ppm (on both strands) are requiredto yield an unambiguous base composition. In this exam-ple, the correct base composition (A19 G38 C12 T36) is
derived from either the FTICR or TOF measurements. Theclosest base composition in mass (A50 G31 C19 T5) wouldrequire a mass-measurement error of �20 ppm on bothstrands, and the base composition is inconsistent withand significantly different from all database entries forthis primer pair. Because the routinely obtained mass-measurement errors of the FTICR and TOF methods are,conservatively, 5 ppm and 15 ppm, respectively, thecorrect base composition is unambiguously determinedon either platform. It is notable that the sensitivities of theFTICR and TOF platforms are comparable for this appli-cation. Given the high signal-to-noise ratios of the spectrain Fig. 3, this result suggests that shorter acquisitionintervals could be used to further enhance the throughputof the system. We are currently validating this benchtopESI-TOF MS platform for high-throughput analysis ofmultiplexed PCR reactions to characterize the hypervari-able mtDNA regions for forensics purposes.
DiscussionESI-FTICR MS, a rapid and accurate method of mtDNAmutation and SNP detection, does not require preciselytargeting a specific variant to identify a deviation from thewild-type sequence. Furthermore, this approach allows
Table 1. Base compositions of PCR products amplified from 24 blinded samples with 13 broad-range primer pairs.Primer
pair Description Amplified region Wild-type base counts Observed base counts Samples (% heteroplasmy)
1 tRNA-Phe 539–643 A36 G12 C38 T19 A36 G12 C38 T19 1–24
2 tRNA-Val 1556–1674 A39 G25 C27 T28 A39 G25 C27 T28 1–24
A40 G20 C36 T341 (50%), 2, 3, 4 (85%), 5, 6 (57%), 7, 21, 22
(15%), 23 (76%), 24 (5%)3 tRNA-Leu-1 3214–3343 A40 G20 C36 T34 A39 G21 C36 T34 1 (50%), 4 (15%), 22 (85%), 23 (24%), 24 (95%)
A40 G20 C37 T33 6 (43%)
4 tRNA-Ser.2 7411–7528 A44 G19 C33 T22 A44 G19 C33 T22 1–24
A43 G19 C26 T32 1–4, 6–20, 22–245 tRNA-Ile-Gln.2 4243–4362 A43 G19 C26 T32 A43 G19 C27 T31 5 (100%)
A43 G19 C25 T33 21 (100%)
6 tRNA-Asn 5602–5731 A46 G15 C39 T30 A46 G15 C39 T30 1–24
7 tRNA-Trp.2 5467–5599 A43 G16 C34 T40 A43 G16 C34 T40 1–24
8 tRNA-Lys.2 8283–8399 A41 G15 C32 T29 A41 G15 C32 T29 1–24
9 tRNA-Gly 9965–10097 A45 G14 C27 T47 A45 G14 C27 T47 1–24
10 tRNA-His 12096–12230 A43 G19 C37 T36 A43 G19 C37 T36 1–14, 16–22, 23 (5%), 24A44 G18 C37 T36 15 (100%), 23 (95%)
11 tRNA-Leu-2.2 12203–12352 A33 G12 C24 T23 A33 G12 C24 T23 1–24
A32 G13 C39 T32 1–8, 10, 11, 13–17, 19–24A31 G14 C39 T32 9 (100%)
12 ND4 11751–11866 A32 G13 C39 T32 A33 G12 C39 T32 12 (100%)A32 G13 C40 T31 18 (100%)
A19 G10 C27 T15 1, 2 (8%), 3–7, 9, 10 (8%), 11–14, 16–18, 20–2413 ATP6 8963–9033 A19 G10 C27 T15 A19 G11 C27 T14 2 (92%), 8 (100%), 10 (92%), 19 (100%)
A19 G10 C28 T14 15 (100%)
Bolded compositions are rare variants further analyzed with confirmatory short-range PCR primers.
200 Jiang et al.: mtDNA Mutation Detection with Electrospray MS
the probing of relatively large regions of genome for thepresence of substitutions, SNPs, insertions, and deletionsthat were not originally targeted. Because this broad-survey assay determines the base composition of a PCRproduct and not the sequence, it does not conclusivelydetermine the exact position of specific mtDNA variants.The purpose of the assay method we have described isprimarily to detect sequence variants and heteroplasmic
states (the presence of 2 or more mitochondrial variantsexisting simultaneously within an individual), either ofwhich may be associated with a metabolic disease. In theevent that a sample is flagged as possibly having 1 ormore characterized mutations, the sample can be furtherinvestigated via sequencing. Compared with traditionalelectrophoresis gel–based methods such as PCR-RFLP,the ESI MS protocol has several advantages: (a) The ESIMS-based method can detect both expected and unex-pected variants. In contrast, traditional PCR-RFLP meth-ods can detect only expected (i.e., targeted) mutations.Traditional methods answer the question, “Is this spe-cific mutation present in the sample?” The protocol basedon ESI MS answers the question, “Which mutations arepresent in the sample?” (b) The MS instrument is a uni-versal detector. It can detect multiple mtDNA variantssimultaneously, whereas PCR-RFLP methods require dif-ferent restriction enzyme digestions for different muta-tions. (c) Data interpretation can be done in an automatedand standardized format, which is difficult for traditionalmethods such as PCR-RFLP. (d) Finally, samples can bescreened in a high-throughput mode.
All analytic steps in the ESI MS protocol, includingPCR amplification, post-PCR sample purification, and MSanalysis, were performed in an automated and parallelformat, resulting in a significant reduction in the chancesof contamination and operator error. The time requirementsfor this method are as follows: PCR amplification, 1 h 40min; post-PCR purification, 30 min per 96-well plate; MSanalysis, 1–2.5 h per 96-well plate. The capability for per-forming all of these processes in high-throughput modeenables screening of large numbers of samples for bothexpected and unexpected variants and facilitates searchesfor associations between mtDNA variants and diseases.The ESI-MS method can be used as a rapid, low-cost toolto screen samples before the time-consuming and costly
Table 2. mtDNA mutations, SNPs, and heteroplasmydetected by ESI MS.
Sample Mutation SNPPercent
heteroplasmy
1 A3243G 502 T8993G 1003 No mutation observed4 A3243G 105 T4336C 1006 T3271C 447 No mutation observed8 T8993G 1009 A11812G 100
10 T8993G 9211 No mutation observed12 G11778A 10013 No mutation observed14 No mutation observed15 T8993C 10016 No mutation observed17 No mutation observed18 T11794C 10019 T8993G 9820 No mutation observed21 C4312T 10022 A3243G 8123 A3243G 2224 A3243G 94
Table 3. Base compositions of PCR products amplified from 24 blinded samples with 6 confirmatory, short-range PCRprimer pairs.
Primerpair
Wild-typebase counts Observed base counts Associated mutation Samples (% heteroplasmy)
1 (50%), 2,3,4 (90%), 5–21,22 (19%), 23 (78%), 24 (6%)3243 A22 G14 C11 T16 A22 G14 C11 T16
A21 G15 C11 T16 A3243G 1 (50%), 4 (10%), 22 (81%), 23 (22%), 24 (94%)1–5, 6 (56%), 7–24
3271 A18 G8 C14 T18 A18 G8 C14 T18A18 G8 C15 T17 T3271C 6 (44%)
8344 A24 G8 C10 T17 A24 G8 C10 T17 1–248356 A26 G7 C13 T14 A26 G7 C13 T14 1–24
A12 G7 C18 T9 1, 3–7, 9, 10 (8%),11–14,16–18,19 (2%),20–248993 A12 G7 C18 T9 A12 G8 C18 T8 T8993G 2 (100%), 8 (100%), 10 (92%), 19 (98%)
A12 G7 C19 T8 T8993C 15 (100%)1–11,13–24
11 778 A15 G6 C17 T12 A15 G6 C17 T12A16 G5 C17 T12 G11778A 12 (100%)
Bolded base compositions corresponded to known pathogenic variants.
Clinical Chemistry 53, No. 2, 2007 201
process of direct DNA sequencing. In most cases, know-ing that a mutation or SNP is present in a region ofinterest (even when the exact coordinates of the mutationare not known), and knowing the type of nucleotidesubstitution (e.g., A3T) are the key data for discriminat-ing a typical patient sample from a sample with 1 or moreabnormalities requiring additional investigation. More-over, in the relatively rare instance when sequencing isrequired to determine the exact coordinates of a nucleo-tide substitution, prescreening by the ESI MS methodsallow much smaller regions to be sequenced, because themass measurement and base-composition analysis pro-vide the approximate location of the SNP.
The estimated reagent costs (for primers, polymerase,deoxynucleoside triphosphates, desalting columns, buff-ers, and so on) for this work in a high-throughputmodality are a few dollars per sample, and the time to apreliminary answer is 4–5 h. In comparison, a PCR-RFLPmethod typically requires 2 days to analyze a batch of 12DNA samples for 7 different mtDNA variants, and 24samples for this variant set requires 4 days. The enzymedigestion and gel electrophoresis steps required by thePCR-RFLP method are not easily automated; these stepsthus create a bottleneck that limits the number of samplesthat can be analyzed simultaneously. ESI MS eliminatesthis bottleneck and avoids the extra costs of restrictionenzymes, agarose gels, and toxic fluorescent dyes. Auto-mated DNA sequencing cannot reliably detect hetero-plasmy at levels of �30% (23 ), and several commercialfacilities currently charge �$20 for single-pass sequenc-ing. Therefore, not only is direct DNA sequencing moreexpensive than ESI MS, mtDNA sequencing is not reliablefor detecting �30% heteroplasmy.
In addition to significantly reducing the equipmentcosts associated with the ESI-FTICR MS platform, fullmigration of this assay to the benchtop ESI-TOF MSplatform requires significantly less space and little or noMS expertise. Multiplexing primer pairs and employingshorter MS acquisition intervals could enable surveys ofup to several hundred samples a day for key mtDNAmutations.
The authors thank Jared Drader (Ibis) and Gordon Ander-son (Pacific Northwest National Laboratory) for theirwork on the monoisotopic relative molecular mass calcu-lations, and we thank Fred Hajjar (MassSpectra) for hiswork on automated base-composition calculation. Sup-port for this work was provided by generous gifts toR.K.N. from Mrs. Dorothy R. Engs, the UCSD FoundationChristini Fund, the Lored Foundation, and the WilliamWright Family Foundation.
References1. Doktycz MJ, Hurst GB, Habibi-Goudarzi S, McLuckey SA, Tang K,
Chen CH, et al. Analysis of polymerase chain reaction-amplifiedDNA products by mass spectrometry using matrix-assisted laser
desorption and electrospray: current status. Anal Biochem 1995;230:205–14.
2. Hurst GB, Doktycz MJ, Vass AA, Buchanan MV. Detection ofbacterial DNA polymerase chain reaction products by matrix-assisted laser desorption/ionization mass spectrometry. RapidCommun Mass Spectrom 1996;10:377–82.
3. Krahmer MT, Johnson YA, Walters JJ, Fox KF, Fox A, Nagpal M.Electrospray quadrupole mass spectrometry analysis of modeloligonucleotides and polymerase chain reaction products: deter-mination of base substitutions, nucleotide additions/deletions,and chemical modifications. Anal Chem 1999;71:2893–900.
4. Naito Y, Ishikawa K, Koga Y, Tsuneyoshi T, Terunuma H. Molec-ular mass measurement of polymerase chain reaction productsamplified from human blood DNA by electrospray ionizationmass spectrometry. Rapid Commun Mass Spectrom 1995;9:1484–6.
5. Naito Y, Ishikawa K, Koga Y, Tsuneyoshi T, Terunuma H, ArakawaR. Genetic diagnosis by polymerase chain reaction and electro-spray ionization mass spectrometry: detection of five base dele-tion from blood DNA of a familial adenomatous polyposis patient.J Am Soc Mass Spectrom 1997;8:737–42.
6. Hofstadler SA, Griffey RH. Analysis of noncovalent complexes ofDNA and RNA by mass spectrometry. Chem Rev 2001;101:377–90.
7. Ecker DJ, Sampath R, Blyn LB, Eshoo MW, Ivy C, Ecker JA, et al.Rapid identification and strain-typing of respiratory pathogens forepidemic surveillance. Proc Natl Acad Sci U S A 2005;102:8012–7.
8. Hall TA, Budowle B, Jiang Y, Blyn L, Eshoo M, Sannes-Lowery KA,et al. Base composition analysis of human mitochondrial DNAusing electrospray ionization mass spectrometry: a novel tool forthe identification and differentiation of humans. Anal Biochem2005;344:53–69.
9. Van Ert MN, Hofstadler SA, Jiang Y, Busch JD, Wagner DM, DraderJJ, et al. Mass spectrometry provides accurate characterization oftwo genetic marker types in Bacillus anthracis. Biotechniques2004;37:642–4.
10. Sampath R, Hofstadler SA, Blyn LB, Eshoo MW, Hall TA, MassireC, et al. Rapid identification of emerging pathogens: coronavirus.Emerg Infect Dis 2005;11:373–9.
11. Muddiman DC, Anderson GA, Hofstadler SA, Smith RD. Lengthand base composition of PCR-amplified nucleic acids using massmeasurements from electrospray ionization mass spectrometry.Anal Chem 1997;69:1543–9.
12. Hofstadler SA, Sampath R, Blyn LB, Eshoo MW, Hall TA, Jiang Y,et al. TIGER: the universal biosensor. Int J Mass Spectrom2005;242:23–41.
13. Ecker JA, Massire C, Hall TA, Ranken R, Pennella TT, Agasino IvyC, et al. Identification of acinetobacter species and genotyping ofacinetobacter baumannii by multilocus PCR and mass spectrom-etry. J Clin Microbiol 2006;44:2921–32.
14. Yoneda M, Tanno Y, Tsuji S, Attardi G. Detection and quantifica-tion of point mutations in mitochondrial DNA by PCR. MethodsEnzymol 1996;264:432–41.
15. Smith ML, Hua XY, Marsden DL, Liu D, Kennaway NG, Ngo KY, et al.Diabetes and mitochondrial encephalomyopathy with lactic acidosisand stroke-like episodes (MELAS): radiolabeled polymerase chainreaction is necessary for accurate detection of low percentages ofmutation. J Clin Endocrinol Metab 1997;82:2826–31.
16. Anderson S, Bankier AT, Barrell BG, de Bruijn MHL, Coulson AR,Drouin J, et al. Sequence and organization of the human mito-chondrial genome. Nature 1981;290:457–65.
17. Andrews RM, Kubacka I, Chinnery PF, Lightowlers RN, TurnbullDM, Howell N. Reanalysis and revision of the Cambridge reference
202 Jiang et al.: mtDNA Mutation Detection with Electrospray MS

sequence for human mitochondrial DNA. Nat Genet 1999;23:147.
18. Hernstadt C, Elson JL, Fahy E, Preston G, Turnbull DM, AndersonC, et al. Reduced-median-network analysis of complete mitochondrialDNA coding-region sequences for the major African, Asian, andEuropean haplogroups. Am J Hum Genet 2002;70:1152–71.
19. Saccone C, Gissi C, Lanave C, Larizza A, Pesole G, Reyes A.Evolution of the mitochondrial genetic system: an overview. Gene2000;261:153–9.
20. Jiang Y, Hofstadler SA. A highly efficient and automated methodof purifying and desalting PCR products for analysis by electrosprayionization mass spectrometry. Anal Biochem 2003;316:50–7.
21. Greig M, Griffey RH. Utility of organic bases for improved electro-spray mass spectrometry of oligonucleotides. Rapid CommunMass Spectrom 1995;9:97–102.
22. Senko MW, Hendrickson CL, Emmett MR, Shi SDH, Marshall AG.External accumulation of ions for enhanced electrospray ioniza-tion Fourier transform ion cyclotron resonance mass spectrome-try. J Am Soc Mass Spectrom 1997;8:970–6.
23. Hancock DK, Tully LA, Levin BC. A standard reference material todetermine the sensitivity of techniques for detecting low-frequencymutations, SNPs, and heteroplasmies in mitochondrial DNA.Genomics 2005;86:446–61.
Clinical Chemistry 53, No. 2, 2007 203

Suppl Table 1, ONLINE ONLY
Table 1. Base compositions of PCR products amplified from 24 blinded samples with 13 broad-range primer pairs.Normal population survey resultsa
Primerpair Description
Ampliconcoordinates
Amplifiednucleotides Primer sequences (5�33�
Variant basecompositions, n
Wild-type basecompositions, %
1 tRNA-Phe 539–643 562–620 TAC CCC GAA CCA ACC AAA CCC CA 11 91TAT GGG GTG ATG TGA GCC CGT CT
2 tRNA-Val 1556–1674 1584–1648 CAA GTC GTA ACA TGG TAA GTG TAC TGG A 5 98.5TAG CTC AGA GCG GTC AAG TTA AGT TG
3 tRNA-Leu-1 3214–3343 3243–3316 TCC AAG AAC AGG GTT TGT TAA GAT GGC AG 7 97.3TGG GTA CAA TGA GGA GTA GGA GGT TGG
4 tRNA-Ile-Gln.2 4243–4362 4269–4336 TGC ATT CCC CCT CAA ACC TAA GAA AT 7 96.2TTC TCA GGG ATG GGT TCG ATT CTC AT
5 tRNA-Trp.2 5467–5599 5494–5568 TCA CGC TAC TCC TAC CTA TCT CCC CTT 5 96.4TGG GCA GTC CTT AGC TGT TAC AGA AAT TAA G
6 tRNA-Asn 5602–5731 5626–5703 TCC ACT CTG CAT CAA CTG AAC GC 6 95.8TGT AGA TTG AAG CCA GTT GAT TAG GGT G
7 tRNA-Ser.2 7411–7528 7443–7498 TCC CAT TCG AAG AAC CCG TAT ACA TAA AAT CT 4 97.5TCT GGT ACC TTT TTG AAA AAG TCA TGG AGG
8 tRNA-Lys.2 8283–8399 8313–8371 TCC TCT AGA GCC CAC TGT AAA GCT AAC TTA 4 99.6TGG TGG GCC ATA CGG TAG TAT TTA GTT G
9 ATP6 8963–9033 8991–9009 TCATCAGCCTACTCATTCAACCAATAGC 3 94.3TAGGTGGCCTGCAGTAATGTTAGC
10 tRNA-Gly 9965–10097 9996–10065 TGTCTCCATCTATTGATGAGGGTCTTACTC 3 95.8TAGGAGGGTGTTGATTATTAAAATTAAGGCGA
11 ND4 11 751–11 866 11 777–11 843 TCT CAA ACT ACG AAC GCA CTC ACA GT 5 94.1TAA GGC GAG GTT AGC GAG GCT TG
12 tRNA-His 12 096–12 230 12 121–12 202 TCC TAT CCC TCA ACC CCG ACA TCA T 7 97.3TTA GCA GTT CTT GTG AGC TTT CTC GG
13 tRNA-Leu-2.2 12 261–12 352 12 294–12 321 TCC CAA CTT TTA AAG GAT AAC AGC TAT CCA TTG 5 84.4TGG GGT GCA TGG TTA TTA CTT TTA TTT GGA G
Bolded compositions are rare variants further analyzed with confirmatory short-range PCR primers.a Among 968 sequences (see Materials and Methods).
Lipoprotein Lipase mRNA Expression in WholeBlood Is a Prognostic Marker in B Cell Chronic
Lymphocytic LeukemiaFemke Van Bockstaele,1† Valerie Pede,1† Ann Janssens,2 Filip Callewaert,1
Fritz Offner,2 Bruno Verhasselt,1 and Jan Philippe1*
Background: Chronic lymphocytic leukemia (CLL) ischaracterized by high individual variability in clinicalcourse and the need for therapy. Differentiation ofprognostic subgroups is based primarily on the muta-tion status of the genes for the variable region of theimmunoglobulin heavy chain (IGHV). The time- andlabor-intensive nature of this analysis necessitates theuse of easily applicable surrogate markers.Methods: We developed a quantitative PCR (qPCR)method for determining lipoprotein lipase (LPL) mRNAexpression and analyzed samples of lysed whole bloodand CD19-selected cells from 50 CLL patients. Associa-tions of LPL and ZAP70 [�-chain (TCR) associated pro-tein kinase 70 kDa] expression with IGHV mutationstatus, overall survival (OS), and treatment-free survival(TFS) were investigated.Results: Lysed samples of whole blood and CD19-selected cells were similar with respect to LPL expres-sion (R � 0.88; P <0.0001). LPL expression was signifi-cantly associated with IGHV mutation status [�2(1) �15.3; P <0.0001] and showed an 89.3% specificity, a68.2% sensitivity, an 83.3% positive predictive value,and a 78.1% negative predictive value for IGHV muta-tion status. LPL expression was significantly associatedwith both OS and TFS in log-rank tests (both P values �0.002). LPL-positive patients had a significantly shortermedian TFS time (23 months) than LPL-negative pa-tients (88 months) (P � 0.002).
Conclusions: LPL mRNA expression is a valuable prog-nostic marker in CLL. The method does not require cellpurification, and its applicability with archived samplesfacilitates its use in the clinical routine and otherstudies.© 2007 American Association for Clinical Chemistry
Chronic lymphocytic leukemia (CLL)3 is heterogeneouswith a continuous spectrum of disease (1 ). At one extremeare patients who have an almost normal life expectancywith no need for treatment; at the other are patientswho die of drug-resistant disease as early as 2 years afterinitial diagnosis (2 ). The appearance of new therapies hasshifted the therapeutic goal from control of the leuko-cytosis to the achievement of a molecular remission,especially in younger patients, for whom the CLL diag-nosis has a significant impact on life expectancy. There-fore, reliable prognostic factors are of utmost importancein the design of randomized clinical trials for determiningif early treatment is meaningful for all younger patients orat least for a high-risk subgroup of such patients. Thecurrent clinical consensus recommends against relyingexclusively on clinical staging systems such as the Rai (3 )or Binet (4 ) score for prognostic assessment of CLLpatients. An assessment of biological and genetic markersat diagnosis has provided more accurate predictions ofdisease outcome, and it is important, therefore, that suchmarkers be evaluated in clinical trials. Markers recentlydemonstrated to be of value are the mutation status of thegenes of the variable region of the immunoglobulin heavychain (IGHV) and the expression of CD38 and ZAP70[�-chain (TCR) associated protein kinase 70kDa]. The
1 Department of Clinical Chemistry, Microbiology and Immunology,Ghent University, Ghent, Belgium.
2 Department of Internal Medicine, Ghent University, Ghent, Belgium.† These authors contributed equally to this study.* Address correspondence to this author at: 2P8, Ghent University Hospi-
tal, De Pintelaan 185, B-9000 Ghent, Belgium. Fax: 32-9-2404985; [email protected].
Received July 14, 2006; accepted November 7, 2006.Previously published online at DOI: 10.1373/clinchem.2006.076331
3 Nonstandard abbreviations: CLL, chronic lymphocytic leukemia; IGHV,variable region of the immunoglobulin heavy chain; qPCR, quantitative PCR;TFS, treatment-free survival; Ct, threshold cycle; OS, overall survival; LDT,lymphocyte doubling time.
Clinical Chemistry 53:2204–212 (2007) Molecular Diagnostics
and Genetics
204
IGHV mutation status was introduced as a new prognos-tic marker in 1999 (5, 6). The difficulty of performingIGHV mutation analysis in the routine diagnostic labora-tory prompted a search for surrogate markers, and studieshave investigated the relationship between IGHV muta-tion status and gene expression profile in CLL cells (7 ).Wiestner et al. (8 ) found that ZAP70 best distinguishedCLL subtypes. Further clinical studies confirmed theclinical usefulness of the ZAP70 protein and mRNAexpression as prognostic markers (9–16). Another studyof gene expression profiling defined a limited set of genesthat were expressed differentially in progressive unmu-tated and stable mutated CLL cases. Two other identifiedgenes were LPL (lipoprotein lipase)4 and ADAM29(ADAM metallopeptidase domain 29) (17 ). Interestingly,Rosenwald et al. (7 ) and Klein et al. (18 ) had mentionedLPL as among the most differentially expressed genes.van ‘t Veer et al. (19 ) and the German CLL Study Group(20 ) further confirmed the predictive value of LPL. LPLexpression was a more reliable marker than ZAP70 inreal-time quantitative PCR (qPCR) assays of CLL samples,even with unselected peripheral blood mononuclear cells(19 ).
We describe the validation of a new qPCR analysis tomeasure LPL expression in whole blood and its power asa prognostic marker in CLL.
Materials and Methodspatients and sample collectionFifty-seven patients diagnosed with CLL at our institutionwere included in the present study, which was approvedby the Ethical Committee of the Ghent University Hospi-tal, and all patients provided informed consent. Weconfirmed the diagnosis and clinical stage for all pa-tients [Moreau–Matutes–Catovsky score of at least 4 on a5-point scale (21 )], and patients were untreated at the timeof blood collection. Cytogenetic characteristics were eval-uated for 53 patients. The median age at diagnosis was 59years (range, 33–76 years), and the median duration offollow-up was 80 months (range, 15–464 months). Sixtypercent of the patients needed therapy during follow-up.Treatment was started when patients developed massivelymphadenopathy, progressive anemia, thrombocythemia,or splenomegaly, or when the lymphocyte count exceeded1011 cells/L. We recorded 5 deaths during the course ofthis study, all of which were CLL-related. Treatment-freesurvival (TFS) and disease-related mortality were calcu-lated from the time of diagnosis. Inclusion of patients was
based on the availability of biological samples: CD19-selected cells from peripheral blood mononuclear cellswere obtained from all patients, and unselected lysedwhole blood samples were available for 50 patients.Peripheral blood mononuclear cells were isolated on aLymphoprep gradient (Nycomed), and CD19� cells wereselected by means of the EasySep technology (StemCellTechnologies) according to the manufacturer’s instruc-tions. Purity was at least 98% by flow cytometry. Un-selected cells from whole blood were obtained aftererythrocytes were lysed with Erythrocyte Lysis Buffer(Qiagen).
rna isolation and cdna synthesisAll analyses were carried out with frozen cells. Totalcellular RNA was extracted with the Trizol method (In-vitrogen) or the RNeasy Kit (Qiagen) according to thesuppliers’ instructions. We determined mutation status bysynthesizing cDNA from 1 �g RNA by means of theSuperscript First-Strand Synthesis System for RT-PCR(Invitrogen). For gene expression analysis, cDNA wassynthesized from 1 �g RNA with the Reverse Transcrip-tase Core kit (Eurogentec) according to the manufactur-er’s instructions.
determination of ighv mutation statusSix IGHV family specific primers that anneal to sequencesin the leader region and a consensus primer for the heavychain joining region were used to amplify cDNA (22 ). Weused an alternative set of primers specific for the frame-work region 1 when amplification with these primersfailed (23 ). Clonal PCR products were purified with theQIAquick PCR Purification Kit (Qiagen), and both strandswere sequenced by fluorescence dideoxy chain termina-tion with an ABI Prism 310 Genetic Analyzer (AppliedBiosystems). IGHV sequences were considered mutated ifthe homology with the closest germ line counterpart was�98%.
flow cytometric analysis of zap70 expressionWe analyzed intracellular ZAP70 expression with flowcytometry according to Crespo et al. (9 ). In brief, cellswere fixed and permeabilized with the Fix and Perm kit(ImTec Diagnostics) according to the manufacturer’s in-structions, incubated with ZAP70 antibody (clone 2F3.2;Upstate Biotechnology), washed, and incubated with phy-coerythrin-labeled goat antimouse antibody (Caltag Lab-oratories). After washing the cells, we followed one of 2procedures. We stained the cells with CD3 conjugatedwith peridinin chlorophyll protein and a cyanine dye(Cy5.5), with allophycocyanin-conjugated CD56 � CD5,and with fluorescein isothiocyanate-conjugated CD19 (BDBiosciences) and performed a 4-color flow cytometricanalysis with a FACSort flow cytometer (BD MedicalSystems). Alternatively, cells were stained with fluores-cein isothiocyanate-conjugated CD3 (BD Biosciences),CD19 tandemly conjugated with phycoerythrin and Texas
4 Human genes: LPL, lipoprotein lipase; ZAP70, �-chain (TCR) associatedprotein kinase 70kDa; ADAM29, ADAM metallopeptidase domain 29; HMBS,hydroxymethylbilane synthase; ABL1, v-abl Abelson murine leukemia viraloncogene homolog 1; IGHV1–69, immunoglobulin heavy variable 1–69;IGHV3–21, immunoglobulin heavy variable 3–21; IGHV3–23, immunoglobulinheavy variable 3–23; IGHV3–7, immunoglobulin heavy variable 3–7; IGHV3–30, immunoglobulin heavy variable 3–30; IGHV4–34, immunoglobulin heavyvariable 4–34; CD38, CD38 molecule.
Clinical Chemistry 53, No. 2, 2007 205
Red (Beckman Coulter), CD5 tandemly conjugated withphycoerythrin and Cy7 (Beckman Coulter), and allo-phycocyanin-conjugated CD56 (Beckman Coulter) andanalyzed on a FC500 instrument with CXP software(Beckman Coulter). The cutoff for ZAP70 expression onCLL cells was set so that 95% of the T cells were positivefor the ZAP70 protein.
quantitative pcrWe analyzed ZAP70 and LPL expression by measuringmRNA with qPCR on an ABI Prism 7700 SequenceDetector (Applied Biosystems) or a Bio-Rad IQ5 RealTime Detection System (Bio-Rad). Wiestner et al. (8 ) havepreviously described the primers and the probe we usedfor ZAP70; those for LPL were designed with PrimerExpress V2.0 software (Applied Biosystems) and are asfollows: forward (exon 2), 5�-CAG CAG CAA AAC CTTCAT GGT-3�; probe (boundary of exons 2 and 3), 5�-FAM-CCA TGG CTG GAC GGT AAC AGG AAT GT-TAMRA-3�; reverse (exon 3), 5�-AGT TTT GGC ACC CAA CTCTCA-3�. For both LPL and ZAP70, 150 nmol/L of probeand 600 nmol/L of each primer were used. PCR reactionswere performed with the qPCR Core kit (Eurogentec)under the following cycling conditions: 50 °C for 2 min, aninitial denaturation step of 95 °C for 10 min, and 50 cyclesof 95 °C for 30 s and 60 °C for 1 min. All reactions weredone in duplicate, and each PCR run included controlsand either calibrator samples [cDNA from the HL-60 cellline (ATCC)] or, in the case of ZAP70, a calibration curveof 6, 10-fold dilutions of Jurkat (ATCC) cDNA. Twoso-called housekeeping genes, HMBS (hydroxymethylbi-lane synthase; primers and probe courtesy Dr. E. Mensinkand Dr. L. van de Locht, Nijmegen, The Netherlands) (24 )and ABL1 (v-abl Abelson murine leukemia viral oncogenehomolog 1) (25 ) were used to normalize ZAP70 and LPLexpression. We performed 2 validation experiments todemonstrate that the threshold cycle (��Ct) method wascapable of quantifying LPL expression. We compared the�Ct values of LPL and HMBS and of LPL and ABL1 for anHL-60 cDNA dilution series. The logarithm of the inputamount was plotted vs the �Ct value. The absolute valueof the slope of the trend line was 0.075 for HMBS and0.021 for ABL1. Because these values are �0.1, the effi-ciencies of the target and reference gene PCRs can beconsidered approximately equal, and the ��Ct methodcan be used (ABI Prism 7700 Sequence Detection System,User Bulletin #2, 2001; Applied Biosystems). We used thecalibration-curve method to quantify ZAP70 expressionand calculated the geometric mean of the results for bothreference genes to obtain final quantitative results.
statistical analysisROC curve analyses were performed with MedCalc sta-tistical software (MedCalc Software) to determine theZAP70 and LPL expression cutoff values that best distin-guished between mutated and unmutated cases. Associ-ations between different clinical markers were described
with Pearson �2 statistics (with the Yates continuity cor-rection for 2 � 2 tables), Spearman correlation coefficients,or odd ratios and 95% confidence intervals. We used theKaplan–Meier method to analyze overall survival (OS)and TFS. The log-rank statistic was used to determinesignificant associations between individual clinical mark-ers and OS or TFS. P values �0.05 were consideredstatistically significant. All analyses were performed withthe SPSS software package, version 13.0 (SPSS).
Resultspatient characteristics and standardprognostic markersWe summarize the biological and clinical characteristicsof the 57 CLL patients included in this study in Table 1.Twenty-six patients (54%) had unmutated IGHV genes. In11 patients (19%), the CLL clone expressed an IGHV genesegment associated with a bad prognosis (IGHV1–69,IGHV3–21, or IGHV3–23) (26 ), and 14 patients (25%) hadan IGHV gene segment associated with a good prognosis(IGHV3–7, IGHV3–30, or IGHV4–34) (27 ). Deletion 11qwas the most frequently observed cytogenetic aberration(n � 12), followed by trisomy 12 (n � 7) and deletion 17p(n � 1).
Cross-tabulations showed a significant association onlybetween mutation status and lymphocyte doubling time(LDT) [�2(1) � 8.4; P � 0.004] and between mutationstatus and cytogenetic factors [�2(1) � 5.4; P � 0.02].
unselected, lysed whole blood and cd19-selected cells show similar lpl expressionLPL expression in lysed samples of whole blood andexpression in CD19-selected B cells for the 50 evaluatedpatients were strongly correlated (Fig. 1) (R � 0.88; P�0.0001). The cutoff values calculated by ROC curveanalysis revealed 6 patients with discordant results. Al-though the samples of lysed whole blood were LPL-negative for these patients, the results for the selected Bcell samples were positive. This discrepancy did notappreciably affect the association with mutation status orprognosis; therefore, only results obtained with wholeblood are discussed further.
To evaluate changes in LPL expression over time, wesampled blood from 11 patients at a median interval of 12months and evaluated the lysed samples for LPL expres-sion. LPL expression did not change over time except for1 patient; this single discrepant result was close to thethreshold value, however.
strong association between lpl and zap70expression and mutation statusCross-tabulations for IGHV mutation status and ZAP70and LPL expression are summarized in Table 1. Mutationstatus was significantly associated with the ZAP70 flowcytometric result [�2(1) � 16.5; P �0.0001], with theZAP70 qPCR result [�2(1) � 25.9; P �0.0001], and withLPL expression [�2(1) � 15.3; P �0.0001] (Fig. 2). Concor-
206 Van Bockstaele et al.: Lipoprotein Lipase as a Prognostic Marker in B Cell CLL
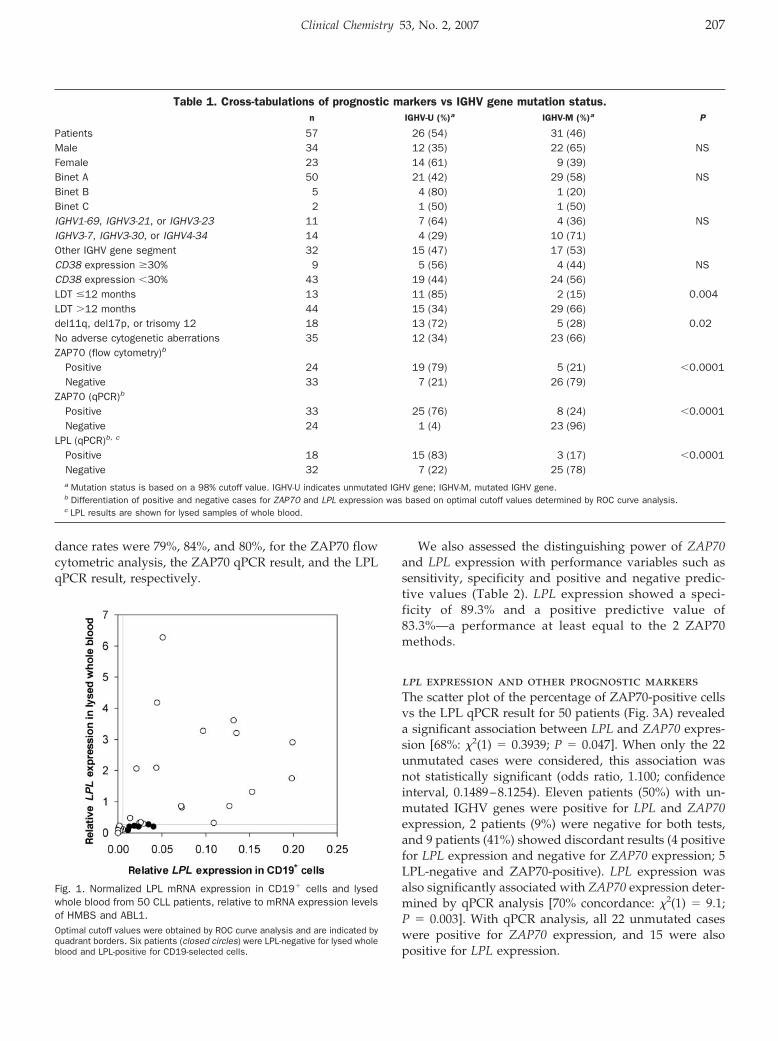
dance rates were 79%, 84%, and 80%, for the ZAP70 flowcytometric analysis, the ZAP70 qPCR result, and the LPLqPCR result, respectively.
We also assessed the distinguishing power of ZAP70and LPL expression with performance variables such assensitivity, specificity and positive and negative predic-tive values (Table 2). LPL expression showed a speci-ficity of 89.3% and a positive predictive value of83.3%—a performance at least equal to the 2 ZAP70methods.
lpl expression and other prognostic markersThe scatter plot of the percentage of ZAP70-positive cellsvs the LPL qPCR result for 50 patients (Fig. 3A) revealeda significant association between LPL and ZAP70 expres-sion [68%: �2(1) � 0.3939; P � 0.047]. When only the 22unmutated cases were considered, this association wasnot statistically significant (odds ratio, 1.100; confidenceinterval, 0.1489–8.1254). Eleven patients (50%) with un-mutated IGHV genes were positive for LPL and ZAP70expression, 2 patients (9%) were negative for both tests,and 9 patients (41%) showed discordant results (4 positivefor LPL expression and negative for ZAP70 expression; 5LPL-negative and ZAP70-positive). LPL expression wasalso significantly associated with ZAP70 expression deter-mined by qPCR analysis [70% concordance: �2(1) � 9.1;P � 0.003]. With qPCR analysis, all 22 unmutated caseswere positive for ZAP70 expression, and 15 were alsopositive for LPL expression.
Fig. 1. Normalized LPL mRNA expression in CD19� cells and lysedwhole blood from 50 CLL patients, relative to mRNA expression levelsof HMBS and ABL1.Optimal cutoff values were obtained by ROC curve analysis and are indicated byquadrant borders. Six patients (closed circles) were LPL-negative for lysed wholeblood and LPL-positive for CD19-selected cells.
Table 1. Cross-tabulations of prognostic markers vs IGHV gene mutation status.n IGHV-U (%)a IGHV-M (%)a P
Patients 57 26 (54) 31 (46)Male 34 12 (35) 22 (65) NSFemale 23 14 (61) 9 (39)Binet A 50 21 (42) 29 (58) NSBinet B 5 4 (80) 1 (20)Binet C 2 1 (50) 1 (50)IGHV1-69, IGHV3-21, or IGHV3-23 11 7 (64) 4 (36) NSIGHV3-7, IGHV3-30, or IGHV4-34 14 4 (29) 10 (71)Other IGHV gene segment 32 15 (47) 17 (53)CD38 expression �30% 9 5 (56) 4 (44) NSCD38 expression �30% 43 19 (44) 24 (56)LDT �12 months 13 11 (85) 2 (15) 0.004LDT �12 months 44 15 (34) 29 (66)del11q, del17p, or trisomy 12 18 13 (72) 5 (28) 0.02No adverse cytogenetic aberrations 35 12 (34) 23 (66)ZAP70 (flow cytometry)b
Positive 24 19 (79) 5 (21) �0.0001Negative 33 7 (21) 26 (79)
ZAP70 (qPCR)b
Positive 33 25 (76) 8 (24) �0.0001Negative 24 1 (4) 23 (96)
LPL (qPCR)b, c
Positive 18 15 (83) 3 (17) �0.0001Negative 32 7 (22) 25 (78)a Mutation status is based on a 98% cutoff value. IGHV-U indicates unmutated IGHV gene; IGHV-M, mutated IGHV gene.b Differentiation of positive and negative cases for ZAP70 and LPL expression was based on optimal cutoff values determined by ROC curve analysis.c LPL results are shown for lysed samples of whole blood.
Clinical Chemistry 53, No. 2, 2007 207
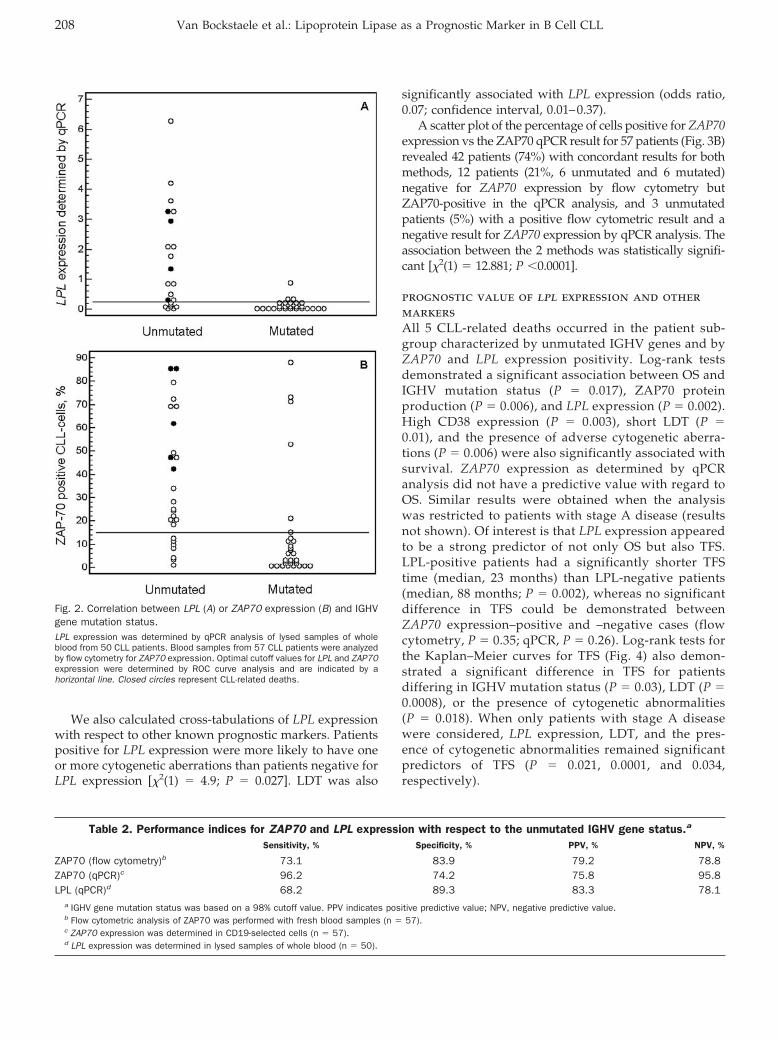
We also calculated cross-tabulations of LPL expressionwith respect to other known prognostic markers. Patientspositive for LPL expression were more likely to have oneor more cytogenetic aberrations than patients negative forLPL expression [�2(1) � 4.9; P � 0.027]. LDT was also
significantly associated with LPL expression (odds ratio,0.07; confidence interval, 0.01–0.37).
A scatter plot of the percentage of cells positive for ZAP70expression vs the ZAP70 qPCR result for 57 patients (Fig. 3B)revealed 42 patients (74%) with concordant results for bothmethods, 12 patients (21%, 6 unmutated and 6 mutated)negative for ZAP70 expression by flow cytometry butZAP70-positive in the qPCR analysis, and 3 unmutatedpatients (5%) with a positive flow cytometric result and anegative result for ZAP70 expression by qPCR analysis. Theassociation between the 2 methods was statistically signifi-cant [�2(1) � 12.881; P �0.0001].
prognostic value of lpl expression and othermarkersAll 5 CLL-related deaths occurred in the patient sub-group characterized by unmutated IGHV genes and byZAP70 and LPL expression positivity. Log-rank testsdemonstrated a significant association between OS andIGHV mutation status (P � 0.017), ZAP70 proteinproduction (P � 0.006), and LPL expression (P � 0.002).High CD38 expression (P � 0.003), short LDT (P �0.01), and the presence of adverse cytogenetic aberra-tions (P � 0.006) were also significantly associated withsurvival. ZAP70 expression as determined by qPCRanalysis did not have a predictive value with regard toOS. Similar results were obtained when the analysiswas restricted to patients with stage A disease (resultsnot shown). Of interest is that LPL expression appearedto be a strong predictor of not only OS but also TFS.LPL-positive patients had a significantly shorter TFStime (median, 23 months) than LPL-negative patients(median, 88 months; P � 0.002), whereas no significantdifference in TFS could be demonstrated betweenZAP70 expression–positive and –negative cases (flowcytometry, P � 0.35; qPCR, P � 0.26). Log-rank tests forthe Kaplan–Meier curves for TFS (Fig. 4) also demon-strated a significant difference in TFS for patientsdiffering in IGHV mutation status (P � 0.03), LDT (P �0.0008), or the presence of cytogenetic abnormalities(P � 0.018). When only patients with stage A diseasewere considered, LPL expression, LDT, and the pres-ence of cytogenetic abnormalities remained significantpredictors of TFS (P � 0.021, 0.0001, and 0.034,respectively).
Fig. 2. Correlation between LPL (A) or ZAP70 expression (B) and IGHVgene mutation status.LPL expression was determined by qPCR analysis of lysed samples of wholeblood from 50 CLL patients. Blood samples from 57 CLL patients were analyzedby flow cytometry for ZAP70 expression. Optimal cutoff values for LPL and ZAP70expression were determined by ROC curve analysis and are indicated by ahorizontal line. Closed circles represent CLL-related deaths.
Table 2. Performance indices for ZAP70 and LPL expression with respect to the unmutated IGHV gene status.a
Sensitivity, % Specificity, % PPV, % NPV, %
ZAP70 (flow cytometry)b 73.1 83.9 79.2 78.8ZAP70 (qPCR)c 96.2 74.2 75.8 95.8LPL (qPCR)d 68.2 89.3 83.3 78.1
a IGHV gene mutation status was based on a 98% cutoff value. PPV indicates positive predictive value; NPV, negative predictive value.b Flow cytometric analysis of ZAP70 was performed with fresh blood samples (n � 57).c ZAP70 expression was determined in CD19-selected cells (n � 57).d LPL expression was determined in lysed samples of whole blood (n � 50).
208 Van Bockstaele et al.: Lipoprotein Lipase as a Prognostic Marker in B Cell CLL
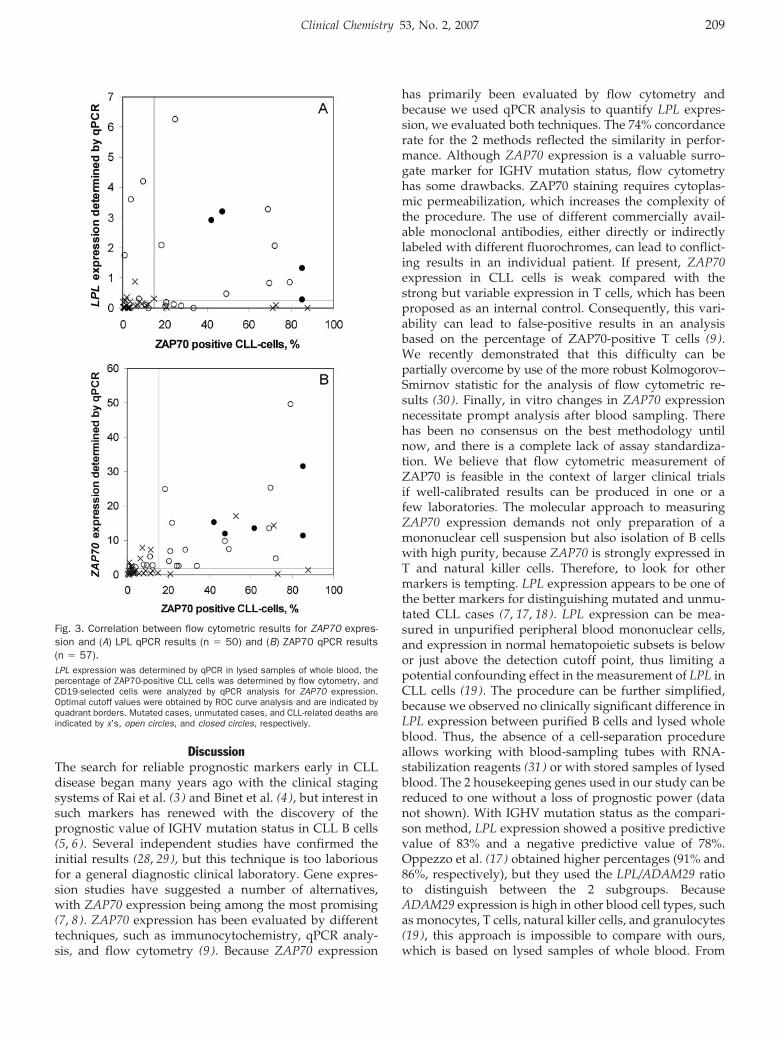
DiscussionThe search for reliable prognostic markers early in CLLdisease began many years ago with the clinical stagingsystems of Rai et al. (3 ) and Binet et al. (4 ), but interest insuch markers has renewed with the discovery of theprognostic value of IGHV mutation status in CLL B cells(5, 6). Several independent studies have confirmed theinitial results (28, 29), but this technique is too laboriousfor a general diagnostic clinical laboratory. Gene expres-sion studies have suggested a number of alternatives,with ZAP70 expression being among the most promising(7, 8). ZAP70 expression has been evaluated by differenttechniques, such as immunocytochemistry, qPCR analy-sis, and flow cytometry (9 ). Because ZAP70 expression
has primarily been evaluated by flow cytometry andbecause we used qPCR analysis to quantify LPL expres-sion, we evaluated both techniques. The 74% concordancerate for the 2 methods reflected the similarity in perfor-mance. Although ZAP70 expression is a valuable surro-gate marker for IGHV mutation status, flow cytometryhas some drawbacks. ZAP70 staining requires cytoplas-mic permeabilization, which increases the complexity ofthe procedure. The use of different commercially avail-able monoclonal antibodies, either directly or indirectlylabeled with different fluorochromes, can lead to conflict-ing results in an individual patient. If present, ZAP70expression in CLL cells is weak compared with thestrong but variable expression in T cells, which has beenproposed as an internal control. Consequently, this vari-ability can lead to false-positive results in an analysisbased on the percentage of ZAP70-positive T cells (9 ).We recently demonstrated that this difficulty can bepartially overcome by use of the more robust Kolmogorov–Smirnov statistic for the analysis of flow cytometric re-sults (30 ). Finally, in vitro changes in ZAP70 expressionnecessitate prompt analysis after blood sampling. Therehas been no consensus on the best methodology untilnow, and there is a complete lack of assay standardiza-tion. We believe that flow cytometric measurement ofZAP70 is feasible in the context of larger clinical trialsif well-calibrated results can be produced in one or afew laboratories. The molecular approach to measuringZAP70 expression demands not only preparation of amononuclear cell suspension but also isolation of B cellswith high purity, because ZAP70 is strongly expressed inT and natural killer cells. Therefore, to look for othermarkers is tempting. LPL expression appears to be one ofthe better markers for distinguishing mutated and unmu-tated CLL cases (7, 17, 18). LPL expression can be mea-sured in unpurified peripheral blood mononuclear cells,and expression in normal hematopoietic subsets is belowor just above the detection cutoff point, thus limiting apotential confounding effect in the measurement of LPL inCLL cells (19 ). The procedure can be further simplified,because we observed no clinically significant difference inLPL expression between purified B cells and lysed wholeblood. Thus, the absence of a cell-separation procedureallows working with blood-sampling tubes with RNA-stabilization reagents (31 ) or with stored samples of lysedblood. The 2 housekeeping genes used in our study can bereduced to one without a loss of prognostic power (datanot shown). With IGHV mutation status as the compari-son method, LPL expression showed a positive predictivevalue of 83% and a negative predictive value of 78%.Oppezzo et al. (17 ) obtained higher percentages (91% and86%, respectively), but they used the LPL/ADAM29 ratioto distinguish between the 2 subgroups. BecauseADAM29 expression is high in other blood cell types, suchas monocytes, T cells, natural killer cells, and granulocytes(19 ), this approach is impossible to compare with ours,which is based on lysed samples of whole blood. From
Fig. 3. Correlation between flow cytometric results for ZAP70 expres-sion and (A) LPL qPCR results (n � 50) and (B) ZAP70 qPCR results(n � 57).LPL expression was determined by qPCR in lysed samples of whole blood, thepercentage of ZAP70-positive CLL cells was determined by flow cytometry, andCD19-selected cells were analyzed by qPCR analysis for ZAP70 expression.Optimal cutoff values were obtained by ROC curve analysis and are indicated byquadrant borders. Mutated cases, unmutated cases, and CLL-related deaths areindicated by x’s, open circles, and closed circles, respectively.
Clinical Chemistry 53, No. 2, 2007 209
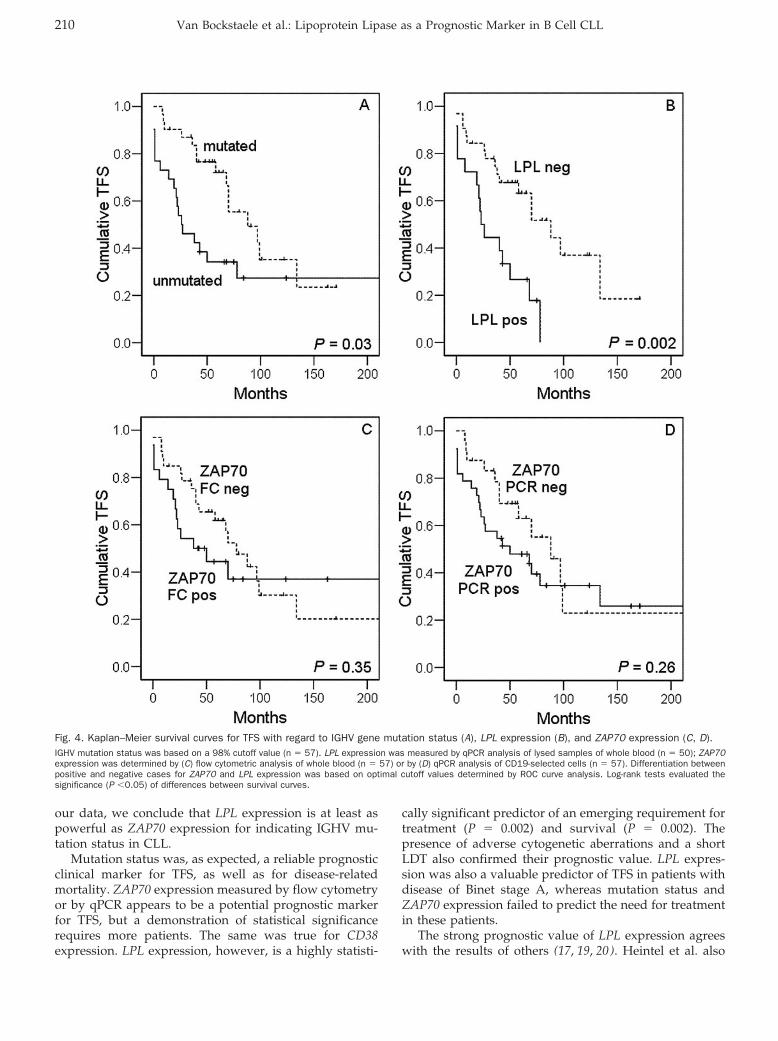
our data, we conclude that LPL expression is at least aspowerful as ZAP70 expression for indicating IGHV mu-tation status in CLL.
Mutation status was, as expected, a reliable prognosticclinical marker for TFS, as well as for disease-relatedmortality. ZAP70 expression measured by flow cytometryor by qPCR appears to be a potential prognostic markerfor TFS, but a demonstration of statistical significancerequires more patients. The same was true for CD38expression. LPL expression, however, is a highly statisti-
cally significant predictor of an emerging requirement fortreatment (P � 0.002) and survival (P � 0.002). Thepresence of adverse cytogenetic aberrations and a shortLDT also confirmed their prognostic value. LPL expres-sion was also a valuable predictor of TFS in patients withdisease of Binet stage A, whereas mutation status andZAP70 expression failed to predict the need for treatmentin these patients.
The strong prognostic value of LPL expression agreeswith the results of others (17, 19, 20). Heintel et al. also
Fig. 4. Kaplan–Meier survival curves for TFS with regard to IGHV gene mutation status (A), LPL expression (B), and ZAP70 expression (C, D).IGHV mutation status was based on a 98% cutoff value (n � 57). LPL expression was measured by qPCR analysis of lysed samples of whole blood (n � 50); ZAP70expression was determined by (C) flow cytometric analysis of whole blood (n � 57) or by (D) qPCR analysis of CD19-selected cells (n � 57). Differentiation betweenpositive and negative cases for ZAP70 and LPL expression was based on optimal cutoff values determined by ROC curve analysis. Log-rank tests evaluated thesignificance (P �0.05) of differences between survival curves.
210 Van Bockstaele et al.: Lipoprotein Lipase as a Prognostic Marker in B Cell CLL
found an association between IGHV mutation status andLPL protein production. However, the magnitude of thedifference in LPL mRNA expression between the 2 groupsof patients (mutated vs unmutated) as assessed by qPCRanalysis was greater than the difference in the intracellu-lar LPL staining intensities (20 ).
Neither the function of LPL in CLL nor the molecularmechanisms regulating its synthesis are known. That CLLB cells express heparan sulfate (personal communication,Peter Van Landschoot, April 12, 2006), which can stabilizeLPL expression on the cellular membrane, invites thespeculation that membrane-associated LPL affects thebiological behavior of CLL cells, such as cell spreading,migration, and intracellular signaling (32 ).
In conclusion, we have shown that measurement of LPLmRNA expression in whole blood correlates with IGHVmutation status, TFS and survival, and requires less timeand labor than the determination of ZAP70 expression.Therefore, this method deserves to be incorporated intonew or ongoing clinical trials that evaluate differenttreatment strategies in CLL, stratified by different prog-nostic profiles.
This work was supported by Grant no. G.0026.06 from theFund for Scientific Research – Flanders (FWO-Vlaan-deren), and Grant no. 01J02006 from the Bijzonder Onder-zoeksfonds from the Ghent University. B.V. is a SeniorClinical Investigator and F.V.B. is a Research Assistant ofthe Research Foundation – Flanders (FWO). The authorsthank the patients enrolled in this study and the person-nel of the Laboratories for Molecular Diagnostics, Hema-tology and Medical Genetics, and the Clinical Departmentof Hematology of the Ghent University Hospital for theircollaboration. We are also indebted to Dr. Ilse Mollet, Dr.Barbara Leus, Dr. Anne Piette, and Dr. Kaat Smits for helpwith analyses.
References1. Hamblin AD, Hamblin TJ. Functional and prognostic role of ZAP-70
in chronic lymphocytic leukaemia. Expert Opin Ther Targets 2005;9:1165–78.
2. Montillo M, Hamblin T, Hallek M, Montserrat E, Morra E. Chroniclymphocytic leukemia: novel prognostic factors and their relevancefor risk-adapted therapeutic strategies. Haematologica 2005;90:391–9.
3. Rai KR, Sawitsky A, Cronkite EP, Chanana AD, Levy RN, Paster-nack BS. Clinical staging of chronic lymphocytic leukemia. Blood1975;46:219–34.
4. Binet JL, Auquier A, Dighiero G, Chastang C, Piguet H, GoasguenJ, et al. A new prognostic classification of chronic lymphocyticleukemia derived from a multivariate survival analysis. Cancer1981;48:198–206.
5. Damle RN, Wasil T, Fais F, Ghiotto F, Valetto A, Allen SL, et al. IgV gene mutation status and CD38 expression as novel prognosticindicators in chronic lymphocytic leukemia. Blood 1999;94:1840–7.
6. Hamblin TJ, Davis Z, Gardiner A, Oscier DG, Stevenson FK.Unmutated Ig V(H) genes are associated with a more aggressiveform of chronic lymphocytic leukemia. Blood 1999;94:1848–54.
7. Rosenwald A, Alizadeh AA, Widhopf G, Simon R, Davis RE, Yu X, etal. Relation of gene expression phenotype to immunoglobulinmutation genotype in B cell chronic lymphocytic leukemia. J ExpMed 2001;194:1639–47.
8. Wiestner A, Rosenwald A, Barry TS, Wright G, Davis RE, Henrick-son SE, et al. ZAP-70 expression identifies a chronic lymphocyticleukemia subtype with unmutated immunoglobulin genes, inferiorclinical outcome, and distinct gene expression profile. Blood2003;101:4944–51.
9. Crespo M, Bosch F, Villamor N, Bellosillo B, Colomer D, RozmanM, et al. ZAP-70 expression as a surrogate for immunoglobulin-variable-region mutations in chronic lymphocytic leukemia. N EnglJ Med 2003;348:1764–75.
10. Durig J, Nuckel H, Cremer M, Fuhrer A, Halfmeyer K, Fandrey J, etal. ZAP-70 expression is a prognostic factor in chronic lymphocyticleukemia. Leukemia 2003;17:2426–34.
11. Orchard JA, Ibbotson RE, Davis Z, Wiestner A, Rosenwald A,Thomas PW, et al. ZAP-70 expression and prognosis in chroniclymphocytic leukaemia. Lancet 2004;363:105–11.
12. Rassenti LZ, Huynh L, Toy TL, Chen L, Keating MJ, Gribben JG, etal. ZAP-70 compared with immunoglobulin heavy-chain gene mu-tation status as a predictor of disease progression in chroniclymphocytic leukemia. N Engl J Med 2004;351:893–901.
13. Schroers R, Griesinger F, Trumper L, Haase D, Kulle B, Klein-Hitpass L, et al. Combined analysis of ZAP-70 and CD38 expres-sion as a predictor of disease progression in B cell chroniclymphocytic leukemia. Leukemia 2005;19:750–8.
14. Del Giudice I, Morilla A, Osuji N, Matutes E, Morilla R, Burford A,et al. Zeta-chain associated protein 70 and CD38 combinedpredict the time to first treatment in patients with chronic lympho-cytic leukemia. Cancer 2005;104:2124–32.
15. Laurenti L, Petlickovski A, Rumi C, Gobessi S, Piccioni P, TarnaniM, et al. Comparison of ZAP-70/Syk mRNA levels with immuno-globulin heavy-chain gene mutation status and disease progres-sion in chronic lymphocytic leukemia. Haematologica 2005;90:1533–40.
16. Vener C, Gianelli U, Cortelezzi A, Fracchiolla NS, Somalvico F, SaviF, et al. ZAP-70 immunoreactivity is a prognostic marker ofdisease progression in chronic lymphocytic leukemia. Leuk Lym-phoma 2006;47:245–51.
17. Oppezzo P, Vasconcelos Y, Settegrana C, Jeannel D, Vuillier F,Legarff-Tavernier M, et al. The LPL/ADAM29 expression ratio is anovel prognosis indicator in chronic lymphocytic leukemia. Blood2005;106:650–7.
18. Klein U, Tu Y, Stolovitzky GA, Mattioli M, Cattoretti G, Husson H,et al. Gene expression profiling of B cell chronic lymphocyticleukemia reveals a homogeneous phenotype related to memory Bcells. J Exp Med 2001;194:1625–38.
19. van’t Veer MB, Brooijmans AM, Langerak AW, Verhaaf B, Goud-swaard CS, Graveland WJ, et al. The predictive value of lipoproteinlipase for survival in chronic lymphocytic leukemia. Haematologica2006;91:56–63.
20. Heintel D, Kienle D, Shehata M, Krober A, Kroemer E, Schwarz-inger I, et al. High expression of lipoprotein lipase in poor risk Bcell chronic lymphocytic leukemia. Leukemia 2005;19:1216–23.
21. Moreau EJ, Matutes E, A’Hern RP, Morilla AM, Morilla RM,Owusu-Ankomah KA, et al. Improvement of the chronic lympho-cytic leukemia scoring system with the monoclonal antibody SN8(CD79b). Am J Clin Pathol 1997;108:378–82.
22. Campbell MJ, Zelenetz AD, Levy S, Levy R. Use of family specificleader region primers for PCR amplification of the human heavy
Clinical Chemistry 53, No. 2, 2007 211
chain variable region gene repertoire. Mol Immunol 1992;29:193–203.
23. Aubin J, Davi F, Nguyen-Salomon F, Leboeuf D, Debert C, Taher M,et al. Description of a novel FR1 IgH PCR strategy and itscomparison with three other strategies for the detection ofclonality in B cell malignancies. Leukemia 1995;9:471–9.
24. Claeys S, De Belder T, Holtappels G, Gevaert P, Verhasselt B, VanCauwenberge P, Bachert C. Macrophage mannose receptor inchronic sinus disease. Allergy 2004;59:606–12.
25. Beillard E, Pallisgaard N, van der Velden VH, Bi W, Dee R, van derSchoot E, et al. Evaluation of candidate control genes for diagno-sis and residual disease detection in leukemic patients using‘real-time’ quantitative reverse-transcriptase polymerase chainreaction (RQ-PCR): a Europe Against Cancer program. Leukemia2003;17:2474–86.
26. Kienle D, Benner A, Krober A, Winkler D, Mertens D, Buhler A, etal. Distinct gene expression patterns in chronic lymphocyticleukemia defined by usage of specific VH genes. Blood 2006;107:2090–3.
27. Philippe J, Van Bockstaele F, Smits K, Offner F, Verhasselt B,Janssens A. The restricted VH-gene usage is of prognostic value in
B-Cell chronic lymphocytic leukemia. ASH Annual Meeting Ab-stracts 2004;104:528–9.
28. Stilgenbauer S, Bullinger L, Lichter P, Dohner H. Genetics ofchronic lymphocytic leukemia: genomic aberrations and V(H) genemutation status in pathogenesis and clinical course. Leukemia2002;16:993–1007.
29. Jelinek DF, Tschumper RC, Geyer SM, Bone ND, Dewald GW,Hanson CA, et al. Analysis of clonal B cell CD38 and immunoglob-ulin variable region sequence status in relation to clinical outcomefor B-chronic lymphocytic leukaemia. Br J Haematol 2001;115:854–61.
30. Van Bockstaele F, Janssens A, Piette A, Callewaert F, Pede V,Offner F, et al. Kolmogorov-Smirnov statistical test for analysis ofZAP-70 expression in B-CLL, compared with quantitative PCR andIgVH mutation status. Cytometry B Clin Cytom 2006;70B:302–8.
31. Thach DC, Lin B, Walter E, Kruzelock R, Rowley RK, Tibbetts C, etal. Assessment of two methods for handling blood in collectiontubes with RNA stabilizing agent for surveillance of gene expres-sion profiles with high density microarrays. J Immunol Methods2003;283:269–79.
32. Kolset SO, Salmivirta M. Cell surface heparan sulfate proteoglycansand lipoprotein metabolism. Cell Mol Life Sci 1999;56:857–70.
212 Van Bockstaele et al.: Lipoprotein Lipase as a Prognostic Marker in B Cell CLL
Cost Consequences of Implementing an ElectronicDecision Support System for Ordering Laboratory
Tests in Primary Care: Evidence from aControlled Prospective Study in The Netherlands
Marten J. Poley,1,2* Kyra I. Edelenbos,3 Mees Mosseveld,3 Marc A.M. van Wijk,3
Dinny H. de Bakker,4 Johan van der Lei,3 Maureen P.M.H. Rutten-van Molken1
Background: The economic consequences of interven-tions to promote rational, evidence-based use of labora-tory tests by physicians are not yet fully understood. Weevaluated the cost consequences of a computer-based,guideline-driven decision-support system (CDSS) forordering blood tests in primary care.Methods: We installed the CDSS in 118 practices [159general practitioners (GPs)] throughout The Nether-lands and calculated the costs of the intervention in thisgroup. During a period of 6 months before and 6 monthsafter installation of the CDSS, the test-ordering behav-ior of 87 (109 GPs) of these 118 study practices wasstudied and the results were compared with those of anonhistorical control group that did not receive theCDSS. In addition the costs of laboratory requests werecalculated for both groups.Results: Total intervention costs, comprising develop-ment costs and installation costs, amounted to €79 000(€670 per practice). Whereas the introduction of theCDSS did not affect the number of order forms submit-ted to the laboratories, it did reduce the number ofblood tests per order form. As a result, the CDSS yielded
mean savings on the costs of laboratory requests of €847per practice per 6 months.Conclusions: This study demonstrates that providingelectronic decision support for ordering blood tests inprimary care represents an economically promising con-cept. Savings on laboratory costs are achievable and notoffset by disproportionally high intervention costs.© 2007 American Association for Clinical Chemistry
Despite recognition of the importance of laboratory test-ing as a diagnostic instrument, there is growing concernabout physician test-ordering behavior. Test-orderingroutines are not always rational, and interdoctor test-ordering behavior varies substantially (1–3). Recognitionof this problem has led to numerous attempts to promoterational, evidence-based use of laboratory tests by physi-cians (4–6). Methods tested alone and in combination inout-of-hospital settings include individual feedback, dis-semination of evidence-based guidelines, and meetingson quality improvement (7–11). Other interventions in-clude order forms showing fewer laboratory tests (12 ),combination of simplified, problem-oriented order formsand feedback (13 ), informing physicians of the charges oftests (14 ), and computer-based, guideline-driven deci-sion-support systems (15–18). These interventions—albeitwith varying degrees of success—appear to reduce thenumber of tests ordered and enhance protocol adherence.
Several questions regarding the efficiency of initiativesto improve test ordering remain unanswered, however.For example, such interventions can be very costly todevelop and implement. A study on physician educationwith feedback, performed in a hospital setting, indicatedthat the cost of the interventions might have canceled outany potential savings on hospital costs (19 ). Thereforesavings on laboratory tests must be balanced against such
1 Institute for Medical Technology Assessment (iMTA), Erasmus MC,Rotterdam, The Netherlands.
2 Department of Pediatric Surgery, Sophia Children’s Hospital, ErasmusMC, Rotterdam, The Netherlands.
3 Institute of Medical Informatics (MIEUR), Erasmus MC, Rotterdam, TheNetherlands.
4 Netherlands Institute for Health Services Research (NIVEL), Utrecht, TheNetherlands.
* Address correspondence to this author at: institute for Medical Technol-ogy Assessment (iMTA), Erasmus MC, P.O. Box 1738, 3000 DR Rotterdam, TheNetherlands. Fax 31-10-408-9092; e-mail [email protected].
Received May 30, 2006; accepted November 17, 2006.Previously published online at DOI: 10.1373/clinchem.2006.073908
Clinical Chemistry 53:2213–219 (2007)
Evidence-BasedLaboratory Medicineand Test Utilization
213
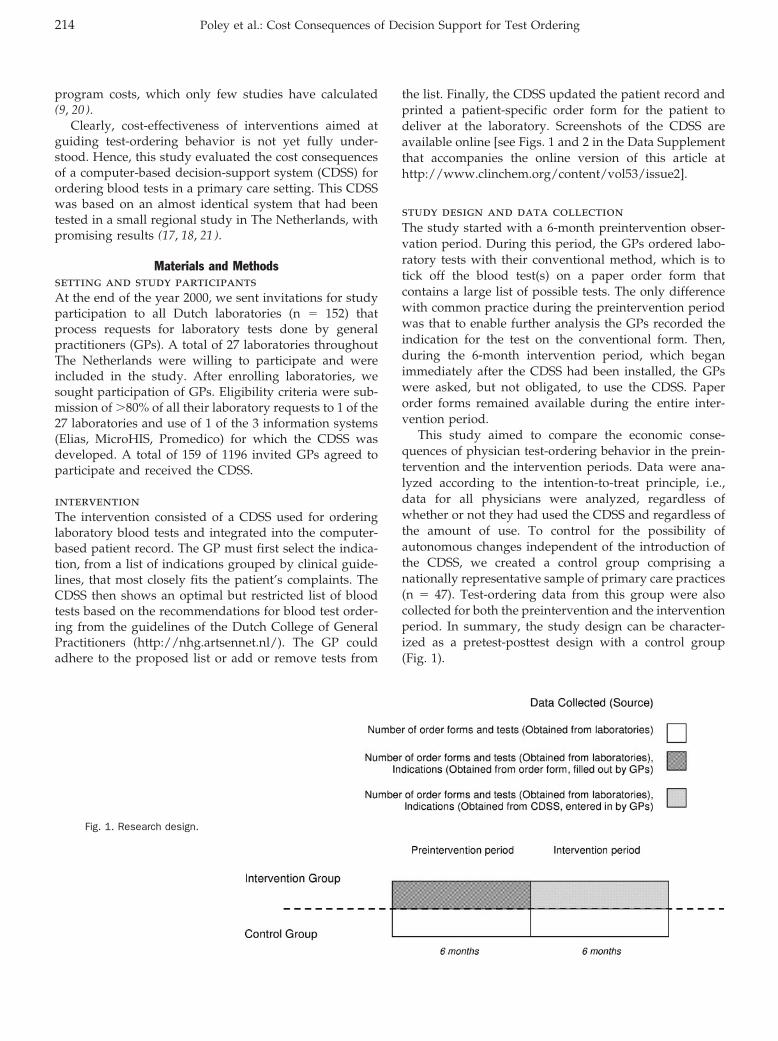
program costs, which only few studies have calculated(9, 20).
Clearly, cost-effectiveness of interventions aimed atguiding test-ordering behavior is not yet fully under-stood. Hence, this study evaluated the cost consequencesof a computer-based decision-support system (CDSS) forordering blood tests in a primary care setting. This CDSSwas based on an almost identical system that had beentested in a small regional study in The Netherlands, withpromising results (17, 18, 21).
Materials and Methodssetting and study participantsAt the end of the year 2000, we sent invitations for studyparticipation to all Dutch laboratories (n � 152) thatprocess requests for laboratory tests done by generalpractitioners (GPs). A total of 27 laboratories throughoutThe Netherlands were willing to participate and wereincluded in the study. After enrolling laboratories, wesought participation of GPs. Eligibility criteria were sub-mission of �80% of all their laboratory requests to 1 of the27 laboratories and use of 1 of the 3 information systems(Elias, MicroHIS, Promedico) for which the CDSS wasdeveloped. A total of 159 of 1196 invited GPs agreed toparticipate and received the CDSS.
interventionThe intervention consisted of a CDSS used for orderinglaboratory blood tests and integrated into the computer-based patient record. The GP must first select the indica-tion, from a list of indications grouped by clinical guide-lines, that most closely fits the patient’s complaints. TheCDSS then shows an optimal but restricted list of bloodtests based on the recommendations for blood test order-ing from the guidelines of the Dutch College of GeneralPractitioners (http://nhg.artsennet.nl/). The GP couldadhere to the proposed list or add or remove tests from
the list. Finally, the CDSS updated the patient record andprinted a patient-specific order form for the patient todeliver at the laboratory. Screenshots of the CDSS areavailable online [see Figs. 1 and 2 in the Data Supplementthat accompanies the online version of this article athttp://www.clinchem.org/content/vol53/issue2].
study design and data collectionThe study started with a 6-month preintervention obser-vation period. During this period, the GPs ordered labo-ratory tests with their conventional method, which is totick off the blood test(s) on a paper order form thatcontains a large list of possible tests. The only differencewith common practice during the preintervention periodwas that to enable further analysis the GPs recorded theindication for the test on the conventional form. Then,during the 6-month intervention period, which beganimmediately after the CDSS had been installed, the GPswere asked, but not obligated, to use the CDSS. Paperorder forms remained available during the entire inter-vention period.
This study aimed to compare the economic conse-quences of physician test-ordering behavior in the prein-tervention and the intervention periods. Data were ana-lyzed according to the intention-to-treat principle, i.e.,data for all physicians were analyzed, regardless ofwhether or not they had used the CDSS and regardless ofthe amount of use. To control for the possibility ofautonomous changes independent of the introduction ofthe CDSS, we created a control group comprising anationally representative sample of primary care practices(n � 47). Test-ordering data from this group were alsocollected for both the preintervention and the interventionperiod. In summary, the study design can be character-ized as a pretest-posttest design with a control group(Fig. 1).
Fig. 1. Research design.
214 Poley et al.: Cost Consequences of Decision Support for Test Ordering
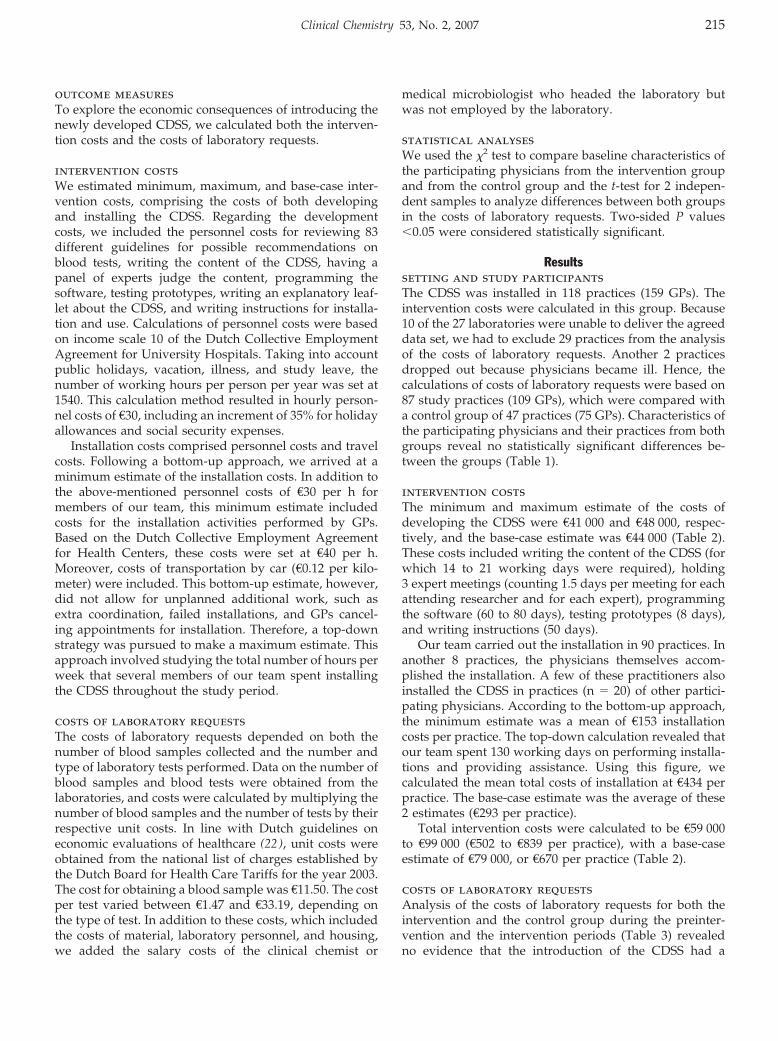
outcome measuresTo explore the economic consequences of introducing thenewly developed CDSS, we calculated both the interven-tion costs and the costs of laboratory requests.
intervention costsWe estimated minimum, maximum, and base-case inter-vention costs, comprising the costs of both developingand installing the CDSS. Regarding the developmentcosts, we included the personnel costs for reviewing 83different guidelines for possible recommendations onblood tests, writing the content of the CDSS, having apanel of experts judge the content, programming thesoftware, testing prototypes, writing an explanatory leaf-let about the CDSS, and writing instructions for installa-tion and use. Calculations of personnel costs were basedon income scale 10 of the Dutch Collective EmploymentAgreement for University Hospitals. Taking into accountpublic holidays, vacation, illness, and study leave, thenumber of working hours per person per year was set at1540. This calculation method resulted in hourly person-nel costs of €30, including an increment of 35% for holidayallowances and social security expenses.
Installation costs comprised personnel costs and travelcosts. Following a bottom-up approach, we arrived at aminimum estimate of the installation costs. In addition tothe above-mentioned personnel costs of €30 per h formembers of our team, this minimum estimate includedcosts for the installation activities performed by GPs.Based on the Dutch Collective Employment Agreementfor Health Centers, these costs were set at €40 per h.Moreover, costs of transportation by car (€0.12 per kilo-meter) were included. This bottom-up estimate, however,did not allow for unplanned additional work, such asextra coordination, failed installations, and GPs cancel-ing appointments for installation. Therefore, a top-downstrategy was pursued to make a maximum estimate. Thisapproach involved studying the total number of hours perweek that several members of our team spent installingthe CDSS throughout the study period.
costs of laboratory requestsThe costs of laboratory requests depended on both thenumber of blood samples collected and the number andtype of laboratory tests performed. Data on the number ofblood samples and blood tests were obtained from thelaboratories, and costs were calculated by multiplying thenumber of blood samples and the number of tests by theirrespective unit costs. In line with Dutch guidelines oneconomic evaluations of healthcare (22 ), unit costs wereobtained from the national list of charges established bythe Dutch Board for Health Care Tariffs for the year 2003.The cost for obtaining a blood sample was €11.50. The costper test varied between €1.47 and €33.19, depending onthe type of test. In addition to these costs, which includedthe costs of material, laboratory personnel, and housing,we added the salary costs of the clinical chemist or
medical microbiologist who headed the laboratory butwas not employed by the laboratory.
statistical analysesWe used the �2 test to compare baseline characteristics ofthe participating physicians from the intervention groupand from the control group and the t-test for 2 indepen-dent samples to analyze differences between both groupsin the costs of laboratory requests. Two-sided P values�0.05 were considered statistically significant.
Resultssetting and study participantsThe CDSS was installed in 118 practices (159 GPs). Theintervention costs were calculated in this group. Because10 of the 27 laboratories were unable to deliver the agreeddata set, we had to exclude 29 practices from the analysisof the costs of laboratory requests. Another 2 practicesdropped out because physicians became ill. Hence, thecalculations of costs of laboratory requests were based on87 study practices (109 GPs), which were compared witha control group of 47 practices (75 GPs). Characteristics ofthe participating physicians and their practices from bothgroups reveal no statistically significant differences be-tween the groups (Table 1).
intervention costsThe minimum and maximum estimate of the costs ofdeveloping the CDSS were €41 000 and €48 000, respec-tively, and the base-case estimate was €44 000 (Table 2).These costs included writing the content of the CDSS (forwhich 14 to 21 working days were required), holding3 expert meetings (counting 1.5 days per meeting for eachattending researcher and for each expert), programmingthe software (60 to 80 days), testing prototypes (8 days),and writing instructions (50 days).
Our team carried out the installation in 90 practices. Inanother 8 practices, the physicians themselves accom-plished the installation. A few of these practitioners alsoinstalled the CDSS in practices (n � 20) of other partici-pating physicians. According to the bottom-up approach,the minimum estimate was a mean of €153 installationcosts per practice. The top-down calculation revealed thatour team spent 130 working days on performing installa-tions and providing assistance. Using this figure, wecalculated the mean total costs of installation at €434 perpractice. The base-case estimate was the average of these2 estimates (€293 per practice).
Total intervention costs were calculated to be €59 000to €99 000 (€502 to €839 per practice), with a base-caseestimate of €79 000, or €670 per practice (Table 2).
costs of laboratory requestsAnalysis of the costs of laboratory requests for both theintervention and the control group during the preinter-vention and the intervention periods (Table 3) revealedno evidence that the introduction of the CDSS had a
Clinical Chemistry 53, No. 2, 2007 215
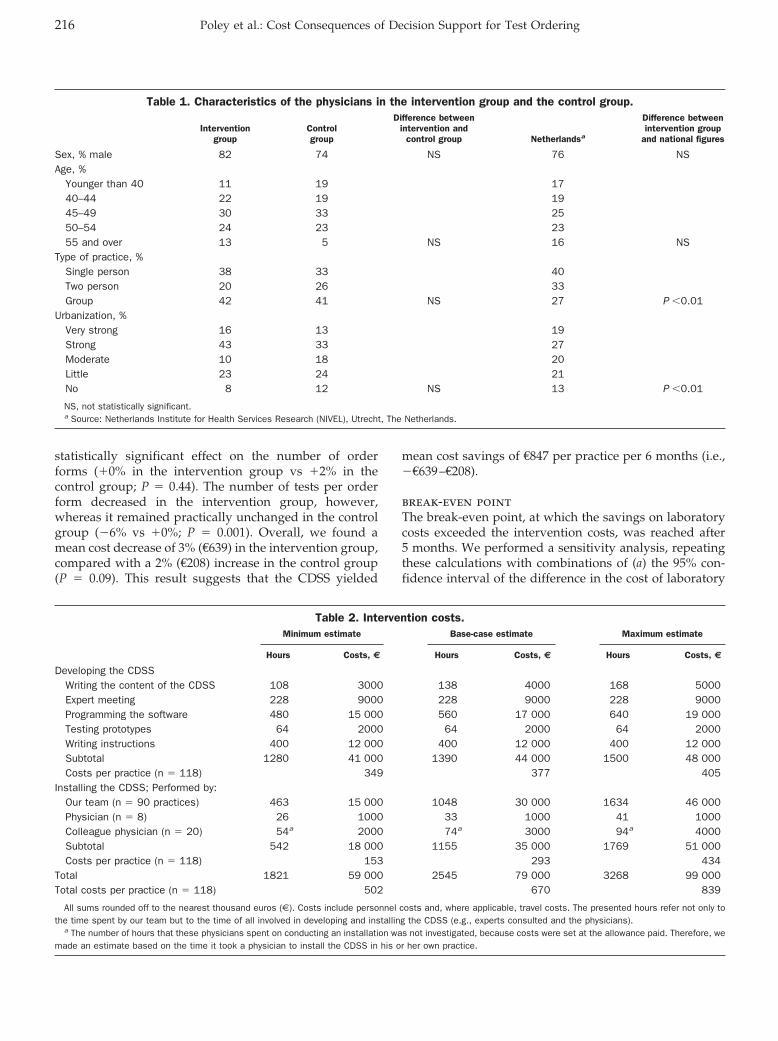
statistically significant effect on the number of orderforms (�0% in the intervention group vs �2% in thecontrol group; P � 0.44). The number of tests per orderform decreased in the intervention group, however,whereas it remained practically unchanged in the controlgroup (�6% vs �0%; P � 0.001). Overall, we found amean cost decrease of 3% (€639) in the intervention group,compared with a 2% (€208) increase in the control group(P � 0.09). This result suggests that the CDSS yielded
mean cost savings of €847 per practice per 6 months (i.e.,�€639–€208).
break-even pointThe break-even point, at which the savings on laboratorycosts exceeded the intervention costs, was reached after5 months. We performed a sensitivity analysis, repeatingthese calculations with combinations of (a) the 95% con-fidence interval of the difference in the cost of laboratory
Table 1. Characteristics of the physicians in the intervention group and the control group.
Interventiongroup
Controlgroup
Difference betweenintervention and
control group Netherlandsa
Difference betweenintervention group
and national figures
Sex, % male 82 74 NS 76 NSAge, %
Younger than 40 11 19 1740–44 22 19 1945–49 30 33 2550–54 24 23 2355 and over 13 5 NS 16 NS
Type of practice, %Single person 38 33 40Two person 20 26 33Group 42 41 NS 27 P �0.01
Urbanization, %Very strong 16 13 19Strong 43 33 27Moderate 10 18 20Little 23 24 21No 8 12 NS 13 P �0.01
NS, not statistically significant.a Source: Netherlands Institute for Health Services Research (NIVEL), Utrecht, The Netherlands.
Table 2. Intervention costs.Minimum estimate Base-case estimate Maximum estimate
Hours Costs, € Hours Costs, € Hours Costs, €
Developing the CDSSWriting the content of the CDSS 108 3000 138 4000 168 5000Expert meeting 228 9000 228 9000 228 9000Programming the software 480 15 000 560 17 000 640 19 000Testing prototypes 64 2000 64 2000 64 2000Writing instructions 400 12 000 400 12 000 400 12 000Subtotal 1280 41 000 1390 44 000 1500 48 000Costs per practice (n � 118) 349 377 405
Installing the CDSS; Performed by:Our team (n � 90 practices) 463 15 000 1048 30 000 1634 46 000Physician (n � 8) 26 1000 33 1000 41 1000Colleague physician (n � 20) 54a 2000 74a 3000 94a 4000Subtotal 542 18 000 1155 35 000 1769 51 000Costs per practice (n � 118) 153 293 434
Total 1821 59 000 2545 79 000 3268 99 000Total costs per practice (n � 118) 502 670 839
All sums rounded off to the nearest thousand euros (€). Costs include personnel costs and, where applicable, travel costs. The presented hours refer not only tothe time spent by our team but to the time of all involved in developing and installing the CDSS (e.g., experts consulted and the physicians).
a The number of hours that these physicians spent on conducting an installation was not investigated, because costs were set at the allowance paid. Therefore, wemade an estimate based on the time it took a physician to install the CDSS in his or her own practice.
216 Poley et al.: Cost Consequences of Decision Support for Test Ordering
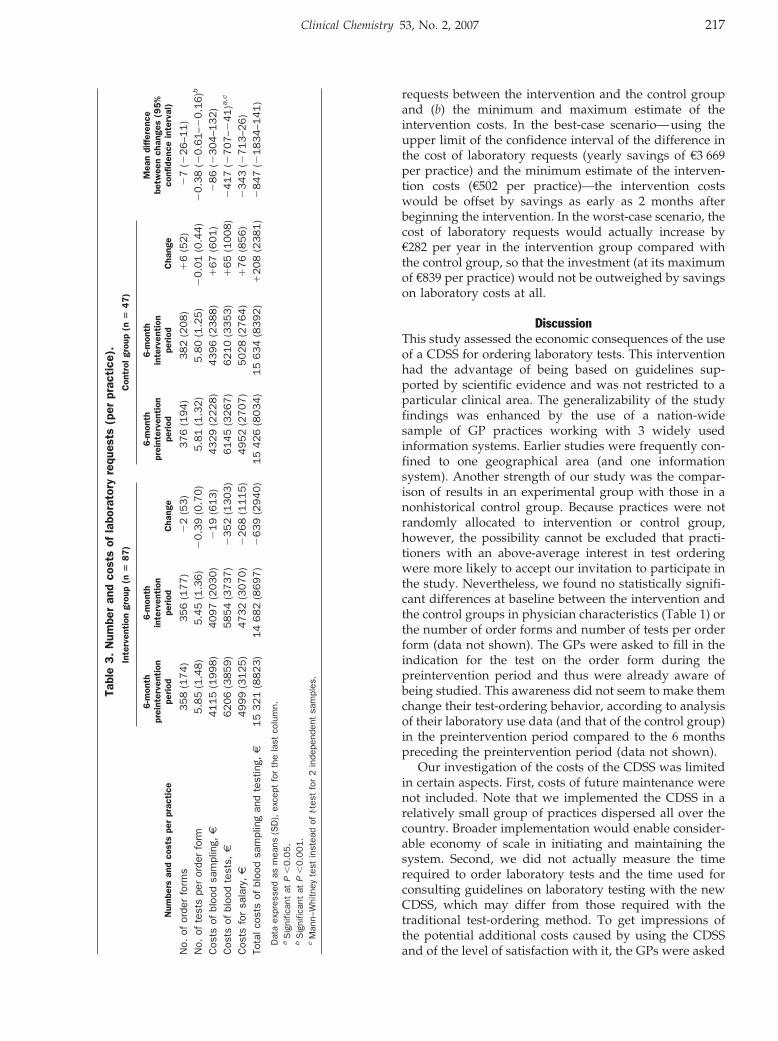
requests between the intervention and the control groupand (b) the minimum and maximum estimate of theintervention costs. In the best-case scenario—using theupper limit of the confidence interval of the difference inthe cost of laboratory requests (yearly savings of €3 669per practice) and the minimum estimate of the interven-tion costs (€502 per practice)—the intervention costswould be offset by savings as early as 2 months afterbeginning the intervention. In the worst-case scenario, thecost of laboratory requests would actually increase by€282 per year in the intervention group compared withthe control group, so that the investment (at its maximumof €839 per practice) would not be outweighed by savingson laboratory costs at all.
DiscussionThis study assessed the economic consequences of the useof a CDSS for ordering laboratory tests. This interventionhad the advantage of being based on guidelines sup-ported by scientific evidence and was not restricted to aparticular clinical area. The generalizability of the studyfindings was enhanced by the use of a nation-widesample of GP practices working with 3 widely usedinformation systems. Earlier studies were frequently con-fined to one geographical area (and one informationsystem). Another strength of our study was the compar-ison of results in an experimental group with those in anonhistorical control group. Because practices were notrandomly allocated to intervention or control group,however, the possibility cannot be excluded that practi-tioners with an above-average interest in test orderingwere more likely to accept our invitation to participate inthe study. Nevertheless, we found no statistically signifi-cant differences at baseline between the intervention andthe control groups in physician characteristics (Table 1) orthe number of order forms and number of tests per orderform (data not shown). The GPs were asked to fill in theindication for the test on the order form during thepreintervention period and thus were already aware ofbeing studied. This awareness did not seem to make themchange their test-ordering behavior, according to analysisof their laboratory use data (and that of the control group)in the preintervention period compared to the 6 monthspreceding the preintervention period (data not shown).
Our investigation of the costs of the CDSS was limitedin certain aspects. First, costs of future maintenance werenot included. Note that we implemented the CDSS in arelatively small group of practices dispersed all over thecountry. Broader implementation would enable consider-able economy of scale in initiating and maintaining thesystem. Second, we did not actually measure the timerequired to order laboratory tests and the time used forconsulting guidelines on laboratory testing with the newCDSS, which may differ from those required with thetraditional test-ordering method. To get impressions ofthe potential additional costs caused by using the CDSSand of the level of satisfaction with it, the GPs were asked
Tabl
e3.
Num
ber
and
cost
sof
labo
rato
ryre
ques
ts(p
erpr
acti
ce).
Num
bers
and
cost
spe
rpr
acti
ce
Inte
rven
tion
grou
p(n
�8
7)
Con
trol
grou
p(n
�4
7)
Mea
ndi
ffer
ence
betw
een
chan
ges
(95
%co
nfid
ence
inte
rval
)
6-m
onth
prei
nter
vent
ion
peri
od
6-m
onth
inte
rven
tion
peri
odC
hang
e
6-m
onth
prei
nter
vent
ion
peri
od
6-m
onth
inte
rven
tion
peri
odC
hang
e
No.
ofor
der
form
s358
(174)
356
(177)
�2
(53)
376
(194)
382
(208)
�6
(52)
�7
(�26–1
1)
No.
ofte
sts
per
orde
rfo
rm5.8
5(1
.48)
5.4
5(1
.36)
�0.3
9(0
.70)
5.8
1(1
.32)
5.8
0(1
.25)
�0.0
1(0
.44)
�0.3
8(�
0.6
1–�
0.1
6)b
Cos
tsof
bloo
dsa
mpl
ing,
€4115
(1998)
4097
(2030)
�19
(613)
4329
(2228)
4396
(2388)
�67
(601)
�86
(�304–1
32)
Cos
tsof
bloo
dte
sts,
€6206
(3859)
5854
(3737)
�352
(1303)
6145
(3267)
6210
(3353)
�65
(1008)
�417
(�707–�
41)a
,c
Cos
tsfo
rsa
lary
,€
4999
(3125)
4732
(3070)
�268
(1115)
4952
(2707)
5028
(2764)
�76
(856)
�343
(�713–2
6)
Tota
lcos
tsof
bloo
dsa
mpl
ing
and
test
ing,
€1
5321
(8823)
14
682
(8697)
�639
(2940)
15
426
(8034)
15
634
(8392)
�208
(2381)
�847
(�1834–1
41)
Dat
aex
pres
sed
asm
eans
(SD
),ex
cept
for
the
last
colu
mn.
aS
igni
fican
tat
P�
0.0
5.
bS
igni
fican
tat
P�
0.0
01.
cM
ann–
Whi
tney
test
inst
ead
oft-t
est
for
2in
depe
nden
tsa
mpl
es.
Clinical Chemistry 53, No. 2, 2007 217
to complete a questionnaire (see Table 1 in the online DataSupplement). Introducing the CDSS required some addi-tional effort for the GPs, a finding consistent with previ-ous research in different contexts that suggested that itmay take physicians more time to write orders with thecomputer than with a paper form (23–25). Furthermore, itmay be troublesome for laboratories to process this newway of ordering tests. The laboratories in this studygenerally were rather unsatisfied with physician submis-sion of new computer-generated order forms, as datacollected by a questionnaire revealed (see Table 2 in theonline Data Supplement). This finding suggests that be-fore the CDSS can achieve its full potential some practicaldifficulties encountered by the laboratories need to beaddressed, a process that may involve a range of solutionsvarying from relatively low-cost methods (e.g., ensuringthat new order forms can be read optically in the usualway) to costlier ones (e.g., enabling electronic sending andreceiving of requests for laboratory tests). Costs for theseprocedures may drop in the long run, however, and makethe process of test ordering less sensitive to error.
Use of the CDSS may also be affected by financialaspects and incentives. In The Netherlands, laboratorytesting in primary care is included in standard carecovered by the mandatory health insurance. Therefore,any cost savings generated by the CDSS accrue to societyas a whole, in the form of a decrease (though small) inhealthcare costs. Dutch GPs have no financial interest inlaboratory testing, because they receive no separate reim-bursement for laboratory tests ordered. On the contrary,implementing the CDSS may have negative consequencesfor the laboratory’s financial stability because the CDSSappeared not to lower the number of blood samples butdid lower the number of tests per order form, and becausethe number of blood samples analyzed is a more impor-tant cost-driving factor than the number of tests re-quested. Because laboratories are partly reimbursed perblood sample and partly per test, their incomes maydecline at a faster rate than their costs.
Reduction in test ordering may be associated withsubstitution of care, for example a shift to other, perhapsmore expensive healthcare procedures to reduce diagnos-tic uncertainty or to reassure patients (26, 27). With this inmind, we performed a preliminary analysis into possiblesubstitution effects. We found no clear evidence that adecrease in laboratory requests was accompanied by ashift to more prescribed medications, GP consultations, orreferrals to specialist care (see Table 3 in the online DataSupplement). Because of the small numbers involved, nofirm conclusions are as yet possible on this issue. Thisfinding nevertheless seems to confirm the few earlierstudies on substitution effects reported in the literature.None of these studies found that a decrease in testrequests went together with an increase in other forms ofmedical care (14, 28).
The ultimate goal of implementing a decision-supportsystem is to improve quality of care and patient health.
Undeniably, however, strategies targeted at optimizinglaboratory test use may have unclear or negative conse-quences, because such interventions could lead to theordering of fewer tests than are necessary. We wereunable to study such effects within the framework of thisinvestigation, but the CDSS was implemented with theexplicit aim of making the GPs more aware of the recom-mendations for test ordering from the guidelines of theDutch College of General Practitioners, which are evi-dence-based and considered authoritative. Importantly,compared with the preintervention period, the partici-pants departed less often from these guidelines during theintervention period (data not shown). These findingsstrongly suggest that our intervention enhances the qual-ity of care, leading to the further conclusion that theintervention is likely to eventually produce positive ef-fects on patient health.
In summary, providing electronic decision support forordering blood tests in primary care represents an eco-nomically promising concept. Our study indicates thatimplementing the CDSS generates savings on laboratorycosts, which are not offset by disproportionally highintervention costs.
The Dutch Health Care Insurance Board (CVZ) fundedthis study (OG 99–074/076).
References1. Kristiansen IS, Hjortdahl P. The general practitioner and laboratory
utilization: why does it vary? Fam Pract 1992;9:22–7.2. van der Weijden T, van Bokhoven MA, Dinant GJ, van Hasselt CM,
Grol RPTM. Understanding laboratory testing in diagnostic uncer-tainty: a qualitative study in general practice. Br J Gen Pract2002;52:974–80.
3. Wong ET, Lincoln TL. Ready! Fire! Aim! An inquiry into laboratorytest ordering. JAMA 1983;250:2510–3.
4. Axt-Adam P, van der Wouden JC, van der Does E. Influencingbehavior of physicians ordering laboratory tests: a literature study.Med Care 1993;31:784–94.
5. Grossman RM. A review of physician cost-containment strategiesfor laboratory testing. Med Care 1983;21:783–802.
6. Solomon DH, Hashimoto H, Daltroy L, Liang MH. Techniques toimprove physicians’ use of diagnostic tests: a new conceptualframework. JAMA 1998;280:2020–7.
7. Bunting PS, van Walraven C. Effect of a controlled feedbackintervention on laboratory test ordering by community physicians.Clin Chem 2004;50:321–6.
8. Verstappen WHJM, van der Weijden T, Sijbrandij J, Smeele I,Hermsen J, Grimshaw J, et al. Effect of a practice-based strategyon test ordering performance of primary care physicians: a ran-domized trial. JAMA 2003;289:2407–12.
9. Verstappen WHJM, van Merode F, Grimshaw J, Dubois WI, GrolRPTM, van der Weijden T. Comparing cost effects of two qualitystrategies to improve test ordering in primary care: a randomizedtrial. Int J Qual Health Care 2004;16:391–8.
10. Winkens RAG, Pop P, Grol RPTM, Kester ADM, Knottnerus JA.Effect of feedback on test ordering behaviour of general practitio-ners. BMJ 1992;304:1093–6.
218 Poley et al.: Cost Consequences of Decision Support for Test Ordering
11. Winkens RAG, Pop P, Bugter-Maessen AMA, Grol RPTM, KesterADM, Beusmans GHMI, et al. Randomised controlled trial ofroutine individual feedback to improve rationality and reducenumbers of test requests. Lancet 1995;345:498–502.
12. Zaat JOM, van Eijk JTM, Bonte HA. Laboratory test form designinfluences test ordering by general practitioners in The Nether-lands. Med Care 1992;30:189–98.
13. van Gend JMWA, van Pelt J, Cleef THM, Mangnus TM, Muris JWM.Quality improvement project ‘laboratory diagnosis by family physi-cians’ leads to considerable decrease in number of laboratorytests [in Dutch]. Ned Tijdschr Geneeskd 1996;140:495–500.
14. Tierney WM, Miller ME, McDonald CJ. The effect on test orderingof informing physicians of the charges for outpatient diagnostictests. N Engl J Med 1990;322:1499–504.
15. Bindels R, Hasman A, van Wersch JWJ, Talmon J, Winkens RAG.Evaluation of an automated test ordering and feedback system forgeneral practitioners in daily practice. Int J Med Inform 2004;73:705–12.
16. Smith BJ, McNeely MDD. The influence of an expert system fortest ordering and interpretation on laboratory investigations. ClinChem 1999;45:1168–75.
17. van Wijk MAM, van der Lei J, Mosseveld M, Bohnen AM, vanBemmel JH. Assessment of decision support for blood testordering in primary care: a randomized trial. Ann Intern Med2001;134:274–81.
18. van Wijk MAM, van der Lei J, Mosseveld M, Bohnen AM, vanBemmel JH. Compliance of general practitioners with a guideline-based decision support system for ordering blood tests. ClinChem 2002;48:55–60.
19. Schroeder SA, Myers LP, McPhee SJ, Showstack JA, Simborg DW,Chapman SA, et al. The failure of physician education as a costcontainment strategy: report of a prospective controlled trial at auniversity hospital. JAMA 1984;252:225–30.
20. Winkens RAG, Ament AJHA, Pop P, Reniers PHA, Grol RPTM,Knottnerus JA. Routine individual feedback on requests for diag-nostic tests: an economic evaluation. Med Decis Making 1996;16:309–14.
21. van Wijk M, Mosseveld M, van der Lei J. Design of a decisionsupport system for test ordering in general practice: choices anddecisions to make. Methods Inf Med 1999;38:355–61.
22. Oostenbrink JB, Bouwmans CAM, Koopmanschap MA, RuttenFFH. Manual for costing research. Methods and guideline pricesfor economic evaluations of healthcare interventions (2004 up-dated edition) [in Dutch]. Diemen: Health Care Insurance Board,2004.
23. Bates DW, Shu K, Narasimhan D, Horsky J. Comparing time spentwriting orders on paper and physician computer order entry. ProcAMIA Symp 2000;965.
24. Tierney WM, Miller ME, Overhage JM, McDonald CJ. Physicianinpatient order writing on microcomputer workstations: effects onresource utilization. JAMA 1993;269:379–83.
25. Overhage JM, Perkins S, Tierney WM, McDonald CJ. Controlledtrial of direct physician order entry: effects on physicians’ timeutilization in ambulatory primary care internal medicine practices.J Am Med Inform Assoc 2001;8:361–71.
26. van Boven K, Dijksterhuis P, Lamberts H. Defensive testing inDutch family practice. Is the grass greener on the other side of theocean? J Fam Pract 1997;44:468–72.
27. Kassirer JP. Our stubborn quest for diagnostic certainty: a causeof excessive testing. N Engl J Med 1989;320:1489–91.
28. Winkens RAG, Grol RPTM, Beusmans GHMI, Kester ADM, Knott-nerus JA, Pop P. Does a reduction in general practitioners’ use ofdiagnostic tests lead to more hospital referrals? Br J Gen Pract1995;45:289–92.
Clinical Chemistry 53, No. 2, 2007 219
Long-Term Health Outcomes Associated withDetectable Troponin I Concentrations
Peter A. Kavsak,1* Alice M. Newman,2 Viliam Lustig,3 Andrew R. MacRae,3
Glenn E. Palomaki,4 Dennis T. Ko,2 Jack V. Tu,2 and Allan S. Jaffe5
Background: Recent data suggest that older men withdetectable cardiac troponin I (cTnI) concentrations thatremain below the 99th percentile concentration cutoffare at increased risk for subsequent cardiovascularevents. We designed this study to extend this observa-tion by examining risk prediction in both men andwomen presenting to an emergency department withchest discomfort.Methods: We obtained data for all-cause mortality andhospital discharges associated with either acute myocar-dial infarction (AMI) or congestive heart failure (CHF)for up to 8 years after the initial presentation in 448patients who originally presented in 1996 with acutecoronary syndrome (ACS). We performed retrospectiveanalysis for cTnI (AccuTnI™; Beckman Coulter) infrozen plasma samples based on the patients’ reportedtime from onset of symptoms. Peak cTnI concentrationwas used for risk assessment.Results: Patients with cTnI concentrations >0.02 �g/L(i.e., limit of detection), including those whose peakvalues remained below the 99th percentile (0.04 �g/L),were at greater risk for death and AMI/CHF readmis-sions at 2, 5, and 8 years of follow-up compared withthose with peak cTnI <0.02 �g/L. All results werestatistically significant (P <0.05) except for death within2 years among patients with normal but detectable cTnI(0.02 to 0.03 �g/L), relative to the group with values<0.02 �g/L. Kaplan–Meier analyses indicated that both
men and women with cTnI >0.02 �g/L had worseoutcomes (P <0.001).Conclusion: Both men and women who present withpossible ACS with detectable cTnI concentrations thatremain below the 99th percentile are at a greater risk forfuture adverse events.© 2007 American Association for Clinical Chemistry
The criterion for identifying myocardial injury is anincreased cardiac troponin (cTn)6 concentration (1 ).Guidelines stipulate that an increase of cTn must begreater than the 99th percentile of a reference population(1, 2 ). In the setting of cardiac ischemia, a cTn concentra-tion above the 99th percentile is sufficient for a diagnosisof acute myocardial infarction (AMI). The 99th percentilecutoff, however, is influenced by both the analyticalprecision and the detection limit of the cTn assay, as wellas the healthy/reference population being assessed (3–8).Recently, while investigating the importance of an appar-ent age-dependent increase in cardiac troponin I (cTnI)concentrations, Zethelius et al. (9 ) demonstrated that lowbut detectable concentrations of cTnI (�0.021 �g/L) mea-sured with the Beckman Coulter AccuTnI™ assay (belowthe 99th percentile of a healthy reference population) wereassociated with long-term risks for coronary heart diseaseand death in an older, presumably healthy, community-based male population (9 ). In this study, we investigatedwhether similar findings were evident in men and womenpresenting to an emergency department with chest pain.
Materials and Methodsstudy populationWe have previously published details on patients, studydesign, and methods (10–12). The study cohort wasrecruited in 1996: 448 unique patients (all with validOntario health insurance numbers for outcome tracking)
1 Department of Pathology and Molecular Medicine, McMaster University,Hamilton, ON, Canada.
2 Institute for Clinical Evaluative Sciences and 3 Department of LaboratoryMedicine and Pathobiology, University of Toronto, Toronto, ON, Canada.
4 Department of Pathology, Women and Infants Hospital, Providence, RI.5 Cardiovascular Division and Division of Laboratory Medicine, Mayo
Clinic, Rochester, MN.*Address correspondence to this author at: McMaster University Medical
Centre, 1200 Main St. W., HSC 2N52, Hamilton, Ontario, L8N 3Z5 Canada. Fax905-521-2344; e-mail [email protected].
Received July 20, 2006; accepted November 30, 2006.Previously published online at DOI: 10.1373/clinchem.2006.076885
6 Nonstandard abbreviations: cTn, cardiac troponin; AMI, acute myocar-dial infarction; cTnI, cardiac troponin I; CHF, congestive heart failure; ACS,acute coronary syndrome.
Clinical Chemistry 53:2220–227 (2007)
Evidence-BasedLaboratory Medicineand Test Utilization
220
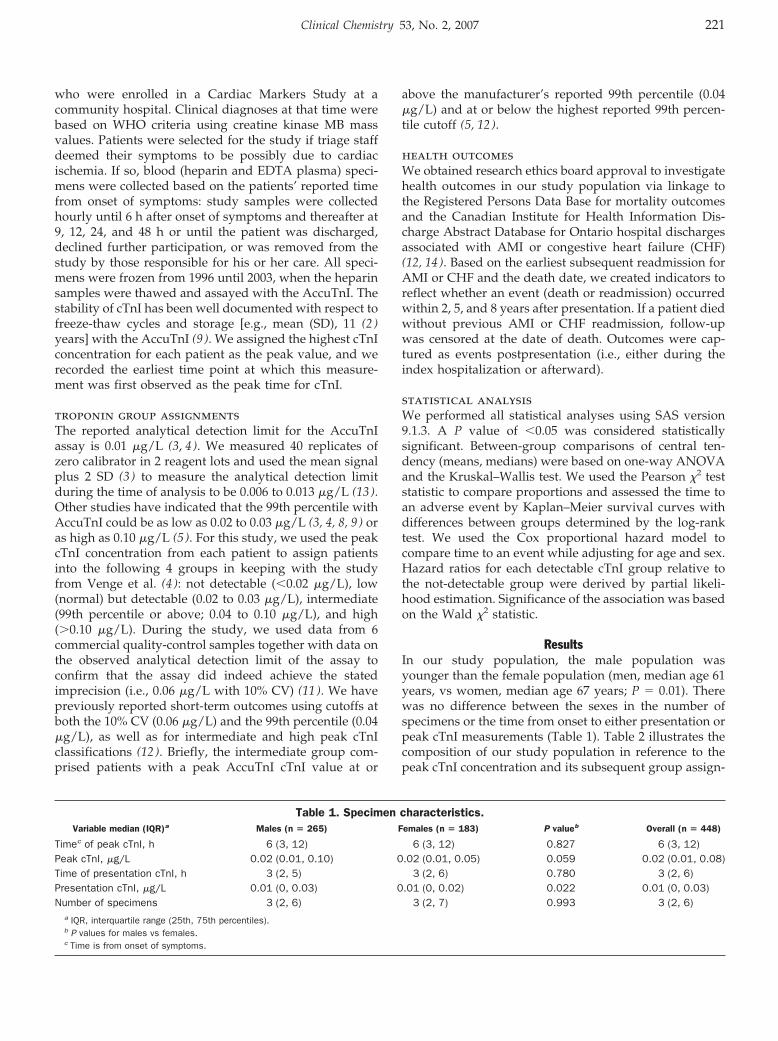
who were enrolled in a Cardiac Markers Study at acommunity hospital. Clinical diagnoses at that time werebased on WHO criteria using creatine kinase MB massvalues. Patients were selected for the study if triage staffdeemed their symptoms to be possibly due to cardiacischemia. If so, blood (heparin and EDTA plasma) speci-mens were collected based on the patients’ reported timefrom onset of symptoms: study samples were collectedhourly until 6 h after onset of symptoms and thereafter at9, 12, 24, and 48 h or until the patient was discharged,declined further participation, or was removed from thestudy by those responsible for his or her care. All speci-mens were frozen from 1996 until 2003, when the heparinsamples were thawed and assayed with the AccuTnI. Thestability of cTnI has been well documented with respect tofreeze-thaw cycles and storage [e.g., mean (SD), 11 (2 )years] with the AccuTnI (9 ). We assigned the highest cTnIconcentration for each patient as the peak value, and werecorded the earliest time point at which this measure-ment was first observed as the peak time for cTnI.
troponin group assignmentsThe reported analytical detection limit for the AccuTnIassay is 0.01 �g/L (3, 4). We measured 40 replicates ofzero calibrator in 2 reagent lots and used the mean signalplus 2 SD (3 ) to measure the analytical detection limitduring the time of analysis to be 0.006 to 0.013 �g/L (13 ).Other studies have indicated that the 99th percentile withAccuTnI could be as low as 0.02 to 0.03 �g/L (3, 4, 8, 9 ) oras high as 0.10 �g/L (5 ). For this study, we used the peakcTnI concentration from each patient to assign patientsinto the following 4 groups in keeping with the studyfrom Venge et al. (4 ): not detectable (�0.02 �g/L), low(normal) but detectable (0.02 to 0.03 �g/L), intermediate(99th percentile or above; 0.04 to 0.10 �g/L), and high(�0.10 �g/L). During the study, we used data from 6commercial quality-control samples together with data onthe observed analytical detection limit of the assay toconfirm that the assay did indeed achieve the statedimprecision (i.e., 0.06 �g/L with 10% CV) (11 ). We havepreviously reported short-term outcomes using cutoffs atboth the 10% CV (0.06 �g/L) and the 99th percentile (0.04�g/L), as well as for intermediate and high peak cTnIclassifications (12 ). Briefly, the intermediate group com-prised patients with a peak AccuTnI cTnI value at or
above the manufacturer’s reported 99th percentile (0.04�g/L) and at or below the highest reported 99th percen-tile cutoff (5, 12 ).
health outcomesWe obtained research ethics board approval to investigatehealth outcomes in our study population via linkage tothe Registered Persons Data Base for mortality outcomesand the Canadian Institute for Health Information Dis-charge Abstract Database for Ontario hospital dischargesassociated with AMI or congestive heart failure (CHF)(12, 14 ). Based on the earliest subsequent readmission forAMI or CHF and the death date, we created indicators toreflect whether an event (death or readmission) occurredwithin 2, 5, and 8 years after presentation. If a patient diedwithout previous AMI or CHF readmission, follow-upwas censored at the date of death. Outcomes were cap-tured as events postpresentation (i.e., either during theindex hospitalization or afterward).
statistical analysisWe performed all statistical analyses using SAS version9.1.3. A P value of �0.05 was considered statisticallysignificant. Between-group comparisons of central ten-dency (means, medians) were based on one-way ANOVAand the Kruskal–Wallis test. We used the Pearson �2 teststatistic to compare proportions and assessed the time toan adverse event by Kaplan–Meier survival curves withdifferences between groups determined by the log-ranktest. We used the Cox proportional hazard model tocompare time to an event while adjusting for age and sex.Hazard ratios for each detectable cTnI group relative tothe not-detectable group were derived by partial likeli-hood estimation. Significance of the association was basedon the Wald �2 statistic.
ResultsIn our study population, the male population wasyounger than the female population (men, median age 61years, vs women, median age 67 years; P � 0.01). Therewas no difference between the sexes in the number ofspecimens or the time from onset to either presentation orpeak cTnI measurements (Table 1). Table 2 illustrates thecomposition of our study population in reference to thepeak cTnI concentration and its subsequent group assign-
Table 1. Specimen characteristics.Variable median (IQR)a Males (n � 265) Females (n � 183) P valueb Overall (n � 448)
Timec of peak cTnI, h 6 (3, 12) 6 (3, 12) 0.827 6 (3, 12)Peak cTnI, �g/L 0.02 (0.01, 0.10) 0.02 (0.01, 0.05) 0.059 0.02 (0.01, 0.08)Time of presentation cTnI, h 3 (2, 5) 3 (2, 6) 0.780 3 (2, 6)Presentation cTnI, �g/L 0.01 (0, 0.03) 0.01 (0, 0.02) 0.022 0.01 (0, 0.03)Number of specimens 3 (2, 6) 3 (2, 7) 0.993 3 (2, 6)
a IQR, interquartile range (25th, 75th percentiles).b P values for males vs females.c Time is from onset of symptoms.
Clinical Chemistry 53, No. 2, 2007 221
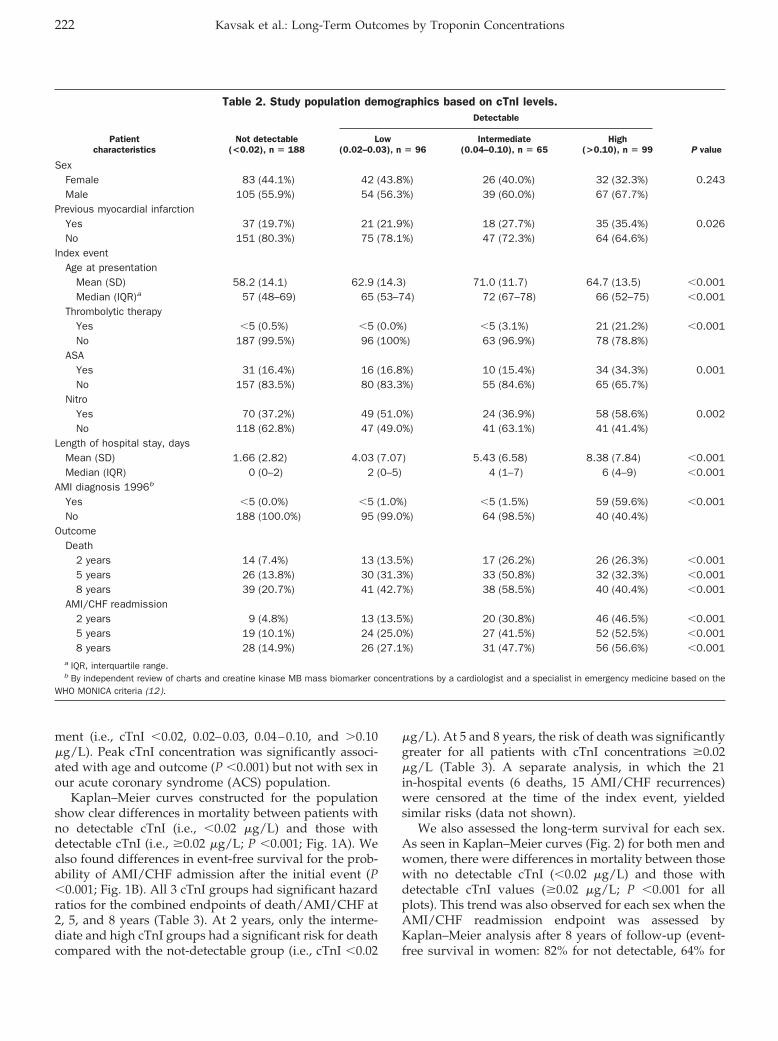
ment (i.e., cTnI �0.02, 0.02–0.03, 0.04–0.10, and �0.10�g/L). Peak cTnI concentration was significantly associ-ated with age and outcome (P �0.001) but not with sex inour acute coronary syndrome (ACS) population.
Kaplan–Meier curves constructed for the populationshow clear differences in mortality between patients withno detectable cTnI (i.e., �0.02 �g/L) and those withdetectable cTnI (i.e., �0.02 �g/L; P �0.001; Fig. 1A). Wealso found differences in event-free survival for the prob-ability of AMI/CHF admission after the initial event (P�0.001; Fig. 1B). All 3 cTnI groups had significant hazardratios for the combined endpoints of death/AMI/CHF at2, 5, and 8 years (Table 3). At 2 years, only the interme-diate and high cTnI groups had a significant risk for deathcompared with the not-detectable group (i.e., cTnI �0.02
�g/L). At 5 and 8 years, the risk of death was significantlygreater for all patients with cTnI concentrations �0.02�g/L (Table 3). A separate analysis, in which the 21in-hospital events (6 deaths, 15 AMI/CHF recurrences)were censored at the time of the index event, yieldedsimilar risks (data not shown).
We also assessed the long-term survival for each sex.As seen in Kaplan–Meier curves (Fig. 2) for both men andwomen, there were differences in mortality between thosewith no detectable cTnI (�0.02 �g/L) and those withdetectable cTnI values (�0.02 �g/L; P �0.001 for allplots). This trend was also observed for each sex when theAMI/CHF readmission endpoint was assessed byKaplan–Meier analysis after 8 years of follow-up (event-free survival in women: 82% for not detectable, 64% for
Table 2. Study population demographics based on cTnI levels.
Patientcharacteristics
Not detectable(<0.02), n � 188
Detectable
P valueLow
(0.02–0.03), n � 96Intermediate
(0.04–0.10), n � 65High
(>0.10), n � 99
SexFemale 83 (44.1%) 42 (43.8%) 26 (40.0%) 32 (32.3%) 0.243Male 105 (55.9%) 54 (56.3%) 39 (60.0%) 67 (67.7%)
Previous myocardial infarctionYes 37 (19.7%) 21 (21.9%) 18 (27.7%) 35 (35.4%) 0.026No 151 (80.3%) 75 (78.1%) 47 (72.3%) 64 (64.6%)
Index eventAge at presentation
Mean (SD) 58.2 (14.1) 62.9 (14.3) 71.0 (11.7) 64.7 (13.5) �0.001Median (IQR)a 57 (48–69) 65 (53–74) 72 (67–78) 66 (52–75) �0.001
Thrombolytic therapyYes �5 (0.5%) �5 (0.0%) �5 (3.1%) 21 (21.2%) �0.001No 187 (99.5%) 96 (100%) 63 (96.9%) 78 (78.8%)
ASAYes 31 (16.4%) 16 (16.8%) 10 (15.4%) 34 (34.3%) 0.001No 157 (83.5%) 80 (83.3%) 55 (84.6%) 65 (65.7%)
NitroYes 70 (37.2%) 49 (51.0%) 24 (36.9%) 58 (58.6%) 0.002No 118 (62.8%) 47 (49.0%) 41 (63.1%) 41 (41.4%)
Length of hospital stay, daysMean (SD) 1.66 (2.82) 4.03 (7.07) 5.43 (6.58) 8.38 (7.84) �0.001Median (IQR) 0 (0–2) 2 (0–5) 4 (1–7) 6 (4–9) �0.001
AMI diagnosis 1996b
Yes �5 (0.0%) �5 (1.0%) �5 (1.5%) 59 (59.6%) �0.001No 188 (100.0%) 95 (99.0%) 64 (98.5%) 40 (40.4%)
OutcomeDeath
2 years 14 (7.4%) 13 (13.5%) 17 (26.2%) 26 (26.3%) �0.0015 years 26 (13.8%) 30 (31.3%) 33 (50.8%) 32 (32.3%) �0.0018 years 39 (20.7%) 41 (42.7%) 38 (58.5%) 40 (40.4%) �0.001
AMI/CHF readmission2 years 9 (4.8%) 13 (13.5%) 20 (30.8%) 46 (46.5%) �0.0015 years 19 (10.1%) 24 (25.0%) 27 (41.5%) 52 (52.5%) �0.0018 years 28 (14.9%) 26 (27.1%) 31 (47.7%) 56 (56.6%) �0.001
a IQR, interquartile range.b By independent review of charts and creatine kinase MB mass biomarker concentrations by a cardiologist and a specialist in emergency medicine based on the
WHO MONICA criteria (12).
222 Kavsak et al.: Long-Term Outcomes by Troponin Concentrations
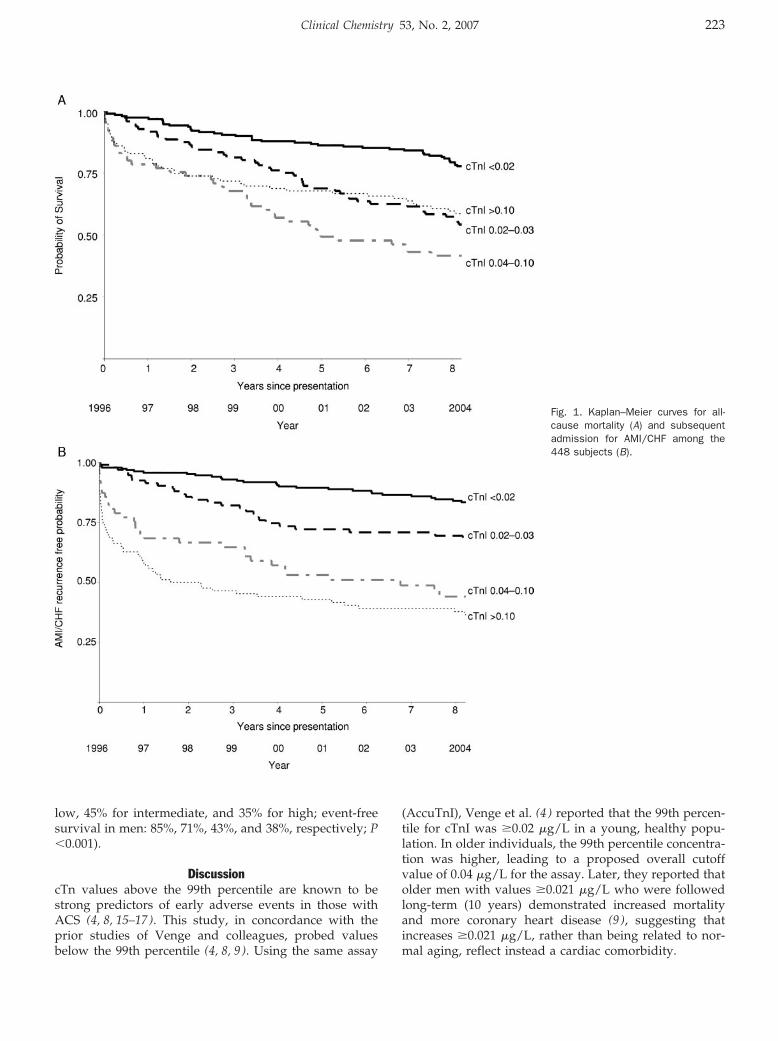
low, 45% for intermediate, and 35% for high; event-freesurvival in men: 85%, 71%, 43%, and 38%, respectively; P�0.001).
DiscussioncTn values above the 99th percentile are known to bestrong predictors of early adverse events in those withACS (4, 8, 15–17). This study, in concordance with theprior studies of Venge and colleagues, probed valuesbelow the 99th percentile (4, 8, 9 ). Using the same assay
(AccuTnI), Venge et al. (4 ) reported that the 99th percen-tile for cTnI was �0.02 �g/L in a young, healthy popu-lation. In older individuals, the 99th percentile concentra-tion was higher, leading to a proposed overall cutoffvalue of 0.04 �g/L for the assay. Later, they reported thatolder men with values �0.021 �g/L who were followedlong-term (10 years) demonstrated increased mortalityand more coronary heart disease (9 ), suggesting thatincreases �0.021 �g/L, rather than being related to nor-mal aging, reflect instead a cardiac comorbidity.
Fig. 1. Kaplan–Meier curves for all-cause mortality (A) and subsequentadmission for AMI/CHF among the448 subjects (B).
Clinical Chemistry 53, No. 2, 2007 223
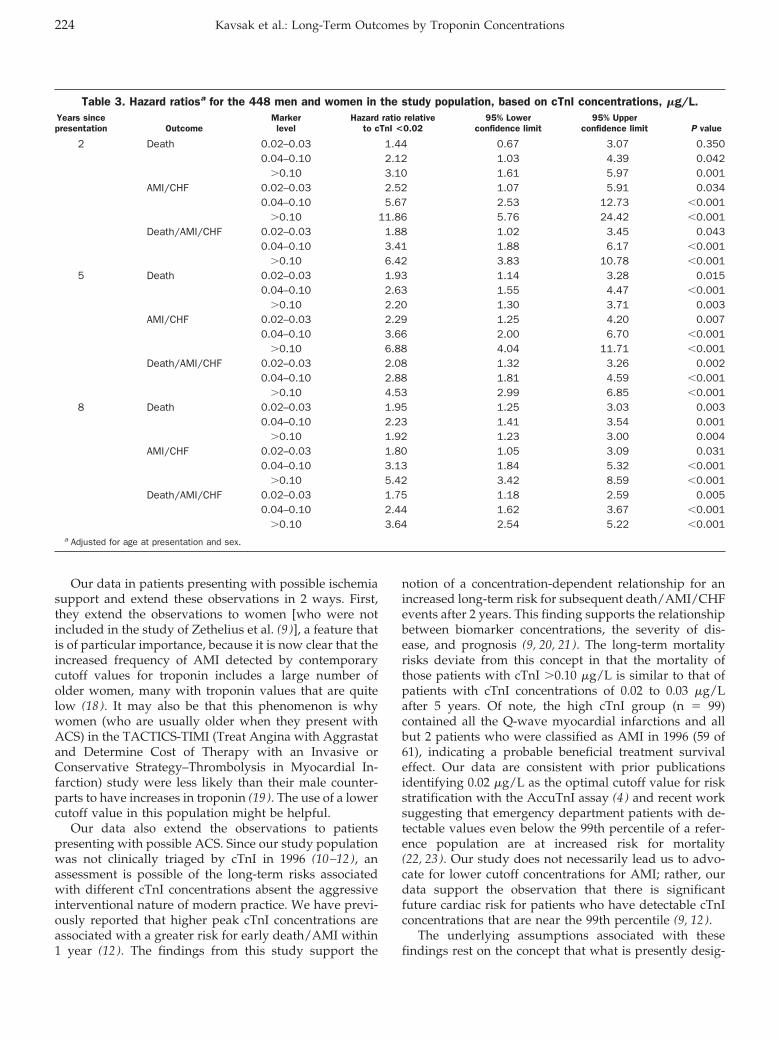
Our data in patients presenting with possible ischemiasupport and extend these observations in 2 ways. First,they extend the observations to women [who were notincluded in the study of Zethelius et al. (9 )], a feature thatis of particular importance, because it is now clear that theincreased frequency of AMI detected by contemporarycutoff values for troponin includes a large number ofolder women, many with troponin values that are quitelow (18 ). It may also be that this phenomenon is whywomen (who are usually older when they present withACS) in the TACTICS-TIMI (Treat Angina with Aggrastatand Determine Cost of Therapy with an Invasive orConservative Strategy–Thrombolysis in Myocardial In-farction) study were less likely than their male counter-parts to have increases in troponin (19 ). The use of a lowercutoff value in this population might be helpful.
Our data also extend the observations to patientspresenting with possible ACS. Since our study populationwas not clinically triaged by cTnI in 1996 (10–12), anassessment is possible of the long-term risks associatedwith different cTnI concentrations absent the aggressiveinterventional nature of modern practice. We have previ-ously reported that higher peak cTnI concentrations areassociated with a greater risk for early death/AMI within1 year (12 ). The findings from this study support the
notion of a concentration-dependent relationship for anincreased long-term risk for subsequent death/AMI/CHFevents after 2 years. This finding supports the relationshipbetween biomarker concentrations, the severity of dis-ease, and prognosis (9, 20, 21 ). The long-term mortalityrisks deviate from this concept in that the mortality ofthose patients with cTnI �0.10 �g/L is similar to that ofpatients with cTnI concentrations of 0.02 to 0.03 �g/Lafter 5 years. Of note, the high cTnI group (n � 99)contained all the Q-wave myocardial infarctions and allbut 2 patients who were classified as AMI in 1996 (59 of61), indicating a probable beneficial treatment survivaleffect. Our data are consistent with prior publicationsidentifying 0.02 �g/L as the optimal cutoff value for riskstratification with the AccuTnI assay (4 ) and recent worksuggesting that emergency department patients with de-tectable values even below the 99th percentile of a refer-ence population are at increased risk for mortality(22, 23 ). Our study does not necessarily lead us to advo-cate for lower cutoff concentrations for AMI; rather, ourdata support the observation that there is significantfuture cardiac risk for patients who have detectable cTnIconcentrations that are near the 99th percentile (9, 12 ).
The underlying assumptions associated with thesefindings rest on the concept that what is presently desig-
Table 3. Hazard ratiosa for the 448 men and women in the study population, based on cTnI concentrations, �g/L.Years sincepresentation Outcome
Markerlevel
Hazard ratio relativeto cTnI <0.02
95% Lowerconfidence limit
95% Upperconfidence limit P value
2 Death 0.02–0.03 1.44 0.67 3.07 0.3500.04–0.10 2.12 1.03 4.39 0.042
�0.10 3.10 1.61 5.97 0.001AMI/CHF 0.02–0.03 2.52 1.07 5.91 0.034
0.04–0.10 5.67 2.53 12.73 �0.001�0.10 11.86 5.76 24.42 �0.001
Death/AMI/CHF 0.02–0.03 1.88 1.02 3.45 0.0430.04–0.10 3.41 1.88 6.17 �0.001
�0.10 6.42 3.83 10.78 �0.0015 Death 0.02–0.03 1.93 1.14 3.28 0.015
0.04–0.10 2.63 1.55 4.47 �0.001�0.10 2.20 1.30 3.71 0.003
AMI/CHF 0.02–0.03 2.29 1.25 4.20 0.0070.04–0.10 3.66 2.00 6.70 �0.001
�0.10 6.88 4.04 11.71 �0.001Death/AMI/CHF 0.02–0.03 2.08 1.32 3.26 0.002
0.04–0.10 2.88 1.81 4.59 �0.001�0.10 4.53 2.99 6.85 �0.001
8 Death 0.02–0.03 1.95 1.25 3.03 0.0030.04–0.10 2.23 1.41 3.54 0.001
�0.10 1.92 1.23 3.00 0.004AMI/CHF 0.02–0.03 1.80 1.05 3.09 0.031
0.04–0.10 3.13 1.84 5.32 �0.001�0.10 5.42 3.42 8.59 �0.001
Death/AMI/CHF 0.02–0.03 1.75 1.18 2.59 0.0050.04–0.10 2.44 1.62 3.67 �0.001
�0.10 3.64 2.54 5.22 �0.001a Adjusted for age at presentation and sex.
224 Kavsak et al.: Long-Term Outcomes by Troponin Concentrations
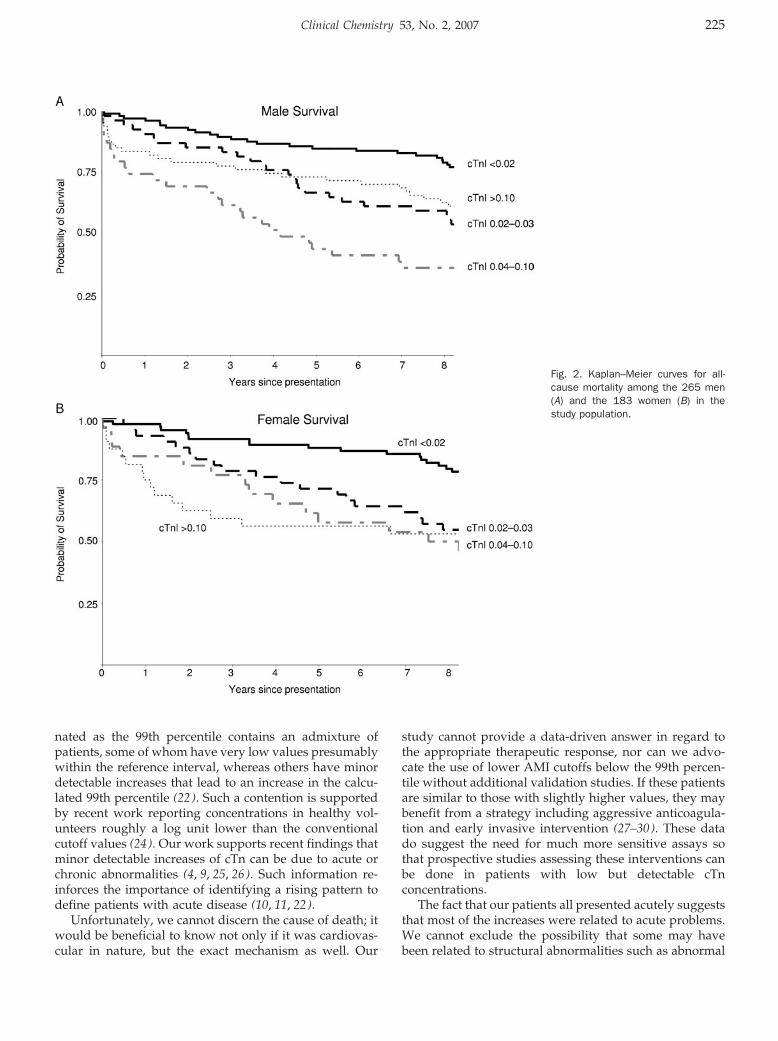
nated as the 99th percentile contains an admixture ofpatients, some of whom have very low values presumablywithin the reference interval, whereas others have minordetectable increases that lead to an increase in the calcu-lated 99th percentile (22 ). Such a contention is supportedby recent work reporting concentrations in healthy vol-unteers roughly a log unit lower than the conventionalcutoff values (24 ). Our work supports recent findings thatminor detectable increases of cTn can be due to acute orchronic abnormalities (4, 9, 25, 26). Such information re-inforces the importance of identifying a rising pattern todefine patients with acute disease (10, 11, 22).
Unfortunately, we cannot discern the cause of death; itwould be beneficial to know not only if it was cardiovas-cular in nature, but the exact mechanism as well. Our
study cannot provide a data-driven answer in regard tothe appropriate therapeutic response, nor can we advo-cate the use of lower AMI cutoffs below the 99th percen-tile without additional validation studies. If these patientsare similar to those with slightly higher values, they maybenefit from a strategy including aggressive anticoagula-tion and early invasive intervention (27–30). These datado suggest the need for much more sensitive assays sothat prospective studies assessing these interventions canbe done in patients with low but detectable cTnconcentrations.
The fact that our patients all presented acutely suggeststhat most of the increases were related to acute problems.We cannot exclude the possibility that some may havebeen related to structural abnormalities such as abnormal
Fig. 2. Kaplan–Meier curves for all-cause mortality among the 265 men(A) and the 183 women (B) in thestudy population.
Clinical Chemistry 53, No. 2, 2007 225
renal function, heart failure, left ventricular hypertrophy,or diabetes, as is likely the case with the other studies(9, 26). However, we suggest that in the future, moresensitive and precise assays that allow for measurementsof cTnI at very low concentrations (i.e., �0.02 �g/L) mayidentify a cohort with these low-level increases who couldbenefit from existing therapies.
This work was supported by a grant from the CanadianInstitutes of Health Research. The AccuTnI reagent wascontributed for the study by an unrestricted grant fromBeckman Coulter Inc. V.L. has received financial supportfor lecturing on cardiac markers from Roche Diagnostics.
References1. Alpert JS, Thygesen K, Antman E, Bassand JP. Myocardial infarc-
tion redefined: a consensus document of the Joint EuropeanSociety of Cardiology/American College of Cardiology Committeefor the Redefinition of Myocardial Infarction. J Am Coll Cardiol2000;36:959–69.
2. Luepker RV, Apple FS, Christenson RH, Crow RS, Fortmann SP,Goff D, et al. AHA Scientific Statement: case definitions for acutecoronary heart disease in epidemiology and clinical researchstudies. Circulation 2003;108:2543–9.
3. Venge P, Lindahl B, Wallentin L. New generation cardiac troponinI assay for the access immunoassay system. Clin Chem 2001;47:959–61.
4. Venge P, Lagerqvist B, Diderholm E, Lindahl B, Wallentin L. Clinicalperformance of three cardiac troponin assays in patients withunstable coronary artery disease (a FRISC II substudy). Am JCardiol 2002;89:1035–41.
5. Apple FS, Quist HE, Doyle PJ, Otto AP, Murakami MM. Plasma99th percentile reference limits for cardiac troponin and creatinekinase MB mass for use with European Society of Cardiology/American College of Cardiology Consensus Recommendations.Clin Chem 2003;49:1331–6.
6. Apple FS, Parvin CA, Buechler KF, Christenson RH, Wu AH, JaffeAS. Validation of the 99th percentile cutoff independent of assayimprecision (CV) for cardiac troponin monitoring for ruling outmyocardial infarction. Clin Chem 2005;51:2198–200.
7. Panteghini M, Pagani F, Yeo KT, Apple FS, Christenson RH, Dati F,et al. Evaluation of imprecision for cardiac troponin assays atlow-range concentrations. Clin Chem 2004;50:327–32.
8. James S, Flodin M, Johnston N, Lindahl B, Venge P. The antibodyconfigurations of cardiac troponin I assays may determine theirclinical performance. Clin Chem 2006;52:832–7.
9. Zethelius B, Johnston N, Venge P. Troponin I as a predictor ofcoronary heart disease and mortality in 70-year-old men: a com-munity-based cohort study. Circulation 2006;113:1071–8.
10. Kavsak PA, MacRae AR, Lustig V, Bhargava R, Vandersluis R,Palomaki GE, et al. The impact of the ESC/ACC redefinition ofmyocardial infarction and new sensitive troponin assays on thefrequency of acute myocardial infarction. Am Heart J 2006;152:118–25.
11. MacRae AR, Kavsak PA, Lustig V, Bhargava R, Vandersluis R,Palomaki GE, et al. Assessing the requirement for the 6-hourinterval between specimens in the American Heart Associationclassification of myocardial infarction in epidemiology and clinicalresearch studies. Clin Chem 2006;52:812–8.
12. Kavsak PA, MacRae AR, Palomaki GE, Newman AM, Ko DT, LustigV, et al. Health outcomes categorized by current and previousdefinitions of acute myocardial infarction in an unselected cohort
of troponin naıve emergency department patients. Clin Chem2006;52:2028–35.
13. Kavsak P, Lustig V, MacRae AR. Clinical evaluation of the Beck-man Coulter AccuTnI assay for the early detection of acutemyocardial infarction [Abstract]. Clin Chem 2004;50:A5.
14. Austin PC, Daly PA, Tu JV. A multicenter study of the codingaccuracy of hospital discharge administrative data for patientsadmitted to cardiac care units in Ontario. Am Heart J 2002;144:290–6.
15. Lindahl B, Venge P, Wallentin L. Relation between troponin T andthe risk of subsequent cardiac events in unstable coronary arterydisease. Circulation 1996;94:1651–7.
16. Antman EM, Tanasijevic MJ, Thompson B, Schactman M, McCabeCH, Cannon CP, et al. Cardiac-specific troponin I levels to predictthe risk of mortality in patients with acute coronary syndromes.N Engl J Med 1996;335:1342–9.
17. Lindahl B, Toss H, Siegbahn A, Venge P, Wallentin L. Markers ofmyocardial damage and inflammation in relation to long-termmortality in unstable coronary artery disease: FRISC Study Group:Fragmin during Instability in Coronary Artery Disease. N Engl J Med2000;343:1139–47.
18. Roger VL, Killian JM, Weston SA, Jaffe AS, Kors J, Santrach PJ, etal. Redefinition of myocardial infarction: prospective evaluation inthe community. Circulation 2006;114:790–7.
19. Wiviott SD, Cannon CP, Morrow DA, Murphy SA, Gibson CM,McCabe CH, et al. Differential expression of cardiac biomarkers bygender in patients with unstable angina/non-ST-elevation myocar-dial infarction: a TACTICS-TIMI 18 (Treat Angina with Aggrastat anddetermine Cost of Therapy with an Invasive or ConservativeStrategy-Thrombolysis In Myocardial Infarction 18) substudy. Cir-culation 2004;109:580–6.
20. Geltman EM, Ehsani AA, Campbell MK, Schechtman K, Roberts R,Sobel BE. The influence of location and extent of myocardialinfarction on long-term ventricular dysrhythmia and mortality.Circulation 1979;60:805–14.
21. Alexander JH, Sparapani RA, Mahaffey KW, Deckers JW, NewbyLK, Ohman EM, et al. Association between minor elevations ofcreatine kinase-MB level and mortality in patients with acutecoronary syndromes without ST-segment elevation. JAMA 2000;283:347–53.
22. Jaffe AS. Chasing troponin: how low can you go if you can see therise? [Editorial]. J Am Coll Cardiol 2006;48:1763–4.
23. Waxman DA, Hecht S, Schappert J, Husk G. A model for troponinI as a quantitative predictor of in-hospital mortality. J Am CollCardiol 2006;48:1755–62.
24. Wu AHB, Fukushima N, Puskas R, Todd J, Goix P. Developmentand preliminary clinical validation of a high sensitivity assay forcardiac troponin using a capillary flow (single molecule) fluores-cence detector. Clin Chem 2006;52:2157–9.
25. Schulz O, Kirpal K, Stein J, Bensch R, Berghofer G, Schimke I, etal. Importance of low concentrations of cardiac troponins. ClinChem 2006;52:1614–5.
26. Wallace TW, Abdullah SM, Drazner MH, Das SR, Khera A, McGuireDK, et al. Prevalence and determinants of troponin T elevation inthe general population. Circulation 2006;113:1958–65.
27. Petersen JL, Mahaffey KW, Hasselblad V, Antman EM, Cohen M,Goodman SG, et al. Efficacy and bleeding complications amongpatients randomized to enoxaparin or unfractionated heparin forantithrombin therapy in non-ST-segment elevation acute coronarysyndromes: a systematic overview. JAMA 2004;292:89–96.
28. Boersma E, Harrington RA, Moliterno DJ, White H, Theroux P, Vande Werf F, et al. Platelet glycoprotein IIb/IIIa inhibitors in acutecoronary syndromes: a meta-analysis of all major randomisedclinical trials. Lancet 2002;359:189–98.
226 Kavsak et al.: Long-Term Outcomes by Troponin Concentrations

29. Sabatine MS, Morrow DA, Giugliano RP, Murphy SA, DemopoulosLA, DiBattiste PM, et al. Implications of upstream glycoproteinIIb/IIIa inhibition and coronary artery stenting in the invasivemanagement of unstable angina/non-ST-elevation myocardialinfarction: a comparison of the Thrombolysis In MyocardialInfarction (TIMI) IIIB trial and the Treat angina with Aggrastatand determine Cost of Therapy with Invasive or Conservative
Strategy (TACTICS)-TIMI 18 trial. Circulation 2004;109:874–80.
30. Wallentin L, Lagerqvist B, Husted S, Kontny F, Stahle E, Swahn E.Outcome at 1 year after an invasive compared with a non-invasivestrategy in unstable coronary-artery disease: the FRISC II invasiverandomised trial: FRISC II Investigators: Fast Revascularisation dur-ing Instability in Coronary artery disease. Lancet 2000;356:9–16.
Clinical Chemistry 53, No. 2, 2007 227
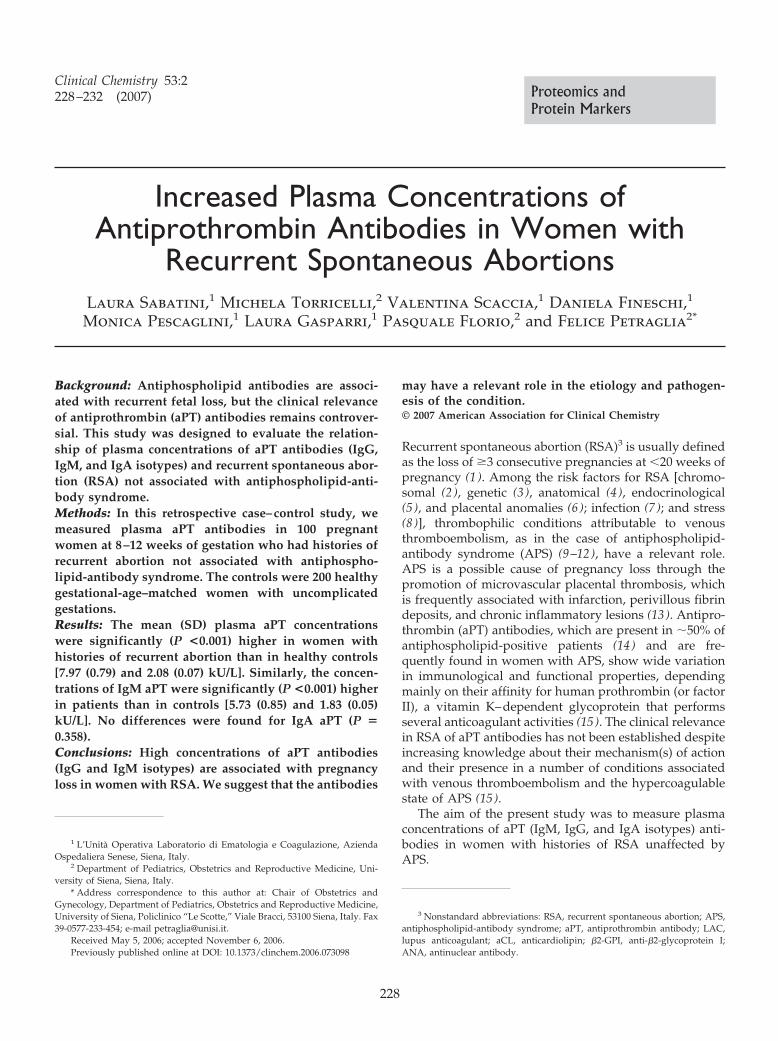
Increased Plasma Concentrations ofAntiprothrombin Antibodies in Women with
Recurrent Spontaneous AbortionsLaura Sabatini,1 Michela Torricelli,2 Valentina Scaccia,1 Daniela Fineschi,1
Monica Pescaglini,1 Laura Gasparri,1 Pasquale Florio,2 and Felice Petraglia2*
Background: Antiphospholipid antibodies are associ-ated with recurrent fetal loss, but the clinical relevanceof antiprothrombin (aPT) antibodies remains controver-sial. This study was designed to evaluate the relation-ship of plasma concentrations of aPT antibodies (IgG,IgM, and IgA isotypes) and recurrent spontaneous abor-tion (RSA) not associated with antiphospholipid-anti-body syndrome.Methods: In this retrospective case–control study, wemeasured plasma aPT antibodies in 100 pregnantwomen at 8–12 weeks of gestation who had histories ofrecurrent abortion not associated with antiphospho-lipid-antibody syndrome. The controls were 200 healthygestational-age–matched women with uncomplicatedgestations.Results: The mean (SD) plasma aPT concentrationswere significantly (P <0.001) higher in women withhistories of recurrent abortion than in healthy controls[7.97 (0.79) and 2.08 (0.07) kU/L]. Similarly, the concen-trations of IgM aPT were significantly (P <0.001) higherin patients than in controls [5.73 (0.85) and 1.83 (0.05)kU/L]. No differences were found for IgA aPT (P �0.358).Conclusions: High concentrations of aPT antibodies(IgG and IgM isotypes) are associated with pregnancyloss in women with RSA. We suggest that the antibodies
may have a relevant role in the etiology and pathogen-esis of the condition.© 2007 American Association for Clinical Chemistry
Recurrent spontaneous abortion (RSA)3 is usually definedas the loss of �3 consecutive pregnancies at �20 weeks ofpregnancy (1 ). Among the risk factors for RSA [chromo-somal (2 ), genetic (3 ), anatomical (4 ), endocrinological(5 ), and placental anomalies (6 ); infection (7 ); and stress(8 )], thrombophilic conditions attributable to venousthromboembolism, as in the case of antiphospholipid-antibody syndrome (APS) (9–12), have a relevant role.APS is a possible cause of pregnancy loss through thepromotion of microvascular placental thrombosis, whichis frequently associated with infarction, perivillous fibrindeposits, and chronic inflammatory lesions (13 ). Antipro-thrombin (aPT) antibodies, which are present in �50% ofantiphospholipid-positive patients (14 ) and are fre-quently found in women with APS, show wide variationin immunological and functional properties, dependingmainly on their affinity for human prothrombin (or factorII), a vitamin K–dependent glycoprotein that performsseveral anticoagulant activities (15 ). The clinical relevancein RSA of aPT antibodies has not been established despiteincreasing knowledge about their mechanism(s) of actionand their presence in a number of conditions associatedwith venous thromboembolism and the hypercoagulablestate of APS (15 ).
The aim of the present study was to measure plasmaconcentrations of aPT (IgM, IgG, and IgA isotypes) anti-bodies in women with histories of RSA unaffected byAPS.
1 L’Unita Operativa Laboratorio di Ematologia e Coagulazione, AziendaOspedaliera Senese, Siena, Italy.
2 Department of Pediatrics, Obstetrics and Reproductive Medicine, Uni-versity of Siena, Siena, Italy.
* Address correspondence to this author at: Chair of Obstetrics andGynecology, Department of Pediatrics, Obstetrics and Reproductive Medicine,University of Siena, Policlinico “Le Scotte,” Viale Bracci, 53100 Siena, Italy. Fax39-0577-233-454; e-mail [email protected].
Received May 5, 2006; accepted November 6, 2006.Previously published online at DOI: 10.1373/clinchem.2006.073098
3 Nonstandard abbreviations: RSA, recurrent spontaneous abortion; APS,antiphospholipid-antibody syndrome; aPT, antiprothrombin antibody; LAC,lupus anticoagulant; aCL, anticardiolipin; �2-GPI, anti-�2-glycoprotein I;ANA, antinuclear antibody.
Clinical Chemistry 53:2228–232 (2007) Proteomics and
Protein Markers
228
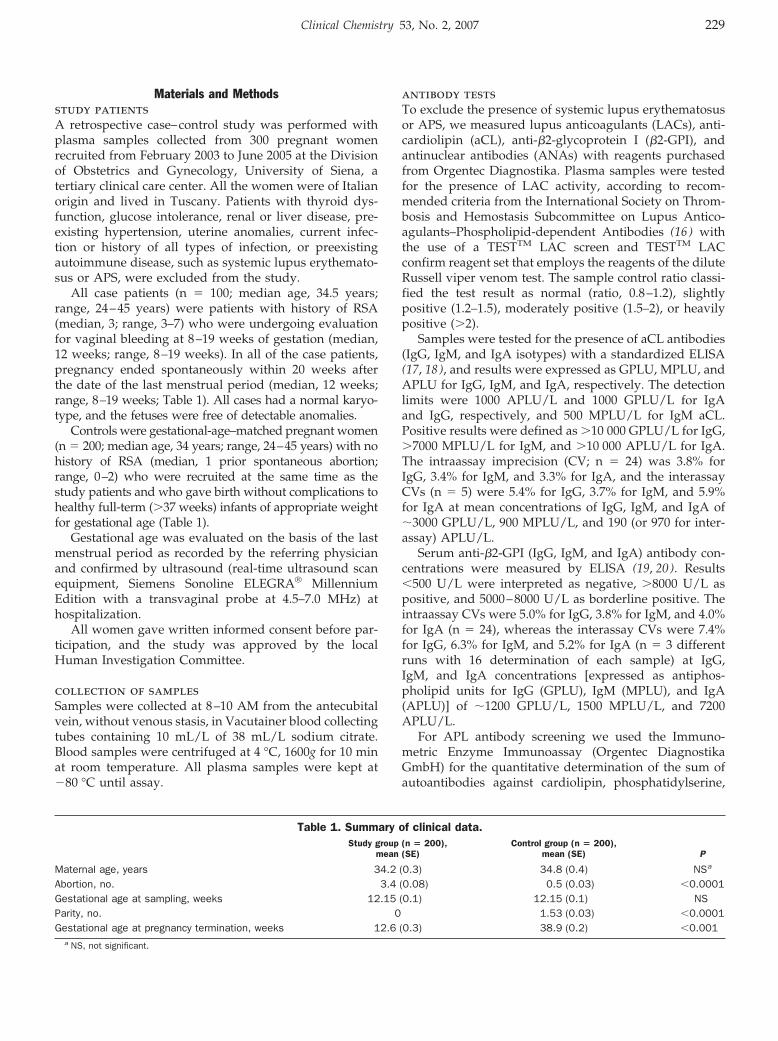
Materials and Methodsstudy patientsA retrospective case–control study was performed withplasma samples collected from 300 pregnant womenrecruited from February 2003 to June 2005 at the Divisionof Obstetrics and Gynecology, University of Siena, atertiary clinical care center. All the women were of Italianorigin and lived in Tuscany. Patients with thyroid dys-function, glucose intolerance, renal or liver disease, pre-existing hypertension, uterine anomalies, current infec-tion or history of all types of infection, or preexistingautoimmune disease, such as systemic lupus erythemato-sus or APS, were excluded from the study.
All case patients (n � 100; median age, 34.5 years;range, 24–45 years) were patients with history of RSA(median, 3; range, 3–7) who were undergoing evaluationfor vaginal bleeding at 8–19 weeks of gestation (median,12 weeks; range, 8–19 weeks). In all of the case patients,pregnancy ended spontaneously within 20 weeks afterthe date of the last menstrual period (median, 12 weeks;range, 8–19 weeks; Table 1). All cases had a normal karyo-type, and the fetuses were free of detectable anomalies.
Controls were gestational-age–matched pregnant women(n � 200; median age, 34 years; range, 24–45 years) with nohistory of RSA (median, 1 prior spontaneous abortion;range, 0–2) who were recruited at the same time as thestudy patients and who gave birth without complications tohealthy full-term (�37 weeks) infants of appropriate weightfor gestational age (Table 1).
Gestational age was evaluated on the basis of the lastmenstrual period as recorded by the referring physicianand confirmed by ultrasound (real-time ultrasound scanequipment, Siemens Sonoline ELEGRA® MillenniumEdition with a transvaginal probe at 4.5–7.0 MHz) athospitalization.
All women gave written informed consent before par-ticipation, and the study was approved by the localHuman Investigation Committee.
collection of samplesSamples were collected at 8–10 AM from the antecubitalvein, without venous stasis, in Vacutainer blood collectingtubes containing 10 mL/L of 38 mL/L sodium citrate.Blood samples were centrifuged at 4 °C, 1600g for 10 minat room temperature. All plasma samples were kept at�80 °C until assay.
antibody testsTo exclude the presence of systemic lupus erythematosusor APS, we measured lupus anticoagulants (LACs), anti-cardiolipin (aCL), anti-�2-glycoprotein I (�2-GPI), andantinuclear antibodies (ANAs) with reagents purchasedfrom Orgentec Diagnostika. Plasma samples were testedfor the presence of LAC activity, according to recom-mended criteria from the International Society on Throm-bosis and Hemostasis Subcommittee on Lupus Antico-agulants–Phospholipid-dependent Antibodies (16 ) withthe use of a TESTTM LAC screen and TESTTM LACconfirm reagent set that employs the reagents of the diluteRussell viper venom test. The sample control ratio classi-fied the test result as normal (ratio, 0.8–1.2), slightlypositive (1.2–1.5), moderately positive (1.5–2), or heavilypositive (�2).
Samples were tested for the presence of aCL antibodies(IgG, IgM, and IgA isotypes) with a standardized ELISA(17, 18), and results were expressed as GPLU, MPLU, andAPLU for IgG, IgM, and IgA, respectively. The detectionlimits were 1000 APLU/L and 1000 GPLU/L for IgAand IgG, respectively, and 500 MPLU/L for IgM aCL.Positive results were defined as �10 000 GPLU/L for IgG,�7000 MPLU/L for IgM, and �10 000 APLU/L for IgA.The intraassay imprecision (CV; n � 24) was 3.8% forIgG, 3.4% for IgM, and 3.3% for IgA, and the interassayCVs (n � 5) were 5.4% for IgG, 3.7% for IgM, and 5.9%for IgA at mean concentrations of IgG, IgM, and IgA of�3000 GPLU/L, 900 MPLU/L, and 190 (or 970 for inter-assay) APLU/L.
Serum anti-�2-GPI (IgG, IgM, and IgA) antibody con-centrations were measured by ELISA (19, 20). Results�500 U/L were interpreted as negative, �8000 U/L aspositive, and 5000–8000 U/L as borderline positive. Theintraassay CVs were 5.0% for IgG, 3.8% for IgM, and 4.0%for IgA (n � 24), whereas the interassay CVs were 7.4%for IgG, 6.3% for IgM, and 5.2% for IgA (n � 3 differentruns with 16 determination of each sample) at IgG,IgM, and IgA concentrations [expressed as antiphos-pholipid units for IgG (GPLU), IgM (MPLU), and IgA(APLU)] of �1200 GPLU/L, 1500 MPLU/L, and 7200APLU/L.
For APL antibody screening we used the Immuno-metric Enzyme Immunoassay (Orgentec DiagnostikaGmbH) for the quantitative determination of the sum ofautoantibodies against cardiolipin, phosphatidylserine,
Table 1. Summary of clinical data.Study group (n � 200),
mean (SE)Control group (n � 200),
mean (SE) P
Maternal age, years 34.2 (0.3) 34.8 (0.4) NSa
Abortion, no. 3.4 (0.08) 0.5 (0.03) �0.0001Gestational age at sampling, weeks 12.15 (0.1) 12.15 (0.1) NSParity, no. 0 1.53 (0.03) �0.0001Gestational age at pregnancy termination, weeks 12.6 (0.3) 38.9 (0.2) �0.001
a NS, not significant.
Clinical Chemistry 53, No. 2, 2007 229
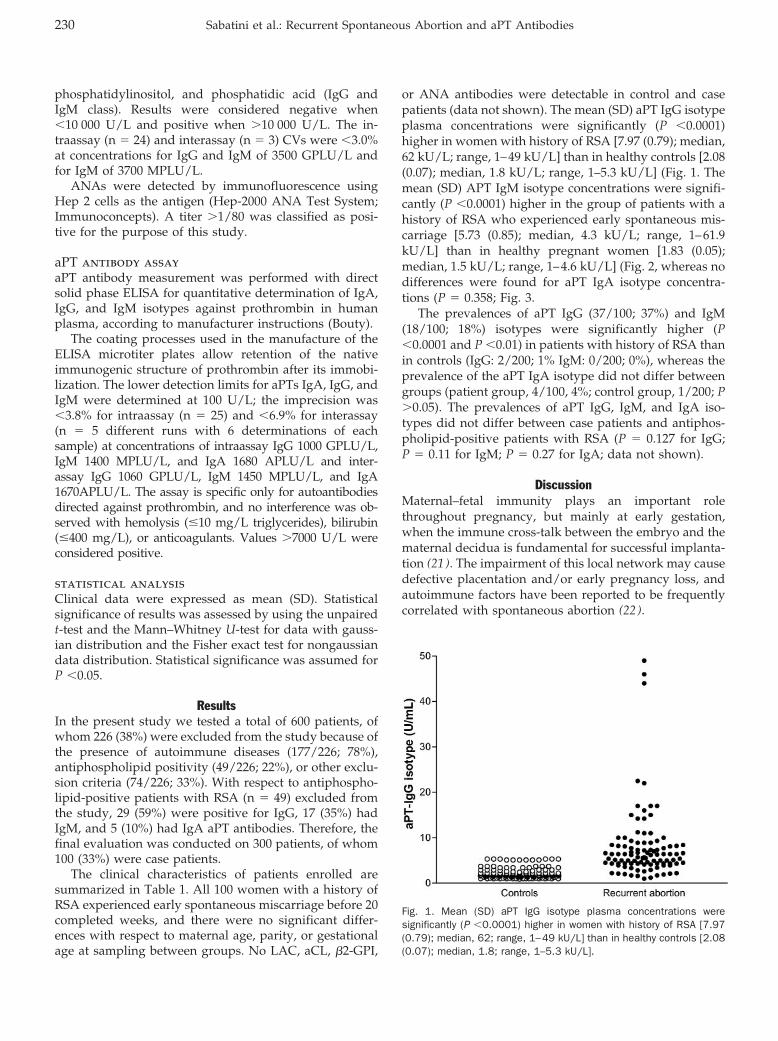
phosphatidylinositol, and phosphatidic acid (IgG andIgM class). Results were considered negative when�10 000 U/L and positive when �10 000 U/L. The in-traassay (n � 24) and interassay (n � 3) CVs were �3.0%at concentrations for IgG and IgM of 3500 GPLU/L andfor IgM of 3700 MPLU/L.
ANAs were detected by immunofluorescence usingHep 2 cells as the antigen (Hep-2000 ANA Test System;Immunoconcepts). A titer �1/80 was classified as posi-tive for the purpose of this study.
aPT antibody assayaPT antibody measurement was performed with directsolid phase ELISA for quantitative determination of IgA,IgG, and IgM isotypes against prothrombin in humanplasma, according to manufacturer instructions (Bouty).
The coating processes used in the manufacture of theELISA microtiter plates allow retention of the nativeimmunogenic structure of prothrombin after its immobi-lization. The lower detection limits for aPTs IgA, IgG, andIgM were determined at 100 U/L; the imprecision was�3.8% for intraassay (n � 25) and �6.9% for interassay(n � 5 different runs with 6 determinations of eachsample) at concentrations of intraassay IgG 1000 GPLU/L,IgM 1400 MPLU/L, and IgA 1680 APLU/L and inter-assay IgG 1060 GPLU/L, IgM 1450 MPLU/L, and IgA1670APLU/L. The assay is specific only for autoantibodiesdirected against prothrombin, and no interference was ob-served with hemolysis (�10 mg/L triglycerides), bilirubin(�400 mg/L), or anticoagulants. Values �7000 U/L wereconsidered positive.
statistical analysisClinical data were expressed as mean (SD). Statisticalsignificance of results was assessed by using the unpairedt-test and the Mann–Whitney U-test for data with gauss-ian distribution and the Fisher exact test for nongaussiandata distribution. Statistical significance was assumed forP �0.05.
ResultsIn the present study we tested a total of 600 patients, ofwhom 226 (38%) were excluded from the study because ofthe presence of autoimmune diseases (177/226; 78%),antiphospholipid positivity (49/226; 22%), or other exclu-sion criteria (74/226; 33%). With respect to antiphospho-lipid-positive patients with RSA (n � 49) excluded fromthe study, 29 (59%) were positive for IgG, 17 (35%) hadIgM, and 5 (10%) had IgA aPT antibodies. Therefore, thefinal evaluation was conducted on 300 patients, of whom100 (33%) were case patients.
The clinical characteristics of patients enrolled aresummarized in Table 1. All 100 women with a history ofRSA experienced early spontaneous miscarriage before 20completed weeks, and there were no significant differ-ences with respect to maternal age, parity, or gestationalage at sampling between groups. No LAC, aCL, �2-GPI,
or ANA antibodies were detectable in control and casepatients (data not shown). The mean (SD) aPT IgG isotypeplasma concentrations were significantly (P �0.0001)higher in women with history of RSA [7.97 (0.79); median,62 kU/L; range, 1–49 kU/L] than in healthy controls [2.08(0.07); median, 1.8 kU/L; range, 1–5.3 kU/L] (Fig. 1. Themean (SD) APT IgM isotype concentrations were signifi-cantly (P �0.0001) higher in the group of patients with ahistory of RSA who experienced early spontaneous mis-carriage [5.73 (0.85); median, 4.3 kU/L; range, 1–61.9kU/L] than in healthy pregnant women [1.83 (0.05);median, 1.5 kU/L; range, 1–4.6 kU/L] (Fig. 2, whereas nodifferences were found for aPT IgA isotype concentra-tions (P � 0.358; Fig. 3.
The prevalences of aPT IgG (37/100; 37%) and IgM(18/100; 18%) isotypes were significantly higher (P�0.0001 and P �0.01) in patients with history of RSA thanin controls (IgG: 2/200; 1% IgM: 0/200; 0%), whereas theprevalence of the aPT IgA isotype did not differ betweengroups (patient group, 4/100, 4%; control group, 1/200; P�0.05). The prevalences of aPT IgG, IgM, and IgA iso-types did not differ between case patients and antiphos-pholipid-positive patients with RSA (P � 0.127 for IgG;P � 0.11 for IgM; P � 0.27 for IgA; data not shown).
DiscussionMaternal–fetal immunity plays an important rolethroughout pregnancy, but mainly at early gestation,when the immune cross-talk between the embryo and thematernal decidua is fundamental for successful implanta-tion (21 ). The impairment of this local network may causedefective placentation and/or early pregnancy loss, andautoimmune factors have been reported to be frequentlycorrelated with spontaneous abortion (22 ).
Fig. 1. Mean (SD) aPT IgG isotype plasma concentrations weresignificantly (P �0.0001) higher in women with history of RSA [7.97(0.79); median, 62; range, 1–49 kU/L] than in healthy controls [2.08(0.07); median, 1.8; range, 1–5.3 kU/L].
230 Sabatini et al.: Recurrent Spontaneous Abortion and aPT Antibodies
In the present study we found that patients with RSAhave higher mean concentrations of IgG and IgM, but notIgA and aPT, than do healthy pregnant women. For IgA,the lack of statistically significant differences betweencontrols and RSA patients is attributable to the widedistribution of aPT IgA antibody values. The fact that IgAappears after IgG and IgM, however, may be a furtherpossible explanation. Therefore, differences in aPT anti-bodies may be due to an immune phenomenon that isalready working at the time of hospitalization and hasallowed the appearance of IgG and IgM, but not IgA.Larger studies are required to elucidate the pathogeneticrole of aPT IgA antibodies.
The association between aPT antibodies and RSA is notnovel, because high concentrations have been reported inpatients affected by APS (23 ). Moreover, some acuteinfectious diseases (syphilis, HIV, hepatitis C, leprosy,and malaria) may be associated with increased aPT anti-
bodies (24 ). Our data, however, were collected frompatients without APS and infectious diseases and there-fore support the hypothesis that aPT antibodies play arole, independently from APS, in the events cascadeleading to early RSA. Indeed, aPT antibodies are com-monly found in women with APS and may lead topregnancy loss through the promotion of microvascularplacental thrombosis, which is frequently associated withinfarction, perivillous fibrin deposits, and chronic inflam-matory lesions (13 ). The development of the placentalcirculation is crucial to the establishment of pregnancyand is ensured by structural modifications of the spiralarteries (25 ) and establishment of a hypercoagulable statefrom an increase in procoagulant factors and a decrease inanticoagulant factors and fibrinolysis (26 ). Disturbancesin this hemostatic balance may lead to adverse pregnancyoutcomes. Although the mechanism by which aPT anti-bodies may cause recurrent abortion remains to be de-fined, placental thrombosis may have an etiologic role,because increased basal thrombogenic potential wouldenhance hypercoagulability during pregnancy, leading toplacental thrombosis and fetal loss. The association ofplacental thrombosis with fetal loss is supported byfindings of thrombotic changes and infarcts in patholog-ical studies of the placentas obtained from pregnanciesterminated by fetal loss (27 ).
Prothrombin seems to be important in the develop-ment of the embryo, particularly in regard to vascularintegrity. Recent studies (28 ) have shown that prothrom-bin deficiency in prothrombin-deficient mice leads topartial embryonic fatality as a result of bleeding into theyolk sac cavity and tissue necrosis of the embryos. ThusaPT antibodies may lead to fatal changes in fetal devel-opment (22 ). Prothrombin plays a central role in the bloodcoagulation system by triggering the activation of plate-lets, converting soluble fibrinogen into insoluble fibrinpolymer, and activating regulatory pathways that controlthe rate of further thrombin formation (29 ). Anothertarget organ for aPT antibodies may be the endothelium;proposed effects of aPT antibodies on endothelial cellsinclude inhibition of thrombin-mediated endothelial cellprostacyclin release and protein C activation (30 ). Inaddition, aPT antibodies may recognize the prothrombin–anionic phospholipid complex on the endothelial cellsurface, thus activating endothelial cells and inducingprocoagulant substances via prothrombin, leading to ahypercoagulable state (31 ). aPT antibodies may also pro-mote thrombosis by facilitating prothrombin interactionswith damaged blood vessel walls and promoting throm-bin generation, leading to a hypercoagulable condition.
In conclusion, women with a history of RSA have highcirculation concentrations of aPT antibodies (IgG and IgMisotypes). Further prospective studies are needed to con-firm the causal association between aPT antibodies andpregnancy loss.
Fig. 2. Mean (SD) aPT IgM isotype concentrations were significantly(P �0.0001) higher in patients with history of RSA [5.73 (0.85);median, 4.3; range, 1–61.9 kU/L] than in healthy controls [1.83(0.05); median, 1.5; range, 1–4.6 kU/L].
Fig. 3. No differences were found for aPT IgA isotype concentrations(P � 0.358) between groups.
Clinical Chemistry 53, No. 2, 2007 231
References1. Harlap S, Shiono PH. Alcohol, smoking, and incidence of sponta-
neous abortions in the first and second trimester. Lancet 1980;2:173–6.
2. Rubio C, Simon C, Vidal F, Rodrigo L, Pehlivan T, Remohi J, et al.Chromosomal abnormalities and embryo development in recurrentmiscarriage couples. Hum Reprod 2003;18:182–8.
3. Takakuwa K, Adachi H, Hataya I, Ishii K, Tamura M, Tanaka K.Molecular genetic studies of HLA-DRB1 alleles in patients withunexplained recurrent abortion in the Japanese population. HumReprod 2003;18:728–33.
4. Weltz JI. Low molecular weight heparins. N Engl J Med 1997;337:688–97.
5. Clifford K, Rai R, Watson H, Regan L. An informative protocol forthe investigation of recurrent miscarriage: preliminary experienceof 500 consecutive cases. Hum Reprod 1994;9:1328–32.
6. Lea RG, al-Sharekh N, Tulppala M, Critchley HO. The immunolo-calization of bcl-2 at the maternal-fetal interface in healthy andfailing pregnancies. Hum Reprod 1997;12:153–8.
7. Matovina M, Husnjak K, Milutin N, Ciglar S, Grce M. Possible roleof bacterial and viral infections in miscarriages. Fertil Steril2004;81:662–9.
8. Sugiura-Ogasawara M, Furukawa TA, Nakano Y, Hori S, Aoki K,Kitamura T. Depression as a potential causal factor in subsequentmiscarriage in recurrent spontaneous aborters. Hum Reprod2002;17:2580–4.
9. Rand JH, Wu XX, Andree HA, Lockwood CJ, Guller S, Scher J, et al.Pregnancy loss in the antiphospholipid-antibody syndrome: apossible thrombogenic mechanism. N Engl J Med 1997;337:154–60.
10. Rai RS, Clifford K, Cohen H, Regan L. High prospective fetal lossrate in untreated pregnancies of women with recurrent miscar-riage and antiphospholipid antibodies. Hum Reprod 1995;10:3301–4.
11. Oshiro BT, Silver RM, Scott JR, Yu H, Branch DW. Antiphospholipidantibodies and fetal death. Obstet Gynecol 1996;87:489–93.
12. Festin MR, Limson GM, Maruo T. Autoimmune causes of recurrentpregnancy loss. Kobe J Med Sci 1997;43:143–57.
13. Salafia CM, Cowchock FS. Placental pathology and antiphospho-lipid antibodies: a descriptive study. Am J Perinatol 1997;14:435–41.
14. Galli M, Barbui T. Antiphospholipid antibodies and pregnancy[Review]. Best Pract Res Clin Haematol 2003;16:211–25.
15. Amengual O, Atsumi T, Koike T. Specificities, properties, and clinicalsignificance of antiprothrombin antibodies. Arthritis Rheum 2003;48:886–95.
16. Lupus Anticoagulant Working Party on behalf of the BCSH Haemo-stasis and Thrombosis Taskforce. Guidelines on testing for lupusanticoagulant. J Clin Pathol 1991;44:885–9.
17. Harris EN. Special report. The Second International Anti-cardio-lipin Standardization Workshop/the Kingston Anti-PhospholipidAntibody Study (KAPS) group. Am J Clin Pathol 1990;94:476–84.
18. Tincani A, Allegri F, Sanmarco M, Cinquini M, Taglietti M, Balestri-eri G, et al. Anticardiolipin antibody assay: a methodologicalanalysis for a better consensus in routine determinations: acooperative project of the European Antiphospholipid Forum.Thromb Haemost 2001;86:575–83.
19. McNally T, Purdy G, Mackie IJ, Machin SJ, Isenberg DA. The use ofan anti-beta 2 glycoprotein I assay for discrimination betweenanticardiolipin antibodies associated with infection increased riskof thrombosis. Br J Haematol 1995;91:471–3.
20. Martinuzzo ME, Forastiero RR, Carreras LO. Anti-beta 2 glycopro-tein I antibodies: detection and association with thrombosis. Br JHaematol 1995;89:397–402.
21. Roberts JM, Cooper DW. Pathogenesis and genetics of pre-eclampsia. Lancet 2001;357:53–6.
22. Chaouat G, Ledee-Bataille N, Dubanchet S. Immunological simi-larities between implantation and pre-eclampsia. Am J ReprodImmunol 2005;53:222–9.
23. von Landenberg P, Matthias T, Zaech J, Schultz M, Lorber M,Blank M, et al. Antiprothrombin antibodies are associated withpregnancy loss in patients with the antiphospholipid syndrome.Am J Reprod Immunol 2003;49:51–6.
24. Loizou S, Singh S, Wypkema E, Asherson RA. Anticardiolipin,anti-beta(2)-glycoprotein I and antiprothrombin antibodies in blackSouth African patients with infectious disease. Ann Rheum Dis2003;62:1106–11.
25. Sheppard BL, Bonnar J. The ultrastructure of the arterial supply ofthe human placenta in early and late pregnancy. J Obstet Gynae-col Br Commonw 1974;81:497–511.
26. Stirling Y, Woolf L, North WRS, Seghatchian MJ, Meade TW.Haemostasis in normal pregnancy. Thromb Haemost 1984;52:176–82.
27. Kujovich JL. Thrombophilia and pregnancy complications. Am JObstet Gynecol 2004;191:412–24.
28. Sun WY, Witte DP, Degen JL, Colbert MC, Burkart MC, HolmbackK, et al. Prothrombin deficiency results in embryonic and neonatallethality in mice. Proc Natl Acad Sci U S A 1998;95:7597–602.
29. Davie EW, Fujikawa K, Kisiel W. The coagulation cascade: initia-tion, maintenance, and regulation. Biochemistry 1991;29, 30:10363–70.
30. Roubey RAS. Autoantibodies to phospholipid-binding plasma pro-teins: a new view of lupus anticoagulants and other “antiphos-pholipid” antibodies. Blood 1994;84:2854–67.
31. Simantov R, LaSala JM, Lo SK, Gharavi AE, Sammaritano LR,Salmon JE, et al. Activation of cultured vascular endothelial cellsby antiphospholipid antibodies. J Clin Invest 1995;96:2211–9.
232 Sabatini et al.: Recurrent Spontaneous Abortion and aPT Antibodies
Comparison of Free and Total Forms of SerumHuman Kallikrein 2 and Prostate-Specific Antigenfor Prediction of Locally Advanced and Recurrent
Prostate CancerThomas Steuber,1,2 Andrew J. Vickers,1,3 Angel M. Serio,1 Ville Vaisanen,4
Alexander Haese,2 Kim Pettersson,4 James A. Eastham,1 Peter T. Scardino,1
Hartwig Huland,2 and Hans Lilja1,5,6,7*
Background: We evaluated the association of total andfree forms of serum human kallikrein 2 (hK2) andprostate-specific antigen (PSA) with prostate cancers ofunfavorable prognosis.Methods: We retrospectively measured total PSA(tPSA), free PSA (fPSA), and total hK2 (thK2) in preop-erative serum samples from 867 men [and assessed freehK2 (fhK2) measured in 577 of these men] treated withradical prostatectomy for clinically localized prostatecancer. Associations between biomarker concentrationsand extracapsular extension, seminal vesicle invasion,and biochemical recurrence (BCR) were evaluated. Asubset of patients with PSA <10 �g/L, the group mostcommonly seen in clinical practice in the US, wasanalyzed.Results: thK2 was the strongest predictor of extracapsu-lar extension and seminal vesicle invasion (areas underthe ROC curve [AUC], 0.662 and 0.719, respectively),followed by tPSA (AUC, 0.654 and 0.663). All biomark-ers were significant predictors of BCR. hK2 forms, butnot PSA forms, remained highly significant for predict-ing BCR in the low-PSA group. Combining tPSA, fPSA,
and thK2 in a multivariable model improved predictioncompared with any biomarker used individually (AUC,0.711, 0.755, and 0.752 for this combination predictingextracapsular extension, seminal vesicle invasion, andBCR, respectively; P <0.001 for all).Conclusions: Increased concentrations of hK2 in theblood are significantly associated with unfavorable fea-tures of prostate cancer, and thK2 is predictive of locallyadvanced and recurrent cancer in patients with PSA <10�g/L. Independent of tPSA and fPSA, hK2 predictsunfavorable prognosis.© 2007 American Association for Clinical Chemistry
Prostate-specific antigen (PSA8; human kallikrein 3 pro-tein) is the protein product of the human KLK39 gene.Because of its remarkable tissue specificity in humanmales, PSA is the most valuable biomarker for prostatecancer (PCa). In addition to its established clinical appli-cation for early detection, PSA is a key variable in currentprognostic models for clinically localized PCa (1–3).These models allow us to assess pathologic tumor stageand the risk of disease recurrence after local therapy. PSAconcentrations in blood do not reflect only the presence ofcancer, however; they are also driven by nodular hyper-plastic or inflammatory processes. This lack of specificitylimits the application of PSA as a predictor of stage andDepartments of 1 Surgery (Urology), 3 Epidemiology and Biostatistics,
5 Clinical Laboratories, and 7 Medicine (GU-Oncology), Memorial Sloan-Ket-tering Cancer Center, New York, NY.
2 Department of Urology, University Hospital Hamburg-Eppendorf, Ham-burg, Germany.
4 Department of Biotechnology, University of Turku, Turku, Finland.6 Department of Laboratory Medicine, Division of Clinical Chemistry,
Lund University, University Hospital, Malmo, Sweden.* Address correspondence to this author at: Memorial Sloan-Kettering
Cancer Center, Departments of Clinical Laboratories, Urology, 1275 York Ave.,Box 213, New York, NY 10021. Fax 212-422-2379; e-mail [email protected].
Received June 14, 2006; accepted November 29, 2006.Previously published online at DOI: 10.1373/clinchem.2006.074963
8 Nonstandard abbreviations: PSA, prostate-specific antigen; PCa, prostatecancer; hK2, human kallikrein 2; ECE, extracapsular extension; tPSA, totalPSA; thK2, total hK2; fhK2, free human kallikrein 2; SVI, seminal vesicleinvasion; BCR, biochemical recurrence; fPSA, free prostate-specific antigen;AUC, area under the ROC curve; c-index, concordance index; CI, confidenceinterval.
9 Human genes: KLK3, kallikrein-related peptidase 3; KLK2, kallikrein-related peptidase 2.
Clinical Chemistry 53:2233–240 (2007) Cancer Diagnostics
233
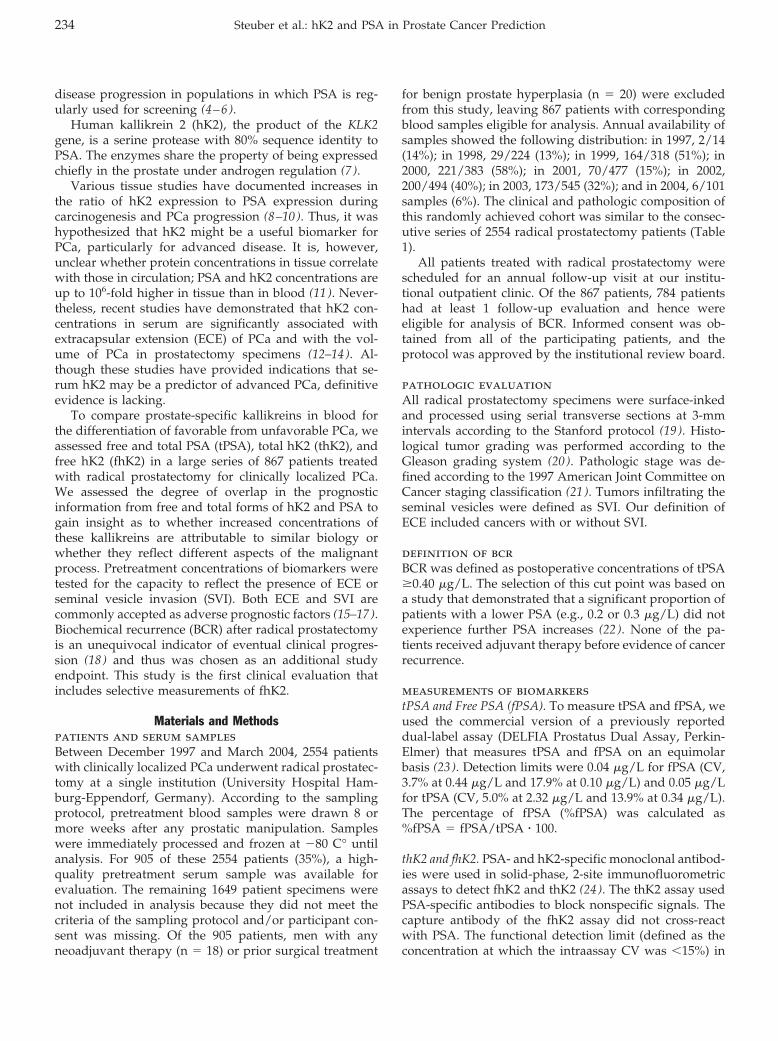
disease progression in populations in which PSA is reg-ularly used for screening (4–6).
Human kallikrein 2 (hK2), the product of the KLK2gene, is a serine protease with 80% sequence identity toPSA. The enzymes share the property of being expressedchiefly in the prostate under androgen regulation (7 ).
Various tissue studies have documented increases inthe ratio of hK2 expression to PSA expression duringcarcinogenesis and PCa progression (8–10). Thus, it washypothesized that hK2 might be a useful biomarker forPCa, particularly for advanced disease. It is, however,unclear whether protein concentrations in tissue correlatewith those in circulation; PSA and hK2 concentrations areup to 106-fold higher in tissue than in blood (11 ). Never-theless, recent studies have demonstrated that hK2 con-centrations in serum are significantly associated withextracapsular extension (ECE) of PCa and with the vol-ume of PCa in prostatectomy specimens (12–14). Al-though these studies have provided indications that se-rum hK2 may be a predictor of advanced PCa, definitiveevidence is lacking.
To compare prostate-specific kallikreins in blood forthe differentiation of favorable from unfavorable PCa, weassessed free and total PSA (tPSA), total hK2 (thK2), andfree hK2 (fhK2) in a large series of 867 patients treatedwith radical prostatectomy for clinically localized PCa.We assessed the degree of overlap in the prognosticinformation from free and total forms of hK2 and PSA togain insight as to whether increased concentrations ofthese kallikreins are attributable to similar biology orwhether they reflect different aspects of the malignantprocess. Pretreatment concentrations of biomarkers weretested for the capacity to reflect the presence of ECE orseminal vesicle invasion (SVI). Both ECE and SVI arecommonly accepted as adverse prognostic factors (15–17).Biochemical recurrence (BCR) after radical prostatectomyis an unequivocal indicator of eventual clinical progres-sion (18 ) and thus was chosen as an additional studyendpoint. This study is the first clinical evaluation thatincludes selective measurements of fhK2.
Materials and Methodspatients and serum samplesBetween December 1997 and March 2004, 2554 patientswith clinically localized PCa underwent radical prostatec-tomy at a single institution (University Hospital Ham-burg-Eppendorf, Germany). According to the samplingprotocol, pretreatment blood samples were drawn 8 ormore weeks after any prostatic manipulation. Sampleswere immediately processed and frozen at �80 C° untilanalysis. For 905 of these 2554 patients (35%), a high-quality pretreatment serum sample was available forevaluation. The remaining 1649 patient specimens werenot included in analysis because they did not meet thecriteria of the sampling protocol and/or participant con-sent was missing. Of the 905 patients, men with anyneoadjuvant therapy (n � 18) or prior surgical treatment
for benign prostate hyperplasia (n � 20) were excludedfrom this study, leaving 867 patients with correspondingblood samples eligible for analysis. Annual availability ofsamples showed the following distribution: in 1997, 2/14(14%); in 1998, 29/224 (13%); in 1999, 164/318 (51%); in2000, 221/383 (58%); in 2001, 70/477 (15%); in 2002,200/494 (40%); in 2003, 173/545 (32%); and in 2004, 6/101samples (6%). The clinical and pathologic composition ofthis randomly achieved cohort was similar to the consec-utive series of 2554 radical prostatectomy patients (Table1).
All patients treated with radical prostatectomy werescheduled for an annual follow-up visit at our institu-tional outpatient clinic. Of the 867 patients, 784 patientshad at least 1 follow-up evaluation and hence wereeligible for analysis of BCR. Informed consent was ob-tained from all of the participating patients, and theprotocol was approved by the institutional review board.
pathologic evaluationAll radical prostatectomy specimens were surface-inkedand processed using serial transverse sections at 3-mmintervals according to the Stanford protocol (19 ). Histo-logical tumor grading was performed according to theGleason grading system (20 ). Pathologic stage was de-fined according to the 1997 American Joint Committee onCancer staging classification (21 ). Tumors infiltrating theseminal vesicles were defined as SVI. Our definition ofECE included cancers with or without SVI.
definition of bcrBCR was defined as postoperative concentrations of tPSA�0.40 �g/L. The selection of this cut point was based ona study that demonstrated that a significant proportion ofpatients with a lower PSA (e.g., 0.2 or 0.3 �g/L) did notexperience further PSA increases (22 ). None of the pa-tients received adjuvant therapy before evidence of cancerrecurrence.
measurements of biomarkerstPSA and Free PSA (fPSA). To measure tPSA and fPSA, weused the commercial version of a previously reporteddual-label assay (DELFIA Prostatus Dual Assay, Perkin-Elmer) that measures tPSA and fPSA on an equimolarbasis (23 ). Detection limits were 0.04 �g/L for fPSA (CV,3.7% at 0.44 �g/L and 17.9% at 0.10 �g/L) and 0.05 �g/Lfor tPSA (CV, 5.0% at 2.32 �g/L and 13.9% at 0.34 �g/L).The percentage of fPSA (%fPSA) was calculated as%fPSA � fPSA/tPSA � 100.
thK2 and fhK2. PSA- and hK2-specific monoclonal antibod-ies were used in solid-phase, 2-site immunofluorometricassays to detect fhK2 and thK2 (24 ). The thK2 assay usedPSA-specific antibodies to block nonspecific signals. Thecapture antibody of the fhK2 assay did not cross-reactwith PSA. The functional detection limit (defined as theconcentration at which the intraassay CV was �15%) in
234 Steuber et al.: hK2 and PSA in Prostate Cancer Prediction
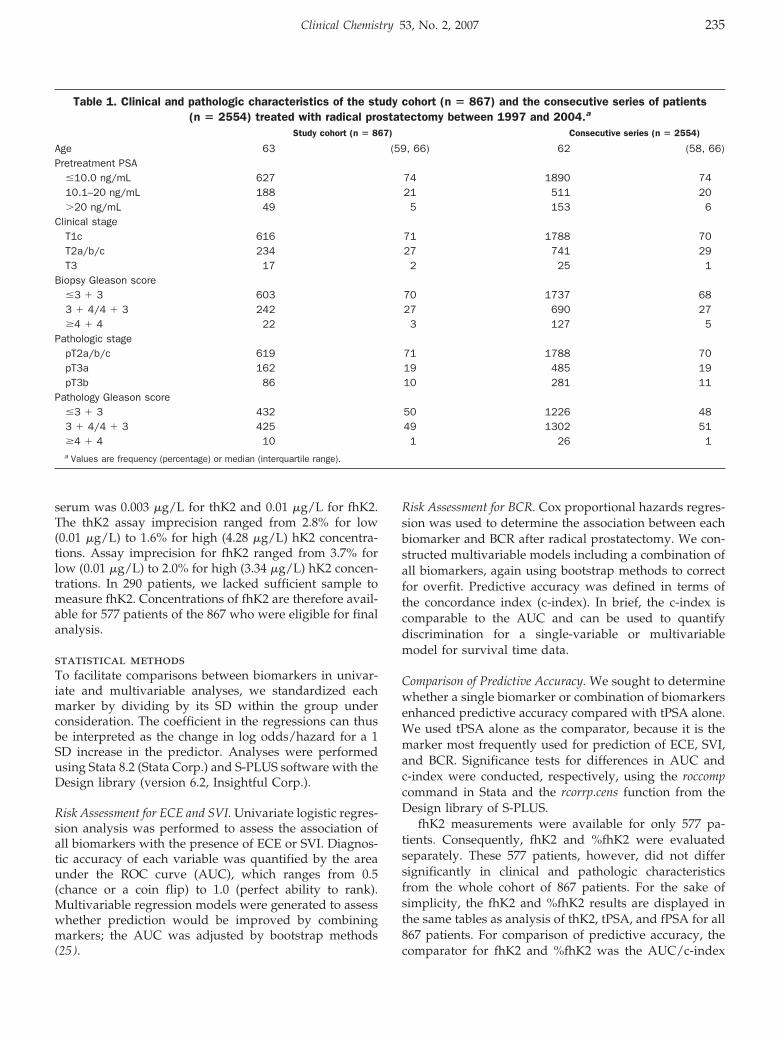
serum was 0.003 �g/L for thK2 and 0.01 �g/L for fhK2.The thK2 assay imprecision ranged from 2.8% for low(0.01 �g/L) to 1.6% for high (4.28 �g/L) hK2 concentra-tions. Assay imprecision for fhK2 ranged from 3.7% forlow (0.01 �g/L) to 2.0% for high (3.34 �g/L) hK2 concen-trations. In 290 patients, we lacked sufficient sample tomeasure fhK2. Concentrations of fhK2 are therefore avail-able for 577 patients of the 867 who were eligible for finalanalysis.
statistical methodsTo facilitate comparisons between biomarkers in univar-iate and multivariable analyses, we standardized eachmarker by dividing by its SD within the group underconsideration. The coefficient in the regressions can thusbe interpreted as the change in log odds/hazard for a 1SD increase in the predictor. Analyses were performedusing Stata 8.2 (Stata Corp.) and S-PLUS software with theDesign library (version 6.2, Insightful Corp.).
Risk Assessment for ECE and SVI. Univariate logistic regres-sion analysis was performed to assess the association ofall biomarkers with the presence of ECE or SVI. Diagnos-tic accuracy of each variable was quantified by the areaunder the ROC curve (AUC), which ranges from 0.5(chance or a coin flip) to 1.0 (perfect ability to rank).Multivariable regression models were generated to assesswhether prediction would be improved by combiningmarkers; the AUC was adjusted by bootstrap methods(25 ).
Risk Assessment for BCR. Cox proportional hazards regres-sion was used to determine the association between eachbiomarker and BCR after radical prostatectomy. We con-structed multivariable models including a combination ofall biomarkers, again using bootstrap methods to correctfor overfit. Predictive accuracy was defined in terms ofthe concordance index (c-index). In brief, the c-index iscomparable to the AUC and can be used to quantifydiscrimination for a single-variable or multivariablemodel for survival time data.
Comparison of Predictive Accuracy. We sought to determinewhether a single biomarker or combination of biomarkersenhanced predictive accuracy compared with tPSA alone.We used tPSA alone as the comparator, because it is themarker most frequently used for prediction of ECE, SVI,and BCR. Significance tests for differences in AUC andc-index were conducted, respectively, using the roccompcommand in Stata and the rcorrp.cens function from theDesign library of S-PLUS.
fhK2 measurements were available for only 577 pa-tients. Consequently, fhK2 and %fhK2 were evaluatedseparately. These 577 patients, however, did not differsignificantly in clinical and pathologic characteristicsfrom the whole cohort of 867 patients. For the sake ofsimplicity, the fhK2 and %fhK2 results are displayed inthe same tables as analysis of thK2, tPSA, and fPSA for all867 patients. For comparison of predictive accuracy, thecomparator for fhK2 and %fhK2 was the AUC/c-index
Table 1. Clinical and pathologic characteristics of the study cohort (n � 867) and the consecutive series of patients(n � 2554) treated with radical prostatectomy between 1997 and 2004.a
Study cohort (n � 867) Consecutive series (n � 2554)
Age 63 (59, 66) 62 (58, 66)Pretreatment PSA
�10.0 ng/mL 627 74 1890 7410.1–20 ng/mL 188 21 511 20�20 ng/mL 49 5 153 6
Clinical stageT1c 616 71 1788 70T2a/b/c 234 27 741 29T3 17 2 25 1
Biopsy Gleason score�3 � 3 603 70 1737 683 � 4/4 � 3 242 27 690 27�4 � 4 22 3 127 5
Pathologic stagepT2a/b/c 619 71 1788 70pT3a 162 19 485 19pT3b 86 10 281 11
Pathology Gleason score�3 � 3 432 50 1226 483 � 4/4 � 3 425 49 1302 51�4 � 4 10 1 26 1a Values are frequency (percentage) or median (interquartile range).
Clinical Chemistry 53, No. 2, 2007 235
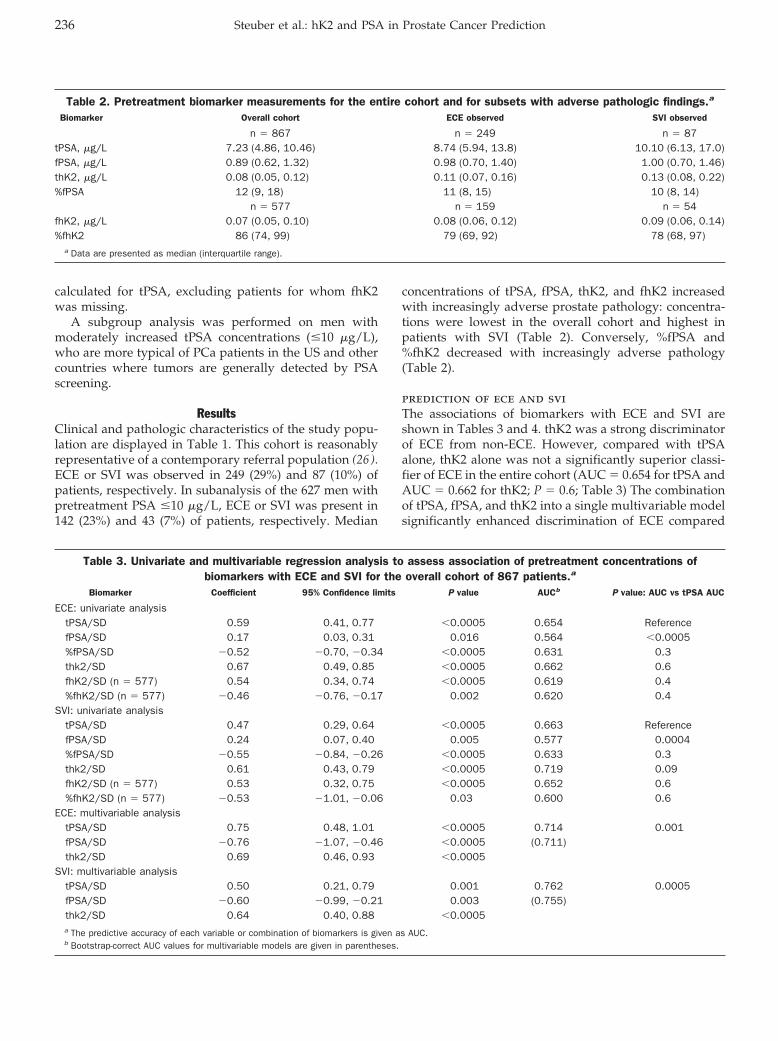
calculated for tPSA, excluding patients for whom fhK2was missing.
A subgroup analysis was performed on men withmoderately increased tPSA concentrations (�10 �g/L),who are more typical of PCa patients in the US and othercountries where tumors are generally detected by PSAscreening.
ResultsClinical and pathologic characteristics of the study popu-lation are displayed in Table 1. This cohort is reasonablyrepresentative of a contemporary referral population (26 ).ECE or SVI was observed in 249 (29%) and 87 (10%) ofpatients, respectively. In subanalysis of the 627 men withpretreatment PSA �10 �g/L, ECE or SVI was present in142 (23%) and 43 (7%) of patients, respectively. Median
concentrations of tPSA, fPSA, thK2, and fhK2 increasedwith increasingly adverse prostate pathology: concentra-tions were lowest in the overall cohort and highest inpatients with SVI (Table 2). Conversely, %fPSA and%fhK2 decreased with increasingly adverse pathology(Table 2).
prediction of ece and sviThe associations of biomarkers with ECE and SVI areshown in Tables 3 and 4. thK2 was a strong discriminatorof ECE from non-ECE. However, compared with tPSAalone, thK2 alone was not a significantly superior classi-fier of ECE in the entire cohort (AUC � 0.654 for tPSA andAUC � 0.662 for thK2; P � 0.6; Table 3) The combinationof tPSA, fPSA, and thK2 into a single multivariable modelsignificantly enhanced discrimination of ECE compared
Table 2. Pretreatment biomarker measurements for the entire cohort and for subsets with adverse pathologic findings.a
Biomarker Overall cohort ECE observed SVI observed
n � 867 n � 249 n � 87tPSA, �g/L 7.23 (4.86, 10.46) 8.74 (5.94, 13.8) 10.10 (6.13, 17.0)fPSA, �g/L 0.89 (0.62, 1.32) 0.98 (0.70, 1.40) 1.00 (0.70, 1.46)thK2, �g/L 0.08 (0.05, 0.12) 0.11 (0.07, 0.16) 0.13 (0.08, 0.22)%fPSA 12 (9, 18) 11 (8, 15) 10 (8, 14)
n � 577 n � 159 n � 54fhK2, �g/L 0.07 (0.05, 0.10) 0.08 (0.06, 0.12) 0.09 (0.06, 0.14)%fhK2 86 (74, 99) 79 (69, 92) 78 (68, 97)
a Data are presented as median (interquartile range).
Table 3. Univariate and multivariable regression analysis to assess association of pretreatment concentrations ofbiomarkers with ECE and SVI for the overall cohort of 867 patients.a
Biomarker Coefficient 95% Confidence limits P value AUCb P value: AUC vs tPSA AUC
ECE: univariate analysistPSA/SD 0.59 0.41, 0.77 �0.0005 0.654 ReferencefPSA/SD 0.17 0.03, 0.31 0.016 0.564 �0.0005%fPSA/SD �0.52 �0.70, �0.34 �0.0005 0.631 0.3thk2/SD 0.67 0.49, 0.85 �0.0005 0.662 0.6fhK2/SD (n � 577) 0.54 0.34, 0.74 �0.0005 0.619 0.4%fhK2/SD (n � 577) �0.46 �0.76, �0.17 0.002 0.620 0.4
SVI: univariate analysistPSA/SD 0.47 0.29, 0.64 �0.0005 0.663 ReferencefPSA/SD 0.24 0.07, 0.40 0.005 0.577 0.0004%fPSA/SD �0.55 �0.84, �0.26 �0.0005 0.633 0.3thk2/SD 0.61 0.43, 0.79 �0.0005 0.719 0.09fhK2/SD (n � 577) 0.53 0.32, 0.75 �0.0005 0.652 0.6%fhK2/SD (n � 577) �0.53 �1.01, �0.06 0.03 0.600 0.6
ECE: multivariable analysistPSA/SD 0.75 0.48, 1.01 �0.0005 0.714 0.001fPSA/SD �0.76 �1.07, �0.46 �0.0005 (0.711)thk2/SD 0.69 0.46, 0.93 �0.0005
SVI: multivariable analysistPSA/SD 0.50 0.21, 0.79 0.001 0.762 0.0005fPSA/SD �0.60 �0.99, �0.21 0.003 (0.755)thk2/SD 0.64 0.40, 0.88 �0.0005a The predictive accuracy of each variable or combination of biomarkers is given as AUC.b Bootstrap-correct AUC values for multivariable models are given in parentheses.
236 Steuber et al.: hK2 and PSA in Prostate Cancer Prediction
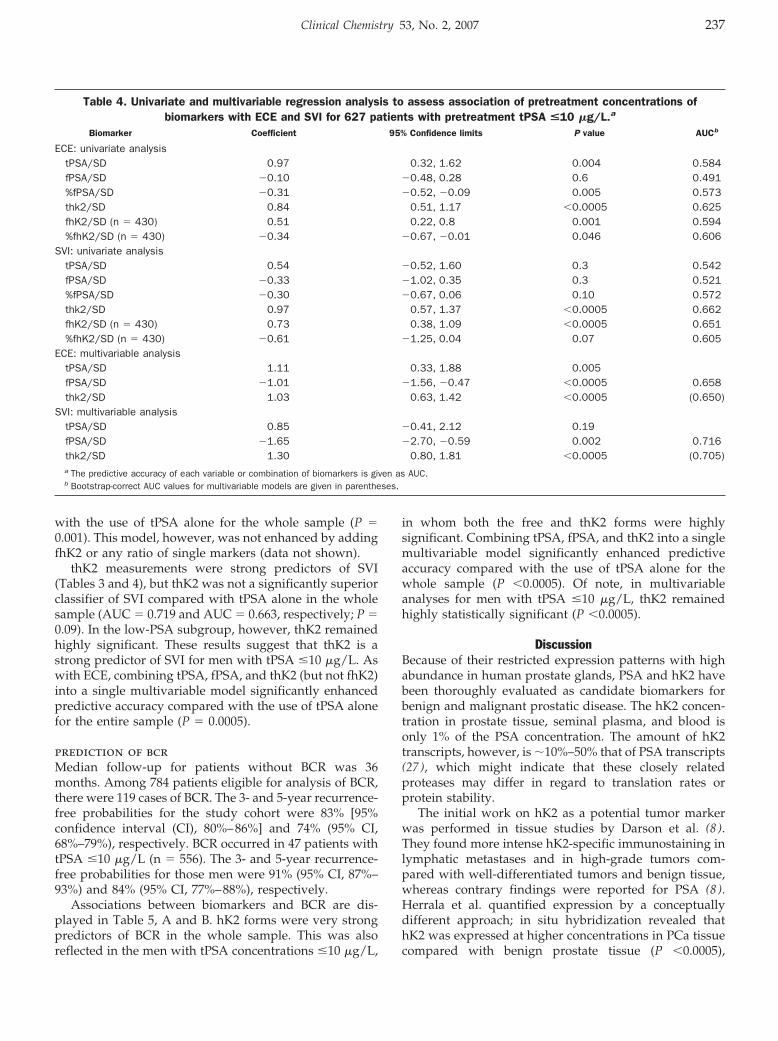
with the use of tPSA alone for the whole sample (P �0.001). This model, however, was not enhanced by addingfhK2 or any ratio of single markers (data not shown).
thK2 measurements were strong predictors of SVI(Tables 3 and 4), but thK2 was not a significantly superiorclassifier of SVI compared with tPSA alone in the wholesample (AUC � 0.719 and AUC � 0.663, respectively; P �0.09). In the low-PSA subgroup, however, thK2 remainedhighly significant. These results suggest that thK2 is astrong predictor of SVI for men with tPSA �10 �g/L. Aswith ECE, combining tPSA, fPSA, and thK2 (but not fhK2)into a single multivariable model significantly enhancedpredictive accuracy compared with the use of tPSA alonefor the entire sample (P � 0.0005).
prediction of bcrMedian follow-up for patients without BCR was 36months. Among 784 patients eligible for analysis of BCR,there were 119 cases of BCR. The 3- and 5-year recurrence-free probabilities for the study cohort were 83% [95%confidence interval (CI), 80%–86%] and 74% (95% CI,68%–79%), respectively. BCR occurred in 47 patients withtPSA �10 �g/L (n � 556). The 3- and 5-year recurrence-free probabilities for those men were 91% (95% CI, 87%–93%) and 84% (95% CI, 77%–88%), respectively.
Associations between biomarkers and BCR are dis-played in Table 5, A and B. hK2 forms were very strongpredictors of BCR in the whole sample. This was alsoreflected in the men with tPSA concentrations �10 �g/L,
in whom both the free and thK2 forms were highlysignificant. Combining tPSA, fPSA, and thK2 into a singlemultivariable model significantly enhanced predictiveaccuracy compared with the use of tPSA alone for thewhole sample (P �0.0005). Of note, in multivariableanalyses for men with tPSA �10 �g/L, thK2 remainedhighly statistically significant (P �0.0005).
DiscussionBecause of their restricted expression patterns with highabundance in human prostate glands, PSA and hK2 havebeen thoroughly evaluated as candidate biomarkers forbenign and malignant prostatic disease. The hK2 concen-tration in prostate tissue, seminal plasma, and blood isonly 1% of the PSA concentration. The amount of hK2transcripts, however, is �10%–50% that of PSA transcripts(27 ), which might indicate that these closely relatedproteases may differ in regard to translation rates orprotein stability.
The initial work on hK2 as a potential tumor markerwas performed in tissue studies by Darson et al. (8 ).They found more intense hK2-specific immunostaining inlymphatic metastases and in high-grade tumors com-pared with well-differentiated tumors and benign tissue,whereas contrary findings were reported for PSA (8 ).Herrala et al. quantified expression by a conceptuallydifferent approach; in situ hybridization revealed thathK2 was expressed at higher concentrations in PCa tissuecompared with benign prostate tissue (P �0.0005),
Table 4. Univariate and multivariable regression analysis to assess association of pretreatment concentrations ofbiomarkers with ECE and SVI for 627 patients with pretreatment tPSA <10 �g/L.a
Biomarker Coefficient 95% Confidence limits P value AUCb
ECE: univariate analysistPSA/SD 0.97 0.32, 1.62 0.004 0.584fPSA/SD �0.10 �0.48, 0.28 0.6 0.491%fPSA/SD �0.31 �0.52, �0.09 0.005 0.573thk2/SD 0.84 0.51, 1.17 �0.0005 0.625fhK2/SD (n � 430) 0.51 0.22, 0.8 0.001 0.594%fhK2/SD (n � 430) �0.34 �0.67, �0.01 0.046 0.606
SVI: univariate analysistPSA/SD 0.54 �0.52, 1.60 0.3 0.542fPSA/SD �0.33 �1.02, 0.35 0.3 0.521%fPSA/SD �0.30 �0.67, 0.06 0.10 0.572thk2/SD 0.97 0.57, 1.37 �0.0005 0.662fhK2/SD (n � 430) 0.73 0.38, 1.09 �0.0005 0.651%fhK2/SD (n � 430) �0.61 �1.25, 0.04 0.07 0.605
ECE: multivariable analysistPSA/SD 1.11 0.33, 1.88 0.005fPSA/SD �1.01 �1.56, �0.47 �0.0005 0.658thk2/SD 1.03 0.63, 1.42 �0.0005 (0.650)
SVI: multivariable analysistPSA/SD 0.85 �0.41, 2.12 0.19fPSA/SD �1.65 �2.70, �0.59 0.002 0.716thk2/SD 1.30 0.80, 1.81 �0.0005 (0.705)a The predictive accuracy of each variable or combination of biomarkers is given as AUC.b Bootstrap-correct AUC values for multivariable models are given in parentheses.
Clinical Chemistry 53, No. 2, 2007 237
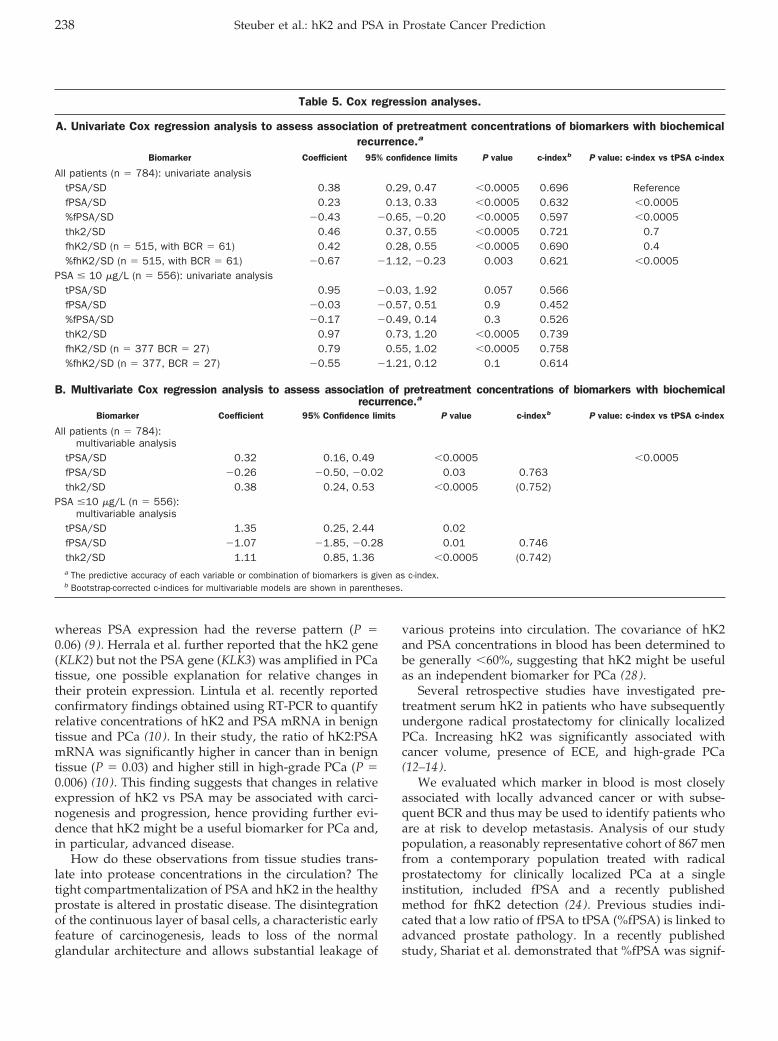
whereas PSA expression had the reverse pattern (P �0.06) (9 ). Herrala et al. further reported that the hK2 gene(KLK2) but not the PSA gene (KLK3) was amplified in PCatissue, one possible explanation for relative changes intheir protein expression. Lintula et al. recently reportedconfirmatory findings obtained using RT-PCR to quantifyrelative concentrations of hK2 and PSA mRNA in benigntissue and PCa (10 ). In their study, the ratio of hK2:PSAmRNA was significantly higher in cancer than in benigntissue (P � 0.03) and higher still in high-grade PCa (P �0.006) (10 ). This finding suggests that changes in relativeexpression of hK2 vs PSA may be associated with carci-nogenesis and progression, hence providing further evi-dence that hK2 might be a useful biomarker for PCa and,in particular, advanced disease.
How do these observations from tissue studies trans-late into protease concentrations in the circulation? Thetight compartmentalization of PSA and hK2 in the healthyprostate is altered in prostatic disease. The disintegrationof the continuous layer of basal cells, a characteristic earlyfeature of carcinogenesis, leads to loss of the normalglandular architecture and allows substantial leakage of
various proteins into circulation. The covariance of hK2and PSA concentrations in blood has been determined tobe generally �60%, suggesting that hK2 might be usefulas an independent biomarker for PCa (28 ).
Several retrospective studies have investigated pre-treatment serum hK2 in patients who have subsequentlyundergone radical prostatectomy for clinically localizedPCa. Increasing hK2 was significantly associated withcancer volume, presence of ECE, and high-grade PCa(12–14).
We evaluated which marker in blood is most closelyassociated with locally advanced cancer or with subse-quent BCR and thus may be used to identify patients whoare at risk to develop metastasis. Analysis of our studypopulation, a reasonably representative cohort of 867 menfrom a contemporary population treated with radicalprostatectomy for clinically localized PCa at a singleinstitution, included fPSA and a recently publishedmethod for fhK2 detection (24 ). Previous studies indi-cated that a low ratio of fPSA to tPSA (%fPSA) is linked toadvanced prostate pathology. In a recently publishedstudy, Shariat et al. demonstrated that %fPSA was signif-
Table 5. Cox regression analyses.
A. Univariate Cox regression analysis to assess association of pretreatment concentrations of biomarkers with biochemicalrecurrence.a
Biomarker Coefficient 95% confidence limits P value c-indexb P value: c-index vs tPSA c-index
All patients (n � 784): univariate analysistPSA/SD 0.38 0.29, 0.47 �0.0005 0.696 ReferencefPSA/SD 0.23 0.13, 0.33 �0.0005 0.632 �0.0005%fPSA/SD �0.43 �0.65, �0.20 �0.0005 0.597 �0.0005thk2/SD 0.46 0.37, 0.55 �0.0005 0.721 0.7fhK2/SD (n � 515, with BCR � 61) 0.42 0.28, 0.55 �0.0005 0.690 0.4%fhK2/SD (n � 515, with BCR � 61) �0.67 �1.12, �0.23 0.003 0.621 �0.0005
PSA � 10 �g/L (n � 556): univariate analysistPSA/SD 0.95 �0.03, 1.92 0.057 0.566fPSA/SD �0.03 �0.57, 0.51 0.9 0.452%fPSA/SD �0.17 �0.49, 0.14 0.3 0.526thK2/SD 0.97 0.73, 1.20 �0.0005 0.739fhK2/SD (n � 377 BCR � 27) 0.79 0.55, 1.02 �0.0005 0.758%fhK2/SD (n � 377, BCR � 27) �0.55 �1.21, 0.12 0.1 0.614
B. Multivariate Cox regression analysis to assess association of pretreatment concentrations of biomarkers with biochemicalrecurrence.a
Biomarker Coefficient 95% Confidence limits P value c-indexb P value: c-index vs tPSA c-index
All patients (n � 784):multivariable analysis
tPSA/SD 0.32 0.16, 0.49 �0.0005 �0.0005fPSA/SD �0.26 �0.50, �0.02 0.03 0.763thk2/SD 0.38 0.24, 0.53 �0.0005 (0.752)
PSA �10 �g/L (n � 556):multivariable analysis
tPSA/SD 1.35 0.25, 2.44 0.02fPSA/SD �1.07 �1.85, �0.28 0.01 0.746thk2/SD 1.11 0.85, 1.36 �0.0005 (0.742)a The predictive accuracy of each variable or combination of biomarkers is given as c-index.b Bootstrap-corrected c-indices for multivariable models are shown in parentheses.
238 Steuber et al.: hK2 and PSA in Prostate Cancer Prediction
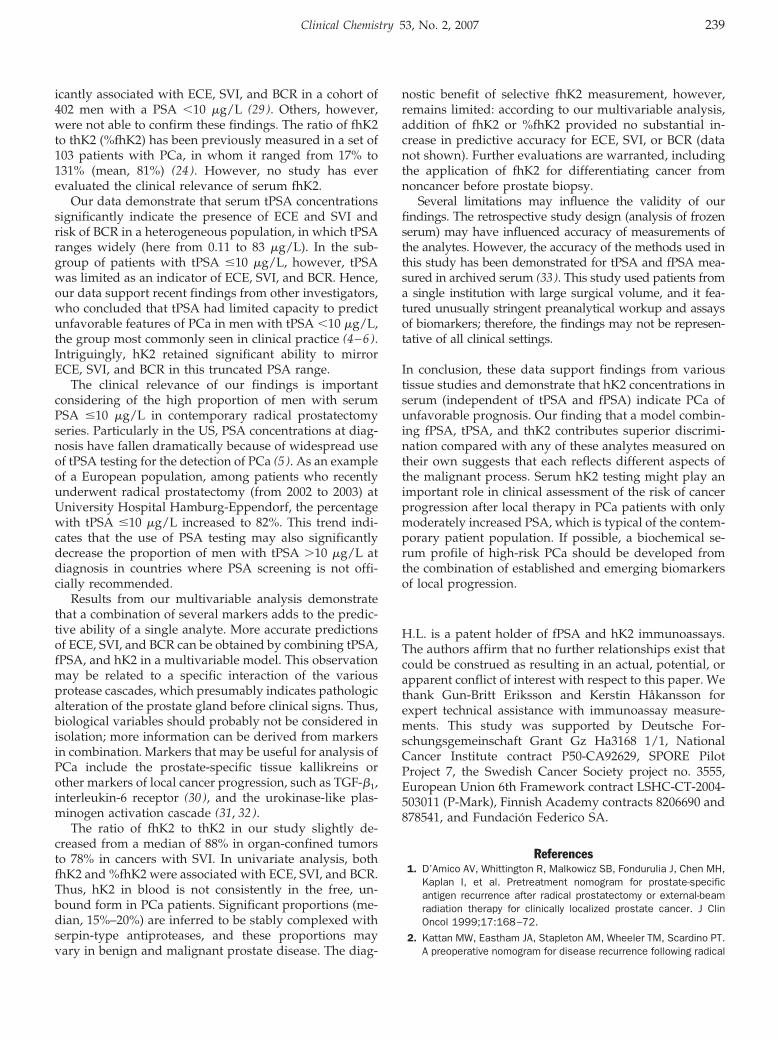
icantly associated with ECE, SVI, and BCR in a cohort of402 men with a PSA �10 �g/L (29 ). Others, however,were not able to confirm these findings. The ratio of fhK2to thK2 (%fhK2) has been previously measured in a set of103 patients with PCa, in whom it ranged from 17% to131% (mean, 81%) (24 ). However, no study has everevaluated the clinical relevance of serum fhK2.
Our data demonstrate that serum tPSA concentrationssignificantly indicate the presence of ECE and SVI andrisk of BCR in a heterogeneous population, in which tPSAranges widely (here from 0.11 to 83 �g/L). In the sub-group of patients with tPSA �10 �g/L, however, tPSAwas limited as an indicator of ECE, SVI, and BCR. Hence,our data support recent findings from other investigators,who concluded that tPSA had limited capacity to predictunfavorable features of PCa in men with tPSA �10 �g/L,the group most commonly seen in clinical practice (4–6).Intriguingly, hK2 retained significant ability to mirrorECE, SVI, and BCR in this truncated PSA range.
The clinical relevance of our findings is importantconsidering of the high proportion of men with serumPSA �10 �g/L in contemporary radical prostatectomyseries. Particularly in the US, PSA concentrations at diag-nosis have fallen dramatically because of widespread useof tPSA testing for the detection of PCa (5 ). As an exampleof a European population, among patients who recentlyunderwent radical prostatectomy (from 2002 to 2003) atUniversity Hospital Hamburg-Eppendorf, the percentagewith tPSA �10 �g/L increased to 82%. This trend indi-cates that the use of PSA testing may also significantlydecrease the proportion of men with tPSA �10 �g/L atdiagnosis in countries where PSA screening is not offi-cially recommended.
Results from our multivariable analysis demonstratethat a combination of several markers adds to the predic-tive ability of a single analyte. More accurate predictionsof ECE, SVI, and BCR can be obtained by combining tPSA,fPSA, and hK2 in a multivariable model. This observationmay be related to a specific interaction of the variousprotease cascades, which presumably indicates pathologicalteration of the prostate gland before clinical signs. Thus,biological variables should probably not be considered inisolation; more information can be derived from markersin combination. Markers that may be useful for analysis ofPCa include the prostate-specific tissue kallikreins orother markers of local cancer progression, such as TGF-�1,interleukin-6 receptor (30 ), and the urokinase-like plas-minogen activation cascade (31, 32).
The ratio of fhK2 to thK2 in our study slightly de-creased from a median of 88% in organ-confined tumorsto 78% in cancers with SVI. In univariate analysis, bothfhK2 and %fhK2 were associated with ECE, SVI, and BCR.Thus, hK2 in blood is not consistently in the free, un-bound form in PCa patients. Significant proportions (me-dian, 15%–20%) are inferred to be stably complexed withserpin-type antiproteases, and these proportions mayvary in benign and malignant prostate disease. The diag-
nostic benefit of selective fhK2 measurement, however,remains limited: according to our multivariable analysis,addition of fhK2 or %fhK2 provided no substantial in-crease in predictive accuracy for ECE, SVI, or BCR (datanot shown). Further evaluations are warranted, includingthe application of fhK2 for differentiating cancer fromnoncancer before prostate biopsy.
Several limitations may influence the validity of ourfindings. The retrospective study design (analysis of frozenserum) may have influenced accuracy of measurements ofthe analytes. However, the accuracy of the methods used inthis study has been demonstrated for tPSA and fPSA mea-sured in archived serum (33). This study used patients froma single institution with large surgical volume, and it fea-tured unusually stringent preanalytical workup and assaysof biomarkers; therefore, the findings may not be represen-tative of all clinical settings.
In conclusion, these data support findings from varioustissue studies and demonstrate that hK2 concentrations inserum (independent of tPSA and fPSA) indicate PCa ofunfavorable prognosis. Our finding that a model combin-ing fPSA, tPSA, and thK2 contributes superior discrimi-nation compared with any of these analytes measured ontheir own suggests that each reflects different aspects ofthe malignant process. Serum hK2 testing might play animportant role in clinical assessment of the risk of cancerprogression after local therapy in PCa patients with onlymoderately increased PSA, which is typical of the contem-porary patient population. If possible, a biochemical se-rum profile of high-risk PCa should be developed fromthe combination of established and emerging biomarkersof local progression.
H.L. is a patent holder of fPSA and hK2 immunoassays.The authors affirm that no further relationships exist thatcould be construed as resulting in an actual, potential, orapparent conflict of interest with respect to this paper. Wethank Gun-Britt Eriksson and Kerstin Håkansson forexpert technical assistance with immunoassay measure-ments. This study was supported by Deutsche For-schungsgemeinschaft Grant Gz Ha3168 1/1, NationalCancer Institute contract P50-CA92629, SPORE PilotProject 7, the Swedish Cancer Society project no. 3555,European Union 6th Framework contract LSHC-CT-2004-503011 (P-Mark), Finnish Academy contracts 8206690 and878541, and Fundacion Federico SA.
References1. D’Amico AV, Whittington R, Malkowicz SB, Fondurulia J, Chen MH,
Kaplan I, et al. Pretreatment nomogram for prostate-specificantigen recurrence after radical prostatectomy or external-beamradiation therapy for clinically localized prostate cancer. J ClinOncol 1999;17:168–72.
2. Kattan MW, Eastham JA, Stapleton AM, Wheeler TM, Scardino PT.A preoperative nomogram for disease recurrence following radical
Clinical Chemistry 53, No. 2, 2007 239
prostatectomy for prostate cancer. J Natl Cancer Inst 1998;90:766–71.
3. Partin AW, Kattan MW, Subong EN, Walsh PC, Wojno KJ, Oester-ling JE, et al. Combination of prostate-specific antigen, clinicalstage, and Gleason score to predict pathological stage of localizedprostate cancer: a multi-institutional update. JAMA 1997;277:1445–51.
4. Stamey TA, Johnstone IM, McNeal JE, Lu AY, Yemoto CM. Preop-erative serum prostate specific antigen levels between 2 and 22ng./ml. correlate poorly with post-radical prostatectomy cancermorphology: prostate specific antigen cure rates appear constantbetween 2 and 9 ng./ml. J Urol 2002;167:103–11.
5. Stamey TA, Caldwell M, McNeal JE, Nolley R, Hemenez M, DownsJ. The prostate specific antigen era in the United States is over forprostate cancer: what happened in the last 20 years? J Urol2004;172:1297–301.
6. Freedland SJ, Aronson WJ, Kane CJ, Terris MK, Presti JC Jr, TrockB, et al. Biochemical outcome after radical prostatectomy amongmen with normal preoperative serum prostate-specific antigenlevels. Cancer 2004;101:748–53.
7. Rittenhouse HG, Finlay JA, Mikolajczyk SD, Partin AW. Humankallikrein 2 (hK2) and prostate-specific antigen (PSA): two closelyrelated, but distinct, kallikreins in the prostate. Crit Rev Clin LabSci 1998;35:275–368.
8. Darson MF, Pacelli A, Roche P, Rittenhouse HG, Wolfert RL, SaeidMS, et al. Human glandular kallikrein 2 expression in prostateadenocarcinoma and lymph node metastases. Urology 1999;53:939–44.
9. Herrala AM, Porvari KS, Kyllonen AP, Vihko PT. Comparison ofhuman prostate specific glandular kallikrein 2 and prostate spe-cific antigen gene expression in prostate with gene amplificationand overexpression of prostate specific glandular kallikrein 2 intumor tissue. Cancer 2001;92:2975–84.
10. Lintula S, Stenman J, Bjartell A, Nordling S, Stenman UH. Relativeconcentrations of hK2/PSA mRNA in benign and malignant pros-tatic tissue. Prostate 2005;63:324–9.
11. Lilja H, Abrahamsson PA. Three predominant proteins secreted bythe human prostate gland. Prostate 1988;12:29–38.
12. Haese A, Graefen M, Becker C, Noldus J, Katz J, Cagiannos I,et al. The role of human glandular kallikrein 2 for prediction ofpathologically organ confined prostate cancer. Prostate 2003;54:181–6.
13. Steuber T, Niemela P, Haese A, Pettersson K, Erbersdobler A,Felix Chun KH, et al. Association of free-prostate specific antigensubfractions and human glandular kallikrein 2 with volume ofbenign and malignant prostatic tissue. Prostate 2005;63:13–8.
14. Steuber T, Vickers AJ, Haese A, Becker C, Pettersson K, Chun FK,et al. Risk assessment for biochemical recurrence prior to radicalprostatectomy: significant enhancement contributed by humanglandular kallikrein 2 (hK2) and free prostate specific antigen(PSA) in men with moderate PSA-elevation in serum. Int J Cancer2006;118:1234–40.
15. D’Amico AV, Whittington R, Malkowicz SB, Schultz D, Schnall M,Tomaszewski JE, et al. A multivariate analysis of clinical andpathological factors that predict for prostate specific antigenfailure after radical prostatectomy for prostate cancer. J Urol1995;154:131–8.
16. Epstein JI, Partin AW, Potter SR, Walsh PC. Adenocarcinoma of theprostate invading the seminal vesicle: prognostic stratificationbased on pathologic parameters. Urology 2000;56:283–8.
17. Hull GW, Rabbani F, Abbas F, Wheeler TM, Kattan MW, ScardinoPT. Cancer control with radical prostatectomy alone in 1,000consecutive patients. J Urol 2002;167:528–34.
18. Pound CR, Partin AW, Eisenberger MA, Chan DW, Pearson JD,Walsh PC. Natural history of progression after PSA elevationfollowing radical prostatectomy. JAMA 1999;281:1591–7.
19. McNeal JE, Redwine EA, Freiha FS, Stamey TA. Zonal distributionof prostatic adenocarcinoma: correlation with histologic patternand direction of spread. Am J Surg Pathol 1988;12:897–906.
20. Gleason DF. Histologic grading and clinical staging of prostatecarcinoma. In: Tannenbaum M, ed. Urologic Pathology: The Pros-tate. Philadelphia, PA: Lea and Febiger, 1977:171–97.
21. Fleming ID, Cooper JS, Murphy GP, Sullivan BO, Sobin LH, YarbroJW, et al., eds. AJCC Cancer Staging Manual, 5th ed. Philadelphia,PA: Lippincott-Raven, 1997:219–22.
22. Amling CL, Bergstralh EJ, Blute ML, Slezak JM, Zincke H. Definingprostate specific antigen progression after radical prostatectomy:what is the most appropriate cut point? J Urol 2001;165:1146–51.
23. Mitrunen K, Pettersson K, Piironen T, Bjork T, Lilja H, Lovgren T.Dual-label one-step immunoassay for simultaneous measurementof free and total prostate-specific antigen concentrations andratios in serum. Clin Chem 1995;41:1115–20.
24. Vaisanen V, Eriksson S, Ivaska KK, Lilja H, Nurmi M, Pettersson K.Development of sensitive immunoassays for free and total humanglandular kallikrein 2. Clin Chem 2004;50:1607–17.
25. Harrell FEJ. Regression Modeling Strategies: With Applications toLinear Models, Logistic Regression, and Survival Analysis. NewYork: Springer, 2001:568pp.
26. Noldus J, Graefen M, Haese A, Henke RP, Hammerer P, Huland H.Stage migration in clinically localized prostate cancer. Eur Urol2000;38:74–8.
27. Ylikoski A, Karp M, Pettersson K, Lilja H, Lovgren T. Simultaneousquantification of human glandular kallikrein 2 and prostate-spe-cific antigen mRNAs in peripheral blood from prostate cancerpatients. J Mol Diagn 2001;3:111–22.
28. Becker C, Piironen T, Kiviniemi J, Lilja H, Pettersson K. Sensitiveand specific immunodetection of human glandular kallikrein 2 inserum. Clin Chem 2000;46:198–206.
29. Shariat SF, Abdel-Aziz KF, Roehrborn CG, Lotan Y. Pre-operativepercent free PSA predicts clinical outcomes in patients treatedwith radical prostatectomy with total PSA levels below 10 ng/ml.Eur Urol 2006;49:293–302.
30. Shariat SF, Kattan MW, Traxel E, Andrews B, Zhu K, Wheeler TM,et al. Association of pre- and postoperative plasma levels oftransforming growth factor �(1) and interleukin 6 and its solublereceptor with prostate cancer progression. Clin Cancer Res 2004;10:1992–9.
31. Piironen T, Haese A, Huland H, Steuber T, Christensen IJ, BrunnerN, et al. Enhanced discrimination of benign from malignantprostatic disease by selective measurements of cleaved forms ofurokinase receptor in serum. Clin Chem 2006;52:838–44.
32. Piironen T, Laursen B, Pass J, List K, Gardsvoll H, Ploug M, et al.Specific immunoassays for detection of intact and cleaved formsof the urokinase receptor. Clin Chem 2004;50:2059–68.
33. Ulmert D, Becker C, Nilsson JA, Piironen T, Bjork T, Hugosson J,et al. Reproducibility and accuracy of measurements of free andtotal prostate-specific antigen in serum vs plasma after long-termstorage at �20 degrees C. Clin Chem 2006;52:235–9.
240 Steuber et al.: hK2 and PSA in Prostate Cancer Prediction
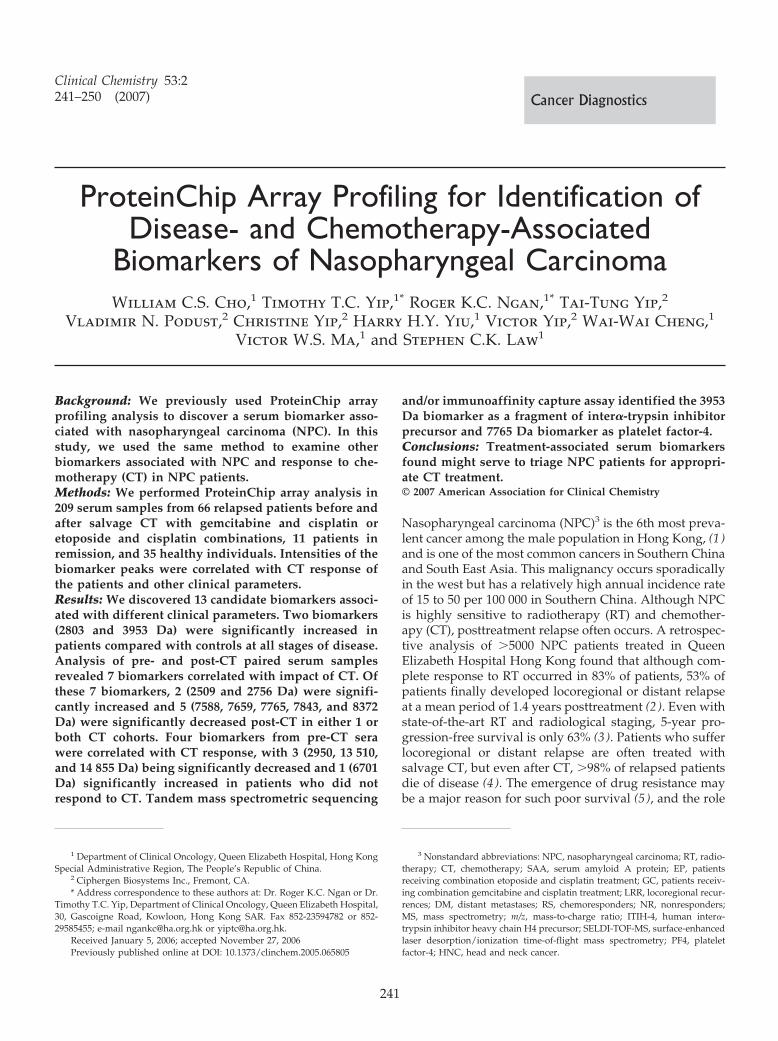
ProteinChip Array Profiling for Identification ofDisease- and Chemotherapy-Associated
Biomarkers of Nasopharyngeal CarcinomaWilliam C.S. Cho,1 Timothy T.C. Yip,1* Roger K.C. Ngan,1* Tai-Tung Yip,2
Vladimir N. Podust,2 Christine Yip,2 Harry H.Y. Yiu,1 Victor Yip,2 Wai-Wai Cheng,1
Victor W.S. Ma,1 and Stephen C.K. Law1
Background: We previously used ProteinChip arrayprofiling analysis to discover a serum biomarker asso-ciated with nasopharyngeal carcinoma (NPC). In thisstudy, we used the same method to examine otherbiomarkers associated with NPC and response to che-motherapy (CT) in NPC patients.Methods: We performed ProteinChip array analysis in209 serum samples from 66 relapsed patients before andafter salvage CT with gemcitabine and cisplatin oretoposide and cisplatin combinations, 11 patients inremission, and 35 healthy individuals. Intensities of thebiomarker peaks were correlated with CT response ofthe patients and other clinical parameters.Results: We discovered 13 candidate biomarkers associ-ated with different clinical parameters. Two biomarkers(2803 and 3953 Da) were significantly increased inpatients compared with controls at all stages of disease.Analysis of pre- and post-CT paired serum samplesrevealed 7 biomarkers correlated with impact of CT. Ofthese 7 biomarkers, 2 (2509 and 2756 Da) were signifi-cantly increased and 5 (7588, 7659, 7765, 7843, and 8372Da) were significantly decreased post-CT in either 1 orboth CT cohorts. Four biomarkers from pre-CT serawere correlated with CT response, with 3 (2950, 13 510,and 14 855 Da) being significantly decreased and 1 (6701Da) significantly increased in patients who did notrespond to CT. Tandem mass spectrometric sequencing
and/or immunoaffinity capture assay identified the 3953Da biomarker as a fragment of inter�-trypsin inhibitorprecursor and 7765 Da biomarker as platelet factor-4.Conclusions: Treatment-associated serum biomarkersfound might serve to triage NPC patients for appropri-ate CT treatment.© 2007 American Association for Clinical Chemistry
Nasopharyngeal carcinoma (NPC)3 is the 6th most preva-lent cancer among the male population in Hong Kong, (1 )and is one of the most common cancers in Southern Chinaand South East Asia. This malignancy occurs sporadicallyin the west but has a relatively high annual incidence rateof 15 to 50 per 100 000 in Southern China. Although NPCis highly sensitive to radiotherapy (RT) and chemother-apy (CT), posttreatment relapse often occurs. A retrospec-tive analysis of �5000 NPC patients treated in QueenElizabeth Hospital Hong Kong found that although com-plete response to RT occurred in 83% of patients, 53% ofpatients finally developed locoregional or distant relapseat a mean period of 1.4 years posttreatment (2 ). Even withstate-of-the-art RT and radiological staging, 5-year pro-gression-free survival is only 63% (3 ). Patients who sufferlocoregional or distant relapse are often treated withsalvage CT, but even after CT, �98% of relapsed patientsdie of disease (4 ). The emergence of drug resistance maybe a major reason for such poor survival (5 ), and the role
1 Department of Clinical Oncology, Queen Elizabeth Hospital, Hong KongSpecial Administrative Region, The People’s Republic of China.
2 Ciphergen Biosystems Inc., Fremont, CA.* Address correspondence to these authors at: Dr. Roger K.C. Ngan or Dr.
Timothy T.C. Yip, Department of Clinical Oncology, Queen Elizabeth Hospital,30, Gascoigne Road, Kowloon, Hong Kong SAR. Fax 852-23594782 or 852-29585455; e-mail [email protected] or [email protected].
Received January 5, 2006; accepted November 27, 2006Previously published online at DOI: 10.1373/clinchem.2005.065805
3 Nonstandard abbreviations: NPC, nasopharyngeal carcinoma; RT, radio-therapy; CT, chemotherapy; SAA, serum amyloid A protein; EP, patientsreceiving combination etoposide and cisplatin treatment; GC, patients receiv-ing combination gemcitabine and cisplatin treatment; LRR, locoregional recur-rences; DM, distant metastases; RS, chemoresponders; NR, nonresponders;MS, mass spectrometry; m/z, mass-to-charge ratio; ITIH-4, human inter�-trypsin inhibitor heavy chain H4 precursor; SELDI-TOF-MS, surface-enhancedlaser desorption/ionization time-of-flight mass spectrometry; PF4, plateletfactor-4; HNC, head and neck cancer.
Clinical Chemistry 53:2241–250 (2007) Cancer Diagnostics
241
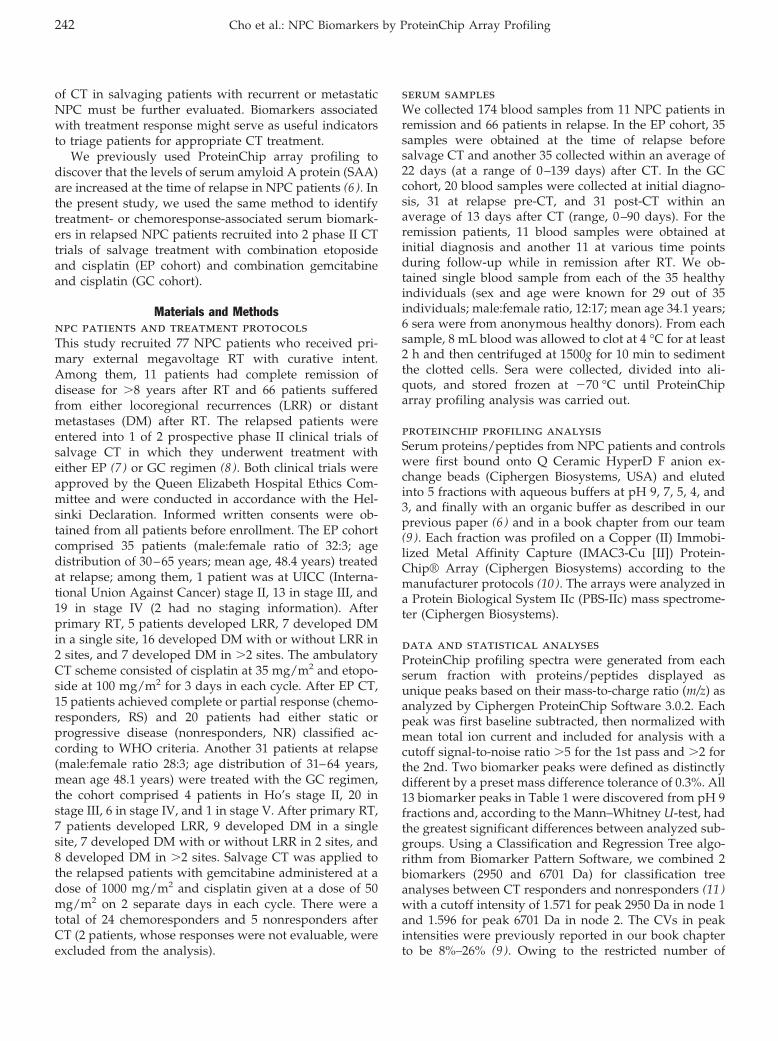
of CT in salvaging patients with recurrent or metastaticNPC must be further evaluated. Biomarkers associatedwith treatment response might serve as useful indicatorsto triage patients for appropriate CT treatment.
We previously used ProteinChip array profiling todiscover that the levels of serum amyloid A protein (SAA)are increased at the time of relapse in NPC patients (6 ). Inthe present study, we used the same method to identifytreatment- or chemoresponse-associated serum biomark-ers in relapsed NPC patients recruited into 2 phase II CTtrials of salvage treatment with combination etoposideand cisplatin (EP cohort) and combination gemcitabineand cisplatin (GC cohort).
Materials and Methodsnpc patients and treatment protocolsThis study recruited 77 NPC patients who received pri-mary external megavoltage RT with curative intent.Among them, 11 patients had complete remission ofdisease for �8 years after RT and 66 patients sufferedfrom either locoregional recurrences (LRR) or distantmetastases (DM) after RT. The relapsed patients wereentered into 1 of 2 prospective phase II clinical trials ofsalvage CT in which they underwent treatment witheither EP (7 ) or GC regimen (8 ). Both clinical trials wereapproved by the Queen Elizabeth Hospital Ethics Com-mittee and were conducted in accordance with the Hel-sinki Declaration. Informed written consents were ob-tained from all patients before enrollment. The EP cohortcomprised 35 patients (male:female ratio of 32:3; agedistribution of 30–65 years; mean age, 48.4 years) treatedat relapse; among them, 1 patient was at UICC (Interna-tional Union Against Cancer) stage II, 13 in stage III, and19 in stage IV (2 had no staging information). Afterprimary RT, 5 patients developed LRR, 7 developed DMin a single site, 16 developed DM with or without LRR in2 sites, and 7 developed DM in �2 sites. The ambulatoryCT scheme consisted of cisplatin at 35 mg/m2 and etopo-side at 100 mg/m2 for 3 days in each cycle. After EP CT,15 patients achieved complete or partial response (chemo-responders, RS) and 20 patients had either static orprogressive disease (nonresponders, NR) classified ac-cording to WHO criteria. Another 31 patients at relapse(male:female ratio 28:3; age distribution of 31–64 years,mean age 48.1 years) were treated with the GC regimen,the cohort comprised 4 patients in Ho’s stage II, 20 instage III, 6 in stage IV, and 1 in stage V. After primary RT,7 patients developed LRR, 9 developed DM in a singlesite, 7 developed DM with or without LRR in 2 sites, and8 developed DM in �2 sites. Salvage CT was applied tothe relapsed patients with gemcitabine administered at adose of 1000 mg/m2 and cisplatin given at a dose of 50mg/m2 on 2 separate days in each cycle. There were atotal of 24 chemoresponders and 5 nonresponders afterCT (2 patients, whose responses were not evaluable, wereexcluded from the analysis).
serum samplesWe collected 174 blood samples from 11 NPC patients inremission and 66 patients in relapse. In the EP cohort, 35samples were obtained at the time of relapse beforesalvage CT and another 35 collected within an average of22 days (at a range of 0–139 days) after CT. In the GCcohort, 20 blood samples were collected at initial diagno-sis, 31 at relapse pre-CT, and 31 post-CT within anaverage of 13 days after CT (range, 0–90 days). For theremission patients, 11 blood samples were obtained atinitial diagnosis and another 11 at various time pointsduring follow-up while in remission after RT. We ob-tained single blood sample from each of the 35 healthyindividuals (sex and age were known for 29 out of 35individuals; male:female ratio, 12:17; mean age 34.1 years;6 sera were from anonymous healthy donors). From eachsample, 8 mL blood was allowed to clot at 4 °C for at least2 h and then centrifuged at 1500g for 10 min to sedimentthe clotted cells. Sera were collected, divided into ali-quots, and stored frozen at �70 °C until ProteinChiparray profiling analysis was carried out.
proteinchip profiling analysisSerum proteins/peptides from NPC patients and controlswere first bound onto Q Ceramic HyperD F anion ex-change beads (Ciphergen Biosystems, USA) and elutedinto 5 fractions with aqueous buffers at pH 9, 7, 5, 4, and3, and finally with an organic buffer as described in ourprevious paper (6 ) and in a book chapter from our team(9 ). Each fraction was profiled on a Copper (II) Immobi-lized Metal Affinity Capture (IMAC3-Cu [II]) Protein-Chip® Array (Ciphergen Biosystems) according to themanufacturer protocols (10 ). The arrays were analyzed ina Protein Biological System IIc (PBS-IIc) mass spectrome-ter (Ciphergen Biosystems).
data and statistical analysesProteinChip profiling spectra were generated from eachserum fraction with proteins/peptides displayed asunique peaks based on their mass-to-charge ratio (m/z) asanalyzed by Ciphergen ProteinChip Software 3.0.2. Eachpeak was first baseline subtracted, then normalized withmean total ion current and included for analysis with acutoff signal-to-noise ratio �5 for the 1st pass and �2 forthe 2nd. Two biomarker peaks were defined as distinctlydifferent by a preset mass difference tolerance of 0.3%. All13 biomarker peaks in Table 1 were discovered from pH 9fractions and, according to the Mann–Whitney U-test, hadthe greatest significant differences between analyzed sub-groups. Using a Classification and Regression Tree algo-rithm from Biomarker Pattern Software, we combined 2biomarkers (2950 and 6701 Da) for classification treeanalyses between CT responders and nonresponders (11 )with a cutoff intensity of 1.571 for peak 2950 Da in node 1and 1.596 for peak 6701 Da in node 2. The CVs in peakintensities were previously reported in our book chapterto be 8%–26% (9 ). Owing to the restricted number of
242 Cho et al.: NPC Biomarkers by ProteinChip Array Profiling
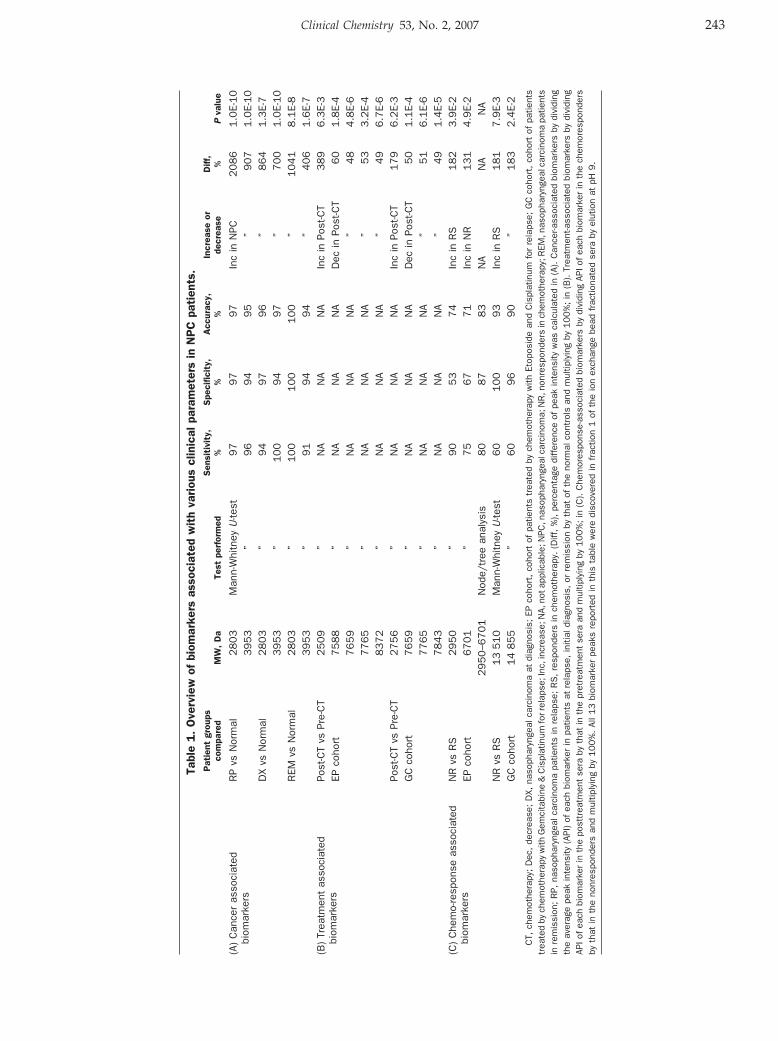
Tabl
e1.
Ove
rvie
wof
biom
arke
rsas
soci
ated
wit
hva
riou
scl
inic
alpa
ram
eter
sin
NP
Cpa
tien
ts.
Pat
ient
grou
psco
mpa
red
MW
,D
aTe
stpe
rfor
med
Sen
siti
vity
,%
Spe
cific
ity,
%A
ccur
acy,
%In
crea
seor
decr
ease
Diff
,%
Pva
lue
(A)
Can
cer
asso
ciat
edbi
omar
kers
RP
vsN
orm
al2803
Man
n-W
hitn
eyU
-test
97
97
97
Inc
inN
PC2086
1.0
E-10
3953
”96
94
95
”907
1.0
E-10
DX
vsN
orm
al2803
”94
97
96
”864
1.3
E-7
3953
”100
94
97
”700
1.0
E-10
REM
vsN
orm
al2803
”100
100
100
”1041
8.1
E-8
3953
”91
94
94
”406
1.6
E-7
(B)
Trea
tmen
tas
soci
ated
biom
arke
rsPo
st-C
Tvs
Pre-
CT
2509
”N
AN
AN
AIn
cin
Post
-CT
389
6.3
E-3
EPco
hort
7588
”N
AN
AN
AD
ecin
Post
-CT
60
1.8
E-4
7659
”N
AN
AN
A”
48
4.8
E-6
7765
”N
AN
AN
A”
53
3.2
E-4
8372
”N
AN
AN
A”
49
6.7
E-6
Post
-CT
vsPr
e-C
T2756
”N
AN
AN
AIn
cin
Post
-CT
179
6.2
E-3
GC
coho
rt7659
”N
AN
AN
AD
ecin
Post
-CT
50
1.1
E-4
7765
”N
AN
AN
A”
51
6.1
E-6
7843
”N
AN
AN
A”
49
1.4
E-5
(C)
Che
mo-
resp
onse
asso
ciat
edbi
omar
kers
NR
vsR
S2950
”90
53
74
Inc
inR
S182
3.9
E-2
EPco
hort
6701
”75
67
71
Inc
inN
R131
4.9
E-2
2950–6
701
Nod
e/tr
eean
alys
is80
87
83
NA
NA
NA
NR
vsR
S13
510
Man
n-W
hitn
eyU
-test
60
100
93
Inc
inR
S181
7.9
E-3
GC
coho
rt14
855
”60
96
90
”183
2.4
E-2
CT,
chem
othe
rapy
;D
ec,
decr
ease
;D
X,na
soph
aryn
geal
carc
inom
aat
diag
nosi
s;EP
coho
rt,
coho
rtof
patie
nts
trea
ted
bych
emot
hera
pyw
ithEt
opos
ide
and
Cis
plat
inum
for
rela
pse;
GC
coho
rt,
coho
rtof
patie
nts
trea
ted
bych
emot
hera
pyw
ithG
emci
tabi
ne&
Cis
plat
inum
forr
elap
se;I
nc,i
ncre
ase;
NA,
nota
pplic
able
;NPC
,nas
opha
ryng
ealc
arci
nom
a;N
R,n
onre
spon
ders
inch
emot
hera
py;R
EM,n
asop
hary
ngea
lcar
cino
ma
patie
nts
inre
mis
sion
;R
P,na
soph
aryn
geal
carc
inom
apa
tient
sin
rela
pse;
RS
,re
spon
ders
inch
emot
hera
py.
(Diff
,%
),pe
rcen
tage
diff
eren
ceof
peak
inte
nsity
was
calc
ulat
edin
(A).
Can
cer-a
ssoc
iate
dbi
omar
kers
bydi
vidi
ngth
eav
erag
epe
akin
tens
ity(A
PI)
ofea
chbi
omar
ker
inpa
tient
sat
rela
pse,
initi
aldi
agno
sis,
orre
mis
sion
byth
atof
the
norm
alco
ntro
lsan
dm
ultip
lyin
gby
10
0%
;in
(B).
Trea
tmen
t-ass
ocia
ted
biom
arke
rsby
divi
ding
APIo
fea
chbi
omar
ker
inth
epo
sttr
eatm
ent
sera
byth
atin
the
pret
reat
men
tse
raan
dm
ultip
lyin
gby
10
0%
;in
(C).
Che
mor
espo
nse-
asso
ciat
edbi
omar
kers
bydi
vidi
ngAP
Iof
each
biom
arke
rin
the
chem
ores
pond
ers
byth
atin
the
nonr
espo
nder
san
dm
ultip
lyin
gby
100%
.Al
l13
biom
arke
rpe
aks
repo
rted
inth
ista
ble
wer
edi
scov
ered
infr
actio
n1
ofth
eio
nex
chan
gebe
adfr
actio
nate
dse
raby
elut
ion
atpH
9.
Clinical Chemistry 53, No. 2, 2007 243
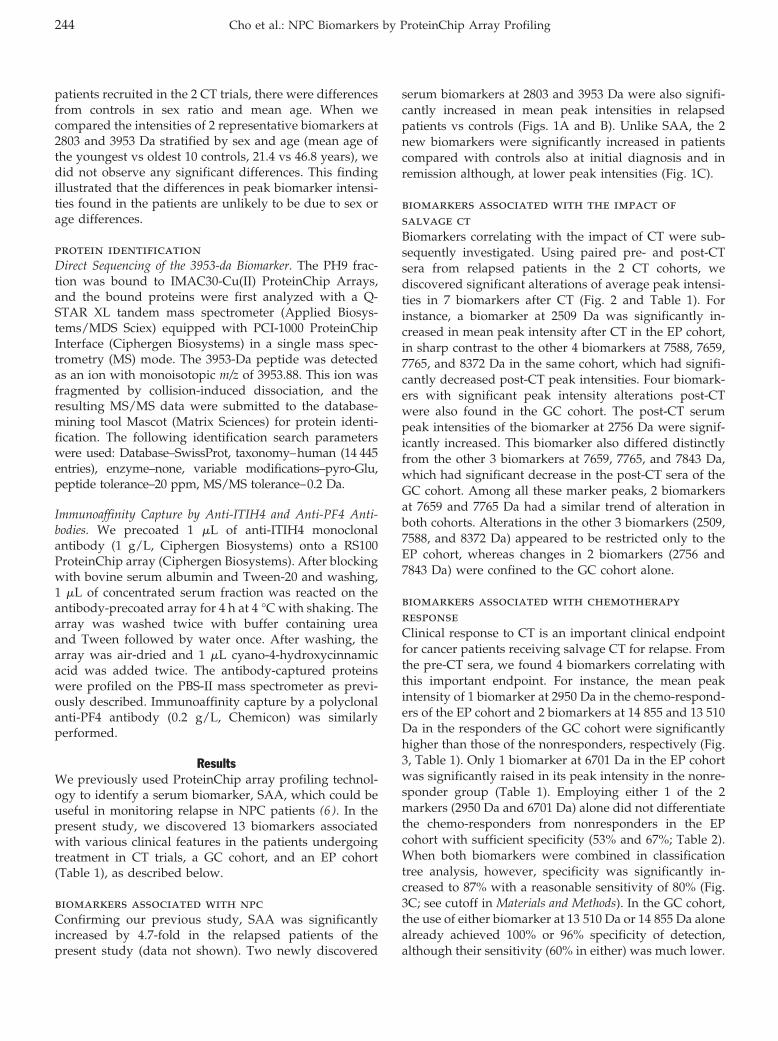
patients recruited in the 2 CT trials, there were differencesfrom controls in sex ratio and mean age. When wecompared the intensities of 2 representative biomarkers at2803 and 3953 Da stratified by sex and age (mean age ofthe youngest vs oldest 10 controls, 21.4 vs 46.8 years), wedid not observe any significant differences. This findingillustrated that the differences in peak biomarker intensi-ties found in the patients are unlikely to be due to sex orage differences.
protein identificationDirect Sequencing of the 3953-da Biomarker. The PH9 frac-tion was bound to IMAC30-Cu(II) ProteinChip Arrays,and the bound proteins were first analyzed with a Q-STAR XL tandem mass spectrometer (Applied Biosys-tems/MDS Sciex) equipped with PCI-1000 ProteinChipInterface (Ciphergen Biosystems) in a single mass spec-trometry (MS) mode. The 3953-Da peptide was detectedas an ion with monoisotopic m/z of 3953.88. This ion wasfragmented by collision-induced dissociation, and theresulting MS/MS data were submitted to the database-mining tool Mascot (Matrix Sciences) for protein identi-fication. The following identification search parameterswere used: Database–SwissProt, taxonomy–human (14 445entries), enzyme–none, variable modifications–pyro-Glu,peptide tolerance–20 ppm, MS/MS tolerance–0.2 Da.
Immunoaffinity Capture by Anti-ITIH4 and Anti-PF4 Anti-bodies. We precoated 1 �L of anti-ITIH4 monoclonalantibody (1 g/L, Ciphergen Biosystems) onto a RS100ProteinChip array (Ciphergen Biosystems). After blockingwith bovine serum albumin and Tween-20 and washing,1 �L of concentrated serum fraction was reacted on theantibody-precoated array for 4 h at 4 °C with shaking. Thearray was washed twice with buffer containing ureaand Tween followed by water once. After washing, thearray was air-dried and 1 �L cyano-4-hydroxycinnamicacid was added twice. The antibody-captured proteinswere profiled on the PBS-II mass spectrometer as previ-ously described. Immunoaffinity capture by a polyclonalanti-PF4 antibody (0.2 g/L, Chemicon) was similarlyperformed.
ResultsWe previously used ProteinChip array profiling technol-ogy to identify a serum biomarker, SAA, which could beuseful in monitoring relapse in NPC patients (6 ). In thepresent study, we discovered 13 biomarkers associatedwith various clinical features in the patients undergoingtreatment in CT trials, a GC cohort, and an EP cohort(Table 1), as described below.
biomarkers associated with npcConfirming our previous study, SAA was significantlyincreased by 4.7-fold in the relapsed patients of thepresent study (data not shown). Two newly discovered
serum biomarkers at 2803 and 3953 Da were also signifi-cantly increased in mean peak intensities in relapsedpatients vs controls (Figs. 1A and B). Unlike SAA, the 2new biomarkers were significantly increased in patientscompared with controls also at initial diagnosis and inremission although, at lower peak intensities (Fig. 1C).
biomarkers associated with the impact ofsalvage ctBiomarkers correlating with the impact of CT were sub-sequently investigated. Using paired pre- and post-CTsera from relapsed patients in the 2 CT cohorts, wediscovered significant alterations of average peak intensi-ties in 7 biomarkers after CT (Fig. 2 and Table 1). Forinstance, a biomarker at 2509 Da was significantly in-creased in mean peak intensity after CT in the EP cohort,in sharp contrast to the other 4 biomarkers at 7588, 7659,7765, and 8372 Da in the same cohort, which had signifi-cantly decreased post-CT peak intensities. Four biomark-ers with significant peak intensity alterations post-CTwere also found in the GC cohort. The post-CT serumpeak intensities of the biomarker at 2756 Da were signif-icantly increased. This biomarker also differed distinctlyfrom the other 3 biomarkers at 7659, 7765, and 7843 Da,which had significant decrease in the post-CT sera of theGC cohort. Among all these marker peaks, 2 biomarkersat 7659 and 7765 Da had a similar trend of alteration inboth cohorts. Alterations in the other 3 biomarkers (2509,7588, and 8372 Da) appeared to be restricted only to theEP cohort, whereas changes in 2 biomarkers (2756 and7843 Da) were confined to the GC cohort alone.
biomarkers associated with chemotherapyresponseClinical response to CT is an important clinical endpointfor cancer patients receiving salvage CT for relapse. Fromthe pre-CT sera, we found 4 biomarkers correlating withthis important endpoint. For instance, the mean peakintensity of 1 biomarker at 2950 Da in the chemo-respond-ers of the EP cohort and 2 biomarkers at 14 855 and 13 510Da in the responders of the GC cohort were significantlyhigher than those of the nonresponders, respectively (Fig.3, Table 1). Only 1 biomarker at 6701 Da in the EP cohortwas significantly raised in its peak intensity in the nonre-sponder group (Table 1). Employing either 1 of the 2markers (2950 Da and 6701 Da) alone did not differentiatethe chemo-responders from nonresponders in the EPcohort with sufficient specificity (53% and 67%; Table 2).When both biomarkers were combined in classificationtree analysis, however, specificity was significantly in-creased to 87% with a reasonable sensitivity of 80% (Fig.3C; see cutoff in Materials and Methods). In the GC cohort,the use of either biomarker at 13 510 Da or 14 855 Da alonealready achieved 100% or 96% specificity of detection,although their sensitivity (60% in either) was much lower.
244 Cho et al.: NPC Biomarkers by ProteinChip Array Profiling
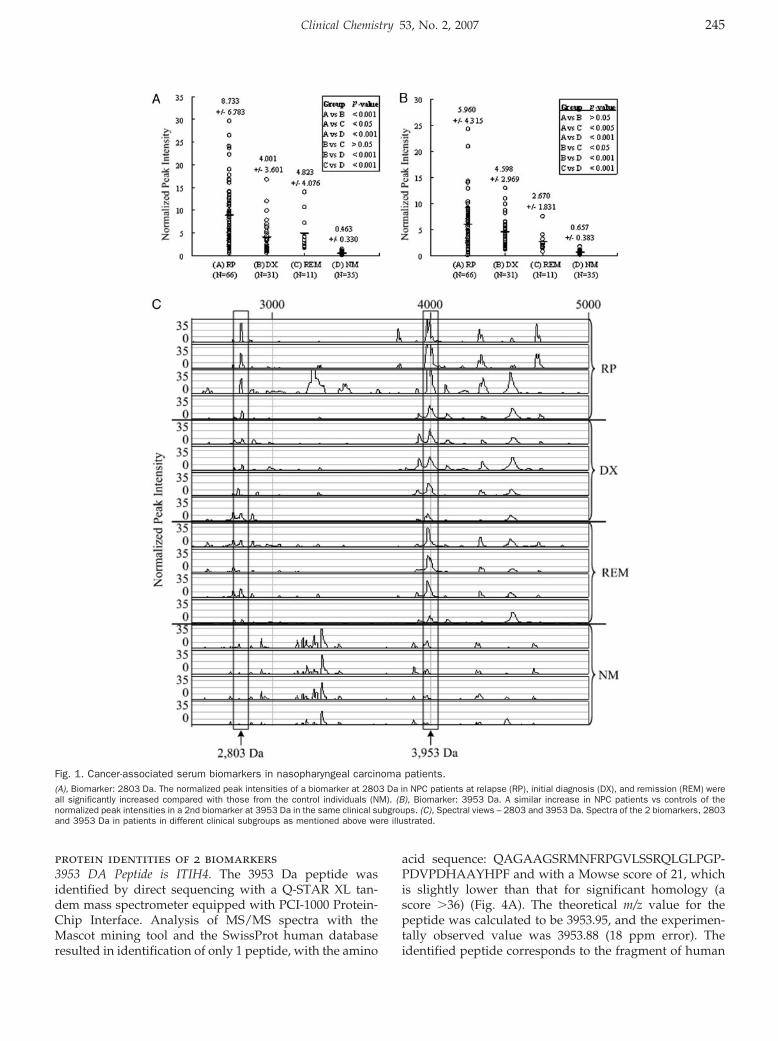
protein identities of 2 biomarkers3953 DA Peptide is ITIH4. The 3953 Da peptide wasidentified by direct sequencing with a Q-STAR XL tan-dem mass spectrometer equipped with PCI-1000 Protein-Chip Interface. Analysis of MS/MS spectra with theMascot mining tool and the SwissProt human databaseresulted in identification of only 1 peptide, with the amino
acid sequence: QAGAAGSRMNFRPGVLSSRQLGLPGP-PDVPDHAAYHPF and with a Mowse score of 21, whichis slightly lower than that for significant homology (ascore �36) (Fig. 4A). The theoretical m/z value for thepeptide was calculated to be 3953.95, and the experimen-tally observed value was 3953.88 (18 ppm error). Theidentified peptide corresponds to the fragment of human
Fig. 1. Cancer-associated serum biomarkers in nasopharyngeal carcinoma patients.(A), Biomarker: 2803 Da. The normalized peak intensities of a biomarker at 2803 Da in NPC patients at relapse (RP), initial diagnosis (DX), and remission (REM) wereall significantly increased compared with those from the control individuals (NM). (B), Biomarker: 3953 Da. A similar increase in NPC patients vs controls of thenormalized peak intensities in a 2nd biomarker at 3953 Da in the same clinical subgroups. (C), Spectral views – 2803 and 3953 Da. Spectra of the 2 biomarkers, 2803and 3953 Da in patients in different clinical subgroups as mentioned above were illustrated.
Clinical Chemistry 53, No. 2, 2007 245
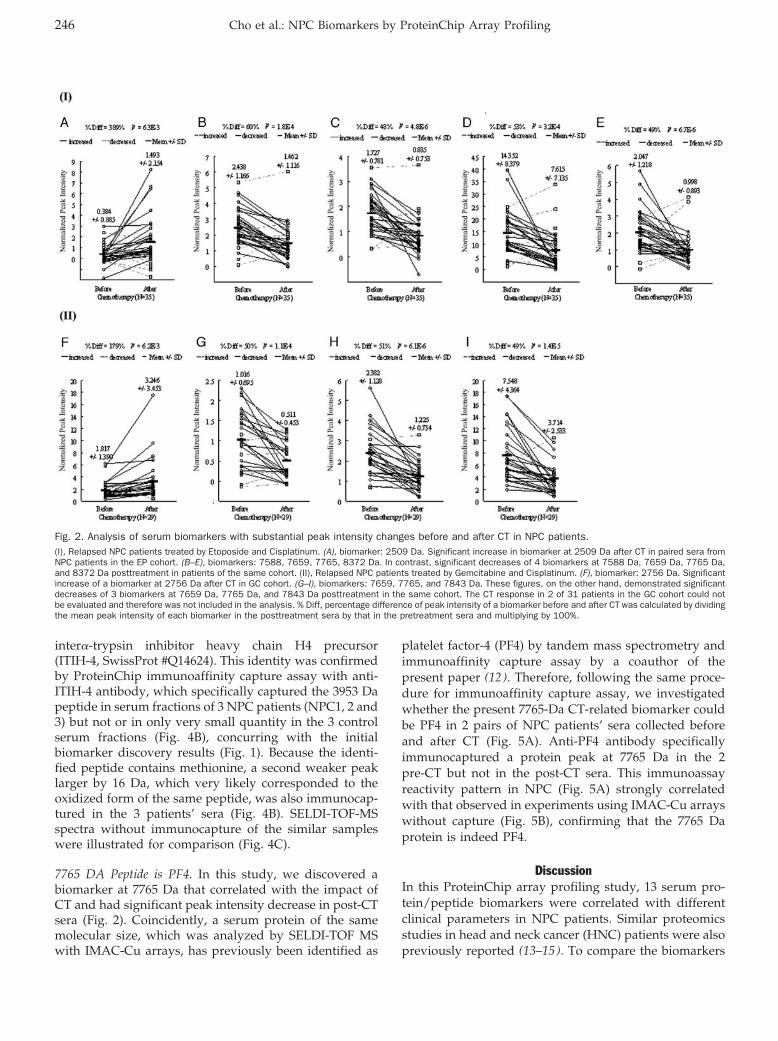
inter�-trypsin inhibitor heavy chain H4 precursor(ITIH-4, SwissProt #Q14624). This identity was confirmedby ProteinChip immunoaffinity capture assay with anti-ITIH-4 antibody, which specifically captured the 3953 Dapeptide in serum fractions of 3 NPC patients (NPC1, 2 and3) but not or in only very small quantity in the 3 controlserum fractions (Fig. 4B), concurring with the initialbiomarker discovery results (Fig. 1). Because the identi-fied peptide contains methionine, a second weaker peaklarger by 16 Da, which very likely corresponded to theoxidized form of the same peptide, was also immunocap-tured in the 3 patients’ sera (Fig. 4B). SELDI-TOF-MSspectra without immunocapture of the similar sampleswere illustrated for comparison (Fig. 4C).
7765 DA Peptide is PF4. In this study, we discovered abiomarker at 7765 Da that correlated with the impact ofCT and had significant peak intensity decrease in post-CTsera (Fig. 2). Coincidently, a serum protein of the samemolecular size, which was analyzed by SELDI-TOF MSwith IMAC-Cu arrays, has previously been identified as
platelet factor-4 (PF4) by tandem mass spectrometry andimmunoaffinity capture assay by a coauthor of thepresent paper (12 ). Therefore, following the same proce-dure for immunoaffinity capture assay, we investigatedwhether the present 7765-Da CT-related biomarker couldbe PF4 in 2 pairs of NPC patients’ sera collected beforeand after CT (Fig. 5A). Anti-PF4 antibody specificallyimmunocaptured a protein peak at 7765 Da in the 2pre-CT but not in the post-CT sera. This immunoassayreactivity pattern in NPC (Fig. 5A) strongly correlatedwith that observed in experiments using IMAC-Cu arrayswithout capture (Fig. 5B), confirming that the 7765 Daprotein is indeed PF4.
DiscussionIn this ProteinChip array profiling study, 13 serum pro-tein/peptide biomarkers were correlated with differentclinical parameters in NPC patients. Similar proteomicsstudies in head and neck cancer (HNC) patients were alsopreviously reported (13–15). To compare the biomarkers
Fig. 2. Analysis of serum biomarkers with substantial peak intensity changes before and after CT in NPC patients.(I), Relapsed NPC patients treated by Etoposide and Cisplatinum. (A), biomarker: 2509 Da. Significant increase in biomarker at 2509 Da after CT in paired sera fromNPC patients in the EP cohort. (B–E), biomarkers: 7588, 7659, 7765, 8372 Da. In contrast, significant decreases of 4 biomarkers at 7588 Da, 7659 Da, 7765 Da,and 8372 Da posttreatment in patients of the same cohort. (II), Relapsed NPC patients treated by Gemcitabine and Cisplatinum. (F), biomarker: 2756 Da. Significantincrease of a biomarker at 2756 Da after CT in GC cohort. (G–I), biomarkers: 7659, 7765, and 7843 Da. These figures, on the other hand, demonstrated significantdecreases of 3 biomarkers at 7659 Da, 7765 Da, and 7843 Da posttreatment in the same cohort. The CT response in 2 of 31 patients in the GC cohort could notbe evaluated and therefore was not included in the analysis. % Diff, percentage difference of peak intensity of a biomarker before and after CT was calculated by dividingthe mean peak intensity of each biomarker in the posttreatment sera by that in the pretreatment sera and multiplying by 100%.
246 Cho et al.: NPC Biomarkers by ProteinChip Array Profiling
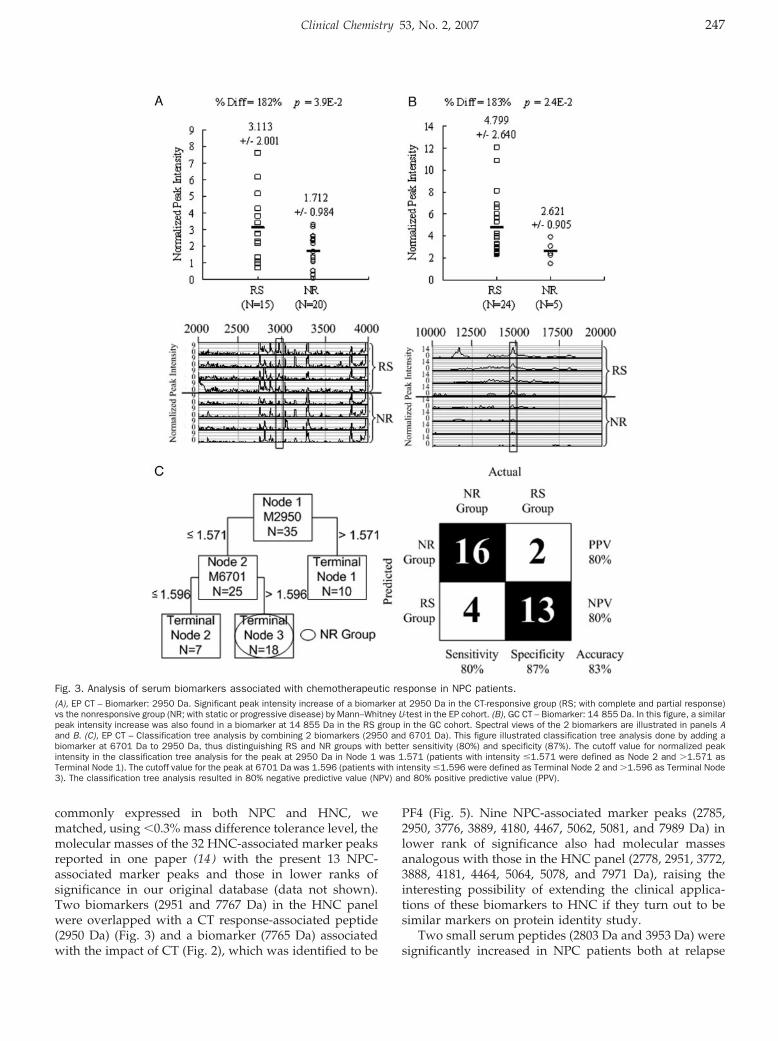
commonly expressed in both NPC and HNC, wematched, using �0.3% mass difference tolerance level, themolecular masses of the 32 HNC-associated marker peaksreported in one paper (14 ) with the present 13 NPC-associated marker peaks and those in lower ranks ofsignificance in our original database (data not shown).Two biomarkers (2951 and 7767 Da) in the HNC panelwere overlapped with a CT response-associated peptide(2950 Da) (Fig. 3) and a biomarker (7765 Da) associatedwith the impact of CT (Fig. 2), which was identified to be
PF4 (Fig. 5). Nine NPC-associated marker peaks (2785,2950, 3776, 3889, 4180, 4467, 5062, 5081, and 7989 Da) inlower rank of significance also had molecular massesanalogous with those in the HNC panel (2778, 2951, 3772,3888, 4181, 4464, 5064, 5078, and 7971 Da), raising theinteresting possibility of extending the clinical applica-tions of these biomarkers to HNC if they turn out to besimilar markers on protein identity study.
Two small serum peptides (2803 Da and 3953 Da) weresignificantly increased in NPC patients both at relapse
Fig. 3. Analysis of serum biomarkers associated with chemotherapeutic response in NPC patients.(A), EP CT – Biomarker: 2950 Da. Significant peak intensity increase of a biomarker at 2950 Da in the CT-responsive group (RS; with complete and partial response)vs the nonresponsive group (NR; with static or progressive disease) by Mann–Whitney U-test in the EP cohort. (B), GC CT – Biomarker: 14 855 Da. In this figure, a similarpeak intensity increase was also found in a biomarker at 14 855 Da in the RS group in the GC cohort. Spectral views of the 2 biomarkers are illustrated in panels Aand B. (C), EP CT – Classification tree analysis by combining 2 biomarkers (2950 and 6701 Da). This figure illustrated classification tree analysis done by adding abiomarker at 6701 Da to 2950 Da, thus distinguishing RS and NR groups with better sensitivity (80%) and specificity (87%). The cutoff value for normalized peakintensity in the classification tree analysis for the peak at 2950 Da in Node 1 was 1.571 (patients with intensity �1.571 were defined as Node 2 and �1.571 asTerminal Node 1). The cutoff value for the peak at 6701 Da was 1.596 (patients with intensity �1.596 were defined as Terminal Node 2 and �1.596 as Terminal Node3). The classification tree analysis resulted in 80% negative predictive value (NPV) and 80% positive predictive value (PPV).
Clinical Chemistry 53, No. 2, 2007 247
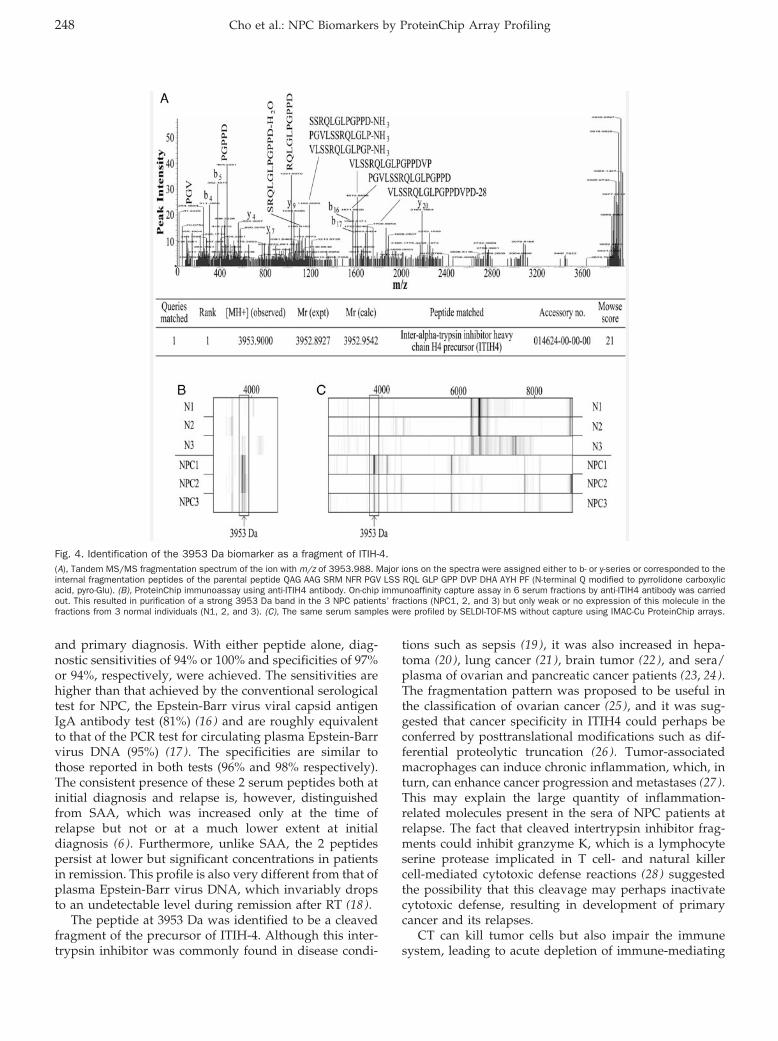
and primary diagnosis. With either peptide alone, diag-nostic sensitivities of 94% or 100% and specificities of 97%or 94%, respectively, were achieved. The sensitivities arehigher than that achieved by the conventional serologicaltest for NPC, the Epstein-Barr virus viral capsid antigenIgA antibody test (81%) (16 ) and are roughly equivalentto that of the PCR test for circulating plasma Epstein-Barrvirus DNA (95%) (17 ). The specificities are similar tothose reported in both tests (96% and 98% respectively).The consistent presence of these 2 serum peptides both atinitial diagnosis and relapse is, however, distinguishedfrom SAA, which was increased only at the time ofrelapse but not or at a much lower extent at initialdiagnosis (6 ). Furthermore, unlike SAA, the 2 peptidespersist at lower but significant concentrations in patientsin remission. This profile is also very different from that ofplasma Epstein-Barr virus DNA, which invariably dropsto an undetectable level during remission after RT (18 ).
The peptide at 3953 Da was identified to be a cleavedfragment of the precursor of ITIH-4. Although this inter-trypsin inhibitor was commonly found in disease condi-
tions such as sepsis (19 ), it was also increased in hepa-toma (20 ), lung cancer (21 ), brain tumor (22 ), and sera/plasma of ovarian and pancreatic cancer patients (23, 24).The fragmentation pattern was proposed to be useful inthe classification of ovarian cancer (25 ), and it was sug-gested that cancer specificity in ITIH4 could perhaps beconferred by posttranslational modifications such as dif-ferential proteolytic truncation (26 ). Tumor-associatedmacrophages can induce chronic inflammation, which, inturn, can enhance cancer progression and metastases (27 ).This may explain the large quantity of inflammation-related molecules present in the sera of NPC patients atrelapse. The fact that cleaved intertrypsin inhibitor frag-ments could inhibit granzyme K, which is a lymphocyteserine protease implicated in T cell- and natural killercell-mediated cytotoxic defense reactions (28 ) suggestedthe possibility that this cleavage may perhaps inactivatecytotoxic defense, resulting in development of primarycancer and its relapses.
CT can kill tumor cells but also impair the immunesystem, leading to acute depletion of immune-mediating
Fig. 4. Identification of the 3953 Da biomarker as a fragment of ITIH-4.(A), Tandem MS/MS fragmentation spectrum of the ion with m/z of 3953.988. Major ions on the spectra were assigned either to b- or y-series or corresponded to theinternal fragmentation peptides of the parental peptide QAG AAG SRM NFR PGV LSS RQL GLP GPP DVP DHA AYH PF (N-terminal Q modified to pyrrolidone carboxylicacid, pyro-Glu). (B), ProteinChip immunoassay using anti-ITIH4 antibody. On-chip immunoaffinity capture assay in 6 serum fractions by anti-ITIH4 antibody was carriedout. This resulted in purification of a strong 3953 Da band in the 3 NPC patients’ fractions (NPC1, 2, and 3) but only weak or no expression of this molecule in thefractions from 3 normal individuals (N1, 2, and 3). (C), The same serum samples were profiled by SELDI-TOF-MS without capture using IMAC-Cu ProteinChip arrays.
248 Cho et al.: NPC Biomarkers by ProteinChip Array Profiling
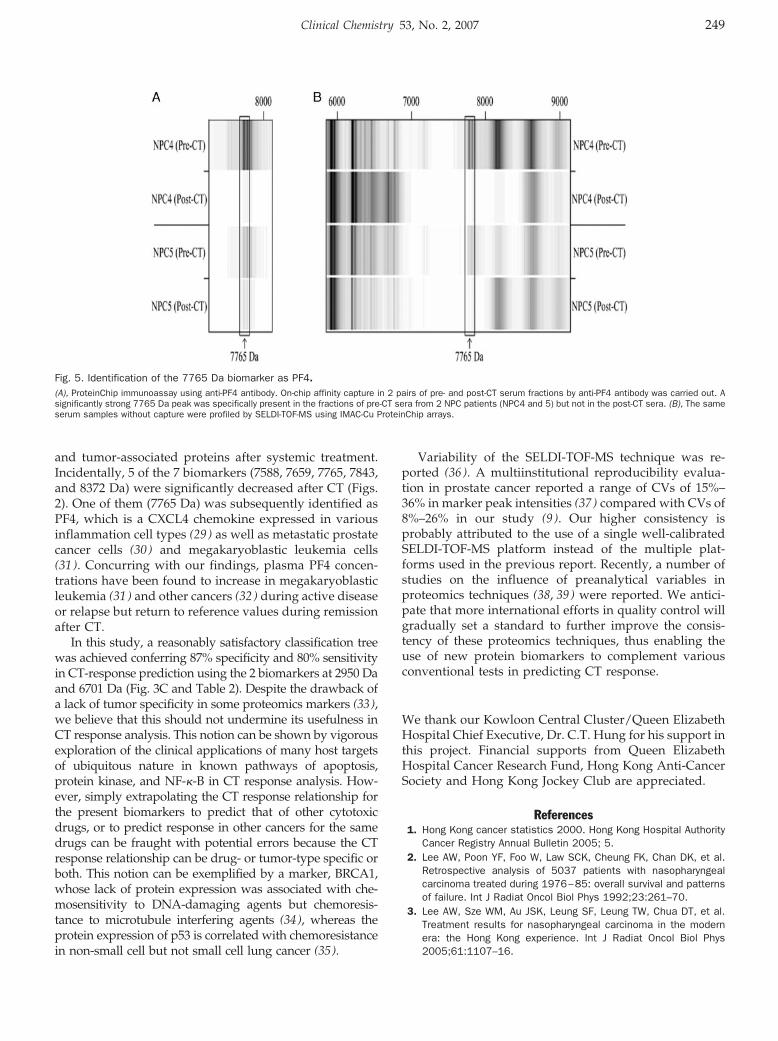
and tumor-associated proteins after systemic treatment.Incidentally, 5 of the 7 biomarkers (7588, 7659, 7765, 7843,and 8372 Da) were significantly decreased after CT (Figs.2). One of them (7765 Da) was subsequently identified asPF4, which is a CXCL4 chemokine expressed in variousinflammation cell types (29 ) as well as metastatic prostatecancer cells (30 ) and megakaryoblastic leukemia cells(31 ). Concurring with our findings, plasma PF4 concen-trations have been found to increase in megakaryoblasticleukemia (31 ) and other cancers (32 ) during active diseaseor relapse but return to reference values during remissionafter CT.
In this study, a reasonably satisfactory classification treewas achieved conferring 87% specificity and 80% sensitivityin CT-response prediction using the 2 biomarkers at 2950 Daand 6701 Da (Fig. 3C and Table 2). Despite the drawback ofa lack of tumor specificity in some proteomics markers (33),we believe that this should not undermine its usefulness inCT response analysis. This notion can be shown by vigorousexploration of the clinical applications of many host targetsof ubiquitous nature in known pathways of apoptosis,protein kinase, and NF-�-B in CT response analysis. How-ever, simply extrapolating the CT response relationship forthe present biomarkers to predict that of other cytotoxicdrugs, or to predict response in other cancers for the samedrugs can be fraught with potential errors because the CTresponse relationship can be drug- or tumor-type specific orboth. This notion can be exemplified by a marker, BRCA1,whose lack of protein expression was associated with che-mosensitivity to DNA-damaging agents but chemoresis-tance to microtubule interfering agents (34), whereas theprotein expression of p53 is correlated with chemoresistancein non-small cell but not small cell lung cancer (35).
Variability of the SELDI-TOF-MS technique was re-ported (36 ). A multiinstitutional reproducibility evalua-tion in prostate cancer reported a range of CVs of 15%–36% in marker peak intensities (37 ) compared with CVs of8%–26% in our study (9 ). Our higher consistency isprobably attributed to the use of a single well-calibratedSELDI-TOF-MS platform instead of the multiple plat-forms used in the previous report. Recently, a number ofstudies on the influence of preanalytical variables inproteomics techniques (38, 39) were reported. We antici-pate that more international efforts in quality control willgradually set a standard to further improve the consis-tency of these proteomics techniques, thus enabling theuse of new protein biomarkers to complement variousconventional tests in predicting CT response.
We thank our Kowloon Central Cluster/Queen ElizabethHospital Chief Executive, Dr. C.T. Hung for his support inthis project. Financial supports from Queen ElizabethHospital Cancer Research Fund, Hong Kong Anti-CancerSociety and Hong Kong Jockey Club are appreciated.
References1. Hong Kong cancer statistics 2000. Hong Kong Hospital Authority
Cancer Registry Annual Bulletin 2005; 5.2. Lee AW, Poon YF, Foo W, Law SCK, Cheung FK, Chan DK, et al.
Retrospective analysis of 5037 patients with nasopharyngealcarcinoma treated during 1976–85: overall survival and patternsof failure. Int J Radiat Oncol Biol Phys 1992;23:261–70.
3. Lee AW, Sze WM, Au JSK, Leung SF, Leung TW, Chua DT, et al.Treatment results for nasopharyngeal carcinoma in the modernera: the Hong Kong experience. Int J Radiat Oncol Biol Phys2005;61:1107–16.
Fig. 5. Identification of the 7765 Da biomarker as PF4.(A), ProteinChip immunoassay using anti-PF4 antibody. On-chip affinity capture in 2 pairs of pre- and post-CT serum fractions by anti-PF4 antibody was carried out. Asignificantly strong 7765 Da peak was specifically present in the fractions of pre-CT sera from 2 NPC patients (NPC4 and 5) but not in the post-CT sera. (B), The sameserum samples without capture were profiled by SELDI-TOF-MS using IMAC-Cu ProteinChip arrays.
Clinical Chemistry 53, No. 2, 2007 249
4. Leung SF, Teo PM, Shiu WW, Tsao SY, Leung TW. Clinical featuresand management of distant metastases of nasopharyngeal carci-noma. J Otolaryngol 1991;20:27–9.
5. Hsu CH, Chen CL, Hong RL, Chen KL, Lin JF, Cheng AL. Prognosticvalue of multidrug resistance 1, glutathione-S-transferase-pi andp53 in advanced nasopharyngeal carcinoma treated with systemicchemotherapy. Oncology 2002;62:305–12.
6. Cho WCS, Yip TTC, Yip C, Yip V, Thulasiraman V, Ngan RKC, et al.Identification of Serum Amyloid A protein as a potentially usefulbiomarker to monitor relapse of nasopharyngeal cancer by serumproteomic profiling. Clin Cancer Res 2004;10:43–52.
7. Yiu HHY, Ngan RKC, Yau S, Cheung FY, Chan DTM, Kwok PCH, etal. Interim results of a phase II study on combination cisplatin andetoposide chemotherapy for metastatic or recurrent nasopharyn-geal carcinoma (NPC). Proc Am Soc Clin Oncol 2003;22:511[Abstr No. 2056].
8. Ngan RKC, Yiu HHY, Lau WH, Yau S, Cheung FY, Chan DTM, et al.Combination gemcitabine and cisplatin chemotherapy for meta-static or recurrent nasopharyngeal carcinoma: report of a Phase IIstudy. Ann Oncol 2002;13:1252–8.
9. Yip TTC, Cho WCS, Cheng WW, Chan JWM, Ma VWS, Yip TT, et al.Application of protein chip array profiling in serum biomarkerdiscovery for patients suffering from severe acute respiratorysyndrome (SARS). In: Rampal JB, ed. Microarray: Methods andProtocols. Method in Molecular Biology Series. U S A: HumanaPress [In press].
10. Yip TT, Lomas L. SELDI ProteinChip array in oncoproteomicresearch. Technol Cancer Res Treat 2002;1:273–80.
11. Loh WY, Shih YS. Split selection methods for classification trees.Statistica Sinica 1997;7:815–40.
12. Vermeulen R, Lan Q, Zhang L, Gunn L, McCarthy D, Woodbury RL,et al. Decreased levels of CXC-chemokines in serum of benzene-exposed workers. PNAS U S A 2005;102:17041–6.
13. Soltys SG, Le QT, Shi G, Tibshirani R, Giaccia AJ, Koong AC. Theuse of plasma surface-enhanced laser desorption/ionization time-of-flight mass spectrometry proteomic patterns for detection ofhead and neck squamous cell cancers. Clin Cancer Res 2004;10:4806–12.
14. Wadsworth JT, Somers KD, Cazares LH, Malik G, Adam BL, StackBC Jr, et al. Serum protein profiles to identify head and neckcancer. Clin Cancer Res 2004;10:1625–32.
15. Cheng AJ, Chen LC, Chien KY, Chen YJ, Chang JT, Wang HM, et al.Oral cancer plasma tumor marker identified with bead-basedaffinity-fractionated proteomic technology. Clin Chem 2005;51:2236–44.
16. Leung SF, Tam JS, Chan AT, Zee B, Chan LY, Huang DP, et al.Improved accuracy of detection of nasopharyngeal carcinoma bycombined application of circulating Epstein-Barr virus DNA andanti-Epstein-Barr viral capsid antigen IgA antibody. Clin Chem2004;50:339–45.
17. Lo YM, Chan LY, Lo KW, Leung SF, Zhang J, Chan AT, et al.Quantitative analysis of cell-free Epstein-Barr virus DNA in plasmaof patients with nasopharyngeal carcinoma. Cancer Res 1999;59:1188–91.
18. Ngan RKC, Lau WH, Yip TTC, Cho WCS, Cheng WW, Lim CKP, et al.Remarkable application of serum EBV EBER-1 in monitoringresponse of nasopharyngeal cancer patients to salvage chemo-therapy. Ann N Y Acad Sci 2001;945:73–9.
19. Josic D, Brown MK, Huang F, Lim YP, Rucevic M, Clifton JG, et al.Proteomic characterization of inter-� inhibitor proteins from hu-man plasma. Proteomics 2006;6:2874–85.
20. Heron A, Borghi H, Calle A, Bourguignon J, Diarra-Mehrpour M,Martin JP, et al. Gene expression and protein distribution ofinter-�-trypsin inhibitor in three human hepatoma cell lines. CellBiol Int 1995;19:593–602.
21. Bourguignon J, Borghi H, Sesboue R, Diarra-Mehrpour M, Bernau-din JF, Metayer J, et al. Immunohistochemical distribution ofinter-�-trypsin inhibitor chains in normal and malignant humanlung tissue. J Histochem Cytochem 1999;47:1625–32.
22. Yoshida E, Maruyama M, Sugiki M, Mihara H. Immunohistochem-ical demonstration of bikunin, a light chain of inter-�-trypsininhibitor, in human brain tumors. Inflammation 1994;18:589–96.
23. Zhang Z, Bast RC Jr, Yu Y, Li J, Sokoll LJ, Rai AJ, et al. Threebiomarkers identified from serum proteomic analysis for thedetection of early stage ovarian cancer. Cancer Res 2004;64:5882–90.
24. Yu KH, Rustgi AK, Blair IA. Characterization of proteins in humanpancreatic cancer serum using differential gel electrophoresis andtandem mass spectrometry. J Proteome Res 2005;4:1742–51.
25. Fung ET, Yip TT, Lomas L, Wang Z, Yip C, Meng XY, et al. Classifica-tion of cancer types by measuring variants of host response proteinsusing SELDI serum assays. Int J Cancer 2005;115:783–9.
26. Villanueva J, Shaffer DR, Philip J, Chaparro CA, Erdjument-Bro-mage H, Olshen AB, et al. Differential exoprotease activitiesconfer tumor-specific serum peptidome patterns. J Clin Invest2006;116:271–84.
27. Pollard JW. Tumour-educated macrophages promote tumour pro-gression and metastasis. Nat Rev Cancer 2004;4:71–8.
28. Wilharm E, Parry MA, Friebel R, Tschesche H, Matschiner G,Sommerhoff CP, et al. Generation of catalytically active granzymeK from Escherichia coli inclusion bodies and identification ofefficient granzyme K inhibitors in human plasma. J Biol Chem1999;274:27331–7.
29. Slungaard A. Platelet factor 4: a chemokine enigma. Int J BiochemCell Biol 2005;37:1162–7.
30. Al-Mondhiry H, Manni A, Owen J, Gordon R. Hemostatic effects ofhormonal stimulation in patients with metastatic prostate cancer.Am J Hematol 1988;28:141–5.
31. Palomera Bernal L, Garcia Diez I. Beta-thromboglobulin and plate-let factor 4 in a follow-up of acute myelofibrosis (megakaryoblasticleukemia) Med Clin (Barc) 1990;95:21–4.
32. Al-Mondhiry H. beta-Thromboglobulin and platelet-factor 4 in pa-tients with cancer: correlation with the stage of disease and theeffect of chemotherapy. Am J Hematol 1983;14:105–11.
33. Hortin GL. The MALDI-TOF mass spectrometric view of the plasmaproteome and peptidome. Clin Chem 2006;52:1223–37.
34. Lafarge S, Sylvain V, Ferrara M, Bignon YJ. Inhibition of BRCA1 leadsto increased chemoresistance to microtubule-interfering agents, aneffect that involves the JNK pathway. Oncogene 2001;20:6597–606.
35. Kawasaki M, Nakanishi Y, Kuwano K, Yatsunami J, Takayama K,Hara N. The utility of p53 immunostaining of transbronchial biopsyspecimens of lung cancer: p53 overexpression predicts poorprognosis and chemoresistance in advanced non-small cell lungcancer. Clin Cancer Res 1997;3:1195–200.
36. Baggerly KA, Morris JS, Coombes KR. Reproducibility of SELDI-TOFprotein patterns in serum: comparing datasets from differentexperiments. Bioinformatics 2004;20:77–85.
37. Semmes OJ, Feng Z, Adam BL, Banez LL, Bigbee WL, Campos D,et al. Evaluation of serum protein profiling by surface-enhancedlaser desorption/ionization time-of-flight mass spectrometry forthe detection of prostate cancer: I. Assessment of platformreproducibility. Clin Chem 2005;51:102–12.
38. Rai AJ, Gelfand CA, Haywood BC, Warunek DJ, Yi J, SchuchardMD, et al. HUPO plasma proteome project specimen collectionand handling: towards the standardization of parameters forplasma proteome samples. Proteomics 2005;5:3262–77.
39. Banks RE, Stanley AJ, Cairns DA, Barrett JH, Clarke P, ThompsonD, et al. Influences of blood sample processing on low-molecular-weight proteome identified by surface-enhanced laser desorption/ionization mass spectrometry. Clin Chem 2005;51:1637–49.
250 Cho et al.: NPC Biomarkers by ProteinChip Array Profiling
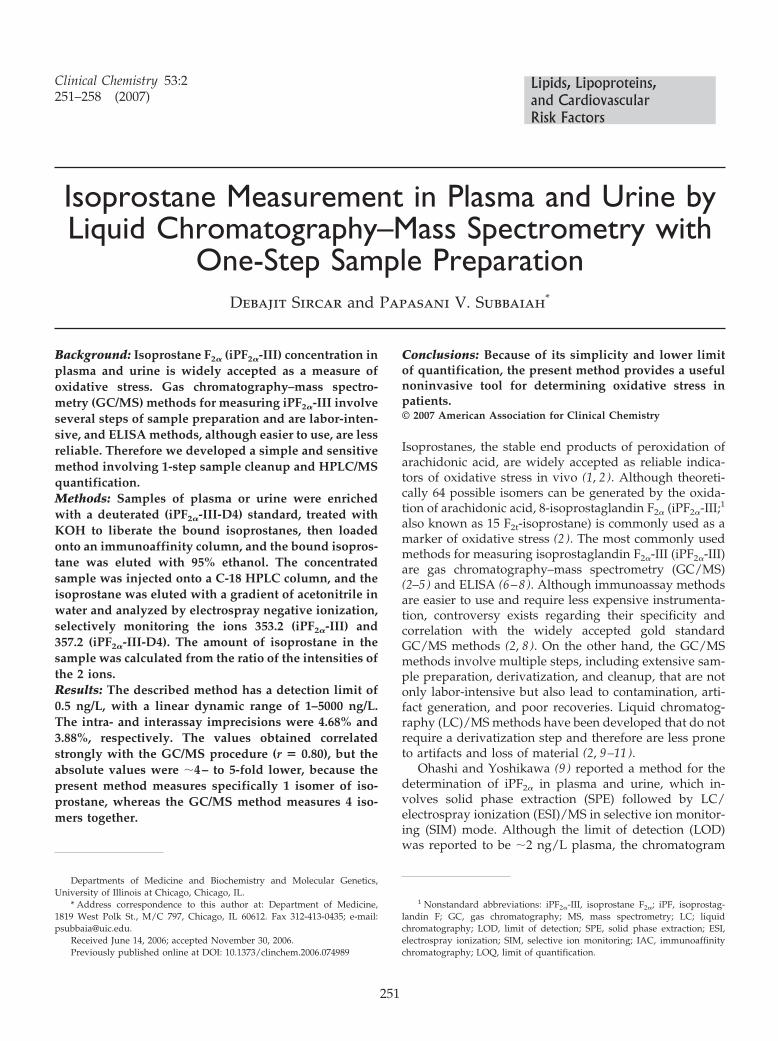
Isoprostane Measurement in Plasma and Urine byLiquid Chromatography–Mass Spectrometry with
One-Step Sample PreparationDebajit Sircar and Papasani V. Subbaiah*
Background: Isoprostane F2� (iPF2�-III) concentration inplasma and urine is widely accepted as a measure ofoxidative stress. Gas chromatography–mass spectro-metry (GC/MS) methods for measuring iPF2�-III involveseveral steps of sample preparation and are labor-inten-sive, and ELISA methods, although easier to use, are lessreliable. Therefore we developed a simple and sensitivemethod involving 1-step sample cleanup and HPLC/MSquantification.Methods: Samples of plasma or urine were enrichedwith a deuterated (iPF2�-III-D4) standard, treated withKOH to liberate the bound isoprostanes, then loadedonto an immunoaffinity column, and the bound isopros-tane was eluted with 95% ethanol. The concentratedsample was injected onto a C-18 HPLC column, and theisoprostane was eluted with a gradient of acetonitrile inwater and analyzed by electrospray negative ionization,selectively monitoring the ions 353.2 (iPF2�-III) and357.2 (iPF2�-III-D4). The amount of isoprostane in thesample was calculated from the ratio of the intensities ofthe 2 ions.Results: The described method has a detection limit of0.5 ng/L, with a linear dynamic range of 1–5000 ng/L.The intra- and interassay imprecisions were 4.68% and3.88%, respectively. The values obtained correlatedstrongly with the GC/MS procedure (r � 0.80), but theabsolute values were �4– to 5-fold lower, because thepresent method measures specifically 1 isomer of iso-prostane, whereas the GC/MS method measures 4 iso-mers together.
Conclusions: Because of its simplicity and lower limitof quantification, the present method provides a usefulnoninvasive tool for determining oxidative stress inpatients.© 2007 American Association for Clinical Chemistry
Isoprostanes, the stable end products of peroxidation ofarachidonic acid, are widely accepted as reliable indica-tors of oxidative stress in vivo (1, 2). Although theoreti-cally 64 possible isomers can be generated by the oxida-tion of arachidonic acid, 8-isoprostaglandin F2� (iPF2�-III;1
also known as 15 F2t-isoprostane) is commonly used as amarker of oxidative stress (2 ). The most commonly usedmethods for measuring isoprostaglandin F2�-III (iPF2�-III)are gas chromatography–mass spectrometry (GC/MS)(2–5) and ELISA (6–8). Although immunoassay methodsare easier to use and require less expensive instrumenta-tion, controversy exists regarding their specificity andcorrelation with the widely accepted gold standardGC/MS methods (2, 8). On the other hand, the GC/MSmethods involve multiple steps, including extensive sam-ple preparation, derivatization, and cleanup, that are notonly labor-intensive but also lead to contamination, arti-fact generation, and poor recoveries. Liquid chromatog-raphy (LC)/MS methods have been developed that do notrequire a derivatization step and therefore are less proneto artifacts and loss of material (2, 9–11).
Ohashi and Yoshikawa (9 ) reported a method for thedetermination of iPF2� in plasma and urine, which in-volves solid phase extraction (SPE) followed by LC/electrospray ionization (ESI)/MS in selective ion monitor-ing (SIM) mode. Although the limit of detection (LOD)was reported to be �2 ng/L plasma, the chromatogram
Departments of Medicine and Biochemistry and Molecular Genetics,University of Illinois at Chicago, Chicago, IL.
* Address correspondence to this author at: Department of Medicine,1819 West Polk St., M/C 797, Chicago, IL 60612. Fax 312-413-0435; e-mail:[email protected].
Received June 14, 2006; accepted November 30, 2006.Previously published online at DOI: 10.1373/clinchem.2006.074989
1 Nonstandard abbreviations: iPF2�-III, isoprostane F2�; iPF, isoprostag-landin F; GC, gas chromatography; MS, mass spectrometry; LC; liquidchromatography; LOD, limit of detection; SPE, solid phase extraction; ESI,electrospray ionization; SIM, selective ion monitoring; IAC, immunoaffinitychromatography; LOQ, limit of quantification.
Clinical Chemistry 53:2251–258 (2007)
Lipids, Lipoproteins,and CardiovascularRisk Factors
251
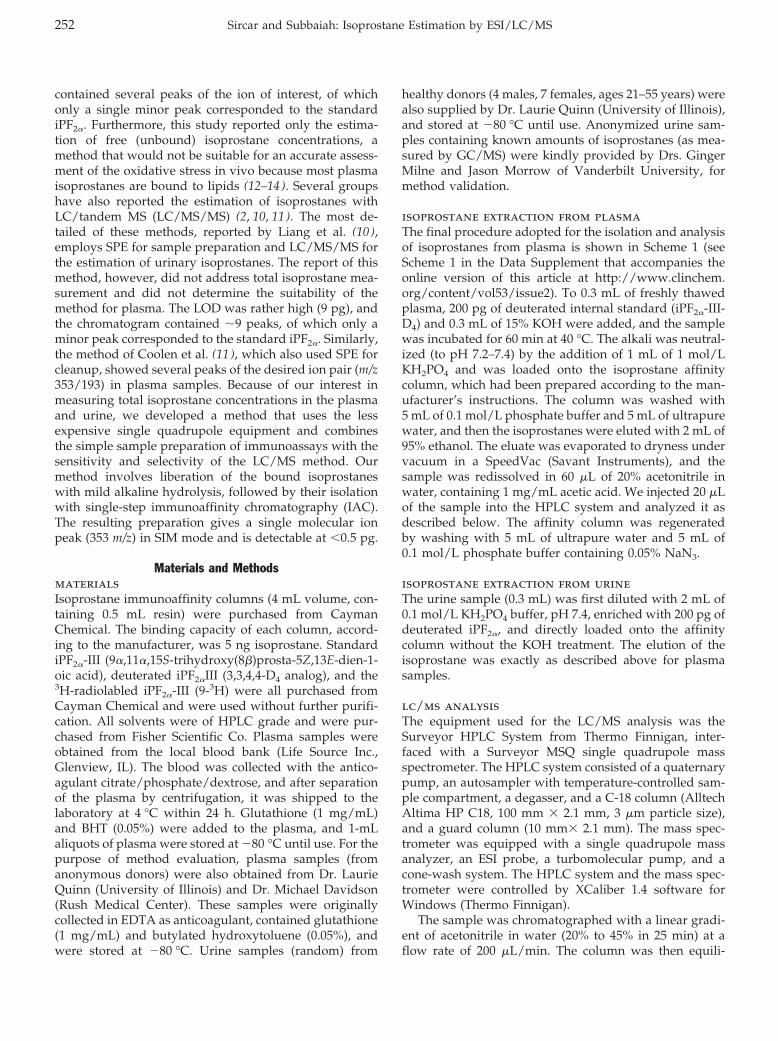
contained several peaks of the ion of interest, of whichonly a single minor peak corresponded to the standardiPF2�. Furthermore, this study reported only the estima-tion of free (unbound) isoprostane concentrations, amethod that would not be suitable for an accurate assess-ment of the oxidative stress in vivo because most plasmaisoprostanes are bound to lipids (12–14). Several groupshave also reported the estimation of isoprostanes withLC/tandem MS (LC/MS/MS) (2, 10, 11). The most de-tailed of these methods, reported by Liang et al. (10 ),employs SPE for sample preparation and LC/MS/MS forthe estimation of urinary isoprostanes. The report of thismethod, however, did not address total isoprostane mea-surement and did not determine the suitability of themethod for plasma. The LOD was rather high (9 pg), andthe chromatogram contained �9 peaks, of which only aminor peak corresponded to the standard iPF2�. Similarly,the method of Coolen et al. (11 ), which also used SPE forcleanup, showed several peaks of the desired ion pair (m/z353/193) in plasma samples. Because of our interest inmeasuring total isoprostane concentrations in the plasmaand urine, we developed a method that uses the lessexpensive single quadrupole equipment and combinesthe simple sample preparation of immunoassays with thesensitivity and selectivity of the LC/MS method. Ourmethod involves liberation of the bound isoprostaneswith mild alkaline hydrolysis, followed by their isolationwith single-step immunoaffinity chromatography (IAC).The resulting preparation gives a single molecular ionpeak (353 m/z) in SIM mode and is detectable at �0.5 pg.
Materials and MethodsmaterialsIsoprostane immunoaffinity columns (4 mL volume, con-taining 0.5 mL resin) were purchased from CaymanChemical. The binding capacity of each column, accord-ing to the manufacturer, was 5 ng isoprostane. StandardiPF2�-III (9�,11�,15S-trihydroxy(8�)prosta-5Z,13E-dien-1-oic acid), deuterated iPF2�III (3,3,4,4-D4 analog), and the3H-radiolabled iPF2�-III (9-3H) were all purchased fromCayman Chemical and were used without further purifi-cation. All solvents were of HPLC grade and were pur-chased from Fisher Scientific Co. Plasma samples wereobtained from the local blood bank (Life Source Inc.,Glenview, IL). The blood was collected with the antico-agulant citrate/phosphate/dextrose, and after separationof the plasma by centrifugation, it was shipped to thelaboratory at 4 °C within 24 h. Glutathione (1 mg/mL)and BHT (0.05%) were added to the plasma, and 1-mLaliquots of plasma were stored at �80 °C until use. For thepurpose of method evaluation, plasma samples (fromanonymous donors) were also obtained from Dr. LaurieQuinn (University of Illinois) and Dr. Michael Davidson(Rush Medical Center). These samples were originallycollected in EDTA as anticoagulant, contained glutathione(1 mg/mL) and butylated hydroxytoluene (0.05%), andwere stored at �80 °C. Urine samples (random) from
healthy donors (4 males, 7 females, ages 21–55 years) werealso supplied by Dr. Laurie Quinn (University of Illinois),and stored at �80 °C until use. Anonymized urine sam-ples containing known amounts of isoprostanes (as mea-sured by GC/MS) were kindly provided by Drs. GingerMilne and Jason Morrow of Vanderbilt University, formethod validation.
isoprostane extraction from plasmaThe final procedure adopted for the isolation and analysisof isoprostanes from plasma is shown in Scheme 1 (seeScheme 1 in the Data Supplement that accompanies theonline version of this article at http://www.clinchem.org/content/vol53/issue2). To 0.3 mL of freshly thawedplasma, 200 pg of deuterated internal standard (iPF2�-III-D4) and 0.3 mL of 15% KOH were added, and the samplewas incubated for 60 min at 40 °C. The alkali was neutral-ized (to pH 7.2–7.4) by the addition of 1 mL of 1 mol/LKH2PO4 and was loaded onto the isoprostane affinitycolumn, which had been prepared according to the man-ufacturer’s instructions. The column was washed with5 mL of 0.1 mol/L phosphate buffer and 5 mL of ultrapurewater, and then the isoprostanes were eluted with 2 mL of95% ethanol. The eluate was evaporated to dryness undervacuum in a SpeedVac (Savant Instruments), and thesample was redissolved in 60 �L of 20% acetonitrile inwater, containing 1 mg/mL acetic acid. We injected 20 �Lof the sample into the HPLC system and analyzed it asdescribed below. The affinity column was regeneratedby washing with 5 mL of ultrapure water and 5 mL of0.1 mol/L phosphate buffer containing 0.05% NaN3.
isoprostane extraction from urineThe urine sample (0.3 mL) was first diluted with 2 mL of0.1 mol/L KH2PO4 buffer, pH 7.4, enriched with 200 pg ofdeuterated iPF2�, and directly loaded onto the affinitycolumn without the KOH treatment. The elution of theisoprostane was exactly as described above for plasmasamples.
lc/ms analysisThe equipment used for the LC/MS analysis was theSurveyor HPLC System from Thermo Finnigan, inter-faced with a Surveyor MSQ single quadrupole massspectrometer. The HPLC system consisted of a quaternarypump, an autosampler with temperature-controlled sam-ple compartment, a degasser, and a C-18 column (AlltechAltima HP C18, 100 mm � 2.1 mm, 3 �m particle size),and a guard column (10 mm� 2.1 mm). The mass spec-trometer was equipped with a single quadrupole massanalyzer, an ESI probe, a turbomolecular pump, and acone-wash system. The HPLC system and the mass spec-trometer were controlled by XCaliber 1.4 software forWindows (Thermo Finnigan).
The sample was chromatographed with a linear gradi-ent of acetonitrile in water (20% to 45% in 25 min) at aflow rate of 200 �L/min. The column was then equili-
252 Sircar and Subbaiah: Isoprostane Estimation by ESI/LC/MS
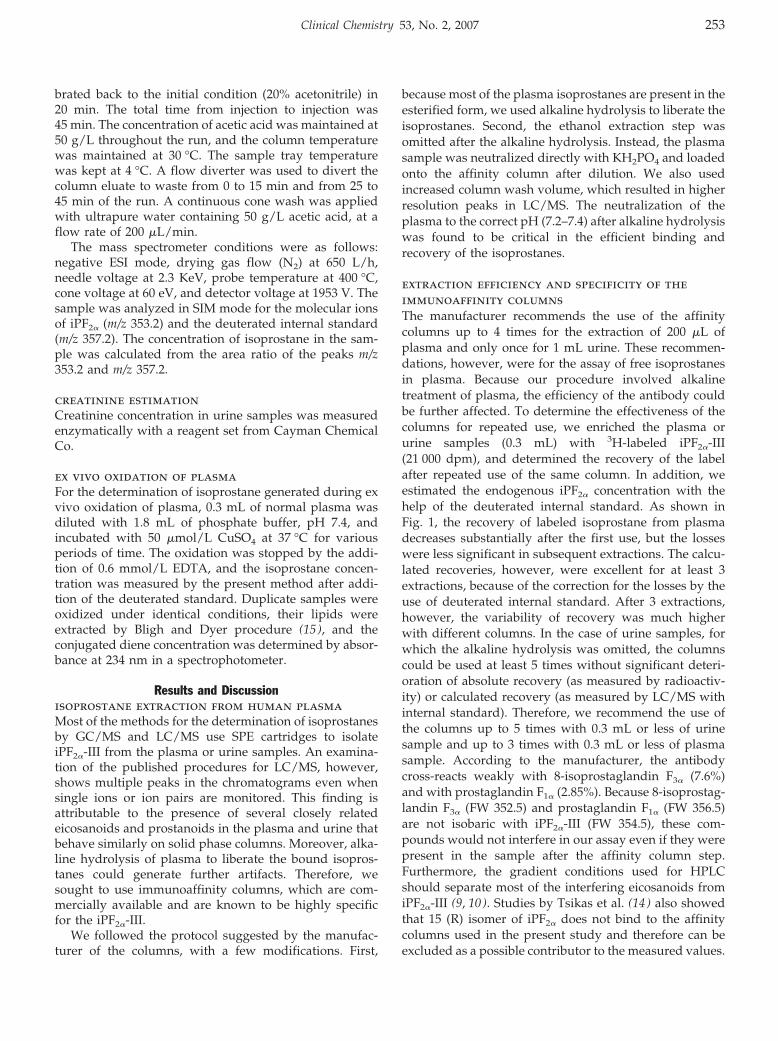
brated back to the initial condition (20% acetonitrile) in20 min. The total time from injection to injection was45 min. The concentration of acetic acid was maintained at50 g/L throughout the run, and the column temperaturewas maintained at 30 °C. The sample tray temperaturewas kept at 4 °C. A flow diverter was used to divert thecolumn eluate to waste from 0 to 15 min and from 25 to45 min of the run. A continuous cone wash was appliedwith ultrapure water containing 50 g/L acetic acid, at aflow rate of 200 �L/min.
The mass spectrometer conditions were as follows:negative ESI mode, drying gas flow (N2) at 650 L/h,needle voltage at 2.3 KeV, probe temperature at 400 °C,cone voltage at 60 eV, and detector voltage at 1953 V. Thesample was analyzed in SIM mode for the molecular ionsof iPF2� (m/z 353.2) and the deuterated internal standard(m/z 357.2). The concentration of isoprostane in the sam-ple was calculated from the area ratio of the peaks m/z353.2 and m/z 357.2.
creatinine estimationCreatinine concentration in urine samples was measuredenzymatically with a reagent set from Cayman ChemicalCo.
ex vivo oxidation of plasmaFor the determination of isoprostane generated during exvivo oxidation of plasma, 0.3 mL of normal plasma wasdiluted with 1.8 mL of phosphate buffer, pH 7.4, andincubated with 50 �mol/L CuSO4 at 37 °C for variousperiods of time. The oxidation was stopped by the addi-tion of 0.6 mmol/L EDTA, and the isoprostane concen-tration was measured by the present method after addi-tion of the deuterated standard. Duplicate samples wereoxidized under identical conditions, their lipids wereextracted by Bligh and Dyer procedure (15 ), and theconjugated diene concentration was determined by absor-bance at 234 nm in a spectrophotometer.
Results and Discussionisoprostane extraction from human plasmaMost of the methods for the determination of isoprostanesby GC/MS and LC/MS use SPE cartridges to isolateiPF2�-III from the plasma or urine samples. An examina-tion of the published procedures for LC/MS, however,shows multiple peaks in the chromatograms even whensingle ions or ion pairs are monitored. This finding isattributable to the presence of several closely relatedeicosanoids and prostanoids in the plasma and urine thatbehave similarly on solid phase columns. Moreover, alka-line hydrolysis of plasma to liberate the bound isopros-tanes could generate further artifacts. Therefore, wesought to use immunoaffinity columns, which are com-mercially available and are known to be highly specificfor the iPF2�-III.
We followed the protocol suggested by the manufac-turer of the columns, with a few modifications. First,
because most of the plasma isoprostanes are present in theesterified form, we used alkaline hydrolysis to liberate theisoprostanes. Second, the ethanol extraction step wasomitted after the alkaline hydrolysis. Instead, the plasmasample was neutralized directly with KH2PO4 and loadedonto the affinity column after dilution. We also usedincreased column wash volume, which resulted in higherresolution peaks in LC/MS. The neutralization of theplasma to the correct pH (7.2–7.4) after alkaline hydrolysiswas found to be critical in the efficient binding andrecovery of the isoprostanes.
extraction efficiency and specificity of theimmunoaffinity columnsThe manufacturer recommends the use of the affinitycolumns up to 4 times for the extraction of 200 �L ofplasma and only once for 1 mL urine. These recommen-dations, however, were for the assay of free isoprostanesin plasma. Because our procedure involved alkalinetreatment of plasma, the efficiency of the antibody couldbe further affected. To determine the effectiveness of thecolumns for repeated use, we enriched the plasma orurine samples (0.3 mL) with 3H-labeled iPF2�-III(21 000 dpm), and determined the recovery of the labelafter repeated use of the same column. In addition, weestimated the endogenous iPF2� concentration with thehelp of the deuterated internal standard. As shown inFig. 1, the recovery of labeled isoprostane from plasmadecreases substantially after the first use, but the losseswere less significant in subsequent extractions. The calcu-lated recoveries, however, were excellent for at least 3extractions, because of the correction for the losses by theuse of deuterated internal standard. After 3 extractions,however, the variability of recovery was much higherwith different columns. In the case of urine samples, forwhich the alkaline hydrolysis was omitted, the columnscould be used at least 5 times without significant deteri-oration of absolute recovery (as measured by radioactiv-ity) or calculated recovery (as measured by LC/MS withinternal standard). Therefore, we recommend the use ofthe columns up to 5 times with 0.3 mL or less of urinesample and up to 3 times with 0.3 mL or less of plasmasample. According to the manufacturer, the antibodycross-reacts weakly with 8-isoprostaglandin F3� (7.6%)and with prostaglandin F1� (2.85%). Because 8-isoprostag-landin F3� (FW 352.5) and prostaglandin F1� (FW 356.5)are not isobaric with iPF2�-III (FW 354.5), these com-pounds would not interfere in our assay even if they werepresent in the sample after the affinity column step.Furthermore, the gradient conditions used for HPLCshould separate most of the interfering eicosanoids fromiPF2�-III (9, 10). Studies by Tsikas et al. (14 ) also showedthat 15 (R) isomer of iPF2� does not bind to the affinitycolumns used in the present study and therefore can beexcluded as a possible contributor to the measured values.
Clinical Chemistry 53, No. 2, 2007 253
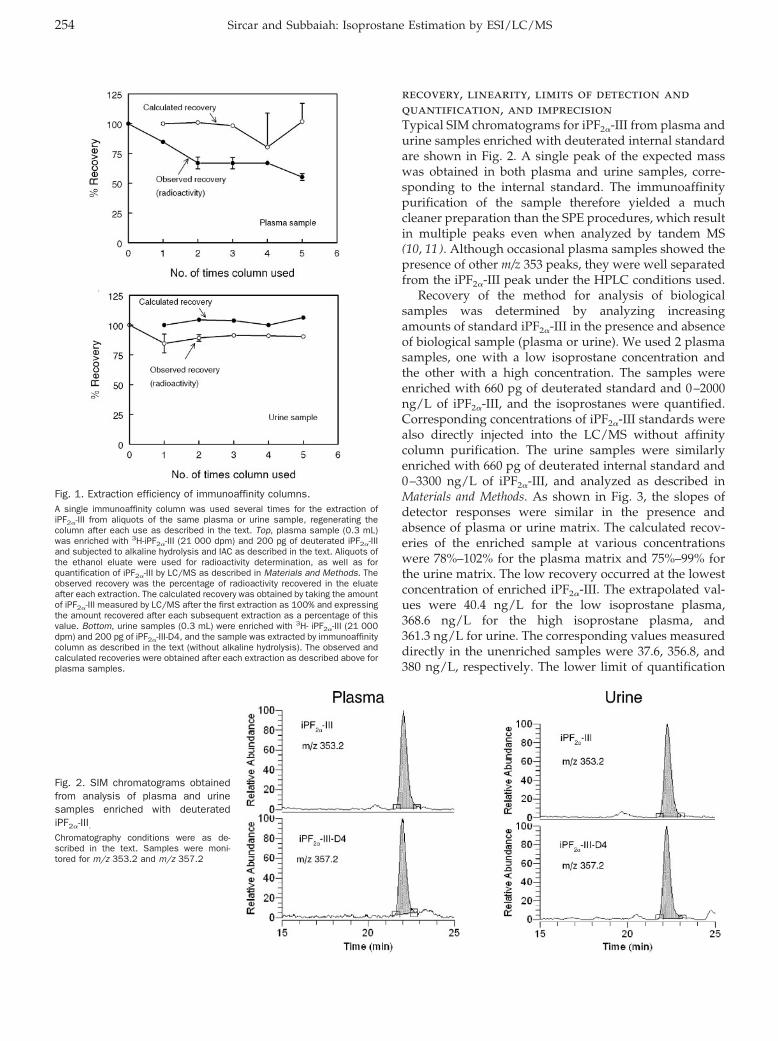
recovery, linearity, limits of detection andquantification, and imprecisionTypical SIM chromatograms for iPF2�-III from plasma andurine samples enriched with deuterated internal standardare shown in Fig. 2. A single peak of the expected masswas obtained in both plasma and urine samples, corre-sponding to the internal standard. The immunoaffinitypurification of the sample therefore yielded a muchcleaner preparation than the SPE procedures, which resultin multiple peaks even when analyzed by tandem MS(10, 11). Although occasional plasma samples showed thepresence of other m/z 353 peaks, they were well separatedfrom the iPF2�-III peak under the HPLC conditions used.
Recovery of the method for analysis of biologicalsamples was determined by analyzing increasingamounts of standard iPF2�-III in the presence and absenceof biological sample (plasma or urine). We used 2 plasmasamples, one with a low isoprostane concentration andthe other with a high concentration. The samples wereenriched with 660 pg of deuterated standard and 0–2000ng/L of iPF2�-III, and the isoprostanes were quantified.Corresponding concentrations of iPF2�-III standards werealso directly injected into the LC/MS without affinitycolumn purification. The urine samples were similarlyenriched with 660 pg of deuterated internal standard and0–3300 ng/L of iPF2�-III, and analyzed as described inMaterials and Methods. As shown in Fig. 3, the slopes ofdetector responses were similar in the presence andabsence of plasma or urine matrix. The calculated recov-eries of the enriched sample at various concentrationswere 78%–102% for the plasma matrix and 75%–99% forthe urine matrix. The low recovery occurred at the lowestconcentration of enriched iPF2�-III. The extrapolated val-ues were 40.4 ng/L for the low isoprostane plasma,368.6 ng/L for the high isoprostane plasma, and361.3 ng/L for urine. The corresponding values measureddirectly in the unenriched samples were 37.6, 356.8, and380 ng/L, respectively. The lower limit of quantification
Fig. 1. Extraction efficiency of immunoaffinity columns.A single immunoaffinity column was used several times for the extraction ofiPF2�-III from aliquots of the same plasma or urine sample, regenerating thecolumn after each use as described in the text. Top, plasma sample (0.3 mL)was enriched with 3H-iPF2�-III (21 000 dpm) and 200 pg of deuterated iPF2�-IIIand subjected to alkaline hydrolysis and IAC as described in the text. Aliquots ofthe ethanol eluate were used for radioactivity determination, as well as forquantification of iPF2�-III by LC/MS as described in Materials and Methods. Theobserved recovery was the percentage of radioactivity recovered in the eluateafter each extraction. The calculated recovery was obtained by taking the amountof iPF2�-III measured by LC/MS after the first extraction as 100% and expressingthe amount recovered after each subsequent extraction as a percentage of thisvalue. Bottom, urine samples (0.3 mL) were enriched with 3H- iPF2�-III (21 000dpm) and 200 pg of iPF2�-III-D4, and the sample was extracted by immunoaffinitycolumn as described in the text (without alkaline hydrolysis). The observed andcalculated recoveries were obtained after each extraction as described above forplasma samples.
Fig. 2. SIM chromatograms obtainedfrom analysis of plasma and urinesamples enriched with deuteratediPF2�-III.Chromatography conditions were as de-scribed in the text. Samples were moni-tored for m/z 353.2 and m/z 357.2
254 Sircar and Subbaiah: Isoprostane Estimation by ESI/LC/MS
(LOQ) (defined as the lowest concentration added thatcan be measured with �20% error) was 30 ng/L plasmaor urine.
The linearity of the assay for unenriched plasma andurine samples is shown in Fig. 1 in the online DataSupplement. The plasma sample used here was not storedin the presence of antioxidants, and therefore the values
were higher than the average values for the normalhuman plasma. Nevertheless, at least 0.5 mL of plasma orurine could be analyzed under linear conditions by thedescribed method. The minimum amount of plasma sam-ple required is 100 �L, which is lower than that requiredfor the GC/MS analyses, most of which require 1–3 mLplasma (4, 16–18). We recommend the use of 0.2–0.3 mLof plasma with the present method for better results.Larger volumes of plasma can be used if the isoprostanevalues are low, but the efficiency of the affinity column iscorrespondingly decreased after repeated use.
The LOD was 0.5 pg per injection at a signal-to-noiseratio of 3. The LOQ for the standard isoprostane was1.0 pg per injection at a signal-to-noise ratio of 10. Theprecision of LOQ was 8.25% (CV). The linear dynamicrange was 1–5000 pg per injection (see Fig. 2 in the onlineData Supplement).
The imprecision of the method was determined byestimating the iPF2�-III values in 2 plasma samples intriplicate, each on 3 different days, and 1 urine sample intriplicate on 4 different days. The intraday imprecision(CV%) was 4.68 for plasma (n � 18; mean value,68.6 ng/L) and 3.83 for urine (n � 12; mean value,365 ng/L). The interday imprecision (CV) was 3.9 forplasma (n � 6) and 2.98 for urine (n � 4).
comparison of the present method with thegc/ms methodTo determine the correlation of the LC/MS method usedhere with the more commonly used GC/MS procedure,we obtained 10 urine samples whose isoprostane concen-tration was determined by GC/MS by the referencelaboratory at Vanderbilt University, through the courtesyof Drs. Ginger Milne and Jason Morrow. The valuesobtained with LC/MS assay were �4- to 5-fold lower thanthose obtained by the GC/MS procedure (Fig. 4). Thedifference in absolute values is most likely due to theestimation of multiple isomers of iPF2� by the GC/MSprocedure, as shown by several studies (14, 16). On theother hand, the present method determines specifically 15(S) iPF2�. Studies by Tsikas et al. (14 ) showed that thepurification of isoprostane by IAC results in specificextraction of 15 (S) iPF2� isomer, and that the amount ofisoprostane (determined by GC/MS/MS) was less thanhalf of that obtained after SPE/thin-layer chromatogra-phy purification steps. In contrast, Liang et al. (10 )reported that the amount of urinary iPF2�-III estimated byLC/MS/MS after SPE purification and IAC purificationwas similar. Although we cannot completely exclude thepresence of other unknown isomers, it is clear that IACresults in the estimation of predominantly 1 isomer ofisoprostane. Furthermore, even after SPE extraction, thevalues obtained by LC/MS procedures are much lowerthan those obtained by GC/MS because of the ability ofLC columns to separate the underivatized isomers (10 ).We have also analyzed the IAC eluates of 5 urine samplesby MS/MS as described by Liang et al. (10 ) (see Fig. 3 in
Fig. 3. Analytical recovery of the method.(A), recovery of standard iPF2�-III added to plasma. Plasma 1 (low isoprostaneconcentration, 0.3 mL) was enriched with 200 pg of deuterated iPF2�-III and 0,10, 20, 50, 100, 300, or 600 pg of unlabeled iPF2�-III, and plasma 2 (highisoprostane concentration, 0.5 mL) was enriched with 200 pg of deuteratedstandard and 0, 20, 50, 100, 300, or 600 pg of PF2�-III. Corresponding amountsof isoprostane standards were also directly injected and analyzed by LC/MS tocalculate the recoveries. The isoprostane values are shown per milliliter ofplasma. The extrapolated value for unenriched plasma 1 was 40.4 ng/L, and forplasma 2, it was 368.6 ng/L. The actual estimated values were 37.6 ng/L and356.8 ng/L, respectively. (B), recovery of isoprostane added to urine sample.The urine sample (0.3 mL) was enriched with 200 pg of deuterated iPF2�-III, and0, 20, 50, 100, 600, or 1000 pg of unlabeled iPF2�-III and analyzed by LC/MSas described in the text. Standard isoprostane corresponding to the aboveconcentrations was also injected directly into LC/MS to calculate recoveries. Theextrapolated value for unenriched urine was 361.3 ng/L, and the actualmeasured value was 380 ng/L.
Clinical Chemistry 53, No. 2, 2007 255
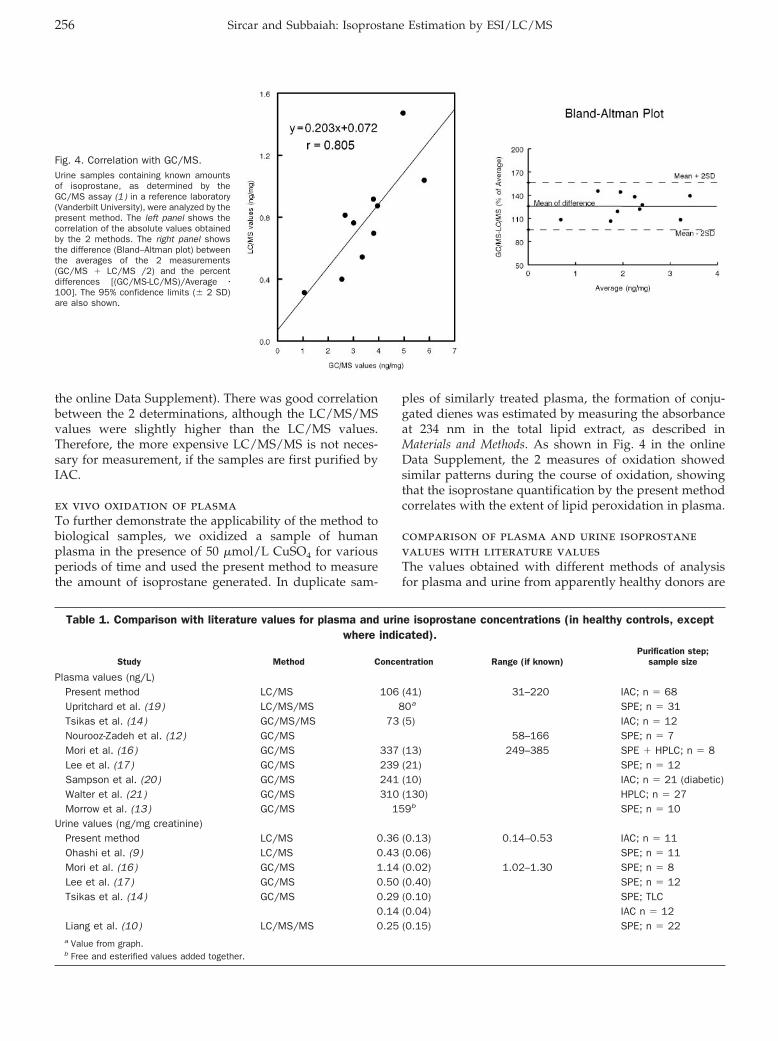
the online Data Supplement). There was good correlationbetween the 2 determinations, although the LC/MS/MSvalues were slightly higher than the LC/MS values.Therefore, the more expensive LC/MS/MS is not neces-sary for measurement, if the samples are first purified byIAC.
ex vivo oxidation of plasmaTo further demonstrate the applicability of the method tobiological samples, we oxidized a sample of humanplasma in the presence of 50 �mol/L CuSO4 for variousperiods of time and used the present method to measurethe amount of isoprostane generated. In duplicate sam-
ples of similarly treated plasma, the formation of conju-gated dienes was estimated by measuring the absorbanceat 234 nm in the total lipid extract, as described inMaterials and Methods. As shown in Fig. 4 in the onlineData Supplement, the 2 measures of oxidation showedsimilar patterns during the course of oxidation, showingthat the isoprostane quantification by the present methodcorrelates with the extent of lipid peroxidation in plasma.
comparison of plasma and urine isoprostanevalues with literature valuesThe values obtained with different methods of analysisfor plasma and urine from apparently healthy donors are
Table 1. Comparison with literature values for plasma and urine isoprostane concentrations (in healthy controls, exceptwhere indicated).
Study Method Concentration Range (if known)Purification step;
sample size
Plasma values (ng/L)Present method LC/MS 106 (41) 31–220 IAC; n � 68Upritchard et al. (19) LC/MS/MS 80a SPE; n � 31Tsikas et al. (14) GC/MS/MS 73 (5) IAC; n � 12Nourooz-Zadeh et al. (12) GC/MS 58–166 SPE; n � 7Mori et al. (16) GC/MS 337 (13) 249–385 SPE � HPLC; n � 8Lee et al. (17) GC/MS 239 (21) SPE; n � 12Sampson et al. (20) GC/MS 241 (10) IAC; n � 21 (diabetic)Walter et al. (21) GC/MS 310 (130) HPLC; n � 27Morrow et al. (13) GC/MS 159b SPE; n � 10
Urine values (ng/mg creatinine)Present method LC/MS 0.36 (0.13) 0.14–0.53 IAC; n � 11Ohashi et al. (9 ) LC/MS 0.43 (0.06) SPE; n � 11Mori et al. (16) GC/MS 1.14 (0.02) 1.02–1.30 SPE; n � 8Lee et al. (17) GC/MS 0.50 (0.40) SPE; n � 12Tsikas et al. (14) GC/MS 0.29 (0.10) SPE; TLC
0.14 (0.04) IAC n � 12Liang et al. (10) LC/MS/MS 0.25 (0.15) SPE; n � 22a Value from graph.b Free and esterified values added together.
Fig. 4. Correlation with GC/MS.Urine samples containing known amountsof isoprostane, as determined by theGC/MS assay (1 ) in a reference laboratory(Vanderbilt University), were analyzed by thepresent method. The left panel shows thecorrelation of the absolute values obtainedby the 2 methods. The right panel showsthe difference (Bland–Altman plot) betweenthe averages of the 2 measurements(GC/MS � LC/MS /2) and the percentdifferences [(GC/MS-LC/MS)/Average �100]. The 95% confidence limits (� 2 SD)are also shown.
256 Sircar and Subbaiah: Isoprostane Estimation by ESI/LC/MS
shown in Table 1. It is evident that even with GC/MS, thereported values differ from laboratory to laboratory, in-dicating the variability in the number of isomers mea-sured and the purification of the samples. The valuesreported by the present method fall within the range ofvalues reported for GC/MS but are closer to the valuesreported with LC/MS/MS (11 ). In addition to the differ-ences in patient populations, the extraction proceduresused and the efficiency of column separation of isomersand contaminants could contribute to these variabilitiesamong laboratories.
ConclusionsThis method combines the simplicity and specificity ofIAC for sample preparation with the sensitivity andselectivity of LC/MS for quantification. Compared withthe more widely used GC/MS procedures, the presentmethod involves fewer steps, and because of the omissionof derivatization and clean-up steps, it is less prone tosample losses and artifact generation. The LLOQ is betterthan most of the GC/MS methods, and the methodrequires only 0.3 mL of urine or plasma. Because of thepurification of the sample by IAC, the more expensivetriple-quadrupole MS equipment is not required. Becausethe isoprostanes have emerged as one of the most impor-tant noninvasive markers of oxidative stress associatedwith the development of several diseases, including heartdisease, cancer, and Alzheimer, the method fills an im-portant need for the clinical laboratory.
This study was supported by NIH Grant HL 68585. Wethank Drs. Laurie Quinn and Michael Davidson for pro-viding plasma and urine samples and Drs. Ginger Milneand Jason Morrow of Vanderbilt University for providingthe urine samples with known concentration of isopros-tanes measured by GC/MS. We also thank Drs. EvgenyBerdyshev and V. Natarajan (University of Chicago) forthe analysis of samples by LC/MS/MS.
References1. Roberts LJ, Morrow JD. Measurement of F-2-isoprostanes as an
index of oxidative stress in vivo. Free Radic Biol Med 2000;28:505–13.
2. Lawson JA, Rokach J, Fitzgerald GA. Isoprostanes: formation,analysis and use as indices of lipid peroxidation in vivo. J BiolChem 1999;274:24441–4.
3. Morrow JD. Quantification of isoprostanes as indices of oxidantstress and the risk of atherosclerosis in humans. ArteriosclerThromb Vasc Biol 2005;25:279–86.
4. Nourooz-Zadeh J. Gas chromatography-mass spectrometry assayfor measurement of plasma isoprostanes. Methods Enzymol1999;300:13–7.
5. Schwedhelm E, Boger RH. Application of gas chromatography-mass spectrometry for analysis of isoprostanes: their role incardiovascular disease. Clin Chem Lab Med 2003;41:1552–61.
6. Wang Z, Ciabattoni G, Creminon C, Lawson J, Fitzgerald GA,Patrono C, et al. Immunological characterization of urinary 8-epi-prostaglandin F2 � excretion in man. J Pharmacol Exp Ther1995;275:94–100.
7. Devaraj S, Hirany SV, Burk RF, Jialal I. Divergence between LDLoxidative susceptibility and urinary F-2-isoprostanes as measuresof oxidative stress in type 2 diabetes. Clin Chem 2001;47:1974–9.
8. Proudfoot J, Barden A, Mori TA, Burke V, Croft KD, Beilin LJ, et al.Measurement of urinary F2-isoprostanes as markers of in vivo lipidperoxidation: a comparison of enzyme immunoassay with gaschromatography/mass spectrometry. Anal Biochem 1999;272:209–15.
9. Ohashi N, Yoshikawa M. Rapid and sensitive quantification of8-isoprostaglandin F2[�] in human plasma and urine by liquidchromatography-electrospray ionization mass spectrometry.J Chromatogr 2000;746:17–24.
10. Liang Y, Wei P, Duke RW, Reaven PD, Harman SM, Cutler RG, etal. Quantification of 8-iso-prostaglandin-F2[�] and 2,3-dinor-8-iso-prostaglandin-F2[�] in human urine using liquid chromatography-tandem mass spectrometry. Free Radic Biol Med 2003;34:409–18.
11. Coolen SAJ, van Buuren B, Duchateau G, Upritchard J, Verha-gen H. Kinetics of biomarkers: biological and technical validityof isoprostanes in plasma. Amino Acids 2005;29:429–36.
12. Nourooz-Zadeh J, Gopaul NK, Barrow S, Mallet AI, Anggard EE.Analysis of F2-isoprostanes as indicators of non-enzymatic lipidperoxidation in vivo by gas chromatography-mass spectrometry:development of a solid-phase extraction procedure. J Chromatogr1995;667:199–208.
13. Morrow JD, Frei B, Longmire AW, Gaziano JM, Lynch SM, Shyr Y,et al. Increase in circulating products of lipid peroxidation (F2-isoprostanes) in smokers: smoking as a cause of oxidativedamage. N Engl J Med 1995;332:1198–203.
14. Tsikas D, Schwedhelm E, Suchy MT, Niemann J, Gutzki FM,Erpenbeck VJ, et al. Divergence in urinary 8-iso-PGF2[�] (iPF2[�]-III, 15-F2t-IsoP) levels from gas chromatography-tandem massspectrometry quantification after thin-layer chromatography andimmunoaffinity column chromatography reveals heterogeneity of8-iso-PGF2[�]: possible methodological, mechanistic and clinicalimplications. J Chromatogr 2003;794:237–55.
15. Bligh EG, Dyer WJ. A rapid method of total lipid extraction andpurification. Can J Biochem Physiol 1959;37:911–7.
16. Mori TA, Croft KD, Puddey IB, Beilin LJ. An improved method forthe measurement of urinary and plasma F2-isoprostanes usinggas chromatography-mass spectrometry. Anal Biochem 1999;268:117–25.
17. Lee CY, Jenner A, Halliwell B. Rapid preparation of human urineand plasma samples for analysis of F2-isoprostanes by gaschromatography-mass spectrometry. Biochem Biophys Res Com-mun 2004;320:696–702.
18. Morrow JD, Roberts LJ II. Mass spectrometric quantification ofF2-isoprostanes in biological fluids and tissues as measure ofoxidant stress. Methods Enzymol 1999;300:3–12.
Clinical Chemistry 53, No. 2, 2007 257

19. Upritchard JE, Schuurman CR, Wiersma A, Tijburg LB, Coolen SA,Rijken PJ, et al. Spread supplemented with moderate doses ofvitamin E and carotenoids reduces lipid peroxidation in healthy,nonsmoking adults. Am J Clin Nutr 2003;78:985–92.
20. Sampson MJ, Hughes DA, Gopaul N, Carrier MJ, Davies IR.Plasma F-2 isoprostanes: direct evidence of increased free radical
damage during acute hyperglycemia in type 2 diabetes. DiabetesCare 2002;25:537–41.
21. Walter MF, Blumberg JB, Dolnikowski GG, Handelman GJ. Stream-lined F2-isoprostane analysis in plasma and urine with high-performance liquid chromatography and gas chromatography/mass spectroscopy. Anal Biochem 2000;280:73–9.
258 Sircar and Subbaiah: Isoprostane Estimation by ESI/LC/MS
Transcriptional Profiling of HematologicMalignancies with a Low-Density DNA MicroarrayPatricia Alvarez,1* Pilar Saenz,2 David Arteta,2 Antonio Martınez,2 Miguel Pocovı,1
Laureano Simon,2 and Pilar Giraldo3
Background: High-density microarrays are powerfultools for expression analysis of thousands of genessimultaneously; however, experience with low-densitymicroarrays in gene expression studies has been limited.Methods: We developed an optimized procedure forgene expression analysis based on a microarray contain-ing 538 oligonucleotides and used this procedure toanalyze neoplastic cell lines and whole-blood samplesfrom healthy individuals and patients with differenthematologic neoplasias. Hierarchical clustering and theWelch t-test with adjusted P values were used for dataanalysis.Results: This procedure detects 0.2 fmol of mRNA andgenerates a linear response of 2 orders of magnitude,with CV values of <20% for hybridization and labelreplicates. We found statistically significant differencesbetween Jurkat and U937 cell lines, between bloodsamples from 15 healthy donors and 59 chronic lympho-cytic leukemia (CLL) samples, and between 6 acutemyeloid leukemia patients and 4 myelodysplastic syn-drome patients. A classification system constructedfrom the expression data predicted healthy or CLLstatus from a whole-blood sample with a 97% successrate.Conclusion: Transcriptional profiling of whole-bloodsamples was carried out without any cellular or samplemanipulation before RNA extraction. This gene expres-sion analysis procedure uncovered statistically signifi-cant differences associated with different hematologicneoplasias and made possible the construction of a
classification system that predicts the healthy or CLLstatus from a whole-blood sample.© 2007 American Association for Clinical Chemistry
Hematologic neoplasias (HNs)4 are malignant transfor-mations that produce a clonal proliferation of differentcell types involved in the hematopoietic system. Cur-rently, HNs are analyzed and classified on the basis ofmorphologic characteristics, cell surface markers, immu-nohistochemistry, cytogenetic aberrations, and molecularmarkers (1 ). Some patients, however, cannot easily beclassified at diagnosis by standard criteria, and suchpatients can exhibit heterogeneous clinical outcomes orresponses to therapy. This heterogeneity has created aneed for improved analysis methods or new markers fordiagnosis and classification of these malignancies. DNAmicroarrays have the potential for global mRNA analysis,and gene expression patterns typical for different HNshave been identified with this tool. In 1999, Golub et al.(2 ) showed that expression profiles for only 50 genes weresufficient to classify leukemia samples as acute lymphoidleukemia or acute myeloid leukemia (AML). In addition,other studies that have applied this technology haveidentified HN disease subgroups not previously known tobe related (3, 4) and discovered new prognostic markersfor such diseases (5 ).
High-density microarrays that measure the expressionof thousands of genes have drawbacks, such as high costsand lengthy times for data analysis and interpretation.The widely used Affymetrix technology holds the stan-dardization advantage with respect to probes, hybridiza-tion protocols, and data quantification (6 ). Nevertheless,this technology has been used mainly for projects involv-ing few samples because the high cost prohibits its use foranalyzing large numbers of samples. Low-density mi-
1 Departamento de Bioquımica y Biologıa Molecular y Celular, Univer-sidad de Zaragoza, Zaragoza, Spain.
2 Progenika Biopharma S.A., Derio, Spain.3 Servicio de Hematologıa, Hospital Universitario Miguel Servet, Zara-
goza, Spain.*Address correspondence to this author at: Departamento de Bioquımica y
Biologıa Molecular y Celular, Universidad de Zaragoza, 50009 Zaragoza,Spain. Fax 976761236; e-mail [email protected].
Received July 4, 2006; accepted November 21, 2006.Previously published online at DOI: 10.1373/clinchem.2006.075887
4 Nonstandard abbreviations: HN, hematologic neoplasia; AML, acutemyeloid leukemia; B-CLL, B-cell chronic lymphocytic leukemia; cRNA, com-plementary RNA; VSN, variance stabilization normalization; maxT, step-downmultiple-testing procedure; MDS, myelodysplastic syndrome.
Clinical Chemistry 53:2259–267 (2007) Hematology
259
croarrays, however, offer an inexpensive, fast, and rela-tively easy way to analyze gene expression (7 ) that ismore suitable for routine applications (8 ).
Our aim was to analyze the transcriptional profiling ofwhole blood from HN patients with a low-density mi-croarray to obtain a molecular characterization of eachneoplasia.
Materials and Methodscell culturesTotal RNA from U937 and Jurkat cell line cultures wasisolated with TRIzol (Life Technologies/Invitrogen) andpurified with the RNeasy Mini Kit (Qiagen).
blood samplesPeripheral blood samples from 15 healthy donors, 59B-cell chronic lymphocytic leukemia (B-CLL) patients,and 13 patients with myeloid neoplasia were collected inPAXgene tubes (PreAnalytiX). All procedures were ap-proved by the Ethics Committee for Clinical Investigationof Aragon in accordance with the Helsinki Declaration of1975. All patients were diagnosed at the Hospital Univer-sitario Miguel Servet of Zaragoza according to the WHOclassification (1 ). Total RNA was extracted with thePAXgene Blood RNA Kit (Qiagen).
array description and quality controlsThe array used in this work [Fundacion para el Estudio dela Hematologia y la Hemoterapia en Aragon (FEHHA)Human Hematochip 8K; ArrayExpress accession no. A-MEXP-336] contains 538 probes (35-mer to 50-mer oligo-nucleotides) that represent 538 genes involved in cellproliferation, cell cycle activation, transcription, apopto-sis, hematopoietic cell biology, leukemia, lymphoma, orcancer. The complete list of genes is available (see Table 1in the Data Supplement that accompanies the onlineversion of this article at http://www.clinchem.org/content/vol53/issue2). To monitor the efficiency of thecomplete process, we included 7 probes complementaryto 7 external poly(dA) standards (external mRNA controlsadded to each total RNA sample before labeling) selectedfrom Bacillus subtilis and plum pox virus genes (see Table2 in the online Data Supplement). To monitor the hybrid-ization and reading processes, we also included 7 probescomplementary to 7 biotinylated DNA sequences [posi-tive hybridization controls added to complementary RNA(cRNA) before hybridization] selected from Arabidopsisthaliana and Trypanosoma brucei genes (see Table 3 in theonline Data Supplement). In addition, 3 probes comple-mentary to nonhuman genes were added as controls forhybridization specificity. To measure the intraarray im-precision, we included each probe in 12-fold redundancyat different array locations. This organization generatedan array of 8192 spots distributed in 32 areas, with 16rows � 16 columns.
array fabricationProbes were spotted onto aminosilane-coated glass slides(Corning) with a MicroGrid II 610 robotic spotter(Genomic Solutions) under controlled humidity and tem-perature conditions. Probes were attached to slides bycross-linking with ultraviolet radiation and baking at80 °C.
synthesis of biotinylated cRNA andfragmentationSingle-strand cDNA was generated from 5 �g total RNAwith external controls by means of a poly(dT) oligonucle-otide that contains a T7 RNA polymerase-initiation site.Double-stranded cDNA was used as a template to gener-ate biotinylated cRNA by in vitro transcription with theMEGAscript T7 High Yield Transcription Kit (Ambion) inthe presence of biotin-11-UTP and biotin-11-CTP(PerkinElmer). The reaction mixture was incubated for 5 hat 37 °C. cRNA was purified with the RNeasy Mini Kitand fragmented in 40 mmol/L Tris-acetate, pH 8.1,100 mmol/L potassium acetate, and 30 mmol/L magne-sium acetate at 94 °C for 35 min.
rna yield and qualityWe quantified the amount of total RNA and biotinylatedcRNA by ultraviolet absorbance at 260 nm, purity by theA260/A280 ratio, and integrity by electrophoresis on a 1%agarose gel containing ethidium bromure.
array hybridization, scanning, andquantificationTen micrograms of fragmented cRNA was denatured at95 °C for 5 min and immediately placed on ice untilhybridization. Automatic hybridization was carried out at42 °C for 6 h in a Ventana Discovery station (VentanaMedical Systems) with ChipMap Kit hybridization buffersand the protocol for the Microarray 9.0 Europe station(Ventana Medical Systems). Arrays were stained withCy3-conjugated streptavidin (Amersham Biosciences) andscanned with a ScanArray 4000 scanner (PerkinElmer).An image of the hybridized array is shown in Fig. 1 in theonline Data Supplement. The image obtained was used toquantify fluorescence intensities with QuantArray 3.0software (PerkinElmer). We calculated hybridization sig-nals in each spot with the median pixel for each spot andlocal background correction. The trimmed mean of thehybridization signal for each probe was calculated fromreplicate spots.
data pretreatmentThe mean of whole-array hybridization, the mean back-ground signal, the CV for each replicated probe, and thevalues for the positive and negative controls were deter-mined as quality-control measurements. To ensure reli-able results, we set these values within a range of exper-imentally obtained values.
260 Alvarez et al.: Hematologic Microarray
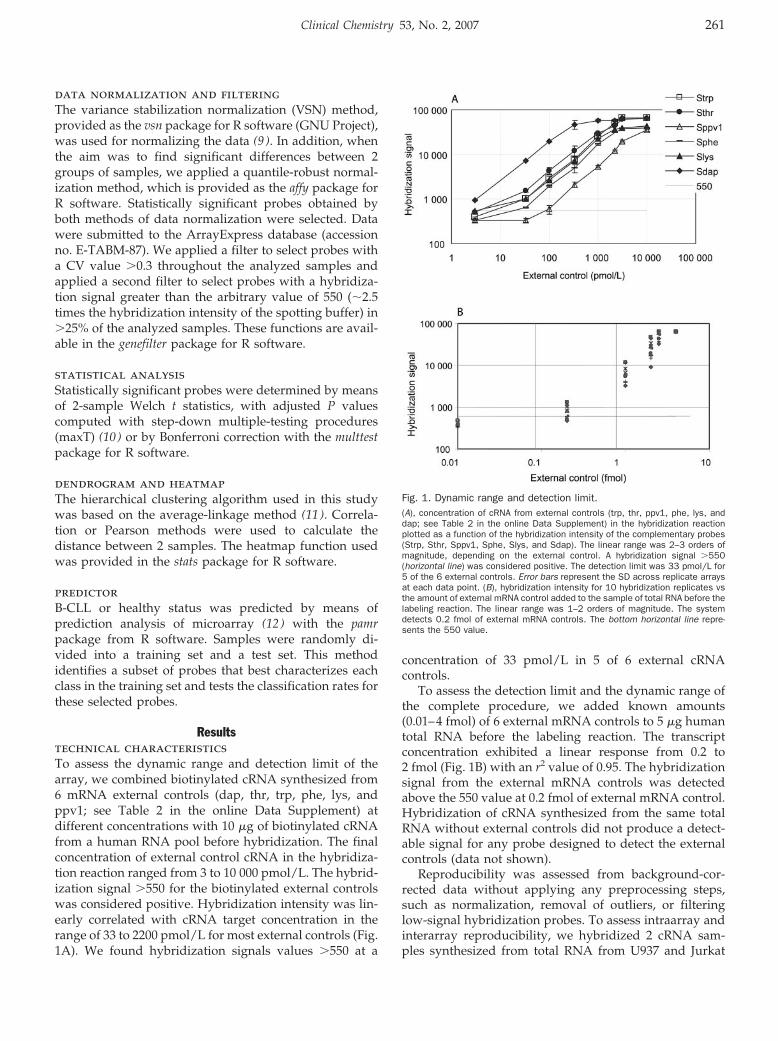
data normalization and filteringThe variance stabilization normalization (VSN) method,provided as the vsn package for R software (GNU Project),was used for normalizing the data (9 ). In addition, whenthe aim was to find significant differences between 2groups of samples, we applied a quantile-robust normal-ization method, which is provided as the affy package forR software. Statistically significant probes obtained byboth methods of data normalization were selected. Datawere submitted to the ArrayExpress database (accessionno. E-TABM-87). We applied a filter to select probes witha CV value �0.3 throughout the analyzed samples andapplied a second filter to select probes with a hybridiza-tion signal greater than the arbitrary value of 550 (�2.5times the hybridization intensity of the spotting buffer) in�25% of the analyzed samples. These functions are avail-able in the genefilter package for R software.
statistical analysisStatistically significant probes were determined by meansof 2-sample Welch t statistics, with adjusted P valuescomputed with step-down multiple-testing procedures(maxT) (10 ) or by Bonferroni correction with the multtestpackage for R software.
dendrogram and heatmapThe hierarchical clustering algorithm used in this studywas based on the average-linkage method (11 ). Correla-tion or Pearson methods were used to calculate thedistance between 2 samples. The heatmap function usedwas provided in the stats package for R software.
predictorB-CLL or healthy status was predicted by means ofprediction analysis of microarray (12 ) with the pamrpackage from R software. Samples were randomly di-vided into a training set and a test set. This methodidentifies a subset of probes that best characterizes eachclass in the training set and tests the classification rates forthese selected probes.
Resultstechnical characteristicsTo assess the dynamic range and detection limit of thearray, we combined biotinylated cRNA synthesized from6 mRNA external controls (dap, thr, trp, phe, lys, andppv1; see Table 2 in the online Data Supplement) atdifferent concentrations with 10 �g of biotinylated cRNAfrom a human RNA pool before hybridization. The finalconcentration of external control cRNA in the hybridiza-tion reaction ranged from 3 to 10 000 pmol/L. The hybrid-ization signal �550 for the biotinylated external controlswas considered positive. Hybridization intensity was lin-early correlated with cRNA target concentration in therange of 33 to 2200 pmol/L for most external controls (Fig.1A). We found hybridization signals values �550 at a
concentration of 33 pmol/L in 5 of 6 external cRNAcontrols.
To assess the detection limit and the dynamic range ofthe complete procedure, we added known amounts(0.01–4 fmol) of 6 external mRNA controls to 5 �g humantotal RNA before the labeling reaction. The transcriptconcentration exhibited a linear response from 0.2 to2 fmol (Fig. 1B) with an r2 value of 0.95. The hybridizationsignal from the external mRNA controls was detectedabove the 550 value at 0.2 fmol of external mRNA control.Hybridization of cRNA synthesized from the same totalRNA without external controls did not produce a detect-able signal for any probe designed to detect the externalcontrols (data not shown).
Reproducibility was assessed from background-cor-rected data without applying any preprocessing steps,such as normalization, removal of outliers, or filteringlow-signal hybridization probes. To assess intraarray andinterarray reproducibility, we hybridized 2 cRNA sam-ples synthesized from total RNA from U937 and Jurkat
Fig. 1. Dynamic range and detection limit.(A), concentration of cRNA from external controls (trp, thr, ppv1, phe, lys, anddap; see Table 2 in the online Data Supplement) in the hybridization reactionplotted as a function of the hybridization intensity of the complementary probes(Strp, Sthr, Sppv1, Sphe, Slys, and Sdap). The linear range was 2–3 orders ofmagnitude, depending on the external control. A hybridization signal �550(horizontal line) was considered positive. The detection limit was 33 pmol/L for5 of the 6 external controls. Error bars represent the SD across replicate arraysat each data point. (B), hybridization intensity for 10 hybridization replicates vsthe amount of external mRNA control added to the sample of total RNA before thelabeling reaction. The linear range was 1–2 orders of magnitude. The systemdetects 0.2 fmol of external mRNA controls. The bottom horizontal line repre-sents the 550 value.
Clinical Chemistry 53, No. 2, 2007 261
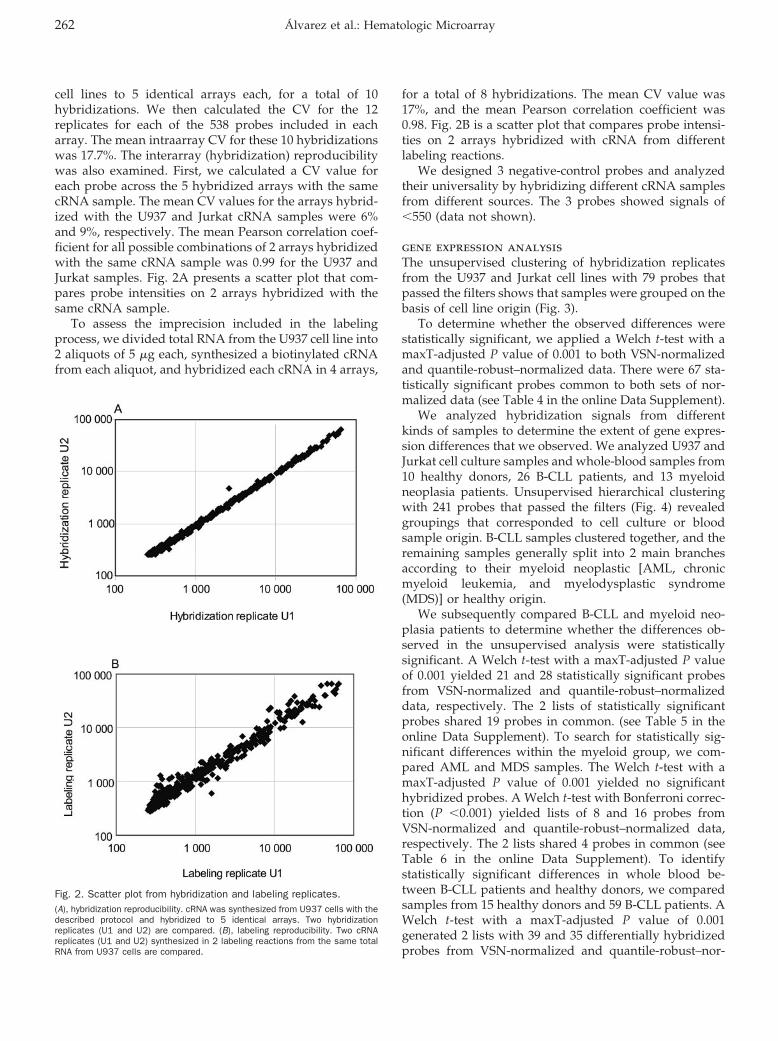
cell lines to 5 identical arrays each, for a total of 10hybridizations. We then calculated the CV for the 12replicates for each of the 538 probes included in eacharray. The mean intraarray CV for these 10 hybridizationswas 17.7%. The interarray (hybridization) reproducibilitywas also examined. First, we calculated a CV value foreach probe across the 5 hybridized arrays with the samecRNA sample. The mean CV values for the arrays hybrid-ized with the U937 and Jurkat cRNA samples were 6%and 9%, respectively. The mean Pearson correlation coef-ficient for all possible combinations of 2 arrays hybridizedwith the same cRNA sample was 0.99 for the U937 andJurkat samples. Fig. 2A presents a scatter plot that com-pares probe intensities on 2 arrays hybridized with thesame cRNA sample.
To assess the imprecision included in the labelingprocess, we divided total RNA from the U937 cell line into2 aliquots of 5 �g each, synthesized a biotinylated cRNAfrom each aliquot, and hybridized each cRNA in 4 arrays,
for a total of 8 hybridizations. The mean CV value was17%, and the mean Pearson correlation coefficient was0.98. Fig. 2B is a scatter plot that compares probe intensi-ties on 2 arrays hybridized with cRNA from differentlabeling reactions.
We designed 3 negative-control probes and analyzedtheir universality by hybridizing different cRNA samplesfrom different sources. The 3 probes showed signals of�550 (data not shown).
gene expression analysisThe unsupervised clustering of hybridization replicatesfrom the U937 and Jurkat cell lines with 79 probes thatpassed the filters shows that samples were grouped on thebasis of cell line origin (Fig. 3).
To determine whether the observed differences werestatistically significant, we applied a Welch t-test with amaxT-adjusted P value of 0.001 to both VSN-normalizedand quantile-robust–normalized data. There were 67 sta-tistically significant probes common to both sets of nor-malized data (see Table 4 in the online Data Supplement).
We analyzed hybridization signals from differentkinds of samples to determine the extent of gene expres-sion differences that we observed. We analyzed U937 andJurkat cell culture samples and whole-blood samples from10 healthy donors, 26 B-CLL patients, and 13 myeloidneoplasia patients. Unsupervised hierarchical clusteringwith 241 probes that passed the filters (Fig. 4) revealedgroupings that corresponded to cell culture or bloodsample origin. B-CLL samples clustered together, and theremaining samples generally split into 2 main branchesaccording to their myeloid neoplastic [AML, chronicmyeloid leukemia, and myelodysplastic syndrome(MDS)] or healthy origin.
We subsequently compared B-CLL and myeloid neo-plasia patients to determine whether the differences ob-served in the unsupervised analysis were statisticallysignificant. A Welch t-test with a maxT-adjusted P valueof 0.001 yielded 21 and 28 statistically significant probesfrom VSN-normalized and quantile-robust–normalizeddata, respectively. The 2 lists of statistically significantprobes shared 19 probes in common. (see Table 5 in theonline Data Supplement). To search for statistically sig-nificant differences within the myeloid group, we com-pared AML and MDS samples. The Welch t-test with amaxT-adjusted P value of 0.001 yielded no significanthybridized probes. A Welch t-test with Bonferroni correc-tion (P �0.001) yielded lists of 8 and 16 probes fromVSN-normalized and quantile-robust–normalized data,respectively. The 2 lists shared 4 probes in common (seeTable 6 in the online Data Supplement). To identifystatistically significant differences in whole blood be-tween B-CLL patients and healthy donors, we comparedsamples from 15 healthy donors and 59 B-CLL patients. AWelch t-test with a maxT-adjusted P value of 0.001generated 2 lists with 39 and 35 differentially hybridizedprobes from VSN-normalized and quantile-robust–nor-
Fig. 2. Scatter plot from hybridization and labeling replicates.(A), hybridization reproducibility. cRNA was synthesized from U937 cells with thedescribed protocol and hybridized to 5 identical arrays. Two hybridizationreplicates (U1 and U2) are compared. (B), labeling reproducibility. Two cRNAreplicates (U1 and U2) synthesized in 2 labeling reactions from the same totalRNA from U937 cells are compared.
262 Alvarez et al.: Hematologic Microarray
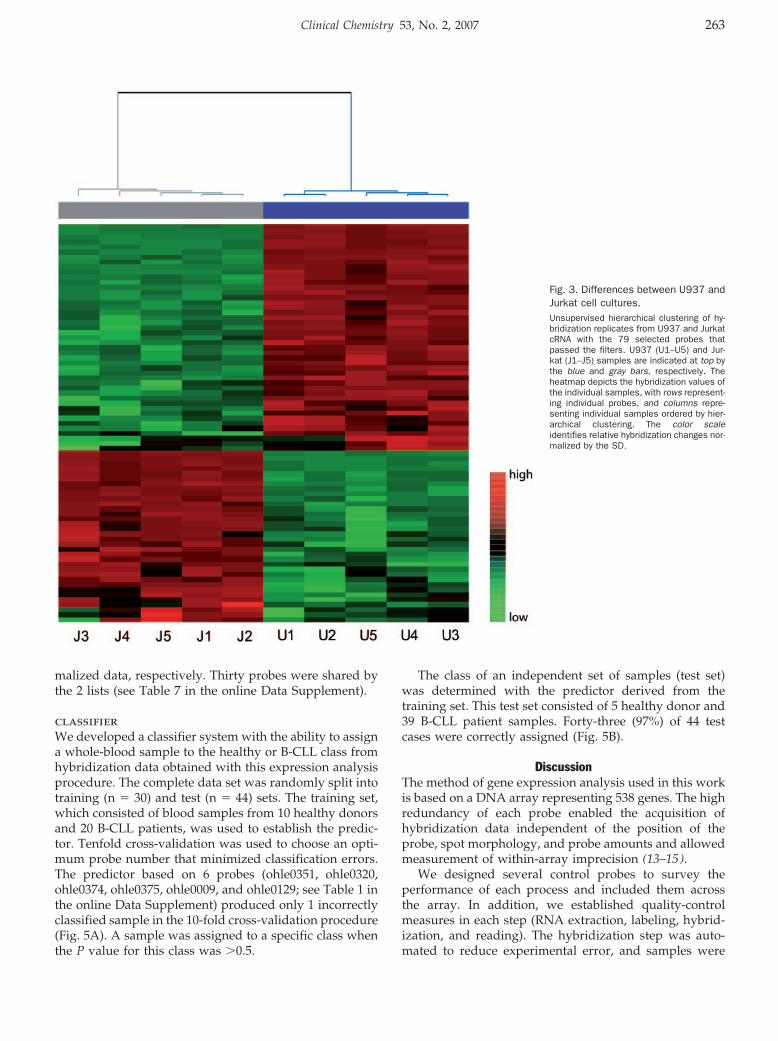
malized data, respectively. Thirty probes were shared bythe 2 lists (see Table 7 in the online Data Supplement).
classifierWe developed a classifier system with the ability to assigna whole-blood sample to the healthy or B-CLL class fromhybridization data obtained with this expression analysisprocedure. The complete data set was randomly split intotraining (n � 30) and test (n � 44) sets. The training set,which consisted of blood samples from 10 healthy donorsand 20 B-CLL patients, was used to establish the predic-tor. Tenfold cross-validation was used to choose an opti-mum probe number that minimized classification errors.The predictor based on 6 probes (ohle0351, ohle0320,ohle0374, ohle0375, ohle0009, and ohle0129; see Table 1 inthe online Data Supplement) produced only 1 incorrectlyclassified sample in the 10-fold cross-validation procedure(Fig. 5A). A sample was assigned to a specific class whenthe P value for this class was �0.5.
The class of an independent set of samples (test set)was determined with the predictor derived from thetraining set. This test set consisted of 5 healthy donor and39 B-CLL patient samples. Forty-three (97%) of 44 testcases were correctly assigned (Fig. 5B).
DiscussionThe method of gene expression analysis used in this workis based on a DNA array representing 538 genes. The highredundancy of each probe enabled the acquisition ofhybridization data independent of the position of theprobe, spot morphology, and probe amounts and allowedmeasurement of within-array imprecision (13–15).
We designed several control probes to survey theperformance of each process and included them acrossthe array. In addition, we established quality-controlmeasures in each step (RNA extraction, labeling, hybrid-ization, and reading). The hybridization step was auto-mated to reduce experimental error, and samples were
Fig. 3. Differences between U937 andJurkat cell cultures.Unsupervised hierarchical clustering of hy-bridization replicates from U937 and JurkatcRNA with the 79 selected probes thatpassed the filters. U937 (U1–U5) and Jur-kat (J1–J5) samples are indicated at top bythe blue and gray bars, respectively. Theheatmap depicts the hybridization values ofthe individual samples, with rows represent-ing individual probes, and columns repre-senting individual samples ordered by hier-archical clustering. The color scaleidentifies relative hybridization changes nor-malized by the SD.
Clinical Chemistry 53, No. 2, 2007 263
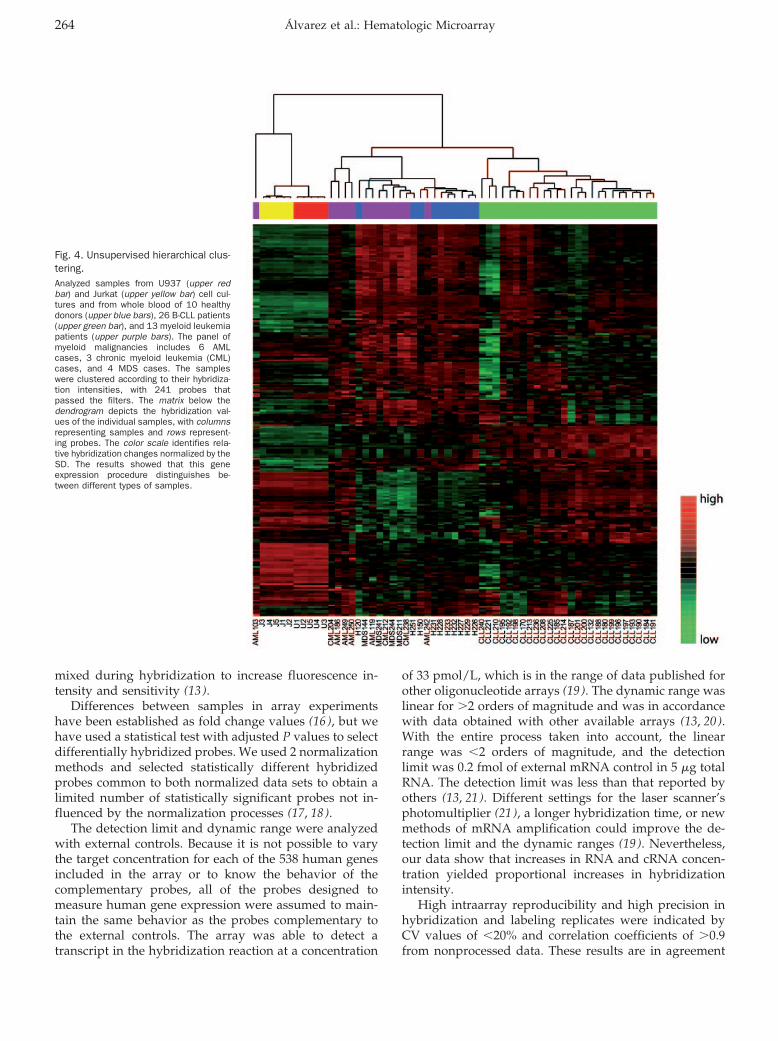
mixed during hybridization to increase fluorescence in-tensity and sensitivity (13 ).
Differences between samples in array experimentshave been established as fold change values (16 ), but wehave used a statistical test with adjusted P values to selectdifferentially hybridized probes. We used 2 normalizationmethods and selected statistically different hybridizedprobes common to both normalized data sets to obtain alimited number of statistically significant probes not in-fluenced by the normalization processes (17, 18).
The detection limit and dynamic range were analyzedwith external controls. Because it is not possible to varythe target concentration for each of the 538 human genesincluded in the array or to know the behavior of thecomplementary probes, all of the probes designed tomeasure human gene expression were assumed to main-tain the same behavior as the probes complementary tothe external controls. The array was able to detect atranscript in the hybridization reaction at a concentration
of 33 pmol/L, which is in the range of data published forother oligonucleotide arrays (19 ). The dynamic range waslinear for �2 orders of magnitude and was in accordancewith data obtained with other available arrays (13, 20).With the entire process taken into account, the linearrange was �2 orders of magnitude, and the detectionlimit was 0.2 fmol of external mRNA control in 5 �g totalRNA. The detection limit was less than that reported byothers (13, 21). Different settings for the laser scanner’sphotomultiplier (21 ), a longer hybridization time, or newmethods of mRNA amplification could improve the de-tection limit and the dynamic ranges (19 ). Nevertheless,our data show that increases in RNA and cRNA concen-tration yielded proportional increases in hybridizationintensity.
High intraarray reproducibility and high precision inhybridization and labeling replicates were indicated byCV values of �20% and correlation coefficients of �0.9from nonprocessed data. These results are in agreement
Fig. 4. Unsupervised hierarchical clus-tering.Analyzed samples from U937 (upper redbar) and Jurkat (upper yellow bar) cell cul-tures and from whole blood of 10 healthydonors (upper blue bars), 26 B-CLL patients(upper green bar), and 13 myeloid leukemiapatients (upper purple bars). The panel ofmyeloid malignancies includes 6 AMLcases, 3 chronic myeloid leukemia (CML)cases, and 4 MDS cases. The sampleswere clustered according to their hybridiza-tion intensities, with 241 probes thatpassed the filters. The matrix below thedendrogram depicts the hybridization val-ues of the individual samples, with columnsrepresenting samples and rows represent-ing probes. The color scale identifies rela-tive hybridization changes normalized by theSD. The results showed that this geneexpression procedure distinguishes be-tween different types of samples.
264 Alvarez et al.: Hematologic Microarray
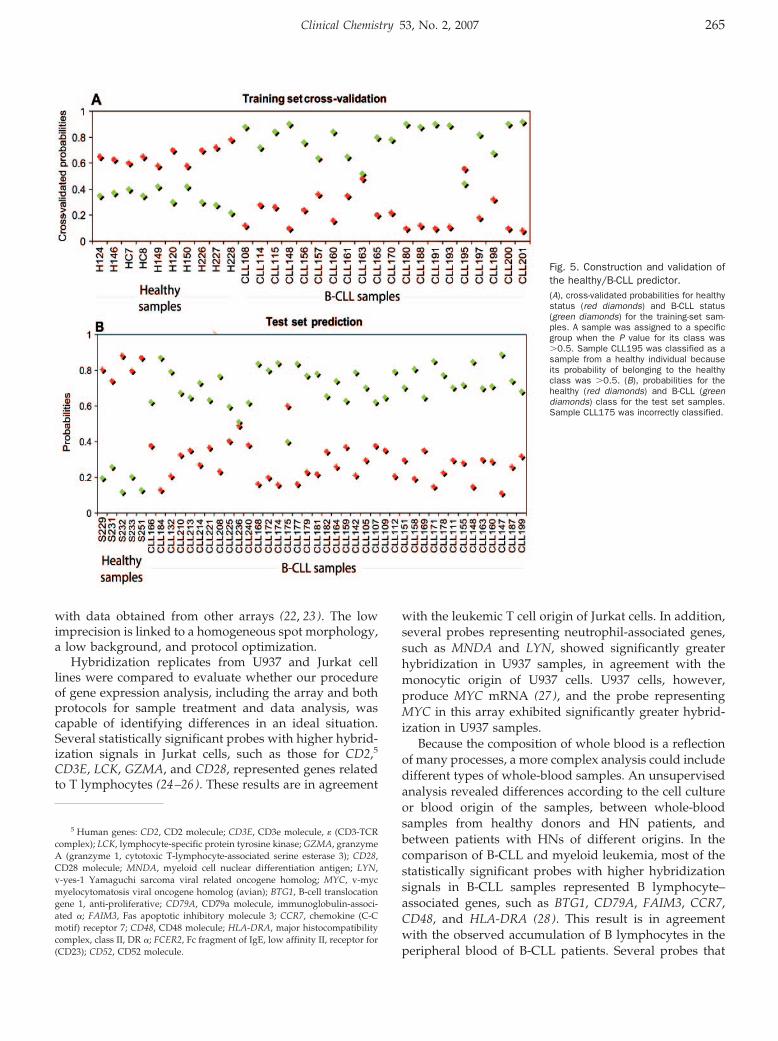
with data obtained from other arrays (22, 23). The lowimprecision is linked to a homogeneous spot morphology,a low background, and protocol optimization.
Hybridization replicates from U937 and Jurkat celllines were compared to evaluate whether our procedureof gene expression analysis, including the array and bothprotocols for sample treatment and data analysis, wascapable of identifying differences in an ideal situation.Several statistically significant probes with higher hybrid-ization signals in Jurkat cells, such as those for CD2,5
CD3E, LCK, GZMA, and CD28, represented genes relatedto T lymphocytes (24–26). These results are in agreement
with the leukemic T cell origin of Jurkat cells. In addition,several probes representing neutrophil-associated genes,such as MNDA and LYN, showed significantly greaterhybridization in U937 samples, in agreement with themonocytic origin of U937 cells. U937 cells, however,produce MYC mRNA (27 ), and the probe representingMYC in this array exhibited significantly greater hybrid-ization in U937 samples.
Because the composition of whole blood is a reflectionof many processes, a more complex analysis could includedifferent types of whole-blood samples. An unsupervisedanalysis revealed differences according to the cell cultureor blood origin of the samples, between whole-bloodsamples from healthy donors and HN patients, andbetween patients with HNs of different origins. In thecomparison of B-CLL and myeloid leukemia, most of thestatistically significant probes with higher hybridizationsignals in B-CLL samples represented B lymphocyte–associated genes, such as BTG1, CD79A, FAIM3, CCR7,CD48, and HLA-DRA (28). This result is in agreementwith the observed accumulation of B lymphocytes in theperipheral blood of B-CLL patients. Several probes that
5 Human genes: CD2, CD2 molecule; CD3E, CD3e molecule, � (CD3-TCRcomplex); LCK, lymphocyte-specific protein tyrosine kinase; GZMA, granzymeA (granzyme 1, cytotoxic T-lymphocyte-associated serine esterase 3); CD28,CD28 molecule; MNDA, myeloid cell nuclear differentiation antigen; LYN,v-yes-1 Yamaguchi sarcoma viral related oncogene homolog; MYC, v-mycmyelocytomatosis viral oncogene homolog (avian); BTG1, B-cell translocationgene 1, anti-proliferative; CD79A, CD79a molecule, immunoglobulin-associ-ated �; FAIM3, Fas apoptotic inhibitory molecule 3; CCR7, chemokine (C-Cmotif) receptor 7; CD48, CD48 molecule; HLA-DRA, major histocompatibilitycomplex, class II, DR �; FCER2, Fc fragment of IgE, low affinity II, receptor for(CD23); CD52, CD52 molecule.
Fig. 5. Construction and validation ofthe healthy/B-CLL predictor.(A), cross-validated probabilities for healthystatus (red diamonds) and B-CLL status(green diamonds) for the training-set sam-ples. A sample was assigned to a specificgroup when the P value for its class was�0.5. Sample CLL195 was classified as asample from a healthy individual becauseits probability of belonging to the healthyclass was �0.5. (B), probabilities for thehealthy (red diamonds) and B-CLL (greendiamonds) class for the test set samples.Sample CLL175 was incorrectly classified.
Clinical Chemistry 53, No. 2, 2007 265
showed differences between blood samples from healthydonors and B-CLL patients represented genes that havepreviously been described for B-CLL gene expressionstudies that used different expression-analysis platformsor different starting material, such as polymorphic mono-nucleated blood cells (29 ) or CD19-selected cells (30, 31).Expression of FCER2 (32, 33), CD52 (34), FAIM3 (33),CCR7 (30), HLA-DRA (34), and BTG1 (29) has beenassociated with B-CLL. Probes that represent these genesare significantly more hybridized in B-CLL samples thanin samples from healthy individuals. The observed differ-ences may reflect differences between these groups ofsamples in the cellular composition of whole blood,indicating that the system we have described is able toidentify relevant genes and therefore is useful for analyz-ing expression profiles in HN samples. We found severalprobes for elongation factors and ribosomal proteins withmore hybridization in B-CLL samples than in healthysamples. These results do not match those of previousstudies (34, 35) and may be attributable to differences inthe procedures used in the gene expression analyses.Moreover, hybridization notably depends on transcriptconcentration, as well as on interaction affinity and probeaccessibility. In addition, we found statistically significantdifferences between AML and MDS samples, but theprobes we obtained had not previously been describedand did not correlate with compared groups. Additionalstudies are required to confirm these results.
Also, this study presents a classification system basedon hybridization intensity for predicting the healthy orB-CLL status of an unknown whole-blood sample. Weclassified an independent set of samples to validate thesystem, and our 97% success rate suggests that the set ofprobes extracted from this assay can predict the origin ofa whole-blood sample (i.e., from a healthy individual or aB-CLL patient).
In summary, we have developed a viable procedure forgene expression analysis of HN that is based on a low-density array. We consider our results satisfactory, be-cause we obtained technical characteristics similar tothose described by other groups and to commercial ar-rays. We analyzed whole blood from HN patients withoutseparating any cellular component or manipulating thesamples before RNA extraction. Several results were inaccordance with results in the literature or with charac-teristics of the compared samples. Our results support theuse of this analytic procedure for the study of geneexpression in HN.
We thank Progenika Biopharma for technical assistance,especially Dr. Tejedor and Dr. Jimenez for collaboration inprotocol optimization. We also thank Inge Villar forspotting the arrays and Dr. Javier Naval for providing theU937 and Jurkat cell lines. This work was supported bygrants from the Fundacion para el Estudio de la Hemato-
logia y la Hemoterapia en Aragon (FEHHA) and theMutua Madrilena Automovil Foundation. This array hasbeen patented by the authors (accession no. PCT/ES2006/070054).
References1. Jaffe ES, Harris NL, Stein H, Vardiman JW, eds. WHO Classifica-
tion of Tumours: Pathology and Genetics of Tumours of Haemato-poietic and Lymphoid Tissues. Lyon, France: IARC Press, 2001.
2. Golub TR, Slonim DK, Tamayo P, Huard C, Gaasenbeek M, MesirovJP, et al. Molecular classification of cancer: class discovery andclass prediction by gene expression monitoring. Science 1999;286:531–7.
3. Alizadeh AA, Eisen MB, Davis RE, Ma C, Lossos IS, Rosenwald A,et al. Distinct types of diffuse large B-cell lymphoma identified bygene expression profiling. Nature 2000;403:503–11.
4. Valk PJ, Verhaak RG, Beijen MA, Erpelinck CA, Barjesteh vanWaalwijk van Doorn-Khosrovani S, Boer JM, et al. Prognosticallyuseful gene-expression profiles in acute myeloid leukemia. N EnglJ Med 2004;350:1617–28.
5. Rosenwald A, Alizadeh AA, Widhopf G, Simon R, Davis RE, Yu X, etal. Relation of gene expression phenotype to immunoglobulinmutation genotype in B cell chronic lymphocytic leukemia. J ExpMed 2001;194:1639–47.
6. Irizarry RA, Warren D, Spencer F, Kim IF, Biswal S, Frank BC, et al.Multiple-laboratory comparison of microarray platforms. Nat Meth-ods 2005;2:345–50.
7. de Longueville F, Atienzar FA, Marcq L, Dufrane S, Evrard S,Wouters L, et al. Use of a low-density microarray for studying geneexpression patterns induced by hepatotoxicants on primary cul-tures of rat hepatocytes. Toxicol Sci 2003;75:378–92.
8. Gillet JP, Efferth T, Steinbach D, Hamels J, de Longueville F,Bertholet V, et al. Microarray-based detection of multidrug resis-tance in human tumor cells by expression profiling of ATP-bindingcassette transporter genes. Cancer Res 2004;64:8987–93.
9. Huber W, von Heydebreck A, Sultmann H, Poustka A, Vingron M.Variance stabilization applied to microarray data calibration and tothe quantification of differential expression. Bioinformatics 2002;18(Suppl 1):96–104.
10. Smyth GK, Yang YH, Speed T. Statistical issues in cDNA microar-ray data analysis. Methods Mol Biol 2003;224:111–36.
11. Eisen MB, Spellman PT, Brown PO, Botstein D. Cluster analysisand display of genome-wide expression patterns. Proc Natl AcadSci U S A 1998;95:14863–8.
12. Tibshirani R, Hastie T, Narasimhan B, Chu G. Diagnosis ofmultiple cancer types by shrunken centroids of gene expression.Proc Natl Acad Sci U S A 2002;99:6567–72.
13. Ramakrishnan R, Dorris D, Lublinsky A, Nguyen A, Domanus M,Prokhorova A, et al. An assessment of Motorola CodeLink microar-ray performance for gene expression profiling applications. Nu-cleic Acids Res 2002;30:e30.
14. Lee ML, Kuo FC, Whitmore GA, Sklar J. Importance of replicationin microarray gene expression studies: statistical methods andevidence from repetitive cDNA hybridizations. Proc Natl Acad SciU S A 2000;97:9834–9.
15. Tseng GC, Oh MK, Rohlin L, Liao JC, Wong WH. Issues in cDNAmicroarray analysis: quality filtering, channel normalization, mod-els of variations and assessment of gene effects. Nucleic AcidsRes 2001;29:2549–57.
16. Hoheisel JD. Microarray technology: beyond transcript profilingand genotype analysis. Nat Rev Genet 2006;7:200–10.
17. Hoffmann R, Seidl T, Dugas M. Profound effect of normalization ondetection of differentially expressed genes in oligonucleotidemicroarray data analysis. Genome Biol 2002;3:RESEARCH0033.
266 Alvarez et al.: Hematologic Microarray
18. Ding Y, Wilkins D. The effect of normalization on microarray dataanalysis. DNA Cell Biol 2004;23:635–42.
19. Chudin E, Walker R, Kosaka A, Wu SX, Rabert D, Chang TK, et al.Assessment of the relationship between signal intensities andtranscript concentration for Affymetrix GeneChip arrays. GenomeBiol 2002;3:RESEARCH0005.
20. Albert TJ, Norton J, Ott M, Richmond T, Nuwaysir K, Nuwaysir EF,et al. Light-directed 5�33� synthesis of complex oligonucleotidemicroarrays. Nucleic Acids Res 2003;31:e35.
21. de Longueville F, Surry D, Meneses-Lorente G, Bertholet V, TalbotV, Evrard S, et al. Gene expression profiling of drug metabolismand toxicology markers using a low-density DNA microarray.Biochem Pharmacol 2002;64:137–49.
22. Bakay M, Chen YW, Borup R, Zhao P, Nagaraju K, Hoffman EP.Sources of variability and effect of experimental approach onexpression profiling data interpretation. BMC Bioinformatics2002;3:4.
23. Bammler T, Beyer RP, Bhattacharya S, Boorman GA, Boyles A,Bradford BU, et al. Standardizing global gene expression analysisbetween laboratories and across platforms. Nat Methods 2005;2:351–6.
24. Veillette A, Abraham N, Caron L, Davidson D. The lymphocyte-specific tyrosine protein kinase p56lck. Semin Immunol 1991;3:143–52.
25. Gershenfeld HK, Weissman IL. Cloning of a cDNA for a T cell-specific serine protease from a cytotoxic T lymphocyte. Science1986;232:854–8.
26. Edmead CE, Lamb JR, Hoyne GF. The T cell surface protein, CD28.Int J Biochem Cell Biol 1997;29:1053–7.
27. Einat M, Resnitzky D, Kimchi A. Close link between reduction ofc-myc expression by interferon and, G0/G1 arrest. Nature 1985;313:597–600.
28. Whitney AR, Diehn M, Popper SJ, Alizadeh AA, Boldrick JC, RelmanDA, et al. Individuality and variation in gene expression patterns inhuman blood. Proc Natl Acad Sci U S A 2003;100:1896–901.
29. Stratowa C, Loffler G, Lichter P, Stilgenbauer S, Haberl P, Schwe-ifer N, et al. cDNA microarray gene expression analysis of B-cellchronic lymphocytic leukemia proposes potential new prognosticmarkers involved in lymphocyte trafficking. Int J Cancer 2001;91:474–80.
30. Klein U, Tu Y, Stolovitzky GA, Mattioli M, Cattoretti G, Husson H,et al. Gene expression profiling of B cell chronic lymphocyticleukemia reveals a homogeneous phenotype related to memory Bcells. J Exp Med 2001;194:1625–38.
31. Jelinek DF, Tschumper RC, Stolovitzky GA, Iturria SJ, Tu Y, LepreJ, et al. Identification of a global gene expression signature ofB-chronic lymphocytic leukemia. Mol Cancer Res 2003;1:346–61.
32. Zent CS, Zhan F, Schichman SA, Bumm KH, Lin P, Chen JB, et al.The distinct gene expression profiles of chronic lymphocyticleukemia and multiple myeloma suggest different anti-apoptoticmechanisms but predict only some differences in phenotype.Leuk Res 2003;27:765–74.
33. Zheng Z, Venkatapathy S, Rao G, Harrington CA. Expressionprofiling of B cell chronic lymphocytic leukemia suggests deficientCD1-mediated immunity, polarized cytokine response, alteredadhesion and increased intracellular protein transport and pro-cessing of leukemic cells. Leukemia 2002;16:2429–37.
34. Belov L, de la Vega O, dos Remedios CG, Mulligan SP, Chris-topherson RI. Immunophenotyping of leukemias using a cluster ofdifferentiation antibody microarray. Cancer Res 2001;61:4483–9.
35. Wang J, Coombes KR, Highsmith WE, Keating MJ, Abruzzo LV.Differences in gene expression between B-cell chronic lymphocyticleukemia and normal B cells: a meta-analysis of three microarraystudies. Bioinformatics 2004;20:3166–78.
Clinical Chemistry 53, No. 2, 2007 267
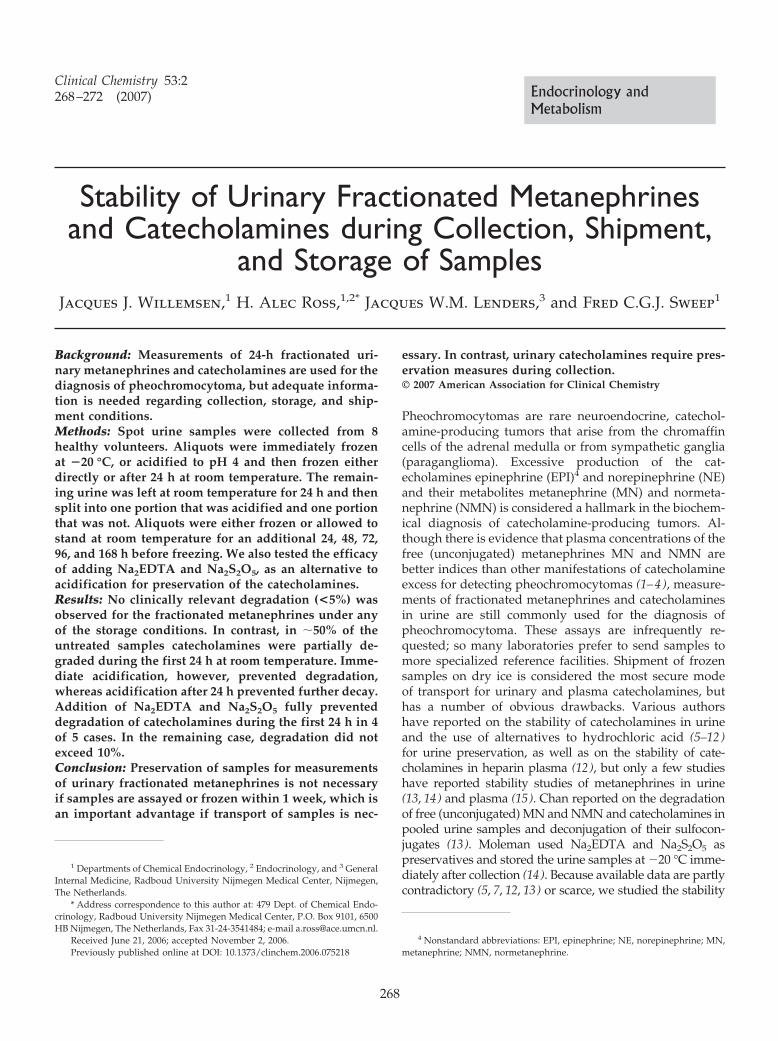
Stability of Urinary Fractionated Metanephrinesand Catecholamines during Collection, Shipment,
and Storage of SamplesJacques J. Willemsen,1 H. Alec Ross,1,2* Jacques W.M. Lenders,3 and Fred C.G.J. Sweep1
Background: Measurements of 24-h fractionated uri-nary metanephrines and catecholamines are used for thediagnosis of pheochromocytoma, but adequate informa-tion is needed regarding collection, storage, and ship-ment conditions.Methods: Spot urine samples were collected from 8healthy volunteers. Aliquots were immediately frozenat �20 °C, or acidified to pH 4 and then frozen eitherdirectly or after 24 h at room temperature. The remain-ing urine was left at room temperature for 24 h and thensplit into one portion that was acidified and one portionthat was not. Aliquots were either frozen or allowed tostand at room temperature for an additional 24, 48, 72,96, and 168 h before freezing. We also tested the efficacyof adding Na2EDTA and Na2S2O5, as an alternative toacidification for preservation of the catecholamines.Results: No clinically relevant degradation (<5%) wasobserved for the fractionated metanephrines under anyof the storage conditions. In contrast, in �50% of theuntreated samples catecholamines were partially de-graded during the first 24 h at room temperature. Imme-diate acidification, however, prevented degradation,whereas acidification after 24 h prevented further decay.Addition of Na2EDTA and Na2S2O5 fully preventeddegradation of catecholamines during the first 24 h in 4of 5 cases. In the remaining case, degradation did notexceed 10%.Conclusion: Preservation of samples for measurementsof urinary fractionated metanephrines is not necessaryif samples are assayed or frozen within 1 week, which isan important advantage if transport of samples is nec-
essary. In contrast, urinary catecholamines require pres-ervation measures during collection.© 2007 American Association for Clinical Chemistry
Pheochromocytomas are rare neuroendocrine, catechol-amine-producing tumors that arise from the chromaffincells of the adrenal medulla or from sympathetic ganglia(paraganglioma). Excessive production of the cat-echolamines epinephrine (EPI)4 and norepinephrine (NE)and their metabolites metanephrine (MN) and normeta-nephrine (NMN) is considered a hallmark in the biochem-ical diagnosis of catecholamine-producing tumors. Al-though there is evidence that plasma concentrations of thefree (unconjugated) metanephrines MN and NMN arebetter indices than other manifestations of catecholamineexcess for detecting pheochromocytomas (1–4), measure-ments of fractionated metanephrines and catecholaminesin urine are still commonly used for the diagnosis ofpheochromocytoma. These assays are infrequently re-quested; so many laboratories prefer to send samples tomore specialized reference facilities. Shipment of frozensamples on dry ice is considered the most secure modeof transport for urinary and plasma catecholamines, buthas a number of obvious drawbacks. Various authorshave reported on the stability of catecholamines in urineand the use of alternatives to hydrochloric acid (5–12)for urine preservation, as well as on the stability of cate-cholamines in heparin plasma (12), but only a few studieshave reported stability studies of metanephrines in urine(13, 14) and plasma (15). Chan reported on the degradationof free (unconjugated) MN and NMN and catecholamines inpooled urine samples and deconjugation of their sulfocon-jugates (13). Moleman used Na2EDTA and Na2S2O5 aspreservatives and stored the urine samples at �20 °C imme-diately after collection (14). Because available data are partlycontradictory (5, 7, 12, 13) or scarce, we studied the stability
1 Departments of Chemical Endocrinology, 2 Endocrinology, and 3 GeneralInternal Medicine, Radboud University Nijmegen Medical Center, Nijmegen,The Netherlands.
* Address correspondence to this author at: 479 Dept. of Chemical Endo-crinology, Radboud University Nijmegen Medical Center, P.O. Box 9101, 6500HB Nijmegen, The Netherlands, Fax 31-24-3541484; e-mail [email protected].
Received June 21, 2006; accepted November 2, 2006.Previously published online at DOI: 10.1373/clinchem.2006.075218
4 Nonstandard abbreviations: EPI, epinephrine; NE, norepinephrine; MN,metanephrine; NMN, normetanephrine.
Clinical Chemistry 53:2268–272 (2007) Endocrinology and
Metabolism
268
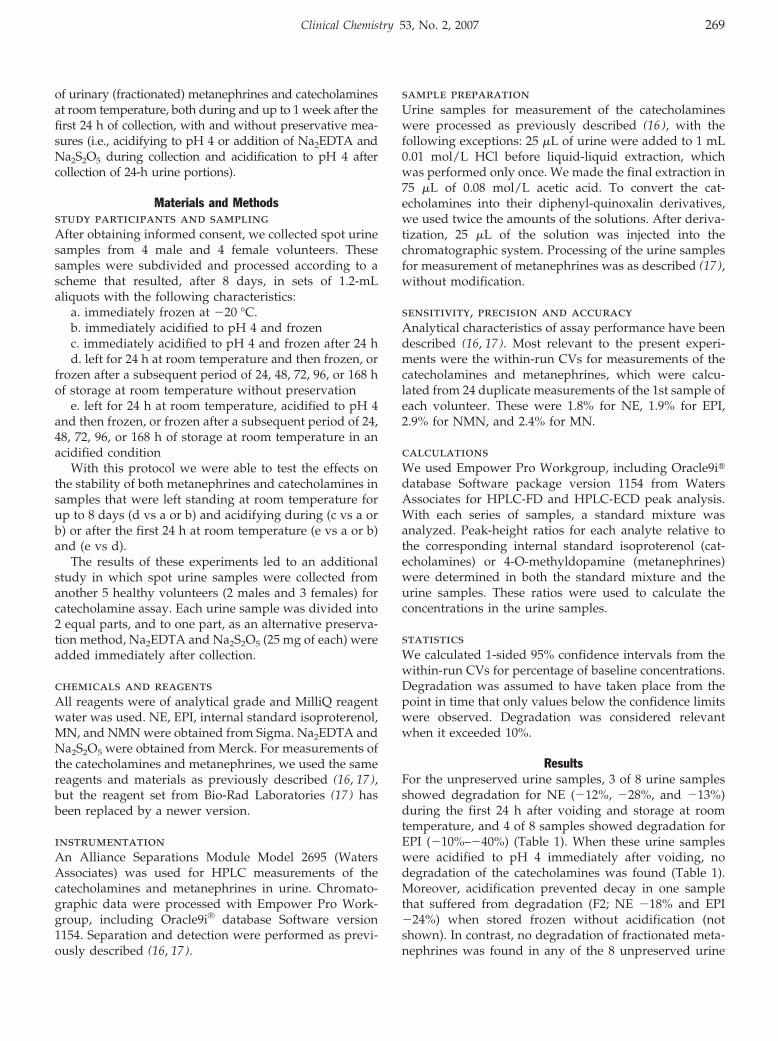
of urinary (fractionated) metanephrines and catecholaminesat room temperature, both during and up to 1 week after thefirst 24 h of collection, with and without preservative mea-sures (i.e., acidifying to pH 4 or addition of Na2EDTA andNa2S2O5 during collection and acidification to pH 4 aftercollection of 24-h urine portions).
Materials and Methodsstudy participants and samplingAfter obtaining informed consent, we collected spot urinesamples from 4 male and 4 female volunteers. Thesesamples were subdivided and processed according to ascheme that resulted, after 8 days, in sets of 1.2-mLaliquots with the following characteristics:
a. immediately frozen at �20 °C.b. immediately acidified to pH 4 and frozenc. immediately acidified to pH 4 and frozen after 24 hd. left for 24 h at room temperature and then frozen, or
frozen after a subsequent period of 24, 48, 72, 96, or 168 hof storage at room temperature without preservation
e. left for 24 h at room temperature, acidified to pH 4and then frozen, or frozen after a subsequent period of 24,48, 72, 96, or 168 h of storage at room temperature in anacidified condition
With this protocol we were able to test the effects onthe stability of both metanephrines and catecholamines insamples that were left standing at room temperature forup to 8 days (d vs a or b) and acidifying during (c vs a orb) or after the first 24 h at room temperature (e vs a or b)and (e vs d).
The results of these experiments led to an additionalstudy in which spot urine samples were collected fromanother 5 healthy volunteers (2 males and 3 females) forcatecholamine assay. Each urine sample was divided into2 equal parts, and to one part, as an alternative preserva-tion method, Na2EDTA and Na2S2O5 (25 mg of each) wereadded immediately after collection.
chemicals and reagentsAll reagents were of analytical grade and MilliQ reagentwater was used. NE, EPI, internal standard isoproterenol,MN, and NMN were obtained from Sigma. Na2EDTA andNa2S2O5 were obtained from Merck. For measurements ofthe catecholamines and metanephrines, we used the samereagents and materials as previously described (16, 17),but the reagent set from Bio-Rad Laboratories (17 ) hasbeen replaced by a newer version.
instrumentationAn Alliance Separations Module Model 2695 (WatersAssociates) was used for HPLC measurements of thecatecholamines and metanephrines in urine. Chromato-graphic data were processed with Empower Pro Work-group, including Oracle9i® database Software version1154. Separation and detection were performed as previ-ously described (16, 17).
sample preparationUrine samples for measurement of the catecholamineswere processed as previously described (16 ), with thefollowing exceptions: 25 �L of urine were added to 1 mL0.01 mol/L HCl before liquid-liquid extraction, whichwas performed only once. We made the final extraction in75 �L of 0.08 mol/L acetic acid. To convert the cat-echolamines into their diphenyl-quinoxalin derivatives,we used twice the amounts of the solutions. After deriva-tization, 25 �L of the solution was injected into thechromatographic system. Processing of the urine samplesfor measurement of metanephrines was as described (17 ),without modification.
sensitivity, precision and accuracyAnalytical characteristics of assay performance have beendescribed (16, 17). Most relevant to the present experi-ments were the within-run CVs for measurements of thecatecholamines and metanephrines, which were calcu-lated from 24 duplicate measurements of the 1st sample ofeach volunteer. These were 1.8% for NE, 1.9% for EPI,2.9% for NMN, and 2.4% for MN.
calculationsWe used Empower Pro Workgroup, including Oracle9i�database Software package version 1154 from WatersAssociates for HPLC-FD and HPLC-ECD peak analysis.With each series of samples, a standard mixture wasanalyzed. Peak-height ratios for each analyte relative tothe corresponding internal standard isoproterenol (cat-echolamines) or 4-O-methyldopamine (metanephrines)were determined in both the standard mixture and theurine samples. These ratios were used to calculate theconcentrations in the urine samples.
statisticsWe calculated 1-sided 95% confidence intervals from thewithin-run CVs for percentage of baseline concentrations.Degradation was assumed to have taken place from thepoint in time that only values below the confidence limitswere observed. Degradation was considered relevantwhen it exceeded 10%.
ResultsFor the unpreserved urine samples, 3 of 8 urine samplesshowed degradation for NE (�12%, �28%, and �13%)during the first 24 h after voiding and storage at roomtemperature, and 4 of 8 samples showed degradation forEPI (�10%–�40%) (Table 1). When these urine sampleswere acidified to pH 4 immediately after voiding, nodegradation of the catecholamines was found (Table 1).Moreover, acidification prevented decay in one samplethat suffered from degradation (F2; NE �18% and EPI�24%) when stored frozen without acidification (notshown). In contrast, no degradation of fractionated meta-nephrines was found in any of the 8 unpreserved urine
Clinical Chemistry 53, No. 2, 2007 269
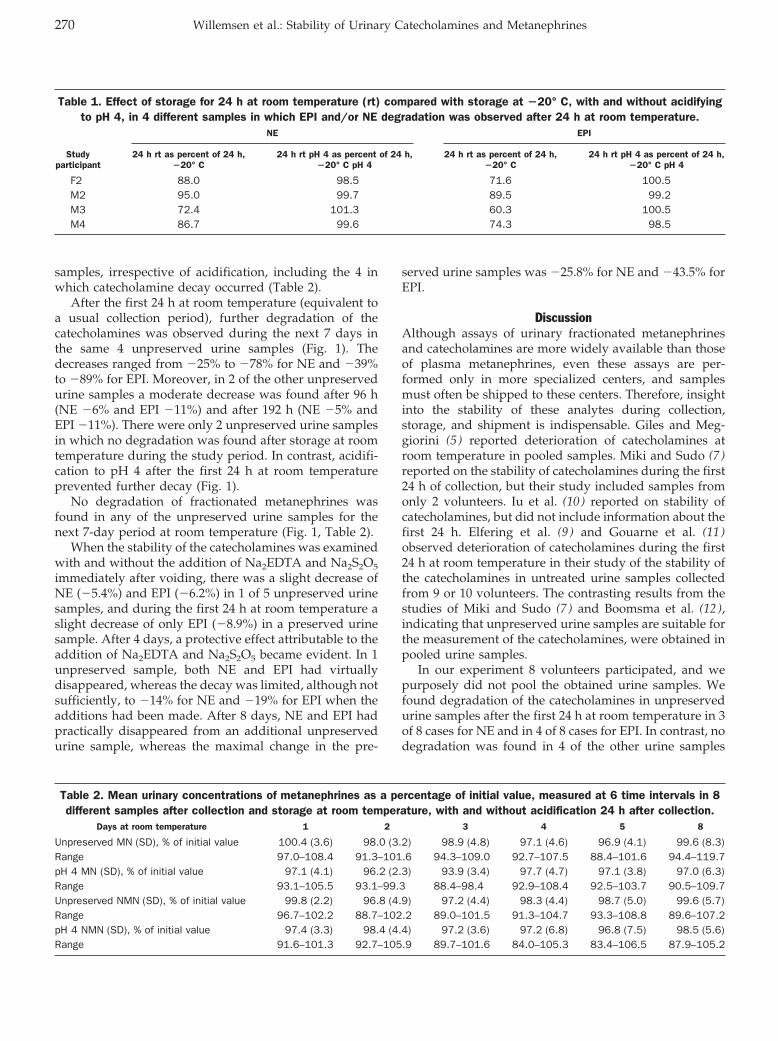
samples, irrespective of acidification, including the 4 inwhich catecholamine decay occurred (Table 2).
After the first 24 h at room temperature (equivalent toa usual collection period), further degradation of thecatecholamines was observed during the next 7 days inthe same 4 unpreserved urine samples (Fig. 1). Thedecreases ranged from �25% to �78% for NE and �39%to �89% for EPI. Moreover, in 2 of the other unpreservedurine samples a moderate decrease was found after 96 h(NE �6% and EPI �11%) and after 192 h (NE �5% andEPI �11%). There were only 2 unpreserved urine samplesin which no degradation was found after storage at roomtemperature during the study period. In contrast, acidifi-cation to pH 4 after the first 24 h at room temperatureprevented further decay (Fig. 1).
No degradation of fractionated metanephrines wasfound in any of the unpreserved urine samples for thenext 7-day period at room temperature (Fig. 1, Table 2).
When the stability of the catecholamines was examinedwith and without the addition of Na2EDTA and Na2S2O5
immediately after voiding, there was a slight decrease ofNE (�5.4%) and EPI (�6.2%) in 1 of 5 unpreserved urinesamples, and during the first 24 h at room temperature aslight decrease of only EPI (�8.9%) in a preserved urinesample. After 4 days, a protective effect attributable to theaddition of Na2EDTA and Na2S2O5 became evident. In 1unpreserved sample, both NE and EPI had virtuallydisappeared, whereas the decay was limited, although notsufficiently, to �14% for NE and �19% for EPI when theadditions had been made. After 8 days, NE and EPI hadpractically disappeared from an additional unpreservedurine sample, whereas the maximal change in the pre-
served urine samples was �25.8% for NE and �43.5% forEPI.
DiscussionAlthough assays of urinary fractionated metanephrinesand catecholamines are more widely available than thoseof plasma metanephrines, even these assays are per-formed only in more specialized centers, and samplesmust often be shipped to these centers. Therefore, insightinto the stability of these analytes during collection,storage, and shipment is indispensable. Giles and Meg-giorini (5 ) reported deterioration of catecholamines atroom temperature in pooled samples. Miki and Sudo (7 )reported on the stability of catecholamines during the first24 h of collection, but their study included samples fromonly 2 volunteers. Iu et al. (10 ) reported on stability ofcatecholamines, but did not include information about thefirst 24 h. Elfering et al. (9 ) and Gouarne et al. (11 )observed deterioration of catecholamines during the first24 h at room temperature in their study of the stability ofthe catecholamines in untreated urine samples collectedfrom 9 or 10 volunteers. The contrasting results from thestudies of Miki and Sudo (7 ) and Boomsma et al. (12 ),indicating that unpreserved urine samples are suitable forthe measurement of the catecholamines, were obtained inpooled urine samples.
In our experiment 8 volunteers participated, and wepurposely did not pool the obtained urine samples. Wefound degradation of the catecholamines in unpreservedurine samples after the first 24 h at room temperature in 3of 8 cases for NE and in 4 of 8 cases for EPI. In contrast, nodegradation was found in 4 of the other urine samples
Table 1. Effect of storage for 24 h at room temperature (rt) compared with storage at �20° C, with and without acidifyingto pH 4, in 4 different samples in which EPI and/or NE degradation was observed after 24 h at room temperature.
Studyparticipant
NE EPI
24 h rt as percent of 24 h,�20° C
24 h rt pH 4 as percent of 24 h,�20° C pH 4
24 h rt as percent of 24 h,�20° C
24 h rt pH 4 as percent of 24 h,�20° C pH 4
F2 88.0 98.5 71.6 100.5M2 95.0 99.7 89.5 99.2M3 72.4 101.3 60.3 100.5M4 86.7 99.6 74.3 98.5
Table 2. Mean urinary concentrations of metanephrines as a percentage of initial value, measured at 6 time intervals in 8different samples after collection and storage at room temperature, with and without acidification 24 h after collection.
Days at room temperature 1 2 3 4 5 8
Unpreserved MN (SD), % of initial value 100.4 (3.6) 98.0 (3.2) 98.9 (4.8) 97.1 (4.6) 96.9 (4.1) 99.6 (8.3)Range 97.0–108.4 91.3–101.6 94.3–109.0 92.7–107.5 88.4–101.6 94.4–119.7pH 4 MN (SD), % of initial value 97.1 (4.1) 96.2 (2.3) 93.9 (3.4) 97.7 (4.7) 97.1 (3.8) 97.0 (6.3)Range 93.1–105.5 93.1–99.3 88.4–98.4 92.9–108.4 92.5–103.7 90.5–109.7Unpreserved NMN (SD), % of initial value 99.8 (2.2) 96.8 (4.9) 97.2 (4.4) 98.3 (4.4) 98.7 (5.0) 99.6 (5.7)Range 96.7–102.2 88.7–102.2 89.0–101.5 91.3–104.7 93.3–108.8 89.6–107.2pH 4 NMN (SD), % of initial value 97.4 (3.3) 98.4 (4.4) 97.2 (3.6) 97.2 (6.8) 96.8 (7.5) 98.5 (5.6)Range 91.6–101.3 92.7–105.9 89.7–101.6 84.0–105.3 83.4–106.5 87.9–105.2
270 Willemsen et al.: Stability of Urinary Catecholamines and Metanephrines
after the first 72 h of storage at room temperature, andonly a small decrease was found in 1 unpreserved urinesample after 96 h storage at room temperature (NE �6%and EPI �11%) and in another urine sample after 192 hstorage at room temperature (NE –5% and EPI –11%). In2 urine samples no degradation was found even after192 h of storage at room temperature. Apparently, cate-cholamine decay may vary widely between individualsamples, even for samples from healthy persons, rangingfrom no deterioration to complete degradation of theanalytes. Therefore, inclusion of too few individuals, orthe use of pooled material, may yield misleading results,an observation that may explain the seeming contradic-tion between our results and those of Miki and Sudo (7 )and Boomsma (12 ). For stability studies in general, weadvise against reliance on pooled urine, serum, or plasma.
The cause of this variability (initial pH, microbial growth,proportion of unconjugated analyte) may be the subject offurther study.
As confirmed by earlier observations (5–12), acidifyingto pH 4 is an effective means to prevent catecholaminedecay, even when it is not done immediately after voiding(Fig. 1). For those urine samples in which degradationstarts during the first 24 h and without acidificationcontinues at room temperature for the next 7 days,acidification after the first 24 h abolishes further degrada-tion. Chan et al. (13 ) reported that unpreserved pooledurine samples stored at �80 °C were stable, with �10%variation for at least 22 days. In one of our cases, weobserved degradation during storage at �20 °C in theunpreserved but not in the acidified sample. To achieveacidification in practice, HCl may be added in advance to
Fig. 1. Two representative patterns of catecholamine and metanephrine concentrations in urine during storage at room temperature for up to 8 daysand the effect of acidifying to pH 4 after 24 h.No detectable decay, as in depicted female study participant F4, was encountered in females F1 and F3, and the male M1. Male study participants M2 and M4 andfemale F2 displayed a pattern similar to the depicted male M3.
Clinical Chemistry 53, No. 2, 2007 271
the polyethylene collection container, but this leads tohydrolysis and poses a hazard to the patient when theacid is still concentrated (7, 10, 13) during the first phaseof collection. The catecholamine concentrations foundunder such conditions result from the opposing effects ofdeconjugation and decay. Moreover, insufficient antioxi-dative capacity may lead to catecholamine instability.Therefore, addition of Na2EDTA and Na2S2O5 instead ofHCl during collection, followed by acidification to pH 4.0with HCl after receiving the urine sample is mandatory.Boric acid (6 ) or formate buffer (10 ) also can be used forthis purpose.
The special requirements to stabilize catecholaminesduring collection and storage at room temperature do notappear to be necessary for fractionated metanephrines inurine (Table 2), at least for a 1-week period. Nevertheless,acidification to pH 4 immediately after receipt of the 24-hurine sample can be considered as a general safety mea-sure. We did not find data in the literature allowing for adirect comparison with the present observations. Ourfindings are highly relevant to the biochemical diagnosisof pheochromocytoma according to recommendationsemerging from the First International Symposium onPheochromocytoma (2005, Bethesda, MD). First, concen-trated acid need not be added to the devices used forurine collection; thus the risk for the patient of injury bythe acid is eliminated. Second, if samples are assayed orfrozen for assay within 1 week, urinary metanephrines aresufficiently stable at room temperature to permit ship-ment by regular mail. Third, the absence of additives maypermit measurement of other analytes such as urinarysodium and potassium, which are essential to the inter-pretation of aldosterone excretion when assessed in thesame sample, as well as albumin and total protein.
We thank Renate Hensen-Lodewijk, Jannette Beunk,Marie-Jose Leupers, and Rob van den Berg for theirhelpful cooperation.
References1. Lenders JW, Pacak K, Walther MM, Linehan WM, Mannelli M,
Friberg P, et al. Biochemical diagnosis of pheochromocytoma:which test is best? JAMA 2002;287:1427–34.
2. Raber W, Raffesberg W, Bischof M, Scheuba C, Niederle B, GasicS, et al. Diagnostic efficacy of unconjugated plasma metaneph-
rines for the detection of pheochromocytoma. Arch Intern Med2000;160:2957–63.
3. Eisenhofer G. Biochemical diagnosis of pheochromocytoma: is ittime to switch to plasma free metanephrines? J Clin EndocrinolMetab 2003;88:550–2.
4. Peaston RT, Weinkove C. Measurement of catecholamines andtheir metabolites. Ann Clin Biochem 2004;41:17–38.
5. Giles HG, Meggiorini S. Stability of catecholamines in urine[Letter]. Clin Chem 1983;29:595.
6. Lee ZSK, Critchley JAJH. Simultaneous measurement of cat-echolamines and kallikrein in urine using boric acid preservative.Clin Chim Acta 1998;276:89–102.
7. Miki K, Sudo A. Effect of urine pH, storage time, and temperatureon stability of catecholamines, cortisol and creatinine. Clin Chem1998;44:1759–62.
8. Weinkove C. Measurement of catecholamines and their metabo-lites in urine. J Clin Pathol 1991;44:269–75.
9. Elfering A, Grebner S, Semmer NK, Byland C, Gerber H. Two urinarycatecholamine measurement indices for applied stress research:effects of time and temperature until freezing. Hum Factors2003;45:563–74.
10. Iu YP, Ho CS, Mak TWL. Formate buffer as preservative for urinaryfree catecholamine measurement. Ann Clin Biochem 2004;41:39–42.
11. Gouarne C, Foury A, Duclos M. Critical study of common condi-tions of storage of glucocorticoids and catecholamines in 24-hurine collected during resting and exercising conditions. Clin ChimActa 2004;348:207–14.
12. Boomsma F, Alberts G, van Eijk L, Man in ‘t Veld AJ, SchalekampMA. Optimal collection and storage conditions for catecholaminemeasurements in human plasma and urine. Clin Chem 1993;39:2503–8.
13. Chan ECY, Wee PY, Ho PC. Evaluation of degradation of urinarycatecholamines and metanephrines and deconjugation of theirsulfoconjugates using stability-indicating reversed-phase ion-pairHPLC with electrochemical detection. J Pharm Biomed Anal2000;22:515–26.
14. Moleman P. Preservation of urine samples for assay of cat-echolamines and their metabolites [Letter]. Clin Chem 1985;31:653–4.
15. Willemsen JJ, Sweep CGJ, Lenders JWM, Ross HA. Stability ofplasma free metanephrines during collection and storage asassessed by an optimized HPLC method with electrochemicaldetection. Clin Chem 2003;49:1951–3.
16. Willemsen JJ, Ross HA, Jacobs MC, Lenders JWM, Thien T,Swinkels LM, et al. Highly sensitive and specific HPLC withfluorometric detection for determination of plasma epinephrineand norepinephrine applied to kinetic studies in humans. ClinChem 1995;41:1455–60.
17. Willemsen JJ, Ross HA, Wolthers BG, Sweep CGJ, Kema IP.Evaluation of specific high-performance liquid-chromatographicdeterminations of urinary metanephrine and normetanephrine bycomparison with isotope dilution mass spectrometry. Ann ClinBiochem 2001;38:722–30.
272 Willemsen et al.: Stability of Urinary Catecholamines and Metanephrines
Asymmetrical Dimethylarginine IndependentlyPredicts Total and Cardiovascular Mortality inIndividuals with Angiographic Coronary Artery
Disease (The Ludwigshafen Risk andCardiovascular Health Study)
Andreas Meinitzer,1 Ursula Seelhorst,2 Britta Wellnitz,2
Gabriele Halwachs-Baumann,1 Bernhard O. Boehm,3 Bernhard R. Winkelmann,4 andWinfried Marz5*
Background: Asymmetrical dimethylarginine (ADMA)is increased in conditions associated with increased riskof atherosclerosis. We investigated the use of ADMA topredict total and cardiovascular mortality in patientsscheduled for coronary angiography.Methods: In 2543 persons with and 695 without coro-nary artery disease (CAD) identified by angiography wemeasured ADMA and recorded total and cardiovascularmortality during a median follow-up of 5.45 years.Results: ADMA was correlated positively to age, femalesex, diabetes mellitus, former and current smoking, andC-reactive protein and inversely to HDL cholesterol andtriglycerides. ADMA was not associated with body massindex, hypertension, LDL cholesterol, or the presence orabsence of angiographic CAD. Glomerular filtrationrate and homocysteine were the strongest predictors ofADMA. At the 2nd, 3rd and 4th quartile of ADMA,hazard ratios for all-cause mortality adjusted for age,sex, and cardiovascular risk factors were 1.12 [95%confidence interval (CI) 0.83–1.52], 1.35 (95% CI 1.01–
1.81), and 1.87 (95% CI 1.43–2.44), respectively, comparedwith the 1st quartile. Hazard ratios for cardiovasculardeath were 1.13 (95% CI 0.78–1.63), 1.42 (95% CI 1.00–2.02), and 1.81 (95% CI 1.31–2.51). ADMA in the highestquartile remained predictive of mortality after account-ing for medication at baseline. The predictive value ofADMA was similar to that in the entire cohort inpersons with CAD, stable or unstable, but was notstatistically significant in persons without angiographicCAD.Conclusions: ADMA concentration predicts all-causeand cardiovascular mortality in individuals with CADindependently of established and emerging cardiovas-cular risk factors.© 2007 American Association for Clinical Chemistry
Asymmetrical dimethylarginine (ADMA),6 an endoge-nous inhibitor of endothelial nitric oxide synthase, isincreased in conditions associated with increased risk ofatherosclerosis, such as impaired renal function (1–4),hypercholesterolemia (5 ), hypertriglyceridemia (6 ), insu-lin resistance (7 ), diabetes mellitus (8 ), hyperhomocys-teinemia (9 ), and hypertension (10 ). ADMA may contrib-ute to endothelial dysfunction (1, 11).
1 Clinical Institute of Medical and Chemical Laboratory Diagnostics, Med-ical University of Graz, Graz, Austria.
2 LURIC Database nonprofit LLC, Freiburg, Germany.3 Division of Endocrinology, Department of Medicine, University Hospital,
Ulm, Germany.4 Cardiology Group, Frankfurt-Sachsenhausen, Germany.5 Synlab Center of Laboratory Diagnostics Heidelberg, Heidelberg, Ger-
many.* Address correspondence to this author at: Synlab Center of Laboratory
Diagnostics Heidelberg, PO Box 10 47 80, D-69037 Heidelberg, Germany. Fax0049-6221-793-111; e-mail [email protected].
Received July 20, 2006; accepted November 27, 2006.Previously published online at DOI: 10.1373/clinchem.2006.076711
6 Nonstandard abbreviations: ADMA, asymmetrical dimethylarginine;ESRD, end-stage renal disease; CAD, coronary artery disease; LURIC, Lud-wigshafen Risk and Cardiovascular Health study; CRP, C-reactive protein;NSTEMI, non–ST-elevation myocardial infarction; MI, myocardial infarction,STEMI, ST-elevation MI; GFR, glomerular filtration rate; HDL-C, HDL choles-terol; LDL-C, LDL cholesterol; BMI, body mass index; HR, hazard ratio;DDAH, dimethyl-arginine dimethylaminohydrolase.
Clinical Chemistry 53:2273–283 (2007) Endocrinology and
Metabolism
273
A few small studies have addressed the ability ofADMA to predict mortality and have found that highADMA was related to mortality in critically ill patients(12, 13) and to unfavorable pulmonary hemodynamicsand mortality (14 ). ADMA was predictive of cardiovas-cular events and total mortality in kidney disease (15 ),end-stage renal disease (ESRD) (3 ), and coronary arterydisease (CAD) (16–18). We investigated the value ofADMA to predict total mortality in patients scheduled forcoronary angiography.
Materials and Methodsstudy design and participantsWe studied participants of the Ludwigshafen Risk andCardiovascular Health (LURIC) study (19 ). Inclusion cri-teria were: German ancestry, clinical stability except foracute coronary syndromes, and the availability of a coro-nary angiogram. The indications for angiography in indi-viduals in clinically stable condition were chest painand/or noninvasive test results consistent with myocar-dial ischemia. Individuals suffering from acute illnessother than acute coronary syndromes, chronic noncardiacdiseases, or malignancy within the 5 past years, and thoseunable to understand the purpose of the study wereexcluded. The study was approved by the ethics commit-tee at the “Arztekammer Rheinland-Pfalz”. Informedwritten consent was obtained from all participants.
CAD was assessed by angiography with maximumluminal narrowing estimated by visual analysis. Clini-cally relevant CAD was defined as the occurrence of �1stenosis of �20% in �1 of 15 coronary segments. Individ-uals with stenoses �20% were considered as not havingCAD. The severity of CAD was quantified with theFriesinger score.
Diabetes mellitus was diagnosed if plasma glucose was�1.25 g/L in the fasting state, or �2.00 g/L 2 h after anoral glucose load (20 ), or if individuals were receivingantidiabetic treatment. Hypertension was diagnosed if thesystolic and/or diastolic blood pressure exceeded 140and/or 90 mmHg or if there was a history of hyperten-sion, evident through the use of antihypertensive drugs.Women were categorized into pre-, peri- or postmeno-pausal according to menstrual bleeding history and theconcentrations of follicle-stimulating hormone (19 ).
Measurements of ADMA, lipoproteins, C-reactive pro-tein (CRP), fibrinogen, creatinine, and homocysteine werecomplete in 3238 of 3279 individuals with coronary an-giograms. Study participants included 928 patients whopresented within 7 days after onset of unstable angina,non–ST-elevation myocardial infarction (MI) (NSTEMI,troponin T �0.1 �g/L), or ST-elevation MI (STEMI, tro-ponin T �0.1 �g/L) because the mean (SD) ADMAconcentrations in these patients [827 (145) nmol/L] wereclose to those in the stable CAD patients [829 (150)nmol/L].
Information on vital status was obtained from localregistries. No patients were lost to follow-up. Of the 3238
persons studied, 497 deaths (15.3%) occurred during amedian follow-up of 5.45 years. Death certificates weremissing for 15 decedents (3%) who were included in thetotal mortality analysis but excluded from the cardiovas-cular mortality analysis. Cardiovascular death includedthe following: sudden death, fatal MI, death because ofcongestive heart failure, death immediately followingintervention to treat CAD, fatal stroke, and other causes ofdeath due to CAD.
laboratory proceduresTo perform ADMA and all other analyses we collectedfasting blood samples before angiography to rule outADMA alterations attributable to food intake (21 ). Thestandard laboratory methods have been described (19 ).Glomerular filtration rate (GFR) was calculated as GFR[mL � min�1 � (1.73 m2)�1] � 186 � creatinine�1.154 �age�0.203 and GFR [mL � min�1 � (1.73 m2)�1] � 138� creatinine�1.154 � age�0.203 in males and in females, re-spectively (22 ).
ADMA was measured in frozen serum (�80 °C) withreversed-phase HPLC (23 ). Within-day and between-dayCVs were 3.1% (620 nmol/L) and 1.0% (2000 nmol/L),and 9% (620 nmol/L) and 1.5% (2000 nmol/L), respec-tively. CRP was measured with high sensitivity immu-nonephelometry (Dade Behring), and fibrinogen with theClauss method (Dade Behring).
statistical analysisTriglycerides and CRP were transformed logarithmically.We established quartiles of continuous variables accord-ing to the values in individuals without CAD. Character-istics of individuals with and without CAD are presentedas percentages for categorical variables and as mean (SD)or median and 25th and 75th percentiles for continuousvariables. Associations of categorical and continuous vari-ables were analyzed by logistic regression and univariateANOVA, respectively, with covariables as indicated (Ta-ble 1). Using ANOVA models in which we included thosefactors not under examination as covariables, we studiedthe effects on ADMA of sex, age, CAD, and cardiovascu-lar risk factors (Table 2) and of drugs. We used the Coxproportional hazards model to examine the relationshipbetween ADMA and mortality (Tables 3 and 4). Asindicated by log-minus-log diagnostic plots, the propor-tional hazards assumption was met.
Multivariable adjustment was carried out for sex, age,CAD, cardiovascular risk factors, and drugs (Tables 3 and4). All statistical tests were 2-sided; P �0.05 was consid-ered significant. The SPSS 11.0 statistical package (SPSSInc.) was used.
Resultsstudy participantsCompared with the group without CAD, CAD patientswere significantly older, more likely to be current or pastsmokers, and had higher prevalence of diabetes mellitus,
274 Meinitzer et al.: ADMA Relationship to Total and Cardiovascular Mortality
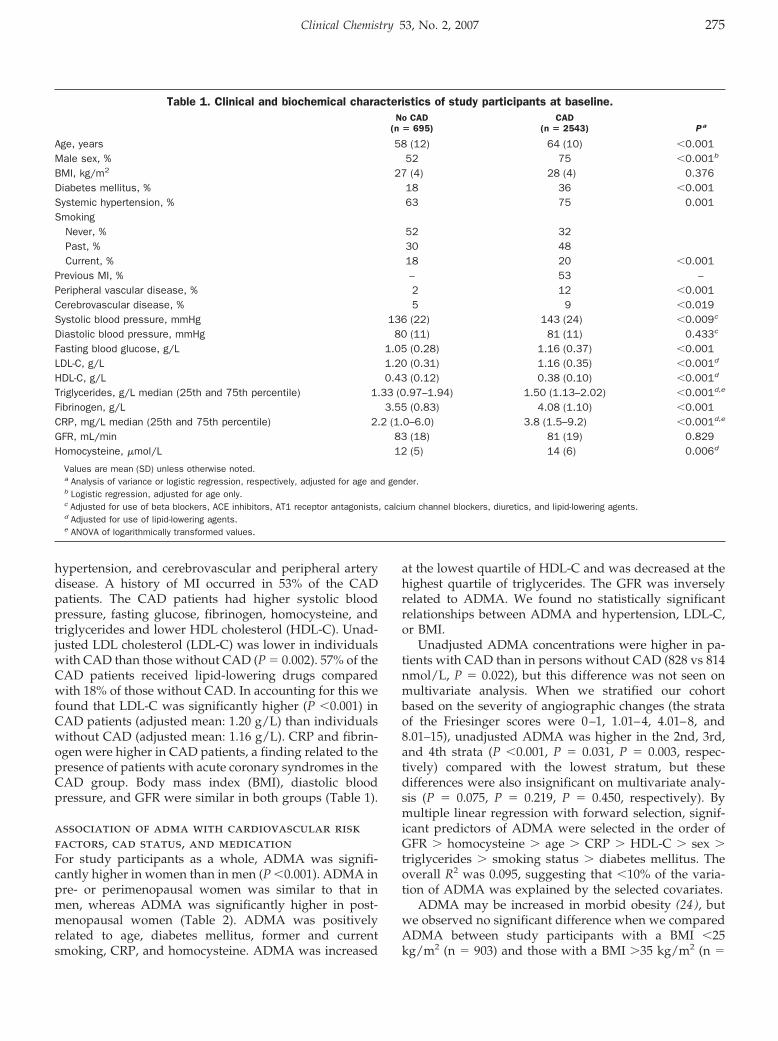
hypertension, and cerebrovascular and peripheral arterydisease. A history of MI occurred in 53% of the CADpatients. The CAD patients had higher systolic bloodpressure, fasting glucose, fibrinogen, homocysteine, andtriglycerides and lower HDL cholesterol (HDL-C). Unad-justed LDL cholesterol (LDL-C) was lower in individualswith CAD than those without CAD (P � 0.002). 57% of theCAD patients received lipid-lowering drugs comparedwith 18% of those without CAD. In accounting for this wefound that LDL-C was significantly higher (P �0.001) inCAD patients (adjusted mean: 1.20 g/L) than individualswithout CAD (adjusted mean: 1.16 g/L). CRP and fibrin-ogen were higher in CAD patients, a finding related to thepresence of patients with acute coronary syndromes in theCAD group. Body mass index (BMI), diastolic bloodpressure, and GFR were similar in both groups (Table 1).
association of adma with cardiovascular riskfactors, cad status, and medicationFor study participants as a whole, ADMA was signifi-cantly higher in women than in men (P �0.001). ADMA inpre- or perimenopausal women was similar to that inmen, whereas ADMA was significantly higher in post-menopausal women (Table 2). ADMA was positivelyrelated to age, diabetes mellitus, former and currentsmoking, CRP, and homocysteine. ADMA was increased
at the lowest quartile of HDL-C and was decreased at thehighest quartile of triglycerides. The GFR was inverselyrelated to ADMA. We found no statistically significantrelationships between ADMA and hypertension, LDL-C,or BMI.
Unadjusted ADMA concentrations were higher in pa-tients with CAD than in persons without CAD (828 vs 814nmol/L, P � 0.022), but this difference was not seen onmultivariate analysis. When we stratified our cohortbased on the severity of angiographic changes (the strataof the Friesinger scores were 0–1, 1.01–4, 4.01–8, and8.01–15), unadjusted ADMA was higher in the 2nd, 3rd,and 4th strata (P �0.001, P � 0.031, P � 0.003, respec-tively) compared with the lowest stratum, but thesedifferences were also insignificant on multivariate analy-sis (P � 0.075, P � 0.219, P � 0.450, respectively). Bymultiple linear regression with forward selection, signif-icant predictors of ADMA were selected in the order ofGFR � homocysteine � age � CRP � HDL-C � sex �triglycerides � smoking status � diabetes mellitus. Theoverall R2 was 0.095, suggesting that �10% of the varia-tion of ADMA was explained by the selected covariates.
ADMA may be increased in morbid obesity (24 ), butwe observed no significant difference when we comparedADMA between study participants with a BMI �25kg/m2 (n � 903) and those with a BMI �35 kg/m2 (n �
Table 1. Clinical and biochemical characteristics of study participants at baseline.No CAD
(n � 695)CAD
(n � 2543) P a
Age, years 58 (12) 64 (10) �0.001Male sex, % 52 75 �0.001b
BMI, kg/m2 27 (4) 28 (4) 0.376Diabetes mellitus, % 18 36 �0.001Systemic hypertension, % 63 75 0.001Smoking
Never, % 52 32Past, % 30 48Current, % 18 20 �0.001
Previous MI, % – 53 –Peripheral vascular disease, % 2 12 �0.001Cerebrovascular disease, % 5 9 �0.019Systolic blood pressure, mmHg 136 (22) 143 (24) �0.009c
Diastolic blood pressure, mmHg 80 (11) 81 (11) 0.433c
Fasting blood glucose, g/L 1.05 (0.28) 1.16 (0.37) �0.001LDL-C, g/L 1.20 (0.31) 1.16 (0.35) �0.001d
HDL-C, g/L 0.43 (0.12) 0.38 (0.10) �0.001d
Triglycerides, g/L median (25th and 75th percentile) 1.33 (0.97–1.94) 1.50 (1.13–2.02) �0.001d,e
Fibrinogen, g/L 3.55 (0.83) 4.08 (1.10) �0.001CRP, mg/L median (25th and 75th percentile) 2.2 (1.0–6.0) 3.8 (1.5–9.2) �0.001d,e
GFR, mL/min 83 (18) 81 (19) 0.829Homocysteine, �mol/L 12 (5) 14 (6) 0.006d
Values are mean (SD) unless otherwise noted.a Analysis of variance or logistic regression, respectively, adjusted for age and gender.b Logistic regression, adjusted for age only.c Adjusted for use of beta blockers, ACE inhibitors, AT1 receptor antagonists, calcium channel blockers, diuretics, and lipid-lowering agents.d Adjusted for use of lipid-lowering agents.e ANOVA of logarithmically transformed values.
Clinical Chemistry 53, No. 2, 2007 275
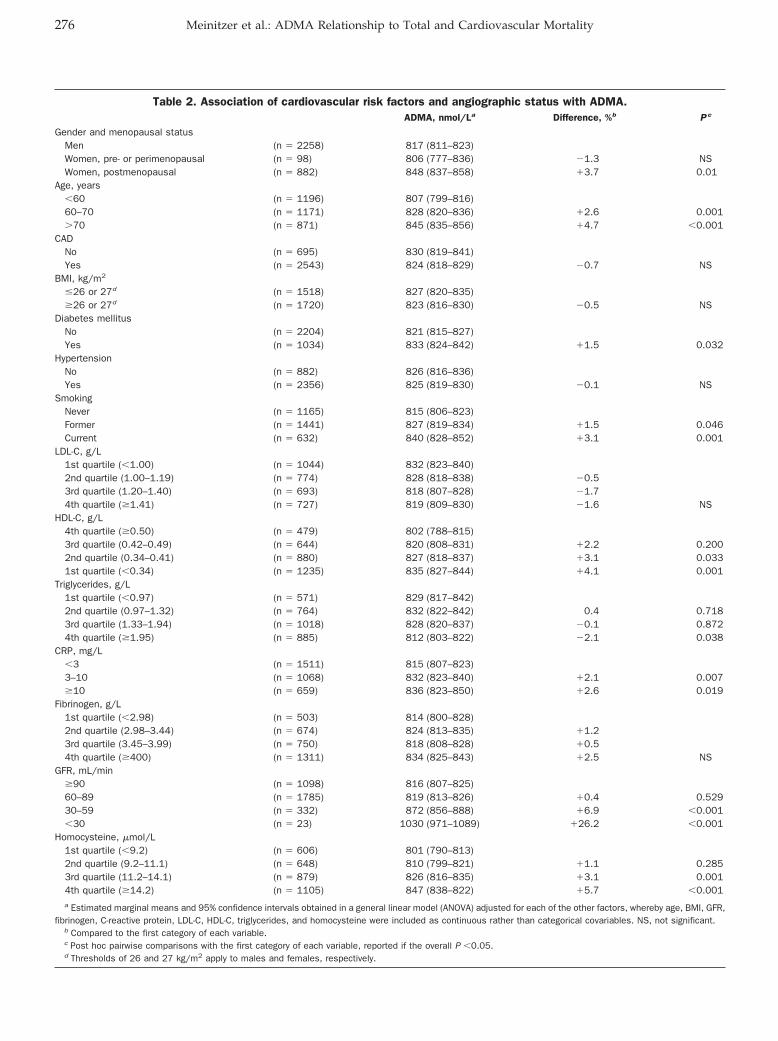
Table 2. Association of cardiovascular risk factors and angiographic status with ADMA.ADMA, nmol/La Difference, %b P c
Gender and menopausal statusMen (n � 2258) 817 (811–823)Women, pre- or perimenopausal (n � 98) 806 (777–836) �1.3 NSWomen, postmenopausal (n � 882) 848 (837–858) �3.7 0.01
Age, years�60 (n � 1196) 807 (799–816)60–70 (n � 1171) 828 (820–836) �2.6 0.001�70 (n � 871) 845 (835–856) �4.7 �0.001
CADNo (n � 695) 830 (819–841)Yes (n � 2543) 824 (818–829) �0.7 NS
BMI, kg/m2
�26 or 27d (n � 1518) 827 (820–835)�26 or 27d (n � 1720) 823 (816–830) �0.5 NS
Diabetes mellitusNo (n � 2204) 821 (815–827)Yes (n � 1034) 833 (824–842) �1.5 0.032
HypertensionNo (n � 882) 826 (816–836)Yes (n � 2356) 825 (819–830) �0.1 NS
SmokingNever (n � 1165) 815 (806–823)Former (n � 1441) 827 (819–834) �1.5 0.046Current (n � 632) 840 (828–852) �3.1 0.001
LDL-C, g/L1st quartile (�1.00) (n � 1044) 832 (823–840)2nd quartile (1.00–1.19) (n � 774) 828 (818–838) �0.53rd quartile (1.20–1.40) (n � 693) 818 (807–828) �1.74th quartile (�1.41) (n � 727) 819 (809–830) �1.6 NS
HDL-C, g/L4th quartile (�0.50) (n � 479) 802 (788–815)3rd quartile (0.42–0.49) (n � 644) 820 (808–831) �2.2 0.2002nd quartile (0.34–0.41) (n � 880) 827 (818–837) �3.1 0.0331st quartile (�0.34) (n � 1235) 835 (827–844) �4.1 0.001
Triglycerides, g/L1st quartile (�0.97) (n � 571) 829 (817–842)2nd quartile (0.97–1.32) (n � 764) 832 (822–842) 0.4 0.7183rd quartile (1.33–1.94) (n � 1018) 828 (820–837) �0.1 0.8724th quartile (�1.95) (n � 885) 812 (803–822) �2.1 0.038
CRP, mg/L�3 (n � 1511) 815 (807–823)3–10 (n � 1068) 832 (823–840) �2.1 0.007�10 (n � 659) 836 (823–850) �2.6 0.019
Fibrinogen, g/L1st quartile (�2.98) (n � 503) 814 (800–828)2nd quartile (2.98–3.44) (n � 674) 824 (813–835) �1.23rd quartile (3.45–3.99) (n � 750) 818 (808–828) �0.54th quartile (�400) (n � 1311) 834 (825–843) �2.5 NS
GFR, mL/min�90 (n � 1098) 816 (807–825)60–89 (n � 1785) 819 (813–826) �0.4 0.52930–59 (n � 332) 872 (856–888) �6.9 �0.001�30 (n � 23) 1030 (971–1089) �26.2 �0.001
Homocysteine, �mol/L1st quartile (�9.2) (n � 606) 801 (790–813)2nd quartile (9.2–11.1) (n � 648) 810 (799–821) �1.1 0.2853rd quartile (11.2–14.1) (n � 879) 826 (816–835) �3.1 0.0014th quartile (�14.2) (n � 1105) 847 (838–822) �5.7 �0.001a Estimated marginal means and 95% confidence intervals obtained in a general linear model (ANOVA) adjusted for each of the other factors, whereby age, BMI, GFR,
fibrinogen, C-reactive protein, LDL-C, HDL-C, triglycerides, and homocysteine were included as continuous rather than categorical covariables. NS, not significant.b Compared to the first category of each variable.c Post hoc pairwise comparisons with the first category of each variable, reported if the overall P �0.05.d Thresholds of 26 and 27 kg/m2 apply to males and females, respectively.
276 Meinitzer et al.: ADMA Relationship to Total and Cardiovascular Mortality
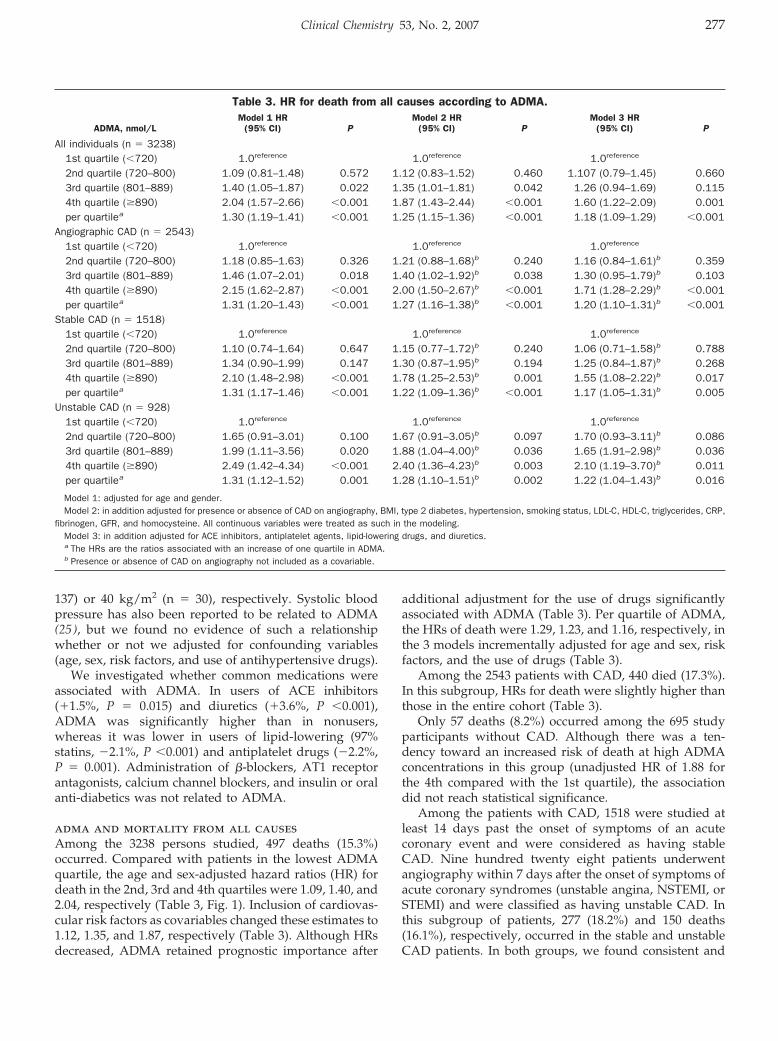
137) or 40 kg/m2 (n � 30), respectively. Systolic bloodpressure has also been reported to be related to ADMA(25 ), but we found no evidence of such a relationshipwhether or not we adjusted for confounding variables(age, sex, risk factors, and use of antihypertensive drugs).
We investigated whether common medications wereassociated with ADMA. In users of ACE inhibitors(�1.5%, P � 0.015) and diuretics (�3.6%, P �0.001),ADMA was significantly higher than in nonusers,whereas it was lower in users of lipid-lowering (97%statins, �2.1%, P �0.001) and antiplatelet drugs (�2.2%,P � 0.001). Administration of �-blockers, AT1 receptorantagonists, calcium channel blockers, and insulin or oralanti-diabetics was not related to ADMA.
adma and mortality from all causesAmong the 3238 persons studied, 497 deaths (15.3%)occurred. Compared with patients in the lowest ADMAquartile, the age and sex-adjusted hazard ratios (HR) fordeath in the 2nd, 3rd and 4th quartiles were 1.09, 1.40, and2.04, respectively (Table 3, Fig. 1). Inclusion of cardiovas-cular risk factors as covariables changed these estimates to1.12, 1.35, and 1.87, respectively (Table 3). Although HRsdecreased, ADMA retained prognostic importance after
additional adjustment for the use of drugs significantlyassociated with ADMA (Table 3). Per quartile of ADMA,the HRs of death were 1.29, 1.23, and 1.16, respectively, inthe 3 models incrementally adjusted for age and sex, riskfactors, and the use of drugs (Table 3).
Among the 2543 patients with CAD, 440 died (17.3%).In this subgroup, HRs for death were slightly higher thanthose in the entire cohort (Table 3).
Only 57 deaths (8.2%) occurred among the 695 studyparticipants without CAD. Although there was a ten-dency toward an increased risk of death at high ADMAconcentrations in this group (unadjusted HR of 1.88 forthe 4th compared with the 1st quartile), the associationdid not reach statistical significance.
Among the patients with CAD, 1518 were studied atleast 14 days past the onset of symptoms of an acutecoronary event and were considered as having stableCAD. Nine hundred twenty eight patients underwentangiography within 7 days after the onset of symptoms ofacute coronary syndromes (unstable angina, NSTEMI, orSTEMI) and were classified as having unstable CAD. Inthis subgroup of patients, 277 (18.2%) and 150 deaths(16.1%), respectively, occurred in the stable and unstableCAD patients. In both groups, we found consistent and
Table 3. HR for death from all causes according to ADMA.
ADMA, nmol/LModel 1 HR
(95% CI) PModel 2 HR
(95% CI) PModel 3 HR
(95% CI) P
All individuals (n � 3238)1st quartile (�720) 1.0reference 1.0reference 1.0reference
2nd quartile (720–800) 1.09 (0.81–1.48) 0.572 1.12 (0.83–1.52) 0.460 1.107 (0.79–1.45) 0.6603rd quartile (801–889) 1.40 (1.05–1.87) 0.022 1.35 (1.01–1.81) 0.042 1.26 (0.94–1.69) 0.1154th quartile (�890) 2.04 (1.57–2.66) �0.001 1.87 (1.43–2.44) �0.001 1.60 (1.22–2.09) 0.001per quartilea 1.30 (1.19–1.41) �0.001 1.25 (1.15–1.36) �0.001 1.18 (1.09–1.29) �0.001
Angiographic CAD (n � 2543)1st quartile (�720) 1.0reference 1.0reference 1.0reference
2nd quartile (720–800) 1.18 (0.85–1.63) 0.326 1.21 (0.88–1.68)b 0.240 1.16 (0.84–1.61)b 0.3593rd quartile (801–889) 1.46 (1.07–2.01) 0.018 1.40 (1.02–1.92)b 0.038 1.30 (0.95–1.79)b 0.1034th quartile (�890) 2.15 (1.62–2.87) �0.001 2.00 (1.50–2.67)b �0.001 1.71 (1.28–2.29)b �0.001per quartilea 1.31 (1.20–1.43) �0.001 1.27 (1.16–1.38)b �0.001 1.20 (1.10–1.31)b �0.001
Stable CAD (n � 1518)1st quartile (�720) 1.0reference 1.0reference 1.0reference
2nd quartile (720–800) 1.10 (0.74–1.64) 0.647 1.15 (0.77–1.72)b 0.240 1.06 (0.71–1.58)b 0.7883rd quartile (801–889) 1.34 (0.90–1.99) 0.147 1.30 (0.87–1.95)b 0.194 1.25 (0.84–1.87)b 0.2684th quartile (�890) 2.10 (1.48–2.98) �0.001 1.78 (1.25–2.53)b 0.001 1.55 (1.08–2.22)b 0.017per quartilea 1.31 (1.17–1.46) �0.001 1.22 (1.09–1.36)b �0.001 1.17 (1.05–1.31)b 0.005
Unstable CAD (n � 928)1st quartile (�720) 1.0reference 1.0reference 1.0reference
2nd quartile (720–800) 1.65 (0.91–3.01) 0.100 1.67 (0.91–3.05)b 0.097 1.70 (0.93–3.11)b 0.0863rd quartile (801–889) 1.99 (1.11–3.56) 0.020 1.88 (1.04–4.00)b 0.036 1.65 (1.91–2.98)b 0.0364th quartile (�890) 2.49 (1.42–4.34) �0.001 2.40 (1.36–4.23)b 0.003 2.10 (1.19–3.70)b 0.011per quartilea 1.31 (1.12–1.52) 0.001 1.28 (1.10–1.51)b 0.002 1.22 (1.04–1.43)b 0.016
Model 1: adjusted for age and gender.Model 2: in addition adjusted for presence or absence of CAD on angiography, BMI, type 2 diabetes, hypertension, smoking status, LDL-C, HDL-C, triglycerides, CRP,
fibrinogen, GFR, and homocysteine. All continuous variables were treated as such in the modeling.Model 3: in addition adjusted for ACE inhibitors, antiplatelet agents, lipid-lowering drugs, and diuretics.a The HRs are the ratios associated with an increase of one quartile in ADMA.b Presence or absence of CAD on angiography not included as a covariable.
Clinical Chemistry 53, No. 2, 2007 277
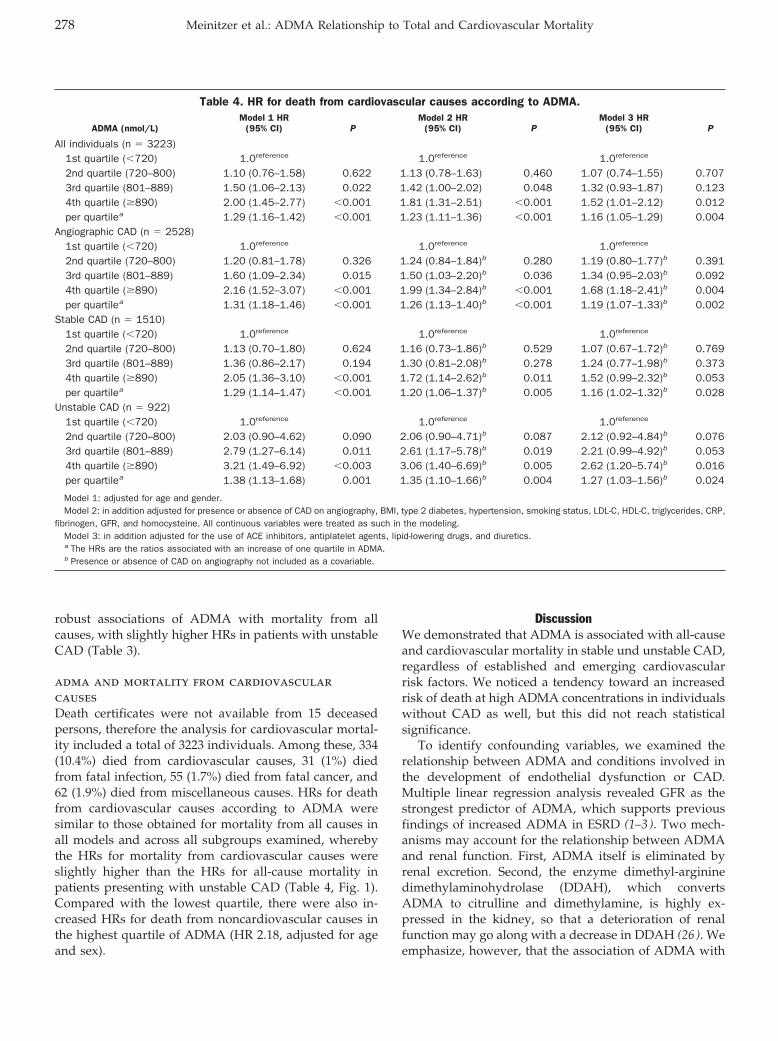
robust associations of ADMA with mortality from allcauses, with slightly higher HRs in patients with unstableCAD (Table 3).
adma and mortality from cardiovascularcausesDeath certificates were not available from 15 deceasedpersons, therefore the analysis for cardiovascular mortal-ity included a total of 3223 individuals. Among these, 334(10.4%) died from cardiovascular causes, 31 (1%) diedfrom fatal infection, 55 (1.7%) died from fatal cancer, and62 (1.9%) died from miscellaneous causes. HRs for deathfrom cardiovascular causes according to ADMA weresimilar to those obtained for mortality from all causes inall models and across all subgroups examined, wherebythe HRs for mortality from cardiovascular causes wereslightly higher than the HRs for all-cause mortality inpatients presenting with unstable CAD (Table 4, Fig. 1).Compared with the lowest quartile, there were also in-creased HRs for death from noncardiovascular causes inthe highest quartile of ADMA (HR 2.18, adjusted for ageand sex).
DiscussionWe demonstrated that ADMA is associated with all-causeand cardiovascular mortality in stable und unstable CAD,regardless of established and emerging cardiovascularrisk factors. We noticed a tendency toward an increasedrisk of death at high ADMA concentrations in individualswithout CAD as well, but this did not reach statisticalsignificance.
To identify confounding variables, we examined therelationship between ADMA and conditions involved inthe development of endothelial dysfunction or CAD.Multiple linear regression analysis revealed GFR as thestrongest predictor of ADMA, which supports previousfindings of increased ADMA in ESRD (1–3). Two mech-anisms may account for the relationship between ADMAand renal function. First, ADMA itself is eliminated byrenal excretion. Second, the enzyme dimethyl-argininedimethylaminohydrolase (DDAH), which convertsADMA to citrulline and dimethylamine, is highly ex-pressed in the kidney, so that a deterioration of renalfunction may go along with a decrease in DDAH (26 ). Weemphasize, however, that the association of ADMA with
Table 4. HR for death from cardiovascular causes according to ADMA.
ADMA (nmol/L)Model 1 HR
(95% CI) PModel 2 HR
(95% CI) PModel 3 HR
(95% CI) P
All individuals (n � 3223)1st quartile (�720) 1.0reference 1.0reference 1.0reference
2nd quartile (720–800) 1.10 (0.76–1.58) 0.622 1.13 (0.78–1.63) 0.460 1.07 (0.74–1.55) 0.7073rd quartile (801–889) 1.50 (1.06–2.13) 0.022 1.42 (1.00–2.02) 0.048 1.32 (0.93–1.87) 0.1234th quartile (�890) 2.00 (1.45–2.77) �0.001 1.81 (1.31–2.51) �0.001 1.52 (1.01–2.12) 0.012per quartilea 1.29 (1.16–1.42) �0.001 1.23 (1.11–1.36) �0.001 1.16 (1.05–1.29) 0.004
Angiographic CAD (n � 2528)1st quartile (�720) 1.0reference 1.0reference 1.0reference
2nd quartile (720–800) 1.20 (0.81–1.78) 0.326 1.24 (0.84–1.84)b 0.280 1.19 (0.80–1.77)b 0.3913rd quartile (801–889) 1.60 (1.09–2.34) 0.015 1.50 (1.03–2.20)b 0.036 1.34 (0.95–2.03)b 0.0924th quartile (�890) 2.16 (1.52–3.07) �0.001 1.99 (1.34–2.84)b �0.001 1.68 (1.18–2.41)b 0.004per quartilea 1.31 (1.18–1.46) �0.001 1.26 (1.13–1.40)b �0.001 1.19 (1.07–1.33)b 0.002
Stable CAD (n � 1510)1st quartile (�720) 1.0reference 1.0reference 1.0reference
2nd quartile (720–800) 1.13 (0.70–1.80) 0.624 1.16 (0.73–1.86)b 0.529 1.07 (0.67–1.72)b 0.7693rd quartile (801–889) 1.36 (0.86–2.17) 0.194 1.30 (0.81–2.08)b 0.278 1.24 (0.77–1.98)b 0.3734th quartile (�890) 2.05 (1.36–3.10) �0.001 1.72 (1.14–2.62)b 0.011 1.52 (0.99–2.32)b 0.053per quartilea 1.29 (1.14–1.47) �0.001 1.20 (1.06–1.37)b 0.005 1.16 (1.02–1.32)b 0.028
Unstable CAD (n � 922)1st quartile (�720) 1.0reference 1.0reference 1.0reference
2nd quartile (720–800) 2.03 (0.90–4.62) 0.090 2.06 (0.90–4.71)b 0.087 2.12 (0.92–4.84)b 0.0763rd quartile (801–889) 2.79 (1.27–6.14) 0.011 2.61 (1.17–5.78)b 0.019 2.21 (0.99–4.92)b 0.0534th quartile (�890) 3.21 (1.49–6.92) �0.003 3.06 (1.40–6.69)b 0.005 2.62 (1.20–5.74)b 0.016per quartilea 1.38 (1.13–1.68) 0.001 1.35 (1.10–1.66)b 0.004 1.27 (1.03–1.56)b 0.024
Model 1: adjusted for age and gender.Model 2: in addition adjusted for presence or absence of CAD on angiography, BMI, type 2 diabetes, hypertension, smoking status, LDL-C, HDL-C, triglycerides, CRP,
fibrinogen, GFR, and homocysteine. All continuous variables were treated as such in the modeling.Model 3: in addition adjusted for the use of ACE inhibitors, antiplatelet agents, lipid-lowering drugs, and diuretics.a The HRs are the ratios associated with an increase of one quartile in ADMA.b Presence or absence of CAD on angiography not included as a covariable.
278 Meinitzer et al.: ADMA Relationship to Total and Cardiovascular Mortality
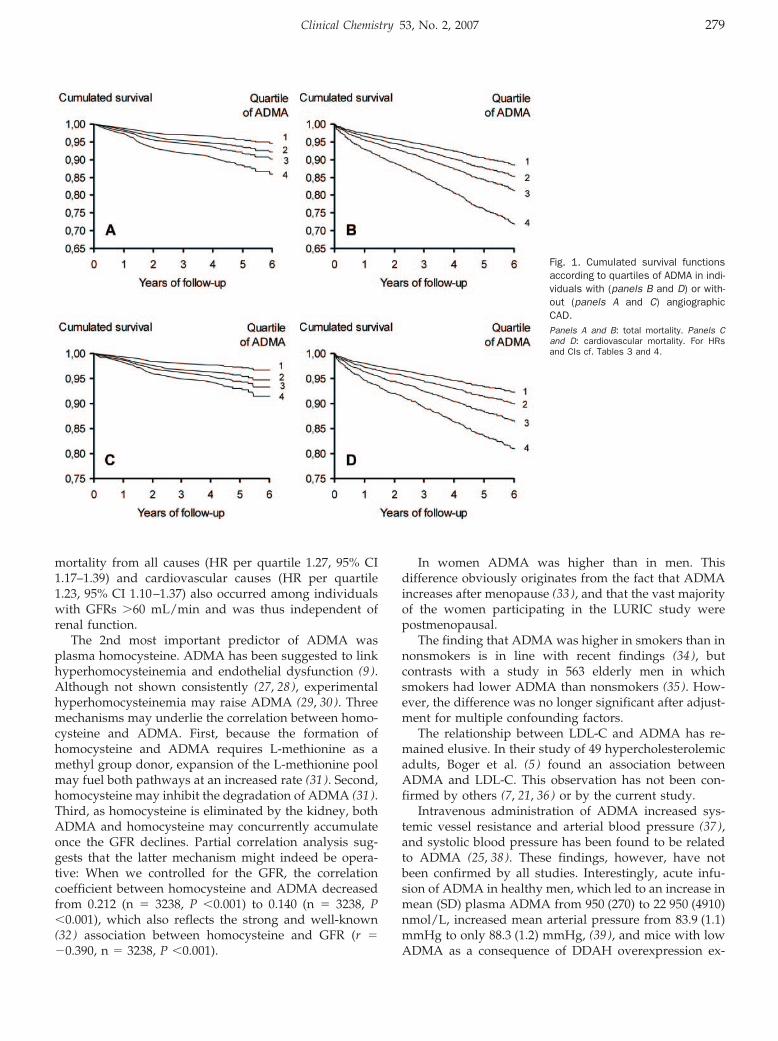
mortality from all causes (HR per quartile 1.27, 95% CI1.17–1.39) and cardiovascular causes (HR per quartile1.23, 95% CI 1.10–1.37) also occurred among individualswith GFRs �60 mL/min and was thus independent ofrenal function.
The 2nd most important predictor of ADMA wasplasma homocysteine. ADMA has been suggested to linkhyperhomocysteinemia and endothelial dysfunction (9 ).Although not shown consistently (27, 28), experimentalhyperhomocysteinemia may raise ADMA (29, 30). Threemechanisms may underlie the correlation between homo-cysteine and ADMA. First, because the formation ofhomocysteine and ADMA requires L-methionine as amethyl group donor, expansion of the L-methionine poolmay fuel both pathways at an increased rate (31 ). Second,homocysteine may inhibit the degradation of ADMA (31 ).Third, as homocysteine is eliminated by the kidney, bothADMA and homocysteine may concurrently accumulateonce the GFR declines. Partial correlation analysis sug-gests that the latter mechanism might indeed be opera-tive: When we controlled for the GFR, the correlationcoefficient between homocysteine and ADMA decreasedfrom 0.212 (n � 3238, P �0.001) to 0.140 (n � 3238, P�0.001), which also reflects the strong and well-known(32 ) association between homocysteine and GFR (r ��0.390, n � 3238, P �0.001).
In women ADMA was higher than in men. Thisdifference obviously originates from the fact that ADMAincreases after menopause (33 ), and that the vast majorityof the women participating in the LURIC study werepostmenopausal.
The finding that ADMA was higher in smokers than innonsmokers is in line with recent findings (34 ), butcontrasts with a study in 563 elderly men in whichsmokers had lower ADMA than nonsmokers (35 ). How-ever, the difference was no longer significant after adjust-ment for multiple confounding factors.
The relationship between LDL-C and ADMA has re-mained elusive. In their study of 49 hypercholesterolemicadults, Boger et al. (5 ) found an association betweenADMA and LDL-C. This observation has not been con-firmed by others (7, 21, 36) or by the current study.
Intravenous administration of ADMA increased sys-temic vessel resistance and arterial blood pressure (37 ),and systolic blood pressure has been found to be relatedto ADMA (25, 38). These findings, however, have notbeen confirmed by all studies. Interestingly, acute infu-sion of ADMA in healthy men, which led to an increase inmean (SD) plasma ADMA from 950 (270) to 22 950 (4910)nmol/L, increased mean arterial pressure from 83.9 (1.1)mmHg to only 88.3 (1.2) mmHg, (39 ), and mice with lowADMA as a consequence of DDAH overexpression ex-
Fig. 1. Cumulated survival functionsaccording to quartiles of ADMA in indi-viduals with (panels B and D) or with-out (panels A and C) angiographicCAD.Panels A and B: total mortality. Panels Cand D: cardiovascular mortality. For HRsand CIs cf. Tables 3 and 4.
Clinical Chemistry 53, No. 2, 2007 279
hibit a modest decrease in blood pressure (40 ). In thecurrent study, we did not detect increased ADMA inhypertensive patients nor were we able to prove a rela-tionship between ADMA and blood pressure. Takentogether, the effect of ADMA on blood pressure may thusbe minor.
Increased ADMA has been shown to coincide withother features of the metabolic syndrome (6, 8, 10). Krzy-zanowksa and colleagues (24 ) found ADMA to be signif-icantly increased in women with morbid obesity [n � 34,mean (SD) BMI 49 (1) kg/m2]. We did not detect any suchassociation, however, and therefore suggest that varia-tions in BMI across the commonly observed range wouldnot appreciably affect ADMA.
ADMA has been found to be increased in persons withnormotensive insulin-resistance (7 ) and diabetes mellitus(8 ). Consistently, ADMA was higher in diabetic than innondiabetic individuals and inversely related to HDL-C.Finally, our results showed a significant correlation ofADMA with CRP and a tendency toward high ADMA athigh fibrinogen. These findings are in line with reportsthat ADMA is increased in low-grade systemic inflamma-tion (24 ).
Our attempt to identify confounding nonrandomizedmedications revealed higher ADMA in users of ACEinhibitors, a result that contrasts with a report suggestingthat ACE inhibitors lower ADMA (41 ). Patients receivingdiuretics had higher ADMA than those not on diuretics.Confirming some (42 ) but not all (36, 43–46) pertinentearlier work, individuals treated with lipid-loweringdrugs (97% statins) had lower ADMA than those un-treated. The use of antiplatelet drugs was associated withlower ADMA. Insulin and oral antidiabetics were notrelated to ADMA, as would have been expected fromearlier research (7, 13, 47). We stress, however, that theseassociations are cross-sectional in nature and do not proveany pharmacological effect of the drugs on ADMA.
So far, few small prospective studies have addressedthe predictive value of ADMA for total mortality andcardiovascular mortality. In patients with mild to ad-vanced chronic kidney disease, ADMA was a strong andindependent risk marker for progression to ESRD anddeath (15 ). Zoccali et al. (3 ) examined 225 hemodialysispatients with a mean ADMA of 2520 nmol/L (interquar-tile range 1580–3850 nmol/L). Compared with the 1st and2nd quartile, HRs for death at ADMA concentrations inthe 3rd and 4th quartile were 1.72 and 3.11, respectively.An even higher mean ADMA concentration (3060nmol/L) and corresponding associations with all-causemortality and cardiovascular mortality were seen in asubsequent study of the same group (48 ). The overall riskof death and cardiovascular events is excessive in ESRD.In the 2 ESRD studies (3, 48), the annual mortality ratewas nearly 5-fold that in the current study. The highcardiovascular mortality of dialyzed patients is not solelyexplained by classical risk factors. Uremia-specific riskfactors may be important. Findings in ESRD, including
interpretation of ADMA concentrations, are thereforedifficult to extrapolate to other situations. Although wefound relative increments of risk by quartiles of ADMAsimilar to those in ESRD (3, 48), our median and 75thpercentile values of ADMA were one fourth to one fifth ofthe values in ESRD (3, 48). Thus, our work extends theinformation on ADMA and all-cause mortality in ESRD toa lower range of ADMA.
In a small nested case-control study of middle-agednonsmoking men from Eastern Finland with (n � 70) orwith no (n � 80) CAD, Valkonen et al. (16 ) observed a3.9-fold increase in the risk of cardiovascular events in thehighest quartile of ADMA compared with the remainingquartiles. The association of ADMA and acute coronaryevents was not significant in men with no history of CAD,nor was it significant in smokers. The relationship ofADMA and all-cause mortality was not reported. Tocompare our results with those by Valkonen et al. (16 ), weseparately considered men and women, individuals whodid not have a history of STEMI, and current or previoussmokers. ADMA attained virtually identical prognosticimportance in women and men. Furthermore, the predic-tive value of ADMA in former or current smokers wasequivalent to that in the entire sample. ADMA also stayedpredictive of total mortality in individuals with no previ-ous STEMI (data not shown). Thus, by demonstrating thatADMA predicts all-cause and cardiovascular death inpersons at intermediate risk regardless of sex, smokingstatus, or previous MI, our results add to those ofValkonen et al. (16 ).
Lu et al. (17 ) studied ADMA in 153 Chinese stableCAD patients undergoing percutaneous coronary inter-vention. Consistent with the current study, Lu et al. foundADMA to be associated with future death or nonfatal MI(17 ), but our study extends their observations by showingan association of high ADMA with adverse outcomes inpatients with acute coronary syndromes. Schnabel et al.(18 ) reported that ADMA was predictive of death fromcardiovascular causes or nonfatal MI in patients withCAD. Although their findings are basically consistentwith ours, Schnabel et al. did not report on total mortality,nor did they differentiate between individuals presentingin a stable clinical condition or with acute coronarysyndromes.
In our cohort total mortality was evidently driven bymortality from cardiovascular causes, and we also ob-served an association of ADMA with noncardiovascularmortality. Because the number of deaths from noncardio-vascular causes was low and because this study was notdesigned to study diseases other than cardiovascular, thisfinding should not be considered definite.
The pooled analysis of patients with stable and unsta-ble CAD is a possible limitation of our study. Anotherstudy of 48 patients with acute coronary syndromes and48 healthy volunteers indicated that acute coronary syn-dromes might increase ADMA (49 ). Because that studydid not include patients with stable CAD, it does not
280 Meinitzer et al.: ADMA Relationship to Total and Cardiovascular Mortality
refute our finding of similar ADMA in stable and unstableCAD. Therefore a combined analysis of these groupsappears justified and is supported by the fact that theseparate analyses of stable and unstable patients in ourstudy yielded very similar HRs.
The observation that ADMA predicts total and cardio-vascular mortality in patients with CAD does not provecausality. We identified several biochemical markers ofcardiovascular risk correlated with ADMA that may bythemselves explain the current findings. Among the con-founding factors, GFR may deserve particular attentionbecause impaired renal function represents a cardiovas-cular risk factor by itself and high ADMA may merelyindicate renal dysfunction. Nevertheless, after we con-trolled for confounding variables in multivariable modelsand for the use of drugs, ADMA retained predictivepower. Other confounders that may be related to ADMAmay have been disregarded in this study, however.
Our study population consisted of selectively enrolledmiddle-aged to elderly Caucasians; therefore the resultscannot be generalized to younger persons or other racesor ethnicities. That coronary angiography was indicatedin each study participant may have produced referralbias. The definition of the coronary artery status, how-ever, may be a strength of the study. The prevalence ofclinically asymptomatic coronary atherosclerosis has beenreported to be high at �50 years of age. Hence, angiog-raphy-based recruitment prevents inadvertent allocationof individuals with significant, clinically unapparent CADto the control group. Surprisingly, among the studyparticipants classified as having no CAD the major car-diovascular risk factors occurred at a frequency similar tothat of the general population. For example, the preva-lence of hypertension is close to that found in the Germanpopulation (50 ). Diabetes mellitus in our group firstappeared to be 2 to 3 times more frequent than in theGerman population, but this is likely due to the fact thatwe measured fasting glucose and performed an oralglucose challenge in individuals not known to havediabetes. Based on clinical history or fasting glucosemeasurements, the National Health and Nutrition Exam-ination surveys 1999–2000 reports prevalences of diabetesmellitus of 9.2% and 19.3% in adults 40–59 or �60 years ofage, respectively (51 ). In the current study, 12.1% of thepersons without CAD had diabetes mellitus according tothis criterion, and another 5.6% were detected by in-creased postchallenge glucose.
In this study, the largest to examine ADMA as apredictor of mortality, ADMA was a surprisingly robustpredictor of mortality from all causes and from cardio-vascular causes. The predictive value of ADMA wassimilar in patients with stable CAD or acute coronarysyndromes and in those with or without history of STEMI.Because the association of ADMA with mortality did notreach statistical significance in persons with no CAD,investigation in asymptomatic persons is warranted.
The authors extend appreciation to the participants of theLudwigshafen Risk and Cardiovascular Health Studywithout their collaboration this article would not havebeen written. We thank Mrs. Gabriele Gartner, Graz, forexcellent technical assistance and the LURIC study teameither temporarily or permanently involved in patientrecruitment, sample and data handling, and the labora-tory staff at the Ludwigshafen General Hospital and theUniversities of Freiburg and Ulm, Germany.
References1. Vallance P, Leone A, Calver A, Collier J, Moncada S. Accumulation
of an endogenous inhibitor of nitric oxide synthesis in chronicrenal failure. Lancet 1992;339:572–5.
2. Anderstam B, Katzarski K, Bergstrom J. Serum levels of NG,NG-dimethyl-L-arginine, a potential endogenous nitric oxide inhib-itor in dialysis patients. J Am Soc Nephrol 1997;8:1437–42.
3. Zoccali C, Bode-Boger S, Mallamaci F, Benedetto F, Tripepi G,Malatino L, et al. Plasma concentration of asymmetrical dimethyl-arginine and mortality in patients with end-stage renal disease: aprospective study. Lancet 2001;358:2113–7.
4. Kielstein JT, Zoccali C. Asymmetric dimethylarginine: a cardiovas-cular risk factor and a uremic toxin coming of age. Am J Kidney Dis2005;46:186–202.
5. Boger RH, Bode-Boger SM, Szuba A, Tsao PS, Chan JR, TangphaoO, et al. Asymmetric dimethylarginine (ADMA): a novel risk factorfor endothelial dysfunction: its role in hypercholesterolemia. Cir-culation 1998;98:1842–7.
6. Lundman P, Eriksson MJ, Stuhlinger M, Cooke JP, Hamsten A,Tornvall P. Mild-to-moderate hypertriglyceridemia in young men isassociated with endothelial dysfunction and increased plasmaconcentrations of asymmetric dimethylarginine. J Am Coll Cardiol2001;38:111–6.
7. Stuhlinger MC, Abbasi F, Chu JW, Lamendola C, McLaughlin TL,Cooke JP, et al. Relationship between insulin resistance and anendogenous nitric oxide synthase inhibitor. JAMA 2002;287:1420–6.
8. Abbasi F, Asagmi T, Cooke JP, Lamendola C, McLaughlin T,Reaven GM, et al. Plasma concentrations of asymmetric dimethyl-arginine are increased in patients with type 2 diabetes mellitus. Am JCardiol 2001;88:1201–3.
9. Stuhlinger MC, Stanger O. Asymmetric dimethyl-L-arginine (ADMA):a possible link between homocyst(e)ine and endothelial dysfunc-tion. Curr Drug Metab 2005;6:3–14.
10. Surdacki A, Nowicki M, Sandmann J, Tsikas D, Boeger RH,Bode-Boeger SM, et al. Reduced urinary excretion of nitric oxidemetabolites and increased plasma levels of asymmetric dimethyl-arginine in men with essential hypertension. J Cardiovasc Pharmacol1999;33:652–8.
11. Cooke JP. Asymmetrical dimethylarginine: the Uber marker? Cir-culation 2004;109:1813–8.
12. Nijveldt RJ, Teerlink T, Van Der Hoven B, Siroen MP, Kuik DJ,Rauwerda JA, et al. Asymmetrical dimethylarginine (ADMA) incritically ill patients: high plasma ADMA concentration is anindependent risk factor of ICU mortality. Clin Nutr 2003;22:23–30.
13. Siroen MP, van Leeuwen PA, Nijveldt RJ, Teerlink T, Wouters PJ,Van den Berghe G. Modulation of asymmetric dimethylarginine incritically ill patients receiving intensive insulin treatment: a pos-sible explanation of reduced morbidity and mortality? Crit CareMed 2005;33:504–10.
14. Kielstein JT, Bode-Boger SM, Hesse G, Martens-Lobenhoffer J,Takacs A, Fliser D, et al. Asymmetrical dimethylarginine in idio-
Clinical Chemistry 53, No. 2, 2007 281
pathic pulmonary arterial hypertension. Arterioscler Thromb VascBiol 2005;25:1414–8.
15. Ravani P, Tripepi G, Malberti F, Testa S, Mallamaci F, Zoccali C.Asymmetrical dimethylarginine predicts progression to dialysisand death in patients with chronic kidney disease: a competingrisks modeling approach. J Am Soc Nephrol 2005;16:2449–55.
16. Valkonen VP, Paiva H, Salonen JT, Lakka TA, Lehtimaki T, LaaksoJ, et al. Risk of acute coronary events and serum concentration ofasymmetrical dimethylarginine. Lancet 2001;358:2127–8.
17. Lu TM, Ding YA, Lin SJ, Lee WS, Tai HC. Plasma levels ofasymmetrical dimethylarginine and adverse cardiovascular eventsafter percutaneous coronary intervention. Eur Heart J 2003;24:1912–9.
18. Schnabel R, Blankenberg S, Lubos E, Lackner KJ, Rupprecht HJ,Espinola-Klein C, et al. Asymmetric dimethylarginine and the riskof cardiovascular events and death in patients with coronary arterydisease: results from the AtheroGene Study. Circ Res 2005;97:e53–9.
19. Winkelmann BR, Marz W, Boehm BO, Zotz R, Hager J, Hellstern P,et al. Rationale and design of the LURIC study–a resource forfunctional genomics, pharmacogenomics and long-term prognosisof cardiovascular disease. Pharmacogenomics 2001;2:S1–73.
20. American Diabetes Association. Diagnosis and classification ofdiabetes mellitus. Diabetes Care 2006;29(Suppl 1):S43–8.
21. Fard A, Tuck CH, Donis JA, Sciacca R, Di Tullio MR, Wu HD, et al.Acute elevations of plasma asymmetric dimethylarginine andimpaired endothelial function in response to a high-fat meal inpatients with type 2 diabetes. Arterioscler Thromb Vasc Biol2000;20:2039–44.
22. Levey AS, Bosch JP, Lewis JB, Greene T, Rogers N, Roth D. A moreaccurate method to estimate glomerular filtration rate from serumcreatinine: a new prediction equation. Modification of Diet inRenal Disease Study Group. Ann Intern Med 1999;130:461–70.
23. Teerlink T, Nijveldt RJ, de Jong S, van Leeuwen PA. Determinationof arginine, asymmetric dimethylarginine, and symmetric dimethyl-arginine in human plasma and other biological samples by high-performance liquid chromatography. Anal Biochem2002;303:131–7.
24. Krzyzanowska K, Mittermayer F, Kopp HP, Wolzt M, SchernthanerG. Weight loss reduces circulating asymmetrical dimethylarginineconcentrations in morbidly obese women. J Clin Endocrinol Metab2004;89:6277–81.
25. Curgunlu A, Uzun H, Bavunoglu I, Karter Y, Genc H, Vehid S.Increased circulating concentrations of asymmetric dimethylargi-nine (ADMA) in white coat hypertension. J Hum Hypertens 2005;19:629–33.
26. Zoccali C, Kielstein JT. Asymmetric dimethylarginine: a new playerin the pathogenesis of renal disease? Curr Opin Nephrol Hyper-tens 2006;15:314–20.
27. Wanby P, Brattstrom L, Brudin L, Hultberg B, Teerlink T. Asymmet-ric dimethylarginine and total homocysteine in plasma after oralmethionine loading. Scand J Clin Lab Invest 2003;63:347–53.
28. Doshi S, McDowell I, Goodfellow J, Stabler S, Boger R, Allen R, etal. Relationship between S-adenosylmethionine, S-adenosylhomo-cysteine, asymmetric dimethylarginine, and endothelial function inhealthy human subjects during experimental hyper- and hypoho-mocysteinemia. Metabolism 2005;54:351–60.
29. Boger RH, Lentz SR, Bode-Boger SM, Knapp HR, Haynes WG.Elevation of asymmetrical dimethylarginine may mediate endothe-lial dysfunction during experimental hyperhomocyst(e)inaemia inhumans. Clin Sci (Lond) 2001;100:161–7.
30. Stuhlinger MC, Oka RK, Graf EE, Schmolzer I, Upson BM, KapoorO, et al. Endothelial dysfunction induced by hyperhomocyst(e)ine-mia: role of asymmetric dimethylarginine. Circulation 2003;108:933–8.
31. Stuhlinger MC, Tsao PS, Her JH, Kimoto M, Balint RF, Cooke JP.Homocysteine impairs the nitric oxide synthase pathway: role ofasymmetric dimethylarginine. Circulation 2001;104:2569–75.
32. Kielstein JT, Boger RH, Bode-Boger SM, Frolich JC, Haller H, RitzE, et al. Marked increase of asymmetric dimethylarginine inpatients with incipient primary chronic renal disease. J Am SocNephrol 2002;13:170–6.
33. Schulze F, Maas R, Freese R, Schwedhelm E, Silberhorn E, BogerRH. Determination of a reference value for N(G), N(G)-dimethyl-L-arginine in 500 subjects. Eur J Clin Invest 2005;35:622–6.
34. Zhang WZ, Venardos K, Chin-Dusting J, Kaye DM. Adverse effectsof cigarette smoke on NO bioavailability: role of arginine metabo-lism and oxidative stress. Hypertension 2006;48:278–85.
35. Eid HM, Arnesen H, Hjerkinn EM, Lyberg T, Seljeflot I. Relationshipbetween obesity, smoking, and the endogenous nitric oxidesynthase inhibitor, asymmetric dimethylarginine. Metabolism2004;53:1574–9.
36. Paiva H, Laakso J, Lehtimaki T, Isomustajarvi M, Ruokonen I,Laaksonen R. Effect of high-dose statin treatment on plasmaconcentrations of endogenous nitric oxide synthase inhibitors.J Cardiovasc Pharmacol 2003;41:219–22.
37. Achan V, Broadhead M, Malaki M, Whitley G, Leiper J, MacAllisterR, et al. Asymmetric dimethylarginine causes hypertension andcardiac dysfunction in humans and is actively metabolized bydimethylarginine dimethylaminohydrolase. Arterioscler ThrombVasc Biol 2003;23:1455–9.
38. Miyazaki H, Matsuoka H, Cooke JP, Usui M, Ueda S, Okuda S,Imaizumi T. Endogenous nitric oxide synthase inhibitor: a novelmarker of atherosclerosis. Circulation 1999;99:1141–6.
39. Kielstein JT, Impraim B, Simmel S, Bode-Boger SM, Tsikas D,Frolich JC, et al. Cardiovascular effects of systemic nitric oxidesynthase inhibition with asymmetrical dimethylarginine in hu-mans. Circulation 2004;109:172–7.
40. Dayoub H, Achan V, Adimoolam S, Jacobi J, Stuehlinger MC, WangBY, et al. Dimethylarginine dimethylaminohydrolase regulatesnitric oxide synthesis: genetic and physiological evidence. Circu-lation 2003;108:3042–7.
41. Chen JW, Hsu NW, Wu TC, Lin SJ, Chang MS. Long-term angioten-sin-converting enzyme inhibition reduces plasma asymmetric di-methylarginine and improves endothelial nitric oxide bioavailabilityand coronary microvascular function in patients with syndrome X.Am J Cardiol 2002;90:974–82.
42. Lu TM, Ding YA, Leu HB, Yin WH, Sheu WH, Chu KM. Effect ofrosuvastatin on plasma levels of asymmetric dimethylarginine inpatients with hypercholesterolemia. Am J Cardiol 2004;94:157–61.
43. Sasaki S, Kuwahara N, Kunitomo K, Harada S, Yamada T, AzumaA, et al. Effects of atorvastatin on oxidized low-density lipoprotein,low-density lipoprotein subfraction distribution, and remnant li-poprotein in patients with mixed hyperlipoproteinemia. Am JCardiol 2002;89:386–9.
44. Eid HM, Eritsland J, Larsen J, Arnesen H, Seljeflot I. Increasedlevels of asymmetric dimethylarginine in populations at risk foratherosclerotic disease. Effects of pravastatin. Atherosclerosis2003;166:279–84.
45. Janatuinen T, Laakso J, Laaksonen R, Vesalainen R, Nuutila P,Lehtimaki T, et al. Plasma asymmetric dimethylarginine modifiesthe effect of pravastatin on myocardial blood flow in young adults.Vasc Med 2003;8:185–9.
46. Maas R, Quitzau K, Schwedhelm E, Spieker L, Rafflenbeul W,Steenpass A, et al. Asymmetrical dimethylarginine (ADMA) andcoronary endothelial function in patients with coronary arterydisease and mild hypercholesterolemia. Atherosclerosis. 2006Jul 6; [Epub ahead of print].
282 Meinitzer et al.: ADMA Relationship to Total and Cardiovascular Mortality

47. Asagami T, Abbasi F, Stuelinger M, Lamendola C, McLaughlin T,Cooke JP, et al. Metformin treatment lowers asymmetric dimethyl-arginine concentrations in patients with type 2 diabetes. Metabolism2002;51:843–6.
48. Mallamaci F, Tripepi G, Cutrupi S, Malatino LS, Zoccali C. Prog-nostic value of combined use of biomarkers of inflammation,endothelial dysfunction, and myocardiopathy in patients withESRD. Kidney Int 2005;67:2330–7.
49. Bae SW, Stuhlinger MC, Yoo HS, Yu KH, Park HK, Choi BY, et al.Plasma asymmetric dimethylarginine concentrations in newly di-
agnosed patients with acute myocardial infarction or unstableangina pectoris during two weeks of medical treatment. Am JCardiol 2005;95:729–33.
50. Wolf-Maier K, Cooper RS, Banegas JR, Giampaoli S, Hense HW,Joffres M, et al. Hypertension prevalence and blood pressurelevels in 6 European countries, Canada, and the United States.JAMA 2003;289:2363–9.
51. Prevalence of diabetes and impaired fasting glucose in adults–United States, 1999–2000. MMWR Morb Mortal Wkly Rep 2003;52:833–7.
Clinical Chemistry 53, No. 2, 2007 283
Circulating Concentrations of Growth-Differentiation Factor 15 in Apparently Healthy
Elderly Individuals and Patients with ChronicHeart Failure as Assessed by a NewImmunoradiometric Sandwich Assay
Tibor Kempf,1 Rudiger Horn-Wichmann,2 Georg Brabant,2 Timo Peter,1 Tim Allhoff,1
Gunnar Klein,1 Helmut Drexler,1 Nina Johnston,3 Lars Wallentin,3 andKai C. Wollert1*
Background: Growth-differentiation factor 15 (GDF15)is a member of the transforming growth factor �(TGF-�) cytokine superfamily. There has been increas-ing interest in using circulating GDF15 as a biomarkerin patients, for example those with cardiovasculardisease.Methods: We developed an IRMA that uses a poly-clonal, affinity chromatography–purified goat antihu-man GDF15 IgG antibody, assessed the preanalyticcharacteristics of GDF15, and determined circulatingGDF15 concentrations in 429 apparently healthy elderlyindividuals and 153 patients with chronic heart failure(CHF).Results: The assay had a detection limit of 20 ng/L, anintraassay imprecision of <10.6%, and an interassayimprecision of <12.2%. Specificity was demonstratedwith size-exclusion chromatography, parallel measure-ments with polyclonal and monoclonal anti-GDF15 an-tibody, and lack of cross-reactivity with TGF-�. Theassay was not appreciably influenced by the anticoagu-lant matrix or unrelated biological substances. GDF15was stable at room temperature for 48 h and resistant to4 freeze-thaw cycles. Apparently healthy, elderly indi-
viduals presented with a median GDF15 concentrationof 762 ng/L (25th–75th percentiles, 600–959 ng/L). GDF15concentrations were associated with age and with cysta-tin C and C-reactive protein concentrations. CHF pa-tients had increased GDF15 concentrations that wereclosely related to disease severity.Conclusion: The IRMA can detect GDF15 in humanserum and plasma with excellent sensitivity and speci-ficity. The reference limits and confounding variablesdefined for apparently healthy elderly individuals andthe favorable preanalytic characteristics of GDF15 areexpected to facilitate future studies of GDF15 as abiomarker in various disease settings, including CHF.© 2007 American Association for Clinical Chemistry
Growth-differentiation factor 15 (GDF15)4 is a member ofthe transforming growth factor � (TGF-�) cytokine super-family. GDF15 was originally cloned as macrophage-inhibitory cytokine 1 and later also identified as placentalTGF-�, placental bone morphogenetic protein, nonsteroi-dal antiinflammatory drug–activated gene 1, and pros-tate-derived factor (1–5). Like other TGF-�–related cyto-kines, GDF15 is synthesized as a precursor protein thatundergoes disulfide-linked dimerization. Proteolysiscleaves the correctly folded GDF15 precursor protein torelease the N-terminal propeptide from the matureDepartments of 1 Cardiology and Angiology and 2 Gastroenterology,
Hepatology, and Endocrinology, Hannover Medical School, Hannover, Ger-many.
3 Department of Cardiology and Uppsala Clinical Research Center, Uni-versity of Uppsala, Uppsala, Sweden.
* Address correspondence to this author at: Abt. Kardiologie und Angi-ologie, Medizinische Hochschule Hannover, Carl-Neuberg Str. 1, 30625 Han-nover, Germany. Fax 49-511-532-5412; e-mail [email protected].
Received July 19, 2006; accepted November 28, 2006.Previously published online at DOI: 10.1373/clinchem.2006.076828
4 Nonstandard abbreviations: GDF15, growth-differentiation factor 15;TGF-�, transforming growth factor �; CHF, chronic heart failure; rh, recombi-nant human; SWISCH, Swedish Women and Men and Ischemic Heart Disease;CRP, C-reactive protein; NT-proBNP, N-terminal pro-B-type natriureticpeptide.
Clinical Chemistry 53:2284–291 (2007) Endocrinology and
Metabolism
284
GDF15 peptide, which is then secreted as a disulfide-linked dimer with an Mr of �28 000 (1, 6, 7). In tumorcells, unprocessed or partially processed forms of GDF15may also be secreted, and these forms remain bound tothe extracellular matrix and undergo extracellularprocessing (8 ).
GDF15 is weakly produced under baseline conditionsin most tissues (1, 9). In response to pathologic or envi-ronmental stress, however, GDF15 production maysharply increase. For example, experimental carbon tetra-chloride poisoning and cryoinjury strongly induce GDF15expression in the liver and brain, respectively (10, 11). Weand others recently reported that GDF15 production in-creases markedly in the heart in mouse models of myo-cardial infarction and heart failure (12, 13). Cell cultureexperiments indicate that GDF15 is involved in the exe-cution of cell survival and cell death programs in neuronsand tumor cell lines (14–18). More recent studies ofGDF155 gene–targeted mice indicating that GDF15 func-tions as a cardioprotective cytokine during myocardialinfarction and heart failure were the first to demonstrate afunctional role for GDF15 in vivo (12, 13).
These basic studies have been accompanied by increas-ing interest in the use of GDF15 as a biomarker fordiagnosis, prognosis, and/or risk stratification in differ-ent patient populations. Serum GDF15 concentrationshave been found to increase during pregnancy (19 ), andlow GDF15 concentrations reportedly are associated withan increased risk of miscarriage (20 ). Additional studieshave shown that patients with pancreatic and colorectalcancer may present with increased circulating GDF15concentrations (21–23). Moreover, increased circulatingGDF15 concentrations have been linked to an enhancedrisk of future adverse cardiovascular events in elderlywomen (24 ). It is remarkable, therefore, that the preana-lytic characteristics of GDF15 and its confounding vari-ables have never been defined for healthy individuals.
In the present study, we established a new sandwichIRMA to measure GDF15 in human serum and plasma.We used this technique to assess the preanalytic charac-teristics of the analyte and to determine circulating GDF15concentrations in a cohort of 429 apparently healthyelderly individuals, both to identify potential confound-ing variables and to establish reference values for futureinvestigations of GDF15 as a biomarker in different pa-tient populations. Given the potential importance ofGDF15 in the failing heart (13 ), we also assessed circulat-ing GDF15 concentrations in 153 patients with chronicheart failure (CHF).
Materials and MethodsmaterialsRecombinant human GDF15 (rhGDF15, 957-GD/CF), apolyclonal GDF15 affinity chromatography–purified goat
antihuman GDF15 IgG antibody (AF957), and a monoclo-nal murine antihuman GDF15 antibody (MAB957) werepurchased from R&D Systems. rhTGF-� (T7039) was fromSigma-Aldrich.
gdf15 sandwich irmaMaxisorp Startubes (Nunc) were coated overnight at 4 °Cwith 0.5 �g polyclonal anti-GDF15 antibody in 0.1 mol/Lsodium carbonate buffer (pH 9) and then washed twicewith phosphate-buffered saline (40 mmol/L sodiumphosphate, 150 mmol/L sodium chloride, pH 7.4) con-taining 1 mL/L Tween 20. Serum and plasma samples(100 �L) were then diluted 1:1 with assay buffer [30 g/Lbovine serum albumin (Sigma-Aldrich), 10 g/L bovineIgG, 10 mL/L goat serum, 1 g/L sodium azide, 1 mol/Lsodium chloride, and 40 mmol/L sodium phosphatebuffer, pH 7.4], added to the tubes, and incubated for 16 hat 4 °C. Polyclonal anti-GDF15 antibody (20 �g) wasiodinated with 25 MBq 125I (Hartmann) with Iodogen(Perbio Science) as previously described (25 ). Unbound125I was removed by desalting on a 10-mL Sephadex G-25column (Pharmacia). After removal of the serum orplasma samples, the tubes were washed twice, and 200 �Lof assay buffer containing �7.4 kBq 125I-labeled poly-clonal anti-GDF15 antibody (tracer) was added to each ofthe tubes, which were then incubated for 4 h at roomtemperature. After 3 final washing steps, bound radioac-tivity was quantified in a gamma counter (LKB Wallac1261). All measurements were performed in duplicate. Ineach experiment, a calibration curve was generated withvarious rhGDF15 dilutions (an rhGDF15 stock solutionwas stored as aliquots at �70 °C) and used to calculateGDF15 concentrations in individual samples. Pooled con-trol samples (also stored in aliquots at �70 °C) wereanalyzed with each single run.
In an initial experiment, assay linearity was assessedwith serial dilutions of 5 serum samples containing highGDF15 concentrations. These samples were obtained from2 pregnant women and 3 CHF patients. Independently ofthe reason for the increased GDF15 serum concentrations,the measured GDF15 concentrations were comparable tothe expected concentrations (none of the samples showeda deviation �15%). The assay was linear from �200 to50 000 ng/L. Moreover, assays of pools of 5 serum sam-ples with low GDF15 concentrations (650–3984 ng/L)with 5 samples with higher concentrations (2506–12 582ng/L) in 5 different combinations yielded measured con-centrations with means well within the range of theexpected concentrations (97%–108%).
We used the polyclonal anti-GDF15 antibody for cap-ture and detection in all experiments in the present study,with the exception of 1 validation experiment. In thisexperiment, we compared the polyclonal anti-GDF15 an-tibody and a newly available monoclonal anti-GDF15antibody with respect to antigen capture in serum andcitrated plasma (containing 10 mmol/L trisodium citrate)to further evaluate the specificity of the assay.5 Human gene: GDF15, growth-differentiation factor 15.
Clinical Chemistry 53, No. 2, 2007 285
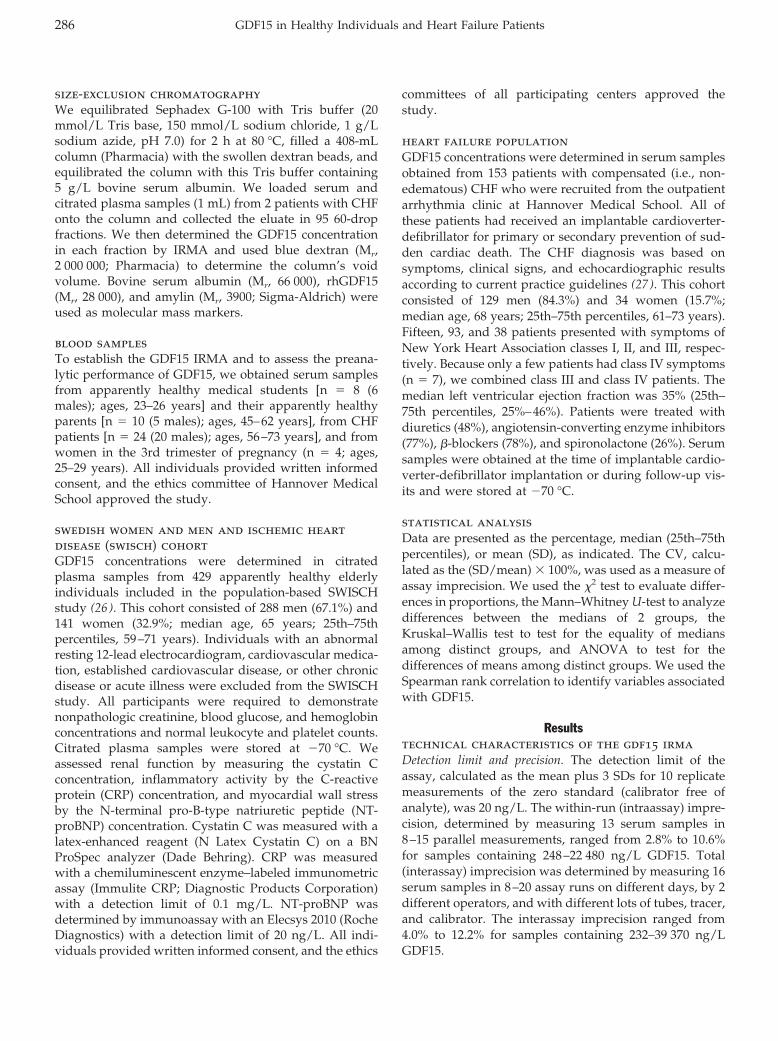
size-exclusion chromatographyWe equilibrated Sephadex G-100 with Tris buffer (20mmol/L Tris base, 150 mmol/L sodium chloride, 1 g/Lsodium azide, pH 7.0) for 2 h at 80 °C, filled a 408-mLcolumn (Pharmacia) with the swollen dextran beads, andequilibrated the column with this Tris buffer containing5 g/L bovine serum albumin. We loaded serum andcitrated plasma samples (1 mL) from 2 patients with CHFonto the column and collected the eluate in 95 60-dropfractions. We then determined the GDF15 concentrationin each fraction by IRMA and used blue dextran (Mr,2 000 000; Pharmacia) to determine the column’s voidvolume. Bovine serum albumin (Mr, 66 000), rhGDF15(Mr, 28 000), and amylin (Mr, 3900; Sigma-Aldrich) wereused as molecular mass markers.
blood samplesTo establish the GDF15 IRMA and to assess the preana-lytic performance of GDF15, we obtained serum samplesfrom apparently healthy medical students [n � 8 (6males); ages, 23–26 years] and their apparently healthyparents [n � 10 (5 males); ages, 45–62 years], from CHFpatients [n � 24 (20 males); ages, 56–73 years], and fromwomen in the 3rd trimester of pregnancy (n � 4; ages,25–29 years). All individuals provided written informedconsent, and the ethics committee of Hannover MedicalSchool approved the study.
swedish women and men and ischemic heartdisease (swisch) cohortGDF15 concentrations were determined in citratedplasma samples from 429 apparently healthy elderlyindividuals included in the population-based SWISCHstudy (26 ). This cohort consisted of 288 men (67.1%) and141 women (32.9%; median age, 65 years; 25th–75thpercentiles, 59–71 years). Individuals with an abnormalresting 12-lead electrocardiogram, cardiovascular medica-tion, established cardiovascular disease, or other chronicdisease or acute illness were excluded from the SWISCHstudy. All participants were required to demonstratenonpathologic creatinine, blood glucose, and hemoglobinconcentrations and normal leukocyte and platelet counts.Citrated plasma samples were stored at �70 °C. Weassessed renal function by measuring the cystatin Cconcentration, inflammatory activity by the C-reactiveprotein (CRP) concentration, and myocardial wall stressby the N-terminal pro-B-type natriuretic peptide (NT-proBNP) concentration. Cystatin C was measured with alatex-enhanced reagent (N Latex Cystatin C) on a BNProSpec analyzer (Dade Behring). CRP was measuredwith a chemiluminescent enzyme–labeled immunometricassay (Immulite CRP; Diagnostic Products Corporation)with a detection limit of 0.1 mg/L. NT-proBNP wasdetermined by immunoassay with an Elecsys 2010 (RocheDiagnostics) with a detection limit of 20 ng/L. All indi-viduals provided written informed consent, and the ethics
committees of all participating centers approved thestudy.
heart failure populationGDF15 concentrations were determined in serum samplesobtained from 153 patients with compensated (i.e., non-edematous) CHF who were recruited from the outpatientarrhythmia clinic at Hannover Medical School. All ofthese patients had received an implantable cardioverter-defibrillator for primary or secondary prevention of sud-den cardiac death. The CHF diagnosis was based onsymptoms, clinical signs, and echocardiographic resultsaccording to current practice guidelines (27 ). This cohortconsisted of 129 men (84.3%) and 34 women (15.7%;median age, 68 years; 25th–75th percentiles, 61–73 years).Fifteen, 93, and 38 patients presented with symptoms ofNew York Heart Association classes I, II, and III, respec-tively. Because only a few patients had class IV symptoms(n � 7), we combined class III and class IV patients. Themedian left ventricular ejection fraction was 35% (25th–75th percentiles, 25%–46%). Patients were treated withdiuretics (48%), angiotensin-converting enzyme inhibitors(77%), �-blockers (78%), and spironolactone (26%). Serumsamples were obtained at the time of implantable cardio-verter-defibrillator implantation or during follow-up vis-its and were stored at �70 °C.
statistical analysisData are presented as the percentage, median (25th–75thpercentiles), or mean (SD), as indicated. The CV, calcu-lated as the (SD/mean) � 100%, was used as a measure ofassay imprecision. We used the �2 test to evaluate differ-ences in proportions, the Mann–Whitney U-test to analyzedifferences between the medians of 2 groups, theKruskal–Wallis test to test for the equality of mediansamong distinct groups, and ANOVA to test for thedifferences of means among distinct groups. We used theSpearman rank correlation to identify variables associatedwith GDF15.
Resultstechnical characteristics of the gdf15 irmaDetection limit and precision. The detection limit of theassay, calculated as the mean plus 3 SDs for 10 replicatemeasurements of the zero standard (calibrator free ofanalyte), was 20 ng/L. The within-run (intraassay) impre-cision, determined by measuring 13 serum samples in8–15 parallel measurements, ranged from 2.8% to 10.6%for samples containing 248–22 480 ng/L GDF15. Total(interassay) imprecision was determined by measuring 16serum samples in 8–20 assay runs on different days, by 2different operators, and with different lots of tubes, tracer,and calibrator. The interassay imprecision ranged from4.0% to 12.2% for samples containing 232–39 370 ng/LGDF15.
286 GDF15 in Healthy Individuals and Heart Failure Patients
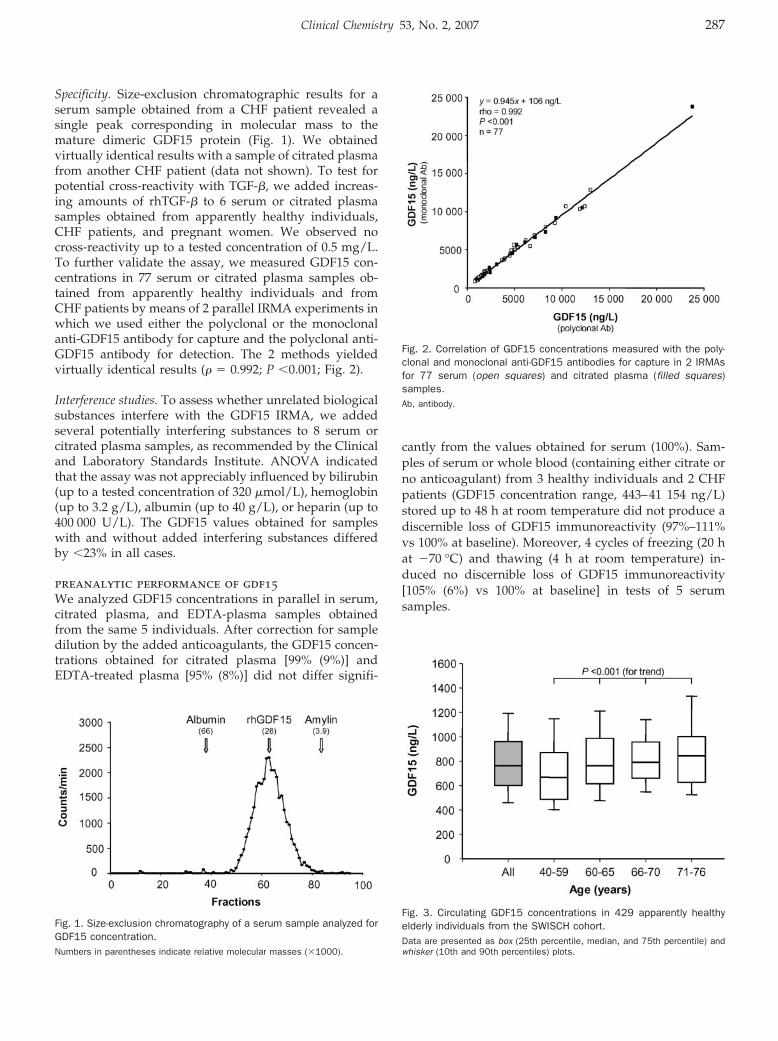
Specificity. Size-exclusion chromatographic results for aserum sample obtained from a CHF patient revealed asingle peak corresponding in molecular mass to themature dimeric GDF15 protein (Fig. 1). We obtainedvirtually identical results with a sample of citrated plasmafrom another CHF patient (data not shown). To test forpotential cross-reactivity with TGF-�, we added increas-ing amounts of rhTGF-� to 6 serum or citrated plasmasamples obtained from apparently healthy individuals,CHF patients, and pregnant women. We observed nocross-reactivity up to a tested concentration of 0.5 mg/L.To further validate the assay, we measured GDF15 con-centrations in 77 serum or citrated plasma samples ob-tained from apparently healthy individuals and fromCHF patients by means of 2 parallel IRMA experiments inwhich we used either the polyclonal or the monoclonalanti-GDF15 antibody for capture and the polyclonal anti-GDF15 antibody for detection. The 2 methods yieldedvirtually identical results (� � 0.992; P �0.001; Fig. 2).
Interference studies. To assess whether unrelated biologicalsubstances interfere with the GDF15 IRMA, we addedseveral potentially interfering substances to 8 serum orcitrated plasma samples, as recommended by the Clinicaland Laboratory Standards Institute. ANOVA indicatedthat the assay was not appreciably influenced by bilirubin(up to a tested concentration of 320 �mol/L), hemoglobin(up to 3.2 g/L), albumin (up to 40 g/L), or heparin (up to400 000 U/L). The GDF15 values obtained for sampleswith and without added interfering substances differedby �23% in all cases.
preanalytic performance of gdf15We analyzed GDF15 concentrations in parallel in serum,citrated plasma, and EDTA-plasma samples obtainedfrom the same 5 individuals. After correction for sampledilution by the added anticoagulants, the GDF15 concen-trations obtained for citrated plasma [99% (9%)] andEDTA-treated plasma [95% (8%)] did not differ signifi-
cantly from the values obtained for serum (100%). Sam-ples of serum or whole blood (containing either citrate orno anticoagulant) from 3 healthy individuals and 2 CHFpatients (GDF15 concentration range, 443–41 154 ng/L)stored up to 48 h at room temperature did not produce adiscernible loss of GDF15 immunoreactivity (97%–111%vs 100% at baseline). Moreover, 4 cycles of freezing (20 hat �70 °C) and thawing (4 h at room temperature) in-duced no discernible loss of GDF15 immunoreactivity[105% (6%) vs 100% at baseline] in tests of 5 serumsamples.
Fig. 3. Circulating GDF15 concentrations in 429 apparently healthyelderly individuals from the SWISCH cohort.Data are presented as box (25th percentile, median, and 75th percentile) andwhisker (10th and 90th percentiles) plots.
Fig. 1. Size-exclusion chromatography of a serum sample analyzed forGDF15 concentration.Numbers in parentheses indicate relative molecular masses (�1000).
Fig. 2. Correlation of GDF15 concentrations measured with the poly-clonal and monoclonal anti-GDF15 antibodies for capture in 2 IRMAsfor 77 serum (open squares) and citrated plasma (filled squares)samples.Ab, antibody.
Clinical Chemistry 53, No. 2, 2007 287
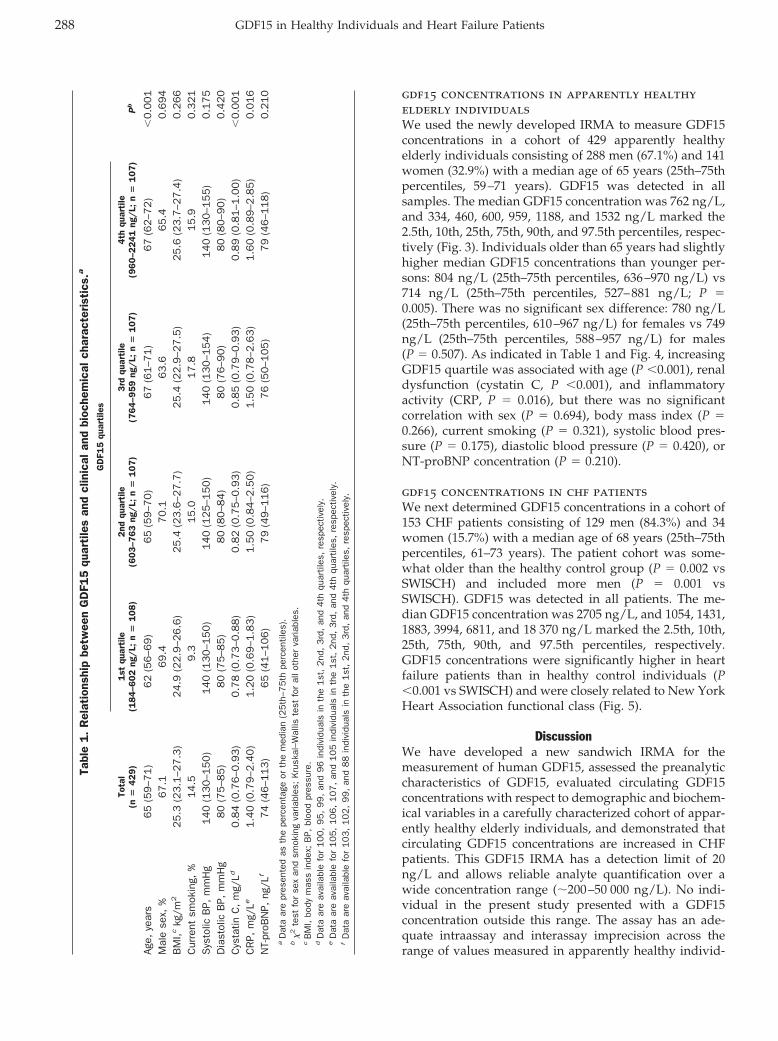
gdf15 concentrations in apparently healthyelderly individualsWe used the newly developed IRMA to measure GDF15concentrations in a cohort of 429 apparently healthyelderly individuals consisting of 288 men (67.1%) and 141women (32.9%) with a median age of 65 years (25th–75thpercentiles, 59–71 years). GDF15 was detected in allsamples. The median GDF15 concentration was 762 ng/L,and 334, 460, 600, 959, 1188, and 1532 ng/L marked the2.5th, 10th, 25th, 75th, 90th, and 97.5th percentiles, respec-tively (Fig. 3). Individuals older than 65 years had slightlyhigher median GDF15 concentrations than younger per-sons: 804 ng/L (25th–75th percentiles, 636–970 ng/L) vs714 ng/L (25th–75th percentiles, 527–881 ng/L; P �0.005). There was no significant sex difference: 780 ng/L(25th–75th percentiles, 610–967 ng/L) for females vs 749ng/L (25th–75th percentiles, 588–957 ng/L) for males(P � 0.507). As indicated in Table 1 and Fig. 4, increasingGDF15 quartile was associated with age (P �0.001), renaldysfunction (cystatin C, P �0.001), and inflammatoryactivity (CRP, P � 0.016), but there was no significantcorrelation with sex (P � 0.694), body mass index (P �0.266), current smoking (P � 0.321), systolic blood pres-sure (P � 0.175), diastolic blood pressure (P � 0.420), orNT-proBNP concentration (P � 0.210).
gdf15 concentrations in chf patientsWe next determined GDF15 concentrations in a cohort of153 CHF patients consisting of 129 men (84.3%) and 34women (15.7%) with a median age of 68 years (25th–75thpercentiles, 61–73 years). The patient cohort was some-what older than the healthy control group (P � 0.002 vsSWISCH) and included more men (P � 0.001 vsSWISCH). GDF15 was detected in all patients. The me-dian GDF15 concentration was 2705 ng/L, and 1054, 1431,1883, 3994, 6811, and 18 370 ng/L marked the 2.5th, 10th,25th, 75th, 90th, and 97.5th percentiles, respectively.GDF15 concentrations were significantly higher in heartfailure patients than in healthy control individuals (P�0.001 vs SWISCH) and were closely related to New YorkHeart Association functional class (Fig. 5).
DiscussionWe have developed a new sandwich IRMA for themeasurement of human GDF15, assessed the preanalyticcharacteristics of GDF15, evaluated circulating GDF15concentrations with respect to demographic and biochem-ical variables in a carefully characterized cohort of appar-ently healthy elderly individuals, and demonstrated thatcirculating GDF15 concentrations are increased in CHFpatients. This GDF15 IRMA has a detection limit of 20ng/L and allows reliable analyte quantification over awide concentration range (�200–50 000 ng/L). No indi-vidual in the present study presented with a GDF15concentration outside this range. The assay has an ade-quate intraassay and interassay imprecision across therange of values measured in apparently healthy individ-
Tabl
e1.
Rel
atio
nshi
pbe
twee
nG
DF1
5qu
arti
les
and
clin
ical
and
bioc
hem
ical
char
acte
rist
ics.
a
Tota
l(n
�429)
GD
F15
quar
tile
s
Pb
1st
quar
tile
(18
4–6
02
ng/
L;n
�1
08
)2
ndqu
arti
le(6
03
–76
3ng
/L;
n�
10
7)
3rd
quar
tile
(76
4–9
59
ng/
L;n
�1
07
)4
thqu
arti
le(9
60
–22
41
ng/
L;n
�1
07
)
Age,
year
s6
5(5
9–7
1)
62
(56–6
9)
65
(59–7
0)
67
(61–7
1)
67
(62–7
2)
�0.0
01
Mal
ese
x,%
67
.169.4
70.1
63.6
65.4
0.6
94
BM
I,ckg
/m2
25
.3(2
3.1
–27
.3)
24.9
(22.9
–26.6
)25.4
(23.6
–27.7
)25.4
(22
.9–2
7.5
)25.6
(23.7
–27.4
)0.2
66
Cur
rent
smok
ing,
%1
4.5
9.3
15.0
17
.815.9
0.3
21
Sys
tolic
BP,
mm
Hg
14
0(1
30
–15
0)
140
(130–1
50)
140
(125–1
50)
140
(13
0–1
54)
140
(130–1
55)
0.1
75
Dia
stol
icB
P,m
mH
g8
0(7
5–8
5)
80
(75–8
5)
80
(80–8
4)
80
(76
–90)
80
(80–9
0)
0.4
20
Cys
tatin
C,
mg/
Ld0
.84
(0.7
6–0
.93
)0.7
8(0
.73–0
.88)
0.8
2(0
.75–0
.93)
0.8
5(0
.79–0
.93)
0.8
9(0
.81–1
.00)
�0.0
01
CR
P,m
g/Le
1.4
0(0
.79
–2.4
0)
1.2
0(0
.69–1
.83)
1.5
0(0
.84–2
.50)
1.5
0(0
.78–2
.63)
1.6
0(0
.89–2
.85)
0.0
16
NT-
proB
NP,
ng/L
f7
4(4
6–1
13
)65
(41–1
06)
79
(49–1
16)
76
(50
–105)
79
(46–1
18)
0.2
10
aD
ata
are
pres
ente
das
the
perc
enta
geor
the
med
ian
(25
th–7
5th
perc
entil
es).
b�
2te
stfo
rse
xan
dsm
okin
gva
riabl
es;
Kru
skal
–Wal
liste
stfo
ral
loth
erva
riabl
es.
cB
MI,
body
mas
sin
dex;
BP,
bloo
dpr
essu
re.
dD
ata
are
avai
labl
efo
r100,
95,
99,
and
96
indi
vidu
als
inth
e1
st,
2nd
,3
rd,
and
4th
quar
tiles
,re
spec
tivel
y.e
Dat
aar
eav
aila
ble
for
105,
106,
107,
and
105
indi
vidu
als
inth
e1
st,
2nd
,3
rd,
and
4th
quar
tiles
,re
spec
tivel
y.f
Dat
aar
eav
aila
ble
for
103,
102,
99,
and
88
indi
vidu
als
inth
e1
st,
2nd
,3
rd,
and
4th
quar
tiles
,re
spec
tivel
y.
288 GDF15 in Healthy Individuals and Heart Failure Patients
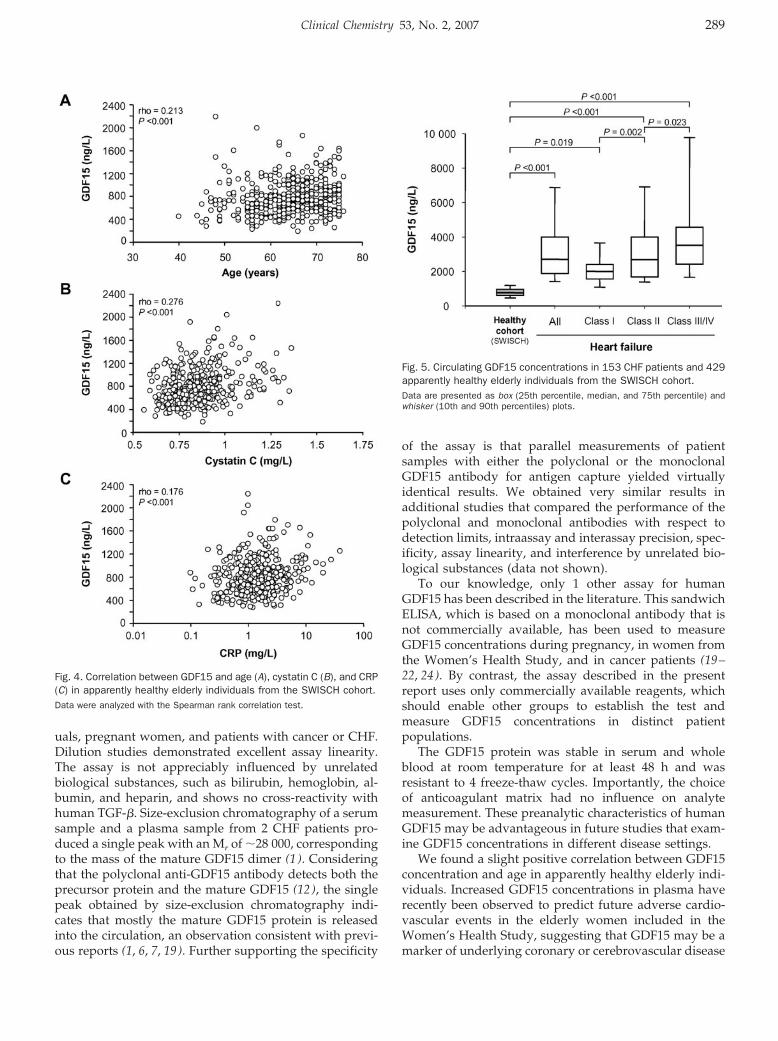
uals, pregnant women, and patients with cancer or CHF.Dilution studies demonstrated excellent assay linearity.The assay is not appreciably influenced by unrelatedbiological substances, such as bilirubin, hemoglobin, al-bumin, and heparin, and shows no cross-reactivity withhuman TGF-�. Size-exclusion chromatography of a serumsample and a plasma sample from 2 CHF patients pro-duced a single peak with an Mr of �28 000, correspondingto the mass of the mature GDF15 dimer (1 ). Consideringthat the polyclonal anti-GDF15 antibody detects both theprecursor protein and the mature GDF15 (12 ), the singlepeak obtained by size-exclusion chromatography indi-cates that mostly the mature GDF15 protein is releasedinto the circulation, an observation consistent with previ-ous reports (1, 6, 7, 19). Further supporting the specificity
of the assay is that parallel measurements of patientsamples with either the polyclonal or the monoclonalGDF15 antibody for antigen capture yielded virtuallyidentical results. We obtained very similar results inadditional studies that compared the performance of thepolyclonal and monoclonal antibodies with respect todetection limits, intraassay and interassay precision, spec-ificity, assay linearity, and interference by unrelated bio-logical substances (data not shown).
To our knowledge, only 1 other assay for humanGDF15 has been described in the literature. This sandwichELISA, which is based on a monoclonal antibody that isnot commercially available, has been used to measureGDF15 concentrations during pregnancy, in women fromthe Women’s Health Study, and in cancer patients (19–22, 24). By contrast, the assay described in the presentreport uses only commercially available reagents, whichshould enable other groups to establish the test andmeasure GDF15 concentrations in distinct patientpopulations.
The GDF15 protein was stable in serum and wholeblood at room temperature for at least 48 h and wasresistant to 4 freeze-thaw cycles. Importantly, the choiceof anticoagulant matrix had no influence on analytemeasurement. These preanalytic characteristics of humanGDF15 may be advantageous in future studies that exam-ine GDF15 concentrations in different disease settings.
We found a slight positive correlation between GDF15concentration and age in apparently healthy elderly indi-viduals. Increased GDF15 concentrations in plasma haverecently been observed to predict future adverse cardio-vascular events in the elderly women included in theWomen’s Health Study, suggesting that GDF15 may be amarker of underlying coronary or cerebrovascular disease
Fig. 4. Correlation between GDF15 and age (A), cystatin C (B), and CRP(C) in apparently healthy elderly individuals from the SWISCH cohort.Data were analyzed with the Spearman rank correlation test.
Fig. 5. Circulating GDF15 concentrations in 153 CHF patients and 429apparently healthy elderly individuals from the SWISCH cohort.Data are presented as box (25th percentile, median, and 75th percentile) andwhisker (10th and 90th percentiles) plots.
Clinical Chemistry 53, No. 2, 2007 289
(24 ). Individuals with manifest cardiovascular diseasewere excluded from the SWISCH cohort (26 ); however,because the prevalence of asymptomatic cardiovasculardisease increases with age (28 ), it is possible that some ofthe individuals with GDF15 concentrations in the upperend of the range may have had asymptomatic cardiovas-cular disease. Indeed, higher GDF15 concentrations ap-peared to identify a subgroup of apparently healthyelderly individuals who may have an increased cardio-vascular risk because of their increased age and highercystatin C and CRP concentrations. Future studies mightexplore the prognostic importance of GDF15 in suchindividuals. Similarly, occult tumors may have beenpresent in some of these individuals, because increasedcirculating concentrations of GDF15 have been reportedin patients with pancreatic and colorectal cancer (21–23).
Although nonpathologic creatinine values were re-quired for inclusion in the SWISCH study (26 ), thecystatin C assay, a more sensitive measure of glomerularfunction that is independent of age, sex, and skeletalmuscle mass (29 ), revealed that renal function wasslightly impaired in some individuals [defined as a cys-tatin C concentration �0.96 mg/L (30 )]. Individuals withcystatin C concentrations �0.96 mg/L had �23% higherGDF15 concentrations than those with nonpathologiccystatin C concentrations, suggesting that GDF15 iscleared from the circulation at least in part through thekidneys and/or that GDF15 synthesis increases in renaldisease. GDF15 concentrations were also associated withCRP, a marker of inflammatory activity (31 ). Consistentwith this observation are results of cell culture studiessuggesting that GDF15 may be involved in inflammatoryreactions by inhibiting macrophage activation (1 ). Be-cause individuals with manifest infections were excludedfrom the SWISCH study, the CRP concentrations in thiscohort of apparently healthy individuals may reflectasymptomatic inflammation, e.g., an association withatherosclerosis (31 ). Considering the possibility that indi-viduals from the SWISCH cohort with GDF15 concentra-tions at the upper end of the spectrum may have occult(cardiovascular) disease, we propose to use 1200 ng/L,the rounded 90th percentile in the SWISCH study, as theupper limit of the reference interval in elderly individuals.
CHF patients had appreciably increased circulatingGDF15 concentrations that were closely related to diseaseseverity as determined by the New York Heart Associa-tion class. Although the patients in this group wereslightly older and included more males than the group ofapparently healthy elderly control individuals, these dif-ferences cannot explain the 3.6-fold increase in circulatingGDF15 concentrations, considering that GDF15 concentra-tions were increased only slightly with age and were notrelated to sex in the control group. Increased cardiacGDF15 concentrations have been observed in mice withheart failure (13 ). Considering that GDF15 is not storedbut is rapidly secreted from most cell types, includingcardiomyocytes (6, 12), it is possible that increased GDF15
synthesis in the heart partly accounts for the increase incirculating GDF15 concentrations in patients with heartfailure. When GDF15 is being considered as a biomarkerin heart failure, it must be noted that GDF15 is not acardiac-specific factor. For example, concentrations ashigh as 10 000 ng/L have been observed in patients withpancreatic tumors (22 ). Future studies of larger patientpopulations could explore the value of GDF15 for prog-nosis and risk stratification in heart failure patients in thecontext of clinical variables and other biomarkers.
K.C.W. was supported by the German Research Founda-tion (WO 552/2-4), and L.W. was supported by theSwedish Heart-Lung Foundation.
References1. Bootcov MR, Bauskin AR, Valenzuela SM, Moore AG, Bansal M, He
XY, et al. MIC-1, a novel macrophage inhibitory cytokine, is adivergent member of the TGF-� superfamily. Proc Natl Acad SciU S A 1997;94:11514–9.
2. Hromas R, Hufford M, Sutton J, Xu D, Li Y, Lu L. PLAB, a novelplacental bone morphogenetic protein. Biochim Biophys Acta1997;1354:40–4.
3. Lawton LN, Bonaldo MF, Jelenc PC, Qiu L, Baumes SA, MarcelinoRA, et al. Identification of a novel member of the TGF-� superfamilyhighly expressed in human placenta. Gene 1997;203:17–26.
4. Yokoyama-Kobayashi M, Saeki M, Sekine S, Kato S. Human cDNAencoding a novel TGF-� superfamily protein highly expressed inplacenta. J Biochem 1997;122:622–6.
5. Paralkar VM, Vail AL, Grasser WA, Brown TA, Xu H, Vukicevic S,et al. Cloning and characterization of a novel member of thetransforming growth factor-�/bone morphogenetic protein family.J Biol Chem 1998;273:13760–7.
6. Bauskin AR, Zhang HP, Fairlie WD, He XY, Russell PK, Moore AG,et al. The propeptide of macrophage inhibitory cytokine (MIC-1), aTGF-� superfamily member, acts as a quality control determinantfor correctly folded MIC-1. EMBO J 2000;19:2212–20.
7. Fairlie WD, Moore AG, Bauskin AR, Russell PK, Zhang HP, BreitSN. MIC-1 is a novel TGF-� superfamily cytokine associated withmacrophage activation. J Leukoc Biol 1999;65:2–5.
8. Bauskin AR, Brown DA, Junankar S, Rasiah KK, Eggleton S, HunterM, et al. The propeptide mediates formation of stromal stores ofPROMIC-1: role in determining prostate cancer outcome. CancerRes 2005;65:2330–6.
9. Bottner M, Suter-Crazzolara C, Schober A, Unsicker K. Expressionof a novel member of the TGF-� superfamily, growth/differentia-tion factor-15/macrophage-inhibiting cytokine-1 (GDF-15/MIC-1)in adult rat tissues. Cell Tissue Res 1999;297:103–10.
10. Hsiao EC, Koniaris LG, Zimmers-Koniaris T, Sebald SM, Huynh TV,Lee SJ. Characterization of growth-differentiation factor 15, atransforming growth factor � superfamily member induced follow-ing liver injury. Mol Cell Biol 2000;20:3742–51.
11. Schober A, Bottner M, Strelau J, Kinscherf R, Bonaterra GA, BarthM, et al. Expression of growth differentiation factor-15/macro-phage inhibitory cytokine-1 (GDF-15/MIC-1) in the perinatal, adult,and injured rat brain. J Comp Neurol 2001;439:32–45.
12. Kempf T, Eden M, Strelau J, Naguib M, Willenbockel C, Tongers J,et al. The transforming growth factor-� superfamily membergrowth-differentiation factor-15 protects the heart from ischemia/reperfusion injury. Circ Res 2006;98:351–60.
290 GDF15 in Healthy Individuals and Heart Failure Patients
13. Xu J, Kimball TR, Lorenz JN, Brown DA, Bauskin AR, Klevitsky R, etal. GDF15/MIC-1 functions as a protective and antihypertrophicfactor released from the myocardium in association with SMADprotein activation. Circ Res 2006;98:342–50.
14. Strelau J, Sullivan A, Bottner M, Lingor P, Falkenstein E, Suter-Crazzolara C, et al. Growth/differentiation factor-15/macrophageinhibitory cytokine-1 is a novel trophic factor for midbrain dopami-nergic neurons in vivo. J Neurosci 2000;20:8597–603.
15. Tan M, Wang Y, Guan K, Sun Y. PTGF-�, a type � transforminggrowth factor (TGF-�) superfamily member, is a p53 target genethat inhibits tumor cell growth via TGF-� signaling pathway. ProcNatl Acad Sci U S A 2000;97:109–14.
16. Graichen R, Liu D, Sun Y, Lee KO, Lobie PE. Autocrine humangrowth hormone inhibits placental transforming growth factor-�gene transcription to prevent apoptosis and allow cell cycleprogression of human mammary carcinoma cells. J Biol Chem2002;277:26662–72.
17. Subramaniam S, Strelau J, Unsicker K. Growth differentiationfactor-15 prevents low potassium-induced cell death of cerebellargranule neurons by differential regulation of Akt and ERK path-ways. J Biol Chem 2003;278:8904–12.
18. Liu T, Bauskin AR, Zaunders J, Brown DA, Pankurst S, Russell PJ,et al. Macrophage inhibitory cytokine 1 reduces cell adhesion andinduces apoptosis in prostate cancer cells. Cancer Res 2003;63:5034–40.
19. Moore AG, Brown DA, Fairlie WD, Bauskin AR, Brown PK, MunierML, et al. The transforming growth factor-� superfamily cytokinemacrophage inhibitory cytokine-1 is present in high concentrationsin the serum of pregnant women. J Clin Endocrinol Metab 2000;85:4781–8.
20. Tong S, Marjono B, Brown DA, Mulvey S, Breit SN, Manuelpillai U,et al. Serum concentrations of macrophage inhibitory cytokine 1(MIC 1) as a predictor of miscarriage. Lancet 2004;363:129–30.
21. Brown DA, Ward RL, Buckhaults P, Liu T, Romans KE, Hawkins NJ,et al. MIC-1 serum level and genotype: associations with progress
and prognosis of colorectal carcinoma. Clin Cancer Res 2003;9:2642–50.
22. Koopmann J, Buckhaults P, Brown DA, Zahurak ML, Sato N,Fukushima N, et al. Serum macrophage inhibitory cytokine 1 as amarker of pancreatic and other periampullary cancers. Clin CancerRes 2004;10:2386–92.
23. Bauskin AR, Brown DA, Kuffner T, Johnen H, Luo XW, Hunter M,et al. Role of macrophage inhibitory cytokine-1 in tumorigenesisand diagnosis of cancer. Cancer Res 2006;66:4983–6.
24. Brown DA, Breit SN, Buring J, Fairlie WD, Bauskin AR, Liu T, et al.Concentration in plasma of macrophage inhibitory cytokine-1 andrisk of cardiovascular events in women: a nested case-controlstudy. Lancet 2002;359:2159–63.
25. Horn R, Geldszus R, Potter E, von zur Muhlen A, Brabant G.Radioimmunoassay for the detection of leptin in human serum.Exp Clin Endocrinol Diabetes 1996;104:454–8.
26. Johnston N, Jernberg T, Lindahl B, Lindback J, Stridsberg M,Larsson A, et al. Biochemical indicators of cardiac and renalfunction in a healthy elderly population. Clin Biochem 2004;37:210–6.
27. Swedberg K, Cleland J, Dargie H, Drexler H, Follath F, Komajda M,et al. Guidelines for the diagnosis and treatment of chronic heartfailure: executive summary (update 2005): the Task Force for theDiagnosis and Treatment of Chronic Heart Failure of the EuropeanSociety of Cardiology. Eur Heart J 2005;26:1115–40.
28. Lloyd-Jones DM, Larson MG, Beiser A, Levy D. Lifetime risk ofdeveloping coronary heart disease. Lancet 1999;353:89–92.
29. Laterza OF, Price CP, Scott MG. Cystatin C: an improved estimatorof glomerular filtration rate. Clin Chem 2002;48:699–707.
30. Finney H, Newman DJ, Gruber W, Merle P, Price CP. Initialevaluation of cystatin C measurement by particle-enhanced immu-nonephelometry on the Behring nephelometer systems (BNA, BNII). Clin Chem 1997;43:1016–22.
31. Ridker PM, Hennekens CH, Buring JE, Rifai N. C-reactive proteinand other markers of inflammation in the prediction of cardiovas-cular disease in women. N Engl J Med 2000;342:836–43.
Clinical Chemistry 53, No. 2, 2007 291
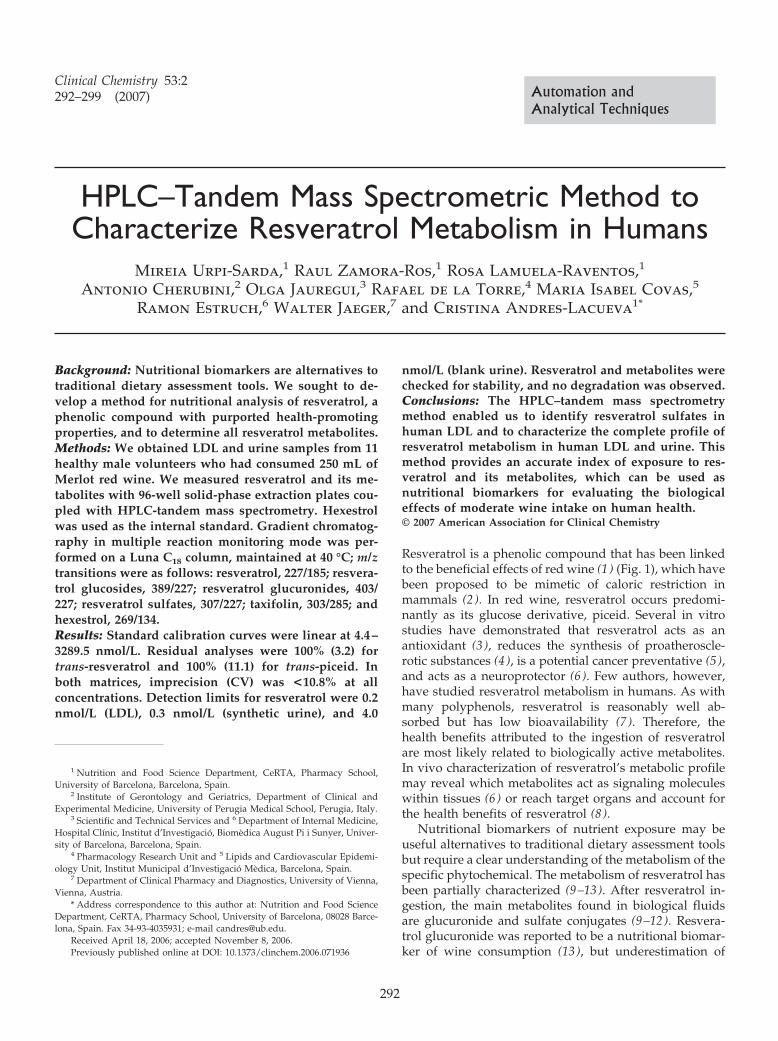
HPLC–Tandem Mass Spectrometric Method toCharacterize Resveratrol Metabolism in Humans
Mireia Urpi-Sarda,1 Raul Zamora-Ros,1 Rosa Lamuela-Raventos,1
Antonio Cherubini,2 Olga Jauregui,3 Rafael de la Torre,4 Maria Isabel Covas,5
Ramon Estruch,6 Walter Jaeger,7 and Cristina Andres-Lacueva1*
Background: Nutritional biomarkers are alternatives totraditional dietary assessment tools. We sought to de-velop a method for nutritional analysis of resveratrol, aphenolic compound with purported health-promotingproperties, and to determine all resveratrol metabolites.Methods: We obtained LDL and urine samples from 11healthy male volunteers who had consumed 250 mL ofMerlot red wine. We measured resveratrol and its me-tabolites with 96-well solid-phase extraction plates cou-pled with HPLC-tandem mass spectrometry. Hexestrolwas used as the internal standard. Gradient chromatog-raphy in multiple reaction monitoring mode was per-formed on a Luna C18 column, maintained at 40 °C; m/ztransitions were as follows: resveratrol, 227/185; resvera-trol glucosides, 389/227; resveratrol glucuronides, 403/227; resveratrol sulfates, 307/227; taxifolin, 303/285; andhexestrol, 269/134.Results: Standard calibration curves were linear at 4.4–3289.5 nmol/L. Residual analyses were 100% (3.2) fortrans-resveratrol and 100% (11.1) for trans-piceid. Inboth matrices, imprecision (CV) was <10.8% at allconcentrations. Detection limits for resveratrol were 0.2nmol/L (LDL), 0.3 nmol/L (synthetic urine), and 4.0
nmol/L (blank urine). Resveratrol and metabolites werechecked for stability, and no degradation was observed.Conclusions: The HPLC–tandem mass spectrometrymethod enabled us to identify resveratrol sulfates inhuman LDL and to characterize the complete profile ofresveratrol metabolism in human LDL and urine. Thismethod provides an accurate index of exposure to res-veratrol and its metabolites, which can be used asnutritional biomarkers for evaluating the biologicaleffects of moderate wine intake on human health.© 2007 American Association for Clinical Chemistry
Resveratrol is a phenolic compound that has been linkedto the beneficial effects of red wine (1 ) (Fig. 1), which havebeen proposed to be mimetic of caloric restriction inmammals (2 ). In red wine, resveratrol occurs predomi-nantly as its glucose derivative, piceid. Several in vitrostudies have demonstrated that resveratrol acts as anantioxidant (3 ), reduces the synthesis of proatheroscle-rotic substances (4 ), is a potential cancer preventative (5 ),and acts as a neuroprotector (6 ). Few authors, however,have studied resveratrol metabolism in humans. As withmany polyphenols, resveratrol is reasonably well ab-sorbed but has low bioavailability (7 ). Therefore, thehealth benefits attributed to the ingestion of resveratrolare most likely related to biologically active metabolites.In vivo characterization of resveratrol’s metabolic profilemay reveal which metabolites act as signaling moleculeswithin tissues (6 ) or reach target organs and account forthe health benefits of resveratrol (8 ).
Nutritional biomarkers of nutrient exposure may beuseful alternatives to traditional dietary assessment toolsbut require a clear understanding of the metabolism of thespecific phytochemical. The metabolism of resveratrol hasbeen partially characterized (9–13). After resveratrol in-gestion, the main metabolites found in biological fluidsare glucuronide and sulfate conjugates (9–12). Resvera-trol glucuronide was reported to be a nutritional biomar-ker of wine consumption (13 ), but underestimation of
1 Nutrition and Food Science Department, CeRTA, Pharmacy School,University of Barcelona, Barcelona, Spain.
2 Institute of Gerontology and Geriatrics, Department of Clinical andExperimental Medicine, University of Perugia Medical School, Perugia, Italy.
3 Scientific and Technical Services and 6 Department of Internal Medicine,Hospital Clınic, Institut d’Investigacio, Biomedica August Pi i Sunyer, Univer-sity of Barcelona, Barcelona, Spain.
4 Pharmacology Research Unit and 5 Lipids and Cardiovascular Epidemi-ology Unit, Institut Municipal d’Investigacio Medica, Barcelona, Spain.
7 Department of Clinical Pharmacy and Diagnostics, University of Vienna,Vienna, Austria.
* Address correspondence to this author at: Nutrition and Food ScienceDepartment, CeRTA, Pharmacy School, University of Barcelona, 08028 Barce-lona, Spain. Fax 34-93-4035931; e-mail [email protected].
Received April 18, 2006; accepted November 8, 2006.Previously published online at DOI: 10.1373/clinchem.2006.071936
Clinical Chemistry 53:2292–299 (2007) Automation and
Analytical Techniques
292
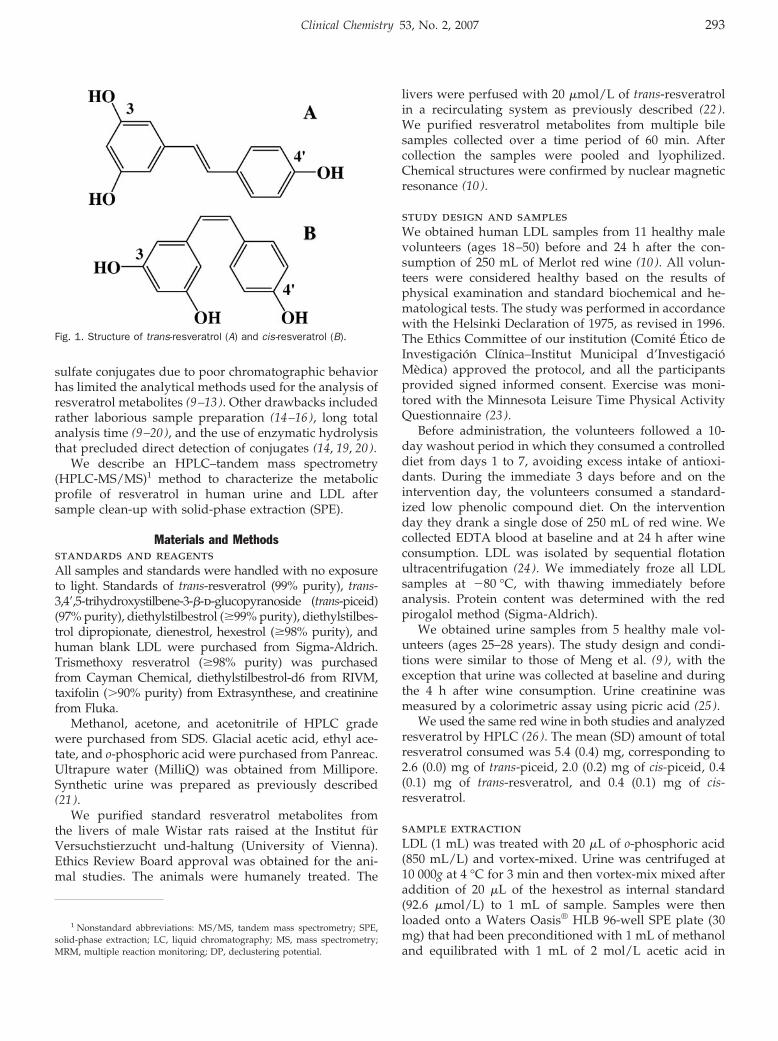
sulfate conjugates due to poor chromatographic behaviorhas limited the analytical methods used for the analysis ofresveratrol metabolites (9–13). Other drawbacks includedrather laborious sample preparation (14–16), long totalanalysis time (9–20), and the use of enzymatic hydrolysisthat precluded direct detection of conjugates (14, 19, 20).
We describe an HPLC–tandem mass spectrometry(HPLC-MS/MS)1 method to characterize the metabolicprofile of resveratrol in human urine and LDL aftersample clean-up with solid-phase extraction (SPE).
Materials and Methodsstandards and reagentsAll samples and standards were handled with no exposureto light. Standards of trans-resveratrol (99% purity), trans-3,4�,5-trihydroxystilbene-3-�-d-glucopyranoside (trans-piceid)(97% purity), diethylstilbestrol (�99% purity), diethylstilbes-trol dipropionate, dienestrol, hexestrol (�98% purity), andhuman blank LDL were purchased from Sigma-Aldrich.Trismethoxy resveratrol (�98% purity) was purchasedfrom Cayman Chemical, diethylstilbestrol-d6 from RIVM,taxifolin (�90% purity) from Extrasynthese, and creatininefrom Fluka.
Methanol, acetone, and acetonitrile of HPLC gradewere purchased from SDS. Glacial acetic acid, ethyl ace-tate, and o-phosphoric acid were purchased from Panreac.Ultrapure water (MilliQ) was obtained from Millipore.Synthetic urine was prepared as previously described(21 ).
We purified standard resveratrol metabolites fromthe livers of male Wistar rats raised at the Institut furVersuchstierzucht und-haltung (University of Vienna).Ethics Review Board approval was obtained for the ani-mal studies. The animals were humanely treated. The
livers were perfused with 20 �mol/L of trans-resveratrolin a recirculating system as previously described (22 ).We purified resveratrol metabolites from multiple bilesamples collected over a time period of 60 min. Aftercollection the samples were pooled and lyophilized.Chemical structures were confirmed by nuclear magneticresonance (10 ).
study design and samplesWe obtained human LDL samples from 11 healthy malevolunteers (ages 18–50) before and 24 h after the con-sumption of 250 mL of Merlot red wine (10 ). All volun-teers were considered healthy based on the results ofphysical examination and standard biochemical and he-matological tests. The study was performed in accordancewith the Helsinki Declaration of 1975, as revised in 1996.The Ethics Committee of our institution (Comite Etico deInvestigacion Clınica–Institut Municipal d’InvestigacioMedica) approved the protocol, and all the participantsprovided signed informed consent. Exercise was moni-tored with the Minnesota Leisure Time Physical ActivityQuestionnaire (23 ).
Before administration, the volunteers followed a 10-day washout period in which they consumed a controlleddiet from days 1 to 7, avoiding excess intake of antioxi-dants. During the immediate 3 days before and on theintervention day, the volunteers consumed a standard-ized low phenolic compound diet. On the interventionday they drank a single dose of 250 mL of red wine. Wecollected EDTA blood at baseline and at 24 h after wineconsumption. LDL was isolated by sequential flotationultracentrifugation (24 ). We immediately froze all LDLsamples at �80 °C, with thawing immediately beforeanalysis. Protein content was determined with the redpirogalol method (Sigma-Aldrich).
We obtained urine samples from 5 healthy male vol-unteers (ages 25–28 years). The study design and condi-tions were similar to those of Meng et al. (9 ), with theexception that urine was collected at baseline and duringthe 4 h after wine consumption. Urine creatinine wasmeasured by a colorimetric assay using picric acid (25 ).
We used the same red wine in both studies and analyzedresveratrol by HPLC (26 ). The mean (SD) amount of totalresveratrol consumed was 5.4 (0.4) mg, corresponding to2.6 (0.0) mg of trans-piceid, 2.0 (0.2) mg of cis-piceid, 0.4(0.1) mg of trans-resveratrol, and 0.4 (0.1) mg of cis-resveratrol.
sample extractionLDL (1 mL) was treated with 20 �L of o-phosphoric acid(850 mL/L) and vortex-mixed. Urine was centrifuged at10 000g at 4 °C for 3 min and then vortex-mix mixed afteraddition of 20 �L of the hexestrol as internal standard(92.6 �mol/L) to 1 mL of sample. Samples were thenloaded onto a Waters Oasis® HLB 96-well SPE plate (30mg) that had been preconditioned with 1 mL of methanoland equilibrated with 1 mL of 2 mol/L acetic acid in
1 Nonstandard abbreviations: MS/MS, tandem mass spectrometry; SPE,solid-phase extraction; LC, liquid chromatography; MS, mass spectrometry;MRM, multiple reaction monitoring; DP, declustering potential.
Fig. 1. Structure of trans-resveratrol (A) and cis-resveratrol (B).
Clinical Chemistry 53, No. 2, 2007 293
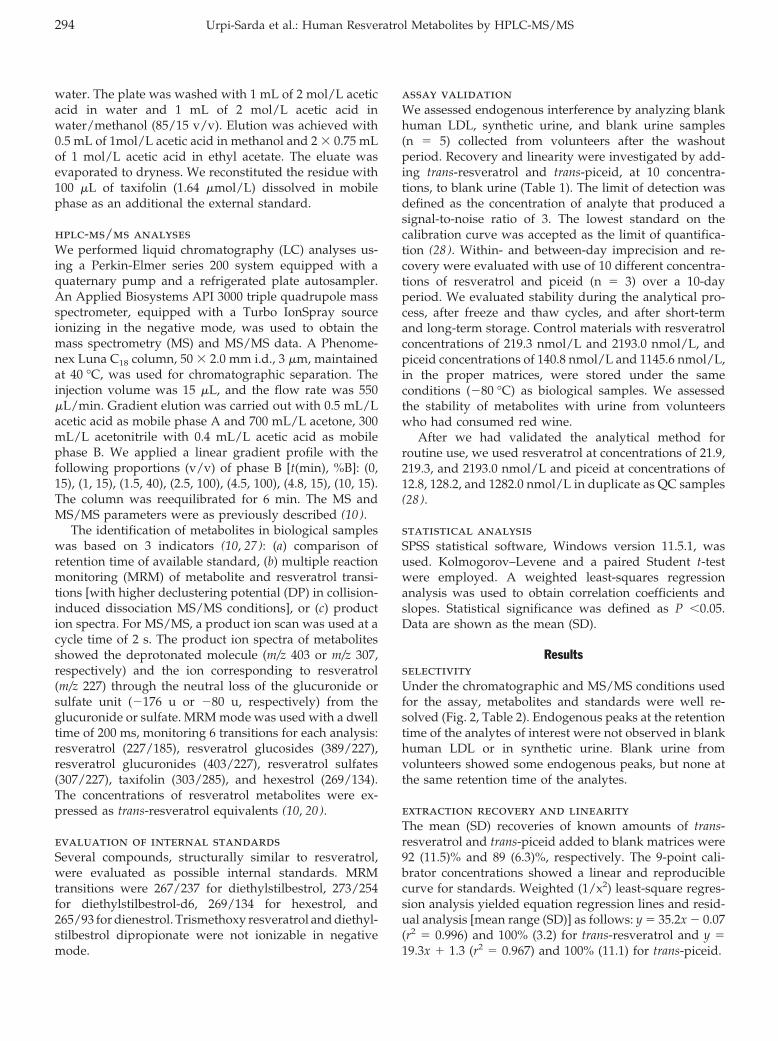
water. The plate was washed with 1 mL of 2 mol/L aceticacid in water and 1 mL of 2 mol/L acetic acid inwater/methanol (85/15 v/v). Elution was achieved with0.5 mL of 1mol/L acetic acid in methanol and 2 � 0.75 mLof 1 mol/L acetic acid in ethyl acetate. The eluate wasevaporated to dryness. We reconstituted the residue with100 �L of taxifolin (1.64 �mol/L) dissolved in mobilephase as an additional the external standard.
hplc-ms/ms analysesWe performed liquid chromatography (LC) analyses us-ing a Perkin-Elmer series 200 system equipped with aquaternary pump and a refrigerated plate autosampler.An Applied Biosystems API 3000 triple quadrupole massspectrometer, equipped with a Turbo IonSpray sourceionizing in the negative mode, was used to obtain themass spectrometry (MS) and MS/MS data. A Phenome-nex Luna C18 column, 50 � 2.0 mm i.d., 3 �m, maintainedat 40 °C, was used for chromatographic separation. Theinjection volume was 15 �L, and the flow rate was 550�L/min. Gradient elution was carried out with 0.5 mL/Lacetic acid as mobile phase A and 700 mL/L acetone, 300mL/L acetonitrile with 0.4 mL/L acetic acid as mobilephase B. We applied a linear gradient profile with thefollowing proportions (v/v) of phase B [t(min), %B]: (0,15), (1, 15), (1.5, 40), (2.5, 100), (4.5, 100), (4.8, 15), (10, 15).The column was reequilibrated for 6 min. The MS andMS/MS parameters were as previously described (10 ).
The identification of metabolites in biological sampleswas based on 3 indicators (10, 27): (a) comparison ofretention time of available standard, (b) multiple reactionmonitoring (MRM) of metabolite and resveratrol transi-tions [with higher declustering potential (DP) in collision-induced dissociation MS/MS conditions], or (c) production spectra. For MS/MS, a product ion scan was used at acycle time of 2 s. The product ion spectra of metabolitesshowed the deprotonated molecule (m/z 403 or m/z 307,respectively) and the ion corresponding to resveratrol(m/z 227) through the neutral loss of the glucuronide orsulfate unit (�176 u or �80 u, respectively) from theglucuronide or sulfate. MRM mode was used with a dwelltime of 200 ms, monitoring 6 transitions for each analysis:resveratrol (227/185), resveratrol glucosides (389/227),resveratrol glucuronides (403/227), resveratrol sulfates(307/227), taxifolin (303/285), and hexestrol (269/134).The concentrations of resveratrol metabolites were ex-pressed as trans-resveratrol equivalents (10, 20).
evaluation of internal standardsSeveral compounds, structurally similar to resveratrol,were evaluated as possible internal standards. MRMtransitions were 267/237 for diethylstilbestrol, 273/254for diethylstilbestrol-d6, 269/134 for hexestrol, and265/93 for dienestrol. Trismethoxy resveratrol and diethyl-stilbestrol dipropionate were not ionizable in negativemode.
assay validationWe assessed endogenous interference by analyzing blankhuman LDL, synthetic urine, and blank urine samples(n � 5) collected from volunteers after the washoutperiod. Recovery and linearity were investigated by add-ing trans-resveratrol and trans-piceid, at 10 concentra-tions, to blank urine (Table 1). The limit of detection wasdefined as the concentration of analyte that produced asignal-to-noise ratio of 3. The lowest standard on thecalibration curve was accepted as the limit of quantifica-tion (28 ). Within- and between-day imprecision and re-covery were evaluated with use of 10 different concentra-tions of resveratrol and piceid (n � 3) over a 10-dayperiod. We evaluated stability during the analytical pro-cess, after freeze and thaw cycles, and after short-termand long-term storage. Control materials with resveratrolconcentrations of 219.3 nmol/L and 2193.0 nmol/L, andpiceid concentrations of 140.8 nmol/L and 1145.6 nmol/L,in the proper matrices, were stored under the sameconditions (�80 °C) as biological samples. We assessedthe stability of metabolites with urine from volunteerswho had consumed red wine.
After we had validated the analytical method forroutine use, we used resveratrol at concentrations of 21.9,219.3, and 2193.0 nmol/L and piceid at concentrations of12.8, 128.2, and 1282.0 nmol/L in duplicate as QC samples(28 ).
statistical analysisSPSS statistical software, Windows version 11.5.1, wasused. Kolmogorov–Levene and a paired Student t-testwere employed. A weighted least-squares regressionanalysis was used to obtain correlation coefficients andslopes. Statistical significance was defined as P �0.05.Data are shown as the mean (SD).
ResultsselectivityUnder the chromatographic and MS/MS conditions usedfor the assay, metabolites and standards were well re-solved (Fig. 2, Table 2). Endogenous peaks at the retentiontime of the analytes of interest were not observed in blankhuman LDL or in synthetic urine. Blank urine fromvolunteers showed some endogenous peaks, but none atthe same retention time of the analytes.
extraction recovery and linearityThe mean (SD) recoveries of known amounts of trans-resveratrol and trans-piceid added to blank matrices were92 (11.5)% and 89 (6.3)%, respectively. The 9-point cali-brator concentrations showed a linear and reproduciblecurve for standards. Weighted (1/x2) least-square regres-sion analysis yielded equation regression lines and resid-ual analysis [mean range (SD)] as follows: y � 35.2x � 0.07(r2 � 0.996) and 100% (3.2) for trans-resveratrol and y �19.3x � 1.3 (r2 � 0.967) and 100% (11.1) for trans-piceid.
294 Urpi-Sarda et al.: Human Resveratrol Metabolites by HPLC-MS/MS
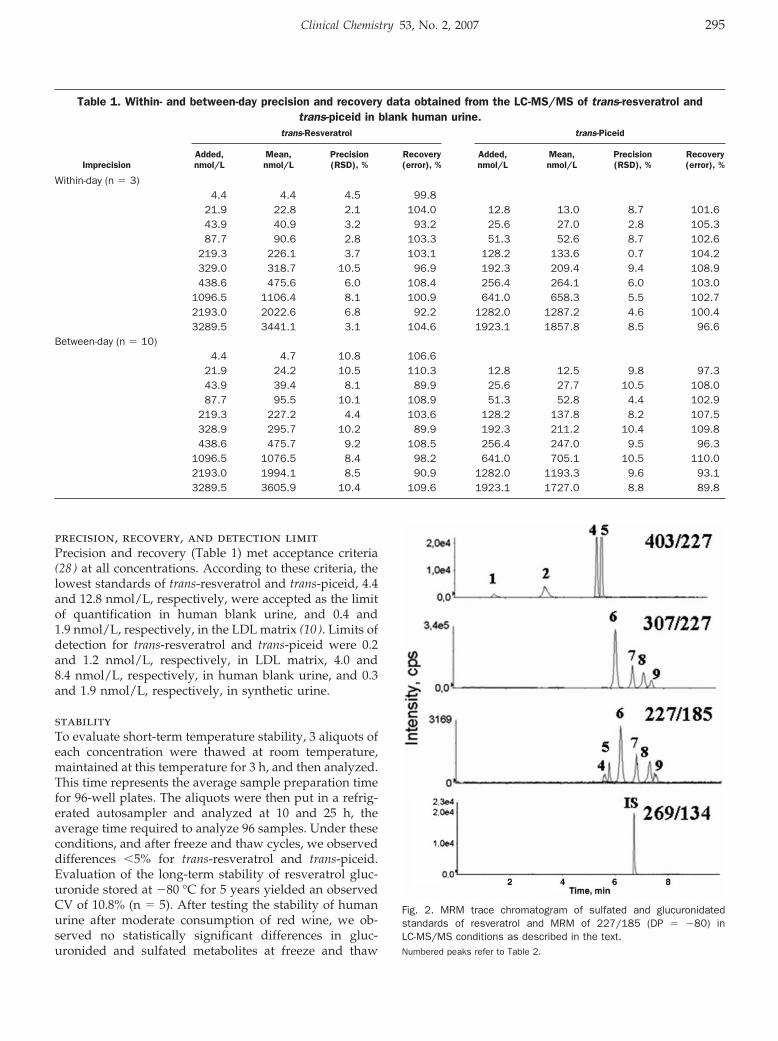
precision, recovery, and detection limitPrecision and recovery (Table 1) met acceptance criteria(28 ) at all concentrations. According to these criteria, thelowest standards of trans-resveratrol and trans-piceid, 4.4and 12.8 nmol/L, respectively, were accepted as the limitof quantification in human blank urine, and 0.4 and1.9 nmol/L, respectively, in the LDL matrix (10 ). Limits ofdetection for trans-resveratrol and trans-piceid were 0.2and 1.2 nmol/L, respectively, in LDL matrix, 4.0 and8.4 nmol/L, respectively, in human blank urine, and 0.3and 1.9 nmol/L, respectively, in synthetic urine.
stabilityTo evaluate short-term temperature stability, 3 aliquots ofeach concentration were thawed at room temperature,maintained at this temperature for 3 h, and then analyzed.This time represents the average sample preparation timefor 96-well plates. The aliquots were then put in a refrig-erated autosampler and analyzed at 10 and 25 h, theaverage time required to analyze 96 samples. Under theseconditions, and after freeze and thaw cycles, we observeddifferences �5% for trans-resveratrol and trans-piceid.Evaluation of the long-term stability of resveratrol gluc-uronide stored at �80 °C for 5 years yielded an observedCV of 10.8% (n � 5). After testing the stability of humanurine after moderate consumption of red wine, we ob-served no statistically significant differences in gluc-uronided and sulfated metabolites at freeze and thaw
Fig. 2. MRM trace chromatogram of sulfated and glucuronidatedstandards of resveratrol and MRM of 227/185 (DP � �80) inLC-MS/MS conditions as described in the text.Numbered peaks refer to Table 2.
Table 1. Within- and between-day precision and recovery data obtained from the LC-MS/MS of trans-resveratrol andtrans-piceid in blank human urine.
trans-Resveratrol trans-Piceid
ImprecisionAdded,nmol/L
Mean,nmol/L
Precision(RSD), %
Recovery(error), %
Added,nmol/L
Mean,nmol/L
Precision(RSD), %
Recovery(error), %
Within-day (n � 3)4.4 4.4 4.5 99.8
21.9 22.8 2.1 104.0 12.8 13.0 8.7 101.643.9 40.9 3.2 93.2 25.6 27.0 2.8 105.387.7 90.6 2.8 103.3 51.3 52.6 8.7 102.6
219.3 226.1 3.7 103.1 128.2 133.6 0.7 104.2329.0 318.7 10.5 96.9 192.3 209.4 9.4 108.9438.6 475.6 6.0 108.4 256.4 264.1 6.0 103.0
1096.5 1106.4 8.1 100.9 641.0 658.3 5.5 102.72193.0 2022.6 6.8 92.2 1282.0 1287.2 4.6 100.43289.5 3441.1 3.1 104.6 1923.1 1857.8 8.5 96.6
Between-day (n � 10)4.4 4.7 10.8 106.6
21.9 24.2 10.5 110.3 12.8 12.5 9.8 97.343.9 39.4 8.1 89.9 25.6 27.7 10.5 108.087.7 95.5 10.1 108.9 51.3 52.8 4.4 102.9
219.3 227.2 4.4 103.6 128.2 137.8 8.2 107.5328.9 295.7 10.2 89.9 192.3 211.2 10.4 109.8438.6 475.7 9.2 108.5 256.4 247.0 9.5 96.3
1096.5 1076.5 8.4 98.2 641.0 705.1 10.5 110.02193.0 1994.1 8.5 90.9 1282.0 1193.3 9.6 93.13289.5 3605.9 10.4 109.6 1923.1 1727.0 8.8 89.8
Clinical Chemistry 53, No. 2, 2007 295
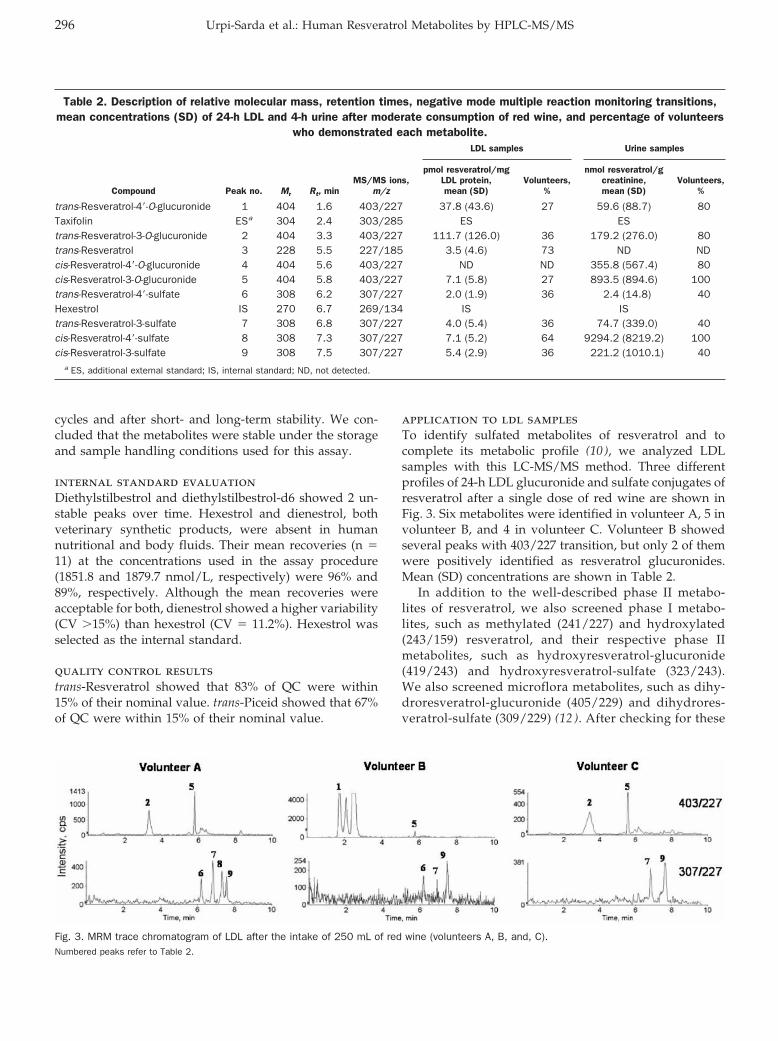
cycles and after short- and long-term stability. We con-cluded that the metabolites were stable under the storageand sample handling conditions used for this assay.
internal standard evaluationDiethylstilbestrol and diethylstilbestrol-d6 showed 2 un-stable peaks over time. Hexestrol and dienestrol, bothveterinary synthetic products, were absent in humannutritional and body fluids. Their mean recoveries (n �11) at the concentrations used in the assay procedure(1851.8 and 1879.7 nmol/L, respectively) were 96% and89%, respectively. Although the mean recoveries wereacceptable for both, dienestrol showed a higher variability(CV �15%) than hexestrol (CV � 11.2%). Hexestrol wasselected as the internal standard.
quality control resultstrans-Resveratrol showed that 83% of QC were within15% of their nominal value. trans-Piceid showed that 67%of QC were within 15% of their nominal value.
application to ldl samplesTo identify sulfated metabolites of resveratrol and tocomplete its metabolic profile (10 ), we analyzed LDLsamples with this LC-MS/MS method. Three differentprofiles of 24-h LDL glucuronide and sulfate conjugates ofresveratrol after a single dose of red wine are shown inFig. 3. Six metabolites were identified in volunteer A, 5 involunteer B, and 4 in volunteer C. Volunteer B showedseveral peaks with 403/227 transition, but only 2 of themwere positively identified as resveratrol glucuronides.Mean (SD) concentrations are shown in Table 2.
In addition to the well-described phase II metabo-lites of resveratrol, we also screened phase I metabo-lites, such as methylated (241/227) and hydroxylated(243/159) resveratrol, and their respective phase IImetabolites, such as hydroxyresveratrol-glucuronide(419/243) and hydroxyresveratrol-sulfate (323/243).We also screened microflora metabolites, such as dihy-droresveratrol-glucuronide (405/229) and dihydrores-veratrol-sulfate (309/229) (12 ). After checking for these
Fig. 3. MRM trace chromatogram of LDL after the intake of 250 mL of red wine (volunteers A, B, and, C).Numbered peaks refer to Table 2.
Table 2. Description of relative molecular mass, retention times, negative mode multiple reaction monitoring transitions,mean concentrations (SD) of 24-h LDL and 4-h urine after moderate consumption of red wine, and percentage of volunteers
who demonstrated each metabolite.
Compound Peak no. Mr Rt, minMS/MS ions,
m/z
LDL samples Urine samples
pmol resveratrol/mgLDL protein,mean (SD)
Volunteers,%
nmol resveratrol/gcreatinine,mean (SD)
Volunteers,%
trans-Resveratrol-4�-O-glucuronide 1 404 1.6 403/227 37.8 (43.6) 27 59.6 (88.7) 80Taxifolin ESa 304 2.4 303/285 ES EStrans-Resveratrol-3-O-glucuronide 2 404 3.3 403/227 111.7 (126.0) 36 179.2 (276.0) 80trans-Resveratrol 3 228 5.5 227/185 3.5 (4.6) 73 ND NDcis-Resveratrol-4�-O-glucuronide 4 404 5.6 403/227 ND ND 355.8 (567.4) 80cis-Resveratrol-3-O-glucuronide 5 404 5.8 403/227 7.1 (5.8) 27 893.5 (894.6) 100trans-Resveratrol-4�-sulfate 6 308 6.2 307/227 2.0 (1.9) 36 2.4 (14.8) 40Hexestrol IS 270 6.7 269/134 IS IStrans-Resveratrol-3-sulfate 7 308 6.8 307/227 4.0 (5.4) 36 74.7 (339.0) 40cis-Resveratrol-4�-sulfate 8 308 7.3 307/227 7.1 (5.2) 64 9294.2 (8219.2) 100cis-Resveratrol-3-sulfate 9 308 7.5 307/227 5.4 (2.9) 36 221.2 (1010.1) 40
a ES, additional external standard; IS, internal standard; ND, not detected.
296 Urpi-Sarda et al.: Human Resveratrol Metabolites by HPLC-MS/MS
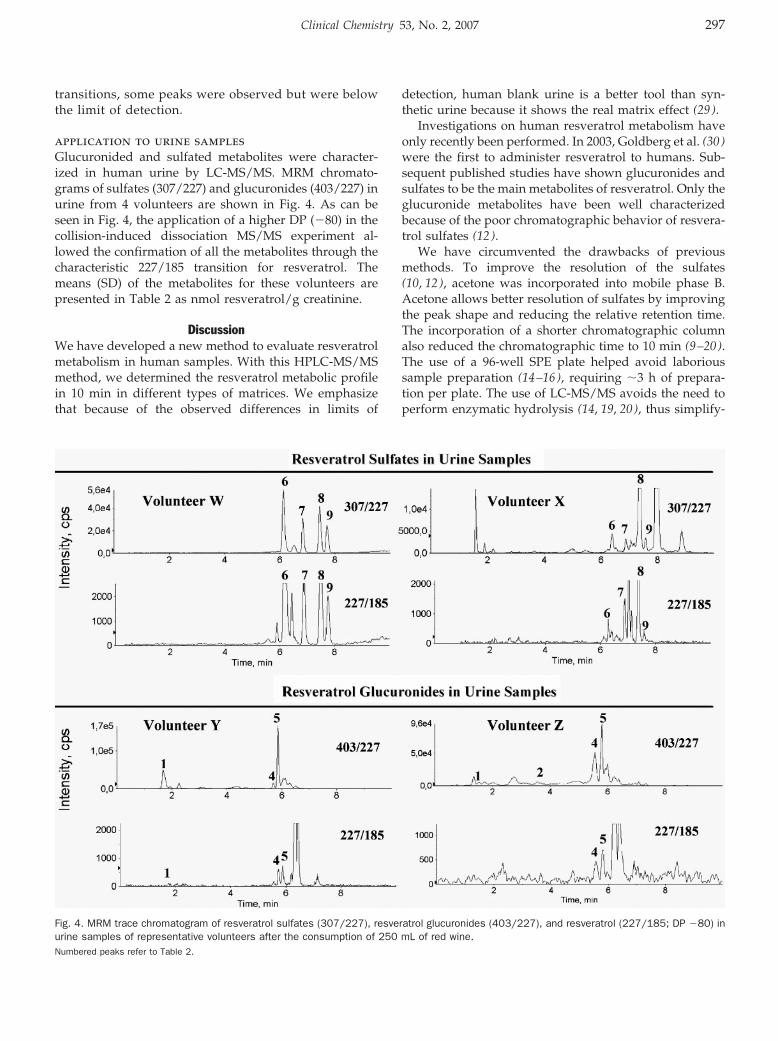
transitions, some peaks were observed but were belowthe limit of detection.
application to urine samplesGlucuronided and sulfated metabolites were character-ized in human urine by LC-MS/MS. MRM chromato-grams of sulfates (307/227) and glucuronides (403/227) inurine from 4 volunteers are shown in Fig. 4. As can beseen in Fig. 4, the application of a higher DP (�80) in thecollision-induced dissociation MS/MS experiment al-lowed the confirmation of all the metabolites through thecharacteristic 227/185 transition for resveratrol. Themeans (SD) of the metabolites for these volunteers arepresented in Table 2 as nmol resveratrol/g creatinine.
DiscussionWe have developed a new method to evaluate resveratrolmetabolism in human samples. With this HPLC-MS/MSmethod, we determined the resveratrol metabolic profilein 10 min in different types of matrices. We emphasizethat because of the observed differences in limits of
detection, human blank urine is a better tool than syn-thetic urine because it shows the real matrix effect (29 ).
Investigations on human resveratrol metabolism haveonly recently been performed. In 2003, Goldberg et al. (30 )were the first to administer resveratrol to humans. Sub-sequent published studies have shown glucuronides andsulfates to be the main metabolites of resveratrol. Only theglucuronide metabolites have been well characterizedbecause of the poor chromatographic behavior of resvera-trol sulfates (12 ).
We have circumvented the drawbacks of previousmethods. To improve the resolution of the sulfates(10, 12), acetone was incorporated into mobile phase B.Acetone allows better resolution of sulfates by improvingthe peak shape and reducing the relative retention time.The incorporation of a shorter chromatographic columnalso reduced the chromatographic time to 10 min (9–20).The use of a 96-well SPE plate helped avoid laborioussample preparation (14–16), requiring �3 h of prepara-tion per plate. The use of LC-MS/MS avoids the need toperform enzymatic hydrolysis (14, 19, 20), thus simplify-
Fig. 4. MRM trace chromatogram of resveratrol sulfates (307/227), resveratrol glucuronides (403/227), and resveratrol (227/185; DP �80) inurine samples of representative volunteers after the consumption of 250 mL of red wine.Numbered peaks refer to Table 2.
Clinical Chemistry 53, No. 2, 2007 297
ing the quantitative and qualitative profiling of the res-veratrol metabolites.
Another highlight of the present method is the abil-ity to differentiate between the trans and cis isomers ofresveratrol-4�-O-glucuronide, resveratrol-3-O-glucuronide,resveratrol-4�-sulfate, and resveratrol-3-sulfate. This methodis the first to identify the entire profile of resveratrol sulfatesin human LDL and urine (Figs. 3 and 4).
There was variability between volunteers (Table 2), butall sulfates were found in similar concentrations in LDL.The main sulfate in LDL was the cis-resveratrol-4�-sulfate,and the main glucuronide was trans-resveratrol-3-O-gluc-uronide. The trans-resveratrol-O-glucuronides were ingreater concentrations than sulfates. Resveratrol can beglucuronidated at 2 positions on the molecule. Althoughthe 3 position seemed to be the preferential glucuronida-tion site in vitro in human liver microsomes, the 4�position is also a possible site of metabolism in humansin vivo (11 ). Considering activity, the presence of the4�-OH is a requisite for inhibition of cell proliferation (31 ).Our results show major glucuronidation of resveratrol in3-position at 24 h maintaining the 4�-OH free. Althoughthe glucuronide metabolites of resveratrol have previ-ously been described in LDL (10 ), this new method is ableto determine resveratrol sulfates without reducing theresolution of glucuronides.
After successful characterization of the resveratrol me-tabolites profile in LDL, we applied the method to urinesamples. Urine is a more adequate sample to be used inlarge-scale population studies to establish nutritional bi-omarkers (32 ). Meng et al. (9 ) described the rapid excre-tion of resveratrol in urine (after 2–3 h) when lowamounts are consumed. In this study, the urine wascollected during the 4 h after moderate red wine intake.When absorbed, resveratrol is rapidly cleared through theglucuronidation and sulfation pathways, and metabolitesare principally excreted in urine (9, 12). All the resveratrolmetabolites previously described were found in theseurine samples. Concerning the stereoselectivity of gluc-uronidation, cis-isomers were glucuronidated faster thantrans-isomers (15 ). This observation is in accordance withour results of our study, in which greater amounts ofcis-O-glucuronide are obtained. Because this is the firsttime that sulfates of resveratrol have been well character-ized, there are no published data about sulfate stereose-lectivity. Taking into account the concentration results(Table 2), however, the behavior of sulfates seems similarto that of glucuronides, showing higher amounts for cisisomers. The variability shown in these results has beenseen previously in LDL (10 ) and is attributable to poly-morphisms of intestinal enzymes (33 ) or to interactionswith other compounds (34 ). Further investigations onresveratrol variability with more volunteers are needed.
This method can be used in future epidemiological andclinical intervention trials. In studies aimed at evaluatingthe biological effects of resveratrol intake via moderatewine consumption, knowledge of the resveratrol profile
may facilitate better estimation of resveratrol consump-tion than dietary data obtained by food frequency ques-tionnaires.
We are grateful to the volunteers for their valuablecooperation in the study. We are also grateful for thefinancial support of the following Spanish Depart-ments: Agriculture (INIA project VIN00-027-C3-2), Edu-cation and Science (MEC) (AGL2004-08378-C02-01/02),and Health: Instituto de Salud Carlos III, Red de GrupoG03/140 (PREDIMED study). M.U.-S. and R.Z.-R. thankthe Formacion de Personal Investigator fellowship pro-gram from MEC and Departament d’Universitats, Recercai Societat de la Informacio, respectively. We are grateful toDr. Isidre Casals from Scientific and Technical Services, toMarta Burrull and Xavier Rodriguez from Waters, and toDr. Benedicte Duretz from Applied Biosystems for tech-nical assistance.
References1. Frankel EN, Waterhouse AL, Kinsella JE. Inhibition of human LDL
oxidation by resveratrol. Lancet 1993;341:1103–4.2. Baur JA, Sinclair DA. Therapeutic potential of resveratrol: the in
vivo evidence. Nat Rev Drug Discov 2006;5:493–506.3. Olas B, Wachowicz B. Resveratrol, a phenolic antioxidant with
effects on blood platelet functions. Platelets 2005;16:251–60.4. Corder R, Douthwaite JA, Lees DM, Khan NQ, Viseu Dos Santos
AC, Wood EG, et al. Endothelin-1 synthesis reduced by red wine.Nature 2001;414:863–4.
5. Rodrigue CM, Porteu F, Navarro N, Bruyneel E, Bracke M, RomeoPH, et al. The cancer chemopreventive agent resveratrol inducestensin, a cell-matrix adhesion protein with signaling and antitumoractivities. Oncogene 2005;24:3274–84.
6. Dore S. Unique properties of polyphenol stilbenes in the brain:more than direct antioxidant actions; gene/protein regulatoryactivity. Neurosignals 2005;14:61–70.
7. Manach C, Scalbert A, Morand C, Remesy C, Jimenez L. Polyphe-nols: food sources and bioavailability. Am J Clin Nutr 2004;79:727–47.
8. Kroon PA, Clifford MN, Crozier A, Day AJ, Donovan JL, Manach C,et al. How should we assess the effects of exposure to dietarypolyphenols in vitro? Am J Clin Nutr 2004;80:15–21.
9. Meng X, Maliakal P, Lu H, Lee MJ, Yang CS. Urinary and plasmalevels of resveratrol and quercetin in humans, mice, and rats afteringestion of pure compounds and grape juice. J Agric Food Chem2004;52:935–42.
10. Urpi-Sarda M, Jauregui O, Lamuela-Raventos RM, Jaeger W,Miksits M, Covas MI, et al. Uptake of diet resveratrol into thehuman low-density lipoprotein: identification and quantification ofresveratrol metabolites by liquid chromatography coupled withtandem mass spectrometry. Anal Chem 2005;77:3149–55.
11. Vitaglione P, Sforza S, Galaverna G, Ghidini C, Caporaso N,Vescovi PP, et al. Bioavailability of trans-resveratrol from red winein humans. Mol Nutr Food Res 2005;49:495–504.
12. Walle T, Hsieh F, DeLegge MH, Oatis JE, Walle UK. High absorp-tion but very low bioavailability of oral resveratrol in humans. DrugMetab Dispos 2004;32:1377–82.
13. Zamora-Ros R, Urpi-Sarda M, Lamuela-Raventos RM, Estruch R,Vazquez-Agell M, Serrano-Martinez M, et al. Diagnostic perfor-mance of urinary resveratrol metabolites as a biomarker ofmoderate wine consumption. Clin Chem 2006;52:1373–80.
298 Urpi-Sarda et al.: Human Resveratrol Metabolites by HPLC-MS/MS
14. Asensi M, Medina I, Ortega A, Carretero J, Bano MC, Obrador E, etal. Inhibition of cancer growth by resveratrol is related to its lowbioavailability. Free Radic Biol Med 2002;33:387–98.
15. Aumont V, Krisa S, Battaglia E, Netter P, Richard T, Merillon JM, etal. Regioselective and stereospecific glucuronidation of trans- andcis-resveratrol in human. Arch Biochem Biophys 2001;393:281–9.
16. Wenzel E, Soldo T, Erbersdobler H, Somoza V. Bioactivity andmetabolism of trans-resveratrol orally administered to Wistar rats.Mol Nutr Food Res 2005;49:482–94.
17. Andlauer W, Kolb J, Siebert K, Furst P. Assessment of resveratrolbioavailability in the perfused small intestine of the rat. Drugs ExpClin Res 2000;26:47–55.
18. Kuhnle G, Spencer JP, Chowrimootoo G, Schroeter H, Debnam ES,Srai SK et al. Resveratrol is absorbed in the small intestine asresveratrol glucuronide. Biochem Biophys Res Commun 2000;272:212–7.
19. Marier JF, Vachon P, Gritsas A, Zhang J, Moreau JP, DucharmeMP. Metabolism and disposition of resveratrol in rats: extent ofabsorption, glucuronidation, and enterohepatic recirculation evi-denced by a linked-rat model. J Pharmacol Exp Ther 2002;302:369–73.
20. Yu C, Shin YG, Chow A, Li Y, Kosmeder JW, Lee YS et al. Human,rat, and mouse metabolism of resveratrol. Pharm Res 2002;19:1907–14.
21. Miro-Casas E, Farre AM, Covas MI, Rodriguez JO, Menoyo CE,Lamuela Raventos RM, et al. Capillary gas chromatography-massspectrometry quantitative determination of hydroxytyrosol andtyrosol in human urine after olive oil intake. Anal Biochem2001;294:63–72.
22. Jager W, Zembsch B, Wolschann P, Pittenauer E, Senderowicz AM,Sausville EA, et al. Metabolism of the anticancer drug flavopiridol,a new inhibitor of cyclin dependent kinases, in rat liver. Life Sci1998;62:1861–73.
23. Elosua R, Marrugat J, Molina L, Pons S, Pujol E. Validation of theMinnesota Leisure Time Physical Activity Questionnaire in Span-ish men. The MARATHOM Investigators. Am J Epidemiol 1994;139:1197–209.
24. Havel RJ, Eder HA, Bragdon JH. The distribution and chemicalcomposition of ultracentrifugally separated lipoproteins in humanserum. J Clin Invest 1955;34:1345–53.
25. Jaffe M. Uber den niederschlag welchen pikrinsaure in normalenharn erzeugt und uber eine neue reaction des kreatinins. Z PhysiolChem 1886;10:391–400.
26. Lamuela-Raventos RM, Romero-Perez AI, Waterhouse AL, de laTorre-Boronat MC. Direct HPLC analysis of cis- and trans-resvera-trol and piceid isomers in Spanish red Vitis vinifera wines. J AgricFood Chem 1995;43:281–3.
27. Hernandez F, Ibanez M, Sancho JV, Pozo OJ. Comparison ofdifferent mass spectrometric techniques combined with liquidchromatography for confirmation of pesticides in environmentalwater based on the use of identification points. Anal Chem2004;76:4349–57.
28. US Department of Health and Human Services, Food and DrugAdministration. Guidance for Industry Bioanalytical Method Vali-dation. 2001. http://www.fda.gov/cder/guidance/4252fnl.htm(accessed December 2006).
29. Annesley TM, Clayton LT. Quantification of mycophenolic acid andglucuronide metabolite in human serum by HPLC-tandem massspectrometry. Clin Chem 2005;51:872–7.
30. Goldberg DM, Yan J, Soleas GJ. Absorption of three wine-relatedpolyphenols in three different matrices by healthy subjects. ClinBiochem 2003;36:79–87.
31. Stivala LA, Savio M, Carafoli F, Perucca P, Bianchi L, Maga G, etal. Specific structural determinants are responsible for the anti-oxidant activity and the cell cycle effects of resveratrol. J BiolChem 2001;276:22586–94.
32. Potischman N. Biologic and methodologic issues for nutritionalbiomarkers. J Nutr 2003;133(Suppl 3):875–80.
33. Manach C, Donovan JL. Pharmacokinetics and metabolism ofdietary flavonoids in humans. Free Radic Res 2004;38:771–85.
34. Pacifici GM. Inhibition of human liver and duodenum sulfotrans-ferases by drugs and dietary chemicals: a review of the literature.Int J Clin Pharmacol Ther 2004;42:488–95.
Clinical Chemistry 53, No. 2, 2007 299
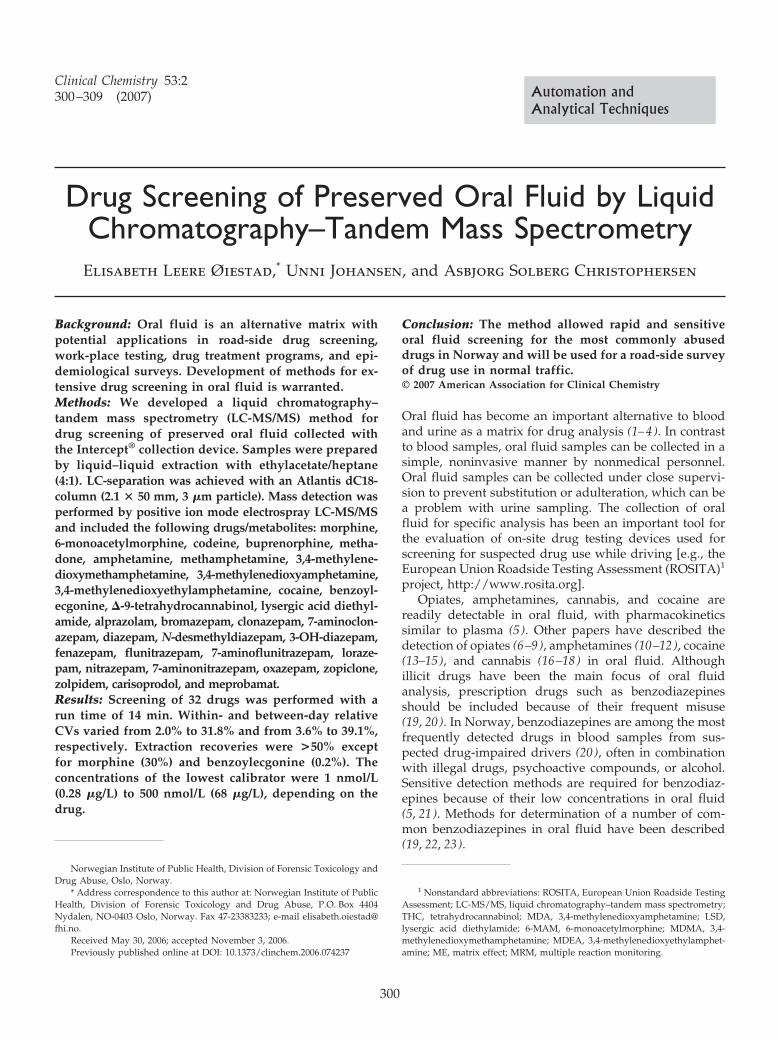
Drug Screening of Preserved Oral Fluid by LiquidChromatography–Tandem Mass Spectrometry
Elisabeth Leere Øiestad,* Unni Johansen, and Asbjorg Solberg Christophersen
Background: Oral fluid is an alternative matrix withpotential applications in road-side drug screening,work-place testing, drug treatment programs, and epi-demiological surveys. Development of methods for ex-tensive drug screening in oral fluid is warranted.Methods: We developed a liquid chromatography–tandem mass spectrometry (LC-MS/MS) method fordrug screening of preserved oral fluid collected withthe Intercept® collection device. Samples were preparedby liquid–liquid extraction with ethylacetate/heptane(4:1). LC-separation was achieved with an Atlantis dC18-column (2.1 � 50 mm, 3 �m particle). Mass detection wasperformed by positive ion mode electrospray LC-MS/MSand included the following drugs/metabolites: morphine,6-monoacetylmorphine, codeine, buprenorphine, metha-done, amphetamine, methamphetamine, 3,4-methylene-dioxymethamphetamine, 3,4-methylenedioxyamphetamine,3,4-methylenedioxyethylamphetamine, cocaine, benzoyl-ecgonine, �-9-tetrahydrocannabinol, lysergic acid diethyl-amide, alprazolam, bromazepam, clonazepam, 7-aminoclon-azepam, diazepam, N-desmethyldiazepam, 3-OH-diazepam,fenazepam, flunitrazepam, 7-aminoflunitrazepam, loraze-pam, nitrazepam, 7-aminonitrazepam, oxazepam, zopiclone,zolpidem, carisoprodol, and meprobamat.Results: Screening of 32 drugs was performed with arun time of 14 min. Within- and between-day relativeCVs varied from 2.0% to 31.8% and from 3.6% to 39.1%,respectively. Extraction recoveries were >50% exceptfor morphine (30%) and benzoylecgonine (0.2%). Theconcentrations of the lowest calibrator were 1 nmol/L(0.28 �g/L) to 500 nmol/L (68 �g/L), depending on thedrug.
Conclusion: The method allowed rapid and sensitiveoral fluid screening for the most commonly abuseddrugs in Norway and will be used for a road-side surveyof drug use in normal traffic.© 2007 American Association for Clinical Chemistry
Oral fluid has become an important alternative to bloodand urine as a matrix for drug analysis (1–4). In contrastto blood samples, oral fluid samples can be collected in asimple, noninvasive manner by nonmedical personnel.Oral fluid samples can be collected under close supervi-sion to prevent substitution or adulteration, which can bea problem with urine sampling. The collection of oralfluid for specific analysis has been an important tool forthe evaluation of on-site drug testing devices used forscreening for suspected drug use while driving [e.g., theEuropean Union Roadside Testing Assessment (ROSITA)1
project, http://www.rosita.org].Opiates, amphetamines, cannabis, and cocaine are
readily detectable in oral fluid, with pharmacokineticssimilar to plasma (5 ). Other papers have described thedetection of opiates (6–9), amphetamines (10–12), cocaine(13–15), and cannabis (16–18) in oral fluid. Althoughillicit drugs have been the main focus of oral fluidanalysis, prescription drugs such as benzodiazepinesshould be included because of their frequent misuse(19, 20). In Norway, benzodiazepines are among the mostfrequently detected drugs in blood samples from sus-pected drug-impaired drivers (20 ), often in combinationwith illegal drugs, psychoactive compounds, or alcohol.Sensitive detection methods are required for benzodiaz-epines because of their low concentrations in oral fluid(5, 21). Methods for determination of a number of com-mon benzodiazepines in oral fluid have been described(19, 22, 23).
Norwegian Institute of Public Health, Division of Forensic Toxicology andDrug Abuse, Oslo, Norway.
* Address correspondence to this author at: Norwegian Institute of PublicHealth, Division of Forensic Toxicology and Drug Abuse, P.O. Box 4404Nydalen, NO-0403 Oslo, Norway. Fax 47-23383233; e-mail [email protected].
Received May 30, 2006; accepted November 3, 2006.Previously published online at DOI: 10.1373/clinchem.2006.074237
1 Nonstandard abbreviations: ROSITA, European Union Roadside TestingAssessment; LC-MS/MS, liquid chromatography–tandem mass spectrometry;THC, tetrahydrocannabinol; MDA, 3,4-methylenedioxyamphetamine; LSD,lysergic acid diethylamide; 6-MAM, 6-monoacetylmorphine; MDMA, 3,4-methylenedioxymethamphetamine; MDEA, 3,4-methylenedioxyethylamphet-amine; ME, matrix effect; MRM, multiple reaction monitoring.
Clinical Chemistry 53:2300–309 (2007) Automation and
Analytical Techniques
300
Passage of a substance from the blood to saliva isdependent on the pH of the blood and oral fluid, proteinbinding, rate of oral fluid flow, pKa, and the molecularweight of the substance (24, 25). Flow rate and pH de-pend on the degree of oral fluid stimulation duringcollection. Recovery and drug stability also depend on themanner in which the sample has been collected (23, 26),e.g., with different collection devices or expectoration.Standardization of sample collection is therefore impor-tant. Often the amount of material available after oralfluid collection with a standard sampling device is lim-ited. Multicomponent methods are therefore advanta-geous, and an increasing number of such methods havebeen described (27–32).
Liquid chromatography–tandem mass spectrometry(LC-MS/MS) is increasingly being used in forensic toxi-cology for the identification and quantification of a widerange of compounds in biological samples (33 ). Easiersample preparation, no required derivatization, and shortanalysis time are the major advantages, and an LC-MS/MS method for opiates, cocaine, and some benzodi-azepines has recently been shown to be a viable replace-ment for immunoassay drug screening of oral fluid in anaddiction clinic setting, although this method did not testfor tetrahydrocannabinol (THC) or amphetamines (34 ).Another comprehensive LC-MS/MS method for the in-vestigation of drugs in drivers has been described, butthis method did not include THC or low-dose benzo-diazepines (35 ).
We describe a rapid and sensitive LC-MS/MS methodfor oral fluid screening of illegal and medicinal drugsimportant to traffic safety. The Intercept® collection de-vice used in this method was selected as the referencecollection device by the European Commission RoadsideTesting Assessment project (ROSITA II; http://www.rosita.org).
Materials and Methodschemicals and reagentsWe obtained reference compounds from multiple pharma-ceutical companies: 7-aminonitrazepam, 7-aminoflunitraz-epam, methamphetamine, benzoylecgonine, 3,4-methyl-enedioxyamphetamine (MDA), lysergic acid diethylamide(LSD), and �-9-THC from Cerilliant Corp; 7-aminonitraz-epam, 7-aminoclonazepam, 7-aminoflunitrazepam, alprazo-lam, lorazepam, 6-monoacetylmorphine (6-MAM), N-des-methyldiazepam, and 3-hydroxydiazepam from Lipomed;alprazolam, bromazepam, 3-hydroxydiazepam, oxazepam,amphetamine, cocaine, benzoylecgonine, codeine, mepro-bamat, and carisoprodol from Sigma-Aldrich; oxazepam,7-aminoclonazepam, N-desmethyldiazepam, clonazepam,nitrazepam, flunitrazepam, MDA, 3,4-methylenedioxymeth-amphetamine (MDMA), 3,4-methylenedioxyethylamphet-amine (MDEA), 6-MAM, and THC from Alltech; buprenor-phine and diazepam from RBI; morphine and methadonefrom NMD; zolpidem from Synthelabo Groupe; zopiclonefrom Council of Europe; and fenazepam from Chiron. We
purchased the internal standards morphine-d3, amphet-amine-d11, metamphetamine-d11, benzoylecgonine-d8,MDMA-d5, 7-aminoflunitrazepam-d7, N-desmethyldiaz-epam-d5, and methadone-d9 from Cerilliant Corp. andTHC-d6 from High Standards Products Corp. Standardcompounds were stored according to supplier recommen-dations (solid substances mainly at room temperature, am-pules at 4 °C). Intercept collection devices and NegativeCalibrator Oral Fluid were purchased from Orasure Tech-nologies Inc., and Flag Blue Liquid Food Color was obtainedfrom Chef’s Classic. HPLC-grade acetonitrile and methanolwere purchased from Lab-scan Ltd.; analytical grade n-heptane, ammonium acetate, ethanol absolute and aceticacid, extra pure ammonia 32%, and HPLC-grade ethylacetate from Merck; and ammonium carbonate from BDHLaboratory Supplies.
solutionsWe prepared stock solutions in methanol, with the excep-tion of zopiclon and zolpidem, which were dissolved inacetonitrile, and THC, which was dissolved in ethanol.Calibrator and QC solutions were prepared by appropri-ate dilution of stock solutions with water. The stock andaqueous solutions were stored at �20 °C and 4 °C, respec-tively. During initial method validation, we observed thatpeak heights for THC decreased substantially over timecompared with freshly made standards, a finding thatwas interpreted as a problem with stability, and THC wastherefore prepared in ethanol:water 1:2 and not combinedwith the rest of the compounds. The Intercept collectiondevices contain salts and preservatives. A solution withthe same contents as the sample sets, Negative CalibratorOral Fluid, was therefore purchased from Orasure Tech-nologies Inc. Because the sample sets contained a blue dyethat was not present in the Negative Calibrator Oral Fluid,the same blue dye was added (100 �L per 100 mL) tomimic the content of the samples. The resulting bluesolution, hereafter referred to as zero calibrant solution, wasused to prepare calibrators and QC samples. The sam-pling sets contained 0.8 mL of preservative buffer, and theexpected volume of oral fluid was �0.4 mL, giving a 2:1dilution that was compensated for in the preparation ofcalibrators and QC samples. The internal standard solu-tion was diluted with water to yield final concentrationsin oral fluid, adjusted for dilution, of 0.015–0.89 �mol/L.
We prepared a 50 mmol/L stock solution of ammo-nium acetate, adjusted to pH 5 with acetic acid. From thisstock a 5 mmol/L buffer solution was prepared by a 1:10dilution with water. A 0.2 mol/L ammonium carbonatebuffer, adjusted to pH 9.3 with ammonia, was also used inthe assay.
sample collection and pretreatmentWe collected oral fluid samples according to the instruc-tions from Intercept (http://www.4intercept.com/procedure). The device consists of a collector pad on aplastic handle and a vial that contains 0.8 mL of stabiliz-
Clinical Chemistry 53, No. 2, 2007 301
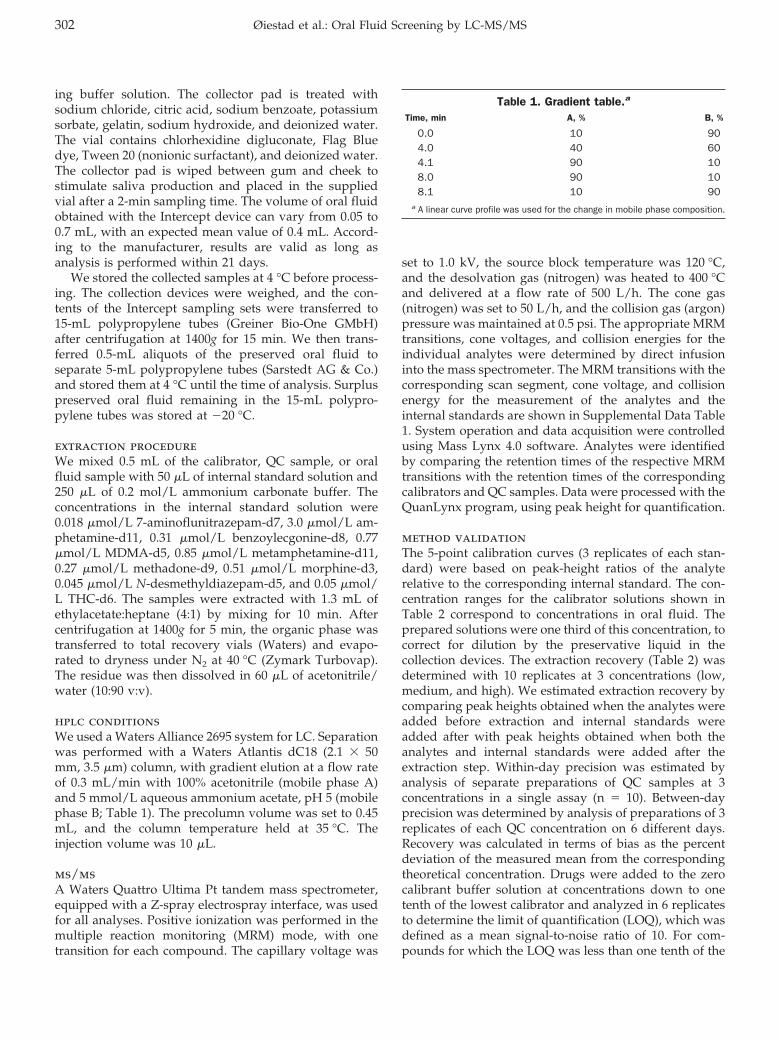
ing buffer solution. The collector pad is treated withsodium chloride, citric acid, sodium benzoate, potassiumsorbate, gelatin, sodium hydroxide, and deionized water.The vial contains chlorhexidine digluconate, Flag Bluedye, Tween 20 (nonionic surfactant), and deionized water.The collector pad is wiped between gum and cheek tostimulate saliva production and placed in the suppliedvial after a 2-min sampling time. The volume of oral fluidobtained with the Intercept device can vary from 0.05 to0.7 mL, with an expected mean value of 0.4 mL. Accord-ing to the manufacturer, results are valid as long asanalysis is performed within 21 days.
We stored the collected samples at 4 °C before process-ing. The collection devices were weighed, and the con-tents of the Intercept sampling sets were transferred to15-mL polypropylene tubes (Greiner Bio-One GMbH)after centrifugation at 1400g for 15 min. We then trans-ferred 0.5-mL aliquots of the preserved oral fluid toseparate 5-mL polypropylene tubes (Sarstedt AG & Co.)and stored them at 4 °C until the time of analysis. Surpluspreserved oral fluid remaining in the 15-mL polypro-pylene tubes was stored at �20 °C.
extraction procedureWe mixed 0.5 mL of the calibrator, QC sample, or oralfluid sample with 50 �L of internal standard solution and250 �L of 0.2 mol/L ammonium carbonate buffer. Theconcentrations in the internal standard solution were0.018 �mol/L 7-aminoflunitrazepam-d7, 3.0 �mol/L am-phetamine-d11, 0.31 �mol/L benzoylecgonine-d8, 0.77�mol/L MDMA-d5, 0.85 �mol/L metamphetamine-d11,0.27 �mol/L methadone-d9, 0.51 �mol/L morphine-d3,0.045 �mol/L N-desmethyldiazepam-d5, and 0.05 �mol/L THC-d6. The samples were extracted with 1.3 mL ofethylacetate:heptane (4:1) by mixing for 10 min. Aftercentrifugation at 1400g for 5 min, the organic phase wastransferred to total recovery vials (Waters) and evapo-rated to dryness under N2 at 40 °C (Zymark Turbovap).The residue was then dissolved in 60 �L of acetonitrile/water (10:90 v:v).
hplc conditionsWe used a Waters Alliance 2695 system for LC. Separationwas performed with a Waters Atlantis dC18 (2.1 � 50mm, 3.5 �m) column, with gradient elution at a flow rateof 0.3 mL/min with 100% acetonitrile (mobile phase A)and 5 mmol/L aqueous ammonium acetate, pH 5 (mobilephase B; Table 1). The precolumn volume was set to 0.45mL, and the column temperature held at 35 °C. Theinjection volume was 10 �L.
ms/msA Waters Quattro Ultima Pt tandem mass spectrometer,equipped with a Z-spray electrospray interface, was usedfor all analyses. Positive ionization was performed in themultiple reaction monitoring (MRM) mode, with onetransition for each compound. The capillary voltage was
set to 1.0 kV, the source block temperature was 120 °C,and the desolvation gas (nitrogen) was heated to 400 °Cand delivered at a flow rate of 500 L/h. The cone gas(nitrogen) was set to 50 L/h, and the collision gas (argon)pressure was maintained at 0.5 psi. The appropriate MRMtransitions, cone voltages, and collision energies for theindividual analytes were determined by direct infusioninto the mass spectrometer. The MRM transitions with thecorresponding scan segment, cone voltage, and collisionenergy for the measurement of the analytes and theinternal standards are shown in Supplemental Data Table1. System operation and data acquisition were controlledusing Mass Lynx 4.0 software. Analytes were identifiedby comparing the retention times of the respective MRMtransitions with the retention times of the correspondingcalibrators and QC samples. Data were processed with theQuanLynx program, using peak height for quantification.
method validationThe 5-point calibration curves (3 replicates of each stan-dard) were based on peak-height ratios of the analyterelative to the corresponding internal standard. The con-centration ranges for the calibrator solutions shown inTable 2 correspond to concentrations in oral fluid. Theprepared solutions were one third of this concentration, tocorrect for dilution by the preservative liquid in thecollection devices. The extraction recovery (Table 2) wasdetermined with 10 replicates at 3 concentrations (low,medium, and high). We estimated extraction recovery bycomparing peak heights obtained when the analytes wereadded before extraction and internal standards wereadded after with peak heights obtained when both theanalytes and internal standards were added after theextraction step. Within-day precision was estimated byanalysis of separate preparations of QC samples at 3concentrations in a single assay (n � 10). Between-dayprecision was determined by analysis of preparations of 3replicates of each QC concentration on 6 different days.Recovery was calculated in terms of bias as the percentdeviation of the measured mean from the correspondingtheoretical concentration. Drugs were added to the zerocalibrant buffer solution at concentrations down to onetenth of the lowest calibrator and analyzed in 6 replicatesto determine the limit of quantification (LOQ), which wasdefined as a mean signal-to-noise ratio of 10. For com-pounds for which the LOQ was less than one tenth of the
Table 1. Gradient table.a
Time, min A, % B, %
0.0 10 904.0 40 604.1 90 108.0 90 108.1 10 90
a A linear curve profile was used for the change in mobile phase composition.
302 Øiestad et al.: Oral Fluid Screening by LC-MS/MS
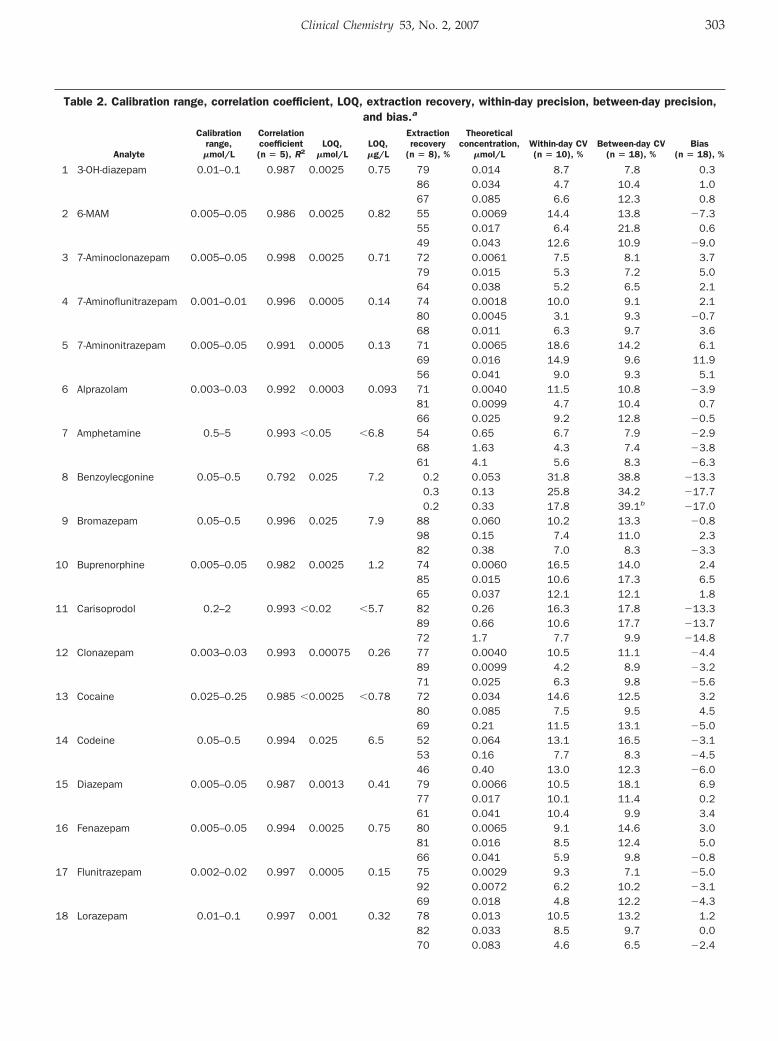
Table 2. Calibration range, correlation coefficient, LOQ, extraction recovery, within-day precision, between-day precision,and bias.a
Analyte
Calibrationrange,
�mol/L
Correlationcoefficient(n � 5), R2
LOQ,�mol/L
LOQ,�g/L
Extractionrecovery
(n � 8), %
Theoreticalconcentration,
�mol/LWithin-day CV(n � 10), %
Between-day CV(n � 18), %
Bias(n � 18), %
1 3-OH-diazepam 0.01–0.1 0.987 0.0025 0.75 79 0.014 8.7 7.8 0.386 0.034 4.7 10.4 1.067 0.085 6.6 12.3 0.8
2 6-MAM 0.005–0.05 0.986 0.0025 0.82 55 0.0069 14.4 13.8 �7.355 0.017 6.4 21.8 0.649 0.043 12.6 10.9 �9.0
3 7-Aminoclonazepam 0.005–0.05 0.998 0.0025 0.71 72 0.0061 7.5 8.1 3.779 0.015 5.3 7.2 5.064 0.038 5.2 6.5 2.1
4 7-Aminoflunitrazepam 0.001–0.01 0.996 0.0005 0.14 74 0.0018 10.0 9.1 2.180 0.0045 3.1 9.3 �0.768 0.011 6.3 9.7 3.6
5 7-Aminonitrazepam 0.005–0.05 0.991 0.0005 0.13 71 0.0065 18.6 14.2 6.169 0.016 14.9 9.6 11.956 0.041 9.0 9.3 5.1
6 Alprazolam 0.003–0.03 0.992 0.0003 0.093 71 0.0040 11.5 10.8 �3.981 0.0099 4.7 10.4 0.766 0.025 9.2 12.8 �0.5
7 Amphetamine 0.5–5 0.993 �0.05 �6.8 54 0.65 6.7 7.9 �2.968 1.63 4.3 7.4 �3.861 4.1 5.6 8.3 �6.3
8 Benzoylecgonine 0.05–0.5 0.792 0.025 7.2 0.2 0.053 31.8 38.8 �13.30.3 0.13 25.8 34.2 �17.70.2 0.33 17.8 39.1b �17.0
9 Bromazepam 0.05–0.5 0.996 0.025 7.9 88 0.060 10.2 13.3 �0.898 0.15 7.4 11.0 2.382 0.38 7.0 8.3 �3.3
10 Buprenorphine 0.005–0.05 0.982 0.0025 1.2 74 0.0060 16.5 14.0 2.485 0.015 10.6 17.3 6.565 0.037 12.1 12.1 1.8
11 Carisoprodol 0.2–2 0.993 �0.02 �5.7 82 0.26 16.3 17.8 �13.389 0.66 10.6 17.7 �13.772 1.7 7.7 9.9 �14.8
12 Clonazepam 0.003–0.03 0.993 0.00075 0.26 77 0.0040 10.5 11.1 �4.489 0.0099 4.2 8.9 �3.271 0.025 6.3 9.8 �5.6
13 Cocaine 0.025–0.25 0.985 �0.0025 �0.78 72 0.034 14.6 12.5 3.280 0.085 7.5 9.5 4.569 0.21 11.5 13.1 �5.0
14 Codeine 0.05–0.5 0.994 0.025 6.5 52 0.064 13.1 16.5 �3.153 0.16 7.7 8.3 �4.546 0.40 13.0 12.3 �6.0
15 Diazepam 0.005–0.05 0.987 0.0013 0.41 79 0.0066 10.5 18.1 6.977 0.017 10.1 11.4 0.261 0.041 10.4 9.9 3.4
16 Fenazepam 0.005–0.05 0.994 0.0025 0.75 80 0.0065 9.1 14.6 3.081 0.016 8.5 12.4 5.066 0.041 5.9 9.8 �0.8
17 Flunitrazepam 0.002–0.02 0.997 0.0005 0.15 75 0.0029 9.3 7.1 �5.092 0.0072 6.2 10.2 �3.169 0.018 4.8 12.2 �4.3
18 Lorazepam 0.01–0.1 0.997 0.001 0.32 78 0.013 10.5 13.2 1.282 0.033 8.5 9.7 0.070 0.083 4.6 6.5 �2.4
Clinical Chemistry 53, No. 2, 2007 303
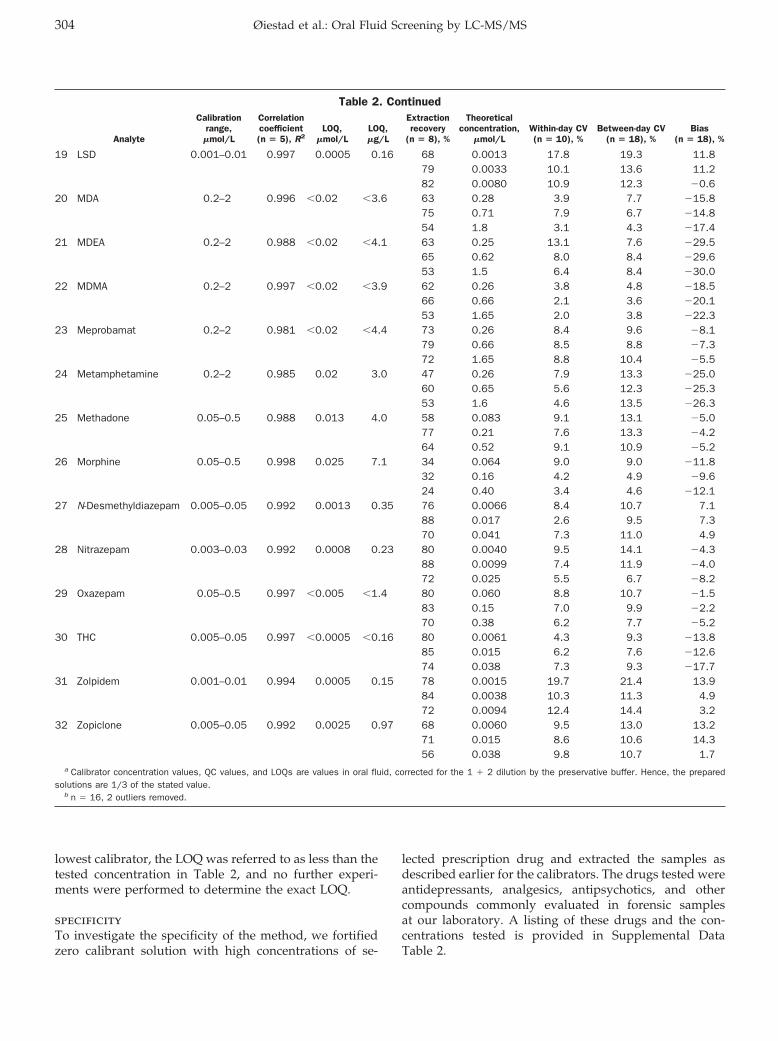
lowest calibrator, the LOQ was referred to as less than thetested concentration in Table 2, and no further experi-ments were performed to determine the exact LOQ.
specificityTo investigate the specificity of the method, we fortifiedzero calibrant solution with high concentrations of se-
lected prescription drug and extracted the samples asdescribed earlier for the calibrators. The drugs tested wereantidepressants, analgesics, antipsychotics, and othercompounds commonly evaluated in forensic samplesat our laboratory. A listing of these drugs and the con-centrations tested is provided in Supplemental DataTable 2.
Table 2. Continued
Analyte
Calibrationrange,
�mol/L
Correlationcoefficient(n � 5), R2
LOQ,�mol/L
LOQ,�g/L
Extractionrecovery
(n � 8), %
Theoreticalconcentration,
�mol/LWithin-day CV(n � 10), %
Between-day CV(n � 18), %
Bias(n � 18), %
19 LSD 0.001–0.01 0.997 0.0005 0.16 68 0.0013 17.8 19.3 11.879 0.0033 10.1 13.6 11.282 0.0080 10.9 12.3 �0.6
20 MDA 0.2–2 0.996 �0.02 �3.6 63 0.28 3.9 7.7 �15.875 0.71 7.9 6.7 �14.854 1.8 3.1 4.3 �17.4
21 MDEA 0.2–2 0.988 �0.02 �4.1 63 0.25 13.1 7.6 �29.565 0.62 8.0 8.4 �29.653 1.5 6.4 8.4 �30.0
22 MDMA 0.2–2 0.997 �0.02 �3.9 62 0.26 3.8 4.8 �18.566 0.66 2.1 3.6 �20.153 1.65 2.0 3.8 �22.3
23 Meprobamat 0.2–2 0.981 �0.02 �4.4 73 0.26 8.4 9.6 �8.179 0.66 8.5 8.8 �7.372 1.65 8.8 10.4 �5.5
24 Metamphetamine 0.2–2 0.985 0.02 3.0 47 0.26 7.9 13.3 �25.060 0.65 5.6 12.3 �25.353 1.6 4.6 13.5 �26.3
25 Methadone 0.05–0.5 0.988 0.013 4.0 58 0.083 9.1 13.1 �5.077 0.21 7.6 13.3 �4.264 0.52 9.1 10.9 �5.2
26 Morphine 0.05–0.5 0.998 0.025 7.1 34 0.064 9.0 9.0 �11.832 0.16 4.2 4.9 �9.624 0.40 3.4 4.6 �12.1
27 N-Desmethyldiazepam 0.005–0.05 0.992 0.0013 0.35 76 0.0066 8.4 10.7 7.188 0.017 2.6 9.5 7.370 0.041 7.3 11.0 4.9
28 Nitrazepam 0.003–0.03 0.992 0.0008 0.23 80 0.0040 9.5 14.1 �4.388 0.0099 7.4 11.9 �4.072 0.025 5.5 6.7 �8.2
29 Oxazepam 0.05–0.5 0.997 �0.005 �1.4 80 0.060 8.8 10.7 �1.583 0.15 7.0 9.9 �2.270 0.38 6.2 7.7 �5.2
30 THC 0.005–0.05 0.997 �0.0005 �0.16 80 0.0061 4.3 9.3 �13.885 0.015 6.2 7.6 �12.674 0.038 7.3 9.3 �17.7
31 Zolpidem 0.001–0.01 0.994 0.0005 0.15 78 0.0015 19.7 21.4 13.984 0.0038 10.3 11.3 4.972 0.0094 12.4 14.4 3.2
32 Zopiclone 0.005–0.05 0.992 0.0025 0.97 68 0.0060 9.5 13.0 13.271 0.015 8.6 10.6 14.356 0.038 9.8 10.7 1.7
a Calibrator concentration values, QC values, and LOQs are values in oral fluid, corrected for the 1 � 2 dilution by the preservative buffer. Hence, the preparedsolutions are 1/3 of the stated value.
b n � 16, 2 outliers removed.
304 Øiestad et al.: Oral Fluid Screening by LC-MS/MS
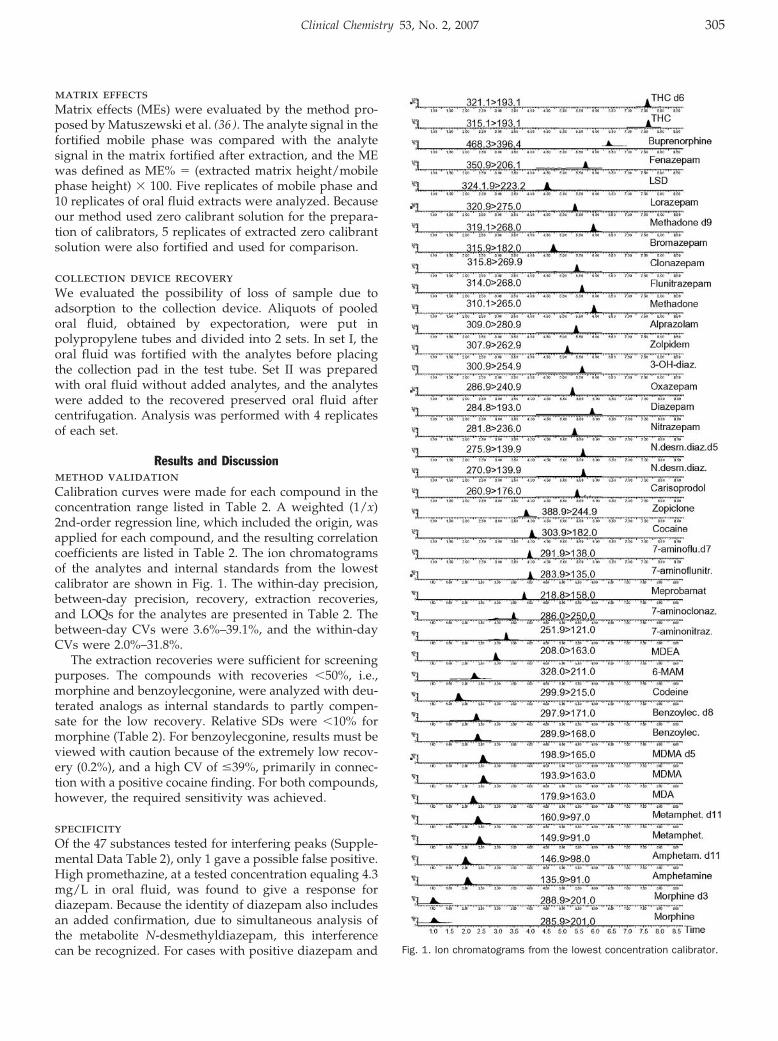
matrix effectsMatrix effects (MEs) were evaluated by the method pro-posed by Matuszewski et al. (36 ). The analyte signal in thefortified mobile phase was compared with the analytesignal in the matrix fortified after extraction, and the MEwas defined as ME% � (extracted matrix height/mobilephase height) � 100. Five replicates of mobile phase and10 replicates of oral fluid extracts were analyzed. Becauseour method used zero calibrant solution for the prepara-tion of calibrators, 5 replicates of extracted zero calibrantsolution were also fortified and used for comparison.
collection device recoveryWe evaluated the possibility of loss of sample due toadsorption to the collection device. Aliquots of pooledoral fluid, obtained by expectoration, were put inpolypropylene tubes and divided into 2 sets. In set I, theoral fluid was fortified with the analytes before placingthe collection pad in the test tube. Set II was preparedwith oral fluid without added analytes, and the analyteswere added to the recovered preserved oral fluid aftercentrifugation. Analysis was performed with 4 replicatesof each set.
Results and Discussionmethod validationCalibration curves were made for each compound in theconcentration range listed in Table 2. A weighted (1/x)2nd-order regression line, which included the origin, wasapplied for each compound, and the resulting correlationcoefficients are listed in Table 2. The ion chromatogramsof the analytes and internal standards from the lowestcalibrator are shown in Fig. 1. The within-day precision,between-day precision, recovery, extraction recoveries,and LOQs for the analytes are presented in Table 2. Thebetween-day CVs were 3.6%–39.1%, and the within-dayCVs were 2.0%–31.8%.
The extraction recoveries were sufficient for screeningpurposes. The compounds with recoveries �50%, i.e.,morphine and benzoylecgonine, were analyzed with deu-terated analogs as internal standards to partly compen-sate for the low recovery. Relative SDs were �10% formorphine (Table 2). For benzoylecgonine, results must beviewed with caution because of the extremely low recov-ery (0.2%), and a high CV of �39%, primarily in connec-tion with a positive cocaine finding. For both compounds,however, the required sensitivity was achieved.
specificityOf the 47 substances tested for interfering peaks (Supple-mental Data Table 2), only 1 gave a possible false positive.High promethazine, at a tested concentration equaling 4.3mg/L in oral fluid, was found to give a response fordiazepam. Because the identity of diazepam also includesan added confirmation, due to simultaneous analysis ofthe metabolite N-desmethyldiazepam, this interferencecan be recognized. For cases with positive diazepam and Fig. 1. Ion chromatograms from the lowest concentration calibrator.
Clinical Chemistry 53, No. 2, 2007 305
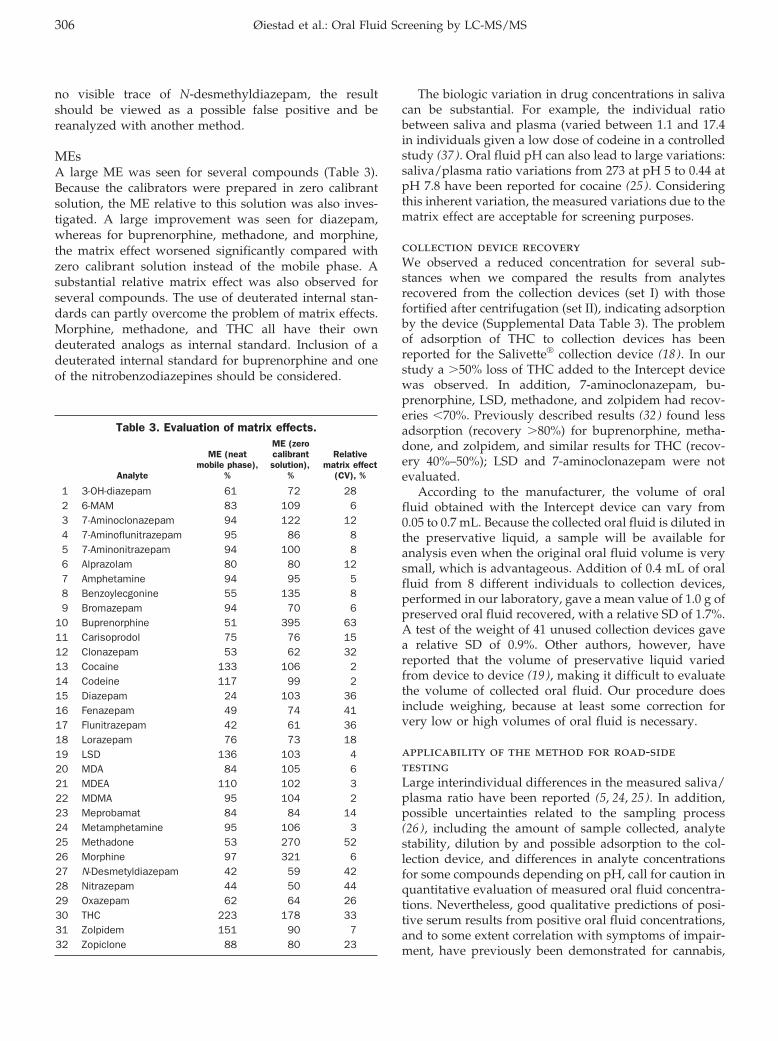
no visible trace of N-desmethyldiazepam, the resultshould be viewed as a possible false positive and bereanalyzed with another method.
MEsA large ME was seen for several compounds (Table 3).Because the calibrators were prepared in zero calibrantsolution, the ME relative to this solution was also inves-tigated. A large improvement was seen for diazepam,whereas for buprenorphine, methadone, and morphine,the matrix effect worsened significantly compared withzero calibrant solution instead of the mobile phase. Asubstantial relative matrix effect was also observed forseveral compounds. The use of deuterated internal stan-dards can partly overcome the problem of matrix effects.Morphine, methadone, and THC all have their owndeuterated analogs as internal standard. Inclusion of adeuterated internal standard for buprenorphine and oneof the nitrobenzodiazepines should be considered.
The biologic variation in drug concentrations in salivacan be substantial. For example, the individual ratiobetween saliva and plasma (varied between 1.1 and 17.4in individuals given a low dose of codeine in a controlledstudy (37 ). Oral fluid pH can also lead to large variations:saliva/plasma ratio variations from 273 at pH 5 to 0.44 atpH 7.8 have been reported for cocaine (25 ). Consideringthis inherent variation, the measured variations due to thematrix effect are acceptable for screening purposes.
collection device recoveryWe observed a reduced concentration for several sub-stances when we compared the results from analytesrecovered from the collection devices (set I) with thosefortified after centrifugation (set II), indicating adsorptionby the device (Supplemental Data Table 3). The problemof adsorption of THC to collection devices has beenreported for the Salivette® collection device (18 ). In ourstudy a �50% loss of THC added to the Intercept devicewas observed. In addition, 7-aminoclonazepam, bu-prenorphine, LSD, methadone, and zolpidem had recov-eries �70%. Previously described results (32 ) found lessadsorption (recovery �80%) for buprenorphine, metha-done, and zolpidem, and similar results for THC (recov-ery 40%–50%); LSD and 7-aminoclonazepam were notevaluated.
According to the manufacturer, the volume of oralfluid obtained with the Intercept device can vary from0.05 to 0.7 mL. Because the collected oral fluid is diluted inthe preservative liquid, a sample will be available foranalysis even when the original oral fluid volume is verysmall, which is advantageous. Addition of 0.4 mL of oralfluid from 8 different individuals to collection devices,performed in our laboratory, gave a mean value of 1.0 g ofpreserved oral fluid recovered, with a relative SD of 1.7%.A test of the weight of 41 unused collection devices gavea relative SD of 0.9%. Other authors, however, havereported that the volume of preservative liquid variedfrom device to device (19 ), making it difficult to evaluatethe volume of collected oral fluid. Our procedure doesinclude weighing, because at least some correction forvery low or high volumes of oral fluid is necessary.
applicability of the method for road-sidetestingLarge interindividual differences in the measured saliva/plasma ratio have been reported (5, 24, 25). In addition,possible uncertainties related to the sampling process(26 ), including the amount of sample collected, analytestability, dilution by and possible adsorption to the col-lection device, and differences in analyte concentrationsfor some compounds depending on pH, call for caution inquantitative evaluation of measured oral fluid concentra-tions. Nevertheless, good qualitative predictions of posi-tive serum results from positive oral fluid concentrations,and to some extent correlation with symptoms of impair-ment, have previously been demonstrated for cannabis,
Table 3. Evaluation of matrix effects.
Analyte
ME (neatmobile phase),
%
ME (zerocalibrantsolution),
%
Relativematrix effect
(CV), %
1 3-OH-diazepam 61 72 282 6-MAM 83 109 63 7-Aminoclonazepam 94 122 124 7-Aminoflunitrazepam 95 86 85 7-Aminonitrazepam 94 100 86 Alprazolam 80 80 127 Amphetamine 94 95 58 Benzoylecgonine 55 135 89 Bromazepam 94 70 6
10 Buprenorphine 51 395 6311 Carisoprodol 75 76 1512 Clonazepam 53 62 3213 Cocaine 133 106 214 Codeine 117 99 215 Diazepam 24 103 3616 Fenazepam 49 74 4117 Flunitrazepam 42 61 3618 Lorazepam 76 73 1819 LSD 136 103 420 MDA 84 105 621 MDEA 110 102 322 MDMA 95 104 223 Meprobamat 84 84 1424 Metamphetamine 95 106 325 Methadone 53 270 5226 Morphine 97 321 627 N-Desmetyldiazepam 42 59 4228 Nitrazepam 44 50 4429 Oxazepam 62 64 2630 THC 223 178 3331 Zolpidem 151 90 732 Zopiclone 88 80 23
306 Øiestad et al.: Oral Fluid Screening by LC-MS/MS
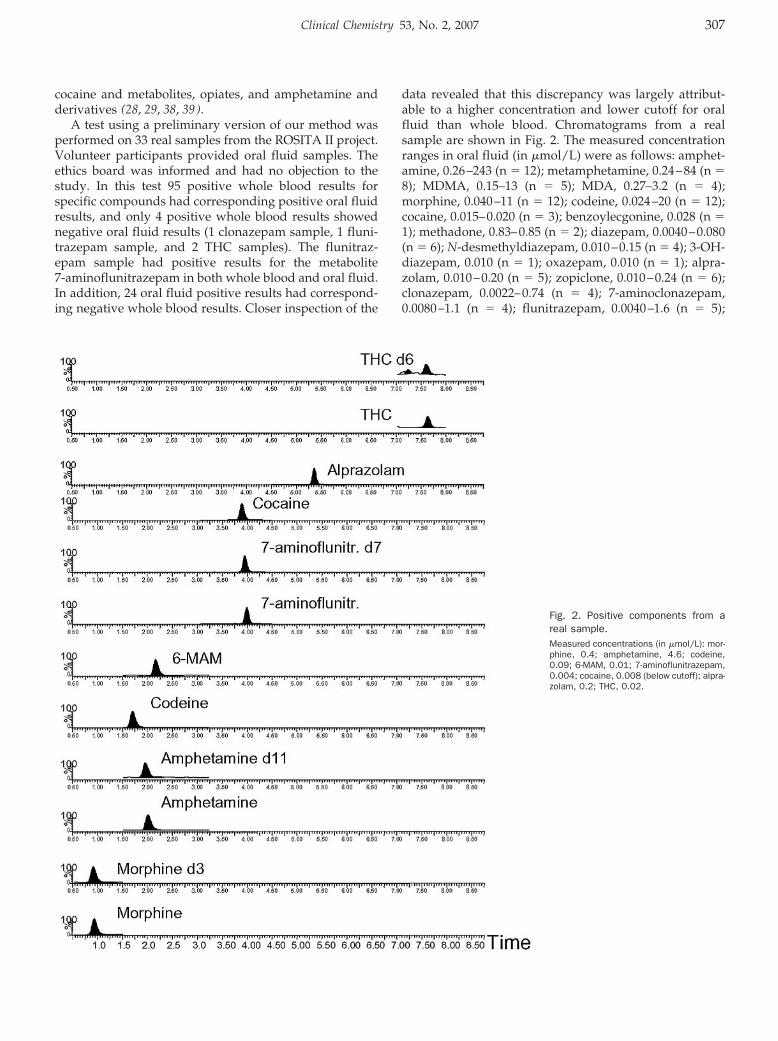
cocaine and metabolites, opiates, and amphetamine andderivatives (28, 29, 38, 39).
A test using a preliminary version of our method wasperformed on 33 real samples from the ROSITA II project.Volunteer participants provided oral fluid samples. Theethics board was informed and had no objection to thestudy. In this test 95 positive whole blood results forspecific compounds had corresponding positive oral fluidresults, and only 4 positive whole blood results showednegative oral fluid results (1 clonazepam sample, 1 fluni-trazepam sample, and 2 THC samples). The flunitraz-epam sample had positive results for the metabolite7-aminoflunitrazepam in both whole blood and oral fluid.In addition, 24 oral fluid positive results had correspond-ing negative whole blood results. Closer inspection of the
data revealed that this discrepancy was largely attribut-able to a higher concentration and lower cutoff for oralfluid than whole blood. Chromatograms from a realsample are shown in Fig. 2. The measured concentrationranges in oral fluid (in �mol/L) were as follows: amphet-amine, 0.26–243 (n � 12); metamphetamine, 0.24–84 (n �8); MDMA, 0.15–13 (n � 5); MDA, 0.27–3.2 (n � 4);morphine, 0.040–11 (n � 12); codeine, 0.024–20 (n � 12);cocaine, 0.015–0.020 (n � 3); benzoylecgonine, 0.028 (n �1); methadone, 0.83–0.85 (n � 2); diazepam, 0.0040–0.080(n � 6); N-desmethyldiazepam, 0.010–0.15 (n � 4); 3-OH-diazepam, 0.010 (n � 1); oxazepam, 0.010 (n � 1); alpra-zolam, 0.010–0.20 (n � 5); zopiclone, 0.010–0.24 (n � 6);clonazepam, 0.0022–0.74 (n � 4); 7-aminoclonazepam,0.0080–1.1 (n � 4); flunitrazepam, 0.0040–1.6 (n � 5);
Fig. 2. Positive components from areal sample.Measured concentrations (in �mol/L): mor-phine, 0.4; amphetamine, 4.6; codeine,0.09; 6-MAM, 0.01; 7-aminoflunitrazepam,0.004; cocaine, 0.008 (below cutoff); alpra-zolam, 0.2; THC, 0.02.
Clinical Chemistry 53, No. 2, 2007 307
7-aminoflunitrazepam, 0.0010–0.61 (n � 6); nitrazepam,0.0030–0.012 (n � 4); and 7-aminonitrazepam, 0.0050–0.13 (n � 3). MDA was not routinely analyzed in blood,but 4 samples were positive in oral fluid (range, 0.27–3.2�mol/L).
Differentiation between heroin and legal prescriptionopiate use can be readily determined from oral fluidtesting because of high concentrations of the heroin me-tabolite 6-MAM in oral fluid (40 ). Because of the lowconcentrations of 6-MAM in whole blood, confirmationsare usually performed at our institution with urine spec-imens. Of the 11 6-MAM positive oral fluid samples in ourstudy, 8 were confirmed in urine. Measured values in oralfluid were 0.0099–0.91 �mol/L.
In conclusion, the presented method can be used toanalyze a large number of drugs of abuse, includinglow-dose benzodiazepines, with easy sample preparation,good sensitivity, and short run time, thus facilitatinghigh-throughput screening of road-side samples. If quan-tification of positive results is needed, samples should bereanalyzed with analytical conditions designated for thespecific drug or drug group, using 2 MRM-transitions.
We thank Inge Frydenlund, Oslo Police District, forcollection of oral fluid samples during the ROSITA projectand Åse Marit Leere Øiestad, Solfrid Hegstad, Jean-PaulBernard, and Jørg Mørland for advice and critical readingof the manuscript.
References1. Bennett GA, Davies E, Thomas P. Is oral fluid analysis as accurate
as urinalysis in detecting drug use in a treatment setting? DrugAlcohol Depend 2003;72:265–9.
2. Masterson LH. Oral fluid testing: six considerations. Occup HealthSaf 2003;72:78.
3. Verstraete AG. Oral fluid testing for driving under the influence ofdrugs: history, recent progress and remaining challenges. Foren-sic Sci Int 2005;150:143–50.
4. Yacoubian J, Cone EJ. A comparison between the Intercept OralFluid Collection Device(R) and urinalysis among Baltimore Cityprobationers. J Crim Justice 2006;34:413–24.
5. Drummer OH. Review: pharmacokinetics of illicit drugs in oralfluid. Forensic Sci Int 2005;150:133–42.
6. Barnes AJ, Kim I, Schepers R, Moolchan ET, Wilson L, Cooper G,et al. Sensitivity, specificity, and efficiency in detecting opiates inoral fluid with the Cozart Opiate Microplate EIA and GC-MSfollowing controlled codeine administration. J Anal Toxicol 2003;27:402–7.
7. Cooper G, Wilson L, Reid C, Main L, Hand C. Evaluation of theCozart RapiScan drug test system for opiates and cocaine in oralfluid. Forensic Sci Int 2005;150:239–43.
8. Ortelli D, Rudaz S, Chevalley AF, Mino A, Deglon JJ, Balant L, et al.Enantioselective analysis of methadone in saliva by liquid chro-matography-mass spectrometry. J Chromatogr A 2000;871:163–72.
9. Rohrig TP, Moore C. The determination of morphine in urine andoral fluid following ingestion of poppy seeds. J Anal Toxicol2003;27:449–52.
10. Concheiro M, de Castro A, Quintela O, Lopez-Rivadulla M, Cruz A.Determination of MDMA, MDA, MDEA and MBDB in oral fluid usinghigh performance liquid chromatography with native fluorescencedetection. Forensic Sci Int 2005;150:221–6.
11. Gentili S, Torresi A, Marsili R, Chiarotti M, Macchia T. Simulta-neous detection of amphetamine-like drugs with headspace solid-phase microextraction and gas chromatography-mass spectrome-try. J Chromatogr B Analyt Technol Biomed Life Sci 2002;780:183–92.
12. Kankaanpaa A, Gunnar T, Ariniemi K, Lillsunde P, Mykkanen S,Seppala T. Single-step procedure for gas chromatography-massspectrometry screening and quantitative determination of amphet-amine-type stimulants and related drugs in blood, serum, oralfluid and urine samples. J Chromatogr B Analyt Technol BiomedLife Sci 2004;810:57–68.
13. Cognard E, Bouchonnet S, Staub C. Validation of a gas chroma-tography–ion trap tandem mass spectrometry for simultaneousanalyse of cocaine and its metabolites in saliva. J Pharm BiomedAnal 2006;41:925–34.
14. Clauwaert K, Decaestecker T, Mortier K, Lambert W, Deforce D,Van Peteghem C, et al. The determination of cocaine, benzo-ylecgonine, and cocaethylene in small-volume oral fluid samplesby liquid chromatography-quadrupole-time-of-flight mass spec-trometry. J Anal Toxicol 2004;28:655–9.
15. Kolbrich EA, Kim I, Barnes AJ, Moolchan ET, Wilson L, Cooper GA,et al. Cozart RapiScan Oral Fluid Drug Testing System: an evalu-ation of sensitivity, specificity, and efficiency for cocaine detectioncompared with ELISA and GC-MS following controlled cocaineadministration. J Anal Toxicol 2003;27:407–11.
16. Concheiro M, de Castro A, Quintela O, Cruz A, Lopez-Rivadulla M.Development and validation of a method for the quantitation of�9tetrahydrocannabinol in oral fluid by liquid chromatographyelectrospray-mass-spectrometry. J Chromatogr B Analyt TechnolBiomed Life Sci 2004;810:319–24.
17. Laloup M, Ramirez Fernandez Mdel M, Wood M, De Boeck G,Henquet C, Maes V, et al. Quantitative analysis of �9-tetrahydro-cannabinol in preserved oral fluid by liquid chromatography-tandem mass spectrometry. J Chromatogr A 2005;1082:15–24.
18. Teixeira H, Proenca P, Verstraete A, Corte-Real F, Vieira DN.Analysis of �9-tetrahydrocannabinol in oral fluid samples usingsolid-phase extraction and high-performance liquid chromatogra-phy-electrospray ionization mass spectrometry. Forensic Sci Int2005;150:205–11.
19. Kintz P, Villain M, Concheiro M, Cirimele V. Screening andconfirmatory method for benzodiazepines and hypnotics in oralfluid by LC-MS/MS. Forensic Sci Int 2005;150:213–20.
20. Skurtveit S, Abotnes B, Christophersen AS. Drugged drivers inNorway with benzodiazepine detections. Forensic Sci Int 2002;125:75–82.
21. Kidwell DA, Holland JC, Athanaselis S. Testing for drugs of abusein saliva and sweat. J Chromatogr B Biomed Sci Appl 1998;713:111–35.
22. Quintela O, Cruz A, Castro A, Concheiro M, Lopez-Rivadulla M.Liquid chromatography-electrospray ionisation mass spectrometryfor the determination of nine selected benzodiazepines in humanplasma and oral fluid. J Chromatogr B Analyt Technol Biomed LifeSci 2005;825:63–71.
23. Samyn N, De Boeck G, Cirimele V, Verstraete A, Kintz P. Detectionof flunitrazepam and 7-aminoflunitrazepam in oral fluid aftercontrolled administration of rohypnol. J Anal Toxicol 2002;26:211–5.
24. Aps JK, Martens LC. Review: the physiology of saliva and transferof drugs into saliva. Forensic Sci Int 2005;150:119–31.
308 Øiestad et al.: Oral Fluid Screening by LC-MS/MS
25. Spiehler V. Drugs in saliva. In: Moffat AC, Osselton MD, Widdop B,eds. Clarke’s Analysis of Drugs and Poisons, 3rd ed. London:Pharmaceutical Press 2004:109–23.
26. Crouch DJ. Oral fluid collection: the neglected variable in oral fluidtesting. Forensic Sci Int 2005;150:165–73.
27. Mortier KA, Maudens KE, Lambert WE, Clauwaert KM, Van Bocx-laer JF, Deforce DL, et al. Simultaneous, quantitative determina-tion of opiates, amphetamines, cocaine and benzoylecgonine inoral fluid by liquid chromatography quadrupole-time-of-flight massspectrometry. J Chromatogr B Analyt Technol Biomed Life Sci2002;779:321–30.
28. Samyn N, van Haeren C. On-site testing of saliva and sweat withDrugwipe and determination of concentrations of drugs of abusein saliva, plasma and urine of suspected users. Int J Legal Med2000;113:150–4.
29. Toennes SW, Steinmeyer S, Maurer HJ, Moeller MR, Kauert GF.Screening for drugs of abuse in oral fluid: correlation of analysisresults with serum in forensic cases. J Anal Toxicol 2005;29:22–7.
30. Wood M, Laloup M, Ramirez Fernandez Mdel M, Jenkins KM,Young MS, Ramaekers JG, et al. Quantitative analysis of multipleillicit drugs in preserved oral fluid by solid-phase extraction andliquid chromatography-tandem mass spectrometry. Forensic SciInt 2005;150:227–38.
31. Yonamine M, Tawil N, Moreau RL, Silva OA. Solid-phase micro-extraction-gas chromatography-mass spectrometry and head-space-gas chromatography of tetrahydrocannabinol, amphetamine,methamphetamine, cocaine and ethanol in saliva samples. J Chro-matogr B Analyt Technol Biomed Life Sci 2003;789:73–8.
32. Gunnar T, Ariniemi K, Lillsunde P. Validated toxicological determi-nation of 30 drugs of abuse as optimized derivatives in oral fluid
by long column fast gas chromatography/electron impact massspectrometry. J Mass Spectrom 2005;40:739–53.
33. Maurer HH. Advances in analytical toxicology: the current role ofliquid chromatography-mass spectrometry in drug quantification inblood and oral fluid. Anal Bioanal Chem 2005;381:110–8.
34. Allen KR, Azad R, Field HP, Blake DK. Replacement of immuno-assay by LC tandem mass spectrometry for the routine measure-ment of drugs of abuse in oral fluid. Ann Clin Biochem 2005;42:277–84.
35. Wylie FM, Torrance H, Anderson RA, Oliver JS. Drugs in oral fluid:part I: validation of an analytical procedure for licit and illicit drugsin oral fluid. Forensic Sci Int 2005;150:191–8.
36. Matuszewski BK, Constanzer ML, Chavez-Eng CM. Strategies forthe assessment of matrix effect in quantitative bioanalyticalmethods based on HPLC-MS/MS. Anal Chem 2003;75:3019–30.
37. Kim I, Barnes AJ, Oyler JM, Schepers R, Joseph RE Jr, Cone EJ,et al. Plasma and oral fluid pharmacokinetics and pharmacody-namics after oral codeine administration. Clin Chem 2002;48:1486–96.
38. Toennes SW, Kauert GF, Steinmeyer S, Moeller MR. Driving underthe influence of drugs: evaluation of analytical data of drugs in oralfluid, serum and urine, and correlation with impairment symp-toms. Forensic Sci Int 2005;152:149–55.
39. Samyn N, De Boeck G, Verstraete AG. The use of oral fluid andsweat wipes for the detection of drugs of abuse in drivers.J Forensic Sci 2002;47:1380–7.
40. Presley L, Lehrer M, Seiter W, Hahn D, Rowland B, Smith M, et al.High prevalence of 6-acetylmorphine in morphine-positive oralfluid specimens. Forensic Sci Int 2003;133:22–5.
Clinical Chemistry 53, No. 2, 2007 309
Accuracy and Biological Variation of HumanSerum Paraoxonase 1 Activity and Polymorphism
(Q192R) by Kinetic Enzyme AssayRichard W. Browne,1* Stephen T. Koury,1 Susan Marion,1 Gregory Wilding,3
Paola Muti,4 and Maurizio Trevisan2
Background: Paraoxonase 1 (PON1) phenotype is a bet-ter predictor of atherosclerosis risk than are PON1genetic polymorphisms alone. Larger studies are re-quired to determine the role of PON1 and there is a needfor standardized PON1 assays between laboratories.Methods: We have adapted 5 enzyme kinetic assays forhigh-throughput automated analysis of PON1 activity.Using different substrates and reaction conditions, wemeasured PON1 activity and used activity ratios toidentify the PON1 Q192R genetic polymorphisms andassessed the accuracy of the genotype assignments in 79adult study participants by comparing them with geno-types determined by AlwI restriction enzyme digestionof a 176-bp PCR amplification product from genomicDNA. Imprecision was determined using pooled serumand purified enzyme preparations. Biological variabilitywas estimated by analysis of serial samples from 17individuals. Variability parameters were compared withtotal cholesterol as a point of reference to a recognizedbiomarker of coronary heart disease risk.Results: Salt stimulation and inhibition ratios were97.4% and 94.7% correct in assigning Q192R genotype,respectively. Analytical imprecision (CV) was 1.0%–3.0% for phenylacetate and paraoxon substrate assaysand 3.0%–8.0% for the para-nitrophenylacetate substrateassays. Combination of the 2 ratios into a double ratioresulted in 100% correct genotype classification.
Conclusion: The described methods for measurement ofPON1 activity and accurate genotype assignment arerapid and have potential to facilitate the efficient inves-tigation of PON1 status in clinical and epidemiologicalstudies.© 2007 American Association for Clinical Chemistry
Human serum paraoxonase 1 (PON1; EC 3.1.1.2)4 plays adual physiological role (1 ). PON1 was first studied inrelation to its ability to metabolize organophosphate pes-ticides such as paraoxon. More recently, investigationshave focused on the role of PON1 in the cardioprotectiveeffects of HDL. HDL protects LDL from atherogenic,oxidative modification when LDL is incubated underoxidizing conditions in vitro (2 ). This effect is primarilyattributed to PON1, which is exclusively associated withHDL (3, 4) and has been shown to hydrolyze specificoxidized lipids in LDL (5, 6).
PON1 has 2 exonic amino acid polymorphisms, 1 atposition 192 [a glutamine (Q)/arginine (R) substitution],and 1 at position 55 [a methionine (M)/leucine (L) sub-stitution] (7 ). The PON1-Q192R polymorphism has beenthe more extensively studied and has been shown to affectthe activity of PON1 alloenzymes with respect to bothorganophosphate detoxification (8 ) and lipoprotein oxi-dation (5 ).
Departments of 1 Biotechnical and Clinical Laboratory Sciences, 2 Socialand Preventive Medicine, and 3 Biostatistics, State University of New York atBuffalo, Buffalo, NY.
4 Department of Epidemiology, Italian National Cancer Institute “ReginaElena”, Rome, Italy.
* Address correspondence to this author at: Department of Biotechnicaland Clinical Laboratory Sciences, State University of New York at Buffalo, 26Cary Hall, 3435 Main Street, Buffalo, NY 14214. Fax 716-829-3601; [email protected].
Received June 7, 2006; accepted November 20, 2006.Previously published online at DOI: 10.1373/clinchem.2006.074559
4 Nonstandard abbreviations: PON1, human serum paraoxonase 1; PA,phenylacetate; CHD, coronary heart disease; SALT, salt-stimulated paraxonaseactivity; IA, phenylacetate-inhibited arylesterase activity; IAO, estimate ofinfluence of nonspecific arylesterase activity of other carboxylic ester hydro-lases; NIA, noninhibited arylesterase activity; PON 4SI ratio, PON salt-stimulation/similar-substrate inhibition, or (SALT/PA)/[(IA-IAO)/NIA];PXON, the activity of PON to hydrolyze paraoxon in the absence of 1 mol/LNaCl; SS, total sum of squares; I, index of individuality; SA
2, analyticalvariance; SI
2, intraindividual variance; SG2, interindividual or group variance;
%SA2, estimated percentage of variance attributable to analytical variation.
Clinical Chemistry 53:2310–317 (2007) Automation and
Analytical Techniques
310
The PON1-Q192R (paraoxonase 1)5 genotype has beenpositively associated with coronary heart disease (CHD)in several case-control studies (9–16), but not in all(17–20), although a recent metaanalysis (21 ) indicates anincreased frequency of the PON 192 R allele in CHD andthat the R allele is associated with an increased risk ofCHD. The discrepancy among studies is likely due to thehigh level of variation of gene expression coupled withthe fact that the PON Q192R polymorphism is functional;meaning it affects PON1 activity. In this light, determina-tion of PON1 activity in addition to genotype (referred toas PON1 status) has been advocated to be more importantthan PON1 genotype alone (21, 22). Larger, preferablyprospective, studies are required to determine the rela-tionship between PON1 status and CHD, and these stud-ies will require high-throughput methods capable ofmeasuring PON1 status.
PON1 phenotype can be determined by kinetic enzymeassays. The identification of PON1 phenotypes by theirresponse to 1 mol/L NaCl (23 ) was refined into theparaoxonase:arylesterase ratio (24 ). A further modifica-tion of the salt-stimulation technique combined the salt-stimulation technique with the differential inhibition ofthe phenylacetate (PA) hydrolysis by 0.1 mmol/L chlor-promazine (25 ). Haagan and Brock (26 ) described theinhibited arylesterase:noninhibited arylesterase ratio, andMueller (27 ) described an assay for PON1 phenotype thatused the inhibitory effect of EDTA on paraoxonase activ-ity (28 ). Paraoxon and diazoxon have been used assubstrates with adaptation to a microtiter plate system(28 ). A semiautomated, microtiter plate-based assay hasbeen described (29 ). These assays are not 100% accurate inassigning genotype and may not be amenable to high-throughput automation. The activity ratios used in thesestudies overlap, especially between QR and RR genotypesat low enzyme activity, and may introduce misclassifica-tion into population-based studies. In the present study,we have automated 5 assays of PON1 activity, used themto assign PON1 phenotype based on activity ratios, andcompared these results with PCR–based genotyping.
Materials and Methodspatients and specimensAs part of continuing, population based, case-controlstudies investigating oxidative stress and different dis-eases in men and women in western New York, wecollected extra blood for ancillary methodological studies(in addition to main study requirements) from 67 healthycontrol individuals. Driver’s license bureau rolls wereused as the sampling frame from which control partici-pants were randomly selected from the population of Erieand Niagara counties in western New York. The methodaccuracy component consisted of genomic DNA andblood serum stored at �80 °C. Twelve additional samples
obtained from faculty and staff volunteers were used tooptimize analytical conditions and generate QC speci-mens. An additional sample set, designed for the estima-tion of biological variation, consisted of serial samplesfrom 17 volunteers (7 men and 10 women) obtained at 0,1, and 4 weeks. All study specimens (79 total) werecollected, processed, and stored with standardized proce-dures that we have described previously (30 ). The exper-imental protocols were approved by the InstitutionalReview Board at the University of Buffalo and informed,written consent was obtained from all participants.
pcr genotypingRecombinant Taq DNA polymerase, forward and reversecustom oligonucleotide primers, and dNTPs were pur-chased from Invitrogen, Inc. Restriction endonucleaseAlwI was purchased from New England Biolabs. Primersfor amplification of a 176-bp sequence coding for position192 of human PON1 were: 5�-GGG ACC TGA GCA CTTTTA TGG C-3� and 5�-CAT CGG GTG AAA TGT TGATTC C-3�. PCR product from each sample was restrictiondigested with AlwI for 2 h at 37 °C. The AlwI recognitionsite is not present in the PON1 192 A allele but is presentin the B allele (7 ). One of 3 restriction fragment lengthpolymorphism genotype patterns was possible: QQ176-bp fragment, RR 118-bp and 58-bp fragments, and QR176-bp, 118-bp, and 58-bp fragments.
kinetic enzyme assaysInstrumentation included the Cobas Fara II automatedchemistry analyzers (Roche Diagnostic Systems Inc.), anda Model 160U ultraviolet-visible recording spectropho-tometer (Shimadzu Corporation). Unless otherwise indi-cated all reagents were obtained from Sigma ChemicalCompany. Diethyl p-nitrophenyl phosphate (paraoxon),98.0%, was obtained from Chem Service. For all assayswater blanks were used to correct for nonenzymatichydrolysis.
paraoxonase activity and salt-stimulatedparaoxonase activityThe rate of formation of p-nitrophenol was measured onthe Cobas Fara II analyzer using 1 mmol/L paraoxon in50 mmol/L glycine buffer, pH 10.5, with 1.0 mmol/LCaCl2, with or without 1 mol/L NaCl. The reaction wasinitiated by 20 �L diluted sample (1:20 in 25 mmol/Ltriethanolamine-hydrochlorine, pH 7.4, 1.0 mmol/LCaCl2) to 360 �L working reagent. The rate of p-nitrophe-nol formation was measured at 405 nm over 200 s with a25 s lag time. The activity was expressed as U/L based onthe molar absorptivity (18 290) of p-nitrophenol at 405nm, at pH 10.5. Paraoxon is a neurotoxic substance andsafety measures included use of dedicated sample andreagent needles and treatment of the on-board waste-water receptacle with concentrated sodium hydroxide.5 Human gene: PON1, paraoxonase 1.
Clinical Chemistry 53, No. 2, 2007 311
arylesterase activity with phenyl acetate assubstrateThe working reagent consisted of 20 mmol/L Tris-HCl,1 mmol/L PA, pH 8.0, with 1.0 mmol/L CaCl2. Thereaction was initiated by 20 �L of diluted sample (1:3in TRIS) to 3.0 mL of the working reagent at 25 °C.The change in absorbance at 270 nm was recorded for60 s after a 20 s lag time on the 160-U spectrophotometer.The activity, expressed as kU/L, was based on themolar absorptivity (1310) of phenol at 270 nm, at pH 8.0(24 ). For automated assay on the Cobas Fara, serumsamples were automatically diluted 1:4 in TRIS bufferand the enzymatic reaction was initiated by addition of5 �L of diluted sample to 0.3 mL of the working re-agent at 25 °C. The activity, expressed as kU/L, wasbased on the molar absorptivity (188) of phenol at285 nm, at pH 8.0 and determined on the 160U spec-trophotometer.
arylesterase activity with p-nitrophenylacetate as substrate and inhibition of p-nitrophenylacetate hydrolysis by phenylacetateThe working reagent consisted of 25 mmol/L triethanol-amine-hydrochlorine buffer, pH 7.4, with 1.0 mmol/LCaCl2 with or without 1 mmol/L phenyl acetate. The startreagent consisted of 2.5 mmol/L p-nitrophenyl acetate inwater. The reaction was initiated by addition of 20 �Ldiluted sample (1:20 in triethanolamine-hydrochlorinebuffer) to 288 �L working reagent followed by 72 �L ofstart reagent. The rate of formation of p-nitrophenol wasdetermined at 405 nm at 25 °C over 225 s after a 100 s lagtime. The activity, expressed in kU/L, was based on themolar absorptivity (14 000) of p-nitrophenol at 405 nm, atpH 7.4 (24 ).
enzyme activity ratiosTo differentiate between PON1 phenotypes we calcu-lated activity ratios (24, 26). The salt-stimulation ratio(SALT/PA) was defined as the salt-stimulated para-oxonase activity (SALT) over arylesterase activity, withPA as substrate (24 ). The inhibition ratio [(IA-IAO)/NIA]was defined as the PA-inhibited arylesterase activity(IA) with p-nitrophenyl acetate as substrate minusthe estimate of influence of nonspecific arylesteraseactivity of other carboxylic ester hydrolases (IAO) di-vided by the noninhibited arylesterase activity (NIA)with p-nitrophenylacetate alone as substrate (26 ). Fi-nally, a double ratio, dubbed the PON salt-stimulation/similar-substrate inhibition (PON 4SI) ratio, was de-fined as (SALT/PA)/[(IA-IAO)/NIA]. The activity ofPON to hydrolyze paraoxon in the absence of 1 mol/LNaCl (PXON) was not used in the calculation of ratiosbut was measured nonetheless as a further indicator ofPON1 activity.
partial purification of pon 1 from humanserumPON1Q and PON1R alloenzymes were partially purifiedfrom 200 mL of pooled human serum according to themethods described by Gan et al. (32 ). The final DEAEanion exchange fractions were screened for total proteinand arylesterase activity and the highest specific activityfractions were used as a QC material.
total cholesterol measurementTotal serum cholesterol was determined by cholesteroloxidase methodology with reagents, calibrators, and con-trols from Wako Diagnostics, Inc.
method performance characteristicsQC materials consisted of 3 human serum pools (QQ, QR,and RR) and 2 preparations (QQ and RR) of partiallypurified PON1. Within-run imprecision was calculated on20 replicates of each material. Between-run imprecisionwas estimated by analysis of 5 replicates per day on 5consecutive days. Imprecision was expressed as the CVand the percentage of total sum of squares (SS) attributedto each component, where within-run SS � between-runSS � Total SS. Correlation among PON1 activity assayswas calculated by Pearson regression. Agreement be-tween manual and automated arylesterase activity mea-surements was calculated as the interclass correlationcoefficient.
method accuracyPCR/AlwI genotype analysis was use as the standard tocompare the efficiency [correctly classified phenotypes/(correctly classified phenotypes � incorrectly classifiedphenotypes)] of activity ratios to classify QQ homozy-gotes vs QR heterozygotes and for QR heterozygotes vsRR homozygotes. Cutoff points for classifying genotypeby activity ratio(s) were determined by plotting the dis-tribution of ratio values for each genotype and identifyingthe point of overlap between adjacent distributions.
biological variabilityTo describe the observed variability we used an uncondi-tional hierarchical nested random effects model. Themodel assumes the total variance in the population isrepresented by �T
2 � �G2 � �I
2 � �A2, and variance
within an individual is represented by �A�I2 � �I
2 � �A2,
where the subscript G � among group, I � withinindividual, and A� analytical or within replicate. IA andNIA were log transformed to meet statistical assumptions.Estimates of the variance obtained from the fitted model(SG
2, SI2 and SA
2) and the percentage each componentrepresents in terms of the total were computed, as werethe CVs (CVG, CVI and CVA). The index of individuality(I) was defined as I � SA�I/SG, where SA�I � (SA
2 �SI
2)1/2. To determine the number of measurements (k)needed to be taken on an individual so that I was at leastas small as the cholesterol index of individuality, IChol, we
312 Browne et al.: Automated Determination of PON1 Status
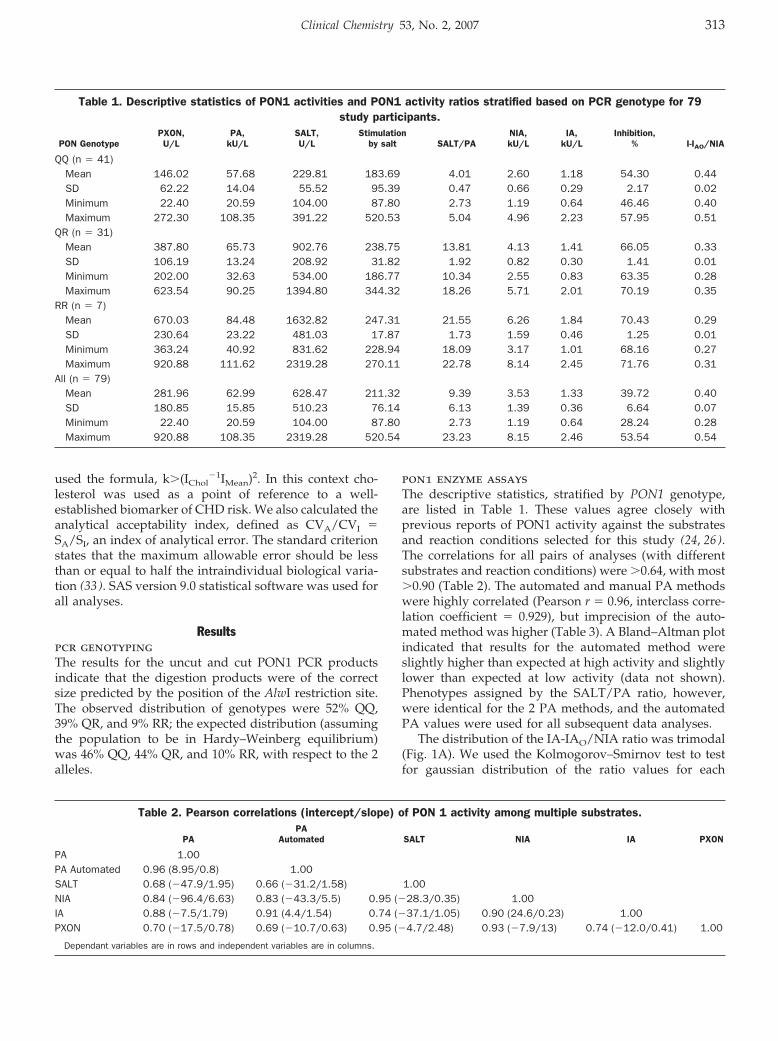
used the formula, k�(IChol�1IMean)2. In this context cho-
lesterol was used as a point of reference to a well-established biomarker of CHD risk. We also calculated theanalytical acceptability index, defined as CVA/CVI �SA/SI, an index of analytical error. The standard criterionstates that the maximum allowable error should be lessthan or equal to half the intraindividual biological varia-tion (33 ). SAS version 9.0 statistical software was used forall analyses.
Resultspcr genotypingThe results for the uncut and cut PON1 PCR productsindicate that the digestion products were of the correctsize predicted by the position of the AlwI restriction site.The observed distribution of genotypes were 52% QQ,39% QR, and 9% RR; the expected distribution (assumingthe population to be in Hardy–Weinberg equilibrium)was 46% QQ, 44% QR, and 10% RR, with respect to the 2alleles.
pon1 enzyme assaysThe descriptive statistics, stratified by PON1 genotype,are listed in Table 1. These values agree closely withprevious reports of PON1 activity against the substratesand reaction conditions selected for this study (24, 26).The correlations for all pairs of analyses (with differentsubstrates and reaction conditions) were �0.64, with most�0.90 (Table 2). The automated and manual PA methodswere highly correlated (Pearson r � 0.96, interclass corre-lation coefficient � 0.929), but imprecision of the auto-mated method was higher (Table 3). A Bland–Altman plotindicated that results for the automated method wereslightly higher than expected at high activity and slightlylower than expected at low activity (data not shown).Phenotypes assigned by the SALT/PA ratio, however,were identical for the 2 PA methods, and the automatedPA values were used for all subsequent data analyses.
The distribution of the IA-IAO/NIA ratio was trimodal(Fig. 1A). We used the Kolmogorov–Smirnov test to testfor gaussian distribution of the ratio values for each
Table 1. Descriptive statistics of PON1 activities and PON1 activity ratios stratified based on PCR genotype for 79study participants.
PON GenotypePXON,U/L
PA,kU/L
SALT,U/L
Stimulationby salt SALT/PA
NIA,kU/L
IA,kU/L
Inhibition,% I-IAO/NIA
QQ (n � 41)Mean 146.02 57.68 229.81 183.69 4.01 2.60 1.18 54.30 0.44SD 62.22 14.04 55.52 95.39 0.47 0.66 0.29 2.17 0.02Minimum 22.40 20.59 104.00 87.80 2.73 1.19 0.64 46.46 0.40Maximum 272.30 108.35 391.22 520.53 5.04 4.96 2.23 57.95 0.51
QR (n � 31)Mean 387.80 65.73 902.76 238.75 13.81 4.13 1.41 66.05 0.33SD 106.19 13.24 208.92 31.82 1.92 0.82 0.30 1.41 0.01Minimum 202.00 32.63 534.00 186.77 10.34 2.55 0.83 63.35 0.28Maximum 623.54 90.25 1394.80 344.32 18.26 5.71 2.01 70.19 0.35
RR (n � 7)Mean 670.03 84.48 1632.82 247.31 21.55 6.26 1.84 70.43 0.29SD 230.64 23.22 481.03 17.87 1.73 1.59 0.46 1.25 0.01Minimum 363.24 40.92 831.62 228.94 18.09 3.17 1.01 68.16 0.27Maximum 920.88 111.62 2319.28 270.11 22.78 8.14 2.45 71.76 0.31
All (n � 79)Mean 281.96 62.99 628.47 211.32 9.39 3.53 1.33 39.72 0.40SD 180.85 15.85 510.23 76.14 6.13 1.39 0.36 6.64 0.07Minimum 22.40 20.59 104.00 87.80 2.73 1.19 0.64 28.24 0.28Maximum 920.88 108.35 2319.28 520.54 23.23 8.15 2.46 53.54 0.54
Table 2. Pearson correlations (intercept/slope) of PON 1 activity among multiple substrates.
PAPA
Automated SALT NIA IA PXON
PA 1.00PA Automated 0.96 (8.95/0.8) 1.00SALT 0.68 (�47.9/1.95) 0.66 (�31.2/1.58) 1.00NIA 0.84 (�96.4/6.63) 0.83 (�43.3/5.5) 0.95 (�28.3/0.35) 1.00IA 0.88 (�7.5/1.79) 0.91 (4.4/1.54) 0.74 (�37.1/1.05) 0.90 (24.6/0.23) 1.00PXON 0.70 (�17.5/0.78) 0.69 (�10.7/0.63) 0.95 (�4.7/2.48) 0.93 (�7.9/13) 0.74 (�12.0/0.41) 1.00
Dependant variables are in rows and independent variables are in columns.
Clinical Chemistry 53, No. 2, 2007 313
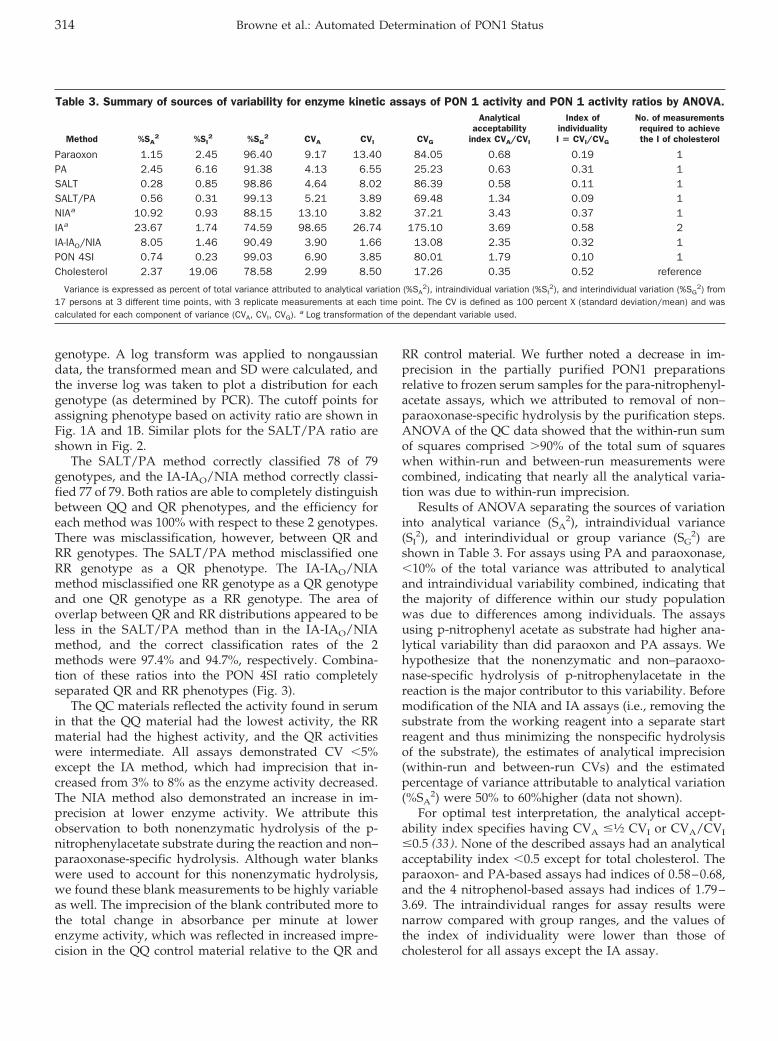
genotype. A log transform was applied to nongaussiandata, the transformed mean and SD were calculated, andthe inverse log was taken to plot a distribution for eachgenotype (as determined by PCR). The cutoff points forassigning phenotype based on activity ratio are shown inFig. 1A and 1B. Similar plots for the SALT/PA ratio areshown in Fig. 2.
The SALT/PA method correctly classified 78 of 79genotypes, and the IA-IAO/NIA method correctly classi-fied 77 of 79. Both ratios are able to completely distinguishbetween QQ and QR phenotypes, and the efficiency foreach method was 100% with respect to these 2 genotypes.There was misclassification, however, between QR andRR genotypes. The SALT/PA method misclassified oneRR genotype as a QR phenotype. The IA-IAO/NIAmethod misclassified one RR genotype as a QR genotypeand one QR genotype as a RR genotype. The area ofoverlap between QR and RR distributions appeared to beless in the SALT/PA method than in the IA-IAO/NIAmethod, and the correct classification rates of the 2methods were 97.4% and 94.7%, respectively. Combina-tion of these ratios into the PON 4SI ratio completelyseparated QR and RR phenotypes (Fig. 3).
The QC materials reflected the activity found in serumin that the QQ material had the lowest activity, the RRmaterial had the highest activity, and the QR activitieswere intermediate. All assays demonstrated CV �5%except the IA method, which had imprecision that in-creased from 3% to 8% as the enzyme activity decreased.The NIA method also demonstrated an increase in im-precision at lower enzyme activity. We attribute thisobservation to both nonenzymatic hydrolysis of the p-nitrophenylacetate substrate during the reaction and non–paraoxonase-specific hydrolysis. Although water blankswere used to account for this nonenzymatic hydrolysis,we found these blank measurements to be highly variableas well. The imprecision of the blank contributed more tothe total change in absorbance per minute at lowerenzyme activity, which was reflected in increased impre-cision in the QQ control material relative to the QR and
RR control material. We further noted a decrease in im-precision in the partially purified PON1 preparationsrelative to frozen serum samples for the para-nitrophenyl-acetate assays, which we attributed to removal of non–paraoxonase-specific hydrolysis by the purification steps.ANOVA of the QC data showed that the within-run sumof squares comprised �90% of the total sum of squareswhen within-run and between-run measurements werecombined, indicating that nearly all the analytical varia-tion was due to within-run imprecision.
Results of ANOVA separating the sources of variationinto analytical variance (SA
2), intraindividual variance(SI
2), and interindividual or group variance (SG2) are
shown in Table 3. For assays using PA and paraoxonase,�10% of the total variance was attributed to analyticaland intraindividual variability combined, indicating thatthe majority of difference within our study populationwas due to differences among individuals. The assaysusing p-nitrophenyl acetate as substrate had higher ana-lytical variability than did paraoxon and PA assays. Wehypothesize that the nonenzymatic and non–paraoxo-nase-specific hydrolysis of p-nitrophenylacetate in thereaction is the major contributor to this variability. Beforemodification of the NIA and IA assays (i.e., removing thesubstrate from the working reagent into a separate startreagent and thus minimizing the nonspecific hydrolysisof the substrate), the estimates of analytical imprecision(within-run and between-run CVs) and the estimatedpercentage of variance attributable to analytical variation(%SA
2) were 50% to 60%higher (data not shown).For optimal test interpretation, the analytical accept-
ability index specifies having CVA �1⁄2 CVI or CVA/CVI
�0.5 (33 ). None of the described assays had an analyticalacceptability index �0.5 except for total cholesterol. Theparaoxon- and PA-based assays had indices of 0.58–0.68,and the 4 nitrophenol-based assays had indices of 1.79–3.69. The intraindividual ranges for assay results werenarrow compared with group ranges, and the values ofthe index of individuality were lower than those ofcholesterol for all assays except the IA assay.
Table 3. Summary of sources of variability for enzyme kinetic assays of PON 1 activity and PON 1 activity ratios by ANOVA.
Method %SA2 %SI
2 %SG2 CVA CVI CVG
Analyticalacceptability
index CVA/CVI
Index ofindividualityI � CVI/CVG
No. of measurementsrequired to achievethe I of cholesterol
Paraoxon 1.15 2.45 96.40 9.17 13.40 84.05 0.68 0.19 1PA 2.45 6.16 91.38 4.13 6.55 25.23 0.63 0.31 1SALT 0.28 0.85 98.86 4.64 8.02 86.39 0.58 0.11 1SALT/PA 0.56 0.31 99.13 5.21 3.89 69.48 1.34 0.09 1NIAa 10.92 0.93 88.15 13.10 3.82 37.21 3.43 0.37 1IAa 23.67 1.74 74.59 98.65 26.74 175.10 3.69 0.58 2IA-IAO/NIA 8.05 1.46 90.49 3.90 1.66 13.08 2.35 0.32 1PON 4SI 0.74 0.23 99.03 6.90 3.85 80.01 1.79 0.10 1Cholesterol 2.37 19.06 78.58 2.99 8.50 17.26 0.35 0.52 reference
Variance is expressed as percent of total variance attributed to analytical variation (%SA2), intraindividual variation (%SI
2), and interindividual variation (%SG2) from
17 persons at 3 different time points, with 3 replicate measurements at each time point. The CV is defined as 100 percent X (standard deviation/mean) and wascalculated for each component of variance (CVA, CVI, CVG). a Log transformation of the dependant variable used.
314 Browne et al.: Automated Determination of PON1 Status
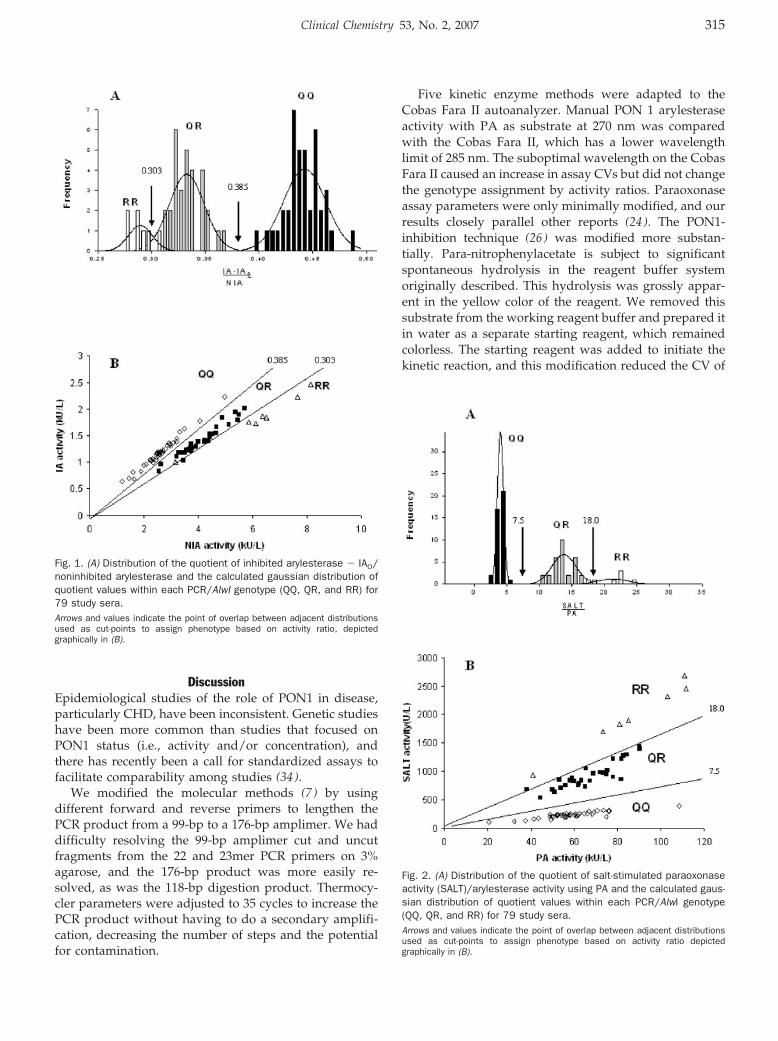
DiscussionEpidemiological studies of the role of PON1 in disease,particularly CHD, have been inconsistent. Genetic studieshave been more common than studies that focused onPON1 status (i.e., activity and/or concentration), andthere has recently been a call for standardized assays tofacilitate comparability among studies (34 ).
We modified the molecular methods (7 ) by usingdifferent forward and reverse primers to lengthen thePCR product from a 99-bp to a 176-bp amplimer. We haddifficulty resolving the 99-bp amplimer cut and uncutfragments from the 22 and 23mer PCR primers on 3%agarose, and the 176-bp product was more easily re-solved, as was the 118-bp digestion product. Thermocy-cler parameters were adjusted to 35 cycles to increase thePCR product without having to do a secondary amplifi-cation, decreasing the number of steps and the potentialfor contamination.
Five kinetic enzyme methods were adapted to theCobas Fara II autoanalyzer. Manual PON 1 arylesteraseactivity with PA as substrate at 270 nm was comparedwith the Cobas Fara II, which has a lower wavelengthlimit of 285 nm. The suboptimal wavelength on the CobasFara II caused an increase in assay CVs but did not changethe genotype assignment by activity ratios. Paraoxonaseassay parameters were only minimally modified, and ourresults closely parallel other reports (24 ). The PON1-inhibition technique (26 ) was modified more substan-tially. Para-nitrophenylacetate is subject to significantspontaneous hydrolysis in the reagent buffer systemoriginally described. This hydrolysis was grossly appar-ent in the yellow color of the reagent. We removed thissubstrate from the working reagent buffer and prepared itin water as a separate starting reagent, which remainedcolorless. The starting reagent was added to initiate thekinetic reaction, and this modification reduced the CV of
Fig. 1. (A) Distribution of the quotient of inhibited arylesterase � IAO/noninhibited arylesterase and the calculated gaussian distribution ofquotient values within each PCR/AlwI genotype (QQ, QR, and RR) for79 study sera.Arrows and values indicate the point of overlap between adjacent distributionsused as cut-points to assign phenotype based on activity ratio, depictedgraphically in (B).
Fig. 2. (A) Distribution of the quotient of salt-stimulated paraoxonaseactivity (SALT)/arylesterase activity using PA and the calculated gaus-sian distribution of quotient values within each PCR/AlwI genotype(QQ, QR, and RR) for 79 study sera.Arrows and values indicate the point of overlap between adjacent distributionsused as cut-points to assign phenotype based on activity ratio depictedgraphically in (B).
Clinical Chemistry 53, No. 2, 2007 315
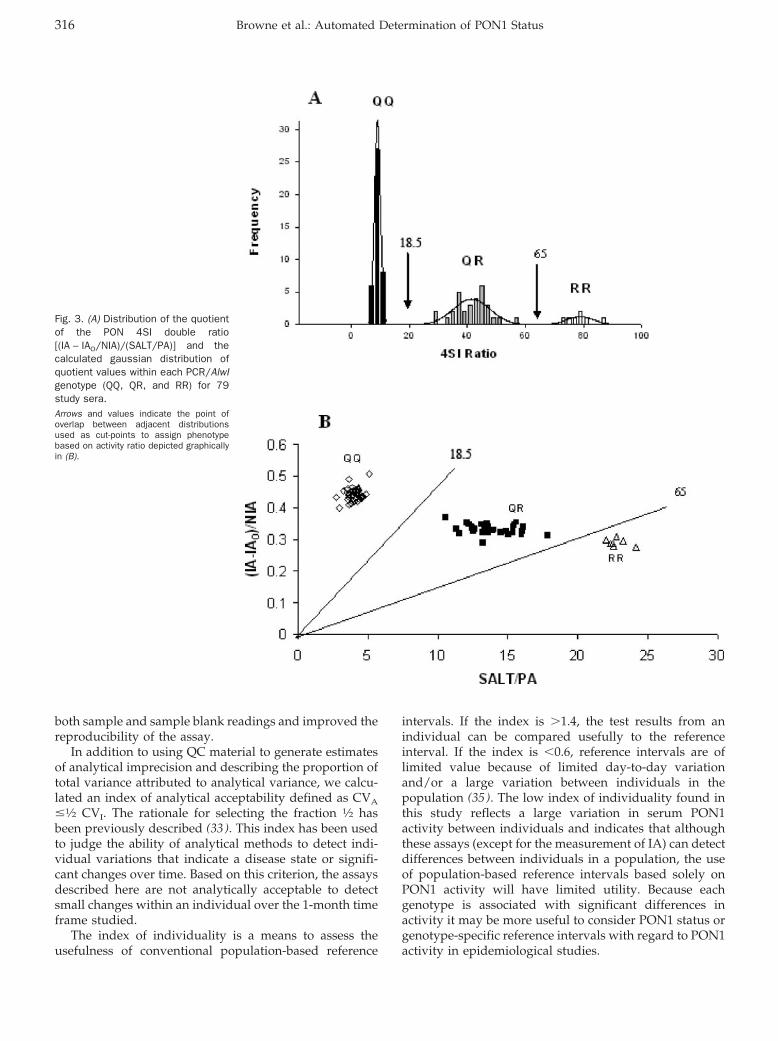
both sample and sample blank readings and improved thereproducibility of the assay.
In addition to using QC material to generate estimatesof analytical imprecision and describing the proportion oftotal variance attributed to analytical variance, we calcu-lated an index of analytical acceptability defined as CVA
�1⁄2 CVI. The rationale for selecting the fraction 1⁄2 hasbeen previously described (33 ). This index has been usedto judge the ability of analytical methods to detect indi-vidual variations that indicate a disease state or signifi-cant changes over time. Based on this criterion, the assaysdescribed here are not analytically acceptable to detectsmall changes within an individual over the 1-month timeframe studied.
The index of individuality is a means to assess theusefulness of conventional population-based reference
intervals. If the index is �1.4, the test results from anindividual can be compared usefully to the referenceinterval. If the index is �0.6, reference intervals are oflimited value because of limited day-to-day variationand/or a large variation between individuals in thepopulation (35 ). The low index of individuality found inthis study reflects a large variation in serum PON1activity between individuals and indicates that althoughthese assays (except for the measurement of IA) can detectdifferences between individuals in a population, the useof population-based reference intervals based solely onPON1 activity will have limited utility. Because eachgenotype is associated with significant differences inactivity it may be more useful to consider PON1 status orgenotype-specific reference intervals with regard to PON1activity in epidemiological studies.
Fig. 3. (A) Distribution of the quotientof the PON 4SI double ratio[(IA – IAO/NIA)/(SALT/PA)] and thecalculated gaussian distribution ofquotient values within each PCR/AlwIgenotype (QQ, QR, and RR) for 79study sera.Arrows and values indicate the point ofoverlap between adjacent distributionsused as cut-points to assign phenotypebased on activity ratio depicted graphicallyin (B).
316 Browne et al.: Automated Determination of PON1 Status
This work was supported in part by an Individual Na-tional Research Service Award F2 HL10215-02 from theNational Heart, Lung, and Blood Institute.
References1. Costa LG, Vitalone A, Cole TB. Furlong CE. Modulation of paraoxo-
nase (PON1) activity. Biochem Pharmacol 2005;69:541–50.2. Mackness MI, Abbott C, Arrol S, Durrington PN. The role of high
density lipoprotein and lipid-soluble antioxidant vitamins in inhib-iting low-density lipoprotein oxidation. Biochem J 1993;294:829–34.
3. Mackness B, Durrington PN, Mackness MI. Polymorphisms ofparaoxonase genes and low-density lipoprotein lipid peroxidation.Lancet 1999;353:468–9.
4. Mackness B, Mackness MI, Arrol S, Turkie W, Durrington PN.Effect of the human serum paraoxonase 55 and 192 geneticpolymorphisms on the protection by high density lipoproteinagainst low density lipoprotein oxidative modification. FEBS Let-ters 1998;423:57–60.
5. Watson AD, Berliner JA, Hama SY, La Du BN, Faull KF, FogelmanAM, et al. Protective effect of high density lipoprotein associatedparaoxonase: inhibition of the biological activity of minimallyoxidized low density lipoprotein. J Clin Invest 1995;96:2882–91.
6. Aviram M, Rosenblat M, Bisgaier CL, Newton RS, Primo-Parmo SL,La Du BN. Paraoxonase inhibits high density lipoprotein (HDL)oxidation and preserves its functions: a possible peroxidative rolefor paraoxonase. J Clin Invest 1998;101:1581–90.
7. Humbert R, Adler DA, Disteche CM, Hassett C, Omiecinski CJ,Furlong CE. The molecular basis of the human serum paraoxonaseactivity polymorphism. Nat Genet 1993;3:73–6.
8. Davies HG, Richter RJ, Keifer M, Broomfield CA, Sowalla J, FurlongCE. The effect of the human serum paraoxonase polymorphism isreversed with diazoxon, soman and sarin. Nat Genet 1996;14:334–6.
9. Serrato M, Marian AJ. A variant human paraoxonase/arylesterase(HUMPONA) gene is a risk factor for coronary artery disease. J ClinInvest 1995;96:3005–8.
10. Sanghera DK, Saha N, Aston CE, Kamboh MI. Genetic polymor-phism of paraoxonase and the risk of coronary heart disease.Arterioscler Thromb Vasc Biol 1997;17:1067–73.
11. Sanghera DK, Aston CE, Saha N, Kamboh MI. DNA polymorphismsin two paraoxonase genes (PON1 and PON2) are associated withthe risk of coronary heart disease. Am J Hum Genet 1998;62:36–44.
12. Zama T, Murata M, Matsubara Y, Kawano K, Aoki N, Yoshino H,et al. A 192Arg variant of the human paraoxonase (HUMPONA)gene polymorphism is associated with an increased risk forcoronary artery disease in the Japanese. Arterioscler Thromb VascBiol 1997;17:3565–9.
13. Pfohl M, Koch M, Enderle MD, Kuhn R, Fullhase J, Karsch KR, etal. Paraoxonase. Gln/Arg gene polymorphism, coronary arterydisease, and myocardial infarction in type 2 diabetes. Diabetes1999;192:48:623–7.
14. Pati N, Pati U. Paraoxonase gene polymorphism and coronaryartery disease in Indian subjects. Int J Cardiol 1998;66:165–8.
15. Ruiz J, Blanche H, James RW, Blatter-Garin MC, Vaisse C,Charpentier G, et al. Gln-Arg192 polymorphism of paraoxonaseand coronary heart disease in type 2 diabetes. Lancet 1995;346:869–72.
16. Odawara M, Tachi Y, Yamashita K. Paraoxonase polymorphism(Gln192-Arg) is associated with coronary heart disease in Japa-nese non-insulin-dependent diabetes mellitus. J Clin EndocrinolMetab 1997;82:2257–60.
17. Antikainen M, Murtomaki S, Syvanne M, Pahlman R, Tahh-vanainen E, Jauhiainen M, et al. The Gln-Arg191 polymorphism ofthe human paraoxonase gene (HUMPONA) is not associated withthe risk of coronary artery disease in Finns. J Clin Invest 1996;98:883–5.
18. Suehiro T, Nakauchi Y, Yamamoto M, Arii K, Itoh H, Hamashige N,et al. Paraoxonase gene polymorphism in Japanese subjects withcoronary heart disease. Int J Cardiol 1996;57:69–73.
19. Herrmann S-M, Blanc H, Poirier O, Arveiler D, Luc G, Evans A, et al.The Gln/Arg polymorphism of human paraoxonase (PON 192) isnot related to myocardial infarction in the ECTIM study. Athero-sclerosis 1996;126:299–303.
20. Ombres D, Pannitteri G, Montali A, Candeloro A, Seccareccia F,Campagna F, et al. The Gln-Arg192 polymorphism of humanparaoxonase gene is not associated with coronary artery diseasein Italian patients. Arterioscler Thromb Vasc Biol 1998;18:1611–6.
21. Mackness B, Davies GK, Turkie W, Lee E, Roberts DH, Hill E, et al.Paraoxonase status in coronary heart disease: are activity andconcentration more important than genotype? Arterioscler ThrombVasc Biol 2001;21:1451–7.
22. Ayub A, Mackness MI, Arrol S, Mackness B, Patel J, DurringtonPN. Serum paraoxonase after myocardial infarction. ArteriosclerThromb Vasc Biol 1999;19:330–5.
23. Eckerson HW, Romson J, Wyte C, La Du BN. The human serumparaoxonase polymorphism: identification of phenotypes by theirresponse to salts. Am J Hum Genet 1983;35:214–27.
24. Eckerson HW, Wyte CM, La Du BN. The human serum paraoxo-nase/arylesterase polymorphism. Am J Hum Genet 1983;35:1126–38.
25. La Du BN, Piko JI, Eckerson HW, Vincent-Viry M, Siest G. Animproved method for phenotyping individuals for the human serumparaoxonase arylesterase polymorphism. Ann Biol Clin 1986;44:369–72.
26. Haagen L, Brock A. A new automated method for phenotypingarylesterase (EC 3.1.1.2) based upon inhibition of enzymatichydrolysis of 4-nitrophenyl acetate by phenyl acetate. Eur J ClinChem Clin Biochem 1992;30:391–5.
27. Mueller RF, Hornung S, Furlong CE, Anderson J, Giblett ER,Motulsky AG. Plasma paraoxonase polymorphism: a new assay,population, family, biochemical, and linkage studies. Am J HumGenet 1983;35:393–408.
28. Richter RJ. Furlong CE. Determination of paraoxonase (PON1)status requires more than genotyping. Pharmacogenetics 1999;9:745–53.
29. Charlton-Menys V, Liu Y, Durrington PN. Semiautomated methodfor determination of serum paraoxonase activity using paraoxonas substrate. Clin Chem 52:453–7.
30. Murphy JM, Browne RW, Hill L, Bolelli GF, Abagnato C, Berrino F,et al. Effects of transportation and delay in processing on thestability of nutritional and metabolic biomarkers. Nutr Cancer2000;37:155–60.
31. Gan KN, Smolen A, Eckerson HW, La Du BN. Purification of humanserum paraoxonase/arylesterase. Evidence for one esterase cat-alyzing both activities. Drug Metab Dispos 1991;19:100–6.
32. Fraser CG, Hyltoft Petersen P, Libeer JC, Ricos C. Proposals forsetting generally applicable quality goals solely based on biology.Ann Clin Biochem 1997;34:8–12.
33. Mackness M, Mackness B. Paraoxonase 1 and atherosclerosis: isthe gene or the protein more important? Free Radic Biol Med2004;37:1317–23.
34. Fraser CG, Harris EK. Generation and application of data onbiological variation in clinical chemistry. CRC Crit Rev Clin Lab Sci1989;409–37.
Clinical Chemistry 53, No. 2, 2007 317
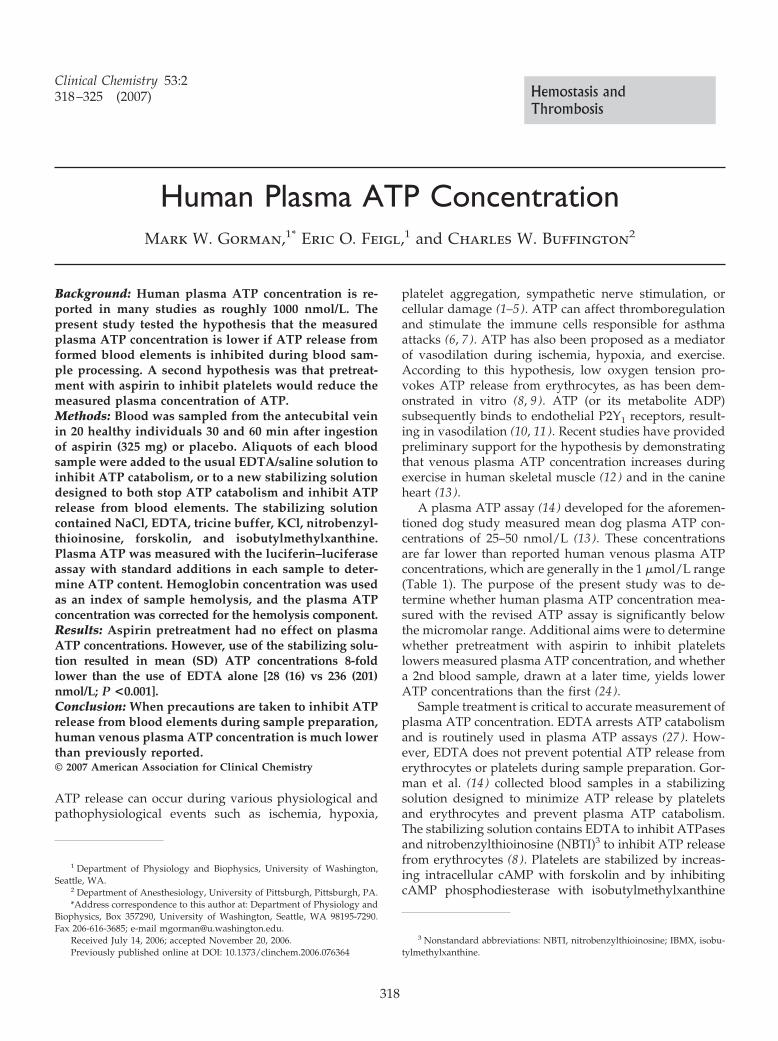
Human Plasma ATP ConcentrationMark W. Gorman,1* Eric O. Feigl,1 and Charles W. Buffington2
Background: Human plasma ATP concentration is re-ported in many studies as roughly 1000 nmol/L. Thepresent study tested the hypothesis that the measuredplasma ATP concentration is lower if ATP release fromformed blood elements is inhibited during blood sam-ple processing. A second hypothesis was that pretreat-ment with aspirin to inhibit platelets would reduce themeasured plasma concentration of ATP.Methods: Blood was sampled from the antecubital veinin 20 healthy individuals 30 and 60 min after ingestionof aspirin (325 mg) or placebo. Aliquots of each bloodsample were added to the usual EDTA/saline solution toinhibit ATP catabolism, or to a new stabilizing solutiondesigned to both stop ATP catabolism and inhibit ATPrelease from blood elements. The stabilizing solutioncontained NaCl, EDTA, tricine buffer, KCl, nitrobenzyl-thioinosine, forskolin, and isobutylmethylxanthine.Plasma ATP was measured with the luciferin–luciferaseassay with standard additions in each sample to deter-mine ATP content. Hemoglobin concentration was usedas an index of sample hemolysis, and the plasma ATPconcentration was corrected for the hemolysis component.Results: Aspirin pretreatment had no effect on plasmaATP concentrations. However, use of the stabilizing solu-tion resulted in mean (SD) ATP concentrations 8-foldlower than the use of EDTA alone [28 (16) vs 236 (201)nmol/L; P <0.001].Conclusion: When precautions are taken to inhibit ATPrelease from blood elements during sample preparation,human venous plasma ATP concentration is much lowerthan previously reported.© 2007 American Association for Clinical Chemistry
ATP release can occur during various physiological andpathophysiological events such as ischemia, hypoxia,
platelet aggregation, sympathetic nerve stimulation, orcellular damage (1–5). ATP can affect thromboregulationand stimulate the immune cells responsible for asthmaattacks (6, 7). ATP has also been proposed as a mediatorof vasodilation during ischemia, hypoxia, and exercise.According to this hypothesis, low oxygen tension pro-vokes ATP release from erythrocytes, as has been dem-onstrated in vitro (8, 9). ATP (or its metabolite ADP)subsequently binds to endothelial P2Y1 receptors, result-ing in vasodilation (10, 11). Recent studies have providedpreliminary support for the hypothesis by demonstratingthat venous plasma ATP concentration increases duringexercise in human skeletal muscle (12 ) and in the canineheart (13 ).
A plasma ATP assay (14 ) developed for the aforemen-tioned dog study measured mean dog plasma ATP con-centrations of 25–50 nmol/L (13 ). These concentrationsare far lower than reported human venous plasma ATPconcentrations, which are generally in the 1 �mol/L range(Table 1). The purpose of the present study was to de-termine whether human plasma ATP concentration mea-sured with the revised ATP assay is significantly belowthe micromolar range. Additional aims were to determinewhether pretreatment with aspirin to inhibit plateletslowers measured plasma ATP concentration, and whethera 2nd blood sample, drawn at a later time, yields lowerATP concentrations than the first (24 ).
Sample treatment is critical to accurate measurement ofplasma ATP concentration. EDTA arrests ATP catabolismand is routinely used in plasma ATP assays (27 ). How-ever, EDTA does not prevent potential ATP release fromerythrocytes or platelets during sample preparation. Gor-man et al. (14 ) collected blood samples in a stabilizingsolution designed to minimize ATP release by plateletsand erythrocytes and prevent plasma ATP catabolism.The stabilizing solution contains EDTA to inhibit ATPasesand nitrobenzylthioinosine (NBTI)3 to inhibit ATP releasefrom erythrocytes (8 ). Platelets are stabilized by increas-ing intracellular cAMP with forskolin and by inhibitingcAMP phosphodiesterase with isobutylmethylxanthine
1 Department of Physiology and Biophysics, University of Washington,Seattle, WA.
2 Department of Anesthesiology, University of Pittsburgh, Pittsburgh, PA.*Address correspondence to this author at: Department of Physiology and
Biophysics, Box 357290, University of Washington, Seattle, WA 98195-7290.Fax 206-616-3685; e-mail [email protected].
Received July 14, 2006; accepted November 20, 2006.Previously published online at DOI: 10.1373/clinchem.2006.076364
3 Nonstandard abbreviations: NBTI, nitrobenzylthioinosine; IBMX, isobu-tylmethylxanthine.
Clinical Chemistry 53:2318–325 (2007) Hemostasis and
Thrombosis
318
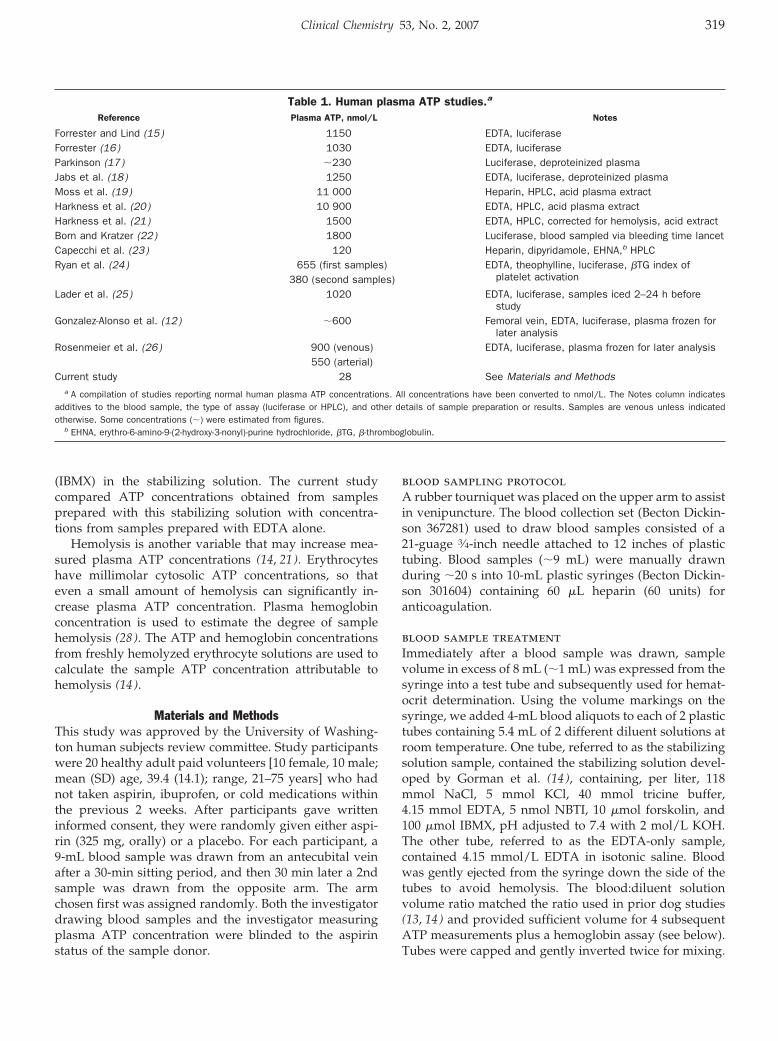
(IBMX) in the stabilizing solution. The current studycompared ATP concentrations obtained from samplesprepared with this stabilizing solution with concentra-tions from samples prepared with EDTA alone.
Hemolysis is another variable that may increase mea-sured plasma ATP concentrations (14, 21). Erythrocyteshave millimolar cytosolic ATP concentrations, so thateven a small amount of hemolysis can significantly in-crease plasma ATP concentration. Plasma hemoglobinconcentration is used to estimate the degree of samplehemolysis (28 ). The ATP and hemoglobin concentrationsfrom freshly hemolyzed erythrocyte solutions are used tocalculate the sample ATP concentration attributable tohemolysis (14 ).
Materials and MethodsThis study was approved by the University of Washing-ton human subjects review committee. Study participantswere 20 healthy adult paid volunteers [10 female, 10 male;mean (SD) age, 39.4 (14.1); range, 21–75 years] who hadnot taken aspirin, ibuprofen, or cold medications withinthe previous 2 weeks. After participants gave writteninformed consent, they were randomly given either aspi-rin (325 mg, orally) or a placebo. For each participant, a9-mL blood sample was drawn from an antecubital veinafter a 30-min sitting period, and then 30 min later a 2ndsample was drawn from the opposite arm. The armchosen first was assigned randomly. Both the investigatordrawing blood samples and the investigator measuringplasma ATP concentration were blinded to the aspirinstatus of the sample donor.
blood sampling protocolA rubber tourniquet was placed on the upper arm to assistin venipuncture. The blood collection set (Becton Dickin-son 367281) used to draw blood samples consisted of a21-guage 3⁄4-inch needle attached to 12 inches of plastictubing. Blood samples (�9 mL) were manually drawnduring �20 s into 10-mL plastic syringes (Becton Dickin-son 301604) containing 60 �L heparin (60 units) foranticoagulation.
blood sample treatmentImmediately after a blood sample was drawn, samplevolume in excess of 8 mL (�1 mL) was expressed from thesyringe into a test tube and subsequently used for hemat-ocrit determination. Using the volume markings on thesyringe, we added 4-mL blood aliquots to each of 2 plastictubes containing 5.4 mL of 2 different diluent solutions atroom temperature. One tube, referred to as the stabilizingsolution sample, contained the stabilizing solution devel-oped by Gorman et al. (14 ), containing, per liter, 118mmol NaCl, 5 mmol KCl, 40 mmol tricine buffer,4.15 mmol EDTA, 5 nmol NBTI, 10 �mol forskolin, and100 �mol IBMX, pH adjusted to 7.4 with 2 mol/L KOH.The other tube, referred to as the EDTA-only sample,contained 4.15 mmol/L EDTA in isotonic saline. Bloodwas gently ejected from the syringe down the side of thetubes to avoid hemolysis. The blood:diluent solutionvolume ratio matched the ratio used in prior dog studies(13, 14) and provided sufficient volume for 4 subsequentATP measurements plus a hemoglobin assay (see below).Tubes were capped and gently inverted twice for mixing.
Table 1. Human plasma ATP studies.a
Reference Plasma ATP, nmol/L Notes
Forrester and Lind (15) 1150 EDTA, luciferaseForrester (16) 1030 EDTA, luciferaseParkinson (17) �230 Luciferase, deproteinized plasmaJabs et al. (18) 1250 EDTA, luciferase, deproteinized plasmaMoss et al. (19) 11 000 Heparin, HPLC, acid plasma extractHarkness et al. (20) 10 900 EDTA, HPLC, acid plasma extractHarkness et al. (21) 1500 EDTA, HPLC, corrected for hemolysis, acid extractBorn and Kratzer (22) 1800 Luciferase, blood sampled via bleeding time lancetCapecchi et al. (23) 120 Heparin, dipyridamole, EHNA,b HPLCRyan et al. (24) 655 (first samples) EDTA, theophylline, luciferase, �TG index of
platelet activation380 (second samples)Lader et al. (25) 1020 EDTA, luciferase, samples iced 2–24 h before
studyGonzalez-Alonso et al. (12) �600 Femoral vein, EDTA, luciferase, plasma frozen for
later analysisRosenmeier et al. (26) 900 (venous) EDTA, luciferase, plasma frozen for later analysis
550 (arterial)Current study 28 See Materials and Methods
a A compilation of studies reporting normal human plasma ATP concentrations. All concentrations have been converted to nmol/L. The Notes column indicatesadditives to the blood sample, the type of assay (luciferase or HPLC), and other details of sample preparation or results. Samples are venous unless indicatedotherwise. Some concentrations (�) were estimated from figures.
b EHNA, erythro-6-amino-9-(2-hydroxy-3-nonyl)-purine hydrochloride, �TG, �-thromboglobulin.
Clinical Chemistry 53, No. 2, 2007 319
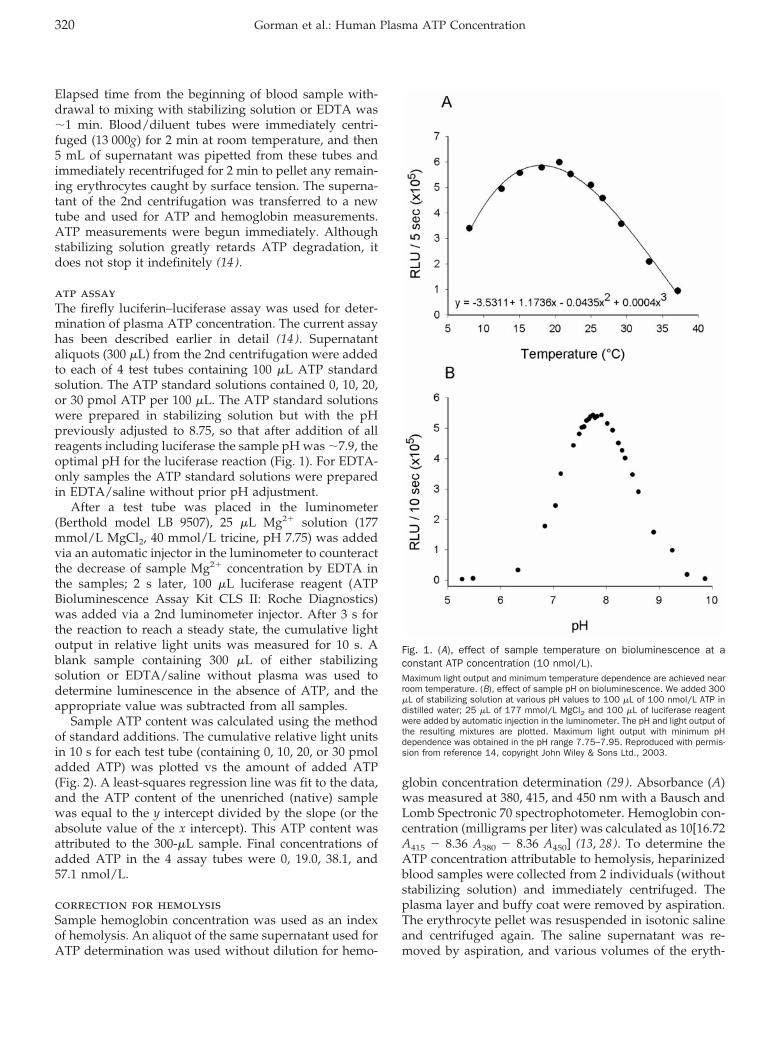
Elapsed time from the beginning of blood sample with-drawal to mixing with stabilizing solution or EDTA was�1 min. Blood/diluent tubes were immediately centri-fuged (13 000g) for 2 min at room temperature, and then5 mL of supernatant was pipetted from these tubes andimmediately recentrifuged for 2 min to pellet any remain-ing erythrocytes caught by surface tension. The superna-tant of the 2nd centrifugation was transferred to a newtube and used for ATP and hemoglobin measurements.ATP measurements were begun immediately. Althoughstabilizing solution greatly retards ATP degradation, itdoes not stop it indefinitely (14 ).
atp assayThe firefly luciferin–luciferase assay was used for deter-mination of plasma ATP concentration. The current assayhas been described earlier in detail (14 ). Supernatantaliquots (300 �L) from the 2nd centrifugation were addedto each of 4 test tubes containing 100 �L ATP standardsolution. The ATP standard solutions contained 0, 10, 20,or 30 pmol ATP per 100 �L. The ATP standard solutionswere prepared in stabilizing solution but with the pHpreviously adjusted to 8.75, so that after addition of allreagents including luciferase the sample pH was �7.9, theoptimal pH for the luciferase reaction (Fig. 1). For EDTA-only samples the ATP standard solutions were preparedin EDTA/saline without prior pH adjustment.
After a test tube was placed in the luminometer(Berthold model LB 9507), 25 �L Mg2� solution (177mmol/L MgCl2, 40 mmol/L tricine, pH 7.75) was addedvia an automatic injector in the luminometer to counteractthe decrease of sample Mg2� concentration by EDTA inthe samples; 2 s later, 100 �L luciferase reagent (ATPBioluminescence Assay Kit CLS II: Roche Diagnostics)was added via a 2nd luminometer injector. After 3 s forthe reaction to reach a steady state, the cumulative lightoutput in relative light units was measured for 10 s. Ablank sample containing 300 �L of either stabilizingsolution or EDTA/saline without plasma was used todetermine luminescence in the absence of ATP, and theappropriate value was subtracted from all samples.
Sample ATP content was calculated using the methodof standard additions. The cumulative relative light unitsin 10 s for each test tube (containing 0, 10, 20, or 30 pmoladded ATP) was plotted vs the amount of added ATP(Fig. 2). A least-squares regression line was fit to the data,and the ATP content of the unenriched (native) samplewas equal to the y intercept divided by the slope (or theabsolute value of the x intercept). This ATP content wasattributed to the 300-�L sample. Final concentrations ofadded ATP in the 4 assay tubes were 0, 19.0, 38.1, and57.1 nmol/L.
correction for hemolysisSample hemoglobin concentration was used as an indexof hemolysis. An aliquot of the same supernatant used forATP determination was used without dilution for hemo-
globin concentration determination (29 ). Absorbance (A)was measured at 380, 415, and 450 nm with a Bausch andLomb Spectronic 70 spectrophotometer. Hemoglobin con-centration (milligrams per liter) was calculated as 10[16.72A415 � 8.36 A380 � 8.36 A450] (13, 28). To determine theATP concentration attributable to hemolysis, heparinizedblood samples were collected from 2 individuals (withoutstabilizing solution) and immediately centrifuged. Theplasma layer and buffy coat were removed by aspiration.The erythrocyte pellet was resuspended in isotonic salineand centrifuged again. The saline supernatant was re-moved by aspiration, and various volumes of the eryth-
Fig. 1. (A), effect of sample temperature on bioluminescence at aconstant ATP concentration (10 nmol/L).Maximum light output and minimum temperature dependence are achieved nearroom temperature. (B), effect of sample pH on bioluminescence. We added 300�L of stabilizing solution at various pH values to 100 �L of 100 nmol/L ATP indistilled water; 25 �L of 177 mmol/L MgCl2 and 100 �L of luciferase reagentwere added by automatic injection in the luminometer. The pH and light output ofthe resulting mixtures are plotted. Maximum light output with minimum pHdependence was obtained in the pH range 7.75–7.95. Reproduced with permis-sion from reference 14, copyright John Wiley & Sons Ltd., 2003.
320 Gorman et al.: Human Plasma ATP Concentration
rocyte pellet (2–40 �L) were lysed in 5 mL distilled watercontaining 3 mmol/L EDTA (to stabilize the ATP concen-tration); 25 �L of this lysate was then diluted in 3 mLstabilizing solution, and the ATP content in 300 �L of thissolution was determined using the 4-point standard ad-dition method described above. ATP concentration wascalculated by attributing the ATP content to the 300 �Lsample volume. Hemoglobin concentration was deter-mined in the same solution. ATP concentration wasplotted vs hemoglobin concentration to create a hemolysiscorrection curve (Fig. 3).
calculation of plasma atp concentrationSample ATP content (pmol per 300 �L sample) wasmultiplied by 3.33 to arrive at the concentration (ATPtotal,nmol/L). The concentration of ATP in the sample due tohemolysis (ATPhemo, nmol/L) was determined from thesample hemoglobin concentration and the hemolysis cor-rection curve and was subtracted from ATPtotal. PlasmaATP concentration was arrived at after correcting fordilution. Thus, plasma [ATP] � (ATPtotal � ATPhemo) �(1.35 � 1 � HCT)/(1 � HCT), where 1.35 is the ratio ofstabilizing solution (or EDTA/saline) volume to bloodsample volume, and HCT is the fractional hematocrit.
statistical analysisThree-way ANOVA using aspirin status, sample time,and diluent solution composition as factors revealed thatthe only significant differences in sample ATP concentra-tion were between stabilizing solution and EDTA-only
samples (P �0.001). Because the data did not show agaussian distribution, further paired comparisons (sam-ple time, stabilizing solution vs EDTA) were made withthe nonparametric Wilcoxon matched-pairs test. Placeboand aspirin results (unpaired) were compared with thenonparametric Mann–Whitney test. Correlation betweenstabilizing solution and EDTA-only results in the samesamples was determined with the nonparametric Spear-man correlation. P �0.05 was considered statisticallysignificant. Statistical tests were done with GraphPadPrism software. Results in the text and tables are pre-sented as mean and SD.
ResultsThe effects of temperature and pH on the luciferasereaction are presented in Fig. 1 (14 ). Maximum lightoutput is achieved at room temperature and a pH of7.75–7.95. The graphical determination of plasma ATPconcentration is illustrated in Fig. 2. Results are shown forthe same blood sample with both stabilizing solution andEDTA only. The native samples are points on the y axiswith zero added ATP. Light output as a function ofsample ATP content is highly linear in both cases. Becauseof sample pH optimization, the slope is higher for thestabilizing solution sample than for the EDTA-only sam-ple.
Results of the placebo vs aspirin groups and stabilizingsolution vs EDTA only are presented in Fig. 4 and Table 2.The 2 samples drawn 30 min apart were not significantlydifferent in any subgroup (Table 2) and have thereforebeen combined in Fig. 4, which illustrates that aspirinpretreatment had no effect on plasma ATP concentration.On the other hand, use of stabilizing solution resulted in
Fig. 2. The standard addition technique for determination of ATPconcentration in unknown plasma samples.Aliquots (4 mL) of the same blood sample were analyzed after treatment with 5.4mL stabilizing solution or saline/EDTA. From the resulting diluted plasmasamples, 4 assay tubes were prepared containing 0, 10, 20, and 30 pmol addedATP. Luminescence from the luciferin–luciferase reaction (after subtracting blankvalues) was plotted vs added ATP. The x intercept of the linear regression lineindicates the ATP content of the native plasma tube (zero added ATP). The slopeis lower in EDTA-only samples because pH was not optimized for the luciferasereaction. The accuracy of the assay was not affected, because luminescenceremains a highly linear function of ATP content. After correction for hematocrit,dilution, and hemolysis, the original plasma concentrations in this sample were22.4 nmol/L with stabilizing solution and 231 nmol/L with EDTA only.
Fig. 3. The influence of hemolysis on sample ATP concentration.Small volumes (2–40 �L) of erythrocytes from 2 individuals (open and closedcircles) were freshly lysed in distilled water/EDTA and further diluted in stabilizingsolution. ATP concentrations were measured with the standard addition tech-nique, and free hemoglobin concentration was measured spectrophotometri-cally. The results were fit to a linear regression line constrained through theorigin. The results demonstrate that even very low levels of hemolysis signifi-cantly increase plasma ATP concentration.
Clinical Chemistry 53, No. 2, 2007 321
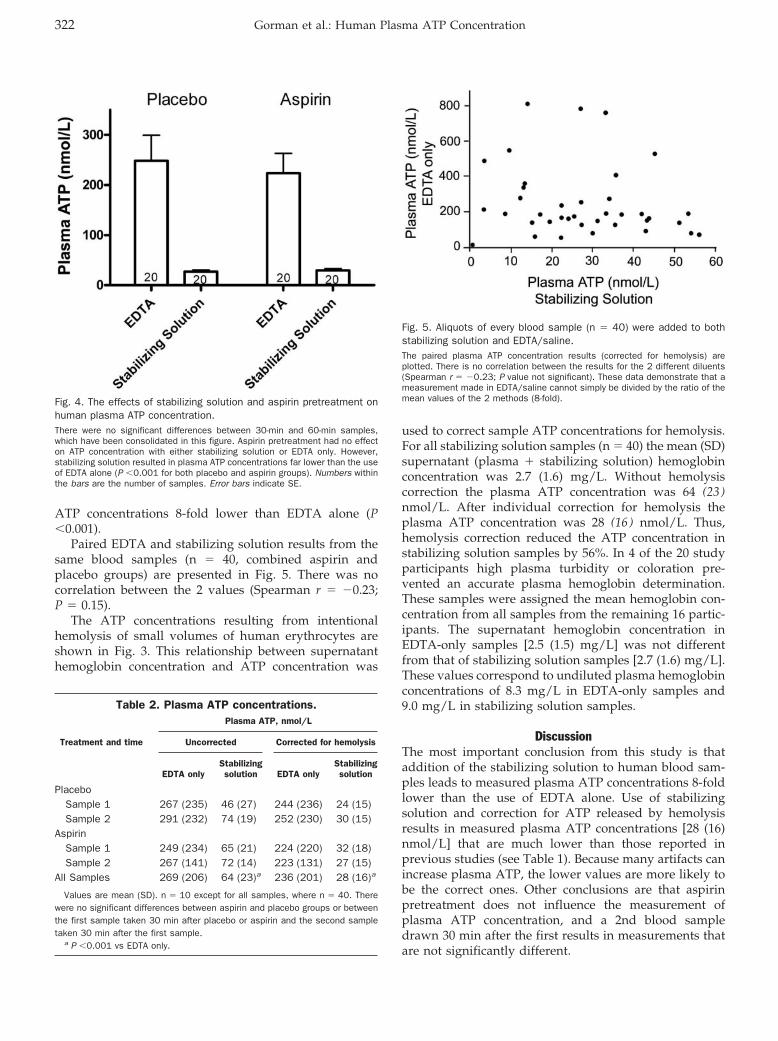
ATP concentrations 8-fold lower than EDTA alone (P�0.001).
Paired EDTA and stabilizing solution results from thesame blood samples (n � 40, combined aspirin andplacebo groups) are presented in Fig. 5. There was nocorrelation between the 2 values (Spearman r � �0.23;P � 0.15).
The ATP concentrations resulting from intentionalhemolysis of small volumes of human erythrocytes areshown in Fig. 3. This relationship between supernatanthemoglobin concentration and ATP concentration was
used to correct sample ATP concentrations for hemolysis.For all stabilizing solution samples (n � 40) the mean (SD)supernatant (plasma � stabilizing solution) hemoglobinconcentration was 2.7 (1.6) mg/L. Without hemolysiscorrection the plasma ATP concentration was 64 (23 )nmol/L. After individual correction for hemolysis theplasma ATP concentration was 28 (16 ) nmol/L. Thus,hemolysis correction reduced the ATP concentration instabilizing solution samples by 56%. In 4 of the 20 studyparticipants high plasma turbidity or coloration pre-vented an accurate plasma hemoglobin determination.These samples were assigned the mean hemoglobin con-centration from all samples from the remaining 16 partic-ipants. The supernatant hemoglobin concentration inEDTA-only samples [2.5 (1.5) mg/L] was not differentfrom that of stabilizing solution samples [2.7 (1.6) mg/L].These values correspond to undiluted plasma hemoglobinconcentrations of 8.3 mg/L in EDTA-only samples and9.0 mg/L in stabilizing solution samples.
DiscussionThe most important conclusion from this study is thataddition of the stabilizing solution to human blood sam-ples leads to measured plasma ATP concentrations 8-foldlower than the use of EDTA alone. Use of stabilizingsolution and correction for ATP released by hemolysisresults in measured plasma ATP concentrations [28 (16)nmol/L] that are much lower than those reported inprevious studies (see Table 1). Because many artifacts canincrease plasma ATP, the lower values are more likely tobe the correct ones. Other conclusions are that aspirinpretreatment does not influence the measurement ofplasma ATP concentration, and a 2nd blood sampledrawn 30 min after the first results in measurements thatare not significantly different.
Fig. 4. The effects of stabilizing solution and aspirin pretreatment onhuman plasma ATP concentration.There were no significant differences between 30-min and 60-min samples,which have been consolidated in this figure. Aspirin pretreatment had no effecton ATP concentration with either stabilizing solution or EDTA only. However,stabilizing solution resulted in plasma ATP concentrations far lower than the useof EDTA alone (P �0.001 for both placebo and aspirin groups). Numbers withinthe bars are the number of samples. Error bars indicate SE.
Table 2. Plasma ATP concentrations.
Treatment and time
Plasma ATP, nmol/L
Uncorrected Corrected for hemolysis
EDTA onlyStabilizingsolution EDTA only
Stabilizingsolution
PlaceboSample 1 267 (235) 46 (27) 244 (236) 24 (15)Sample 2 291 (232) 74 (19) 252 (230) 30 (15)
AspirinSample 1 249 (234) 65 (21) 224 (220) 32 (18)Sample 2 267 (141) 72 (14) 223 (131) 27 (15)
All Samples 269 (206) 64 (23)a 236 (201) 28 (16)a
Values are mean (SD). n � 10 except for all samples, where n � 40. Therewere no significant differences between aspirin and placebo groups or betweenthe first sample taken 30 min after placebo or aspirin and the second sampletaken 30 min after the first sample.
a P �0.001 vs EDTA only.
Fig. 5. Aliquots of every blood sample (n � 40) were added to bothstabilizing solution and EDTA/saline.The paired plasma ATP concentration results (corrected for hemolysis) areplotted. There is no correlation between the results for the 2 different diluents(Spearman r � �0.23; P value not significant). These data demonstrate that ameasurement made in EDTA/saline cannot simply be divided by the ratio of themean values of the 2 methods (8-fold).
322 Gorman et al.: Human Plasma ATP Concentration
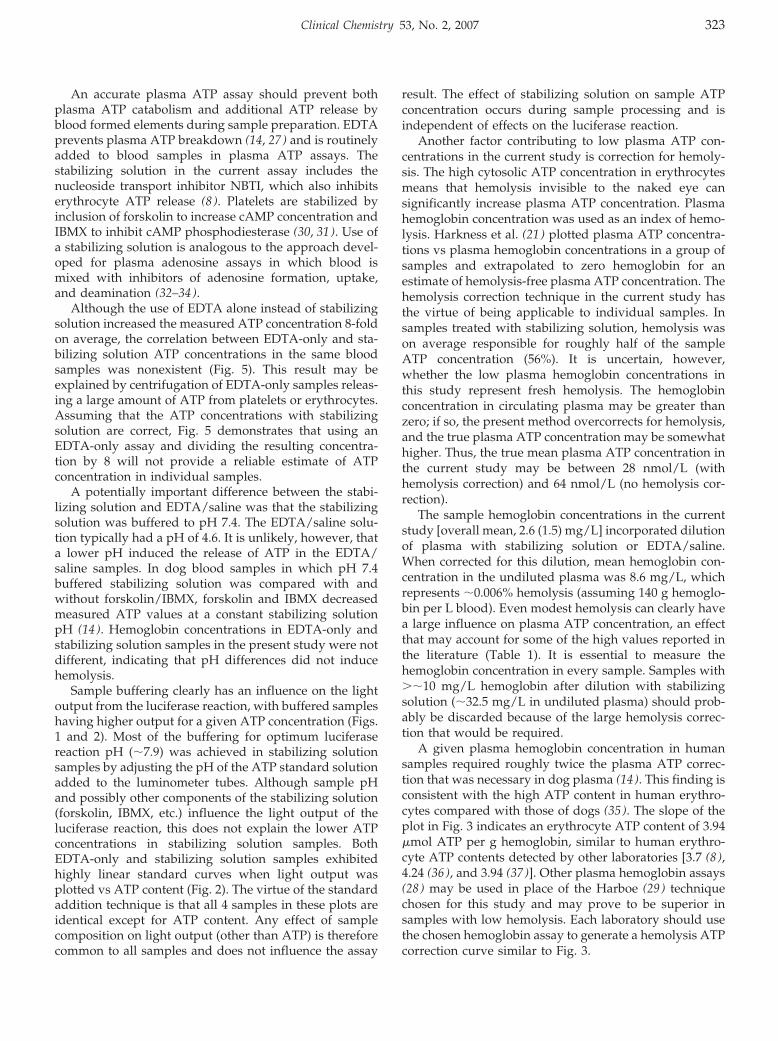
An accurate plasma ATP assay should prevent bothplasma ATP catabolism and additional ATP release byblood formed elements during sample preparation. EDTAprevents plasma ATP breakdown (14, 27) and is routinelyadded to blood samples in plasma ATP assays. Thestabilizing solution in the current assay includes thenucleoside transport inhibitor NBTI, which also inhibitserythrocyte ATP release (8 ). Platelets are stabilized byinclusion of forskolin to increase cAMP concentration andIBMX to inhibit cAMP phosphodiesterase (30, 31). Use ofa stabilizing solution is analogous to the approach devel-oped for plasma adenosine assays in which blood ismixed with inhibitors of adenosine formation, uptake,and deamination (32–34).
Although the use of EDTA alone instead of stabilizingsolution increased the measured ATP concentration 8-foldon average, the correlation between EDTA-only and sta-bilizing solution ATP concentrations in the same bloodsamples was nonexistent (Fig. 5). This result may beexplained by centrifugation of EDTA-only samples releas-ing a large amount of ATP from platelets or erythrocytes.Assuming that the ATP concentrations with stabilizingsolution are correct, Fig. 5 demonstrates that using anEDTA-only assay and dividing the resulting concentra-tion by 8 will not provide a reliable estimate of ATPconcentration in individual samples.
A potentially important difference between the stabi-lizing solution and EDTA/saline was that the stabilizingsolution was buffered to pH 7.4. The EDTA/saline solu-tion typically had a pH of 4.6. It is unlikely, however, thata lower pH induced the release of ATP in the EDTA/saline samples. In dog blood samples in which pH 7.4buffered stabilizing solution was compared with andwithout forskolin/IBMX, forskolin and IBMX decreasedmeasured ATP values at a constant stabilizing solutionpH (14 ). Hemoglobin concentrations in EDTA-only andstabilizing solution samples in the present study were notdifferent, indicating that pH differences did not inducehemolysis.
Sample buffering clearly has an influence on the lightoutput from the luciferase reaction, with buffered sampleshaving higher output for a given ATP concentration (Figs.1 and 2). Most of the buffering for optimum luciferasereaction pH (�7.9) was achieved in stabilizing solutionsamples by adjusting the pH of the ATP standard solutionadded to the luminometer tubes. Although sample pHand possibly other components of the stabilizing solution(forskolin, IBMX, etc.) influence the light output of theluciferase reaction, this does not explain the lower ATPconcentrations in stabilizing solution samples. BothEDTA-only and stabilizing solution samples exhibitedhighly linear standard curves when light output wasplotted vs ATP content (Fig. 2). The virtue of the standardaddition technique is that all 4 samples in these plots areidentical except for ATP content. Any effect of samplecomposition on light output (other than ATP) is thereforecommon to all samples and does not influence the assay
result. The effect of stabilizing solution on sample ATPconcentration occurs during sample processing and isindependent of effects on the luciferase reaction.
Another factor contributing to low plasma ATP con-centrations in the current study is correction for hemoly-sis. The high cytosolic ATP concentration in erythrocytesmeans that hemolysis invisible to the naked eye cansignificantly increase plasma ATP concentration. Plasmahemoglobin concentration was used as an index of hemo-lysis. Harkness et al. (21 ) plotted plasma ATP concentra-tions vs plasma hemoglobin concentrations in a group ofsamples and extrapolated to zero hemoglobin for anestimate of hemolysis-free plasma ATP concentration. Thehemolysis correction technique in the current study hasthe virtue of being applicable to individual samples. Insamples treated with stabilizing solution, hemolysis wason average responsible for roughly half of the sampleATP concentration (56%). It is uncertain, however,whether the low plasma hemoglobin concentrations inthis study represent fresh hemolysis. The hemoglobinconcentration in circulating plasma may be greater thanzero; if so, the present method overcorrects for hemolysis,and the true plasma ATP concentration may be somewhathigher. Thus, the true mean plasma ATP concentration inthe current study may be between 28 nmol/L (withhemolysis correction) and 64 nmol/L (no hemolysis cor-rection).
The sample hemoglobin concentrations in the currentstudy [overall mean, 2.6 (1.5) mg/L] incorporated dilutionof plasma with stabilizing solution or EDTA/saline.When corrected for this dilution, mean hemoglobin con-centration in the undiluted plasma was 8.6 mg/L, whichrepresents �0.006% hemolysis (assuming 140 g hemoglo-bin per L blood). Even modest hemolysis can clearly havea large influence on plasma ATP concentration, an effectthat may account for some of the high values reported inthe literature (Table 1). It is essential to measure thehemoglobin concentration in every sample. Samples with��10 mg/L hemoglobin after dilution with stabilizingsolution (�32.5 mg/L in undiluted plasma) should prob-ably be discarded because of the large hemolysis correc-tion that would be required.
A given plasma hemoglobin concentration in humansamples required roughly twice the plasma ATP correc-tion that was necessary in dog plasma (14 ). This finding isconsistent with the high ATP content in human erythro-cytes compared with those of dogs (35 ). The slope of theplot in Fig. 3 indicates an erythrocyte ATP content of 3.94�mol ATP per g hemoglobin, similar to human erythro-cyte ATP contents detected by other laboratories [3.7 (8 ),4.24 (36 ), and 3.94 (37 )]. Other plasma hemoglobin assays(28 ) may be used in place of the Harboe (29 ) techniquechosen for this study and may prove to be superior insamples with low hemolysis. Each laboratory should usethe chosen hemoglobin assay to generate a hemolysis ATPcorrection curve similar to Fig. 3.
Clinical Chemistry 53, No. 2, 2007 323
One hypothesis was that the negative effects of aspirinon platelet aggregation might reduce platelet ATP releaseand lead to lower plasma ATP concentrations, especiallyin samples treated with EDTA only. The results clearly donot support this hypothesis, because aspirin pretreatmenthad no effect on plasma ATP concentration in eithersaline/EDTA or stabilizing solution. Aspirin had no effectin samples taken either 30 or 60 min after aspirin inges-tion. Thirty min after oral administration is sufficient foraspirin-induced suppression of platelet thromboxane B2
production (38 ).Ryan et al. (24 ) found that when blood sampling was
repeated 15–30 min after obtaining the initial sample, the2nd sample contained 42% less ATP. The present studyfound no significant changes in ATP concentration mea-sured in samples collected 30 min apart with eitherstabilizing solution or EDTA/saline, regardless ofwhether or not aspirin was present.
The low plasma ATP concentrations in the currentstudy are not the result of low recoveries. Plasma ATPloss stops as soon as blood is treated with EDTA (14, 27).The current assay recovers 96.2% of exogenously addedATP (14 ). Some plasma ATP is bound to albumin and isnot detected by the luciferin–luciferase assay (39 ). In ratplasma, heat denaturation increased average plasma ATPconcentration from 93 to 150 nmol/L (39 ). Similar albu-min binding probably occurs in human plasma, but hasnot been measured to date. The present results do notinclude albumin-bound ATP. The unbound ATP concen-tration is probably indicative of the ATP that acts onphysiological purinergic receptors.
The use of syringe volume markings to measure 4-mLsamples of blood in the current study is less accurate thanthe use of pipettes. However, pipetting these blood sam-ples would require additional time and manipulation ofblood that had not yet been treated with either EDTA orstabilizing solution, resulting in additional ATP catabo-lism and possibly additional hemolysis or platelet activa-tion. A modest amount of volume accuracy was pur-posely sacrificed to avoid these complications. Volumeinaccuracies should be randomly distributed amongEDTA-only and stabilizing solution samples.
All blood samples in this study were drawn from theantecubital veins. Because oxygen tension influences ATPrelease from erythrocytes (8, 9), samples drawn fromother locations with different venous oxygen tensionsmay result in different ATP concentrations. Local ATPconcentrations, particularly near aggregating platelets ornerve endings, may be considerably higher than thecirculating venous concentrations reported here.
In summary, addition of blood samples to a stabilizingsolution designed to stabilize plasma ATP concentrationresulted in human plasma ATP concentrations 8-foldlower than treatment with EDTA alone. Aspirin pretreat-ment did not affect plasma ATP concentration. ATPconcentration did not change in blood samples drawn 30
min apart. Correction for hemolysis-induced ATP releasedecreased plasma ATP concentration by 56%. These re-sults indicate that the true resting human venous plasmaATP concentration is far lower than previously reportedand is �28 nmol/L.
References1. Mills DC, Robb IA, Roberts GC. The release of nucleotides,
5-hydroxytryptamine and enzymes from human blood plateletsduring aggregation. J Physiol 1968;195:715–29.
2. Paddle BM, Burnstock G. Release of ATP from perfused heartduring coronary vasodilatation. Blood Vessels 1974;11:110–9.
3. Fredholm BB, Hedqvist P, Lindstrom K, Wennmalm M. Release ofnucleosides and nucleotides from the rabbit heart by sympatheticnerve stimulation. Acta Physiol Scand 1982;116:285–95.
4. Gordon JL. Extracellular ATP: effects, sources and fate. Biochem J1986;233:309–19.
5. Borst MM, Schrader J. Adenine nucleotide release from isolatedperfused guinea pig hearts and extracellular formation of adeno-sine. Circ Res 1991;68:797–806.
6. Pelleg A, Schulman ES. Adenosine 5�-triphosphate axis in obstruc-tive airway diseases [Review]. Am J Ther 2002;9:454–64.
7. Vial C, Pitt SJ, Roberts J, Rolf MG, Mahaut-Smith MP, Evans RJ.Lack of evidence for functional ADP-activated human P2X1 recep-tors supports a role for ATP during hemostasis and thrombosis.Blood 2003;102:3646–51.
8. Bergfeld GR, Forrester T. Release of ATP from human erythrocytesin response to a brief period of hypoxia and hypercapnia. Cardio-vasc Res 1992;26:40–7.
9. Ellsworth ML, Forrester T, Ellis CG, Dietrich HH. The erythrocyte asa regulator of vascular tone. Am J Physiol 1995;269:H2155–61.
10. Ralevic V, Burnstock G. Receptors for purines and pyrimidines.Pharmacol Rev 1998;50:413–92.
11. Gorman MW, Ogimoto K, Savage MV, Jacobson KA, Feigl EO.Nucleotide coronary vasodilation in guinea pig hearts. Am JPhysiol Heart Circ Physiol 2003;285:H1040–7.
12. Gonzalez-Alonso J, Olsen DB, Saltin B. Erythrocyte and the regu-lation of human skeletal muscle blood flow and oxygen delivery:role of circulating ATP. Circ Res 2002;91:1046–55.
13. Farias M III, Gorman MW, Savage MV, Feigl EO. Plasma ATP duringexercise: possible role in regulation of coronary blood flow. Am JPhysiol Heart Circ Physiol 2005;288:H1586–90.
14. Gorman MW, Marble DR, Ogimoto K, Feigl EO. Measurement ofadenine nucleotides in plasma. Luminescence 2003;18:173–81.
15. Forrester T, Lind AR. Identification of adenosine triphosphate inhuman plasma and the concentration in the venous effluent offorearm muscles before, during and after sustained contractions.J Physiol 1969;204:347–64.
16. Forrester T. The identification of adenosine triphosphate in freshhuman plasma. J Physiol 1969;200:53P–4P.
17. Parkinson PI. The effect of graduated exercise on the concentra-tion of adenine nucleotides in plasma. J Physiol 1973;234:72P–4P.
18. Jabs CM, Ferrell WJ, Robb HJ. Microdetermination of plasma ATPand creatine phosphate concentrations with a luminescencebiometer. Clin Chem 1977;23:2254–7.
19. Moss AH, Solomons CC, Alfrey AC. Elevated plasma adeninenucleotide levels in chronic renal failure and their possiblesignificance. Proc Clin Dial Transplant Forum 1979;9:184–8.
20. Harkness RA, Simmonds RJ, Coade SB. Purine transport andmetabolism in man: the effect of exercise on concentrations ofpurine bases, nucleosides and nucleotides in plasma, urine,leucocytes and erythrocytes. Clin Sci (Lond) 1983;64:333–40.
324 Gorman et al.: Human Plasma ATP Concentration
21. Harkness RA, Coade SB, Webster AD. ATP, ADP and AMP inplasma from peripheral venous blood. Clin Chim Acta 1984;143:91–8.
22. Born GV, Kratzer MA. Source and concentration of extracellularadenosine triphosphate during haemostasis in rats, rabbits andman. J Physiol 1984;354:419–29.
23. Capecchi PL, Laghi PF, Sodi N, Chiavetta M, Sensi S, De Lalla A,et al. Increase in plasma levels of adenosine and adeninenucleotides after intravenous infusion of buflomedil in humans.J Cardiovasc Pharmacol 1995;25:35–9.
24. Ryan LM, Rachow JW, McCarty BA, McCarty DJ. Adenosine triphos-phate levels in human plasma. J Rheumatol 1996;23:214–9.
25. Lader AS, Prat AG, Jackson GR Jr, Chervinsky KL, Lapey A, KinaneTB, et al. Increased circulating levels of plasma ATP in cysticfibrosis patients. Clin Physiol 2000;20:348–53.
26. Rosenmeier JB, Hansen J, Gonzalez-Alonso J. Circulating ATP-induced vasodilatation overrides sympathetic vasoconstrictor ac-tivity in human skeletal muscle. J Physiol 2004;558:351–65.
27. Holmsen H, Holmsen I, Bernhardsen A. Microdetermination ofadenosine diphosphate and adenosine triphosphate in plasmawith firefly luciferase system. Anal Biochem 1966;17:456–73.
28. Malinauskas RA. Plasma hemoglobin measurement techniquesfor the in vitro evaluation of blood damage caused by medicaldevices. Artif Organs 1997;21:1255–67.
29. Harboe M. A method for determination of hemoglobin in plasma bynear-ultraviolet spectrophotometry. Scand J Clin Lab Invest 1959;11:66–70.
30. Feinstein MB, Fraser C. Human platelet secretion and aggregationinduced by calcium ionophores: inhibition by PGE1 and dibutyrylcyclic AMP. J Gen Physiol 1975;66:561–81.
31. Salzman EW, Rubino EB, Sims RV. Cyclic 3�,5�-adenosine mono-phosphate in human blood platelets: 3: the role of cyclic AMP inplatelet aggregation. Ser Haematol 1970;3:100–13.
32. Manfredi JP, Sparks HV Jr. Adenosine’s role in coronary vasodila-tion induced by atrial pacing and norepinephrine. Am J PhysiolHeart Circ Physiol 1982;243:H536–45.
33. Shryock JC, Boykin MT, Hill JA, Belardinelli L. A new method ofsampling blood for measurement of plasma adenosine. Am JPhysiol Heart Circ Physiol 1990;258:H1232–9.
34. Herrmann SC, Feigl EO. Subtraction method for the high-perfor-mance chromatographic measurement of plasma adenosine.J Chromatogr 1992;574:247–53.
35. Miseta A, Bogner P, Berenyi E, Kellermayer M, Galambos C,Wheatley DN, et al. Relationship between cellular ATP, potas-sium, sodium and magnesium concentrations in mammalianand avian erythrocytes. Biochim Biophys Acta 1993;1175:133–9.
36. Olsson T, Gulliksson H, Palmeborn M, Bergstrom K, Thore A.Methodological aspects on the firefly luciferase assay of adeninenucleotides in whole blood and red blood cells. Scand J Clin LabInvest 1983;43:657–64.
37. Ecker T, Hitzler WE. Effect of 6-hour exposure to 20 degrees C onthe ATP content and other biochemical measures of CPDA-1packed red cells. Clin Lab 2000;46:291–3.
38. Patrono C, Ciabattoni G, Patrignani P, Pugliese F, Filabozzi P,Catella F, et al. Clinical pharmacology of platelet cyclooxygenaseinhibition. Circulation 1985;72:1177–84.
39. Douillet CD, Suy S, Zarzaur BL, Robinson WP III, Milano PM,Boucher RC, et al. Measurement of free and bound fractions ofextracellular ATP in biological solutions using bioluminescence.Luminescence 2005;20:435–41.
Clinical Chemistry 53, No. 2, 2007 325
Biomarkers of Folate and Vitamin B12 Are Relatedin Blood and Cerebrospinal Fluid
Rima Obeid,1 Panagiotis Kostopoulos,2 Jean-Pierre Knapp,1 Mariz Kasoha,1
George Becker,2† Klaus Fassbender,2 and Wolfgang Herrmann1*
Background: B-vitamins (folate, B12) are important mi-cronutrients for brain function and essential cofactorsfor homocysteine (HCY) metabolism. Increased HCYhas been related to neurological and psychiatric disor-ders. We studied the role of the B-vitamins in HCYmetabolism in the brain.Methods: We studied blood and cerebrospinal fluid(CSF) samples from 72 patients who underwent lumbarpuncture. We measured HCY, methylmalonic acid(MMA), and cystathionine by gas chromatography-massspectrometry; S-adenosylmethionine (SAM) and S-ad-enosylhomocysteine (SAH) by liquid chromatography-tandem mass spectrometry; and the B-vitamins by HPLCor immunoassays.Results: Concentrations were lower in CSF than serumor plasma for HCY (0.09 vs 9.4 �mol/L), SAH (13.2 vs 16.8nmol/L), cystathionine (54 vs 329 nmol/L), and holo-transcobalamin (16 vs 63 pmol/L), whereas concentra-tions in CSF were higher for MMA (359 vs 186 nmol/L)and SAM (270 vs 113 nmol/L; all P <0.05). CSF concen-trations of HCY correlated significantly with CSF folate(r � �0.46), CSF SAH (r � 0.48), CSF-albumin (r � 0.31),and age (r � 0.32). Aging was also associated with lowerconcentrations of CSF-folate and higher CSF-SAH. Therelationship between serum and CSF folate dependedon serum folate: the correlation (r) of serum and CSF-folate was 0.69 at serum folate <15.7 nmol/L. CSFconcentrations of MMA and holotranscobalamin werenot significantly correlated.Conclusions: CSF and serum/plasma concentrations ofvitamin biomarkers are significantly correlated. Older
age is associated with higher CSF-HCY and CSF-SAHand lower CSF-folate. These metabolic alterations maybe important indicators of low folate status, hyperho-mocysteinemia, and neurodegenerative diseases.© 2007 American Association for Clinical Chemistry
Folate and cobalamin (vitamin B12) are important micro-nutrients for brain function (1 ). Both vitamins are re-quired for the catabolism of the sulfur-containing aminoacid homocysteine (HCY).3 Methylcobalamin is the co-factor for methionine synthase, the enzyme that mediatesHCY remethylation to methionine. HCY metabolism inthe brain differs slightly from that in the liver. Thealternative remethylation pathway that is mediated bybetaine-HCY methyl transferase seems to be absent in thebrain (2 ). The transsulfuration of HCY in the brain hasnot been well studied, but the presence of cystathionine�-synthase has been confirmed by several investigators(3 ).
Methionine, the methylation product of HCY, is amajor source of S-adenosylmethionine (SAM) in the brain(1 ). Folate and vitamin B12 are important cofactors forSAM production in the brain (4 ). Folate and/or cobal-amin deficiency can cause increased concentrations ofHCY and disturbed methylation status. The importance ofthe transmethylation pathway in the central nervoussystem has been outlined (5, 6). SAM is the most impor-tant methyl donor in the brain. Disturbed methylation hasbeen implicated in the etiology of psychiatric and neuro-logic illness (5, 6). Biological methylation by SAM isinvolved in the integrity and maintenance of myelin,synthesis and inactivation of neurotransmitters, and DNAand RNA synthesis and methylation.
Recent studies demonstrated that increased plasmaHCY concentration is a risk factor for several disorders ofthe central nervous system (7–9). A causal role for HCY in
Departments of 1 Clinical Chemistry and Laboratory Medicine and 2 Neu-rology, Faculty of Medicine, University Hospital of Saarland, Homburg/Saar,Germany.
†Dr. Becker died in 2003.*Address correspondence to this author at: Department of Clinical Chem-
istry and Laboratory Medicine, University Hospital of the Saarland, KirrbergerStraße, Gebaude 57, 66421 Homburg, Germany. Fax 49-6841-1630703; [email protected].
Received July 13, 2006; accepted November 17, 2006.Previously published online at DOI: 10.1373/clinchem.2006.076448
3 Nonstandard abbreviations: HCY, homocysteine; SAM, S-adenosylme-thionine; CSF, cerebrospinal fluid; Cys, cystathionine; holoTC, holotranscobal-amin; MMA, methylmalonic acid; SAH, S-adenosylhomocysteine.
Clinical Chemistry 53:2326–333 (2007) General Clinical
Chemistry
326
neuronal damage has been shown by numerous in vitroand in vivo studies. Deficiencies of folate and cobalaminare common (10, 11), especially in patients with neurolog-ical and neuropsychiatric disorders (12 ), suggesting acausal role for B-vitamin deficiency in neuronal damage,either directly or via increasing HCY concentrations. Therelationship between HCY and brain function seemsstronger in observational (13 ) than in intervention studies(14–16), a finding that could be related to the inability ofthe central nervous system to regenerate.
Little is known about the influence of B-vitamin statuson HCY metabolism and the methylation capacity of thebrain. We investigated the role of folate and cobalamin asdeterminants of HCY concentrations in the cerebrospinalfluid (CSF) and the relationship between blood and CSFconcentrations of HCY, cystathionine (Cys), holotransco-balamin (holoTC), and methylmalonic acid (MMA).
Materials and Methodspatients and specimensPatients were recruited from the Department of Neurol-ogy, Saarland University Hospital, Germany, duringApril 2002 and April 2004. The study included 72 patients(41 females, 31 males). Exclusion criteria included liverdysfunction, alcoholism, treatment with l-dopa or anti-convulsants, major depression, brain tumor, multiple scle-rosis, or peripheral neuropathy. CSF samples contami-nated with peripheral blood or hemoglobin or with cellcount �5 cells/�L were excluded from this study.
Nonfasting blood samples were collected from allpatients. Serum and EDTA plasma were available. CSFsamples were collected during clinically indicated lumbarpunctures. Blood and CSF samples were collected within24 h of each other. Blood and CSF samples were centri-fuged within 30 min of collection, and several aliquotswere prepared and stored at �80 °C until analysis. Ali-quots of the EDTA-plasma and CSF were immediatelydeproteinized with perchloric acid (100 g/L). These sam-ples were stored at �80 °C and were used for SAM andS-adenosylhomocysteine (SAH) assays. An aliquot of theCSF was used for determining cell count and protein andglucose concentrations. The study was approved by theEthics Committee at the Saarland University Hospital,and written informed consent was obtained from allpatients.
analytical methodsConcentrations of HCY, Cys, and MMA were measured inserum and CSF samples with gas chromatography massspectrometry as described elsewhere (17 ). Day-to-dayimprecision (CV) for HCY was �5% in serum (at 8.0 and16.0 �mol/L) and �10% in CSF (at 0.30 �mol/L). The CVfor MMA was �6% in serum and CSF (at 290 and 540nmol/L, respectively), and for Cys, it was �8% in serum(at 300 nmol/L) and �10% in CSF (at 60 nmol/L). Therecovery of the 3 metabolites in CSF was 99% to 107% (seeTable 1 in the Data Supplement that accompanies the
online version of this article at http://www.clinchem.org/content/vol53/issue2). In-house prepared pool se-rum and pool CSF were run each time with the studysample and were used to calculate the assay CV. Concen-trations of SAM and SAH were measured with a slightlymodified liquid chromatography-tandem mass spectrom-etry method according to Gellekink et al. (18 ). CVs forSAM and SAH assays were 4.8% and 8%, respectively at103 nmol/L for SAM and 15.6 nmol/L for SAH.
Concentrations of vitamin B12 and folate were mea-sured with a chemiluminescence immunoassay (ADVIACentaur System, Bayer), plasma vitamin B6 (pyridoxal-5-phosphate) with HPLC connected to a fluorescence detec-tor (with reagents from Immundiagnostik), and serumand CSF holoTC with RIA (Axis-Shield). The CVs for theholoTC assay were 6% and 8% at 37 and 95 pmol/L,respectively. Serum concentrations of cholesterol andtriglycerides were measured by enzymatic colorimetrictests (Roche Diagnostics), and HDL by an enzymatichomogeneous assay (Roche Diagnostics). LDL was calcu-lated from total cholesterol, triglycerides, and HDL ac-cording to the Friedewald equation. Serum creatinineconcentrations were measured in serum with a kineticcolorimetric assay (Roche Diagnostics), and quantitativeglucose was measured by enzymatic ultraviolet test (hex-okinase method). Albumin concentration was measuredby nephelometry with specific antibodies (DADE Behr-ing). Cell counts and routine variable were measuredimmediately, and concentrations of B vitamins and me-tabolites were measured within 6 months of samplecollection.
statistical analysesData analyses were performed with SPSS (version 12). Allvariables were skewed and therefore were log-trans-formed to approach gaussian distribution before applica-tion of parametric tests. We used the paired t-test tocompare means of the log-transformed variables in bloodand CSF and the 1-way ANOVA test for multiple com-parisons. The post hoc Tamhane-T test was performed toidentify the significantly different group means when theANOVA test was significant. Correlations between vari-ables were examined by Spearman Rho test. All tests were2-sided; P values �0.05 were considered statisticallysignificant.
ResultsThe main characteristics of the study population aresummarized in Table 2 in the online Data Supplement.Concentrations of HCY and related biomarkers in bloodand CSF are presented in Table 1. Concentrations of HCY,Cys, and MMA in the CSF were comparable to thosefound in previous studies (19, 20). Concentrations of HCYin serum were �119-fold higher than concentrations inthe CSF. In contrast, concentrations of MMA were higherin the CSF than in serum (Table 1). Concentrations of SAHwere significantly lower in the CSF than in plasma (13.2 vs
Clinical Chemistry 53, No. 2, 2007 327
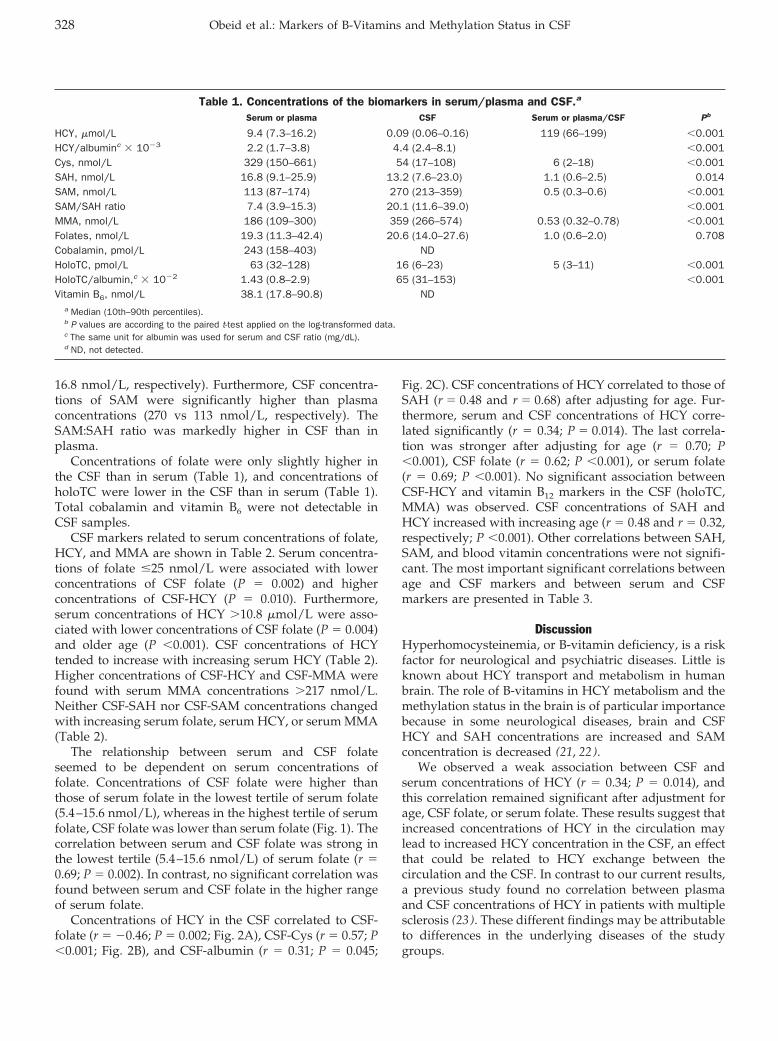
16.8 nmol/L, respectively). Furthermore, CSF concentra-tions of SAM were significantly higher than plasmaconcentrations (270 vs 113 nmol/L, respectively). TheSAM:SAH ratio was markedly higher in CSF than inplasma.
Concentrations of folate were only slightly higher inthe CSF than in serum (Table 1), and concentrations ofholoTC were lower in the CSF than in serum (Table 1).Total cobalamin and vitamin B6 were not detectable inCSF samples.
CSF markers related to serum concentrations of folate,HCY, and MMA are shown in Table 2. Serum concentra-tions of folate �25 nmol/L were associated with lowerconcentrations of CSF folate (P � 0.002) and higherconcentrations of CSF-HCY (P � 0.010). Furthermore,serum concentrations of HCY �10.8 �mol/L were asso-ciated with lower concentrations of CSF folate (P � 0.004)and older age (P �0.001). CSF concentrations of HCYtended to increase with increasing serum HCY (Table 2).Higher concentrations of CSF-HCY and CSF-MMA werefound with serum MMA concentrations �217 nmol/L.Neither CSF-SAH nor CSF-SAM concentrations changedwith increasing serum folate, serum HCY, or serum MMA(Table 2).
The relationship between serum and CSF folateseemed to be dependent on serum concentrations offolate. Concentrations of CSF folate were higher thanthose of serum folate in the lowest tertile of serum folate(5.4–15.6 nmol/L), whereas in the highest tertile of serumfolate, CSF folate was lower than serum folate (Fig. 1). Thecorrelation between serum and CSF folate was strong inthe lowest tertile (5.4–15.6 nmol/L) of serum folate (r �0.69; P � 0.002). In contrast, no significant correlation wasfound between serum and CSF folate in the higher rangeof serum folate.
Concentrations of HCY in the CSF correlated to CSF-folate (r � �0.46; P � 0.002; Fig. 2A), CSF-Cys (r � 0.57; P�0.001; Fig. 2B), and CSF-albumin (r � 0.31; P � 0.045;
Fig. 2C). CSF concentrations of HCY correlated to those ofSAH (r � 0.48 and r � 0.68) after adjusting for age. Fur-thermore, serum and CSF concentrations of HCY corre-lated significantly (r � 0.34; P � 0.014). The last correla-tion was stronger after adjusting for age (r � 0.70; P�0.001), CSF folate (r � 0.62; P �0.001), or serum folate(r � 0.69; P �0.001). No significant association betweenCSF-HCY and vitamin B12 markers in the CSF (holoTC,MMA) was observed. CSF concentrations of SAH andHCY increased with increasing age (r � 0.48 and r � 0.32,respectively; P �0.001). Other correlations between SAH,SAM, and blood vitamin concentrations were not signifi-cant. The most important significant correlations betweenage and CSF markers and between serum and CSFmarkers are presented in Table 3.
DiscussionHyperhomocysteinemia, or B-vitamin deficiency, is a riskfactor for neurological and psychiatric diseases. Little isknown about HCY transport and metabolism in humanbrain. The role of B-vitamins in HCY metabolism and themethylation status in the brain is of particular importancebecause in some neurological diseases, brain and CSFHCY and SAH concentrations are increased and SAMconcentration is decreased (21, 22).
We observed a weak association between CSF andserum concentrations of HCY (r � 0.34; P � 0.014), andthis correlation remained significant after adjustment forage, CSF folate, or serum folate. These results suggest thatincreased concentrations of HCY in the circulation maylead to increased HCY concentration in the CSF, an effectthat could be related to HCY exchange between thecirculation and the CSF. In contrast to our current results,a previous study found no correlation between plasmaand CSF concentrations of HCY in patients with multiplesclerosis (23 ). These different findings may be attributableto differences in the underlying diseases of the studygroups.
Table 1. Concentrations of the biomarkers in serum/plasma and CSF.a
Serum or plasma CSF Serum or plasma/CSF Pb
HCY, �mol/L 9.4 (7.3–16.2) 0.09 (0.06–0.16) 119 (66–199) �0.001HCY/albuminc � 10�3 2.2 (1.7–3.8) 4.4 (2.4–8.1) �0.001Cys, nmol/L 329 (150–661) 54 (17–108) 6 (2–18) �0.001SAH, nmol/L 16.8 (9.1–25.9) 13.2 (7.6–23.0) 1.1 (0.6–2.5) 0.014SAM, nmol/L 113 (87–174) 270 (213–359) 0.5 (0.3–0.6) �0.001SAM/SAH ratio 7.4 (3.9–15.3) 20.1 (11.6–39.0) �0.001MMA, nmol/L 186 (109–300) 359 (266–574) 0.53 (0.32–0.78) �0.001Folates, nmol/L 19.3 (11.3–42.4) 20.6 (14.0–27.6) 1.0 (0.6–2.0) 0.708Cobalamin, pmol/L 243 (158–403) NDHoloTC, pmol/L 63 (32–128) 16 (6–23) 5 (3–11) �0.001HoloTC/albumin,c � 10�2 1.43 (0.8–2.9) 65 (31–153) �0.001Vitamin B6, nmol/L 38.1 (17.8–90.8) ND
a Median (10th–90th percentiles).b P values are according to the paired t-test applied on the log-transformed data.c The same unit for albumin was used for serum and CSF ratio (mg/dL).d ND, not detected.
328 Obeid et al.: Markers of B-Vitamins and Methylation Status in CSF
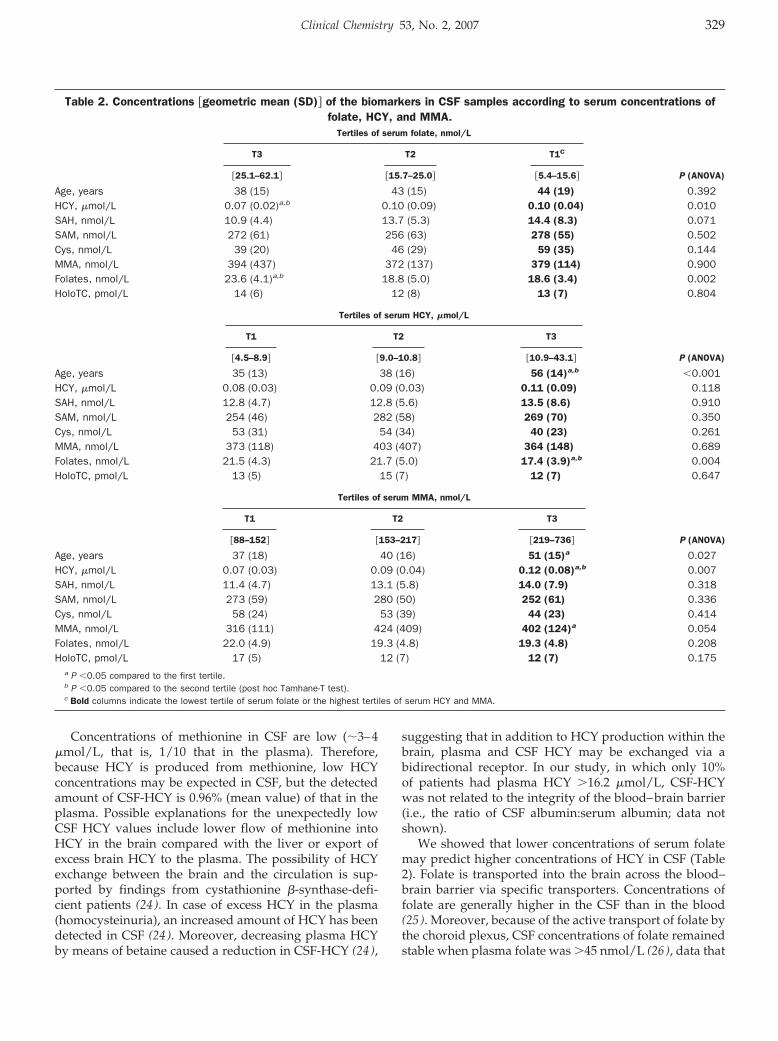
Concentrations of methionine in CSF are low (�3–4�mol/L, that is, 1/10 that in the plasma). Therefore,because HCY is produced from methionine, low HCYconcentrations may be expected in CSF, but the detectedamount of CSF-HCY is 0.96% (mean value) of that in theplasma. Possible explanations for the unexpectedly lowCSF HCY values include lower flow of methionine intoHCY in the brain compared with the liver or export ofexcess brain HCY to the plasma. The possibility of HCYexchange between the brain and the circulation is sup-ported by findings from cystathionine �-synthase-defi-cient patients (24 ). In case of excess HCY in the plasma(homocysteinuria), an increased amount of HCY has beendetected in CSF (24 ). Moreover, decreasing plasma HCYby means of betaine caused a reduction in CSF-HCY (24 ),
suggesting that in addition to HCY production within thebrain, plasma and CSF HCY may be exchanged via abidirectional receptor. In our study, in which only 10%of patients had plasma HCY �16.2 �mol/L, CSF-HCYwas not related to the integrity of the blood–brain barrier(i.e., the ratio of CSF albumin:serum albumin; data notshown).
We showed that lower concentrations of serum folatemay predict higher concentrations of HCY in CSF (Table2). Folate is transported into the brain across the blood–brain barrier via specific transporters. Concentrations offolate are generally higher in the CSF than in the blood(25 ). Moreover, because of the active transport of folate bythe choroid plexus, CSF concentrations of folate remainedstable when plasma folate was �45 nmol/L (26 ), data that
Table 2. Concentrations �geometric mean (SD)� of the biomarkers in CSF samples according to serum concentrations offolate, HCY, and MMA.
Tertiles of serum folate, nmol/L
P (ANOVA)
T3 T2 T1C
�25.1–62.1� �15.7–25.0� �5.4–15.6�
Age, years 38 (15) 43 (15) 44 (19) 0.392HCY, �mol/L 0.07 (0.02)a,b 0.10 (0.09) 0.10 (0.04) 0.010SAH, nmol/L 10.9 (4.4) 13.7 (5.3) 14.4 (8.3) 0.071SAM, nmol/L 272 (61) 256 (63) 278 (55) 0.502Cys, nmol/L 39 (20) 46 (29) 59 (35) 0.144MMA, nmol/L 394 (437) 372 (137) 379 (114) 0.900Folates, nmol/L 23.6 (4.1)a,b 18.8 (5.0) 18.6 (3.4) 0.002HoloTC, pmol/L 14 (6) 12 (8) 13 (7) 0.804
Tertiles of serum HCY, �mol/L
P (ANOVA)
T1 T2 T3
�4.5–8.9� �9.0–10.8� �10.9–43.1�
Age, years 35 (13) 38 (16) 56 (14)a,b �0.001HCY, �mol/L 0.08 (0.03) 0.09 (0.03) 0.11 (0.09) 0.118SAH, nmol/L 12.8 (4.7) 12.8 (5.6) 13.5 (8.6) 0.910SAM, nmol/L 254 (46) 282 (58) 269 (70) 0.350Cys, nmol/L 53 (31) 54 (34) 40 (23) 0.261MMA, nmol/L 373 (118) 403 (407) 364 (148) 0.689Folates, nmol/L 21.5 (4.3) 21.7 (5.0) 17.4 (3.9)a,b 0.004HoloTC, pmol/L 13 (5) 15 (7) 12 (7) 0.647
Tertiles of serum MMA, nmol/L
P (ANOVA)
T1 T2 T3
�88–152� �153–217� �219–736�
Age, years 37 (18) 40 (16) 51 (15)a 0.027HCY, �mol/L 0.07 (0.03) 0.09 (0.04) 0.12 (0.08)a,b 0.007SAH, nmol/L 11.4 (4.7) 13.1 (5.8) 14.0 (7.9) 0.318SAM, nmol/L 273 (59) 280 (50) 252 (61) 0.336Cys, nmol/L 58 (24) 53 (39) 44 (23) 0.414MMA, nmol/L 316 (111) 424 (409) 402 (124)a 0.054Folates, nmol/L 22.0 (4.9) 19.3 (4.8) 19.3 (4.8) 0.208HoloTC, pmol/L 17 (5) 12 (7) 12 (7) 0.175
a P �0.05 compared to the first tertile.b P �0.05 compared to the second tertile (post hoc Tamhane-T test).c Bold columns indicate the lowest tertile of serum folate or the highest tertiles of serum HCY and MMA.
Clinical Chemistry 53, No. 2, 2007 329
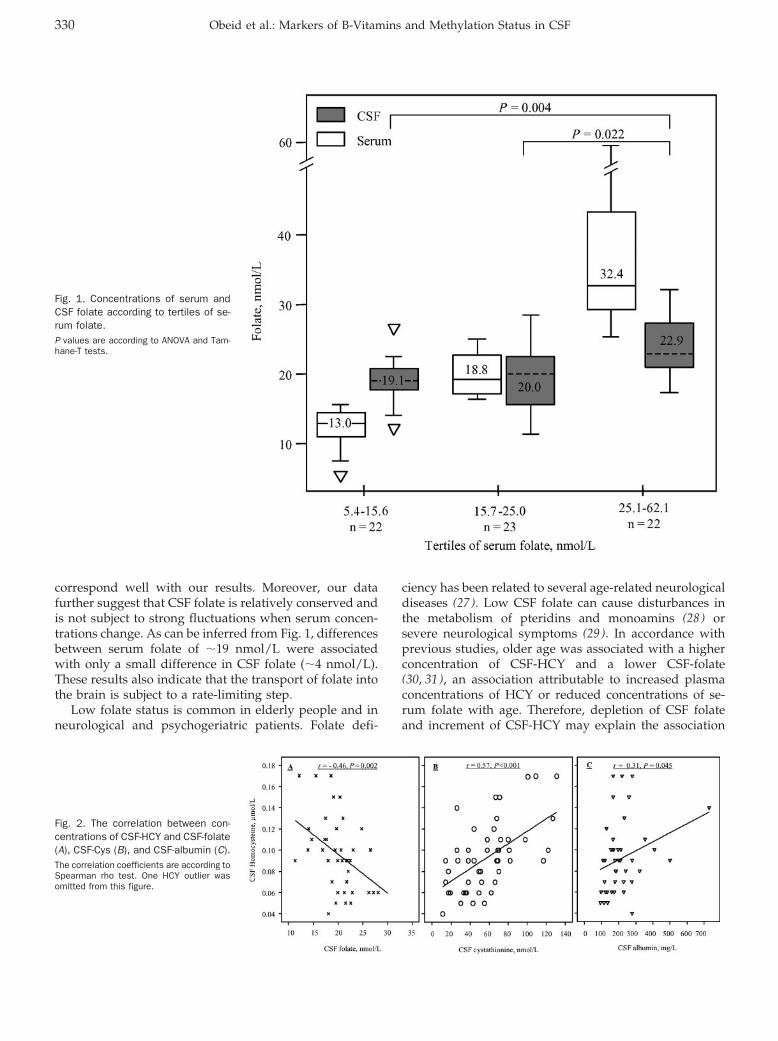
correspond well with our results. Moreover, our datafurther suggest that CSF folate is relatively conserved andis not subject to strong fluctuations when serum concen-trations change. As can be inferred from Fig. 1, differencesbetween serum folate of �19 nmol/L were associatedwith only a small difference in CSF folate (�4 nmol/L).These results also indicate that the transport of folate intothe brain is subject to a rate-limiting step.
Low folate status is common in elderly people and inneurological and psychogeriatric patients. Folate defi-
ciency has been related to several age-related neurologicaldiseases (27 ). Low CSF folate can cause disturbances inthe metabolism of pteridins and monoamins (28 ) orsevere neurological symptoms (29 ). In accordance withprevious studies, older age was associated with a higherconcentration of CSF-HCY and a lower CSF-folate(30, 31), an association attributable to increased plasmaconcentrations of HCY or reduced concentrations of se-rum folate with age. Therefore, depletion of CSF folateand increment of CSF-HCY may explain the association
Fig. 1. Concentrations of serum andCSF folate according to tertiles of se-rum folate.P values are according to ANOVA and Tam-hane-T tests.
Fig. 2. The correlation between con-centrations of CSF-HCY and CSF-folate(A), CSF-Cys (B), and CSF-albumin (C).The correlation coefficients are according toSpearman rho test. One HCY outlier wasomitted from this figure.
330 Obeid et al.: Markers of B-Vitamins and Methylation Status in CSF
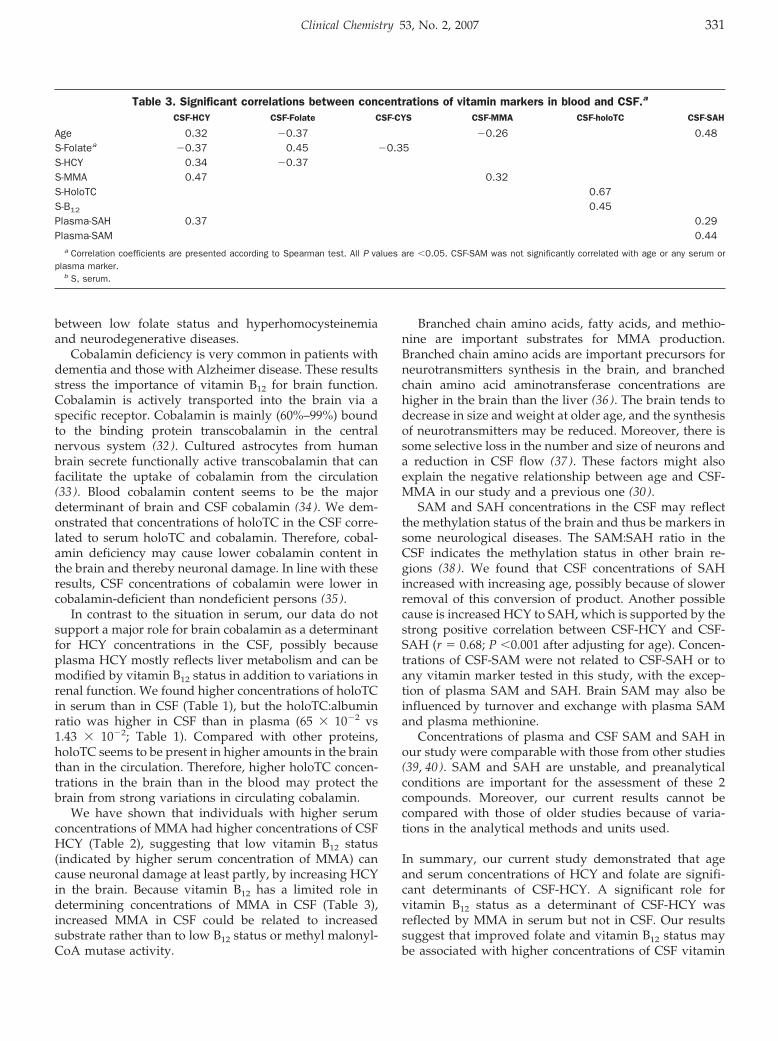
between low folate status and hyperhomocysteinemiaand neurodegenerative diseases.
Cobalamin deficiency is very common in patients withdementia and those with Alzheimer disease. These resultsstress the importance of vitamin B12 for brain function.Cobalamin is actively transported into the brain via aspecific receptor. Cobalamin is mainly (60%–99%) boundto the binding protein transcobalamin in the centralnervous system (32 ). Cultured astrocytes from humanbrain secrete functionally active transcobalamin that canfacilitate the uptake of cobalamin from the circulation(33 ). Blood cobalamin content seems to be the majordeterminant of brain and CSF cobalamin (34 ). We dem-onstrated that concentrations of holoTC in the CSF corre-lated to serum holoTC and cobalamin. Therefore, cobal-amin deficiency may cause lower cobalamin content inthe brain and thereby neuronal damage. In line with theseresults, CSF concentrations of cobalamin were lower incobalamin-deficient than nondeficient persons (35 ).
In contrast to the situation in serum, our data do notsupport a major role for brain cobalamin as a determinantfor HCY concentrations in the CSF, possibly becauseplasma HCY mostly reflects liver metabolism and can bemodified by vitamin B12 status in addition to variations inrenal function. We found higher concentrations of holoTCin serum than in CSF (Table 1), but the holoTC:albuminratio was higher in CSF than in plasma (65 � 10�2 vs1.43 � 10�2; Table 1). Compared with other proteins,holoTC seems to be present in higher amounts in the brainthan in the circulation. Therefore, higher holoTC concen-trations in the brain than in the blood may protect thebrain from strong variations in circulating cobalamin.
We have shown that individuals with higher serumconcentrations of MMA had higher concentrations of CSFHCY (Table 2), suggesting that low vitamin B12 status(indicated by higher serum concentration of MMA) cancause neuronal damage at least partly, by increasing HCYin the brain. Because vitamin B12 has a limited role indetermining concentrations of MMA in CSF (Table 3),increased MMA in CSF could be related to increasedsubstrate rather than to low B12 status or methyl malonyl-CoA mutase activity.
Branched chain amino acids, fatty acids, and methio-nine are important substrates for MMA production.Branched chain amino acids are important precursors forneurotransmitters synthesis in the brain, and branchedchain amino acid aminotransferase concentrations arehigher in the brain than the liver (36 ). The brain tends todecrease in size and weight at older age, and the synthesisof neurotransmitters may be reduced. Moreover, there issome selective loss in the number and size of neurons anda reduction in CSF flow (37 ). These factors might alsoexplain the negative relationship between age and CSF-MMA in our study and a previous one (30 ).
SAM and SAH concentrations in the CSF may reflectthe methylation status of the brain and thus be markers insome neurological diseases. The SAM:SAH ratio in theCSF indicates the methylation status in other brain re-gions (38 ). We found that CSF concentrations of SAHincreased with increasing age, possibly because of slowerremoval of this conversion of product. Another possiblecause is increased HCY to SAH, which is supported by thestrong positive correlation between CSF-HCY and CSF-SAH (r � 0.68; P �0.001 after adjusting for age). Concen-trations of CSF-SAM were not related to CSF-SAH or toany vitamin marker tested in this study, with the excep-tion of plasma SAM and SAH. Brain SAM may also beinfluenced by turnover and exchange with plasma SAMand plasma methionine.
Concentrations of plasma and CSF SAM and SAH inour study were comparable with those from other studies(39, 40). SAM and SAH are unstable, and preanalyticalconditions are important for the assessment of these 2compounds. Moreover, our current results cannot becompared with those of older studies because of varia-tions in the analytical methods and units used.
In summary, our current study demonstrated that ageand serum concentrations of HCY and folate are signifi-cant determinants of CSF-HCY. A significant role forvitamin B12 status as a determinant of CSF-HCY wasreflected by MMA in serum but not in CSF. Our resultssuggest that improved folate and vitamin B12 status maybe associated with higher concentrations of CSF vitamin
Table 3. Significant correlations between concentrations of vitamin markers in blood and CSF.a
CSF-HCY CSF-Folate CSF-CYS CSF-MMA CSF-holoTC CSF-SAH
Age 0.32 �0.37 �0.26 0.48S-Folatea �0.37 0.45 �0.35S-HCY 0.34 �0.37S-MMA 0.47 0.32S-HoloTC 0.67S-B12 0.45Plasma-SAH 0.37 0.29Plasma-SAM 0.44
a Correlation coefficients are presented according to Spearman test. All P values are �0.05. CSF-SAM was not significantly correlated with age or any serum orplasma marker.
b S, serum.
Clinical Chemistry 53, No. 2, 2007 331
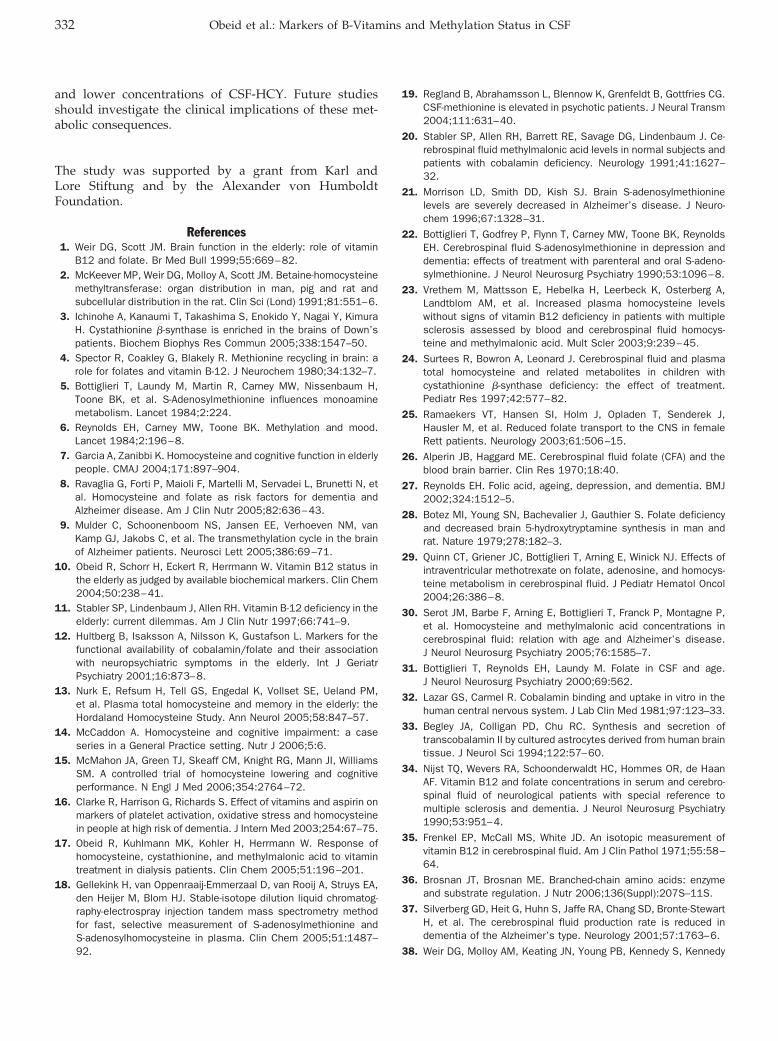
and lower concentrations of CSF-HCY. Future studiesshould investigate the clinical implications of these met-abolic consequences.
The study was supported by a grant from Karl andLore Stiftung and by the Alexander von HumboldtFoundation.
References1. Weir DG, Scott JM. Brain function in the elderly: role of vitamin
B12 and folate. Br Med Bull 1999;55:669–82.2. McKeever MP, Weir DG, Molloy A, Scott JM. Betaine-homocysteine
methyltransferase: organ distribution in man, pig and rat andsubcellular distribution in the rat. Clin Sci (Lond) 1991;81:551–6.
3. Ichinohe A, Kanaumi T, Takashima S, Enokido Y, Nagai Y, KimuraH. Cystathionine �-synthase is enriched in the brains of Down’spatients. Biochem Biophys Res Commun 2005;338:1547–50.
4. Spector R, Coakley G, Blakely R. Methionine recycling in brain: arole for folates and vitamin B-12. J Neurochem 1980;34:132–7.
5. Bottiglieri T, Laundy M, Martin R, Carney MW, Nissenbaum H,Toone BK, et al. S-Adenosylmethionine influences monoaminemetabolism. Lancet 1984;2:224.
6. Reynolds EH, Carney MW, Toone BK. Methylation and mood.Lancet 1984;2:196–8.
7. Garcia A, Zanibbi K. Homocysteine and cognitive function in elderlypeople. CMAJ 2004;171:897–904.
8. Ravaglia G, Forti P, Maioli F, Martelli M, Servadei L, Brunetti N, etal. Homocysteine and folate as risk factors for dementia andAlzheimer disease. Am J Clin Nutr 2005;82:636–43.
9. Mulder C, Schoonenboom NS, Jansen EE, Verhoeven NM, vanKamp GJ, Jakobs C, et al. The transmethylation cycle in the brainof Alzheimer patients. Neurosci Lett 2005;386:69–71.
10. Obeid R, Schorr H, Eckert R, Herrmann W. Vitamin B12 status inthe elderly as judged by available biochemical markers. Clin Chem2004;50:238–41.
11. Stabler SP, Lindenbaum J, Allen RH. Vitamin B-12 deficiency in theelderly: current dilemmas. Am J Clin Nutr 1997;66:741–9.
12. Hultberg B, Isaksson A, Nilsson K, Gustafson L. Markers for thefunctional availability of cobalamin/folate and their associationwith neuropsychiatric symptoms in the elderly. Int J GeriatrPsychiatry 2001;16:873–8.
13. Nurk E, Refsum H, Tell GS, Engedal K, Vollset SE, Ueland PM,et al. Plasma total homocysteine and memory in the elderly: theHordaland Homocysteine Study. Ann Neurol 2005;58:847–57.
14. McCaddon A. Homocysteine and cognitive impairment: a caseseries in a General Practice setting. Nutr J 2006;5:6.
15. McMahon JA, Green TJ, Skeaff CM, Knight RG, Mann JI, WilliamsSM. A controlled trial of homocysteine lowering and cognitiveperformance. N Engl J Med 2006;354:2764–72.
16. Clarke R, Harrison G, Richards S. Effect of vitamins and aspirin onmarkers of platelet activation, oxidative stress and homocysteinein people at high risk of dementia. J Intern Med 2003;254:67–75.
17. Obeid R, Kuhlmann MK, Kohler H, Herrmann W. Response ofhomocysteine, cystathionine, and methylmalonic acid to vitamintreatment in dialysis patients. Clin Chem 2005;51:196–201.
18. Gellekink H, van Oppenraaij-Emmerzaal D, van Rooij A, Struys EA,den Heijer M, Blom HJ. Stable-isotope dilution liquid chromatog-raphy-electrospray injection tandem mass spectrometry methodfor fast, selective measurement of S-adenosylmethionine andS-adenosylhomocysteine in plasma. Clin Chem 2005;51:1487–92.
19. Regland B, Abrahamsson L, Blennow K, Grenfeldt B, Gottfries CG.CSF-methionine is elevated in psychotic patients. J Neural Transm2004;111:631–40.
20. Stabler SP, Allen RH, Barrett RE, Savage DG, Lindenbaum J. Ce-rebrospinal fluid methylmalonic acid levels in normal subjects andpatients with cobalamin deficiency. Neurology 1991;41:1627–32.
21. Morrison LD, Smith DD, Kish SJ. Brain S-adenosylmethioninelevels are severely decreased in Alzheimer’s disease. J Neuro-chem 1996;67:1328–31.
22. Bottiglieri T, Godfrey P, Flynn T, Carney MW, Toone BK, ReynoldsEH. Cerebrospinal fluid S-adenosylmethionine in depression anddementia: effects of treatment with parenteral and oral S-adeno-sylmethionine. J Neurol Neurosurg Psychiatry 1990;53:1096–8.
23. Vrethem M, Mattsson E, Hebelka H, Leerbeck K, Osterberg A,Landtblom AM, et al. Increased plasma homocysteine levelswithout signs of vitamin B12 deficiency in patients with multiplesclerosis assessed by blood and cerebrospinal fluid homocys-teine and methylmalonic acid. Mult Scler 2003;9:239–45.
24. Surtees R, Bowron A, Leonard J. Cerebrospinal fluid and plasmatotal homocysteine and related metabolites in children withcystathionine �-synthase deficiency: the effect of treatment.Pediatr Res 1997;42:577–82.
25. Ramaekers VT, Hansen SI, Holm J, Opladen T, Senderek J,Hausler M, et al. Reduced folate transport to the CNS in femaleRett patients. Neurology 2003;61:506–15.
26. Alperin JB, Haggard ME. Cerebrospinal fluid folate (CFA) and theblood brain barrier. Clin Res 1970;18:40.
27. Reynolds EH. Folic acid, ageing, depression, and dementia. BMJ2002;324:1512–5.
28. Botez MI, Young SN, Bachevalier J, Gauthier S. Folate deficiencyand decreased brain 5-hydroxytryptamine synthesis in man andrat. Nature 1979;278:182–3.
29. Quinn CT, Griener JC, Bottiglieri T, Arning E, Winick NJ. Effects ofintraventricular methotrexate on folate, adenosine, and homocys-teine metabolism in cerebrospinal fluid. J Pediatr Hematol Oncol2004;26:386–8.
30. Serot JM, Barbe F, Arning E, Bottiglieri T, Franck P, Montagne P,et al. Homocysteine and methylmalonic acid concentrations incerebrospinal fluid: relation with age and Alzheimer’s disease.J Neurol Neurosurg Psychiatry 2005;76:1585–7.
31. Bottiglieri T, Reynolds EH, Laundy M. Folate in CSF and age.J Neurol Neurosurg Psychiatry 2000;69:562.
32. Lazar GS, Carmel R. Cobalamin binding and uptake in vitro in thehuman central nervous system. J Lab Clin Med 1981;97:123–33.
33. Begley JA, Colligan PD, Chu RC. Synthesis and secretion oftranscobalamin II by cultured astrocytes derived from human braintissue. J Neurol Sci 1994;122:57–60.
34. Nijst TQ, Wevers RA, Schoonderwaldt HC, Hommes OR, de HaanAF. Vitamin B12 and folate concentrations in serum and cerebro-spinal fluid of neurological patients with special reference tomultiple sclerosis and dementia. J Neurol Neurosurg Psychiatry1990;53:951–4.
35. Frenkel EP, McCall MS, White JD. An isotopic measurement ofvitamin B12 in cerebrospinal fluid. Am J Clin Pathol 1971;55:58–64.
36. Brosnan JT, Brosnan ME. Branched-chain amino acids: enzymeand substrate regulation. J Nutr 2006;136(Suppl):207S–11S.
37. Silverberg GD, Heit G, Huhn S, Jaffe RA, Chang SD, Bronte-StewartH, et al. The cerebrospinal fluid production rate is reduced indementia of the Alzheimer’s type. Neurology 2001;57:1763–6.
38. Weir DG, Molloy AM, Keating JN, Young PB, Kennedy S, Kennedy
332 Obeid et al.: Markers of B-Vitamins and Methylation Status in CSF

DG, et al. Correlation of the ratio of S-adenosyl-L-methionine toS-adenosyl-L-homocysteine in the brain and cerebrospinal fluid ofthe pig: implications for the determination of this methylation ratioin human brain. Clin Sci (Lond) 1992;82:93–7.
39. Stabler SP, Allen RH. Quantification of serum and urinary S-adenosylmethionine and S-adenosylhomocysteine by stable-iso-
tope-dilution liquid chromatography-mass spectrometry. ClinChem 2004;50:365–72.
40. Baric I, Fumic K, Glenn B, Cuk M, Schulze A, Finkelstein JD, et al.S-adenosylhomocysteine hydrolase deficiency in a human: a ge-netic disorder of methionine metabolism. Proc Natl Acad Sci U S A2004;101:4234–9.
Clinical Chemistry 53, No. 2, 2007 333
Novel Biosensor–Based Analytic Device for theDetection of Anti–Double-Stranded
DNA AntibodiesAlexander Buhl,1 Jochen H. Metzger,1 Niels H. H. Heegaard,2
Philipp von Landenberg,3 Martin Fleck,4 and Peter B. Luppa1*
Background: Patients with systemic lupus erythemato-sus (SLE) develop a wide variety of serologic manifes-tations, including double-stranded DNA autoantibodies(anti-dsDNA). The determination of the potentiallypathogenic autoantibodies is diagnostically relevant.Methods: We developed a novel surface plasmon reso-nance (SPR) biosensor chip for studies of dsDNA andanti-dsDNA binding. A synthetic oligonucleotide wascoupled to biotinylated human transferrin, hybridizedwith the complementary antistrand, and ligated with ahuman recombinant dsDNA fragment 233 bp in length.After surface immobilization of this antigenic construct,diluted sera from SLE patients and healthy donors wereanalyzed with the resulting SPR biosensor system.Results: This SPR biosensor allowed specific detectionof anti-dsDNA. In pilot experiments, sera from SLEpatients were distinguished from control sera. We alsoconfirmed the specificity of this biosensor by supple-menting anti-dsDNA–positive sera with salmon spermDNA, which blocked the surface binding of anti-dsDNA in a concentration-dependent manner.Conclusions: An SPR biosensor monitors interactionsin real time under homogeneous conditions, providinginformation about binding kinetics and affinities. Itsapplicability critically depends on the design of the
solid-state surface of the sensor chips. Covalently im-mobilizing dsDNA as the antigen to the surface in aflow-through cell assured maximal stability for multipleserum injections and regeneration cycles. This tech-nique, which adds a new analytic quality to existingmethods, may be beneficial in the diagnosis and clinicalmonitoring of SLE.© 2007 American Association for Clinical Chemistry
Systemic lupus erythematosus (SLE)5, often consideredthe prototypic systemic autoimmune disease, is an im-mune system disorder associated with the production ofan entire set of different autoantibodies, predominantlyagainst components of the cell nucleus (1, 2). Althoughthe exact etiology remains elusive, the wide range ofknown genetic and environmental factors cause immuno-regulatory abnormalities that contribute to disease mani-festation. Women, especially of childbearing age, andindividuals of African-American descent are more likelythan men to be affected (3 ).
According to the SLE classification criteria of theAmerican College of Rheumatology (4, 5), at least 4 of 11criteria have to be met for disease diagnosis. There is adelay of �2 years between the onset of symptoms andfinal diagnosis (6 ), reflecting the fact that reliably diag-nosing SLE at an early stage is still a difficult task. Boththe detection of antinuclear antibodies by immunofluo-rescence and findings of “antibodies to native DNA inabnormal titer” (American College of Rheumatology cri-terion 10.b) are of high diagnostic significance and areconsidered specific (7 ) and early (8 ) markers for SLE.
1 Institute of Clinical Chemistry and Pathobiochemistry, Klinikum rechtsder Isar der Techni-schen Universitat Munchen, Munchen, Germany.
2 Statens Serum Institut, Copenhagen, Denmark.3 Institute of Clinical Chemistry and Laboratory Medicine, Klinikum der
Johannes Gutenberg-Universitat Mainz, Mainz, Germany.4 Department of Internal Medicine I, Klinikum der Universitat Regens-
burg, Germany.*Address correspondence to this author at: Institute of Clinical Chemistry
and Pathobiochemistry, Klinikum rechts der Isar der Techni-schen UniversitatMunchen, Ismaninger Str. 22, D-81675 Munchen, Germany. Fax 49-89-4140-4875; e-mail [email protected].
Received July 28, 2006; accepted November 20, 2006.Previously published online at DOI: 10.1373/clinchem.2006.077339
5 Nonstandard abbreviations: Anti-dsDNA, double-stranded DNA auto-antibodies; CHO, 5�-aldehyde–modified; EIA, enzyme immunoassay; hTf,human transferrin; ODN, oligodeoxynucleotide; SANH, succinimidyl 4-hy-drazinonicotinate acetone hydrazone; SLE, systemic lupus erythematosus;SPR, surface plasmon resonance; ssDNA, single-stranded DNA.
Clinical Chemistry 53:2334–341 (2007) Clinical Immunology
334
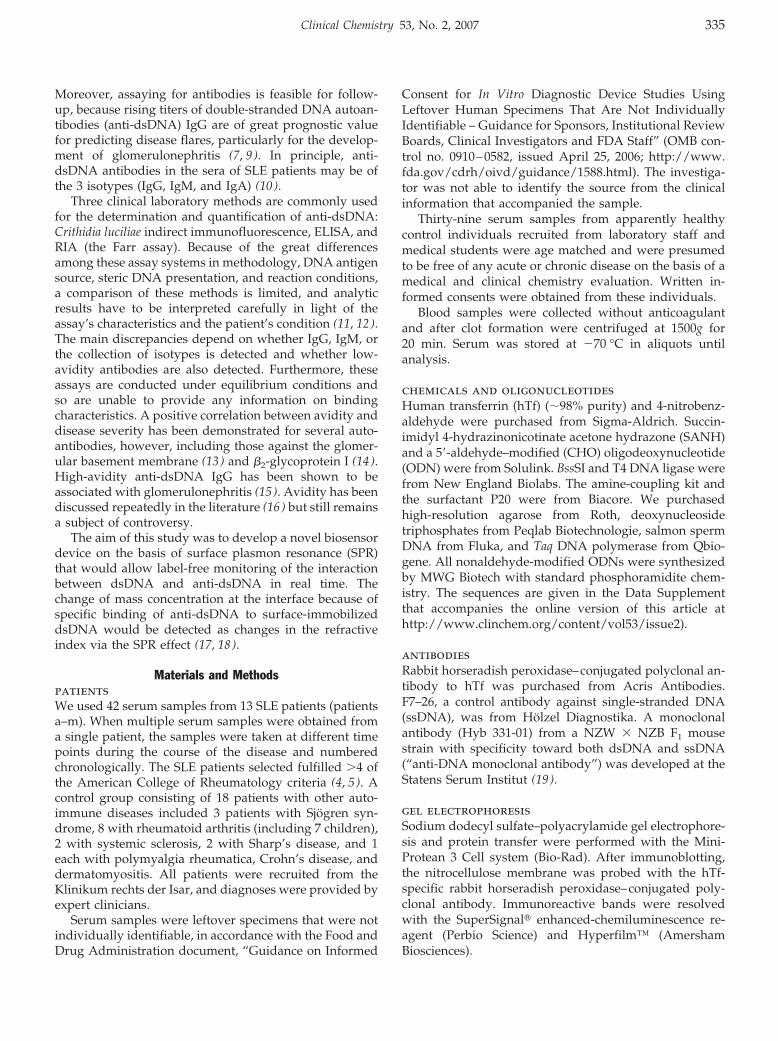
Moreover, assaying for antibodies is feasible for follow-up, because rising titers of double-stranded DNA autoan-tibodies (anti-dsDNA) IgG are of great prognostic valuefor predicting disease flares, particularly for the develop-ment of glomerulonephritis (7, 9). In principle, anti-dsDNA antibodies in the sera of SLE patients may be ofthe 3 isotypes (IgG, IgM, and IgA) (10 ).
Three clinical laboratory methods are commonly usedfor the determination and quantification of anti-dsDNA:Crithidia luciliae indirect immunofluorescence, ELISA, andRIA (the Farr assay). Because of the great differencesamong these assay systems in methodology, DNA antigensource, steric DNA presentation, and reaction conditions,a comparison of these methods is limited, and analyticresults have to be interpreted carefully in light of theassay’s characteristics and the patient’s condition (11, 12).The main discrepancies depend on whether IgG, IgM, orthe collection of isotypes is detected and whether low-avidity antibodies are also detected. Furthermore, theseassays are conducted under equilibrium conditions andso are unable to provide any information on bindingcharacteristics. A positive correlation between avidity anddisease severity has been demonstrated for several auto-antibodies, however, including those against the glomer-ular basement membrane (13 ) and �2-glycoprotein I (14 ).High-avidity anti-dsDNA IgG has been shown to beassociated with glomerulonephritis (15 ). Avidity has beendiscussed repeatedly in the literature (16 ) but still remainsa subject of controversy.
The aim of this study was to develop a novel biosensordevice on the basis of surface plasmon resonance (SPR)that would allow label-free monitoring of the interactionbetween dsDNA and anti-dsDNA in real time. Thechange of mass concentration at the interface because ofspecific binding of anti-dsDNA to surface-immobilizeddsDNA would be detected as changes in the refractiveindex via the SPR effect (17, 18).
Materials and MethodspatientsWe used 42 serum samples from 13 SLE patients (patientsa–m). When multiple serum samples were obtained froma single patient, the samples were taken at different timepoints during the course of the disease and numberedchronologically. The SLE patients selected fulfilled �4 ofthe American College of Rheumatology criteria (4, 5). Acontrol group consisting of 18 patients with other auto-immune diseases included 3 patients with Sjogren syn-drome, 8 with rheumatoid arthritis (including 7 children),2 with systemic sclerosis, 2 with Sharp’s disease, and 1each with polymyalgia rheumatica, Crohn’s disease, anddermatomyositis. All patients were recruited from theKlinikum rechts der Isar, and diagnoses were provided byexpert clinicians.
Serum samples were leftover specimens that were notindividually identifiable, in accordance with the Food andDrug Administration document, “Guidance on Informed
Consent for In Vitro Diagnostic Device Studies UsingLeftover Human Specimens That Are Not IndividuallyIdentifiable – Guidance for Sponsors, Institutional ReviewBoards, Clinical Investigators and FDA Staff” (OMB con-trol no. 0910–0582, issued April 25, 2006; http://www.fda.gov/cdrh/oivd/guidance/1588.html). The investiga-tor was not able to identify the source from the clinicalinformation that accompanied the sample.
Thirty-nine serum samples from apparently healthycontrol individuals recruited from laboratory staff andmedical students were age matched and were presumedto be free of any acute or chronic disease on the basis of amedical and clinical chemistry evaluation. Written in-formed consents were obtained from these individuals.
Blood samples were collected without anticoagulantand after clot formation were centrifuged at 1500g for20 min. Serum was stored at �70 °C in aliquots untilanalysis.
chemicals and oligonucleotidesHuman transferrin (hTf) (�98% purity) and 4-nitrobenz-aldehyde were purchased from Sigma-Aldrich. Succin-imidyl 4-hydrazinonicotinate acetone hydrazone (SANH)and a 5�-aldehyde–modified (CHO) oligodeoxynucleotide(ODN) were from Solulink. BssSI and T4 DNA ligase werefrom New England Biolabs. The amine-coupling kit andthe surfactant P20 were from Biacore. We purchasedhigh-resolution agarose from Roth, deoxynucleosidetriphosphates from Peqlab Biotechnologie, salmon spermDNA from Fluka, and Taq DNA polymerase from Qbio-gene. All nonaldehyde-modified ODNs were synthesizedby MWG Biotech with standard phosphoramidite chem-istry. The sequences are given in the Data Supplementthat accompanies the online version of this article athttp://www.clinchem.org/content/vol53/issue2).
antibodiesRabbit horseradish peroxidase–conjugated polyclonal an-tibody to hTf was purchased from Acris Antibodies.F7–26, a control antibody against single-stranded DNA(ssDNA), was from Holzel Diagnostika. A monoclonalantibody (Hyb 331-01) from a NZW � NZB F1 mousestrain with specificity toward both dsDNA and ssDNA(“anti-DNA monoclonal antibody”) was developed at theStatens Serum Institut (19 ).
gel electrophoresisSodium dodecyl sulfate–polyacrylamide gel electrophore-sis and protein transfer were performed with the Mini-Protean 3 Cell system (Bio-Rad). After immunoblotting,the nitrocellulose membrane was probed with the hTf-specific rabbit horseradish peroxidase–conjugated poly-clonal antibody. Immunoreactive bands were resolvedwith the SuperSignal� enhanced-chemiluminescence re-agent (Perbio Science) and Hyperfilm™ (AmershamBiosciences).
Clinical Chemistry 53, No. 2, 2007 335
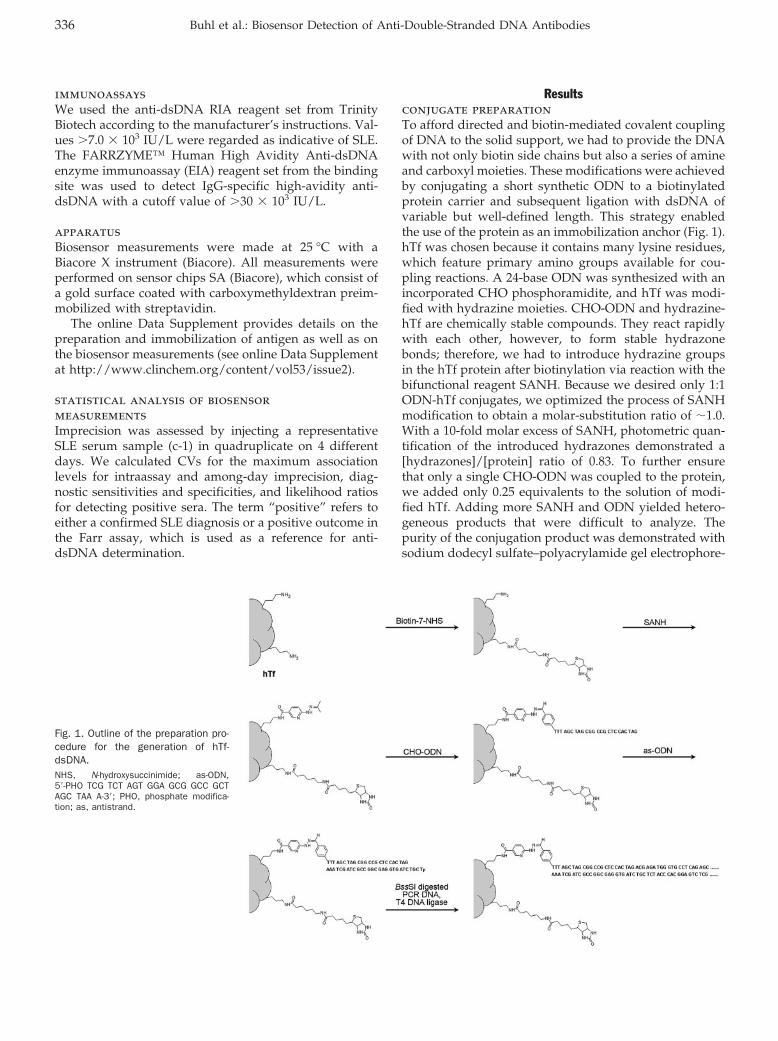
immunoassaysWe used the anti-dsDNA RIA reagent set from TrinityBiotech according to the manufacturer’s instructions. Val-ues �7.0 � 103 IU/L were regarded as indicative of SLE.The FARRZYME™ Human High Avidity Anti-dsDNAenzyme immunoassay (EIA) reagent set from the bindingsite was used to detect IgG-specific high-avidity anti-dsDNA with a cutoff value of �30 � 103 IU/L.
apparatusBiosensor measurements were made at 25 °C with aBiacore X instrument (Biacore). All measurements wereperformed on sensor chips SA (Biacore), which consist ofa gold surface coated with carboxymethyldextran preim-mobilized with streptavidin.
The online Data Supplement provides details on thepreparation and immobilization of antigen as well as onthe biosensor measurements (see online Data Supplementat http://www.clinchem.org/content/vol53/issue2).
statistical analysis of biosensormeasurementsImprecision was assessed by injecting a representativeSLE serum sample (c-1) in quadruplicate on 4 differentdays. We calculated CVs for the maximum associationlevels for intraassay and among-day imprecision, diag-nostic sensitivities and specificities, and likelihood ratiosfor detecting positive sera. The term “positive” refers toeither a confirmed SLE diagnosis or a positive outcome inthe Farr assay, which is used as a reference for anti-dsDNA determination.
Resultsconjugate preparationTo afford directed and biotin-mediated covalent couplingof DNA to the solid support, we had to provide the DNAwith not only biotin side chains but also a series of amineand carboxyl moieties. These modifications were achievedby conjugating a short synthetic ODN to a biotinylatedprotein carrier and subsequent ligation with dsDNA ofvariable but well-defined length. This strategy enabledthe use of the protein as an immobilization anchor (Fig. 1).hTf was chosen because it contains many lysine residues,which feature primary amino groups available for cou-pling reactions. A 24-base ODN was synthesized with anincorporated CHO phosphoramidite, and hTf was modi-fied with hydrazine moieties. CHO-ODN and hydrazine-hTf are chemically stable compounds. They react rapidlywith each other, however, to form stable hydrazonebonds; therefore, we had to introduce hydrazine groupsin the hTf protein after biotinylation via reaction with thebifunctional reagent SANH. Because we desired only 1:1ODN-hTf conjugates, we optimized the process of SANHmodification to obtain a molar-substitution ratio of �1.0.With a 10-fold molar excess of SANH, photometric quan-tification of the introduced hydrazones demonstrated a[hydrazones]/[protein] ratio of 0.83. To further ensurethat only a single CHO-ODN was coupled to the protein,we added only 0.25 equivalents to the solution of modi-fied hTf. Adding more SANH and ODN yielded hetero-geneous products that were difficult to analyze. Thepurity of the conjugation product was demonstrated withsodium dodecyl sulfate–polyacrylamide gel electrophore-
Fig. 1. Outline of the preparation pro-cedure for the generation of hTf-dsDNA.NHS, N-hydroxysuccinimide; as-ODN,5�-PHO TCG TCT AGT GGA GCG GCC GCTAGC TAA A-3�; PHO, phosphate modifica-tion; as, antistrand.
336 Buhl et al.: Biosensor Detection of Anti-Double-Stranded DNA Antibodies
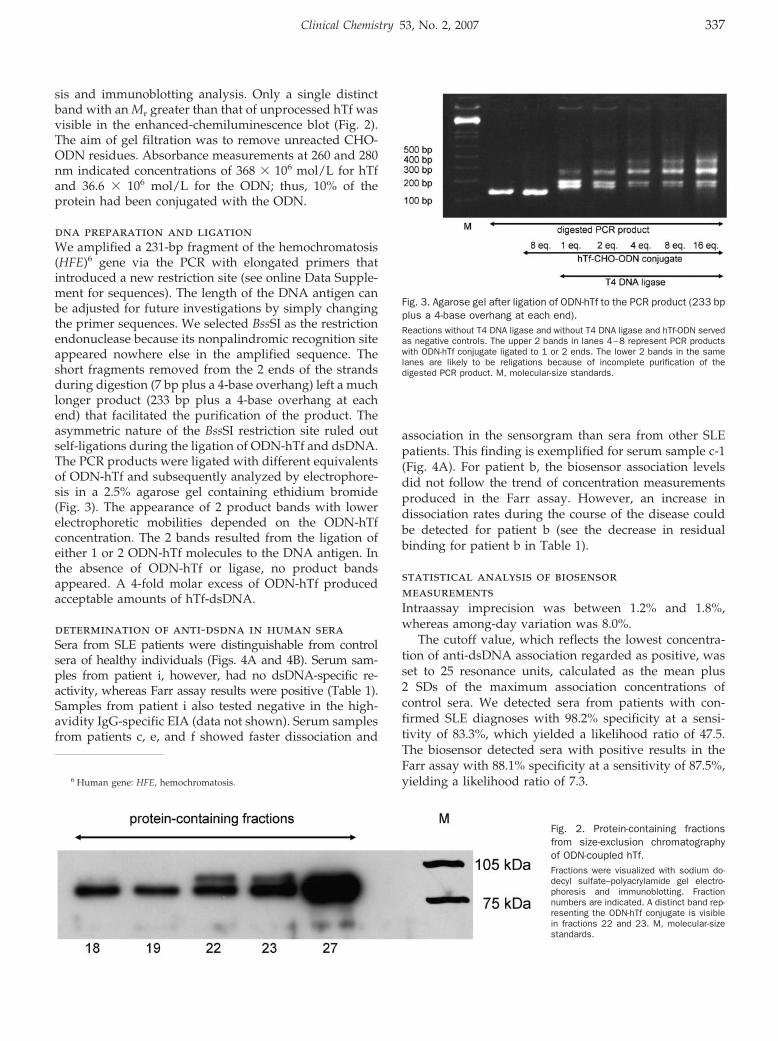
sis and immunoblotting analysis. Only a single distinctband with an Mr greater than that of unprocessed hTf wasvisible in the enhanced-chemiluminescence blot (Fig. 2).The aim of gel filtration was to remove unreacted CHO-ODN residues. Absorbance measurements at 260 and 280nm indicated concentrations of 368 � 106 mol/L for hTfand 36.6 � 106 mol/L for the ODN; thus, 10% of theprotein had been conjugated with the ODN.
dna preparation and ligationWe amplified a 231-bp fragment of the hemochromatosis(HFE)6 gene via the PCR with elongated primers thatintroduced a new restriction site (see online Data Supple-ment for sequences). The length of the DNA antigen canbe adjusted for future investigations by simply changingthe primer sequences. We selected BssSI as the restrictionendonuclease because its nonpalindromic recognition siteappeared nowhere else in the amplified sequence. Theshort fragments removed from the 2 ends of the strandsduring digestion (7 bp plus a 4-base overhang) left a muchlonger product (233 bp plus a 4-base overhang at eachend) that facilitated the purification of the product. Theasymmetric nature of the BssSI restriction site ruled outself-ligations during the ligation of ODN-hTf and dsDNA.The PCR products were ligated with different equivalentsof ODN-hTf and subsequently analyzed by electrophore-sis in a 2.5% agarose gel containing ethidium bromide(Fig. 3). The appearance of 2 product bands with lowerelectrophoretic mobilities depended on the ODN-hTfconcentration. The 2 bands resulted from the ligation ofeither 1 or 2 ODN-hTf molecules to the DNA antigen. Inthe absence of ODN-hTf or ligase, no product bandsappeared. A 4-fold molar excess of ODN-hTf producedacceptable amounts of hTf-dsDNA.
determination of anti-dsdna in human seraSera from SLE patients were distinguishable from controlsera of healthy individuals (Figs. 4A and 4B). Serum sam-ples from patient i, however, had no dsDNA-specific re-activity, whereas Farr assay results were positive (Table 1).Samples from patient i also tested negative in the high-avidity IgG-specific EIA (data not shown). Serum samplesfrom patients c, e, and f showed faster dissociation and
association in the sensorgram than sera from other SLEpatients. This finding is exemplified for serum sample c-1(Fig. 4A). For patient b, the biosensor association levelsdid not follow the trend of concentration measurementsproduced in the Farr assay. However, an increase indissociation rates during the course of the disease couldbe detected for patient b (see the decrease in residualbinding for patient b in Table 1).
statistical analysis of biosensormeasurementsIntraassay imprecision was between 1.2% and 1.8%,whereas among-day variation was 8.0%.
The cutoff value, which reflects the lowest concentra-tion of anti-dsDNA association regarded as positive, wasset to 25 resonance units, calculated as the mean plus2 SDs of the maximum association concentrations ofcontrol sera. We detected sera from patients with con-firmed SLE diagnoses with 98.2% specificity at a sensi-tivity of 83.3%, which yielded a likelihood ratio of 47.5.The biosensor detected sera with positive results in theFarr assay with 88.1% specificity at a sensitivity of 87.5%,yielding a likelihood ratio of 7.3.6 Human gene: HFE, hemochromatosis.
Fig. 2. Protein-containing fractionsfrom size-exclusion chromatographyof ODN-coupled hTf.Fractions were visualized with sodium do-decyl sulfate–polyacrylamide gel electro-phoresis and immunoblotting. Fractionnumbers are indicated. A distinct band rep-resenting the ODN-hTf conjugate is visiblein fractions 22 and 23. M, molecular-sizestandards.
Fig. 3. Agarose gel after ligation of ODN-hTf to the PCR product (233 bpplus a 4-base overhang at each end).Reactions without T4 DNA ligase and without T4 DNA ligase and hTf-ODN servedas negative controls. The upper 2 bands in lanes 4–8 represent PCR productswith ODN-hTf conjugate ligated to 1 or 2 ends. The lower 2 bands in the samelanes are likely to be religations because of incomplete purification of thedigested PCR product. M, molecular-size standards.
Clinical Chemistry 53, No. 2, 2007 337
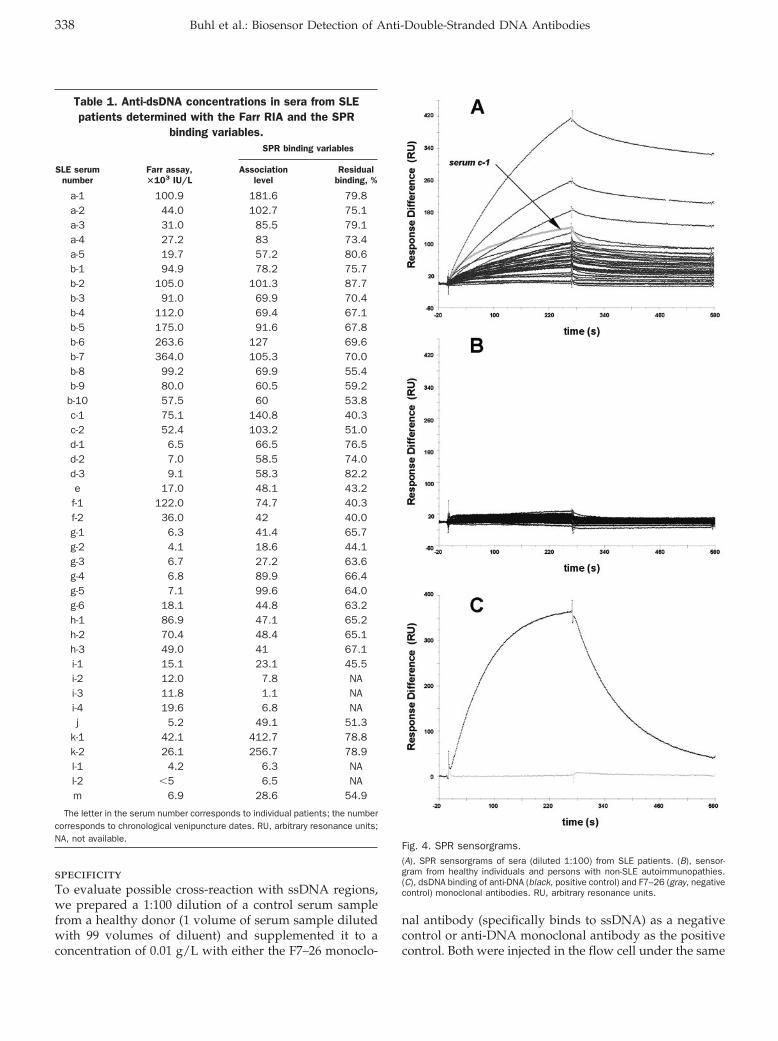
specificityTo evaluate possible cross-reaction with ssDNA regions,we prepared a 1:100 dilution of a control serum samplefrom a healthy donor (1 volume of serum sample dilutedwith 99 volumes of diluent) and supplemented it to aconcentration of 0.01 g/L with either the F7–26 monoclo-
nal antibody (specifically binds to ssDNA) as a negativecontrol or anti-DNA monoclonal antibody as the positivecontrol. Both were injected in the flow cell under the same
Fig. 4. SPR sensorgrams.(A), SPR sensorgrams of sera (diluted 1:100) from SLE patients. (B), sensor-gram from healthy individuals and persons with non-SLE autoimmunopathies.(C), dsDNA binding of anti-DNA (black, positive control) and F7–26 (gray, negativecontrol) monoclonal antibodies. RU, arbitrary resonance units.
Table 1. Anti-dsDNA concentrations in sera from SLEpatients determined with the Farr RIA and the SPR
binding variables.
SLE serumnumber
Farr assay,�103 IU/L
SPR binding variables
Associationlevel
Residualbinding, %
a-1 100.9 181.6 79.8a-2 44.0 102.7 75.1a-3 31.0 85.5 79.1a-4 27.2 83 73.4a-5 19.7 57.2 80.6b-1 94.9 78.2 75.7b-2 105.0 101.3 87.7b-3 91.0 69.9 70.4b-4 112.0 69.4 67.1b-5 175.0 91.6 67.8b-6 263.6 127 69.6b-7 364.0 105.3 70.0b-8 99.2 69.9 55.4b-9 80.0 60.5 59.2
b-10 57.5 60 53.8c-1 75.1 140.8 40.3c-2 52.4 103.2 51.0d-1 6.5 66.5 76.5d-2 7.0 58.5 74.0d-3 9.1 58.3 82.2e 17.0 48.1 43.2f-1 122.0 74.7 40.3f-2 36.0 42 40.0g-1 6.3 41.4 65.7g-2 4.1 18.6 44.1g-3 6.7 27.2 63.6g-4 6.8 89.9 66.4g-5 7.1 99.6 64.0g-6 18.1 44.8 63.2h-1 86.9 47.1 65.2h-2 70.4 48.4 65.1h-3 49.0 41 67.1i-1 15.1 23.1 45.5i-2 12.0 7.8 NAi-3 11.8 1.1 NAi-4 19.6 6.8 NAj 5.2 49.1 51.3
k-1 42.1 412.7 78.8k-2 26.1 256.7 78.9l-1 4.2 6.3 NAl-2 �5 6.5 NAm 6.9 28.6 54.9
The letter in the serum number corresponds to individual patients; the numbercorresponds to chronological venipuncture dates. RU, arbitrary resonance units;NA, not available.
338 Buhl et al.: Biosensor Detection of Anti-Double-Stranded DNA Antibodies
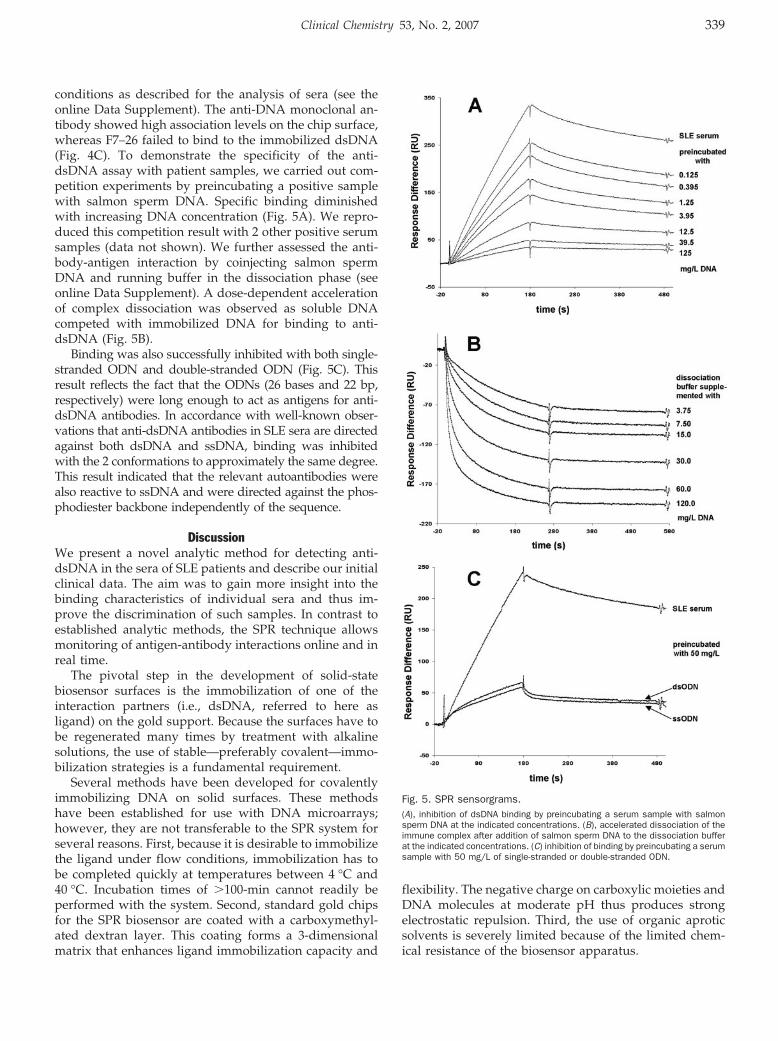
conditions as described for the analysis of sera (see theonline Data Supplement). The anti-DNA monoclonal an-tibody showed high association levels on the chip surface,whereas F7–26 failed to bind to the immobilized dsDNA(Fig. 4C). To demonstrate the specificity of the anti-dsDNA assay with patient samples, we carried out com-petition experiments by preincubating a positive samplewith salmon sperm DNA. Specific binding diminishedwith increasing DNA concentration (Fig. 5A). We repro-duced this competition result with 2 other positive serumsamples (data not shown). We further assessed the anti-body-antigen interaction by coinjecting salmon spermDNA and running buffer in the dissociation phase (seeonline Data Supplement). A dose-dependent accelerationof complex dissociation was observed as soluble DNAcompeted with immobilized DNA for binding to anti-dsDNA (Fig. 5B).
Binding was also successfully inhibited with both single-stranded ODN and double-stranded ODN (Fig. 5C). Thisresult reflects the fact that the ODNs (26 bases and 22 bp,respectively) were long enough to act as antigens for anti-dsDNA antibodies. In accordance with well-known obser-vations that anti-dsDNA antibodies in SLE sera are directedagainst both dsDNA and ssDNA, binding was inhibitedwith the 2 conformations to approximately the same degree.This result indicated that the relevant autoantibodies werealso reactive to ssDNA and were directed against the phos-phodiester backbone independently of the sequence.
DiscussionWe present a novel analytic method for detecting anti-dsDNA in the sera of SLE patients and describe our initialclinical data. The aim was to gain more insight into thebinding characteristics of individual sera and thus im-prove the discrimination of such samples. In contrast toestablished analytic methods, the SPR technique allowsmonitoring of antigen-antibody interactions online and inreal time.
The pivotal step in the development of solid-statebiosensor surfaces is the immobilization of one of theinteraction partners (i.e., dsDNA, referred to here asligand) on the gold support. Because the surfaces have tobe regenerated many times by treatment with alkalinesolutions, the use of stable—preferably covalent—immo-bilization strategies is a fundamental requirement.
Several methods have been developed for covalentlyimmobilizing DNA on solid surfaces. These methodshave been established for use with DNA microarrays;however, they are not transferable to the SPR system forseveral reasons. First, because it is desirable to immobilizethe ligand under flow conditions, immobilization has tobe completed quickly at temperatures between 4 °C and40 °C. Incubation times of �100-min cannot readily beperformed with the system. Second, standard gold chipsfor the SPR biosensor are coated with a carboxymethyl-ated dextran layer. This coating forms a 3-dimensionalmatrix that enhances ligand immobilization capacity and
flexibility. The negative charge on carboxylic moieties andDNA molecules at moderate pH thus produces strongelectrostatic repulsion. Third, the use of organic aproticsolvents is severely limited because of the limited chem-ical resistance of the biosensor apparatus.
Fig. 5. SPR sensorgrams.(A), inhibition of dsDNA binding by preincubating a serum sample with salmonsperm DNA at the indicated concentrations. (B), accelerated dissociation of theimmune complex after addition of salmon sperm DNA to the dissociation bufferat the indicated concentrations. (C) inhibition of binding by preincubating a serumsample with 50 mg/L of single-stranded or double-stranded ODN.
Clinical Chemistry 53, No. 2, 2007 339
Our immobilization strategy meets all of these ambi-tious requirements through the use of 2 coupling chem-istries: biotin/streptavidin for fast and efficient capturingof ligand at the surface of streptavidin-coated chips,followed by covalent amine coupling for the final stabili-zation and rigid surface presentation of the dsDNA.
A synthetic single-stranded ODN was covalently cou-pled to biotinylated hTf. We used aldehyde and hydra-zine chemistry for this conjugation (20 ). hTf was used inexcess to prevent high losses of CHO-ODN and formationof poorly defined side products. Product analysis re-vealed homogeneous 1:1 conjugation of hTf and ODN (seeFig. 2).
Because the source of the DNA used and its prepara-tion play a decisive role in the quality of the resultsobtained from an anti-dsDNA assay, we used humanrecombinant DNA amplified via the PCR. Immobilizationprovides a defined steric access to the DNA and avoidsprotein contamination. In this respect, this method con-trasts with the C. luciliae indirect immunofluorescencetechnique, in which histone impurities may lead to cross-reactivity (21 ), and with the Farr assay, in which radioly-sis may lead to DNA decomposition (22 ).
The most important feature of our SPR biosensorshould be the ability to differentiate the sera from SLEpatients and healthy control individuals, and we wereable to demonstrate this capacity in pilot experimentswith serum samples from healthy individuals, patientswith non-SLE autoimmunopathies, and SLE patients. Useof a cutoff value of 25 resonance units in the SPR bio-sensor assay offers superb specificity (98%) at a highsensitivity (83%); thus, the results obtained with thismethod appear to approximate the performance of theFarr assay. Table 1 compares anti-dsDNA concentrationsobtained with the Farr assay with both maximum associ-ation concentrations at the end of association phases inthe SPR biosensor and the percentages of residual bindingafter 300 s of dissociation. As expected, there is no simplecorrelation between concentrations obtained with the Farrassay and binding values obtained in the biosensor. Thisfinding is due to the fundamentally different methodolo-gies of the 2 assay systems. In contrast to results derivedwith the Farr assay, biosensor association levels dependnot only on antibody concentrations but also on theiraffinities. Our initial data demonstrate that the SPR bio-sensor–based analytic method gives more detailed infor-mation about the anti-dsDNA in SLE sera.
Patient i, who tested positive in the Farr assay andnegative in the high-avidity IgG-specific EIA, tested neg-ative with our biosensor system. The Farr assay and theEIA method use a high salt concentration (Farr assay)or stringent washing steps (EIA) in the first analyticphase to differentiate high-avidity antibodies. In the sec-ond step, however, all bound antibodies contributeequally to the quantification. The biosensor allows fur-ther differentiation by means of a direct impact of anti-body avidity on the respective sensorgram. In particular,
anti-dsDNA from patient i caused low association levelsin our system. The antibodies were avid enough, how-ever, to produce a small signal in the Farr assay but not inthe EIA.
The different shapes of the binding curves, which werecaused by different binding kinetics, suggest that vary-ing combinations of anti-dsDNA isotypes are present inthe sera. This point is exemplified in patient c (Fig. 4A).Different shapes of the characteristic curves may indicateeither IgG or IgM isotype predominance. Whereas IgMshows a delayed association phase and weak dissociationcorrelated with high residual binding, IgG exhibits fasterassociation and a variable dissociation phase. Accord-ingly, the increase in dissociation rates during the courseof the disease, as seen in the sera samples from patient b(Table 1), hints at changing isotype patterns. Such chang-ing patterns would be associated with alterations inavidities and antibody molecular masses and are a cred-ible explanation for the lack of correlation of the Farrassay and biosensor assay data. Further investigations,especially comparisons of Farr assay and biosensor assayresults with clinical records, are required to understandthe significance of these differences.
The formation of ssDNA regions within the dsDNAmolecule has to be considered. Autoantibodies againstssDNA are also used as markers for SLE, but their lack ofspecificity (23 ) makes their determination undesirable.Antibodies that are of high diagnostic or predictive valuefor SLE are dsDNA specific and of high affinity. Someassays use a single-stranded control to exclude cross-reactivity. One possibility for evaluating the reactivity ofthe surface toward ssDNA antibodies is to use the F7–26monoclonal antibody as a negative control. F7–26 spe-cifically binds to ssDNA and shows no reactivity towarddsDNA (24, 25). On the other hand, we used a mono-clonal antibody derived from a lupus-prone mousemodel as a positive control. This antibody reacts withboth ssDNA and, with higher affinity, dsDNA (19 ). Thesuperior specificity of the biosensor surface can be pre-sumed from the data generated with these controls(Fig. 4). We further established the specificity of thesystem in competition experiments with salmon spermDNA and both single-stranded and double-strandedODNs.
A major distinguishing feature of existing methodsfor measuring anti-dsDNA is the detection of differentsets of isotypes. Although the Farr assay does not dis-criminate between isotypes, both the C. luciliae indirectimmunofluorescence and the ELISA methods offer thispossibility via the choice of the secondary antibody.Different isotypes are most likely to differ in clinicalrelevance. Some authors recommend IgG determinationalone, whereas others state that the analysis of all iso-types may be superior in terms of specificity and sensi-tivity (7, 10, 22). Because our device monitors formationof the immune complex directly, there is no isotypedifferentiation for the most part; hence, we have devel-
340 Buhl et al.: Biosensor Detection of Anti-Double-Stranded DNA Antibodies
oped a protocol for the removal of unwanted isotypesbefore analysis (to be reported elsewhere).
In summary, the SPR biosensor device is well suited forthe detection of anti-dsDNA in the sera of SLE patients.In addition, the technique acquires information aboutbinding kinetics and affinities of the specific autoanti-bodies through its capacity to monitor biospecific interac-tions in real time. Although this technique cannot readilydifferentiate between concentrations and affinities/avid-ities of antibodies in polyclonal sera, the associationconcentration, which represents the degree of immunecomplex formation within a given time period and thusis defined by both of these variables, is one of the moststraightforward and accurate measures of antibody-binding intensity now available.
We gratefully acknowledge the financial support of theKommission fur Klinische Forschung des Klinikums rechtsder Isar der Technischen Universitat Munchen. We alsothank Anita Schreiegg for excellent technical assistance.
References1. Kotzin BL. Systemic lupus erythematosus. Cell 1996;85:303–6.2. Mok CC, Lau CS. Pathogenesis of systemic lupus erythematosus.
J Clin Pathol 2003;56:481–90.3. Manzi S. Epidemiology of systemic lupus erythematosus. Am J
Manag Care 2001;7 (16 Suppl):474–9.4. Tan EM, Cohen AS, Fries JF, Masi AT, McShane DJ, Rothfield NF,
et al. The 1982 revised criteria for the classification of systemiclupus erythematosus. Arthritis Rheum 1982;25:1271–7.
5. Hochberg MC. Updating the American College of Rheumatologyrevised criteria for the classification of systemic lupus erythema-tosus. Arthritis Rheum 1997;40:1725.
6. Cervera R, Khamashta MA, Font J, Sebastiani GD, Gil A, Lavilla P,et al. Systemic lupus erythematosus: clinical and immunologicpatterns of disease expression in a cohort of 1,000 patients. TheEuropean Working Party on Systemic Lupus Erythematosus. Med-icine (Baltimore) 1993;72:113–24.
7. Hahn BH. Antibodies to DNA. N Engl J Med 1998;338:1359–68.8. Swaak T, Smeenk R. Detection of anti-dsDNA as a diagnostic tool:
a prospective study in 441 non-systemic lupus erythematosuspatients with anti-dsDNA antibody (anti-dsDNA). Ann Rheum Dis1985;44:245–51.
9. Bootsma H, Spronk PE, Ter Borg EJ, Hummel EJ, de Boer G,Limburg PC, et al. The predictive value of fluctuations in IgM andIgG class anti-dsDNA antibodies for relapses in systemic lupus
erythematosus: a prospective long term observation. Ann RheumDis 1997;56:661–6
10. Forger F, Matthias T, Oppermann M, Becker H, Helmke K. Clinicalsignificance of anti-dsDNA antibody isotypes: IgG/IgM ratio ofanti-dsDNA antibodies as a prognostic marker for lupus nephritis.Lupus 2004;13:36–44.
11. Isenberg D, Smeenk R. Clinical laboratory assays for measuringanti-dsDNA antibodies: where are we now? Lupus 2002;11:797–800.
12. Rahman A, Hiepe F. Anti-DNA antibodies–overview of assays andclinical correlations. Lupus 2002;11:770–3.
13. Cui Z, Zhao MH. Avidity of anti-glomerular basement membraneautoantibodies was associated with disease severity. Clin Immu-nol 2005;116:77–82.
14. Cucnik S, Kveder T, Krizaj I, Rozman B, Bozic B. High avidityanti-�2-glycoprotein I antibodies in patients with antiphospholipidsyndrome. Ann Rheum Dis 2004;63:1478–82.
15. Winfield JB, Faiferman I, Koffler D. Avidity of anti-DNA antibodies inserum and IgG glomerular eluates from patients with systemiclupus erythematosus. J Clin Invest 1977;59:90–6.
16. Villalta D, Romelli PB, Savina C, Bizzaro N, Tozzoli R, Tonutti E,et al. Anti-dsDNA antibody avidity determination by a simplereliable ELISA method for SLE diagnosis and monitoring. Lupus2003;12:31–6.
17. Jonsson U, Malmqvist M. Real time biospecific interaction analy-sis, the integration of surface plasmon resonance detection,general biospecific interface chemistry and microfluidics into oneanalytical system. Adv Biosensors 1992;2:291–336.
18. Van Regenmortel MH, Altschuh D, Chatellier J, Christensen L,Rauffer-Bruyere N, Richarlet-Secordel P, et al. Measurement ofantigen-antibody interactions with biosensors. J Mol Recognit1998;11:163–7.
19. Heegaard NH, Olsen DT, Larsen KL. Immuno-capillary electro-phoresis for the characterization of a monoclonal antibody againstDNA. J Chrom A 1996;744:285–94.
20. Kozlov IA, Melnyk PC, Stromsborg KE, Chee MS, Barker DL, ZhaoC. Efficient strategies for the conjugation of oligonucleotides toantibodies enabling highly sensitive protein detection. Biopoly-mers 2004;73:621–30.
21. Deng JS, Sontheimer RD, Lipscomb MF, Gilliam JN. The binding ofantihistone antibodies to crithidia luciliae kinetoplasts is growthcycle-dependent. Arthritis Rheum 1985;28:163–8.
22. Egner W. The use of laboratory tests in the diagnosis of SLE. J ClinPathol 2000;53:424–32.
23. Reveille JD. Predictive value of autoantibodies for activity ofsystemic lupus erythematosus. Lupus 2004;13:290–7.
24. Frankfurt OS. Detection of DNA damage in individual cells by flowcytrometric analysis using anti-ssDNA monoclonal antibody. ExpCell Res 1987;170:369–80.
25. Frankfurt OS. Decreased DNA stability in the cells treated withalkylating agents. Exp Cell Res 1990;191:181–5.
Clinical Chemistry 53, No. 2, 2007 341
Lateral Flow Immunoassay Using Europium (III)Chelate Microparticles and Time-Resolved
Fluorescence for Eosinophils and Neutrophils inWhole Blood
Gerd Rundstrom,1,2*† Ann Jonsson,1,2 Ola Mårtensson,2† Ib Mendel-Hartvig,2† andPer Venge3
Background: A simple point-of-care method for mea-suring leukocyte counts in a doctor’s office or emer-gency room could be of great importance. We developeda protocol for measuring cell count by disrupting thecell membrane and analyzing specific proteins withinthe cells and used it to analyze proteins from eosino-phils and neutrophils.Methods: Lateral immunochromatographic (ICR) assayshave been developed for eosinophil protein X (EPX) andhuman neutrophil lipocalin (HNL) as measures of theconcentration of eosinophils and neutrophils. The cor-relation between the lateral ICR assays and cell count-ing of eosinophils and neutrophils was performed man-ually and with an automated cell counter. RIA assaysmeasuring the same analytes were also compared withthe results from cell counting and lateral ICR assays.Results: The optimized assays showed analytical detec-tion limits below the clinical ranges of 3.36 �g/L and2.05 �g/L for EPX and HNL, respectively. The recoverywas 114.8%–122.8% for EPX and 94.5%–96.9% for HNL.The imprecision was 3%–17% CV for EPX over thewhole range and 5%–16% CV for HNL. The correlationcoefficients between manually counted cells and lateralICR assays were 0.9 and 0.83 for EPX and HNL,respectively.
Conclusion: The numbers of eosinophils and neutro-phils in small amounts of blood can be estimated in thepoint-of-care setting by means of fast lateral ICR assaysof EPX and HNL.© 2007 American Association for Clinical Chemistry
New technologies for point-of-care (POC)4 analyses in-clude methods based on magnetic particles (1 ) or lateralflow immunoassays (2 ). Magnetic bead assays require astrong magnet to perform the separation as well as adetection method. Lateral flow assays may be based onvisual detection without detection instrumentation, but ifthere is a need for quantification, a detection scheme isnecessary. Detection schemes may be based on goldparticles, colored particles, carbon black, or fluorescence,which is often preferred to obtain the highest sensitivity inan assay. The detector reagents (mainly antibodies) maybe directly labeled with fluorophores, such as the Cyfamily or the Alexa dyes (3 ). Antibodies can also becoupled to particles incorporated with fluorophores, inwhich case the fluorescence intensity is amplified. Themost sensitive type of fluorescence, time-resolved fluores-cence (Tr-FIA), is based on chelates of the lanthanides(e.g., europium, samarium). Incorporating these chelatesinto particles is an advantageous way to obtain assayswith high sensitivity (4–6).
We aimed to develop a simple POC application tomeasure eosinophils and neutrophils in blood by use ofeuropium (III) chelate microparticles and time-resolved
1 Department for Surface Biotechnology, Uppsala University, Uppsala,Sweden.
2 Phadia AB, Uppsala, Sweden.3 Department of Clinical Chemistry, University Hospital, Uppsala, Swe-
den.† Present address: Åmic AB, Dag Hammarskjoldsvag, Uppsala, Sweden.* Address correspondence to this author at: Åmic AB, Dag Hammar-
skjoldsvag 52B, SE-751 83, Uppsala, Sweden. Fax 46-18-521680; e-mail address:[email protected].
Received May 28, 2006; accepted November 21, 2006.Previously published online at DOI: 10.1373/clinchem.2006.074021
4 Nonstandard abbreviations: POC, point-of-care; HNL, human neutrophillipocalin; EPX, eosinophil protein X; ICR, immunochromatographic; mAb,monoclonal antibody; PEG, polyethylene glycol; aEPX, mAb to EPX; aHNL,mAb to HNL; RZ, reaction zone; CTAB, N-cetyl-N-N-N-trimethylammoniumbromide; CM/EU, Europium (III) chelate particles.
Clinical Chemistry 53:2342–348 (2007) Other Areas of
Clinical Chemistry
342
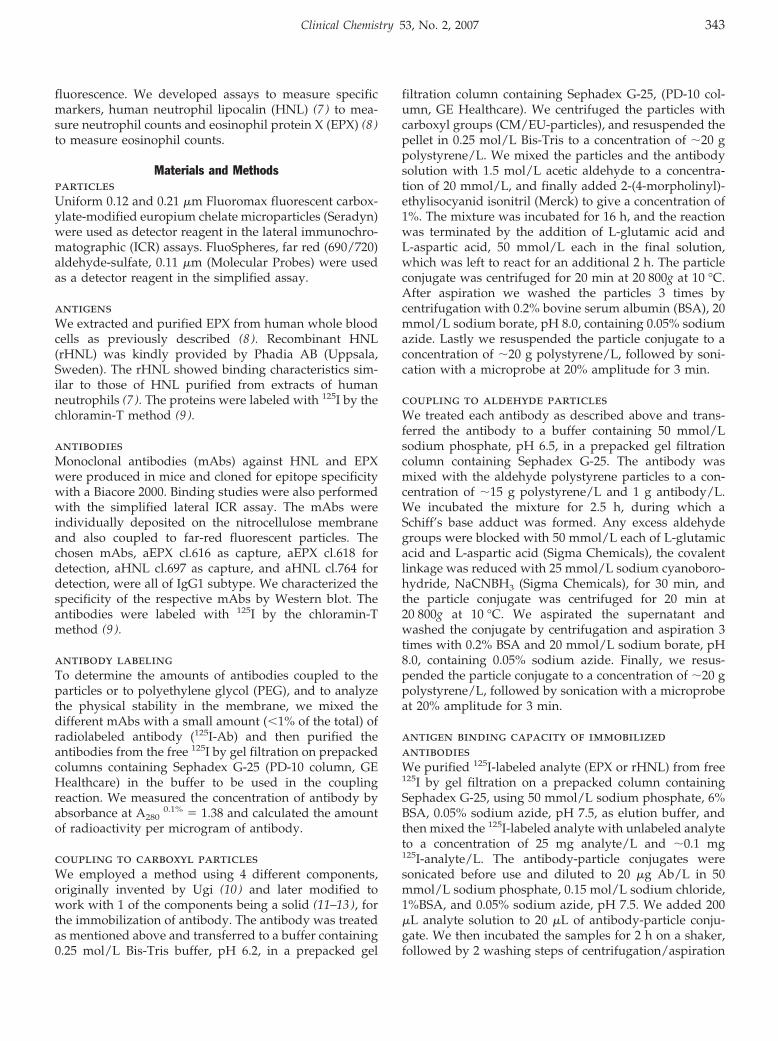
fluorescence. We developed assays to measure specificmarkers, human neutrophil lipocalin (HNL) (7 ) to mea-sure neutrophil counts and eosinophil protein X (EPX) (8 )to measure eosinophil counts.
Materials and MethodsparticlesUniform 0.12 and 0.21 �m Fluoromax fluorescent carbox-ylate-modified europium chelate microparticles (Seradyn)were used as detector reagent in the lateral immunochro-matographic (ICR) assays. FluoSpheres, far red (690/720)aldehyde-sulfate, 0.11 �m (Molecular Probes) were usedas a detector reagent in the simplified assay.
antigensWe extracted and purified EPX from human whole bloodcells as previously described (8 ). Recombinant HNL(rHNL) was kindly provided by Phadia AB (Uppsala,Sweden). The rHNL showed binding characteristics sim-ilar to those of HNL purified from extracts of humanneutrophils (7 ). The proteins were labeled with 125I by thechloramin-T method (9 ).
antibodiesMonoclonal antibodies (mAbs) against HNL and EPXwere produced in mice and cloned for epitope specificitywith a Biacore 2000. Binding studies were also performedwith the simplified lateral ICR assay. The mAbs wereindividually deposited on the nitrocellulose membraneand also coupled to far-red fluorescent particles. Thechosen mAbs, aEPX cl.616 as capture, aEPX cl.618 fordetection, aHNL cl.697 as capture, and aHNL cl.764 fordetection, were all of IgG1 subtype. We characterized thespecificity of the respective mAbs by Western blot. Theantibodies were labeled with 125I by the chloramin-Tmethod (9 ).
antibody labelingTo determine the amounts of antibodies coupled to theparticles or to polyethylene glycol (PEG), and to analyzethe physical stability in the membrane, we mixed thedifferent mAbs with a small amount (�1% of the total) ofradiolabeled antibody (125I-Ab) and then purified theantibodies from the free 125I by gel filtration on prepackedcolumns containing Sephadex G-25 (PD-10 column, GEHealthcare) in the buffer to be used in the couplingreaction. We measured the concentration of antibody byabsorbance at A280
0.1% � 1.38 and calculated the amountof radioactivity per microgram of antibody.
coupling to carboxyl particlesWe employed a method using 4 different components,originally invented by Ugi (10 ) and later modified towork with 1 of the components being a solid (11–13), forthe immobilization of antibody. The antibody was treatedas mentioned above and transferred to a buffer containing0.25 mol/L Bis-Tris buffer, pH 6.2, in a prepacked gel
filtration column containing Sephadex G-25, (PD-10 col-umn, GE Healthcare). We centrifuged the particles withcarboxyl groups (CM/EU-particles), and resuspended thepellet in 0.25 mol/L Bis-Tris to a concentration of �20 gpolystyrene/L. We mixed the particles and the antibodysolution with 1.5 mol/L acetic aldehyde to a concentra-tion of 20 mmol/L, and finally added 2-(4-morpholinyl)-ethylisocyanid isonitril (Merck) to give a concentration of1%. The mixture was incubated for 16 h, and the reactionwas terminated by the addition of L-glutamic acid andL-aspartic acid, 50 mmol/L each in the final solution,which was left to react for an additional 2 h. The particleconjugate was centrifuged for 20 min at 20 800g at 10 °C.After aspiration we washed the particles 3 times bycentrifugation with 0.2% bovine serum albumin (BSA), 20mmol/L sodium borate, pH 8.0, containing 0.05% sodiumazide. Lastly we resuspended the particle conjugate to aconcentration of �20 g polystyrene/L, followed by soni-cation with a microprobe at 20% amplitude for 3 min.
coupling to aldehyde particlesWe treated each antibody as described above and trans-ferred the antibody to a buffer containing 50 mmol/Lsodium phosphate, pH 6.5, in a prepacked gel filtrationcolumn containing Sephadex G-25. The antibody wasmixed with the aldehyde polystyrene particles to a con-centration of �15 g polystyrene/L and 1 g antibody/L.We incubated the mixture for 2.5 h, during which aSchiff’s base adduct was formed. Any excess aldehydegroups were blocked with 50 mmol/L each of L-glutamicacid and L-aspartic acid (Sigma Chemicals), the covalentlinkage was reduced with 25 mmol/L sodium cyanoboro-hydride, NaCNBH3 (Sigma Chemicals), for 30 min, andthe particle conjugate was centrifuged for 20 min at20 800g at 10 °C. We aspirated the supernatant andwashed the conjugate by centrifugation and aspiration 3times with 0.2% BSA and 20 mmol/L sodium borate, pH8.0, containing 0.05% sodium azide. Finally, we resus-pended the particle conjugate to a concentration of �20 gpolystyrene/L, followed by sonication with a microprobeat 20% amplitude for 3 min.
antigen binding capacity of immobilizedantibodiesWe purified 125I-labeled analyte (EPX or rHNL) from free125I by gel filtration on a prepacked column containingSephadex G-25, using 50 mmol/L sodium phosphate, 6%BSA, 0.05% sodium azide, pH 7.5, as elution buffer, andthen mixed the 125I-labeled analyte with unlabeled analyteto a concentration of 25 mg analyte/L and �0.1 mg125I-analyte/L. The antibody-particle conjugates weresonicated before use and diluted to 20 �g Ab/L in 50mmol/L sodium phosphate, 0.15 mol/L sodium chloride,1%BSA, and 0.05% sodium azide, pH 7.5. We added 200�L analyte solution to 20 �L of antibody-particle conju-gate. We then incubated the samples for 2 h on a shaker,followed by 2 washing steps of centrifugation/aspiration
Clinical Chemistry 53, No. 2, 2007 343
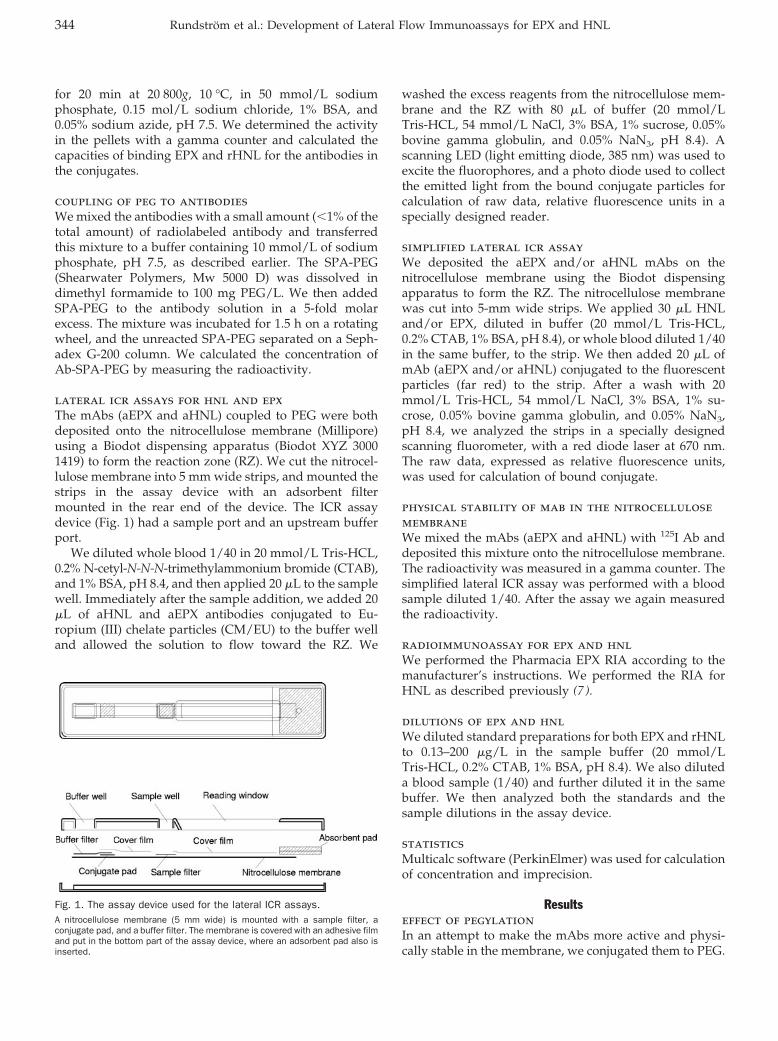
for 20 min at 20 800g, 10 °C, in 50 mmol/L sodiumphosphate, 0.15 mol/L sodium chloride, 1% BSA, and0.05% sodium azide, pH 7.5. We determined the activityin the pellets with a gamma counter and calculated thecapacities of binding EPX and rHNL for the antibodies inthe conjugates.
coupling of peg to antibodiesWe mixed the antibodies with a small amount (�1% of thetotal amount) of radiolabeled antibody and transferredthis mixture to a buffer containing 10 mmol/L of sodiumphosphate, pH 7.5, as described earlier. The SPA-PEG(Shearwater Polymers, Mw 5000 D) was dissolved indimethyl formamide to 100 mg PEG/L. We then addedSPA-PEG to the antibody solution in a 5-fold molarexcess. The mixture was incubated for 1.5 h on a rotatingwheel, and the unreacted SPA-PEG separated on a Seph-adex G-200 column. We calculated the concentration ofAb-SPA-PEG by measuring the radioactivity.
lateral icr assays for hnl and epxThe mAbs (aEPX and aHNL) coupled to PEG were bothdeposited onto the nitrocellulose membrane (Millipore)using a Biodot dispensing apparatus (Biodot XYZ 30001419) to form the reaction zone (RZ). We cut the nitrocel-lulose membrane into 5 mm wide strips, and mounted thestrips in the assay device with an adsorbent filtermounted in the rear end of the device. The ICR assaydevice (Fig. 1) had a sample port and an upstream bufferport.
We diluted whole blood 1/40 in 20 mmol/L Tris-HCL,0.2% N-cetyl-N-N-N-trimethylammonium bromide (CTAB),and 1% BSA, pH 8.4, and then applied 20 �L to the samplewell. Immediately after the sample addition, we added 20�L of aHNL and aEPX antibodies conjugated to Eu-ropium (III) chelate particles (CM/EU) to the buffer welland allowed the solution to flow toward the RZ. We
washed the excess reagents from the nitrocellulose mem-brane and the RZ with 80 �L of buffer (20 mmol/LTris-HCL, 54 mmol/L NaCl, 3% BSA, 1% sucrose, 0.05%bovine gamma globulin, and 0.05% NaN3, pH 8.4). Ascanning LED (light emitting diode, 385 nm) was used toexcite the fluorophores, and a photo diode used to collectthe emitted light from the bound conjugate particles forcalculation of raw data, relative fluorescence units in aspecially designed reader.
simplified lateral icr assayWe deposited the aEPX and/or aHNL mAbs on thenitrocellulose membrane using the Biodot dispensingapparatus to form the RZ. The nitrocellulose membranewas cut into 5-mm wide strips. We applied 30 �L HNLand/or EPX, diluted in buffer (20 mmol/L Tris-HCL,0.2% CTAB, 1% BSA, pH 8.4), or whole blood diluted 1/40in the same buffer, to the strip. We then added 20 �L ofmAb (aEPX and/or aHNL) conjugated to the fluorescentparticles (far red) to the strip. After a wash with 20mmol/L Tris-HCL, 54 mmol/L NaCl, 3% BSA, 1% su-crose, 0.05% bovine gamma globulin, and 0.05% NaN3,pH 8.4, we analyzed the strips in a specially designedscanning fluorometer, with a red diode laser at 670 nm.The raw data, expressed as relative fluorescence units,was used for calculation of bound conjugate.
physical stability of mab in the nitrocellulosemembraneWe mixed the mAbs (aEPX and aHNL) with 125I Ab anddeposited this mixture onto the nitrocellulose membrane.The radioactivity was measured in a gamma counter. Thesimplified lateral ICR assay was performed with a bloodsample diluted 1/40. After the assay we again measuredthe radioactivity.
radioimmunoassay for epx and hnlWe performed the Pharmacia EPX RIA according to themanufacturer’s instructions. We performed the RIA forHNL as described previously (7 ).
dilutions of epx and hnlWe diluted standard preparations for both EPX and rHNLto 0.13–200 �g/L in the sample buffer (20 mmol/LTris-HCL, 0.2% CTAB, 1% BSA, pH 8.4). We also diluteda blood sample (1/40) and further diluted it in the samebuffer. We then analyzed both the standards and thesample dilutions in the assay device.
statisticsMulticalc software (PerkinElmer) was used for calculationof concentration and imprecision.
Resultseffect of pegylationIn an attempt to make the mAbs more active and physi-cally stable in the membrane, we conjugated them to PEG.
Fig. 1. The assay device used for the lateral ICR assays.A nitrocellulose membrane (5 mm wide) is mounted with a sample filter, aconjugate pad, and a buffer filter. The membrane is covered with an adhesive filmand put in the bottom part of the assay device, where an adsorbent pad also isinserted.
344 Rundstrom et al.: Development of Lateral Flow Immunoassays for EPX and HNL
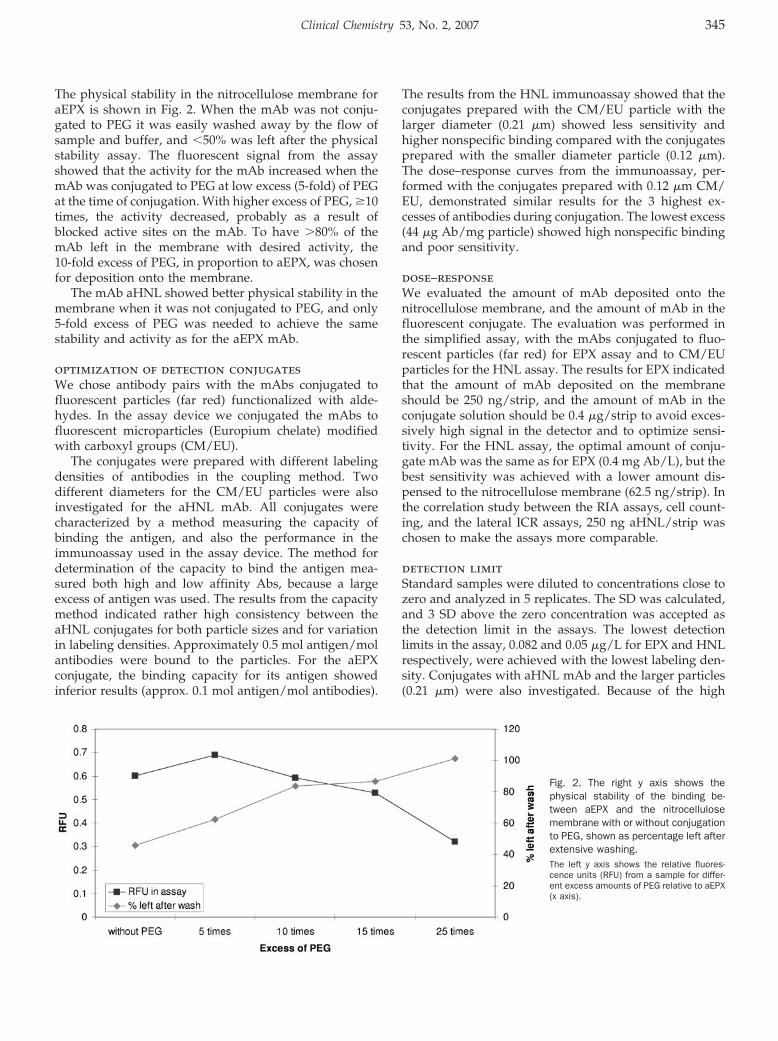
The physical stability in the nitrocellulose membrane foraEPX is shown in Fig. 2. When the mAb was not conju-gated to PEG it was easily washed away by the flow ofsample and buffer, and �50% was left after the physicalstability assay. The fluorescent signal from the assayshowed that the activity for the mAb increased when themAb was conjugated to PEG at low excess (5-fold) of PEGat the time of conjugation. With higher excess of PEG, �10times, the activity decreased, probably as a result ofblocked active sites on the mAb. To have �80% of themAb left in the membrane with desired activity, the10-fold excess of PEG, in proportion to aEPX, was chosenfor deposition onto the membrane.
The mAb aHNL showed better physical stability in themembrane when it was not conjugated to PEG, and only5-fold excess of PEG was needed to achieve the samestability and activity as for the aEPX mAb.
optimization of detection conjugatesWe chose antibody pairs with the mAbs conjugated tofluorescent particles (far red) functionalized with alde-hydes. In the assay device we conjugated the mAbs tofluorescent microparticles (Europium chelate) modifiedwith carboxyl groups (CM/EU).
The conjugates were prepared with different labelingdensities of antibodies in the coupling method. Twodifferent diameters for the CM/EU particles were alsoinvestigated for the aHNL mAb. All conjugates werecharacterized by a method measuring the capacity ofbinding the antigen, and also the performance in theimmunoassay used in the assay device. The method fordetermination of the capacity to bind the antigen mea-sured both high and low affinity Abs, because a largeexcess of antigen was used. The results from the capacitymethod indicated rather high consistency between theaHNL conjugates for both particle sizes and for variationin labeling densities. Approximately 0.5 mol antigen/molantibodies were bound to the particles. For the aEPXconjugate, the binding capacity for its antigen showedinferior results (approx. 0.1 mol antigen/mol antibodies).
The results from the HNL immunoassay showed that theconjugates prepared with the CM/EU particle with thelarger diameter (0.21 �m) showed less sensitivity andhigher nonspecific binding compared with the conjugatesprepared with the smaller diameter particle (0.12 �m).The dose–response curves from the immunoassay, per-formed with the conjugates prepared with 0.12 �m CM/EU, demonstrated similar results for the 3 highest ex-cesses of antibodies during conjugation. The lowest excess(44 �g Ab/mg particle) showed high nonspecific bindingand poor sensitivity.
dose–responseWe evaluated the amount of mAb deposited onto thenitrocellulose membrane, and the amount of mAb in thefluorescent conjugate. The evaluation was performed inthe simplified assay, with the mAbs conjugated to fluo-rescent particles (far red) for EPX assay and to CM/EUparticles for the HNL assay. The results for EPX indicatedthat the amount of mAb deposited on the membraneshould be 250 ng/strip, and the amount of mAb in theconjugate solution should be 0.4 �g/strip to avoid exces-sively high signal in the detector and to optimize sensi-tivity. For the HNL assay, the optimal amount of conju-gate mAb was the same as for EPX (0.4 mg Ab/L), but thebest sensitivity was achieved with a lower amount dis-pensed to the nitrocellulose membrane (62.5 ng/strip). Inthe correlation study between the RIA assays, cell count-ing, and the lateral ICR assays, 250 ng aHNL/strip waschosen to make the assays more comparable.
detection limitStandard samples were diluted to concentrations close tozero and analyzed in 5 replicates. The SD was calculated,and 3 SD above the zero concentration was accepted asthe detection limit in the assays. The lowest detectionlimits in the assay, 0.082 and 0.05 �g/L for EPX and HNLrespectively, were achieved with the lowest labeling den-sity. Conjugates with aHNL mAb and the larger particles(0.21 �m) were also investigated. Because of the high
Fig. 2. The right y axis shows thephysical stability of the binding be-tween aEPX and the nitrocellulosemembrane with or without conjugationto PEG, shown as percentage left afterextensive washing.The left y axis shows the relative fluores-cence units (RFU) from a sample for differ-ent excess amounts of PEG relative to aEPX(x axis).
Clinical Chemistry 53, No. 2, 2007 345
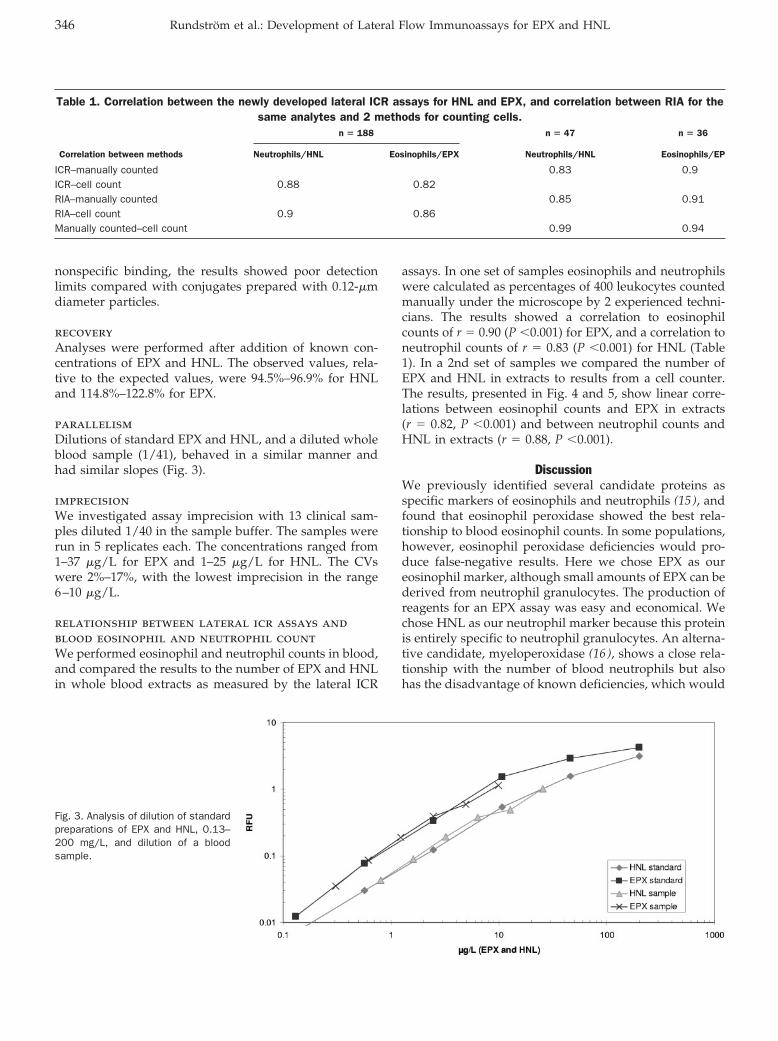
nonspecific binding, the results showed poor detectionlimits compared with conjugates prepared with 0.12-�mdiameter particles.
recoveryAnalyses were performed after addition of known con-centrations of EPX and HNL. The observed values, rela-tive to the expected values, were 94.5%–96.9% for HNLand 114.8%–122.8% for EPX.
parallelismDilutions of standard EPX and HNL, and a diluted wholeblood sample (1/41), behaved in a similar manner andhad similar slopes (Fig. 3).
imprecisionWe investigated assay imprecision with 13 clinical sam-ples diluted 1/40 in the sample buffer. The samples wererun in 5 replicates each. The concentrations ranged from1–37 �g/L for EPX and 1–25 �g/L for HNL. The CVswere 2%–17%, with the lowest imprecision in the range6–10 �g/L.
relationship between lateral icr assays andblood eosinophil and neutrophil countWe performed eosinophil and neutrophil counts in blood,and compared the results to the number of EPX and HNLin whole blood extracts as measured by the lateral ICR
assays. In one set of samples eosinophils and neutrophilswere calculated as percentages of 400 leukocytes countedmanually under the microscope by 2 experienced techni-cians. The results showed a correlation to eosinophilcounts of r � 0.90 (P �0.001) for EPX, and a correlation toneutrophil counts of r � 0.83 (P �0.001) for HNL (Table1). In a 2nd set of samples we compared the number ofEPX and HNL in extracts to results from a cell counter.The results, presented in Fig. 4 and 5, show linear corre-lations between eosinophil counts and EPX in extracts(r � 0.82, P �0.001) and between neutrophil counts andHNL in extracts (r � 0.88, P �0.001).
DiscussionWe previously identified several candidate proteins asspecific markers of eosinophils and neutrophils (15 ), andfound that eosinophil peroxidase showed the best rela-tionship to blood eosinophil counts. In some populations,however, eosinophil peroxidase deficiencies would pro-duce false-negative results. Here we chose EPX as oureosinophil marker, although small amounts of EPX can bederived from neutrophil granulocytes. The production ofreagents for an EPX assay was easy and economical. Wechose HNL as our neutrophil marker because this proteinis entirely specific to neutrophil granulocytes. An alterna-tive candidate, myeloperoxidase (16 ), shows a close rela-tionship with the number of blood neutrophils but alsohas the disadvantage of known deficiencies, which would
Table 1. Correlation between the newly developed lateral ICR assays for HNL and EPX, and correlation between RIA for thesame analytes and 2 methods for counting cells.
n � 188 n � 47 n � 36
Correlation between methods Neutrophils/HNL Eosinophils/EPX Neutrophils/HNL Eosinophils/EP
ICR–manually counted 0.83 0.9ICR–cell count 0.88 0.82RIA–manually counted 0.85 0.91RIA–cell count 0.9 0.86Manually counted–cell count 0.99 0.94
Fig. 3. Analysis of dilution of standardpreparations of EPX and HNL, 0.13–200 mg/L, and dilution of a bloodsample.
346 Rundstrom et al.: Development of Lateral Flow Immunoassays for EPX and HNL
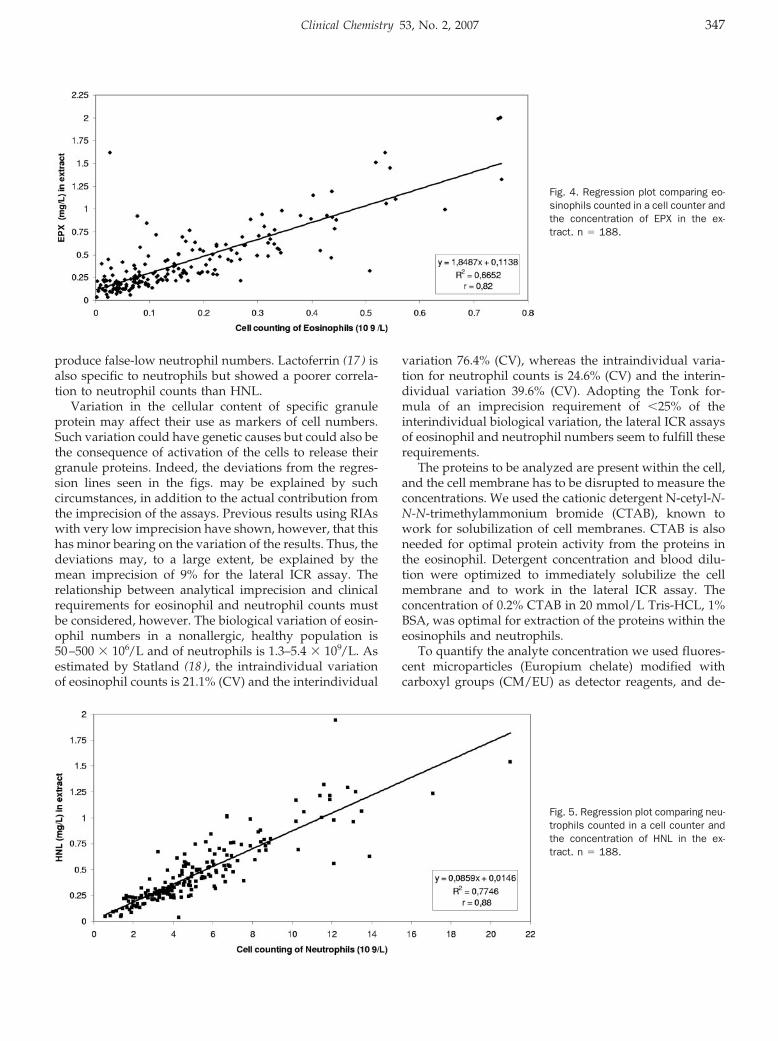
produce false-low neutrophil numbers. Lactoferrin (17 ) isalso specific to neutrophils but showed a poorer correla-tion to neutrophil counts than HNL.
Variation in the cellular content of specific granuleprotein may affect their use as markers of cell numbers.Such variation could have genetic causes but could also bethe consequence of activation of the cells to release theirgranule proteins. Indeed, the deviations from the regres-sion lines seen in the figs. may be explained by suchcircumstances, in addition to the actual contribution fromthe imprecision of the assays. Previous results using RIAswith very low imprecision have shown, however, that thishas minor bearing on the variation of the results. Thus, thedeviations may, to a large extent, be explained by themean imprecision of 9% for the lateral ICR assay. Therelationship between analytical imprecision and clinicalrequirements for eosinophil and neutrophil counts mustbe considered, however. The biological variation of eosin-ophil numbers in a nonallergic, healthy population is50–500 � 106/L and of neutrophils is 1.3–5.4 � 109/L. Asestimated by Statland (18 ), the intraindividual variationof eosinophil counts is 21.1% (CV) and the interindividual
variation 76.4% (CV), whereas the intraindividual varia-tion for neutrophil counts is 24.6% (CV) and the interin-dividual variation 39.6% (CV). Adopting the Tonk for-mula of an imprecision requirement of �25% of theinterindividual biological variation, the lateral ICR assaysof eosinophil and neutrophil numbers seem to fulfill theserequirements.
The proteins to be analyzed are present within the cell,and the cell membrane has to be disrupted to measure theconcentrations. We used the cationic detergent N-cetyl-N-N-N-trimethylammonium bromide (CTAB), known towork for solubilization of cell membranes. CTAB is alsoneeded for optimal protein activity from the proteins inthe eosinophil. Detergent concentration and blood dilu-tion were optimized to immediately solubilize the cellmembrane and to work in the lateral ICR assay. Theconcentration of 0.2% CTAB in 20 mmol/L Tris-HCL, 1%BSA, was optimal for extraction of the proteins within theeosinophils and neutrophils.
To quantify the analyte concentration we used fluores-cent microparticles (Europium chelate) modified withcarboxyl groups (CM/EU) as detector reagents, and de-
Fig. 5. Regression plot comparing neu-trophils counted in a cell counter andthe concentration of HNL in the ex-tract. n � 188.
Fig. 4. Regression plot comparing eo-sinophils counted in a cell counter andthe concentration of EPX in the ex-tract. n � 188.
Clinical Chemistry 53, No. 2, 2007 347
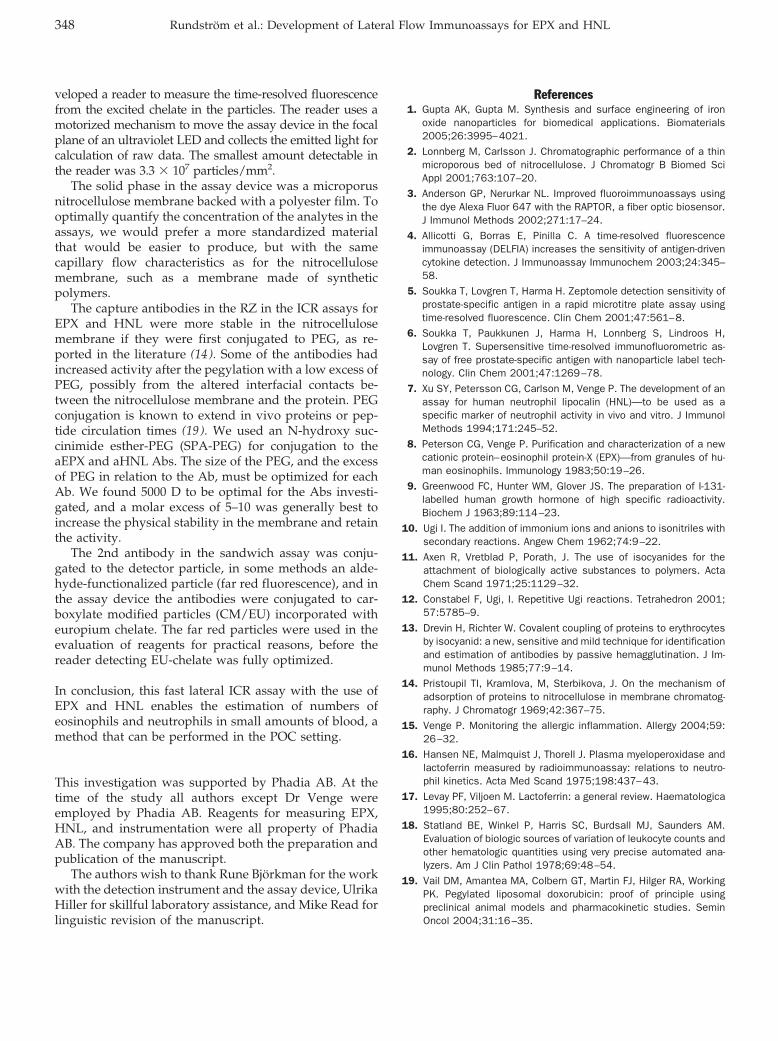
veloped a reader to measure the time-resolved fluorescencefrom the excited chelate in the particles. The reader uses amotorized mechanism to move the assay device in the focalplane of an ultraviolet LED and collects the emitted light forcalculation of raw data. The smallest amount detectable inthe reader was 3.3 � 107 particles/mm2.
The solid phase in the assay device was a microporusnitrocellulose membrane backed with a polyester film. Tooptimally quantify the concentration of the analytes in theassays, we would prefer a more standardized materialthat would be easier to produce, but with the samecapillary flow characteristics as for the nitrocellulosemembrane, such as a membrane made of syntheticpolymers.
The capture antibodies in the RZ in the ICR assays forEPX and HNL were more stable in the nitrocellulosemembrane if they were first conjugated to PEG, as re-ported in the literature (14 ). Some of the antibodies hadincreased activity after the pegylation with a low excess ofPEG, possibly from the altered interfacial contacts be-tween the nitrocellulose membrane and the protein. PEGconjugation is known to extend in vivo proteins or pep-tide circulation times (19 ). We used an N-hydroxy suc-cinimide esther-PEG (SPA-PEG) for conjugation to theaEPX and aHNL Abs. The size of the PEG, and the excessof PEG in relation to the Ab, must be optimized for eachAb. We found 5000 D to be optimal for the Abs investi-gated, and a molar excess of 5–10 was generally best toincrease the physical stability in the membrane and retainthe activity.
The 2nd antibody in the sandwich assay was conju-gated to the detector particle, in some methods an alde-hyde-functionalized particle (far red fluorescence), and inthe assay device the antibodies were conjugated to car-boxylate modified particles (CM/EU) incorporated witheuropium chelate. The far red particles were used in theevaluation of reagents for practical reasons, before thereader detecting EU-chelate was fully optimized.
In conclusion, this fast lateral ICR assay with the use ofEPX and HNL enables the estimation of numbers ofeosinophils and neutrophils in small amounts of blood, amethod that can be performed in the POC setting.
This investigation was supported by Phadia AB. At thetime of the study all authors except Dr Venge wereemployed by Phadia AB. Reagents for measuring EPX,HNL, and instrumentation were all property of PhadiaAB. The company has approved both the preparation andpublication of the manuscript.
The authors wish to thank Rune Bjorkman for the workwith the detection instrument and the assay device, UlrikaHiller for skillful laboratory assistance, and Mike Read forlinguistic revision of the manuscript.
References1. Gupta AK, Gupta M. Synthesis and surface engineering of iron
oxide nanoparticles for biomedical applications. Biomaterials2005;26:3995–4021.
2. Lonnberg M, Carlsson J. Chromatographic performance of a thinmicroporous bed of nitrocellulose. J Chromatogr B Biomed SciAppl 2001;763:107–20.
3. Anderson GP, Nerurkar NL. Improved fluoroimmunoassays usingthe dye Alexa Fluor 647 with the RAPTOR, a fiber optic biosensor.J Immunol Methods 2002;271:17–24.
4. Allicotti G, Borras E, Pinilla C. A time-resolved fluorescenceimmunoassay (DELFIA) increases the sensitivity of antigen-drivencytokine detection. J Immunoassay Immunochem 2003;24:345–58.
5. Soukka T, Lovgren T, Harma H. Zeptomole detection sensitivity ofprostate-specific antigen in a rapid microtitre plate assay usingtime-resolved fluorescence. Clin Chem 2001;47:561–8.
6. Soukka T, Paukkunen J, Harma H, Lonnberg S, Lindroos H,Lovgren T. Supersensitive time-resolved immunofluorometric as-say of free prostate-specific antigen with nanoparticle label tech-nology. Clin Chem 2001;47:1269–78.
7. Xu SY, Petersson CG, Carlson M, Venge P. The development of anassay for human neutrophil lipocalin (HNL)—to be used as aspecific marker of neutrophil activity in vivo and vitro. J ImmunolMethods 1994;171:245–52.
8. Peterson CG, Venge P. Purification and characterization of a newcationic protein–eosinophil protein-X (EPX)—from granules of hu-man eosinophils. Immunology 1983;50:19–26.
9. Greenwood FC, Hunter WM, Glover JS. The preparation of I-131-labelled human growth hormone of high specific radioactivity.Biochem J 1963;89:114–23.
10. Ugi I. The addition of immonium ions and anions to isonitriles withsecondary reactions. Angew Chem 1962;74:9–22.
11. Axen R, Vretblad P, Porath, J. The use of isocyanides for theattachment of biologically active substances to polymers. ActaChem Scand 1971;25:1129–32.
12. Constabel F, Ugi, I. Repetitive Ugi reactions. Tetrahedron 2001;57:5785–9.
13. Drevin H, Richter W. Covalent coupling of proteins to erythrocytesby isocyanid: a new, sensitive and mild technique for identificationand estimation of antibodies by passive hemagglutination. J Im-munol Methods 1985;77:9–14.
14. Pristoupil TI, Kramlova, M, Sterbikova, J. On the mechanism ofadsorption of proteins to nitrocellulose in membrane chromatog-raphy. J Chromatogr 1969;42:367–75.
15. Venge P. Monitoring the allergic inflammation. Allergy 2004;59:26–32.
16. Hansen NE, Malmquist J, Thorell J. Plasma myeloperoxidase andlactoferrin measured by radioimmunoassay: relations to neutro-phil kinetics. Acta Med Scand 1975;198:437–43.
17. Levay PF, Viljoen M. Lactoferrin: a general review. Haematologica1995;80:252–67.
18. Statland BE, Winkel P, Harris SC, Burdsall MJ, Saunders AM.Evaluation of biologic sources of variation of leukocyte counts andother hematologic quantities using very precise automated ana-lyzers. Am J Clin Pathol 1978;69:48–54.
19. Vail DM, Amantea MA, Colbern GT, Martin FJ, Hilger RA, WorkingPK. Pegylated liposomal doxorubicin: proof of principle usingpreclinical animal models and pharmacokinetic studies. SeminOncol 2004;31:16–35.
348 Rundstrom et al.: Development of Lateral Flow Immunoassays for EPX and HNL
Mutation Scanning the GJB1 Gene with High-Resolu-tion Melting Analysis: Implications for Mutation Scan-ning of Genes for Charcot-Marie-Tooth Disease, MarinaL. Kennerson,1,2* Trent Warburton,3 Eva Nelis,4 Megan Brew-er,5 Patsie Polly,5 Peter De Jonghe,4 Vincent Timmerman,6 andGarth A. Nicholson1,2 (1 Northcott Neuroscience Labora-tory, ANZAC Research Institute, Concord NSW, Austra-lia; 2 Molecular Medicine Laboratory, Concord Hospital,Concord NSW, Australia; 3 John Morris Scientific, Victo-ria, Australia; 4 Neurogenetics Group and 6 PeripheralNeuropathy Group, Department of Molecular Genetics,Flanders Interuniversity Institute for Biotechnology, Insti-tute Born-Bunge, University of Antwerp, Antwerpen,Belgium; 5 Department of Pathology, School of MedicalSciences, University of New South Wales, Kensington,NSW, Australia; * address correspondence to this authorat: Northcott Neuroscience Laboratory, ANZAC ResearchInstitute, Concord, NSW, Australia 2139; fax 61-2-9767-9101, e-mail [email protected])
Background: X-linked Charcot-Marie-Tooth type 1 dis-ease has been associated with 280 mutations in the GJB1[gap junction protein, beta 1, 32kDa (connexin 32, Char-cot-Marie-Tooth neuropathy, X-linked)] gene. High-res-olution melting analysis with an automated instrumentcan be used to scan DNA for alterations, but its use inX-linked disorders has not been described.Methods: A 96-well LightScanner for high resolutionmelting analysis was used to scan amplicons of the GJB1gene. All mutations reported in this study had beenconfirmed previously by sequence analysis. DNA sam-ples were amplified with the double-stranded DNA-binding dye LC Green Plus. Melting curves were ana-lyzed as fluorescence difference plots. The shift andcurve shapes of melting profiles were used to distin-guish controls from patient samples.Results: The method detected each of the 23 mutationsused in this study. Eighteen known mutations providedvalidation of the high-resolution melting method and afurther 5 mutations were identified in a blind study.Altered fluorescence difference curves for all the muta-tions were easily distinguished from the wild-type melt-ing profile.Conclusion: High-resolution melting analysis is a sim-ple, sensitive, and cost-efficient alternative method toscan for gene mutations in the GJB1 gene. The technol-ogy has the potential to reduce sequencing burden andwould be suitable for mutation screening of exons oflarge multiexon genes that have been discovered to beassociated with Charcot Marie Tooth neuropathy.© 2007 American Association for Clinical Chemistry
Charcot-Marie-Tooth (CMT) neuropathy is the most com-mon group of hereditary disorders presenting to geneticclinics and affects �1 in 2500 individuals (1 ). The CMTsyndrome includes many hereditary disorders of periph-eral nerves and affects both motor and sensory neurons.
Patients suffering from CMT show progressive distalwasting and weakness, pes cavus or foot drop, and loss ofdeep tendon reflexes. X-linked CMT (CMTX) is the 2ndmost common form of demyelinating CMT after Charcot-Marie-Tooth disease type 1A and accounts for 10%–15%of all CMT cases (2 ). CMTX1 (MIM 302800) is an X-linkeddominant trait caused by mutations in the GJB1 [gapjunction protein, beta 1, 32kDa (connexin 32, Charcot-Marie-Tooth neuropathy, X-linked)] gene (3 ). Over 280mutations have been reported in this gene according tothe Inherited Peripheral Neuropathies Mutation Database(www.molgen.ua.ac.be/CMTMutations).
Our laboratory currently uses sequencing to identifygene mutations in the GJB1 gene. High-resolution melting(HRM) curve analysis is a powerful tool for scanningentire amplicons and detecting sequence variations, madepossible through the discovery of the saturating double-stranded (ds) DNA dye, LC Green Plus (4 ), and byadvances in instrumentation that enable acquisition ofhigh-resolution fluorescent data (5 ). LC Green Plus(Idaho Technology) can be used at concentrations that donot inhibit PCR amplification but efficiently saturate PCRproducts. HRM analysis of PCR products amplified in thepresence of LC Green Plus can detect heterozygous andmost homozygous sequence variations by the differencein shape and position of the melting curve when com-pared with a wild-type melt profile (4, 6 ). The methodwould therefore be amenable to screening an X-linkeddominant disorder with heterozygous females and hemi-zygous male patients.
Informed consent for DNA studies was obtained fromall patients according to protocols approved by the Con-cord Hospital and the University of Antwerp EthicsReview Committees. To validate the HRM method, weselected 18 known patient samples that were positive forGJB1 mutations (10 males and 8 females) and 4 controlindividuals (3 females and 1 male). In addition, 10 dei-dentified DNA samples (6 males, 4 females) with andwithout GJB1 mutations were selected for blind analysisfrom the Molecular Genetics Department, University ofAntwerp, Belgium. The control and patient samples usedin both the validation and blind study were previouslyconfirmed by sequence analysis with primers describedby Bergoffen et al. (3 ). The GenBank sequence NM_000166 was used as the reference sequence for the cDNA.Nucleotide numbering of the A in the ATG translationinitiation site was designated �1. There is 1 reportedsingle-nucleotide polymorphism (SNP; rs11551260) in thecoding sequence of the GJB1 gene; however, none of theindividuals used in this study contained the SNP (c.287C�G).
Primers to amplify 4 overlapping amplicons were de-signed with the Oligo Program Version 6 (MolecularBiology Insights) to provide comprehensive coverage ofthe GJB1 single-exon 852-bp open reading frame. Primerinformation, fragment size, fragment coverage, andpathogenic codons are shown in Table 1. Fragments 1, 2,and 4 provided adequate coverage for gene scanning, andfragment 3 was designed to test for mutations close to the
Technical Briefs
Clinical Chemistry 53, No. 2, 2007 349
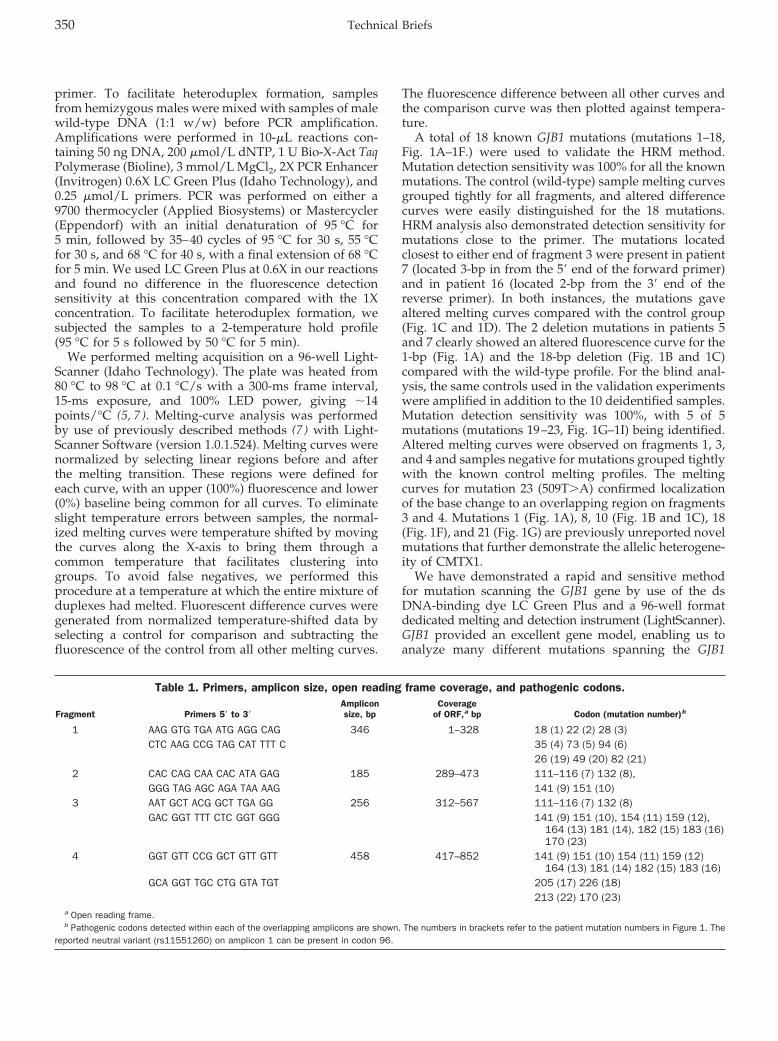
primer. To facilitate heteroduplex formation, samplesfrom hemizygous males were mixed with samples of malewild-type DNA (1:1 w/w) before PCR amplification.Amplifications were performed in 10-�L reactions con-taining 50 ng DNA, 200 �mol/L dNTP, 1 U Bio-X-Act TaqPolymerase (Bioline), 3 mmol/L MgCl2, 2X PCR Enhancer(Invitrogen) 0.6X LC Green Plus (Idaho Technology), and0.25 �mol/L primers. PCR was performed on either a9700 thermocycler (Applied Biosystems) or Mastercycler(Eppendorf) with an initial denaturation of 95 °C for5 min, followed by 35–40 cycles of 95 °C for 30 s, 55 °Cfor 30 s, and 68 °C for 40 s, with a final extension of 68 °Cfor 5 min. We used LC Green Plus at 0.6X in our reactionsand found no difference in the fluorescence detectionsensitivity at this concentration compared with the 1Xconcentration. To facilitate heteroduplex formation, wesubjected the samples to a 2-temperature hold profile(95 °C for 5 s followed by 50 °C for 5 min).
We performed melting acquisition on a 96-well Light-Scanner (Idaho Technology). The plate was heated from80 °C to 98 °C at 0.1 °C/s with a 300-ms frame interval,15-ms exposure, and 100% LED power, giving �14points/°C (5, 7 ). Melting-curve analysis was performedby use of previously described methods (7 ) with Light-Scanner Software (version 1.0.1.524). Melting curves werenormalized by selecting linear regions before and afterthe melting transition. These regions were defined foreach curve, with an upper (100%) fluorescence and lower(0%) baseline being common for all curves. To eliminateslight temperature errors between samples, the normal-ized melting curves were temperature shifted by movingthe curves along the X-axis to bring them through acommon temperature that facilitates clustering intogroups. To avoid false negatives, we performed thisprocedure at a temperature at which the entire mixture ofduplexes had melted. Fluorescent difference curves weregenerated from normalized temperature-shifted data byselecting a control for comparison and subtracting thefluorescence of the control from all other melting curves.
The fluorescence difference between all other curves andthe comparison curve was then plotted against tempera-ture.
A total of 18 known GJB1 mutations (mutations 1–18,Fig. 1A–1F.) were used to validate the HRM method.Mutation detection sensitivity was 100% for all the knownmutations. The control (wild-type) sample melting curvesgrouped tightly for all fragments, and altered differencecurves were easily distinguished for the 18 mutations.HRM analysis also demonstrated detection sensitivity formutations close to the primer. The mutations locatedclosest to either end of fragment 3 were present in patient7 (located 3-bp in from the 5� end of the forward primer)and in patient 16 (located 2-bp from the 3� end of thereverse primer). In both instances, the mutations gavealtered melting curves compared with the control group(Fig. 1C and 1D). The 2 deletion mutations in patients 5and 7 clearly showed an altered fluorescence curve for the1-bp (Fig. 1A) and the 18-bp deletion (Fig. 1B and 1C)compared with the wild-type profile. For the blind anal-ysis, the same controls used in the validation experimentswere amplified in addition to the 10 deidentified samples.Mutation detection sensitivity was 100%, with 5 of 5mutations (mutations 19–23, Fig. 1G–1I) being identified.Altered melting curves were observed on fragments 1, 3,and 4 and samples negative for mutations grouped tightlywith the known control melting profiles. The meltingcurves for mutation 23 (509T�A) confirmed localizationof the base change to an overlapping region on fragments3 and 4. Mutations 1 (Fig. 1A), 8, 10 (Fig. 1B and 1C), 18(Fig. 1F), and 21 (Fig. 1G) are previously unreported novelmutations that further demonstrate the allelic heterogene-ity of CMTX1.
We have demonstrated a rapid and sensitive methodfor mutation scanning the GJB1 gene by use of the dsDNA-binding dye LC Green Plus and a 96-well formatdedicated melting and detection instrument (LightScanner).GJB1 provided an excellent gene model, enabling us toanalyze many different mutations spanning the GJB1
Table 1. Primers, amplicon size, open reading frame coverage, and pathogenic codons.
Fragment Primers 5� to 3�Ampliconsize, bp
Coverageof ORF,a bp Codon (mutation number)b
1 AAG GTG TGA ATG AGG CAG 346 1–328 18 (1) 22 (2) 28 (3)CTC AAG CCG TAG CAT TTT C 35 (4) 73 (5) 94 (6)
26 (19) 49 (20) 82 (21)2 CAC CAG CAA CAC ATA GAG 185 289–473 111–116 (7) 132 (8),
GGG TAG AGC AGA TAA AAG 141 (9) 151 (10)3 AAT GCT ACG GCT TGA GG 256 312–567 111–116 (7) 132 (8)
GAC GGT TTT CTC GGT GGG 141 (9) 151 (10), 154 (11) 159 (12),164 (13) 181 (14), 182 (15) 183 (16)170 (23)
4 GGT GTT CCG GCT GTT GTT 458 417–852 141 (9) 151 (10) 154 (11) 159 (12)164 (13) 181 (14) 182 (15) 183 (16)
GCA GGT TGC CTG GTA TGT 205 (17) 226 (18)213 (22) 170 (23)
a Open reading frame.b Pathogenic codons detected within each of the overlapping amplicons are shown. The numbers in brackets refer to the patient mutation numbers in Figure 1. The
reported neutral variant (rs11551260) on amplicon 1 can be present in codon 96.
350 Technical Briefs
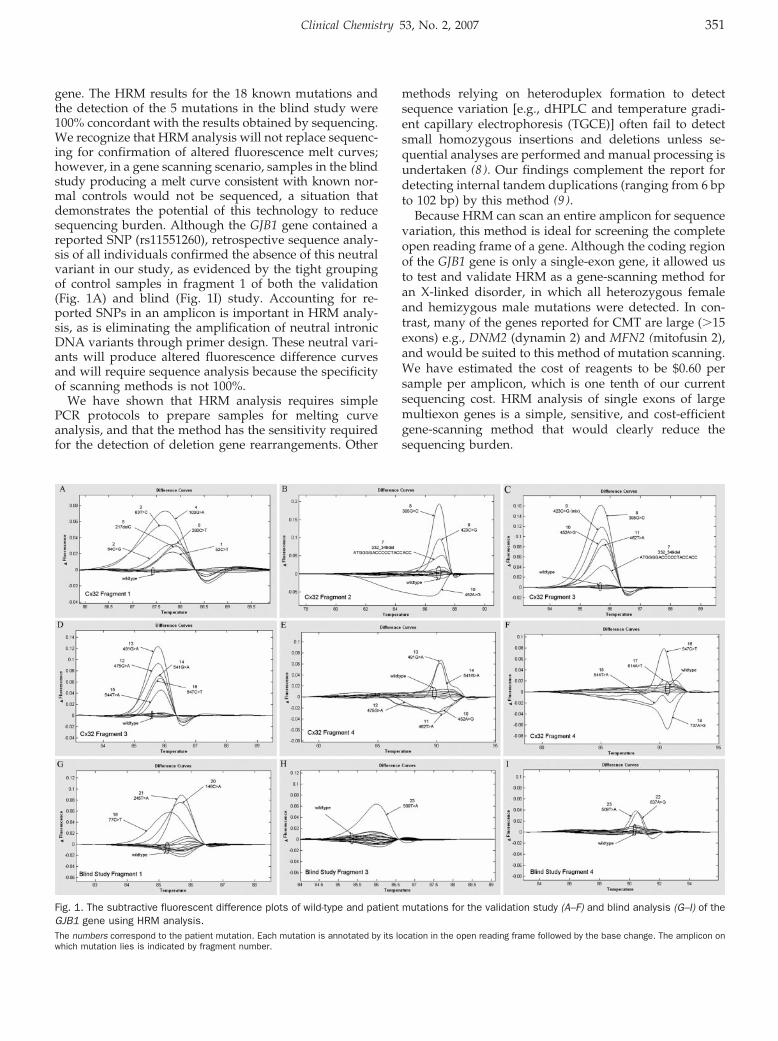
gene. The HRM results for the 18 known mutations andthe detection of the 5 mutations in the blind study were100% concordant with the results obtained by sequencing.We recognize that HRM analysis will not replace sequenc-ing for confirmation of altered fluorescence melt curves;however, in a gene scanning scenario, samples in the blindstudy producing a melt curve consistent with known nor-mal controls would not be sequenced, a situation thatdemonstrates the potential of this technology to reducesequencing burden. Although the GJB1 gene contained areported SNP (rs11551260), retrospective sequence analy-sis of all individuals confirmed the absence of this neutralvariant in our study, as evidenced by the tight groupingof control samples in fragment 1 of both the validation(Fig. 1A) and blind (Fig. 1I) study. Accounting for re-ported SNPs in an amplicon is important in HRM analy-sis, as is eliminating the amplification of neutral intronicDNA variants through primer design. These neutral vari-ants will produce altered fluorescence difference curvesand will require sequence analysis because the specificityof scanning methods is not 100%.
We have shown that HRM analysis requires simplePCR protocols to prepare samples for melting curveanalysis, and that the method has the sensitivity requiredfor the detection of deletion gene rearrangements. Other
methods relying on heteroduplex formation to detectsequence variation [e.g., dHPLC and temperature gradi-ent capillary electrophoresis (TGCE)] often fail to detectsmall homozygous insertions and deletions unless se-quential analyses are performed and manual processing isundertaken (8 ). Our findings complement the report fordetecting internal tandem duplications (ranging from 6 bpto 102 bp) by this method (9 ).
Because HRM can scan an entire amplicon for sequencevariation, this method is ideal for screening the completeopen reading frame of a gene. Although the coding regionof the GJB1 gene is only a single-exon gene, it allowed usto test and validate HRM as a gene-scanning method foran X-linked disorder, in which all heterozygous femaleand hemizygous male mutations were detected. In con-trast, many of the genes reported for CMT are large (�15exons) e.g., DNM2 (dynamin 2) and MFN2 (mitofusin 2),and would be suited to this method of mutation scanning.We have estimated the cost of reagents to be $0.60 persample per amplicon, which is one tenth of our currentsequencing cost. HRM analysis of single exons of largemultiexon genes is a simple, sensitive, and cost-efficientgene-scanning method that would clearly reduce thesequencing burden.
Fig. 1. The subtractive fluorescent difference plots of wild-type and patient mutations for the validation study (A–F) and blind analysis (G–I) of theGJB1 gene using HRM analysis.The numbers correspond to the patient mutation. Each mutation is annotated by its location in the open reading frame followed by the base change. The amplicon onwhich mutation lies is indicated by fragment number.
Clinical Chemistry 53, No. 2, 2007 351
References1. Skre H. Genetic and clinical aspects of Charcot-Marie-Tooth’s disease. Clin
Genet 1974;6:98–118.2. Ionasescu VV, Searby C, Ionasescu R, Neuhaus IM, Werner R. Mutations of
the noncoding region of the connexin32 gene in X-linked dominant Charcot-Marie-Tooth neuropathy. Neurology 1996;47:541–4.
3. Bergoffen J, Scherer SS, Wang S, Scott MO, Bone LJ, Paul DL et al. Connexinmutations in X-linked Charcot-Marie-Tooth disease. Science 1993;262:2039–42.
4. Wittwer CT, Reed GH, Gundry CN, Vandersteen JG, Pryor RJ. High-resolutiongenotyping by amplicon melting analysis using LCGreen. Clin Chem 2003;49:853–60.
5. Herrmann MG, Durtschi JD, Bromley LK, Wittwer CT, Voelkerding KV. AmpliconDNA melting analysis for mutation scanning and genotyping: cross-platformcomparison of instruments and dyes. Clin Chem 2006;52:494–503.
6. Gundry CN, Vandersteen JG, Reed GH, Pryor RJ, Chen J, Wittwer CT. Ampliconmelting analysis with labeled primers: a closed-tube method for differentiatinghomozygotes and heterozygotes. Clin Chem 2003;49:396–406.
7. Zhou L, Wang L, Palais R, Pryor R, Wittwer CT. High-resolution DNA meltinganalysis for simultaneous mutation scanning and genotyping in solution. ClinChem 2005;51:1770–7.
8. Palais RA, Liew MA, Wittwer CT. Quantitative heteroduplex analysis for singlenucleotide polymorphism genotyping. Anal Biochem 2005;346:167–75.
9. Vaughn CP, Elenitoba-Johnson KS. High-resolution melting analysis for detec-tion of internal tandem duplications. J Mol Diagn 2004;6:211–6.
Previously published online at DOI: 10.1373/clinchem.2006.080010
Is Supine Rest Necessary before Blood Sampling forPlasma Metanephrines? Jacques W.M. Lenders,* Jacques J.Willemsen,2 Graeme Eisenhofer,4 H. Alec Ross,2 Karel Pacak,5
Henri J.L.M. Timmers,3 and C.G.J. (Fred) Sweep2 (Depart-ments of 1 Internal Medicine, 2 Chemical Endocrinology,and 3 Endocrinology, Radboud University Nijmegen Med-ical Center, Nijmegen, The Netherlands; 4 Clinical Neuro-cardiology Section, National Institute of NeurologicalDisorders and Stroke and 5 Reproductive Biology andMedicine Branch, National Institute of Child Health andHuman Development, National Institutes of Health, Be-thesda, MD; * address correspondence to this author at:Department of Internal Medicine, Radboud UniversityNijmegen Medical Center, Geert Grooteplein, P.O. Box9101, 6500 HB, Nijmegen, The Netherlands; fax 31-24-3541734, e-mail [email protected])
Background: The impact of blood sampling in sitting vssupine positions on measurements of plasma metane-phrines for diagnosis of pheochromocytoma is unknown.Methods: We compared plasma concentrations of freemetanephrines in samples from patients with primaryhypertension obtained after supine rest with those ob-tained in the sitting position without preceding rest. Wealso assessed the effects on diagnostic test performanceretrospectively in patients with and without pheochro-mocytoma, and we calculated cost-effectiveness forpheochromocytoma testing.Results: Upper reference limits of plasma free meta-nephrines were higher in samples obtained from seatedpatients without preceding rest than from supine pa-tients with preceding rest. Application of these higherupper reference limits to samples from supine patients
with pheochromocytoma decreased the diagnostic sen-sitivity from 99% to 96%. In patients without pheochro-mocytoma, adjusting the plasma concentration for theeffects of sitting while preserving the 99% sensitivity byuse of the supine upper reference limits increased thenumber of false-positive test results from 9% to 25%.Conclusions: To preserve high diagnostic sensitivity werecommend the use of upper reference limits deter-mined from blood samples collected in the supineposition. Under these conditions, negative test resultsfor blood samples obtained with patients sitting are aseffective for ruling out pheochromocytoma as negativeresults from samples obtained after supine rest. Repeattesting with samples obtained in the supine positionoffers a cost-effective approach for dealing with theincreased numbers of false-positive results expectedafter initial sampling in the sitting position.© 2007 American Association for Clinical Chemistry
Measurements of plasma free metanephrines (normeta-nephrine and metanephrine) provide a particularly sensi-tive test for the diagnosis of pheochromocytoma (1–4).Suboptimal specificity in some studies may be attribut-able to blood sampling conditions (5 ). We thereforeexamined diagnostic test performance for samples ob-tained from patients who were either supine or sitting.
Study participants were 60 patients [38 females, mean(SD) age 45 (13.3) years, range 22–78 years; blood pressure154 (15)/96 (8) mmHg] with primary hypertension (offmedication for 2–3 weeks) and normal renal function. Afirst blood sample was drawn through an antecubitalcannula immediately after patients sat down and a 2ndblood sample after 30 min of supine rest. Plasma sampleswere assayed for concentrations of metanephrines (6 ).
Gaussian distributions of metanephrines were obtainedafter logarithmic transformation of the data. The antilog-arithm of the mean � 2 SD of the transformed data of the60 patients was used as an estimate of the 97.5th percen-tile, which was adopted as the upper reference limit.
The data obtained from sitting and supine conditionswere used in a retrospective analysis of a dataset ofsamples drawn after at least 20 min of supine rest frompatients with (n � 228) and without pheochromocytoma(n � 644) (1 ). We used the upper reference limits ofsamples obtained from the 60 hypertensives in the sittingand supine positions to recalculate all diagnostic indicesin the retrospective dataset. To further assess the potentialinfluences of posture on diagnostic specificity, we ad-justed the test results in the 644 patients without pheo-chromocytoma for the influence of sitting. We did not doso for the pheochromocytoma patients because of thelikely negligible influence of posture on the alreadyconsiderably increased plasma concentrations of meta-nephrines in these patients.
The distributions of the 4 variables from sampling insupine and sitting positions were tested for normalityusing the Shapiro–Wilk test (SPSS v12). The effect of the
352 Technical Briefs
different positions was tested by conventional pairedt-test.
Samples obtained from seated hypertensive patientshad 30% higher (P �0.001) values of plasma normeta-nephrine and 27% higher (P �0.001) values for plasmametanephrine than samples obtained from patients after30 min of supine rest (data not shown). These resultsindicated higher upper reference limits in the sitting thanthe supine position for both plasma free normetanephrine(0.73 vs 0.62 nmol/L) and metanephrine (0.50 vs 0.35nmol/L). In the present study the upper reference limitsfor supine plasma metanephrines for the 60 hypertensivepatients were similar to those we previously estimated ina mixed population of 178 normotensive and hyperten-sive patients, 0.62 nmol/L for normetanephrine and 0.31nmol/L for metanephrine.
Applying the supine upper reference limits of thepresent study to the supine data of our previous study inpatients with and without pheochromocytoma resulted inno or little change in diagnostic sensitivity (99% vs 99%)or specificity (87% vs 91%) for plasma metanephrines (1 ).In contrast, applying the upper reference limits derivedfrom the samples obtained from sitting patients resultedin a 3-fold increase in false-negative test results (3 to 9patients), leading to a change in diagnostic sensitivity forplasma free metanephrines from 99% to 96% (Table 1).Adjusting the supine data in the 644 patients withoutpheochromocytoma for the projected 30% and 27% sit-ting-associated increases in plasma normetanephrine andmetanephrine resulted in a diagnostic specificity of 89%.Applying the supine upper reference limits to the sameposture-adjusted values in the patients without pheochro-mocytoma led to a 2.8-fold increase in false-positive testresults and a drop in diagnostic specificity to 75%, with apreserved sensitivity of 99% (Table 1).
We calculated the financial implications of samplingunder both conditions (sitting and supine) to test forpheochromocytoma in 100 000 hypothetical patients.From a 3rd-payer perspective, the charges in US dollarswere assumed to be $20 for a venipuncture, $100 for anassay of plasma free metanephrines, and $200 dollars forthe supine rest test. The calculation was carried out withthe assumption of a prevalence rate of pheochromocy-
toma of 0.1% (7 ), a diagnostic sensitivity of 99%, and aspecificity of 75% for plasma free metanephrines (Table 1).The total cost of initial supine rest tests in all patients wascalculated to be $30 000 000. If all 100 000 patients hadinitial samples drawn in the sitting position, however,25 074 patients (99 true positives and 24 975 false-posi-tives) would have positive test results for plasma meta-nephrines and should have additional supine tests. Thetotal costs of this latter approach would be $19 522 200,reducing the cost by nearly $10 000 000.
The effect of posture on plasma concentrations of freemetanephrines must be considered in establishing refer-ence intervals and interpreting test results for diagnosis ofpheochromocytoma. The higher plasma concentrations ofmetanephrines associated with blood sampling from pa-tients in seated rather than in the supine positions are notunexpected given the known effects of posture on plasmacatecholamines. The findings are also consistent withprevious observations that during sympathoadrenal acti-vation plasma free metanephrines show similar, albeitsmaller, directional changes compared to plasma cat-echolamines (8-10). Despite such influences it has becomea relatively common practice to measure plasma meta-nephrines in blood samples obtained from seated patients(2 ).
Obtaining blood samples from seated rather than su-pine patients may be more practical for phlebotomists,but the sympathoadrenal activating effects of uprightposture may compromise the diagnostic accuracy of mea-surements of plasma metanephrines. As we show here,sitting-associated increases in plasma metanephrines inpatients without pheochromocytoma decreases the sig-nal-to-noise ratio for a true-positive compared to a false-positive test result, thereby increasing the difficulty ofdistinguishing increases in metanephrines due to a tumorfrom those due to seated posture. More importantly, aswe also show, use of reference intervals established fromsamples obtained from seated patients can be expected toresult in increased false-negative test results and loss ofdiagnostic sensitivity.
Although pheochromocytomas are rare, they can havedeadly consequences if undiagnosed. Initial testingshould therefore reliably provide a positive test result in
Table 1. Effects of body position and rest on test characteristics for plasma metanephrines.Position for derivation of
upper reference limitsCorrection nonpheochromocytoma
samplesaPlasma metanephrines
(%)
Sensitivity (95% CI) Supine � 99 (98–100)Sitting � 96 (93–99)
Specificity (95% CI) Supine � 91 (89–93)Sitting � 89 (87–91)Supine � 75 (72–78)
a The supine test results in the 644 nonpheochromocytoma patients were adjusted for projected 30% and 27% seated position-associated increases in plasmanormetanephrine and metanephrine. The test results in the patients who had a pheochromocytoma were not adjusted for projected seated position-associatedincreases in plasma metanephrines in view of the negligible effects of posture on the very high plasma concentrations in these patients.
The upper reference limits for plasma normetanephrine were 0.62 nmol/L and 0.73 nmol/L, for the supine and sitting positions, respectively. The upper referencelimits for plasma metanephrine were 0.35 nmol/L, and 0.50 nmol/L for the supine and sitting positions, respectively.
For a 100% specificity, plasma levels are higher in the sitting position: plasma normetanephrine 2.84 nmol/L and metanephrine 1.49 nmol/L (vs 2.20 nmol/L and1.20 nmol/L, respectively, in the supine position). At 100% specificity, the sensitivity of plasma metanephrines drawn in the sitting position would be 72%.
Clinical Chemistry 53, No. 2, 2007 353
that rare patient with the tumor. This conversely alsomeans that a negative result reliably excludes the tumor,thereby avoiding the need for multiple or repeat biochem-ical testing and costly and unnecessary imaging studies.The projected 3-fold increase in false-negative test resultsassociated with reference intervals established from bloodsamples drawn in the seated position erodes confidencethat a negative test result for plasma free metanephrinesreliably excludes pheochromocytoma.
The disadvantage of upper reference intervals estab-lished for samples obtained from supine patients is anexpected increase in false-positive test results when sam-ples for diagnosis of pheochromocytoma are drawn fromseated patients, the condition most convenient for phle-botomists. The diagnostic sensitivity, however, is pre-served at 99%. Retrospective analysis of the present studyindicated a likely 2.8-fold increase in false-positive results,from 9% to 25%. In the additional 16% of patients withposture-dependent false-positive results, the tumor maybe ruled out by true-negative test results after additionaltesting with blood samples taken after 30 min of supinerest.
What are the practical implications of initial bloodsampling from patients in the diagnostically ideal supineposition vs the more convenient and less costly seatedposition? Provided that upper reference limits obtainedafter supine rest are used, negative test results for bloodsamples from seated patients are as effective in ruling outpheochromocytoma as negative results obtained frompatients after supine rest. Repeat testing with samplesobtained in the supine position offers a cost-effectiveapproach for dealing with the increased numbers of
false-positive results expected after initial sampling in thesitting position.
References1. Lenders JWM, Pacak K, Walther MM, Linehan WM, Mannelli J, Friberg J, et
al. Biochemical diagnosis of pheochromocytoma: which test is best? JAMA2002;287:1427–34.
2. Sawka AM, Jaeschke R, Singh RJ, Young WF, Jr. A comparison of biochem-ical tests for pheochromocytoma: measurement of fractionated plasmametanephrines compared with the combination of 24-hour urinary meta-nephrines and catecholamines. J Clin Endocrinol Metab 2003;88:553–8.
3. Raber W, Raffesberg W, Bischof M, Scheuba C, Niederle B, Gasic S, et al.Diagnostic efficacy of unconjugated plasma metanephrines for the detectionof pheochromocytoma. Arch Intern Med 2000;160:2957–63.
4. Unger N, Pitt C, Schmidt IL, Walz MK, Schmid KW, Philipp T, et al. Diagnosticvalue of various biochemical parameters for the diagnosis of pheochromo-cytoma in patients with adrenal mass. Eur J Endocrinol 2006;154:409–17.
5. Eisenhofer G. Editorial: biochemical diagnosis of pheochromocytoma–is ittime to switch to plasma-free metanephrines? J Clin Endocrinol Metab2003;88:550–2.
6. Willemsen JJ, Sweep CG, Lenders JW, Ross HA. Stability of plasma freemetanephrines during collection and storage as assessed by an optimizedHPLC method with electrochemical detection. Clin Chem 2003;49:1951–3.
7. Lenders JW, Eisenhofer G, Mannelli M, Pacak K. Phaeochromocytoma.Lancet 2005;366:665–75.
8. Robertson DA, Johnson GA, Robertson RM, Nies AS, Shand DG, Oates JA.Comparative assessment of stimuli that release neuronal and adrenomed-ullary catecholamines in man. Circulation 1979;59:637–43.
9. Eisenhofer G, Goldstein DS, Walther MM, Friberg P, Lenders JWM, KeiserHR, et al. Biochemical diagnosis of pheochromocytoma: How to distinguishtrue- from false-positive test results. J Clin Endocrinol Metab 2003;88:2656–66.
10. Eisenhofer G, Friberg P, Pacak K, Goldstein DS, Murphy DL, Tsigos C, et al.Plasma metadrenalines: Do they provide useful information about sympa-tho-adrenal function and catecholamine metabolism? Clin Sci 1995;88:533–42.
DOI: 10.1373/clinchem.2006.076489
354 Technical Briefs
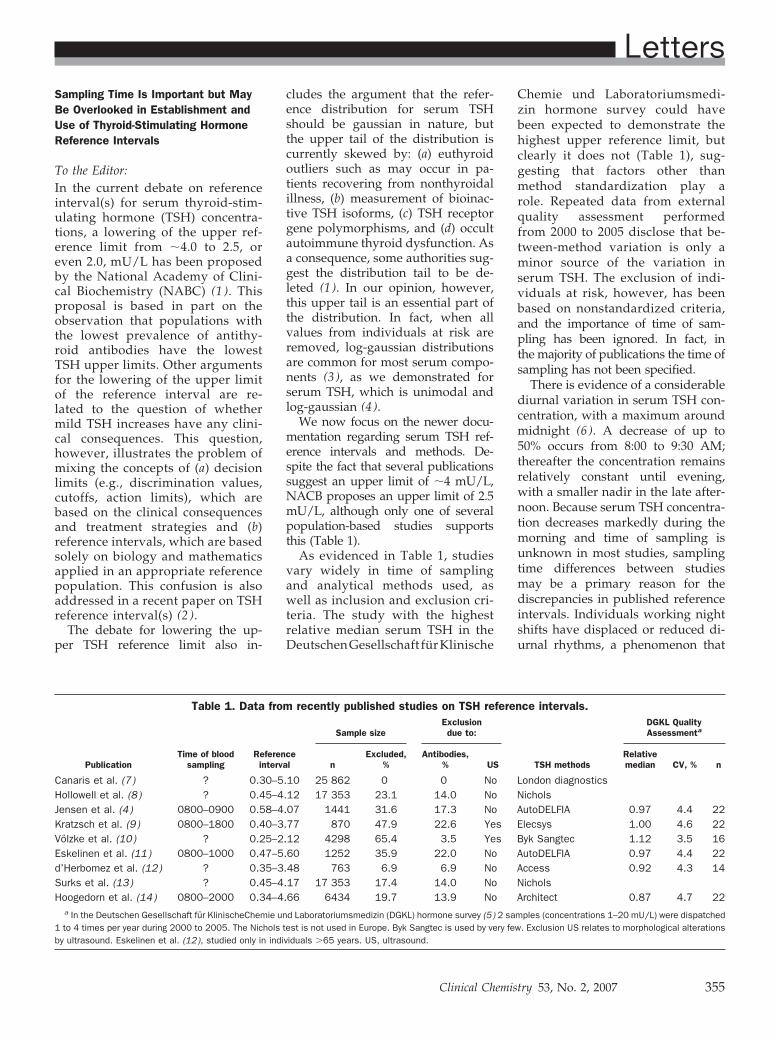
Sampling Time Is Important but MayBe Overlooked in Establishment andUse of Thyroid-Stimulating HormoneReference Intervals
To the Editor:In the current debate on referenceinterval(s) for serum thyroid-stim-ulating hormone (TSH) concentra-tions, a lowering of the upper ref-erence limit from �4.0 to 2.5, oreven 2.0, mU/L has been proposedby the National Academy of Clini-cal Biochemistry (NABC) (1 ). Thisproposal is based in part on theobservation that populations withthe lowest prevalence of antithy-roid antibodies have the lowestTSH upper limits. Other argumentsfor the lowering of the upper limitof the reference interval are re-lated to the question of whethermild TSH increases have any clini-cal consequences. This question,however, illustrates the problem ofmixing the concepts of (a) decisionlimits (e.g., discrimination values,cutoffs, action limits), which arebased on the clinical consequencesand treatment strategies and (b)reference intervals, which are basedsolely on biology and mathematicsapplied in an appropriate referencepopulation. This confusion is alsoaddressed in a recent paper on TSHreference interval(s) (2 ).
The debate for lowering the up-per TSH reference limit also in-
cludes the argument that the refer-ence distribution for serum TSHshould be gaussian in nature, butthe upper tail of the distribution iscurrently skewed by: (a) euthyroidoutliers such as may occur in pa-tients recovering from nonthyroidalillness, (b) measurement of bioinac-tive TSH isoforms, (c) TSH receptorgene polymorphisms, and (d) occultautoimmune thyroid dysfunction. Asa consequence, some authorities sug-gest the distribution tail to be de-leted (1 ). In our opinion, however,this upper tail is an essential part ofthe distribution. In fact, when allvalues from individuals at risk areremoved, log-gaussian distributionsare common for most serum compo-nents (3 ), as we demonstrated forserum TSH, which is unimodal andlog-gaussian (4 ).
We now focus on the newer docu-mentation regarding serum TSH ref-erence intervals and methods. De-spite the fact that several publicationssuggest an upper limit of �4 mU/L,NACB proposes an upper limit of 2.5mU/L, although only one of severalpopulation-based studies supportsthis (Table 1).
As evidenced in Table 1, studiesvary widely in time of samplingand analytical methods used, aswell as inclusion and exclusion cri-teria. The study with the highestrelative median serum TSH in theDeutschenGesellschaft furKlinische
Chemie und Laboratoriumsmedi-zin hormone survey could havebeen expected to demonstrate thehighest upper reference limit, butclearly it does not (Table 1), sug-gesting that factors other thanmethod standardization play arole. Repeated data from externalquality assessment performedfrom 2000 to 2005 disclose that be-tween-method variation is only aminor source of the variation inserum TSH. The exclusion of indi-viduals at risk, however, has beenbased on nonstandardized criteria,and the importance of time of sam-pling has been ignored. In fact, inthe majority of publications the time ofsampling has not been specified.
There is evidence of a considerablediurnal variation in serum TSH con-centration, with a maximum aroundmidnight (6 ). A decrease of up to50% occurs from 8:00 to 9:30 AM;thereafter the concentration remainsrelatively constant until evening,with a smaller nadir in the late after-noon. Because serum TSH concentra-tion decreases markedly during themorning and time of sampling isunknown in most studies, samplingtime differences between studiesmay be a primary reason for thediscrepancies in published referenceintervals. Individuals working nightshifts have displaced or reduced di-urnal rhythms, a phenomenon that
Table 1. Data from recently published studies on TSH reference intervals.
PublicationTime of blood
samplingReferenceinterval
Sample sizeExclusiondue to:
TSH methods
DGKL QualityAssessmenta
nExcluded,
%Antibodies,
% USRelativemedian CV, % n
Canaris et al. (7 ) ? 0.30–5.10 25 862 0 0 No London diagnosticsHollowell et al. (8 ) ? 0.45–4.12 17 353 23.1 14.0 No NicholsJensen et al. (4 ) 0800–0900 0.58–4.07 1441 31.6 17.3 No AutoDELFIA 0.97 4.4 22Kratzsch et al. (9 ) 0800–1800 0.40–3.77 870 47.9 22.6 Yes Elecsys 1.00 4.6 22Völzke et al. (10) ? 0.25–2.12 4298 65.4 3.5 Yes Byk Sangtec 1.12 3.5 16Eskelinen et al. (11) 0800–1000 0.47–5.60 1252 35.9 22.0 No AutoDELFIA 0.97 4.4 22d’Herbomez et al. (12) ? 0.35–3.48 763 6.9 6.9 No Access 0.92 4.3 14Surks et al. (13) ? 0.45–4.17 17 353 17.4 14.0 No NicholsHoogedorn et al. (14) 0800–2000 0.34–4.66 6434 19.7 13.9 No Architect 0.87 4.7 22
a In the Deutschen Gesellschaft für KlinischeChemie und Laboratoriumsmedizin (DGKL) hormone survey (5 ) 2 samples (concentrations 1–20 mU/L) were dispatched1 to 4 times per year during 2000 to 2005. The Nichols test is not used in Europe. Byk Sangtec is used by very few. Exclusion US relates to morphological alterationsby ultrasound. Eskelinen et al. (12), studied only in individuals �65 years. US, ultrasound.
Letters
Clinical Chemistry 53, No. 2, 2007 355
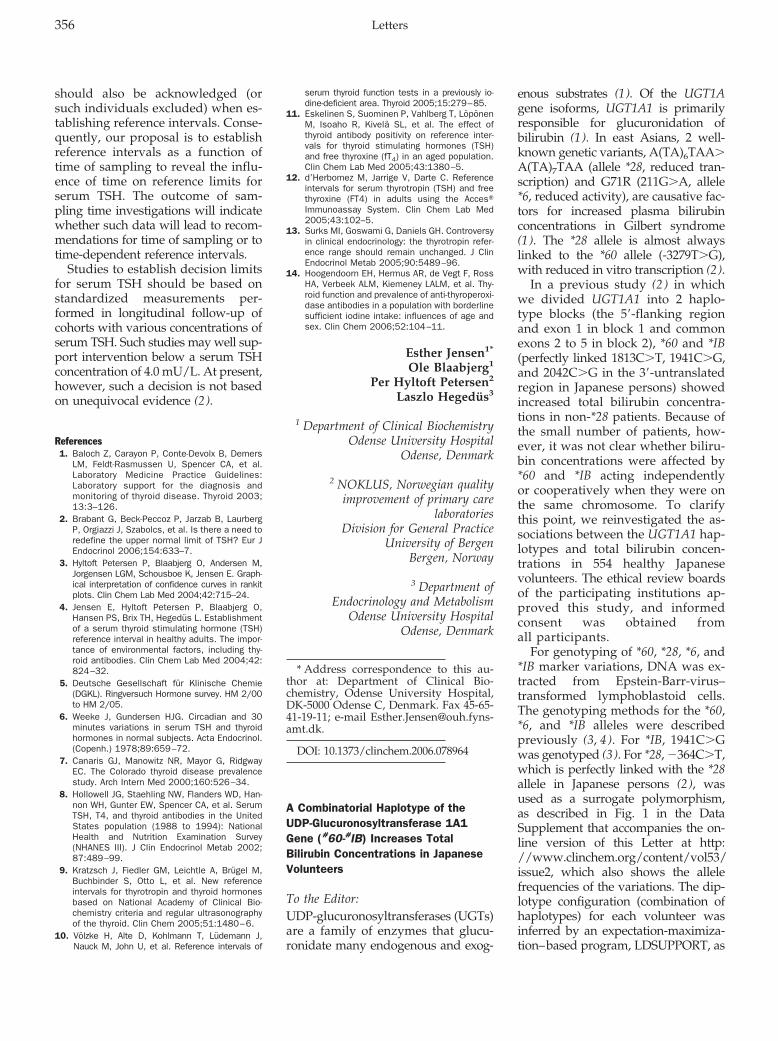
should also be acknowledged (orsuch individuals excluded) when es-tablishing reference intervals. Conse-quently, our proposal is to establishreference intervals as a function oftime of sampling to reveal the influ-ence of time on reference limits forserum TSH. The outcome of sam-pling time investigations will indicatewhether such data will lead to recom-mendations for time of sampling or totime-dependent reference intervals.
Studies to establish decision limitsfor serum TSH should be based onstandardized measurements per-formed in longitudinal follow-up ofcohorts with various concentrations ofserum TSH. Such studies may well sup-port intervention below a serum TSHconcentration of 4.0 mU/L. At present,however, such a decision is not basedon unequivocal evidence (2).
References1. Baloch Z, Carayon P, Conte-Devolx B, Demers
LM, Feldt-Rasmussen U, Spencer CA, et al.Laboratory Medicine Practice Guidelines:Laboratory support for the diagnosis andmonitoring of thyroid disease. Thyroid 2003;13:3–126.
2. Brabant G, Beck-Peccoz P, Jarzab B, LaurbergP, Orgiazzi J, Szabolcs, et al. Is there a need toredefine the upper normal limit of TSH? Eur JEndocrinol 2006;154:633–7.
3. Hyltoft Petersen P, Blaabjerg O, Andersen M,Jorgensen LGM, Schousboe K, Jensen E. Graph-ical interpretation of confidence curves in rankitplots. Clin Chem Lab Med 2004;42:715–24.
4. Jensen E, Hyltoft Petersen P, Blaabjerg O,Hansen PS, Brix TH, Hegedus L. Establishmentof a serum thyroid stimulating hormone (TSH)reference interval in healthy adults. The impor-tance of environmental factors, including thy-roid antibodies. Clin Chem Lab Med 2004;42:824–32.
5. Deutsche Gesellschaft fur Klinische Chemie(DGKL). Ringversuch Hormone survey. HM 2/00to HM 2/05.
6. Weeke J, Gundersen HJG. Circadian and 30minutes variations in serum TSH and thyroidhormones in normal subjects. Acta Endocrinol.(Copenh.) 1978;89:659–72.
7. Canaris GJ, Manowitz NR, Mayor G, RidgwayEC. The Colorado thyroid disease prevalencestudy. Arch Intern Med 2000;160:526–34.
8. Hollowell JG, Staehling NW, Flanders WD, Han-non WH, Gunter EW, Spencer CA, et al. SerumTSH, T4, and thyroid antibodies in the UnitedStates population (1988 to 1994): NationalHealth and Nutrition Examination Survey(NHANES III). J Clin Endocrinol Metab 2002;87:489–99.
9. Kratzsch J, Fiedler GM, Leichtle A, Brugel M,Buchbinder S, Otto L, et al. New referenceintervals for thyrotropin and thyroid hormonesbased on National Academy of Clinical Bio-chemistry criteria and regular ultrasonographyof the thyroid. Clin Chem 2005;51:1480–6.
10. Volzke H, Alte D, Kohlmann T, Ludemann J,Nauck M, John U, et al. Reference intervals of
serum thyroid function tests in a previously io-dine-deficient area. Thyroid 2005;15:279–85.
11. Eskelinen S, Suominen P, Vahlberg T, LoponenM, Isoaho R, Kivela SL, et al. The effect ofthyroid antibody positivity on reference inter-vals for thyroid stimulating hormones (TSH)and free thyroxine (fT4) in an aged population.Clin Chem Lab Med 2005;43:1380–5.
12. d’Herbomez M, Jarrige V, Darte C. Referenceintervals for serum thyrotropin (TSH) and freethyroxine (FT4) in adults using the Acces�Immunoassay System. Clin Chem Lab Med2005;43:102–5.
13. Surks MI, Goswami G, Daniels GH. Controversyin clinical endocrinology: the thyrotropin refer-ence range should remain unchanged. J ClinEndocrinol Metab 2005;90:5489–96.
14. Hoogendoorn EH, Hermus AR, de Vegt F, RossHA, Verbeek ALM, Kiemeney LALM, et al. Thy-roid function and prevalence of anti-thyroperoxi-dase antibodies in a population with borderlinesufficient iodine intake: influences of age andsex. Clin Chem 2006;52:104–11.
Esther Jensen1*
Ole Blaabjerg1
Per Hyltoft Petersen2
Laszlo Hegedus3
1 Department of Clinical BiochemistryOdense University Hospital
Odense, Denmark
2 NOKLUS, Norwegian qualityimprovement of primary care
laboratoriesDivision for General Practice
University of BergenBergen, Norway
3 Department ofEndocrinology and Metabolism
Odense University HospitalOdense, Denmark
* Address correspondence to this au-thor at: Department of Clinical Bio-chemistry, Odense University Hospital,DK-5000 Odense C, Denmark. Fax 45-65-41-19-11; e-mail [email protected].
DOI: 10.1373/clinchem.2006.078964
A Combinatorial Haplotype of theUDP-Glucuronosyltransferase 1A1Gene (#60-#IB) Increases TotalBilirubin Concentrations in JapaneseVolunteers
To the Editor:UDP-glucuronosyltransferases (UGTs)are a family of enzymes that glucu-ronidate many endogenous and exog-
enous substrates (1). Of the UGT1Agene isoforms, UGT1A1 is primarilyresponsible for glucuronidation ofbilirubin (1). In east Asians, 2 well-known genetic variants, A(TA)6TAA�A(TA)7TAA (allele *28, reduced tran-scription) and G71R (211G�A, allele*6, reduced activity), are causative fac-tors for increased plasma bilirubinconcentrations in Gilbert syndrome(1). The *28 allele is almost alwayslinked to the *60 allele (-3279T�G),with reduced in vitro transcription (2).
In a previous study (2 ) in whichwe divided UGT1A1 into 2 haplo-type blocks (the 5�-flanking regionand exon 1 in block 1 and commonexons 2 to 5 in block 2), *60 and *IB(perfectly linked 1813C�T, 1941C�G,and 2042C�G in the 3�-untranslatedregion in Japanese persons) showedincreased total bilirubin concentra-tions in non-*28 patients. Because ofthe small number of patients, how-ever, it was not clear whether biliru-bin concentrations were affected by*60 and *IB acting independentlyor cooperatively when they were onthe same chromosome. To clarifythis point, we reinvestigated the as-sociations between the UGT1A1 hap-lotypes and total bilirubin concen-trations in 554 healthy Japanesevolunteers. The ethical review boardsof the participating institutions ap-proved this study, and informedconsent was obtained fromall participants.
For genotyping of *60, *28, *6, and*IB marker variations, DNA was ex-tracted from Epstein-Barr-virus–transformed lymphoblastoid cells.The genotyping methods for the *60,*6, and *IB alleles were describedpreviously (3, 4). For *IB, 1941C�Gwas genotyped (3). For *28, �364C�T,which is perfectly linked with the *28allele in Japanese persons (2), wasused as a surrogate polymorphism,as described in Fig. 1 in the DataSupplement that accompanies the on-line version of this Letter at http://www.clinchem.org/content/vol53/issue2, which also shows the allelefrequencies of the variations. The dip-lotype configuration (combination ofhaplotypes) for each volunteer wasinferred by an expectation-maximiza-tion–based program, LDSUPPORT, as
356 Letters
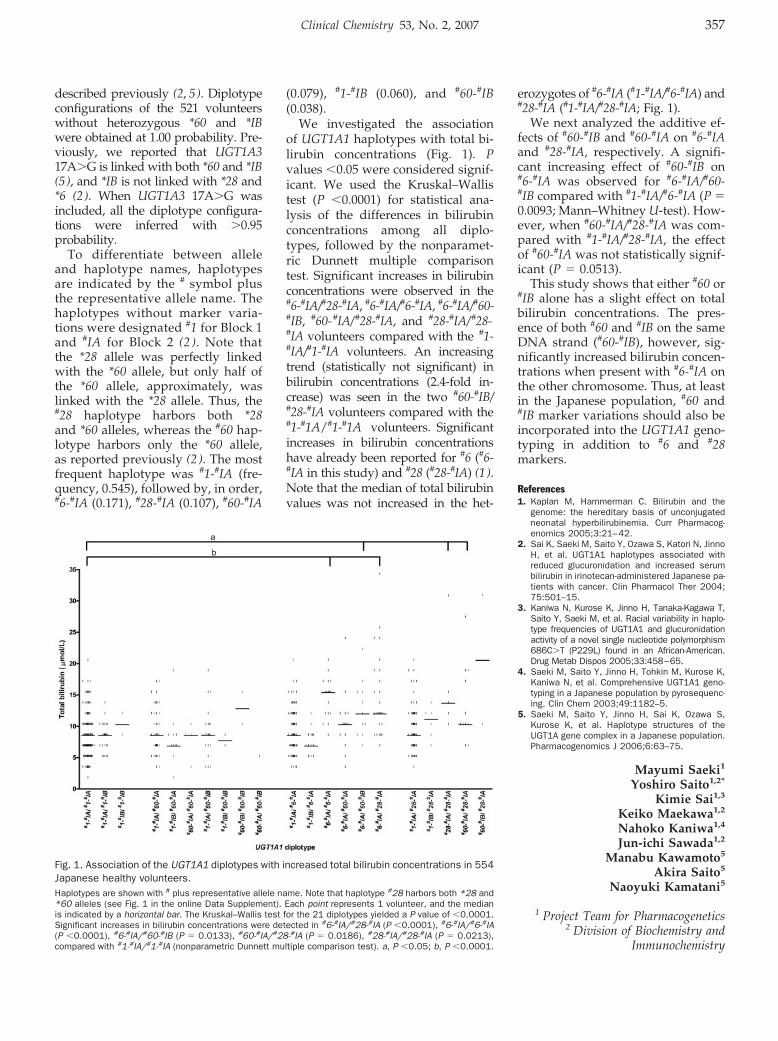
described previously (2, 5). Diplotypeconfigurations of the 521 volunteerswithout heterozygous *60 and *IBwere obtained at 1.00 probability. Pre-viously, we reported that UGT1A317A�G is linked with both *60 and *IB(5), and *IB is not linked with *28 and*6 (2). When UGT1A3 17A�G wasincluded, all the diplotype configura-tions were inferred with �0.95probability.
To differentiate between alleleand haplotype names, haplotypesare indicated by the # symbol plusthe representative allele name. Thehaplotypes without marker varia-tions were designated #1 for Block 1and #IA for Block 2 (2 ). Note thatthe *28 allele was perfectly linkedwith the *60 allele, but only half ofthe *60 allele, approximately, waslinked with the *28 allele. Thus, the#28 haplotype harbors both *28and *60 alleles, whereas the #60 hap-lotype harbors only the *60 allele,as reported previously (2 ). The mostfrequent haplotype was #1-#IA (fre-quency, 0.545), followed by, in order,#6-#IA (0.171), #28-#IA (0.107), #60-#IA
(0.079), #1-#IB (0.060), and #60-#IB(0.038).
We investigated the associationof UGT1A1 haplotypes with total bi-lirubin concentrations (Fig. 1). Pvalues �0.05 were considered signif-icant. We used the Kruskal–Wallistest (P �0.0001) for statistical ana-lysis of the differences in bilirubinconcentrations among all diplo-types, followed by the nonparamet-ric Dunnett multiple comparisontest. Significant increases in bilirubinconcentrations were observed in the#6-#IA/#28-#IA, #6-#IA/#6-#IA, #6-#IA/#60-#IB, #60-#IA/#28-#IA, and #28-#IA/#28-#IA volunteers compared with the #1-#IA/#1-#IA volunteers. An increasingtrend (statistically not significant) inbilirubin concentrations (2.4-fold in-crease) was seen in the two #60-#IB/#28-#IA volunteers compared with the#1-#1A/#1-#1A volunteers. Significantincreases in bilirubin concentrationshave already been reported for #6 (#6-#IA in this study) and #28 (#28-#IA) (1).Note that the median of total bilirubinvalues was not increased in the het-
erozygotes of #6-#IA (#1-#IA/#6-#IA) and#28-#IA (#1-#IA/#28-#IA; Fig. 1).
We next analyzed the additive ef-fects of #60-#IB and #60-#IA on #6-#IAand #28-#IA, respectively. A signifi-cant increasing effect of #60-#IB on#6-#IA was observed for #6-#IA/#60-#IB compared with #1-#IA/#6-#IA (P �0.0093; Mann–Whitney U-test). How-ever, when #60-#IA/#28-#IA was com-pared with #1-#IA/#28-#IA, the effectof #60-#IA was not statistically signif-icant (P � 0.0513).
This study shows that either #60 or#IB alone has a slight effect on totalbilirubin concentrations. The pres-ence of both #60 and #IB on the sameDNA strand (#60-#IB), however, sig-nificantly increased bilirubin concen-trations when present with #6-#IA onthe other chromosome. Thus, at leastin the Japanese population, #60 and#IB marker variations should also beincorporated into the UGT1A1 geno-typing in addition to #6 and #28markers.
References1. Kaplan M, Hammerman C. Bilirubin and the
genome: the hereditary basis of unconjugatedneonatal hyperbilirubinemia. Curr Pharmacog-enomics 2005;3:21–42.
2. Sai K, Saeki M, Saito Y, Ozawa S, Katori N, JinnoH, et al. UGT1A1 haplotypes associated withreduced glucuronidation and increased serumbilirubin in irinotecan-administered Japanese pa-tients with cancer. Clin Pharmacol Ther 2004;75:501–15.
3. Kaniwa N, Kurose K, Jinno H, Tanaka-Kagawa T,Saito Y, Saeki M, et al. Racial variability in haplo-type frequencies of UGT1A1 and glucuronidationactivity of a novel single nucleotide polymorphism686C�T (P229L) found in an African-American.Drug Metab Dispos 2005;33:458–65.
4. Saeki M, Saito Y, Jinno H, Tohkin M, Kurose K,Kaniwa N, et al. Comprehensive UGT1A1 geno-typing in a Japanese population by pyrosequenc-ing. Clin Chem 2003;49:1182–5.
5. Saeki M, Saito Y, Jinno H, Sai K, Ozawa S,Kurose K, et al. Haplotype structures of theUGT1A gene complex in a Japanese population.Pharmacogenomics J 2006;6:63–75.
Mayumi Saeki1
Yoshiro Saito1,2*
Kimie Sai1,3
Keiko Maekawa1,2
Nahoko Kaniwa1,4
Jun-ichi Sawada1,2
Manabu Kawamoto5
Akira Saito5
Naoyuki Kamatani5
1 Project Team for Pharmacogenetics2 Division of Biochemistry and
Immunochemistry
Fig. 1. Association of the UGT1A1 diplotypes with increased total bilirubin concentrations in 554Japanese healthy volunteers.Haplotypes are shown with # plus representative allele name. Note that haplotype #28 harbors both *28 and*60 alleles (see Fig. 1 in the online Data Supplement). Each point represents 1 volunteer, and the medianis indicated by a horizontal bar. The Kruskal–Wallis test for the 21 diplotypes yielded a P value of �0.0001.Significant increases in bilirubin concentrations were detected in #6-#IA/#28-#IA (P �0.0001), #6-#IA/#6-#IA(P �0.0001), #6-#IA/#60-#IB (P � 0.0133), #60-#IA/#28-#IA (P � 0.0186), #28-#IA/#28-#IA (P � 0.0213),compared with #1-#IA/#1-#IA (nonparametric Dunnett multiple comparison test). a, P �0.05; b, P �0.0001.
Clinical Chemistry 53, No. 2, 2007 357
3 Division of Biosignaling4 Division of Medicinal Safety Science
National Institute of Health SciencesTokyo, Japan
5 Division of Genomic MedicineDepartment of Advanced Biomedical
Engineering and ScienceTokyo Women’s Medical University
Tokyo, Japan
*Address correspondence to this au-thor at: Division of Biochemistry andImmunochemistry, National Instituteof Health Sciences, 1-18-1 Kamiyoga,Setagaya-ku, Tokyo 158-8501, Japan.Fax 81-3-5717-3832; e-mail [email protected].
DOI: 10.1373/clinchem.2006.077990
Preanalytical Stability ofAdrenocorticotropic HormoneDepends on Time to CentrifugationRather than Temperature
To the Editor:Preanalytical factors can affect reli-ability of hormone assay results. Ad-renocorticotropic hormone (ACTH)in blood is considered highly unsta-ble because of proteolytic degra-dation (1–4), so storage of bloodsamples on ice until analysis is rec-ommended. In clinical practice, how-ever, this procedure may present lo-gistical problems because mostsamples for ACTH measurementmust be shipped from the place ofsample collection to the laboratory.Therefore, we studied the impact oftime and temperature before plasmaseparation and analysis on the re-sults of ACTH assays.
At 8 am, we obtained 2 bloodsamples from each of 19 healthy vol-unteers and 2 patients with patholog-ically high ACTH values (1 with Ad-dison disease and 1 with congenitaladrenal hyperplasia). Volunteers andpatients gave written informed con-sent, and the ethics committee forour institution approved the study.ACTH concentrations were 5–774ng/L. As recommended by the manu-facturer (Monovette, Sarstedt), col-lection tubes contained 1.2–2 g of
potassium EDTA/L, with a maxi-mum 1% dilution effect of liquidEDTA.
For each set of 2 samples, 1 samplewas centrifuged immediately aftercollection and then divided into ali-quots for storage at room tempera-ture (22 °C), 4 °C, or �20 °C for 1, 2,4, 24, or 48 h before being frozen at�80 °C until it was assayed. The 2ndsample was left in the primary col-lection tube at either room tempera-ture or 4 °C for 1, 2, 4, 24, or 48 hbefore centrifugation and then frozenat �80 °C until it was assayed. Allsamples from 1 individual were an-alyzed in 1 run with an automatedchemiluminescence assay (Advantage,Nichols). Results were compared withthe concentration obtained from analiquot stored under standard condi-tions (collected on ice, immediatelycentrifuged, and frozen at �80 °C untilanalysis) and expressed as percentageof standard condition.
We used pairwise 1-sided testingwith the Wilcoxon signed-rank testto analyze the significance of changesin hormone concentrations. The dura-tion of hormone stability was approx-imated by fitting a monoexponentially
decaying function to the raw data foreach scenario and calculating the timeperiod of 10% decreases in hormoneconcentrations compared with base-line concentrations under standardconditions. Analytical testing andcurve fitting were implemented inMathematica version 5 (WolframResearch).
As expected, measured ACTH con-centrations significantly decreasedwith time before freezing at �80 °C.Interestingly, temperature alone didnot appear to influence hormone con-centration stability (P �0.05). The cal-culated times for decay of mean con-centrations to 90% of baseline values at4 °C and room temperature, respec-tively, were 24 h and 19 h for uncen-trifuged samples and 33 h and 31 h forimmediately centrifuged samples.
After 2 h of storage at 4 °C, theACTH concentration was signifi-cantly higher in samples centrifugedimmediately than in uncentrifugedsamples (P �0.01) (Fig. 1A). At 22 °Cthis difference was observed after 1 h(P �0.05) (Fig. 1B). The decrease inthe measured ACTH concentrationwith time before centrifugation wasalso observed in samples containing
Fig. 1. ACTH concentrationsdrop significantly faster ifsamples are not centrifugedafter venipuncture [mean(SE)]; temperature per se isless important.
358 Letters
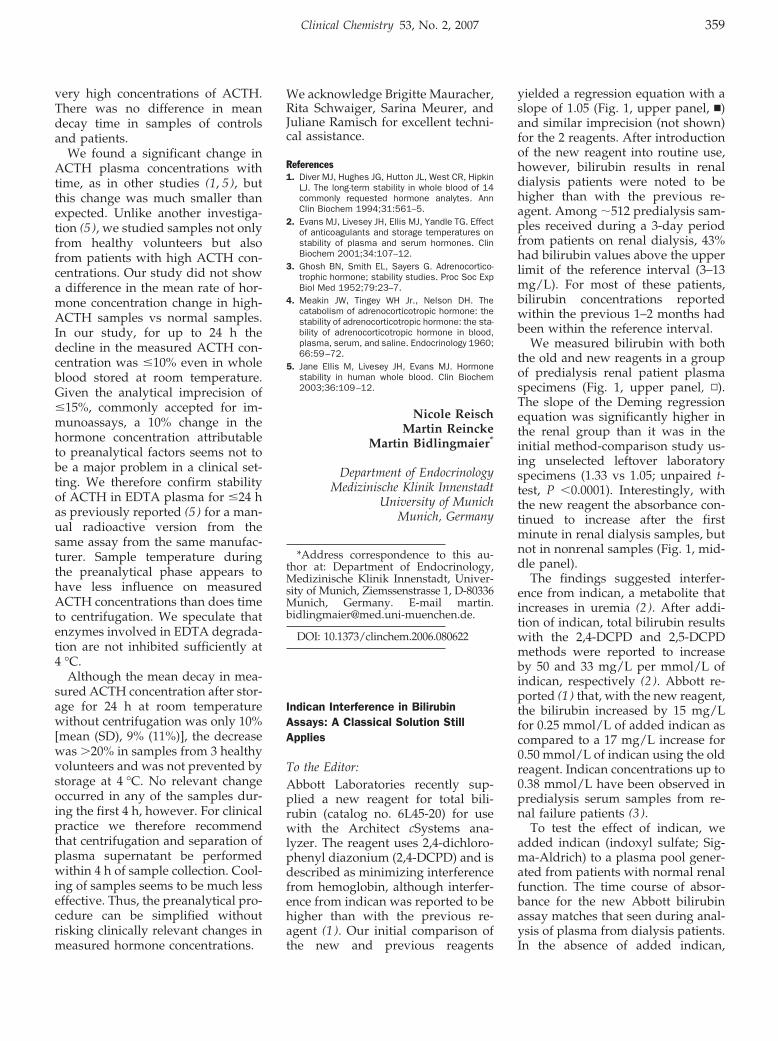
very high concentrations of ACTH.There was no difference in meandecay time in samples of controlsand patients.
We found a significant change inACTH plasma concentrations withtime, as in other studies (1, 5), butthis change was much smaller thanexpected. Unlike another investiga-tion (5 ), we studied samples not onlyfrom healthy volunteers but alsofrom patients with high ACTH con-centrations. Our study did not showa difference in the mean rate of hor-mone concentration change in high-ACTH samples vs normal samples.In our study, for up to 24 h thedecline in the measured ACTH con-centration was �10% even in wholeblood stored at room temperature.Given the analytical imprecision of�15%, commonly accepted for im-munoassays, a 10% change in thehormone concentration attributableto preanalytical factors seems not tobe a major problem in a clinical set-ting. We therefore confirm stabilityof ACTH in EDTA plasma for �24 has previously reported (5 ) for a man-ual radioactive version from thesame assay from the same manufac-turer. Sample temperature duringthe preanalytical phase appears tohave less influence on measuredACTH concentrations than does timeto centrifugation. We speculate thatenzymes involved in EDTA degrada-tion are not inhibited sufficiently at4 °C.
Although the mean decay in mea-sured ACTH concentration after stor-age for 24 h at room temperaturewithout centrifugation was only 10%[mean (SD), 9% (11%)], the decreasewas �20% in samples from 3 healthyvolunteers and was not prevented bystorage at 4 °C. No relevant changeoccurred in any of the samples dur-ing the first 4 h, however. For clinicalpractice we therefore recommendthat centrifugation and separation ofplasma supernatant be performedwithin 4 h of sample collection. Cool-ing of samples seems to be much lesseffective. Thus, the preanalytical pro-cedure can be simplified withoutrisking clinically relevant changes inmeasured hormone concentrations.
We acknowledge Brigitte Mauracher,Rita Schwaiger, Sarina Meurer, andJuliane Ramisch for excellent techni-cal assistance.
References1. Diver MJ, Hughes JG, Hutton JL, West CR, Hipkin
LJ. The long-term stability in whole blood of 14commonly requested hormone analytes. AnnClin Biochem 1994;31:561–5.
2. Evans MJ, Livesey JH, Ellis MJ, Yandle TG. Effectof anticoagulants and storage temperatures onstability of plasma and serum hormones. ClinBiochem 2001;34:107–12.
3. Ghosh BN, Smith EL, Sayers G. Adrenocortico-trophic hormone; stability studies. Proc Soc ExpBiol Med 1952;79:23–7.
4. Meakin JW, Tingey WH Jr., Nelson DH. Thecatabolism of adrenocorticotropic hormone: thestability of adrenocorticotropic hormone: the sta-bility of adrenocorticotropic hormone in blood,plasma, serum, and saline. Endocrinology 1960;66:59–72.
5. Jane Ellis M, Livesey JH, Evans MJ. Hormonestability in human whole blood. Clin Biochem2003;36:109–12.
Nicole ReischMartin Reincke
Martin Bidlingmaier*
Department of EndocrinologyMedizinische Klinik Innenstadt
University of MunichMunich, Germany
*Address correspondence to this au-thor at: Department of Endocrinology,Medizinische Klinik Innenstadt, Univer-sity of Munich, Ziemssenstrasse 1, D-80336Munich, Germany. E-mail [email protected].
DOI: 10.1373/clinchem.2006.080622
Indican Interference in BilirubinAssays: A Classical Solution StillApplies
To the Editor:Abbott Laboratories recently sup-plied a new reagent for total bili-rubin (catalog no. 6L45-20) for usewith the Architect cSystems ana-lyzer. The reagent uses 2,4-dichloro-phenyl diazonium (2,4-DCPD) and isdescribed as minimizing interferencefrom hemoglobin, although interfer-ence from indican was reported to behigher than with the previous re-agent (1 ). Our initial comparison ofthe new and previous reagents
yielded a regression equation with aslope of 1.05 (Fig. 1, upper panel, �)and similar imprecision (not shown)for the 2 reagents. After introductionof the new reagent into routine use,however, bilirubin results in renaldialysis patients were noted to behigher than with the previous re-agent. Among �512 predialysis sam-ples received during a 3-day periodfrom patients on renal dialysis, 43%had bilirubin values above the upperlimit of the reference interval (3–13mg/L). For most of these patients,bilirubin concentrations reportedwithin the previous 1–2 months hadbeen within the reference interval.
We measured bilirubin with boththe old and new reagents in a groupof predialysis renal patient plasmaspecimens (Fig. 1, upper panel, ▫).The slope of the Deming regressionequation was significantly higher inthe renal group than it was in theinitial method-comparison study us-ing unselected leftover laboratoryspecimens (1.33 vs 1.05; unpaired t-test, P �0.0001). Interestingly, withthe new reagent the absorbance con-tinued to increase after the firstminute in renal dialysis samples, butnot in nonrenal samples (Fig. 1, mid-dle panel).
The findings suggested interfer-ence from indican, a metabolite thatincreases in uremia (2 ). After addi-tion of indican, total bilirubin resultswith the 2,4-DCPD and 2,5-DCPDmethods were reported to increaseby 50 and 33 mg/L per mmol/L ofindican, respectively (2 ). Abbott re-ported (1 ) that, with the new reagent,the bilirubin increased by 15 mg/Lfor 0.25 mmol/L of added indican ascompared to a 17 mg/L increase for0.50 mmol/L of indican using the oldreagent. Indican concentrations up to0.38 mmol/L have been observed inpredialysis serum samples from re-nal failure patients (3 ).
To test the effect of indican, weadded indican (indoxyl sulfate; Sig-ma-Aldrich) to a plasma pool gener-ated from patients with normal renalfunction. The time course of absor-bance for the new Abbott bilirubinassay matches that seen during anal-ysis of plasma from dialysis patients.In the absence of added indican,
Clinical Chemistry 53, No. 2, 2007 359
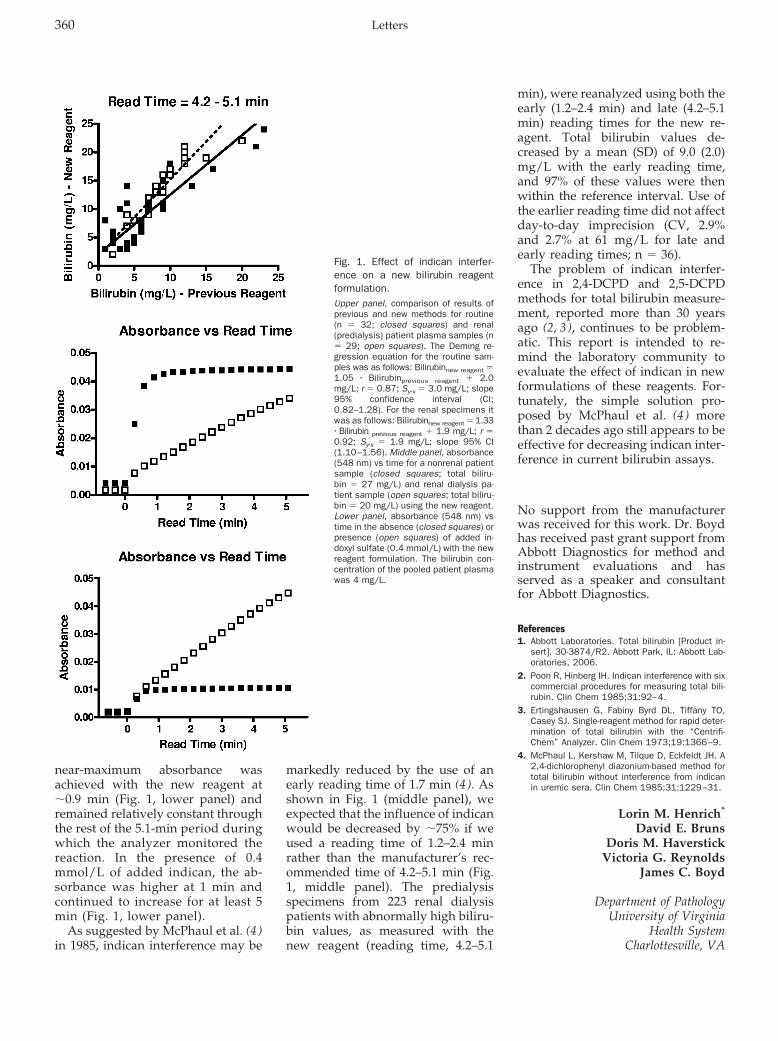
near-maximum absorbance wasachieved with the new reagent at�0.9 min (Fig. 1, lower panel) andremained relatively constant throughthe rest of the 5.1-min period duringwhich the analyzer monitored thereaction. In the presence of 0.4mmol/L of added indican, the ab-sorbance was higher at 1 min andcontinued to increase for at least 5min (Fig. 1, lower panel).
As suggested by McPhaul et al. (4 )in 1985, indican interference may be
markedly reduced by the use of anearly reading time of 1.7 min (4 ). Asshown in Fig. 1 (middle panel), weexpected that the influence of indicanwould be decreased by �75% if weused a reading time of 1.2–2.4 minrather than the manufacturer’s rec-ommended time of 4.2–5.1 min (Fig.1, middle panel). The predialysisspecimens from 223 renal dialysispatients with abnormally high biliru-bin values, as measured with thenew reagent (reading time, 4.2–5.1
min), were reanalyzed using both theearly (1.2–2.4 min) and late (4.2–5.1min) reading times for the new re-agent. Total bilirubin values de-creased by a mean (SD) of 9.0 (2.0)mg/L with the early reading time,and 97% of these values were thenwithin the reference interval. Use ofthe earlier reading time did not affectday-to-day imprecision (CV, 2.9%and 2.7% at 61 mg/L for late andearly reading times; n � 36).
The problem of indican interfer-ence in 2,4-DCPD and 2,5-DCPDmethods for total bilirubin measure-ment, reported more than 30 yearsago (2, 3), continues to be problem-atic. This report is intended to re-mind the laboratory community toevaluate the effect of indican in newformulations of these reagents. For-tunately, the simple solution pro-posed by McPhaul et al. (4 ) morethan 2 decades ago still appears to beeffective for decreasing indican inter-ference in current bilirubin assays.
No support from the manufacturerwas received for this work. Dr. Boydhas received past grant support fromAbbott Diagnostics for method andinstrument evaluations and hasserved as a speaker and consultantfor Abbott Diagnostics.
References1. Abbott Laboratories. Total bilirubin [Product in-
sert]. 30-3874/R2. Abbott Park, IL: Abbott Lab-oratories, 2006.
2. Poon R, Hinberg IH. Indican interference with sixcommercial procedures for measuring total bili-rubin. Clin Chem 1985;31:92–4.
3. Ertingshausen G, Fabiny Byrd DL, Tiffany TO,Casey SJ. Single-reagent method for rapid deter-mination of total bilirubin with the “Centrifi-Chem” Analyzer. Clin Chem 1973;19:1366–9.
4. McPhaul L, Kershaw M, Tilque D, Eckfeldt JH. A2,4-dichlorophenyl diazonium-based method fortotal bilirubin without interference from indicanin uremic sera. Clin Chem 1985;31:1229–31.
Lorin M. Henrich*
David E. BrunsDoris M. Haverstick
Victoria G. ReynoldsJames C. Boyd
Department of PathologyUniversity of Virginia
Health SystemCharlottesville, VA
Fig. 1. Effect of indican interfer-ence on a new bilirubin reagentformulation.Upper panel, comparison of results ofprevious and new methods for routine(n � 32; closed squares) and renal(predialysis) patient plasma samples (n� 29; open squares). The Deming re-gression equation for the routine sam-ples was as follows: Bilirubinnew reagent �1.05 � Bilirubinprevious reagent � 2.0mg/L; r � 0.87; Sy�x � 3.0 mg/L; slope95% confidence interval (CI;0.82–1.28). For the renal specimens itwas as follows: Bilirubinnew reagent � 1.33� Bilirubin previous reagent � 1.9 mg/L; r �0.92; Sy�x � 1.9 mg/L; slope 95% CI(1.10–1.56). Middle panel, absorbance(548 nm) vs time for a nonrenal patientsample (closed squares; total biliru-bin � 27 mg/L) and renal dialysis pa-tient sample (open squares; total biliru-bin � 20 mg/L) using the new reagent.Lower panel, absorbance (548 nm) vstime in the absence (closed squares) orpresence (open squares) of added in-doxyl sulfate (0.4 mmol/L) with the newreagent formulation. The bilirubin con-centration of the pooled patient plasmawas 4 mg/L.
360 Letters
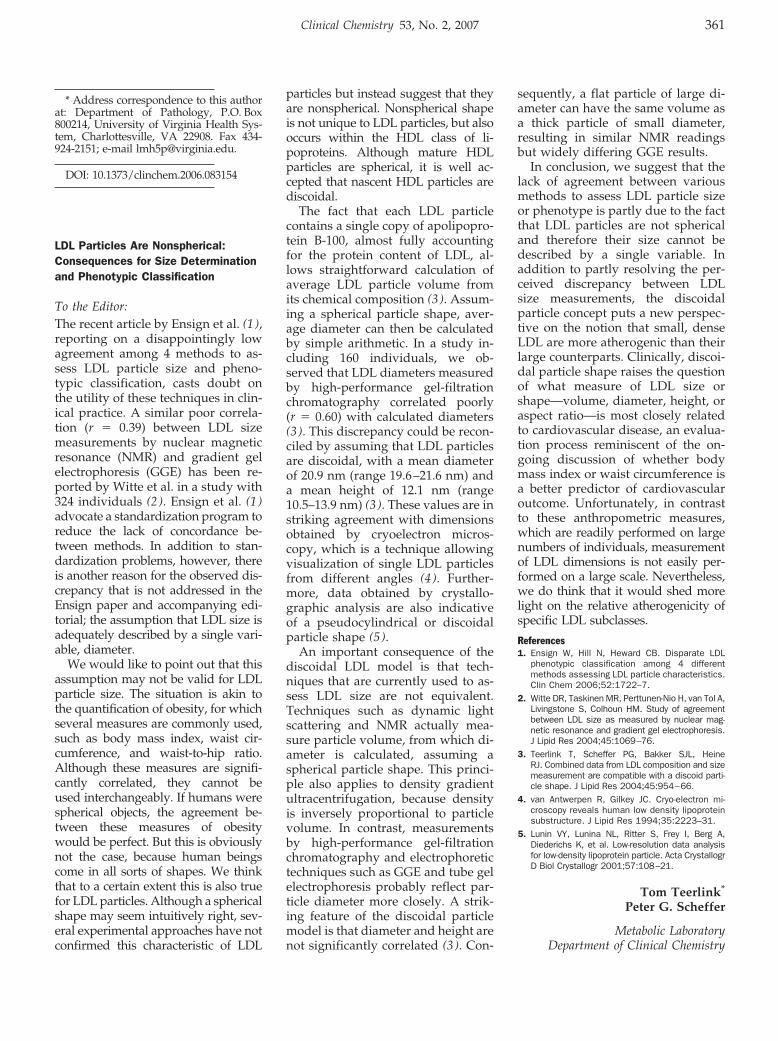
* Address correspondence to this authorat: Department of Pathology, P.O. Box800214, University of Virginia Health Sys-tem, Charlottesville, VA 22908. Fax 434-924-2151; e-mail [email protected].
DOI: 10.1373/clinchem.2006.083154
LDL Particles Are Nonspherical:Consequences for Size Determinationand Phenotypic Classification
To the Editor:The recent article by Ensign et al. (1 ),reporting on a disappointingly lowagreement among 4 methods to as-sess LDL particle size and pheno-typic classification, casts doubt onthe utility of these techniques in clin-ical practice. A similar poor correla-tion (r � 0.39) between LDL sizemeasurements by nuclear magneticresonance (NMR) and gradient gelelectrophoresis (GGE) has been re-ported by Witte et al. in a study with324 individuals (2 ). Ensign et al. (1 )advocate a standardization program toreduce the lack of concordance be-tween methods. In addition to stan-dardization problems, however, thereis another reason for the observed dis-crepancy that is not addressed in theEnsign paper and accompanying edi-torial; the assumption that LDL size isadequately described by a single vari-able, diameter.
We would like to point out that thisassumption may not be valid for LDLparticle size. The situation is akin tothe quantification of obesity, for whichseveral measures are commonly used,such as body mass index, waist cir-cumference, and waist-to-hip ratio.Although these measures are signifi-cantly correlated, they cannot beused interchangeably. If humans werespherical objects, the agreement be-tween these measures of obesitywould be perfect. But this is obviouslynot the case, because human beingscome in all sorts of shapes. We thinkthat to a certain extent this is also truefor LDL particles. Although a sphericalshape may seem intuitively right, sev-eral experimental approaches have notconfirmed this characteristic of LDL
particles but instead suggest that theyare nonspherical. Nonspherical shapeis not unique to LDL particles, but alsooccurs within the HDL class of li-poproteins. Although mature HDLparticles are spherical, it is well ac-cepted that nascent HDL particles arediscoidal.
The fact that each LDL particlecontains a single copy of apolipopro-tein B-100, almost fully accountingfor the protein content of LDL, al-lows straightforward calculation ofaverage LDL particle volume fromits chemical composition (3 ). Assum-ing a spherical particle shape, aver-age diameter can then be calculatedby simple arithmetic. In a study in-cluding 160 individuals, we ob-served that LDL diameters measuredby high-performance gel-filtrationchromatography correlated poorly(r � 0.60) with calculated diameters(3 ). This discrepancy could be recon-ciled by assuming that LDL particlesare discoidal, with a mean diameterof 20.9 nm (range 19.6–21.6 nm) anda mean height of 12.1 nm (range10.5–13.9 nm) (3 ). These values are instriking agreement with dimensionsobtained by cryoelectron micros-copy, which is a technique allowingvisualization of single LDL particlesfrom different angles (4 ). Further-more, data obtained by crystallo-graphic analysis are also indicativeof a pseudocylindrical or discoidalparticle shape (5 ).
An important consequence of thediscoidal LDL model is that tech-niques that are currently used to as-sess LDL size are not equivalent.Techniques such as dynamic lightscattering and NMR actually mea-sure particle volume, from which di-ameter is calculated, assuming aspherical particle shape. This princi-ple also applies to density gradientultracentrifugation, because densityis inversely proportional to particlevolume. In contrast, measurementsby high-performance gel-filtrationchromatography and electrophoretictechniques such as GGE and tube gelelectrophoresis probably reflect par-ticle diameter more closely. A strik-ing feature of the discoidal particlemodel is that diameter and height arenot significantly correlated (3 ). Con-
sequently, a flat particle of large di-ameter can have the same volume asa thick particle of small diameter,resulting in similar NMR readingsbut widely differing GGE results.
In conclusion, we suggest that thelack of agreement between variousmethods to assess LDL particle sizeor phenotype is partly due to the factthat LDL particles are not sphericaland therefore their size cannot bedescribed by a single variable. Inaddition to partly resolving the per-ceived discrepancy between LDLsize measurements, the discoidalparticle concept puts a new perspec-tive on the notion that small, denseLDL are more atherogenic than theirlarge counterparts. Clinically, discoi-dal particle shape raises the questionof what measure of LDL size orshape—volume, diameter, height, oraspect ratio—is most closely relatedto cardiovascular disease, an evalua-tion process reminiscent of the on-going discussion of whether bodymass index or waist circumference isa better predictor of cardiovascularoutcome. Unfortunately, in contrastto these anthropometric measures,which are readily performed on largenumbers of individuals, measurementof LDL dimensions is not easily per-formed on a large scale. Nevertheless,we do think that it would shed morelight on the relative atherogenicity ofspecific LDL subclasses.
References1. Ensign W, Hill N, Heward CB. Disparate LDL
phenotypic classification among 4 differentmethods assessing LDL particle characteristics.Clin Chem 2006;52:1722–7.
2. Witte DR, Taskinen MR, Perttunen-Nio H, van Tol A,Livingstone S, Colhoun HM. Study of agreementbetween LDL size as measured by nuclear mag-netic resonance and gradient gel electrophoresis.J Lipid Res 2004;45:1069–76.
3. Teerlink T, Scheffer PG, Bakker SJL, HeineRJ. Combined data from LDL composition and sizemeasurement are compatible with a discoid parti-cle shape. J Lipid Res 2004;45:954–66.
4. van Antwerpen R, Gilkey JC. Cryo-electron mi-croscopy reveals human low density lipoproteinsubstructure. J Lipid Res 1994;35:2223–31.
5. Lunin VY, Lunina NL, Ritter S, Frey I, Berg A,Diederichs K, et al. Low-resolution data analysisfor low-density lipoprotein particle. Acta CrystallogrD Biol Crystallogr 2001;57:108–21.
Tom Teerlink*
Peter G. Scheffer
Metabolic LaboratoryDepartment of Clinical Chemistry
Clinical Chemistry 53, No. 2, 2007 361
VU University Medical CenterAmsterdam, The Netherlands
* Address correspondence to this au-thor at: P.O. Box 7057, 1007 MB Amster-dam, The Netherlands. Fax 31-2044-43895; e-mail [email protected].
DOI: 10.1373/clinchem.2006.079871
A Case of IgM Paraproteinemia inWhich Serum Free Light Chain ValuesWere Within Reference Intervals
To the Editor:We read with interest the recent pa-per on the combination of serumprotein electrophoresis (SPEP) andserum free light chain (FLC) assay asa potential alternative to SPEP andurine protein electrophoresis (UPEP)screening for paraproteinemia (1 ), aswell as the accompanying editorialon sensitivity and specificity issuesof the serum FLC assay (2 ). Thisassay, which first became commer-cially available in 2001, is used todiagnose and monitor light chainmyeloma, primary amyloidosis, andrelated light chain diseases. Despitethe usually quoted high clinical sen-sitivity of serum FLC assay in detect-ing light chain disease, results withinreference intervals can occur withintact immunoglobulin parapro-teinemia (3 ). We describe a patientwith IgM paraproteinemia whoshowed FLC concentrations and �:�ratio within reference intervals.
A 79-year old Chinese woman pre-sented with blurred vision due tohyperviscosity syndrome and bleed-ing tendency. Physical examinationshowed no hepatosplenomegaly orlymphadenopathy. Complete bloodcounts showed hemoglobin of 78g/L, 8.3 � 109 leukocytes/L and110 � 109 platelets/L. The patient’sblood smear showed obvious eryth-rocyte rouleaux formation in associ-ation with 6% circulating plasmacells. The total globulin concentra-tion was markedly increased at 115g/L, but renal and liver biochemistrytests were unremarkable. No hyper-calcemia was apparent, and a skele-tal survey showed no osteolytic le-
sions. Bone marrow examinationrevealed 46% plasma cells and fairrepresentation of trilineage hemato-poiesis. Flow cytometric analysis of abone marrow sample showed 32%plasma cells that were clonal in na-ture, with cytoplasmic IgM expres-sion and � light chain restriction, asgated by CD38 expression. Few B-cells were demonstrated. Bone bi-opsy showed interstitial infiltrate oflymphoplasmacytic cells withDutcher body formation. The abnor-mal infiltrate was shown by immu-nohistochemistry to comprise mostlyplasma cells that expressed CD79a,CD138, and IgM, with � light chainrestriction. Very few B cells werepresent, as demonstrated by the lackof CD20 immunostaining. The over-all picture was compatible with IgMmultiple myeloma.
Although SPEP (Genio, InterlabScientific Instruments) in this patientshowed an abundant M-protein of86.7 g/L as determined by densitom-etry, UPEP showed no evidence ofM-protein. Cryoglobulin was nega-tive. Serum immunoglobulin concen-trations (Dade Behring, Marburg,GmBH) showed a marked increase inIgM at 99.9 g/L and decreased IgGand IgA concentrations. Serum FLCassay (Binding Site) performed onthe Dade Behring BN Pro Spec ana-lyzer showed a � concentration of15.9 mg/L, within the reference in-terval (RI) of 3.3–19.4 mg/L and a �concentration of 14.6 mg/L, alsowithin the RI of 5.7–26.3. The � to �ratio of 1.09 was also within thereference interval, (RI 0.26–1.65). Di-lution study results excluded antigenexcess and the presence of a prozone,but a serum total (bound and free)light chains (Dade Behring) showeda marked increase of � (20.2 g/L, RI1.7–3.7 g/L) compared to � (1.13 g/L,RI 0.9–2.1 g/L), resulting in a total�:� ratio of 17.9 (RI 1.35–2.65). Im-munofixation (Minifix, Binding Site)confirmed a monoclonal IgM-� para-protein.
IgM paraproteinemia is seen inWaldenstrom macroglobulinemia, B-cell lymphoma or lymphoprolifera-tive disorders, monoclonal gam-mopathy of undermined significance(MGUS), �-heavy chain disease, and
IgM myeloma. Our patient was un-usual in that the paraprotein mostprobably consisted of only intact IgMmolecules with no excess FLC, thusexplaining the normal serum FLCconcentration and ratio. The diag-nostic performance of serum FLC as-say has been evaluated in patientswith plasma cell disorders (4 ) in-cluding IgM paraproteins, includingmacroglobulinemia, IgM lympho-proliferative disorder, and lym-phoma, but no detailed breakdownof data was available in this sub-group. In another study, among 37patients with Waldenstrom macro-globulinemia, all but one had abnor-mal FLC concentrations and/or anabnormal �:� ratio (3 ). Furthermore,FLC concentrations were reported tobe within reference values in �4% ofintact Ig multiple myeloma and in40% of MGUS at presentation (5 ).Thus although the serum FLC assaymay allow identification of addi-tional monoclonal FLC-producingindividuals, the test must be inter-preted in conjunction with SPEPwith or without immunofixation, es-pecially in the setting of paraproteinscreening. This patient serves as areminder that FLC assays cannot re-place SPEP as a screening test but canidentify additional patients withlight disease that may be missed by acombination of SPEP and UPEP. Itwould be of interest to extend ourcase observation to more patientswith IgM paraproteinemia to docu-ment the frequency and any associ-ated clinical significance of normal�:� ratios.
References1. Hill PG, Forsyth JM, Rai B, Mayne S. Serum free
light chains: an alternative to the urine BenceJones proteins screening test for monoclonalgammopathies. Clin Chem 2006;52:1743–8.
2. Katzmann JA. Serum free light chain specificityand sensitivity: a reality check. Clin Chem 2006;52:1638–9.
3. Bradwell AR. Serum Free Light Chain Analysis,Fourth Edition. Birmingham, UK: The BindingSite Ltd, 2006;285pp.
4. Katzmann JA, Abraham RS, Dispenzieri A, LustJA, Kyle RA. Diagnostic performance of quantita-tive � and � free light chain assays in clinicalpractice. Clin Chem 2005;51:878–81.
5. Mead GP, Drayson MT, Carr-Smith HD, BradwellAR. Measurement of immunoglobulin free lightchains in serum. Clin Chem 2003;49:1957–8.
362 Letters
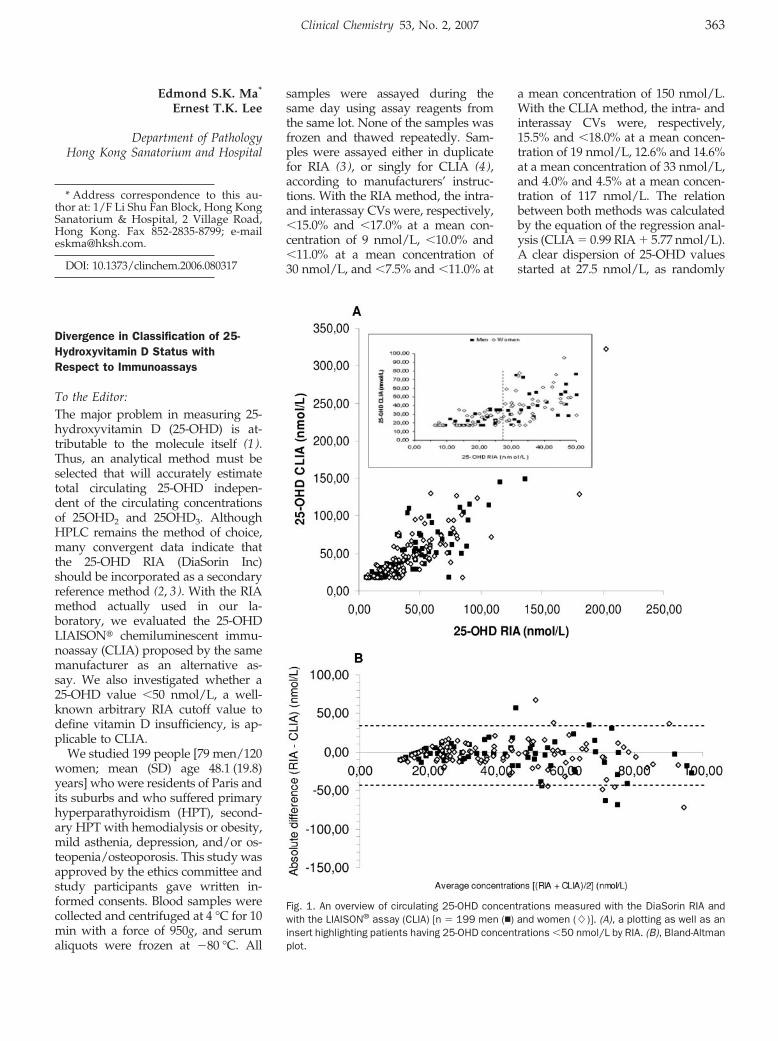
Edmond S.K. Ma*
Ernest T.K. Lee
Department of PathologyHong Kong Sanatorium and Hospital
* Address correspondence to this au-thor at: 1/F Li Shu Fan Block, Hong KongSanatorium & Hospital, 2 Village Road,Hong Kong. Fax 852-2835-8799; [email protected].
DOI: 10.1373/clinchem.2006.080317
Divergence in Classification of 25-Hydroxyvitamin D Status withRespect to Immunoassays
To the Editor:The major problem in measuring 25-hydroxyvitamin D (25-OHD) is at-tributable to the molecule itself (1).Thus, an analytical method must beselected that will accurately estimatetotal circulating 25-OHD indepen-dent of the circulating concentrationsof 25OHD2 and 25OHD3. AlthoughHPLC remains the method of choice,many convergent data indicate thatthe 25-OHD RIA (DiaSorin Inc)should be incorporated as a secondaryreference method (2, 3). With the RIAmethod actually used in our la-boratory, we evaluated the 25-OHDLIAISON� chemiluminescent immu-noassay (CLIA) proposed by the samemanufacturer as an alternative as-say. We also investigated whether a25-OHD value �50 nmol/L, a well-known arbitrary RIA cutoff value todefine vitamin D insufficiency, is ap-plicable to CLIA.
We studied 199 people [79 men/120women; mean (SD) age 48.1 (19.8)years] who were residents of Paris andits suburbs and who suffered primaryhyperparathyroidism (HPT), second-ary HPT with hemodialysis or obesity,mild asthenia, depression, and/or os-teopenia/osteoporosis. This study wasapproved by the ethics committee andstudy participants gave written in-formed consents. Blood samples werecollected and centrifuged at 4 °C for 10min with a force of 950g, and serumaliquots were frozen at �80 °C. All
samples were assayed during thesame day using assay reagents fromthe same lot. None of the samples wasfrozen and thawed repeatedly. Sam-ples were assayed either in duplicatefor RIA (3), or singly for CLIA (4),according to manufacturers’ instruc-tions. With the RIA method, the intra-and interassay CVs were, respectively,�15.0% and �17.0% at a mean con-centration of 9 nmol/L, �10.0% and�11.0% at a mean concentration of30 nmol/L, and �7.5% and �11.0% at
a mean concentration of 150 nmol/L.With the CLIA method, the intra- andinterassay CVs were, respectively,15.5% and �18.0% at a mean concen-tration of 19 nmol/L, 12.6% and 14.6%at a mean concentration of 33 nmol/L,and 4.0% and 4.5% at a mean concen-tration of 117 nmol/L. The relationbetween both methods was calculatedby the equation of the regression anal-ysis (CLIA � 0.99 RIA � 5.77 nmol/L).A clear dispersion of 25-OHD valuesstarted at 27.5 nmol/L, as randomly
Fig. 1. An overview of circulating 25-OHD concentrations measured with the DiaSorin RIA andwith the LIAISON® assay (CLIA) [n � 199 men (�) and women (�)]. (A), a plotting as well as aninsert highlighting patients having 25-OHD concentrations �50 nmol/L by RIA. (B), Bland-Altmanplot.
Clinical Chemistry 53, No. 2, 2007 363
highlighted by the insert presented inFig. 1A. The Bland-Altman plot (Fig.1B) confirmed this random tendency,which was independent of concentra-tion and of sex, and also demonstratedan amplified dispersion at 25-OHDconcentrations �50 nmol/L.
Our data (Fig. 1B) suggested thatCLIA results tended to be higherthan RIA at low and high concentra-tions, conversely to data previouslypublished (4 ). With a threshold of25-OHD �30 nmol/L but �50 nmol/Lto define vitamin D insufficiency, in33% of the 54 individuals with 25-OHD concentrations classified as in-sufficient by RIA, 25-OHD concen-trations were normalized by CLIA(range: 53.0–109.5 nmol/L). In con-trast, 21% of the 62 study partici-pants with 25-OHD concentrations�50 nmol/L by RIA had insufficient25-OHD concentrations by CLIA(range: 17.5–48.0 nmol/L). For opti-mal serum 25-OHD concentrationdefined as �75 nmol/L in osteopo-rotic patients, 35% of the 23 patentswith 25-OHD concentrations abovethis threshold by RIA had concentra-tions below it by CLIA. The RIAmethod used a primary antibody to25-OHD in a homogenous phasewith a 2nd antibody used as precip-itating agent, whereas CLIA used thesame primary antibody immobilizedonto coated magnetic particles. Thisantibody interacts differently withthe first calibrator [i.e., 17.5 nmol/L(CLIA); 12.5 nmol/L (RIA) with anoptional calibrator of 6.25 nmol/L(B/B0: 91%) created by diluting 12.5at 1:2 as suggested by the manufac-turer], indicating different affinityprofiles that are probably respon-sible for these random results. Thesedivergent results may also be attrib-utable to different calibrators, con-stituted in either human- (RIA) orhorse-based serum (CLIA), differentincubation times (90 min by RIA vs30 min by CLIA), or an insufficientquantity of reagents used to dissoci-ate 25-OHD from its binding protein.
Overall, these 2 methods did notsimilarly classify individuals withreference to well-known arbitrarycutoff values. The random tendencyobserved whatever the concentra-tions measured did not permit the
definition of a clear strategy con-cerning patient follow-up, particu-larly for those needing treatmentwith respect to their vitamin D sta-tus. The discrepancy between these2 methods is consistent with eitherimportant negative (4, 5) or positive(our data) intercepts traducing dif-ferences in the assay response to thecalibrant matrix.
Finally, our results are consistentwith the poor correlation previouslyreported between RIA and CLIA (5)and demonstrate that in disagreementwith recently published data (4), a25-OHD value �50 nmol/L used todefine vitamin D insufficiency withthe DiaSorin RIA is not suitable for usewith the LIAISON� assay (CLIA).
References1. Hollis BW. Editorial: The determination of circu-
lating 25-hydroxyvitamin D: no easy task. J ClinEndocrinol Metab 2004;89:3149–51.
2. Carter GD, Carter R, Jones J, Berry J. Howaccurate are assays for 25-hydroxyvitamin D?Data from the international vitamin D externalquality assessment scheme. Clin Chem 2004;50:2195–7.
3. Binkley N, Krueger D, Cowgill CS, Plum L, Lake E,Hansen KE, et al. Assay variation confounds thediagnosis of hypovitaminosis D: a call for standard-ization. J Clin Endocrinol Metab 2004;89:3152–7.
4. Souberbielle JC, Fayol V, Sault C, Lawson-BodyE, Kahan A, Cormier C. Assay-specific decisionlimits for two new automated parathyroid hor-mone and 25-hydroxyvitamin D assays. ClinChem 2005;51:395–400.
5. Turpeinen U, Hohenthal U, Stenman UH. Determi-nation of 25-hydroxyvitamin D in serum by HPLCand immunoassay. Clin Chem 2003;49:1521–4.
Fidaa IbrahimChristine Parmentier
Philippe Boudou*
Unit of Hormonal BiologyHopital Saint-LouisAssistance Publique
Hopitaux de ParisParis, France
* Address correspondence to this au-thor at: Unit of Hormonal Biology, Saint-Louis University Hospital (AP-HP) andINSERM U 671, 1 avenue Claude Velle-faux, 75475 Paris cedex 10, France. Fax33-1-42-49-42-80; e-mail [email protected].
DOI: 10.1373/clinchem.2006.080903
High Total Protein Impairs AppropriateGel Barrier Formation in BDVacutainer Blood Collection Tubes
To the Editor:
Many laboratories perform routinechemistry analysis with serum orplasma–based blood collection tubescontaining separator gels. A barrierpolymer is present at the bottom ofthe tube. The density of the materialcauses it to move upwards duringcentrifugation to the supernatant–cellinterface, where it forms a barrier sep-arating plasma or serum from cells.Supernatant plasma or serum may beaspirated directly from the collectiontube, eliminating the need for transferto a secondary tube.
We recently observed 2 occasionswithin 1 month when both the ion-selective electrode and chemistrysampling probes of the analyzer(Modular Analytics, Roche Diagnos-tics) were occluded. In both cases,the occlusion was caused by inap-propriate gel barrier formation aftercentrifugation (2000g for 10 min atroom temperature) of the primarytubes. Plasma (BD Vacutainer� PST™II) and serum (BD Vacutainer� SST™II) samples had been collected from2 patients diagnosed with multiplemyeloma. In the plasma tube, the gelbarrier material was floating on thesurface of the supernatant, and in theserum tube the gel barrier was en-twined with the serum and erythro-cytes (Fig. 1). Analysis of blood sam-ples from both patients in plain serumtubes showed highly increased totalprotein concentrations (139 and 142g/L; reference interval 60–80 g/L)caused by the presence of a mono-clonal-protein (an IgG-� of 89 g/Land an IgA-� of 92 g/L, respectively).Furthermore, plasma viscosity valueswere 5.7 and 7.1 centipoise, respec-tively, (reference interval 1.5–2.0 centi-poise) and specific gravities, as mea-sured by weighing 500 �L of plasmaor serum, were 1.037 and 1.039, respec-tively.
The positioning of the gel in thetube is influenced by a number ofvariables, some of which are con-
364 Letters
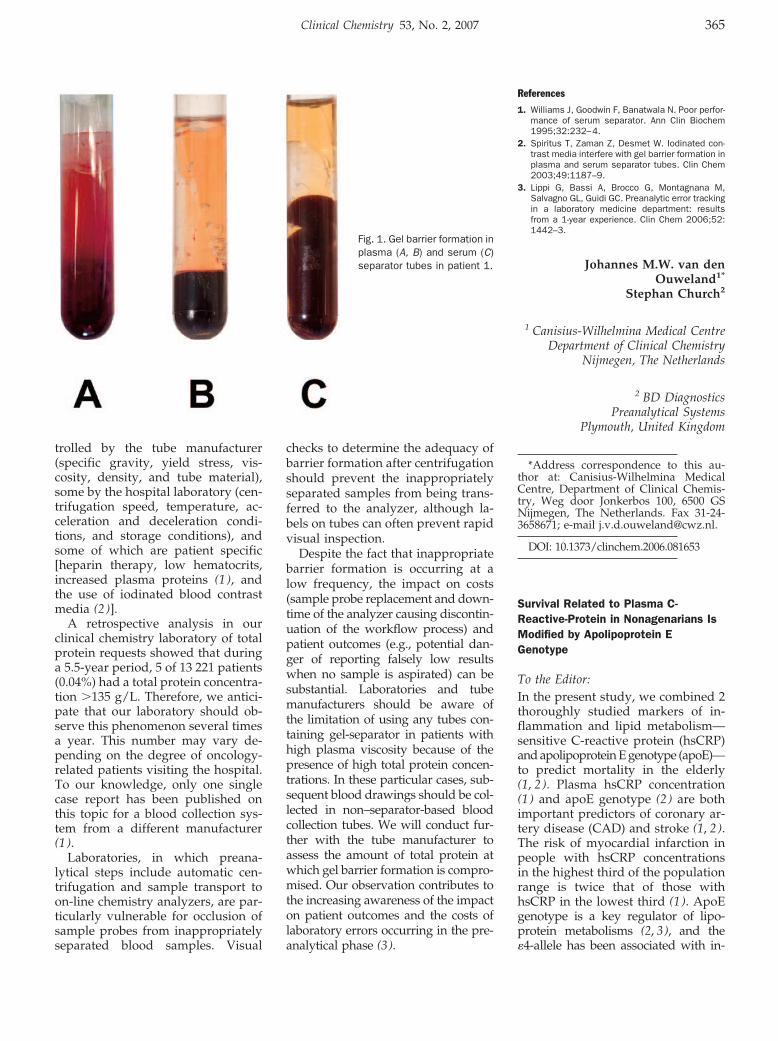
trolled by the tube manufacturer(specific gravity, yield stress, vis-cosity, density, and tube material),some by the hospital laboratory (cen-trifugation speed, temperature, ac-celeration and deceleration condi-tions, and storage conditions), andsome of which are patient specific[heparin therapy, low hematocrits,increased plasma proteins (1 ), andthe use of iodinated blood contrastmedia (2 )].
A retrospective analysis in ourclinical chemistry laboratory of totalprotein requests showed that duringa 5.5-year period, 5 of 13 221 patients(0.04%) had a total protein concentra-tion �135 g/L. Therefore, we antici-pate that our laboratory should ob-serve this phenomenon several timesa year. This number may vary de-pending on the degree of oncology-related patients visiting the hospital.To our knowledge, only one singlecase report has been published onthis topic for a blood collection sys-tem from a different manufacturer(1 ).
Laboratories, in which preana-lytical steps include automatic cen-trifugation and sample transport toon-line chemistry analyzers, are par-ticularly vulnerable for occlusion ofsample probes from inappropriatelyseparated blood samples. Visual
checks to determine the adequacy ofbarrier formation after centrifugationshould prevent the inappropriatelyseparated samples from being trans-ferred to the analyzer, although la-bels on tubes can often prevent rapidvisual inspection.
Despite the fact that inappropriatebarrier formation is occurring at alow frequency, the impact on costs(sample probe replacement and down-time of the analyzer causing discontin-uation of the workflow process) andpatient outcomes (e.g., potential dan-ger of reporting falsely low resultswhen no sample is aspirated) can besubstantial. Laboratories and tubemanufacturers should be aware ofthe limitation of using any tubes con-taining gel-separator in patients withhigh plasma viscosity because of thepresence of high total protein concen-trations. In these particular cases, sub-sequent blood drawings should be col-lected in non–separator-based bloodcollection tubes. We will conduct fur-ther with the tube manufacturer toassess the amount of total protein atwhich gel barrier formation is compro-mised. Our observation contributes tothe increasing awareness of the impacton patient outcomes and the costs oflaboratory errors occurring in the pre-analytical phase (3).
References
1. Williams J, Goodwin F, Banatwala N. Poor perfor-mance of serum separator. Ann Clin Biochem1995;32:232–4.
2. Spiritus T, Zaman Z, Desmet W. Iodinated con-trast media interfere with gel barrier formation inplasma and serum separator tubes. Clin Chem2003;49:1187–9.
3. Lippi G, Bassi A, Brocco G, Montagnana M,Salvagno GL, Guidi GC. Preanalytic error trackingin a laboratory medicine department: resultsfrom a 1-year experience. Clin Chem 2006;52:1442–3.
Johannes M.W. van denOuweland1*
Stephan Church2
1 Canisius-Wilhelmina Medical CentreDepartment of Clinical Chemistry
Nijmegen, The Netherlands
2 BD DiagnosticsPreanalytical Systems
Plymouth, United Kingdom
*Address correspondence to this au-thor at: Canisius-Wilhelmina MedicalCentre, Department of Clinical Chemis-try, Weg door Jonkerbos 100, 6500 GSNijmegen, The Netherlands. Fax 31-24-3658671; e-mail [email protected].
DOI: 10.1373/clinchem.2006.081653
Survival Related to Plasma C-Reactive-Protein in Nonagenarians IsModified by Apolipoprotein EGenotype
To the Editor:In the present study, we combined 2thoroughly studied markers of in-flammation and lipid metabolism—sensitive C-reactive protein (hsCRP)and apolipoprotein E genotype (apoE)—to predict mortality in the elderly(1, 2). Plasma hsCRP concentration(1 ) and apoE genotype (2 ) are bothimportant predictors of coronary ar-tery disease (CAD) and stroke (1, 2).The risk of myocardial infarction inpeople with hsCRP concentrationsin the highest third of the populationrange is twice that of those withhsCRP in the lowest third (1 ). ApoEgenotype is a key regulator of lipo-protein metabolisms (2, 3), and the�4-allele has been associated with in-
Fig. 1. Gel barrier formation inplasma (A, B) and serum (C)separator tubes in patient 1.
Clinical Chemistry 53, No. 2, 2007 365
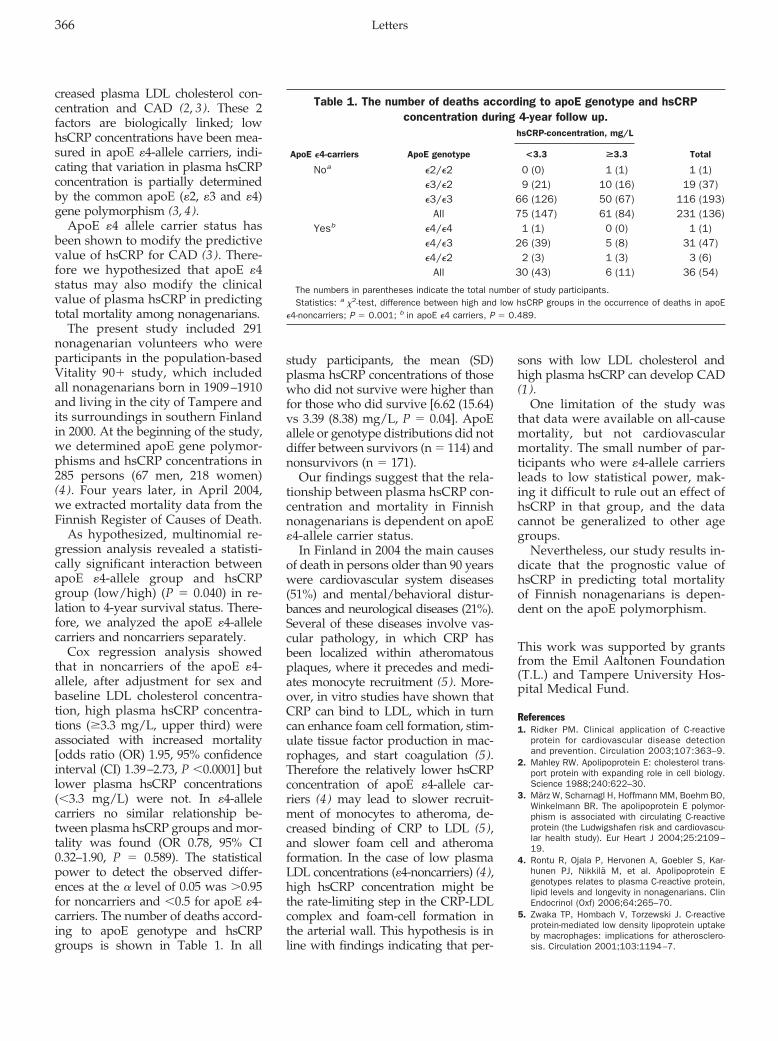
creased plasma LDL cholesterol con-centration and CAD (2, 3). These 2factors are biologically linked; lowhsCRP concentrations have been mea-sured in apoE �4-allele carriers, indi-cating that variation in plasma hsCRPconcentration is partially determinedby the common apoE (�2, �3 and �4)gene polymorphism (3, 4).
ApoE �4 allele carrier status hasbeen shown to modify the predictivevalue of hsCRP for CAD (3 ). There-fore we hypothesized that apoE �4status may also modify the clinicalvalue of plasma hsCRP in predictingtotal mortality among nonagenarians.
The present study included 291nonagenarian volunteers who wereparticipants in the population-basedVitality 90� study, which includedall nonagenarians born in 1909–1910and living in the city of Tampere andits surroundings in southern Finlandin 2000. At the beginning of the study,we determined apoE gene polymor-phisms and hsCRP concentrations in285 persons (67 men, 218 women)(4 ). Four years later, in April 2004,we extracted mortality data from theFinnish Register of Causes of Death.
As hypothesized, multinomial re-gression analysis revealed a statisti-cally significant interaction betweenapoE �4-allele group and hsCRPgroup (low/high) (P � 0.040) in re-lation to 4-year survival status. There-fore, we analyzed the apoE �4-allelecarriers and noncarriers separately.
Cox regression analysis showedthat in noncarriers of the apoE �4-allele, after adjustment for sex andbaseline LDL cholesterol concentra-tion, high plasma hsCRP concentra-tions (�3.3 mg/L, upper third) wereassociated with increased mortality[odds ratio (OR) 1.95, 95% confidenceinterval (CI) 1.39–2.73, P �0.0001] butlower plasma hsCRP concentrations(�3.3 mg/L) were not. In �4-allelecarriers no similar relationship be-tween plasma hsCRP groups and mor-tality was found (OR 0.78, 95% CI0.32–1.90, P � 0.589). The statisticalpower to detect the observed differ-ences at the � level of 0.05 was �0.95for noncarriers and �0.5 for apoE �4-carriers. The number of deaths accord-ing to apoE genotype and hsCRPgroups is shown in Table 1. In all
study participants, the mean (SD)plasma hsCRP concentrations of thosewho did not survive were higher thanfor those who did survive [6.62 (15.64)vs 3.39 (8.38) mg/L, P � 0.04]. ApoEallele or genotype distributions did notdiffer between survivors (n � 114) andnonsurvivors (n � 171).
Our findings suggest that the rela-tionship between plasma hsCRP con-centration and mortality in Finnishnonagenarians is dependent on apoE�4-allele carrier status.
In Finland in 2004 the main causesof death in persons older than 90 yearswere cardiovascular system diseases(51%) and mental/behavioral distur-bances and neurological diseases (21%).Several of these diseases involve vas-cular pathology, in which CRP hasbeen localized within atheromatousplaques, where it precedes and medi-ates monocyte recruitment (5). More-over, in vitro studies have shown thatCRP can bind to LDL, which in turncan enhance foam cell formation, stim-ulate tissue factor production in mac-rophages, and start coagulation (5).Therefore the relatively lower hsCRPconcentration of apoE �4-allele car-riers (4) may lead to slower recruit-ment of monocytes to atheroma, de-creased binding of CRP to LDL (5),and slower foam cell and atheromaformation. In the case of low plasmaLDL concentrations (�4-noncarriers) (4),high hsCRP concentration might bethe rate-limiting step in the CRP-LDLcomplex and foam-cell formation inthe arterial wall. This hypothesis is inline with findings indicating that per-
sons with low LDL cholesterol andhigh plasma hsCRP can develop CAD(1).
One limitation of the study wasthat data were available on all-causemortality, but not cardiovascularmortality. The small number of par-ticipants who were �4-allele carriersleads to low statistical power, mak-ing it difficult to rule out an effect ofhsCRP in that group, and the datacannot be generalized to other agegroups.
Nevertheless, our study results in-dicate that the prognostic value ofhsCRP in predicting total mortalityof Finnish nonagenarians is depen-dent on the apoE polymorphism.
This work was supported by grantsfrom the Emil Aaltonen Foundation(T.L.) and Tampere University Hos-pital Medical Fund.
References1. Ridker PM. Clinical application of C-reactive
protein for cardiovascular disease detectionand prevention. Circulation 2003;107:363–9.
2. Mahley RW. Apolipoprotein E: cholesterol trans-port protein with expanding role in cell biology.Science 1988;240:622–30.
3. Marz W, Scharnagl H, Hoffmann MM, Boehm BO,Winkelmann BR. The apolipoprotein E polymor-phism is associated with circulating C-reactiveprotein (the Ludwigshafen risk and cardiovascu-lar health study). Eur Heart J 2004;25:2109–19.
4. Rontu R, Ojala P, Hervonen A, Goebler S, Kar-hunen PJ, Nikkila M, et al. Apolipoprotein Egenotypes relates to plasma C-reactive protein,lipid levels and longevity in nonagenarians. ClinEndocrinol (Oxf) 2006;64:265–70.
5. Zwaka TP, Hombach V, Torzewski J. C-reactiveprotein-mediated low density lipoprotein uptakeby macrophages: implications for atherosclero-sis. Circulation 2001;103:1194–7.
Table 1. The number of deaths according to apoE genotype and hsCRPconcentration during 4-year follow up.
hsCRP-concentration, mg/L
ApoE �4-carriers ApoE genotype <3.3 >3.3 Total
Noa �2/�2 0 (0) 1 (1) 1 (1)�3/�2 9 (21) 10 (16) 19 (37)�3/�3 66 (126) 50 (67) 116 (193)
All 75 (147) 61 (84) 231 (136)Yesb �4/�4 1 (1) 0 (0) 1 (1)
�4/�3 26 (39) 5 (8) 31 (47)�4/�2 2 (3) 1 (3) 3 (6)
All 30 (43) 6 (11) 36 (54)
The numbers in parentheses indicate the total number of study participants.Statistics: a 2-test, difference between high and low hsCRP groups in the occurrence of deaths in apoE
�4-noncarriers; P � 0.001; b in apoE �4 carriers, P � 0.489.
366 Letters
Terho Lehtimaki1*
Antti Hervonen2
Riikka Rontu1
Pekka Karhunen3
Marja Jylha2
Mikko Hurme4
1 Laboratory ofAtherosclerosis Genetics
Tampere University HospitalCentre for Laboratory Medicine
Department of Clinical ChemistryUniversity of Tampere
Medical School
2 Laboratory of GerontologyTampere School of Public Health
University of Tampere
3 Department ofForensic Medicine
University of TampereMedical School and
Tampere University HospitalCentre for Laboratory Medicine
4 Department ofMicrobiology and Immunology
University of TampereMedical School and
Tampere University HospitalCentre for Laboratory Medicine
Tampere, Finland
* Address correspondence to this au-thor at: Tampere University Hospital,Centre for Laboratory Medicine, Depart-ment of Clinical Chemistry, Finn-Medi 2,3rd floor, P.O. Box 2000, 33521 Tampere,Finland. Fax 358-3-311-74168; [email protected].
DOI: 10.1373/clinchem.2006.075002
Haptocorrin (Transcobalamin I) andCobalamin Deficiencies
To the Editor:Based on analyses in cobalamin-defi-cient patients before and after ther-apy, Morkbak and colleagues (1 )confirm our finding that cobalaminconcentrations correlate with hap-tocorrin (HC; transcobalamin I) (2 )but propose that HC concentrationsare regulated by cobalamin statusrather than being genetically deter-
mined, which they mistake as myview. In fact, no exclusive theory ofHC regulation is likely. Many thingsaffect HC synthesis, release, and clear-ance, and HC concentrations are al-tered in many varied disorders (3 ).Moreover, cobalamin changes oftenfollow, rather than precede, such HCchanges because HC’s long half-lifedisproportionately influences reten-tion of its attached cobalamin (holo-HC). In addition, highly variablerelease of leukocytic apo-HC (cobal-amin-free HC) frequently occurswhenever serum is tested instead ofplasma (4 ); critical effects of this ar-tifact on Morkbak’s vegan serumdata cannot be dismissed merely be-cause leukocyte counts did notchange after therapy.
Statistical associations betweencobalamin and HC concentrationsrequire no complicated theories. The75% or greater identity between cir-culating cobalamin and holo-HC,which in turn also constitutes 80% ormore of total HC, guarantees signif-icant associations and renders mostalternative interpretations specula-tive. Nor should too much be madeof the probably nonindependent sta-tistical associations of methylmalonicacid and homocysteine with HC,given HC’s confounding near-iden-tity with cobalamin.
Morkbak’s claims that HC was“decreased” in cobalamin deficiencyand that cobalamin deficiency mayexplain much HC deficiency are un-dercut by her data: most patientswith low cobalamin (�200 pmol/L)actually had total HC concentrationswell within the reference interval(�240 pmol/L). Closer study ofthose few exceptions with total HC�240 pmol/L [see Fig. 1A in (1 )]might have proved enlightening;postreatment values in Table 1 of (1 )imply that some very low HC con-centrations persisted after cobalamintherapy, casting doubt on their rela-tion to cobalamin status. Inattentionto individually important patients,especially those who do not quiteconform to group expectations, is un-fortunately commonplace in contem-porary studies of cobalamin status,which too often focus exclusively onoverall group statistics.
Further weakening Morkbak’s the-sis is the likelihood that the disparityin posttherapy HC changes betweencobalamin-deficient and nondeficientpatients had much more to do withthe grossly disparate cobalamin reg-imens the 3 study groups receivedthan with differences in their cobal-amin status. Excessive cobalamindoses were given to the cobalamin-deficient vegan group (5 mg orallydaily) and the group suspected ofdeficiency (1 mg intramuscularlyevery week). As a result, mean co-balamin concentrations rose mas-sively from 97 to 1016 pmol/L in thefirst group (947% increase) and from281 to 960 pmol/L in the second(242% increase). Compare these withthe nondeficient group, who re-ceived only 0.4 mg orally daily andwhose mean cobalamin therefore rosejust 51%, from 350 to 527 pmol/L.Small wonder that the first groupshowed significant increases in serumholo-HC and total HC—holo-HC be-cause of apo-HC saturation by mas-sive cobalamin doses and total HCpossibly from leukocytic HC releasebecause serum was tested instead ofplasma—and the second group showedonly the holo-HC increase in plasma asmassive cobalamin injections con-verted apo-HC to holo-HC, whereasthe third group showed neither plasmaHC saturation nor increase becauserelatively modest amounts of newcobalamin entered the bloodstream.Nor do HC data stratified by MMAresponse to therapy prove theclaimed influence of metabolic co-balamin status on HC concentra-tions. The 2 groups whose MMAconcentrations responded to ther-apy were those also confounded bymassive cobalamin doses and se-rum testing, unlike the nonrespon-sive controls. Proof of HC depen-dence on cobalamin status awaitsstudies with uniform treatment regi-mens and uniform testing of plasma.
To dispel potential diagnostic con-fusion and Morkbak’s concerns aboutassuming HC deficiency simply fromlow circulating cobalamin concentra-tions, the apparently underappreci-ated diagnostic criteria for primaryHC deficiency (as fulfilled in all ourpublished cases save one unusually
Clinical Chemistry 53, No. 2, 2007 367
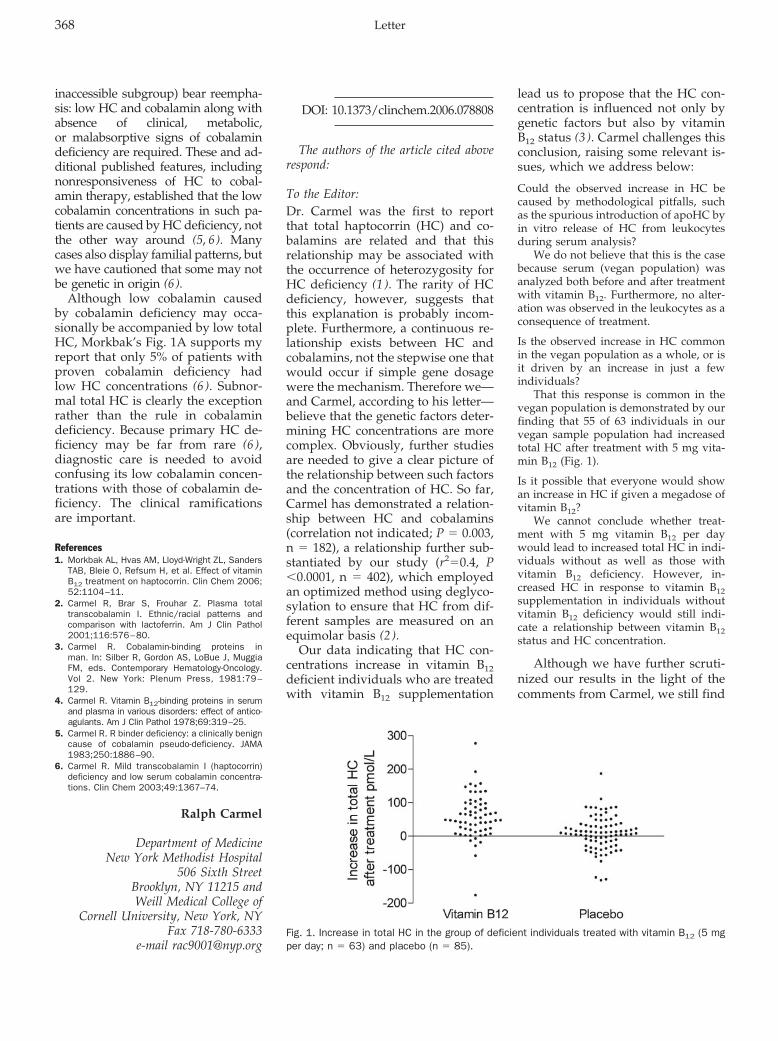
inaccessible subgroup) bear reempha-sis: low HC and cobalamin along withabsence of clinical, metabolic,or malabsorptive signs of cobalamindeficiency are required. These and ad-ditional published features, includingnonresponsiveness of HC to cobal-amin therapy, established that the lowcobalamin concentrations in such pa-tients are caused by HC deficiency, notthe other way around (5, 6). Manycases also display familial patterns, butwe have cautioned that some may notbe genetic in origin (6).
Although low cobalamin causedby cobalamin deficiency may occa-sionally be accompanied by low totalHC, Morkbak’s Fig. 1A supports myreport that only 5% of patients withproven cobalamin deficiency hadlow HC concentrations (6 ). Subnor-mal total HC is clearly the exceptionrather than the rule in cobalamindeficiency. Because primary HC de-ficiency may be far from rare (6 ),diagnostic care is needed to avoidconfusing its low cobalamin concen-trations with those of cobalamin de-ficiency. The clinical ramificationsare important.
References1. Morkbak AL, Hvas AM, Lloyd-Wright ZL, Sanders
TAB, Bleie O, Refsum H, et al. Effect of vitaminB12 treatment on haptocorrin. Clin Chem 2006;52:1104–11.
2. Carmel R, Brar S, Frouhar Z. Plasma totaltranscobalamin I. Ethnic/racial patterns andcomparison with lactoferrin. Am J Clin Pathol2001;116:576–80.
3. Carmel R. Cobalamin-binding proteins inman. In: Silber R, Gordon AS, LoBue J, MuggiaFM, eds. Contemporary Hematology-Oncology.Vol 2. New York: Plenum Press, 1981:79–129.
4. Carmel R. Vitamin B12-binding proteins in serumand plasma in various disorders: effect of antico-agulants. Am J Clin Pathol 1978;69:319–25.
5. Carmel R. R binder deficiency: a clinically benigncause of cobalamin pseudo-deficiency. JAMA1983;250:1886–90.
6. Carmel R. Mild transcobalamin I (haptocorrin)deficiency and low serum cobalamin concentra-tions. Clin Chem 2003;49:1367–74.
Ralph Carmel
Department of MedicineNew York Methodist Hospital
506 Sixth StreetBrooklyn, NY 11215 andWeill Medical College of
Cornell University, New York, NYFax 718-780-6333
e-mail [email protected]
DOI: 10.1373/clinchem.2006.078808
The authors of the article cited aboverespond:
To the Editor:Dr. Carmel was the first to reportthat total haptocorrin (HC) and co-balamins are related and that thisrelationship may be associated withthe occurrence of heterozygosity forHC deficiency (1 ). The rarity of HCdeficiency, however, suggests thatthis explanation is probably incom-plete. Furthermore, a continuous re-lationship exists between HC andcobalamins, not the stepwise one thatwould occur if simple gene dosagewere the mechanism. Therefore we—and Carmel, according to his letter—believe that the genetic factors deter-mining HC concentrations are morecomplex. Obviously, further studiesare needed to give a clear picture ofthe relationship between such factorsand the concentration of HC. So far,Carmel has demonstrated a relation-ship between HC and cobalamins(correlation not indicated; P � 0.003,n � 182), a relationship further sub-stantiated by our study (r2�0.4, P�0.0001, n � 402), which employedan optimized method using deglyco-sylation to ensure that HC from dif-ferent samples are measured on anequimolar basis (2 ).
Our data indicating that HC con-centrations increase in vitamin B12deficient individuals who are treatedwith vitamin B12 supplementation
lead us to propose that the HC con-centration is influenced not only bygenetic factors but also by vitaminB12 status (3 ). Carmel challenges thisconclusion, raising some relevant is-sues, which we address below:
Could the observed increase in HC becaused by methodological pitfalls, suchas the spurious introduction of apoHC byin vitro release of HC from leukocytesduring serum analysis?
We do not believe that this is the casebecause serum (vegan population) wasanalyzed both before and after treatmentwith vitamin B12. Furthermore, no alter-ation was observed in the leukocytes as aconsequence of treatment.
Is the observed increase in HC commonin the vegan population as a whole, or isit driven by an increase in just a fewindividuals?
That this response is common in thevegan population is demonstrated by ourfinding that 55 of 63 individuals in ourvegan sample population had increasedtotal HC after treatment with 5 mg vita-min B12 (Fig. 1).
Is it possible that everyone would showan increase in HC if given a megadose ofvitamin B12?
We cannot conclude whether treat-ment with 5 mg vitamin B12 per daywould lead to increased total HC in indi-viduals without as well as those withvitamin B12 deficiency. However, in-creased HC in response to vitamin B12supplementation in individuals withoutvitamin B12 deficiency would still indi-cate a relationship between vitamin B12status and HC concentration.
Although we have further scruti-nized our results in the light of thecomments from Carmel, we still find
Fig. 1. Increase in total HC in the group of deficient individuals treated with vitamin B12 (5 mgper day; n � 63) and placebo (n � 85).
368 Letter
that the most obvious explanation forour findings is that the concentrationof HC is influenced by the vitaminB12 status of the patient. The issuehas important implications for theinterpretation of low cobalamin inrelation to low HC concentrations inpatients undergoing examination forvitamin B12 deficiency. If genetic fac-tors were the only regulators of theHC concentration, the physiciancould decide that the low concentra-tion of cobalamins reflected an inher-ited low HC. If HC is regulated bythe vitamin B12 status in addition tothe genetic factors, as suggested byus, such a patient should always un-dergo further analysis to rule out adeficiency state.
References1. Carmel R, Brar S, Frouhar Z. Plasma total
transcobalamin I. Ethnic/racial patterns andcomparison with lactoferrin. Am J Clin Pathol2001;116:576–80.
2. Morkbak AL, Pedersen JF, Nexo E. Glycosylationindependent measurement of the cobalaminbinding protein haptocorrin. Clin Chim Acta2005;356:184–90.
3. Morkbak AL, Hvas AM, Lloyd-Wright Z, SandersTA, Bleie O, Refsum H, et al. Effect of vitaminB12 treatment on haptocorrin. Clin Chem 2006;52:1104–11.
Anne L. Morkbak*
Ebba Nexø
Department of Clinical BiochemistryAarhus Sygehus
Aarhus University Hospital8000 Aarhus, Denmark.
* Address correspondence to this au-thor at: Department of Clinical Biochem-istry, Aarhus Sygehus, Aarhus UniversityHospital, 8000 Aarhus, Denmark.
DOI: 10.1373/clinchem.2006.080978
Perchloric Acid Treatment To StabilizeUric Acid Concentrations in BloodSamples of Patients Receiving UricAcid Oxidase (Rasburicase) Therapy
To the Editor:Sample handling requirements foruric acid analysis during recombi-nant uric acid oxidase (rasburicase,Sanofi-Synthelabo) therapy are amatter of concern. Rasburicase cata-
lyzes the oxidation of uric acid toallantoin, which is easily excreted bythe kidney. It is indicated for thetreatment and prophylaxis of malig-nancy- or chemotherapy-associatedhyperuricemia (1 ).
For monitoring uricemia in pa-tients receiving rasburicase therapy,the manufacturer recommends keep-ing blood samples in ice water imme-diately after collection and duringspecimen transport until analysis.When samples are maintained at4 °C, uric acid concentrations are re-ported to be adequately preserved(2 ). However, cold inactivation ofthe enzyme requires a cooling periodto bring the collection tube to 4 °C,during which further degradation ofuric acid is possible (3 ). Further-more, rack-based modern randomaccess analyzers do not allow main-taining the sample temperature at4 °C. Moreover, in practice, laborato-ries are often unaware that the pa-tient has received rasburicase be-cause the blood samples were sentat room temperature to the labora-tory as part of routine biochemistrytesting (2 ). In view of the rapid urico-lysis by rasburicase, the accuracy ofuric acid determinations in patientsunder rasburicase treatment can bequestioned under routine conditions.
We studied inactivation of thetherapeutic enzyme to preserve uricacid. A blood sample (0.5 mL) wassupplemented with 1 mL 8% per-chloric acid (PCA) (4 ). After centrif-ugation, (900g, 10 min, room temper-ature) 1 volume of supernatant wasneutralized with 1/2 volume tri-potassium phosphate 0.7 mol/L(pH � 13). After centrifugation, thesupernatant was analyzed. Uric acidanalysis was performed by an enzy-matic colorimetric assay (Modular P,Roche Diagnostics) with a detectionlimit of 12 �mol/L, and between-runimprecision (CVs) of 1.2% and 1.3%,at mean concentrations of 297 and714 �mol/L, respectively. The influ-ence of hematocrit was evaluated byreconstituting plasma and blood cellsof a donor in different proportions,resulting in hematocrit values in therange 0.2–0.5. Based on measure-ments with 3 different donors, theplasma uric acid concentration (y,
�mol/L) correlated to the measureduric acid concentration (x, �mol/L)as follows:
y x � 4.5/0.905 � 0.63 � hct,
in which hct represents the hemato-crit value.
To investigate its in vitro urico-lytic activity, rasburicase (concentra-tion: 1.5 mg/L) was added to hepa-rinized blood samples from healthyvolunteers (n � 4). An aliquot wastreated with PCA, a 2nd aliquot waspromptly placed on ice water, and a3rd aliquot was kept at room temper-ature. Uric acid analysis was per-formed at 30-min intervals for 4 h(Table 1). In untreated samples storedat room temperature (�20 °C), plasmauric acid concentration decreased to�12 �mol/L within 3 h. When un-treated samples were stored at 4 °Cand, as under routine conditions, cen-trifuged at room temperature, uricoly-sis was much less pronounced. How-ever, uric acid values still showed amarked decrease of 30%, thereby ex-ceeding the maximum error budget of14.8% (5). In PCA treated samples,calculated uric acid values remainedstable at room temperature.
To mimic sampling conditions,heparinized blood samples from 2volunteers (uric acid concentrations:321 and 506 �mol/L) were placed ina heating bath at 37 °C before addi-tion of 1.5 mg/L rasburicase. Afteraddition, an aliquot of 0.5 mL wastreated with PCA, while the remain-ing tube was placed in ice water.Residual uric acid concentrationswere highest with PCA treatment (atleast 95%), while storage in ice waterand centrifugation at 4 °C resulted ina higher but stable loss (up to 30%),probably due to degradation duringthe equilibration time needed forcomplete enzymatic inactivation.Overall, our findings are in agree-ment with Lim et al. (1, 2) who dem-onstrated that the in vitro uricolyticactivity of rasburicase is minimizedin samples maintained at 4 °C.
We also evaluated a sample of apatient with a hematologic malig-nancy who was given rasburicase for
Clinical Chemistry 53, No. 2, 2007 369
prophylaxis of hyperuricemia. Fol-lowing the manufacturer’s instruc-tions, uric acid concentration was 83�mol/L, compared to 95 �mol/L af-ter immediate PCA treatment, and�12 �mol/L after 1 h storage atroom temperature.
In conclusion, sample pretreat-ment with PCA appears to be a use-ful tool for monitoring of plasma uricacid concentrations during rasburicasetreatment. We recommend supplyingplastic tubes containing 2 mL PCA. A1 mL syringe can be used to add 1 mLwhole blood to this tube. Immediatelyafter addition, the tube should beshaken vigorously for 30 seconds be-fore being sent to the laboratory.
We thank Sanofi-Synthelabo for pro-viding rasburicase (Fasturtec�).
References1. Goldman SC, Holcenberg JS, Finklestein JZ,
Hutchinson R, Kreissman S, Johnson FL, et al. Arandomized comparison between rasburicaseand allopurinol in children with lymphoma orleukemia at high risk for tumor lysis. Blood2001;97:2998–3003.
2. Lim E, Bennett P, Beilby J. Sample preparation inpatients receiving uric acid oxidase (rasburicase)therapy. Clin Chem 2003;49:1417–9.
3. Hagelauer U, Faust U. The importance of ther-mal equilibration for quality control in clinicalenzyme analysis. Biomed Tech (Berl) 1985;30:264–71.
4. Chuang CK, Wang TJ, Yeung CY, Hsieh WS, LinDS, Ho SC, et al. Interference and blood samplepreparation for a pyruvate enzymatic assay. ClinBiochem 2006;39:74–7.
5. Ricos C, Alvarez V, Cava F, Garcia-Lario JV,Hernandez A, Jimenez CV, et al. Current data-bases on biological variation: pros, cons andprogress. Scand J Clin Lab Invest 1999;59:491–500.
Veronique Stove*
Birgitte WuytsJoris Delanghe
Department of Clinical BiochemistryUniversity Hospital
Ghent, Belgium
* Address correspondence to this au-thor at: Department of Clinical Bio-chemistry, University Hospital Ghent, DePintelaan 185, B 9000 Ghent, Belgium.Fax 32-9-2404985; e-mail [email protected].
DOI: 10.1373/clinchem.2006.081414
Does Bilirubin Cause Interference inRoche Creatinine Methods?
To the Editor:Bilirubin interference in kinetic alka-line picrate (Jaffe) creatinine assayshas been well documented (1, 2). Theexact mechanism of interference isstill unclear, however, and both con-jugated and unconjugated bilirubinhave been implicated. Enzymatic as-says, which reportedly suffer less in-terference, are an alternative, but theextra reagent cost has restricted theiruse. Historical data continue to beused to estimate the extent of biliru-bin interference, although modifica-tions to these assays or instrumentsmay have taken place since the orig-
inal interference studies were per-formed. We used liquid chromatog-raphy tandem mass spectrometry(LC-MS/MS) as the reference methodto investigate the extent of bilirubininterference in 2 automated creati-nine assays. We have previouslyshown that this LC-MS/MS assaycompares well to the 2 automatedmethods at creatinine concentrationsof �150 �mol/L (3 ) by analyzing�100 samples with bilirubin concen-trations within reference intervals.
We added varying amounts of cre-atinine (Sigma) to phosphate buff-ered saline (PBS) pH 7.4, containing40 g/L bovine serum albumin, togive concentrations of 37.5–1000�mol/L. One liter of PBS contained8 g sodium chloride, 0.2 g potassiumchloride, 1.44 g disodium hydrogenphosphate, and 0.24 g potassium di-hydrogen phosphate. Unconjugatedbilirubin (Sigma) was then added togive bilirubin concentrations up to511 �mol/L. Anonymized ictericsera (n � 73) with creatinine concen-trations �150 �mol/L were stored at�20 °C for �2 weeks, and total andconjugated bilirubin were deter-mined by the Roche liquid diazo-nium ion and Jendrassik-Grof basedassays, respectively. All sampleswere analyzed by the following 3different creatinine methods.
The automated creatinine assayswere the rate-blanked, compensatedJaffe method and the creatinine plusenzymatic assay performed on theRoche Modular according to themanufacturer’s instructions (RocheDiagnostics). The reagent set insertstates that there is no significant in-terference by bilirubin for concentra-tions �171 �mol/L and 428 �mol/L,respectively. The LC-MS/MS assayemployed was used as described byOwen et al. (3 ).
The comparative LC-MS/MSmethod shows no significant inter-ference by bilirubin (see Fig. 1 in theData Supplement that accompaniesthe online version of this Letter athttp//www.clinchem.org/content/vol53/issue2). Surprisingly, the Jaffemethod (Fig. 1A) did not show sig-nificant interference in most PBSsamples; however, the samples withthe lowest creatinine concentrations
Table 1. Residual uric acid concentrations in whole blood after additionof rasburicase.
Mean (SD) residual uric acid concentration,% of original
Time 4 °C RT � PCA, RT
30 min 70 (3) 57 (6) 101 (�0.1)60 min 76 (2) 45 (5) 103 (5)
120 min 70 (6) 18 (6) 102 (1)180 min 68 (5) 6 (4) 105 (7)240 min 68 (5) 0 94 (2)300 min 70 (5) ND 97 (4)
The original uric acid concentrations before addition of rasburicase in the 4 donors were 482, 358, 336,and 290 �mol/L, respectively. At defined intervals after addition of rasburicase (time 0), samples werecentrifuged, supernatants were collected and prepared for analysis. For the PCA pretreatment, all aliquotswere treated with PCA at time 0, with further sample preparation at the indicated time points. PCA, perchloricacid 8%; RT, room temperature; ND, not determined.
370 Letters
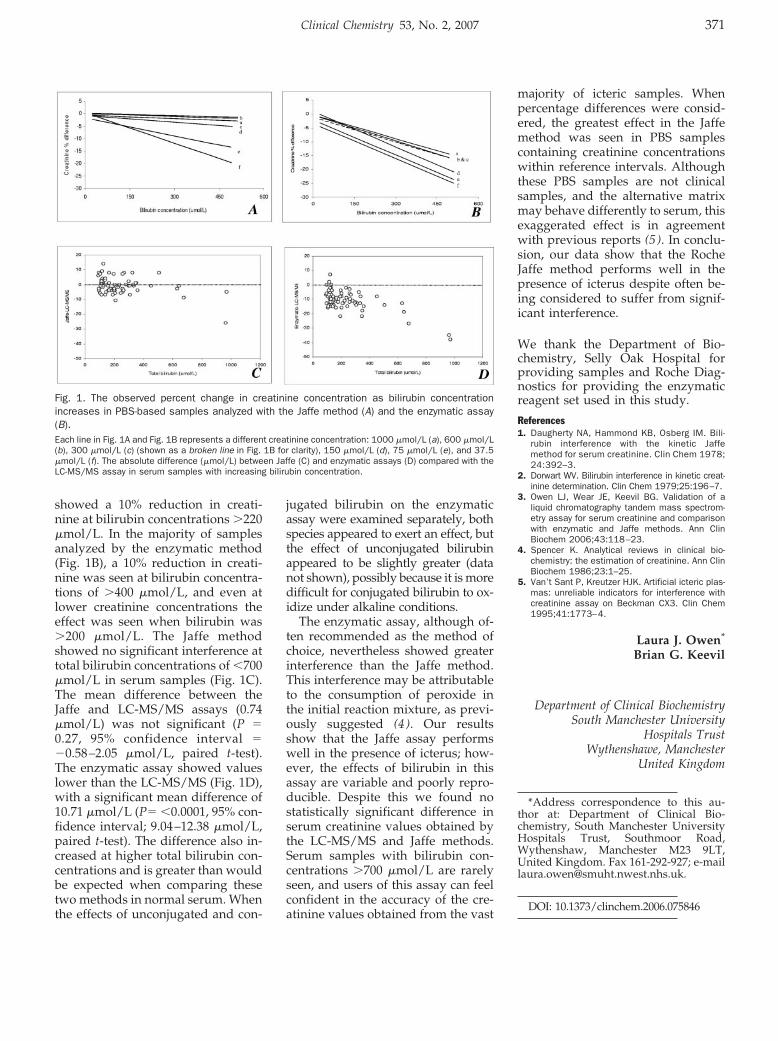
showed a 10% reduction in creati-nine at bilirubin concentrations �220�mol/L. In the majority of samplesanalyzed by the enzymatic method(Fig. 1B), a 10% reduction in creati-nine was seen at bilirubin concentra-tions of �400 �mol/L, and even atlower creatinine concentrations theeffect was seen when bilirubin was�200 �mol/L. The Jaffe methodshowed no significant interference attotal bilirubin concentrations of �700�mol/L in serum samples (Fig. 1C).The mean difference between theJaffe and LC-MS/MS assays (0.74�mol/L) was not significant (P �0.27, 95% confidence interval ��0.58–2.05 �mol/L, paired t-test).The enzymatic assay showed valueslower than the LC-MS/MS (Fig. 1D),with a significant mean difference of10.71 �mol/L (P� �0.0001, 95% con-fidence interval; 9.04–12.38 �mol/L,paired t-test). The difference also in-creased at higher total bilirubin con-centrations and is greater than wouldbe expected when comparing thesetwo methods in normal serum. Whenthe effects of unconjugated and con-
jugated bilirubin on the enzymaticassay were examined separately, bothspecies appeared to exert an effect, butthe effect of unconjugated bilirubinappeared to be slightly greater (datanot shown), possibly because it is moredifficult for conjugated bilirubin to ox-idize under alkaline conditions.
The enzymatic assay, although of-ten recommended as the method ofchoice, nevertheless showed greaterinterference than the Jaffe method.This interference may be attributableto the consumption of peroxide inthe initial reaction mixture, as previ-ously suggested (4 ). Our resultsshow that the Jaffe assay performswell in the presence of icterus; how-ever, the effects of bilirubin in thisassay are variable and poorly repro-ducible. Despite this we found nostatistically significant difference inserum creatinine values obtained bythe LC-MS/MS and Jaffe methods.Serum samples with bilirubin con-centrations �700 �mol/L are rarelyseen, and users of this assay can feelconfident in the accuracy of the cre-atinine values obtained from the vast
majority of icteric samples. Whenpercentage differences were consid-ered, the greatest effect in the Jaffemethod was seen in PBS samplescontaining creatinine concentrationswithin reference intervals. Althoughthese PBS samples are not clinicalsamples, and the alternative matrixmay behave differently to serum, thisexaggerated effect is in agreementwith previous reports (5 ). In conclu-sion, our data show that the RocheJaffe method performs well in thepresence of icterus despite often be-ing considered to suffer from signif-icant interference.
We thank the Department of Bio-chemistry, Selly Oak Hospital forproviding samples and Roche Diag-nostics for providing the enzymaticreagent set used in this study.
References1. Daugherty NA, Hammond KB, Osberg IM. Bili-
rubin interference with the kinetic Jaffemethod for serum creatinine. Clin Chem 1978;24:392–3.
2. Dorwart WV. Bilirubin interference in kinetic creat-inine determination. Clin Chem 1979;25:196–7.
3. Owen LJ, Wear JE, Keevil BG. Validation of aliquid chromatography tandem mass spectrom-etry assay for serum creatinine and comparisonwith enzymatic and Jaffe methods. Ann ClinBiochem 2006;43:118–23.
4. Spencer K. Analytical reviews in clinical bio-chemistry: the estimation of creatinine. Ann ClinBiochem 1986;23:1–25.
5. Van’t Sant P, Kreutzer HJK. Artificial icteric plas-mas: unreliable indicators for interference withcreatinine assay on Beckman CX3. Clin Chem1995;41:1773–4.
Laura J. Owen*
Brian G. Keevil
Department of Clinical BiochemistrySouth Manchester University
Hospitals TrustWythenshawe, Manchester
United Kingdom
*Address correspondence to this au-thor at: Department of Clinical Bio-chemistry, South Manchester UniversityHospitals Trust, Southmoor Road,Wythenshaw, Manchester M23 9LT,United Kingdom. Fax 161-292-927; [email protected].
DOI: 10.1373/clinchem.2006.075846
Fig. 1. The observed percent change in creatinine concentration as bilirubin concentrationincreases in PBS-based samples analyzed with the Jaffe method (A) and the enzymatic assay(B).Each line in Fig. 1A and Fig. 1B represents a different creatinine concentration: 1000 �mol/L (a), 600 �mol/L(b), 300 �mol/L (c) (shown as a broken line in Fig. 1B for clarity), 150 �mol/L (d), 75 �mol/L (e), and 37.5�mol/L (f). The absolute difference (�mol/L) between Jaffe (C) and enzymatic assays (D) compared with theLC-MS/MS assay in serum samples with increasing bilirubin concentration.
Clinical Chemistry 53, No. 2, 2007 371
Pharmaceutical Toxicology. GeraldJ. Mulder, Lennart Dencker, eds.London: Pharmaceutical Press, 2006,280 pp., $49.95, paperback. ISBN0-85369-593-8.
This volume is the first in a series ofintroductory textbooks that areaimed at students in pharmacy andpharmaceutical sciences and are be-ing produced by the European Uni-versity Consortium for AdvancedPharmaceutical Education and Re-search. This volume will be of valueto the intended audience and willalso serve as a solid review text ondrug safety and basic toxicology forresidents and fellows in laboratorymedicine who may be many yearsaway from their training inpharmacology.
The text begins with a chapter ongeneral concepts including kinetics,bioavailability, and, importantly, thetypes of studies that need to be con-ducted to determine toxicity of phar-maceutical compounds. Many of thedetails are specifically related tostudies in the European Union (EU),but the basic concepts are relevant toreaders in the rest of the world aswell.
The next section contains chapterson drug metabolism, molecular andcellular mechanisms of toxicity, tera-
tology, genotoxicity, and carcinoge-nicity. The editors have not man-dated a format for the chapters,allowing relevant information to ap-pear in a different order in eachchapter, a format that was somewhatdistracting. All 5 chapters, however,contain definitions, mechanisms,specific drug examples, and exam-ples of studies that can be performedto assess potential toxicity.
The third section examines toxicityby organ system: liver, kidney, respi-ratory system, and immunotoxicity.These chapters are laid out in a morestandardized fashion, with an over-view of the system followed by thetypes of toxicity each system mightexhibit and specific drug examples.Of particular relevance to the clinicalchemist or toxicologist is a review ofthe specific symptoms and labora-tory tests that can be used to identifypotential toxicity in the specific or-gan system.
The final section contains a chap-ter on clinical toxicology (acute over-dose management), regulatory aspectsof safety assessment, and pharmaco-vigilence. As with the information onstudy design in chapter 1, the last 2chapters provide a great deal of detailrelevant to the EU and, of all the infor-mation in this text, are most relevant topharmaceutical practices rather than
laboratory medicine. Nevertheless, theinformation provided to laboratoriansmay increase understanding of regula-tory aspects that affect other services,so this section is not without merit.
The tables, figures, and line draw-ings provide good examples of thevarious concepts being discussedthroughout the text. The photo-graphs, however, are of mediocrequality. Most disappointing to mewere the further readings cited at theend of each text; for the most partthey were text books or articles pub-lished 5 or more years ago. Althoughsuch texts might be adequate for theintended audience of BSc students inpharmaceutical sciences, citations ofrecent review articles in which pri-mary data could be reviewed oridentified would have been of morevalue to a student of laboratory med-icine at any level. Despite this flaw,this text will be one that I will rec-ommend to residents and fellows aspart of their toxicology training.
Dede Haverstick
University of VirginiaDepartment of Pathology
Charlottesville, VA 22908-0214
DOI: 10.1373/clinchem.2006.079368
Book, Software, and Web Site Reviews
372 Clinical Chemistry 53, No. 2, 2007
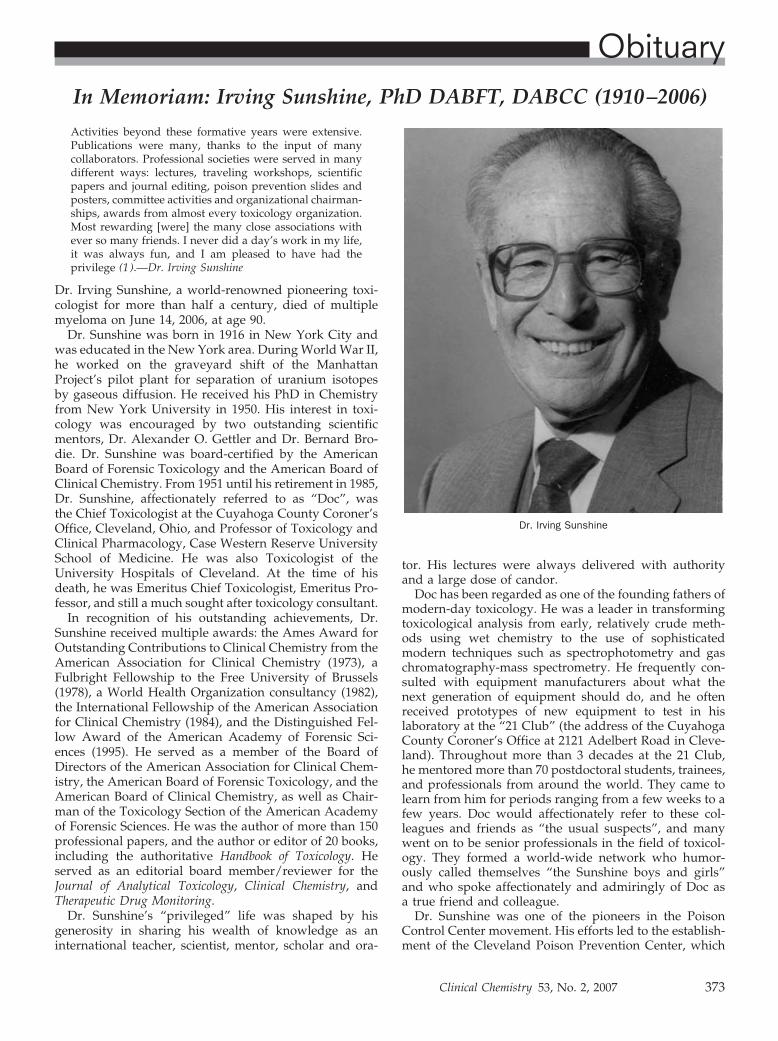
In Memoriam: Irving Sunshine, PhD DABFT, DABCC (1910–2006)
Activities beyond these formative years were extensive.Publications were many, thanks to the input of manycollaborators. Professional societies were served in manydifferent ways: lectures, traveling workshops, scientificpapers and journal editing, poison prevention slides andposters, committee activities and organizational chairman-ships, awards from almost every toxicology organization.Most rewarding [were] the many close associations withever so many friends. I never did a day’s work in my life,it was always fun, and I am pleased to have had theprivilege (1 ).—Dr. Irving Sunshine
Dr. Irving Sunshine, a world-renowned pioneering toxi-cologist for more than half a century, died of multiplemyeloma on June 14, 2006, at age 90.
Dr. Sunshine was born in 1916 in New York City andwas educated in the New York area. During World War II,he worked on the graveyard shift of the ManhattanProject’s pilot plant for separation of uranium isotopesby gaseous diffusion. He received his PhD in Chemistryfrom New York University in 1950. His interest in toxi-cology was encouraged by two outstanding scientificmentors, Dr. Alexander O. Gettler and Dr. Bernard Bro-die. Dr. Sunshine was board-certified by the AmericanBoard of Forensic Toxicology and the American Board ofClinical Chemistry. From 1951 until his retirement in 1985,Dr. Sunshine, affectionately referred to as “Doc”, wasthe Chief Toxicologist at the Cuyahoga County Coroner’sOffice, Cleveland, Ohio, and Professor of Toxicology andClinical Pharmacology, Case Western Reserve UniversitySchool of Medicine. He was also Toxicologist of theUniversity Hospitals of Cleveland. At the time of hisdeath, he was Emeritus Chief Toxicologist, Emeritus Pro-fessor, and still a much sought after toxicology consultant.
In recognition of his outstanding achievements, Dr.Sunshine received multiple awards: the Ames Award forOutstanding Contributions to Clinical Chemistry from theAmerican Association for Clinical Chemistry (1973), aFulbright Fellowship to the Free University of Brussels(1978), a World Health Organization consultancy (1982),the International Fellowship of the American Associationfor Clinical Chemistry (1984), and the Distinguished Fel-low Award of the American Academy of Forensic Sci-ences (1995). He served as a member of the Board ofDirectors of the American Association for Clinical Chem-istry, the American Board of Forensic Toxicology, and theAmerican Board of Clinical Chemistry, as well as Chair-man of the Toxicology Section of the American Academyof Forensic Sciences. He was the author of more than 150professional papers, and the author or editor of 20 books,including the authoritative Handbook of Toxicology. Heserved as an editorial board member/reviewer for theJournal of Analytical Toxicology, Clinical Chemistry, andTherapeutic Drug Monitoring.
Dr. Sunshine’s “privileged” life was shaped by hisgenerosity in sharing his wealth of knowledge as aninternational teacher, scientist, mentor, scholar and ora-
tor. His lectures were always delivered with authorityand a large dose of candor.
Doc has been regarded as one of the founding fathers ofmodern-day toxicology. He was a leader in transformingtoxicological analysis from early, relatively crude meth-ods using wet chemistry to the use of sophisticatedmodern techniques such as spectrophotometry and gaschromatography-mass spectrometry. He frequently con-sulted with equipment manufacturers about what thenext generation of equipment should do, and he oftenreceived prototypes of new equipment to test in hislaboratory at the “21 Club” (the address of the CuyahogaCounty Coroner’s Office at 2121 Adelbert Road in Cleve-land). Throughout more than 3 decades at the 21 Club,he mentored more than 70 postdoctoral students, trainees,and professionals from around the world. They came tolearn from him for periods ranging from a few weeks to afew years. Doc would affectionately refer to these col-leagues and friends as “the usual suspects”, and manywent on to be senior professionals in the field of toxicol-ogy. They formed a world-wide network who humor-ously called themselves “the Sunshine boys and girls”and who spoke affectionately and admiringly of Doc asa true friend and colleague.
Dr. Sunshine was one of the pioneers in the PoisonControl Center movement. His efforts led to the establish-ment of the Cleveland Poison Prevention Center, which
Dr. Irving Sunshine
Obituary
Clinical Chemistry 53, No. 2, 2007 373
he directed for 24 years. He was President of the Ameri-can Association of Poison Control Centers from 1966 to1968 and was Chairman of its Education Committee from1964 to 1979.
As part of his effort in sharing with the worldwidecommunity of toxicology, Dr. Sunshine was an inveterateinternational traveler. In this context, he was recognizedby being made an Honorary Member of the Italian Societyof Forensic Toxicologists, and he is known as the father ofthe Benelux Toxicology Society. In the autumn of 2005, atthe age of 89, he was an invited keynote speaker at themeeting of the International Association of Forensic Tox-icologists in Seoul, Korea.
In recognition of his professional distinction, devotedmentoring, and assistance to colleagues, no less than threeprofessional societies—the International Association forTherapeutic Drug Monitoring and Clinical Toxicology,the International Association for Forensic Toxicology;and the American Academy of Forensic Sciences—estab-lished awards for distinction in their fields that are namedthe Irving Sunshine Award.
Dr. Sunshine was devoted to Yiddish, the language ofEastern European Jewry. He worked to preserve it, as wellas the ideals of social justice often associated with itthrough the Workmen’s Circle school and associatedprograms. Dr. Sunshine was an enthusiastic patron of thearts. He endowed a trust that benefits both the ClevelandMuseum and Cleveland Symphony. He was also an avidgardener.
Dr. Sunshine was married to Helen (nee Rogoff) untilher death in 1983 and then to June Singer (nee Kurlander)
until her death in 2004. He is survived by two sons,Jonathan and Carl, a brother, Gilbert, five grandchildren,and three great grandchildren.
Reference1. Sunshine, I. Irving Sunshine. In: Sunshine I, ed. Was It a Poisoning? Copyright
Pepper Pike, OH: Irving Sunshine, 1998, pg 77–80.
Steven H. Wong
Department of PathologyMedical College of Wisconsin, and
Milwaukee County Medical Examiner’s OfficeMilwaukee, WI
Jonathan Sunshine
American College of RadiologyWashington, DC and
Yale University School of MedicineNew Haven, CT
Bradford R. Hepler
Wayne County Medical Examiner’s OfficeDetroit, MI
DOI: 10.1373/clinchem.2006.083204
374 Obituary: Irving Sunshine
Related Documents