Invited Review Clinical Applications of Diffusion Tensor Imaging Qian Dong, MD, Robert C. Welsh, PhD, * Thomas L. Chenevert, PhD, Ruth C. Carlos, MD, MS, Pia Maly-Sundgren, MD, PhD, Diana M. Gomez-Hassan, MD, PhD, and Suresh K. Mukherji, MD Directionally-ordered cellular structures that impede water motion, such as cell membranes and myelin, result in wa- ter mobility that is also directionally-dependent. Diffusion tensor imaging characterizes this directional nature of wa- ter motion and thereby provides structural information that cannot be obtained by standard anatomic imaging. Quantitative apparent diffusion coefficients and fractional anisotropy have emerged from being primarily research tools to methods enabling valuable clinical applications. This review describes the clinical utility of diffusion tensor imaging, including the basic principles of the technique, acquisition, data analysis, and the major clinical applica- tions. Key Words: diffusion tensor; MRI; DTI; brain; apparent diffusion coefficient; diffusion anisotropy J. Magn. Reson. Imaging 2004;19:6 –18. © 2003 Wiley-Liss, Inc. DIFFUSION TENSOR IMAGING (DTI) relies on thermally- driven random motion of water molecules to supply microscopic structural information in vivo (1,2). Ran- dom motion of water molecules, also known as Brown- ian motion, can be quantified and reflects intrinsic features of tissue microstructure in vivo (3). In uncon- strained water molecules in a pure liquid environment free of impediments or in a sample where the barriers are not coherently oriented as in a cyst, diffusion is equal in all directions. This situation is referred to as “isotropic.” In brain tissue, however, water diffusion is substantially reduced by impediments placed by struc- tures such as myelin sheaths, cell membranes, and white matter tracts. In general, the diffusion of the water molecules is less restricted along the long-axis of a group of aligned tissue fibers (such as those of white matter) than perpendicular to it. The condition of direc- tionally-dependent diffusion is referred to as “anisotro- pic.” Three descriptive levels are commonly used to por- tray tissue diffusion properties. First, the apparent diffusion coefficient (ADC) can be quantified to provide information on the degree of restriction of water mole- cules. Second, the degree of directionality is often de- scribed via an index such as fractional anisotropy (FA). Highly-directional axonal fibers, such as white matter, are revealed as hyperintense on an FA map. Third, the predominant diffusion direction can also be deter- mined, which is used as an input to fiber tracking algorithms. In general, the more unrestricted the water molecules are in a given tissue, the higher the ADC will be and the lower the anisotropy will be. Directionally- encoded color (DEC), another method to identify major fiber direction, recently developed by Pajevic and Pier- paoli (4), derives additional information from DTI. The location and orientation of major white matter fiber tracts can be revealed by hue with these full tensor- based color methods. With recent improvements in MR hardware, DTI acquisition times have been reduced to allow complete brain coverage in a clinically acceptable period. These features of the DTI technique provide a sensitive means to identify different components of brain tissue and evaluate the integrity and direction of the fiber tracts in various pathological conditions. Tis- sue maladies studied by DTI include cerebral ischemia, multiple sclerosis, epilepsy, metabolic disorders, and brain tumor. PHYSICS, ACQUISITION, AND DATA ANALYSIS Diffusion, Scalar, and Anisotropic Tensor imaging is predicated on the self-diffusion of water in vivo and how free-isotropic self-diffusion may be affected by the properties of the tissue. Diffusion, also referred to Brownian Motion, is the inherent ran- dom motion of a molecule due to its thermal energy. Self-diffusion was first observed by Brown in 1827 (5), and quantified by Einstein in 1905 (6). In a liquid, diffusion is determined by the size and temperature of the molecule and the viscosity of the medium. On av- erage, there is no net change in position over an ensem- ble of water molecules since there is no preferred mi- gration direction. Each molecule, however, will randomly move about, and will have a net root mean square displacement (RMS). Along any given direction, the RMS displacement is given by RMS 2D (1) Department of Radiology, University of Michigan, Ann Arbor, Michigan. *Address reprint requests to: R.C.W., University of Michigan Medical Center, Department of Radiology-MRI Division, 1500 E. Medical Center Drive, Ann Arbor, MI 48109-0030. E-mail: [email protected] Received May 13, 2003; Accepted August 22, 2003. DOI 10.1002/jmri.10424 Published online in Wiley InterScience (www.interscience.wiley.com). JOURNAL OF MAGNETIC RESONANCE IMAGING 19:6 –18 (2004) © 2003 Wiley-Liss, Inc. 6

Welcome message from author
This document is posted to help you gain knowledge. Please leave a comment to let me know what you think about it! Share it to your friends and learn new things together.
Transcript
Invited Review
Clinical Applications of Diffusion Tensor Imaging
Qian Dong, MD, Robert C. Welsh, PhD,* Thomas L. Chenevert, PhD,Ruth C. Carlos, MD, MS, Pia Maly-Sundgren, MD, PhD,Diana M. Gomez-Hassan, MD, PhD, and Suresh K. Mukherji, MD
Directionally-ordered cellular structures that impede watermotion, such as cell membranes and myelin, result in wa-ter mobility that is also directionally-dependent. Diffusiontensor imaging characterizes this directional nature of wa-ter motion and thereby provides structural informationthat cannot be obtained by standard anatomic imaging.Quantitative apparent diffusion coefficients and fractionalanisotropy have emerged from being primarily researchtools to methods enabling valuable clinical applications.This review describes the clinical utility of diffusion tensorimaging, including the basic principles of the technique,acquisition, data analysis, and the major clinical applica-tions.
Key Words: diffusion tensor; MRI; DTI; brain; apparentdiffusion coefficient; diffusion anisotropyJ. Magn. Reson. Imaging 2004;19:6–18.© 2003 Wiley-Liss, Inc.
DIFFUSION TENSOR IMAGING (DTI) relies on thermally-driven random motion of water molecules to supplymicroscopic structural information in vivo (1,2). Ran-dom motion of water molecules, also known as Brown-ian motion, can be quantified and reflects intrinsicfeatures of tissue microstructure in vivo (3). In uncon-strained water molecules in a pure liquid environmentfree of impediments or in a sample where the barriersare not coherently oriented as in a cyst, diffusion isequal in all directions. This situation is referred to as“isotropic.” In brain tissue, however, water diffusion issubstantially reduced by impediments placed by struc-tures such as myelin sheaths, cell membranes, andwhite matter tracts. In general, the diffusion of thewater molecules is less restricted along the long-axis ofa group of aligned tissue fibers (such as those of whitematter) than perpendicular to it. The condition of direc-tionally-dependent diffusion is referred to as “anisotro-pic.” Three descriptive levels are commonly used to por-tray tissue diffusion properties. First, the apparentdiffusion coefficient (ADC) can be quantified to provide
information on the degree of restriction of water mole-cules. Second, the degree of directionality is often de-scribed via an index such as fractional anisotropy (FA).Highly-directional axonal fibers, such as white matter,are revealed as hyperintense on an FA map. Third, thepredominant diffusion direction can also be deter-mined, which is used as an input to fiber trackingalgorithms. In general, the more unrestricted the watermolecules are in a given tissue, the higher the ADC willbe and the lower the anisotropy will be. Directionally-encoded color (DEC), another method to identify majorfiber direction, recently developed by Pajevic and Pier-paoli (4), derives additional information from DTI. Thelocation and orientation of major white matter fibertracts can be revealed by hue with these full tensor-based color methods. With recent improvements in MRhardware, DTI acquisition times have been reduced toallow complete brain coverage in a clinically acceptableperiod. These features of the DTI technique provide asensitive means to identify different components ofbrain tissue and evaluate the integrity and direction ofthe fiber tracts in various pathological conditions. Tis-sue maladies studied by DTI include cerebral ischemia,multiple sclerosis, epilepsy, metabolic disorders, andbrain tumor.
PHYSICS, ACQUISITION, AND DATA ANALYSIS
Diffusion, Scalar, and Anisotropic
Tensor imaging is predicated on the self-diffusion ofwater in vivo and how free-isotropic self-diffusion maybe affected by the properties of the tissue. Diffusion,also referred to Brownian Motion, is the inherent ran-dom motion of a molecule due to its thermal energy.Self-diffusion was first observed by Brown in 1827 (5),and quantified by Einstein in 1905 (6). In a liquid,diffusion is determined by the size and temperature ofthe molecule and the viscosity of the medium. On av-erage, there is no net change in position over an ensem-ble of water molecules since there is no preferred mi-gration direction. Each molecule, however, willrandomly move about, and will have a net root meansquare displacement (RMS). Along any given direction,the RMS displacement is given by
RMS � �2D� (1)
Department of Radiology, University of Michigan, Ann Arbor, Michigan.*Address reprint requests to: R.C.W., University of Michigan MedicalCenter, Department of Radiology-MRI Division, 1500 E. Medical CenterDrive, Ann Arbor, MI 48109-0030. E-mail: [email protected] May 13, 2003; Accepted August 22, 2003.DOI 10.1002/jmri.10424Published online in Wiley InterScience (www.interscience.wiley.com).
JOURNAL OF MAGNETIC RESONANCE IMAGING 19:6–18 (2004)
© 2003 Wiley-Liss, Inc. 6

where � is the time the molecule diffuses, and D is thediffusion coefficient. Essentially, during a time interval�, a water molecule “samples” its local environment. Inan isotropic medium, such as a water bath at a con-stant temperature, the water molecules that are awayfrom any boundary will isotropically diffuse. This iso-tropic diffusion can be made anisotropic by the intro-duction of boundaries. If the boundaries are highly im-permeable, the water will be strictly bounded anddiffusion will take place mainly along the direction par-allel to the boundary. However, if this boundary is per-meable, molecules will traverse boundaries, althoughthe RMS displacement in this direction is reduced com-pared to parallel to the boundaries. Effectively, two dif-fusion coefficients D� and D�, one for random motionparallel and one for random motion transverse to theboundary result in an anisotropy of the diffusion coef-ficient (D� � D�).
Examples of free and bounded diffusion are shown inFig. 1. Microscopically, the intrinsic diffusion coeffi-cient is still the same, however the observed diffusioncoefficient is reduced as the boundary becomes imper-meable.
Note that if the diffusion time is insufficient, then theboundaries, permeable or not, will not be probed by thewater molecules and any difference in diffusion coeffi-cients will not be detected.
Diffusion Tensor
Under more general conditions, the diffusion propertiesare no longer limited to being scalar in nature (i.e.,isotropic), and the diffusion coefficient can be elevatedto a tensor form (7–9).
D 3 D̂ � � Dxx Dxy Dxz
Dyx Dyy Dyz
Dzx Dzy Dzz
� (2)
In tensor form, the diffusion coefficient can now havethree principal values (Dxx, Dyy, and Dzz). Additionally, ifthe measurement axes do not correspond to the naturalsymmetry axes of the object being measured, the tensorwill take a nondiagonal form and crossterms will appear(Dxy, Dxz, and Dyz). Due to symmetry properties of diffu-sion, there are only six independent terms in the tensor(Dxy � Dyx, Dxz � Dzx, and Dyz � Dzy).
Nuclear Magnetic Resonance Acquisition
Scalar diffusion measurements are made by using apair of pulsed magnetic field gradients (10). Using adisplacement-encoding scheme as shown in Fig. 2, thespin-echo amplitude A as compared to the echo ampli-tude A0 without diffusion gradients is given by the fol-lowing equation:
A � A0e�D�2G2�2����/3� (3a)
A � A0e�bD (3b)
where � is the diffusion time, � is the proton gyromag-netic ratio, � is the encoding gradient pulse width, G isthe gradient strength, and the quantity of interest D isthe diffusion coefficient. During the first gradient, thecurrent position of the molecule is encoded with phase.The second gradient then will rewind phase with a netphase resulting from any net displacement due to ran-dom motion. Due to the incoherent nature of randommotion, the residual phase of the water molecules willbe uncorrelated, resulting in signal degradation asgiven by Eq. [3]. Note that the diffusion coefficient mea-sured here is a scalar quantity that is sufficient todescribe diffusion only if the system exhibits isotropicdiffusion. The diffusion gradient timing and strength issummarized in Eq. [3b] as the “b” factor, b � �2G2�2(� ��/3).
DTI
With the tensor description, there are now six unknownquantities that must be determined, as compared to asingle diffusion coefficient for isotropic media. Since thediffusion coefficient is elevated to the status of a tensor(matrix), the b-factor must be as well, and Eq. [3b] nowtakes the form
A � A0e�b̂D̂ (4a)
where
b̂D̂ � �i
�j
bijDij (4b)
Figure 1. Both panels illustrate the random motion of a singlewater molecule due to diffusion for 60 msec. The left paneldemonstrates free diffusion, while in the right panel the mol-ecule is constrained by the vertical boundaries indicated bythe dashed lines.
Figure 2. Stejskal/Tanner diffusion preparation: initial 90°RF pulse, followed by first diffusion lobe, 180° refocusing RFpulse, then second diffusion lobe. Leading edges of diffusionlobes are separated by �. Each lobe has duration �.
Clinical Applications of Diffusion Tensor Imaging 7
and in the case of rectangular gradient pulses the b-matrix takes the simplified form of
bij � �2GiGj�2�� � �/3� (4c)
For more complex diffusion gradient waveforms a nu-merical solution for the b-matrix must be calculated(11,12).
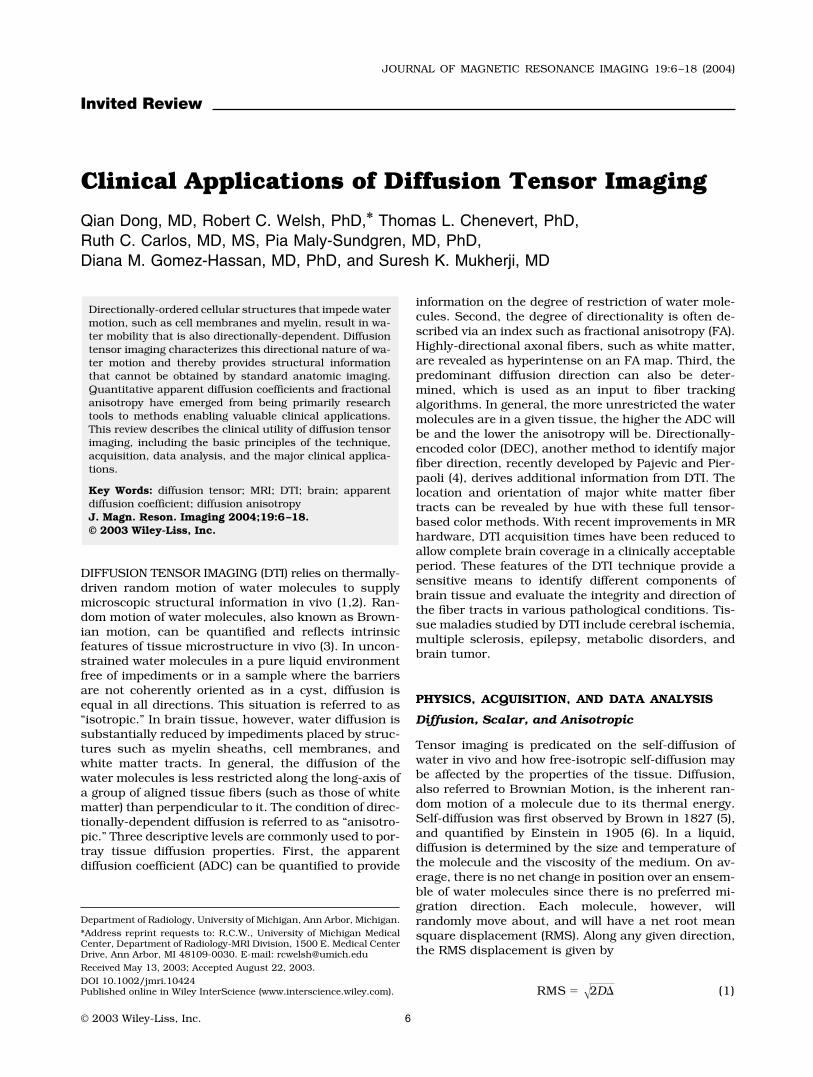
A minimum of seven diffusion-weighted images areacquired (gradient directions are noncolinear) (13) tosolve for the tensor components of diffusion, Dij, in Eq.[4a]. As a result, each voxel of the image then has adiffusion tensor defined. By applying a mathematicaloperation known as diagonalization, the eigenvalues (ofwhich there will be three: 1, 2, and 3) and eigenvec-tors (again three: 1, 2, and 3) of the tensor can bedetermined. The largest of the three eigenvalues (whichare diffusion coefficients themselves) is the value of themaximal diffusion, regardless of direction. The corre-sponding eigenvector for this maximum eigenvaluepoints in the direction of maximal diffusion. This direc-tion is parallel to the boundaries that give rise to an-isotropy in the system. Two identical samples of tissuerandomly oriented with respect to each other will havethe same eigenvalues calculated from the diffusion ten-sor. The samples will only differ in the resulting eigen-vectors. Figure 3 illustrates a simple numerical simu-lation of anisotropic diffusion and the resultingprincipal eigenvectors are displayed on each pixel of afour by three image. In the figure, pixels of identicaltissue samples lie in the same column, differing only inorientation. Increasingly more anisotropic tissue issimulated and illustrated left to right in the figure.
MRI Acquisition
One of the primary difficulties of imaging is patient/subject motion. This is particularly true for diffusion-weighted imaging in which diffusion-sensitizationpulses amplify bulk motion phase artifact. To mitigatemotion artifact, most diffusion imaging sequences arebased on single-shot echo-planar imaging (EPI). Re-cently, spiral imaging has also been used in diffusionimaging (14). If multishot imaging is done, it is para-mount that navigation echoes are acquired to correctfor phase discontinuity between shots (15,16). Bothsingle-shot EPI and spiral acquisition suffer from mag-netic susceptibility artifact, though less in spiral acqui-sition due to the nature of the trajectory through k-space (17). Improvements in image resolution andreduction of distortion have been made using PROPEL-LOR and SENSE-EPI techniques (18,19).
To solve for the diffusion tensor D̂, at least sevendiffusion-weighted images are required, though moreacquisition will improve signal to noise ratio (SNR). Inparticular, to provide the minimum bias in determina-tion of tensor components, the gradient vectors aredistributed spatially on a unit sphere according to amodel of how electric charge distributes itself to mini-mize interaction energy (20,21).
Gradients short in duration, but large in amplitude,are best for diffusion imaging. A ramification of such adiffusion-gradient scheme is the rise of eddy currents,which greatly affect imaging techniques such as EPI
and spiral. One method of mitigating large gradientswitching is to use a twice-refocused spin-echo tech-nique proposed by Reese et al (22). Additionally, gradi-ent pre-emphasis can be used (23).
DTI Metrics and Presentation
DTI provides a very rich dataset that requires someform of data reduction for a more interpretable presen-tation. It is important that any scalar metric formedfrom the eigenvalues of the diffusion tensor be “rota-tionally invariant,” i.e., the scalar metric is independentof the orientation of the gradient axis direction and theeigenvalue sorting order (24). Isotropic diffusion is wellcharacterized by the trace of the diffusion tensor
Tr�D̂� � 1 � 2 � 3 (5)
The trace, or one-third of the trace (i.e., the mean of theeigenvalues), is also an important scalar metric foranisotropic media, since it represents the average dif-fusivity of the media. Typically, this quantity is referredto as the ADC. Since the trace is scalar invariant, oneneed not determine the full tensor to measure ADC; thesum of the diffusion coefficients measured along anythree orthogonal directions is sufficient to measure thetrace or the ADC. However, more importantly for theclinical application of the investigation of white-matterintegrity, metrics of diffusion anisotropy are more ap-propriate. Two very useful metrics are FA, which is ameasure of the portion of the magnitude of the diffusiontensor due to anisotropy,
FA�D̂� � �1/2��1 � 2�
2 � �2 � 3�2 � �3 � 1�
2
�12 � 2
2 � 32 (6)
and relative anisotropy (RA), derived from a ratio of theanisotropic portion of the diffusion tensor to the isotro-pic portion,
RA�D̂� ���1 � 2�
2 � �2 � 3�2 � �3 � 1�
2
Tr�D̂�(7)
Both anisotropy indices, which are dimensionless butquantitative, acquire a value of 0.0 for a purely isotropicmedium. For a highly anisotropic, cylindrically sym-metric medium (1 � 2 � 3) FA tends towards 1, whileRA tends towards �2. Both FA and RA maps can bepresented as gray scale images for evaluation.
Another form of data presentation is the combinationof the eigenvalue information into a color image. Bychoosing the eigenvector (1) associated with the largesteigenvalue, the principal diffusion direction of the un-derlying brain structure can be encoded with color andthe magnitude of the anisotropy, such as FA, can befurther used as an illumination factor of the calculationof a directionally encoded color image (4). This resultsin a calculation of the color components (R, G, and B) ofa pixel given by:
R � FA�εx1�, G � FA�εy
1�, B � FA�εz1� (8)
8 Dong et al.

Figure 3. A graphical illustration of a Monte Carlo diffusion simulation for a 4 � 3 pixel image. The simulated tissue hasimpermeable boundaries, which give rise to anisotropy, oriented at a slowly increasing angle ( /12 increment per pixel,increasing bottom to top, left to right). The resulting principal eigenvector, which is along the direction of maximal diffusion, isindicated by the blue line present on top of each random walk shown in green (a single particle is shown for clarity). Thesecondary eigenvector is shown in red. The length of each eigenvector is indicative of the corresponding eigenvalue. Finally, thebackground image is the fractional anisotropy (FA) map calculated from these eigenvalues. Black indicates little or no anisot-ropy, while white is FA � 1. The boundary spacing is wide, giving a vanishing anisotropy in the leftmost column of pixels anddecreasing to the right, resulting in higher values of anisotropy. For a given value of anisotropy, the only thing changing whilemoving up is the orientation of the principal diffusion. The major eigenvalue is the same throughout the image, while the secondeigenvalue (length of red line) changes as the boundary spacing decreases.
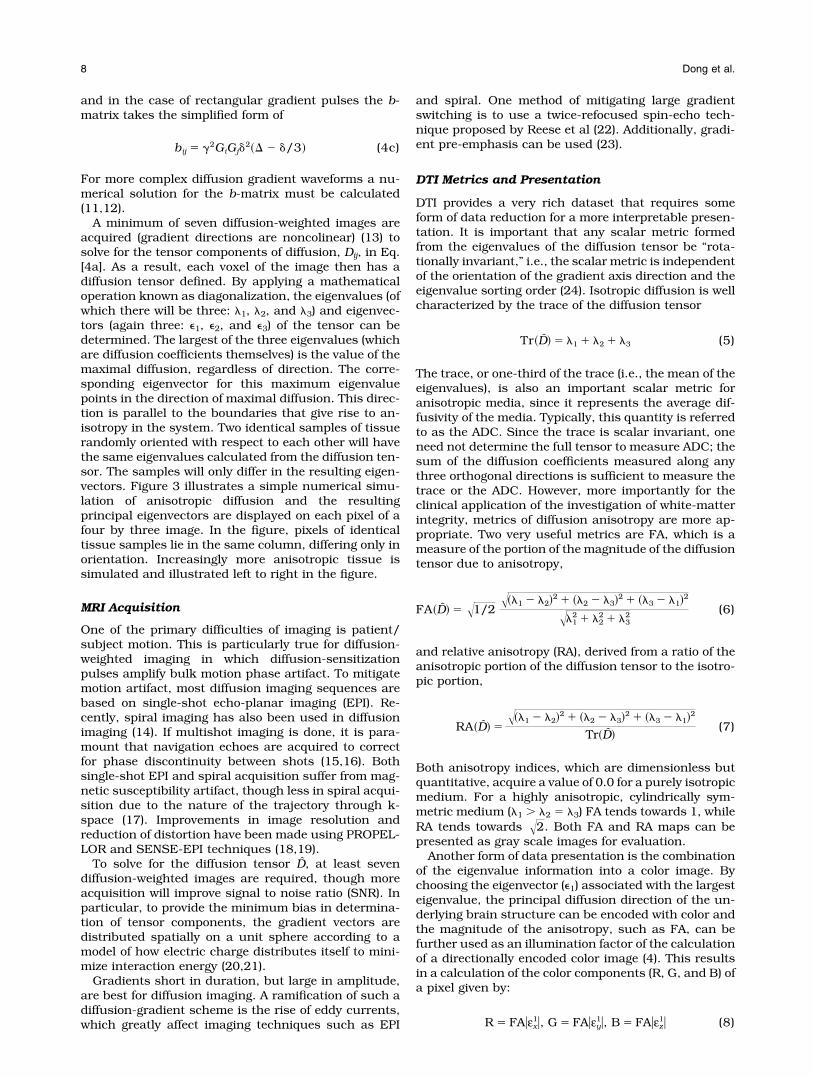
Figure 4. Axial multisection T2-weighted(first row), ADC map (second row), and FAmap (third row) images from a normal vol-unteer with a DTI technique, obtained us-ing a single shot spin echo EPI sequence.ADC and FA maps were generated withvendor-provided software. Highly direc-tional white matter structures are sensi-tively demonstrated on FA maps. DECimages (bottom row) indicate superior–inferior (SI) fiber orientation as blue, an-terior–posterior (AP) fiber orientation asgreen, and left–right (LR) fiber orienta-tion as red. Fibers along directions otherthan these are demonstrated by a pro-portional mix of RGB according to thevector components along their principaldirections (SI, AP, LR).
Clinical Applications of Diffusion Tensor Imaging 9
Fiber Tractography
Working from the assumption that white matter tractdirection can be measured with diffusion tensor imag-ing, the field of fiber tractography addresses the possi-bilities of noninvasive digital reconstruction of neuro-nal connectivity (25,26). The general concept is that ineach voxel, the local fiber orientation is measuredthrough diffusion tensor imaging. The task of tractog-raphy is to sensibly assign mathematical associationsbetween adjacent voxels based on eigenvalue and eig-envector information. A variety of fiber-tracking algo-rithms have been introduced and are beyond the scopeof this review (27). These methods hold the promise ofallowing full reconstruction of white matter tracts thatconnect distal regions of gray matter. However, a majorchallenge to fiber tracking is what happens when fiberbundles cross or coexist in single voxels.
Crossing Fibers
Crossing fibers are not captured in the mathematicalmodel of a diffusion tensor and can appear as a voxel oflow anisotropy (28). This can result in the breakdown ofa fiber trajectory. Solutions to this problem have beenproposed that are sensitive to multiple fiber directionsin a single voxel, but these require much larger diffu-sion-weighted datasets, nearly 50 in the case of highangular resolution diffusion (29,30), and hundreds ofdiffusion images in the case of diffusion spectrum im-aging (31). Investigations to address stability and per-formance of complex fiber configurations are underway,but are beyond the targeted scope of this review.
Sample MR Protocols and Imaging Processing
In addition to a standard anatomical imaging protocolwhich includes routing T1-weighted, T2-weighted, fluid-attentuated-inversion recovery (FLAIR) and, frequently,contrast-enhanced T1-weighted sequences, diffusiontensor imaging was obtained using a single shot spin-echo EPI technique along nine different directions witha b value of 1000 seconds/mm2 in our institution. Allexaminations use a 1.5-T system with the manufactur-er-supplied birdcage, quadrature head coil.
Image postprocessing is performed to generate ADCand FA maps with vendor-provided software (Fig. 4).Initially, images are preprocessed to remove image dis-tortion that arises from the EPI readout: shear, com-pression, and shift are corrected. To further reduceartifactual values, a noise threshold is applied. Finally,a tensor dataset for each voxel (including eigenvaluesand eigenvectors) is generated. DEC FA-weighted im-ages are calculated according to the scheme by Pajevicand Pierpaoli (4).
CLINICAL APPLICATIONS
Normal Brain Maturation and Aging
Normal human brain maturation begins in utero andcontinues after birth into adolescence, with the mostdramatic changes in myelination in the first few years oflife. Characteristic MRI signal changes on T1- and T2-weighted images may reflect a decrease in brain watercontent and an increase in white matter myelination
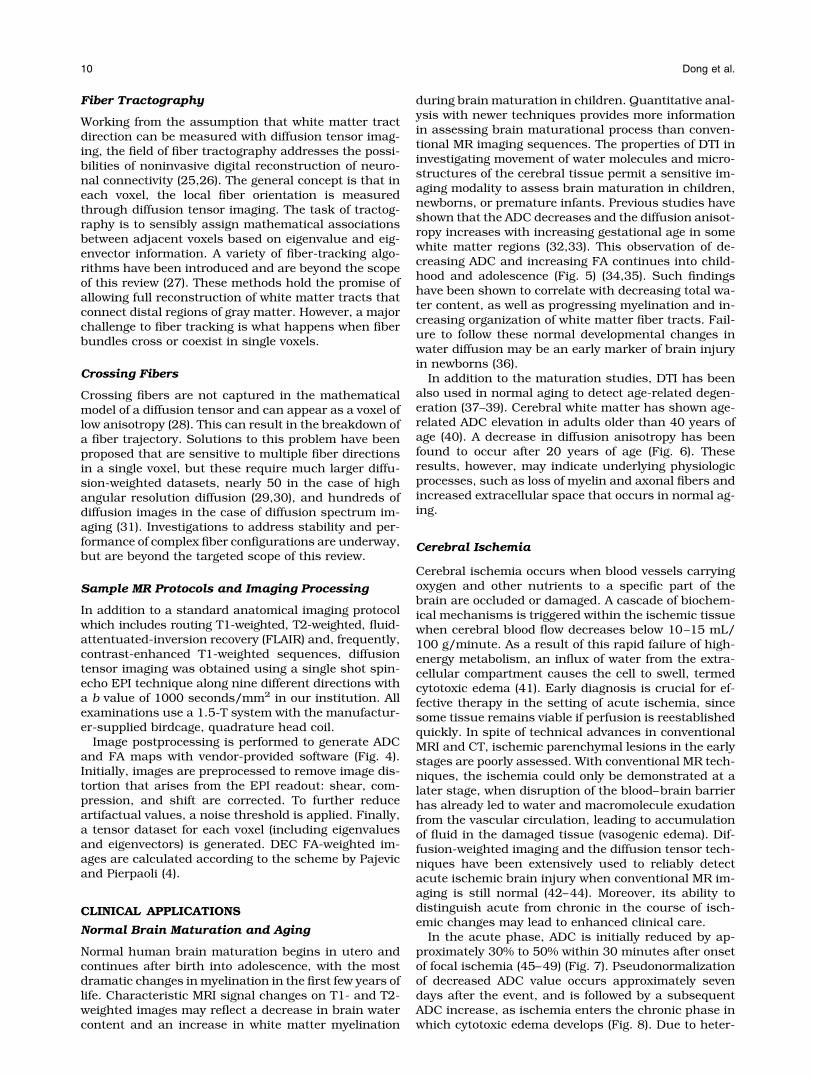
during brain maturation in children. Quantitative anal-ysis with newer techniques provides more informationin assessing brain maturational process than conven-tional MR imaging sequences. The properties of DTI ininvestigating movement of water molecules and micro-structures of the cerebral tissue permit a sensitive im-aging modality to assess brain maturation in children,newborns, or premature infants. Previous studies haveshown that the ADC decreases and the diffusion anisot-ropy increases with increasing gestational age in somewhite matter regions (32,33). This observation of de-creasing ADC and increasing FA continues into child-hood and adolescence (Fig. 5) (34,35). Such findingshave been shown to correlate with decreasing total wa-ter content, as well as progressing myelination and in-creasing organization of white matter fiber tracts. Fail-ure to follow these normal developmental changes inwater diffusion may be an early marker of brain injuryin newborns (36).
In addition to the maturation studies, DTI has beenalso used in normal aging to detect age-related degen-eration (37–39). Cerebral white matter has shown age-related ADC elevation in adults older than 40 years ofage (40). A decrease in diffusion anisotropy has beenfound to occur after 20 years of age (Fig. 6). Theseresults, however, may indicate underlying physiologicprocesses, such as loss of myelin and axonal fibers andincreased extracellular space that occurs in normal ag-ing.
Cerebral Ischemia
Cerebral ischemia occurs when blood vessels carryingoxygen and other nutrients to a specific part of thebrain are occluded or damaged. A cascade of biochem-ical mechanisms is triggered within the ischemic tissuewhen cerebral blood flow decreases below 10–15 mL/100 g/minute. As a result of this rapid failure of high-energy metabolism, an influx of water from the extra-cellular compartment causes the cell to swell, termedcytotoxic edema (41). Early diagnosis is crucial for ef-fective therapy in the setting of acute ischemia, sincesome tissue remains viable if perfusion is reestablishedquickly. In spite of technical advances in conventionalMRI and CT, ischemic parenchymal lesions in the earlystages are poorly assessed. With conventional MR tech-niques, the ischemia could only be demonstrated at alater stage, when disruption of the blood–brain barrierhas already led to water and macromolecule exudationfrom the vascular circulation, leading to accumulationof fluid in the damaged tissue (vasogenic edema). Dif-fusion-weighted imaging and the diffusion tensor tech-niques have been extensively used to reliably detectacute ischemic brain injury when conventional MR im-aging is still normal (42–44). Moreover, its ability todistinguish acute from chronic in the course of isch-emic changes may lead to enhanced clinical care.
In the acute phase, ADC is initially reduced by ap-proximately 30% to 50% within 30 minutes after onsetof focal ischemia (45–49) (Fig. 7). Pseudonormalizationof decreased ADC value occurs approximately sevendays after the event, and is followed by a subsequentADC increase, as ischemia enters the chronic phase inwhich cytotoxic edema develops (Fig. 8). Due to heter-
10 Dong et al.
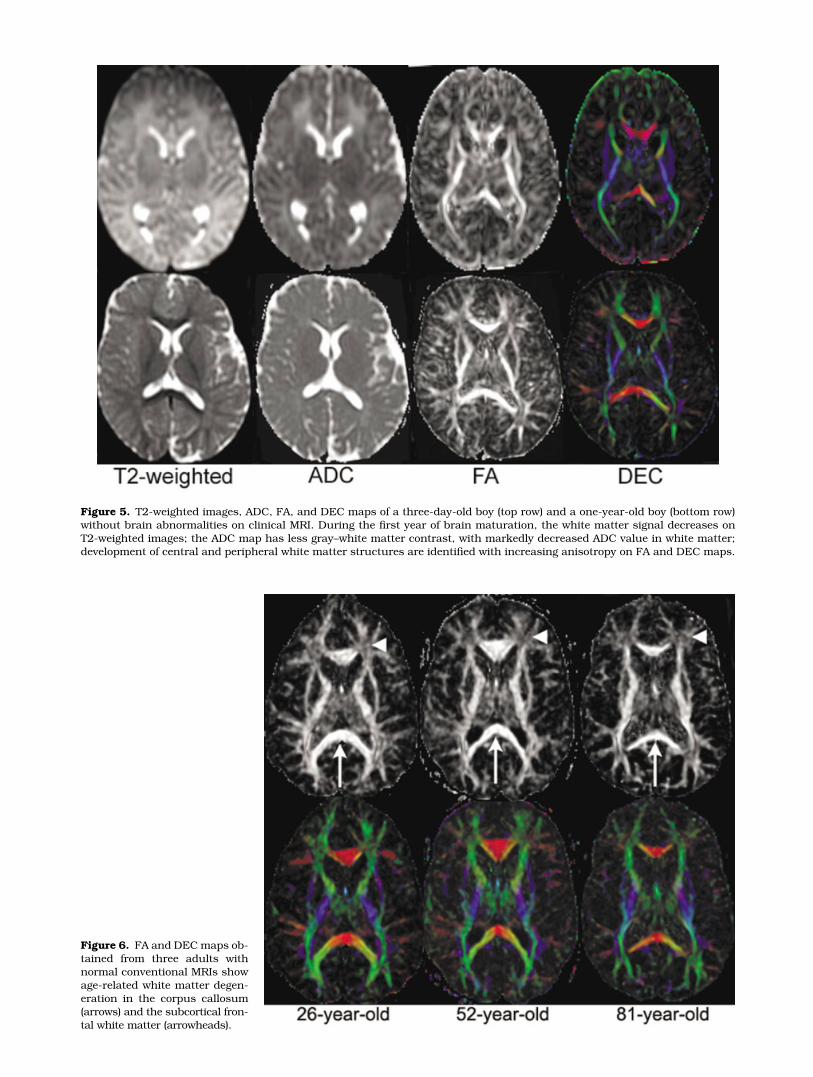
Figure 5. T2-weighted images, ADC, FA, and DEC maps of a three-day-old boy (top row) and a one-year-old boy (bottom row)without brain abnormalities on clinical MRI. During the first year of brain maturation, the white matter signal decreases onT2-weighted images; the ADC map has less gray–white matter contrast, with markedly decreased ADC value in white matter;development of central and peripheral white matter structures are identified with increasing anisotropy on FA and DEC maps.
Figure 6. FA and DEC maps ob-tained from three adults withnormal conventional MRIs showage-related white matter degen-eration in the corpus callosum(arrows) and the subcortical fron-tal white matter (arrowheads).
ogeneity of the ischemic process, more severe ADC re-duction in white matter than in gray matter has beendemonstrated during acute and early subacute isch-emia (50). In addition to substantial changes in ADCvalue, an acute elevation in FA has been also observedin ischemic white matter but not in ischemic gray mat-ter, followed by a significant reduction in FA during thechronic phase of cerebral ischemia (51). These changesare thought to be due to loss of organization in normalstructures when the cytoarchitecture is disrupted. Inaddition to providing information regarding the courseof ischemia, ADC threshold values have shown to beuseful in predicting tissue viability and stroke outcome(47). These powerful features of the DTI technique yieldunique insights into ultrastructural changes of strokeevolution, which are not available with conventionalMRI.
Wallerian degeneration (WD) refers to antegrade de-generation of axons and their myelin sheaths as a resultof proximal axonal injury or death of the cell body. Thecorticospinal tract is most commonly involved, due tocerebral infarction occurring ipsilaterally. T2 signal in-tensity abnormalities in the degenerating tract can beidentified with conventional MRI within 4–10 weeksafter acute insult (52). Recently, several studies (53–56)have shown severely reduced diffusion anisotropy andincreased ADC in WD by using the MR diffusion tech-nique. The mechanism responsible for these changes isconsidered to be axonal loss after ischemic or hemor-rhagic stroke. Pierpaoli et al (56) demonstrated that DTIis more sensitive than T2-weighted imaging in detectingWD, and has the potential to distinguish primary strokelesions from the areas of WD (Fig. 9). While diffusionanisotropy is reduced in both the primary lesion andthe areas of WD, ADC is only slightly increased in WD,while it is greatly increased in the primary lesion.
Multiple Sclerosis
MRI has been considered to be the most informativenoninvasive method to diagnose and monitor diseaseprogression in patients with multiple sclerosis (MS)(57). However, conventional T2-weighted MR images donot sufficiently correlate with histopathological sub-strates and clinical disability (57). Conventional T2-weighted images are unable to distinguish underlying
histopathological substrates, such as inflammation,edema, demyelination, gliosis, and axonal loss, becauseall of the above lesions have identical high signal onT2-weighted images. Moreover, T2-weighted imagescan not detect occult tissue damage within normal ap-pearing white matter (NAWM), which may contribute tothe disability of patients with MS. DTI offers quantita-tive information complementary to that provided byother MR techniques in evaluating the structural dam-age occurring in MS lesions and NAWM (58–68).
Recent studies (58–69) have demonstrated that: 1)lesions had higher ADC and lower FA than NAWM, andhigher ADC and lower FA values in patient NAWM thanthat from normal control subject white matter (Table 1).2) A significantly increased ADC and decreased FA werefound in acute (enhancing) vs. MS lesions compared tochronic (nonenhancing) lesions. 3) Nonenhancing T1-hypointense lesions had higher ADC and lower FA val-ues compared to T1-isointense lesions. 4) ADC wassignificantly higher in patients with secondary progres-sive MS than in patients with primary progressive MS(67,69). 5) FA values were more sensitive than ADCvalues in detecting white matter abnormalities in MS(58,61,66). All these findings may reflect a net loss anddisorganization of structural barriers to water molecu-lar motion (Fig. 10). Bozzali et al (68) also found in-creased water diffusivity in the cerebral gray matter(GM) of patients with MS, suggesting cerebral GM is notspared by the MS pathologic process.
Epilepsy
Epilepsy is a common neurological disorder character-ized by recurrent seizures due to abnormal electricaldischarges in the brain. It is estimated that 20% ofpatients with epilepsy are refractory to all forms of med-ical treatment (70). Surgical resection of epileptogenicstructural disorders such as mesial temporal sclerosis,tumors, and vascular malformations may improve thequality of life by achieving complete or maximal seizurecontrol without adding neurological deficit in patientswith medically intractable epilepsy. Complex partialseizure, the most common type of refractory epilepsy,frequently involves the temporal lobe. Mesial temporalsclerosis or hippocampal sclerosis is a common pathol-
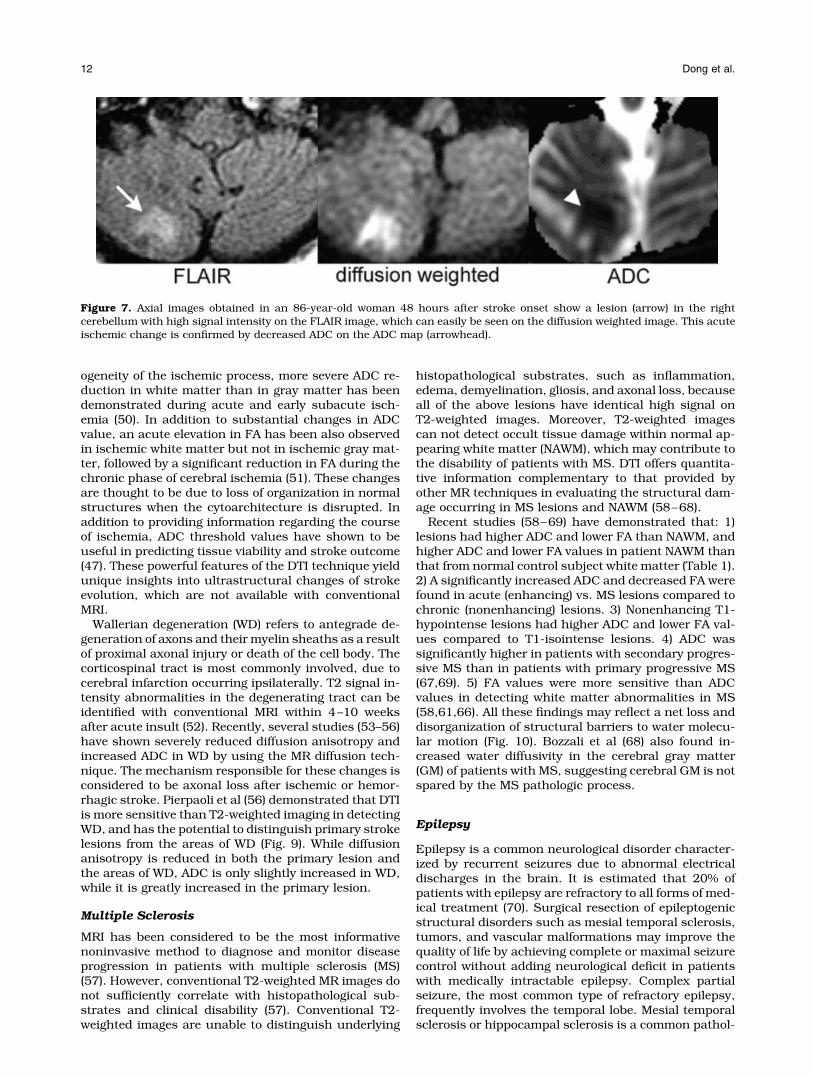
Figure 7. Axial images obtained in an 86-year-old woman 48 hours after stroke onset show a lesion (arrow) in the rightcerebellum with high signal intensity on the FLAIR image, which can easily be seen on the diffusion weighted image. This acuteischemic change is confirmed by decreased ADC on the ADC map (arrowhead).
12 Dong et al.
ogy for temporal lobe epilepsy. MRI is sensitive in iden-tifying mesial temporal sclerosis, with characteristicfindings including hippocampal volume loss and T2signal hyperintensity (71,72), but in some patients, it isdifficult to identify the subtle abnormalities with con-ventional MR images.
DTI has been recently used in depicting abnormali-ties in patients with epilepsy. Increased diffusivity andreduced anisotropy in the sclerotic hippocampi of pa-
tients with chronic epilepsy and hippocampal sclerosis(73–75) (Fig. 11) suggest the loss of structural organi-zation and expansion of the extracellular space. In pa-tients with malformations of cortical development(MCD), another common association with refractory ep-ilepsy, higher diffusivity and lower anisotropy weredemonstrated not only within MCD (76), but also inareas that appeared normal on conventional MRI (76).In addition, these changes in diffusivity and anisotropy
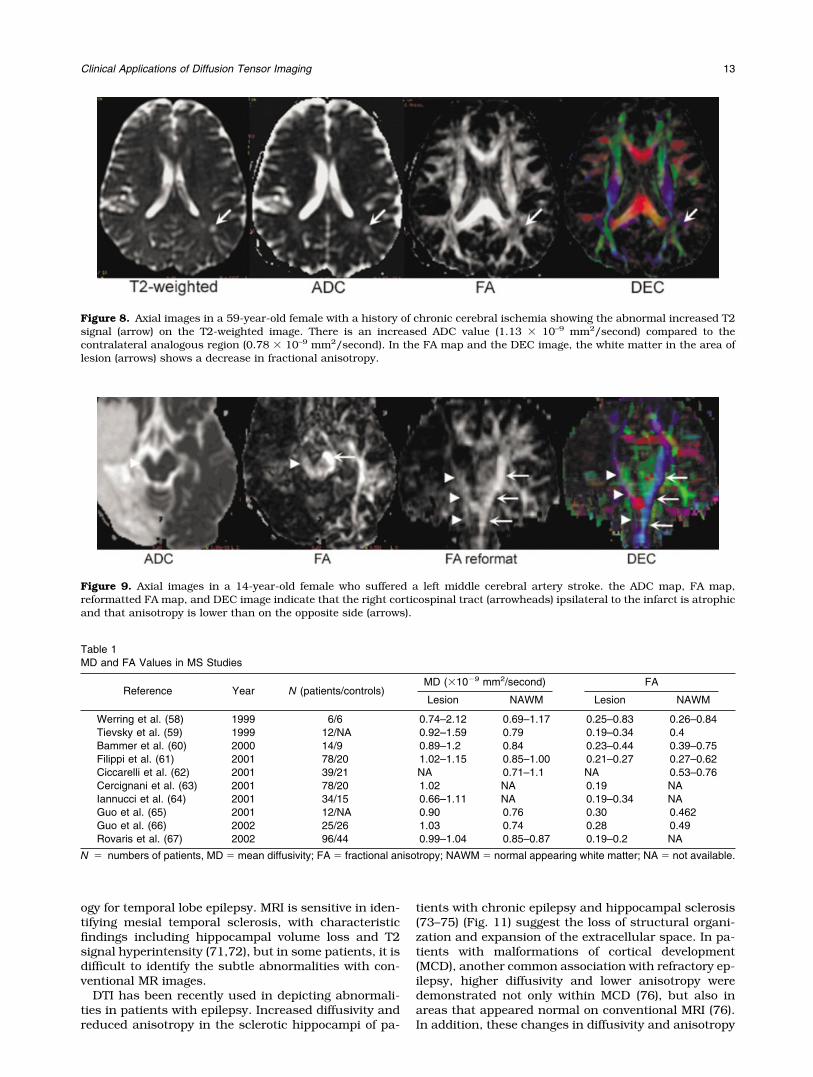
Figure 8. Axial images in a 59-year-old female with a history of chronic cerebral ischemia showing the abnormal increased T2signal (arrow) on the T2-weighted image. There is an increased ADC value (1.13 � 10–9 mm2/second) compared to thecontralateral analogous region (0.78 � 10–9 mm2/second). In the FA map and the DEC image, the white matter in the area oflesion (arrows) shows a decrease in fractional anisotropy.
Figure 9. Axial images in a 14-year-old female who suffered a left middle cerebral artery stroke. the ADC map, FA map,reformatted FA map, and DEC image indicate that the right corticospinal tract (arrowheads) ipsilateral to the infarct is atrophicand that anisotropy is lower than on the opposite side (arrows).
Table 1MD and FA Values in MS Studies
Reference Year N (patients/controls)MD (�10�9 mm2/second) FA
Lesion NAWM Lesion NAWM
Werring et al. (58) 1999 6/6 0.74–2.12 0.69–1.17 0.25–0.83 0.26–0.84Tievsky et al. (59) 1999 12/NA 0.92–1.59 0.79 0.19–0.34 0.4Bammer et al. (60) 2000 14/9 0.89–1.2 0.84 0.23–0.44 0.39–0.75Filippi et al. (61) 2001 78/20 1.02–1.15 0.85–1.00 0.21–0.27 0.27–0.62Ciccarelli et al. (62) 2001 39/21 NA 0.71–1.1 NA 0.53–0.76Cercignani et al. (63) 2001 78/20 1.02 NA 0.19 NAIannucci et al. (64) 2001 34/15 0.66–1.11 NA 0.19–0.34 NAGuo et al. (65) 2001 12/NA 0.90 0.76 0.30 0.462Guo et al. (66) 2002 25/26 1.03 0.74 0.28 0.49Rovaris et al. (67) 2002 96/44 0.99–1.04 0.85–0.87 0.19–0.2 NA
N � numbers of patients, MD � mean diffusivity; FA � fractional anisotropy; NAWM � normal appearing white matter; NA � not available.
Clinical Applications of Diffusion Tensor Imaging 13
revealed in normal-appearing brain tissue beyond theorigin of seizures have also been reported in other stud-ies (75,77,78). This may be important to help localizelesions in MRI-negative patients and provide more in-formation in detecting occult epileptogenic regions, of-fering possible surgical treatment for these individuals.
Metabolic Disorders
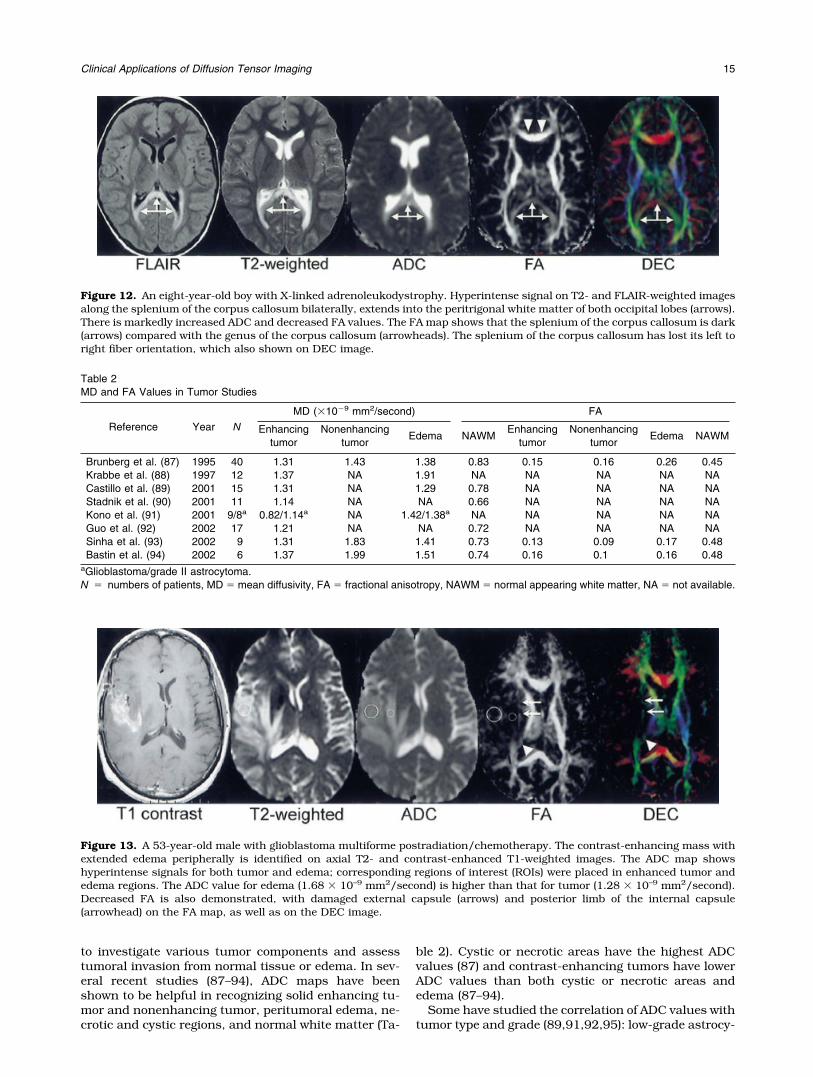
This group encompasses a wide spectrum of inheritedneurodegenerative disorders that affect the gray andwhite matter to varying degrees. Leukodystrophies arethe major classified diseases characterized by symmet-ric and diffuse white matter changes. They can be sub-divided into lysosomal, peroxisomal, and mitochondrialdiseases (79). Based on the advantage of the DTI tech-nique in the assessment of white matter disease, sev-eral studies have been done to evaluate abnormalitiesrelated to demyelination in patients with adrenoleu-kodystrophy (ALD) (80,81) and Krabbe disease (82).
X-linked ALD is a rare, genetic disorder characterizedby the breakdown or loss of the myelin sheath sur-rounding nerve cells in the brain and progressive dys-function of the adrenal gland. A drop in FA and theincrease in ADC were demonstrated by Eichler et al(81). The changes in ADC and FA values within theaffected white matter from periphery to core correlate tohistopathological zonal changes described by Schaum-
burg et al (83), which may indicate an increase in freewater and loss of the integrity of the myelin sheath andaxon in white matter (Fig. 12). Better sensitivity of an-isotropy maps compared with conventional MRI in de-tecting dysmyelination in patients with Krabbe diseasehas been illustrated by early disease detection and bythe correlation of treatment effects with alterations inanisotropic disturbances (82). Moreover, Ono et al(84,85) have found that DTI is superior to conventionalMRI in differentiating dysmyelinating disorders (i.e.,Pelizaeus-Merzbacher disease) from demyelinating dis-orders (i.e., Krabbe disease, Alexander disease). Theexistence of diffusional anisotropy in dysmyelinated le-sions and the lack of diffusional anisotropy in demyeli-nated lesions has been verified in both animal andhuman studies (84,85).
Brain Tumor
Brain tumors are responsible for significant morbidityand mortality in both pediatric and adult populations.Approximately 18,000 brain tumors are diagnosed an-nually in the United States (86). Despite the informa-tion provided by conventional MR with contrast-en-hanced T1-weighted and T2-weighted sequences incharacterizing the location and extent of these tumors,the specification and grading of brain tumors is stilllimited. Diffusion imaging has been increasingly used
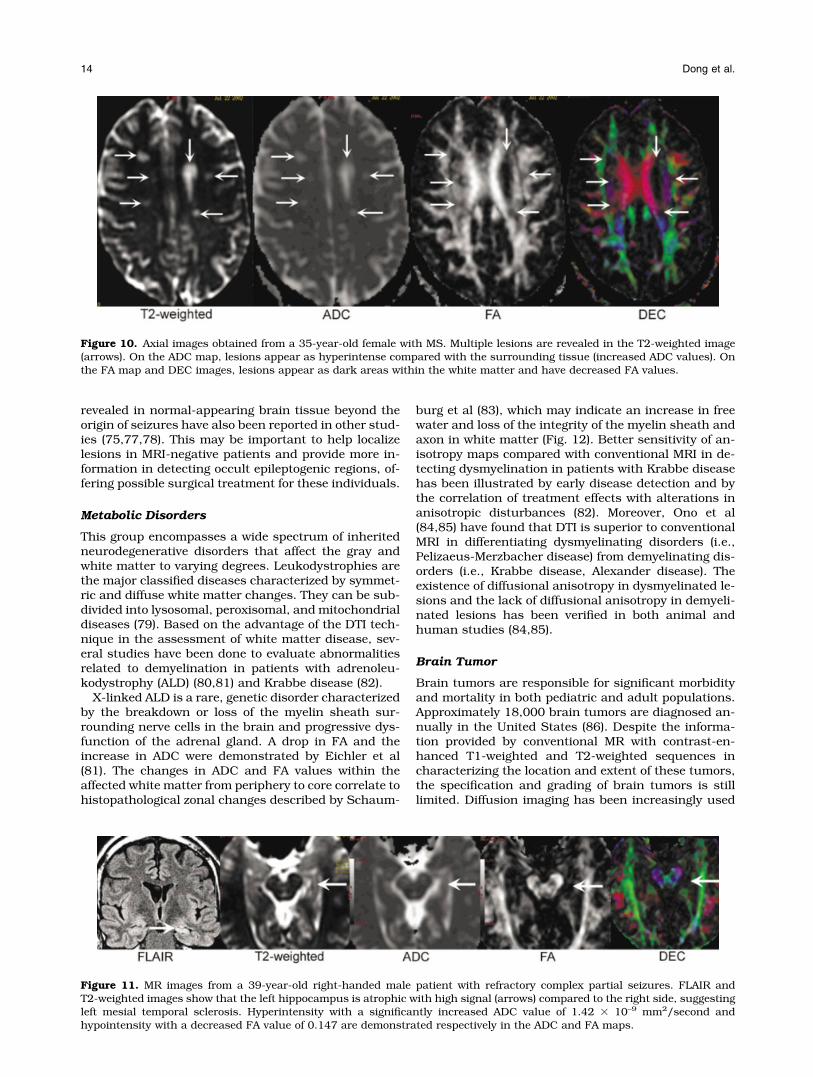
Figure 10. Axial images obtained from a 35-year-old female with MS. Multiple lesions are revealed in the T2-weighted image(arrows). On the ADC map, lesions appear as hyperintense compared with the surrounding tissue (increased ADC values). Onthe FA map and DEC images, lesions appear as dark areas within the white matter and have decreased FA values.
Figure 11. MR images from a 39-year-old right-handed male patient with refractory complex partial seizures. FLAIR andT2-weighted images show that the left hippocampus is atrophic with high signal (arrows) compared to the right side, suggestingleft mesial temporal sclerosis. Hyperintensity with a significantly increased ADC value of 1.42 � 10–9 mm2/second andhypointensity with a decreased FA value of 0.147 are demonstrated respectively in the ADC and FA maps.
14 Dong et al.
to investigate various tumor components and assesstumoral invasion from normal tissue or edema. In sev-eral recent studies (87–94), ADC maps have beenshown to be helpful in recognizing solid enhancing tu-mor and nonenhancing tumor, peritumoral edema, ne-crotic and cystic regions, and normal white matter (Ta-
ble 2). Cystic or necrotic areas have the highest ADCvalues (87) and contrast-enhancing tumors have lowerADC values than both cystic or necrotic areas andedema (87–94).
Some have studied the correlation of ADC values withtumor type and grade (89,91,92,95): low-grade astrocy-
Figure 12. An eight-year-old boy with X-linked adrenoleukodystrophy. Hyperintense signal on T2- and FLAIR-weighted imagesalong the splenium of the corpus callosum bilaterally, extends into the peritrigonal white matter of both occipital lobes (arrows).There is markedly increased ADC and decreased FA values. The FA map shows that the splenium of the corpus callosum is dark(arrows) compared with the genus of the corpus callosum (arrowheads). The splenium of the corpus callosum has lost its left toright fiber orientation, which also shown on DEC image.
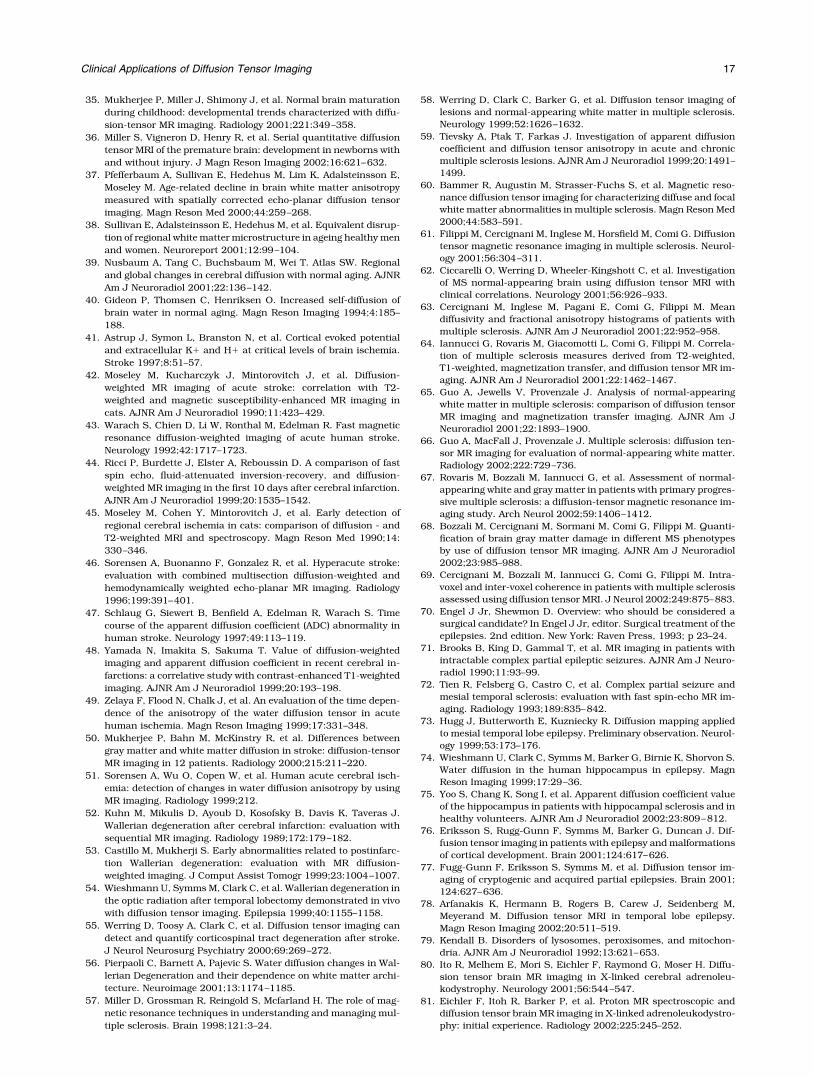
Figure 13. A 53-year-old male with glioblastoma multiforme postradiation/chemotherapy. The contrast-enhancing mass withextended edema peripherally is identified on axial T2- and contrast-enhanced T1-weighted images. The ADC map showshyperintense signals for both tumor and edema; corresponding regions of interest (ROIs) were placed in enhanced tumor andedema regions. The ADC value for edema (1.68 � 10–9 mm2/second) is higher than that for tumor (1.28 � 10–9 mm2/second).Decreased FA is also demonstrated, with damaged external capsule (arrows) and posterior limb of the internal capsule(arrowhead) on the FA map, as well as on the DEC image.
Table 2MD and FA Values in Tumor Studies
Reference Year N
MD (�10�9 mm2/second) FA
Enhancingtumor
Nonenhancingtumor
Edema NAWMEnhancing
tumorNonenhancing
tumorEdema NAWM
Brunberg et al. (87) 1995 40 1.31 1.43 1.38 0.83 0.15 0.16 0.26 0.45Krabbe et al. (88) 1997 12 1.37 NA 1.91 NA NA NA NA NACastillo et al. (89) 2001 15 1.31 NA 1.29 0.78 NA NA NA NAStadnik et al. (90) 2001 11 1.14 NA NA 0.66 NA NA NA NAKono et al. (91) 2001 9/8a 0.82/1.14a NA 1.42/1.38a NA NA NA NA NAGuo et al. (92) 2002 17 1.21 NA NA 0.72 NA NA NA NASinha et al. (93) 2002 9 1.31 1.83 1.41 0.73 0.13 0.09 0.17 0.48Bastin et al. (94) 2002 6 1.37 1.99 1.51 0.74 0.16 0.1 0.16 0.48
aGlioblastoma/grade II astrocytoma.N � numbers of patients, MD � mean diffusivity, FA � fractional anisotropy, NAWM � normal appearing white matter, NA � not available.
Clinical Applications of Diffusion Tensor Imaging 15

toma has higher ADC values, whereas high-grade ma-lignant glioma has lower ADC values, reflecting morerestricted diffusion from increasing tumor cellularity.FA values are generally reduced in the tumor, whichsuggests structural disorder, and may not be able toprovide extra information in tissue differentiation (93).However, disorganization of the white matter tracts andthe effects of tumor on white matter pathways can beidentified with this value (Fig. 13) (96), which can notobtained with standard MR techniques. Understandingthe tumor effect on white matter fibers may be impor-tant in neurosurgical planning. Data obtained fromboth animal models and human studies suggest thatdiffusion imaging may be sensitive for evaluating tumorresponse to therapy (97–100). Early increasing ADCvalues during therapy may relate to therapy-inducedcell necrosis. The subsequent drop in tumor ADC topretreatment levels is an indicator of tumor regrowth.
SUMMARY
DTI provides a powerful noninvasive tool to study com-plex brain tissue architecture. Its value in applicationto normal issues such as neuroanatomy, fiber connec-tivity, and brain development is promising. In addition,it also has tremendous potential in a broad variety ofpathologies, such as cerebral ischemia, multiple scle-rosis, epilepsy, metabolic disorders, and brain tumor.Advances in efficient MR acquisitions and suitablepostprocessing algorithms are needed to further en-hance the information derived from DTI. With technicalimprovements and robust postprocessing analyses, theutilization of DTI may become more reliable, both forresearch and clinical applications.
ACKNOWLEDGMENTS
We thank Suzanne Murphy for assistance with prepa-ration of the manuscript.
REFERENCES1. Le Bihan D, Breton E, Lallemand D, Grenier P, Cabanis E, Laval-
Jeantet M. MR imaging of intravoxel incoherent motions: applica-tion to diffusion and perfusion in neurologic disorders. Radiology1986;161:401–407.
2. Chenevert TL, Brunberg JA, Pipe JG. Anisotropic diffusion in hu-man white matter: demonstration with MR techniques in vivo.Radiology 1990;177:401–405.
3. Pierpaoli C, Jezzard P, Basser PJ, Barnett A, Di Chiro G. Diffusiontensor MR imaging of the human brain. Radiology 1996;201:637–648.
4. Pajevic S, Pierpaoli C. Color schemes to represent the orientationof anisotropic tissues from diffusion tensor data: application towhite matter fiber tract mapping in the human brain. Magn ResonMed 1999;42:526–540.
5. Brown R. A brief account of microscopical observations and on thegeneral existence of active molecules in organic and inorganicbodies. In: The Philosophical Magazine, vol. IV. London: RichardTaylor; 1828. p 161–173.
6. Einstein A. About the movement of suspended particles in liquidsat rest as required by the molecular kinetic theory of heat. [Uberdie von der molekularkinetischen Theorie der Warme geforderteBewegung von in ruhenden Flussigkeiten suspendiertenTeilchen]. Ann Phys 1905;322:549–560. (Ger)
7. Crank J. The mathematics of diffusion. Oxford: Oxford UniversityPress; 1975. p 1–10.
8. Callaghan P. Principles of nuclear magnetic resonance micros-copy. Oxford: Oxford Science Publications; 1991. p 334–335.
9. Basser P, Mattiello J, LeBihan D. Estimation of the effective self-diffusion tensor from NMR spin echo. J Magn Reson B 1994;103:247–254.
10. Stejskal E, Tanner J. Spin diffusion measurements: spin echoes inthe presence of time-dependent field gradient. J Chem Phys 1965;42:282–292.
11. Mattiello J, Basser P, Le Bihan D. The b matrix in diffusion tensorecho-planar imaging. Magn Reson Med 1997;37:292–300.
12. Mattiello J, Basser P, Lebihan D. Analytical expressions for the bmatrix in NMR diffusion imaging and spectroscopy. J Magn ResonA 1994;108:131–141.
13. Basser P, Pierpaoli C. A simplified method to measure the diffu-sion tensor from seven MR images. Magn Reson Med 1998;39:928–934.
14. Bammer R, Glover G, Moseley M. Diffusion tensor spiral imaging(abstract). In: Proceedings of the 10th Annual Meeting of theISMRM, Honolulu, 2002;1111.
15. Ordidge R, Helpern J, Qing Z, Knight R, Nagesh V. Correction ofmotional artifacts in diffusion-weighted MR images using naviga-tor echoes. Magn Reson Imag 1994;2:455–460.
16. Anderson A, Gore J. Analysis and correction of motion artifacts indiffusion weighted imaging. Magn Reson Med 1994;32:379–387.
17. Haacke E, Brown R, Thompson M, Venkatesan R. In chapter 19:Magnetic resonance imaging, physical principles and sequencedesign. New York: John Wiley & Sons, Inc.; 1999. p 513–567.
18. Pipe J, Farthing V, Forbes K. Multishot diffusion-weighted FSEusing PROPELLER MRI. Magn Reson Med 2002;47:42–52.
19. Bammer R, Auer M, Keeling S, et al. Diffusion tensor imagingusing single-shot SENSE-EPI. Magn Reson Med 2002;48:128–136.
20. Jones D, Horsfield M, Simmons A. Optimal strategies for measur-ing diffusion anisotropic systems by magnetic resonance imaging.Magn Reson Med 1999;42:515–525.
21. Skare S, Hedehus M, Moseley M, Li T. Condition number as ameasure of noise performance of diffusion tensor acquisitionschemes with MRI. J Magn Reson A 2000;147:340–352.
22. Reese T, Weisskoff R, Wedeen V. Diffusion NMR facilitated by arefocused eddy-current EPI pulse sequence (Abstract). In: Pro-ceedings of the 6th Annual Meeting of the ISMRM, Sydney, Aus-tralia, 1998;663.
23. Papadakis N, Martin K, Pickard J, Hall L, Carpenter T, Huang C.Gradient preemphasis calibration in diffusion-weighted echo-pla-nar imaging. Magn Reson Med 2000;44:616–624.
24. Basser P, Pierpaoli C. Microstructural and physiological featuresof tissues elucidated by quantitative-diffusion-tensor MRI. J MagnReson B 1996;111:209–219.
25. Conturo T, Lori N, Cull T, et al. Tracking neuronal fiber pathwaysin the living human brain. Proc Natl Acad Sci USA 1999;96:10422–10427.
26. Basser P, Pajevic S, Pierpaoli C, Duda J, Aldroubi A. In vivo fibertractography using DT-MRI data. Magn Reson Med 2000;44:625–632.
27. Mori S, Van Zijl P. Fiber tracking: principles and strategies - atechnical review. NMR Biomed 2002;15:468–480.
28. Tuch D, Weisskoff R, Belliveau J, Wedeen V. High angular reso-lution diffusion imaging of the human brain sequence (abstract).In: Proceedings of the 7th Annual Meeting of the ISMRM, Phila-delphia, 1999;321.
29. Frank L. Anisotropy in high angular resolution diffusion-weightedMRI. Magn Reson Med 2001;45:935–939.
30. Frank L. Characterization of anisotropy in high angular resolutiondiffusion-weighted MRI. Magn Reson Med 2002;47:1083–1099.
31. Wedeen V, Reese T, Tuch D, et al. Mapping fiber orientation spec-tra in cerebral white matter with Fourier-transform diffusion MRI(abstract). In: Proceedings of the 8th Annual Meeting of theISMRM, Denver, 2000;82.
32. Huppi P, Maier S, Peled S, et al. Microstructural development ofhuman newborn cerebral white matter assessed in vivo by diffu-sion tensor magnetic resonance imaging. Pediatr Res 1998;44:584–590.
33. Neil J, Shiran S, McKinstry R, et al. Normal brain in humannewborns: apparent diffusion coefficient and diffusion anisotropymeasured by using diffusion tensor MR imaging. Radiology 1998;209:57–66.
34. McGraw P, Liang L, Provenzale J. Evaluation of normal age-relatedchanges in anisotropy during infancy and childhood as shown bydiffusion tensor imaging. AJR Am J Roentgenol 2002;179:1515–1522.
16 Dong et al.
35. Mukherjee P, Miller J, Shimony J, et al. Normal brain maturationduring childhood: developmental trends characterized with diffu-sion-tensor MR imaging. Radiology 2001;221:349–358.
36. Miller S, Vigneron D, Henry R, et al. Serial quantitative diffusiontensor MRI of the premature brain: development in newborns withand without injury. J Magn Reson Imaging 2002;16:621–632.
37. Pfefferbaum A, Sullivan E, Hedehus M, Lim K, Adalsteinsson E,Moseley M. Age-related decline in brain white matter anisotropymeasured with spatially corrected echo-planar diffusion tensorimaging. Magn Reson Med 2000;44:259–268.
38. Sullivan E, Adalsteinsson E, Hedehus M, et al. Equivalent disrup-tion of regional white matter microstructure in ageing healthy menand women. Neuroreport 2001;12:99–104.
39. Nusbaum A, Tang C, Buchsbaum M, Wei T. Atlas SW. Regionaland global changes in cerebral diffusion with normal aging. AJNRAm J Neuroradiol 2001;22:136–142.
40. Gideon P, Thomsen C, Henriksen O. Increased self-diffusion ofbrain water in normal aging. Magn Reson Imaging 1994;4:185–188.
41. Astrup J, Symon L, Branston N, et al. Cortical evoked potentialand extracellular K� and H� at critical levels of brain ischemia.Stroke 1997;8:51–57.
42. Moseley M, Kucharczyk J, Mintorovitch J, et al. Diffusion-weighted MR imaging of acute stroke: correlation with T2-weighted and magnetic susceptibility-enhanced MR imaging incats. AJNR Am J Neuroradiol 1990;11:423–429.
43. Warach S, Chien D, Li W, Ronthal M, Edelman R. Fast magneticresonance diffusion-weighted imaging of acute human stroke.Neurology 1992;42:1717–1723.
44. Ricci P, Burdette J, Elster A, Reboussin D. A comparison of fastspin echo, fluid-attenuated inversion-recovery, and diffusion-weighted MR imaging in the first 10 days after cerebral infarction.AJNR Am J Neuroradiol 1999;20:1535–1542.
45. Moseley M, Cohen Y, Mintorovitch J, et al. Early detection ofregional cerebral ischemia in cats: comparison of diffusion - andT2-weighted MRI and spectroscopy. Magn Reson Med 1990;14:330–346.
46. Sorensen A, Buonanno F, Gonzalez R, et al. Hyperacute stroke:evaluation with combined multisection diffusion-weighted andhemodynamically weighted echo-planar MR imaging. Radiology1996;199:391–401.
47. Schlaug G, Siewert B, Benfield A, Edelman R, Warach S. Timecourse of the apparent diffusion coefficient (ADC) abnormality inhuman stroke. Neurology 1997;49:113–119.
48. Yamada N, Imakita S, Sakuma T. Value of diffusion-weightedimaging and apparent diffusion coefficient in recent cerebral in-farctions: a correlative study with contrast-enhanced T1-weightedimaging. AJNR Am J Neuroradiol 1999;20:193–198.
49. Zelaya F, Flood N, Chalk J, et al. An evaluation of the time depen-dence of the anisotropy of the water diffusion tensor in acutehuman ischemia. Magn Reson Imaging 1999;17:331–348.
50. Mukherjee P, Bahn M, McKinstry R, et al. Differences betweengray matter and white matter diffusion in stroke: diffusion-tensorMR imaging in 12 patients. Radiology 2000;215:211–220.
51. Sorensen A, Wu O, Copen W, et al. Human acute cerebral isch-emia: detection of changes in water diffusion anisotropy by usingMR imaging. Radiology 1999;212.
52. Kuhn M, Mikulis D, Ayoub D, Kosofsky B, Davis K, Taveras J.Wallerian degeneration after cerebral infarction: evaluation withsequential MR imaging. Radiology 1989;172:179–182.
53. Castillo M, Mukherji S. Early abnormalities related to postinfarc-tion Wallerian degeneration: evaluation with MR diffusion-weighted imaging. J Comput Assist Tomogr 1999;23:1004–1007.
54. Wieshmann U, Symms M, Clark C, et al. Wallerian degeneration inthe optic radiation after temporal lobectomy demonstrated in vivowith diffusion tensor imaging. Epilepsia 1999;40:1155–1158.
55. Werring D, Toosy A, Clark C, et al. Diffusion tensor imaging candetect and quantify corticospinal tract degeneration after stroke.J Neurol Neurosurg Psychiatry 2000;69:269–272.
56. Pierpaoli C, Barnett A, Pajevic S. Water diffusion changes in Wal-lerian Degeneration and their dependence on white matter archi-tecture. Neuroimage 2001;13:1174–1185.
57. Miller D, Grossman R, Reingold S, Mcfarland H. The role of mag-netic resonance techniques in understanding and managing mul-tiple sclerosis. Brain 1998;121:3–24.
58. Werring D, Clark C, Barker G, et al. Diffusion tensor imaging oflesions and normal-appearing white matter in multiple sclerosis.Neurology 1999;52:1626–1632.
59. Tievsky A, Ptak T, Farkas J. Investigation of apparent diffusioncoefficient and diffusion tensor anisotropy in acute and chronicmultiple sclerosis lesions. AJNR Am J Neuroradiol 1999;20:1491–1499.
60. Bammer R, Augustin M, Strasser-Fuchs S, et al. Magnetic reso-nance diffusion tensor imaging for characterizing diffuse and focalwhite matter abnormalities in multiple sclerosis. Magn Reson Med2000;44:583–591.
61. Filippi M, Cercignani M, Inglese M, Horsfield M, Comi G. Diffusiontensor magnetic resonance imaging in multiple sclerosis. Neurol-ogy 2001;56:304–311.
62. Ciccarelli O, Werring D, Wheeler-Kingshott C, et al. Investigationof MS normal-appearing brain using diffusion tensor MRI withclinical correlations. Neurology 2001;56:926–933.
63. Cercignani M, Inglese M, Pagani E, Comi G, Filippi M. Meandiffusivity and fractional anisotropy histograms of patients withmultiple sclerosis. AJNR Am J Neuroradiol 2001;22:952–958.
64. Iannucci G, Rovaris M, Giacomotti L, Comi G, Filippi M. Correla-tion of multiple sclerosis measures derived from T2-weighted,T1-weighted, magnetization transfer, and diffusion tensor MR im-aging. AJNR Am J Neuroradiol 2001;22:1462–1467.
65. Guo A, Jewells V, Provenzale J. Analysis of normal-appearingwhite matter in multiple sclerosis: comparison of diffusion tensorMR imaging and magnetization transfer imaging. AJNR Am JNeuroradiol 2001;22:1893–1900.
66. Guo A, MacFall J, Provenzale J. Multiple sclerosis: diffusion ten-sor MR imaging for evaluation of normal-appearing white matter.Radiology 2002;222:729–736.
67. Rovaris M, Bozzali M, Iannucci G, et al. Assessment of normal-appearing white and gray matter in patients with primary progres-sive multiple sclerosis: a diffusion-tensor magnetic resonance im-aging study. Arch Neurol 2002;59:1406–1412.
68. Bozzali M, Cercignani M, Sormani M, Comi G, Filippi M. Quanti-fication of brain gray matter damage in different MS phenotypesby use of diffusion tensor MR imaging. AJNR Am J Neuroradiol2002;23:985–988.
69. Cercignani M, Bozzali M, Iannucci G, Comi G, Filippi M. Intra-voxel and inter-voxel coherence in patients with multiple sclerosisassessed using diffusion tensor MRI. J Neurol 2002;249:875–883.
70. Engel J Jr, Shewmon D. Overview: who should be considered asurgical candidate? In Engel J Jr, editor. Surgical treatment of theepilepsies. 2nd edition. New York: Raven Press, 1993; p 23–24.
71. Brooks B, King D, Gammal T, et al. MR imaging in patients withintractable complex partial epileptic seizures. AJNR Am J Neuro-radiol 1990;11:93–99.
72. Tien R, Felsberg G, Castro C, et al. Complex partial seizure andmesial temporal sclerosis: evaluation with fast spin-echo MR im-aging. Radiology 1993;189:835–842.
73. Hugg J, Butterworth E, Kuzniecky R. Diffusion mapping appliedto mesial temporal lobe epilepsy. Preliminary observation. Neurol-ogy 1999;53:173–176.
74. Wieshmann U, Clark C, Symms M, Barker G, Birnie K, Shorvon S.Water diffusion in the human hippocampus in epilepsy. MagnReson Imaging 1999;17:29–36.
75. Yoo S, Chang K, Song I, et al. Apparent diffusion coefficient valueof the hippocampus in patients with hippocampal sclerosis and inhealthy volunteers. AJNR Am J Neuroradiol 2002;23:809–812.
76. Eriksson S, Rugg-Gunn F, Symms M, Barker G, Duncan J. Dif-fusion tensor imaging in patients with epilepsy and malformationsof cortical development. Brain 2001;124:617–626.
77. Fugg-Gunn F, Eriksson S, Symms M, et al. Diffusion tensor im-aging of cryptogenic and acquired partial epilepsies. Brain 2001;124:627–636.
78. Arfanakis K, Hermann B, Rogers B, Carew J, Seidenberg M,Meyerand M. Diffusion tensor MRI in temporal lobe epilepsy.Magn Reson Imaging 2002;20:511–519.
79. Kendall B. Disorders of lysosomes, peroxisomes, and mitochon-dria. AJNR Am J Neuroradiol 1992;13:621–653.
80. Ito R, Melhem E, Mori S, Eichler F, Raymond G, Moser H. Diffu-sion tensor brain MR imaging in X-linked cerebral adrenoleu-kodystrophy. Neurology 2001;56:544–547.
81. Eichler F, Itoh R, Barker P, et al. Proton MR spectroscopic anddiffusion tensor brain MR imaging in X-linked adrenoleukodystro-phy: initial experience. Radiology 2002;225:245–252.
Clinical Applications of Diffusion Tensor Imaging 17

82. Guo A, Petrella J, Kurtzberg J, et al. Evaluation of white matteranisotropy in Krabbe disease with diffusion tensor MR imaging:initial experience. Radiology 2001;218:809–815.
83. Schaumburg H, Powers J, Raine C, Suzuki K, Richardson E.Adrenoleukodystrophy: a clinical and pathological study of 17cases. Arch Neurol 1975;32:577–591.
84. Ono J, Harada K, Takahashi M, et al. Differentiation betweendysmyelination and demyelination using magnetic resonance dif-fusional anisotropy. Brain Res 1995;671:141–148.
85. Ono J, Harada K, Mano T, Sakurai K, Okada S. Differentiation ofdys- and demyelination using diffusional anisotropy. Pediatr Neu-rol 1997;16:63–66.
86. Legler J, Ries L, Smith M, et al. Cancer surveillance series [cor-rected]: brain and other central nervous system cancers: recenttrends in incidence and mortality. J Natl Cancer Inst 1999;91:1382–1390.
87. Brunberg J, Chenevert T, McKeever P, et al. In vivo MR determi-nation of water diffusion coefficients and diffusion anisotropy:correlation with structural alteration in gliomas of the cerebralhemispheres. AJNR Am J Neuroradiol 1995;16:361–371.
88. Krabbe K, Gideon P, Wagn P, Hansen U, Thomsen C, Madsen F.MR diffusion imaging of human intracranial tumors. Neuroradi-ology 1997;39:483–489.
89. Castillo M, Smith J, Kwock L, Wilber K. Apparent diffusion coef-ficients in the evaluation of high-grade cerebral gliomas. AJNRAm J Neuroradiol 2001;22:60–64.
90. Stadnik T, Chaskis C, Michotte A, et al. Diffusion-weighted MRimaging of intracerebral masses: comparison with conventionalMR imaging and histologic findings. AJNR Am J Neuroradiol 2001;22:969–976.
91. Kono K, Inoue Y, Nakayama K, et al. The role of diffusion-weightedimaging in patients with brain tumors. AJNR Am J Neuroradiol2001;22:1081–1088.
92. Guo A, Cummings T, Dash R, Provenzale J. Lymphomas andhigh-grade astrocytomas: comparison of water diffusibility andhistologic characteristics. Radiology 2002;224:177–183.
93. Sinha S, Bastin M, Whittle I, et al. Diffusion tensor MR imaging ofhigh-grade cerebral gliomas. AJNR Am J Neuroradiol 2002;23:520–527.
94. Bastin M, Sinha S, Whittle I, Wardlaw J. Measurements of waterdiffusion and T1 values in peritumoural oedematous brain. Neu-roreport 2002;13:1335–1340.
95. Gauvain K, McKinstry R, Mukherjee P, et al. Evaluating pediatricbrain tumor cellularity with diffusion-tensor imaging. AJR Am JRoentgenol 2001;177:449–454.
96. Mori S, Frederiksen K, van Zijl P, et al. Brain white matter anat-omy of tumor patients evaluated with diffusion tensor imaging.Ann Neurol 2002;51:377–380.
97. Chenevert T, McKeever P, Ross B. Monitoring early response ofexperimental brain tumors to therapy using diffusion magneticresonance imaging. Clin Cancer Res 1997;3:1457–1466.
98. Chenevert T, Stegman L, Taylor J, et al. Diffusion magnetic reso-nance imaging: an early surrogate marker of therapeutic efficacyin brain tumors. J Natl Cancer Inst 2000;92:2029–2036.
99. Mardor Y, Pfeffer R, Spiegelmann R, et al. Early detection of re-sponse to radiation therapy in patients with brain malignanciesusing conventional and high b-value diffusion-weighted magneticresonance imaging. J Clin Oncol 2003;21:1094–1100.
100. Dzik-Jurasz A, Domenig C, George M, et al. Diffusion MRI forprediction of response of rectal cancer to chemoradiation. Lancet2002;360:307–308.
18 Dong et al.
Related Documents