VOL. 17, NO. 12 15 JUNE 2004 JOURNAL OF CLIMATE q 2004 American Meteorological Society 2261 Climatology of the Low-Level Jet East of the Andes as Derived from the NCEP–NCAR Reanalyses: Characteristics and Temporal Variability JOSE A. MARENGO AND WAGNER R. SOARES CPTEC/INPE, Sa ˜o Paulo, Brazil CELESTE SAULO AND MATILDE NICOLINI CIMA/University of Buenos Aires, Buenos Aires, Argentina (Manuscript received 15 January 2003, in final form 14 January 2004) ABSTRACT A climatology of the South American low-level jet east of the Andes (SALLJ) is developed using the 1950– 2000 circulation and moisture fields from the NCEP–NCAR reanalyses and available upper-air observations made in Bolivia and Paraguay since 1998. Upper- and low-level circulation fields were derived for seasonal means and SALLJ composites during the warm and cold seasons. The Bonner criterion 1 was applied for sites in central Bolivia and downstream near northern Paraguay, to determine the spatial and temporal characteristics of the SALLJ. On the circulation characteristics, SALLJ composites during the warm season show the enhanced low-level meridional moisture transport coming from equatorial South America as well as an upper-level wave train emanating from the west Pacific propagating toward South America. The intensification of the warm season SALLJ follows the establishment of an upper-level ridge over southern Brazil and a trough over most of Argentina. The circulation anomalies at upper and lower levels suggest that the intensification of the SALLJ would lead to an intensification of the South Atlantic convergence zone (SACZ) later on and to the penetration of cold fronts with an area of enhanced convection ahead at the exit region of the SALLJ. Regarding the time variability, the SALLJ seems to occur all year long, bringing tropical moist air masses from the Amazon into southern Brazil–northern Argentina more frequently in the warm season, and bringing tropical maritime air, which is less humid than the tropical air masses coming from the subtropical Atlantic high, more frequently during the cold season. SALLJs are detected mostly during the warm season to the north of ;208S, while to the south the SALLJs seem to occur all year long. The diurnal cycle shows that SALLJs are more frequent and intense between 0600 and 1200 UTC for the warm season north of 208S, while at the region downstream the maximum is detected between 0000 and 0600 UTC during the cold season. At interannual time scales, even though there is a weak tendency for stronger and more frequent warm season SALLJ episodes in years with anomalously warm surface waters in the tropical Pacific, it cannot be affirmed with a large degree of certainty that there is a strong relationship between the occurrence of El Nin ˜o events and the number and/ or intensity of SALLJ episodes. However, the 1998 El Nin ˜o featured more frequent and intense warm season jet episodes than occurred during the 1999 La Nin ˜a, and this has been demonstrated by the reanalyses, the available Pan American Climate Studies-Sound Network (PACS-SONET) upper-air observations, and by other studies using independent datasets and regional modeling. 1. Introduction The low-level jet (LLJ) represents a wind maximum situated within the lowest 1–2 km, which sometimes exhibits a horizontal extent of subsynoptic dimensions and often has strong diurnal oscillations. The LLJ rep- resents a relevant feature of the warm season low-level circulation and represents a poleward transport of warm and moist air concentrated in a relatively narrow region, with strong wind speeds at low levels downstream and Corresponding author address: Dr. Jose A. Marengo, CPTEC/ INPE, Rodovia Presidente Dutra KM 40, Cachoeira Paulista, Sa ˜o Paulo 12630-000, Brazil. E-mail: [email protected] to the east of mountain barriers, as documented in earlier studies for various regions of the world (Means 1952, 1954; Blackadar 1957; Bonner 1968; Stensrud 1996; Whiteman et al. 1997). For the Americas, the first climatology of the low- level jet was implemented in the United States by Bon- ner (1968) and later updated by Whiteman et al. (1997). They identified that the LLJ occurred most frequently over the Great Plains east of the Rocky Mountains, with significant diurnal and seasonal variations: more LLJs episodes in early morning soundings than in the after- noon soundings, and more episodes in the warm Au- gust–September season as well. The South American LLJ east of the Andes (SALLJ) has been characterized as a narrow stream that channels the near-surface flow

Welcome message from author
This document is posted to help you gain knowledge. Please leave a comment to let me know what you think about it! Share it to your friends and learn new things together.
Transcript
VOL. 17, NO. 12 15 JUNE 2004J O U R N A L O F C L I M A T E
q 2004 American Meteorological Society 2261
Climatology of the Low-Level Jet East of the Andes as Derived from the NCEP–NCARReanalyses: Characteristics and Temporal Variability
JOSE A. MARENGO AND WAGNER R. SOARES
CPTEC/INPE, Sao Paulo, Brazil
CELESTE SAULO AND MATILDE NICOLINI
CIMA/University of Buenos Aires, Buenos Aires, Argentina
(Manuscript received 15 January 2003, in final form 14 January 2004)
ABSTRACT
A climatology of the South American low-level jet east of the Andes (SALLJ) is developed using the 1950–2000 circulation and moisture fields from the NCEP–NCAR reanalyses and available upper-air observationsmade in Bolivia and Paraguay since 1998. Upper- and low-level circulation fields were derived for seasonalmeans and SALLJ composites during the warm and cold seasons. The Bonner criterion 1 was applied for sitesin central Bolivia and downstream near northern Paraguay, to determine the spatial and temporal characteristicsof the SALLJ. On the circulation characteristics, SALLJ composites during the warm season show the enhancedlow-level meridional moisture transport coming from equatorial South America as well as an upper-level wavetrain emanating from the west Pacific propagating toward South America. The intensification of the warm seasonSALLJ follows the establishment of an upper-level ridge over southern Brazil and a trough over most of Argentina.The circulation anomalies at upper and lower levels suggest that the intensification of the SALLJ would leadto an intensification of the South Atlantic convergence zone (SACZ) later on and to the penetration of coldfronts with an area of enhanced convection ahead at the exit region of the SALLJ.
Regarding the time variability, the SALLJ seems to occur all year long, bringing tropical moist air massesfrom the Amazon into southern Brazil–northern Argentina more frequently in the warm season, and bringingtropical maritime air, which is less humid than the tropical air masses coming from the subtropical Atlantichigh, more frequently during the cold season. SALLJs are detected mostly during the warm season to the northof ;208S, while to the south the SALLJs seem to occur all year long. The diurnal cycle shows that SALLJsare more frequent and intense between 0600 and 1200 UTC for the warm season north of 208S, while at theregion downstream the maximum is detected between 0000 and 0600 UTC during the cold season. At interannualtime scales, even though there is a weak tendency for stronger and more frequent warm season SALLJ episodesin years with anomalously warm surface waters in the tropical Pacific, it cannot be affirmed with a large degreeof certainty that there is a strong relationship between the occurrence of El Nino events and the number and/or intensity of SALLJ episodes. However, the 1998 El Nino featured more frequent and intense warm seasonjet episodes than occurred during the 1999 La Nina, and this has been demonstrated by the reanalyses, theavailable Pan American Climate Studies-Sound Network (PACS-SONET) upper-air observations, and by otherstudies using independent datasets and regional modeling.
1. Introduction
The low-level jet (LLJ) represents a wind maximumsituated within the lowest 1–2 km, which sometimesexhibits a horizontal extent of subsynoptic dimensionsand often has strong diurnal oscillations. The LLJ rep-resents a relevant feature of the warm season low-levelcirculation and represents a poleward transport of warmand moist air concentrated in a relatively narrow region,with strong wind speeds at low levels downstream and
Corresponding author address: Dr. Jose A. Marengo, CPTEC/INPE, Rodovia Presidente Dutra KM 40, Cachoeira Paulista, SaoPaulo 12630-000, Brazil.E-mail: [email protected]
to the east of mountain barriers, as documented in earlierstudies for various regions of the world (Means 1952,1954; Blackadar 1957; Bonner 1968; Stensrud 1996;Whiteman et al. 1997).
For the Americas, the first climatology of the low-level jet was implemented in the United States by Bon-ner (1968) and later updated by Whiteman et al. (1997).They identified that the LLJ occurred most frequentlyover the Great Plains east of the Rocky Mountains, withsignificant diurnal and seasonal variations: more LLJsepisodes in early morning soundings than in the after-noon soundings, and more episodes in the warm Au-gust–September season as well. The South AmericanLLJ east of the Andes (SALLJ) has been characterizedas a narrow stream that channels the near-surface flow
2262 VOLUME 17J O U R N A L O F C L I M A T E
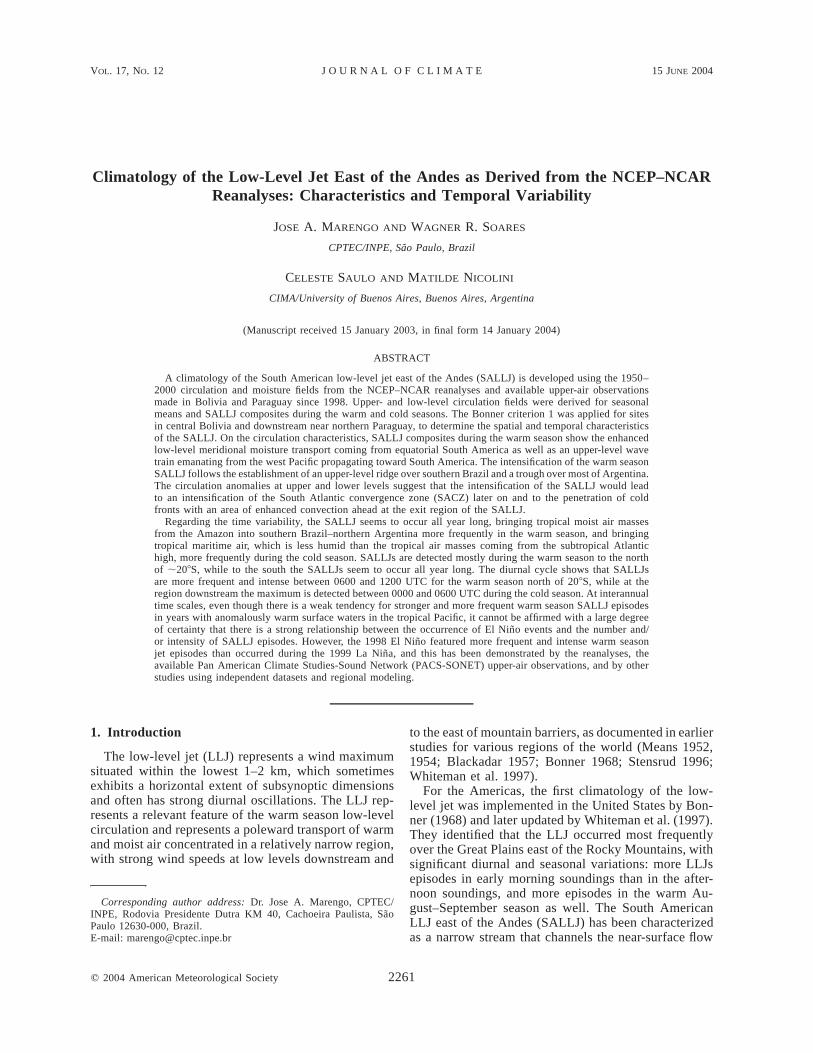
FIG. 1. Conceptual model of the SALLJ east of the Andes.
between the Tropics and midlatitudes east of the moun-tain range. The SALLJ is related to moisture transportfrom the Amazon region into the fertile lands of south-ern Brazil–northern Argentina and was identified instudies during the 1980s and 1990s based on a fewrawinsonde observations for short-term periods or in-dividual case studies (Virji 1981; Inzunza and Berri1980; Berri and Inzunza 1993; Sugahara et al. 1994;Douglas et al. 1999). Recent work based on the NationalCenters for Environmental Prediction–National Centerfor Atmospheric Research (NCEP–NCAR) and Euro-pean Centre for Medium-Range Weather Forecasts(ECMWF) have identified some of the circulation andmoisture transport features of the low-level circulationeast of the Andes, suggesting an active role for theSALLJ in the positioning and intensity of the SouthAtlantic convergence zone (SACZ) and the rainfall andconvection at the exit region of the jet in southeasternSouth America (Nogues-Paegle and Mo 1997; Seluchiand Marengo 2000; Berbery and Collini 2001; Mo andPaegle 2001; Berbery and Barros 2002; Nogues-Paegleet al. 2002; Cazes-Boezio et al. 2003, and referencestherein). Simulations of the SALLJ using global andregional model have shown the basic low-level circu-lation and rainfall features detected in previous obser-
vational studies (Saulo et al. 2000; Misra et al. 2000;Nicolini et al. 2002; Vernekar et al. 2003; Berbery andCollini 2000).
Figure 1 shows a conceptual model of the SALLJ asa component of the South American monsoon system.It illustrates the moisture transport coming from the Am-azon–tropical North Atlantic region by the trade winds,the change in direction of the near-surface flow fromnortheast to southeast once it encounters the Andes, theconvergence of this southeastern flow with the north-west stream coming from the subtropical Atlantic hightoward the southern Brazil–northern Argentina regionat the exit region of the jet, and the development ofconvective activity and rain at the exit region of the jetin southeastern South America over the La Plata Riverbasin. The moisture transport is enriched by the evapo-transpiration from Amazonia. The conceptual modelalso shows the effects of the topography in the SALLJthrough dry and moist processes; the impact of the en-ergy balance terms (sensible and latent heat) releasedfrom the Bolivian plateau while the near-surface heatlow is important in terms of the impacts of transientsin the SALLJ [see reviews in Paegle et al. (2001) andNogues-Paegle et al. (2002)]. The present study con-centrates on the circulation, convection, and moisture
15 JUNE 2004 2263M A R E N G O E T A L .
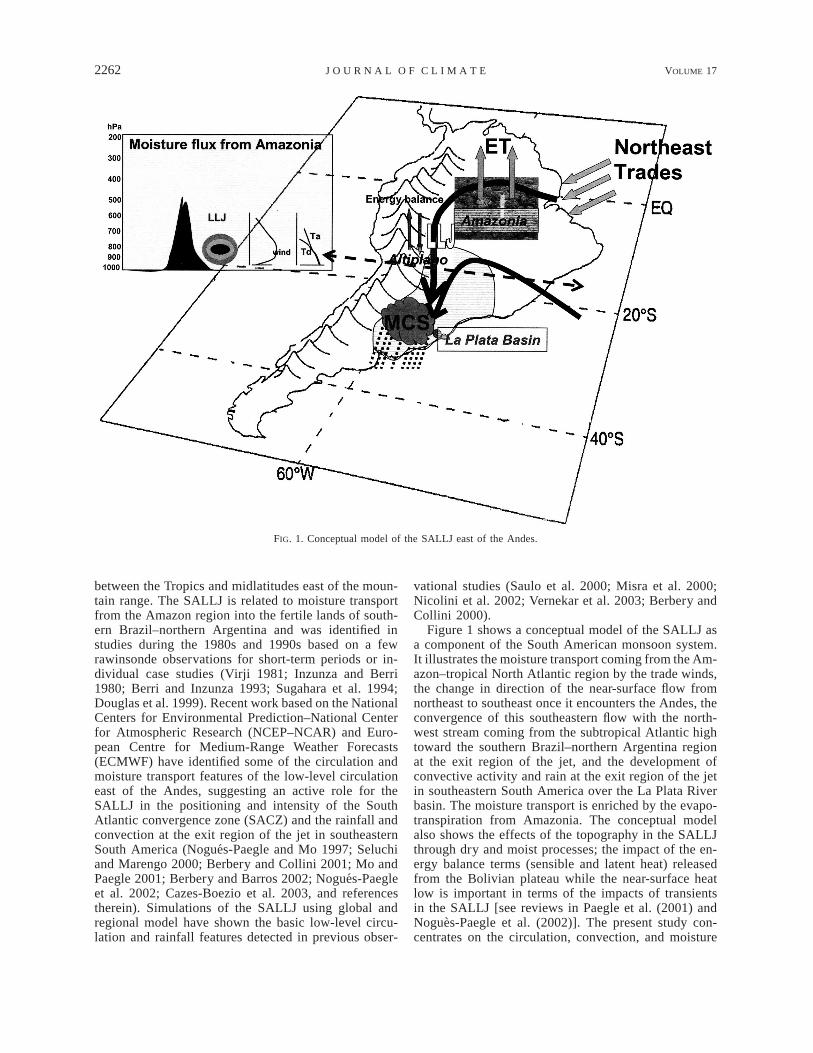
FIG. 2. Annual cycle of number of cases verifying SALLJ Bonner criterion 1. PACS-SONET and upper-air stations are shown by dots atthe core and the exit region of the jet. Solid gray arrow shows the trajectory of tropical moist air coming from Amazonia, and the dottedgray arrow shows the trajectory of subtropical air from the subtropical Atlantic high. The cases were verified using the NCEP–NCARreanalyses at the grid box closest to the stations.
transport components of the SALLJ from this concep-tual model.
The SALLJ’s variability in time and space is rela-tively poorly understood because the limited availabilityof the upper-air observational network in South Americaeast of the Andes seems to be unsuitable for capturingthe occurrence of the low-level jet and its horizontalextension and intensity or temporal variability. Becauseof the limited observational verification, the reanalyseshave by necessity been taken as a reasonable approxi-mation of the true atmospheric state over South Americaeast of the Andes.
With the availability of upper-air observations fromthe Pan American Climate Studies-Sounding Network(PACS-SONET) pilot balloon network for Santa Cruz,Bolivia, since 1998 (Douglas et al. 1998, 1999, 2000),and the implementation of the Large-Scale Biosphere–Atmosphere Experiment in Amazonia–Tropical RainfallMeasuring Mission (LBA–TRMM) field campaign dur-
ing the austral summer of 1999 (Silva Dias et al. 2002;Marengo et al. 2002; Nieto Ferreira et al. 2003), ad-ditional rawinsonde observations in Santa Cruz havemade possible the identification of some observed fea-tures of the vertical structure and diurnal variability ofthe SALLJ. Studies for individual cases during the aus-tral summers of 1998 and 1999 have allowed for thedetection of some important characteristics of theSALLJ. A maximum northwesterly flow below 3 kmthat can reach up to 30 m s21 with a late afternoonmaximum, was observed (based on twice-a-day obser-vations). In comparison, Douglas et al. (1998) usingregional Eta Model results showed a marked diurnalcycle with an evening maximum. Therefore, the SALLJexhibits important observational features that still re-main unexplored, among them its time variability.
The present study introduces a climatology of SALLJepisodes during the period 1950–2000 using the NCEP–NCAR reanalyses. The analysis focuses on the warm
2264 VOLUME 17J O U R N A L O F C L I M A T E
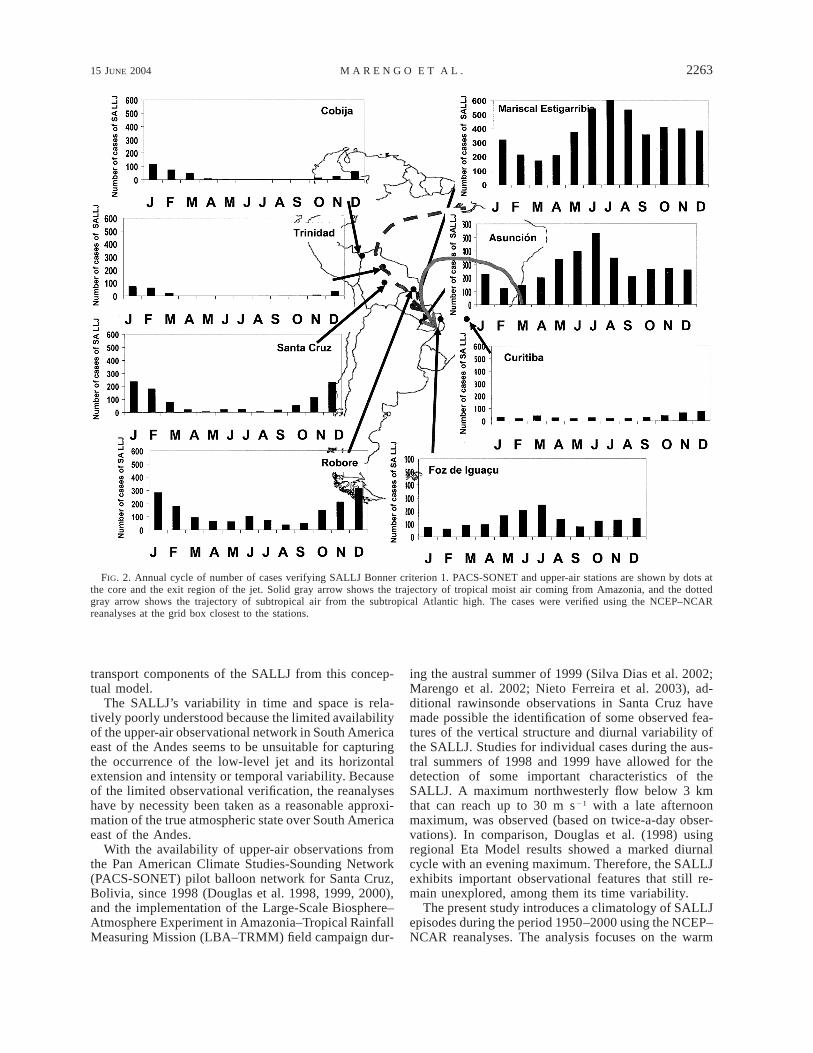
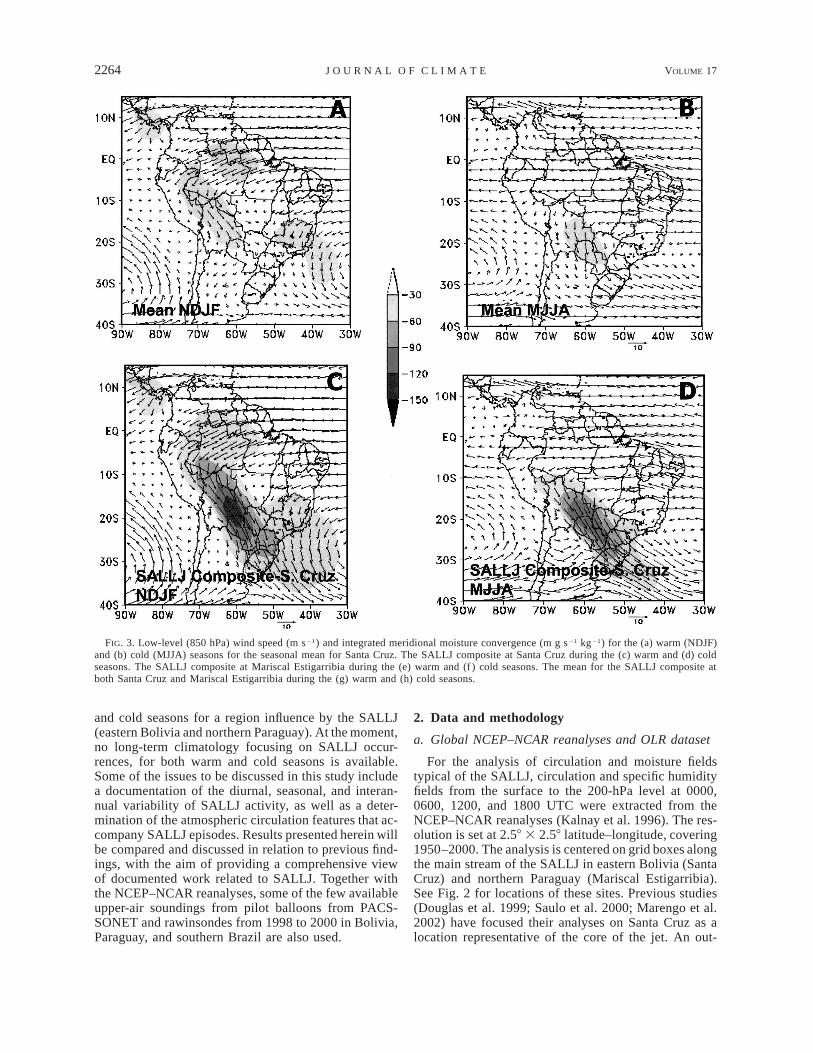
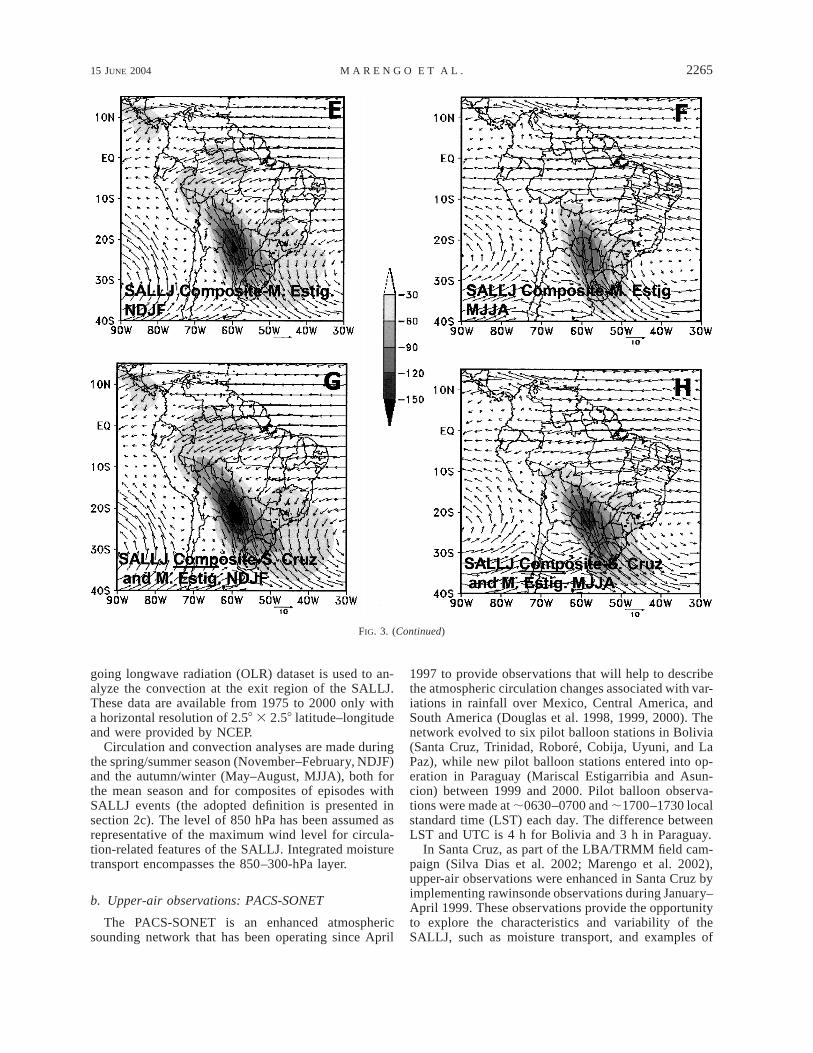
FIG. 3. Low-level (850 hPa) wind speed (m s21) and integrated meridional moisture convergence (m g s21 kg21) for the (a) warm (NDJF)and (b) cold (MJJA) seasons for the seasonal mean for Santa Cruz. The SALLJ composite at Santa Cruz during the (c) warm and (d) coldseasons. The SALLJ composite at Mariscal Estigarribia during the (e) warm and (f ) cold seasons. The mean for the SALLJ composite atboth Santa Cruz and Mariscal Estigarribia during the (g) warm and (h) cold seasons.
and cold seasons for a region influence by the SALLJ(eastern Bolivia and northern Paraguay). At the moment,no long-term climatology focusing on SALLJ occur-rences, for both warm and cold seasons is available.Some of the issues to be discussed in this study includea documentation of the diurnal, seasonal, and interan-nual variability of SALLJ activity, as well as a deter-mination of the atmospheric circulation features that ac-company SALLJ episodes. Results presented herein willbe compared and discussed in relation to previous find-ings, with the aim of providing a comprehensive viewof documented work related to SALLJ. Together withthe NCEP–NCAR reanalyses, some of the few availableupper-air soundings from pilot balloons from PACS-SONET and rawinsondes from 1998 to 2000 in Bolivia,Paraguay, and southern Brazil are also used.
2. Data and methodology
a. Global NCEP–NCAR reanalyses and OLR dataset
For the analysis of circulation and moisture fieldstypical of the SALLJ, circulation and specific humidityfields from the surface to the 200-hPa level at 0000,0600, 1200, and 1800 UTC were extracted from theNCEP–NCAR reanalyses (Kalnay et al. 1996). The res-olution is set at 2.58 3 2.58 latitude–longitude, covering1950–2000. The analysis is centered on grid boxes alongthe main stream of the SALLJ in eastern Bolivia (SantaCruz) and northern Paraguay (Mariscal Estigarribia).See Fig. 2 for locations of these sites. Previous studies(Douglas et al. 1999; Saulo et al. 2000; Marengo et al.2002) have focused their analyses on Santa Cruz as alocation representative of the core of the jet. An out-
15 JUNE 2004 2265M A R E N G O E T A L .
FIG. 3. (Continued)
going longwave radiation (OLR) dataset is used to an-alyze the convection at the exit region of the SALLJ.These data are available from 1975 to 2000 only witha horizontal resolution of 2.58 3 2.58 latitude–longitudeand were provided by NCEP.
Circulation and convection analyses are made duringthe spring/summer season (November–February, NDJF)and the autumn/winter (May–August, MJJA), both forthe mean season and for composites of episodes withSALLJ events (the adopted definition is presented insection 2c). The level of 850 hPa has been assumed asrepresentative of the maximum wind level for circula-tion-related features of the SALLJ. Integrated moisturetransport encompasses the 850–300-hPa layer.
b. Upper-air observations: PACS-SONET
The PACS-SONET is an enhanced atmosphericsounding network that has been operating since April
1997 to provide observations that will help to describethe atmospheric circulation changes associated with var-iations in rainfall over Mexico, Central America, andSouth America (Douglas et al. 1998, 1999, 2000). Thenetwork evolved to six pilot balloon stations in Bolivia(Santa Cruz, Trinidad, Robore, Cobija, Uyuni, and LaPaz), while new pilot balloon stations entered into op-eration in Paraguay (Mariscal Estigarribia and Asun-cion) between 1999 and 2000. Pilot balloon observa-tions were made at ;0630–0700 and ;1700–1730 localstandard time (LST) each day. The difference betweenLST and UTC is 4 h for Bolivia and 3 h in Paraguay.
In Santa Cruz, as part of the LBA/TRMM field cam-paign (Silva Dias et al. 2002; Marengo et al. 2002),upper-air observations were enhanced in Santa Cruz byimplementing rawinsonde observations during January–April 1999. These observations provide the opportunityto explore the characteristics and variability of theSALLJ, such as moisture transport, and examples of
2266 VOLUME 17J O U R N A L O F C L I M A T E
some jet case studies detected during summer and au-tumn 1999 are described in Marengo et al. (2002) andMarengo and Soares (2002).
c. Methodology: Identification of LLJ
The Bonner criterion 1 is applied to PACS-SONETupper-air stations and to the NCEP–NCAR reanalysesfor grid boxes closest to PACS-SONET sites in SantaCruz and Mariscal Estigarribia (Fig. 2). The sites areideally suited for SALLJ research because they are lo-cated near the core of the stream. These are the con-ditions that must be met to detect a low-level jet: 1)northerly 850-hPa winds with speeds equal or largerthan 12 m s21, 2) a vertical wind shear larger or equalthan 6 m s21 between 850 and 700 hPa, and 3) a Me-ridional component larger than the zonal component,and with the meridional winds from the north, in orderto exclude southerly wind events. The criterion of se-lecting the 850-hPa level is less restrictive than the 925-hPa level and has been used in previous studies onSALLJ (Li and Le Treut 1999; Salio et al. 2002; Sauloet al. 2000; Marengo et al. 2002; Marengo and Soares2002); in addition, strong jet episodes can exhibit in-tense near-surface winds that can be detected both at850 and 925 hPa. Observations from the PACS-SONETsounding network from Santa Cruz during the 1998 ob-servations (Douglas et al. 1998; Saulo et al. 2000; Ma-rengo et al. 2002) have identified SALLJ episodes withwind speeds of up to 30 m s21 in the northwesterly flowaround 850 hPa.
Some concerns over the use of the NCEP–NCARreanalyses for studies on spatial variability and the fre-quency of the SALLJ have been raised by Berbery andBarros (2002), suggesting that the global reanalyses areperhaps not the best datasets to use when examining aphenomenon like the SALLJ, which has mesoscale char-acteristics, and they point out the risk of using data thatis affected by the global model that generates the re-analyses (regions with poor data coverage). However,some useful information regarding circulation charac-teristics and moisture transports can still be extractedfrom the reanalyses, and long-term climatologies canonly be derived from datasets like this. The lack ofupper-air observations precludes the selection of an ad-equate criterion at this stage; therefore, the Bonner cri-terion may be arbitrary. In any case, we have adoptedit given its generalized use in previous work and forclimatological purposes in the identification of low-leveljets.
Once the episodes of the SALLJ are identified in thefour times daily NCEP–NCAR reanalyses using Bonnercriterion 1, we then average all of these cases during1950–2000 to implement the mean seasonal fields forthe warm season (NDJF) in Santa Cruz and for the coldseason (MJJA) in Mariscal Estigarribia. Then we formcomposites of SALLJ episodes by integrating all casesthat meet Bonner criterion 1. Spatial and temporal var-
iabilities for the warm and cold season circulations inSouth America are discussed for the seasonal mean andfor the SALLJ composites. For individual SALLJ casestudies, comparisons are made between wind profilesobtained from the reanalyses and those from the avail-able upper-air observations at Santa Cruz and MariscalEstigarribia.
3. Low-level jet spatial and temporal variability
In this section we describe the geographical extent,and the lower- and upper-level circulation characteristicsassociated with the SALLJ east of the Andes, as wellas its time variability, during the warm and cold seasons.The analysis is focused on the mean circulation and forcomposites of SALLJ events in the two seasons. Fo-cusing on Santa Cruz during the warm season NDJF,from the total of 24 532 wind occurrences detected from1950 to 2000, a subtotal of 764 cases exhibited a low-level jet, suggesting that from the total of wind occur-rences during this period and season, roughly 3% fea-tured a low-level jet.
a. Geographical distribution of SALLJ wind andmoisture fields during summer and winter
Figure 2 shows the number of cases of SALLJ eventsalong the region of the jet to the east of the Andes asderived from the NCEP–NCAR reanalyses, indicatingthat the SALLJ annual cycle depends on the latitude,the proximity to the Andes, and the circulation featuresduring those seasons. In general SALLJ episodes canbe detected during the entire year, as compared to thesummertime-only LLJ in the U.S. Great Plains as iden-tified in Berbery and Barros (2002).
At lower latitudes, the seasonal cycle shows thatSALLJ occurrences peak during warm months, whilesouth of Mariscal Estigarribia (208S) there are more jetepisodes detected during the cold season. This is a firstindication that the mechanisms organizing the low-leveljets at these latitudes during both warm and cold seasonsmay not be the same. There may be SALLJ episodesdetected during the warm season in Santa Cruz that maynot show at Mariscal Estigarribia, and on a few occa-sions SALLJs are detected in Santa Cruz and MariscalEstigarribia with just a few hours of difference. The factthe there are more SALLJ episodes detected during theautumn/cold seasons in Mariscal Estigarribia as com-pared to Santa Cruz is something that deserves specialattention and will be discussed later on.
The mean low-level circulation during the warm andcold seasons (Figs. 3a,b) shows features similar to thoseidentified in previous studies (Rao et al. 1996; Garreaudand Wallace 1998; Labraga et al. 2000; Salio et al. 2002;Berbery and Barros 2002). The mean 850-hPa circu-lation and vertically integrated moisture flux from Fig.3a shows that the warm season is characterized by strongnortheast trade winds near the equator, which veer to
15 JUNE 2004 2267M A R E N G O E T A L .
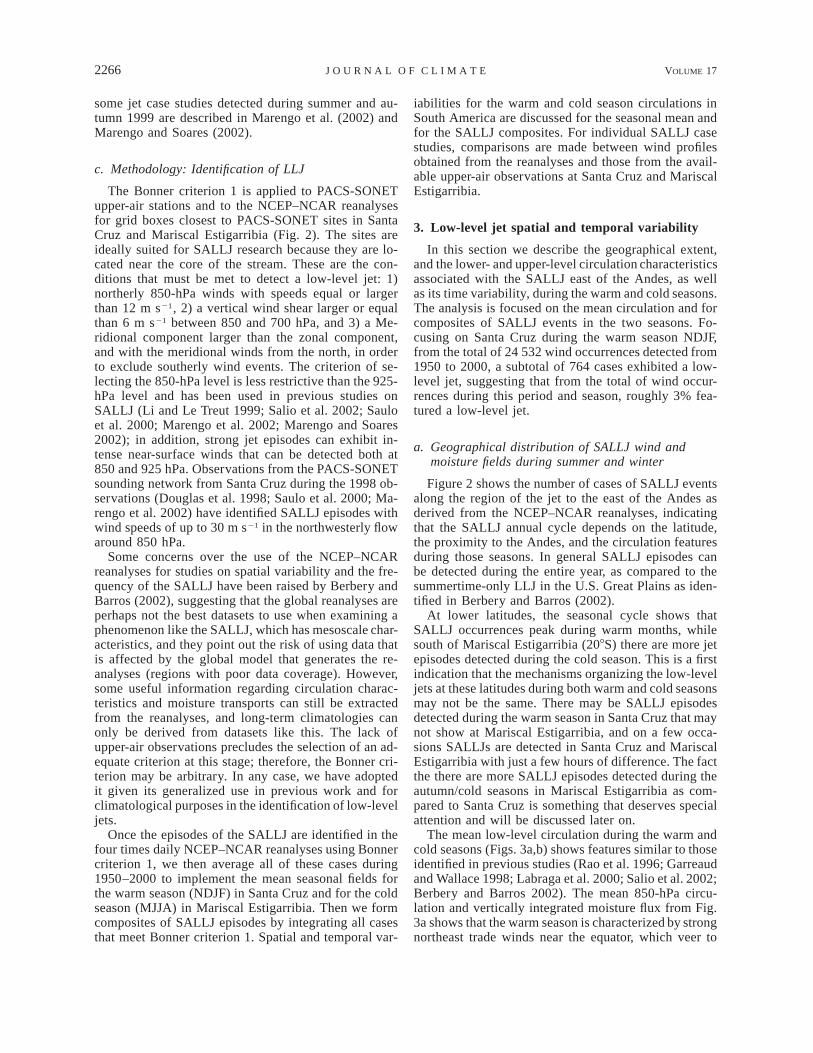
FIG. 4. OLR fields during the warm season for the 1975–2000 period: (a) mean field, (b) SALLJ composite for both Santa Cruz andMariscal Estigarribia simultaneously, and (c) the anomaly (b) 2 (a). Units are in W m22.
the southwest as they approach the Andes, producing amaximum in the northwesterly flow nearby Santa Cruz(;17.58S), while another maximum occurs at approx-imately 208S, associated with the subtropical Atlantichigh and the Brazilian Planalto. Figure 3b shows the850-hPa circulation for the cold season, with the weak-ening of the northeast trades and the irruption of tropicalair, while the strong northerly flow over eastern Boliviaand Paraguay is due to the intensification of synopticeddies in the moisture fluxes, as described in previousstudies (Rao et al. 1996; Labraga et al. 2000; Vera etal. 2002).
Figures 3c and 3d show the mean low-level circu-lation and moisture transport fields for a SALLJ com-posite detected in Santa Cruz for the warm and coldseasons. The warm season SALLJ composite map showsan intensification of the circulation features of the sea-son mean, specifically the enhanced northeast tradesfrom the tropical North Atlantic, the low-level flow eastof the Andes, and the enhanced meridional moisturetransport coming from tropical South America, which
is almost twice the mean of the summer season. In win-ter, while still enhanced, the pattern does not seem tobe as efficient as it is in summer at producing precip-itation with in the continent. Similar figures for SALLJcomposites for Mariscal Estigarribia during the warmand cold seasons (Figs. 3e,f) show a weakening of thenortheast trade winds and moisture transport and a moreconcentrated maximum flux, possibly associated withtransient eddies as suggested by Berbery and Barros(2002) and Vera et al. (2002). Figures 3e and 3f showthe intensification of the winds from the subtropical At-lantic high contributed to the acceleration of the SALLJstream driving moisture directly into the La Plata basin.
The analyses of Figs. 2 and 3a–f show that there mightbe SALLJ episodes detected in Mariscal Estigarribiathat are not detected in Santa Cruz and vice versa. Astrong SALLJ should in principle be detected in bothSanta Cruz and Mariscal Estigarribia, and it is duringthe austral summer when strong SALLJ events are de-tected in both seasons. Therefore, Figs. 3g and 3h showthe circulation fields for a SALLJ composite of episodes
2268 VOLUME 17J O U R N A L O F C L I M A T E
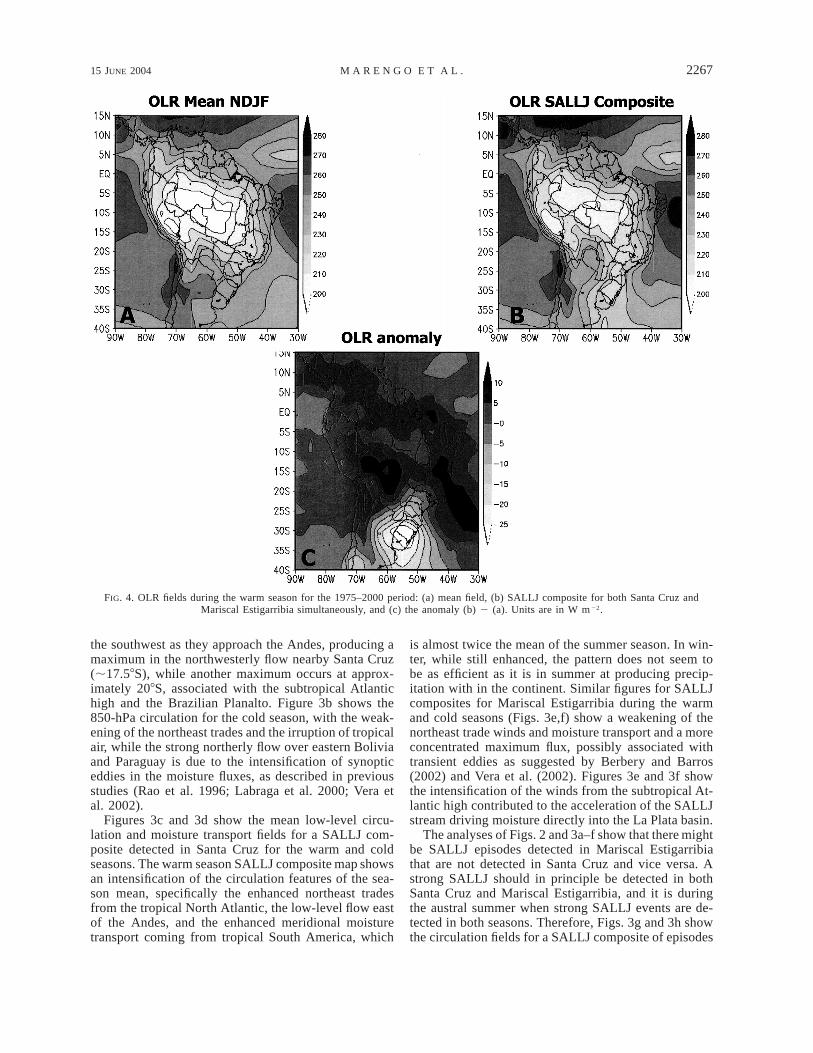
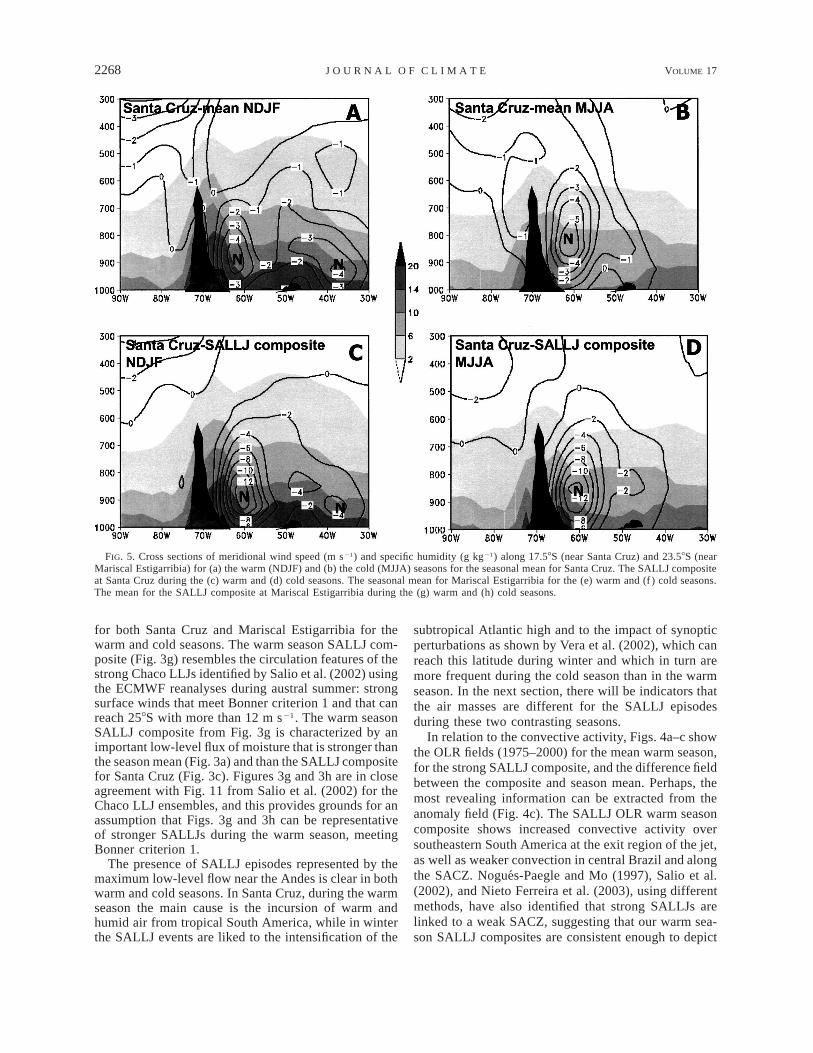
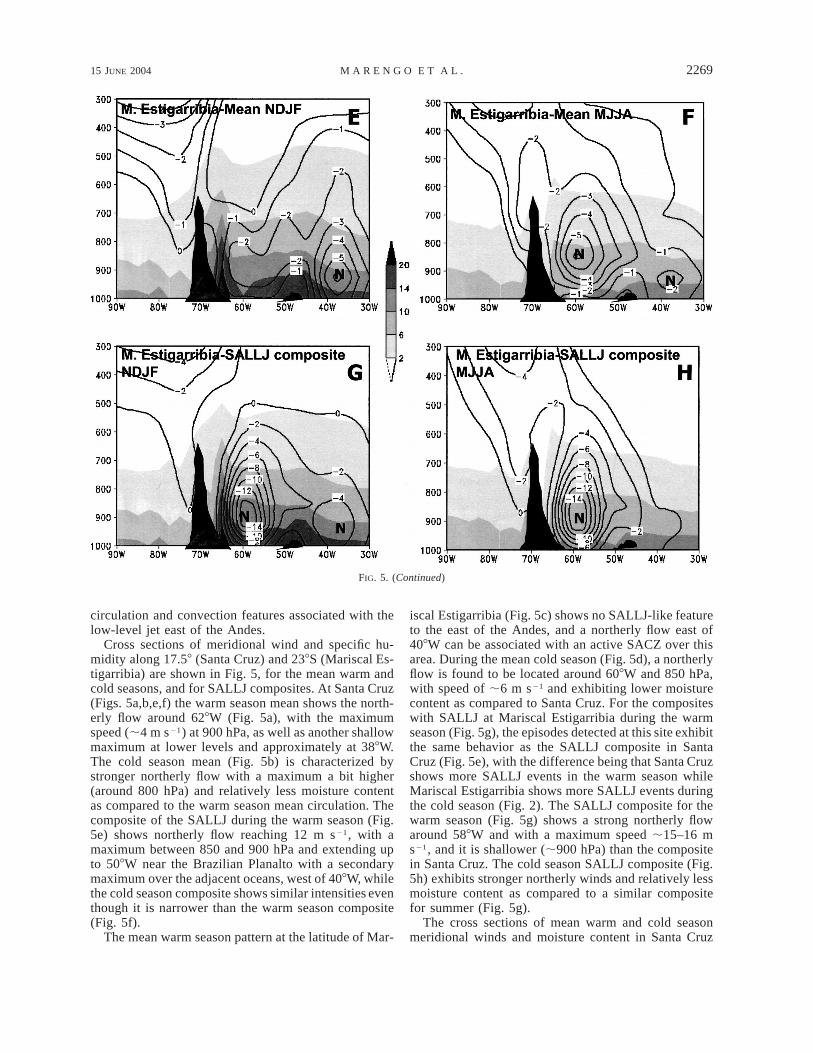
FIG. 5. Cross sections of meridional wind speed (m s21) and specific humidity (g kg21) along 17.58S (near Santa Cruz) and 23.58S (nearMariscal Estigarribia) for (a) the warm (NDJF) and (b) the cold (MJJA) seasons for the seasonal mean for Santa Cruz. The SALLJ compositeat Santa Cruz during the (c) warm and (d) cold seasons. The seasonal mean for Mariscal Estigarribia for the (e) warm and (f ) cold seasons.The mean for the SALLJ composite at Mariscal Estigarribia during the (g) warm and (h) cold seasons.
for both Santa Cruz and Mariscal Estigarribia for thewarm and cold seasons. The warm season SALLJ com-posite (Fig. 3g) resembles the circulation features of thestrong Chaco LLJs identified by Salio et al. (2002) usingthe ECMWF reanalyses during austral summer: strongsurface winds that meet Bonner criterion 1 and that canreach 258S with more than 12 m s21. The warm seasonSALLJ composite from Fig. 3g is characterized by animportant low-level flux of moisture that is stronger thanthe season mean (Fig. 3a) and than the SALLJ compositefor Santa Cruz (Fig. 3c). Figures 3g and 3h are in closeagreement with Fig. 11 from Salio et al. (2002) for theChaco LLJ ensembles, and this provides grounds for anassumption that Figs. 3g and 3h can be representativeof stronger SALLJs during the warm season, meetingBonner criterion 1.
The presence of SALLJ episodes represented by themaximum low-level flow near the Andes is clear in bothwarm and cold seasons. In Santa Cruz, during the warmseason the main cause is the incursion of warm andhumid air from tropical South America, while in winterthe SALLJ events are liked to the intensification of the
subtropical Atlantic high and to the impact of synopticperturbations as shown by Vera et al. (2002), which canreach this latitude during winter and which in turn aremore frequent during the cold season than in the warmseason. In the next section, there will be indicators thatthe air masses are different for the SALLJ episodesduring these two contrasting seasons.
In relation to the convective activity, Figs. 4a–c showthe OLR fields (1975–2000) for the mean warm season,for the strong SALLJ composite, and the difference fieldbetween the composite and season mean. Perhaps, themost revealing information can be extracted from theanomaly field (Fig. 4c). The SALLJ OLR warm seasoncomposite shows increased convective activity oversoutheastern South America at the exit region of the jet,as well as weaker convection in central Brazil and alongthe SACZ. Nogues-Paegle and Mo (1997), Salio et al.(2002), and Nieto Ferreira et al. (2003), using differentmethods, have also identified that strong SALLJs arelinked to a weak SACZ, suggesting that our warm sea-son SALLJ composites are consistent enough to depict
15 JUNE 2004 2269M A R E N G O E T A L .
FIG. 5. (Continued)
circulation and convection features associated with thelow-level jet east of the Andes.
Cross sections of meridional wind and specific hu-midity along 17.58 (Santa Cruz) and 238S (Mariscal Es-tigarribia) are shown in Fig. 5, for the mean warm andcold seasons, and for SALLJ composites. At Santa Cruz(Figs. 5a,b,e,f) the warm season mean shows the north-erly flow around 628W (Fig. 5a), with the maximumspeed (;4 m s21) at 900 hPa, as well as another shallowmaximum at lower levels and approximately at 388W.The cold season mean (Fig. 5b) is characterized bystronger northerly flow with a maximum a bit higher(around 800 hPa) and relatively less moisture contentas compared to the warm season mean circulation. Thecomposite of the SALLJ during the warm season (Fig.5e) shows northerly flow reaching 12 m s21, with amaximum between 850 and 900 hPa and extending upto 508W near the Brazilian Planalto with a secondarymaximum over the adjacent oceans, west of 408W, whilethe cold season composite shows similar intensities eventhough it is narrower than the warm season composite(Fig. 5f).
The mean warm season pattern at the latitude of Mar-
iscal Estigarribia (Fig. 5c) shows no SALLJ-like featureto the east of the Andes, and a northerly flow east of408W can be associated with an active SACZ over thisarea. During the mean cold season (Fig. 5d), a northerlyflow is found to be located around 608W and 850 hPa,with speed of ;6 m s21 and exhibiting lower moisturecontent as compared to Santa Cruz. For the compositeswith SALLJ at Mariscal Estigarribia during the warmseason (Fig. 5g), the episodes detected at this site exhibitthe same behavior as the SALLJ composite in SantaCruz (Fig. 5e), with the difference being that Santa Cruzshows more SALLJ events in the warm season whileMariscal Estigarribia shows more SALLJ events duringthe cold season (Fig. 2). The SALLJ composite for thewarm season (Fig. 5g) shows a strong northerly flowaround 588W and with a maximum speed ;15–16 ms21, and it is shallower (;900 hPa) than the compositein Santa Cruz. The cold season SALLJ composite (Fig.5h) exhibits stronger northerly winds and relatively lessmoisture content as compared to a similar compositefor summer (Fig. 5g).
The cross sections of mean warm and cold seasonmeridional winds and moisture content in Santa Cruz
2270 VOLUME 17J O U R N A L O F C L I M A T E
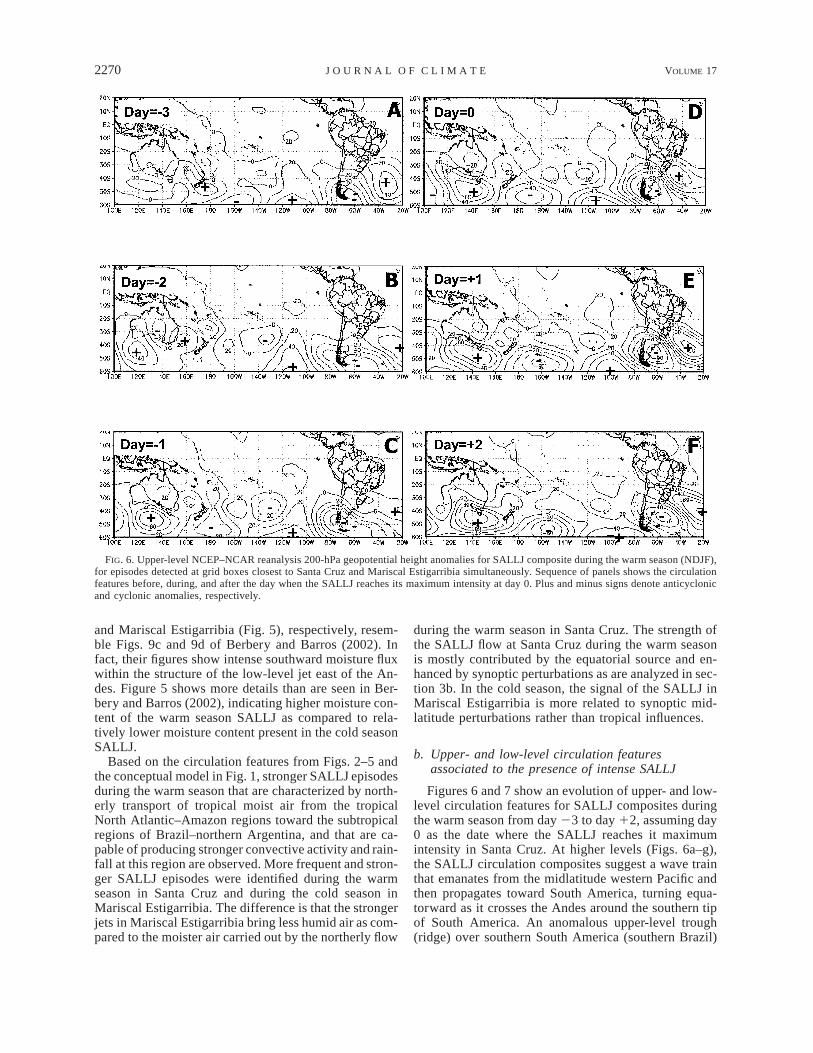
FIG. 6. Upper-level NCEP–NCAR reanalysis 200-hPa geopotential height anomalies for SALLJ composite during the warm season (NDJF),for episodes detected at grid boxes closest to Santa Cruz and Mariscal Estigarribia simultaneously. Sequence of panels shows the circulationfeatures before, during, and after the day when the SALLJ reaches its maximum intensity at day 0. Plus and minus signs denote anticyclonicand cyclonic anomalies, respectively.
and Mariscal Estigarribia (Fig. 5), respectively, resem-ble Figs. 9c and 9d of Berbery and Barros (2002). Infact, their figures show intense southward moisture fluxwithin the structure of the low-level jet east of the An-des. Figure 5 shows more details than are seen in Ber-bery and Barros (2002), indicating higher moisture con-tent of the warm season SALLJ as compared to rela-tively lower moisture content present in the cold seasonSALLJ.
Based on the circulation features from Figs. 2–5 andthe conceptual model in Fig. 1, stronger SALLJ episodesduring the warm season that are characterized by north-erly transport of tropical moist air from the tropicalNorth Atlantic–Amazon regions toward the subtropicalregions of Brazil–northern Argentina, and that are ca-pable of producing stronger convective activity and rain-fall at this region are observed. More frequent and stron-ger SALLJ episodes were identified during the warmseason in Santa Cruz and during the cold season inMariscal Estigarribia. The difference is that the strongerjets in Mariscal Estigarribia bring less humid air as com-pared to the moister air carried out by the northerly flow
during the warm season in Santa Cruz. The strength ofthe SALLJ flow at Santa Cruz during the warm seasonis mostly contributed by the equatorial source and en-hanced by synoptic perturbations as are analyzed in sec-tion 3b. In the cold season, the signal of the SALLJ inMariscal Estigarribia is more related to synoptic mid-latitude perturbations rather than tropical influences.
b. Upper- and low-level circulation featuresassociated to the presence of intense SALLJ
Figures 6 and 7 show an evolution of upper- and low-level circulation features for SALLJ composites duringthe warm season from day 23 to day 12, assuming day0 as the date where the SALLJ reaches it maximumintensity in Santa Cruz. At higher levels (Figs. 6a–g),the SALLJ circulation composites suggest a wave trainthat emanates from the midlatitude western Pacific andthen propagates toward South America, turning equa-torward as it crosses the Andes around the southern tipof South America. An anomalous upper-level trough(ridge) over southern South America (southern Brazil)
15 JUNE 2004 2271M A R E N G O E T A L .
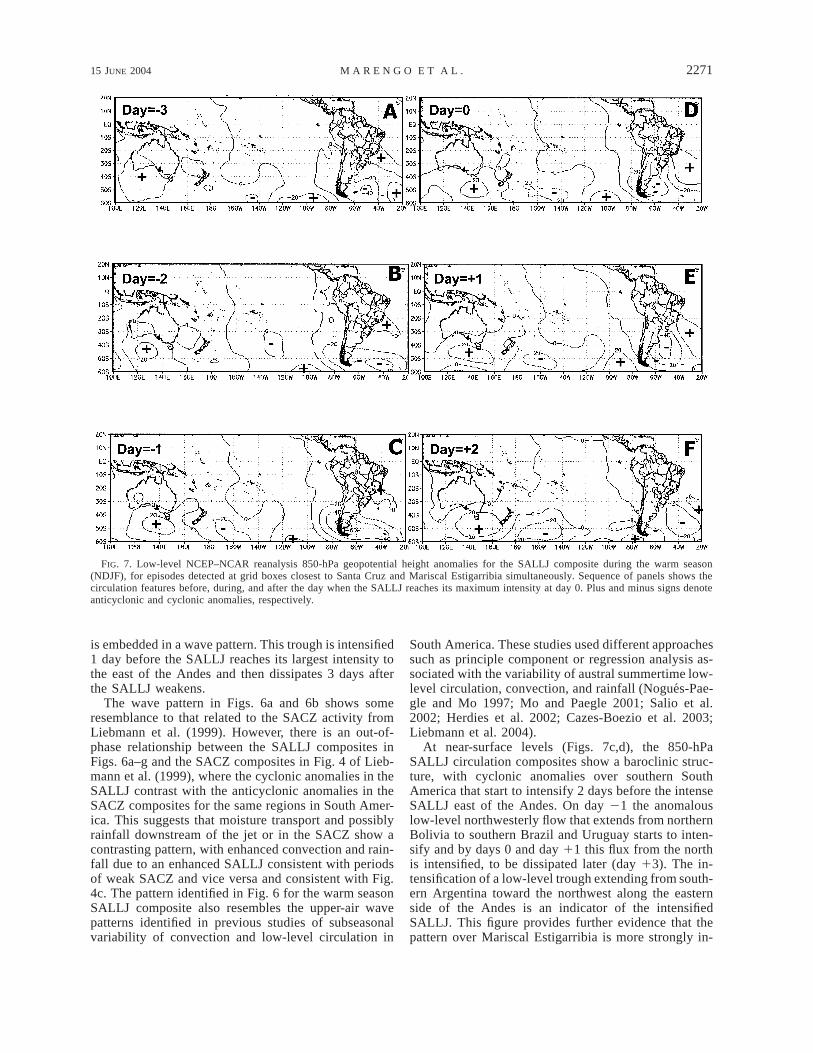
FIG. 7. Low-level NCEP–NCAR reanalysis 850-hPa geopotential height anomalies for the SALLJ composite during the warm season(NDJF), for episodes detected at grid boxes closest to Santa Cruz and Mariscal Estigarribia simultaneously. Sequence of panels shows thecirculation features before, during, and after the day when the SALLJ reaches its maximum intensity at day 0. Plus and minus signs denoteanticyclonic and cyclonic anomalies, respectively.
is embedded in a wave pattern. This trough is intensified1 day before the SALLJ reaches its largest intensity tothe east of the Andes and then dissipates 3 days afterthe SALLJ weakens.
The wave pattern in Figs. 6a and 6b shows someresemblance to that related to the SACZ activity fromLiebmann et al. (1999). However, there is an out-of-phase relationship between the SALLJ composites inFigs. 6a–g and the SACZ composites in Fig. 4 of Lieb-mann et al. (1999), where the cyclonic anomalies in theSALLJ contrast with the anticyclonic anomalies in theSACZ composites for the same regions in South Amer-ica. This suggests that moisture transport and possiblyrainfall downstream of the jet or in the SACZ show acontrasting pattern, with enhanced convection and rain-fall due to an enhanced SALLJ consistent with periodsof weak SACZ and vice versa and consistent with Fig.4c. The pattern identified in Fig. 6 for the warm seasonSALLJ composite also resembles the upper-air wavepatterns identified in previous studies of subseasonalvariability of convection and low-level circulation in
South America. These studies used different approachessuch as principle component or regression analysis as-sociated with the variability of austral summertime low-level circulation, convection, and rainfall (Nogues-Pae-gle and Mo 1997; Mo and Paegle 2001; Salio et al.2002; Herdies et al. 2002; Cazes-Boezio et al. 2003;Liebmann et al. 2004).
At near-surface levels (Figs. 7c,d), the 850-hPaSALLJ circulation composites show a baroclinic struc-ture, with cyclonic anomalies over southern SouthAmerica that start to intensify 2 days before the intenseSALLJ east of the Andes. On day 21 the anomalouslow-level northwesterly flow that extends from northernBolivia to southern Brazil and Uruguay starts to inten-sify and by days 0 and day 11 this flux from the northis intensified, to be dissipated later (day 13). The in-tensification of a low-level trough extending from south-ern Argentina toward the northwest along the easternside of the Andes is an indicator of the intensifiedSALLJ. This figure provides further evidence that thepattern over Mariscal Estigarribia is more strongly in-
2272 VOLUME 17J O U R N A L O F C L I M A T E
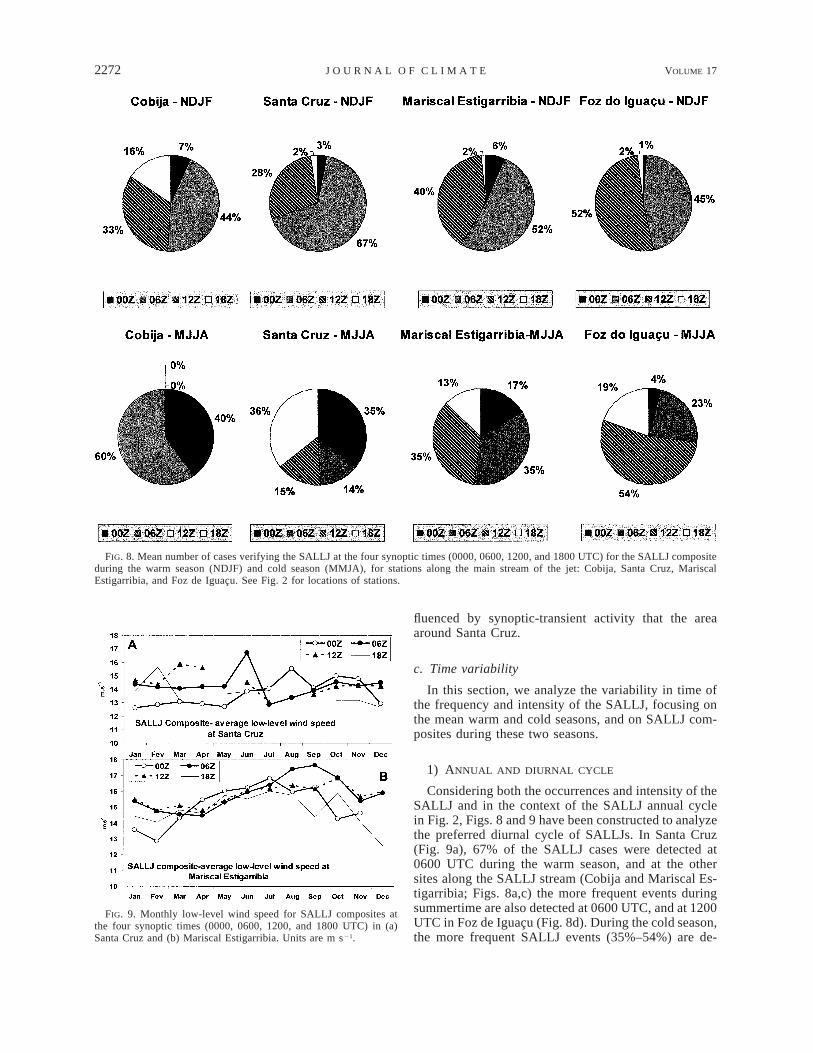
FIG. 8. Mean number of cases verifying the SALLJ at the four synoptic times (0000, 0600, 1200, and 1800 UTC) for the SALLJ compositeduring the warm season (NDJF) and cold season (MMJA), for stations along the main stream of the jet: Cobija, Santa Cruz, MariscalEstigarribia, and Foz de Iguacu. See Fig. 2 for locations of stations.
FIG. 9. Monthly low-level wind speed for SALLJ composites atthe four synoptic times (0000, 0600, 1200, and 1800 UTC) in (a)Santa Cruz and (b) Mariscal Estigarribia. Units are m s21.
fluenced by synoptic-transient activity that the areaaround Santa Cruz.
c. Time variability
In this section, we analyze the variability in time ofthe frequency and intensity of the SALLJ, focusing onthe mean warm and cold seasons, and on SALLJ com-posites during these two seasons.
1) ANNUAL AND DIURNAL CYCLE
Considering both the occurrences and intensity of theSALLJ and in the context of the SALLJ annual cyclein Fig. 2, Figs. 8 and 9 have been constructed to analyzethe preferred diurnal cycle of SALLJs. In Santa Cruz(Fig. 9a), 67% of the SALLJ cases were detected at0600 UTC during the warm season, and at the othersites along the SALLJ stream (Cobija and Mariscal Es-tigarribia; Figs. 8a,c) the more frequent events duringsummertime are also detected at 0600 UTC, and at 1200UTC in Foz de Iguacu (Fig. 8d). During the cold season,the more frequent SALLJ events (35%–54%) are de-
15 JUNE 2004 2273M A R E N G O E T A L .
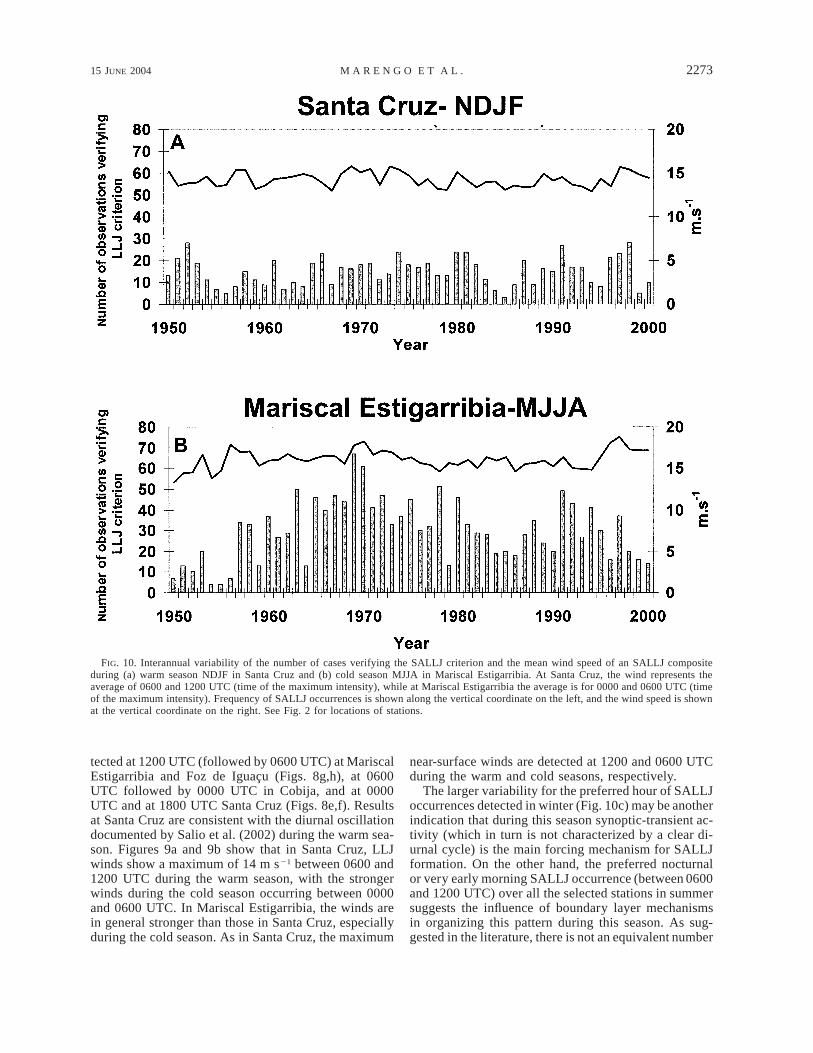
FIG. 10. Interannual variability of the number of cases verifying the SALLJ criterion and the mean wind speed of an SALLJ compositeduring (a) warm season NDJF in Santa Cruz and (b) cold season MJJA in Mariscal Estigarribia. At Santa Cruz, the wind represents theaverage of 0600 and 1200 UTC (time of the maximum intensity), while at Mariscal Estigarribia the average is for 0000 and 0600 UTC (timeof the maximum intensity). Frequency of SALLJ occurrences is shown along the vertical coordinate on the left, and the wind speed is shownat the vertical coordinate on the right. See Fig. 2 for locations of stations.
tected at 1200 UTC (followed by 0600 UTC) at MariscalEstigarribia and Foz de Iguacu (Figs. 8g,h), at 0600UTC followed by 0000 UTC in Cobija, and at 0000UTC and at 1800 UTC Santa Cruz (Figs. 8e,f). Resultsat Santa Cruz are consistent with the diurnal oscillationdocumented by Salio et al. (2002) during the warm sea-son. Figures 9a and 9b show that in Santa Cruz, LLJwinds show a maximum of 14 m s21 between 0600 and1200 UTC during the warm season, with the strongerwinds during the cold season occurring between 0000and 0600 UTC. In Mariscal Estigarribia, the winds arein general stronger than those in Santa Cruz, especiallyduring the cold season. As in Santa Cruz, the maximum
near-surface winds are detected at 1200 and 0600 UTCduring the warm and cold seasons, respectively.
The larger variability for the preferred hour of SALLJoccurrences detected in winter (Fig. 10c) may be anotherindication that during this season synoptic-transient ac-tivity (which in turn is not characterized by a clear di-urnal cycle) is the main forcing mechanism for SALLJformation. On the other hand, the preferred nocturnalor very early morning SALLJ occurrence (between 0600and 1200 UTC) over all the selected stations in summersuggests the influence of boundary layer mechanismsin organizing this pattern during this season. As sug-gested in the literature, there is not an equivalent number
2274 VOLUME 17J O U R N A L O F C L I M A T E
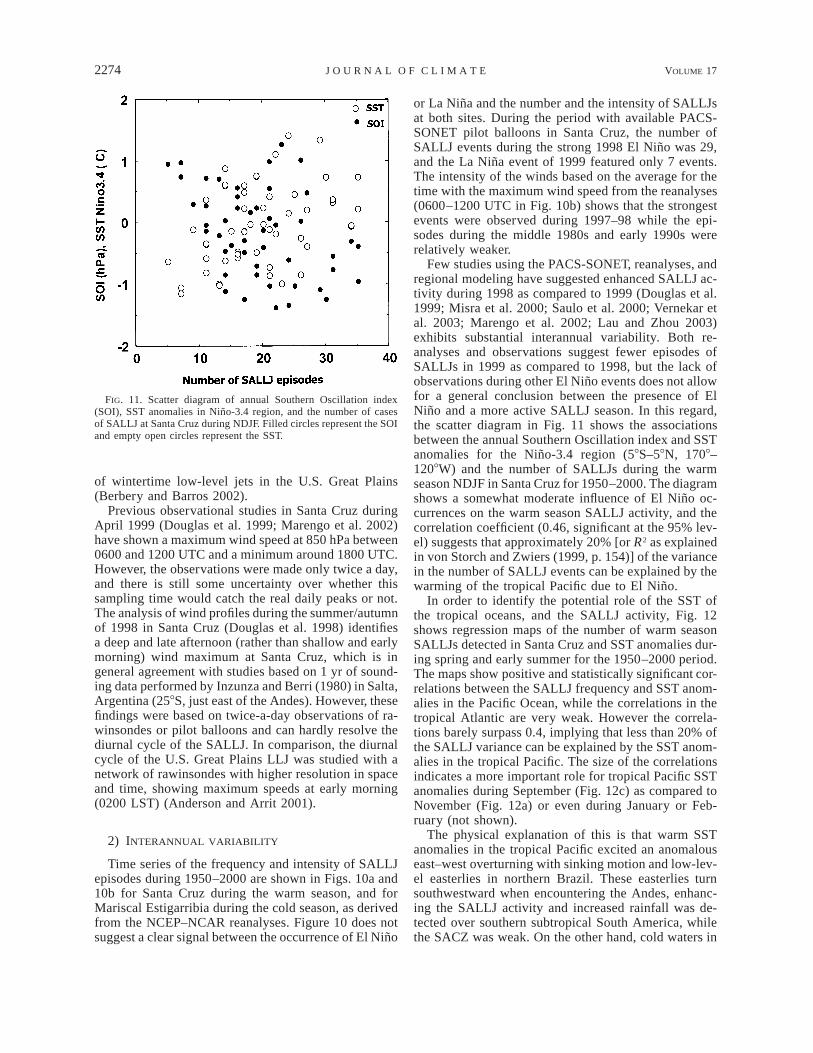
FIG. 11. Scatter diagram of annual Southern Oscillation index(SOI), SST anomalies in Nino-3.4 region, and the number of casesof SALLJ at Santa Cruz during NDJF. Filled circles represent the SOIand empty open circles represent the SST.
of wintertime low-level jets in the U.S. Great Plains(Berbery and Barros 2002).
Previous observational studies in Santa Cruz duringApril 1999 (Douglas et al. 1999; Marengo et al. 2002)have shown a maximum wind speed at 850 hPa between0600 and 1200 UTC and a minimum around 1800 UTC.However, the observations were made only twice a day,and there is still some uncertainty over whether thissampling time would catch the real daily peaks or not.The analysis of wind profiles during the summer/autumnof 1998 in Santa Cruz (Douglas et al. 1998) identifiesa deep and late afternoon (rather than shallow and earlymorning) wind maximum at Santa Cruz, which is ingeneral agreement with studies based on 1 yr of sound-ing data performed by Inzunza and Berri (1980) in Salta,Argentina (258S, just east of the Andes). However, thesefindings were based on twice-a-day observations of ra-winsondes or pilot balloons and can hardly resolve thediurnal cycle of the SALLJ. In comparison, the diurnalcycle of the U.S. Great Plains LLJ was studied with anetwork of rawinsondes with higher resolution in spaceand time, showing maximum speeds at early morning(0200 LST) (Anderson and Arrit 2001).
2) INTERANNUAL VARIABILITY
Time series of the frequency and intensity of SALLJepisodes during 1950–2000 are shown in Figs. 10a and10b for Santa Cruz during the warm season, and forMariscal Estigarribia during the cold season, as derivedfrom the NCEP–NCAR reanalyses. Figure 10 does notsuggest a clear signal between the occurrence of El Nino
or La Nina and the number and the intensity of SALLJsat both sites. During the period with available PACS-SONET pilot balloons in Santa Cruz, the number ofSALLJ events during the strong 1998 El Nino was 29,and the La Nina event of 1999 featured only 7 events.The intensity of the winds based on the average for thetime with the maximum wind speed from the reanalyses(0600–1200 UTC in Fig. 10b) shows that the strongestevents were observed during 1997–98 while the epi-sodes during the middle 1980s and early 1990s wererelatively weaker.
Few studies using the PACS-SONET, reanalyses, andregional modeling have suggested enhanced SALLJ ac-tivity during 1998 as compared to 1999 (Douglas et al.1999; Misra et al. 2000; Saulo et al. 2000; Vernekar etal. 2003; Marengo et al. 2002; Lau and Zhou 2003)exhibits substantial interannual variability. Both re-analyses and observations suggest fewer episodes ofSALLJs in 1999 as compared to 1998, but the lack ofobservations during other El Nino events does not allowfor a general conclusion between the presence of ElNino and a more active SALLJ season. In this regard,the scatter diagram in Fig. 11 shows the associationsbetween the annual Southern Oscillation index and SSTanomalies for the Nino-3.4 region (58S–58N, 1708–1208W) and the number of SALLJs during the warmseason NDJF in Santa Cruz for 1950–2000. The diagramshows a somewhat moderate influence of El Nino oc-currences on the warm season SALLJ activity, and thecorrelation coefficient (0.46, significant at the 95% lev-el) suggests that approximately 20% [or R2 as explainedin von Storch and Zwiers (1999, p. 154)] of the variancein the number of SALLJ events can be explained by thewarming of the tropical Pacific due to El Nino.
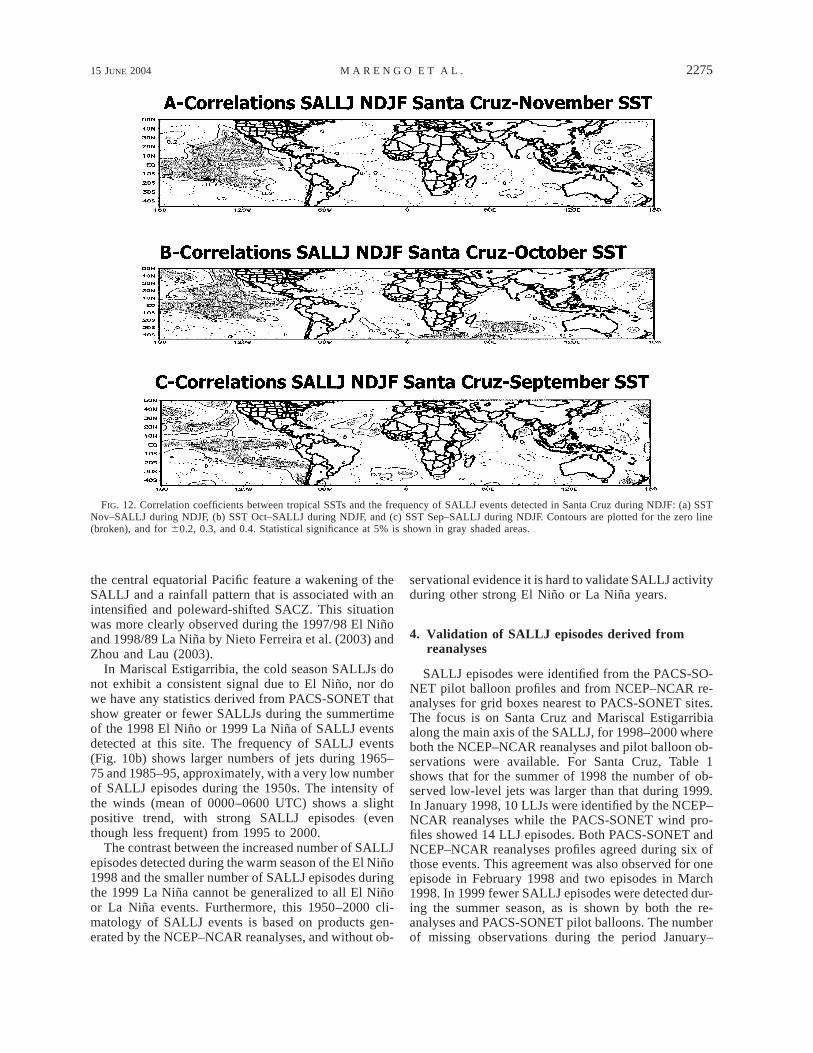
In order to identify the potential role of the SST ofthe tropical oceans, and the SALLJ activity, Fig. 12shows regression maps of the number of warm seasonSALLJs detected in Santa Cruz and SST anomalies dur-ing spring and early summer for the 1950–2000 period.The maps show positive and statistically significant cor-relations between the SALLJ frequency and SST anom-alies in the Pacific Ocean, while the correlations in thetropical Atlantic are very weak. However the correla-tions barely surpass 0.4, implying that less than 20% ofthe SALLJ variance can be explained by the SST anom-alies in the tropical Pacific. The size of the correlationsindicates a more important role for tropical Pacific SSTanomalies during September (Fig. 12c) as compared toNovember (Fig. 12a) or even during January or Feb-ruary (not shown).
The physical explanation of this is that warm SSTanomalies in the tropical Pacific excited an anomalouseast–west overturning with sinking motion and low-lev-el easterlies in northern Brazil. These easterlies turnsouthwestward when encountering the Andes, enhanc-ing the SALLJ activity and increased rainfall was de-tected over southern subtropical South America, whilethe SACZ was weak. On the other hand, cold waters in
15 JUNE 2004 2275M A R E N G O E T A L .
FIG. 12. Correlation coefficients between tropical SSTs and the frequency of SALLJ events detected in Santa Cruz during NDJF: (a) SSTNov–SALLJ during NDJF, (b) SST Oct–SALLJ during NDJF, and (c) SST Sep–SALLJ during NDJF. Contours are plotted for the zero line(broken), and for 60.2, 0.3, and 0.4. Statistical significance at 5% is shown in gray shaded areas.
the central equatorial Pacific feature a wakening of theSALLJ and a rainfall pattern that is associated with anintensified and poleward-shifted SACZ. This situationwas more clearly observed during the 1997/98 El Ninoand 1998/89 La Nina by Nieto Ferreira et al. (2003) andZhou and Lau (2003).
In Mariscal Estigarribia, the cold season SALLJs donot exhibit a consistent signal due to El Nino, nor dowe have any statistics derived from PACS-SONET thatshow greater or fewer SALLJs during the summertimeof the 1998 El Nino or 1999 La Nina of SALLJ eventsdetected at this site. The frequency of SALLJ events(Fig. 10b) shows larger numbers of jets during 1965–75 and 1985–95, approximately, with a very low numberof SALLJ episodes during the 1950s. The intensity ofthe winds (mean of 0000–0600 UTC) shows a slightpositive trend, with strong SALLJ episodes (eventhough less frequent) from 1995 to 2000.
The contrast between the increased number of SALLJepisodes detected during the warm season of the El Nino1998 and the smaller number of SALLJ episodes duringthe 1999 La Nina cannot be generalized to all El Ninoor La Nina events. Furthermore, this 1950–2000 cli-matology of SALLJ events is based on products gen-erated by the NCEP–NCAR reanalyses, and without ob-
servational evidence it is hard to validate SALLJ activityduring other strong El Nino or La Nina years.
4. Validation of SALLJ episodes derived fromreanalyses
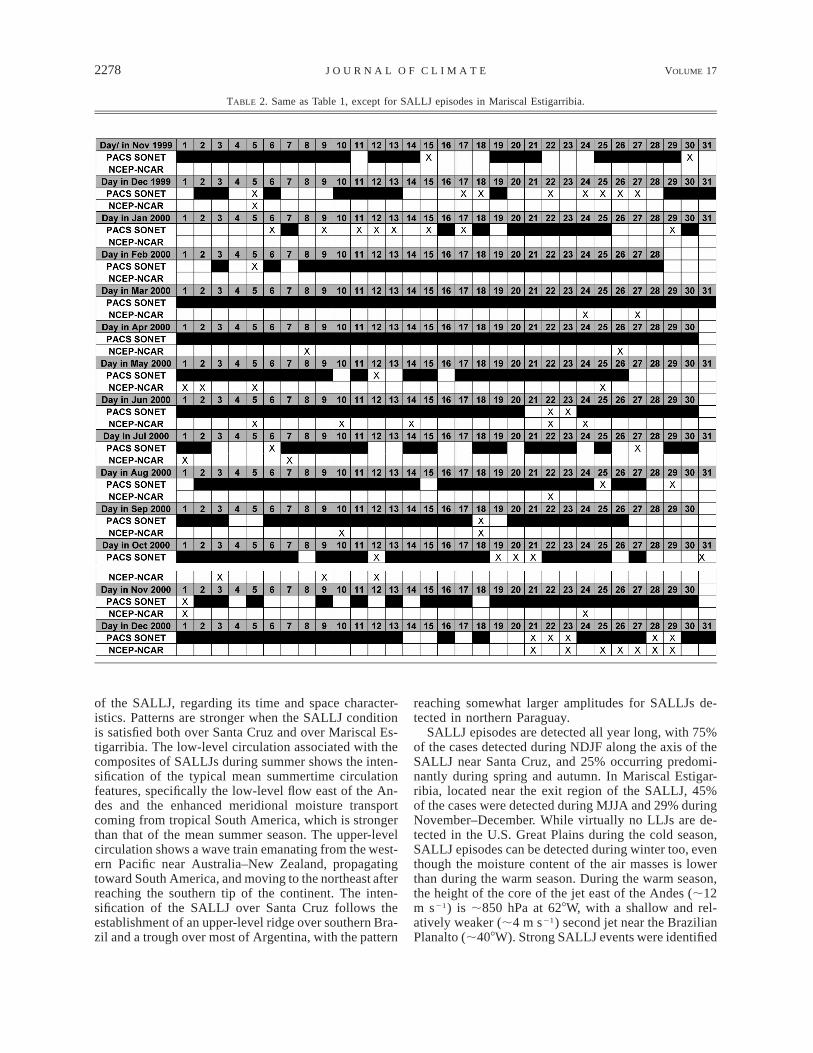
SALLJ episodes were identified from the PACS-SO-NET pilot balloon profiles and from NCEP–NCAR re-analyses for grid boxes nearest to PACS-SONET sites.The focus is on Santa Cruz and Mariscal Estigarribiaalong the main axis of the SALLJ, for 1998–2000 whereboth the NCEP–NCAR reanalyses and pilot balloon ob-servations were available. For Santa Cruz, Table 1shows that for the summer of 1998 the number of ob-served low-level jets was larger than that during 1999.In January 1998, 10 LLJs were identified by the NCEP–NCAR reanalyses while the PACS-SONET wind pro-files showed 14 LLJ episodes. Both PACS-SONET andNCEP–NCAR reanalyses profiles agreed during six ofthose events. This agreement was also observed for oneepisode in February 1998 and two episodes in March1998. In 1999 fewer SALLJ episodes were detected dur-ing the summer season, as is shown by both the re-analyses and PACS-SONET pilot balloons. The numberof missing observations during the period January–
2276 VOLUME 17J O U R N A L O F C L I M A T E
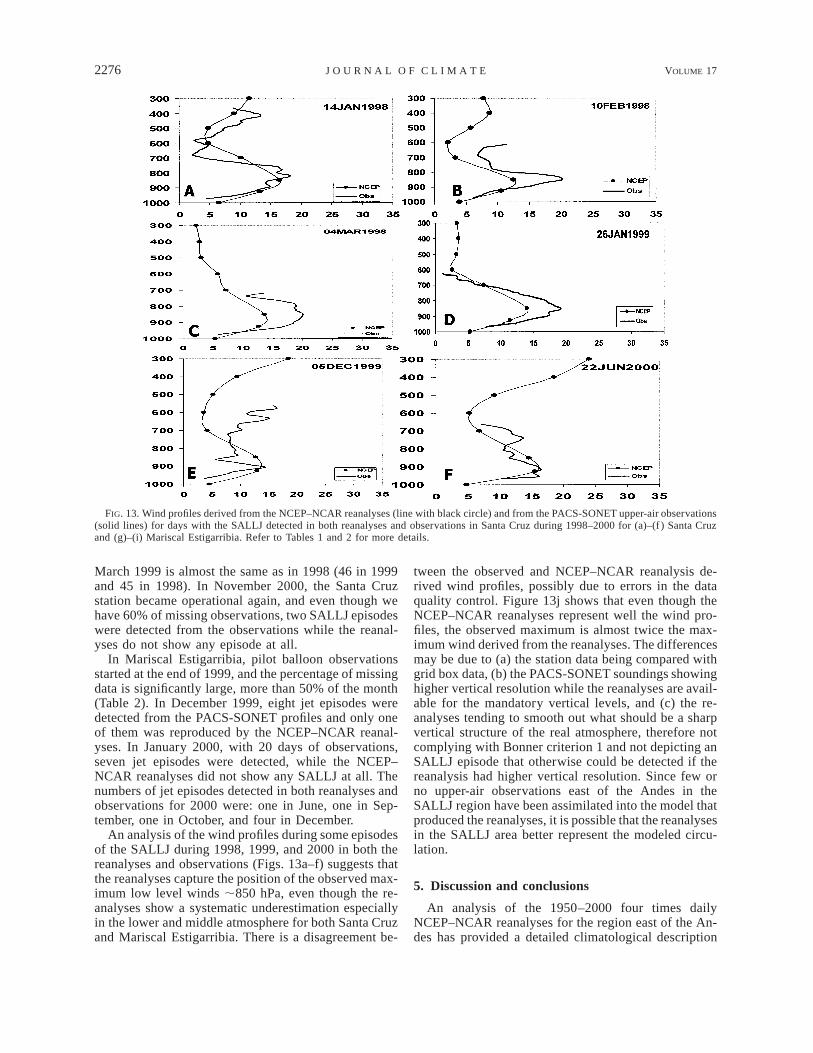
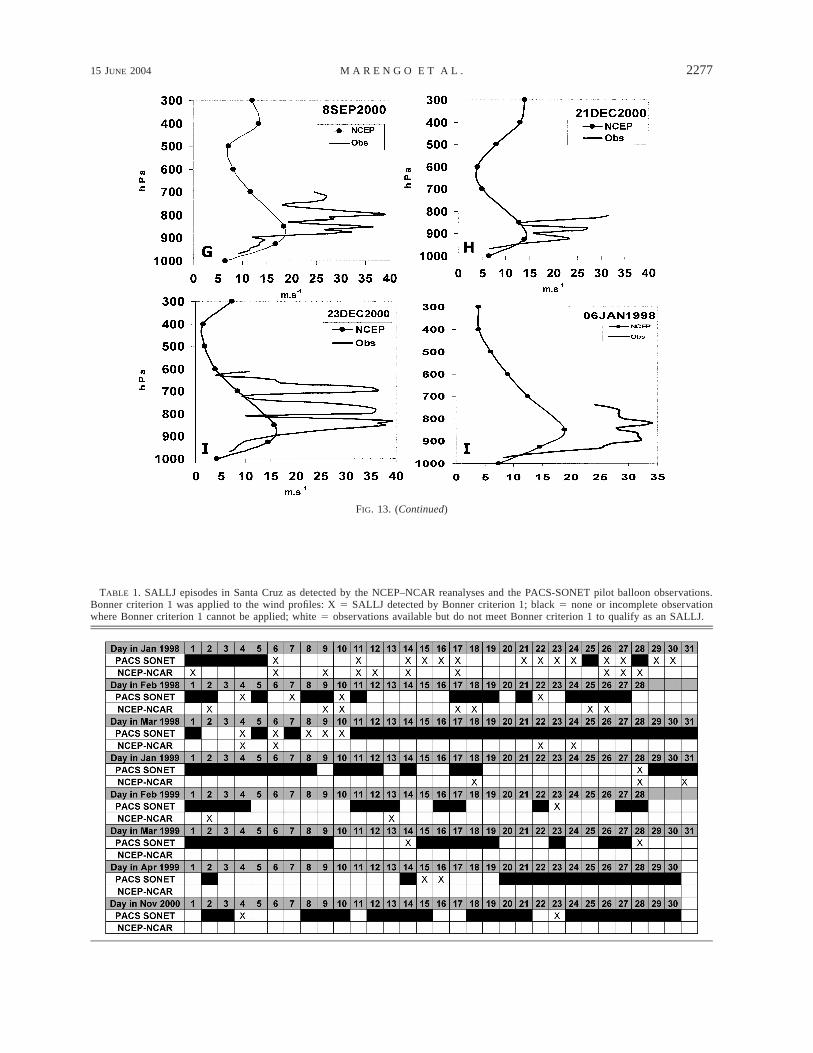
FIG. 13. Wind profiles derived from the NCEP–NCAR reanalyses (line with black circle) and from the PACS-SONET upper-air observations(solid lines) for days with the SALLJ detected in both reanalyses and observations in Santa Cruz during 1998–2000 for (a)–(f ) Santa Cruzand (g)–(i) Mariscal Estigarribia. Refer to Tables 1 and 2 for more details.
March 1999 is almost the same as in 1998 (46 in 1999and 45 in 1998). In November 2000, the Santa Cruzstation became operational again, and even though wehave 60% of missing observations, two SALLJ episodeswere detected from the observations while the reanal-yses do not show any episode at all.
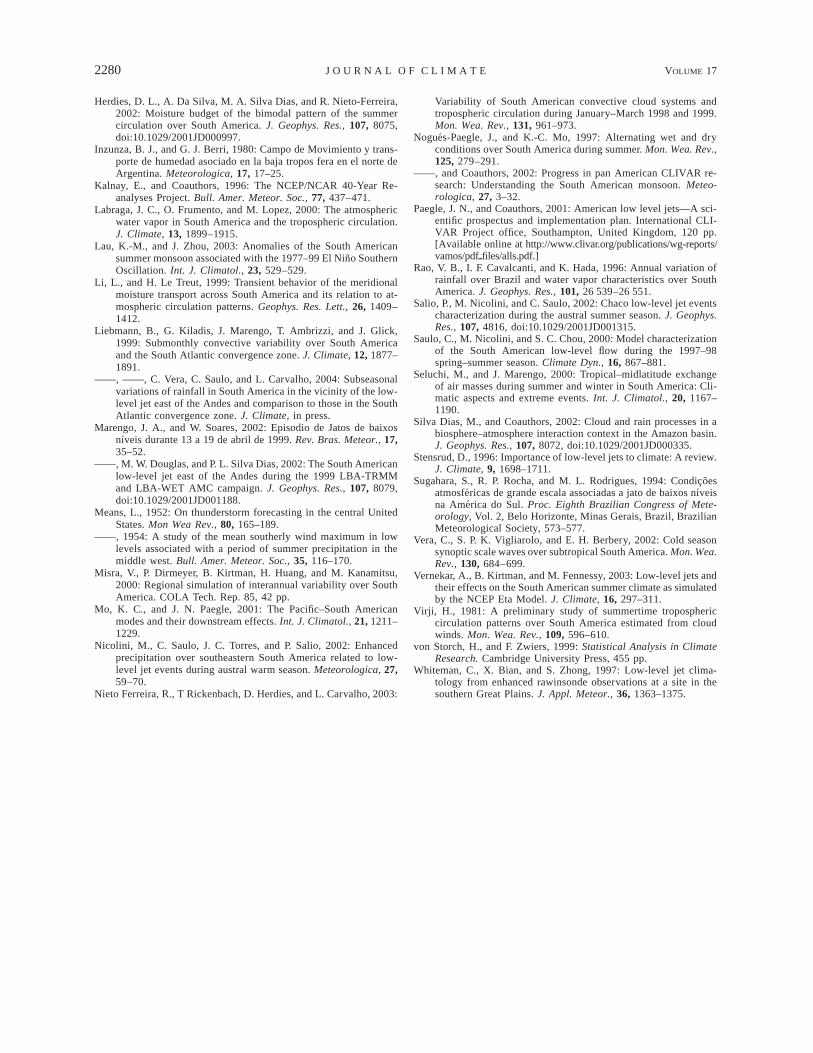
In Mariscal Estigarribia, pilot balloon observationsstarted at the end of 1999, and the percentage of missingdata is significantly large, more than 50% of the month(Table 2). In December 1999, eight jet episodes weredetected from the PACS-SONET profiles and only oneof them was reproduced by the NCEP–NCAR reanal-yses. In January 2000, with 20 days of observations,seven jet episodes were detected, while the NCEP–NCAR reanalyses did not show any SALLJ at all. Thenumbers of jet episodes detected in both reanalyses andobservations for 2000 were: one in June, one in Sep-tember, one in October, and four in December.
An analysis of the wind profiles during some episodesof the SALLJ during 1998, 1999, and 2000 in both thereanalyses and observations (Figs. 13a–f) suggests thatthe reanalyses capture the position of the observed max-imum low level winds ;850 hPa, even though the re-analyses show a systematic underestimation especiallyin the lower and middle atmosphere for both Santa Cruzand Mariscal Estigarribia. There is a disagreement be-
tween the observed and NCEP–NCAR reanalysis de-rived wind profiles, possibly due to errors in the dataquality control. Figure 13j shows that even though theNCEP–NCAR reanalyses represent well the wind pro-files, the observed maximum is almost twice the max-imum wind derived from the reanalyses. The differencesmay be due to (a) the station data being compared withgrid box data, (b) the PACS-SONET soundings showinghigher vertical resolution while the reanalyses are avail-able for the mandatory vertical levels, and (c) the re-analyses tending to smooth out what should be a sharpvertical structure of the real atmosphere, therefore notcomplying with Bonner criterion 1 and not depicting anSALLJ episode that otherwise could be detected if thereanalysis had higher vertical resolution. Since few orno upper-air observations east of the Andes in theSALLJ region have been assimilated into the model thatproduced the reanalyses, it is possible that the reanalysesin the SALLJ area better represent the modeled circu-lation.
5. Discussion and conclusions
An analysis of the 1950–2000 four times dailyNCEP–NCAR reanalyses for the region east of the An-des has provided a detailed climatological description
15 JUNE 2004 2277M A R E N G O E T A L .
FIG. 13. (Continued)
TABLE 1. SALLJ episodes in Santa Cruz as detected by the NCEP–NCAR reanalyses and the PACS-SONET pilot balloon observations.Bonner criterion 1 was applied to the wind profiles: X 5 SALLJ detected by Bonner criterion 1; black 5 none or incomplete observationwhere Bonner criterion 1 cannot be applied; white 5 observations available but do not meet Bonner criterion 1 to qualify as an SALLJ.
2278 VOLUME 17J O U R N A L O F C L I M A T E
TABLE 2. Same as Table 1, except for SALLJ episodes in Mariscal Estigarribia.
of the SALLJ, regarding its time and space character-istics. Patterns are stronger when the SALLJ conditionis satisfied both over Santa Cruz and over Mariscal Es-tigarribia. The low-level circulation associated with thecomposites of SALLJs during summer shows the inten-sification of the typical mean summertime circulationfeatures, specifically the low-level flow east of the An-des and the enhanced meridional moisture transportcoming from tropical South America, which is strongerthan that of the mean summer season. The upper-levelcirculation shows a wave train emanating from the west-ern Pacific near Australia–New Zealand, propagatingtoward South America, and moving to the northeast afterreaching the southern tip of the continent. The inten-sification of the SALLJ over Santa Cruz follows theestablishment of an upper-level ridge over southern Bra-zil and a trough over most of Argentina, with the pattern
reaching somewhat larger amplitudes for SALLJs de-tected in northern Paraguay.
SALLJ episodes are detected all year long, with 75%of the cases detected during NDJF along the axis of theSALLJ near Santa Cruz, and 25% occurring predomi-nantly during spring and autumn. In Mariscal Estigar-ribia, located near the exit region of the SALLJ, 45%of the cases were detected during MJJA and 29% duringNovember–December. While virtually no LLJs are de-tected in the U.S. Great Plains during the cold season,SALLJ episodes can be detected during winter too, eventhough the moisture content of the air masses is lowerthan during the warm season. During the warm season,the height of the core of the jet east of the Andes (;12m s21) is ;850 hPa at 628W, with a shallow and rel-atively weaker (;4 m s21) second jet near the BrazilianPlanalto (;408W). Strong SALLJ events were identified

15 JUNE 2004 2279M A R E N G O E T A L .
as those occurring both in Santa Cruz and Mariscal Es-tigarribia, and during the warm season. More frequentwintertime SALLJs are related to the intensity and po-sition of the subtropical Atlantic anticyclone. In thiscase, the source of moisture is the tropical and sub-tropical Atlantic, during the summertime SALLJ. Themost important source is the northeast winds deflectedto the southwest, with enriched moisture content pro-vided by the Amazon basin, with a less pronouncedsecondary moisture supply coming from the subtropicalAtlantic Ocean.
At interannual time scales, even though there havebeen more frequent and stronger SALLJ episodes iden-tified during the 1998 El Nino as compared to the 1999La Nina, there is no strong statistical evidence that sug-gests that more SALLJ episodes are detected during ElNino years or less strong or frequent SALLJs during LaNina years. Of course, the low percentage of the vari-ance of the SALLJ explained by tropical Pacific SSTanomalies indicates that other factors make importantcontributions to this variability, factors such as the as-similation of satellite data or some other nonmeteorol-ogical causes. Given the uncertainties in the ability ofthe NCEP–NCAR reanalyses in studying interannualvariability of the SALLJ due to changes in assimilationtechniques and the introduction of satellite data duringthe late 1970s, we analyzed the circulation features andthe number of SALLJ occurrences in Santa Cruz during1950–2000 and 1979–2000 and we have not noticedany significant difference in the low-level circulationfeatures or the frequency of SALLJ cases that could beattributed to changes in the data ingested into the re-analyses.
The reanalyses for the SALLJ region east of the An-des are produced by model output in a region wherefew observations are assimilated by the model. Thus, itis possible that the reanalyses show only the circulationfeatures generated by the model. In any case, we usethe wind at station level from PACS-SONET comparedwith the wind from a 250 km 3 250 km grid box toexplain this underestimation. It should also be pointedout that the observations provided by PACS-SONETexhibit many discontinuities. This fact suggests that re-sults from this dataset should be interpreted cautiously.
While the reanalyses show some success in depictingthe structure and characteristics of the SALLJ as wellas its variability in time, they do show some limitationsin reproducing the diurnal cycle or the interannual var-iability. This is due in part to the lack of continuousupper-air observations in time and space that are assim-ilated by the NCEP–NCAR model to generate the re-analyses, and it is necessary to validate these resultswith a larger and better observational network. The Bon-ner criterion 1 applied to either upper-air stations or tothe grid box closest to the stations using the reanalysesproducts helps to identify an SALLJ by taking into ac-count the low-level wind speeds and wind profiles.However, this criterion does not specify the character-
istics of the air mass, thus allowing SALLJs in summerand winter and from tropical and subtropical sources.The discrepancy between the diurnal cycle derived fromthe surface–upper-air observations and the NCEP–NCAR reanalyses indicates the need for more obser-vations, and a more accurate evaluation of the diurnalcycle will be accomplished through a dense network ofobservations at least four to six times per day. This hasbeen one of the major objectives of the South AmericanLow Level Jet Experiment (SALLJEX) that took placeduring the austral summer of 2002/03, as part of theVariability of South American Monsoon Systems (VA-MOS) project.
Acknowledgments. We wish to thank the NOAA Of-fice of Global Programs for supporting the PACS-SO-NET observation program, one component of which wasoperating the Santa Cruz, Bolivia, sounding site. Ad-ditional thanks go to Jan and Julia Paegle, V. Kousky,M. Seluchi, M. Silva Dias, I. Cavalcanti, P. Silva Dias,M. Douglas, others from the University of Utah,CPTEC/INPE, NCEP, the University of Buenos Aires,and the University of Sao Paulo. This study was fundedby the Inter American Institute for Global Change (IAI;Grant IAI-CRN 055 PROSUR) and an FAPESP Grant(01/13816-1).
REFERENCES
Anderson, C. J., and R. Arrit, 2001: Representation of summertimelow-level jets in the central United States by NCEP–NCAR re-analyses. J. Climate, 14, 234–247.
Berbery, E. H., and E. A. Collini, 2000: Springtime precipitation andwater vapor flux convergence over southeastern South America.Mon. Wea. Rev., 128, 1328–1346.
——, and V. Barros, 2002: The hydrological cycle of the La Platabasin in South America. J. Hydrometeor., 3, 630–645.
Berri, G. J., and B. Inzunza, 1993: The effect of the low-level jet onthe poleward water vapor transport in the central region of SouthAmerica. Atmos. Environ., 27A, 335–341.
Blackadar, A., 1957: Boundary layer wind maxima and their signif-icance for the growth of nocturnal inversions. Bull. Amer. Me-teor. Soc., 38, 283–290.
Bonner, W. D., 1968: Climatology of the low level jet. Mon. Wea.Rev., 96, 833–850.
Cazes-Boezio, G. H., A. W. Robertson, and C. R. Mechoso, 2003:Seasonal dependence of ENSO teleconnections over SouthAmerica and relations with precipitation in Uruguay. J. Climate,16, 1159–1176.
Douglas, M. W., M. Nicolini, and C. Saulo, 1998: Observationalevidences of a low level jet east of the Andes during January–March 1998. Meteorologica, 23, 63–72.
——, ——, and ——, 1999: The low-level jet at Santa Cruz, Boliviaduring January-March 1998, pilot balloon observations and mod-el comparisons. Preprints, 10th Symp. on Global Change Studies,Dallas, TX, Amer. Meteor. Soc., 223–226.
——, M. Pena, and R. Villarpando, 2000: Special observations ofthe low level flow over eastern Bolivia during the 1999 atmo-spheric mesoscale campaign. Preprints, Sixth Int. Conf. on South-ern Hemisphere Meteorology and Oceanography, Santiago,Chile, Amer. Meteor. Soc., 157–158.
Garreaud, R., and J. M. Wallace, 1998: Summertime incursions ofmidlatitude air into subtropical and tropical South America. Mon.Wea Rev., 126, 2713–1733.
2280 VOLUME 17J O U R N A L O F C L I M A T E
Herdies, D. L., A. Da Silva, M. A. Silva Dias, and R. Nieto-Ferreira,2002: Moisture budget of the bimodal pattern of the summercirculation over South America. J. Geophys. Res., 107, 8075,doi:10.1029/2001JD000997.
Inzunza, B. J., and G. J. Berri, 1980: Campo de Movimiento y trans-porte de humedad asociado en la baja tropos fera en el norte deArgentina. Meteorologica, 17, 17–25.
Kalnay, E., and Coauthors, 1996: The NCEP/NCAR 40-Year Re-analyses Project. Bull. Amer. Meteor. Soc., 77, 437–471.
Labraga, J. C., O. Frumento, and M. Lopez, 2000: The atmosphericwater vapor in South America and the tropospheric circulation.J. Climate, 13, 1899–1915.
Lau, K.-M., and J. Zhou, 2003: Anomalies of the South Americansummer monsoon associated with the 1977–99 El Nino SouthernOscillation. Int. J. Climatol., 23, 529–529.
Li, L., and H. Le Treut, 1999: Transient behavior of the meridionalmoisture transport across South America and its relation to at-mospheric circulation patterns. Geophys. Res. Lett., 26, 1409–1412.
Liebmann, B., G. Kiladis, J. Marengo, T. Ambrizzi, and J. Glick,1999: Submonthly convective variability over South Americaand the South Atlantic convergence zone. J. Climate, 12, 1877–1891.
——, ——, C. Vera, C. Saulo, and L. Carvalho, 2004: Subseasonalvariations of rainfall in South America in the vicinity of the low-level jet east of the Andes and comparison to those in the SouthAtlantic convergence zone. J. Climate, in press.
Marengo, J. A., and W. Soares, 2002: Episodio de Jatos de baixosnıveis durante 13 a 19 de abril de 1999. Rev. Bras. Meteor., 17,35–52.
——, M. W. Douglas, and P. L. Silva Dias, 2002: The South Americanlow-level jet east of the Andes during the 1999 LBA-TRMMand LBA-WET AMC campaign. J. Geophys. Res., 107, 8079,doi:10.1029/2001JD001188.
Means, L., 1952: On thunderstorm forecasting in the central UnitedStates. Mon Wea Rev., 80, 165–189.
——, 1954: A study of the mean southerly wind maximum in lowlevels associated with a period of summer precipitation in themiddle west. Bull. Amer. Meteor. Soc., 35, 116–170.
Misra, V., P. Dirmeyer, B. Kirtman, H. Huang, and M. Kanamitsu,2000: Regional simulation of interannual variability over SouthAmerica. COLA Tech. Rep. 85, 42 pp.
Mo, K. C., and J. N. Paegle, 2001: The Pacific–South Americanmodes and their downstream effects. Int. J. Climatol., 21, 1211–1229.
Nicolini, M., C. Saulo, J. C. Torres, and P. Salio, 2002: Enhancedprecipitation over southeastern South America related to low-level jet events during austral warm season. Meteorologica, 27,59–70.
Nieto Ferreira, R., T Rickenbach, D. Herdies, and L. Carvalho, 2003:
Variability of South American convective cloud systems andtropospheric circulation during January–March 1998 and 1999.Mon. Wea. Rev., 131, 961–973.
Nogues-Paegle, J., and K.-C. Mo, 1997: Alternating wet and dryconditions over South America during summer. Mon. Wea. Rev.,125, 279–291.
——, and Coauthors, 2002: Progress in pan American CLIVAR re-search: Understanding the South American monsoon. Meteo-rologica, 27, 3–32.
Paegle, J. N., and Coauthors, 2001: American low level jets—A sci-entific prospectus and implementation plan. International CLI-VAR Project office, Southampton, United Kingdom, 120 pp.[Available online at http://www.clivar.org/publications/wg-reports/vamos/pdfpfiles/alls.pdf.]
Rao, V. B., I. F. Cavalcanti, and K. Hada, 1996: Annual variation ofrainfall over Brazil and water vapor characteristics over SouthAmerica. J. Geophys. Res., 101, 26 539–26 551.
Salio, P., M. Nicolini, and C. Saulo, 2002: Chaco low-level jet eventscharacterization during the austral summer season. J. Geophys.Res., 107, 4816, doi:10.1029/2001JD001315.
Saulo, C., M. Nicolini, and S. C. Chou, 2000: Model characterizationof the South American low-level flow during the 1997–98spring–summer season. Climate Dyn., 16, 867–881.
Seluchi, M., and J. Marengo, 2000: Tropical–midlatitude exchangeof air masses during summer and winter in South America: Cli-matic aspects and extreme events. Int. J. Climatol., 20, 1167–1190.
Silva Dias, M., and Coauthors, 2002: Cloud and rain processes in abiosphere–atmosphere interaction context in the Amazon basin.J. Geophys. Res., 107, 8072, doi:10.1029/2001JD000335.
Stensrud, D., 1996: Importance of low-level jets to climate: A review.J. Climate, 9, 1698–1711.
Sugahara, S., R. P. Rocha, and M. L. Rodrigues, 1994: Condicoesatmosfericas de grande escala associadas a jato de baixos nıveisna America do Sul. Proc. Eighth Brazilian Congress of Mete-orology, Vol. 2, Belo Horizonte, Minas Gerais, Brazil, BrazilianMeteorological Society, 573–577.
Vera, C., S. P. K. Vigliarolo, and E. H. Berbery, 2002: Cold seasonsynoptic scale waves over subtropical South America. Mon. Wea.Rev., 130, 684–699.
Vernekar, A., B. Kirtman, and M. Fennessy, 2003: Low-level jets andtheir effects on the South American summer climate as simulatedby the NCEP Eta Model. J. Climate, 16, 297–311.
Virji, H., 1981: A preliminary study of summertime troposphericcirculation patterns over South America estimated from cloudwinds. Mon. Wea. Rev., 109, 596–610.
von Storch, H., and F. Zwiers, 1999: Statistical Analysis in ClimateResearch. Cambridge University Press, 455 pp.
Whiteman, C., X. Bian, and S. Zhong, 1997: Low-level jet clima-tology from enhanced rawinsonde observations at a site in thesouthern Great Plains. J. Appl. Meteor., 36, 1363–1375.
Related Documents