CLIMATIC CONDITIONS INSIDE NUCLEAR REACTOR CONTAINMENTS REPORT 2016:287

Welcome message from author
This document is posted to help you gain knowledge. Please leave a comment to let me know what you think about it! Share it to your friends and learn new things together.
Transcript

CLIMATIC CONDITIONS INSIDE NUCLEAR REACTOR CONTAINMENTSREPORT 2016:287

!!
!

!
!
!
!
!
!
!
!
!
Climatic*conditions*inside*nuclear*reactor*containments*
!
MIKAEL*OXFALL*
ISBN!97899197673928798!|!©!2016!ENERGIFORSK!
Energiforsk!AB!|!Telefon:!089677!25!30!|!E9post:[email protected]!|!www.energiforsk.se!

!!
!
IN
Evawith
D
CLIMNSIDE
C
aluation hin react
t
Doctoral thesFacul
MATIE NUCONT
of moistor contthe amb
M
sis, Report Tlty of Engine
IC COUCLEATAINM
ture conainmentient com
Mikael O
VBM-1035, Deering, Lund
ONDITAR REMEN
ndition its and in
mpartme
Oxfall
Division of B University, L
TIONEACT
NTS
in the conteractioents
Building MatLund 2016
NS TOR
oncrete on with
erials,
I

II
Copyright © Mikael Oxfall 2016
Lund University, Faculty of Engineering, Division of Building Materials P.O. Box 118 SE-221 00 Lund, Sweden www.byggnadsmaterial.lth.se ISRN LUTVDG/TVBM – 16/1035 – SE(1-81) ISSN 0348-7911 TVBM ISBN 978-91-7623-820-2 (Print) ISBN 978-91-7623-821-9 (Pdf) Printed in Sweden by Media-Tryck, Lund University Lund 2016
III
Preface
This doctoral thesis is the result of research conducted since 2010 at the division of building
materials at Lund University and at Vattenfall AB R&D-laboratories in Älvkarleby. The
project has been financed by Energiforsk, the Swedish Electrical Utilities R&D Company,
with constitutions from: Fortum, Karlstad Energi, Skellefteå kraft, Teollisuuden Voima,
Uniper, Vattenfall and Swedish radiation safety authority. Their financial support is
gratefully acknowledged.
I would like to thank my supervisors Prof. Lars Wadsö, Dr. Peter Johansson, Adj.prof.
Manouchehr Hassanzadeh for all of their support and the encouragement during these last
six years. I wold like to express my greatest gratitude to all personal at Forsmark and
Ringhals that has been involved in this study and assisted me during my in situ work. I
would like to thank the board members in the Energiforsk nuclear concrete program and
especially those included in my reference group; Ulrik Brandin, Uniper; Henrik Bäckström,
Forsmark KG; Johan Klasson and Johanna Spåls, Ringhals.
I would like to thank all my colleges both in Lund at the division of building materials and
at the civil engineering group at Vattenfall AB in Älvkareby. A special acknowledgment is
expressed to my college and friend Dr. Martin Rosenqvist for lots and lots of discussions
and to Dr. Bojan Stojanovic for encouragement and advices.
I would like to thank my family and friends for all encouragement and love throughout this
adventure. Finally I would like to express my deepest love and gratitude to Anna for all the
love, patience and support and for listening to my disguised monologues.
IV
List of appended papers
I. MOISTURE PROFILES IN CONCRETE WALLS OF A NUCLEAR REACTOR
CONTAINMENT AFTER 30 YEARS OF OPERATION
M, Oxfall. P, Johansson. M, Hassanzadeh
Proceeding: Presented at the Nordic Concrete Research Symposium XXII,
Reykjavik, Island, August 4–7 2014.
Nordic Concrete Research, Publication No. 50. Editor: D. Bager. 532 pp.
II. ASSESSMENT OF FACTORS THAT MAY AFFECT THE MOISTURE- AND
TEMPERATURE VARIATION IN THE CONCRETE STRUCTURES INSIDE
NUCLEAR REACTOR CONTAINMENTS
M, Oxfall. P, Johansson. M, Hassanzadeh
Proceeding: Presented at Fontevraud 8, Avignon, France, September 15-18 2014
III. MOISTURE LEVELS AND DRYING POTENTIAL OF THE CONCRETE IN
SWEDISH REACTOR CONTAINMENTS
M, Oxfall. M, Hassanzadeh P, Johansson
EPJ Web of conferences, 2013. 56, 03002
IV. LONG-TERM HYGROTHERMAL PERFORMANCE OF NUCLEAR REACTOR
CONCRETE CONTAINMENTS – LABORATORY EVALUATION OF
MEASUREMENT SETUP, IN SITU SAMPLING, AND MOISTURE FLUX
CALCULATIONS
M, Oxfall. P, Johansson. M, Hassanzadeh
Cement and Concrete Composite, 2016. 65 128–138
V. MOISTURE AND TEMPERATURE MEASUREMENTS IN POROUS MATERIALS
UNDER NON-ISOTHERMAL CONDITIONS – EVALUATION AND ERROR
LIMITATION
M, Oxfall. P, Johansson. M, Hassanzadeh (Manuscript)
VI. A MODEL TO PREDICT THE MOISTURE DISTRIBUTION OF THE CONCRETE
STRUCTURES INSIDE NUCLEAR REACTOR CONTAINMENTS, AND ITS
MOISTURE CONTRIBUTION TO THE ENVIRONMENTAL CONDITION
M, Oxfall. M, Hassanzadeh. P, Johansson. (Manuscript)
V
Contribution of co-authors
1. MO came up with the idea for the paper, planned the study, and collected and
prepared the specimens with assistance from PJ. MO performed the
measurements and analysis, and wrote the manuscript. MH and PJ contributed in
planning the measurements and commented on the manuscript.
2. MO came up with the idea for the paper, planned the evaluation, collected and
analysed the results and wrote the manuscript. MH and PJ commented on the
manuscript.
3. MO came up with the idea for the paper, designed the measurement setup,
conducted the measurements, analysed the results and wrote the manuscript. MH
and PJ contributed in planning the study, assisted in each step, and commented on
the manuscript
4. MO came up with the idea for the paper, designed the measurement setup,
designed and assembled the experimental set-up, conducted the measurements,
analysed the results and wrote the manuscript. MH and PJ contributed in planning
the study, assisted in each step, and commented on the manuscript
5. MO came up with the idea for the paper, designed the measurement setup,
produced the specimens, designed and assembled the experimental set-ups,
conducted the measurements, designed and established the FEM models with
theoretical assistance from Bojan Stojanovic and Magnus Åhs, analysed the results
and wrote the manuscript. MH and PJ contributed in planning the study, assisted
in each step, and commented on the manuscript.
6. MO came up with the idea for the paper, established the model, designed and
wrote the MATLAB subroutines, planned and executed and analysed the
measurements, analysed the results and wrote the manuscript. MH and PJ
contributed in planning the study, assisted in each step, and commented on the
manuscript.
VI
Abstract
Safety is the top priority at a nuclear facility. The nuclear power plants are designed to
prevent radioactive leakage to the surroundings, both during normal operation as well as in
case of a severe accident. One of the most important structures in a nuclear power plant,
with regard to safety, is thus the reactor containment wall. The containment wall is the last
main barrier to prevent radioactive leakage, and it is designed to limit and control internal
hazards if all other barriers fail. In order to understand and identify the potential deviation
of the barrier, the effects of changes in the materials and how these changes occur and
propagate have to be understood.
The work presented in this thesis concerns the moisture condition within nuclear reactor
containment inner walls in addition to other concrete structures within the containments.
The study aims to describe earlier, ongoing and future moisture contributions, and
redistribution of moisture within and from the concrete structures within the containments.
An in situ measurement setup for long term monitoring of relative humidity and
temperature in concrete was designed and installed in four reactor containments. The setup
was used to monitor the actual conditions within the containments and in the concrete
structures, and how they change over time. The measurements showed that all
containments within the study complied with the regulated conditions with regard to
temperature. The stable humidity in the air within the containments indicated that the
dehumidification apparatus at the sites worked as anticipated, and that the measured
conditions can be considered as "as-designed conditions", even though there is no
regulation regarding permissible humidity. The results from the monitoring campaigns
were further used to validate a model which was designed to describe the ongoing drying
and moisture redistribution in the concrete structures.
The measurements and simulations done in this study show that the concrete structures
within the reactor containment are still drying after approximately 30 years of operation,
and will continue to dry and contribute with moisture to the ambient compartment for the
remaining part of the service life for the reactors. The simulations presents that 35–45 % of
the initial evaporable water had dried out, until this study, and that the amount for 60 years
of operation is 45–55 %. The main drying has already occurred, and the moisture
contribution to the ambient compartments will continue to decrease, thus contributing less
moisture to the air in the containment in the future.
Keywords: Nuclear power plant, concrete, in site measurements, relative humidity, boiling
water reactor, pressurized water reactor, mass transport.
VII
Sammanfattning
Inom kärnkraftsindustrin är säkerhet den aspekt som prioriteras högst. Alla kärnkraftverk
är designade för att i högsta möjliga mån förhindra läckage av radioaktivetet till
omgivningen, både under drift och i händelse av en allvarlig olycka. Med anledning av detta
är reaktorinneslutningens vägg en av de viktigaste säkerhetsrelaterade konstruktionerna vid
en anläggning, detta då denna konstruktionsdel är den sista barriären för att förhindra ett
läckage av radioaktiva partiklar. Reaktorinneslutningens vägg är designad för att begränsa
och kontrollera effekten av inre olyckor om övriga barriärer fallerat. För att förstå och
identifiera potentiella förändringar, samt effekter från åldring, av barriären behövs en ökad
förståelse för hur ingående material ändras över tid.
Arbetet som presenteras i den här avhandlingen berör främst fuktförhållanden i
reaktorinneslutningarnas väggar och till viss del övriga betongkomponenter lokaliserade i
inneslutningarna. Studiens mål var att beskriva den tidigare, pågående, och framtida
omfördelningen av fukt, både i betongkonstruktionerna samt fuktbidraget från betongen.
En mätuppställning för in situ långtidsmätning av relativ fuktighet och temperatur i betong
designades och installerades för monitorering i fyra olika reaktorinneslutningar.
Utrustningen användes för att mäta de aktuella förhållandena samt för att studera
variationer över tid. Mätningarna gjordes både i inneslutningarnas betongkonstruktioner
samt i omgivande luft. De utförda mätningarna visade att de temperaturer som uppmättes
svarade mot de krav som ställts på konstruktionen. Vidare indikerade den stabila relativa
fuktigheten i inneslutningarnas luft att anläggningarnas avfuktning fungerade väl och att
det bör kunna antas att rådande nivåer överensstämmer med de avsedda fuktnivåerna.
Resultaten erhållna från monitoreringen användes vidare för att validera en modell
framarbetad för att beskriva den pågående uttorkningen och omfördelningen av fukt i
inneslutningarnas betongkonstruktioner.
De samlade resultaten från simuleringarna och mätningarna i studien visar att uttorkning
av reaktorinneslutningarnas betong fortfarande pågår efter runt 30 år i drift. Betongen
kommer även i fortsättningen att bidra med fukt till inneslutningens utrymmen, enligt
simuleringarna ända fram till dess att verken tas ur drift. Den sammanlagda uttorkningen
fram till de utförda mätningarna motsvarar i storleksordningen 35–45 % av betongens
initiala förångningsbara vatten. Motsvarande värde vid 60 års drift förutspås vara 45–55 %,
huvuddelen av betongkonstruktionernas uttorkning har således redan inträffat och
fukttillskottet till inneslutningens luft kommer att avta med tiden.
Nyckelord: Kärnkraftverk, betong, in situ mätningar, relativ fuktighet, kokvattenreaktorer, tryckvattenreaktorer, masstransport.
VIII
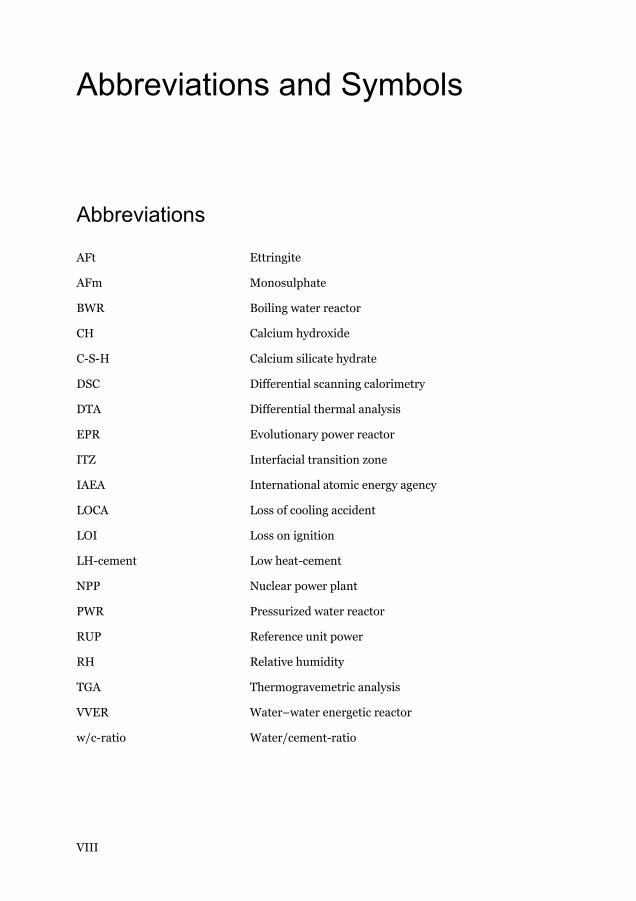
Abbreviations and Symbols
Abbreviations
AFt Ettringite
AFm Monosulphate
BWR Boiling water reactor
CH Calcium hydroxide
C-S-H Calcium silicate hydrate
DSC Differential scanning calorimetry
DTA Differential thermal analysis
EPR Evolutionary power reactor
ITZ Interfacial transition zone
IAEA International atomic energy agency
LOCA Loss of cooling accident
LOI Loss on ignition
LH-cement Low heat-cement
NPP Nuclear power plant
PWR Pressurized water reactor
RUP Reference unit power
RH Relative humidity
TGA Thermogravemetric analysis
VVER Water–water energetic reactor
w/c-ratio Water/cement-ratio
IX
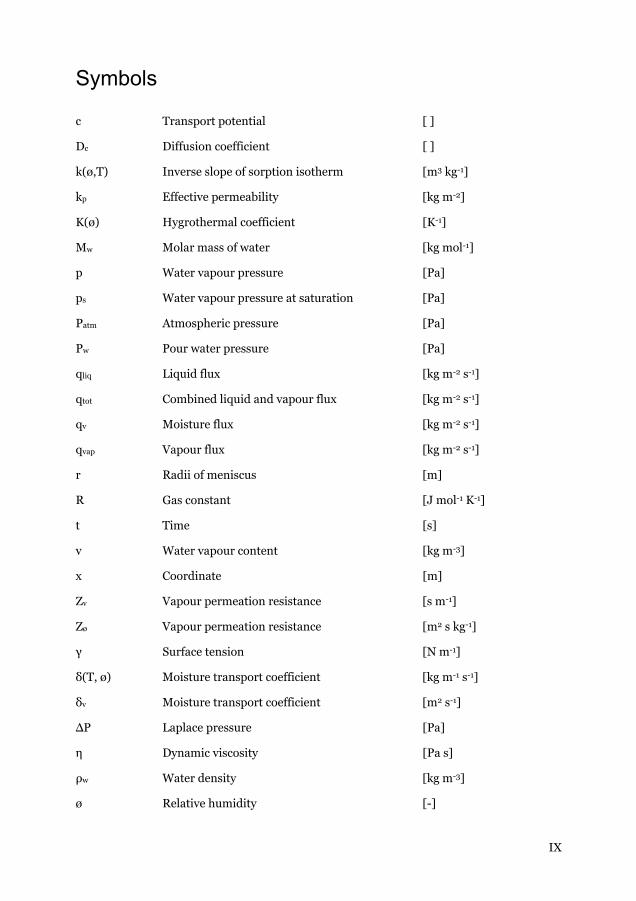
Symbols
c Transport potential [ ]
Dc Diffusion coefficient [ ]
k(ø,T) Inverse slope of sorption isotherm [m3 kg-1]
kp Effective permeability [kg m-2]
K(ø) Hygrothermal coefficient [K-1]
Mw Molar mass of water [kg mol-1]
p Water vapour pressure [Pa]
ps Water vapour pressure at saturation [Pa]
Patm Atmospheric pressure [Pa]
Pw Pour water pressure [Pa]
qliq Liquid flux [kg m-2 s-1]
qtot Combined liquid and vapour flux [kg m-2 s-1]
qv Moisture flux [kg m-2 s-1]
qvap Vapour flux [kg m-2 s-1]
r Radii of meniscus [m]
R Gas constant [J mol-1 K-1]
t Time [s]
v Water vapour content [kg m-3]
x Coordinate [m]
Zv Vapour permeation resistance [s m-1]
Zø Vapour permeation resistance [m2 s kg-1]
γ Surface tension [N m-1]
δ(T, ø) Moisture transport coefficient [kg m-1 s-1]
δv Moisture transport coefficient [m2 s-1]
ΔP Laplace pressure [Pa]
η Dynamic viscosity [Pa s]
ρw Water density [kg m-3]
ø Relative humidity [-]
X
Table of Contents
Preface III
List of appended papers IV
Contribution of co-authors V
Abstract VI
Sammanfattning VII
Abbreviations and Symbols VIII
Abbreviations VIII
Symbols IX
Table of Contents X
1 Introduction 1
1.1 Background 1
1.2 Aim and research objectives 3
2 Nuclear power plant 5
2.1 Reactor safety 6
2.2 Pressurized water reactor 9
2.3 Boiling water reactor 11
2.4 Nordic reactor containments – similarities and differences 12
2.5 As-designed climatic conditions 13
2.6 Actual climatic conditions 14
3 Moisture transport 17
4 Determination of material properties 21
4.1 Material 23
4.2 Moisture transport properties 25
4.2.1 Epoxy vapour permeation resistance 29
4.2.2 Moisture transport coefficient 34
XI
4.3 Variation in degree of hydration 42
4.3.1 Measurements and results 44
5 Monitoring campaigns 49
5.1 Measurements at Ringhals 1 51
5.2 Measurements at Forsmark 2 53
5.3 Measurements at Forsmark 3 56
5.4 Measurements at Ringhals 4 59
6 Moisture contribution 63
7 Concluding remarks 69
8 Future Research 73
Reference 75
Appendix 1 81

1
1 Introduction
1.1 Background
The reactor containment is one of the most important structures in a nuclear power plant
(NPP), as the containment wall is the final barrier that protects the surrounding area from
radioactive leakage, both during normal operation and in case of an accident. The main
function of this structure is thus to envelop and protect the reactor vessel. There are several
types of NPPs, and the design of the reactor containment can differ, both in size and shape.
Two of the Nordic countries, Sweden and Finland, have nuclear power as an electric power
source, as of 2015. The Nordic NPPs, which are in operation, were all built during the period
from the late 1960s to the mid-1980s. Three different types of NPPs were in operation in
2015: boiling water reactor (BWR), pressurized water reactor (PWR) and water–water
energetic reactor (VVER). The Nordic BWRs were designed by ASEA-Atom, the PWRs were
manufactured by Westinghouse, and the VVER by Atomstroyexport.
The climatic condition, i.e. humidity and temperature, inside the containments is monitored
continuously by the plant owners, mainly to monitor the conditions in specific zones close
to sensitive equipment and to detect steam leakage. The climatic conditions inside the
reactor containment may affect different mechanical components because of the moisture
or temperate conditions. There are many building components, such as joints, fastening
plates, pipe or cable lead-throughs, and other components that may be affected by climatic
conditions. With a combination of high humidity and high temperature, surface
condensation on cold surfaces may occur. Constant exposure of a metal surface to humidity
may lead to surface corrosion. Thus, the climatic condition within the reactor containment
is an area of importance for prediction of the life of the equipment.
The climatic conditions in the containments vary not only between different reactors and
within each containment, but also with time. These variations will affect the concrete
structures because of the interaction between the containment and the concrete
components. The climatic conditions inside a reactor containment are affected by the
boundary conditions. The boundary is defined as the contact zone between the air in the
reactor containment and the concrete surfaces inside the containment. The humidity
conditions inside the containment will, in addition, decide to what level the concrete
structural elements will eventually dry when in equilibrium with its surrounding, a state not
likely to be achieved over the technical lifespan of the containment.
2
The main source of moisture inside a containment is generally presumed, within the nuclear
industry, to be water leaking from steam pipes. The other potential sources are, e.g. the
suppression pool in the BWR and the large amount of concrete within the reactor
containment. The air within the containments is dehumidified during operation; however,
the amount of water extracted has not been well documented and/or is not accessible. This
limits the possibility to derive and quantify the actual moisture contribution to the
containment from potential sources. However, in this study, it is considered that concrete
may have a notable effect, as it is a large moisture source.
The most widely used building material to construct reactor containments is concrete. Close
to 95 % of the NPPs constructed between 1971 and 1999, worldwide, have some type of
concrete containment [1]. Most of the containments are single-walled structures with
prestressed concrete, or single-walled structures with only conventional reinforced
concrete, or double-walled structures of conventional reinforced concrete with or without
prestressing [1]. Both single-walled structures and double-walled structures are normally
constructed with a steel liner to ensure leak tightness. The steel liner is either embedded in
the concrete wall or installed on one of the concrete surfaces. When the steel liner is
embedded, the wall is divided to an outer and an inner containment wall.
Apart from reasonably high compressive strength and good durability, which may be
considered beneficial for a nuclear facility, there are additional properties or parameters
relevant to a nuclear facility such as thermal conductivity, heat capacity [2], moisture
transport coefficient, creep and shrinkage [3], gas permeability [4], and neutron and
gamma radiation shielding properties [2, 5]. Most of these properties or parameters are
dependent on the moisture content as well as on the water to cement ratio (w/c-ratio),
degree of hydration, and cement type and content.
Moisture content in concrete has been studied in several fields for decades, mainly focusing
on drying of concrete slabs and walls in buildings, e.g. [6, 7], the influence of moisture
content on creep and shrinkage, e.g. [8-12] and degrading mechanisms such as alkali silica
reactions [13] and frost related damage, e.g. [14, 15]. Most moisture related studies on
concrete have been carried out in a laboratory controlled environment or as computer
simulations; only a few studies have been based on environmental effects in the field, e.g.
[16, 17]. No systematic measurements or studies on the moisture condition within reactor
containments and internal concrete components have been presented. There are however a
few studies where the moisture level has been estimated [5, 18] or measuring techniques
have been evaluated [19]. Some measurements and models have also been made to
primarily evaluate the conditions in the outer wall of a containment [18, 20-22]. These
studies will be further discussed in Section 2.6.
Knowledge of the state of concrete structures in a reactor containment is important,
especially for considering long-term operation. Because of the long-term exposure of the
structures to high temperatures, it is necessary to evaluate how these conditions affect the
concrete structures, and also whether the drying rate is sufficiently large to impact ambient
3
humidity. High temperatures in combination with low ambient relative humidity (RH)
could result in a large transport potential for drying of the concrete.
The climatic conditions inside a nuclear reactor containment change over the years. How
these changes affect the concrete structures within the containment, and whether the
concrete itself affects the containment, have not yet been fully investigated. Thus, the
knowledge of the moisture history and the possibility of predicting its development with
time are of great value for assessing the current and future conditions of concrete
structures.
1.2 Aim and research objectives
The aim of the research project presented in this thesis was to investigate and evaluate the
climatic conditions inside nuclear reactor containments, historically, at present, and in
future. Though the knowledge of the inner climate of a reactor containment and the
condition of the concrete structure within the containment are important in order to
evaluate their long-term effects on the containment, no studies dealing with climate
conditions inside a nuclear containment have been carried out so far.
The main research objectives prior the project were the following.
I. Suggest and develop surveillance methods – i.e. measurement devices, measurement locations, data acquisition systems, etc. to determine the exposure conditions around the structural elements and the impact of these conditions on the structural elements. Chapter: 5 Papers: III, IV, V
II. Clarify the temperature and humidity conditions in the containments, by explaining and quantifying them. Chapters: 2, 5, 7 Papers: I, II, III, IV, VI
III. Compare the as-designed climatic conditions around the structural elements with the actual conditions and explain the differences between them. If necessary, suggest remedial actions to re-establish the as-designed conditions. Chapters: 2, 7 Paper: VI
IV. Determine whether there are any differences between two containments of the same type with regard to temperature and moisture conditions, and explain the reason for the differences. Chapters: 2, 5, 6, 7 Papers: II, III, IV, VI
V. Determine the moisture flow inside and through concrete structures and quantify the possible consequences. Chapters: 3, 4, 6, 7 Papers: II, IV, VI
VI. Develop guidelines for new build in order to avoid differences between the prescribed conditions and working conditions. Chapter: 2, 7 Paper:

4
2
A nuclear
facilities a
There are
followed
only the N
Sweden a
electric p
construct
were ten
the bigge
sites in Sw
BWRs eac
Finland h
BWRs in
construct
study.
Most of th
another N
Oskarsha
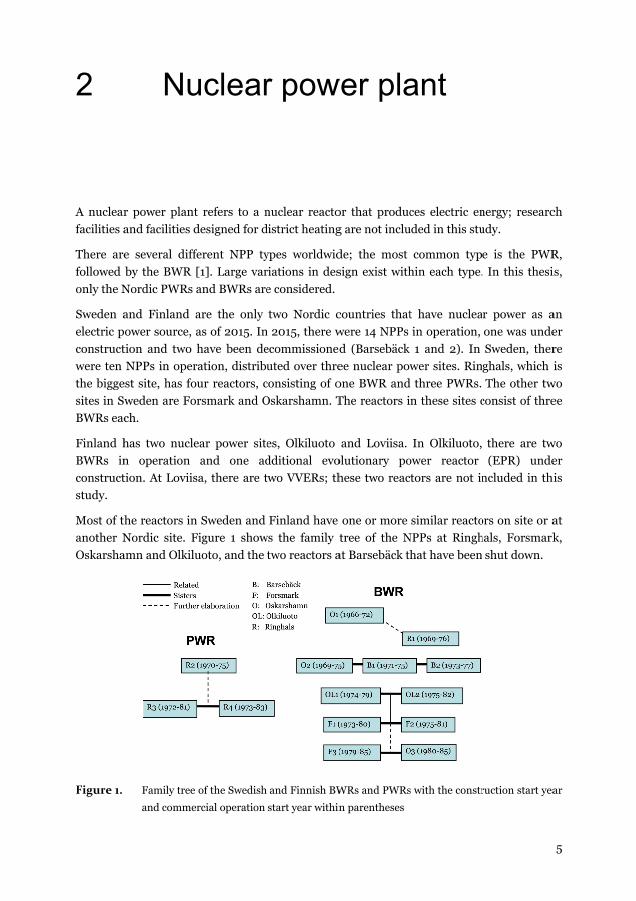
Figure 1.
Nu
r power plant
and facilities d
e several diff
by the BWR
Nordic PWRs
and Finland a
ower source,
tion and two
NPPs in oper
est site, has fo
weden are Fo
ch.
has two nucle
n operation
tion. At Loviis
he reactors in
Nordic site. F
amn and Olkilu
Family tree
and comme
uclear
t refers to a n
designed for d
ferent NPP ty
[1]. Large var
and BWRs are
are the only
as of 2015. In
have been de
ration, distribu
our reactors, c
orsmark and O
ear power site
and one ad
sa, there are t
n Sweden and
Figure 1 show
uoto, and the t
of the Swedish
ercial operation
r pow
nuclear reacto
district heating
ypes worldwid
riations in des
e considered.
two Nordic c
n 2015, there w
ecommissione
uted over thre
consisting of o
Oskarshamn. T
es, Olkiluoto
dditional evo
two VVERs; th
Finland have
ws the family
two reactors a
and Finnish BW
start year within
wer pla
or that produc
g are not inclu
de; the most
sign exist with
countries that
were 14 NPPs
ed (Barsebäck
ee nuclear pow
one BWR and
The reactors i
and Loviisa.
olutionary po
hese two reac
one or more
tree of the N
at Barsebäck th
WRs and PWRs
n parentheses
ant
ces electric en
uded in this stu
common typ
hin each type.
t have nuclea
in operation,
1 and 2). In
wer sites. Rin
d three PWRs.
n these sites c
In Olkiluoto,
ower reactor
tors are not in
similar reacto
NPPs at Ringh
hat have been
s with the constr
nergy; researc
udy.
e is the PWR
. In this thesi
ar power as a
one was unde
Sweden, ther
nghals, which i
The other tw
consist of thre
there are tw
(EPR) unde
ncluded in thi
ors on site or a
hals, Forsmark
shut down.
ruction start yea
5
ch
R,
is,
an
er
re
is
wo
ee
wo
er
his
at
k,
ar
6
Only four of the Nordic NPPs were further evaluated in this work. The reactors were chosen
to represent four of the five different groups, as presented in Figure 1. The PWRs are
represented by Ringhals 4; Ringhals 1 represents the old generation BWR, Forsmark 2; the
four Swedish and Finnish BWRs and Forsmark 3 represent the newest BWRs.
2.1 Reactor safety
The reactor building and the structures within are the main structures at an NPP.
Depending on the reactor design, the reactor building can be either the building envelope
housing the reactor containment, or the actual containment itself. The main purpose of the
reactor containment is the following, according to the International Atomic Energy Agency
(IAEA) [23].
Isolate radioactive substances during operation and in the event of an internal and/or external accident.
Protect the NPP from natural and human induced events. Shield radiation during operation and in accidental conditions.
Safety is the main focus at an NPP, and the strategy for safety is called defence in depth
[24]. The strategy consists of five levels of safety, with the principle that if one level fails, the
next will take over. The main objective is to prevent accidents, but if the prevention fails, the
strategy is designed to limit the potential consequences and prevent any development into
more serious conditions. Level 1 in the defence strategy corresponds to prevention of
abnormal operation through conservative design and high quality, while Level 5
corresponds to the situation when the containment fails with significant release of
radioactive material as a consequence [24].
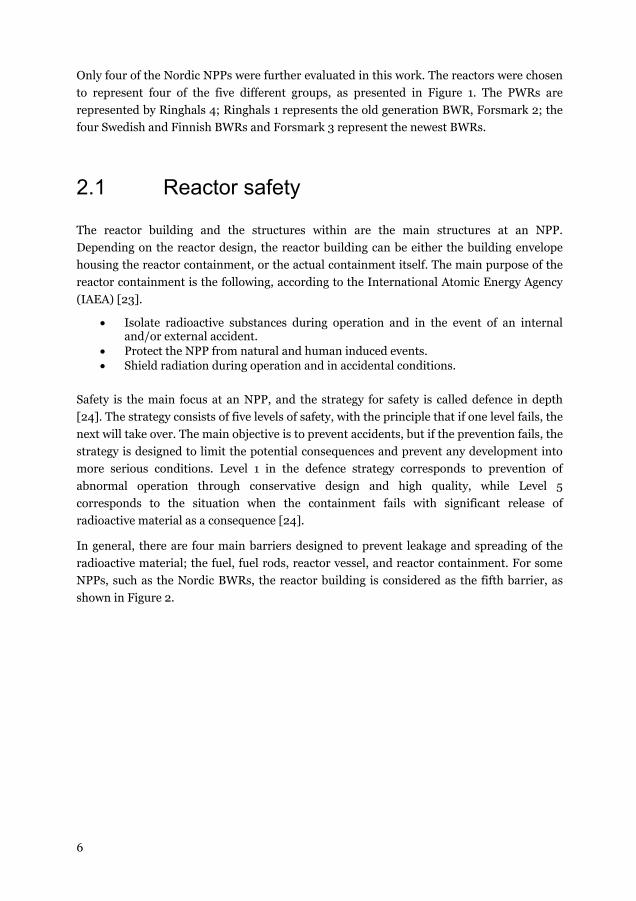
In general, there are four main barriers designed to prevent leakage and spreading of the
radioactive material; the fuel, fuel rods, reactor vessel, and reactor containment. For some
NPPs, such as the Nordic BWRs, the reactor building is considered as the fifth barrier, as
shown in Figure 2.
Figure 2.
The react
control t
containm
Leakage
accident.
The exte
tornadoes
ensure th
that indu
The main
B B S
o C
s I
An LOCA
possible s
breaks. I
rapidly, a
inside the
The four m
surrounding
building en
complemen
permission)
tor containme
the radioactiv
ment one of the
of radioactive
The possible
ernal acciden
s (with flying
hat the leak ti
ces an interna
n internal accid
Break in high Break in systeSystem transior dynamic loContainment systems or steInternal hazar
A is considere
scenario when
n this scenar
affecting the r
e reactor vesse
main safety bar
gs during opera
nvelop outside
ntary barrier.
)
ent is the las
ve material
e most importa
e material to
accidents can
ts are, earth
debris), airpl
ightness is no
al accident, e.g
dents or event
energy systemems containingents causing rads) bypass eventseam generatorrds
ed as a basic
n an LOCA ca
rio, the pressu
reactor contai
el drops, and i
rriers for preve
ation and in the
e the containm
(Figure owned
st main barrie
if the other
ant structures
the surroun
be divided int
hquakes, floo
lane crash, et
ot jeopardized
g. because of a
ts can be subd
ms g radioactive mrepresentative
s such as loss or tube rupture
accident cond
n occur is wh
ure and temp
inment with a
if the safety sy
enting leakage
e event of an ac
ment, this can
d by Vattenfa
er, and the st
barriers fail
s in an NPP.
ndings is the
to two main g
ding, tsunam
tc. In these ca
d. External acc
a station black
divided into fiv
material e limiting load
of cooling acc
dition for a re
hen one of the
perature insid
a high interna
ystems which
of radioactive
ccident. If the N
n be considere
all AB, publis
tructure has t
l. This make
primary risk
groups, interna
mis, extreme
ases, the conta
cidents may a
out.
ve categories [
ds (e.g. pressur
cidents (LOCA
eactor contain
e pipes in the
de the contain
al pressure. T
are expected t
material to th
NPP has a reacto
ed as the fift
shed with the
to contain an
es the reacto
in case of a
al and externa
cold or hea
ainment has t
also be a facto
25].
re, temperatur
A) in interfacin
nment [1]. On
primary circu
nment increas
The water leve
to maintain th
7
he
or
th
eir
nd
or
an
al.
at,
to
or
re
ng
ne
uit
se
vel
he
8
cooling of the core fail, there is a risk of core melt accident, making the event a serious
accident with high temperature and high internal pressure.
If the containment is not leak tight, an LOCA-scenario could result in a leakage of
radioactive material to the surroundings. In a PWR, depending on the containment design,
an LOCA normally generates a pressure increase of approximately 0.5 MPa and a peak
temperature of 150 °C. For a BWR, the corresponding pressure is 0.6 MPa and the
temperature is 170 °C [1]. The leak tightness of the Nordic containments is tested thrice
during every ten-year period to ensure that the structure can handle the high pressure.
The strategies to control the pressure increase vary depending on the reactor design. The
PWRs used in Sweden employ a design concept called full pressure dry containment. To
withstand the increased temperature and steam build-up, the containment has a large
volume, and thus the pressure increase is limited without jeopardising the structure and
leak tightness.
The BWRs in Sweden and Finland use a pressure suppression containment system. The
containments are divided into two main compartments, drywell and wetwell, connected
with several downcomers. In the wetwell, there is a suppression pool in which the
downcomers are submerged. In case of a steam leakage in the drywell, the steam will be
forced down into the suppression pool for condensation, thus reducing the pressure.
In the event of a core melt accident, the fuel cladding around the fuel melts, and hydrogen is
produced. To avoid the risk from oxy-hydrogen gas, the air in the BWRs is replaced by
nitrogen when the plant is in operation. In a PWR, the total space of the reactor
containment is big enough so that a dangerous concentration of the gas cannot occur. In
addition, the Swedish and Finnish reactors have an emergency ventilation system that can
filter the radiation from the gas, thereby lowering the risk from oxy-hydrogen gas and
decreasing the pressure within the containment in case of an accident.
As a result of nuclear reactions within the reactor core, different types of radiations are
produced. To lower the radiation within the NPP, different types of radiation shields are
used. Different materials have varying abilities to shield radiation. Apart from materials
such as lead and steel, concrete is a suitable material owing to its high density and the
presence of internal water.
The neutron and gamma radiation shielding properties have been investigated in several
studies [2, 5, 26-33], often with the attended use in nuclear facilities. The major forms of
radiation that escape from the reactor core are high-energy gamma rays and neutron
radiations. The reactor vessel absorbs most of the energy from the radiations, and most of
the remaining radiation is thereafter absorbed in the biological shield.
The neutron attenuation in concrete is due to the chemical composition of the hydrated
cement, and mainly the amount of hydrogen. Because of this, the attenuation is strongly
dependent on the moisture content in the concrete, the main source of hydrogen in
concrete. One example of the moisture influence is stated by Thorn in 1961, who showed
that lowe
relaxation
Gamma r
radiation
density of
the gamm
loss due t
2.2
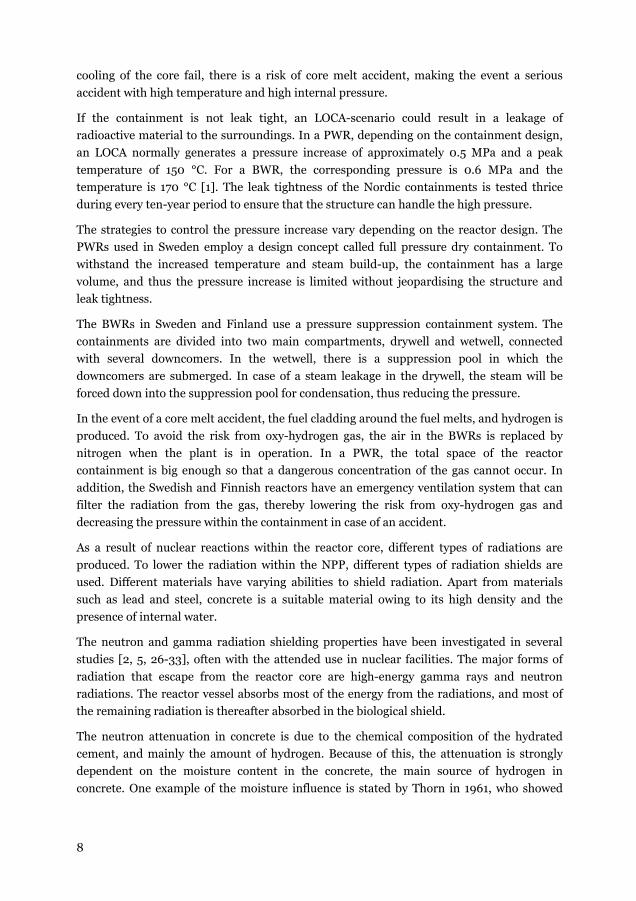
The PWR
the react
circuits.
pressuriz
used to pr
Figure 3.
Both the
containm
pressure
a large
ering of mois
n length by 30
ray shielding d
. The shieldin
f the material
ma ray relaxati
to drying [2].
Pre
R is the most w
or function is
The primary
ed water thro
roduce steam,
Reactor des
where press
produce ste
AB, publish
e primary ci
ment in a PW
dry containm
volume. The
sture content
0 % [2].
does not depe
ng property th
l. Test results
ion length inc
ssurized
widely used r
s shown in F
y circuit inclu
ugh nuclear fi
, which is used
sign and basic f
surized water is
eam to propel th
hed with their pe
rcuit and th
R, thus requi
ment design str
total volum
in concrete
nd on the moi
hat affects the
with radiation
creases by the
d water
eactor type in
Figure 3, whic
udes the reac
ission. In the s
d to propel the
function of a PW
produced in th
he turbines in th
ermission)
he steam gen
iring a large
rategy, as men
me within the
by five perce
isture content
e gamma ray
n at 3 MeV (m
same magnitu
reactor
n the world. T
ch illustrates
ctor vessel, w
secondary circ
e turbines and
WR. The PWR
he reactor and th
he steam genera
nerator are l
volume. This
ntioned in Sec
e PWR cont
entage points
t in the same w
radiation atte
mega-electron
ude as the inv
The fundamen
the primary
which produc
cuit, the press
d generate elec
is divided into
he other which
ator. (Figure own
located withi
is well adap
ction 2.1, whic
tainment at
s increases th
way as neutro
enuation is th
volt) show tha
verted moistur
ntal principle o
and secondar
ces overheate
surized water i
ctrical energy.
two circuits, on
uses the water t
ned by Vattenfa
in the reacto
pted to the fu
ch also require
Ringhals 4 i
9
he
on
he
at
re
of
ry
ed
is
ne
to
all
or
ull
es
is
10
app
app
For
hou
The
em
tigh
ver
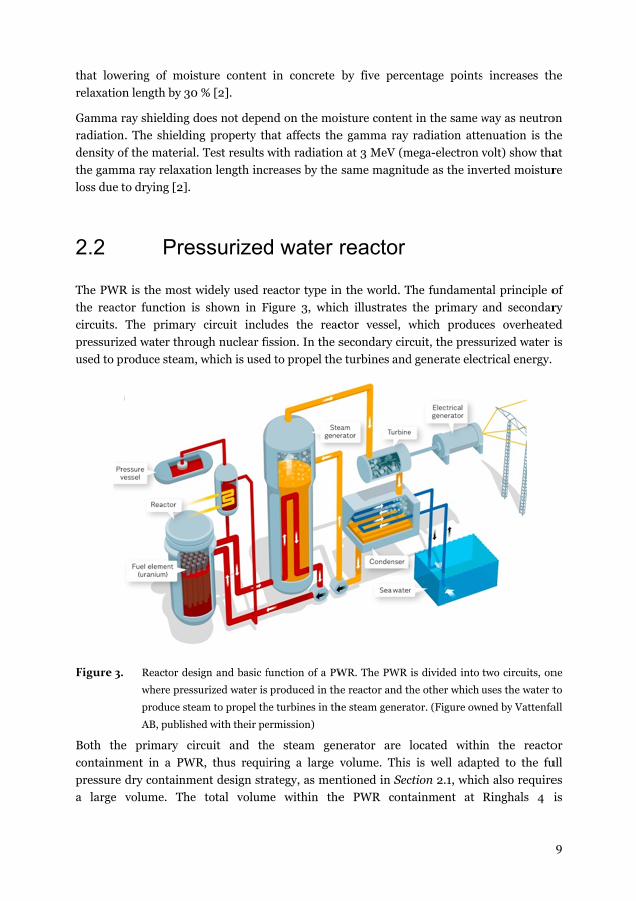
Ap
int
col
rea
shi
rea
is 8
PW
Fig
proximately 5
proximately 6
r single-walle
using the cont
e Nordic PWR
mbedded steel
htness. The o
rtically prestre
art from the
ernal concrete
lumns for the
actor vessel, w
ield. The thic
actors, they ar
8000 m3 for th
WRs.
gure 4. Sche
the g
repre
55,000 m3, an
0,000 m3 [1].
d full pressur
tainment; inst
Rs have a sing
liner located a
outer part of
essed. The inn
inner contain
e structures, i
e internal com
which is locate
ckness of the
re approximate
he Nordic PW
ematic illustratio
general design.
esent the concre
nd most PWR
re dry contain
tead, the cont
gle prestressed
approximately
the wall (out
ner containmen
nment wall an
including the
mponents, e.g.
ed in the lowe
shield can va
ely 2 m thick.
WRs. Figure 4 i
on of a PWR. Th
The thick black
ete.
Rs around the
nments, there
tainment wall
d, 1.1 m thick,
y 300 mm fro
ter containme
nt wall is mad
nd the bottom
fuel handling
steam gener
er part of the
ary for differ
The total con
illustrates the
he illustration is
k lines represen
e world have
e is normally
is exposed to
concrete cont
om the inner s
ent wall) is b
de of reinforce
m slab, there a
g pool and loa
rators and pre
containment
rent reactors,
ncrete volume
section of a P
s not to scale, b
nt the steel line
e an inner vol
no building e
o the outdoor
tainment wall
surface to ensu
both horizonta
d concrete.
are a vast am
ad bearing wa
essurizer. Aro
, there is a bi
but for the S
within the ste
PWR, based on
ut only an illust
rs and the grey
lume of
envelope
climate.
with an
ure leak
ally and
mount of
alls, and
und the
iological
Swedish
eel liner
n Nordic
tration of
surfaces
2.3
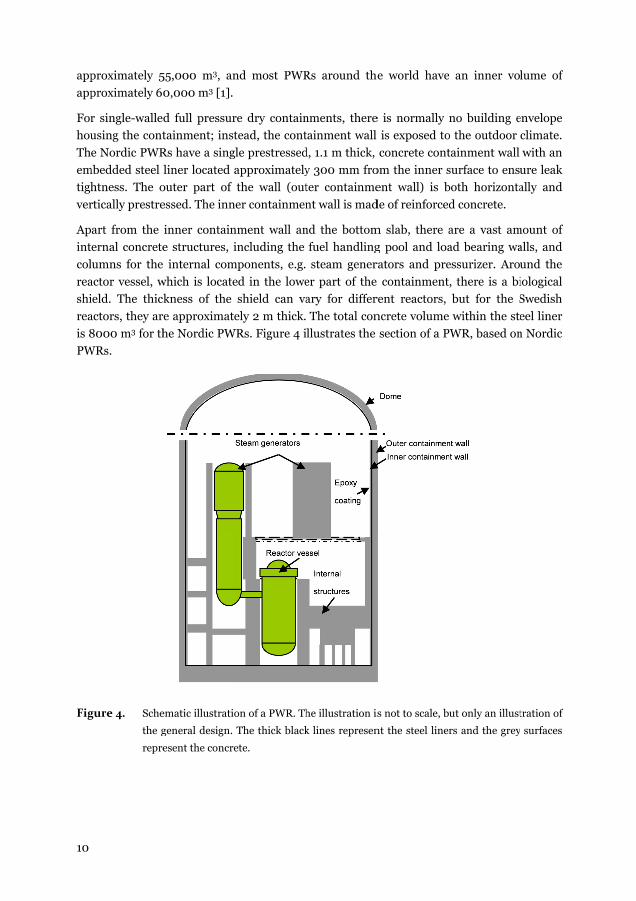
The boilin
reactor d
reactor ve
BWR is gi
Figure 5.
Because
containm
PWRs. A
The Nord
protecting
prestresse
approxim
inner surf
The react
compartm
reactor ve
made of p
the differ
reactor v
drywell.
Boil
ng water reac
esign is based
essel and later
iven in Figure
Reactor des
reactor and
Vattenfall A
of the press
ment can be sig
typical BWR c
dic BWRs are
g the contain
ed single-wal
mately 1.1 m th
face. The steel
tor containme
ments, drywel
essel and mai
prestressed or
rent reactors, b
essel is consi
ling wate
ctor BWR is th
d on one prim
r used to prop
e 5.
sign and basic fu
d later used to
AB, published wi
sure suppress
gnificantly sm
containment h
e all located
nment from e
lled concrete
hick, and the
l liner is used
ents are cylin
ll and wetwel
n components
r reinforced co
but normally
dered to be a
er reacto
he second mos
mary circuit wh
el the turbines
unction of a BW
propel the turb
ith their permis
sion design,
maller than lar
has a volume o
within a buil
external sour
with embedd
steel liner is
to ensure leak
drical, and th
ll. The drywel
s. Around the
oncrete. The th
it is approxim
a part of the d
or
st common re
here the steam
s. An illustrati
WR. In a BWR, s
bine in one pri
ssion)
as described
rge dry contai
of approximat
lding envelop
rces. The con
ded steel line
located appro
k tightness of t
he inside regio
ll is the main
e reactor vesse
thickness of th
mately 1–2 m.
drywell, and i
eactor type in
m is produced
ion of the basi
steam is produc
mary circuit. (F
in Section
nments such
tely 12,000 m3
pe, i.e. the re
ntainments ar
ers. Normally,
oximately 300
the containme
on is divided
n compartmen
el, there is a b
he biological s
The compartm
is normally ca
1
the world. Th
d directly in th
ic principle of
ed directly in th
Figure owned b
2.1, the BW
as the Swedis3 [1].
actor building
re all made o
, the walls ar
0 mm from th
ent.
into two mai
nt housing th
iological shiel
hield varies fo
ment below th
alled the lowe
11
he
he
f a
he
by
WR
sh
g,
of
re
he
in
he
ld
or
he
er
12
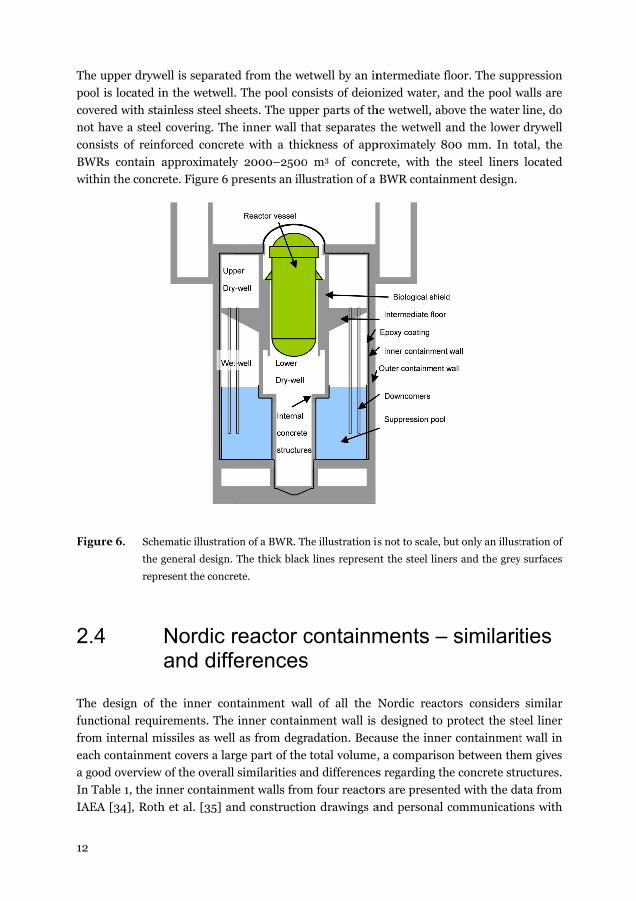
The
poo
cov
not
con
BW
wit
Fig
2.
The
fun
fro
eac
a g
In
IAE
e upper drywe
ol is located in
vered with sta
t have a steel
nsists of reinf
WRs contain a
thin the concre
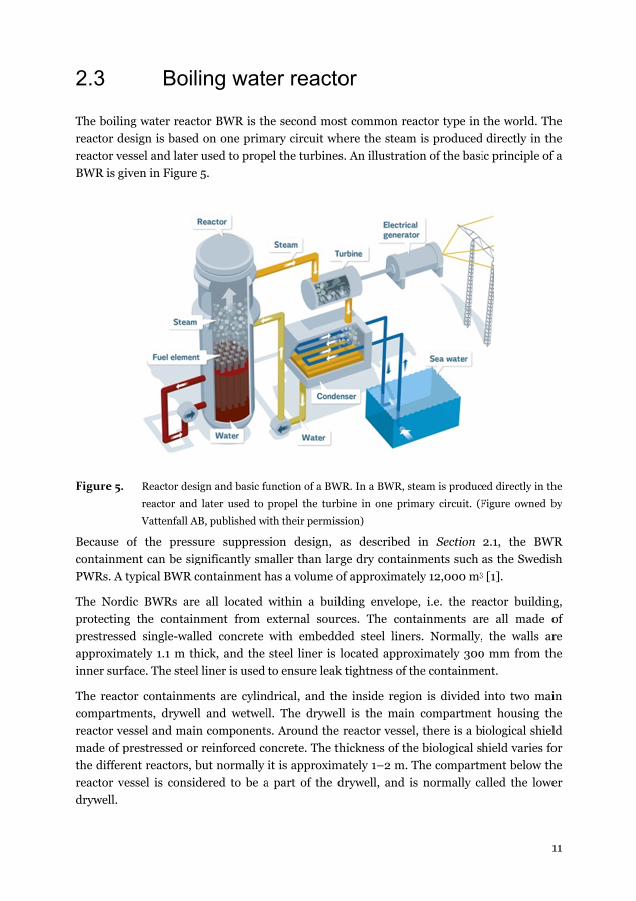
gure 6. Sche
the g
repre
.4
e design of t
nctional requir
m internal m
ch containmen
good overview
Table 1, the in
EA [34], Roth
ell is separate
n the wetwell
ainless steel sh
covering. The
forced concret
approximately
ete. Figure 6 p
ematic illustratio
general design.
esent the concre
Nordic rand diffe
the inner con
rements. The
issiles as well
nt covers a lar
of the overall
nner containm
h et al. [35] an
ed from the we
. The pool con
heets. The upp
e inner wall th
te with a thic
y 2000–2500
presents an illu
on of a BWR. Th
The thick black
ete.
reactor cerences
ntainment wa
inner contain
l as from degr
rge part of the
similarities a
ment walls from
nd constructio
etwell by an in
nsists of deion
per parts of th
hat separates
ckness of app
0 m3 of concr
ustration of a
he illustration is
k lines represen
containms
ll of all the
nment wall is
radation. Beca
e total volume,
nd differences
m four reactor
on drawings a
ntermediate fl
nized water, a
he wetwell, abo
the wetwell a
proximately 80
rete, with the
BWR contain
s not to scale, b
nt the steel line
ments –
Nordic reacto
designed to p
ause the inner
, a comparison
s regarding th
rs are presente
and personal c
loor. The supp
and the pool w
ove the water
and the lower
00 mm. In to
e steel liners
nment design.
ut only an illust
rs and the grey
similarit
ors considers
protect the ste
r containment
n between the
he concrete str
ed with the da
communicatio
pression
walls are
line, do
drywell
otal, the
located
tration of
surfaces
ties
similar
eel liner
t wall in
em gives
uctures.
ata from
ons with
13
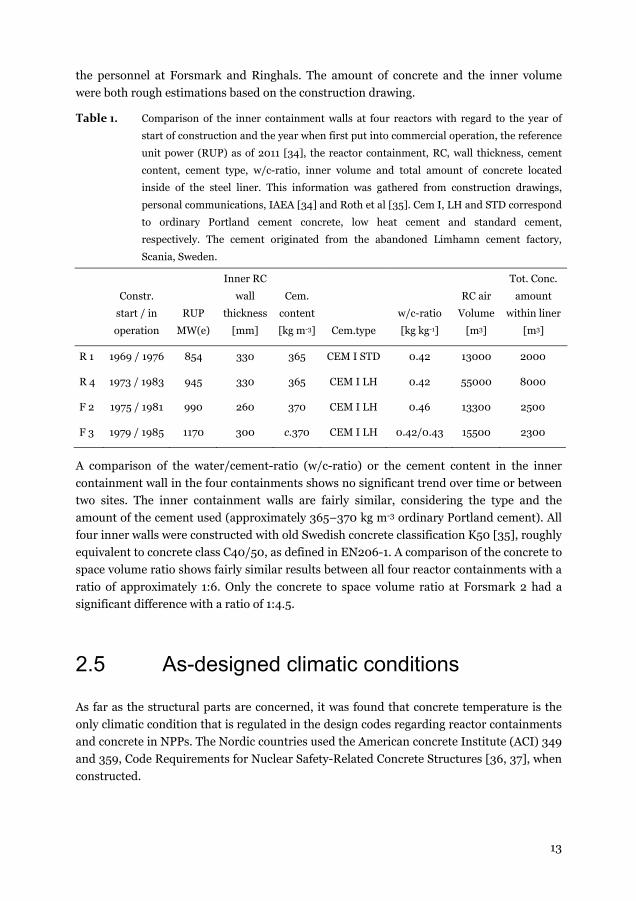
the personnel at Forsmark and Ringhals. The amount of concrete and the inner volume
were both rough estimations based on the construction drawing.
Table 1. Comparison of the inner containment walls at four reactors with regard to the year of
start of construction and the year when first put into commercial operation, the reference
unit power (RUP) as of 2011 [34], the reactor containment, RC, wall thickness, cement
content, cement type, w/c-ratio, inner volume and total amount of concrete located
inside of the steel liner. This information was gathered from construction drawings,
personal communications, IAEA [34] and Roth et al [35]. Cem I, LH and STD correspond
to ordinary Portland cement concrete, low heat cement and standard cement,
respectively. The cement originated from the abandoned Limhamn cement factory,
Scania, Sweden.
Constr.
start / in
operation
RUP
MW(e)
Inner RC
wall
thickness
[mm]
Cem.
content
[kg m-3] Cem.type
w/c-ratio
[kg kg-1]
RC air
Volume
[m3]
Tot. Conc.
amount
within liner
[m3]
R 1 1969 / 1976 854 330 365 CEM I STD 0.42 13000 2000
R 4 1973 / 1983 945 330 365 CEM I LH 0.42 55000 8000
F 2 1975 / 1981 990 260 370 CEM I LH 0.46 13300 2500
F 3 1979 / 1985 1170 300 c.370 CEM I LH 0.42/0.43 15500 2300
A comparison of the water/cement-ratio (w/c-ratio) or the cement content in the inner
containment wall in the four containments shows no significant trend over time or between
two sites. The inner containment walls are fairly similar, considering the type and the
amount of the cement used (approximately 365–370 kg m-3 ordinary Portland cement). All
four inner walls were constructed with old Swedish concrete classification K50 [35], roughly
equivalent to concrete class C40/50, as defined in EN206-1. A comparison of the concrete to
space volume ratio shows fairly similar results between all four reactor containments with a
ratio of approximately 1:6. Only the concrete to space volume ratio at Forsmark 2 had a
significant difference with a ratio of 1:4.5.
2.5 As-designed climatic conditions
As far as the structural parts are concerned, it was found that concrete temperature is the
only climatic condition that is regulated in the design codes regarding reactor containments
and concrete in NPPs. The Nordic countries used the American concrete Institute (ACI) 349
and 359, Code Requirements for Nuclear Safety-Related Concrete Structures [36, 37], when
constructed.
14
In normal operation, the highest long-term concrete temperature allowed is 150 °F
(approximately 66 °C). However, in local areas, e.g. around steam pipe penetrations, the
temperature is allowed to be higher, i.e. up to 200 °F (approximately 93 °C). It is possible to
increase these temperature limits, if tests show that the strength of the concrete is not
lowered under the accepted design criteria because of the increased temperature. Tests
should also provide evidence that the elevated temperatures do not cause deterioration of
concrete [36].
There are also regulations regarding accident inflicted temperatures or short term
temperatures. In these cases, the concrete surface temperature shall not exceed 350 °F
(approximately 176 °C). In local areas, however, the concrete surface is allowed to reach up
to 650 °F (approximately 343°C) from steam or water jets in case of a steam pipe failure
[37].
No recommendations regarding RH levels have been found for the climatic conditions
inside the nuclear reactor containment as well as for the moisture content or RH in concrete
components. IAEA [25] has, however, recommendations to monitor the humidity levels in
the containment during operation, e.g. to detect leakage from the primary circuit.
Because the air within the reactor containments is dehumidified during operation, it is
further assumed that the conditions measured within the containments are "as-designed
conditions". However, details regarding the dehumidification of the reactor containment air
were not found or accessible.
2.6 Actual climatic conditions
The climatic condition in the Swedish reactor containments has previously been studied
primarily with regard to the drying of the outer containment wall, both on BWRs and PWRs
[18, 20, 21, 38]. In these studies, the ambient conditions outside of the outer containment
on three reactors were monitored during operation. The results showed that the
temperature at the surface varied at different heights in the BWR, with temperature of
approximately 50 °C high up and 20 °C down below. The results also showed that the
vapour content inside the reactor building followed that of the outdoor conditions. This
resulted in low RH at higher levels on the containment wall and significantly higher RH at
lower levels. The results also showed that when compared to the temperature inside of the
containment, there was no significant temperature gradient in the containment wall [20]. In
contrast to the BWR, the measurements at the PWR showed that there were large
temperature gradients on those sections of the containment wall that were exposed directly
to the environment [20].
A model was developed and applied to the BWR and PWR containments. The model was
validated using measurements on concrete cylinders, extracted from the outer containment
wall at one of the BWRs [38] and measurements on the outer surface of the containment
15
wall [20]. The model showed good agreement with the measurements, and the moisture
profile in the containment concrete indicated high humidity at greater depths [18]. The
model was also applied to the PWR containment wall; however, it was not validated at
greater depths [21]. The moisture profile at the PWR containment wall was predicted to
decrease with depth owing to the temperature gradient effect on the moisture transport.
As the first step of the work presented in this thesis, the moisture profile was measured with
respect to the degree of capillary saturation. The measurement was done on concrete from
inner and outer containment walls at the PWR Ringhals 4 (Paper I). The results presented
in Paper I show a clear moisture gradient in both inner and outer containment walls, with
high moisture levels at greater depths. These results indicated that the model presented in
the previous study [21] did not properly describe the influence of temperature gradient, a
conclusion later stated by the same author [39].
The earlier studies showed that the temperature and RH varied within the reactor
containments. Temperatures of 20–60 °C and RH of 30–60 % were observed in BWRs
during operation. The measurements within a PWR showed that the temperature on low
levels was in the range of 20–30 °C with a corresponding RH of approximately 50 %, while
the temperature higher up was approximately 40 °C with an RH of approximately 30 %
[21].
An evaluation of the potential factors that may have a significant influence on the internal
temperature and humidity variation during operation is presented in Paper II.
Measurements of temperature and RH in the two reactor containments, one BWR and one
PWR, with the measurement setup developed in this project, were compared with respect to
three identified factors: outdoor temperature, NPP cooling (i.e. seawater temperature), and
the operational state of each reactor. The conclusions drawn in Paper II were that only the
outdoor temperature had a significant influence on the conditions in the PWR. No clear
correlation to the seawater temperature or the operational state (power outage not
included) was found in the PWR or the BWR. The conclusion drawn from the studies was
that the conditions within a BWR should be stable over the years without any significant
difference, while the conditions within a PWR may change from year to year depending on
the ambient conditions, as well as with daily and seasonal changes. The measured
conditions as well as the seasonal trends as observed in Paper II are also found in the work
by Nilsson and Johansson [21].
In this project, the actual conditions in four reactor containments, both in the concrete as
well as in the surroundings, were measured and evaluated. Evaluations of the measuring
technique and setup, as well as the measured results are presented in Papers II, III, IV
and VI. The setup and the results are also briefly presented in Chapter 5.

16
17
3 Moisture transport
Moisture transfer in a porous material is a combination of different transport phenomena.
When describing the transport on a microscale or nanoscale, the transport is often divided
into permeation of liquid water, permeation of gaseous phase, diffusion of water vapour in
gas [40], inter layer water transport and transport in adsorbed water [39]. Gravity induced
transport may be neglected while considering porous media with very small pores [41] such
as concrete. While considering the transport on a macro level, one can combine the different
flows to liquid and vapour flow [39, 42-46]. While using a macroscopic approach, the
material can be considered as a quasicontinuum; thus, it is possible to use volume average
quantities in the model [47]. This also allows the moisture flow [kg s-1] to be expressed as
flux [kg m-2 s-1] for porous materials.
Vapour flux is often described through diffusion, i.e. the motion of moisture molecules due
to difference in concentrations. The motion is randomized, but the total vapour flux can be
described using Fick´s first law of diffusion, as given in Eq. 1.
. (1)
where
qvap. [kg m-2 s-1] Vapour flux
x [m] Coordinate
Dc [ ] Diffusion coefficient
c [ ] Transport potential
The unit of diffusion coefficient is dependent on the unit of transport potential, and hence,
they may be expressed in several ways.
The transport potential c for vapour transport can be described with any of the state
variables–RH, water vapour content v, moisture content w, water vapour pressure p, or
pore water pressure Pw. When in isothermal condition, the transport potential can be
redefined because of the unique relations between the state variables [48] through the
material specific sorption isotherm and the relation described in the Kelvin equation when
combined with the Young–Laplace equation, given by Eq. 2.
18
ln (2)
where
Pw [Pa] Pore water pressure
ø [-] RH
R [J mol-1 K-1] Gas constant
M [kg mol-1] Molar mass of water
ρw [kg m-3] Water density
T [K] Temperature
Liquid transport in a porous material can be divided into viscous saturated flux and
capillary transport. Both can be described by Darcy's law. The viscous flux is valid only if
there is a pressure gradient over the structure. The viscous flow is neglected in this study.
The transport potential for capillary transport is the Laplace pressure ΔP, as given by Eq. 3.
.∆
(3)
where
qliq. [kg m-2 s-1] Liquid flux
kp [kg m-2] Effective permeability
η [Pa s] Dynamic viscosity
ΔP [Pa] Laplace pressure
x [m] Coordinate
The pore water pressure, given by Eq. 4, is further defined in a capillary pore as the
difference between the atmospheric pressure and the pressure difference over the meniscus,
i.e. Laplace pressure, as described according to Young–Laplace equation (Eq. 5).
∆ (4)
∆1 1
(5)
where
Pw [Pa] Pore water pressure
Patm [Pa] Atmospheric pressure
ΔP [Pa] Laplace pressure
γ [N m-1] Surface tension
r [m] Radii of the meniscus.
19
Normally, the atmospheric pressure Patm (approximately 100 kPa) is much smaller than ΔP
and can be neglected.
Combining Eqs. 2, 4, and 5 and expressing the RH with regard to water vapour pressure
gives the following equation.
∆ ln (6)
where
ΔP [Pa] Laplace pressure
Pw [Pa] Pore water pressure
R [J mol-1 K-1] Ideal gas constant
T [K] Temperature,
ρw [kg m-3] Density of water
Mw [kg mol-1] Molar mass of water
p [Pa] Water vapour pressure
ps [Pa] Water vapour pressure at saturation.
The total moisture transport through a porous material is a combination of both vapour and
liquid transport, which can be separated only in theory. The combined vapour and liquid
transport can be described by combining Eqs. 1, 3, and 4; when Patm is neglected, the total
flux qtot [kg m-2 s-1] can then be expressed as Eq. 7.
. . (7)
In an isothermal state, it is further possible to rewrite the total flux equation (Eq. 7) to one
single expression [49], as given by Eq. 8, considering Eq. 6. The diffusivity and permeability
are then combined into one moisture transport coefficient δc, which describes both the
vapour and liquid water transport resistances and one single moisture transport potential
(c) for both vapour and liquid transport is used. The unit of δc depends on the unit of the
transport potential.
(8)
Further discussion regarding moisture transport in porous materials, and the required
material properties in non-isothermal conditions and at different uniform and quasi-
uniform temperature conditions are described in Chapter 4 and in Paper VI.

20
21
4 Determination of material properties
Concrete is a complex material with material properties that may vary over time. These
variations can be due to various factors, e.g. ongoing cement hydration or moisture and
temperature variations. To better describe the process within a cement-based material,
identification and determination of these parameters have been done experimentally and
theoretically for several decades. At least two material properties are needed to describe the
moisture condition and moisture transport in a porous material. They are, moisture
fixation, which is normally described with sorption isotherm, and moisture transport
coefficient, which combines vapour and liquid transport of water in porous materials;
however, the combination is valid only under isothermal conditions.
The accuracy of a moisture transport model in a specific concrete structure increases
significantly if appropriate material properties are used. For this to be possible,
measurements on that specific material or on an equivalent material will have to be done.
However, if a large structure is considered, such as an inner reactor containment wall,
which corresponds to almost 2000 m3 of concrete for a PWR, variations can also be
expected between different areas of the structure. Differences because of reasons, such as
different castings, different concrete batches, and different climatic conditions, are possible,
but were neglected in this study. Material variation depending on the depth of the structure
is also a possibility. In a structure exposed to continuous drying and/or temperature
gradient, internal variation should be possible because of the temperature and moisture
dependency of cement hydration. This aspect was evaluated in this study through moisture
transport coefficient measurements over the depth of the containment wall, and
measurements of variation in the degree of hydration of the structure.
A model based on the mass conservation principle as presented in Fick's second law of
diffusion was established through the model by Bažant and Najjar [50], and presented in
Paper VI (Eq. 9). The material properties needed for the model were, moisture and
temperature dependent moisture transport coefficient δ(T,ø) and the temperature and
moisture dependent moisture fixation. The moisture fixation is given in Eq. 9 as the inverse
slope of the sorption isotherm k(T,ø).
22
, , (9)
where
ø [-] RH
t [s] Time
k(T,ø) [m3 kg-1] Invers slope of the sorption isotherm
δ(T,ø) [kg m-1 s-1] Moisture transport coefficient
K(ø) [K-1] Hygrothermal coefficient [51]
∂T/∂t [K] time dependent temperature change
Moisture transport within a material, as well as out of the material, is also dependent on the
water vapour permeation resistance Z of the surface. In this study, this was considered
through the properties of an epoxy coating, that was applied on all concrete surfaces within
the containments. The composition of the epoxy coatings that were used in the different
containments, their properties, and if there were any variations between the containments,
were not known.
Four different NPPs were included in this study. The plants included in this study differed
in age, and were located at two different geographic locations. The comparison presented
earlier, i.e. in Section 2.4, Table 1, had shown that there are several similarities between the
different plants regarding concrete compositions, cement type, cement content and w/c-
ratio. Because of these similarities, it was assumed that using the material properties from
one of these structures would be a better approach for simulating the moisture transport
than using the already existing models or empirical regression models, e.g. those based on
the moisture transport coefficient measurements done by Hedenblad [52]. All the material
samples used in this study were collected from the containment wall at Ringhals 4. The
material was gathered from a concrete block that was extracted from the wall during a
steam generator change at Ringhals 4 in 2011.
The material investigation within this work is divided into four parts as given below.
1) Moisture and temperature dependent vapour permeation resistance of epoxy coating.
2) Moisture and temperature dependent moisture transport coefficient of concrete.
3) Desorption and adsorption isotherms of concrete.
4) Internal hydration variations.
The water vapour permeation resistance of the epoxy coating, given in Section 4.2, and the
moisture transport coefficient for the concrete, given in Section 4.3, were evaluated using
the cup method [7, 52]. To evaluate temperature dependency, measurements were done
both at 20 °C and 50 °C.
The sorption isotherm measurements were planned and initiated using RH equilibrium
climate box method. It should be noted that the measurements were aborted owing to
measurement setup failure, and were discarded in this study. The intended approach was
however as followed. Specimens of 10 mm thickness were first capillary saturated and then
23
placed in boxes with different levels of RH (held constant). Each climate box contained a
CO2 adsorbent and a different saturated salt solution to control the different levels of RH.
One extra control box was prepared and used for confirming whether the equilibrium was
reached. The specimens from the control box were measured until equilibrium was reached.
Further, the specimens in the main boxes were measured only after equilibrium in the
control box was reach. This was done to minimize disturbance on the main climate boxes.
No results was obtained from the measurements due to the leakage from the climate boxes.
Internal variation within the concrete structure was evaluated through moisture transport
coefficient measurements, which was done at four different depths and by evaluating the
variations in the degree of hydration, as given in Section 4.4. The degree of hydration was
evaluated by quantifying the calcium hydroxide variations over the depth of the structure
through thermogravimetric analysis (TGA).
The findings collected from the material study were used in the moisture transport model
(Eq. 9) and presented in Paper VI and Chapter 6. Because of failure of the setup, the
sorption isotherm measurements on concrete with w/c ratios of 0.4 and 0.5, as presented by
Nilsson [7], were used. Simulation was conducted assuming a linear relation between the
two desorption isotherms, i.e. desorption isotherms for concrete compositions with w/c-
ratios 0f 0.42 and 0.46, respectively. The temperature dependency of the moisture fixation
was considered with regard to the hygrothermal coefficient, as presented in Paper VI.
4.1 Material
Forty concrete cylinders with a diameter of 94 mm and a length of 300 mm were extracted
from a 6×8 m2 concrete block from the containment wall at Ringhals 4. The concrete block
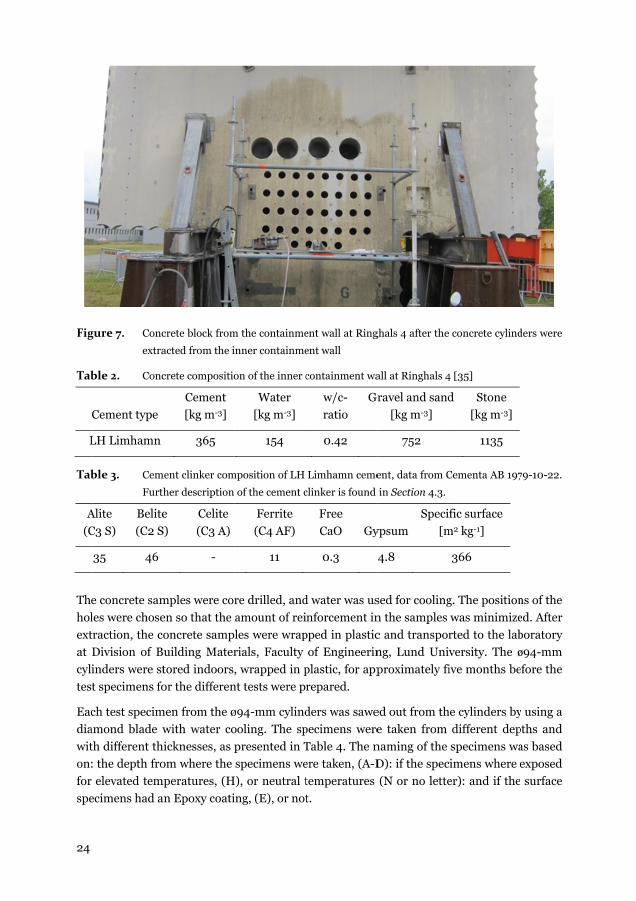
was earlier removed because of a steam generator replacement in 2011. Figure 7 shows the
inner side (inner containment wall) of the concrete block after the concrete for the material
study was extracted. The specimens were extracted approximately four weeks after the
concrete block had been removed from the containment wall. During that period, the
concrete block was stored outdoors. The larger holes, as seen in Figure 7, and two additional
holes from the outer containment wall, were used for measuring the degree of capillary
saturation, as presented in Paper I.
The concrete composition is presented in Table 2, and the cement clinker composition of
Low Heat (LH) cement from the disused Limhamn cement factory in Scania, Sweden, is
presented in Table 3. The cement clinker composition may vary to some extent over time,
but the variation should be within the region as presented in Table 3. The concrete at
Ringhals 4 is fairly similar to that used in the other NPPs included in this study (see Section
2.4).
24
Fig
Tab
L
Tab
A
(C
The
hol
ext
at
cyl
tes
Eac
dia
wit
on:
for
spe
gure 7. Conc
extra
ble 2. Conc
Cement type
LH Limhamn
ble 3. Cem
Furt
Alite
C3 S)
Belite
(C2 S
35 46
e concrete sam
les were chose
traction, the c
Division of B
inders were st
t specimens fo
ch test specim
amond blade w
th different th
: the depth fro
r elevated tem
ecimens had a
crete block from
acted from the i
crete compositio
Cement
[kg m-3]
365
ment clinker com
ther description
e
S)
Celite
(C3 A)
-
mples were cor
en so that the
oncrete samp
Building Mater
tored indoors,
or the differen
men from the ø
with water co
hicknesses, as p
om where the
mperatures, (H
an Epoxy coati
m the containme
inner containme
on of the inner c
Water
[kg m-3]
154
mposition of LH
of the cement c
Ferrite
(C4 AF)
11
re drilled, and
amount of rei
les were wrap
rials, Faculty
, wrapped in p
nt tests were p
ø94-mm cylind
ooling. The sp
presented in T
specimens we
H), or neutral t
ing, (E), or not
ent wall at Ring
ent wall
containment wa
w/c-
ratio
Gr
0.42
Limhamn ceme
clinker is found
Free
CaO Gy
0.3
d water was us
nforcement in
pped in plastic
of Engineerin
plastic, for app
repared.
ders was sawe
pecimens were
Table 4. The n
ere taken, (A-D
temperatures
t.
ghals 4 after the
all at Ringhals 4
ravel and sand
[kg m-3]
752
ent, data from C
in Section 4.3.
ypsum
Speci
[m
4.8
sed for cooling
n the samples
c and transpor
ng, Lund Univ
proximately fi
ed out from th
e taken from
naming of the
D): if the spec
(N or no lette
concrete cylind
4 [35]
d Stone
[kg m-3]
1135
Cementa AB 197
fic surface
m2 kg-1]
366
g. The position
was minimize
rted to the lab
versity. The ø
ive months be
he cylinders by
different dep
specimens wa
cimens where
er): and if the
ders were
79-10-22.
ns of the
ed. After
boratory
ø94-mm
efore the
y using a
pths and
as based
exposed
surface
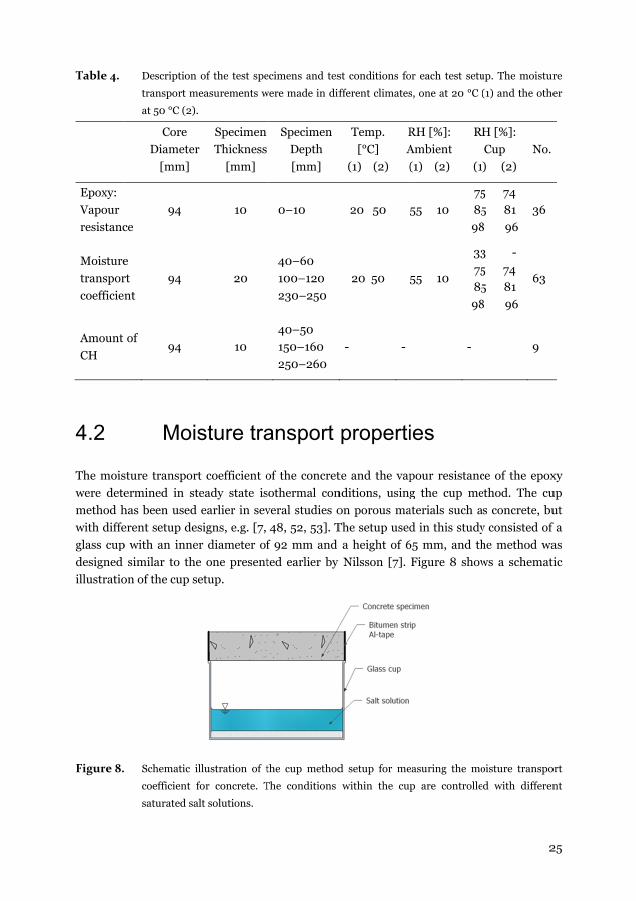
Table 4.
Epoxy:
Vapour
resistanc
Moisture
transpor
coefficien
Amount
CH
4.2
The mois
were dete
method h
with diffe
glass cup
designed
illustratio
Figure 8.
Description
transport m
at 50 °C (2)
Core
Diameter
[mm]
ce
94
e
rt
nt
94
of 94
Moi
sture transpor
ermined in st
has been used
erent setup de
p with an inne
similar to th
on of the cup s
Schematic i
coefficient
saturated sa
n of the test spe
measurements w
.
r
Specimen
Thickness
[mm]
10
20
10
sture tra
rt coefficient o
teady state is
d earlier in sev
esigns, e.g. [7,
er diameter of
e one present
setup.
illustration of t
for concrete. T
alt solutions.
ecimens and tes
were made in dif
Specimen
Depth
[mm]
0–10
40–60
100–120
230–250
40–50
150–160
250–260
ansport
of the concret
sothermal con
veral studies o
48, 52, 53]. T
f 92 mm and
ted earlier by
the cup method
The conditions
st conditions fo
fferent climates
Temp.
[°C]
(1) (2)
R
A
(
20 50 5
20 50 5
- -
properti
te and the vap
nditions, using
on porous ma
The setup used
a height of 6
Nilsson [7].
d setup for me
within the cup
or each test setu
s, one at 20 °C
RH [%]:
Ambient
(1) (2)
R
(1
55 10
75
85
98
55 10
33
75
85
98
-
ies
pour resistanc
g the cup me
aterials such a
d in this study
65 mm, and th
Figure 8 show
easuring the mo
p are controlle
2
up. The moistur
(1) and the othe
H [%]:
Cup
) (2)
No.
5 74
5 81
8 96
36
3 -
5 74
5 81
8 96
63
9
ce of the epox
ethod. The cu
as concrete, bu
y consisted of
he method wa
ws a schemati
oisture transpo
ed with differen
25
re
er
xy
up
ut
f a
as
tic
ort
nt
26
The
the
foil
on
The
app
and
bet
Fig
Fou
diff
def
and
Tab
The
salt
of t
The
s-1,
e cylindrical s
e cups were as
l on the outer
to the concret
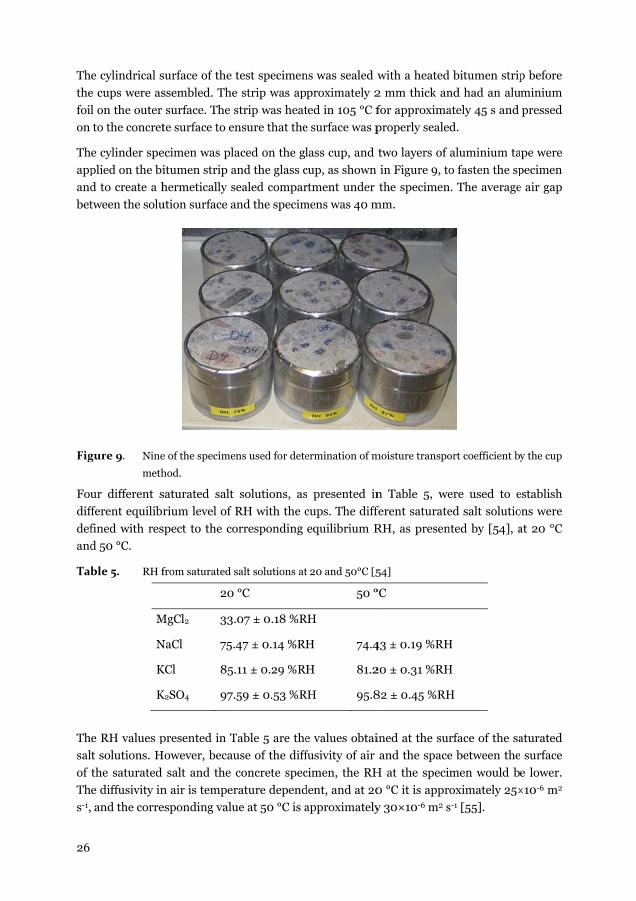
e cylinder spe
plied on the bi
d to create a h
tween the solu
gure 9. Nine
meth
ur different s
fferent equilibr
fined with res
d 50 °C.
ble 5. RH f
M
N
K
K
e RH values p
t solutions. H
the saturated
e diffusivity in
and the corre
surface of the
ssembled. The
surface. The s
te surface to e
ecimen was pl
itumen strip a
hermetically s
ution surface a
e of the specime
hod.
saturated salt
rium level of
spect to the co
from saturated s
20
MgCl2 33.
NaCl 75.
KCl 85.
K2SO4 97.
presented in T
However, becau
salt and the
n air is temper
esponding valu
test specimen
e strip was ap
strip was heat
nsure that the
aced on the gl
and the glass c
sealed compar
and the specim
ens used for dete
solutions, as
RH with the c
orresponding
salt solutions at
°C
.07 ± 0.18 %R
.47 ± 0.14 %R
.11 ± 0.29 %R
.59 ± 0.53 %R
Table 5 are the
use of the diff
concrete spec
rature depend
ue at 50 °C is a
ns was sealed w
proximately 2
ted in 105 °C f
e surface was p
lass cup, and
cup, as shown
rtment under
mens was 40 m
ermination of m
s presented in
cups. The diff
equilibrium R
t 20 and 50°C [5
50 °
RH
H 74.4
H 81.2
RH 95.8
e values obtai
fusivity of air
cimen, the RH
dent, and at 20
approximately
with a heated
2 mm thick an
for approxima
properly seale
two layers of
in Figure 9, to
the specimen
mm.
moisture transpo
n Table 5, we
ferent saturate
RH, as presen
54]
°C
43 ± 0.19 %RH
20 ± 0.31 %RH
82 ± 0.45 %RH
ined at the sur
and the space
H at the speci
0 °C it is appr
y 30×10-6 m2 s
d bitumen strip
nd had an alu
ately 45 s and
d.
aluminium ta
o fasten the sp
n. The average
ort coefficient by
ere used to e
ed salt solutio
nted by [54], a
H
H
H
rface of the sa
e between the
men would b
roximately 25×
s-1 [55].
p before
minium
pressed
ape were
pecimen
e air gap
y the cup
establish
ons were
at 20 °C
aturated
surface
e lower.
×10-6 m2
27
When the cups are in steady state condition, the moisture transport from the surface of the
saturated salt to the specimen is equal to the moisture flow through the specimen. The ∆RH
over the air gap can then be determined by Fick´s first law, as given in Eq. 1. Further
reduction of RH at the specimen surface due to resistance at the saturated salt solution
surface and at the specimen surface can be negligible according to earlier studies [7, 56].
To validate the tightness of the assembly, three validation cups were prepared. The
specimens were 20 mm thick aluminium pucks with a diameter of 94 mm. Bitumen strip
and aluminium tape were applied in the same manner as for the concrete specimens. The
bitumen strip only covered 10 mm of the aluminium part to represent both the concrete and
the epoxy coated specimens, as a conservative approach. Deionized water was used in the
cups to give humidity at the water surface of approximately 100 %RH. High RH was chosen
to increase the transport potential. It was assumed that the vapour resistance of the sealing
was independent of humidity; thus, only one RH gradient was studied.
The validation specimens were placed in a climate chamber with 55 %RH and 20 °C. The
mass change of the specimens varied up and down by a few milligrams during the
measurement period. After seven months, the mass varied between two and five milligrams
from the original mass. This proves that the validation setup was close to hermetically
sealed condition. It should however be noted that a potential leakage between the bitumen
strip and the concrete specimens has not been adequately tested, as the aluminium surface
is much smoother than the concrete surface. Any effect form this factor was not considered
in this study.
The moisture transport coefficient of the concrete was determined using a coupled vapour
and liquid transport model, as given in Eq. 8, based on the mass change measurements and
with water vapour content as transport potential (Eq. 10). Steady state flow was obtained
over the cups at equilibrium when a constant time dependent loss of mass of the specimens
was obtained. By measuring the loss of mass of the specimens over a prolonged period of
time, the steady state mass change could be expressed as moisture flux q [kg m-2 s-1],
considering the specimen surface area. The measurements were made at different RH
intervals, which could be translated into different water vapour contents v. Together with
the thickness of the specimens, this gave the moisture gradient dv/dx. The quotient of
moisture flux divided by the corresponding moisture gradient gave the moisture transport
coefficient δv [m2 s-1] in that specific RH interval.
(10)
where
qv [kg m-2 s-1] Moisture flux,
δv [m2 s-1] Moisture transport coefficient (v)
v [kg m-3] Water vapour content
x [m] Coordinate
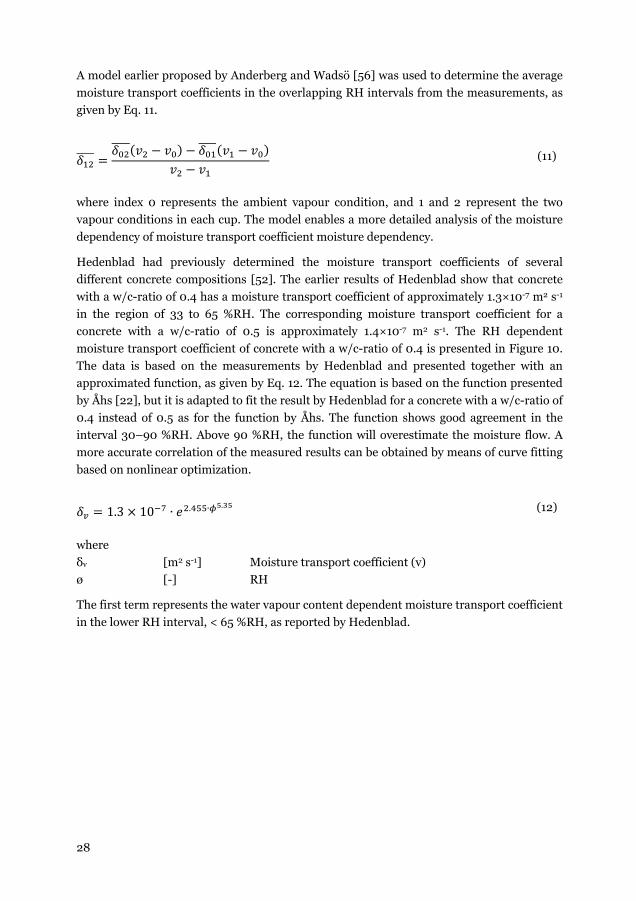
28
A model earlier proposed by Anderberg and Wadsö [56] was used to determine the average
moisture transport coefficients in the overlapping RH intervals from the measurements, as
given by Eq. 11.
(11)
where index 0 represents the ambient vapour condition, and 1 and 2 represent the two
vapour conditions in each cup. The model enables a more detailed analysis of the moisture
dependency of moisture transport coefficient moisture dependency.
Hedenblad had previously determined the moisture transport coefficients of several
different concrete compositions [52]. The earlier results of Hedenblad show that concrete
with a w/c-ratio of 0.4 has a moisture transport coefficient of approximately 1.3×10⁻⁷ m2 s-1
in the region of 33 to 65 %RH. The corresponding moisture transport coefficient for a
concrete with a w/c-ratio of 0.5 is approximately 1.4×10⁻⁷ m2 s-1. The RH dependent
moisture transport coefficient of concrete with a w/c-ratio of 0.4 is presented in Figure 10.
The data is based on the measurements by Hedenblad and presented together with an
approximated function, as given by Eq. 12. The equation is based on the function presented
by Åhs [22], but it is adapted to fit the result by Hedenblad for a concrete with a w/c-ratio of
0.4 instead of 0.5 as for the function by Åhs. The function shows good agreement in the
interval 30–90 %RH. Above 90 %RH, the function will overestimate the moisture flow. A
more accurate correlation of the measured results can be obtained by means of curve fitting
based on nonlinear optimization.
1.3 10 ∙ . ∙ . (12)
where
δv [m2 s-1] Moisture transport coefficient (v)
ø [-] RH
The first term represents the water vapour content dependent moisture transport coefficient
in the lower RH interval, < 65 %RH, as reported by Hedenblad.
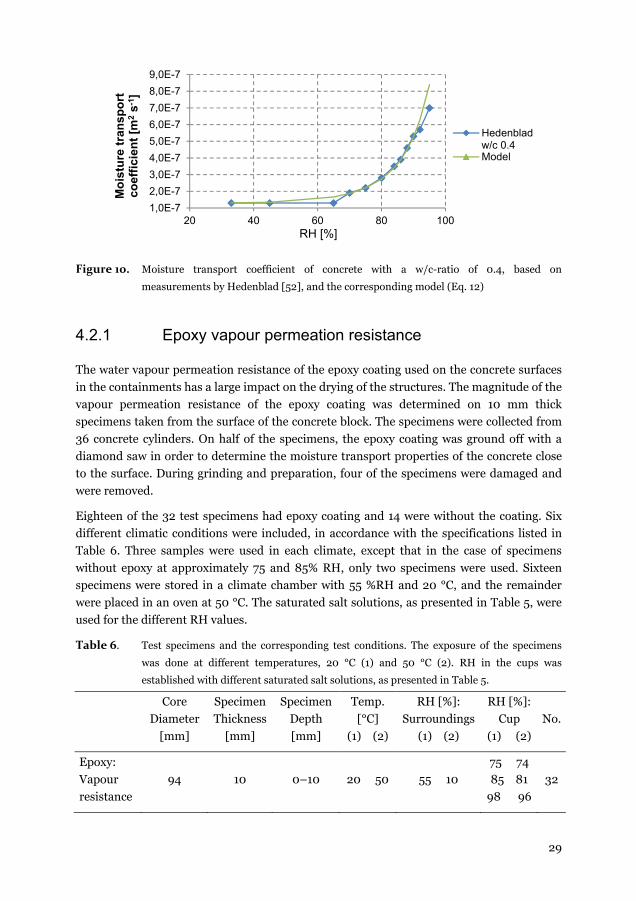
29
Figure 10. Moisture transport coefficient of concrete with a w/c-ratio of 0.4, based on
measurements by Hedenblad [52], and the corresponding model (Eq. 12)
4.2.1 Epoxy vapour permeation resistance
The water vapour permeation resistance of the epoxy coating used on the concrete surfaces
in the containments has a large impact on the drying of the structures. The magnitude of the
vapour permeation resistance of the epoxy coating was determined on 10 mm thick
specimens taken from the surface of the concrete block. The specimens were collected from
36 concrete cylinders. On half of the specimens, the epoxy coating was ground off with a
diamond saw in order to determine the moisture transport properties of the concrete close
to the surface. During grinding and preparation, four of the specimens were damaged and
were removed.
Eighteen of the 32 test specimens had epoxy coating and 14 were without the coating. Six
different climatic conditions were included, in accordance with the specifications listed in
Table 6. Three samples were used in each climate, except that in the case of specimens
without epoxy at approximately 75 and 85% RH, only two specimens were used. Sixteen
specimens were stored in a climate chamber with 55 %RH and 20 °C, and the remainder
were placed in an oven at 50 °C. The saturated salt solutions, as presented in Table 5, were
used for the different RH values.
Table 6. Test specimens and the corresponding test conditions. The exposure of the specimens
was done at different temperatures, 20 °C (1) and 50 °C (2). RH in the cups was
established with different saturated salt solutions, as presented in Table 5.
Core
Diameter
[mm]
Specimen
Thickness
[mm]
Specimen
Depth
[mm]
Temp.
[°C]
(1) (2)
RH [%]:
Surroundings
(1) (2)
RH [%]:
Cup
(1) (2)
No.
Epoxy:
Vapour
resistance
94 10 0–10 20 50 55 10
75 74
85 81
98 96
32
1,0E-7
2,0E-7
3,0E-7
4,0E-7
5,0E-7
6,0E-7
7,0E-7
8,0E-7
9,0E-7
20 40 60 80 100
Mo
istu
re t
ran
spo
rt
coef
fici
ent
[m2
s-1]
RH [%]
Hedenbladw/c 0.4Model
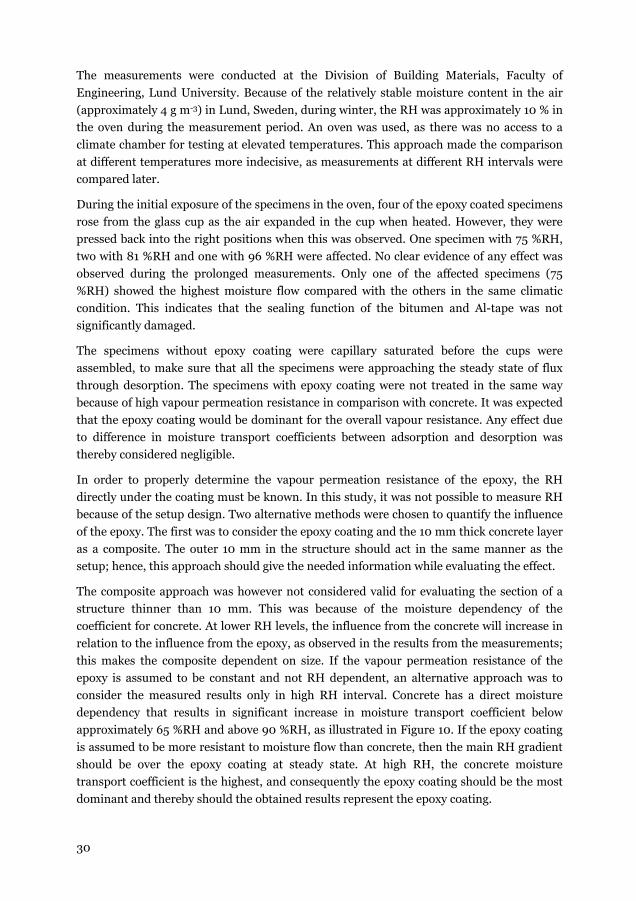
30
The measurements were conducted at the Division of Building Materials, Faculty of
Engineering, Lund University. Because of the relatively stable moisture content in the air
(approximately 4 g m-3) in Lund, Sweden, during winter, the RH was approximately 10 % in
the oven during the measurement period. An oven was used, as there was no access to a
climate chamber for testing at elevated temperatures. This approach made the comparison
at different temperatures more indecisive, as measurements at different RH intervals were
compared later.
During the initial exposure of the specimens in the oven, four of the epoxy coated specimens
rose from the glass cup as the air expanded in the cup when heated. However, they were
pressed back into the right positions when this was observed. One specimen with 75 %RH,
two with 81 %RH and one with 96 %RH were affected. No clear evidence of any effect was
observed during the prolonged measurements. Only one of the affected specimens (75
%RH) showed the highest moisture flow compared with the others in the same climatic
condition. This indicates that the sealing function of the bitumen and Al-tape was not
significantly damaged.
The specimens without epoxy coating were capillary saturated before the cups were
assembled, to make sure that all the specimens were approaching the steady state of flux
through desorption. The specimens with epoxy coating were not treated in the same way
because of high vapour permeation resistance in comparison with concrete. It was expected
that the epoxy coating would be dominant for the overall vapour resistance. Any effect due
to difference in moisture transport coefficients between adsorption and desorption was
thereby considered negligible.
In order to properly determine the vapour permeation resistance of the epoxy, the RH
directly under the coating must be known. In this study, it was not possible to measure RH
because of the setup design. Two alternative methods were chosen to quantify the influence
of the epoxy. The first was to consider the epoxy coating and the 10 mm thick concrete layer
as a composite. The outer 10 mm in the structure should act in the same manner as the
setup; hence, this approach should give the needed information while evaluating the effect.
The composite approach was however not considered valid for evaluating the section of a
structure thinner than 10 mm. This was because of the moisture dependency of the
coefficient for concrete. At lower RH levels, the influence from the concrete will increase in
relation to the influence from the epoxy, as observed in the results from the measurements;
this makes the composite dependent on size. If the vapour permeation resistance of the
epoxy is assumed to be constant and not RH dependent, an alternative approach was to
consider the measured results only in high RH interval. Concrete has a direct moisture
dependency that results in significant increase in moisture transport coefficient below
approximately 65 %RH and above 90 %RH, as illustrated in Figure 10. If the epoxy coating
is assumed to be more resistant to moisture flow than concrete, then the main RH gradient
should be over the epoxy coating at steady state. At high RH, the concrete moisture
transport coefficient is the highest, and consequently the epoxy coating should be the most
dominant and thereby should the obtained results represent the epoxy coating.
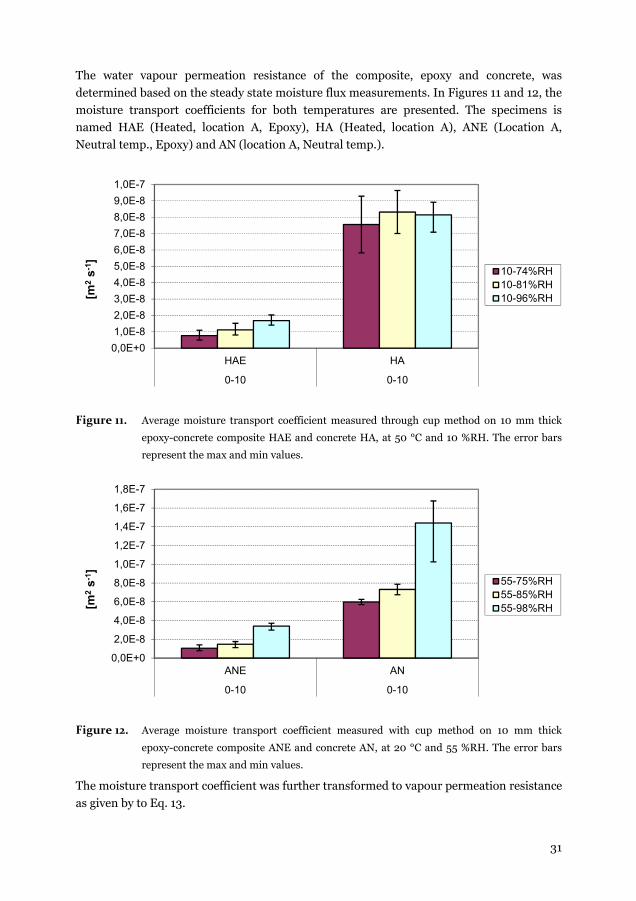
31
The water vapour permeation resistance of the composite, epoxy and concrete, was
determined based on the steady state moisture flux measurements. In Figures 11 and 12, the
moisture transport coefficients for both temperatures are presented. The specimens is
named HAE (Heated, location A, Epoxy), HA (Heated, location A), ANE (Location A,
Neutral temp., Epoxy) and AN (location A, Neutral temp.).
Figure 11. Average moisture transport coefficient measured through cup method on 10 mm thick
epoxy-concrete composite HAE and concrete HA, at 50 °C and 10 %RH. The error bars
represent the max and min values.
Figure 12. Average moisture transport coefficient measured with cup method on 10 mm thick
epoxy-concrete composite ANE and concrete AN, at 20 °C and 55 %RH. The error bars
represent the max and min values.
The moisture transport coefficient was further transformed to vapour permeation resistance
as given by to Eq. 13.
0,0E+0
1,0E-8
2,0E-8
3,0E-8
4,0E-8
5,0E-8
6,0E-8
7,0E-8
8,0E-8
9,0E-8
1,0E-7
HAE HA
0-10 0-10
[m2
s-1]
10-74%RH10-81%RH10-96%RH
0,0E+0
2,0E-8
4,0E-8
6,0E-8
8,0E-8
1,0E-7
1,2E-7
1,4E-7
1,6E-7
1,8E-7
ANE AN
0-10 0-10
[m2
s-1]
55-75%RH55-85%RH55-98%RH
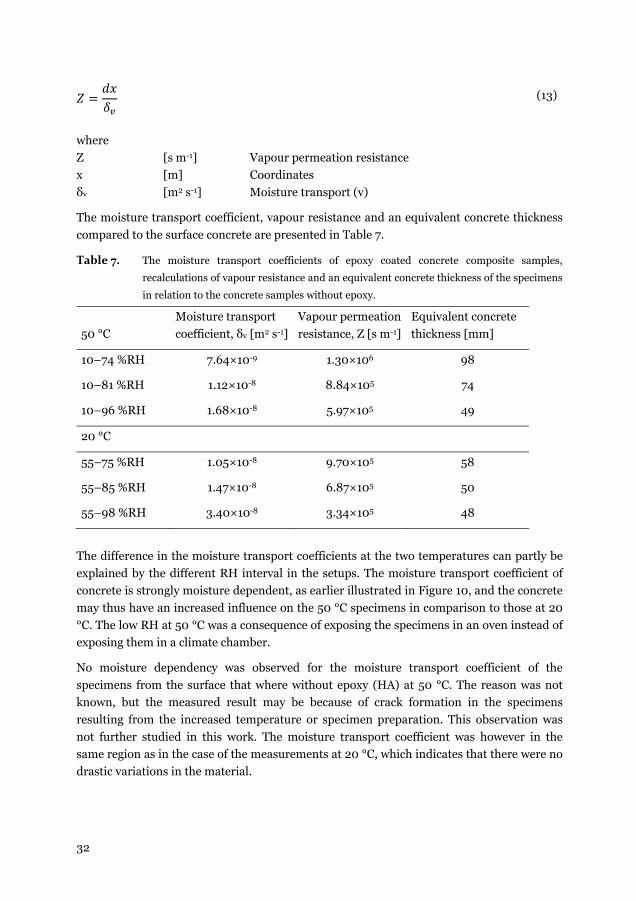
32
(13)
where
Z [s m-1] Vapour permeation resistance
x [m] Coordinates
δv [m2 s-1] Moisture transport (v)
The moisture transport coefficient, vapour resistance and an equivalent concrete thickness
compared to the surface concrete are presented in Table 7.
Table 7. The moisture transport coefficients of epoxy coated concrete composite samples,
recalculations of vapour resistance and an equivalent concrete thickness of the specimens
in relation to the concrete samples without epoxy.
50 °C
Moisture transport
coefficient, δv [m2 s-1]
Vapour permeation
resistance, Z [s m-1]
Equivalent concrete
thickness [mm]
10–74 %RH 7.64×10⁻⁹ 1.30×10⁶ 98
10–81 %RH 1.12×10⁻⁸ 8.84×10⁵ 74
10–96 %RH 1.68×10⁻⁸ 5.97×10⁵ 49
20 °C
55–75 %RH 1.05×10⁻⁸ 9.70×10⁵ 58
55–85 %RH 1.47×10⁻⁸ 6.87×10⁵ 50
55–98 %RH 3.40×10⁻⁸ 3.34×10⁵ 48
The difference in the moisture transport coefficients at the two temperatures can partly be
explained by the different RH interval in the setups. The moisture transport coefficient of
concrete is strongly moisture dependent, as earlier illustrated in Figure 10, and the concrete
may thus have an increased influence on the 50 °C specimens in comparison to those at 20
°C. The low RH at 50 °C was a consequence of exposing the specimens in an oven instead of
exposing them in a climate chamber.
No moisture dependency was observed for the moisture transport coefficient of the
specimens from the surface that where without epoxy (HA) at 50 °C. The reason was not
known, but the measured result may be because of crack formation in the specimens
resulting from the increased temperature or specimen preparation. This observation was
not further studied in this work. The moisture transport coefficient was however in the
same region as in the case of the measurements at 20 °C, which indicates that there were no
drastic variations in the material.
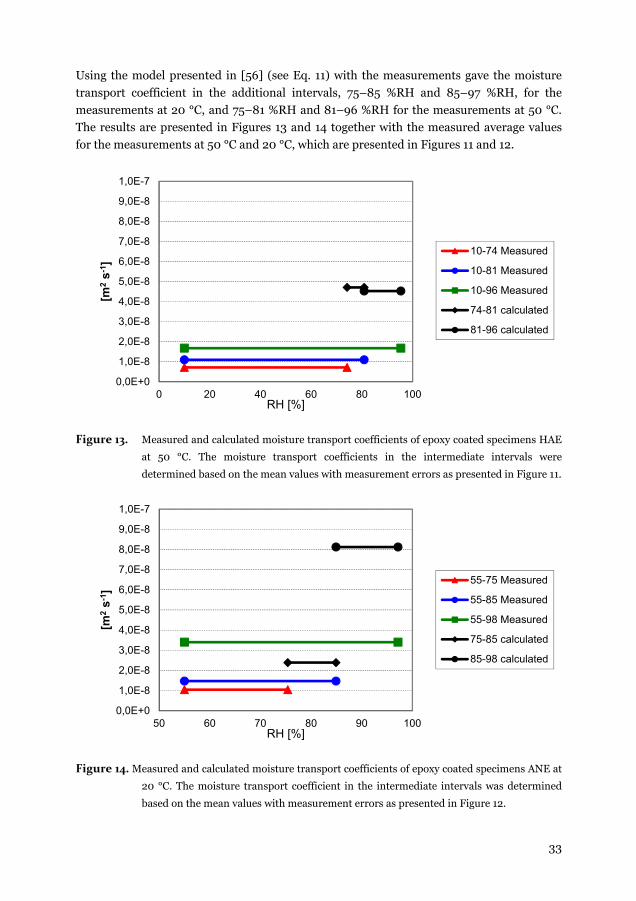
33
Using the model presented in [56] (see Eq. 11) with the measurements gave the moisture
transport coefficient in the additional intervals, 75–85 %RH and 85–97 %RH, for the
measurements at 20 °C, and 75–81 %RH and 81–96 %RH for the measurements at 50 °C.
The results are presented in Figures 13 and 14 together with the measured average values
for the measurements at 50 °C and 20 °C, which are presented in Figures 11 and 12.
Figure 13. Measured and calculated moisture transport coefficients of epoxy coated specimens HAE
at 50 °C. The moisture transport coefficients in the intermediate intervals were
determined based on the mean values with measurement errors as presented in Figure 11.
Figure 14. Measured and calculated moisture transport coefficients of epoxy coated specimens ANE at
20 °C. The moisture transport coefficient in the intermediate intervals was determined
based on the mean values with measurement errors as presented in Figure 12.
0,0E+0
1,0E-8
2,0E-8
3,0E-8
4,0E-8
5,0E-8
6,0E-8
7,0E-8
8,0E-8
9,0E-8
1,0E-7
0 20 40 60 80 100
[m2
s-1]
RH [%]
10-74 Measured
10-81 Measured
10-96 Measured
74-81 calculated
81-96 calculated
0,0E+0
1,0E-8
2,0E-8
3,0E-8
4,0E-8
5,0E-8
6,0E-8
7,0E-8
8,0E-8
9,0E-8
1,0E-7
50 60 70 80 90 100
[m2
s-1]
RH [%]
55-75 Measured
55-85 Measured
55-98 Measured
75-85 calculated
85-98 calculated
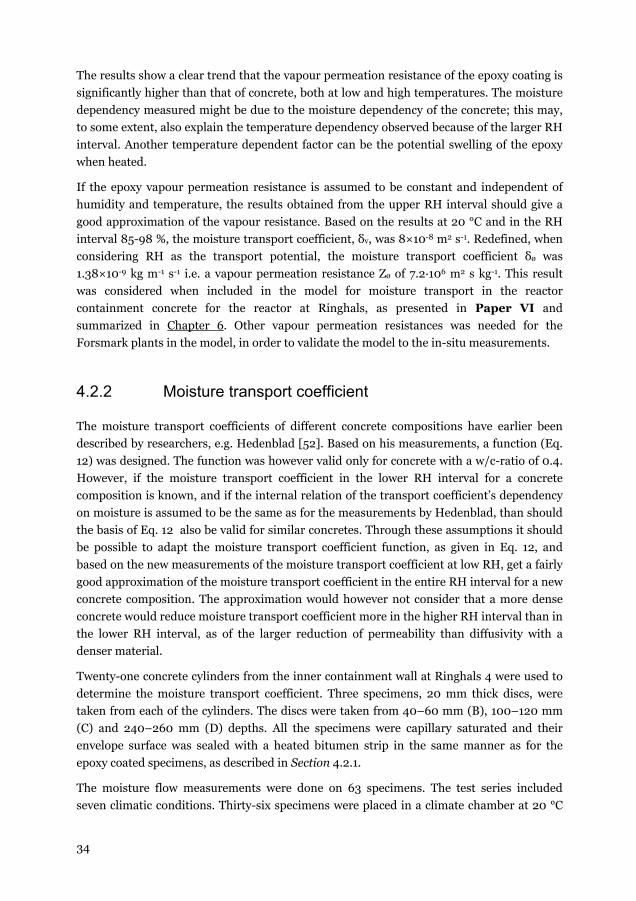
34
The results show a clear trend that the vapour permeation resistance of the epoxy coating is
significantly higher than that of concrete, both at low and high temperatures. The moisture
dependency measured might be due to the moisture dependency of the concrete; this may,
to some extent, also explain the temperature dependency observed because of the larger RH
interval. Another temperature dependent factor can be the potential swelling of the epoxy
when heated.
If the epoxy vapour permeation resistance is assumed to be constant and independent of
humidity and temperature, the results obtained from the upper RH interval should give a
good approximation of the vapour resistance. Based on the results at 20 °C and in the RH
interval 85-98 %, the moisture transport coefficient, δv, was 8×10⁻⁸ m2 s-1. Redefined, when
considering RH as the transport potential, the moisture transport coefficient δø was
1.38×10⁻⁹ kg m-1 s-1 i.e. a vapour permeation resistance Zø of 7.2·106 m2 s kg-1. This result
was considered when included in the model for moisture transport in the reactor
containment concrete for the reactor at Ringhals, as presented in Paper VI and
summarized in Chapter 6. Other vapour permeation resistances was needed for the
Forsmark plants in the model, in order to validate the model to the in-situ measurements.
4.2.2 Moisture transport coefficient
The moisture transport coefficients of different concrete compositions have earlier been
described by researchers, e.g. Hedenblad [52]. Based on his measurements, a function (Eq.
12) was designed. The function was however valid only for concrete with a w/c-ratio of 0.4.
However, if the moisture transport coefficient in the lower RH interval for a concrete
composition is known, and if the internal relation of the transport coefficient’s dependency
on moisture is assumed to be the same as for the measurements by Hedenblad, than should
the basis of Eq. 12 also be valid for similar concretes. Through these assumptions it should
be possible to adapt the moisture transport coefficient function, as given in Eq. 12, and
based on the new measurements of the moisture transport coefficient at low RH, get a fairly
good approximation of the moisture transport coefficient in the entire RH interval for a new
concrete composition. The approximation would however not consider that a more dense
concrete would reduce moisture transport coefficient more in the higher RH interval than in
the lower RH interval, as of the larger reduction of permeability than diffusivity with a
denser material.
Twenty-one concrete cylinders from the inner containment wall at Ringhals 4 were used to
determine the moisture transport coefficient. Three specimens, 20 mm thick discs, were
taken from each of the cylinders. The discs were taken from 40–60 mm (B), 100–120 mm
(C) and 240–260 mm (D) depths. All the specimens were capillary saturated and their
envelope surface was sealed with a heated bitumen strip in the same manner as for the
epoxy coated specimens, as described in Section 4.2.1.
The moisture flow measurements were done on 63 specimens. The test series included
seven climatic conditions. Thirty-six specimens were placed in a climate chamber at 20 °C
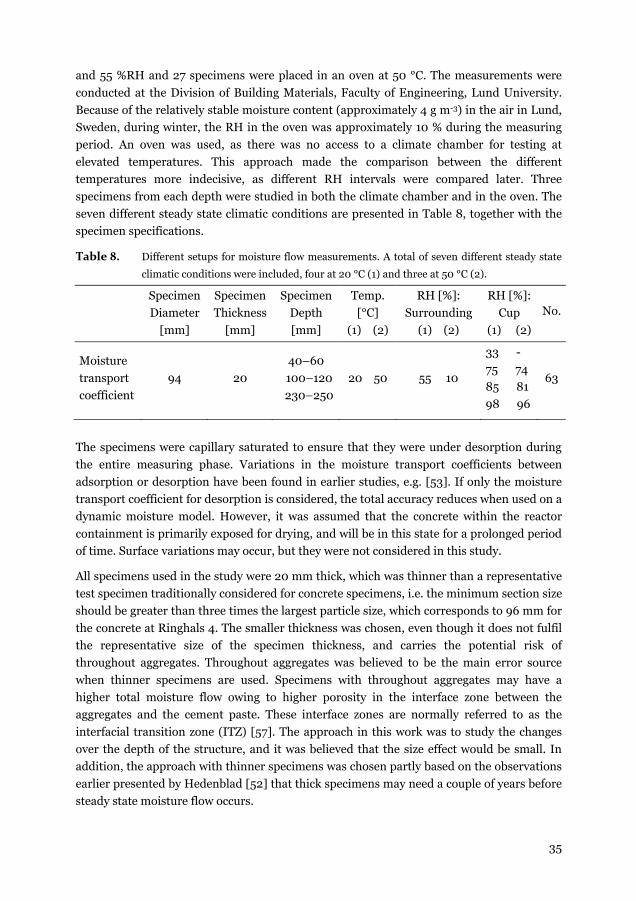
35
and 55 %RH and 27 specimens were placed in an oven at 50 °C. The measurements were
conducted at the Division of Building Materials, Faculty of Engineering, Lund University.
Because of the relatively stable moisture content (approximately 4 g m-3) in the air in Lund,
Sweden, during winter, the RH in the oven was approximately 10 % during the measuring
period. An oven was used, as there was no access to a climate chamber for testing at
elevated temperatures. This approach made the comparison between the different
temperatures more indecisive, as different RH intervals were compared later. Three
specimens from each depth were studied in both the climate chamber and in the oven. The
seven different steady state climatic conditions are presented in Table 8, together with the
specimen specifications.
Table 8. Different setups for moisture flow measurements. A total of seven different steady state
climatic conditions were included, four at 20 °C (1) and three at 50 °C (2).
Specimen
Diameter
[mm]
Specimen
Thickness
[mm]
Specimen
Depth
[mm]
Temp.
[°C]
(1) (2)
RH [%]:
Surrounding
(1) (2)
RH [%]:
Cup
(1) (2)
No.
Moisture
transport
coefficient
94 20
40–60
a100–120
a230–250
20 50 55 10
33 -
75 74
85 81
98 96
63
The specimens were capillary saturated to ensure that they were under desorption during
the entire measuring phase. Variations in the moisture transport coefficients between
adsorption or desorption have been found in earlier studies, e.g. [53]. If only the moisture
transport coefficient for desorption is considered, the total accuracy reduces when used on a
dynamic moisture model. However, it was assumed that the concrete within the reactor
containment is primarily exposed for drying, and will be in this state for a prolonged period
of time. Surface variations may occur, but they were not considered in this study.
All specimens used in the study were 20 mm thick, which was thinner than a representative
test specimen traditionally considered for concrete specimens, i.e. the minimum section size
should be greater than three times the largest particle size, which corresponds to 96 mm for
the concrete at Ringhals 4. The smaller thickness was chosen, even though it does not fulfil
the representative size of the specimen thickness, and carries the potential risk of
throughout aggregates. Throughout aggregates was believed to be the main error source
when thinner specimens are used. Specimens with throughout aggregates may have a
higher total moisture flow owing to higher porosity in the interface zone between the
aggregates and the cement paste. These interface zones are normally referred to as the
interfacial transition zone (ITZ) [57]. The approach in this work was to study the changes
over the depth of the structure, and it was believed that the size effect would be small. In
addition, the approach with thinner specimens was chosen partly based on the observations
earlier presented by Hedenblad [52] that thick specimens may need a couple of years before
steady state moisture flow occurs.
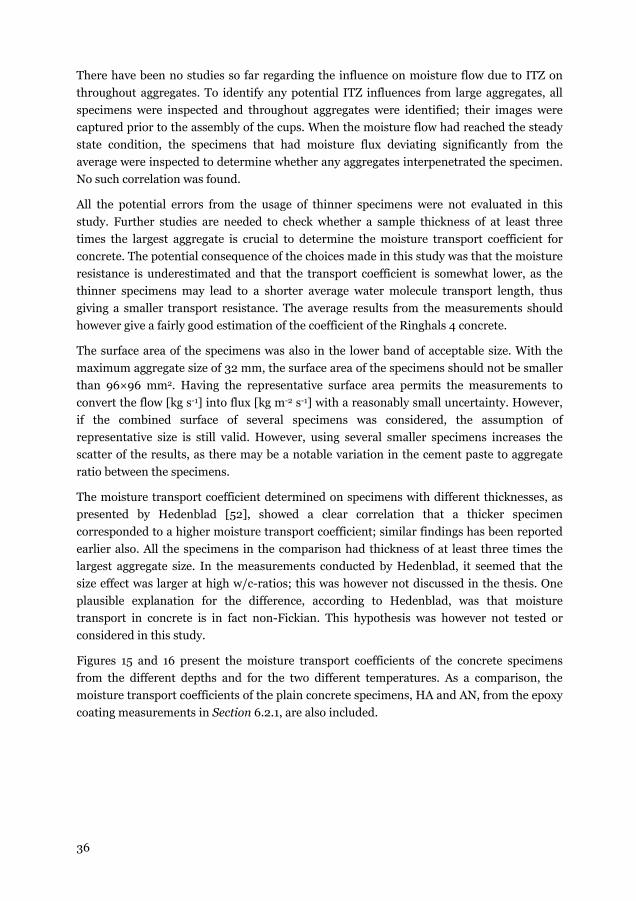
36
There have been no studies so far regarding the influence on moisture flow due to ITZ on
throughout aggregates. To identify any potential ITZ influences from large aggregates, all
specimens were inspected and throughout aggregates were identified; their images were
captured prior to the assembly of the cups. When the moisture flow had reached the steady
state condition, the specimens that had moisture flux deviating significantly from the
average were inspected to determine whether any aggregates interpenetrated the specimen.
No such correlation was found.
All the potential errors from the usage of thinner specimens were not evaluated in this
study. Further studies are needed to check whether a sample thickness of at least three
times the largest aggregate is crucial to determine the moisture transport coefficient for
concrete. The potential consequence of the choices made in this study was that the moisture
resistance is underestimated and that the transport coefficient is somewhat lower, as the
thinner specimens may lead to a shorter average water molecule transport length, thus
giving a smaller transport resistance. The average results from the measurements should
however give a fairly good estimation of the coefficient of the Ringhals 4 concrete.
The surface area of the specimens was also in the lower band of acceptable size. With the
maximum aggregate size of 32 mm, the surface area of the specimens should not be smaller
than 96×96 mm2. Having the representative surface area permits the measurements to
convert the flow [kg s-1] into flux [kg m-2 s-1] with a reasonably small uncertainty. However,
if the combined surface of several specimens was considered, the assumption of
representative size is still valid. However, using several smaller specimens increases the
scatter of the results, as there may be a notable variation in the cement paste to aggregate
ratio between the specimens.
The moisture transport coefficient determined on specimens with different thicknesses, as
presented by Hedenblad [52], showed a clear correlation that a thicker specimen
corresponded to a higher moisture transport coefficient; similar findings has been reported
earlier also. All the specimens in the comparison had thickness of at least three times the
largest aggregate size. In the measurements conducted by Hedenblad, it seemed that the
size effect was larger at high w/c-ratios; this was however not discussed in the thesis. One
plausible explanation for the difference, according to Hedenblad, was that moisture
transport in concrete is in fact non-Fickian. This hypothesis was however not tested or
considered in this study.
Figures 15 and 16 present the moisture transport coefficients of the concrete specimens
from the different depths and for the two different temperatures. As a comparison, the
moisture transport coefficients of the plain concrete specimens, HA and AN, from the epoxy
coating measurements in Section 6.2.1, are also included.
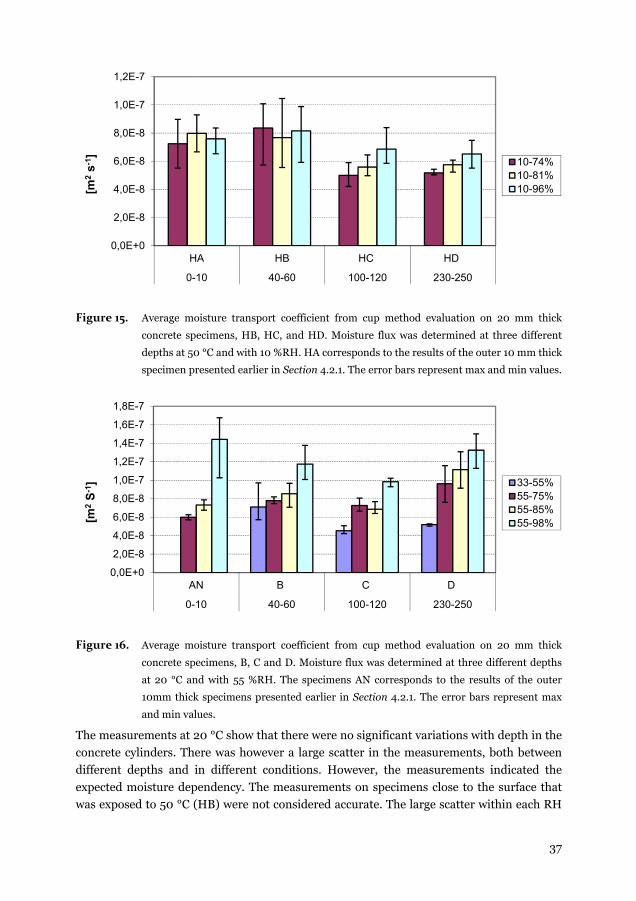
37
Figure 15. Average moisture transport coefficient from cup method evaluation on 20 mm thick
concrete specimens, HB, HC, and HD. Moisture flux was determined at three different
depths at 50 °C and with 10 %RH. HA corresponds to the results of the outer 10 mm thick
specimen presented earlier in Section 4.2.1. The error bars represent max and min values.
Figure 16. Average moisture transport coefficient from cup method evaluation on 20 mm thick
concrete specimens, B, C and D. Moisture flux was determined at three different depths
at 20 °C and with 55 %RH. The specimens AN corresponds to the results of the outer
10mm thick specimens presented earlier in Section 4.2.1. The error bars represent max
and min values.
The measurements at 20 °C show that there were no significant variations with depth in the
concrete cylinders. There was however a large scatter in the measurements, both between
different depths and in different conditions. However, the measurements indicated the
expected moisture dependency. The measurements on specimens close to the surface that
was exposed to 50 °C (HB) were not considered accurate. The large scatter within each RH
0,0E+0
2,0E-8
4,0E-8
6,0E-8
8,0E-8
1,0E-7
1,2E-7
HA HB HC HD
0-10 40-60 100-120 230-250
[m2
s-1]
10-74%10-81%10-96%
0,0E+0
2,0E-8
4,0E-8
6,0E-8
8,0E-8
1,0E-7
1,2E-7
1,4E-7
1,6E-7
1,8E-7
AN B C D
0-10 40-60 100-120 230-250
[m2
S-1
] 33-55%55-75%55-85%55-98%
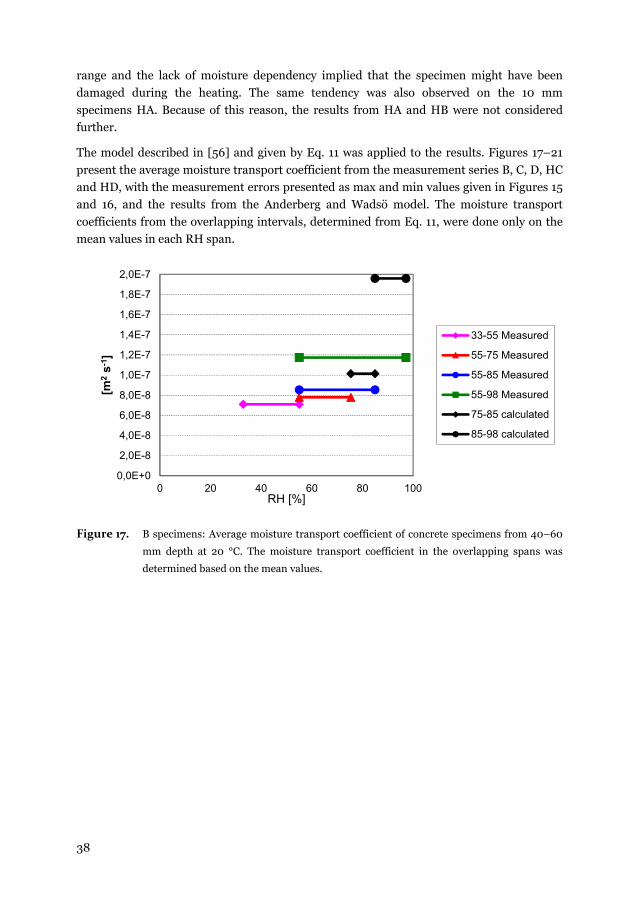
38
range and the lack of moisture dependency implied that the specimen might have been
damaged during the heating. The same tendency was also observed on the 10 mm
specimens HA. Because of this reason, the results from HA and HB were not considered
further.
The model described in [56] and given by Eq. 11 was applied to the results. Figures 17–21
present the average moisture transport coefficient from the measurement series B, C, D, HC
and HD, with the measurement errors presented as max and min values given in Figures 15
and 16, and the results from the Anderberg and Wadsö model. The moisture transport
coefficients from the overlapping intervals, determined from Eq. 11, were done only on the
mean values in each RH span.
Figure 17. B specimens: Average moisture transport coefficient of concrete specimens from 40–60
mm depth at 20 °C. The moisture transport coefficient in the overlapping spans was
determined based on the mean values.
0,0E+0
2,0E-8
4,0E-8
6,0E-8
8,0E-8
1,0E-7
1,2E-7
1,4E-7
1,6E-7
1,8E-7
2,0E-7
0 20 40 60 80 100
[m2
s-1]
RH [%]
33-55 Measured
55-75 Measured
55-85 Measured
55-98 Measured
75-85 calculated
85-98 calculated
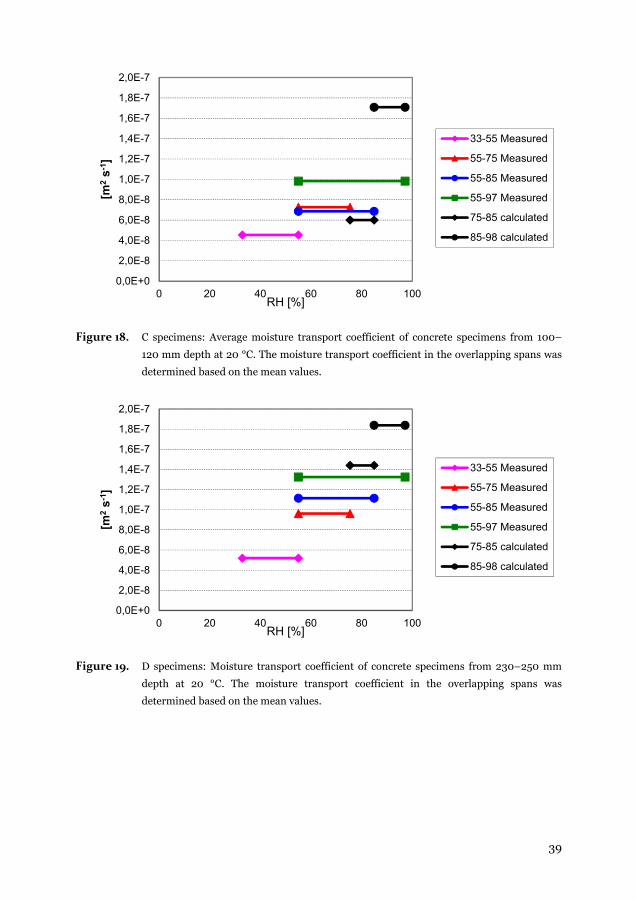
39
Figure 18. C specimens: Average moisture transport coefficient of concrete specimens from 100–
120 mm depth at 20 °C. The moisture transport coefficient in the overlapping spans was
determined based on the mean values.
Figure 19. D specimens: Moisture transport coefficient of concrete specimens from 230–250 mm
depth at 20 °C. The moisture transport coefficient in the overlapping spans was
determined based on the mean values.
0,0E+0
2,0E-8
4,0E-8
6,0E-8
8,0E-8
1,0E-7
1,2E-7
1,4E-7
1,6E-7
1,8E-7
2,0E-7
0 20 40 60 80 100
[m2
s-1]
RH [%]
33-55 Measured
55-75 Measured
55-85 Measured
55-97 Measured
75-85 calculated
85-98 calculated
0,0E+0
2,0E-8
4,0E-8
6,0E-8
8,0E-8
1,0E-7
1,2E-7
1,4E-7
1,6E-7
1,8E-7
2,0E-7
0 20 40 60 80 100
[m2
s-1]
RH [%]
33-55 Measured
55-75 Measured
55-85 Measured
55-97 Measured
75-85 calculated
85-98 calculated
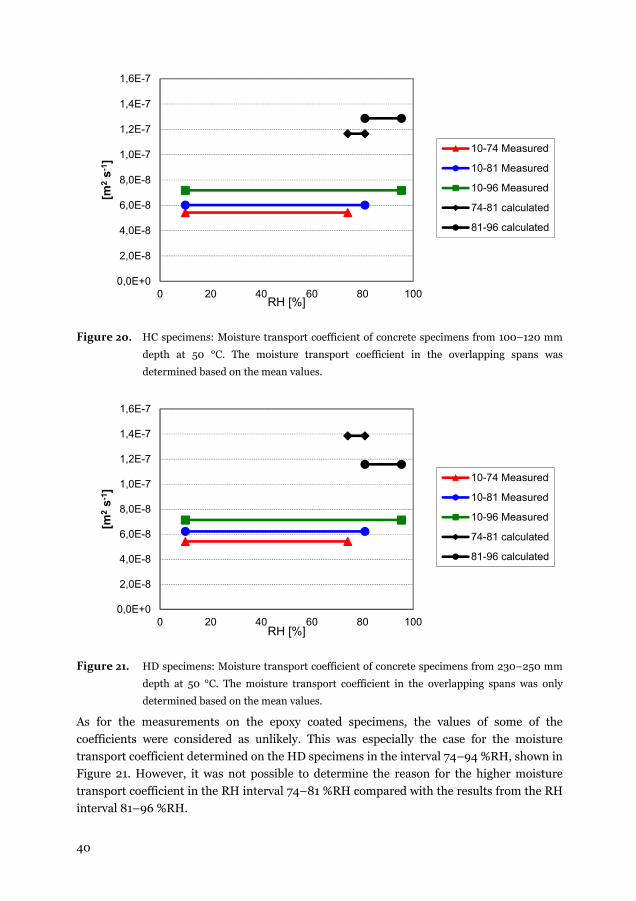
40
Figure 20. HC specimens: Moisture transport coefficient of concrete specimens from 100–120 mm
depth at 50 °C. The moisture transport coefficient in the overlapping spans was
determined based on the mean values.
Figure 21. HD specimens: Moisture transport coefficient of concrete specimens from 230–250 mm
depth at 50 °C. The moisture transport coefficient in the overlapping spans was only
determined based on the mean values.
As for the measurements on the epoxy coated specimens, the values of some of the
coefficients were considered as unlikely. This was especially the case for the moisture
transport coefficient determined on the HD specimens in the interval 74–94 %RH, shown in
Figure 21. However, it was not possible to determine the reason for the higher moisture
transport coefficient in the RH interval 74–81 %RH compared with the results from the RH
interval 81–96 %RH.
0,0E+0
2,0E-8
4,0E-8
6,0E-8
8,0E-8
1,0E-7
1,2E-7
1,4E-7
1,6E-7
0 20 40 60 80 100
[m2
s-1]
RH [%]
10-74 Measured
10-81 Measured
10-96 Measured
74-81 calculated
81-96 calculated
0,0E+0
2,0E-8
4,0E-8
6,0E-8
8,0E-8
1,0E-7
1,2E-7
1,4E-7
1,6E-7
0 20 40 60 80 100
[m2
s-1]
RH [%]
10-74 Measured
10-81 Measured
10-96 Measured
74-81 calculated
81-96 calculated
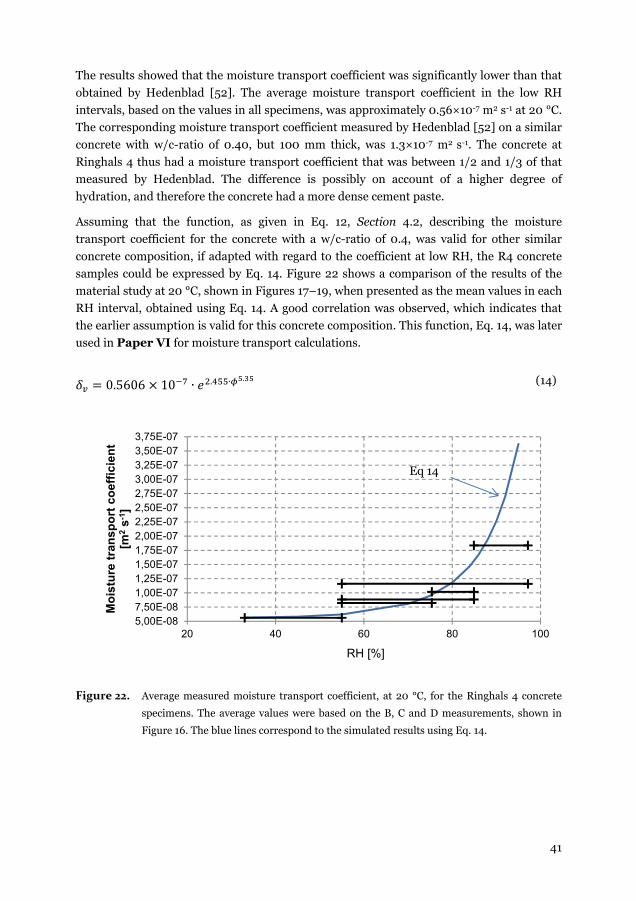
41
The results showed that the moisture transport coefficient was significantly lower than that
obtained by Hedenblad [52]. The average moisture transport coefficient in the low RH
intervals, based on the values in all specimens, was approximately 0.56×10⁻⁷ m2 s-1 at 20 °C.
The corresponding moisture transport coefficient measured by Hedenblad [52] on a similar
concrete with w/c-ratio of 0.40, but 100 mm thick, was 1.3×10⁻⁷ m2 s-1. The concrete at
Ringhals 4 thus had a moisture transport coefficient that was between 1/2 and 1/3 of that
measured by Hedenblad. The difference is possibly on account of a higher degree of
hydration, and therefore the concrete had a more dense cement paste.
Assuming that the function, as given in Eq. 12, Section 4.2, describing the moisture
transport coefficient for the concrete with a w/c-ratio of 0.4, was valid for other similar
concrete composition, if adapted with regard to the coefficient at low RH, the R4 concrete
samples could be expressed by Eq. 14. Figure 22 shows a comparison of the results of the
material study at 20 °C, shown in Figures 17–19, when presented as the mean values in each
RH interval, obtained using Eq. 14. A good correlation was observed, which indicates that
the earlier assumption is valid for this concrete composition. This function, Eq. 14, was later
used in Paper VI for moisture transport calculations.
0.5606 10 ∙ . ∙ . (14)
Figure 22. Average measured moisture transport coefficient, at 20 °C, for the Ringhals 4 concrete
specimens. The average values were based on the B, C and D measurements, shown in
Figure 16. The blue lines correspond to the simulated results using Eq. 14.
5,00E-087,50E-081,00E-071,25E-071,50E-071,75E-072,00E-072,25E-072,50E-072,75E-073,00E-073,25E-073,50E-073,75E-07
20 40 60 80 100
Mo
istu
re t
ran
spo
rt c
oef
fici
ent
[m2
s-1]
RH [%]
Eq 14
42
4.3 Variation in degree of hydration
The hydration process of cement is not linear, and the larger part of hydration occurs within
the first few days and weeks. The speed of the hydration decreases rapidly with time and the
concrete may still not have reached full hydration after several years. The variations depend
mainly on w/c-ratio, curing conditions, access to water and the cement type. The hydration
process stops either because of absence of space or water, i.e. when the RH decreases below
about 85 % [58]. The space available for the hydration products reduces with decreasing
w/c-ratio. The theoretical minimum w/c-ratio that can achieve full hydration is 0.42,
assuming that there is no access to external water [59]. With external water access, the limit
is 0.36 [59], and if unlimited space is assumed, the limit is 0.25; this is the amount of
chemically bound water required for fully hydrated cement.
Variations in the degree of hydration in a structure can arise because of sustained
temperature gradients or early drying of the surface. A variation in hydration would lead to
variations in material properties such as the moisture transport coefficient.
The main cement clinker components, which are the reactive particles that together with
gypsum make the ordinary Portland cement, are the following.
C3S Alite Tricalcium Silicate
C2S Belite Dicalcium Silicate
C3A Celite Tricalcium Aluminate
C4AF Ferrite Tetracalcium Aluminioferrite
When water is added to the dry concrete mixture, a reaction starts between the cement and
water, i.e. the cement starts to hydrate. Water reacts with the different clinker components
and cement gel is formed. The main hydration products in the cement gel are calcium
hydroxide (CH), calcium silicate hydrate (C-S-H), Ettringite (AFt) and monosulphate
(AFm). The C-S-H is the main product and represents a group of crystalline formations
which is considered as poorly crystallized and partly amorphous, and hence normally
referred to as C-S-H gel [60].
During the hydration of cement, the mixing water is physically and chemically bound in the
cement gel. With the model developed by Powers and Brownyard [58, 59], the amount of
bound water can be determined for a specific concrete if the clinker composition and the
degree of hydration are known. Normally, it is assumed that the fully hydrated cement
chemically binds water corresponding to approximately 25 % of the cement dry mass.
However, this value varies depending on the clinker composition of the specific cement.
The results from Power’s and Brownyard’s work have been used in several studies to
determine the degree of hydration or to estimate the amount of different components, e.g.
[61-63]. A traditional way to determine the degree of hydration is through loss on ignition
(LOI) measurements. The LOI method is based on the assumption that all the water in
hydrated cement is extracted if the material is exposed to 1050 °C until mass equilibrium is
43
reached. If all the evaporable water is assumed to be extracted when exposed to 105 °C, the
mass loss between 105 °C and 1050 °C corresponds to the non-evaporable water i.e. water
bound in the hydrated cement. By comparing this value with the theoretical maximum
bound water, the degree of hydration can be determined.
One weakness of the LOI method is that it is hard to identify and quantify the potential
influence of aggregates or other components. For instance, aggregates that contain
components such as CaCO3, limestone, or carbonated cement will lose mass during the LOI
test because of decarbonisation. If the amount of a component, e.g. limestone, is not known,
a proper determination cannot be made.
When exposed to elevated temperature the cement hydration products are decomposed.
Dividing the decomposition into different steps in which different components lose their
water and decompose gives an overview of the process. One way to describe the
decomposition is to divide it into three intervals [64].
105 °C to 440 °C: Dehydration of mainly C-S-H gel, AFt, etc.
440 °C to 580 °C: Dehydroxylation of CH
580 °C to approximately 1000 °C: Decarbonation of CaCo3
The temperature interval for dehydroxylation may vary somewhat between different
studies, but the decomposition of CH at approximately 450 °C is well documented [61, 62,
64-66].
As an alternative to the LOI method, the mass change in the different intervals can be
evaluated separately, e.g. the dehydroxylation of CH. While performing a
thermogravimetric analysis (TGA), the temperature is plotted against the mass loss. The
dehydroxylation can clearly be seen as an increased mass loss at approximately 450 °C
during the TGA of cement paste or concrete. The dehydroxylation can also be identified
when a differential thermal analysis (DTA) or differential scanning calorimetry (DSC) is
performed. With both techniques, it is possible to determine whether there is an
endothermic or exothermic reaction at different temperature intervals. Decomposition of
CH, which is an endothermic reaction [61], shows as a peak in the DTA or DSC
measurements.
Using the knowledge from Powers and Brownyard, together with TGA, DTA or DSC
measurements, it is possible to determine the amount of CH that a specific concrete should
contain. This is done through recalculations of the mass loss in the dehydroxylation
interval. The recalculation is made based on the hydration reactions for the four main
clinker compositions.
Based on a simplified description of the cement clinker reactions, where Afwillite (C3S2H3)
is the only C-S-H mineral, it is possible to derive CH formation at full hydration in relation
to the cement content [kg(CH) kg(cement)-1], as given in Eq. 15. The actual cement clinker
hydration is more complicated than this generalisation, and is not fully explained by this
44
estimation. However, this estimation would give an indication of the CH amount or at least
it is possible to compare variations over the depth of a structure.
1000.49
1000.21
1000.31 (15)
By inserting the clinker composition as presented in Table 3, Section 4.1, the total CH
formation possible in the concrete is 0.234 kg (CH) kg-1 (Cement). The dehydroxation the
CH decomposition can further be written as follows.
Ca(OH)2 CaO + H2O
The molar mass of CH is 74.093 g mol-1, that of CaO is 56.077 g mol-1, and that of water
18.015 g mol-1. This gives a water to CH ratio of 18.015/74.093 = 0.243. By measuring the
amount of water released during the dehydroxation of CH in a cement paste, it is possible to
determine the amount of CH that it represents. The quotient between the theoretical CH
formation, as given in Eq. 15, and the amount from the TGA measurements gives an
approximate degree of hydration based on a smaller temperature interval than LOI. With
this approach, the effect from unknown components, e.g. lime stone, is limited; however,
carbonation has to be considered.
4.3.1 Measurements and results
The measurements of the amount of CH were made on nine test specimens. The specimens
were taken from three depths, 40–50, 150–160 and 250–260 mm and sawed out from three
concrete cylinders. All the specimens were then placed in an oven at 105 °C for
approximately four hours. The specimens were to be left in the oven until steady state to
remove all evaporable water. However, because of the tight time schedule, this was not
possible. The mass loss close to 450 °C, which was the focus in these measurements, should
however not be influenced by this change. The dry mass of the sample was used to
determine the cement content of each specimen, and hence a systematic error was inserted.
This error should be the same for all samples.
After the specimens had been stored in the oven, the specimen was crushed with a hammer
and ground in a mill, down to a size of approximately 200 μm. The powder from each
specimen was placed in a diffusion tight plastic cup to limit further carbonation.
Carbonation of hydrated cement, where CH transforms to CaCO3, requires access to CO2,
as well as some moisture for the process to proceed. One approach to reduce the
carbonation rate, apart from limiting the CO2 exposure, is to dry the sample. The
carbonation rate decreases with respect to the highest rates for both high and low RH. A
high RH results in slow CO2 ingress, and a low RH reduces the moisture needed for the
reaction. The RH in the ground sample was unfortunately not known. The period after
grinding was thereby the most crucial with regard to carbonation because of the much
larger surface area of the powder than of the concrete specimens. However, because all
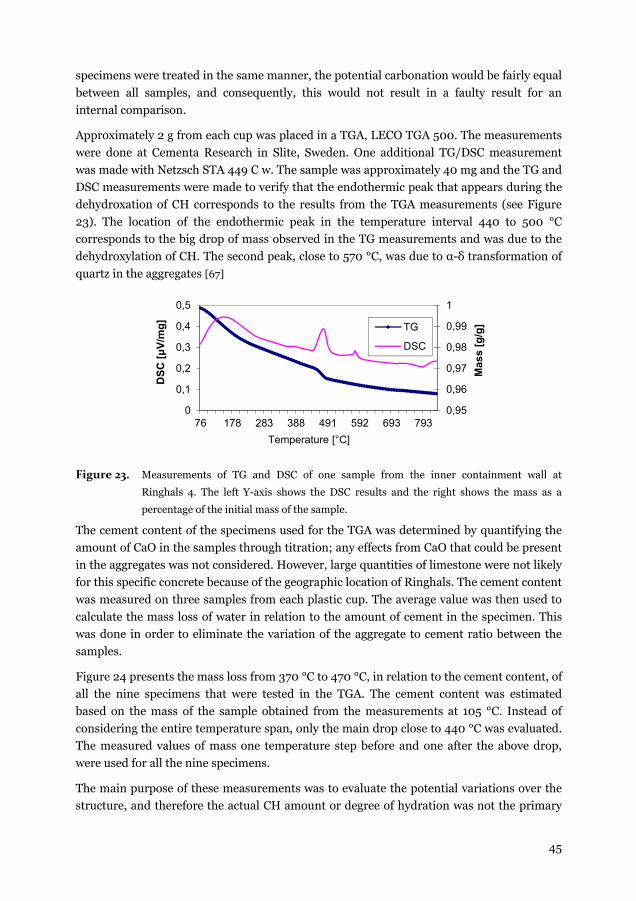
45
specimens were treated in the same manner, the potential carbonation would be fairly equal
between all samples, and consequently, this would not result in a faulty result for an
internal comparison.
Approximately 2 g from each cup was placed in a TGA, LECO TGA 500. The measurements
were done at Cementa Research in Slite, Sweden. One additional TG/DSC measurement
was made with Netzsch STA 449 C w. The sample was approximately 40 mg and the TG and
DSC measurements were made to verify that the endothermic peak that appears during the
dehydroxation of CH corresponds to the results from the TGA measurements (see Figure
23). The location of the endothermic peak in the temperature interval 440 to 500 °C
corresponds to the big drop of mass observed in the TG measurements and was due to the
dehydroxylation of CH. The second peak, close to 570 °C, was due to α-δ transformation of
quartz in the aggregates [67]
Figure 23. Measurements of TG and DSC of one sample from the inner containment wall at
Ringhals 4. The left Y-axis shows the DSC results and the right shows the mass as a
percentage of the initial mass of the sample.
The cement content of the specimens used for the TGA was determined by quantifying the
amount of CaO in the samples through titration; any effects from CaO that could be present
in the aggregates was not considered. However, large quantities of limestone were not likely
for this specific concrete because of the geographic location of Ringhals. The cement content
was measured on three samples from each plastic cup. The average value was then used to
calculate the mass loss of water in relation to the amount of cement in the specimen. This
was done in order to eliminate the variation of the aggregate to cement ratio between the
samples.
Figure 24 presents the mass loss from 370 °C to 470 °C, in relation to the cement content, of
all the nine specimens that were tested in the TGA. The cement content was estimated
based on the mass of the sample obtained from the measurements at 105 °C. Instead of
considering the entire temperature span, only the main drop close to 440 °C was evaluated.
The measured values of mass one temperature step before and one after the above drop,
were used for all the nine specimens.
The main purpose of these measurements was to evaluate the potential variations over the
structure, and therefore the actual CH amount or degree of hydration was not the primary
0
0,1
0,2
0,3
0,4
0,5
76 178 283 388 491 592 693 7930,95
0,96
0,97
0,98
0,99
1
DS
C [μ
V/m
g]
Temperature [°C]
Mas
s [g
/g]TG
DSC
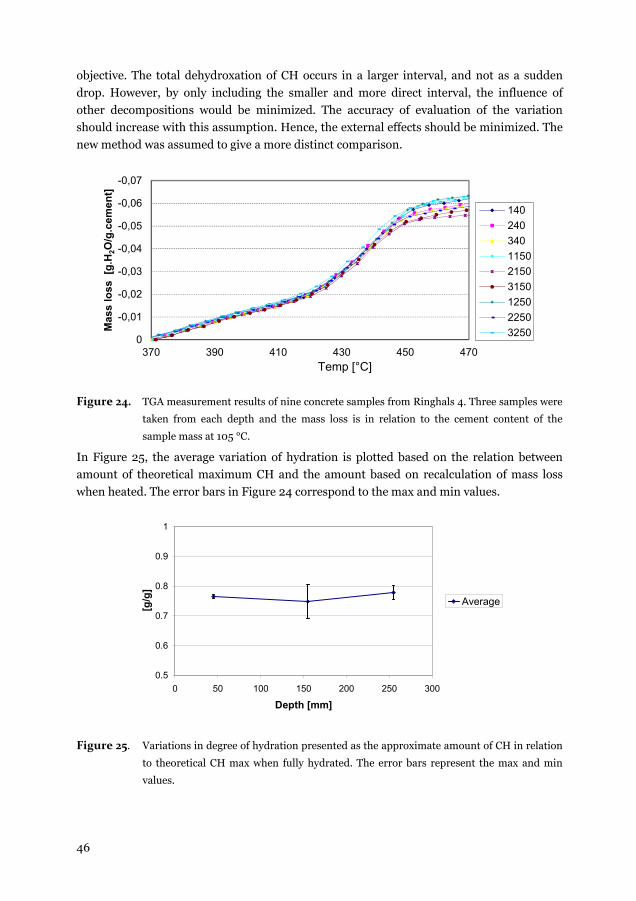
46
objective. The total dehydroxation of CH occurs in a larger interval, and not as a sudden
drop. However, by only including the smaller and more direct interval, the influence of
other decompositions would be minimized. The accuracy of evaluation of the variation
should increase with this assumption. Hence, the external effects should be minimized. The
new method was assumed to give a more distinct comparison.
Figure 24. TGA measurement results of nine concrete samples from Ringhals 4. Three samples were
taken from each depth and the mass loss is in relation to the cement content of the
sample mass at 105 °C.
In Figure 25, the average variation of hydration is plotted based on the relation between
amount of theoretical maximum CH and the amount based on recalculation of mass loss
when heated. The error bars in Figure 24 correspond to the max and min values.
Figure 25. Variations in degree of hydration presented as the approximate amount of CH in relation
to theoretical CH max when fully hydrated. The error bars represent the max and min
values.
-0,07
-0,06
-0,05
-0,04
-0,03
-0,02
-0,01
0370 390 410 430 450 470
Mas
s lo
ss
[g.H
2O/g
.cem
ent]
Temp [°C]
140
240
340
1150
2150
3150
1250
2250
3250
0.5
0.6
0.7
0.8
0.9
1
0 50 100 150 200 250 300
Depth [mm]
[g/g
]
Average

47
The results presented in Figure 25 show no clear trend of the variation in hydration over the
depth of the inner containment wall at Ringhals 4. The assumption that all the CH was
decomposed in the measured interval gave a degree of hydration of approximately 75 %.
This value is lower than what can be expected on a 30-year old structure. The main reason
is that CH decomposes over a larger temperature interval. According to [60], 98 % of the
CH is decomposed in the temperature interval 370–580 °C.
The results of the degree of hydration, together with the moisture transport coefficient
variations, as presented in Section 4.2.2, showed that there was no significant variation over
the depth of the structure, and therefore the same models, for e.g. moisture transport
coefficient and moisture fixation, can be used for the total depth of each structure. This
assumption was used in the model presented in Paper VI.

48
49
5 Monitoring campaigns
The actual conditions within the reactor containments and the concrete structures in
different; reactor types, containment designs and geographic locations were evaluated in
order to determine the variations and similarities. A measurement setup for monitoring the
moisture and temperature in concrete, in situ and over a prolonged period of time, was thus
designed and evaluated. Four monitoring campaigns were conducted to study the climatic
conditions inside the nuclear reactor containments during operation. The reactors were
chosen to represent four of the five reactor groups described in Section 2.1.
The conditions both in the concrete structures as well as the ambient conditions were
monitored during one operational year. Four reactors were included in the study: Ringhals
1, Ringhals 4 and Forsmark 2 were monitored during the operational year 2012–2013, and
Forsmark 3 was monitored during the year 2013–2014.
The equipment used for accuracy evaluation and monitoring campaigns consisted of RH
and temperature measurement probes, HMP 110, from Vaisala OY. The probe measures RH
with a Vaisala HUMICAP® 180R sensor, and measures temperature with Pt1000 RTD, 1/3
Class B IEC 751. The data were primary collected with a logger CR1000 and multiplexer
AM25T from Campbell Scientific Inc.
The setup, shown in Figure 26, was designed and tested both during accuracy evaluation
and in situ monitoring campaigns. The design of the setup is presented and evaluated in
Papers III, IV and V. The evaluation of the measurement setup was done with regard to
the following.
Measurement stability: In situ measurements – Papers III and IV
Measurement stability: Laboratory conditions – Papers IV and V
Leak tightness of measuring setup – Paper V
Temperature measurement accuracy – Paper V
Equipment environmental sensibility – Paper V
Based on the evaluation of the setup, it was concluded that the setup was suitable for long-
term measurements. Additional attention is however needed while measuring in shallow
depths, as of the increased risk of leakage. It was further concluded that the setup was stable
over time if properly installed; however, measurements should not be done for more than
one year, as re-calibration of the RH/T probes is advised once in a year. The largest error
source identified in the study was temperature misread, especially while measuring in
shallow depths. In a non-isothermal condition, additional temperature measurements, e.g.
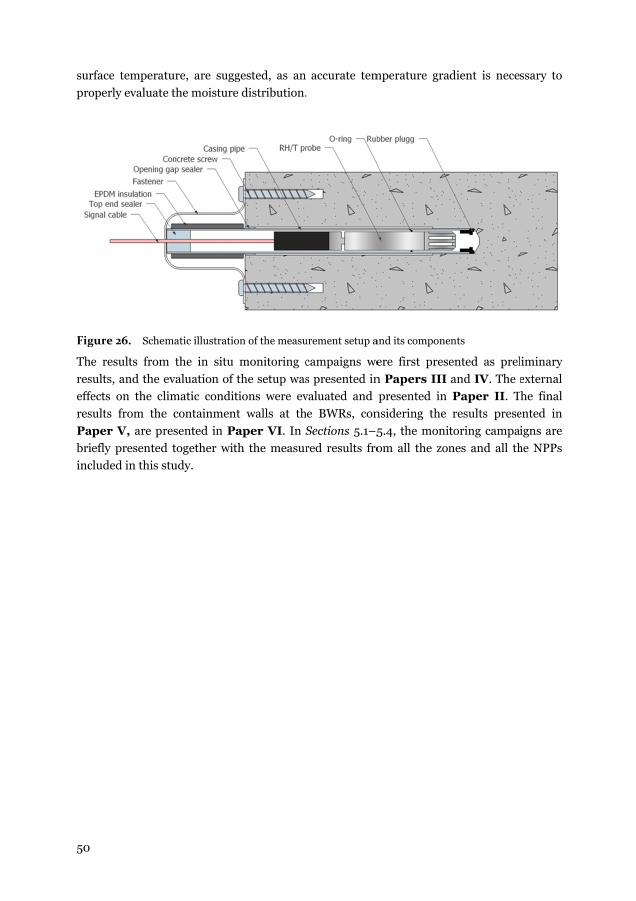
50
sur
pro
Fig
The
res
effe
res
Pa
bri
inc
rface tempera
operly evaluat
gure 26. Sche
e results from
sults, and the
ects on the cl
sults from the
aper V, are pr
efly presented
cluded in this s
ature, are sug
e the moisture
ematic illustratio
m the in situ
evaluation of
limatic condit
e containmen
resented in P
d together wit
study.
gested, as an
e distribution.
on of the measu
monitoring c
the setup was
tions were ev
nt walls at th
Paper VI. In S
th the measur
accurate tem
.
urement setup a
campaigns we
s presented in
valuated and
he BWRs, con
Sections 5.1–5
red results fro
mperature gra
and its compone
ere first pres
n Papers III
presented in
nsidering the
5.4, the moni
om all the zon
adient is neces
ents
ented as prel
and IV. The e
Paper II. T
results prese
toring campa
nes and all th
ssary to
liminary
external
he final
ented in
igns are
he NPPs
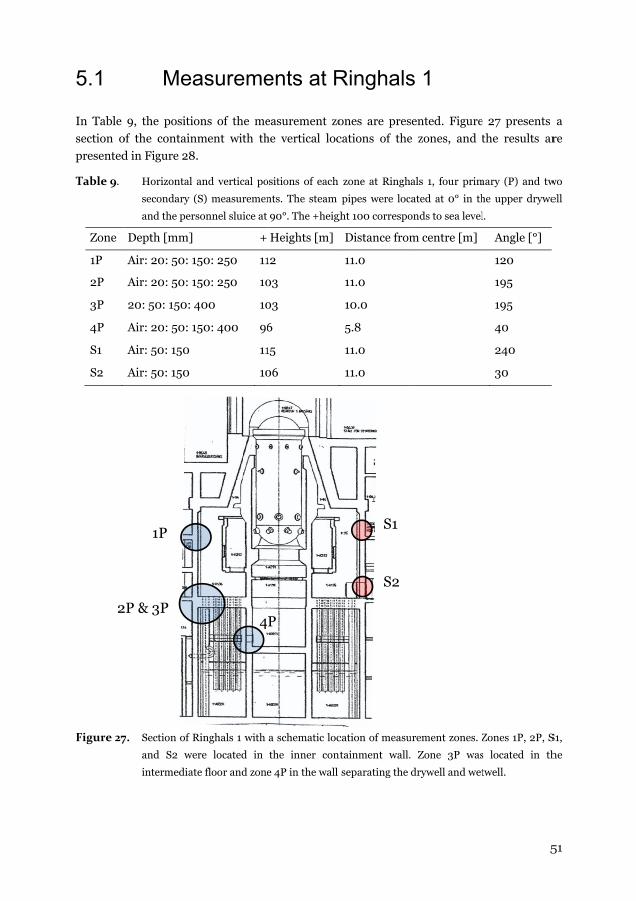
5.1
In Table
section o
presented
Table 9.
Zone
1P
2P
3P
4P
S1
S2
Figure 27
2
Mea
9, the positio
of the contain
d in Figure 28
Horizontal
secondary (
and the pers
Depth [mm]
Air: 20: 50: 1
Air: 20: 50: 1
20: 50: 150: 4
Air: 20: 50: 1
Air: 50: 150
Air: 50: 150
7. Section of R
and S2 we
intermediat
1P
2P & 3P
asureme
ons of the me
nment with th
.
and vertical po
(S) measuremen
sonnel sluice at
+
150: 250 11
150: 250 10
400 10
150: 400 96
11
10
Ringhals 1 with
ere located in
te floor and zone
4
ents at R
easurement zo
he vertical loc
ositions of each
nts. The steam
90°. The +heig
Heights [m]
12
03
03
6
15
06
a schematic loc
the inner con
e 4P in the wall
P
Ringhals
ones are pres
cations of the
zone at Ringh
pipes were loc
ght 100 correspo
Distance from
11.0
11.0
10.0
5.8
11.0
11.0
cation of measu
ntainment wall.
separating the
4P
S1
S2
s 1
sented. Figure
e zones, and
als 1, four prim
cated at 0° in th
onds to sea level
m centre [m]
urement zones. Z
. Zone 3P was
drywell and wet
5
e 27 presents
the results ar
mary (P) and tw
he upper drywe
l.
Angle [°]
120
195
195
40
240
30
Zones 1P, 2P, S
s located in th
twell.
51
a
re
wo
ell
S1,
he
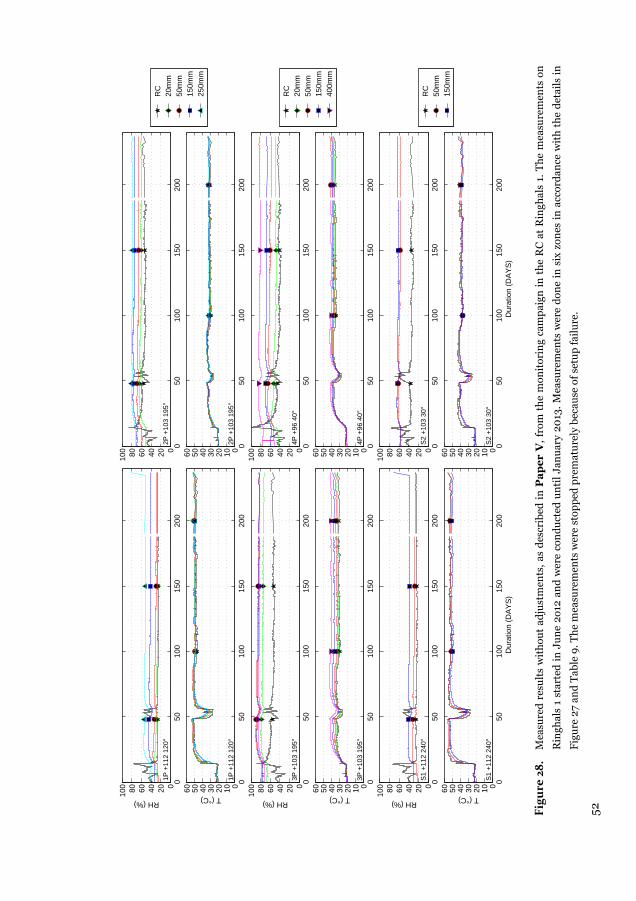
52
Figure 28.
Mea
sure
d r
esu
lts
wit
hou
t ad
just
men
ts,
as d
escr
ibed
in
Pa
pe
r V
, fr
om t
he
mon
itor
ing
cam
pai
gn i
n t
he
RC
at
Rin
ghal
s 1.
Th
e m
easu
rem
ents
on
Rin
ghal
s 1
star
ted
in
Ju
ne
2o12
an
d w
ere
con
du
cted
un
til
Jan
uar
y 20
13.
Mea
sure
men
ts w
ere
don
e in
six
zon
es i
n a
ccor
dan
ce w
ith
th
e d
etai
ls i
n
Fig
ure
27
and
Tab
le 9
. Th
e m
easu
rem
ents
wer
e st
opp
ed p
rem
atu
rely
bec
ause
of
setu
p fa
ilu
re.
050
100
150
200
020406080100
RH (%)
1P +
112
120°
050
100
150
200
0102030405060
T (°C)
1P +
112
120°
050
100
150
200
020406080100
2P +
103
195°
RC
20m
m50
mm
150m
m25
0mm
050
100
150
200
0102030405060
2P +
103
195°
050
100
150
200
020406080100
RH (%)
3P +
103
195°
050
100
150
200
0102030405060
T (°C)
3P +
103
195°
050
100
150
200
020406080100
4P +
96 4
0°
RC
20m
m50
mm
150m
m40
0mm
050
100
150
200
0102030405060
4P +
96 4
0°
050
100
150
200
020406080100
RH (%)
S1
+11
2 24
0°
050
100
150
200
020406080100
S2
+10
3 30
°
RC
50m
m15
0mm
050
100
150
200
0102030405060
Dur
atio
n (D
AY
S)
S2
+10
3 30
°
050
100
150
200
0102030405060
Dur
atio
n (D
AY
S)
T (°C)
S1
+11
2 24
0°
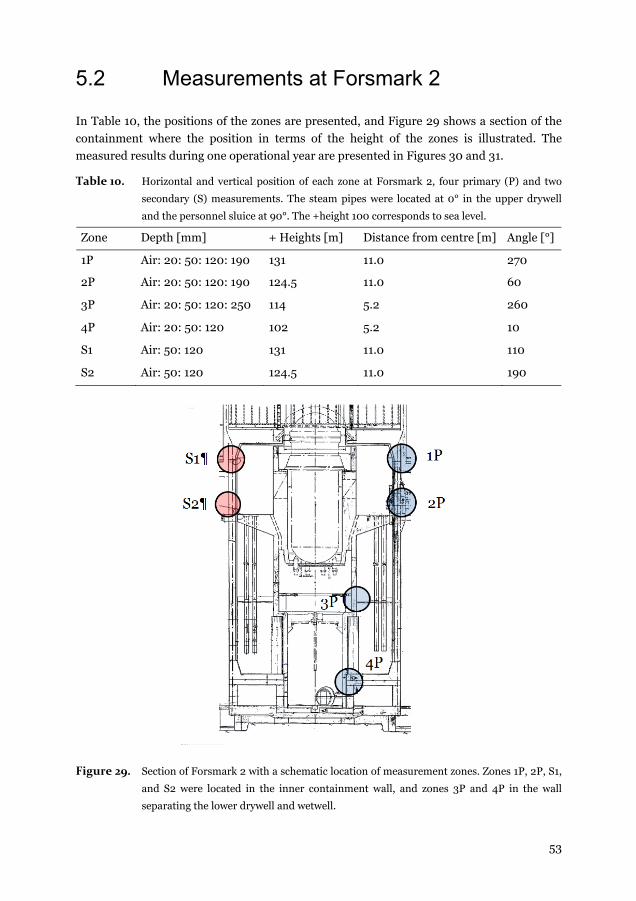
53
5.2 Measurements at Forsmark 2
In Table 10, the positions of the zones are presented, and Figure 29 shows a section of the
containment where the position in terms of the height of the zones is illustrated. The
measured results during one operational year are presented in Figures 30 and 31.
Table 10. Horizontal and vertical position of each zone at Forsmark 2, four primary (P) and two
secondary (S) measurements. The steam pipes were located at 0° in the upper drywell
and the personnel sluice at 90°. The +height 100 corresponds to sea level.
Zone Depth [mm] + Heights [m] Distance from centre [m] Angle [°]
1P Air: 20: 50: 120: 190 131 11.0 270
2P Air: 20: 50: 120: 190 124.5 11.0 60
3P Air: 20: 50: 120: 250 114 5.2 260
4P Air: 20: 50: 120 102 5.2 10
S1 Air: 50: 120 131 11.0 110
S2 Air: 50: 120 124.5 11.0 190
Figure 29. Section of Forsmark 2 with a schematic location of measurement zones. Zones 1P, 2P, S1,
and S2 were located in the inner containment wall, and zones 3P and 4P in the wall
separating the lower drywell and wetwell.
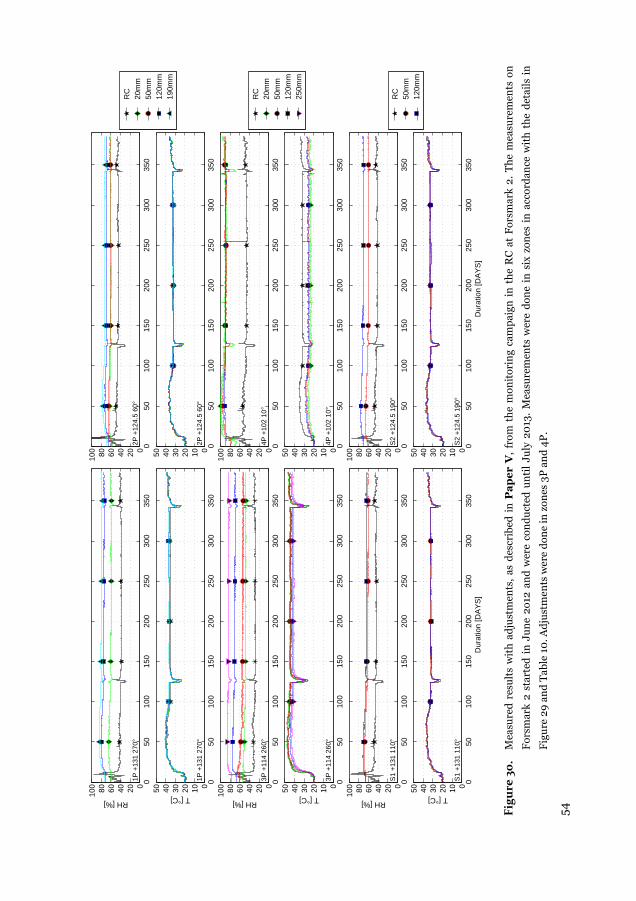
54
Figure 30.
Mea
sure
d r
esu
lts
wit
h a
dju
stm
ents
, as
des
crib
ed i
n P
ap
er
V,
from
th
e m
onit
orin
g ca
mp
aign
in
th
e R
C a
t F
orsm
ark
2. T
he
mea
sure
men
ts o
n
For
smar
k 2
star
ted
in
Ju
ne
2o12
an
d w
ere
con
du
cted
un
til
July
20
13.
Mea
sure
men
ts w
ere
don
e in
six
zon
es i
n a
ccor
dan
ce w
ith
th
e d
etai
ls i
n
Fig
ure
29
and
Tab
le 1
0. A
dju
stm
ents
wer
e d
one
in z
ones
3P
an
d 4
P.
050
100
150
200
250
300
350
020406080100
RH [%]
1P +
131
270°
050
100
150
200
250
300
350
01020304050
T [°C]
1P +
131
270°
050
100
150
200
250
300
350
020406080100
2P +
124.
5 60
°
RC
20m
m50
mm
120m
m19
0mm
050
100
150
200
250
300
350
01020304050
2P +
124.
5 60
°
050
100
150
200
250
300
350
020406080100
RH [%]
3P +
114
260°
050
100
150
200
250
300
350
01020304050
T [°C]
3P +
114
260°
RC
20m
m50
mm
120m
m25
0mm
050
100
150
200
250
300
350
020406080100
4P +
102
10°
050
100
150
200
250
300
350
01020304050
4P +
102
10°
050
100
150
200
250
300
350
020406080100
RH [%]
S1
+13
1 11
0°
050
100
150
200
250
300
350
01020304050
Dur
atio
n [D
AY
S]
T [°C]
S1
+13
1 11
0°
050
100
150
200
250
300
350
020406080100
S2
+12
4.5
190°
RC
50m
m12
0mm
050
100
150
200
250
300
350
01020304050
Dur
atio
n [D
AY
S]
S2
+12
4.5
190°
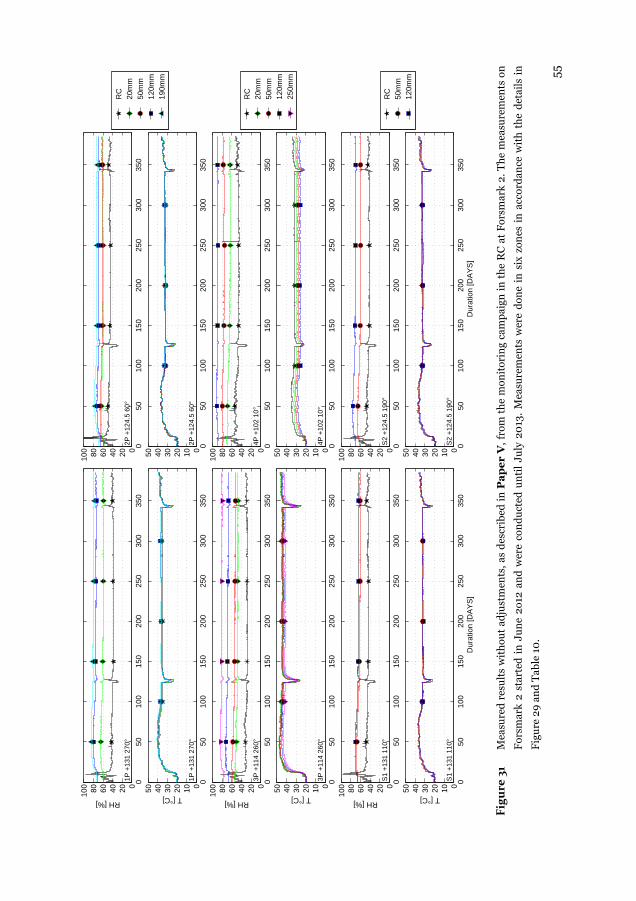
55
Figure 31
M
easu
red
res
ult
s w
ith
out
adju
stm
ents
, as
des
crib
ed i
n P
ap
er
V, f
rom
th
e m
onit
orin
g ca
mp
aign
in
th
e R
C a
t F
orsm
ark
2. T
he
mea
sure
men
ts o
n
For
smar
k 2
star
ted
in
Ju
ne
2o12
an
d w
ere
con
du
cted
un
til
July
20
13.
Mea
sure
men
ts w
ere
don
e in
six
zon
es i
n a
ccor
dan
ce w
ith
th
e d
etai
ls i
n
Fig
ure
29
and
Tab
le 1
0.
050
100
150
200
250
300
350
020406080100
RH [%]
1P +
131
270°
050
100
150
200
250
300
350
01020304050
T [°C]
1P +
131
270°
050
100
150
200
250
300
350
020406080100
2P +
124.
5 60
°
RC
20m
m50
mm
120m
m19
0mm
050
100
150
200
250
300
350
01020304050
2P +
124.
5 60
°
050
100
150
200
250
300
350
020406080100
RH [%]
3P +
114
260°
050
100
150
200
250
300
350
01020304050
T [°C]
3P +
114
260°
RC
20m
m50
mm
120m
m25
0mm
050
100
150
200
250
300
350
020406080100
4P +
102
10°
050
100
150
200
250
300
350
01020304050
4P +
102
10°
050
100
150
200
250
300
350
020406080100
RH [%]
S1
+13
1 11
0°
050
100
150
200
250
300
350
01020304050
Dur
atio
n [D
AY
S]
T [°C]
S1
+13
1 11
0°
050
100
150
200
250
300
350
020406080100
S2
+12
4.5
190°
RC
50m
m12
0mm
050
100
150
200
250
300
350
01020304050
Dur
atio
n [D
AY
S]
S2
+12
4.5
190°
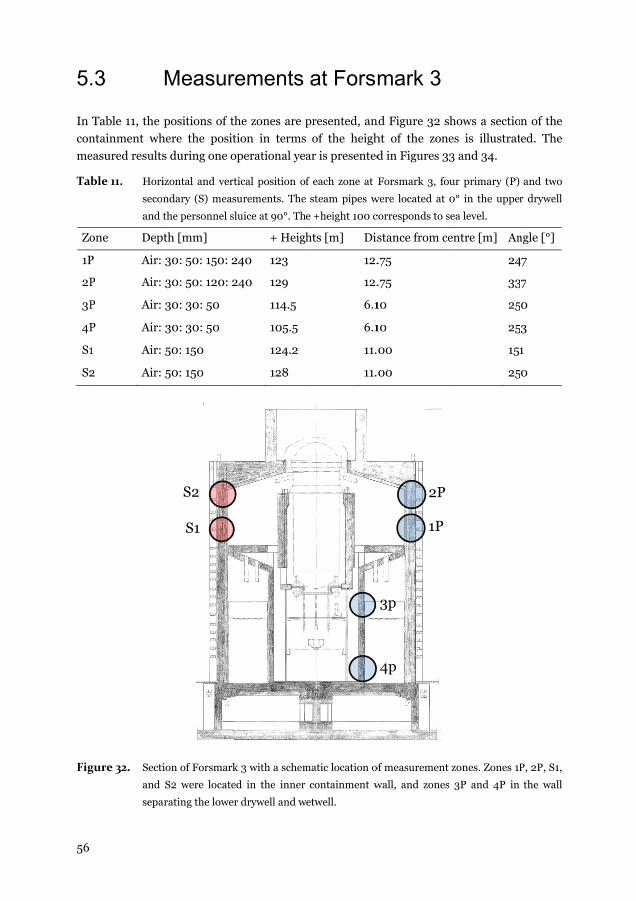
56
5.
In
con
me
Tab
Zo
1P
2P
3P
4P
S1
S2
Fig
.3
Table 11, the
ntainment wh
easured results
ble 11. Hori
seco
and t
one Dep
P Air:
P Air:
P Air:
P Air:
1 Air:
2 Air:
gure 32. Secti
and
sepa
Measur
positions of th
here the posit
s during one o
izontal and vert
ndary (S) meas
the personnel sl
pth [mm]
30: 50: 150: 2
30: 50: 120: 2
30: 30: 50
30: 30: 50
50: 150
50: 150
ion of Forsmark
S2 were locate
arating the lower
S2
S1
rements
he zones are p
tion in terms
operational ye
tical position of
surements. The
luice at 90°. Th
+ Heigh
240 123
240 129
114.5
105.5
124.2
128
k 3 with a schem
ed in the inner
r drywell and w
at Forsm
presented, an
of the heigh
ar is presented
f each zone at
steam pipes w
e +height 100 c
hts [m] Dis
12.
12.
6.1
6.1
11.
11.
matic location o
containment w
wetwell.
mark 3
nd Figure 32 s
ht of the zone
d in Figures 3
Forsmark 3, fo
were located at
corresponds to s
stance from ce
.75
.75
10
10
00
00
of measurement
wall, and zones
2P
1P
3p
4p
hows a sectio
es is illustrat
3 and 34.
ur primary (P)
0° in the upper
sea level.
entre [m] An
24
33
25
25
151
25
zones. Zones 1P
s 3P and 4P in
n of the
ed. The
and two
r drywell
ngle [°]
47
7
0
3
1
0
P, 2P, S1,
the wall
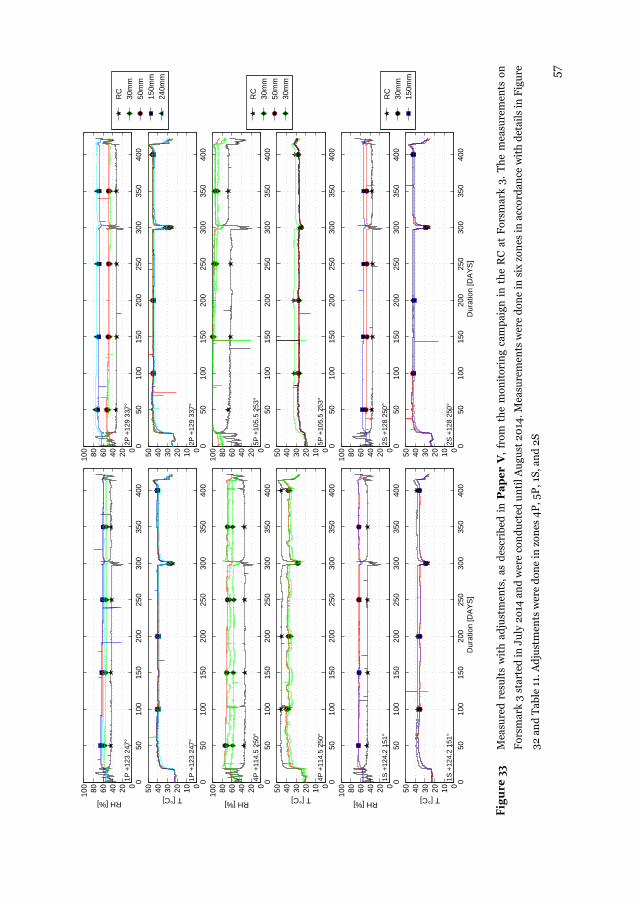
57
Figure 33
M
easu
red
res
ult
s w
ith
ad
just
men
ts,
as d
escr
ibed
in
Pa
pe
r V
, fr
om t
he
mon
itor
ing
cam
pai
gn i
n t
he
RC
at
For
smar
k 3.
Th
e m
easu
rem
ents
on
For
smar
k 3
star
ted
in J
uly
2o1
4 an
d w
ere
con
du
cted
un
til A
ugu
st 2
014
. Mea
sure
men
ts w
ere
don
e in
six
zon
es in
acc
ord
ance
wit
h d
etai
ls in
Fig
ure
32 a
nd
Tab
le 1
1. A
dju
stm
ents
wer
e d
one
in z
ones
4P
, 5P
, 1S,
an
d 2
S
050
100
150
200
250
300
350
400
020406080100
RH [%]
1P +
123
247°
050
100
150
200
250
300
350
400
01020304050
T [°C]
1P +
123
247°
050
100
150
200
250
300
350
400
020406080100
RH [%]
1S +
124.
2 15
1°
050
100
150
200
250
300
350
400
01020304050
Dur
atio
n [D
AY
S]
T [°C]
1S +
124.
2 15
1°
050
100
150
200
250
300
350
400
020406080100
2S +
128
250°
RC
30m
m15
0mm
050
100
150
200
250
300
350
400
01020304050
Dur
atio
n [D
AY
S]
2S +
128
250°
050
100
150
200
250
300
350
400
020406080100
2P +
129
337°
RC
30m
m50
mm
150m
m24
0mm
050
100
150
200
250
300
350
400
01020304050
2P +
129
337°
050
100
150
200
250
300
350
400
020406080100
RH [%]
4P +
114.
5 25
0°
050
100
150
200
250
300
350
400
01020304050
T [°C]
4P +
114.
5 25
0°
0
5010
015
020
025
030
035
040
0020406080100
5P +
105.
5 25
3°
RC
30m
m50
mm
30m
m
050
100
150
200
250
300
350
400
01020304050
5P +
105.
5 25
3°
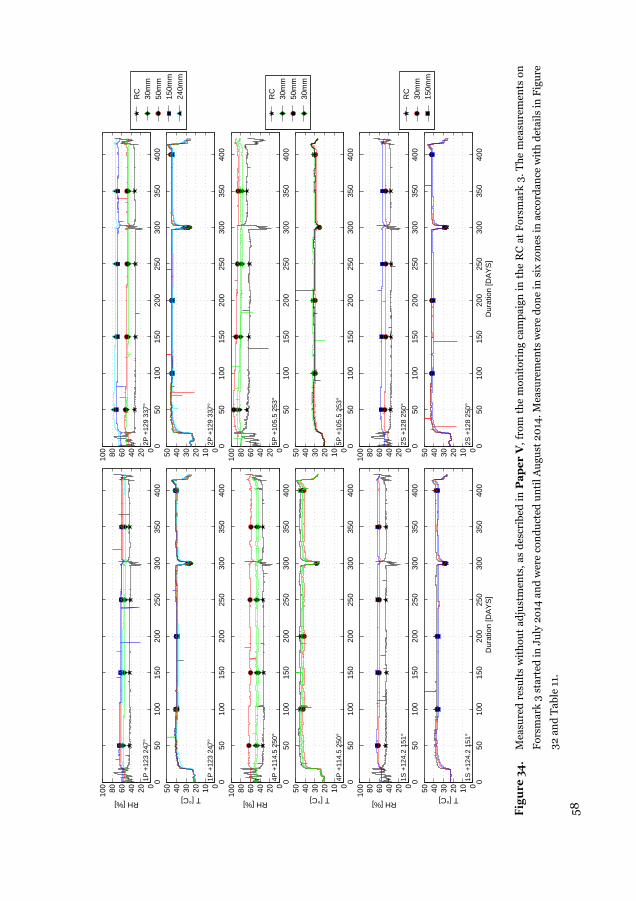
58
Figure 34.
Mea
sure
d r
esu
lts
wit
hou
t ad
just
men
ts, a
s d
escr
ibed
in
Pa
pe
r V
, fro
m t
he
mon
itor
ing
cam
pai
gn i
n t
he
RC
at
For
smar
k 3.
Th
e m
easu
rem
ents
on
For
smar
k 3
star
ted
in J
uly
2o1
4 an
d w
ere
con
du
cted
un
til A
ugu
st 2
014
. Mea
sure
men
ts w
ere
don
e in
six
zon
es in
acc
ord
ance
wit
h d
etai
ls in
Fig
ure
32 a
nd
Tab
le 1
1.
050
100
150
200
250
300
350
400
020406080100
RH [%]
1P +
123
247°
050
100
150
200
250
300
350
400
01020304050
T [°C]
1P +
123
247°
050
100
150
200
250
300
350
400
020406080100
RH [%]
1S +
124.
2 15
1°
050
100
150
200
250
300
350
400
01020304050
Dur
atio
n [D
AY
S]
T [°C]
1S +
124.
2 15
1°
050
100
150
200
250
300
350
400
020406080100
2S +
128
250°
RC
30m
m15
0mm
050
100
150
200
250
300
350
400
01020304050
Dur
atio
n [D
AY
S]
2S +
128
250°
050
100
150
200
250
300
350
400
020406080100
2P +
129
337°
RC
30m
m50
mm
150m
m24
0mm
050
100
150
200
250
300
350
400
01020304050
2P +
129
337°
050
100
150
200
250
300
350
400
020406080100
RH [%]
4P +
114.
5 25
0°
050
100
150
200
250
300
350
400
01020304050
T [°C]
4P +
114.
5 25
0°
0
5010
015
020
025
030
035
040
0020406080100
5P +
105.
5 25
3°
RC
30m
m50
mm
30m
m
050
100
150
200
250
300
350
400
01020304050
5P +
105.
5 25
3°
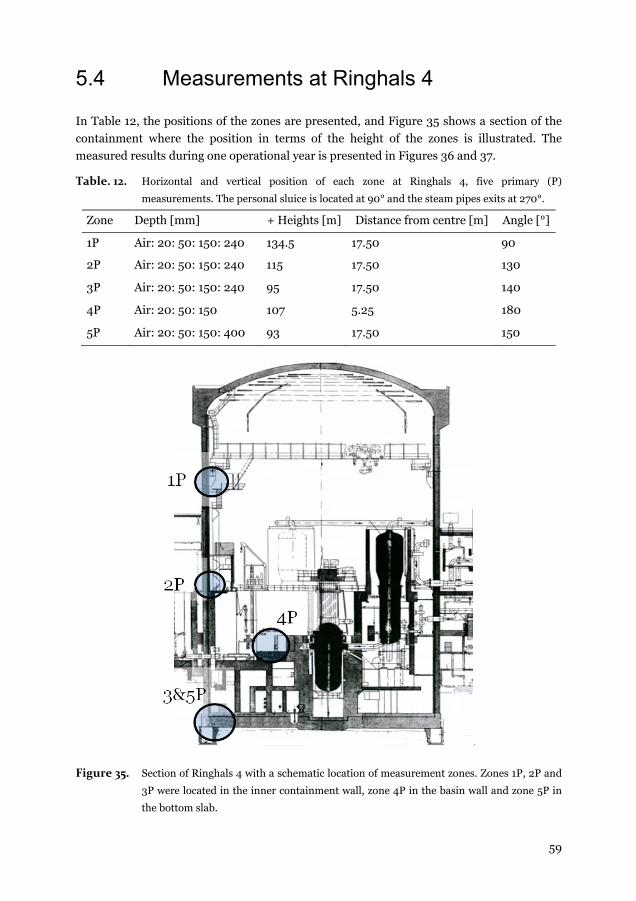
59
5.4 Measurements at Ringhals 4
In Table 12, the positions of the zones are presented, and Figure 35 shows a section of the
containment where the position in terms of the height of the zones is illustrated. The
measured results during one operational year is presented in Figures 36 and 37.
Table. 12. Horizontal and vertical position of each zone at Ringhals 4, five primary (P)
measurements. The personal sluice is located at 90° and the steam pipes exits at 270°.
Zone Depth [mm] + Heights [m] Distance from centre [m] Angle [°]
1P Air: 20: 50: 150: 240 134.5 17.50 90
2P Air: 20: 50: 150: 240 115 17.50 130
3P Air: 20: 50: 150: 240 95 17.50 140
4P Air: 20: 50: 150 107 5.25 180
5P Air: 20: 50: 150: 400 93 17.50 150
Figure 35. Section of Ringhals 4 with a schematic location of measurement zones. Zones 1P, 2P and
3P were located in the inner containment wall, zone 4P in the basin wall and zone 5P in
the bottom slab.
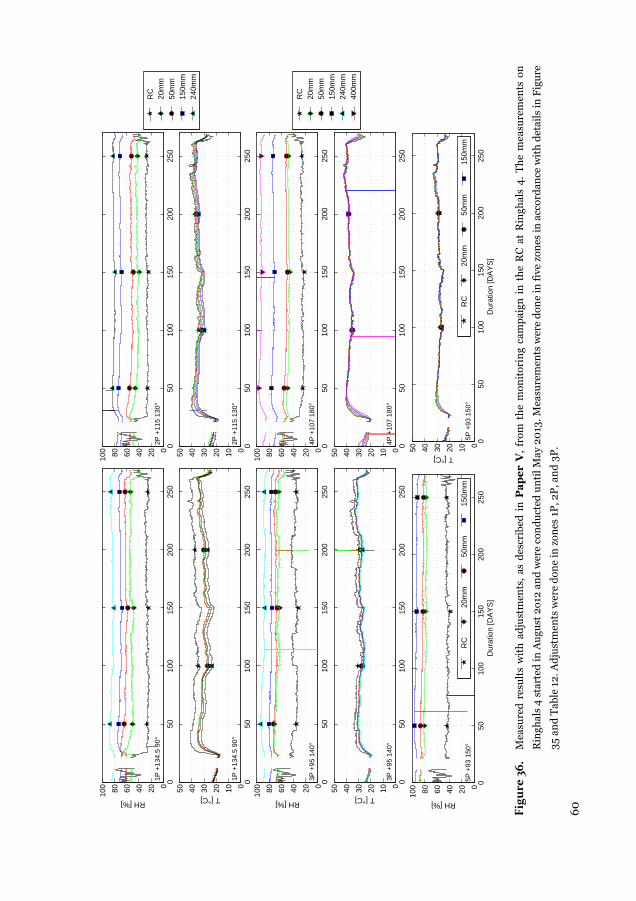
60
Figure 36.
Mea
sure
d r
esu
lts
wit
h a
dju
stm
ents
, as
des
crib
ed i
n P
ap
er
V,
from
th
e m
onit
orin
g ca
mp
aign
in
th
e R
C a
t R
ingh
als
4. T
he
mea
sure
men
ts o
n
Rin
ghal
s 4
sta
rted
in A
ugu
st 2
o12
and
wer
e co
nd
uct
ed u
nti
l May
20
13. M
easu
rem
ents
wer
e d
one
in fi
ve z
ones
in a
ccor
dan
ce w
ith
det
ails
in F
igu
re
35 a
nd
Tab
le 1
2. A
dju
stm
ents
wer
e d
one
in z
ones
1P
, 2P
, an
d 3
P.
050
100
150
200
250
020406080100
RH [%]
1P +
134.
5 90
°
050
100
150
200
250
01020304050
T [°C]
1P +
134.
5 90
°
050
100
150
200
250
020406080100
2P +
115
130°
RC
20m
m50
mm
150m
m24
0mm
050
100
150
200
250
01020304050
2P +
115
130°
050
100
150
200
250
020406080100
RH [%]
3P +
95 1
40°
050
100
150
200
250
01020304050
T [°C]
3P +
95 1
40°
050
100
150
200
250
020406080100
4P +
107
180°
RC
20m
m50
mm
150m
m24
0mm
400m
m
050
100
150
200
250
01020304050
4P +
107
180°
050
100
150
200
250
020406080100
Dur
atio
n [D
AY
S]
RH [%]
5P +
93 1
50°
RC
20m
m50
mm
150m
m
050
100
150
200
250
01020304050
Dur
atio
n [D
AY
S]
T [°C]
5P +
93 1
50°
RC
20m
m50
mm
150m
m
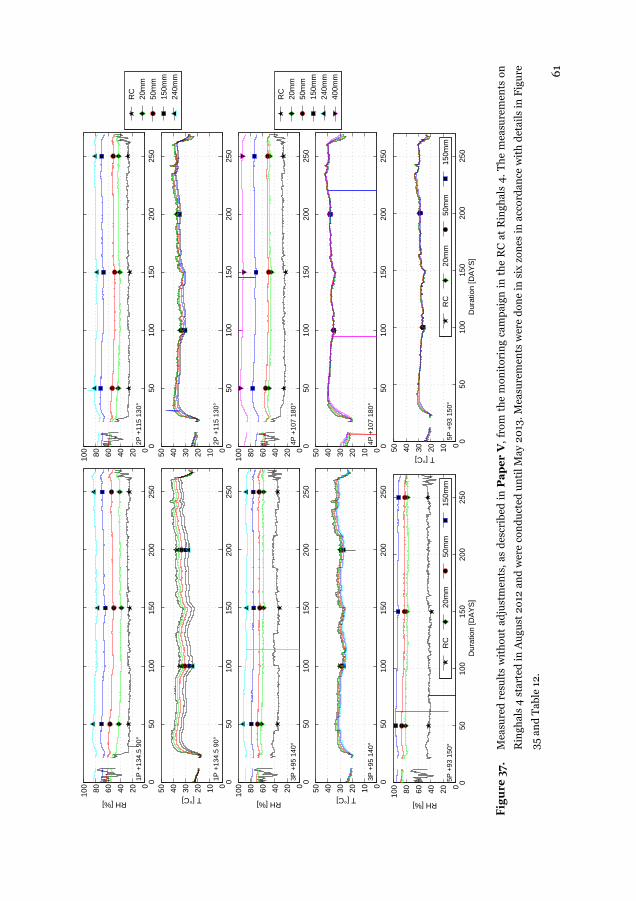
61
Figure 37.
M
easu
red
res
ult
s w
ith
out
adju
stm
ents
, as
des
crib
ed i
n P
ap
er
V,
from
th
e m
onit
orin
g ca
mp
aign
in
th
e R
C a
t R
ingh
als
4. T
he
mea
sure
men
ts o
n
Rin
ghal
s 4
star
ted
in A
ugu
st 2
o12
and
wer
e co
nd
uct
ed u
nti
l May
20
13. M
easu
rem
ents
wer
e d
one
in s
ix z
ones
in a
ccor
dan
ce w
ith
det
ails
in F
igu
re
35 a
nd
Tab
le 1
2.
050
100
150
200
250
020406080100
RH [%]
1P +
134.
5 90
°
050
100
150
200
250
01020304050
T [°C]
1P +
134.
5 90
°
050
100
150
200
250
020406080100
2P +
115
130°
RC
20m
m50
mm
150m
m24
0mm
050
100
150
200
250
01020304050
2P +
115
130°
050
100
150
200
250
020406080100
RH [%]
3P +
95 1
40°
050
100
150
200
250
01020304050
T [°C]
3P +
95 1
40°
050
100
150
200
250
020406080100
4P +
107
180°
RC
20m
m50
mm
150m
m24
0mm
400m
m
050
100
150
200
250
01020304050
4P +
107
180°
050
100
150
200
250
020406080100
Dur
atio
n [D
AY
S]
RH [%]
5P +
93 1
50°
RC
20m
m50
mm
150m
m
050
100
150
200
250
01020304050
Dur
atio
n [D
AY
S]
T [°C]5P
+93
150
°
RC
20m
m50
mm
150m
m

62
63
6 Moisture contribution
A model was developed in this study to evaluate the ongoing moisture transport in different
concrete components within the reactor containments during operation. The purpose of the
model was to describe the ongoing processes as well as predict future conditions. The model
is briefly presented in Chapter 4, and is given by Eq. 9. A thorough presentation of the
model can be found in Paper VI. The model was validated by in situ measurements, as
described in Chapter 5. The model was used to evaluate the conditions in the inner
containment wall at the Nordic BWRs and predict its moisture contribution to the ambient
compartments. The inner containment wall was chosen because it has similarities in
different BWRs, and also covers all the regions of the upper drywell, allowing an evaluation
of the whole compartment.
A MATLAB function for simulation of the ongoing drying of the reactor containments was
designed using forward differential equations based on the model presented earlier. The
structure of the function was designed as a main subroutine that communicated with the
main loop. The main loop corresponds to one operational year. The operational year of the
BWRs and the corresponding boundary conditions for the concrete components were
divided into one outage period and one operational period. This was done based on the
findings regarding seasonal changes, as presented in Paper II. Continuous changes in
temperature and RH, as those observed at a PWR, require a more advanced non-isothermal
model.
Simulations of the process for each year was further subdivided to cope with boundary
variations, and the output from each subperiod was used as input in the following period.
The same system applies for each year’s cycle. A schematic illustration of the model design
is shown in Figure 38. The material properties, sorption isotherms and moisture transfer
coefficient were covered in additional subroutines, and used by the subcalculation loops.
The subcalculation loop calculated the flux between each cell, and the new condition was
calculated by the sum of the derivatives of the sorption isotherm.
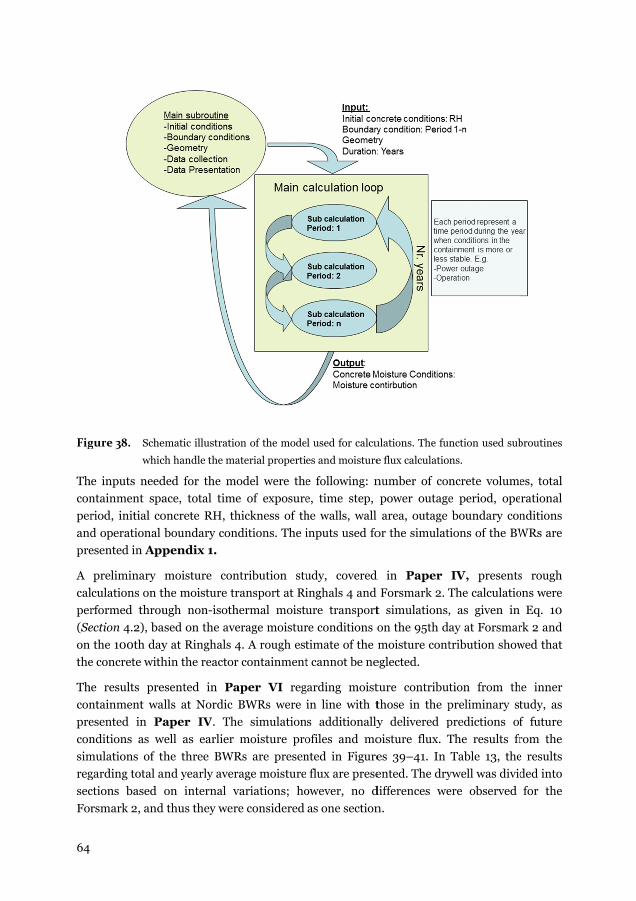
64
Fig
The
con
per
and
pre
A
cal
per
(Se
on
the
The
con
pre
con
sim
reg
sec
For
gure 38. Sche
whic
e inputs need
ntainment spa
riod, initial co
d operational
esented in App
preliminary
culations on t
rformed throu
ection 4.2), ba
the 100th day
e concrete with
e results pre
ntainment wa
esented in Pa
nditions as w
mulations of t
garding total a
ctions based
rsmark 2, and
ematic illustrati
ch handle the m
ded for the m
ace, total tim
oncrete RH, th
boundary con
pendix 1.
moisture con
the moisture t
ugh non-isoth
ased on the av
y at Ringhals
hin the reactor
esented in Pa
alls at Nordic
aper IV. Th
well as earlier
the three BWR
and yearly aver
on internal v
d thus they wer
on of the mode
material properti
model were the
me of exposure
hickness of th
nditions. The i
ntribution stu
transport at Ri
hermal moist
verage moistur
4. A rough est
r containment
aper VI reg
BWRs were
he simulation
moisture pro
Rs are presen
rage moisture
variations; ho
re considered
el used for calcu
es and moisture
e following: n
e, time step,
he walls, wall
inputs used fo
udy, covered
inghals 4 and
ure transport
re conditions o
timate of the
t cannot be ne
garding moist
in line with t
ns additionally
ofiles and mo
nted in Figure
e flux are prese
owever, no d
as one section
ulations. The fu
e flux calculatio
number of con
power outage
area, outage
or the simulat
d in Paper
Forsmark 2. T
t simulations,
on the 95th d
moisture cont
eglected.
ture contribu
those in the p
y delivered p
oisture flux. T
es 39–41. In
ented. The dry
differences we
n.
nction used sub
ns.
ncrete volume
e period, ope
boundary con
tions of the BW
IV, presents
The calculatio
, as given in
ay at Forsmar
tribution show
tion from th
preliminary st
predictions of
The results fr
Table 13, the
ywell was divid
ere observed
broutines
es, total
rational
nditions
WRs are
s rough
ons were
Eq. 10
rk 2 and
wed that
he inner
tudy, as
f future
rom the
e results
ded into
for the
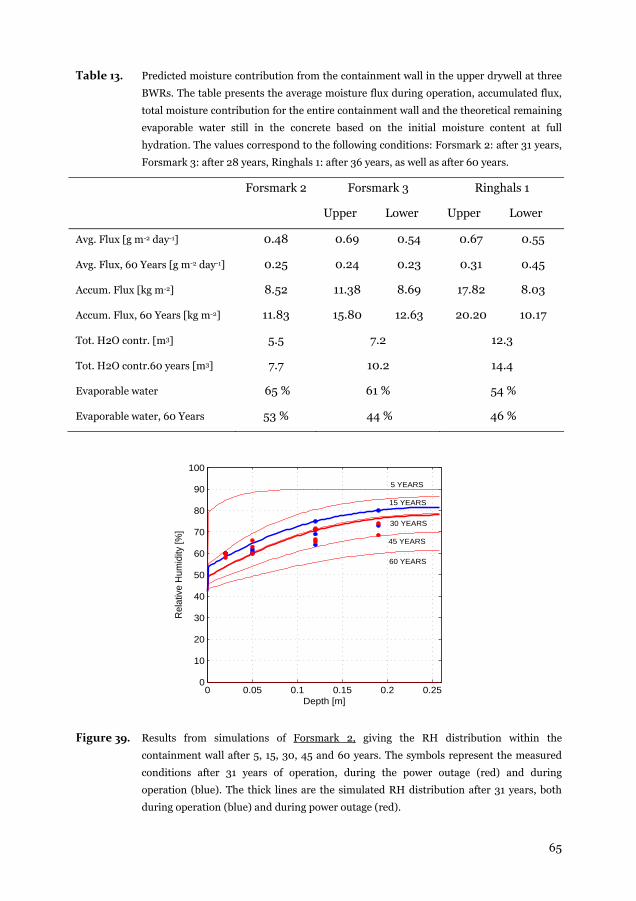
65
Table 13. Predicted moisture contribution from the containment wall in the upper drywell at three
BWRs. The table presents the average moisture flux during operation, accumulated flux,
total moisture contribution for the entire containment wall and the theoretical remaining
evaporable water still in the concrete based on the initial moisture content at full
hydration. The values correspond to the following conditions: Forsmark 2: after 31 years,
Forsmark 3: after 28 years, Ringhals 1: after 36 years, as well as after 60 years.
Forsmark 2 Forsmark 3 Ringhals 1
Upper Lower Upper Lower
Avg. Flux [g m-2 day-1] 0.48 0.69 0.54 0.67 0.55
Avg. Flux, 60 Years [g m-2 day-1] 0.25 0.24 0.23 0.31 0.45
Accum. Flux [kg m-2] 8.52 11.38 8.69 17.82 8.03
Accum. Flux, 60 Years [kg m-2] 11.83 15.80 12.63 20.20 10.17
Tot. H2O contr. [m3] 5.5 7.2 12.3
Tot. H2O contr.60 years [m3] 7.7 10.2 14.4
Evaporable water 65 % 61 % 54 %
Evaporable water, 60 Years 53 % 44 % 46 %
Figure 39. Results from simulations of Forsmark 2, giving the RH distribution within the
containment wall after 5, 15, 30, 45 and 60 years. The symbols represent the measured
conditions after 31 years of operation, during the power outage (red) and during
operation (blue). The thick lines are the simulated RH distribution after 31 years, both
during operation (blue) and during power outage (red).
0 0.05 0.1 0.15 0.2 0.250
10
20
30
40
50
60
70
80
90
100
Rel
ativ
e H
umid
ity [%
]
Depth [m]
5 YEARS
15 YEARS
30 YEARS
45 YEARS
60 YEARS
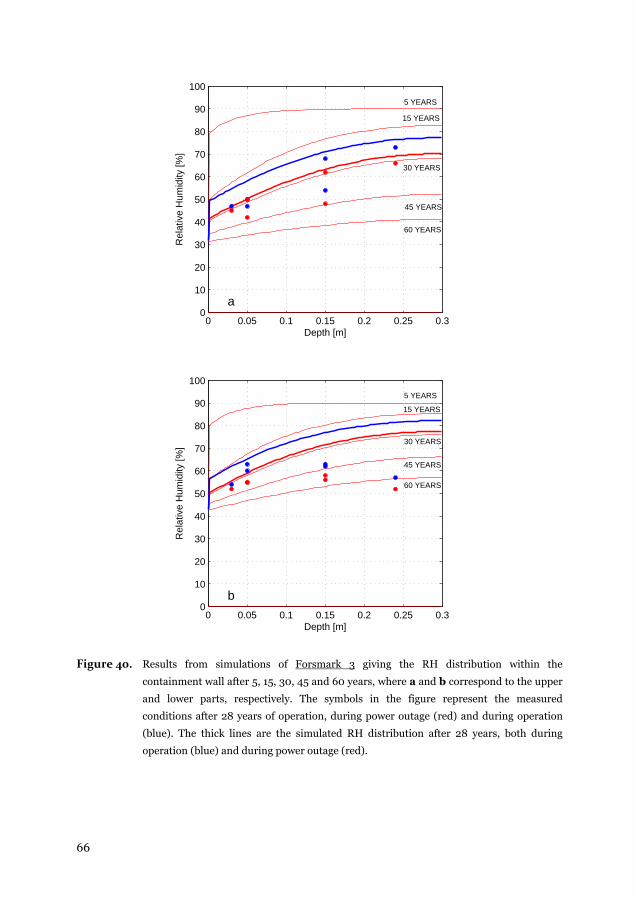
66
Figure 40. Results from simulations of Forsmark 3 giving the RH distribution within the
containment wall after 5, 15, 30, 45 and 60 years, where a and b correspond to the upper
and lower parts, respectively. The symbols in the figure represent the measured
conditions after 28 years of operation, during power outage (red) and during operation
(blue). The thick lines are the simulated RH distribution after 28 years, both during
operation (blue) and during power outage (red).
0 0.05 0.1 0.15 0.2 0.25 0.30
10
20
30
40
50
60
70
80
90
100
Rel
ativ
e H
umid
ity [%
]
Depth [m]
a
5 YEARS
15 YEARS
30 YEARS
45 YEARS
60 YEARS
0 0.05 0.1 0.15 0.2 0.25 0.30
10
20
30
40
50
60
70
80
90
100
Rel
ativ
e H
umid
ity [%
]
Depth [m]
b
5 YEARS
15 YEARS
30 YEARS
45 YEARS
60 YEARS
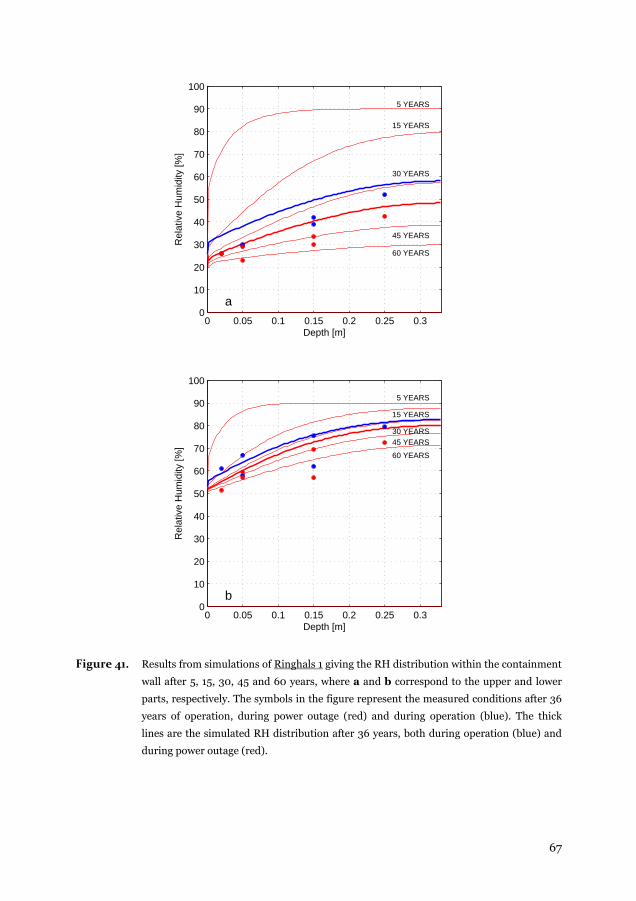
67
Figure 41. Results from simulations of Ringhals 1 giving the RH distribution within the containment
wall after 5, 15, 30, 45 and 60 years, where a and b correspond to the upper and lower
parts, respectively. The symbols in the figure represent the measured conditions after 36
years of operation, during power outage (red) and during operation (blue). The thick
lines are the simulated RH distribution after 36 years, both during operation (blue) and
during power outage (red).
0 0.05 0.1 0.15 0.2 0.25 0.30
10
20
30
40
50
60
70
80
90
100
Rel
ativ
e H
umid
ity [%
]
Depth [m]
a
5 YEARS
15 YEARS
30 YEARS
45 YEARS
60 YEARS
0 0.05 0.1 0.15 0.2 0.25 0.30
10
20
30
40
50
60
70
80
90
100
Rel
ativ
e H
umid
ity [%
]
Depth [m]
b
5 YEARS
15 YEARS
30 YEARS45 YEARS
60 YEARS

68
69
7 Concluding remarks
The moisture contributions from the concrete as well as from other moisture sources have
to be known to reliably evaluate the moisture condition within a reactor containment.
Systematic measurements of the moisture conditions of interior air and concrete are needed
to understand to some extent, the prevailing moisture condition in a reactor containment
and the expected contribution from the concrete structures in contact with the interior air.
By measuring the moisture profiles in the concrete structures during operation and the
boundary conditions at the concrete surfaces, the actual moisture conditions in the
structures and the drying rate could be determined. These data were thereafter used to
validate a model to determine the past and future moisture conditions in the concrete
structures in the rector containment.
A measurement setup was designed and evaluated in this project. The setup was used in the
monitoring campaigns at four NPPs in Sweden in order to describe the conditions within
the different containments during an operational year. The monitoring campaigns were
designed to describe the overall conditions, both in the compartments and in the concrete
structures. Equivalent zones and concrete structures were chosen at the NPPs to evaluate
internal variations as well as similarities and differences between the different NPPs. The
inner containment wall was chosen as the main structure for the comparisons, as the design
was similar between all NPPs included in this study, and because of its being one of the
larger structures in each containment.
A stable and reliable measurement setup was essential to ensure that the conditions
monitored can be considered as accurate. Because of this requirement, the setup was
thoroughly tested in evaluations in controlled conditions, as given in Papers IV and V,
through computer simulations, as given in Paper V, and in situ measurements, as given in
Papers III and IV. It was concluded from these evaluations that the setup was stable and
valid for long term monitoring in concrete structures when in isothermal condition. Based
on the results, it was concluded that measurements at shallow depths, i.e. 20 and 50 mm,
have to be treated with more attention. Later results from the moisture transport model, as
presented in Paper VI, however showed that in some zone, e.g. zone 1P at Ringhals 1, the
concrete was exposed for drying and rewetting, and consequently, what was earlier
suggested as leakage is most likely the moisture movement. It was concluded that
measurements at shallow depths require more attention and that a revision of the opening
gap sealant system is needed.
The largest error while using the test setup was found when temperature differences
between the concrete and the surroundings occurred. Because of the design of the setup, the
70
temperature measurements in the concrete were directly affected by the ambient
temperature and required a correction in this misread value. An evaluation in a laboratory
condition, presented in Paper V, showed that the effect was large while measuring at
shallow depths, and this effect had to be considered. This effect reduced with depth, and for
measurements at depths greater than 100 mm, the temperature misread directly correlated
to the temperature gradient in the material, and not to the ambient conditions. However,
from the evaluations, it was not possible to deliver a universal tool to cope with these errors,
as site specific conditions affect the influence, e.g. through variation of surface thermal
resistance. Based on the findings, it is suggested that the surface temperature is to be
measured in order to better adjust the measurements when in non-isothermal conditions.
The measurements in situ presented in this thesis, together with the information in Papers
I, II, III, IV and VI, represent the first instance when such monitoring inside NPPs have
been done systematically and published. The measurements show that there are several
similarities while comparing the different NPPs with regard to the climatic conditions
within different compartments, as well as the conditions within the concretes structures.
Furthermore, the measurements show that there are large variations between all
containments included in this study, both while comparing NPPs of the same type and of
different types. In view of these findings, similar measurements are required at other NPPs
for a proper evaluation of their specific conditions. The results presented here should,
however, be considered as an approximation of the conditions expected for the other NPPs.
The differences observed between the NPPs are a result of differences in the designs of the
inner structures, variations in the internal climatic conditions and the effect of outdoor
temperature, as presented in Paper II. Even though some of the NPPs have several design
similarities, climatic differences are observed. One clear example is while comparing
Forsmark 2 and Forsmark 3, where the measurements show clear internal variations in the
upper drywell at Forsmark 3, but almost no variation at Forsmark 2. The large variations
between the NPPs are considered to be due to the absence of regulation regarding humidity
levels within the RC and concrete, as well as due to a wide array of design regulations
regarding acceptable concrete temperatures. Based on the measurements it was concluded
that all NPPs were within the regulated temperature intervals, even though large variations
occurred. It was also concluded, based on the stable conditions within the containments,
that the humidity within the containments are "as-designed". The constant humidity was
most likely due to the continuous dehumidification; however, in this project, it was not
possible to determine the exact quantity of dehumidified water during the year of operation.
A moisture transport model was developed to address the variations in the conditions
within the Nordic BWRs, presented in Paper VI. Only the BWRs were evaluated because of
a more complex condition existing within the PWRs. Based on the study presented in
Paper II, it was concluded that because of the rapid temperature variations in concrete
structures, as well as in the ambient air, a more advanced non-isothermal model was
needed for the PWR. It was further concluded that it is not possible to derive a non-
isothermal model in this study because of the absence of the relevant material properties,
and methods to determine them.
71
Simulations of moisture transport within the inner containment wall in the upper drywell at
the BWRs was done through a new MATLAB function that was based on the new model and
simulated through forward differential equation loops. The model was validated by
comparing the simulations with the in situ measurements, as presented in Chapter 5 and
Paper VI, using the equipment and setup designed and evaluated in Papers III, IV and
V. The simulations showed reasonable correlation and acceptable agreement with the
measured conditions. The model was thus considered to deliver a fairly good approximation
of the future conditions as well as describe the earlier conditions with acceptable accuracy.
Complementary measurements are however needed within 5–15 years to validate the
continuing drying equivalent to that predicted by the simulations. The largest source of
error in the simulations is considered to be inaccurate material properties and the
conditions before the reactors were put into operation.
The results of the moisture transport simulation and measurements led to the conclusion
that the concrete components within the containments were still drying and emitted vapour
to the interior air. The simulated results of approximately 30 years of operation indicated
drying of 35–45 % of the initial evaporable water. If similar exposure is considered until 60
years of operation, this would result in a total drying of 45–55 % of the initial evaporable
water. The main drying of the structures has thus already occurred, and the moisture
contribution to the ambient compartments will continue to decrease further.
As it was not possible to quantify the total quantity of water that was collected by the
dehumidification equipment, the actual contribution could not be evaluated. It was
therefore not possible to determine whether the drying of concrete was the main source of
moisture or whether it was negligible. It was however concluded that the concrete within
the containments did contribute with a considerable amount of water. As an example, 10 %
of the concrete at Forsmark 2 has contributed with five cubic meters of water as the reactor
was put into operation until the time of monitoring. The total contribution from Forsmark 3
and Ringhals 1 was seven and twelve cubic meters of water, respectively, as they were
started until the monitoring campaigns were conducted.
The consequence of drying of the concrete within the containments are not obvious.
Different moisture levels in concrete have advantages as well as negative aspects. A high RH
in the concrete may result in an increased risk of corrosion of the metal within the concrete,
provided that an air cavity exists between the concrete and the metal surface. A high RH,
however, drastically reduces the CO2 ingress, and hence the carbonation, and consequently
reduces corrosion of the reinforcement. Moreover, a high RH is essential for the hydration
of the cement. The moisture content within the concrete is also a key element for the
radiation shielding properties, which reduce drastically with a decreasing moisture content.
A large moisture contribution to the surroundings may lead to surface condensation on
metal surfaces on ambient structures and consequently pose an increased risk of surface
corrosion. Drying of concrete also leads to increase in shrinkage and creep.
The optimal moisture conditions in concrete differ for different structures within the
containments. In the case of a new build, the concrete structures could be designed based

72
on the main function of the specific structures; this might however not be possible or be
expensive. The second best approach is to have the knowledge of the moisture conditions
that can be expected in the different structures. In the case of a new build, the concrete used
as well as the structures should be properly evaluated. Further, the specific material
parameters needed to predict the future conditions should be determined, and concrete
samples should be stored for future analyses.
73
8 Future Research
With regards to the results presented in this doctoral thesis, the following are suggested as
future research issues.
Further research is needed in order to increase the accuracy of the RH measurements in
non-isothermal conditions. Without accurate measurements, it is difficult to develop
and verify accurate moisture transport models as well as to describe the actual
conditions in a structure. The set-up developed in this work failed to reach the same
level of accuracy in the non-isothermal conditions as in the isothermal conditions.
A model was suggested in this study to describe the conditions within different reactor
containment, and how the conditions vary with time. The model was however not
sufficient in order to describe all the conditions relevant for any type of nuclear reactor
containment. The model was developed only to describe a quasi-uniform moisture
transport model and was not applicable for the entirely non-isothermal conditions, such
as those observed in the containment wall at a Nordic PWR. A non-isothermal moisture
transport model should be designed to describe the moisture transport processes within
a nuclear reactor containment. The model should include properties such as the
moisture fixation hysteresis as well as the moisture and temperature dependency of the
material.
The obtained results from this thesis gives great potential for further evaluation and
research of the effects from the moisture conditions within different concrete structures
located in the containment. Multiple material parameters and conditions are moisture
dependent, such as creep and shrinkage, gas tightness and radiation shielding
properties. The same compiles for several degrading mechanisms such as corrosion and
carbonation. Further research is needed within these fields in order to increase the
awareness of the conditions of the reactor containments.
Further work is needed in order to compare the obtained results of the moisture
contribution from the concrete structures. The actual impact of the concrete drying
within the containment has not yet been quantified.
Follow-up in situ measurements within 5-10 years is further suggested in order to
validate the accuracy of the model and simulations of future predictions presented in
this thesis.

74
75
Reference
1. J. Picaut, et al., Nuclear containments, in fib State-of-art report. 2001, International Federation for Structural Concrete (fib): Lausanne, Switzerland.
2. C.P. Thorne, Concrete properties relevant to rector shield behaviour. Journal of the American concrete institute, 1961. 32(11): p. 1491-1508.
3. L. Barcelo, M. Moranville, and B. Clavaud, Autogenous shrinkage of concrete: a balance between autogenous swelling and self-desiccation. Cement and Concrete Research, 2005. 35(1): p. 177-183.
4. P. Fredlund and L.-O. Nilsson, Gas penetration in concrete reactor containments - Measurements and Modelling (In Swedish), in Elforsk rapport 09:101. 2009, Lund University, Division of Building Materials: Lund, Sweden.
5. H.K. Hilsdorf, A method to estimate the water content of concrete shields. Nuclear Engineering and Design, 1967. 6(3): p. 251-263.
6. M. Åhs, Redistribution of moisture and ions in cement based materials, Doctoral Thesis. 2011. Lund University, Lund, Sweden
7. L.-O. Nilsson, Hygroscopic moisture in concrete - drying, measurements & related material properties, Doctoral Thesis. 1980. Lund University, Lund, Sweden
8. H.-W. Song, et al., Creep prediction of concrete for reactor containment structures. Nuclear Engineering and Design, 2002. 217(3): p. 225-236.
9. Z. Grasley, D. Lange, and M. D'Ambrosia, Internal relative humidity and drying stress gradients in concrete. Materials and Structures, 2006. 39(9): p. 901-909.
10. Z. Grasley and D. Lange, Thermal dilation and internal relative humidity of hardened cement paste. Materials and Structures, 2007. 40(3): p. 311-317.
11. Z.P. Bažant, Delayed thermal dilatations of cement paste and concrete due to mass transport. Nuclear Engineering and Design, 1970. 14(2): p. 308-318.
12. Z. Hora and B. Patzák, Analysis of long-term behaviour of nuclear reactor containment. Nuclear Engineering and Design, 2007. 237(3): p. 253-259.
13. H. Kagimoto and M. Kawamura, Measurements of strain and humidity within massive concrete cylinders related to the formation of ASR surface cracks. Cement and Concrete Research, 2011. 41(8): p. 808-816.
14. G. Fagerlund, Critical degree of saturation at freezing of porous and brittle materials, Doctoral Thesis. 1972. Lund University, Lund, Sweden
76
15. K. Fridh, Internal frost damage in concrete- Experimental studies of destruction mechanisms, Doctoral Thesis. 2005. Lund University, Lund, Sweden
16. D.-W. Ryu, J.-W. Ko, and T. Noguchi, Effects of simulated environmental conditions on the internal relative humidity and relative moisture content distribution of exposed concrete. Cement and Concrete Composites, 2011. 33(1): p. 142-153.
17. C. Andrade, J. Sarrıa, and C. Alonso, Relative humidity in the interior of concrete exposed to natural and artificial weathering. Cement and Concrete Research, 1999. 29(8): p. 1249-1259.
18. L.-O. Nilsson, Drying of reactor containment walls of concrete during past and future decades, in SMiRT 19. 2007, International association of structural mechanics in reactor technology: Toronto.
19. A. Courtois, et al., Water Content Monitoring for Nuclear Concrete Buildings: Needs, Feedback and Perspectives. Poromechanics, 2013. V: p. 1654-1663.
20. P. Johansson and L.-O. Nilsson, Climatic conditions at the surfaces of concrete containments - examples for two BWR and PWR reactors, in SMiRT 19. 2007: Toronto.
21. L.-O. Nilsson and P. Johansson, Changes in reactor containments - The drying and climatic conditions in the concrete walls (In Swedish), in Elforsk rapport 09:100. 2009, Lund University, Division of Building Materials: Lund, Sweden.
22. M. Åhs, et al., A model to predict moisture conditions in concrete reactor containments, in Fontevraud 8, Contribution of materials investigations and operating experience to LWRs' safety, performance and reliability. 2014: Avignon.
23. IAEA, Assessment and management of ageing of major nuclear power plant components important to safety: Concrete containment building, in IAEA-TECDOC Series. 1998, IAEA: Vienna, Austria.
24. IAEA, Defence in depth in nuclear safety: INSAG-10 in INSAG series. 1996, IAEA: Vienna, Austria.
25. IAEA, Design of reactor containment systems for nuclear power plants, in Safety standards series. 2004, IAEA: Vienna, Austria.
26. I. Akkurt, et al., Gamma-ray shielding properties of concrete including barite at different energies. Progress in Nuclear Energy, 2010. 52: p. 620-623.
27. S. Alhajali, et al., Estimation of the activation of local reactor shielding concretes. Progress in Nuclear Energy, 2009. 51(2): p. 374-377.
28. L. Chang-Min, L. Yoon Hee, and L. Kun Jai, Cracking effect on gamma-ray shielding performance in concrete structure. Progress in Nuclear Energy, 2007. 49: p. 303-312.
29. M.H. Kharita, M. AlNassar, and S. Yousef, The effect of the initial water to cement ratio on shielding properties of ordinary concrete. Progress in Nuclear Energy, 2010. 52(5): p. 491-493.
77
30. M.H. Kharita, et al., Development of special radiation shielding concretes using natural local materials and evaluation of their shielding characteristics. Progress in Nuclear Energy, 2008. 50(1): p. 33-36.
31. M.H. Kharita, S. Yousef, and M. AlNassar, Review on the addition of boron compounds to radiation shielding concrete. Progress in Nuclear Energy, 2011. 53(2): p. 207-211.
32. T. Korkut, et al., A new radiation shielding material: Amethyst ore. Annals of Nuclear Energy, 2011. 38(1): p. 56-59.
33. F. Vodák, et al., Effect of gamma irradiation on properties of hardened cement paste. Materials and Structures/Materiaux et Constructions, 2011. 44(1): p. 101-107.
34. IAEA, Operating experience with nuclear power stations in member states in 2011. 2012, IAEA: Vienna, Austria.
35. T. Roth, J. Silfwerbrand, and H. Sundqvist, Concrete reactor containments at Swedish Nuclear Power Plants (In Swedish). 2002, KTH Royal Institute of Technology: Stockholm, Sweden.
36. ACI, Code Requirements for Nuclear Safety Related Concrete Structures, in (ACI 349-01). 2001, American Concrete Institute.
37. ACI-ASME, Code for Concrete Reactor Vessels and Containments, in ACI 359-01. 2001, American Society of Mechanical Engineers. p. 437-457.
38. L.-O. Nilsson and P. Johansson, The moisture conditions of nuclear reactor concrete containment walls – an example for a BWR reactor. J. Phys. IV France, 2006. 136: p. 141-150.
39. L.-O. Nilsson. Moisture transport under temperature gradient - Some old and new studies. in Understanding the fundamental properties of concrete. Celebrating Prof. Erik J. Sellevold on his 75th birthday. 2013. Trondheim.
40. E. Drouet, S. Poyet, and J.-M. Torrenti, Temperature influence on water transport in hardened cement pastes. Cement and Concrete Research, 2015. 76: p. 37-50.
41. S. Whitaker, Simultaneous Heat, Mass, and Momentum Transfer in Porous Media: A Theory of Drying. 1977, Elsevier. p. 119-203.
42. M. Jensen, B. Johannesson, and M. Geiker, A Numerical Comparison of Ionic Multi-Species Diffusion with and without Sorption Hysteresis for Cement-Based Materials. Transport in Porous Media, 2015. 107(1): p. 27-47.
43. J.R. Philip and D.A. De Vries, Moisture movement in porous materials under temperature gradients. American Geophysical Union, 1957. 38(2): p. 222-232.
44. A.V. Luikov, Heat and Mass Transfer in Capillary-Porous Bodies, in Advances in Heat Transfer, F.I. Thomas and P.H. James, Editors. 1964, Elsevier. p. 123-184.
45. H.P. Lien and F.H. Wittmann, Mass transfer in inhomogeneous porous media under thermal gradients. Nuclear Engineering and Design, 1998. 179(2): p. 179-189.
78
46. H. Garbalińska, S.J. Kowalski, and M. Staszak, Moisture Transfer Between Unsaturated Cement Mortar and Ambient Air. Transport in Porous Media, 2010. 85(1): p. 79-96.
47. D.A. De Vries, The theory of heat and moisture transfer in porous media revisited. International Journal of Heat and Mass Transfer, 1987. 30(7): p. 1343-1350.
48. M. Janz, Moisture transport and fixation in porous materials at high moisture levels, Doctoral Thesis. 2000. Lund University, Lund, Sweden
49. J. Claesson, A few remarks on moisture flow potentials, in TVBH-7163. 1993, Lund University, Division of Building Physics: Lund, Sweden.
50. Z. Bažant and L. Najjar, Nonlinear water diffusion in nonsaturated concrete. Materials and Structures, 1972. 5(1): p. 3-20.
51. Z.P. Bažant, Thermodynamic theory of concrete deformation at variable temperature and humidity. 1969, University of California: Berkeley.
52. G. Hedenblad, Moisture permeability of mature concrete, cement mortar and cement paste, Doctoral Thesis. 1993. Lund University, Lund, Sweden
53. M. Saeidpour and L. Wadsö, Moisture diffusion coefficients of mortars in absorption and desorption. Cement and Concrete Research, 2016. 83: p. 179-187.
54. L. Greenspan, Humidity Fixed Points of Binary Saturated Aqueous Solutions. Journal of Research of the National Bureau of Standards. Section A: Physics and Chemistry 1977. 81A (1 ): p. 89-96.
55. M. Hjorslev Hansen, Estimation of transfer coefficients in models for coupled heat and moisture transfer in porous media, Doctoral Thesis. 1993. Technical University of Denmark, Lyngby
56. A. Anderberg and L. Wadsö, Method for simultaneous determination of sorption isotherms and diffusivity of cement-based materials. Cement and Concrete Research, 2008. 38(1): p. 89-94.
57. J.P. Ollivier, J.C. Maso, and B. Bourdette, Interfacial transition zone in concrete. Advanced Cement Based Materials, 1995. 2(1): p. 30-38.
58. T.C. Powers and T.L. Brownyard, Studies of the physical properties of hardened portland cement paste. Part 9. General summary of findings on the properties of hardened portland cement paste. Journal of the American concrete institute, 1947. 18(8): p. 971-992.
59. T. Hansen, Physical structure of hardened cement paste. A classical approach. Materials and Structures, 1986. 19(6): p. 423-436.
60. H.F.W. Taylor, Cement chemistry. 2nd edition ed. 1997, London: Thomas Telford Publishing.
61. J.I. Bhatty and K.J. Reid, Use of thermal analysis in the hydration studies of a type 1 portland cement produced from mineral tailings. Thermochimica Acta, 1985. 91(C): p. 95-105.
62. H.G. Midgley, The determination of calcium hydroxide in set Portland cements. Cement and Concrete Research, 1979. 9(1): p. 77-82.
63. H.S. Wong and N.R. Buenfeld, Determining the water-cement ratio, cement content, water content and degree of hydration of hardened cement paste: Method development and validation on paste samples. Cement and Concrete Research, 2009. 39(10): p. 957-965.

79
64. B. El-Jazairi and J.M. Illston, A simultaneous semi-isothermal method of thermogravimetry and derivative thermogravimetry, and its application to cement pastes. Cement and Concrete Research, 1977. 7(3): p. 247-257.
65. I. Pane and W. Hansen, Investigation of blended cement hydration by isothermal calorimetry and thermal analysis. Cement and Concrete Research, 2005. 35(6): p. 1155-1164.
66. L. Alarcon-Ruiz, et al., The use of thermal analysis in assessing the effect of temperature on a cement paste. Cement and Concrete Research, 2005. 35(3): p. 609-613.
67. B.A. Schrefler, et al., Thermo-hydro-mechanical modelling of high performance concrete at high temperatures. Engineering Computations (Swansea, Wales), 2002. 19(7-8): p. 787-819.

80
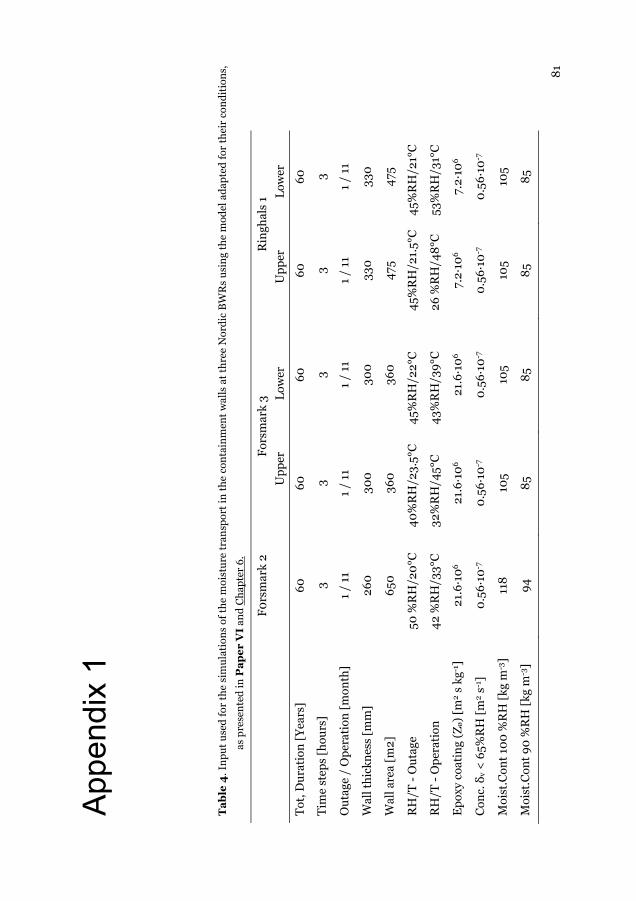
81
App
endi
x 1
Ta
ble
4. I
np
ut
use
d f
or t
he
sim
ula
tion
s of
th
e m
oist
ure
tra
nsp
ort
in t
he
con
tain
men
t w
alls
at
thre
e N
ord
ic B
WR
s u
sin
g th
e m
odel
ad
apte
d f
or t
hei
r co
nd
itio
ns,
as p
rese
nte
d in
Pa
pe
r V
I an
d C
hap
ter
6.
F
0rs
mar
k 2
For
smar
k 3
Up
per
Low
er
Rin
ghal
s 1
Up
per
Low
er
Tot
, Du
rati
on [
Yea
rs]
60
60
60
60
60
Tim
e st
eps
[hou
rs]
3 3
3 3
3
Ou
tage
/ O
per
atio
n [
mon
th]
1 /
11
1 /
11
1 /
11
1 /
11
1 /
11
Wal
l th
ickn
ess
[mm
] 26
0
300
30
0
330
33
0
Wal
l are
a [m
2]
650
36
0
360
47
5 47
5
RH
/T -
Ou
tage
50
%R
H/2
0°C
40
%R
H/2
3.5°
C
45%
RH
/22°
C
45%
RH
/21.
5°C
45
%R
H/2
1°C
RH
/T -
Op
erat
ion
42
%R
H/3
3°C
32
%R
H/4
5°C
43
%R
H/3
9°C
26
%R
H/4
8°C
53
%R
H/3
1°C
Ep
oxy
coat
ing
(Zø)
[m
2 s
kg-1
] 21
.6·1
06
21.6
·10
6
21.6
·10
6
7.2·
106
7.2·
106
Con
c. δ
v <
65%
RH
[m
2 s-1
] 0
.56·
10-7
0
.56·
10-7
0
.56·
10-7
0
.56·
10-7
0
.56·
10-7
Moi
st.C
ont
100
%R
H [
kg m
-3]
118
10
5 10
5 10
5 10
5
Moi
st.C
ont
90 %
RH
[kg
m-3
] 94
8
5 8
5 8
5 8
5

CLIMATIC CONDITIONS INSIDE NUCLEAR REACTOR CONTAINMENTS Här presenteras avhandlingen från ett doktorandprojekt som handlar om fukt-förhållanden i reaktorinneslutningars väggar. Avhandlingen beskriver tidigare, pågående och framtida omfördelning av fukt i betongkonstruktionerna, men också bidraget av fukt från betongen. Det är första gången som en systematisk genomgång av fuktinnehåll i kärnkraftens betongkonstruktioner har gjorts.
Resultaten visar att det fortfarande efter 30 år pågår uttorkning av reaktorinne-slutningarnas betong. Det betyder att betongen också i fortsättningen kommer att bidra med fukt till inneslutningens utrymmen ända fram tills verket tas ur drift. Det här har stor betydelse för kärnkraftindustrin som nu bättre kommer att kunna utvärdera effekten av olika fuktberoende processer i reaktorinneslut-ningarna, exempelvis krympning, korrosion av metaller och betongens strål-skyddsegenskaper. Det kommer också att bli lättare att bedöma risken för att olika nedbrytningsprocesser sätts igång.
Another step forward in Swedish energy researchEnergiforsk – Swedish Energy Research Centre – an industrially owned body dedicated to me-eting the common energy challenges faced by industries, authorities and society. Our vision is to be hub of Swedish energy research and our mission is to make the world of energy smarter! We are actively meeting current energy challenges by developing new ways to store energy, helping to create a fossil free transportation system, establishing new market models for the heat and power sector, developing new materials and regulating the grid. www.energiforsk.se
Related Documents