Climate, Water, and Health Hatim Sharif University of Texas at San Antonio

Welcome message from author
This document is posted to help you gain knowledge. Please leave a comment to let me know what you think about it! Share it to your friends and learn new things together.
Transcript

Climate, Water, and Health
Hatim Sharif
University of Texas
at San Antonio


Corvalan et al., 2003
Pathways from Driving Forces
to Potential Health Impacts

Potential Health Impacts of Climate Variability and Change (Haines and Patz, J Amer Med Assoc, 2004)
Health Impacts of Heat and Humidity
Death
Heatstroke
Heat exhaustion
Smog
Increased vector and pathogen populations
Mold
Algae blooms

Distribution of Heat-Related Excess Mortality in France, August 1 – 15, 2003 (>
14,800 deaths)
Daily Mortality in Paris

Temperature-Mortality Relative Risk Functions for 11 US Cities (1973 – 1994) (Curreiro, et al., Am J Epidemiol, 2003)

0.00
0.05
0.10
0.15
0.20
0.25
0.30
40 60 80 100 120
Mean Maximum Temperature (oF)
Da
ily
Ma
xim
um
Ozo
ne
(p
pm
)
South Coast Air Basin
Ozone Levels
(1996-1999)
Our Changing Climate: Assessing the Risks to California (2006),
www.climatechange.ca.gov. Source: Air Resources Board, 2000
Hotter Days Lead to More Smog

Floods
Flooding can be cause by
Excessive rainfall
and/or rapid
snowmelt
Land use changes that
reduce infiltration,
surface roughness,
and retention
Failure of stormwater
system

Health Impacts of Floods
Immediate deaths and injuries
Nonspecific increases in mortality
Infectious diseases – leptospirosis, hepatitis, diarrheal, respiratory, and vector-borne diseases
Allergies (mold)
Displacement
Mental health effects
Increased demands on health systems

Health Impacts of Droughts
Wildfires (e.g Bastrop fire, most destructive in Texas history Sept 4/Oct 29, 2011): death, injury, property loss, mental health
Concentration of pollutants
Wind blown dust: respiratory illness, meningitis, evidence that mortality is increased in the days after a dust storm
Decreased water supply for municipal, industrial, and agricultural use

Flood Mortality
About 12% of US flood fatalities occurred here

•Second most fatal weather-related
disaster
•Second most costly weather-
related disaster
•Flash floods are most dangerous
Floods in the US

•Texas leads the nation in flood
fatalities
•Number of fatalities >3 times the
second state
•Fatalities every single year since start
of record
•Problem is persisting
Flood Fatalities in Texas

•National Climatic Data Center (NCDC)
Storm Data
•Spatial Hazard Event and Loss
Database (SHELDUS)
•Texas Department of State Health
Services (DSHS)
Sources of Data

Why Three Data Sources?
• NCDC: Most comprehensive, focused on
storms, misses some details
• SHELDUS similar to NCDC, more organized,
focused on floods, not as comprehensive as
NCDC
• DSHS very accurate in terms of person-time-
place, not very specific in terms of cause of
death (changes in ICD codes)

Relevant ICD codes
Period ICD Code Definition of cause of death
1999-2006 ICD-10 X38 Victim of Flood, include flood: arising from remote storm,
of cataclysmic nature arising from melting snow, resulting
directly from storm
1979-1998 ICD-9 E908.2 Torrential rainfall and flash flood
1968-1978 ICD-8 E908 Cataclysm, includes: cloudburst, cyclone, earthquake,
flood, hurricane, tidal wave, tornado, torrential rain,
volcanic eruption
1964-1967 ICD-7 E934.0-9 Cataclysm, includes: cloudburst, cyclone, earthquake,
flood, hurricane, tidal wave, tornado, torrential rain,
volcanic eruption

How does Texas compare to
other states? Rank State Fatalities Rank State Fatalities
1 Texas 840 26 Illinois 56
2 Louisiana 621 27 Kansas 55
3 Pennsylvania 265 28 Minnesota 55
4 Mississippi 252 29 New Jersey 50
5 California 246 30 Iowa 47
6 South Dakota 244 31 Montana 45
7 Virginia 237 32 Oregon 45
8 Colorado 185 33 Washington 39
9 Missouri 174 34 Michigan 31
10 North Carolina 155 35 Nevada 29
11 Wisconsin 149 36 Utah 26
12 Ohio 147 37 North Dakota 15
13 Kentucky 144 38 West Virginia 15
14 New York 134 39 Connecticut 14
15 Tennessee 131 40 Delaware 14
16 Arkansas 129 41 Nebraska 14
17 Georgia 120 42 Wyoming 14
18 Oklahoma 110 43 Maine 13
19 Maryland 101 44 New Hampshire 13
20 Arizona 86 45 Vermont 11
21 Indiana 79 46 Massachusetts 7
22 Florida 75 47 District of Columbia 4
23 Alabama 68 48 Idaho 4
24 New Mexico 68 49 Rhode Island 0
25 South Carolina 64
Flood fatalities for the 48 conterminous states and District Columbia
for the 1959-2008 period.
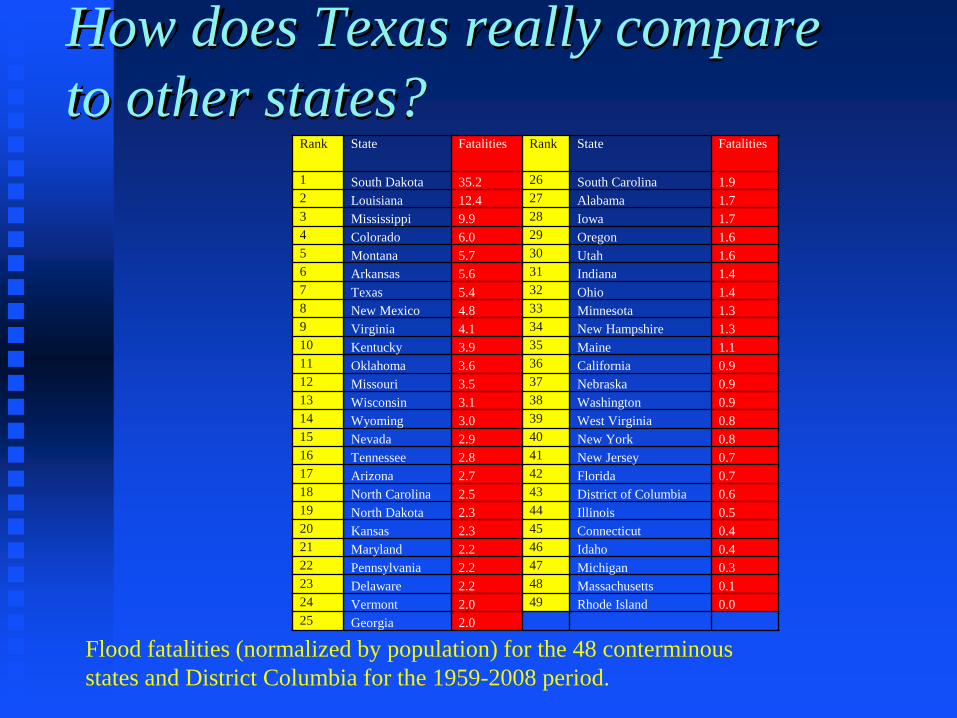
How does Texas really compare
to other states? Rank State Fatalities Rank State Fatalities
1 South Dakota 35.2 26 South Carolina 1.9
2 Louisiana 12.4 27 Alabama 1.7
3 Mississippi 9.9 28 Iowa 1.7
4 Colorado 6.0 29 Oregon 1.6
5 Montana 5.7 30 Utah 1.6
6 Arkansas 5.6 31 Indiana 1.4
7 Texas 5.4 32 Ohio 1.4
8 New Mexico 4.8 33 Minnesota 1.3
9 Virginia 4.1 34 New Hampshire 1.3
10 Kentucky 3.9 35 Maine 1.1
11 Oklahoma 3.6 36 California 0.9
12 Missouri 3.5 37 Nebraska 0.9
13 Wisconsin 3.1 38 Washington 0.9
14 Wyoming 3.0 39 West Virginia 0.8
15 Nevada 2.9 40 New York 0.8
16 Tennessee 2.8 41 New Jersey 0.7
17 Arizona 2.7 42 Florida 0.7
18 North Carolina 2.5 43 District of Columbia 0.6
19 North Dakota 2.3 44 Illinois 0.5
20 Kansas 2.3 45 Connecticut 0.4
21 Maryland 2.2 46 Idaho 0.4
22 Pennsylvania 2.2 47 Michigan 0.3
23 Delaware 2.2 48 Massachusetts 0.1
24 Vermont 2.0 49 Rhode Island 0.0
25 Georgia 2.0
Flood fatalities (normalized by population) for the 48 conterminous
states and District Columbia for the 1959-2008 period.
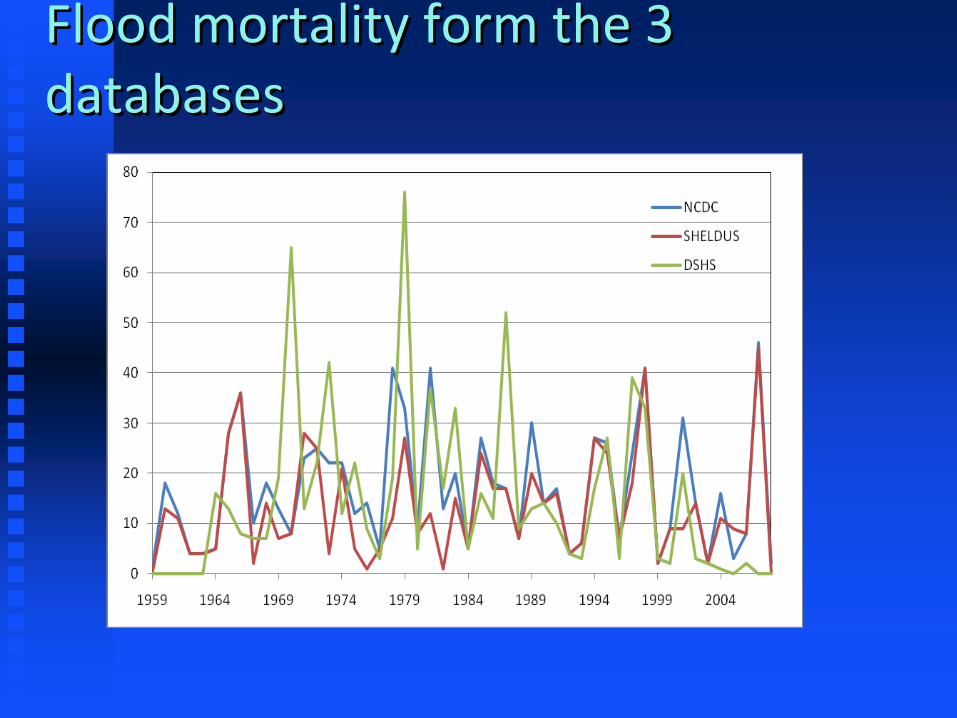
Flood mortality form the 3 databases
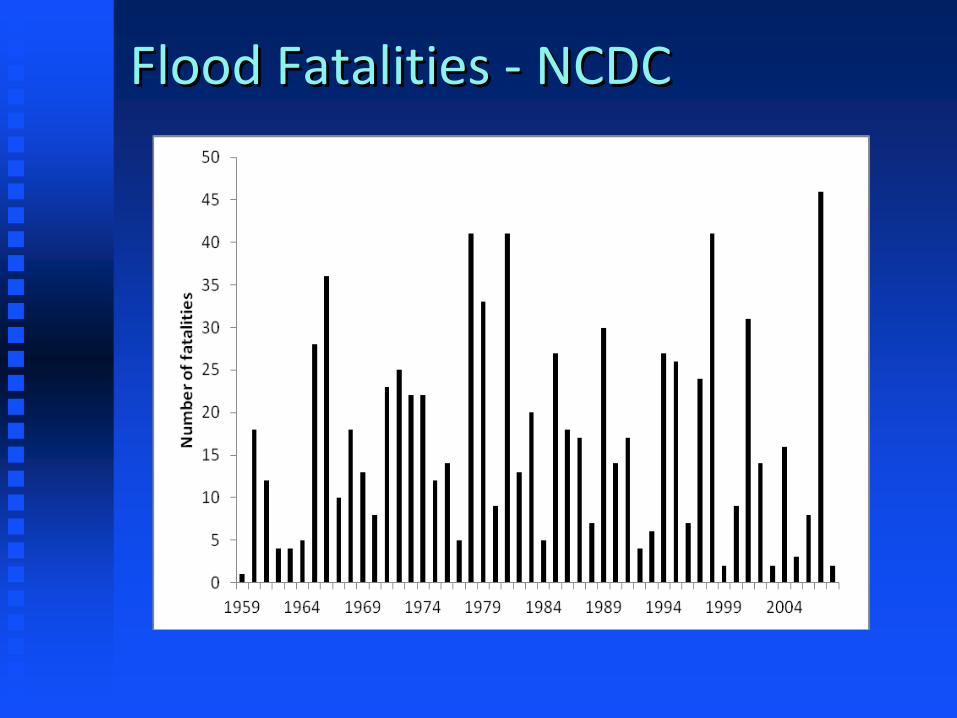
Flood Fatalities - NCDC

Normalized Flood Fatalities

Flood fatalities by flood type
Rain
15%
Flood
30%
Flash Flood
50%
Flooding
due to
Tropical
System
5%
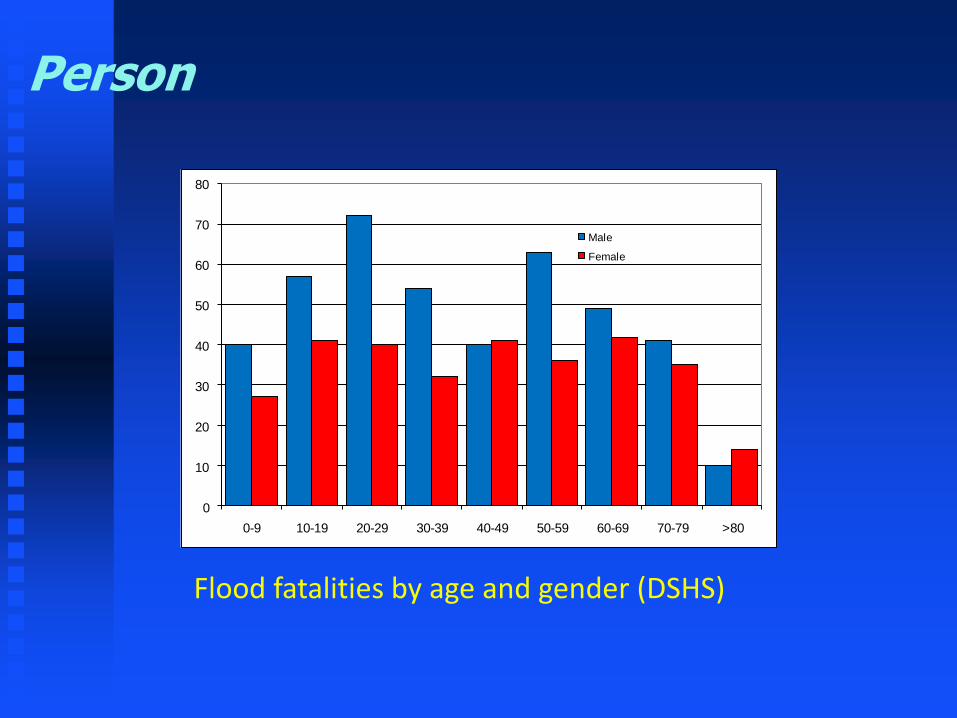
Person
0
10
20
30
40
50
60
70
80
0-9 10-19 20-29 30-39 40-49 50-59 60-69 70-79 >80
Male
Female
Flood fatalities by age and gender (DSHS)
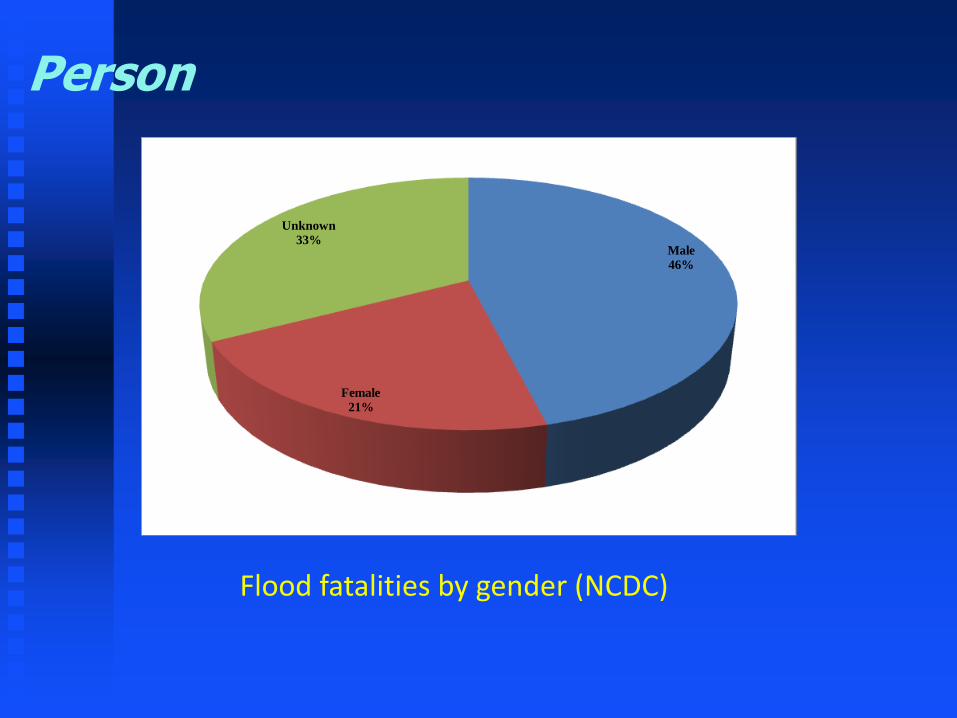
Person
Flood fatalities by gender (NCDC)
Male
46%
Female
21%
Unknown
33%

Person
Flood fatalities by age (NCDC)
0-9
11%
10--19
20%
20-29
17%30-39
9%
40-49
10%
50-59
11%
60-69
11%
70-79
7%
80-89
4%
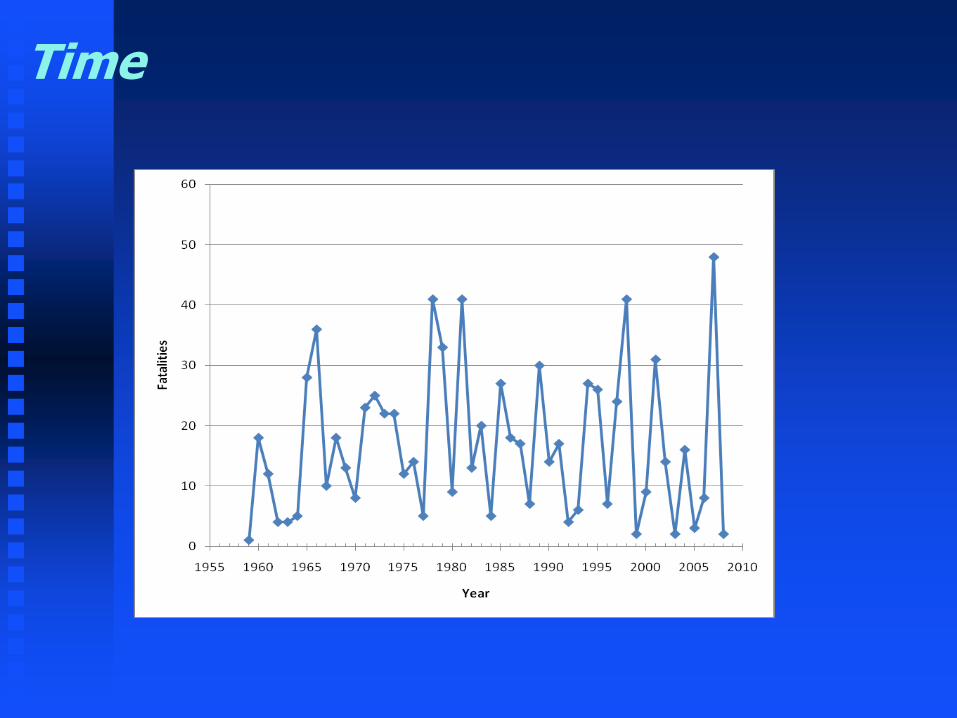
Time

Time cont’d
Flood Fatalities Average Precipitation
0
50
100
150
200
250
JAN FEB MAR APR MAY JUNE JULY AUG SEP OCT NOV DEC
NCDC
SHELDUS
DSHS

Time of the day
0
20
40
60
80
100
120
140
160
180
200
12AM-6AM 6AM-12PM 12PM-6PM 6PM-12AM
NCDC
DSHS

Place
Fatalities by county

Fatalities by county
County Number of Fatalities
Bexar 68
Dallas 63
Travis 51
Harris 45
Tarrant 43
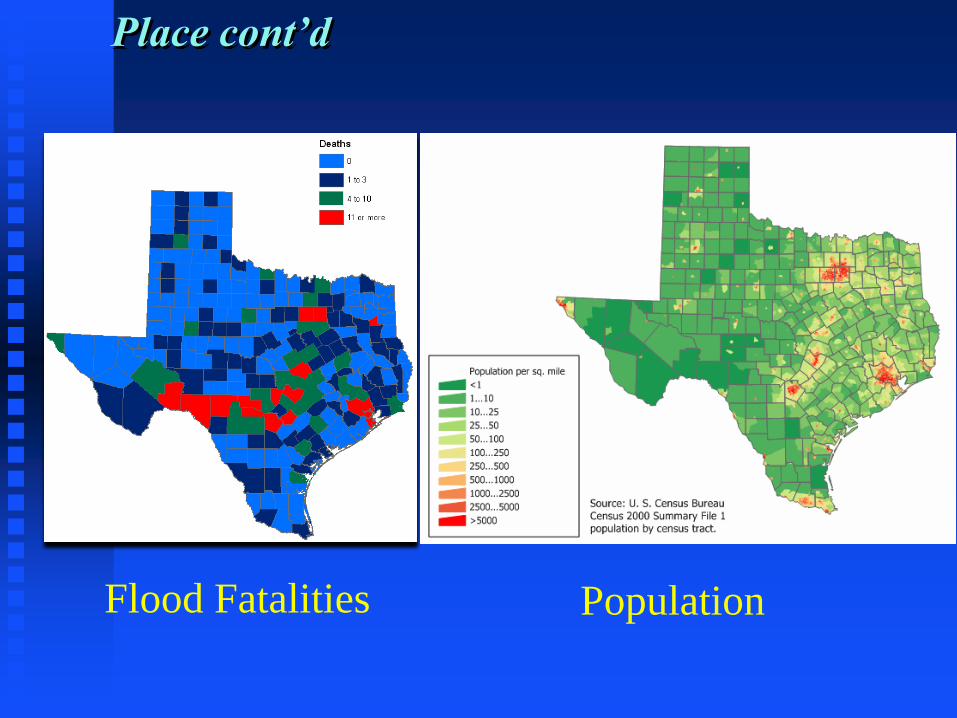
Place cont’d
Flood Fatalities Population

Place cont’d
Flood Fatalities Physiography

Place cont’d
Flood Fatalities Rainfall
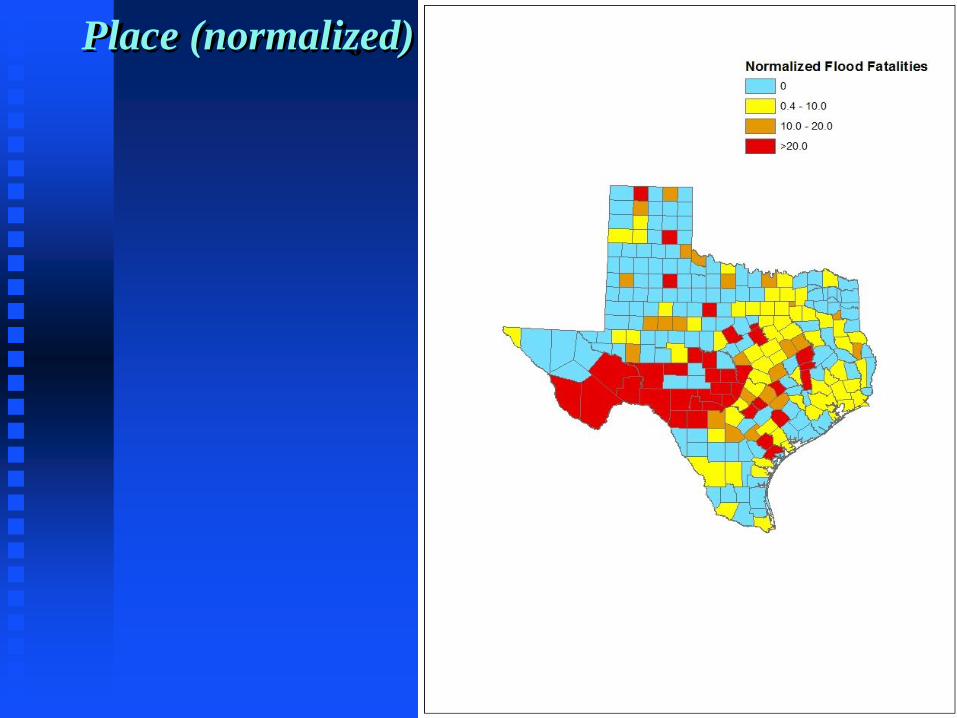
Place (normalized)
Place cont’d
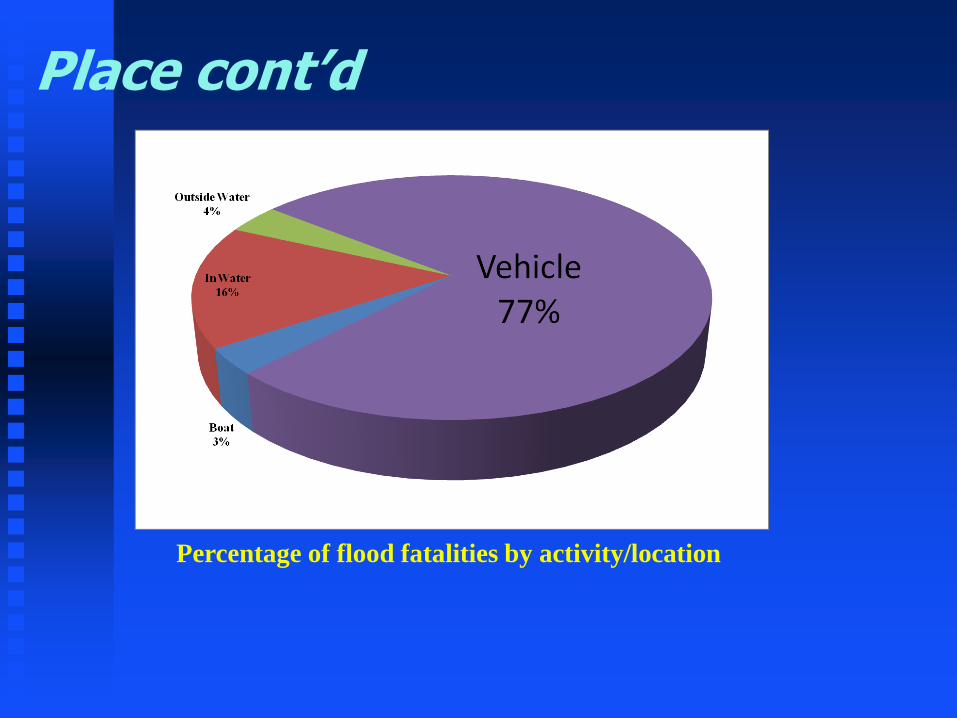
Percentage of flood fatalities by activity/location

Driving under the influence of water
• Most fatalities happen in urban areas and rural
areas surrounding urban centers
• Visibility can be a factor
• Mostly at low-water crossings

Motor vehicle-related flood fatalities by flood type
Rain
11%
Flood
25%
Flash
Flood
61%
Flooding due to
Tropical System
3%

Person
Motor vehicle-related flood fatalities by gender
Male
52%
Female
29%
Unknown
19%

Time
0
5
10
15
20
25
30
35
1955 1960 1965 1970 1975 1980 1985 1990 1995 2000 2005 2010
Fatalities
Year

Place
Fatalities by county
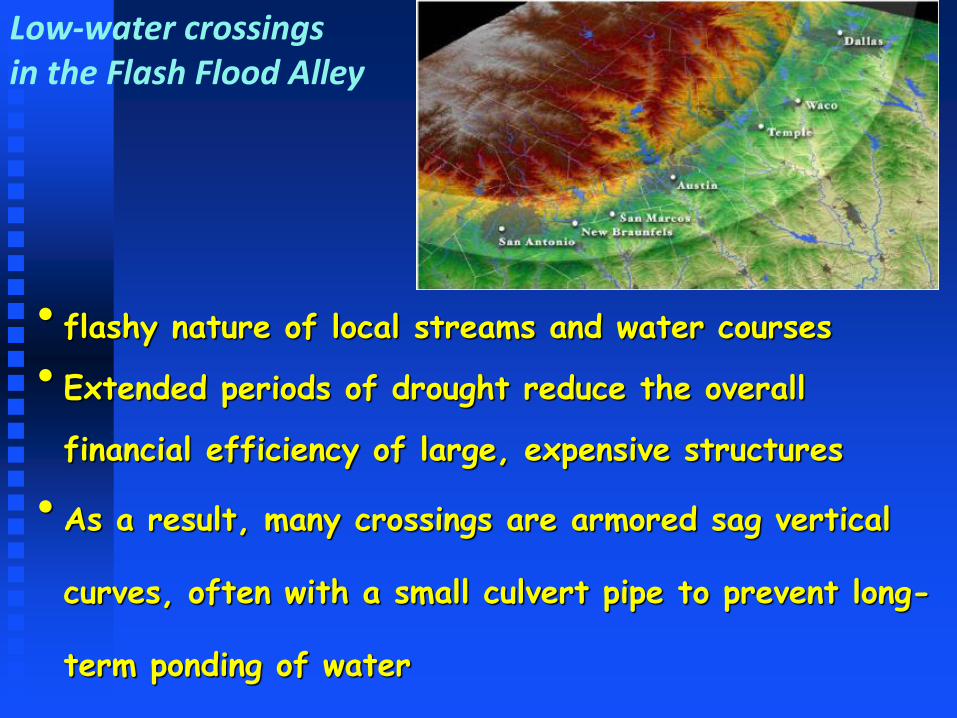
• flashy nature of local streams and water courses
•Extended periods of drought reduce the overall
financial efficiency of large, expensive structures
•As a result, many crossings are armored sag vertical
curves, often with a small culvert pipe to prevent long-
term ponding of water
Low-water crossings in the Flash Flood Alley

U.S. Example

Houston 2001

San Antonio 2007

Take home message
• “In-place shelter” a good option
• Education is helping
• Forecasting can be improved
• Structural solutions are difficult

Outputs: Fort Collins Flood , 28 July 1997
Radar Precipitation Runoff Depth

Hurricanes 2005

Hurricane Katrina – calm eye is 1
August 28th 2005
New Orleans 2 on the Gulf of Mexico coast, USA
2
1
Katrina

It was the sixth-strongest Atlantic hurricane ever recorded and the third-strongest landfalling U.S. hurricane on record.
The track of the hurricane 23rd to 29th August 2005.

Storm Surge
The intense LOW PRESSURE and strong winds
… allows sea level to rise
… Flooding coastal areas -several kilometres inland in some places
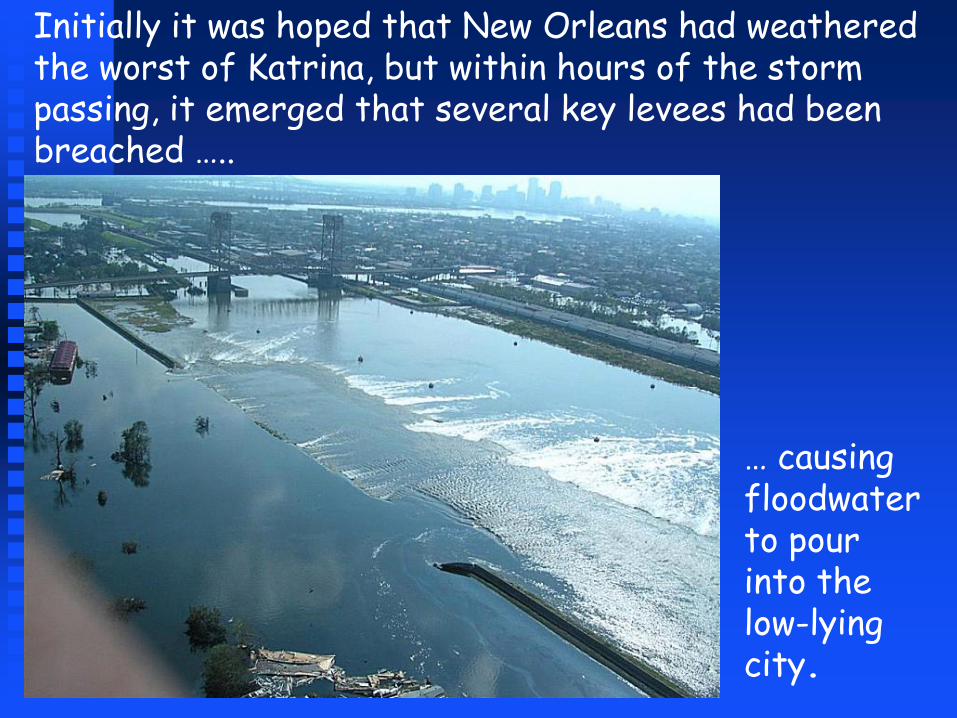
Initially it was hoped that New Orleans had weathered the worst of Katrina, but within hours of the storm passing, it emerged that several key levees had been breached …..
… causing floodwater to pour into the low-lying city.

Much of New Orleans lies below sea level. The city has a system of canals and levees topped with concrete floodwalls to keep water out. These are designed to withstand a category three hurricane, but when Katrina hit, they were quickly overwhelmed. Within 24 hours, 80% of the city was flooded.

Mississippi Delta
Levees broken and land flooded
Especially around New Orleans city.
By August 31, 2005, 80% of the city was flooded, with some parts under 6.1 meters of water.
Four of the city's protective levees were breached, including the 17th Street Canal levee, the Industrial Canal levee, and the London Avenue Canal floodwall.

Katrina

Hurricane Katrina
Aftermath
An interdisciplinary, critical inquiry.
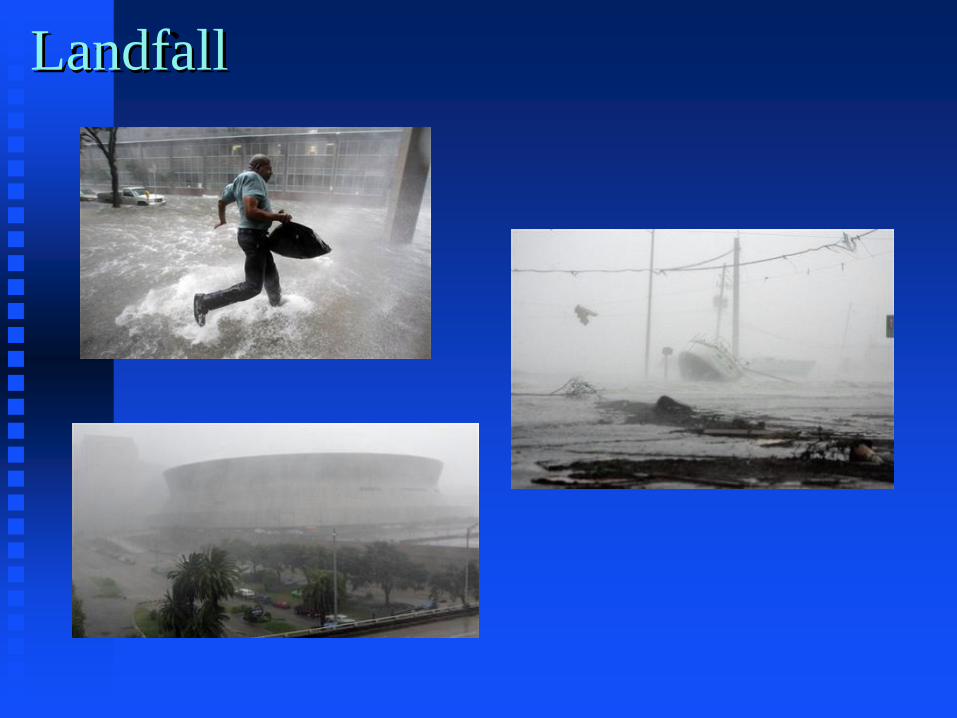
Landfall
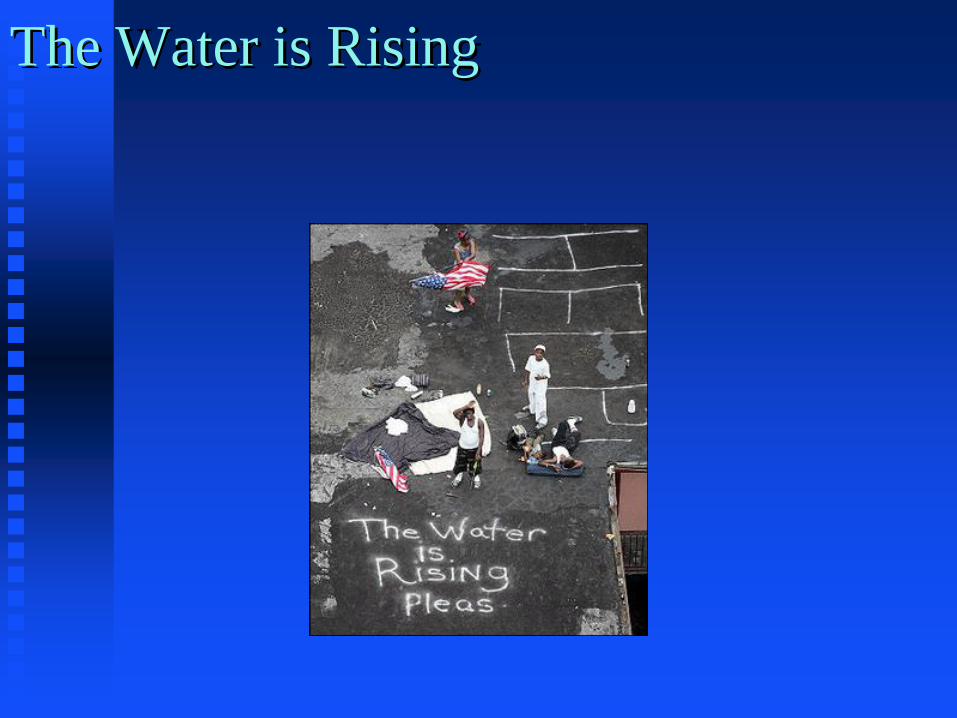
The Water is Rising
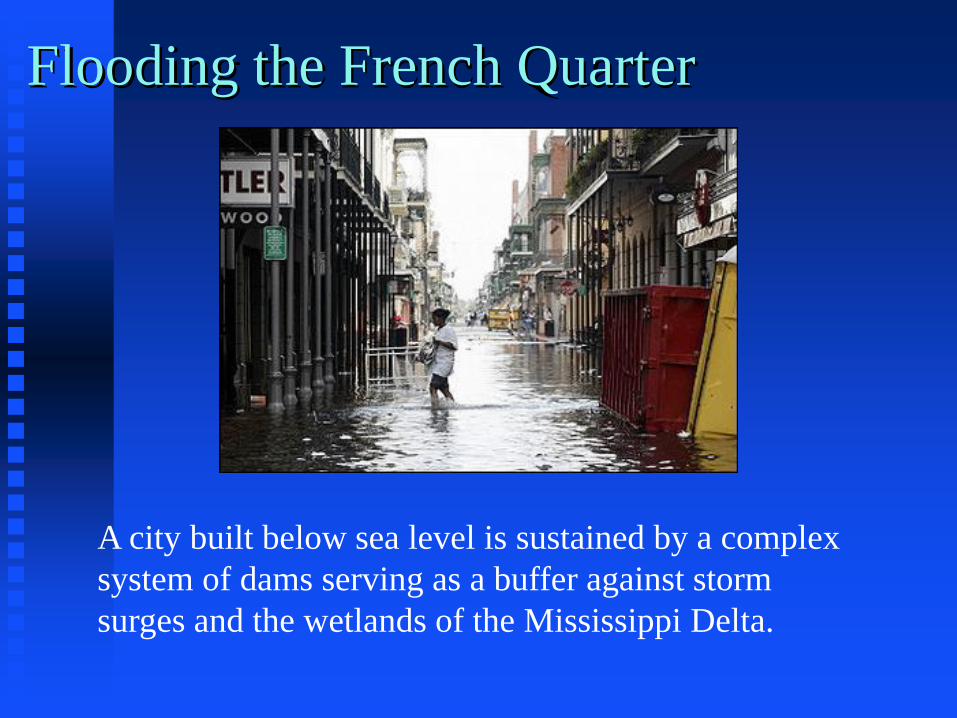
Flooding the French Quarter
A city built below sea level is sustained by a complex
system of dams serving as a buffer against storm
surges and the wetlands of the Mississippi Delta.

Boats travel flooded streets

New Orleans Superdome

Leaving the Superdome
Walking out on I-10

Is this the USA?
Thousands of residents from
New Orleans gather at an
evacuation staging area along
Interstate-10 in Metarie, La.,
on Thursday, Sept. 1, 2005.
AP Photo/Dave Martin
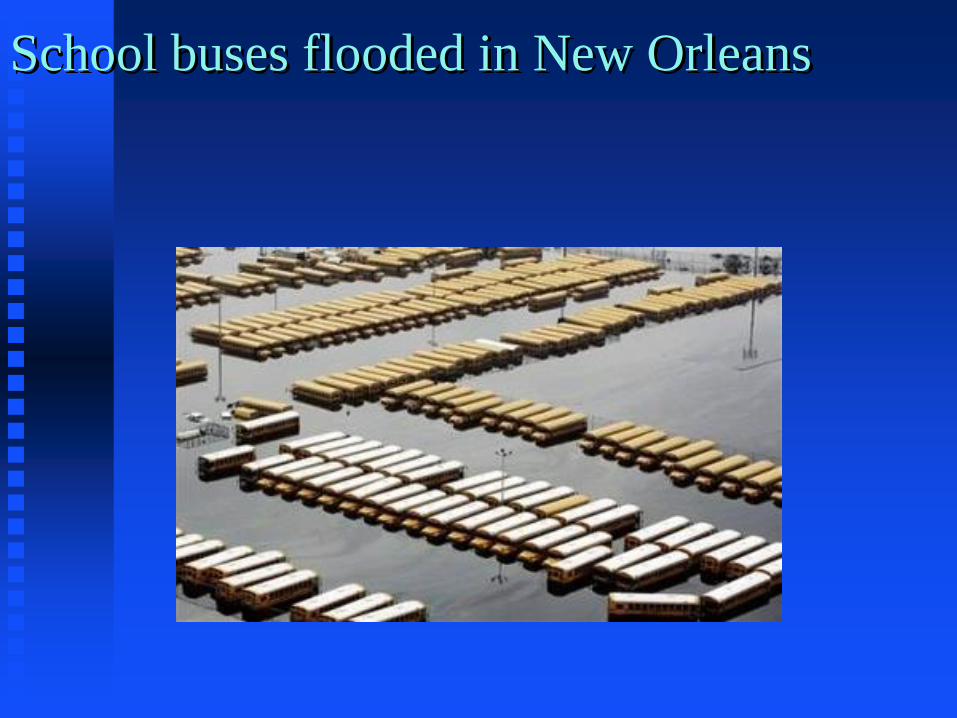
School buses flooded in New Orleans

Boat Jam on the road

Stranded on Rooftops

Louisiana State Troops

Rooftop Rescues Continue

Searching for survivors
Conclusion
• Storm forecasting is improving
• People not aware of storm surge models and
maps
• Need for improving storm surge products and
graphics
Related Documents


