www.orebro.se Climate Strategy for the Municipality of Örebro Per Elvingson [email protected] Climate Office, Municipality of Örebro, Sweden CATCH Climate Change & Travel Behaviour, Brussels 17 February 2010

Welcome message from author
This document is posted to help you gain knowledge. Please leave a comment to let me know what you think about it! Share it to your friends and learn new things together.
Transcript

www.orebro.se
Climate Strategy for
the Municipality of Örebro
Per Elvingson [email protected]
Climate Office, Municipality of Örebro, Sweden
CATCH Climate Change & Travel Behaviour, Brussels 17 February 2010

www.orebro.se
Outline
1. Introduction – Örebro: Location, transport system
2. Climate strategy – the process
3. Proposed measures in the transport sector

www.orebro.se
Örebro132 000 inhabitants(+1200/yr)
200 km to Stockholm(2 hours by train)
1. Introduction - Örebro

www.orebro.se
2 km 4 km 6 km

www.orebro.se
Cars in the city centre(average No./day, thousands)
The Castle
Main square,
City hall

www.orebro.se
Travel
habits
survey
2004
PT
Cars
Cycling
Walking
5%2%7%82%Distance travelled
5%12%24%56%Number of trips
BusWalkingCyclingCars
414 cars per 1000 inhabitants. 92 percent owns a bike.

www.orebro.se
Sustainable Transport PlanAdopted in October 2008
Developed as a part of EU-funded
project ”Bustrip”.
Much more than climate change!
(focus on short car trips in the city)
Climate Strategy Public consultation period ends today!
Hopefully adopted by City Council
in June.
Transport an important part.
(more focus on longer trips...)

www.orebro.se
2. Climate strategy
- the process
Starting point: A clear political commitment.
From the City Executive Committee early in 2009:
• The target is to reduce the emissions by 40 percent
between 2000 and 2020 (and close to zero 2050)
• The strategy should be adopted in June 2010 at
latest (general elections in September 2010...)
Gabriella Blomgren
Green Party, Vice Mayor

www.orebro.se
What we have done so far
February – July 2009 Preparatory work, set up of working
groups, reference groups etc.
Background studies. Self assessment.
August – October
2009
Meeting in working and reference
groups (more than 60 persons involved).
Agreement on targets and measures.
Decision in city executive committee.
17 November 2009
– 17 February 2010
Public consultation period.
February – May 2010 Political negotiations. Finalizing the
strategy.
June 2010 Adoption in City Council.

www.orebro.se
Working groups
Project group
Political committee
Internal
reference group
External
reference group
Working group
Energy
Working group
Transport
Working group
Food consumption

www.orebro.se
Augusti September Oktober
32 33 34 35 36 37 38 39 40 41 42 43 44 45
Gemensamt möte 1:
Avstamp
Gemensamt möte 2:
Komma överens om nuläge, diskutera delmål och prioriteringav åtgärder
Gemensamt möte 3:
Presentera och diskutera förslag till delmål och prioriterade åtgärder
Arbetsgrupperna
Komplettera nulägesanalys
Ta fram bruttolista på åtgärder
Arbetsgrupperna
Ta fram förslag till delmål
inkl. uppföljning
Prioritera bland åtgärder
Arbetsgrupperna v. 42
Kompletteringar.
Feedback från politisk styrgrupp
(möte 9 oktober)
AG
An intensive autumn!
1 32
AG AG AG AG
s s
Int
4
Ext
s
IntExt
IDA
G: R
em
issm
ate
rial p
rese
nte
ras
s

www.orebro.se
Work in progress
Not the first climate target for the municipality.
But for the first time backed by a real strategy…
.. based on a solid emission inventory,
.. with an estimate of costs and effects of proposed
measures,
.. widely accepted in the own organization,
.. with commitments from different actors, and a
system for evaluation on a yearly basis.

www.orebro.se
Two different targets developed
1. The 40% target is for all activities within the borders of the
municipality.
2. A new 50% target for the own organization.
We use a per capita approach (+15 000 inhabitants by 2020).
We define how much can be done at local level and what must
be done at national and EU level.
We include not only direct emissions, but also indirect emissions
caused by activities within the municipality’s borders.*
* Electricity for example: Almost no local emissions. But we use
the factor 400 grams CO2/kWh (= estimated European average by
2020; Swedish average today is only 10-50 grams)
www.orebro.se
Emissions included
Municipality as a whole
• Energy sector
• Transport within the
municipality’s borders
Our own organization
• Energy sector
• Transport acitivities,
also outside the
municipality’s borders
• Food consumption

www.orebro.se
Emissions caused by acitivities
within municipality borders 2008
Road
vehicles
17%
Electricity
use
31%
Heating
7%
Air travel
7%
Food
consump-
tion
18%
Imported
products
(net)
20%
Total: 841 000 tons CO2
or 6.4 tons per inhabitant
All (?) emissionsOur mark off
Total: 1 500 000 tons CO2
or 11.4 tons per inhabitant
Electricity
use
56%
Road
vehicles
31%
Heating
13%
National
estimatesOwn
inventory

www.orebro.se
Why exclude
some sectors?Air travel, food
consumption, products…
Mainly two reasons:
1. We must be able to measure and follow up our
targets – for the excluded sectors we only have
national average figures for the moment.
2. We must be able to influence the development.

www.orebro.se
Emissions from transport sector calculated by
consultants, using a quite simple Excel model:
1. Number of vehicles and distance travelled
2. Energy used per vehicle category
3. Emission factor per fuel

www.orebro.se
Emission factor
per fuel (LCA)
Fuel Carbon dioxide eq.
Petrol (E5) 2.65 kg/l
Diesel oil 2.98 kg/l
Ethanol (E85) 0.66 kg/l
Biogas (methane) 0.39 kg/m3
Electricity 0.40 kg/kWh

www.orebro.se
National
roads
Secondary
roads
City
streets Sum
Light duty vehicles 82 (35%) 22 (9%) 50 (21%) 154 (66%)
Heavy duty vehicles 60 (25%) 8 (3%) 14 (6%) 82 (34%)
Sum 142 (60%) 30 (13%) 64 (27%) 236
(100%)
For comparison:
All car trips shorter than 5 km: 15 000 tons CO2
From diesel to biogas (metane) in city buses: 3 000 tons CO2
Emissions from air travel by inhabitants in Örebro, approx. 100 000 tons!
Carbon dioxide emissions from road
vehicles within Örebro Municipality 2008(thousand tons; contribution in percent within parenthesis).

www.orebro.se
Development 2000 to 2008
per capita emissions from all activities within our borders
0,0
1,0
2,0
3,0
4,0
5,0
6,0
7,0
2000 2008 2020
ton
per
invån
are
transporter
energi
Måln
ivå 2
020
Minus 7.6% per cap.
Target
2020
-40%/cap.

www.orebro.se
Emissions from our own organization
Total transport sector emissions 236 000 tons/year,
our own contribution is approx 8 percent:
Travel by car 1 500
Own transport activities 2 000
Transport activities procured 2 000
Employees commuting 5 800
Public transport 6 700
SUM ca 18 000 tons/yr
Air travel 500-1 000 tons/yr

www.orebro.se
Utsläpp per invånare med kommunal rådighet
0
100
200
300
400
500
600
700
800
900
1000
2000 2008 2020
kg
/in
v.
mat
transporter
energi
Måln
ivå 2
020
Development 2000 to 2008- per capita emissions from the own organization
Minus 11% per cap.
Target
2020
-50%/cap.
Food consumption

www.orebro.se
3. How to reach
the targets
• A reduction by 40 percent from 2000 to 2020 for the
whole municipality
• A reduction by 50 percent from 2000 to 2020 for the
own organization

www.orebro.se
Sustainable transport:
The role of the
municipality1. System design. It must be
easy and rational for everyone
to ”do the right thing”.
2. Support other (big) actors,
important first step to clean
up at your front door...
3. Influence national (and EU)
level, because we do not have
access to the full set of tools
on the local level.

www.orebro.se
5512
47
10
3734
39
-7,6%
0
100
200
300
400
500
600
700
800
900
1 000
Klim
atb
ela
stn
ing
2000
Åtg
ärd
er
2000-2
008
Klim
atb
ela
stn
ing
2008
Energ
ieffektiv
isering
Konvert
ering a
v o
lja
Åtg
ärd
er
i
fjärr
värm
esyste
met
Ny förn
ybar
energ
i
Tra
nsport
er
egen
verk
sam
het
Tra
nsport
er
lokala
åtg
ärd
er
Tra
nsport
er
natio
nella
sty
rmedel
Klim
atb
ela
stn
ing
2020
10
00
to
n k
old
ioxid
Whole municipality: -40% per cap. 2000-2020
Measures in the energy sector Measures in the
transport sector
Climate effect of the SUTP

www.orebro.se
General observations
• Easier measures, and at a lower cost, in the energy sector.
• Transport sector: Easy to caculate cost and climate effect
of some measures, such as change of vehicles and fuels.
Petrol-driven car 2.0 kg CO2/10 km
Metane-driven car 0.2 kg CO2/10 km
Reduction 90 percent
If the vehicles are very efficient and clean, travel distance is not so
important - from a climate point ov view...
• Often difficult to calculate effect of measures designed to
influence travel behaviour.
• Important not to forget positive side effects, such as
cleaner air, less noise, more attractive city...

www.orebro.se
Package: The local transport system - 12 000 tons/yr
Sub target 1: Increase the share of walking, cycling and public transport
in modal split, from 46 percent year 2000 to 50 percent 2010 and
60 percent 2020.
Climate effect: 3 800 tons/yr. Measures: Implementation of the SUTP.
Sub target 2: Share of public transport in regional communing shall
increase to 25 percent by 2015 and 40 percent by 2030 (today 18%).
Climate effect : 2 000 tons/yr. Measures: Better marketing, faster
journeys, improved connection between different transport modes.
Sub target 3: Measures implemented by large employers shall result in a
emission reduction by 6 000 tons a year in the period 2008-2020,
above the effect of better national incentives.
Climate effect : 6 000 tons/yr. Measures: Continue ongoing dialogue and
supporting activities.

www.orebro.se
Package: Measures at national level
- 55 000 tons/yrNational climate target: Domestic emissions in the non-ETS sector
shall decrease by 28 percent in the period 2008-2020.
If this target will be reached, emissions from the transport sector
in Örebro will decrease by approx 55 000 tons/year.
But decisions taken so far only results in status quo for the
transport sector by 2020!
Measures: Develop a strategy to influence decisions at national
level.

www.orebro.se
3,72,2
5,32,7
170,9
8,7
-11%
0
20
40
60
80
100
120
140
Klim
atb
ela
stn
ing
2000
Åtg
ärd
er
2000-2
008
Klim
atb
ela
stn
ing
2008
Energ
ieff
ektivis
eri
ng
Konvert
eri
ng a
v o
lja
Ny f
örn
ybar
energ
i
Tjä
nste
resor
+
arb
ets
resor
Kolle
ktivtr
afik
Tra
nsport
er
+ ö
vri
gt
Konsum
tion
livsm
edel
Klim
atb
ela
stn
ing
2020
tuse
n t
on
ko
ldio
xid
Own organization: -50% per cap. 2000-2020
Measures in the transport sectorca. 10 000 tons
Food consumption
Measures in the energy sector

www.orebro.se
Package 1: Travelling by employees
in the own organization
Emissions from work trips by car should be close to zero by 2020.
Climate effect: 1 400 tons/yr.
Follow up: From the economy system (yearly, or even more often).
How: Switch to energy efficient, biogas-driven vehicles, plus a reduction
of travel distance by 20 percent from 2008.
Cost, side effects: Switch of vehicles no extra cost. Better meeting and
travel policy even profitable.
PRIORITERADE ÅTGÄRDER Ansvar Tid
Inköp av effektiva fordon som drivs med klimateffektiva förnybara
drivmedel. Utforma prissättning på ett sätt som stödjer
måluppfyllelse. Årlig redovisning av fordonsparkens
energieffektivitet och drivmedelsanvändning.
Tekniska nämnden Fortlöpande
Implementering och uppföljning av reseriktlinjerna, inklusive dess
klimateffekter.
Alla nämnder 2010, årlig
redovisning
Krav på låga utsläpp av koldioxid per km och årlig rapportering
ska ställas vid upphandling av tjänster.
Alla nämnder Fortlöpande, årlig
redovisning
Proposed measures, responsibility, timing

www.orebro.se
Package 1: Travelling by employees
in the own organization
Emissions from employees commuting to work shall be reduced by 30
percent from 2008 to 2020 (numbers of employees/inhabitants
supposed to be the same).
Climate effect: 1 300 tons/year.
Follow up: Survey every second year.
How: We can use both carrots and sticks. A 30% reduction is 10% above
the effect of stronger national incentives.
Cost, side effects: Proposed budget 1.2 million SEK/year (10 euro/
employee). Supposed to give benefits (health) that are much bigger.
PRIORITERADE ÅTGÄRDER Ansvar Tid
Ta fram paket med åtgärder som uppmuntrar hållbart resande (t.ex.
subventionerade pendlarkort, prova på-busskort, leasingcyklar, hälsotrampare,
samåkning, möjlighet att distansarbeta).
KS 2011-2012
Kommunanställdas arbetsplatsparkeringar ska i möjligaste mån få
marknadspriser.
PNS 2010Proposed measures, responsibility, timing

www.orebro.se
Package 2: Decarbonization
of public transportEmissions from public transport by bus within the municipality’s
borders should be reduced by 75 per cent from 2008 to 2020.
Climate effect: 5 300 tons/yr (of which 3 900 ton in city traffic, already
done!)
Follow up: Fuel statistics, yearly.
How: Switch to biogas-driven buses (procurement process). Allows for an
increase in vehicle kilometres by 50 percent.
Cost, side effects: A quite expensive measure, but with a high symbolic
value. Good for PT image. Cleaner air, less noise. Some new local jobs.
PRIORITERADE ÅTGÄRDER Ansvar Tid
Verka för övergång till biogas i landsbygdstrafiken genom aktivt arbete i
Länstrafikens styrelse.
KS Fortlöpande
Ställa skärpta klimatkrav vid upphandling av särskild kollektivtrafik. KS Fortlöpande
Insatser för att öka samordningen mellan kollektivtrafikens olika delar (t.ex. linjelagd
trafik och skolskjutsar).
KS 2011-2012
I samband med upphandling verka för införande av incitament för utförarna att köra
förnybart och energieffektivt.
KS Fortlöpande
Proposed measures, responsibility, timing

www.orebro.se
Package 3: Other transport
activities in the own organization
Emissions from own and procured transport activities (garbage
collection, street and park management, building equipment etc)
should be reduced by 50 percent between 2008 and 2020.
Climate effect: 2 200 tons/yr. Approx!
Follow up: Statistics, yearly (no follow up of procured transports today!)
How: Swich of vehicles and fuels. Better route planning, ecodriving..
Cost, side effects: Unknown cost for the moment.
PRIORITERADE ÅTGÄRDER Ansvar Tid
Utforma handlingsplaner för att minska utsläppen från egna och
inköpta transporttjänster.
Tekniska nämnden,
Gymnasienämnden, Fritids-
och turistnämnden
2010-2011
Ställ krav på fordonspark och redovisning av utsläpp per km vid
upphandling av entreprenader och andra transporttjänster.
Kommunstyrelsen,
Tekniska nämnden
Fortlöpande
Uppföljning för att tillse att upphandlande enheter följer
kommunens riktlinjer och att utförare lever upp till åtaganden.
Kommunstyrelsen,
Tekniska nämnden
Fortlöpande
Proposed measures, responsibility, timing

www.orebro.se
Commitments for all relevant
actors summarized

www.orebro.se
SUTP: What’s going on? A few examples:
System design
• A new bus network with faster trips
and more frequent tours will start
in April.
• City buses run on biogas since Oct.
• Project with regional authorities to
develop regional public transport.
• Development of a traffic plan,
including parking policy,
redistribution of space from cars to
sustainable transport modes, speed
restrictions for cars.
• More attractive city environment,
carfree squares for example.
• The city grows mostly inwards, try
to avoid urban sprawl.
Influence people and organizations
• Programme to maximize cycling.
• New system for short-time bike rental.
• Mobility management project focusing on large organizations and school travel.
Do as you preach…
• Travel policy – implementation.
• Better route planning.
• No free parking for employees.
• Car sharing scheme instead of own cars.
• Internal climate charge on travels.
www.orebro.se
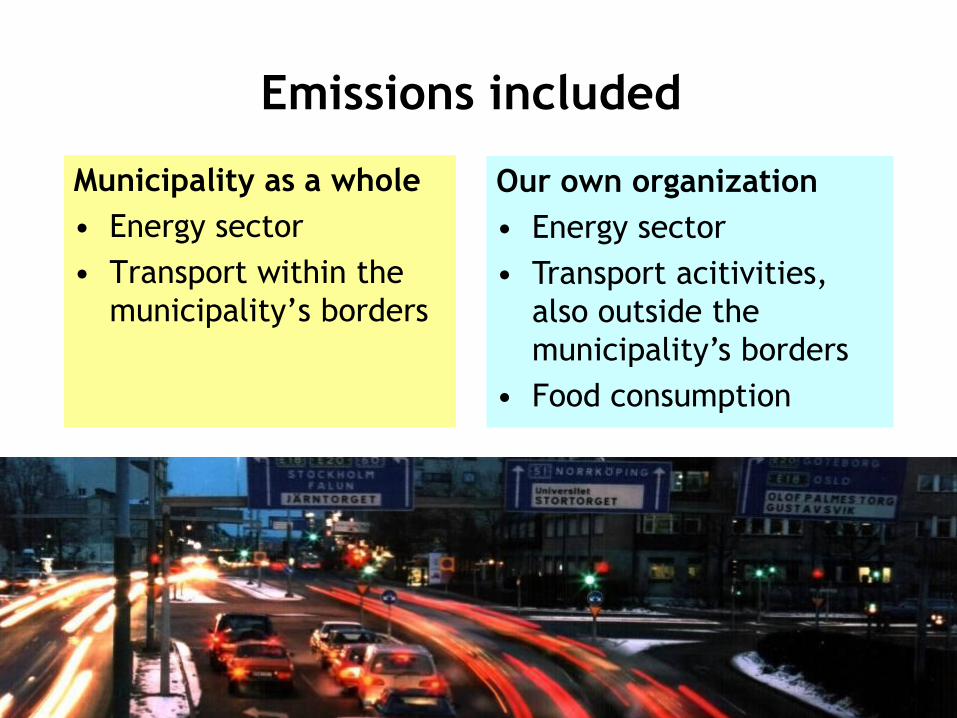
SUTP: What’s going on? A few examples:
System design
• A new bus network with faster trips
and more frequent tours will start
in April.
• City buses run on biogas since Oct.
• Project with regional authorities to
develop regional public transport.
• Development of a traffic plan,
including parking policy,
redistribution of space from cars to
sustainable transport modes, speed
restrictions.
• More attractive city environment,
carfree squares for example.
• The city grows mostly inwards,
avoid urban sprawl.
Influence individuals and organizations
• Programme to maximize cycling.
• New system for short-time bike rental.
• Mobility management projects focusing on large employers and travel to school.
Section “Do as you preach”…
• Travel policy – implementation.
• Better route planning.
• No free parking for employees.
• Car sharing scheme instead of own cars.
• Internal climate charge on travels.

www.orebro.se
Some general findings• It must be rational for citizens to do the right thing (“What’s in
it for me?”). Only “carrots” will not work!
• Put focus on changing the incentives (politics!), rather than
asking people to change their habits (“privatisation” of the
problem).
• It is essential to give resources to evaluation of results.
• Start with the own organisation.
”It’s easier if you pull in
the same direction”

www.orebro.se
Thank you for listening!

www.orebro.se
Walking and cycling: Maximize!

www.orebro.se
More attractive exchange between modes More priority for public transport
Public transport: Optimize!
A better network and more frequent tours will start in April.
Public transport must be more involved in the planning process

www.orebro.se
Road traffic: Find a better balance!

www.orebro.se

www.orebro.se
Related Documents