Methodology for assessing the benefits of active transportation projects CLIMATE-SMART CITIES ™

Welcome message from author
This document is posted to help you gain knowledge. Please leave a comment to let me know what you think about it! Share it to your friends and learn new things together.
Transcript
Methodology for assessing the benefits of active transportation projects
C L I M A T E - S M A R T C I T I E S ™

Written by Eliot Rose and James Choe, ICF International For The Trust for Public Land’s Climate-Smart Cities™ program December 2015

Printed on 100% recycled paper. © 2016 The Trust for Public Land.
Methodology for assessing the benefits of active transportation projects
Executive Report

The Trust for Public Land creates parks
and protects land for people,
ensuring healthy, livable communities
for generations to come.
tpl.org
climate-smart cities methodology for assessing the benefits of active transportation projects 3
Table of contents
List of tables .............................................................................................................................. 6
1 Introduction ........................................................................................................................... 9
1.1 Benefits of bicycle and pedestrian trails ................................................................ 10
1.2 Quantifying benefits ................................................................................................. 11
1.3 About this report ....................................................................................................... 12
2 Methodology ...................................................................................................................... 13
2.1 Overview .................................................................................................................... 13
2.2 Calculations ............................................................................................................... 13
2.2.1 Reduced vehicle trips due to bicycling and walking .................................. 13
2.2.2 Reduced vehicle trips due to transit ............................................................. 14
2.2.3 Reduced VMT ................................................................................................... 15
2.2.4 Environmental, economic, and public health benefits ............................... 15
2.3 Variables ..................................................................................................................... 15
4 climate-smart cities methodology for assessing the benefits of active transportation projects
3 Inputting data ...................................................................................................................... 20
3.1 Annual average daily traffic on a parallel roadway ............................................... 20
3.1.1 Preferred approach ......................................................................................... 20
3.1.2 Alternate approaches ...................................................................................... 21
3.2 Average length of bicycle, pedestrian, and transit trips ...................................... 22
3.2.1 Preferred approach ......................................................................................... 22
3.2.2 Default assumptions ........................................................................................ 23
3.3 University area ........................................................................................................... 25
3.3.1 Preferred approach ......................................................................................... 28
3.4 Number of activity centers ....................................................................................... 28
3.4.1 Preferred approach ......................................................................................... 29
3.4.2 Alternate approaches ...................................................................................... 29
3.5 Transit-related inputs: transit access, area type, ................................................... 30 transit type, and transit ridership
3.5.1 Preferred approach ......................................................................................... 30
3.6 Number of days per year that people use the facility .......................................... 31
climate-smart cities methodology for assessing the benefits of active transportation projects 5
4 Estimating benefits ............................................................................................................. 33
4.1 Greenhouse gas and criteria pollutant emission factors ..................................... 33
4.2 Household transportation costs .............................................................................. 35
4.3 Mortality ..................................................................................................................... 35
4.4 Property values .......................................................................................................... 38
5 Conclusion ........................................................................................................................... 42
References .............................................................................................................................. 44

6 climate-smart cities methodology for assessing the benefits of active transportation projects
Table 1: Adjustment factors (A) by AADT, facility length, ................................................. 13 and whether the project is located in a university area
Table 2: Activity center credits (C) by number of .............................................................. 13 activity centers and distance from the facility
Table 3: Increase in transit trips (T) by area type and transit type ................................... 14
Table 4: Summary of variables used in the methodology ................................................ 15
Table 5: Volume groups and AADT ranges used in NTAD HPMS data ........................... 22
Table 6: Typical characteristics, including AADT, ............................................................... 23 by roadway functional class
Table 7: NHTS mode, trip purpose, and trip length .......................................................... 25 data used in default length assumptions
Table 8: Adjustment factors by length and ........................................................................ 26 AADT for university and non-university areas
Table 9: Population and walk / bicycle commute .............................................................. 27 mode share in selected university towns
List of tables
climate-smart cities methodology for assessing the benefits of active transportation projects 7
Table 10: Activity center adjustment factor credits ........................................................... 29
Table 11: Factors used to estimate increase in transit trips .............................................. 30
Table 12: Emission factors used in the methodology (from MOVES 2014a) ................. 34
Table 13: MOVES parameters used to derive emission factors ....................................... 34
Table 14: Constants and data sources used in mortality calculations ............................. 38
Table 15: Summary of public health research reviewed ................................................... 39
Table 16: Summary of property value research reviewed ................................................ 41
8 climate-smart cities methodology for assessing the benefits of active transportation projects
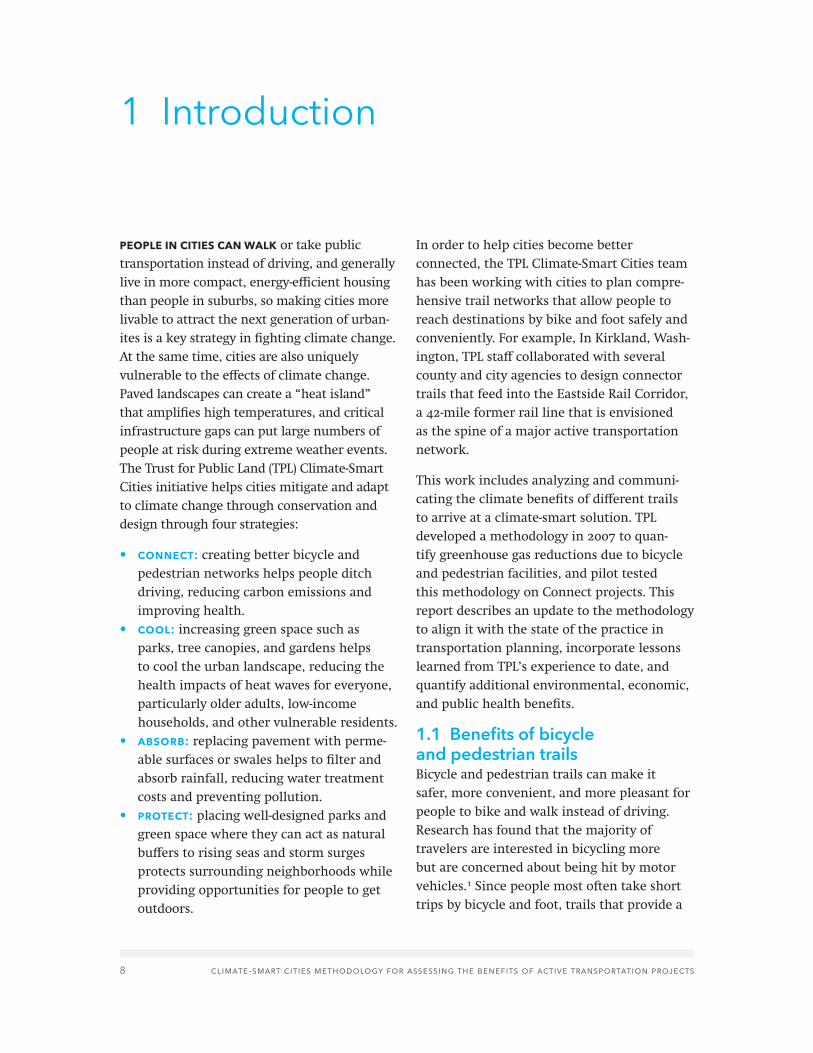
PEOPLE IN CITIES CAN WALK or take public transportation instead of driving, and generally live in more compact, energy-efficient housing than people in suburbs, so making cities more livable to attract the next generation of urban-ites is a key strategy in fighting climate change. At the same time, cities are also uniquely vulnerable to the effects of climate change. Paved landscapes can create a “heat island” that amplifies high temperatures, and critical infrastructure gaps can put large numbers of people at risk during extreme weather events. The Trust for Public Land (TPL) Climate-Smart Cities initiative helps cities mitigate and adapt to climate change through conservation and design through four strategies:
• connect: creating better bicycle and pedestrian networks helps people ditch driving, reducing carbon emissions and improving health.
• cool: increasing green space such as parks, tree canopies, and gardens helps to cool the urban landscape, reducing the health impacts of heat waves for everyone, particularly older adults, low-income households, and other vulnerable residents.
• absorb: replacing pavement with perme-able surfaces or swales helps to filter and absorb rainfall, reducing water treatment costs and preventing pollution.
• protect: placing well-designed parks and green space where they can act as natural buffers to rising seas and storm surges protects surrounding neighborhoods while providing opportunities for people to get outdoors.
In order to help cities become better connected, the TPL Climate-Smart Cities team has been working with cities to plan compre-hensive trail networks that allow people to reach destinations by bike and foot safely and conveniently. For example, In Kirkland, Wash-ington, TPL staff collaborated with several county and city agencies to design connector trails that feed into the Eastside Rail Corridor, a 42-mile former rail line that is envisioned as the spine of a major active transportation network.
This work includes analyzing and communi-cating the climate benefits of different trails to arrive at a climate-smart solution. TPL developed a methodology in 2007 to quan-tify greenhouse gas reductions due to bicycle and pedestrian facilities, and pilot tested this methodology on Connect projects. This report describes an update to the methodology to align it with the state of the practice in transportation planning, incorporate lessons learned from TPL’s experience to date, and quantify additional environmental, economic, and public health benefits.
1.1 Benefits of bicycle and pedestrian trailsBicycle and pedestrian trails can make it safer, more convenient, and more pleasant for people to bike and walk instead of driving. Research has found that the majority of travelers are interested in bicycling more but are concerned about being hit by motor vehicles.1 Since people most often take short trips by bicycle and foot, trails that provide a
1 Introduction
climate-smart cities methodology for assessing the benefits of active transportation projects 9
direct, safe connection to destinations make cycling and walking more viable alternatives to driving. Bicyclists and pedestrians are more sensitive to their surroundings than other travelers, so trails that travel through pleasant natural settings can also induce people to bicycle and walk more. In addition, many people access transit stations by foot or by bicycle, so connecting trails to transit can also encourage people to ride the bus or train.
By making it easier for people to walk, bicycle, or take transit instead of driving, trails produce a host of benefits:
• economic benefits Transportation is the second-largest household expenditure after housing, and people save money by driving less. Businesses that are accessible by bicycle or foot often see more shoppers, and increased bicycling helps to boost spending at local bicycle-related businesses. Homeowners who live near trails may see an increase in property values, with a corre-sponding increase in property tax revenues for local governments. Communities that develop a reputation for being walkable or bike-friendly may also see increased tourism from active travelers.2
• environmental benefits People who drive less reduce air pollution and green-house gas emissions. Over the long term, cities where people drive less need less space for roads and parking, which helps to preserve open space and reduce water pollution due to runoff from paved surfaces.
• health benefits People who bike and walk every day are more likely to meet physical activity guidelines, which helps to reduce the risk of diabetes, obesity, and other related health issues. Meanwhile, long car commutes can increase stress and contribute to a sedentary lifestyle. Commu-nities where people drive more generally see a higher incidence of collisions, and bicyclists and pedestrians are particularly vulnerable to injury and death from traffic incidents, so trails can help reduce the extent and severity of collisions. Reducing air pollution also lowers the incidence of asthma and other respiratory conditions. Shifting travel from driving to bicycling or walking not only benefits individuals, but reduces overall public health care costs.3
• social equity benefits Trails benefit everyone, but particularly low-income people, who are less likely to own cars and more likely to walk or bicycle out of need instead of choice. Low-income and minority communities have disproportionately high exposure rates to unsafe streets and traffic collisions, so providing trails in these communities can have significant safety benefits. Many low-income neighborhoods lack grocery stores or other neighbor-hood businesses, and well-planned trails can improve residents’ access to healthy food, health and social services, and other important destinations. Some of these benefits can be quantified. For more than a decade, transportation agencies have been estimating reductions in vehicle trips
10 climate-smart cities methodology for assessing the benefits of active transportation projects
and vehicle miles traveled due to bicycle facilities in order to calculate the resulting reduction in air pollution. Over time, researchers and transportation planners have refined methods for estimating the impact of bicycle and pedestrian facilities on driving. At the same time, research, tools, and best practices have also become available to quantify some of the other economic, environmental, and health benefits of reduced driving and increased active transportation.
1.2 Quantifying benefitsThe methodology described in this report and the accompanying spreadsheet tool draw on state-of-the-practice research and methods to quantify the benefits of bicycle and pedestrian trails, including:
• Reduced greenhouse gas emissions• Reduced air pollution• Household transportation savings• Reduced mortality
At the heart of our methodology is a method for estimating reductions in vehicle trips and vehicle miles traveled due to bicycle facili-ties that was developed by the California Air Resources Board (ARB) in 2005.4 There are other methods available to estimate the trans-portation impacts of bicycle and pedestrian facilities, but the ARB methodology combines several key advantages:
• it is widely used Transportation agencies throughout the United States continue to apply and improve upon the methodology developed by ARB. Most recently, regional transportation agencies in the Phoenix5 and Atlanta6 metropolitan areas have developed applications of the methodology that account for pedestrian trips and for increased transit trips where trails connect to transit stations. Applying the ARB meth-odology helps to ensure that TPL’s work represents the state of the practice.
• it is simple The calculations and assump-tions for the ARB methodology can be encapsulated in a spreadsheet, and the methodology draws upon data that are typi-cally available from local transportation agencies. The Benefit-Cost Analysis of Bicycle Facilities developed by researchers at the University of Minnesota, which is the next simplest nationally applicable method-ology, requires GIS analysis to identify the number of residents living near a planned facility.7 More sophisticated methodologies used by regional transportation agencies require complex travel demand models to analyze bicycle and pedestrian behavior.8
• it is widely applicable The ARB method-ology is based primarily on national data and has been applied by transportation agencies throughout the United States Local and regional transportation agen-cies have developed methods that may capture the behavior of local bicyclists and pedestrians more accurately but draw on extensive data, including travel surveys, traffic counts, and spatial data on the
climate-smart cities methodology for assessing the benefits of active transportation projects 11
transportation network.9 Since TPL advo-cates for high-quality trails in communities across the United States, we need to use a methodology that is broadly applicable and does not require extensive data collection.
The methodology described here is broader in focus than the ARB methodology. It converts reduced vehicle trips and vehicle miles trav-eled due to bicycle and pedestrian trails not only to reductions in greenhouse gas emis-sions and air pollutants, but also to household transportation cost savings. The methodology avoided deaths using factors drawn from best practices and peer-reviewed research. Wherever possible, we use factors that are recommended by federal agencies, including the Environmental Protection Agency and the Internal Revenue Service.
1.3 About this reportThe remainder of this report provides in-depth information on the calculations and data sources behind the methodology, as well as detailed instructions for inputting data.
• Section 2 describes calculations for esti-mating reductions in vehicle trips and vehicle miles traveled and summarizes the key variables used in the tool.
• Section 3 offers detailed instructions on inputting data into the tool, including preferred approaches for sourcing data and alternate approaches where data are not available from the preferred source, and documents the default assumptions used for some inputs.
• Section 4 discusses the data sources and supporting research used to convert reduced vehicle trips and miles trav-eled into the environmental, economic, and health benefits captured by the methodology.
12 climate-smart cities methodology for assessing the benefits of active transportation projects
2.1 OverviewTHE ARB METHODOLOGY, which was developed for the purpose of quantifying emissions reductions when allocating federal Congestion Mitigation and Air Quality (CMAQ) funds, assumes that a new bicycle facility leads a portion of drivers who travel along the route served by the facility to shift from driving to bicycling. It calculates two key outputs, reduced vehicle trips and vehicle miles traveled (VMT), based on the characteristics of the route and of the surrounding area. These outputs are often converted into emissions reductions for the purpose of allocating CMAQ funding and comparing the environmental benefits of trails to those of other transportation projects, but they can also serve as a basis for calculating economic and public health benefits.
Several metropolitan planning organizations (MPOs) have applied the ARB methodology when allocating CMAQ funding, and a few have added updates that we incorporate into our methodology. Whereas the ARB methodology focused exclusively on bicycling, the Maricopa Association of Governments (MAG) assumes that trails also induce a shift from driving to walking and uses the same calculations to quantify reduced vehicle trips due to walking as for bicycling.10 The Atlanta Regional Commission (ARC) incorporates this assumption and also captures mode shift to transit for trails that connect to stations.11
2.2 Calculations2.2.1 reduced vehicle trips due to bicycling and walking
To calculate the reduction in vehicle trips due to a bicycle or pedestrian project, the method-ology applies an adjustment factor and activity center credit to the daily traffic volume along a parallel arterial in order to estimate the number of drivers who shift to bicycling or walking and annualizes the result, as follows:
VTB,P = (BIKE x D x AADT x [A + C]) + (PED x D x AADT x [A + C])
Where:
VTB,P = Annual vehicle trips reduced due to bicycling and walking
BIKE = Binary variable indicating whether the project has a bicycle component
PED = Binary variable indicating whether the project has a pedestrian component
D = Number of days per year that people use the facility
AADT = Annual average daily traffic on a parallel roadway
A = Adjustment factor (based on AADT, facility length, and whether the project is located in a university area; see Table 1)
C = Activity center credit (based on the number of activity centers located within a quarter or half mile of the project; see Table 2)
2 Methodology
climate-smart cities methodology for assessing the benefits of active transportation projects 13
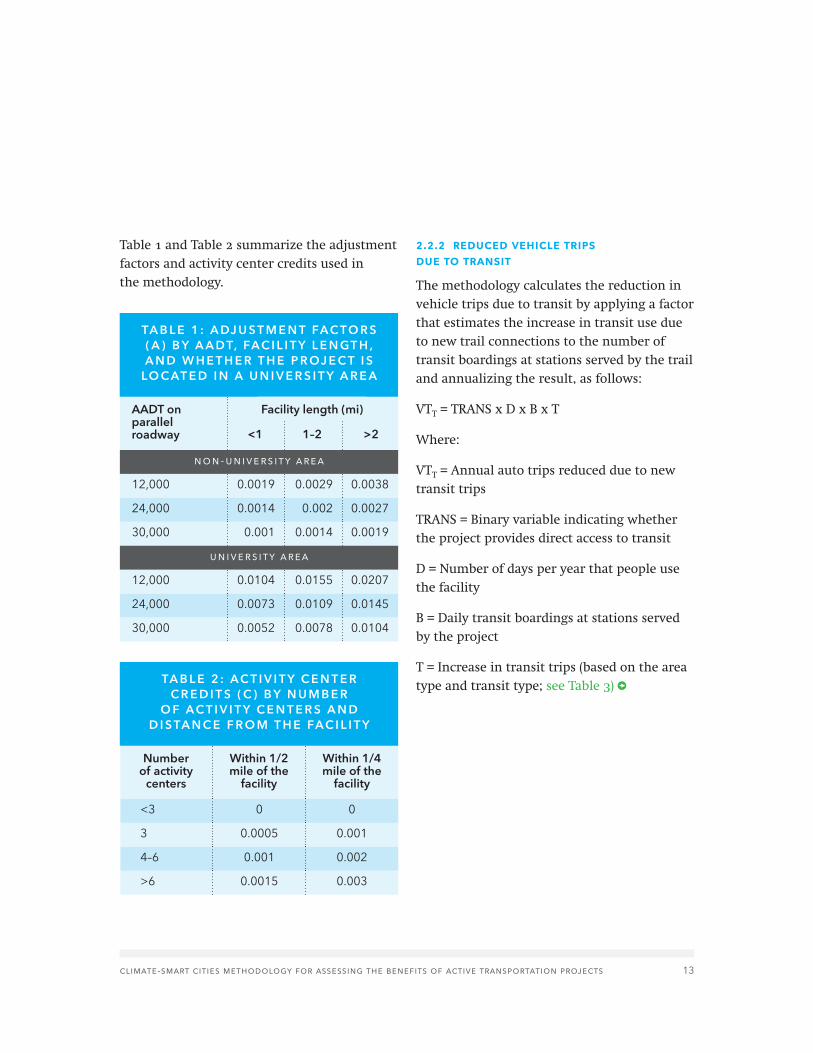
Table 1 and Table 2 summarize the adjustment factors and activity center credits used in the methodology.
2.2.2 reduced vehicle trips due to transit
The methodology calculates the reduction in vehicle trips due to transit by applying a factor that estimates the increase in transit use due to new trail connections to the number of transit boardings at stations served by the trail and annualizing the result, as follows:
VTT = TRANS x D x B x T
Where:
VTT = Annual auto trips reduced due to new transit trips
TRANS = Binary variable indicating whether the project provides direct access to transit
D = Number of days per year that people use the facility
B = Daily transit boardings at stations served by the project
T = Increase in transit trips (based on the area type and transit type; see Table 3)
non-university area
12,000 0.0019 0.0029 0.0038
24,000 0.0014 0.002 0.0027
30,000 0.001 0.0014 0.0019
university area
12,000 0.0104 0.0155 0.0207
24,000 0.0073 0.0109 0.0145
30,000 0.0052 0.0078 0.0104
<3 0 0
3 0.0005 0.001
4–6 0.001 0.002
>6 0.0015 0.003
TA B L E 1 : A DJ U S T M E N T FA C TO R S ( A ) B Y A A DT, FA C I L I T Y L E N GT H , A N D W H E T H E R T H E P R OJ E C T I S
LO C AT E D I N A U N I V E R S I T Y A R E A
TA B L E 2 : A C T I V I T Y C E N T E R C R E D I T S ( C ) B Y N U M B E R
O F A C T I V I T Y C E N T E R S A N D D I S TA N C E F R O M T H E FA C I L I T Y
1–2<1 >2
Within 1/4 mile of the
facility
Within 1/2 mile of the
facility
Number of activity
centers
AADT on parallel roadway
Facility length (mi)
14 climate-smart cities methodology for assessing the benefits of active transportation projects
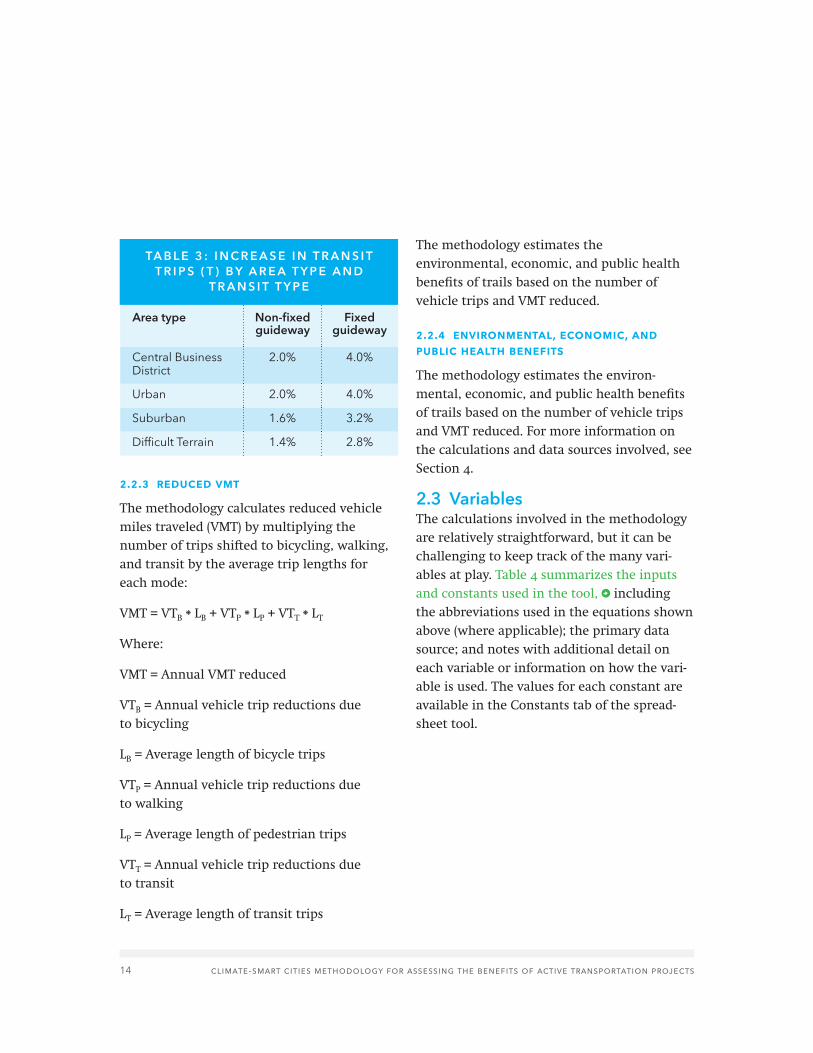
2.2.3 reduced vmt
The methodology calculates reduced vehicle miles traveled (VMT) by multiplying the number of trips shifted to bicycling, walking, and transit by the average trip lengths for each mode:
VMT = VTB * LB + VTP * LP + VTT * LT
Where:
VMT = Annual VMT reduced
VTB = Annual vehicle trip reductions due to bicycling
LB = Average length of bicycle trips
VTP = Annual vehicle trip reductions due to walking
LP = Average length of pedestrian trips
VTT = Annual vehicle trip reductions due to transit
LT = Average length of transit trips
The methodology estimates the environmental, economic, and public health benefits of trails based on the number of vehicle trips and VMT reduced.
2.2.4 environmental, economic, and public health benefits
The methodology estimates the environ-mental, economic, and public health benefits of trails based on the number of vehicle trips and VMT reduced. For more information on the calculations and data sources involved, see Section 4.
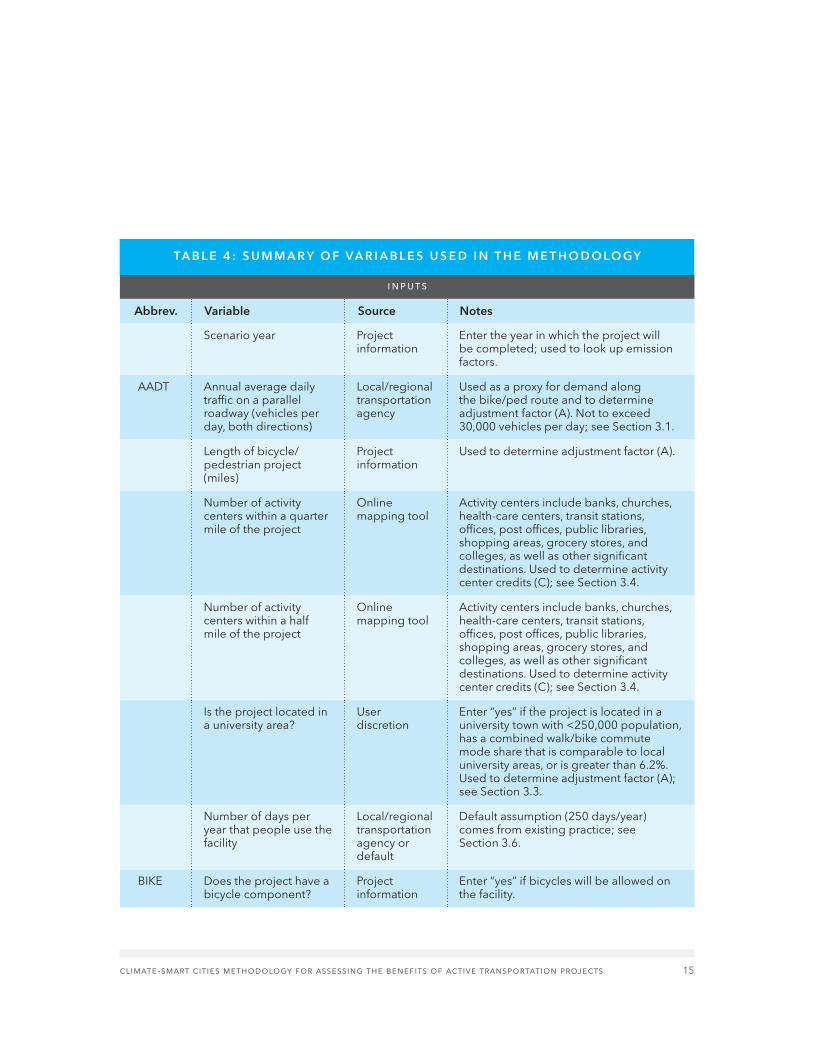
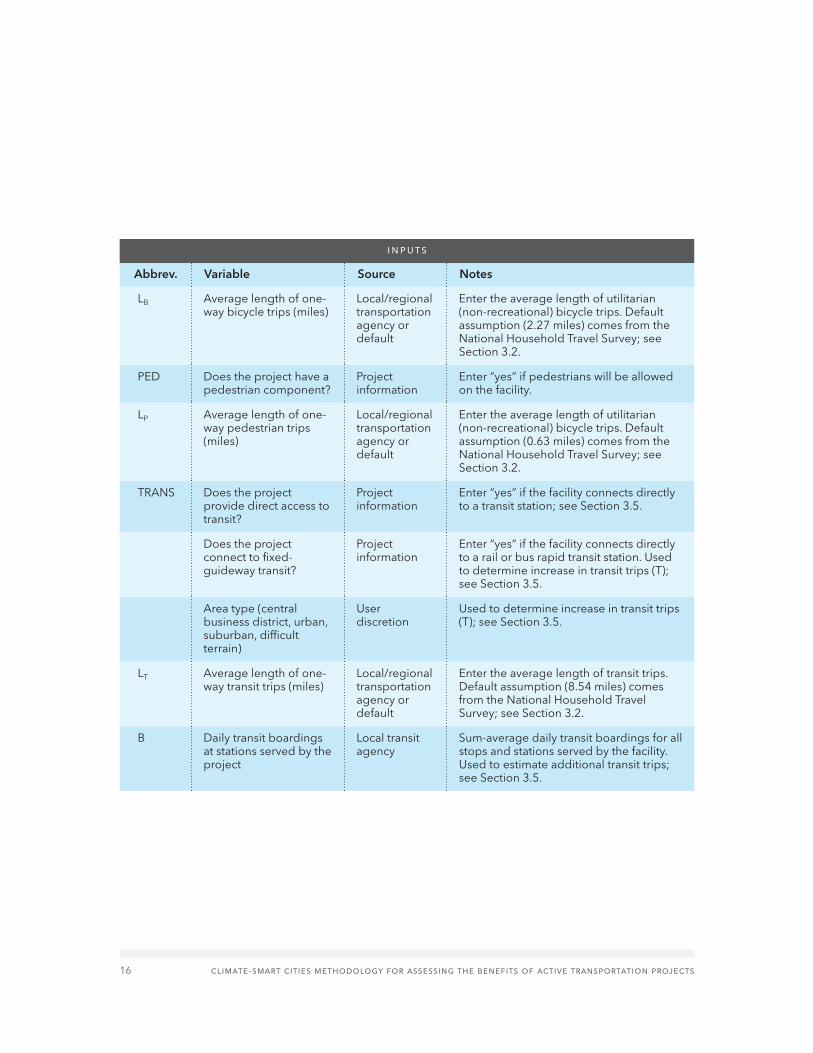
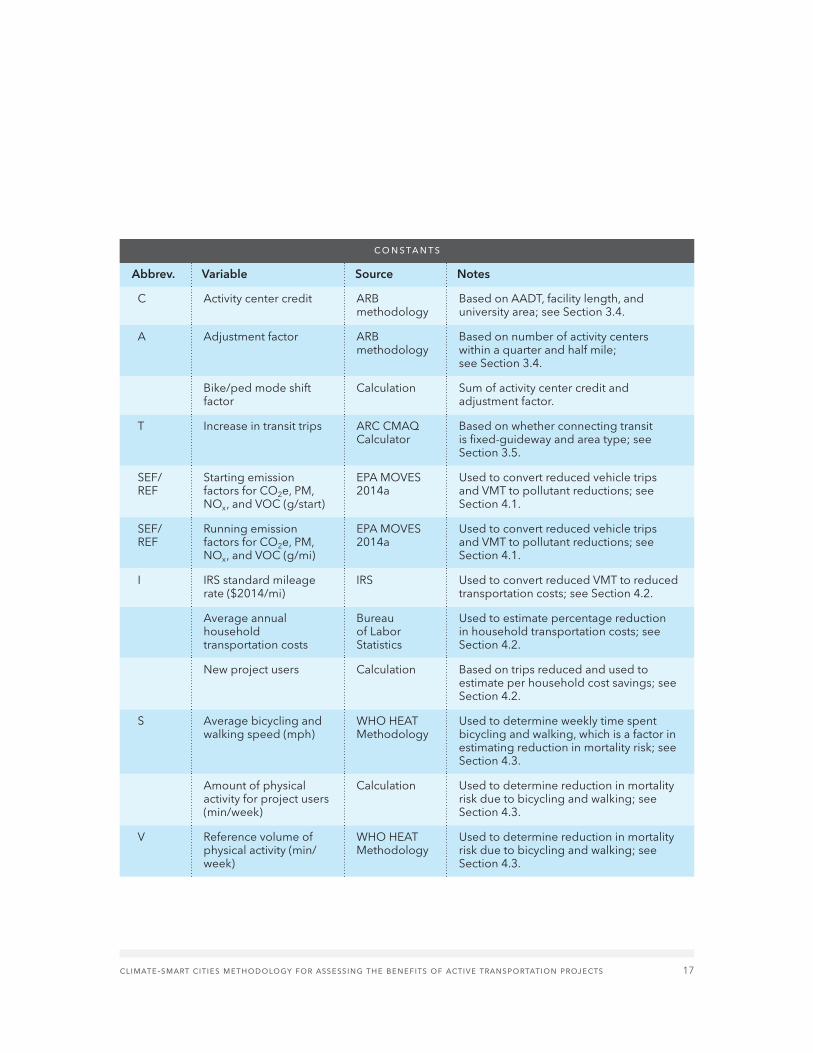
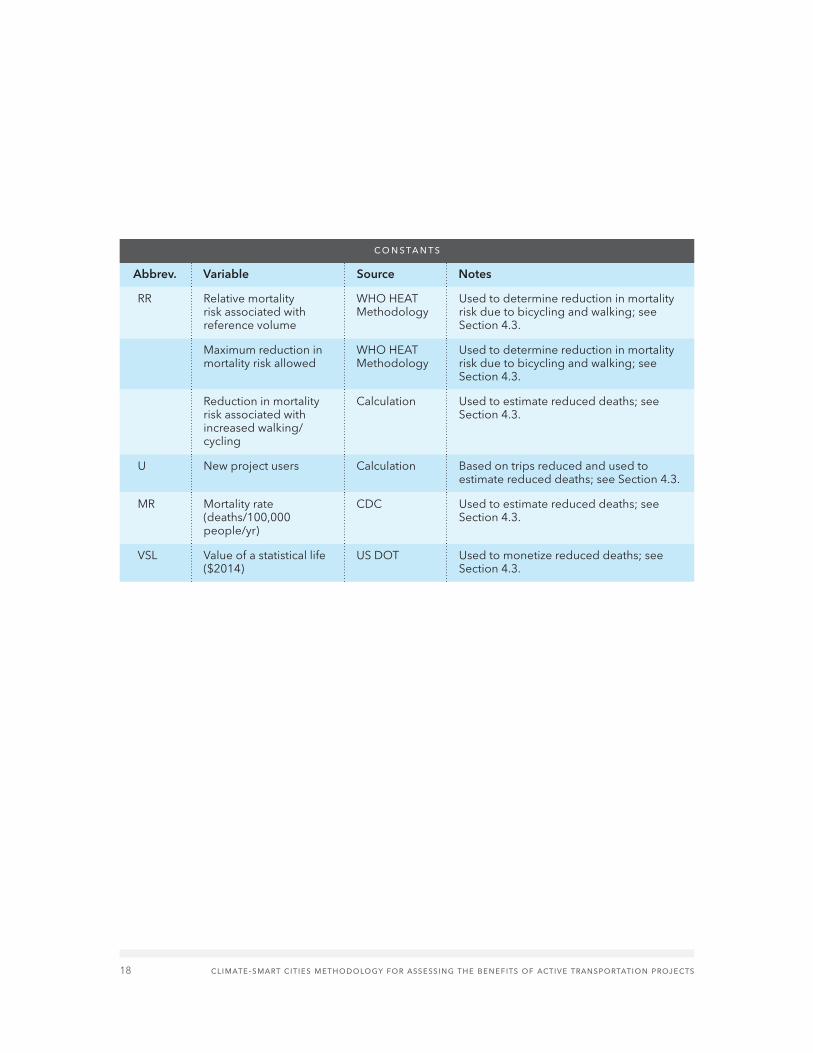
2.3 VariablesThe calculations involved in the methodology are relatively straightforward, but it can be challenging to keep track of the many vari-ables at play. Table 4 summarizes the inputs and constants used in the tool, including the abbreviations used in the equations shown above (where applicable); the primary data source; and notes with additional detail on each variable or information on how the vari-able is used. The values for each constant are available in the Constants tab of the spread-sheet tool.
Central Business District
2.0% 4.0%
Urban 2.0% 4.0%
Suburban 1.6% 3.2%
Difficult Terrain 1.4% 2.8%
TA B L E 3 : I N C R E A S E I N T R A N S I T T R I P S ( T ) B Y A R E A T Y P E A N D
T R A N S I T T Y P E
Fixed guideway
Non-fixed guideway
Area type
climate-smart cities methodology for assessing the benefits of active transportation projects 15
inputs
Scenario year Project information
Enter the year in which the project will be completed; used to look up emission factors.
AADT Annual average daily traffic on a parallel roadway (vehicles per day, both directions)
Local/regional transportation agency
Used as a proxy for demand along the bike/ped route and to determine adjustment factor (A). Not to exceed 30,000 vehicles per day; see Section 3.1.
Length of bicycle/pedestrian project (miles)
Project information
Used to determine adjustment factor (A).
Number of activity centers within a quarter mile of the project
Online mapping tool
Activity centers include banks, churches, health-care centers, transit stations, offices, post offices, public libraries, shopping areas, grocery stores, and colleges, as well as other significant destinations. Used to determine activity center credits (C); see Section 3.4.
Number of activity centers within a half mile of the project
Online mapping tool
Activity centers include banks, churches, health-care centers, transit stations, offices, post offices, public libraries, shopping areas, grocery stores, and colleges, as well as other significant destinations. Used to determine activity center credits (C); see Section 3.4.
Is the project located in a university area?
User discretion
Enter “yes” if the project is located in a university town with <250,000 population, has a combined walk/bike commute mode share that is comparable to local university areas, or is greater than 6.2%. Used to determine adjustment factor (A); see Section 3.3.
Number of days per year that people use the facility
Local/regional transportation agency or default
Default assumption (250 days/year) comes from existing practice; see Section 3.6.
BIKE Does the project have a bicycle component?
Project information
Enter “yes” if bicycles will be allowed on the facility.
TA B L E 4 : S U M M A R Y O F VA R I A B L E S U S E D I N T H E M E T H O D O LO GY
Abbrev. Variable Source Notes
16 climate-smart cities methodology for assessing the benefits of active transportation projects
inputs
LB Average length of one-way bicycle trips (miles)
Local/regional transportation agency or default
Enter the average length of utilitarian (non-recreational) bicycle trips. Default assumption (2.27 miles) comes from the National Household Travel Survey; see Section 3.2.
PED Does the project have a pedestrian component?
Project information
Enter “yes” if pedestrians will be allowed on the facility.
LP Average length of one-way pedestrian trips (miles)
Local/regional transportation agency or default
Enter the average length of utilitarian (non-recreational) bicycle trips. Default assumption (0.63 miles) comes from the National Household Travel Survey; see Section 3.2.
TRANS Does the project provide direct access to transit?
Project information
Enter “yes” if the facility connects directly to a transit station; see Section 3.5.
Does the project connect to fixed-guideway transit?
Project information
Enter “yes” if the facility connects directly to a rail or bus rapid transit station. Used to determine increase in transit trips (T); see Section 3.5.
Area type (central business district, urban, suburban, difficult terrain)
User discretion
Used to determine increase in transit trips (T); see Section 3.5.
LT Average length of one-way transit trips (miles)
Local/regional transportation agency or default
Enter the average length of transit trips. Default assumption (8.54 miles) comes from the National Household Travel Survey; see Section 3.2.
B Daily transit boardings at stations served by the project
Local transit agency
Sum-average daily transit boardings for all stops and stations served by the facility. Used to estimate additional transit trips; see Section 3.5.
Abbrev. Variable Source Notes
climate-smart cities methodology for assessing the benefits of active transportation projects 17
constants
C Activity center credit ARB methodology
Based on AADT, facility length, and university area; see Section 3.4.
A Adjustment factor ARB methodology
Based on number of activity centers within a quarter and half mile; see Section 3.4.
Bike/ped mode shift factor
Calculation Sum of activity center credit and adjustment factor.
T Increase in transit trips ARC CMAQ Calculator
Based on whether connecting transit is fixed-guideway and area type; see Section 3.5.
SEF/REF
Starting emission factors for CO2e, PM, NOx, and VOC (g/start)
EPA MOVES 2014a
Used to convert reduced vehicle trips and VMT to pollutant reductions; see Section 4.1.
SEF/REF
Running emission factors for CO2e, PM, NOx, and VOC (g/mi)
EPA MOVES 2014a
Used to convert reduced vehicle trips and VMT to pollutant reductions; see Section 4.1.
I IRS standard mileage rate ($2014/mi)
IRS Used to convert reduced VMT to reduced transportation costs; see Section 4.2.
Average annual household transportation costs
Bureau of Labor Statistics
Used to estimate percentage reduction in household transportation costs; see Section 4.2.
New project users Calculation Based on trips reduced and used to estimate per household cost savings; see Section 4.2.
S Average bicycling and walking speed (mph)
WHO HEAT Methodology
Used to determine weekly time spent bicycling and walking, which is a factor in estimating reduction in mortality risk; see Section 4.3.
Amount of physical activity for project users (min/week)
Calculation Used to determine reduction in mortality risk due to bicycling and walking; see Section 4.3.
V Reference volume of physical activity (min/week)
WHO HEAT Methodology
Used to determine reduction in mortality risk due to bicycling and walking; see Section 4.3.
Abbrev. Variable Source Notes
18 climate-smart cities methodology for assessing the benefits of active transportation projects
constants
RR Relative mortality risk associated with reference volume
WHO HEAT Methodology
Used to determine reduction in mortality risk due to bicycling and walking; see Section 4.3.
Maximum reduction in mortality risk allowed
WHO HEAT Methodology
Used to determine reduction in mortality risk due to bicycling and walking; see Section 4.3.
Reduction in mortality risk associated with increased walking/cycling
Calculation Used to estimate reduced deaths; see Section 4.3.
U New project users Calculation Based on trips reduced and used to estimate reduced deaths; see Section 4.3.
MR Mortality rate (deaths/100,000 people/yr)
CDC Used to estimate reduced deaths; see Section 4.3.
VSL Value of a statistical life ($2014)
US DOT Used to monetize reduced deaths; see Section 4.3.
Abbrev. Variable Source Notes
climate-smart cities methodology for assessing the benefits of active transportation projects 19
THOUGH THE METHODOLOGY IS DESIGNED TO produce defensible estimates of the benefits of bicycle and pedestrian trails using simple data and straightforward calculations, sourcing and inputting some of the required data can be challenging. This section contains detailed guidance on inputting data for key variables used in the tool, including alternative options when data are not available from a preferred source and information on the default assumptions included in the tool. The inputs discussed in this section include:
• Annual average daily traffic on a parallel roadway
• Average length of bicycle, pedestrian, and transit trips
• University area• Number of activity centers• Transit-related inputs: transit access, area
type, transit type, and transit ridership• Number of days per year that people use
the path
3.1 Annual average daily traffic on a parallel roadwayThe methodology uses the annual average daily traffic (AADT, sometimes abbreviated as ADT12) on a roadway paralleling the trail as a proxy for how much demand there is for travel along the trail route. The maximum AADT value allowed is 30,000 vehicles per day. AADT is also used as a factor in selecting the adjustment factor that is used to esti-mate how many drivers along the parallel roadway will shift to walking or bicycling. This
adjustment factor is then applied to AADT in order to estimate the number of new walking and bicycling trips along the proposed trail. AADT is a standard metric used to measure traffic volumes, but data may not always be available, and where data are available users may need to determine how to apply them appropriately.
3.1.1 preferred approach
It is best to collect AADT data directly from local transportation agencies and to defer to these agencies when identifying an appropriate parallel road that can serve as a proxy for demand along the proposed trail. Paths and trails typically are adjacent to lower-volume local streets as opposed to higher-volume arterials and freeways, and local agencies are the only source of data on local streets. There is no standard format or medium for providing traffic data to the public, so data must be obtained directly from agency staff.
Transportation agencies conduct traffic counts at specific points in the roadway network, so data may be available for multiple points along a planned trail. Where this is the case, users should take the average AADT across all data points located along the trail.
Transportation agencies unfamiliar with this methodology may also provide data on multiple roadways and let users choose which roadway to use as a data source. While the parallel roadway for a bicycle lane is simply
3 Inputting data
20 climate-smart cities methodology for assessing the benefits of active transportation projects
the roadway along which the lane is located, it is sometimes not as straightforward to identify a parallel roadway for an off-street path, since a path may parallel multiple road-ways. Though other applications of the ARB methodology on which our methodology is based typically direct users to select a single roadway, in cases where a path is equidistant from multiple roadways it may be justifiable to take the average AADT across all roadways. The maximum AADT value recommended by ARB is 30,000 vehicles per day, so high-volume roadways such as interstates should be excluded from the average.
3.1.2 alternate approaches
Local transportation agencies often do not always conduct traffic counts on all roads on a regular basis, so up-to-date data may not be available for all areas. When data are not available, there are a number of alternate data sources that users can draw upon, though none provide particularly precise data.
regional travel model data
One novel approach to estimating demand along the route of a planned path is to use the estimated travel demand from local or regional agencies that operate a travel model. This approach is included in the ARC CMAQ tool application of the ARB methodology and applied to regionally significant bicycle and pedestrian projects on a separated facility.13 Using modeled data can be less precise but more accurate than using AADT from a parallel roadway, because models estimate all
travel demand along the route served by a trail rather than using known data from a single road as a proxy for travel demand. However, data may not be available for all areas.
MPOs, as well as some larger cities, use computerized travel models to assess trans-portation projects. These models divide a region or city into zones and estimate the demand between each pair of zones based on household travel survey data. Data on the annual demand between the two zones at the endpoints of the proposed facility can be used as a substitute for AADT. Travel models are highly technical, so data must be obtained from modeling staff. Extra calculations may also be necessary to convert model outputs to AADT. This approach will likely only be feasible in areas where the users have strong relationships with agencies that maintain travel demand models.
national transportation atlas database
The National Transportation Atlas Database (NTAD)14 is a geospatial database that includes a wealth of data on the U.S. transportation system. NTAD includes traffic volumes from the Highway Performance Monitoring System (HPMS), which covers all roads that are part of the state and federal highway system. This includes some lower-volume arterials and collector streets in addition to freeways. The NTAD HPMS files may include data for road-ways paralleling a trail. The HPMS assigns roads to one of 12 volume groups with asso-ciated AADT ranges (see Table 5 ), so users
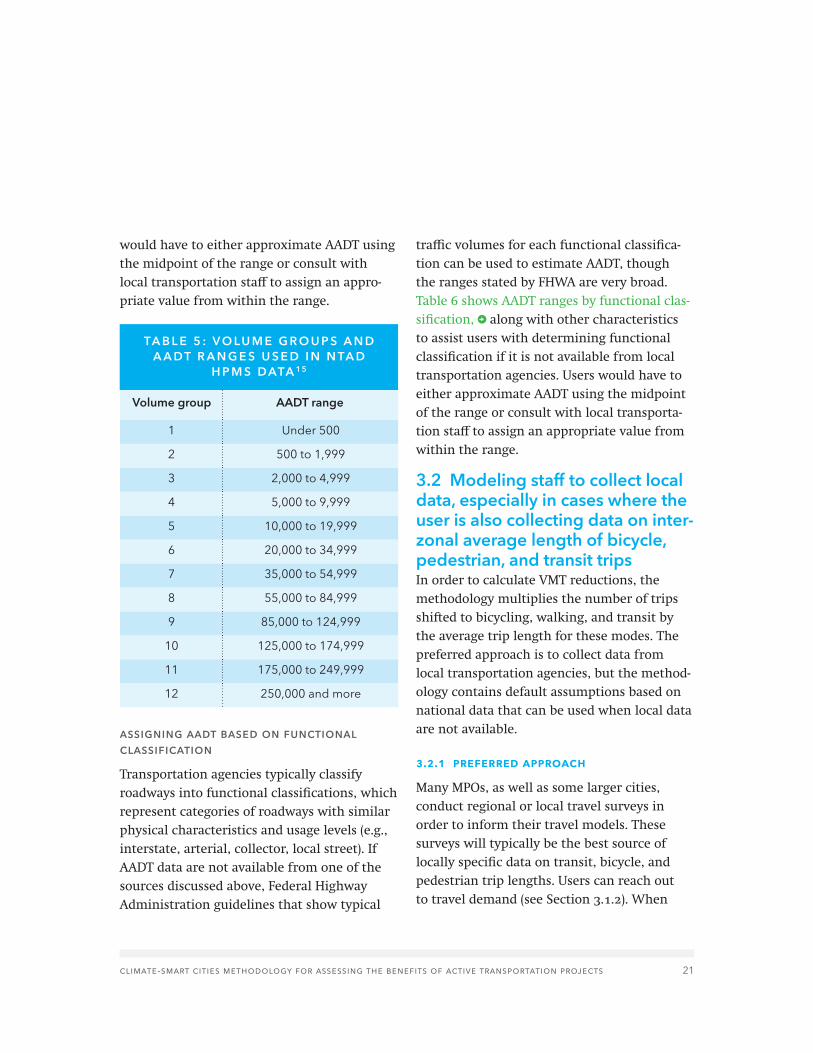
climate-smart cities methodology for assessing the benefits of active transportation projects 21
would have to either approximate AADT using the midpoint of the range or consult with local transportation staff to assign an appro-priate value from within the range.
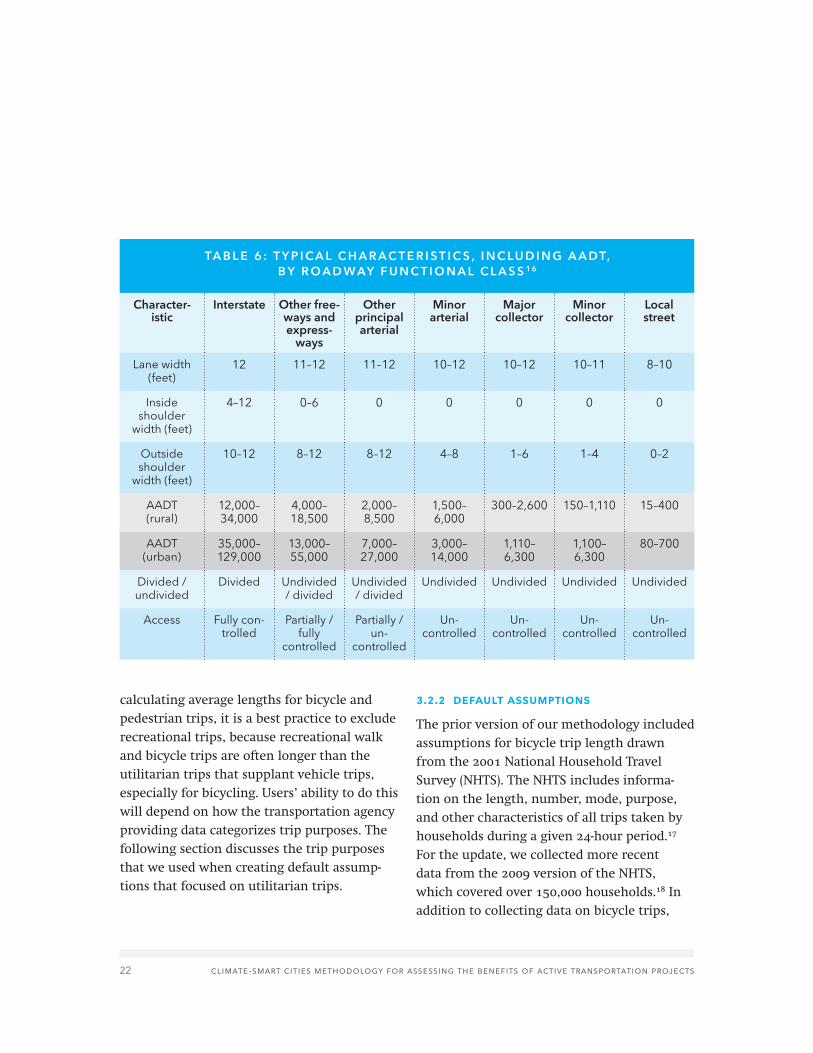
assigning aadt based on functional classification
Transportation agencies typically classify roadways into functional classifications, which represent categories of roadways with similar physical characteristics and usage levels (e.g., interstate, arterial, collector, local street). If AADT data are not available from one of the sources discussed above, Federal Highway Administration guidelines that show typical
traffic volumes for each functional classifica-tion can be used to estimate AADT, though the ranges stated by FHWA are very broad. Table 6 shows AADT ranges by functional clas-sification, along with other characteristics to assist users with determining functional classification if it is not available from local transportation agencies. Users would have to either approximate AADT using the midpoint of the range or consult with local transporta-tion staff to assign an appropriate value from within the range.
3.2 Modeling staff to collect local data, especially in cases where the user is also collecting data on inter-zonal average length of bicycle, pedestrian, and transit tripsIn order to calculate VMT reductions, the methodology multiplies the number of trips shifted to bicycling, walking, and transit by the average trip length for these modes. The preferred approach is to collect data from local transportation agencies, but the method-ology contains default assumptions based on national data that can be used when local data are not available.
3.2.1 preferred approach
Many MPOs, as well as some larger cities, conduct regional or local travel surveys in order to inform their travel models. These surveys will typically be the best source of locally specific data on transit, bicycle, and pedestrian trip lengths. Users can reach out to travel demand (see Section 3.1.2). When
1 Under 500
2 500 to 1,999
3 2,000 to 4,999
4 5,000 to 9,999
5 10,000 to 19,999
6 20,000 to 34,999
7 35,000 to 54,999
8 55,000 to 84,999
9 85,000 to 124,999
10 125,000 to 174,999
11 175,000 to 249,999
12 250,000 and more
TA B L E 5 : V O L U M E G R O U P S A N D A A DT R A N G E S U S E D I N N TA D
H P M S D ATA 1 5
Volume group AADT range
22 climate-smart cities methodology for assessing the benefits of active transportation projects
Lane width (feet)
12 11–12 11–12 10–12 10–12 10–11 8–10
Inside shoulder
width (feet)
4–12 0–6 0 0 0 0 0
Outside shoulder
width (feet)
10–12 8–12 8–12 4–8 1–6 1–4 0–2
AADT (rural)
12,000–34,000
4,000–18,500
2,000–8,500
1,500–6,000
300–2,600 150–1,110 15–400
AADT (urban)
35,000–129,000
13,000–55,000
7,000–27,000
3,000–14,000
1,110–6,300
1,100–6,300
80–700
Divided / undivided
Divided Undivided / divided
Undivided / divided
Undivided Undivided Undivided Undivided
Access Fully con-trolled
Partially / fully
controlled
Partially / un-
controlled
Un- controlled
Un- controlled
Un- controlled
Un- controlled
TA B L E 6 : T Y P I C A L C H A R A C T E R I S T I C S , I N C L U D I N G A A DT, B Y R O A D W AY F U N C T I O N A L C L A S S 1 6
Character-istic
Interstate Other free-ways and express-
ways
Other principal arterial
Minor arterial
Major collector
Minor collector
Local street
calculating average lengths for bicycle and pedestrian trips, it is a best practice to exclude recreational trips, because recreational walk and bicycle trips are often longer than the utilitarian trips that supplant vehicle trips, especially for bicycling. Users’ ability to do this will depend on how the transportation agency providing data categorizes trip purposes. The following section discusses the trip purposes that we used when creating default assump-tions that focused on utilitarian trips.
3.2.2 default assumptions
The prior version of our methodology included assumptions for bicycle trip length drawn from the 2001 National Household Travel Survey (NHTS). The NHTS includes informa-tion on the length, number, mode, purpose, and other characteristics of all trips taken by households during a given 24-hour period.17 For the update, we collected more recent data from the 2009 version of the NHTS, which covered over 150,000 households.18 In addition to collecting data on bicycle trips,

climate-smart cities methodology for assessing the benefits of active transportation projects 23
we collected data for pedestrian and transit trips, since these modes are captured in the updated methodology, and calculated aver-ages for bicycle and pedestrian trips so that they exclude recreational trips and focus on the utilitarian trips that substitute for vehicle trips.
The NHTS categorizes trip purposes as follows:
• Other home-based• Home-based shopping• Home-based work• Not home-based• Home-based social/recreational• Not ascertained
When calculating average bicycle and pedes-trian trip lengths, we only used the italicized categories in the list above. We took the average length for each of these four trip purposes, weighted by the number of trips in each category.
For transit trips, we took the average trip length for the following transit modes reported by the NHTS, weighted by the number of trips in the sample via each mode:
• Local public bus• Commuter bus• Commuter train• Subway/elevated train• Street car/trolley
We did not omit social and recreational trips when calculating transit trip lengths because while people may ride transit instead of
driving to reach social or recreational destina-tions, they typically do not ride transit in and of itself for social or recreational purposes, whereas such purely recreational trips do account for a large share of social and recre-ational bicycle and pedestrian travel.
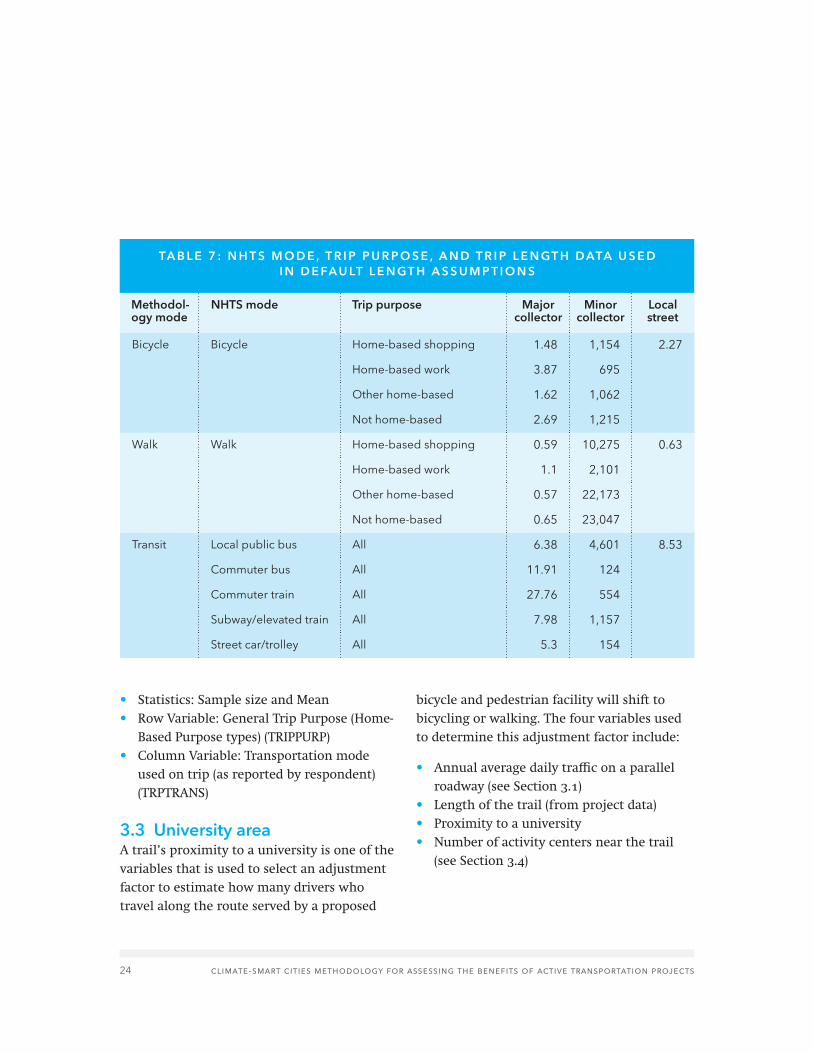
Table 7 summarizes the modes and trip purposes used in our calculations of average trip lengths.
The average length for some transit modes is much longer than others; for example, the average length of a commuter rail trip is 28 miles while the average length of a street car or trolley trip is five miles. It may be appro-priate to use the national average length for the actual transit mode that connects to the trail subject to analysis, but regional and local transportation agencies will likely have more accurate local data on transit lengths.
The NHTS is updated every five to seven years. Data from the next update will likely be avail-able in 2016 or 2017, at which point users can update the data in the spreadsheet following the same process we used to collect 2009 data for this update. We went to the NHTS’s Online Analysis Tools19 and selected Table Designer to build a custom data table. Users are required to create a log-in, free of charge, in order to access the Table Designer. We then created a table using the following settings:
• Survey: 2009• Analysis variable: Average person trip
length—Travel Day• Type of table: Two-way
24 climate-smart cities methodology for assessing the benefits of active transportation projects
• Statistics: Sample size and Mean• Row Variable: General Trip Purpose (Home-
Based Purpose types) (TRIPPURP)• Column Variable: Transportation mode
used on trip (as reported by respondent) (TRPTRANS)
3.3 University areaA trail’s proximity to a university is one of the variables that is used to select an adjustment factor to estimate how many drivers who travel along the route served by a proposed
bicycle and pedestrian facility will shift to bicycling or walking. The four variables used to determine this adjustment factor include:
• Annual average daily traffic on a parallel roadway (see Section 3.1)
• Length of the trail (from project data)• Proximity to a university• Number of activity centers near the trail
(see Section 3.4)
Bicycle Bicycle Home-based shopping 1.48 1,154 2.27
Home-based work 3.87 695
Other home-based 1.62 1,062
Not home-based 2.69 1,215
Walk Walk Home-based shopping 0.59 10,275 0.63
Home-based work 1.1 2,101
Other home-based 0.57 22,173
Not home-based 0.65 23,047
Transit Local public bus All 6.38 4,601 8.53
Commuter bus All 11.91 124
Commuter train All 27.76 554
Subway/elevated train All 7.98 1,157
Street car/trolley All 5.3 154
TA B L E 7 : N H T S M O D E , T R I P P U R P O S E , A N D T R I P L E N GT H D ATA U S E D I N D E FA U LT L E N GT H A S S U M P T I O N S
Methodol-ogy mode
NHTS mode Trip purpose Major collector
Minor collector
Local street
climate-smart cities methodology for assessing the benefits of active transportation projects 25
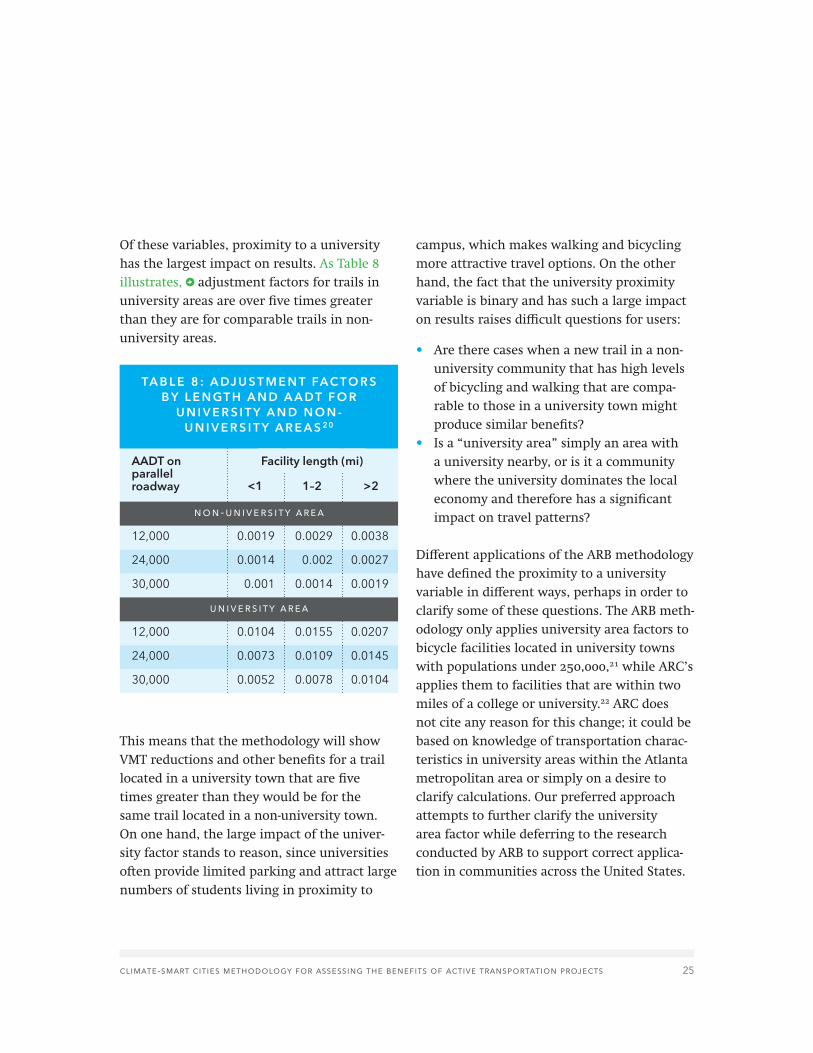
Of these variables, proximity to a university has the largest impact on results. As Table 8 illustrates, adjustment factors for trails in university areas are over five times greater than they are for comparable trails in non-university areas.
This means that the methodology will show VMT reductions and other benefits for a trail located in a university town that are five times greater than they would be for the same trail located in a non-university town. On one hand, the large impact of the univer-sity factor stands to reason, since universities often provide limited parking and attract large numbers of students living in proximity to
campus, which makes walking and bicycling more attractive travel options. On the other hand, the fact that the university proximity variable is binary and has such a large impact on results raises difficult questions for users:
• Are there cases when a new trail in a non-university community that has high levels of bicycling and walking that are compa-rable to those in a university town might produce similar benefits?
• Is a “university area” simply an area with a university nearby, or is it a community where the university dominates the local economy and therefore has a significant impact on travel patterns?
Different applications of the ARB methodology have defined the proximity to a university variable in different ways, perhaps in order to clarify some of these questions. The ARB meth-odology only applies university area factors to bicycle facilities located in university towns with populations under 250,000,21 while ARC’s applies them to facilities that are within two miles of a college or university.22 ARC does not cite any reason for this change; it could be based on knowledge of transportation charac-teristics in university areas within the Atlanta metropolitan area or simply on a desire to clarify calculations. Our preferred approach attempts to further clarify the university area factor while deferring to the research conducted by ARB to support correct applica-tion in communities across the United States.
non-university area
12,000 0.0019 0.0029 0.0038
24,000 0.0014 0.002 0.0027
30,000 0.001 0.0014 0.0019
university area
12,000 0.0104 0.0155 0.0207
24,000 0.0073 0.0109 0.0145
30,000 0.0052 0.0078 0.0104
TA B L E 8 : A DJ U S T M E N T FA C TO R S B Y L E N GT H A N D A A DT F O R
U N I V E R S I T Y A N D N O N -U N I V E R S I T Y A R E A S 2 0
1–2<1 >2
AADT on parallel roadway
Facility length (mi)
26 climate-smart cities methodology for assessing the benefits of active transportation projects
Brunswick, ME 20,278 11.9% 2.4% 14.3%
Oxford, MS 21,757 2.7% 0.9% 3.6%
Moscow, ID 24,747 3.5% 6.8% 10.3%
Ithaca, NY 30,720 41.7% 1.7% 43.4%
Claremont, CA 36,054 9.6% 1.9% 11.5%
Bozeman, MT 41,660 9.8% 5.8% 15.6%
State College, PA 42,000 35.8% 5.3% 41.1%
Charlottesville, VA 45,593 11.7% 3.5% 15.2%
Logan, UT 48,997 7.3% 4.0% 11.3%
Chapel Hill, NC 59,376 10.1% 1.7% 11.8%
Fayetteville, AR 80,621 5.5% 0.8% 6.3%
Lawrence, KS 92,763 6.0% 1.6% 7.6%
College Station, TX 103,483 5.9% 2.1% 8.0%
Cambridge, MA 109,694 23.9% 7.0% 30.9%
Ann Arbor, MI 117,770 15.0% 4.2% 19.2%
Berkeley, CA 118,853 15.4% 8.6% 24.0%
Fort Collins, CO 156,480 3.5% 6.8% 10.3%
Eugene, OR 160,561 6.9% 8.4% 15.3%
Tempe, AZ 172,816 3.8% 3.9% 7.7%
Champaign-Urbana, IL 231,891 7.8% 2.3% 10.1%
Madison, WI 245,691 9.6% 5.3% 14.9%
Average 4.6% 1.6% 6.2%
TA B L E 9 : P O P U L AT I O N A N D W A L K / B I C YC L E C O M M U T E M O D E S H A R E I N S E L E C T E D U N I V E R S I T Y TO W N S 2 3
City Population Walk commute
mode share
Bicycle com-mute mode
share
Combined walk-bike commute
mode share

climate-smart cities methodology for assessing the benefits of active transportation projects 27
3.3.1 preferred approach
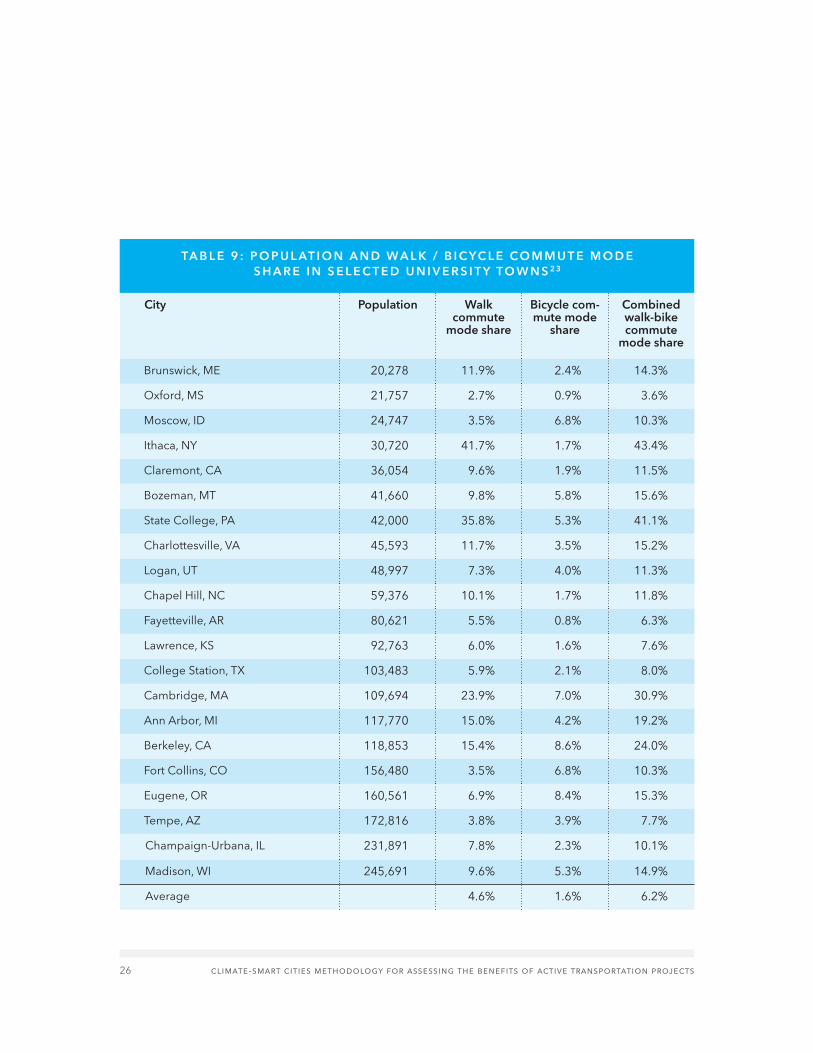
The most conservative approach is to follow the original ARB methodology and consider a project to be located in a university area only when it is located in a university town with a population under 250,000. However, it may be justifiable to apply the factor when the trail is located (a) in a community with high levels of bicycling and walking that local planners consider comparable to those in local univer-sity areas or (b) in a city or series of Census tracts with an average combined walking and bicycling mode share of 6.2 percent.
We arrived at the 6.2 percent figure by collecting data on commute mode share for 20 university towns with populations under 250,000. We defined “university towns” as cities where the university is the largest employer, or where related firms in the technology and education sector dominate the economy. Our sample of university towns varies in terms of geographic location within the United States, population, and context (i.e., some towns are located within a larger metropolitan area, whereas others are in rural areas). Table 9 summarizes mode shares for the towns included in our analysis.
This is not a comprehensive analysis, but it serves to illustrate the wide range of mode shares in university towns and to provide general guidelines on when it may be appro-priate to apply the university area factor for non-university areas. The finest scale at which commute mode share data are readily avail-able is at the Census tract level,24 so users
can determine whether an area surrounding a proposed trail has university-like levels of bicycling and walking by taking the average mode share across all Census tracts served by the trail. If the average combined walk and bike mode share is more than 6.2 percent (or, in the case of bicycle- or pedestrian-only trails, if bicycle mode share is more than 4.6 percent or walk mode share is more than 1.6 percent), it may be justifiable to apply the university area factor.
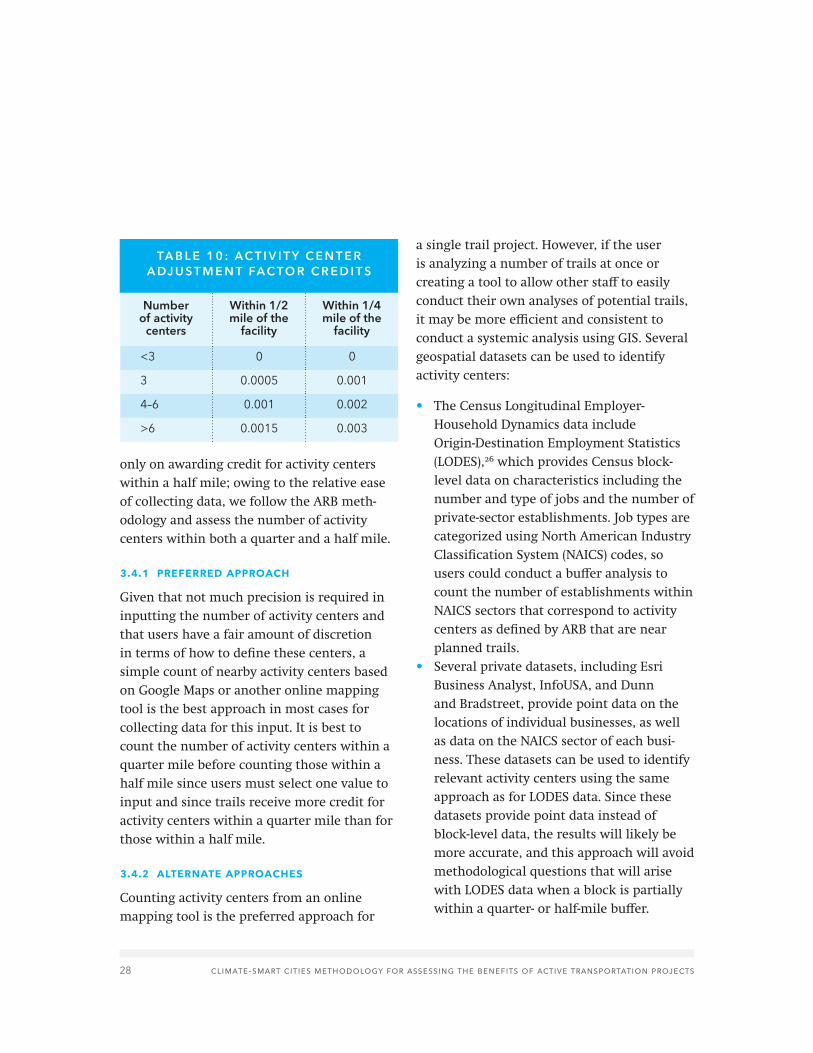
3.4 Number of activity centersOur methodology adjusts the bicycle/pedes-trian mode shift factor upward for trails that serve activity centers, since these destina-tions can help to attract a greater number of bicyclists and pedestrians. The ARB method-ology lists the following examples of activity centers: banks, churches, hospitals or health-care centers, light-rail stations, office parks, post offices, public libraries, shopping areas or grocery stores, and universities or junior colleges.25 These are examples of the types of activity centers that receive credit; other significant destinations can also be counted as an activity center. The methodology awards credit based on the number of activity centers within either a quarter or half mile, giving greater credit for those within a quarter mile. Table 10 shows adjustment factor credits.
These credits are added to the adjustment factors shown in Table 8 (Section 3.3) to calculate the total adjustment factor for each facility. Other applications of the ARB meth-odology have simplified these inputs to focus
28 climate-smart cities methodology for assessing the benefits of active transportation projects
only on awarding credit for activity centers within a half mile; owing to the relative ease of collecting data, we follow the ARB meth-odology and assess the number of activity centers within both a quarter and a half mile.
3.4.1 preferred approach
Given that not much precision is required in inputting the number of activity centers and that users have a fair amount of discretion in terms of how to define these centers, a simple count of nearby activity centers based on Google Maps or another online mapping tool is the best approach in most cases for collecting data for this input. It is best to count the number of activity centers within a quarter mile before counting those within a half mile since users must select one value to input and since trails receive more credit for activity centers within a quarter mile than for those within a half mile.
3.4.2 alternate approaches
Counting activity centers from an online mapping tool is the preferred approach for
a single trail project. However, if the user is analyzing a number of trails at once or creating a tool to allow other staff to easily conduct their own analyses of potential trails, it may be more efficient and consistent to conduct a systemic analysis using GIS. Several geospatial datasets can be used to identify activity centers:
• The Census Longitudinal Employer-Household Dynamics data include Origin-Destination Employment Statistics (LODES),26 which provides Census block-level data on characteristics including the number and type of jobs and the number of private-sector establishments. Job types are categorized using North American Industry Classification System (NAICS) codes, so users could conduct a buffer analysis to count the number of establishments within NAICS sectors that correspond to activity centers as defined by ARB that are near planned trails.
• Several private datasets, including Esri Business Analyst, InfoUSA, and Dunn and Bradstreet, provide point data on the locations of individual businesses, as well as data on the NAICS sector of each busi-ness. These datasets can be used to identify relevant activity centers using the same approach as for LODES data. Since these datasets provide point data instead of block-level data, the results will likely be more accurate, and this approach will avoid methodological questions that will arise with LODES data when a block is partially within a quarter- or half-mile buffer.
TA B L E 1 0 : A C T I V I T Y C E N T E R A DJ U S T M E N T FA C TO R C R E D I T S
<3 0 0
3 0.0005 0.001
4–6 0.001 0.002
>6 0.0015 0.003
Within 1/4 mile of the
facility
Within 1/2 mile of the
facility
Number of activity
centers

climate-smart cities methodology for assessing the benefits of active transportation projects 29
However, there may be a cost associated with purchasing data.
• Local land use or tax assessment datasets also can be used to identify parcels that host activity centers. These datasets will typically have data on parcels rather than individual establishments, so they may undercount private-sector activity centers. However, they may provide better informa-tion on public-sector activity centers (e.g., transit stations, public libraries), which may not be captured by the above datasets.
3.5 Transit-related inputs: transit access, area type, transit type, and transit ridershipIn its CMAQ Calculator, the Atlanta Regional Commission (ARC) accounts for the resulting increase in transit trips in cases where bicycle and pedestrian facilities directly serve stops or stations. This increase is calculated by multiplying the total number of boardings at the transit stations along the trail by a factor to estimate the increase in transit trips that is based on the type of area in which the trail is located and the type of transit to which it connects. Since these variables are inter-related, we discuss them all in this section. Table 11 shows the factors used to estimate the increase in transit trips in the methodology.
These factors are based on a study that exam-ined the increase in transit use for California residents that moved from conventional devel-opments to transit-oriented developments in central business districts and urban areas28
and are adjusted for other area types based on an analysis of vehicle-miles-traveled data for suburban and mountainous areas from the National Household Travel Survey.
3.5.1 preferred approach
direct access to transit
Only projects that provide access to transit receive credit for mode shift from driving to transit. The ARC methodology does not state specific criteria for determining whether a trail provides access to transit. We recom-mend a conservative approach where only trails that connect directly to transit stations receive credit. It may be justifiable to award credit for access to stations that are located within a short distance (i.e., under a quarter mile) of the trail via a high-quality bicycle or pedestrian facility (e.g., a sidewalk, path, or protected lane).
TA B L E 11 : FA C TO R S U S E D TO E S T I M AT E I N C R E A S E I N
T R A N S I T T R I P S 2 7
Central business district
2.0% 4.0%
Urban 2.0% 4.0%
Suburban 1.6% 3.2%
Difficult terrain
1.4% 2.8%
Fixed guideway
Non-fixed guideway
Area type
30 climate-smart cities methodology for assessing the benefits of active transportation projects
daily transit boardings
Data on the number of daily transit board-ings at the stations served by the trail should be collected from the transit agencies that operate these stations. In some cases, the local or regional transportation planning agencies that are the source of other input data may have data on transit boardings. There is no national data source for transit boardings at individual stations, and ridership varies too widely between transit systems to estimate boardings based on general rules of thumb. Users should sum-average daily transit board-ings for all stops and stations that are directly served (see the discussion of direct access above) by the proposed trail. If only weekday data are available, users may also need to collect factors to convert weekday boardings to average daily boardings.
area type
Area type should be inputted based on the judgment of users or of local planners. The area types used in the methodology are terms of art and are not defined by ARC. Various resources have defined density ranges for urban and suburban areas, and research may be available on the exact pitch at which walking or bicycling becomes “difficult,” but the purpose of area types is to account for the perceived ease of using a trail to connect to transit by cyclists and pedestrians, which will vary from region to region. For example, a central business district in a small college town may be more of an urban neighbor-hood by the standards of New York City, and
pedestrians and cyclists in San Francisco likely have a higher tolerance for hills than those in Omaha. User discretion is the best way to account for these contextual differences.
transit type
Users should be able to determine whether connecting transit is fixed-guideway or not based on the following definitions:
• Fixed-guideway transit operates on a dedicated right of way that includes transit-specific infrastructure, such as a rail line or a bus rapid transit route with a dedicated lane.
• Non-fixed-guideway transit operates in mixed traffic; most bus services are non-fixed-guideway.
Research consistently shows that fixed-guideway transit is a more attractive alternative to driving than non-fixed-guideway transit, which is why the increase in transit trips for fixed-guideway transit is higher.
3.6 Number of days per year that people use the facilityIf local planners report using a standard assumption for bicycling and walking days per year, it is best to use this assumption for consistency’s sake. Otherwise, we recommend a default assumption of 250 days per year. The default assumption is based on the number of working days in a typical year and is consis-tent with assumptions used by the ARC29 and MAG.30 This approach assumes that utili-tarian cyclists and pedestrians are committed

climate-smart cities methodology for assessing the benefits of active transportation projects 31
to using their mode of choice regardless of the weather. Though bicycling and walking activity does vary with the weather and the ARB methodology does direct users to consider the local climate when calculating the number of cycling and walking days per year, there is often insufficient research to quantify this variation, particularly for more committed cyclists and pedestrians. Using the default assumption of 250 days per year will help results be more consistent with other transportation analyses, which often focus on commute trips since those trips shape conges-tion patterns and are the type of trips for which the most data are typically available.
32 climate-smart cities methodology for assessing the benefits of active transportation projects
THE METHODOLOGY USES THE MAIN OUTPUTS
OF THE METHODOLOGY discussed in Section 2—reduced vehicle trips and reduced vehicle miles traveled—to estimate the following benefits of bicycle and pedestrian trails:
• Reduced greenhouse gas emissions and criteria pollutants
• Household transportation savings• Reduced mortality
We also explored the potential to quantify increased property values for homes and businesses located near a trail but found that there was not strong enough evidence to support doing so. This section discusses the data sources and calculations involved in estimating the benefits of bicycle and pedestrian facilities.
4.1 Greenhouse gas and criteria pollutant emission factorsShifting trips from driving to bicycling, walking, or transit reduces greenhouse gas (GHG) and criteria pollutant emissions. The calculations and data sources that the methodology uses to estimate emissions reductions are the same used by state and local transit agencies under federal air quality regulations. We quantify reductions in the following pollutants:
• Carbon dioxide equivalent (CO2e) (commonly used to measure GHG emissions)
• Fine particulate matter (PM2.5) • Oxides of nitrogen (NOx) • Volatile organic compounds (VOC)
The spreadsheet tool reports emission reductions in both kilograms per day (the standard metric used in CMAQ analysis) and pounds per year (commonly used by TPL in GHG analyses).
calculation
The Environmental Protection Agency (EPA) recommends calculating pollutant emissions based on both vehicle starts (each trip is assumed to involve a single start) and vehicle miles traveled (VMT) as follows:
EP = (VT x SEFP) + (VMT x REFP)
Where:
EP = Total emissions reduced for pollutant p (grams/year)
VT = Annual automobile trips reduced
SEFP = Starting emission factor for pollutant p
VMT = Annual automobile VMT reduced
REFP = Running emission factor for pollutant p
The tool then converts pollutant reductions from grams per year into the two metrics used by the tool, kilograms per day and pounds per year.
data source
We derived emission factors from the EPA’s Motor Vehicle Emission Simulator (MOVES 2014a) model,31 which estimates factors by year and vehicle type based on anticipated changes to the vehicle fleet. We collected
4 Estimating benefits
climate-smart cities methodology for assessing the benefits of active transportation projects 33
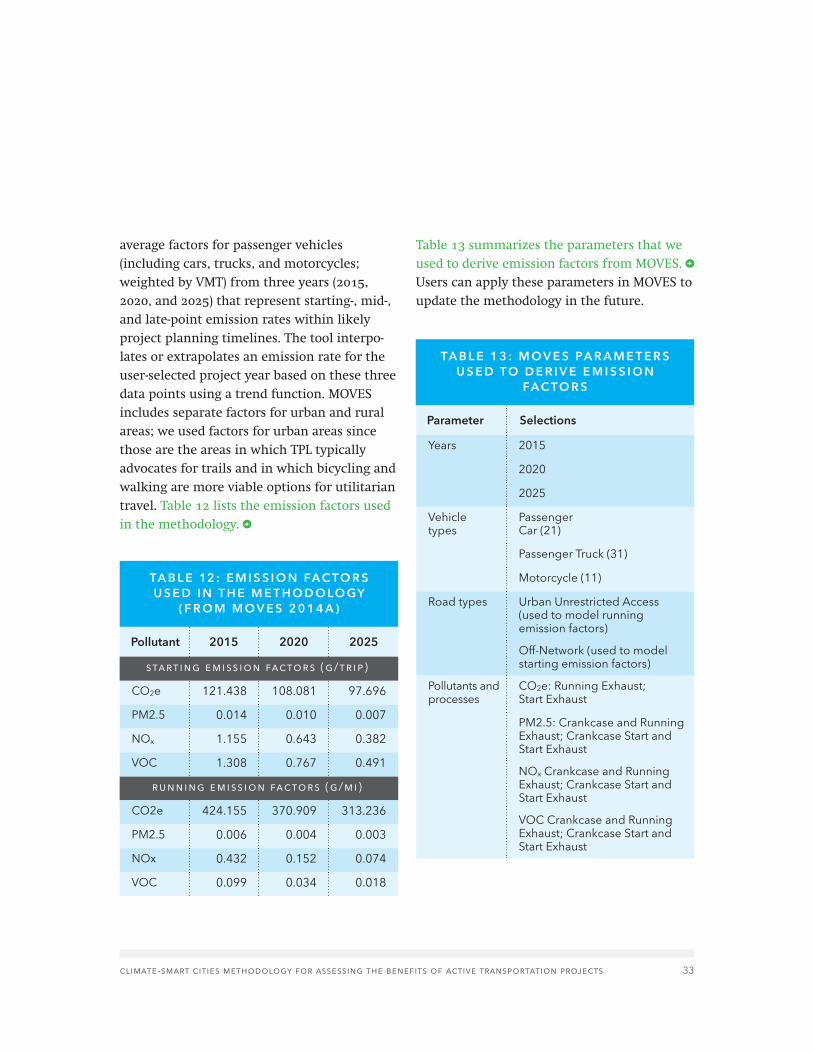
average factors for passenger vehicles (including cars, trucks, and motorcycles; weighted by VMT) from three years (2015, 2020, and 2025) that represent starting-, mid-, and late-point emission rates within likely project planning timelines. The tool interpo-lates or extrapolates an emission rate for the user-selected project year based on these three data points using a trend function. MOVES includes separate factors for urban and rural areas; we used factors for urban areas since those are the areas in which TPL typically advocates for trails and in which bicycling and walking are more viable options for utilitarian travel. Table 12 lists the emission factors used in the methodology.
Table 13 summarizes the parameters that we used to derive emission factors from MOVES. Users can apply these parameters in MOVES to update the methodology in the future.
starting emission factors (g/trip)
CO2e 121.438 108.081 97.696
PM2.5 0.014 0.010 0.007
NOx 1.155 0.643 0.382
VOC 1.308 0.767 0.491
running emission factors (g/mi)
CO2e 424.155 370.909 313.236
PM2.5 0.006 0.004 0.003
NOx 0.432 0.152 0.074
VOC 0.099 0.034 0.018
Years 2015
2020
2025
Vehicle types
Passenger Car (21)
Passenger Truck (31)
Motorcycle (11)
Road types Urban Unrestricted Access (used to model running emission factors)
Off-Network (used to model starting emission factors)
Pollutants and processes
CO2e: Running Exhaust; Start Exhaust
PM2.5: Crankcase and Running Exhaust; Crankcase Start and Start Exhaust
NOx Crankcase and Running Exhaust; Crankcase Start and Start Exhaust
VOC Crankcase and Running Exhaust; Crankcase Start and Start Exhaust
TA B L E 12 : E M I S S I O N FA C TO R S U S E D I N T H E M E T H O D O LO GY
( F R O M M O V E S 2 0 1 4 A )
TA B L E 1 3 : M O V E S PA R A M E T E R S U S E D TO D E R I V E E M I S S I O N
FA C TO R S
Pollutant
Parameter Selections
2015 2020 2025
34 climate-smart cities methodology for assessing the benefits of active transportation projects
4.2 Household transportation costsThe average U.S. household spends $9,073 a year, roughly 14 percent of its income, on transportation, making transportation the second-largest household expense after housing.32 People can save money on vehicle operating costs, which include fuel and main-tenance, with each mile that they walk or bike instead of driving. Over the long term, people who regularly travel by foot or bike can save even more money on vehicle ownership costs by shedding a car. The methodology quantifies total savings on fuel, maintenance, and vehicle depreciation by multiplying VMT reductions by the Internal Revenue Service (IRS) Standard Mileage Rate, which is commonly used by government agencies and private companies to reimburse employees and contractors for work-related driving.
calculation
The methodology quantifies household trans-portation cost savings as follows:
H = VMT x I
Where:
H = Reduced household transportation costs per year ($2014)
VMT = Total annual auto VMT reduced, all modes
I = Mileage rate ($2014/mile)
The tool estimates transportation cost savings
on a per-household basis by dividing total costs by the number of users. The number of users is calculated by dividing the total reduction in vehicle trips due to bicycling and walking by twice the number of bicycling and walking days per year. This assumes that regular trail users make one round trip per user per day and that there is one regular trail user per household.
data source
The IRS Standard Mileage Rate for 2014, which is the most recent year for which data are available, is $0.575 per mile.33 The IRS publishes new Standard Mileage Rates each year, so the household cost factor can be updated annually. Although the IRS rate captures some vehicle ownership costs in its estimate of depreciation, there is not a reliable method to capture some of the more complex long-term relationships between how much households drive and how many vehicles they own. Regular bicyclists and pedestrians can save a substantial amount of money by shed-ding a car, but there is currently not enough information to quantify reduced ownership costs apart from those related to depreciation.
4.3 Mortality Shifting miles traveled from automobiles to biking or walking can have multiple health benefits. Air pollutants from conventional cars increase the risk of multiple diseases, including asthma and chronic obstructive pulmonary disease, and reducing the amount of vehicles driving in an area can reduce exposure to these pollutants.34 In addition,
climate-smart cities methodology for assessing the benefits of active transportation projects 35
increased physical activity can have numerous public health benefits, including reducing the incidence of heart disease, depression, obesity, and hypertension.35 Although the health benefits of encouraging biking and walking are clear, quantifying the impacts is not straightforward: assessing the health benefits of improving local air quality requires complex dispersion modeling, there is very little consistency in terms of the metrics and methods used to quantify the health benefits of active transportation, and very few studies quantify the health benefits of trails or other infrastructure, focusing instead on the health benefits of a given type of behavior (e.g., active commuting). Our methodology quantifies the number of deaths reduced per year, as well as the monetary value of avoided deaths, using the methodology developed by the World Health Organization (WHO) for its Health Economic Assessment Tool (HEAT) tool.36
calculations
The primary input that HEAT uses to calculate public health benefits is minutes of physically active travel per week per user. We calculate this value for bicyclists and pedestrians based on other variables included in the method-ology as follows:
TX = VMTX / UX x W / SX x 60
Where:
TX = Minutes per week of travel by mode x (bicycling or walking)
VMTX = Annual VMT reduced due to mode x
UX = Number of trail users who travel by mode x, estimated as the total reduction in vehicle trips due to mode x divided by twice the number of bicycling and walking days per year. This assumes that regular trail users make one round trip per user per day.
W = Number of weeks per year
SX = Average speed by mode x (mph)
The methodology then estimates the reduction in deaths due to both bicycling and walking based on the relative mortality risk reduction due to active transportation. WHO reviewed research to identify the average relative risk reduction associated with a reference volume of bicycling and walking; the methodology prorates this value by comparing the minutes per week of active transportation due to the trail to the reference volume. HEAT assumes that the risk reduction scales linearly to the amount biking or walking occurring (up to a maximum risk reduction of 45% for biking and 30% for walking). The methodology multiplies the risk reduction by the national mortality rate and number of users to calculate the total reduction in fatalities as follows:
FX = (1 - RRX) x (TX / VX) x MR / 100,000 x UX
Where:
FX = Reduction in fatalities per year due to new trips by mode x (bicycling or walking)
RRX = Relative mortality risk associated with the reference volume for mode x
36 climate-smart cities methodology for assessing the benefits of active transportation projects
TX = Minutes per week of travel by mode x
VX = Reference volume for mode x (min/week)
MRX = Mortality rate (deaths/100,000 people)
UX = Number of trail users who travel by mode x, estimated as the total reduction in vehicle trips due to mode x divided by twice the number of bicycling and walking days per year. This assumes that regular trail users make one round trip per user per day.
The methodology then multiplies the total avoided deaths due to both bicycling and walking by the value of a statistical life to calculate the monetary value of avoided deaths:
ZX = YX x VSL
Where:
ZX = Value of benefits by mode x ($2014)
FX = Reduction in deaths per year due to new trips by mode x
VSL = Value of a statistical life ($2014)
data sources
We base our calculations of the mortality benefits of bicycling and walking on the WHO HEAT methodology.37 In addition to HEAT, we reviewed the Integrated Transport and Health Impact Model (ITHIM), which was developed by the Centre for Diet and Activity Research in the United Kingdom and adapted by the California Department of Public Health to
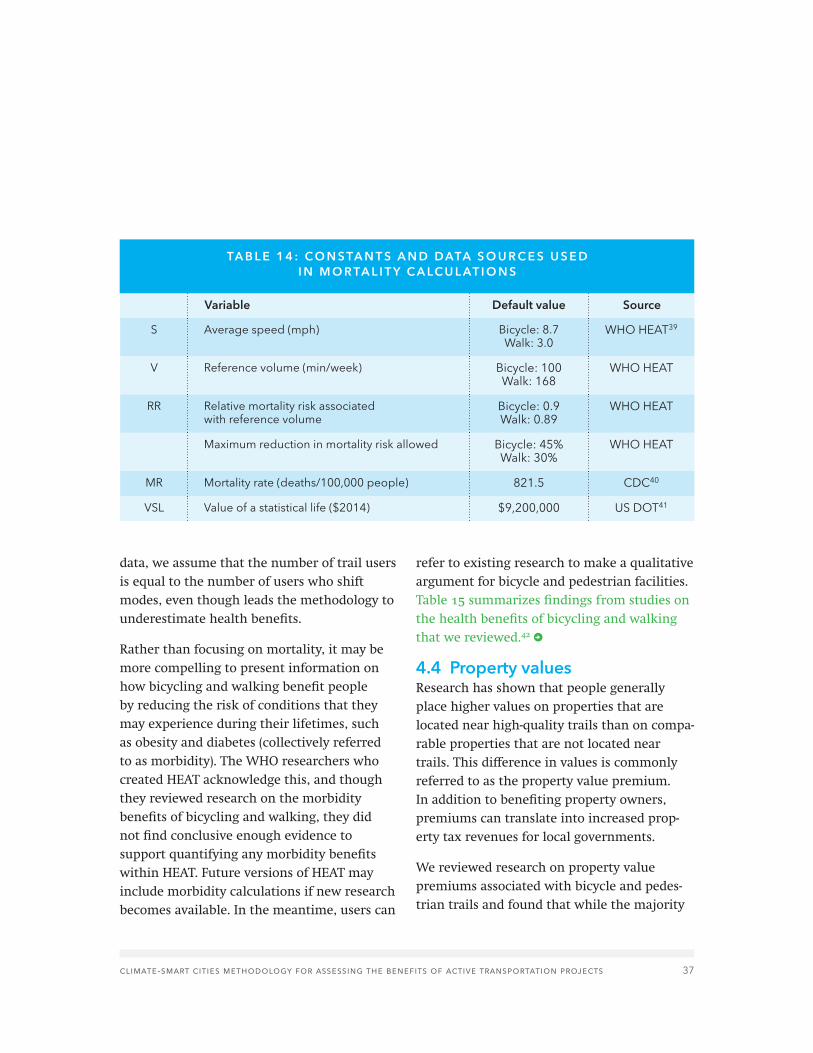
quantify the health impacts associated with various active transportation scenarios and policies in terms of metrics such as years of life lost and disability-adjusted life years.38 ITHIM provides richer health data than HEAT but is much more data-intensive, so we opted to use the HEAT methodology, which can be more readily applied with the data that are typically available to users. HEAT was devel-oped for use in Europe, so we adapted it for the United States by collecting national data for some parameters. Table 14 summarizes the constants used in mortality calculations and their sources.
limitations
Applying the HEAT methodology within the context of the methodology developed by ARB to assess mode shift likely underestimates the health benefits of trails. When analyzing the impacts of trails on travel behavior, the ARB methodology focuses on estimating the subset of trail users who shift from driving to utilitarian bicycling, walking, or transit use because pollution reduction and other benefits depend on mode shift. However, anyone who bicycles or walks on a trail experiences health benefits regardless of whether they are using the trail for utilitarian purposes or just for recreation. There are methodologies that can be used to estimate the total number of bicyclists and pedestrians who will use a trail, but they draw on different data and do not produce comparable results to the ARB meth-odology. In order to maximize consistency and minimize the level of effort for users to collect
climate-smart cities methodology for assessing the benefits of active transportation projects 37
S Average speed (mph) Bicycle: 8.7Walk: 3.0
WHO HEAT39
V Reference volume (min/week) Bicycle: 100Walk: 168
WHO HEAT
RR Relative mortality risk associated with reference volume
Bicycle: 0.9Walk: 0.89
WHO HEAT
Maximum reduction in mortality risk allowed Bicycle: 45%Walk: 30%
WHO HEAT
MR Mortality rate (deaths/100,000 people) 821.5 CDC40
VSL Value of a statistical life ($2014) $9,200,000 US DOT41
TA B L E 1 4 : C O N S TA N T S A N D D ATA S O U R C E S U S E D I N M O R TA L I T Y C A LC U L AT I O N S
Variable Default value Source
data, we assume that the number of trail users is equal to the number of users who shift modes, even though leads the methodology to underestimate health benefits.
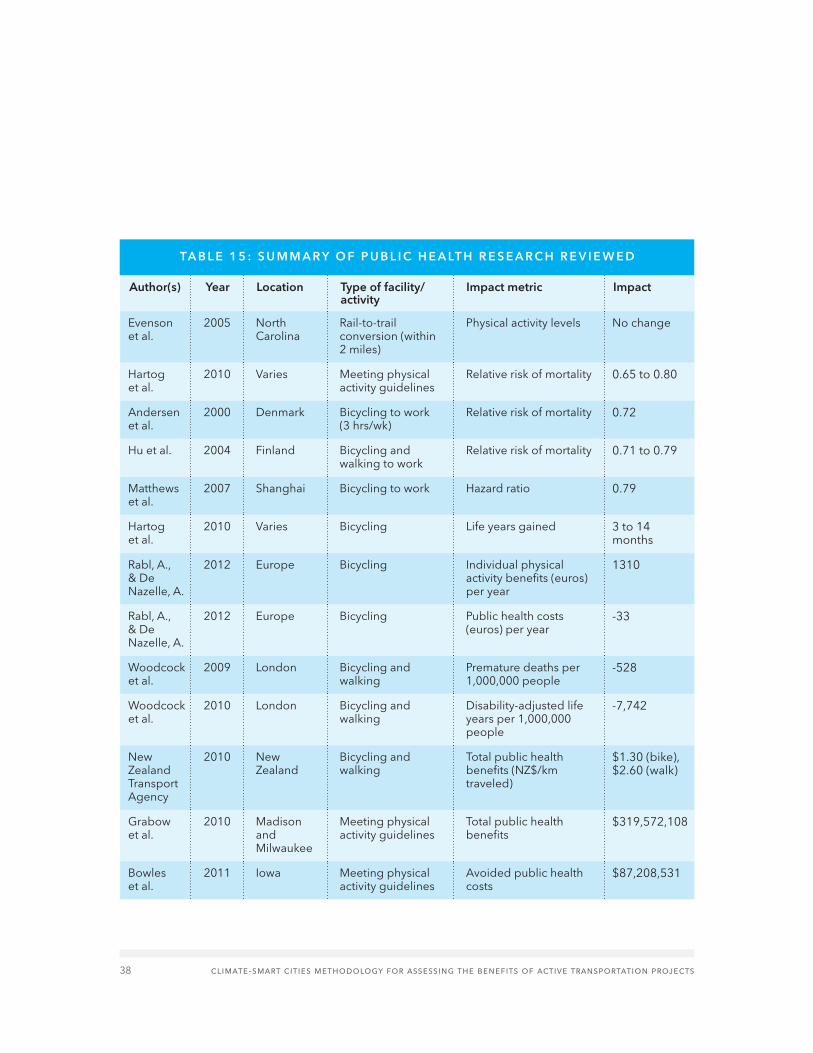
Rather than focusing on mortality, it may be more compelling to present information on how bicycling and walking benefit people by reducing the risk of conditions that they may experience during their lifetimes, such as obesity and diabetes (collectively referred to as morbidity). The WHO researchers who created HEAT acknowledge this, and though they reviewed research on the morbidity benefits of bicycling and walking, they did not find conclusive enough evidence to support quantifying any morbidity benefits within HEAT. Future versions of HEAT may include morbidity calculations if new research becomes available. In the meantime, users can
refer to existing research to make a qualitative argument for bicycle and pedestrian facilities. Table 15 summarizes findings from studies on the health benefits of bicycling and walking that we reviewed.42
4.4 Property valuesResearch has shown that people generally place higher values on properties that are located near high-quality trails than on compa-rable properties that are not located near trails. This difference in values is commonly referred to as the property value premium. In addition to benefiting property owners, premiums can translate into increased prop-erty tax revenues for local governments.
We reviewed research on property value premiums associated with bicycle and pedes-trian trails and found that while the majority
38 climate-smart cities methodology for assessing the benefits of active transportation projects
Evenson et al.
2005 North Carolina
Rail-to-trail conversion (within 2 miles)
Physical activity levels No change
Hartog et al.
2010 Varies Meeting physical activity guidelines
Relative risk of mortality 0.65 to 0.80
Andersen et al.
2000 Denmark Bicycling to work (3 hrs/wk)
Relative risk of mortality 0.72
Hu et al. 2004 Finland Bicycling and walking to work
Relative risk of mortality 0.71 to 0.79
Matthews et al.
2007 Shanghai Bicycling to work Hazard ratio 0.79
Hartog et al.
2010 Varies Bicycling Life years gained 3 to 14 months
Rabl, A., & De Nazelle, A.
2012 Europe Bicycling Individual physical activity benefits (euros) per year
1310
Rabl, A., & De Nazelle, A.
2012 Europe Bicycling Public health costs (euros) per year
-33
Woodcock et al.
2009 London Bicycling and walking
Premature deaths per 1,000,000 people
-528
Woodcock et al.
2010 London Bicycling and walking
Disability-adjusted life years per 1,000,000 people
-7,742
New Zealand Transport Agency
2010 New Zealand
Bicycling and walking
Total public health benefits (NZ$/km traveled)
$1.30 (bike), $2.60 (walk)
Grabow et al.
2010 Madison and Milwaukee
Meeting physical activity guidelines
Total public health benefits
$319,572,108
Bowles et al.
2011 Iowa Meeting physical activity guidelines
Avoided public health costs
$87,208,531
TA B L E 1 5 : S U M M A R Y O F P U B L I C H E A LT H R E S E A R C H R E V I E W E D
Author(s) Year Location Type of facility/activity
Impact metric Impact

climate-smart cities methodology for assessing the benefits of active transportation projects 39
of studies indicate that proximity to a path or trail increases property values, some studies have found no impact and others have found negative results. The studies reviewed focus on a variety of facility types, including greenbelts or dedicated paths and trails. Greenbelts may not be a good point of comparison for TPL projects because they include more open space in addition to trails. Because of the wide range of findings and the lack of consistency among facilities studied, we cannot conclusively quan-tify the property value benefits of trails.
Table 16 summarizes the relevant research we reviewed, including the location, type of facility assessed, distance from the facility within which property values were assessed, impact metric (either property value premium or property tax increase), and impact found.
Pucher et al.
2010 National U.S. study
Active commuting Physical activity rates, obesity rates, and causality
Confirms benefits
Brownson et al.
2004 Rural Missouri
Trail users % of users who increase physical activity
32.1%
Brownson et al.
2000 Rural Missouri
Trail users % of users who increase walking
55.1%
NYC Dept. of Health
2009 New York City
Walking or bicycling for routine neighborhood trips
% of active transportation users who report good health vs. nonactive-transportation users
83% vs. 70%
NYC Dept. of Health
2010 New York City
Walking or bicycling for routine neighborhood trips
% of active transportation users who report emotional health vs. nonactive-transportation users
10% vs. 14%
Author(s) Year Location Type of facility/activity
Impact metric Impact
TA B L E 1 5 : S U M M A R Y O F P U B L I C H E A LT H R E S E A R C H R E V I E W E D
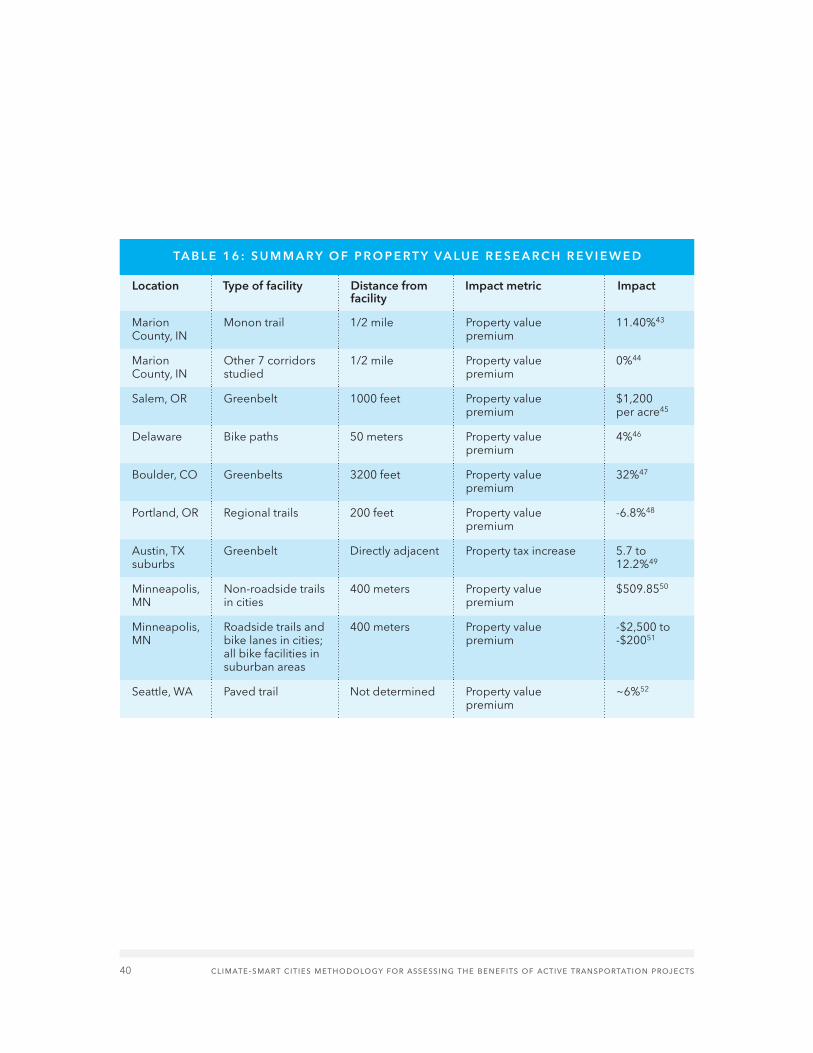
40 climate-smart cities methodology for assessing the benefits of active transportation projects
Marion County, IN
Monon trail 1/2 mile Property value premium
11.40%43
Marion County, IN
Other 7 corridors studied
1/2 mile Property value premium
0%44
Salem, OR Greenbelt 1000 feet Property value premium
$1,200 per acre45
Delaware Bike paths 50 meters Property value premium
4%46
Boulder, CO Greenbelts 3200 feet Property value premium
32%47
Portland, OR Regional trails 200 feet Property value premium
-6.8%48
Austin, TX suburbs
Greenbelt Directly adjacent Property tax increase 5.7 to 12.2%49
Minneapolis, MN
Non-roadside trails in cities
400 meters Property value premium
$509.8550
Minneapolis, MN
Roadside trails and bike lanes in cities; all bike facilities in suburban areas
400 meters Property value premium
-$2,500 to -$20051
Seattle, WA Paved trail Not determined Property value premium
~6%52
Location Type of facility Distance from facility
Impact metric Impact
TA B L E 1 6 : S U M M A R Y O F P R O P E R T Y VA L U E R E S E A R C H R E V I E W E D

climate-smart cities methodology for assessing the benefits of active transportation projects 41
BICYCLE AND PEDESTRIAN TRAILS CAN MAKE IT
SAFER, more convenient, and more pleasant for people to bike and walk instead of driving. By building networks of high-quality trails, cities can reduce greenhouse gas emissions, provide opportunities for exercise, and save residents money, and connecting people to destinations via trails is a key strategy in TPL’s Climate-Smart Cities Initiative. The methodology described in this report and the accompanying spreadsheet tool can be used to quantify the following benefits of bicycle and pedestrian trails:
• Reduced greenhouse gas emissions• Reduced air pollution• Household transportation savings• Reduced mortality
The benefits of trails are by no means limited to those that can be quantified based on the evidence available. Research has shown that high-quality bicycle and pedestrian facilities can boost businesses at the retail districts they serve, increase nearby property values, lengthen users’ lives, and reduce health care costs. As more cities build trails and researchers continue to study bicycling and walking, it seems likely that the evidence in favor of better connecting our cities will only continue to mount.
5 Conclusion
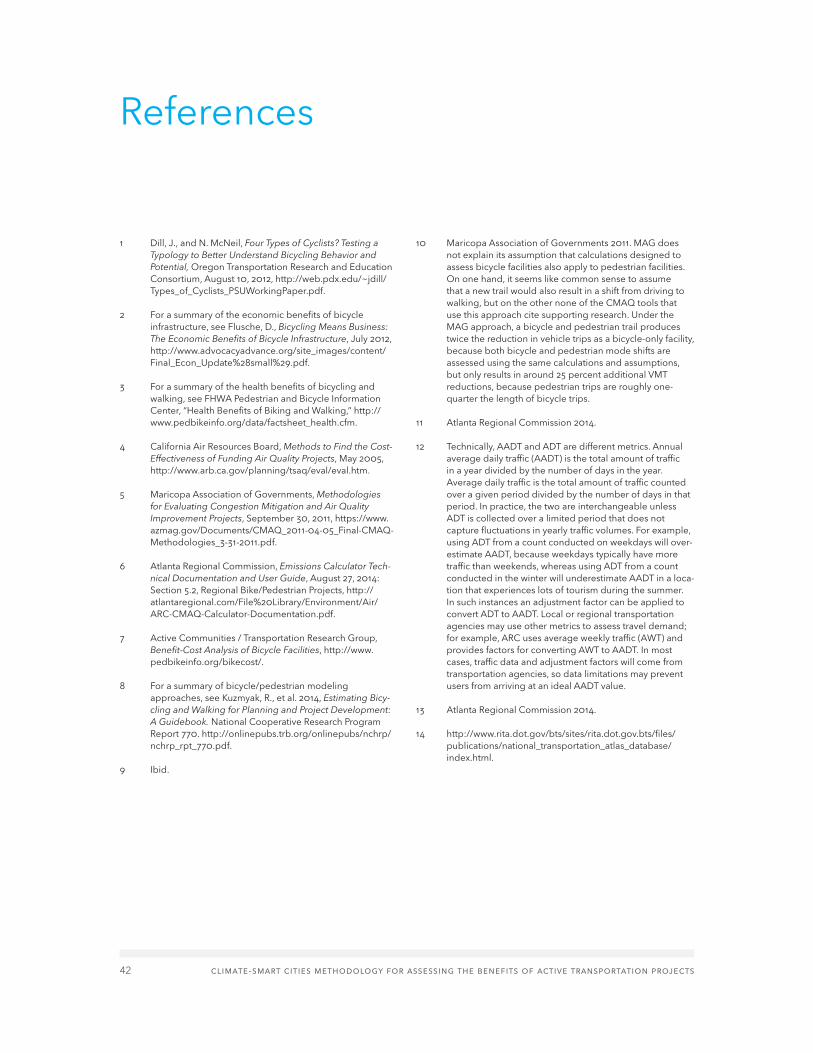
42 climate-smart cities methodology for assessing the benefits of active transportation projects
References
1 Dill, J., and N. McNeil, Four Types of Cyclists? Testing a Typology to Better Understand Bicycling Behavior and Potential, Oregon Transportation Research and Education Consortium, August 10, 2012, http://web.pdx.edu/~jdill/Types_of_Cyclists_PSUWorkingPaper.pdf.
2 For a summary of the economic benefits of bicycle infrastructure, see Flusche, D., Bicycling Means Business: The Economic Benefits of Bicycle Infrastructure, July 2012, http://www.advocacyadvance.org/site_images/content/Final_Econ_Update%28small%29.pdf.
3 For a summary of the health benefits of bicycling and walking, see FHWA Pedestrian and Bicycle Information Center, “Health Benefits of Biking and Walking,” http://www.pedbikeinfo.org/data/factsheet_health.cfm.
4 California Air Resources Board, Methods to Find the Cost-Effectiveness of Funding Air Quality Projects, May 2005, http://www.arb.ca.gov/planning/tsaq/eval/eval.htm.
5 Maricopa Association of Governments, Methodologies for Evaluating Congestion Mitigation and Air Quality Improvement Projects, September 30, 2011, https://www.azmag.gov/Documents/CMAQ_2011-04-05_Final-CMAQ-Methodologies_3-31-2011.pdf.
6 Atlanta Regional Commission, Emissions Calculator Tech-nical Documentation and User Guide, August 27, 2014: Section 5.2, Regional Bike/Pedestrian Projects, http://atlantaregional.com/File%20Library/Environment/Air/ARC-CMAQ-Calculator-Documentation.pdf.
7 Active Communities / Transportation Research Group, Benefit-Cost Analysis of Bicycle Facilities, http://www.pedbikeinfo.org/bikecost/.
8 For a summary of bicycle/pedestrian modeling approaches, see Kuzmyak, R., et al. 2014, Estimating Bicy-cling and Walking for Planning and Project Development: A Guidebook. National Cooperative Research Program Report 770. http://onlinepubs.trb.org/onlinepubs/nchrp/nchrp_rpt_770.pdf.
9 Ibid.
10 Maricopa Association of Governments 2011. MAG does not explain its assumption that calculations designed to assess bicycle facilities also apply to pedestrian facilities. On one hand, it seems like common sense to assume that a new trail would also result in a shift from driving to walking, but on the other none of the CMAQ tools that use this approach cite supporting research. Under the MAG approach, a bicycle and pedestrian trail produces twice the reduction in vehicle trips as a bicycle-only facility, because both bicycle and pedestrian mode shifts are assessed using the same calculations and assumptions, but only results in around 25 percent additional VMT reductions, because pedestrian trips are roughly one-quarter the length of bicycle trips.
11 Atlanta Regional Commission 2014.
12 Technically, AADT and ADT are different metrics. Annual average daily traffic (AADT) is the total amount of traffic in a year divided by the number of days in the year. Average daily traffic is the total amount of traffic counted over a given period divided by the number of days in that period. In practice, the two are interchangeable unless ADT is collected over a limited period that does not capture fluctuations in yearly traffic volumes. For example, using ADT from a count conducted on weekdays will over-estimate AADT, because weekdays typically have more traffic than weekends, whereas using ADT from a count conducted in the winter will underestimate AADT in a loca-tion that experiences lots of tourism during the summer. In such instances an adjustment factor can be applied to convert ADT to AADT. Local or regional transportation agencies may use other metrics to assess travel demand; for example, ARC uses average weekly traffic (AWT) and provides factors for converting AWT to AADT. In most cases, traffic data and adjustment factors will come from transportation agencies, so data limitations may prevent users from arriving at an ideal AADT value.
13 Atlanta Regional Commission 2014.
14 http://www.rita.dot.gov/bts/sites/rita.dot.gov.bts/files/publications/national_transportation_atlas_database/index.html.

climate-smart cities methodology for assessing the benefits of active transportation projects 43
15 Federal Highway Administration Office of Highway Policy Information, Highway Performance Monitoring System (HPMS) Chapter 6, Sampling: Table 6.1, Volume Group / AADT Ranges, March 2014, http://www.fhwa.dot.gov/policyinformation/hpms/fieldmanual/chapter6.cfm#chapt6_6_3.
16 Federal Highway Administration Office of Planning, Environment, and Realty, Highway Functional Classification Concepts, Criteria, and Procedures, Section 3: Criteria: Table 3-5: VMT and Mileage Guidelines by Functional Classifications – Arterials and Table 3-6: VMT and Mileage Guidelines by Functional Classifications - Collectors and Locals, December 2013, http://www.fhwa.dot.gov/ planning/processes/statewide/related/highway_ functional_classifications/section03.cfm.
17 Federal Highway Administration, 2009 National House-hold Travel Survey User’s Guide Version 2, October 2011, http://nhts.ornl.gov/2009/pub/UsersGuideV2.pdf.
18 Ibid.
19 http://nhts.ornl.gov/tools.shtml.
20 California Air Resources Board 2005. Adjustment factors are derived from the 1992 FHWA National Biking and Walking Study and from research conducted by the Bay Area Air Quality Management District. Though the source data are dated, these factors are still widely used.
21 California Air Resources Board 2005.
22 Atlanta Regional Commission 2014.
23 Mode share data are from the 2013 5-year American Community Survey Estimates, Table S0801: Commute Characteristics by Sex, and are available from American FactFinder, http://factfinder.census.gov/. Population data are from 2014 Census population estimates and are avail-able from Census QuickFacts (http://quickfacts.census.gov/qfd/index.html.
24 Data can be obtained from American FactFinder, http://factfinder.census.gov/.
25 California Air Resources Board 2005.
26 http://lehd.ces.census.gov/data/.
27 Atlanta Regional Commission 2014, p. 5-4.
28 Lund, H., R. Cervero, and R. Willson, Travel Characteristics of Transit-Oriented Development in California, January 2014, https://www.bart.gov/sites/default/files/docs/Travel_of_TOD.pdf.
29 Atlanta Regional Commission 2014.
30 Maricopa Association of Governments 2011.
31 http://www3.epa.gov/otaq/models/moves/.
32 Bureau of Labor Statistics, Consumer Expenditures – 2014, September 3, 2015, http://www.bls.gov/news.release/cesan.nr0.htm.
33 Standard Mileage Rates, Internal Revenue Service, http://www.irs.gov/Tax-Professionals/Standard-Mileage-Rates.
34 See American Lung Association website: http://www.lung.org/healthy-air/outdoor/protecting-your-health/impacts-on-your-health/.
35 See FHWA Pedestrian and Bicycle Information Center, “Health Benefits of Biking and Walking,” http://www.pedbikeinfo.org/data/factsheet_health.cfm.
36 http://www.heatwalkingcycling.org/.
37 World Health Organization, Health Economic Assess-ment Tools (HEAT) for Walking and for Cycling, Methodology and User Guide, 2014 Update, http://www.euro.who.int/__data/assets/pdf_file/0010/256168/ECONOMIC-ASSESSMENT-OF-TRANSPORT- INFRASTRUCTURE-AND-POLICIES.pdf?ua=1.
38 http://www.cedar.iph.cam.ac.uk/research/modelling/ithim/.
39 World Health Organization 2014.
40 CDC National Vital Statistics Report (NVSR) Deaths: Final Data for 2013. Mortality rate accessed through the National Center for Health Statistics (NCHS) FastStats. See http://www.cdc.gov/nchs/fastats/deaths.htm.
41 United States Department of Transportation, Guidance on Treatment of the Economic Value of a Statistical Life. See https://www.transporta-tion.gov/office-policy/transportation-policy/guidance-treatment-economic-value-statistical-life.
44 climate-smart cities methodology for assessing the benefits of active transportation projects
42 For a summary of the health benefits of bicycling and walking, see FHWA Pedestrian and Bicycle Information Center, “Health Benefits of Biking and Walking,” http://www.pedbikeinfo.org/data/factsheet_health.cfm.
43 Lindsey et al., “Property Values, Recreation Values, and Urban Greenways,” Journal of Park and Recreation Admin-istration 22(3) (2004): 69-90. http://staff.washington.edu/kwolf/Archive/Classes/ESRM304_SocSci/304%20Soc%20Sci%20Lab%20Articles/Lindsey_2004.pdf.
44 Ibid.
45 Brabec, E., On the Value of Open Spaces, 1992; cited in Lindsey et al. 2004.
46 Racca, D. P., and Dhanju, A., Property Value/desirability Effects of Bike Paths Adjacent to Residential Areas, Center for Applied Demography & Survey Research, 2006, http://dspace.udel.edu/handle/19716/13246.
47 Correll, Lillydahl, and Singell, The Effects of Greenbelts on Residential Property Values: Some Findings on the Political Economy of Open Space, 1978, http://www.jstor.org/stable/3146234?seq=1#page_scan_tab_contents.
48 Netusil, N., The Effect of Environmental Zoning and Amenities on Property Values, City of Portland Bureau of Planning, 2003; cited in Racca and Dhanju 2006.
49 Nicholls, S., and J. Crompton, “The Impact of Green-ways and Trails on Property Values: Evidence from Austin, Texas,” Journal of Leisure Research 37(3) (2005): 321-341, http://www.franklin-gov.com/home/showdocument?id=2590.
50 Krizek, K., “Two Approaches to Valuing Some of Bicycle Facilities’ Presumed Benefits,” Journal of the American Planning Association 72(3) (Summer 2006): 309-319, http://kevinjkrizek.org/wp-content/uploads/2012/04/ Two-approaches-valuing-bike.pdf.
51 Ibid.
52 Zarker, G., et al., Evaluation of the Burke-Gilman Trail’s Effect on Property Values and Crime, Seattle Office for Planning, May 1987, http://atfiles.org/files/pdf/ BurkeGilmanStudy.pdf.


The Trust for Public Land
101 Montgomery St., Suite 900
San Francisco, CA 94104
415.495.4014
photos: front, darcy kiefel;
back, kyle lanzer
tpl.org
Related Documents