2021 Climate Scenario Report Accelerating the future of energy, together

Welcome message from author
This document is posted to help you gain knowledge. Please leave a comment to let me know what you think about it! Share it to your friends and learn new things together.
Transcript

2021
Climate Scenario Report
Accelerating the future of energy, together

2 | © 2021 THE AES CORPORATION
Legal disclaimer
This report was prepared in March 2021, and the results are based on specific assumptions and estimates made in the context of the scenarios modeled in the report. Given the inherent uncertainty in predicting and modeling future conditions, caution should be exercised when interpreting the information provided. The results are not indicative of, and this report does not represent, a preferred or expected outcome of the future.
The scenarios modeled in this report are largely derived from assumptions contained in the International Energy Agency’s (IEA) 2020 World Energy Outlook (WEO) and the Representative Concentration Pathways (RCPs) established by the Intergovernmental Panel on Climate Change’s (IPCC) Fifth Assessment Report (AR5). These scenarios should not be mistaken for forecasts or predictions. Accordingly, there can be no assurance that the scenario modeling or assessments presented in this report are a reliable indicator of the actual impact of climate change on AES’ portfolio or businesses.
This report contains forward-looking statements within the meaning of the Securities Act of 1933 and of the Securities Exchange Act of 1934. Such forward-looking statements include, but are not limited to, those related to future energy demand, future power prices, the availability and cost of natural gas, the growth of solar and other renewable forms of electricity generation and energy storage, future carbon taxes or regulations, potential rates of reduction in coal-fired electricity generation, the expected operating life of existing coal-fired electricity generation plants, the level of energy efficiency investments, the impact of demand-side management and AES’ corporate strategy. Forward-looking statements are not intended to be a guarantee of future results, but instead constitute AES’ current expectations based on reasonable assumptions, or, as
noted in the report, expectations provided by third parties such as the IEA. These assumptions include, but are not limited to, continued normal levels of operating performance and electricity volume at our distribution companies and operational performance at our generation businesses consistent with historical levels, as well as achievements of planned productivity improvements and execution of AES’ corporate strategy.
Actual results could differ materially from those projected in our forward-looking statements due to risks, uncertainties and other factors. Important factors that could affect actual results are discussed in AES’ filings with the Securities and Exchange Commission (SEC), including, but not limited to, the risks discussed under Item 1A “Risk Factors” and Item 7 “Management’s Discussion & Analysis” in AES’ 2020 Annual Report on Form 10-K and in subsequent reports filed with the SEC. Readers are encouraged to read AES’ filings to learn more about the risk factors associated with AES’ business. AES undertakes no obligation to update or revise any forward-looking statements, whether as a result of new information, future events or otherwise. Material contained on our website is not part of and is not incorporated by reference in this report.
Any Stockholder who desires a copy of the Company’s 2020 Annual Report on Form 10-K filed on February 25, 2021 with the SEC may obtain a copy (excluding Exhibits) without charge by addressing a request to the Office of the Corporate Secretary, The AES Corporation, 4300 Wilson Boulevard, Arlington, Virginia 22203. Exhibits also may be requested, but a charge equal to the reproduction cost thereof will be made. A copy of the Form 10-K may also be obtained by visiting the Company’s website at www.aes.com.
© 2021 THE AES CORPORATION | 3
Table of contents
A letter from the CEO 4
Executive summary 5
Governance at AES: an integrated risk and strategy approach
22
Our purpose and solutions for the future 9
Stress testing our portfolio 24
The strength of our portfolio 32
TCFD index 38
Conclusion 37
4 | © 2021 THE AES CORPORATION
A letter from the CEO
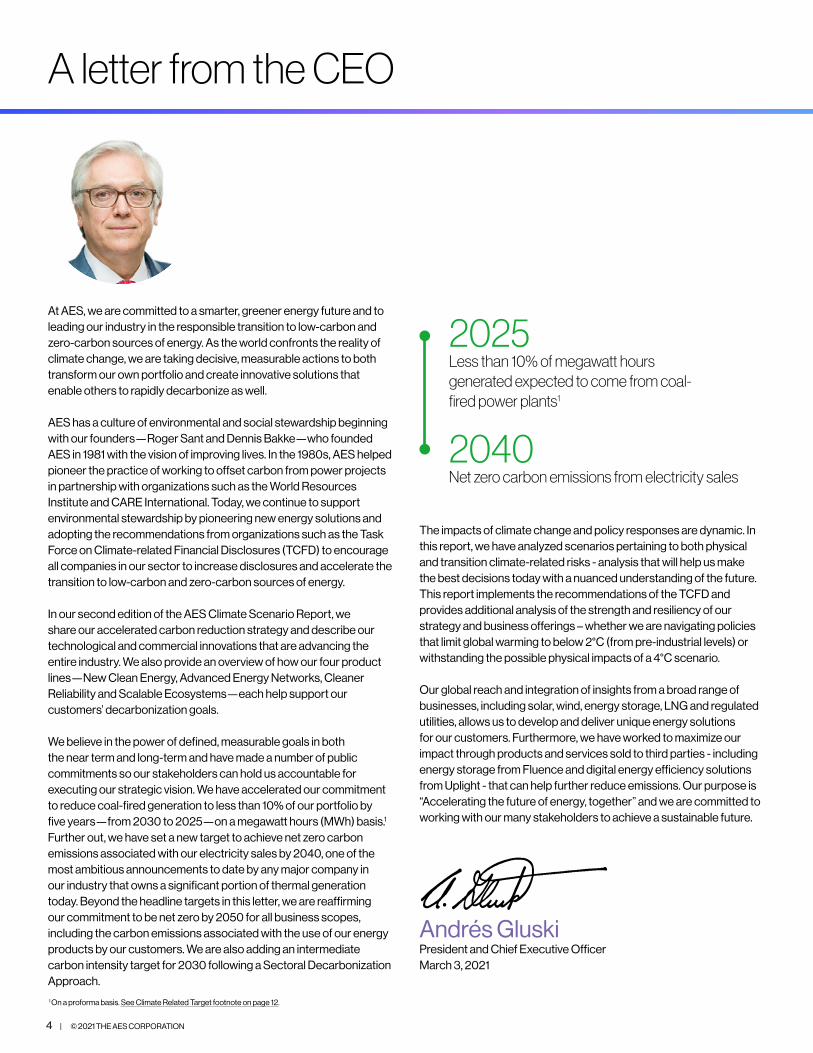
At AES, we are committed to a smarter, greener energy future and to leading our industry in the responsible transition to low-carbon and zero-carbon sources of energy. As the world confronts the reality of climate change, we are taking decisive, measurable actions to both transform our own portfolio and create innovative solutions that enable others to rapidly decarbonize as well.
AES has a culture of environmental and social stewardship beginning with our founders—Roger Sant and Dennis Bakke—who founded AES in 1981 with the vision of improving lives. In the 1980s, AES helped pioneer the practice of working to offset carbon from power projects in partnership with organizations such as the World Resources Institute and CARE International. Today, we continue to support environmental stewardship by pioneering new energy solutions and adopting the recommendations from organizations such as the Task Force on Climate-related Financial Disclosures (TCFD) to encourage all companies in our sector to increase disclosures and accelerate the transition to low-carbon and zero-carbon sources of energy.
In our second edition of the AES Climate Scenario Report, we share our accelerated carbon reduction strategy and describe our technological and commercial innovations that are advancing the entire industry. We also provide an overview of how our four product lines—New Clean Energy, Advanced Energy Networks, Cleaner Reliability and Scalable Ecosystems—each help support our customers’ decarbonization goals.
We believe in the power of defined, measurable goals in both the near term and long-term and have made a number of public commitments so our stakeholders can hold us accountable for executing our strategic vision. We have accelerated our commitment to reduce coal-fired generation to less than 10% of our portfolio by five years—from 2030 to 2025—on a megawatt hours (MWh) basis.1 Further out, we have set a new target to achieve net zero carbon emissions associated with our electricity sales by 2040, one of the most ambitious announcements to date by any major company in our industry that owns a significant portion of thermal generation today. Beyond the headline targets in this letter, we are reaffirming our commitment to be net zero by 2050 for all business scopes, including the carbon emissions associated with the use of our energy products by our customers. We are also adding an intermediate carbon intensity target for 2030 following a Sectoral Decarbonization Approach.
The impacts of climate change and policy responses are dynamic. In this report, we have analyzed scenarios pertaining to both physical and transition climate-related risks - analysis that will help us make the best decisions today with a nuanced understanding of the future. This report implements the recommendations of the TCFD and provides additional analysis of the strength and resiliency of our strategy and business offerings – whether we are navigating policies that limit global warming to below 2°C (from pre-industrial levels) or withstanding the possible physical impacts of a 4°C scenario.
Our global reach and integration of insights from a broad range of businesses, including solar, wind, energy storage, LNG and regulated utilities, allows us to develop and deliver unique energy solutions for our customers. Furthermore, we have worked to maximize our impact through products and services sold to third parties - including energy storage from Fluence and digital energy efficiency solutions from Uplight - that can help further reduce emissions. Our purpose is “Accelerating the future of energy, together” and we are committed to working with our many stakeholders to achieve a sustainable future.
Andrés Gluski President and Chief Executive Officer March 3, 2021
Less than 10% of megawatt hours generated expected to come from coal-fired power plants1
2025
Net zero carbon emissions from electricity sales2040
1 On a proforma basis. See Climate Related Target footnote on page 12.

© 2021 THE AES CORPORATION | 5
Executive summary
In 2018, AES was the first publicly-traded US utility and power company to publish a report in line with the recommendations of the Task Force on Climate-related Financial Disclosures (TCFD) and third-party scenarios. The 2018 report described the resilience of our strategy under a range of scenarios, including simulating the impact of carbon policies that align to the Paris Climate Agreement in order to limit global temperature rise to 1.5 - 2°C.
Our 2021 Climate Scenario Report updates our analysis of climate risk, leveraging refreshed scenarios published by the International Energy Agency (IEA) and the United Nations’ Intergovernmental Panel on Climate Change (IPCC). Additionally, we have enhanced our physical climate risk analysis by including a detailed assessment of the potential risk from extreme weather events on our portfolio of generation, transmission and distribution assets.
In addition to analyzing the impact of climate change risks and opportunities on our portfolio, this report addresses the specific steps that AES is taking to reduce our exposure to climate risks and articulates how our corporate strategy and product lines are positioned to lead and accelerate decarbonization of the electric sector overall.
For additional disclosures, see our Sustainability Resources webpage.
Our strategy and solutions for the futureAES’ corporate strategy and vision for the future is based on the fundamental premise that there is a need for the power sector to transition to low-carbon and carbon-free sources of generation. Our strategy, which is set at the highest level of management and approved by the Board of Directors, is focused on both growing our four product lines and selling or retiring much of our coal-fired generation fleet. Our product lines are each positioned to be an integral solution to accelerate the global transition to less carbon-intensive sources of energy.
Our strategy is reinforced by the expectations of our stakeholders, customer demand for low-carbon energy solutions, feedback from investors and a focus on integrating sustainability into everything we do.
Our four product lines are all supported by a focus on innovation, both technological and commercial. AES was one of the original pioneers of energy storage—starting over 14 years ago—and we continue to lead the market to incorporate new technologies and applications that benefit our customers and, in many cases, the entire electricity grid. Our focus on innovation gives us a competitive advantage and allows us to maximize our impact by leading the entire sector in finding new sustainable solutions.
Finally, our strategy is backed by short and long-term measurable goals and a clear path for how to get there, informed by our vision for a decarbonized energy future of the entire sector. We envision a future energy system that has been massively electrified, with extraordinary increases in renewable generation and widespread use of synthetic fuels.
As the world seeks to mitigate climate change,
our customers are looking to decarbonize their
energy supply. A key tenant of our strategy is
a rapid and widespread buildout of renewable
capacity that not only helps lower the carbon
intensity of the electricity grid, but also
proactively helps our customers achieve their
ambitious sustainability targets.
We expect demand for smart, energy-efficient
solutions and strategies to drive an expansion of
our businesses leading to new ways to support
customers through digital solutions, and an
increase in rate-based investments for our
regulated businesses.
New Clean Energy
Advanced Energy Networks
The transition to a low-carbon economy
requires stable and resilient electricity grids.
We are adapting our generation fleet in ways
that support customers, and electricity markets
more broadly, on this journey.
To meet the challenge of the energy transition, the best innovations need to be available to all
stakeholders, not just a few companies. This business portfolio provides technology pillars for the energy
transition in energy storage, demand-side efficiency and demand management and solar deployment to
AES businesses and our industry peers.
Cleaner Reliability
Scalable Ecosystems
Fluence deals awarded: 1.7 GW
Progress since our 2018 report
Sold or retired: 6.2 GW of coal2
Signed power purchase agreements: 5.8 gigawatts (GW)
2 Based on announced asset sales or retirements.
Our four product lines
6 | © 2021 THE AES CORPORATION
Executive summary
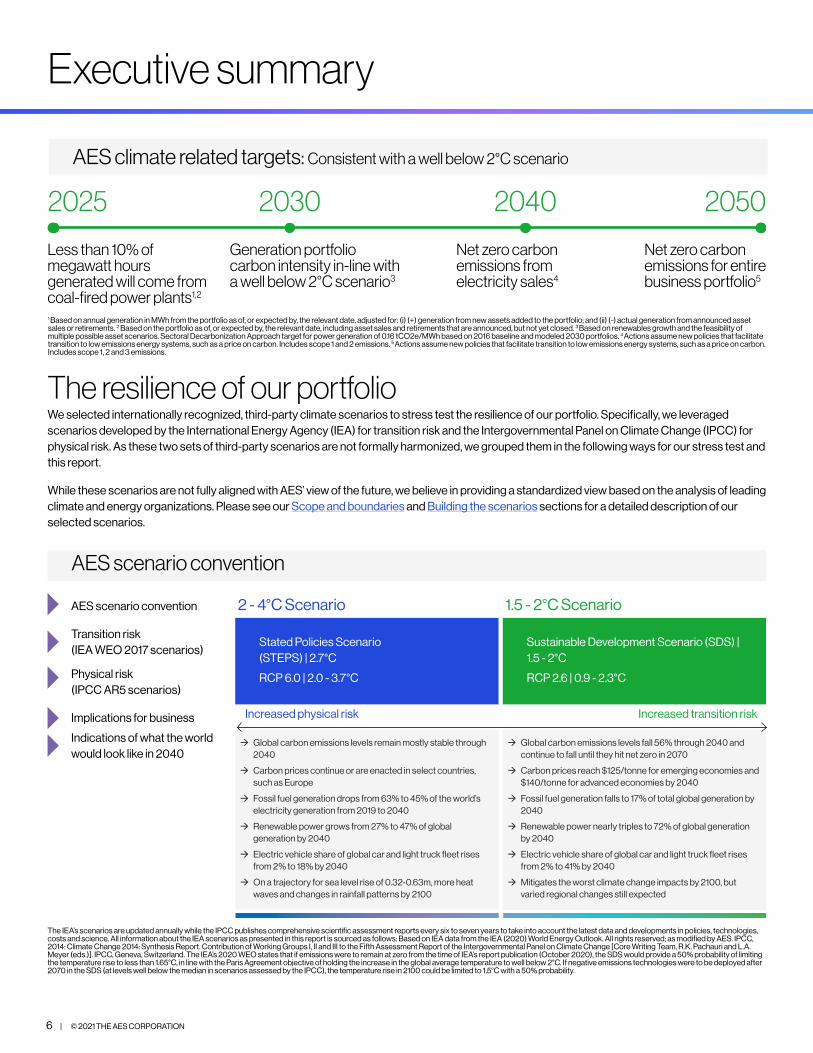
The resilience of our portfolio We selected internationally recognized, third-party climate scenarios to stress test the resilience of our portfolio. Specifically, we leveraged scenarios developed by the International Energy Agency (IEA) for transition risk and the Intergovernmental Panel on Climate Change (IPCC) for physical risk. As these two sets of third-party scenarios are not formally harmonized, we grouped them in the following ways for our stress test and this report.
While these scenarios are not fully aligned with AES’ view of the future, we believe in providing a standardized view based on the analysis of leading climate and energy organizations. Please see our Scope and boundaries and Building the scenarios sections for a detailed description of our selected scenarios.
Sustainable Development Scenario (SDS) | 1.5 - 2°C
RCP 2.6 | 0.9 - 2.3°C
Stated Policies Scenario (STEPS) | 2.7°C
RCP 6.0 | 2.0 - 3.7°C
AES scenario convention
Æ Global carbon emissions levels remain mostly stable through 2040
Æ Carbon prices continue or are enacted in select countries, such as Europe
Æ Fossil fuel generation drops from 63% to 45% of the world’s electricity generation from 2019 to 2040
Æ Renewable power grows from 27% to 47% of global generation by 2040
Æ Electric vehicle share of global car and light truck fleet rises from 2% to 18% by 2040
Æ On a trajectory for sea level rise of 0.32-0.63m, more heat waves and changes in rainfall patterns by 2100
Æ Global carbon emissions levels fall 56% through 2040 and continue to fall until they hit net zero in 2070
Æ Carbon prices reach $125/tonne for emerging economies and $140/tonne for advanced economies by 2040
Æ Fossil fuel generation falls to 17% of total global generation by 2040
Æ Renewable power nearly triples to 72% of global generation by 2040
Æ Electric vehicle share of global car and light truck fleet rises from 2% to 41% by 2040
Æ Mitigates the worst climate change impacts by 2100, but varied regional changes still expected
2 - 4°C Scenario 1.5 - 2°C Scenario
Transition risk (IEA WEO 2017 scenarios)
Physical risk(IPCC AR5 scenarios)
Indications of what the world would look like in 2040
AES scenario convention
Implications for business Increased physical risk Increased transition risk
The IEA’s scenarios are updated annually while the IPCC publishes comprehensive scientific assessment reports every six to seven years to take into account the latest data and developments in policies, technologies, costs and science. All information about the IEA scenarios as presented in this report is sourced as follows: Based on IEA data from the IEA (2020) World Energy Outlook. All rights reserved; as modified by AES. IPCC, 2014: Climate Change 2014: Synthesis Report. Contribution of Working Groups I, II and III to the Fifth Assessment Report of the Intergovernmental Panel on Climate Change [Core Writing Team, R.K. Pachauri and L.A. Meyer (eds.)]. IPCC, Geneva, Switzerland. The IEA’s 2020 WEO states that if emissions were to remain at zero from the time of IEA’s report publication (October 2020), the SDS would provide a 50% probability of limiting the temperature rise to less than 1.65°C, in line with the Paris Agreement objective of holding the increase in the global average temperature to well below 2°C. If negative emissions technologies were to be deployed after 2070 in the SDS (at levels well below the median in scenarios assessed by the IPCC), the temperature rise in 2100 could be limited to 1.5°C with a 50% probability.
Less than 10% of megawatt hours generated will come from coal-fired power plants1,2
2025 2030 20502040
Generation portfolio carbon intensity in-line with a well below 2°C scenario3
Net zero carbon emissions from electricity sales4
Net zero carbon emissions for entire business portfolio5
1 Based on annual generation in MWh from the portfolio as of, or expected by, the relevant date, adjusted for: (i) (+) generation from new assets added to the portfolio; and (ii) (-) actual generation from announced asset sales or retirements. 2 Based on the portfolio as of, or expected by, the relevant date, including asset sales and retirements that are announced, but not yet closed. 3 Based on renewables growth and the feasibility of multiple possible asset scenarios. Sectoral Decarbonization Approach target for power generation of 0.16 tCO2e/MWh based on 2016 baseline and modeled 2030 portfolios. 4 Actions assume new policies that facilitate transition to low emissions energy systems, such as a price on carbon. Includes scope 1 and 2 emissions. 5 Actions assume new policies that facilitate transition to low emissions energy systems, such as a price on carbon. Includes scope 1, 2 and 3 emissions.
AES climate related targets: Consistent with a well below 2°C scenario
© 2021 THE AES CORPORATION | 7
Executive summary
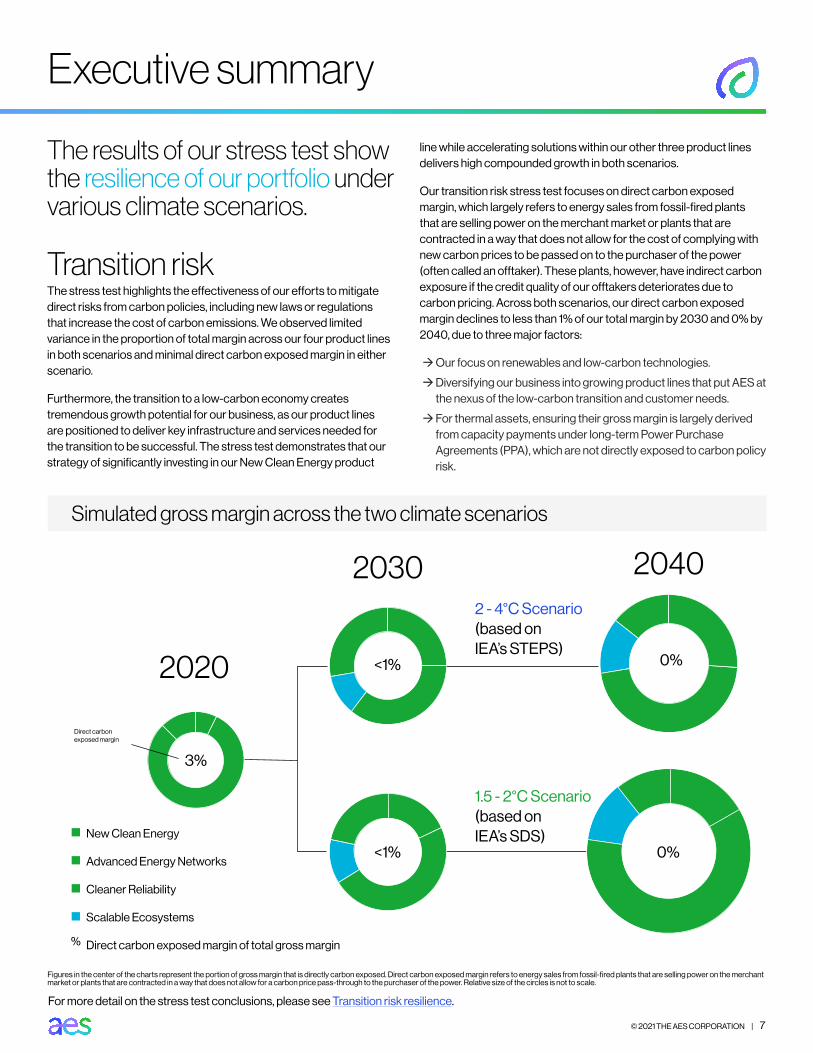
The results of our stress test show the resilience of our portfolio under various climate scenarios.
Transition riskThe stress test highlights the effectiveness of our efforts to mitigate direct risks from carbon policies, including new laws or regulations that increase the cost of carbon emissions. We observed limited variance in the proportion of total margin across our four product lines in both scenarios and minimal direct carbon exposed margin in either scenario.
Furthermore, the transition to a low-carbon economy creates tremendous growth potential for our business, as our product lines are positioned to deliver key infrastructure and services needed for the transition to be successful. The stress test demonstrates that our strategy of significantly investing in our New Clean Energy product
line while accelerating solutions within our other three product lines delivers high compounded growth in both scenarios.
Our transition risk stress test focuses on direct carbon exposed margin, which largely refers to energy sales from fossil-fired plants that are selling power on the merchant market or plants that are contracted in a way that does not allow for the cost of complying with new carbon prices to be passed on to the purchaser of the power (often called an offtaker). These plants, however, have indirect carbon exposure if the credit quality of our offtakers deteriorates due to carbon pricing. Across both scenarios, our direct carbon exposed margin declines to less than 1% of our total margin by 2030 and 0% by 2040, due to three major factors:
ÆOur focus on renewables and low-carbon technologies.
ÆDiversifying our business into growing product lines that put AES at the nexus of the low-carbon transition and customer needs.
ÆFor thermal assets, ensuring their gross margin is largely derived from capacity payments under long-term Power Purchase Agreements (PPA), which are not directly exposed to carbon policy risk.
Figures in the center of the charts represent the portion of gross margin that is directly carbon exposed. Direct carbon exposed margin refers to energy sales from fossil-fired plants that are selling power on the merchant market or plants that are contracted in a way that does not allow for a carbon price pass-through to the purchaser of the power. Relative size of the circles is not to scale.
Simulated gross margin across the two climate scenarios
New Clean Energy
Advanced Energy Networks
Cleaner Reliability
Scalable Ecosystems
Direct carbon exposed margin of total gross margin%
2020
2030 20402 - 4°C Scenario (based on IEA’s STEPS)
1.5 - 2°C Scenario (based on IEA’s SDS)
3%
<1% 0%
<1% 0%
Direct carbon exposed margin
For more detail on the stress test conclusions, please see Transition risk resilience.
8 | © 2021 THE AES CORPORATION
Executive summary
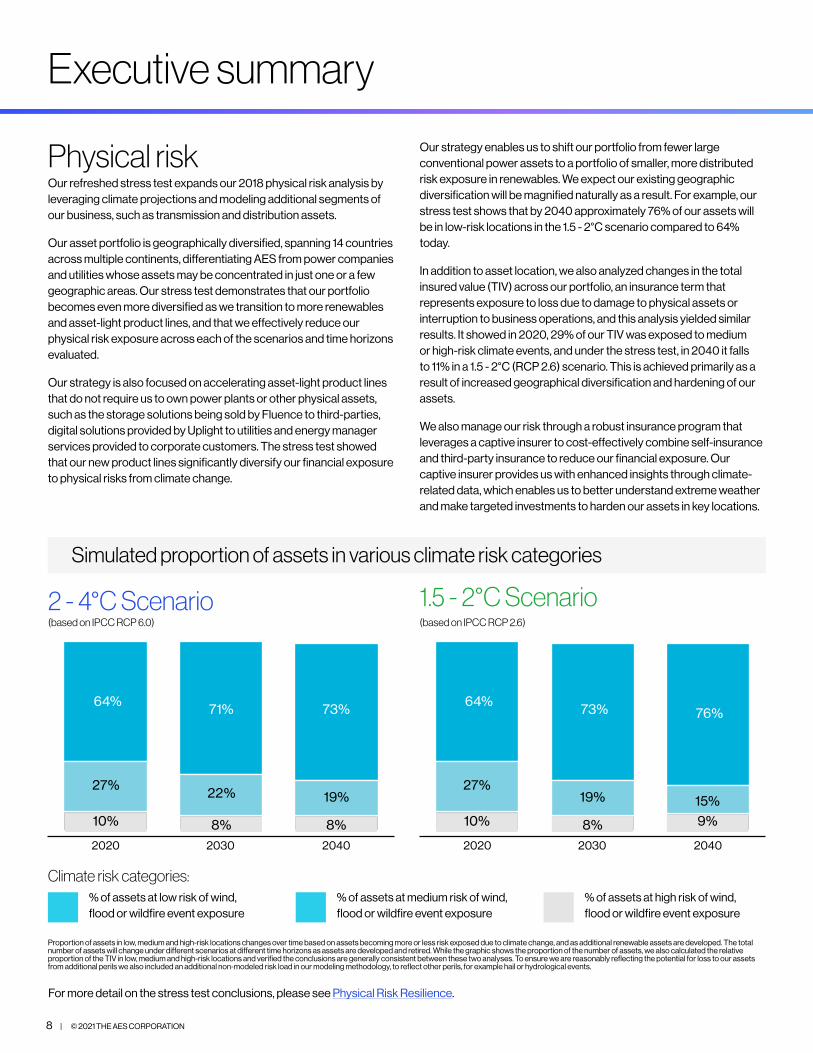
Physical riskOur refreshed stress test expands our 2018 physical risk analysis by leveraging climate projections and modeling additional segments of our business, such as transmission and distribution assets.
Our asset portfolio is geographically diversified, spanning 14 countries across multiple continents, differentiating AES from power companies and utilities whose assets may be concentrated in just one or a few geographic areas. Our stress test demonstrates that our portfolio becomes even more diversified as we transition to more renewables and asset-light product lines, and that we effectively reduce our physical risk exposure across each of the scenarios and time horizons evaluated.
Our strategy is also focused on accelerating asset-light product lines that do not require us to own power plants or other physical assets, such as the storage solutions being sold by Fluence to third-parties, digital solutions provided by Uplight to utilities and energy manager services provided to corporate customers. The stress test showed that our new product lines significantly diversify our financial exposure to physical risks from climate change.
Our strategy enables us to shift our portfolio from fewer large conventional power assets to a portfolio of smaller, more distributed risk exposure in renewables. We expect our existing geographic diversification will be magnified naturally as a result. For example, our stress test shows that by 2040 approximately 76% of our assets will be in low-risk locations in the 1.5 - 2°C scenario compared to 64% today.
In addition to asset location, we also analyzed changes in the total insured value (TIV) across our portfolio, an insurance term that represents exposure to loss due to damage to physical assets or interruption to business operations, and this analysis yielded similar results. It showed in 2020, 29% of our TIV was exposed to medium or high-risk climate events, and under the stress test, in 2040 it falls to 11% in a 1.5 - 2°C (RCP 2.6) scenario. This is achieved primarily as a result of increased geographical diversification and hardening of our assets.
We also manage our risk through a robust insurance program that leverages a captive insurer to cost-effectively combine self-insurance and third-party insurance to reduce our financial exposure. Our captive insurer provides us with enhanced insights through climate-related data, which enables us to better understand extreme weather and make targeted investments to harden our assets in key locations.
% of assets at low risk of wind, flood or wildfire event exposure
% of assets at medium risk of wind, flood or wildfire event exposure
% of assets at high risk of wind, flood or wildfire event exposure
Simulated proportion of assets in various climate risk categories
Climate risk categories:
Proportion of assets in low, medium and high-risk locations changes over time based on assets becoming more or less risk exposed due to climate change, and as additional renewable assets are developed. The total number of assets will change under different scenarios at different time horizons as assets are developed and retired. While the graphic shows the proportion of the number of assets, we also calculated the relative proportion of the TIV in low, medium and high-risk locations and verified the conclusions are generally consistent between these two analyses. To ensure we are reasonably reflecting the potential for loss to our assets from additional perils we also included an additional non-modeled risk load in our modeling methodology, to reflect other perils, for example hail or hydrological events.
For more detail on the stress test conclusions, please see Physical Risk Resilience.
64% 73% 76%
27%19% 15%
64% 71% 73%
10% 8% 8%2020 2030 2040
2 - 4°C Scenario (based on IPCC RCP 6.0)
27% 22% 19%
10% 8% 9%
2020 2030 2040
1.5 - 2°C Scenario(based on IPCC RCP 2.6)

© 2021 THE AES CORPORATION | 9
Our purpose and solutions for the future
Accelerating the future of energy, together
Working with our stakeholders, we’re improving lives by delivering greener, smarter energy solutions the world needs.
Customers no longer think of energy as a matter of supply and demand, but rather as a space for innovation and partnership. With this transformation comes a responsibility to work with a smarter approach, with new thinking informed by experience and with stronger collaboration between established providers and new entrants, old systems and new technologies.
At AES, we know that every customer, community and country is at a unique place on their path to sustainability. We are working with our stakeholders to strategically transition to the future while delivering the greener, smarter energy solutions the world needs. Combining our expertise in renewable energy, energy storage, power generation,
LNG and smart, energy efficient grid platforms, we have led the sector in solutions that benefit not just our direct customers, but the entire grid. Our solutions include battery storage, the delivery of cleaner fuels and commercial innovations such as our Green Blend offering that allows customers to systematically replace energy consumption from coal with lower cost renewables over time.
The successful application of our solutions is helping drive change beyond the electricity sector in many of the world’s largest sources of carbon emissions - commercial buildings, manufacturing, mining and data center and infrastructure - to create a carbon-free energy future for everyone.
Our four product lines
New Clean Energy
Advanced Energy Networks
Cleaner Reliability
Scalable Ecosystems
10 | © 2021 THE AES CORPORATION
Our purpose and solutions for the future
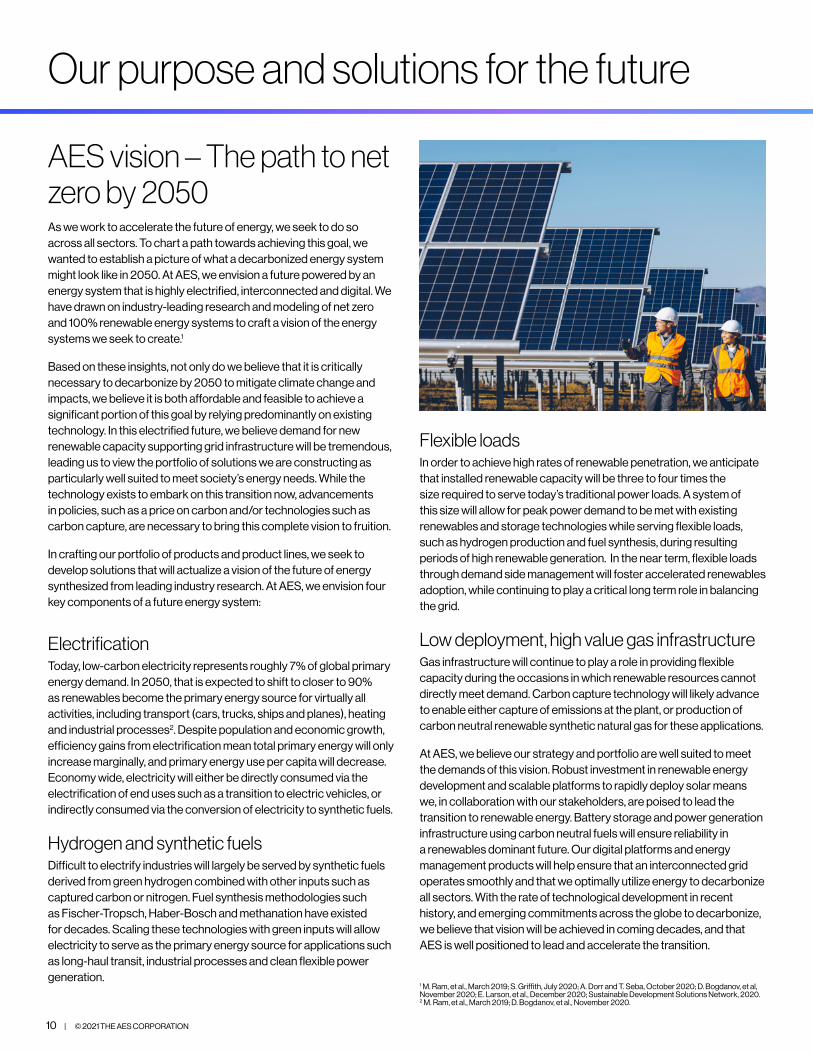
AES vision – The path to net zero by 2050 As we work to accelerate the future of energy, we seek to do so across all sectors. To chart a path towards achieving this goal, we wanted to establish a picture of what a decarbonized energy system might look like in 2050. At AES, we envision a future powered by an energy system that is highly electrified, interconnected and digital. We have drawn on industry-leading research and modeling of net zero and 100% renewable energy systems to craft a vision of the energy systems we seek to create.1
Based on these insights, not only do we believe that it is critically necessary to decarbonize by 2050 to mitigate climate change and impacts, we believe it is both affordable and feasible to achieve a significant portion of this goal by relying predominantly on existing technology. In this electrified future, we believe demand for new renewable capacity supporting grid infrastructure will be tremendous, leading us to view the portfolio of solutions we are constructing as particularly well suited to meet society’s energy needs. While the technology exists to embark on this transition now, advancements in policies, such as a price on carbon and/or technologies such as carbon capture, are necessary to bring this complete vision to fruition.
In crafting our portfolio of products and product lines, we seek to develop solutions that will actualize a vision of the future of energy synthesized from leading industry research. At AES, we envision four key components of a future energy system:
ElectrificationToday, low-carbon electricity represents roughly 7% of global primary energy demand. In 2050, that is expected to shift to closer to 90% as renewables become the primary energy source for virtually all activities, including transport (cars, trucks, ships and planes), heating and industrial processes2. Despite population and economic growth, efficiency gains from electrification mean total primary energy will only increase marginally, and primary energy use per capita will decrease. Economy wide, electricity will either be directly consumed via the electrification of end uses such as a transition to electric vehicles, or indirectly consumed via the conversion of electricity to synthetic fuels.
Hydrogen and synthetic fuels Difficult to electrify industries will largely be served by synthetic fuels derived from green hydrogen combined with other inputs such as captured carbon or nitrogen. Fuel synthesis methodologies such as Fischer-Tropsch, Haber-Bosch and methanation have existed for decades. Scaling these technologies with green inputs will allow electricity to serve as the primary energy source for applications such as long-haul transit, industrial processes and clean flexible power generation.
Flexible loadsIn order to achieve high rates of renewable penetration, we anticipate that installed renewable capacity will be three to four times the size required to serve today’s traditional power loads. A system of this size will allow for peak power demand to be met with existing renewables and storage technologies while serving flexible loads, such as hydrogen production and fuel synthesis, during resulting periods of high renewable generation. In the near term, flexible loads through demand side management will foster accelerated renewables adoption, while continuing to play a critical long term role in balancing the grid.
Low deployment, high value gas infrastructureGas infrastructure will continue to play a role in providing flexible capacity during the occasions in which renewable resources cannot directly meet demand. Carbon capture technology will likely advance to enable either capture of emissions at the plant, or production of carbon neutral renewable synthetic natural gas for these applications.
At AES, we believe our strategy and portfolio are well suited to meet the demands of this vision. Robust investment in renewable energy development and scalable platforms to rapidly deploy solar means we, in collaboration with our stakeholders, are poised to lead the transition to renewable energy. Battery storage and power generation infrastructure using carbon neutral fuels will ensure reliability in a renewables dominant future. Our digital platforms and energy management products will help ensure that an interconnected grid operates smoothly and that we optimally utilize energy to decarbonize all sectors. With the rate of technological development in recent history, and emerging commitments across the globe to decarbonize, we believe that vision will be achieved in coming decades, and that AES is well positioned to lead and accelerate the transition.
1 M. Ram, et al., March 2019; S. Griffith, July 2020; A. Dorr and T. Seba, October 2020; D. Bogdanov, et al, November 2020; E. Larson, et al., December 2020; Sustainable Development Solutions Network, 2020. 2 M. Ram, et al., March 2019; D. Bogdanov, et al., November 2020.
© 2021 THE AES CORPORATION | 11
Our purpose and solutions for the future
AES climate-related policy positions – Support for Paris Agreement and 2050 net zeroAES supports the objectives of the Paris Agreement to limit the average rise in global temperatures to well below 2°C above pre-industrial levels and to pursue efforts to limit it to 1.5°C. There are many policy tools available to pursue these objectives, and we support the following policies:
ÆPlacing a price on carbon The pricing mechanism should be market-based and could take the form of a carbon tax, cap and trade system or other mechanism designed to incentivize a substantial reduction in greenhouse gas (GHG) emissions while fostering the development of new technologies.
ÆGovernment support for carbon reducing technologies We believe the development and deployment at scale of new technologies is critical for achieving the objectives of the Paris Agreement, and targeted government support in the form of research and policies plays an important role in advancing these new technologies. We consider synthetic fuels derived from green hydrogen to be a particularly promising technology and there will be many other key technologies that can be accelerated through targeted government support.
ÆGlobal cooperation to achieve net zero emissions by 2050 We support greater efforts by governments to harmonize and accelerate their respective energy transitions to achieve net zero GHG emissions by 2050 or earlier.
ÆJust transition We support public and private actions to manage the impact on workers and communities dependent on fossil fuels as decarbonization accelerates, and we are committed to working with our stakeholders to foster just transitions. Governments, employers, unions and community organizations should work collaboratively, as we have been doing in Chile, to create transition plans tailored to the unique circumstances faced by each group of workers and their community.
Trade associationsAES seeks to maintain an active role in the trade associations to which we belong so that we may address any significant conflicts between our values and policy priorities and perspectives of the trade associations.
We do not currently see any significant misalignment between our support for the Paris Agreement and 2050 net zero emissions and the positions of our principal trade associations. We will continuously monitor our membership in trade associations and the positions they endorse. If we identify any actual or potentially significant misalignment on these or other high-priority issues, we will advocate for our views within the trade association and, depending on the circumstances, we may publicly dissent from a trade association position. Before considering withdrawal from any trade association due to misalignment, we would consider the overall benefits from continued membership and the impact we can have from remaining in the association.
12 | © 2021 THE AES CORPORATION
Our purpose and solutions for the future
Balancing risk and opportunity Climate change presents AES and our stakeholders with a host of risks and opportunities. Our goal is to manage these appropriately, meet changing energy needs with agility and continue creating innovative, customized energy solutions that deliver the most value to our stakeholders while empowering growth.
As a power company, these risks and opportunities are intrinsic to our industry, and thus deeply rooted in our corporate strategy. They inform our decisions for how to best achieve our customers’ energy needs, drive impact through access and insights, and secure a sustainable future. Our four product lines mitigate risks while leveraging opportunities related to climate change. Since 2016, we have reduced our direct carbon exposed margin while growing our overall margin through our focus on clean energy growth, strategic asset sales, retirements and long-term contracting with fixed capacity payments. Please see Transition risk resilience for more information on direct carbon exposed margin.
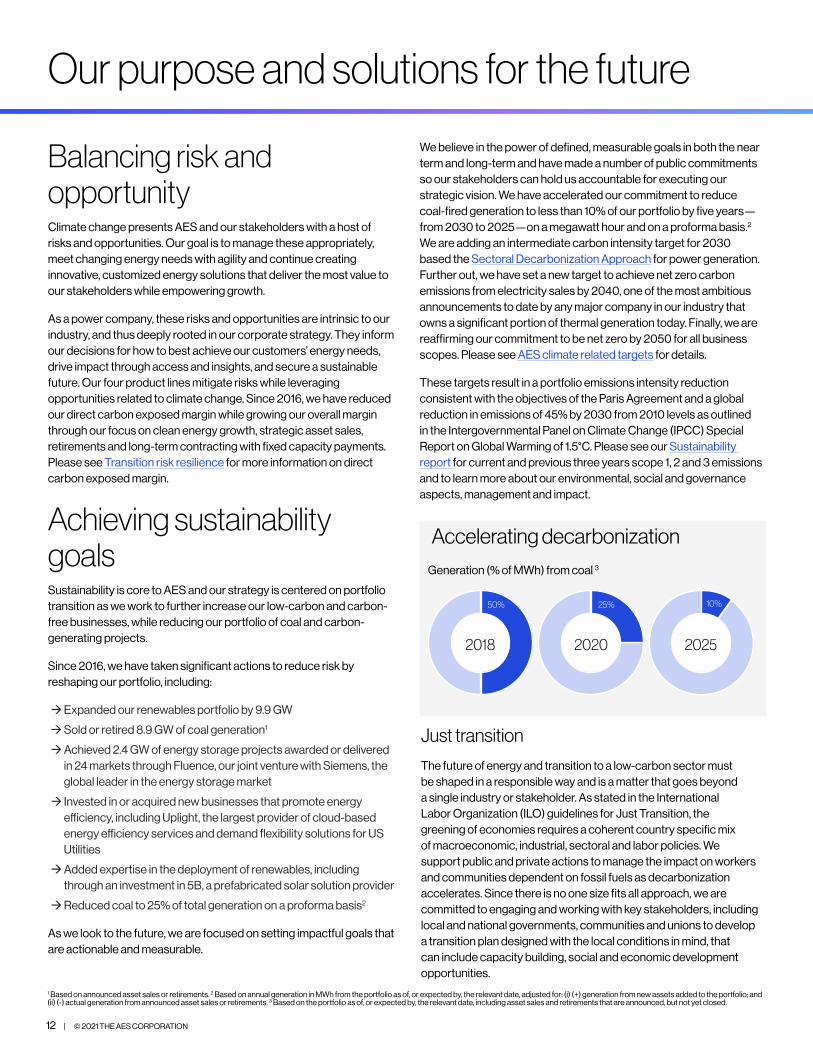
Achieving sustainability goalsSustainability is core to AES and our strategy is centered on portfolio transition as we work to further increase our low-carbon and carbon-free businesses, while reducing our portfolio of coal and carbon-generating projects.
Since 2016, we have taken significant actions to reduce risk by reshaping our portfolio, including:
ÆExpanded our renewables portfolio by 9.9 GW
ÆSold or retired 8.9 GW of coal generation1
ÆAchieved 2.4 GW of energy storage projects awarded or delivered in 24 markets through Fluence, our joint venture with Siemens, the global leader in the energy storage market
Æ Invested in or acquired new businesses that promote energy efficiency, including Uplight, the largest provider of cloud-based energy efficiency services and demand flexibility solutions for US Utilities
ÆAdded expertise in the deployment of renewables, including through an investment in 5B, a prefabricated solar solution provider
ÆReduced coal to 25% of total generation on a proforma basis2
As we look to the future, we are focused on setting impactful goals that are actionable and measurable.
We believe in the power of defined, measurable goals in both the near term and long-term and have made a number of public commitments so our stakeholders can hold us accountable for executing our strategic vision. We have accelerated our commitment to reduce coal-fired generation to less than 10% of our portfolio by five years—from 2030 to 2025—on a megawatt hour and on a proforma basis.2 We are adding an intermediate carbon intensity target for 2030 based the Sectoral Decarbonization Approach for power generation. Further out, we have set a new target to achieve net zero carbon emissions from electricity sales by 2040, one of the most ambitious announcements to date by any major company in our industry that owns a significant portion of thermal generation today. Finally, we are reaffirming our commitment to be net zero by 2050 for all business scopes. Please see AES climate related targets for details.
These targets result in a portfolio emissions intensity reduction consistent with the objectives of the Paris Agreement and a global reduction in emissions of 45% by 2030 from 2010 levels as outlined in the Intergovernmental Panel on Climate Change (IPCC) Special Report on Global Warming of 1.5°C. Please see our Sustainability report for current and previous three years scope 1, 2 and 3 emissions and to learn more about our environmental, social and governance aspects, management and impact.
Accelerating decarbonization
Just transition
The future of energy and transition to a low-carbon sector must be shaped in a responsible way and is a matter that goes beyond a single industry or stakeholder. As stated in the International Labor Organization (ILO) guidelines for Just Transition, the greening of economies requires a coherent country specific mix of macroeconomic, industrial, sectoral and labor policies. We support public and private actions to manage the impact on workers and communities dependent on fossil fuels as decarbonization accelerates. Since there is no one size fits all approach, we are committed to engaging and working with key stakeholders, including local and national governments, communities and unions to develop a transition plan designed with the local conditions in mind, that can include capacity building, social and economic development opportunities.
1 Based on announced asset sales or retirements. 2 Based on annual generation in MWh from the portfolio as of, or expected by, the relevant date, adjusted for: (i) (+) generation from new assets added to the portfolio; and (ii) (-) actual generation from announced asset sales or retirements. 3 Based on the portfolio as of, or expected by, the relevant date, including asset sales and retirements that are announced, but not yet closed.
20202018 2025
50% 25% 10%
Generation (% of MWh) from coal 3
© 2021 THE AES CORPORATION | 13
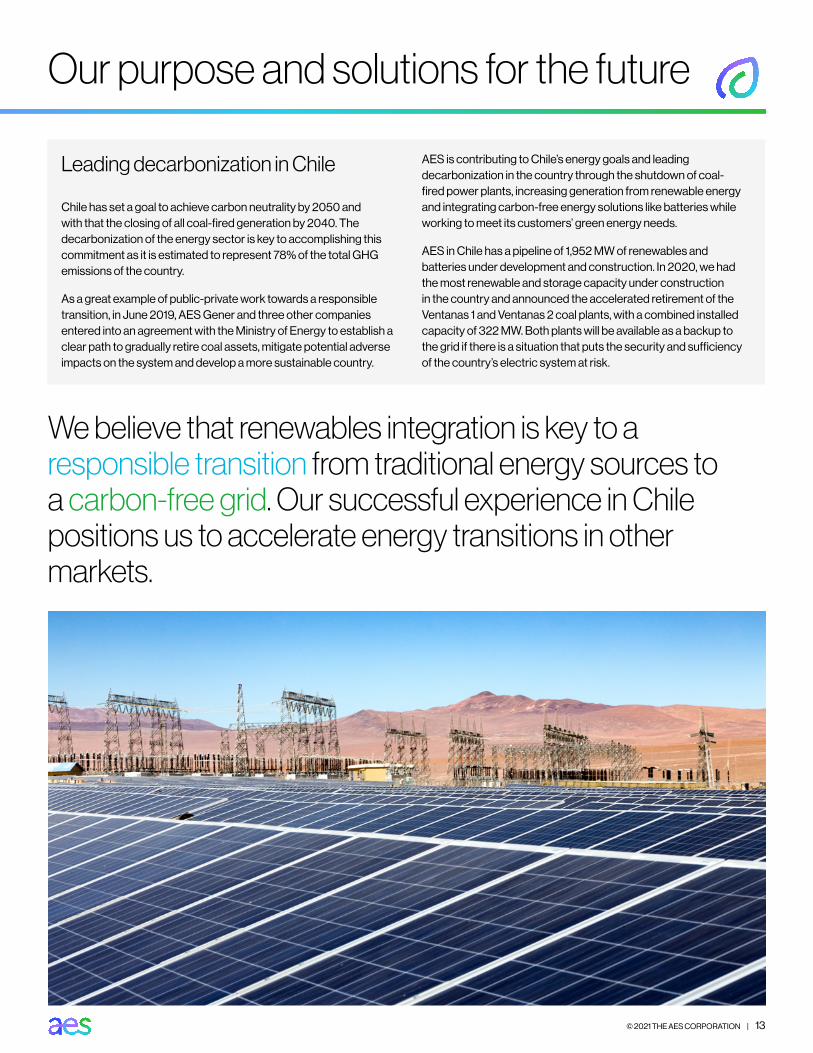
Leading decarbonization in Chile
Chile has set a goal to achieve carbon neutrality by 2050 and with that the closing of all coal-fired generation by 2040. The decarbonization of the energy sector is key to accomplishing this commitment as it is estimated to represent 78% of the total GHG emissions of the country.
As a great example of public-private work towards a responsible transition, in June 2019, AES Gener and three other companies entered into an agreement with the Ministry of Energy to establish a clear path to gradually retire coal assets, mitigate potential adverse impacts on the system and develop a more sustainable country.
AES is contributing to Chile’s energy goals and leading decarbonization in the country through the shutdown of coal-fired power plants, increasing generation from renewable energy and integrating carbon-free energy solutions like batteries while working to meet its customers’ green energy needs.
AES in Chile has a pipeline of 1,952 MW of renewables and batteries under development and construction. In 2020, we had the most renewable and storage capacity under construction in the country and announced the accelerated retirement of the Ventanas 1 and Ventanas 2 coal plants, with a combined installed capacity of 322 MW. Both plants will be available as a backup to the grid if there is a situation that puts the security and sufficiency of the country’s electric system at risk.
Our purpose and solutions for the future
We believe that renewables integration is key to a responsible transition from traditional energy sources to a carbon-free grid. Our successful experience in Chile positions us to accelerate energy transitions in other markets.
14 | © 2021 THE AES CORPORATION
Our purpose and solutions for the future
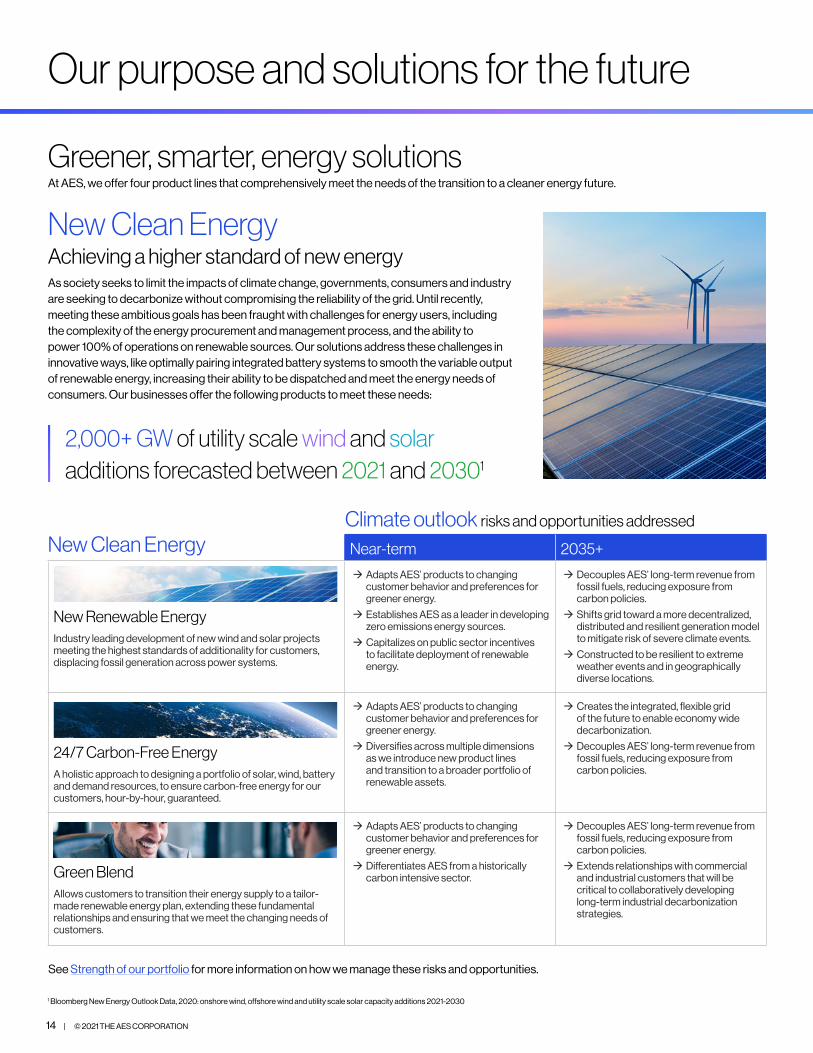
New Clean EnergyAchieving a higher standard of new energyAs society seeks to limit the impacts of climate change, governments, consumers and industry are seeking to decarbonize without compromising the reliability of the grid. Until recently, meeting these ambitious goals has been fraught with challenges for energy users, including the complexity of the energy procurement and management process, and the ability to power 100% of operations on renewable sources. Our solutions address these challenges in innovative ways, like optimally pairing integrated battery systems to smooth the variable output of renewable energy, increasing their ability to be dispatched and meet the energy needs of consumers. Our businesses offer the following products to meet these needs:
2,000+ GW of utility scale wind and solar additions forecasted between 2021 and 2030 1
Near-term 2035+
New Renewable Energy Industry leading development of new wind and solar projects meeting the highest standards of additionality for customers, displacing fossil generation across power systems.
Æ Adapts AES’ products to changing customer behavior and preferences for greener energy.
Æ Establishes AES as a leader in developing zero emissions energy sources.
Æ Capitalizes on public sector incentives to facilitate deployment of renewable energy.
Æ Decouples AES’ long-term revenue from fossil fuels, reducing exposure from carbon policies.
Æ Shifts grid toward a more decentralized, distributed and resilient generation model to mitigate risk of severe climate events.
Æ Constructed to be resilient to extreme weather events and in geographically diverse locations.
24/7 Carbon-Free Energy A holistic approach to designing a portfolio of solar, wind, battery and demand resources, to ensure carbon-free energy for our customers, hour-by-hour, guaranteed.
Æ Adapts AES’ products to changing customer behavior and preferences for greener energy.
Æ Diversifies across multiple dimensions as we introduce new product lines and transition to a broader portfolio of renewable assets.
Æ Creates the integrated, flexible grid of the future to enable economy wide decarbonization.
Æ Decouples AES’ long-term revenue from fossil fuels, reducing exposure from carbon policies.
Green BlendAllows customers to transition their energy supply to a tailor-made renewable energy plan, extending these fundamental relationships and ensuring that we meet the changing needs of customers.
Æ Adapts AES’ products to changing customer behavior and preferences for greener energy.
Æ Differentiates AES from a historically carbon intensive sector.
Æ Decouples AES’ long-term revenue from fossil fuels, reducing exposure from carbon policies.
Æ Extends relationships with commercial and industrial customers that will be critical to collaboratively developing long-term industrial decarbonization strategies.
Climate outlook risks and opportunities addressed
New Clean Energy
See Strength of our portfolio for more information on how we manage these risks and opportunities.
1 Bloomberg New Energy Outlook Data, 2020: onshore wind, offshore wind and utility scale solar capacity additions 2021-2030
Greener, smarter, energy solutionsAt AES, we offer four product lines that comprehensively meet the needs of the transition to a cleaner energy future.
© 2021 THE AES CORPORATION | 15
Our purpose and solutions for the future
Climate outlook risks and opportunities addressed
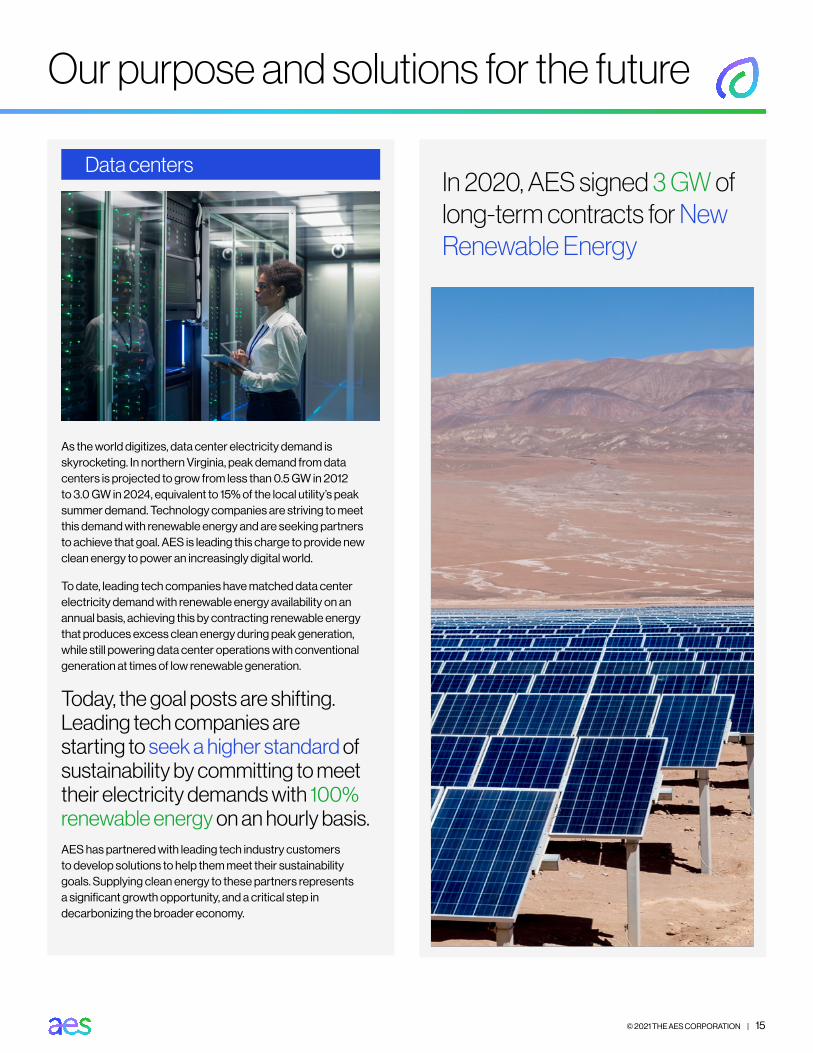
As the world digitizes, data center electricity demand is skyrocketing. In northern Virginia, peak demand from data centers is projected to grow from less than 0.5 GW in 2012 to 3.0 GW in 2024, equivalent to 15% of the local utility’s peak summer demand. Technology companies are striving to meet this demand with renewable energy and are seeking partners to achieve that goal. AES is leading this charge to provide new clean energy to power an increasingly digital world.
To date, leading tech companies have matched data center electricity demand with renewable energy availability on an annual basis, achieving this by contracting renewable energy that produces excess clean energy during peak generation, while still powering data center operations with conventional generation at times of low renewable generation.
Today, the goal posts are shifting. Leading tech companies are starting to seek a higher standard of sustainability by committing to meet their electricity demands with 100% renewable energy on an hourly basis.AES has partnered with leading tech industry customers to develop solutions to help them meet their sustainability goals. Supplying clean energy to these partners represents a significant growth opportunity, and a critical step in decarbonizing the broader economy.
In 2020, AES signed 3 GW of long-term contracts for New Renewable Energy
Data centersData centers
16 | © 2021 THE AES CORPORATION © 2021 THE AES CORPORATION | 16
Our purpose and solutions for the future
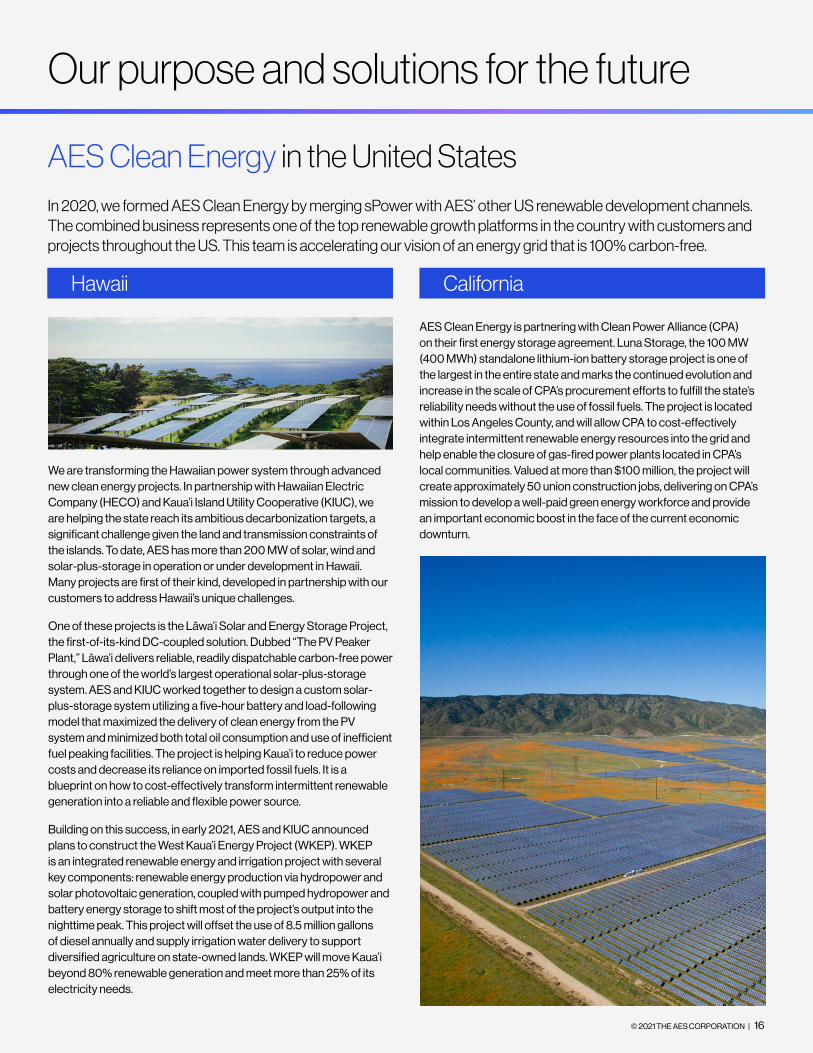
AES Clean Energy in the United StatesIn 2020, we formed AES Clean Energy by merging sPower with AES’ other US renewable development channels. The combined business represents one of the top renewable growth platforms in the country with customers and projects throughout the US. This team is accelerating our vision of an energy grid that is 100% carbon-free.
AES Clean Energy is partnering with Clean Power Alliance (CPA) on their first energy storage agreement. Luna Storage, the 100 MW (400 MWh) standalone lithium-ion battery storage project is one of the largest in the entire state and marks the continued evolution and increase in the scale of CPA’s procurement efforts to fulfill the state’s reliability needs without the use of fossil fuels. The project is located within Los Angeles County, and will allow CPA to cost-effectively integrate intermittent renewable energy resources into the grid and help enable the closure of gas-fired power plants located in CPA’s local communities. Valued at more than $100 million, the project will create approximately 50 union construction jobs, delivering on CPA’s mission to develop a well-paid green energy workforce and provide an important economic boost in the face of the current economic downturn.
Hawaii California
We are transforming the Hawaiian power system through advanced new clean energy projects. In partnership with Hawaiian Electric Company (HECO) and Kaua’i Island Utility Cooperative (KIUC), we are helping the state reach its ambitious decarbonization targets, a significant challenge given the land and transmission constraints of the islands. To date, AES has more than 200 MW of solar, wind and solar-plus-storage in operation or under development in Hawaii. Many projects are first of their kind, developed in partnership with our customers to address Hawaii’s unique challenges.
One of these projects is the Lāwa’i Solar and Energy Storage Project, the first-of-its-kind DC-coupled solution. Dubbed “The PV Peaker Plant,” Lāwa’i delivers reliable, readily dispatchable carbon-free power through one of the world’s largest operational solar-plus-storage system. AES and KIUC worked together to design a custom solar-plus-storage system utilizing a five-hour battery and load-following model that maximized the delivery of clean energy from the PV system and minimized both total oil consumption and use of inefficient fuel peaking facilities. The project is helping Kaua’i to reduce power costs and decrease its reliance on imported fossil fuels. It is a blueprint on how to cost-effectively transform intermittent renewable generation into a reliable and flexible power source.
Building on this success, in early 2021, AES and KIUC announced plans to construct the West Kaua’i Energy Project (WKEP). WKEP is an integrated renewable energy and irrigation project with several key components: renewable energy production via hydropower and solar photovoltaic generation, coupled with pumped hydropower and battery energy storage to shift most of the project’s output into the nighttime peak. This project will offset the use of 8.5 million gallons of diesel annually and supply irrigation water delivery to support diversified agriculture on state-owned lands. WKEP will move Kaua’i beyond 80% renewable generation and meet more than 25% of its electricity needs.

© 2021 THE AES CORPORATION | 17
Our purpose and solutions for the future
Advanced Energy NetworksDriving impact through access and insights
115+ GW of energy efficiency and digital energy management capacity forecasted between 2021 and 2030 1
Near-term 2035+
Smart Distribution NetworksThe energy transition depends on utility customer engagement to drive customer action for more energy efficiency and smart integration of distributed energy resources. This offering lights up homes and businesses through next-generation utility platforms to ensure safe, reliable and efficient energy.
Æ Positions AES to fulfill growing transmission & distribution needs to enable zero emissions energy sources.
Æ Expands services associated with an evolving grid while facilitating the adoption of new technologies and energy efficient practices.
Æ Creates the integrated, flexible grid necessary for whole economy decarbonization.
Æ Decouples AES’ long-term revenue from fossil fuels, reducing exposure from carbon policies.
Clean Energy Navigator A growing number of enterprises are looking for ways to improve the sustainability of their operations while improving their bottom line. Our Clean Energy Navigator offering connects our commercial customers to business relevant insights and solutions to improve their operations while meeting their sustainability goals.
Æ Adapts to changing customer behavior and preferences for greener energy and support with their energy management strategies.
Æ Broadens our business to capture our share of the services market with smart technology for the transition to a low-carbon economy.
Æ Forges relationships with commercial and industrial customers that will be critical to collaboratively developing climate solutions.
Æ Decouples AES’ long-term revenue from fossil fuels, reducing exposure from carbon policies.
Climate outlook risks and opportunities addressed
Advanced Energy Networks
See Strength of our portfolio for more information on how we manage these risks and opportunities.
With the broad array of generation and digital energy technologies available to consumers, it can be hard to have the visibility, control and insights they need to make informed energy decisions. Our Advanced Energy Networks solutions put data to work to provide transparency and insights into energy consumption and production.
With our Smart Distribution Networks and Clean Energy Navigator offerings, AES connects businesses to the insights that matter - to take control of unique energy needs by better understanding their consumption, costs and optimization opportunities. Through these insights, we help to create operational efficiencies, fuel innovation and drive sustainability by providing cleaner and more resilient energy solutions for our customers.
1 Guidehouse Global DER Deployment Database, Q1 2021: DERMS, DR and energy efficiency capacity additions 2021-2030
18 | © 2021 THE AES CORPORATION
Our purpose and solutions for the future
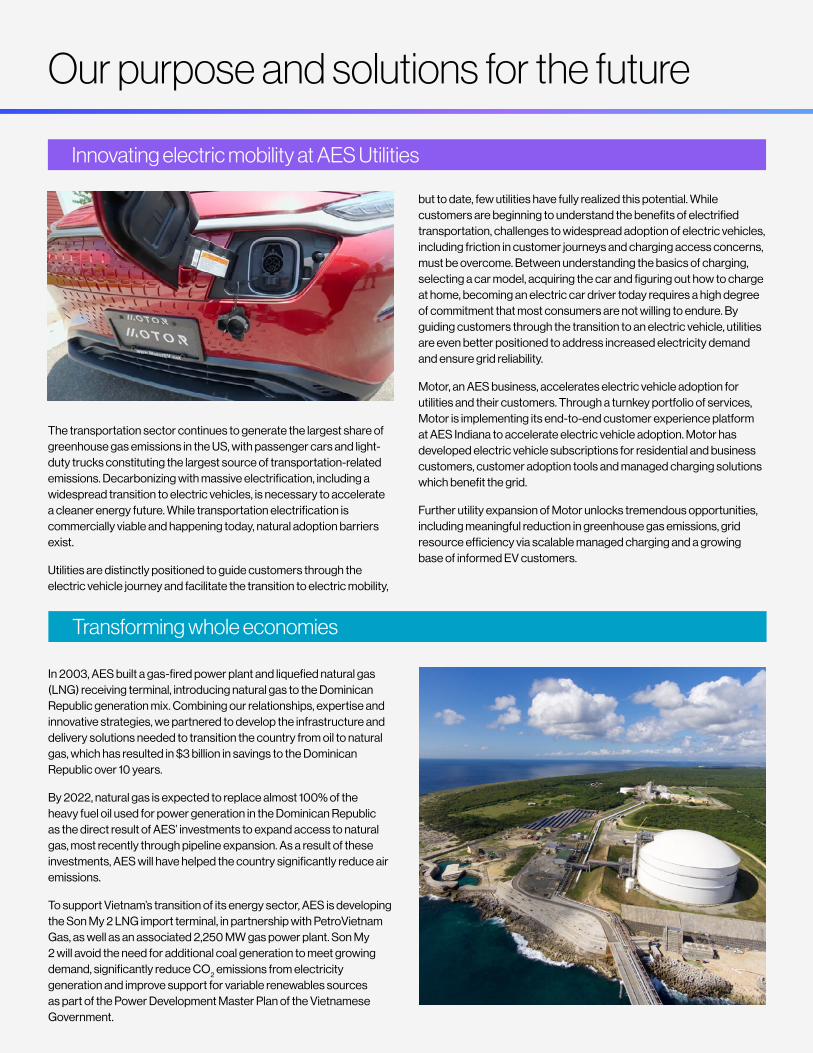
The transportation sector continues to generate the largest share of greenhouse gas emissions in the US, with passenger cars and light-duty trucks constituting the largest source of transportation-related emissions. Decarbonizing with massive electrification, including a widespread transition to electric vehicles, is necessary to accelerate a cleaner energy future. While transportation electrification is commercially viable and happening today, natural adoption barriers exist.
Utilities are distinctly positioned to guide customers through the electric vehicle journey and facilitate the transition to electric mobility,
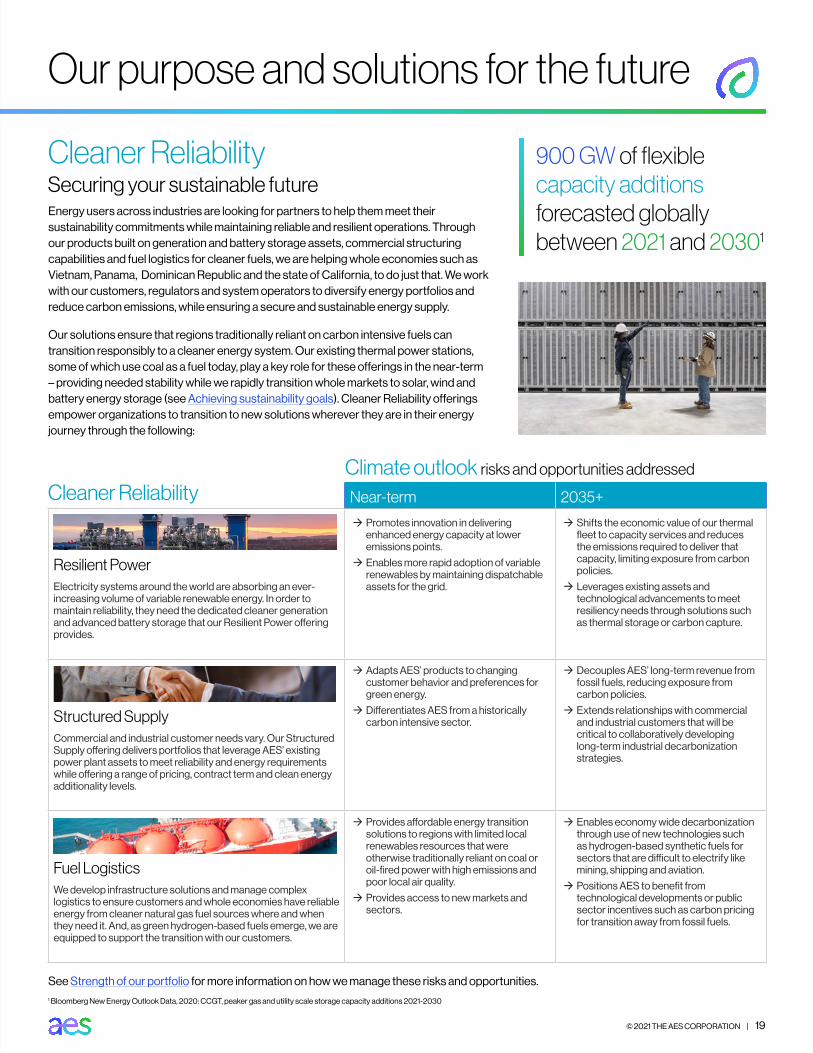
In 2003, AES built a gas-fired power plant and liquefied natural gas (LNG) receiving terminal, introducing natural gas to the Dominican Republic generation mix. Combining our relationships, expertise and innovative strategies, we partnered to develop the infrastructure and delivery solutions needed to transition the country from oil to natural gas, which has resulted in $3 billion in savings to the Dominican Republic over 10 years.
By 2022, natural gas is expected to replace almost 100% of the heavy fuel oil used for power generation in the Dominican Republic as the direct result of AES’ investments to expand access to natural gas, most recently through pipeline expansion. As a result of these investments, AES will have helped the country significantly reduce air emissions.
To support Vietnam’s transition of its energy sector, AES is developing the Son My 2 LNG import terminal, in partnership with PetroVietnam Gas, as well as an associated 2,250 MW gas power plant. Son My 2 will avoid the need for additional coal generation to meet growing demand, significantly reduce CO
2 emissions from electricity generation and improve support for variable renewables sources as part of the Power Development Master Plan of the Vietnamese Government.
Innovating electric mobility at AES Utilities
Transforming whole economies
but to date, few utilities have fully realized this potential. While customers are beginning to understand the benefits of electrified transportation, challenges to widespread adoption of electric vehicles, including friction in customer journeys and charging access concerns, must be overcome. Between understanding the basics of charging, selecting a car model, acquiring the car and figuring out how to charge at home, becoming an electric car driver today requires a high degree of commitment that most consumers are not willing to endure. By guiding customers through the transition to an electric vehicle, utilities are even better positioned to address increased electricity demand and ensure grid reliability.
Motor, an AES business, accelerates electric vehicle adoption for utilities and their customers. Through a turnkey portfolio of services, Motor is implementing its end-to-end customer experience platform at AES Indiana to accelerate electric vehicle adoption. Motor has developed electric vehicle subscriptions for residential and business customers, customer adoption tools and managed charging solutions which benefit the grid.
Further utility expansion of Motor unlocks tremendous opportunities, including meaningful reduction in greenhouse gas emissions, grid resource efficiency via scalable managed charging and a growing base of informed EV customers.
© 2021 THE AES CORPORATION | 19
Our purpose and solutions for the future
Cleaner ReliabilitySecuring your sustainable future
Near-term 2035+
Resilient PowerElectricity systems around the world are absorbing an ever-increasing volume of variable renewable energy. In order to maintain reliability, they need the dedicated cleaner generation and advanced battery storage that our Resilient Power offering provides.
Æ Promotes innovation in delivering enhanced energy capacity at lower emissions points.
Æ Enables more rapid adoption of variable renewables by maintaining dispatchable assets for the grid.
Æ Shifts the economic value of our thermal fleet to capacity services and reduces the emissions required to deliver that capacity, limiting exposure from carbon policies.
Æ Leverages existing assets and technological advancements to meet resiliency needs through solutions such as thermal storage or carbon capture.
Structured SupplyCommercial and industrial customer needs vary. Our Structured Supply offering delivers portfolios that leverage AES’ existing power plant assets to meet reliability and energy requirements while offering a range of pricing, contract term and clean energy additionality levels.
Æ Adapts AES’ products to changing customer behavior and preferences for green energy.
Æ Differentiates AES from a historically carbon intensive sector.
Æ Decouples AES’ long-term revenue from fossil fuels, reducing exposure from carbon policies.
Æ Extends relationships with commercial and industrial customers that will be critical to collaboratively developing long-term industrial decarbonization strategies.
Fuel LogisticsWe develop infrastructure solutions and manage complex logistics to ensure customers and whole economies have reliable energy from cleaner natural gas fuel sources where and when they need it. And, as green hydrogen-based fuels emerge, we are equipped to support the transition with our customers.
Æ Provides affordable energy transition solutions to regions with limited local renewables resources that were otherwise traditionally reliant on coal or oil-fired power with high emissions and poor local air quality.
Æ Provides access to new markets and sectors.
Æ Enables economy wide decarbonization through use of new technologies such as hydrogen-based synthetic fuels for sectors that are difficult to electrify like mining, shipping and aviation.
Æ Positions AES to benefit from technological developments or public sector incentives such as carbon pricing for transition away from fossil fuels.
Climate outlook risks and opportunities addressed
Cleaner Reliability
See Strength of our portfolio for more information on how we manage these risks and opportunities.
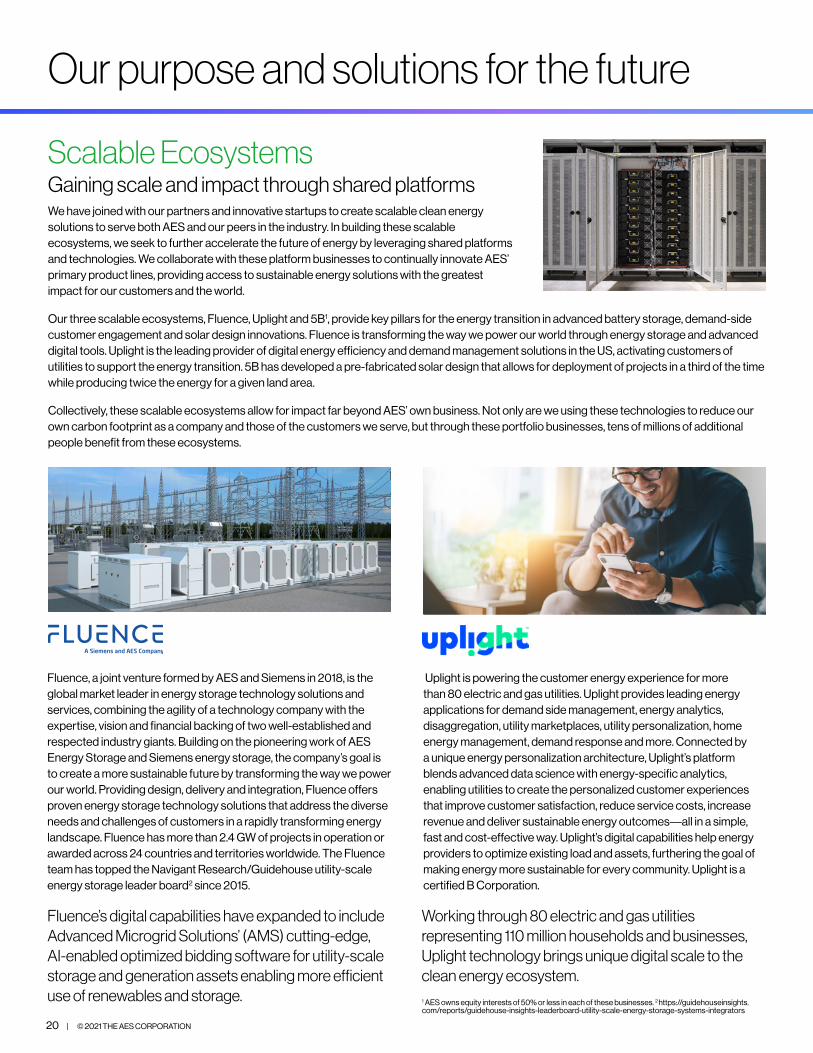
Energy users across industries are looking for partners to help them meet their sustainability commitments while maintaining reliable and resilient operations. Through our products built on generation and battery storage assets, commercial structuring capabilities and fuel logistics for cleaner fuels, we are helping whole economies such as Vietnam, Panama, Dominican Republic and the state of California, to do just that. We work with our customers, regulators and system operators to diversify energy portfolios and reduce carbon emissions, while ensuring a secure and sustainable energy supply.
Our solutions ensure that regions traditionally reliant on carbon intensive fuels can transition responsibly to a cleaner energy system. Our existing thermal power stations, some of which use coal as a fuel today, play a key role for these offerings in the near-term – providing needed stability while we rapidly transition whole markets to solar, wind and battery energy storage (see Achieving sustainability goals). Cleaner Reliability offerings empower organizations to transition to new solutions wherever they are in their energy journey through the following:
900 GW of flexible capacity additions forecasted globally between 2021 and 20301
1 Bloomberg New Energy Outlook Data, 2020: CCGT, peaker gas and utility scale storage capacity additions 2021-2030
20 | © 2021 THE AES CORPORATION
Our purpose and solutions for the future
Scalable EcosystemsGaining scale and impact through shared platformsWe have joined with our partners and innovative startups to create scalable clean energy solutions to serve both AES and our peers in the industry. In building these scalable ecosystems, we seek to further accelerate the future of energy by leveraging shared platforms and technologies. We collaborate with these platform businesses to continually innovate AES’ primary product lines, providing access to sustainable energy solutions with the greatest impact for our customers and the world.
Our three scalable ecosystems, Fluence, Uplight and 5B1, provide key pillars for the energy transition in advanced battery storage, demand-side customer engagement and solar design innovations. Fluence is transforming the way we power our world through energy storage and advanced digital tools. Uplight is the leading provider of digital energy efficiency and demand management solutions in the US, activating customers of utilities to support the energy transition. 5B has developed a pre-fabricated solar design that allows for deployment of projects in a third of the time while producing twice the energy for a given land area.
Collectively, these scalable ecosystems allow for impact far beyond AES’ own business. Not only are we using these technologies to reduce our own carbon footprint as a company and those of the customers we serve, but through these portfolio businesses, tens of millions of additional people benefit from these ecosystems.
Fluence, a joint venture formed by AES and Siemens in 2018, is the global market leader in energy storage technology solutions and services, combining the agility of a technology company with the expertise, vision and financial backing of two well-established and respected industry giants. Building on the pioneering work of AES Energy Storage and Siemens energy storage, the company’s goal is to create a more sustainable future by transforming the way we power our world. Providing design, delivery and integration, Fluence offers proven energy storage technology solutions that address the diverse needs and challenges of customers in a rapidly transforming energy landscape. Fluence has more than 2.4 GW of projects in operation or awarded across 24 countries and territories worldwide. The Fluence team has topped the Navigant Research/Guidehouse utility-scale energy storage leader board2 since 2015.
Uplight is powering the customer energy experience for more than 80 electric and gas utilities. Uplight provides leading energy applications for demand side management, energy analytics, disaggregation, utility marketplaces, utility personalization, home energy management, demand response and more. Connected by a unique energy personalization architecture, Uplight’s platform blends advanced data science with energy-specific analytics, enabling utilities to create the personalized customer experiences that improve customer satisfaction, reduce service costs, increase revenue and deliver sustainable energy outcomes––all in a simple, fast and cost-effective way. Uplight’s digital capabilities help energy providers to optimize existing load and assets, furthering the goal of making energy more sustainable for every community. Uplight is a certified B Corporation.
Working through 80 electric and gas utilities representing 110 million households and businesses, Uplight technology brings unique digital scale to the clean energy ecosystem.
Fluence’s digital capabilities have expanded to include Advanced Microgrid Solutions’ (AMS) cutting-edge, AI-enabled optimized bidding software for utility-scale storage and generation assets enabling more efficient use of renewables and storage. 1 AES owns equity interests of 50% or less in each of these businesses. 2 https://guidehouseinsights.
com/reports/guidehouse-insights-leaderboard-utility-scale-energy-storage-systems-integrators
© 2021 THE AES CORPORATION | 21
Our purpose and solutions for the future
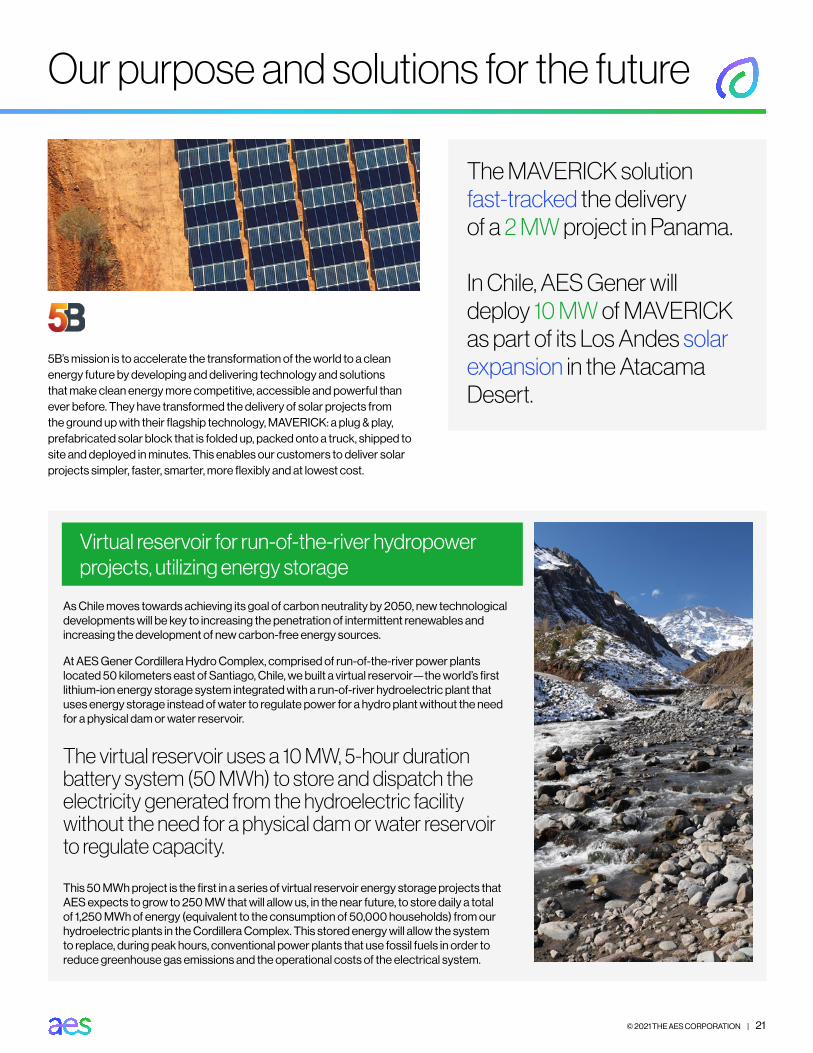
5B’s mission is to accelerate the transformation of the world to a clean energy future by developing and delivering technology and solutions that make clean energy more competitive, accessible and powerful than ever before. They have transformed the delivery of solar projects from the ground up with their flagship technology, MAVERICK: a plug & play, prefabricated solar block that is folded up, packed onto a truck, shipped to site and deployed in minutes. This enables our customers to deliver solar projects simpler, faster, smarter, more flexibly and at lowest cost.
The MAVERICK solution fast-tracked the delivery of a 2 MW project in Panama.
In Chile, AES Gener will deploy 10 MW of MAVERICK as part of its Los Andes solar expansion in the Atacama Desert.
As Chile moves towards achieving its goal of carbon neutrality by 2050, new technological developments will be key to increasing the penetration of intermittent renewables and increasing the development of new carbon-free energy sources.
At AES Gener Cordillera Hydro Complex, comprised of run-of-the-river power plants located 50 kilometers east of Santiago, Chile, we built a virtual reservoir—the world’s first lithium-ion energy storage system integrated with a run-of-river hydroelectric plant that uses energy storage instead of water to regulate power for a hydro plant without the need for a physical dam or water reservoir.
The virtual reservoir uses a 10 MW, 5-hour duration battery system (50 MWh) to store and dispatch the electricity generated from the hydroelectric facility without the need for a physical dam or water reservoir to regulate capacity.
This 50 MWh project is the first in a series of virtual reservoir energy storage projects that AES expects to grow to 250 MW that will allow us, in the near future, to store daily a total of 1,250 MWh of energy (equivalent to the consumption of 50,000 households) from our hydroelectric plants in the Cordillera Complex. This stored energy will allow the system to replace, during peak hours, conventional power plants that use fossil fuels in order to reduce greenhouse gas emissions and the operational costs of the electrical system.
Virtual reservoir for run-of-the-river hydropower projects, utilizing energy storage

22 | © 2021 THE AES CORPORATION
Governance at AES
An integrated risk and strategy approach At AES, our corporate strategy drives our business decisions, both at the portfolio level and the business level. Our strategy, which is to grow our four product lines and sell or retire our coal-fired generation portfolio, is based on the fundamental view that there is a need to transition to less carbon-intensive sources of energy. This strategy is set at the highest level of management—with approval by the AES Board of Directors—and directly incorporates the findings from our risk management processes.
We take a deliberate and systematic approach to establishing our strategy, including an annual review at the corporate level, which defines relevant goals and establishes mechanisms to track progress toward meeting those goals. Our progress toward meeting strategic goals, including the growth of carbon-free energy solutions and reduction in coal-fired generation is directly linked to executive compensation.
Many key business decisions must be approved by the AES Investment Committee, a multi-disciplinary team of the Company’s most senior leaders and are measured against the company’s strategic objectives. The planning process is designed to identify the key internal and external drivers that have a significant impact on value creation, with climate change being a key input.
This corporate strategic process is complemented by periodic review at the business level, with a formal scenario analysis that we internally call “Multiple Views of the Future” (MVF), led by our Global Risk Management team. This process provides deep insights into the factors shaping our markets, including the impacts of climate change, and expected market reactions over a 10-year period.
The AES Board of Directors, which meets at least five times per year, has oversight and direct input to ensure that factors related to climate change are incorporated in the Company’s decision making. In addition to the AES Board’s annual strategic review, there are also two committees that directly oversee related topics. The Governance Committee oversees environmental, social and governance issues and the Innovation and Technology Committee oversees AES’ efforts to foster innovation as we seek to lead the industry in new sustainable solutions.
At the core of our strategic processes is our risk management approach. We have several internal structures and processes to identify, quantify and manage risks across many categories, including environmental, political, physical, regulatory, technology and market-based risks.

© 2021 THE AES CORPORATION | 23
Governance at AES
AES boardThe Board receives a risk report and additional materials at each meeting that identify top risks including climate related issues and major market trends. They then also oversee the risk management practices implemented by management and maintain oversight.
AES senior managementAnnually, each of our Strategic Business Units (SBUs) present their Market Management Strategies (MMS) at our Risk Oversight Committee (ROC). The MMS provides market updates, risk mitigation proposals, as well as guidance on strategic questions in each of our markets.
SBU senior managementAt the SBU level, our Risk Management Committee (RMC) is responsible for the identification, tracking and approval of mitigation of risks associated within our existing portfolio as well as growth projects.
In addition to the formal governance described above, there are additional risk management processes that help to identify, assess and manage the potential impacts of climate change:
ÆEnterprise Risk Management Model (ERM) – At AES, our full ERM is reviewed at least annually by both the Board of Directors and the full Executive Leadership Team (ELT). After aggregating risks from across our businesses, our Global Risk Management team identifies the Top 10 risks based on the likelihood of occurrence and magnitude of the impact to AES, which are then assigned an ELT sponsor with primary responsibility for managing the risk. Throughout the year, the ELT is provided a deep dive on a subset of the Top 10 risks through our Quarterly Risk Reviews.
ÆGlobal Weather Risk Committee – In 2019, with AES’ success in becoming a top global developer of solar and wind generation, we evolved our Hydrology Risk Committee into the Global Weather Risk Committee. This committee is responsible for the quantification and tracking of our risk to key weather uncertainties involving wind, irradiance and hydrology across our global markets. We also explore the dynamism of these uncertainties due to climate change. This cross functional committee explores the risk diversification that AES has at a global level associated with weather, works to identify new opportunities and relationships to improve AES development efforts and reports on the realized and forecasted risk associated with weather.
Another strength of our risk management approach is our use of a captive insurance program. We believe that our captive insurance model provides us with a unique understanding of our underlying physical risks and creates a continuous improvement feedback loop within the organization.
We have a risk engineering team that assesses global facilities, identifies risk mitigation recommendations and tracks progress on implementation. We have considerably improved the risk profile of our portfolio through reduction in loss expectancy by implementing over 2,000 internal risk reduction recommendations of our engineering experts over the last five years. On average, our business units are exposed to a $1 million deductible per event and we retain an additional $40 million of exposure within our wholly owned captive insurance company, with excess exposure ceded to reinsurers. We maintain reserves within our captive insurance company equal to its aggregate exposure, further protecting AES in the case of losses.
24 | © 2021 THE AES CORPORATION
Stress testing our portfolio
In its 2019 World Energy Outlook (WEO), the IEA replaced its New Policies Scenario (NPS), which we used in our 2018 analysis, with a Stated Policies Scenario (STEPS). The updated scenario reflects the impact of today’s announced climate policy commitments and is intended to provide a view of what the world and the energy sector would look like through the year 2040 if those policies are successful. Additionally, the IEA removed the Current Policies Scenario (CPS), a 3 - 6°C scenario, as it neglected the effects of announced policies (it only considered policies in place, a pathway no longer deemed viable). In response, we removed the “Business as Usual” scenario associated with CPS that was referenced in our 2018 report.
The use of IEA’s Sustainable Development Scenario (SDS) and IPCC’s Risk Concentration Pathways (RCPs) 6.0 and 2.0 are unchanged from our last analysis, as these outcomes still provide the most current data available for pathways of this type. These widely accepted scenario updates are encouraging and reflect the meaningful actions and firm commitments of governments, customers, providers and other energy stakeholders over the last decade toward a low-carbon economy. See Building the scenarios for additional information on the analysis conducted.
Refreshing our stress testing approachProponents of scenario planning for climate change impacts have highlighted the importance of using standardized scenarios for investors to compare climate resilience across companies. The TCFD also recommends that companies use a range of scenarios and that at least one is aligned to the Paris Agreement’s goal of limiting global temperature rise to well below 2°C above pre-industrial levels.
Following our TCFD-aligned 2018 Climate Scenario Report, we continue to use stress tests to evaluate our portfolio’s resilience using internationally recognized, third-party climate scenarios. The IEA’s scenarios are updated annually while the IPCC publishes comprehensive scientific assessment reports every six to seven years to take into account the latest data and developments in policies, technologies, costs and science. We have made several adjustments to the analysis from our initial report, based on updates to the IEA’s outlook as well as recent developments in our own business strategy.
Additionally, we have worked with actuaries and catastrophe risk modelers in our revised stress test to simulate the future perils posed by climate change in each scenario at an asset level across AES. Our effort continues to be guided by a cross functional steering group consisting of executives from our financial planning and analysis, risk, strategy, innovation, product and commercial, sustainability, legal, operations and other teams. See Scope and Boundaries (below) for more information about these key updates.
While some assumptions contemplated by the IEA and IPCC may seem contrary to current trends, they are modeled as presented for standardization purposes and best practices. The scenarios chosen are described in Building the scenarios. In addition to following the scenarios outlined by third parties, we have also included our own perspective that draws on a number of low-carbon transition scenarios in AES vision.
Scope and boundariesOur stress test was conducted over the projected time period of 2020 to 2040 and includes all of AES’ businesses and global assets, both current and anticipated. Our stress test includes varying growth trajectories for building new renewable energy assets and future growth in our asset-light1 product lines. We account for our equity stake in each asset and any publicly announced retirements or divestments. We assume that a significant portion of our future cash flows are reinvested in our New Clean Energy product line, which includes an accelerated expansion of solar and wind capacity.
1 Asset-light offerings include a variety of business lines which do not require us to own power plants or other physical assets, such as the storage solutions being sold by Fluence to third-parties, digital solutions provided by Uplight to utilities and energy manager services provided to corporate customers.

© 2021 THE AES CORPORATION | 25
Stress testing our portfolio
The 2020 WEO also introduced two new scenarios, a Delayed Recovery Scenario (DRS) and a Net Zero Emissions by 2050 case (NZE2050). Neither of these outlooks are included in the scope of our stress test due to a lack of data available in the 2020 WEO, but we have included an AES vision of a variety of net zero scenarios. The DRS was introduced to reflect the uncertainties associated with COVID-19, assuming a longer pandemic and economic recovery, compared to STEPS. The NZE2050 case examines what additional actions would be needed beyond SDS over the next ten years to reach net zero emissions by 2050 (rather than 2070 in SDS), in line with the pathways used by the IPCC for the Special Report on Global Warming of 1.5°C (SR1.5) released in late 2018.
Please see Building the scenarios for more information.
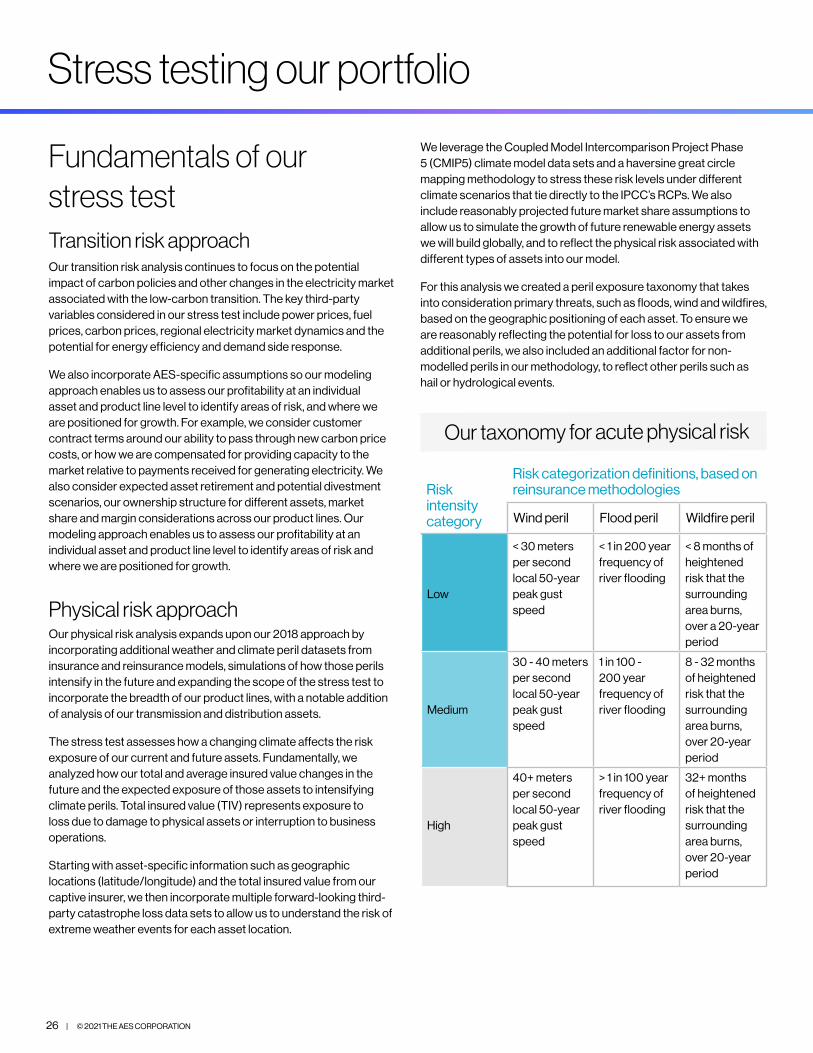
Balance between physical and transition climate risks
Increased physical risk Increased transition risk
Æ Severe changes in climate and weather events.
Æ Businesses impacted by climate change.
Æ Businesses impacted by carbon policies and market and technology disruption.
1.5 - 2°C ScenarioAchievement of Paris Agreement goals:Greenhouse gas emissions rapidly fall by 70% by 2050
2 - 4°C ScenarioGlobal greenhouse gas emissions continue to exceed the levels agreed to in the Paris Agreement
26 | © 2021 THE AES CORPORATION
Stress testing our portfolio
Fundamentals of our stress testTransition risk approachOur transition risk analysis continues to focus on the potential impact of carbon policies and other changes in the electricity market associated with the low-carbon transition. The key third-party variables considered in our stress test include power prices, fuel prices, carbon prices, regional electricity market dynamics and the potential for energy efficiency and demand side response.
We also incorporate AES-specific assumptions so our modeling approach enables us to assess our profitability at an individual asset and product line level to identify areas of risk, and where we are positioned for growth. For example, we consider customer contract terms around our ability to pass through new carbon price costs, or how we are compensated for providing capacity to the market relative to payments received for generating electricity. We also consider expected asset retirement and potential divestment scenarios, our ownership structure for different assets, market share and margin considerations across our product lines. Our modeling approach enables us to assess our profitability at an individual asset and product line level to identify areas of risk and where we are positioned for growth.
Physical risk approachOur physical risk analysis expands upon our 2018 approach by incorporating additional weather and climate peril datasets from insurance and reinsurance models, simulations of how those perils intensify in the future and expanding the scope of the stress test to incorporate the breadth of our product lines, with a notable addition of analysis of our transmission and distribution assets.
The stress test assesses how a changing climate affects the risk exposure of our current and future assets. Fundamentally, we analyzed how our total and average insured value changes in the future and the expected exposure of those assets to intensifying climate perils. Total insured value (TIV) represents exposure to loss due to damage to physical assets or interruption to business operations.
Starting with asset-specific information such as geographic locations (latitude/longitude) and the total insured value from our captive insurer, we then incorporate multiple forward-looking third-party catastrophe loss data sets to allow us to understand the risk of extreme weather events for each asset location.
We leverage the Coupled Model Intercomparison Project Phase 5 (CMIP5) climate model data sets and a haversine great circle mapping methodology to stress these risk levels under different climate scenarios that tie directly to the IPCC’s RCPs. We also include reasonably projected future market share assumptions to allow us to simulate the growth of future renewable energy assets we will build globally, and to reflect the physical risk associated with different types of assets into our model.
For this analysis we created a peril exposure taxonomy that takes into consideration primary threats, such as floods, wind and wildfires, based on the geographic positioning of each asset. To ensure we are reasonably reflecting the potential for loss to our assets from additional perils, we also included an additional factor for non-modelled perils in our methodology, to reflect other perils such as hail or hydrological events.
Risk intensity category
Risk categorization definitions, based on reinsurance methodologies
Wind peril Flood peril Wildfire peril
Low
< 30 meters per second local 50-year peak gust speed
< 1 in 200 year frequency of river flooding
< 8 months of heightened risk that the surrounding area burns, over a 20-year period
Medium
30 - 40 meters per second local 50-year peak gust speed
1 in 100 - 200 year frequency of river flooding
8 - 32 months of heightened risk that the surrounding area burns, over 20-year period
High
40+ meters per second local 50-year peak gust speed
> 1 in 100 year frequency of river flooding
32+ months of heightened risk that the surrounding area burns, over 20-year period
Our taxonomy for acute physical risk

© 2021 THE AES CORPORATION | 27
Stress testing our portfolio
Stress test approach across transition and physical risks
Stress test grouping
New Clean Energy
Advanced Energy Networks
Cleaner Reliability
Scalable Ecosystems
Inputs
Third party inputs for stress testing
Reinsurance risk data
Current risk intensity data for flood, wind and wildfire perils
IPCC CMP5 data
Projected changes in risk intensity at a regional and global level
IEA data
Renewable energy growth through 2040
Key AES inputs for stress testing
Asset attributes Asset locations
Future renewable energy market share assumptions
Asset hardening assumptions
Stress test outputs
Resulting gross marginResulting change in insured value and value risk
Conclusions on the resilience of our strategy
Physical risk
IEA inputs for stress testing
Power process and regional power supply curves
Fuel prices
Carbon prices
Solar and wind costs
Storage market growth and battery costs
Demand responses potential
Key AES inputs for stress testing
Asset attributes Technology costs
Business structure
Power market dynamics
Transition risk
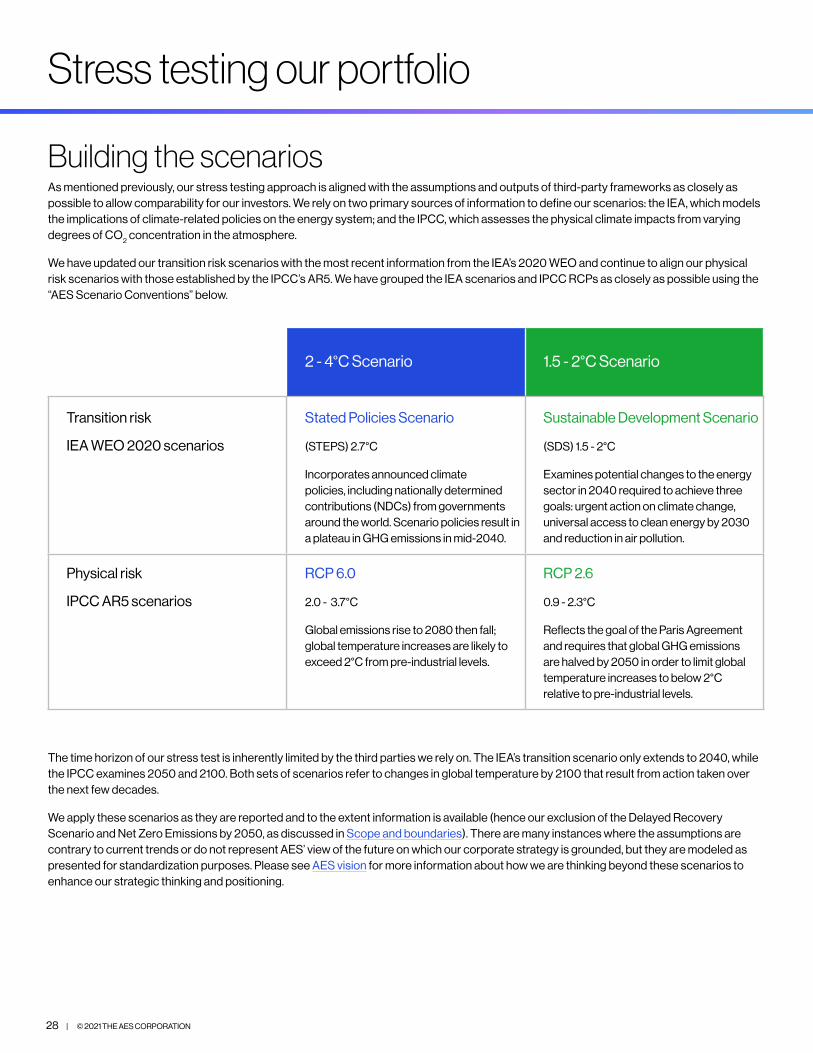
28 | © 2021 THE AES CORPORATION
Stress testing our portfolio
Building the scenariosAs mentioned previously, our stress testing approach is aligned with the assumptions and outputs of third-party frameworks as closely as possible to allow comparability for our investors. We rely on two primary sources of information to define our scenarios: the IEA, which models the implications of climate-related policies on the energy system; and the IPCC, which assesses the physical climate impacts from varying degrees of CO
2 concentration in the atmosphere.
We have updated our transition risk scenarios with the most recent information from the IEA’s 2020 WEO and continue to align our physical risk scenarios with those established by the IPCC’s AR5. We have grouped the IEA scenarios and IPCC RCPs as closely as possible using the “AES Scenario Conventions” below.
2 - 4°C Scenario 1.5 - 2°C Scenario
Transition risk
IEA WEO 2020 scenarios
Stated Policies Scenario
(STEPS) 2.7°C
Incorporates announced climate policies, including nationally determined contributions (NDCs) from governments around the world. Scenario policies result in a plateau in GHG emissions in mid-2040.
Sustainable Development Scenario
(SDS) 1.5 - 2°C
Examines potential changes to the energy sector in 2040 required to achieve three goals: urgent action on climate change, universal access to clean energy by 2030 and reduction in air pollution.
Physical risk
IPCC AR5 scenarios
RCP 6.0
2.0 - 3.7°C
Global emissions rise to 2080 then fall; global temperature increases are likely to exceed 2°C from pre-industrial levels.
RCP 2.6
0.9 - 2.3°C
Reflects the goal of the Paris Agreement and requires that global GHG emissions are halved by 2050 in order to limit global temperature increases to below 2°C relative to pre-industrial levels.
The time horizon of our stress test is inherently limited by the third parties we rely on. The IEA’s transition scenario only extends to 2040, while the IPCC examines 2050 and 2100. Both sets of scenarios refer to changes in global temperature by 2100 that result from action taken over the next few decades.
We apply these scenarios as they are reported and to the extent information is available (hence our exclusion of the Delayed Recovery Scenario and Net Zero Emissions by 2050, as discussed in Scope and boundaries). There are many instances where the assumptions are contrary to current trends or do not represent AES’ view of the future on which our corporate strategy is grounded, but they are modeled as presented for standardization purposes. Please see AES vision for more information about how we are thinking beyond these scenarios to enhance our strategic thinking and positioning.
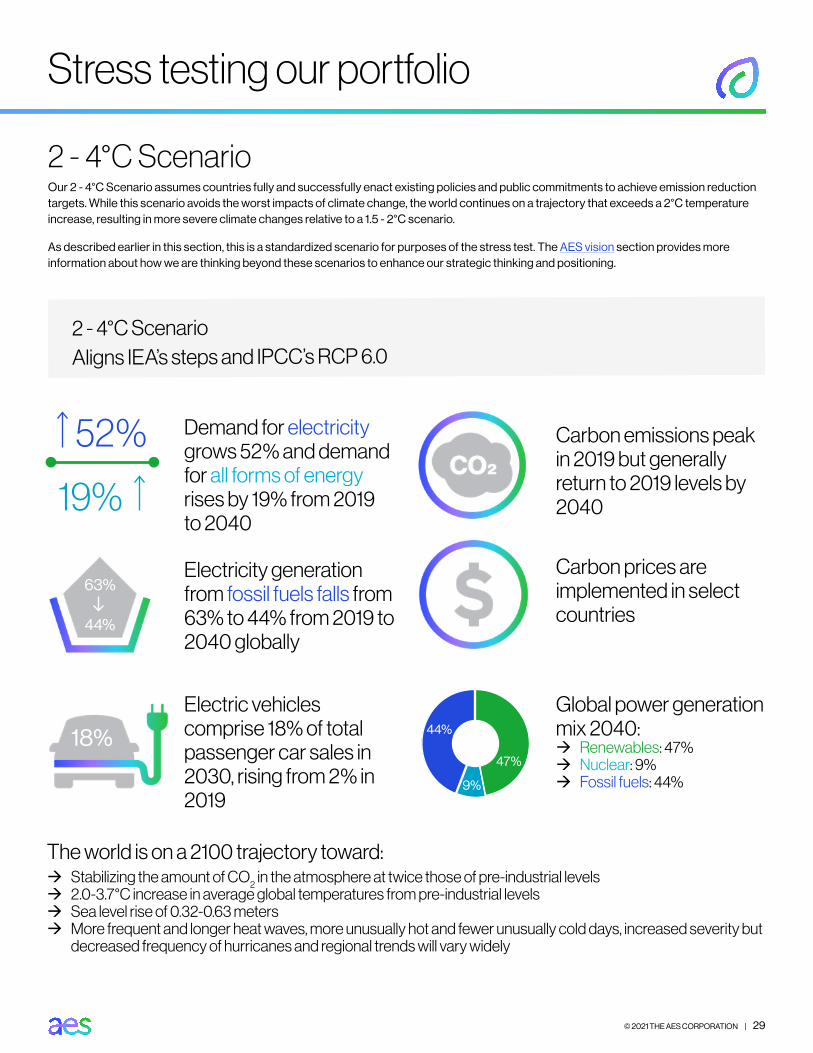
© 2021 THE AES CORPORATION | 29
Stress testing our portfolio
2 - 4°C ScenarioOur 2 - 4°C Scenario assumes countries fully and successfully enact existing policies and public commitments to achieve emission reduction targets. While this scenario avoids the worst impacts of climate change, the world continues on a trajectory that exceeds a 2°C temperature increase, resulting in more severe climate changes relative to a 1.5 - 2°C scenario.
As described earlier in this section, this is a standardized scenario for purposes of the stress test. The AES vision section provides more information about how we are thinking beyond these scenarios to enhance our strategic thinking and positioning.
Demand for electricity grows 52% and demand for all forms of energy rises by 19% from 2019 to 2040
52%
19%
Carbon emissions peak in 2019 but generally return to 2019 levels by 2040
Electricity generation from fossil fuels falls from 63% to 44% from 2019 to 2040 globally
44%
Carbon prices are implemented in select countries
Electric vehicles comprise 18% of total passenger car sales in 2030, rising from 2% in 2019
Global power generation mix 2040:
Æ Renewables: 47% Æ Nuclear: 9% Æ Fossil fuels: 44%
47%
9%
The world is on a 2100 trajectory toward: Æ Stabilizing the amount of CO
2 in the atmosphere at twice those of pre-industrial levels
Æ 2.0-3.7°C increase in average global temperatures from pre-industrial levels Æ Sea level rise of 0.32-0.63 meters Æ More frequent and longer heat waves, more unusually hot and fewer unusually cold days, increased severity but
decreased frequency of hurricanes and regional trends will vary widely
44%
63%
2 - 4°C Scenario Aligns IEA’s steps and IPCC’s RCP 6.0
18%

30 | © 2021 THE AES CORPORATION
Stress testing our portfolio
1.5 - 2°C ScenarioThe 1.5 - 2°C Scenario requires global emissions to peak as soon as possible and rapidly fall by 70% by 2050, until they hit net zero by 2070. The scenario defines how the global energy sector needs to change by 2040 to both limit temperature increases to 2°C and also achieve the UN’s related policy goals around energy access and air pollution. Under this scenario, the world has a near even chance of staying within the 2°C temperature increase1, thereby mitigating extreme impacts of climate change and the associated physical risk.
As described earlier in this section, this is a standardized scenario for purposes of the stress test. The AES vision of 2050 provides more information about how we are thinking beyond these scenarios to enhance our strategic thinking and positioning.
1 The IEA’s 2020 WEO states that if emissions were to remain at zero after 2070, the SDS would provide a 50% probability of limiting the temperature rise to less than 1.65°C, in line with the Paris Agreement objective of holding the increase in the global average temperature to well below 2°C. If negative emissions technologies were to be deployed after 2070 (at levels well below the median in scenarios assessed by the IPCC), the temperature rise in 2100 could be limited to 1.5°C with a 50% probability.
Demand for electricity grows 47% and demand for all forms of energy fall 10% from 2010 to 2040
47%
10%
Carbon emissions peak in 2019 and decrease by 56% through 2040
Electricity generation from fossil fuels falls to 17% of total global generation by 2040
17%
Carbon price schemes are established in all advanced economies, and emerging countries implement moderately less aggressive cap and trade schemes
Electric vehicles comprise 42% of total passenger car sales in 2030, rising from 2% in 2019
Global power generation mix 2040:
Æ Renewables: 72% Æ Nuclear: 11% Æ Fossil Fuels: 17%
72%
11%
17%
The world is on a 2100 trajectory toward: Æ Stabilizing the amount of CO
2 in the atmosphere at less than twice those of pre-industrial levels
Æ 0.3-1.7°C increase in average global temperatures from pre-industrial levels Æ Sea level rise of 0.26-0.55 meters Æ Generally mitigating the worst climate change impacts, but it is projected that there will be more frequent and
longer heat waves and regional trends will vary widely
1.5 - 2°C Scenario Aligns IEA’s SDS and IPCC’s RCP 2.6
42%
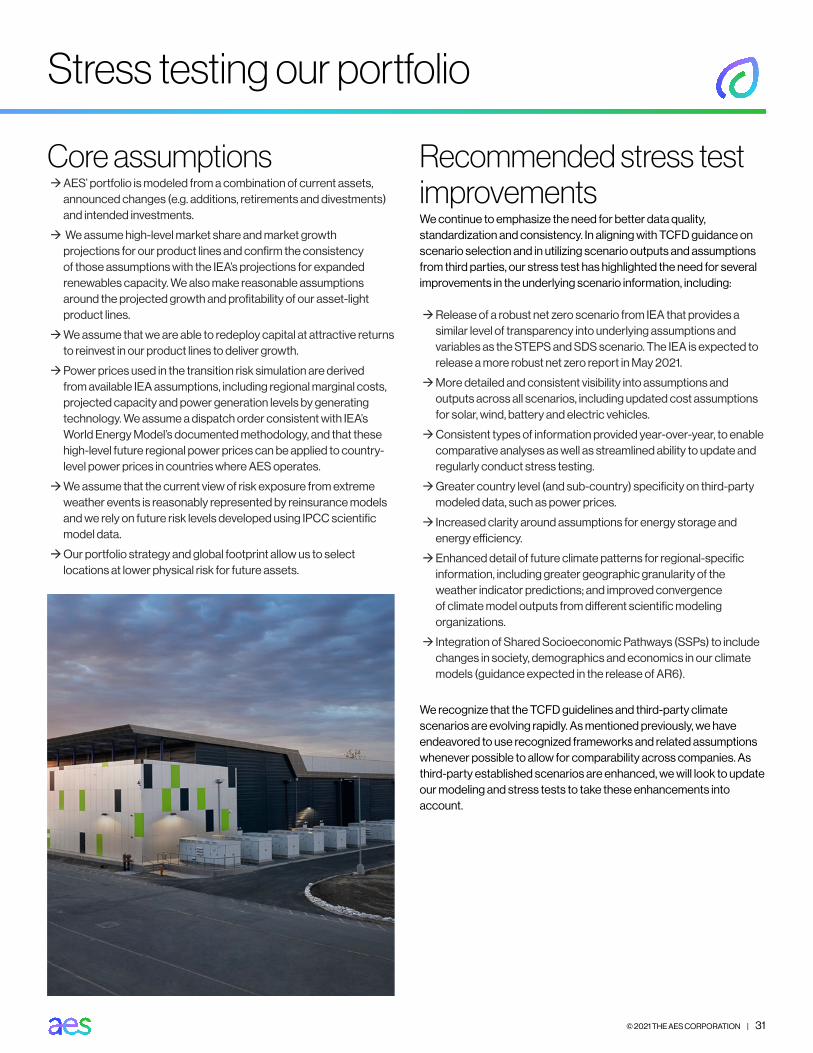
© 2021 THE AES CORPORATION | 31
Stress testing our portfolio
Core assumptions ÆAES’ portfolio is modeled from a combination of current assets, announced changes (e.g. additions, retirements and divestments) and intended investments.
Æ We assume high-level market share and market growth projections for our product lines and confirm the consistency of those assumptions with the IEA’s projections for expanded renewables capacity. We also make reasonable assumptions around the projected growth and profitability of our asset-light product lines.
ÆWe assume that we are able to redeploy capital at attractive returns to reinvest in our product lines to deliver growth.
ÆPower prices used in the transition risk simulation are derived from available IEA assumptions, including regional marginal costs, projected capacity and power generation levels by generating technology. We assume a dispatch order consistent with IEA’s World Energy Model’s documented methodology, and that these high-level future regional power prices can be applied to country-level power prices in countries where AES operates.
ÆWe assume that the current view of risk exposure from extreme weather events is reasonably represented by reinsurance models and we rely on future risk levels developed using IPCC scientific model data.
ÆOur portfolio strategy and global footprint allow us to select locations at lower physical risk for future assets.
Recommended stress test improvementsWe continue to emphasize the need for better data quality, standardization and consistency. In aligning with TCFD guidance on scenario selection and in utilizing scenario outputs and assumptions from third parties, our stress test has highlighted the need for several improvements in the underlying scenario information, including:
ÆRelease of a robust net zero scenario from IEA that provides a similar level of transparency into underlying assumptions and variables as the STEPS and SDS scenario. The IEA is expected to release a more robust net zero report in May 2021.
ÆMore detailed and consistent visibility into assumptions and outputs across all scenarios, including updated cost assumptions for solar, wind, battery and electric vehicles.
ÆConsistent types of information provided year-over-year, to enable comparative analyses as well as streamlined ability to update and regularly conduct stress testing.
ÆGreater country level (and sub-country) specificity on third-party modeled data, such as power prices.
Æ Increased clarity around assumptions for energy storage and energy efficiency.
ÆEnhanced detail of future climate patterns for regional-specific information, including greater geographic granularity of the weather indicator predictions; and improved convergence of climate model outputs from different scientific modeling organizations.
Æ Integration of Shared Socioeconomic Pathways (SSPs) to include changes in society, demographics and economics in our climate models (guidance expected in the release of AR6).
We recognize that the TCFD guidelines and third-party climate scenarios are evolving rapidly. As mentioned previously, we have endeavored to use recognized frameworks and related assumptions whenever possible to allow for comparability across companies. As third-party established scenarios are enhanced, we will look to update our modeling and stress tests to take these enhancements into account.
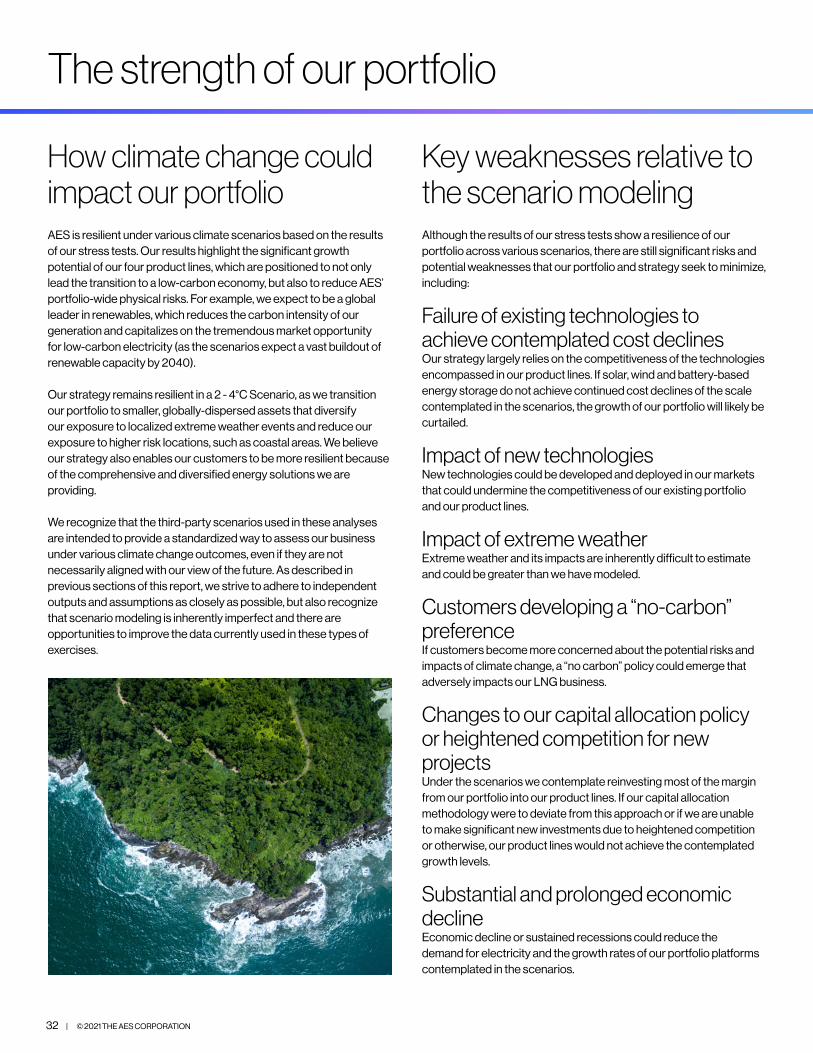
32 | © 2021 THE AES CORPORATION
The strength of our portfolio
How climate change could impact our portfolioAES is resilient under various climate scenarios based on the results of our stress tests. Our results highlight the significant growth potential of our four product lines, which are positioned to not only lead the transition to a low-carbon economy, but also to reduce AES’ portfolio-wide physical risks. For example, we expect to be a global leader in renewables, which reduces the carbon intensity of our generation and capitalizes on the tremendous market opportunity for low-carbon electricity (as the scenarios expect a vast buildout of renewable capacity by 2040).
Our strategy remains resilient in a 2 - 4°C Scenario, as we transition our portfolio to smaller, globally-dispersed assets that diversify our exposure to localized extreme weather events and reduce our exposure to higher risk locations, such as coastal areas. We believe our strategy also enables our customers to be more resilient because of the comprehensive and diversified energy solutions we are providing.
We recognize that the third-party scenarios used in these analyses are intended to provide a standardized way to assess our business under various climate change outcomes, even if they are not necessarily aligned with our view of the future. As described in previous sections of this report, we strive to adhere to independent outputs and assumptions as closely as possible, but also recognize that scenario modeling is inherently imperfect and there are opportunities to improve the data currently used in these types of exercises.
Key weaknesses relative to the scenario modelingAlthough the results of our stress tests show a resilience of our portfolio across various scenarios, there are still significant risks and potential weaknesses that our portfolio and strategy seek to minimize, including:
Failure of existing technologies to achieve contemplated cost declines Our strategy largely relies on the competitiveness of the technologies encompassed in our product lines. If solar, wind and battery-based energy storage do not achieve continued cost declines of the scale contemplated in the scenarios, the growth of our portfolio will likely be curtailed.
Impact of new technologies New technologies could be developed and deployed in our markets that could undermine the competitiveness of our existing portfolio and our product lines.
Impact of extreme weatherExtreme weather and its impacts are inherently difficult to estimate and could be greater than we have modeled.
Customers developing a “no-carbon” preferenceIf customers become more concerned about the potential risks and impacts of climate change, a “no carbon” policy could emerge that adversely impacts our LNG business.
Changes to our capital allocation policy or heightened competition for new projectsUnder the scenarios we contemplate reinvesting most of the margin from our portfolio into our product lines. If our capital allocation methodology were to deviate from this approach or if we are unable to make significant new investments due to heightened competition or otherwise, our product lines would not achieve the contemplated growth levels.
Substantial and prolonged economic declineEconomic decline or sustained recessions could reduce the demand for electricity and the growth rates of our portfolio platforms contemplated in the scenarios.
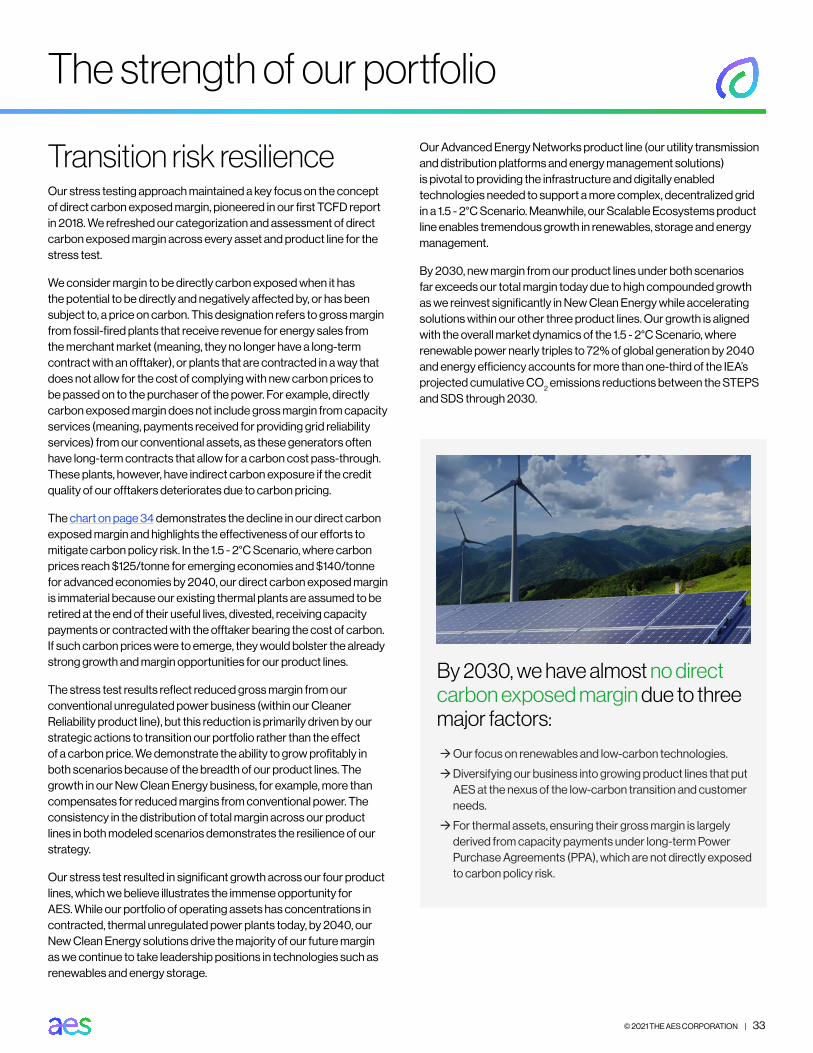
© 2021 THE AES CORPORATION | 33
The strength of our portfolio
Transition risk resilienceOur stress testing approach maintained a key focus on the concept of direct carbon exposed margin, pioneered in our first TCFD report in 2018. We refreshed our categorization and assessment of direct carbon exposed margin across every asset and product line for the stress test.
We consider margin to be directly carbon exposed when it has the potential to be directly and negatively affected by, or has been subject to, a price on carbon. This designation refers to gross margin from fossil-fired plants that receive revenue for energy sales from the merchant market (meaning, they no longer have a long-term contract with an offtaker), or plants that are contracted in a way that does not allow for the cost of complying with new carbon prices to be passed on to the purchaser of the power. For example, directly carbon exposed margin does not include gross margin from capacity services (meaning, payments received for providing grid reliability services) from our conventional assets, as these generators often have long-term contracts that allow for a carbon cost pass-through. These plants, however, have indirect carbon exposure if the credit quality of our offtakers deteriorates due to carbon pricing.
The chart on page 34 demonstrates the decline in our direct carbon exposed margin and highlights the effectiveness of our efforts to mitigate carbon policy risk. In the 1.5 - 2°C Scenario, where carbon prices reach $125/tonne for emerging economies and $140/tonne for advanced economies by 2040, our direct carbon exposed margin is immaterial because our existing thermal plants are assumed to be retired at the end of their useful lives, divested, receiving capacity payments or contracted with the offtaker bearing the cost of carbon. If such carbon prices were to emerge, they would bolster the already strong growth and margin opportunities for our product lines.
The stress test results reflect reduced gross margin from our conventional unregulated power business (within our Cleaner Reliability product line), but this reduction is primarily driven by our strategic actions to transition our portfolio rather than the effect of a carbon price. We demonstrate the ability to grow profitably in both scenarios because of the breadth of our product lines. The growth in our New Clean Energy business, for example, more than compensates for reduced margins from conventional power. The consistency in the distribution of total margin across our product lines in both modeled scenarios demonstrates the resilience of our strategy.
Our stress test resulted in significant growth across our four product lines, which we believe illustrates the immense opportunity for AES. While our portfolio of operating assets has concentrations in contracted, thermal unregulated power plants today, by 2040, our New Clean Energy solutions drive the majority of our future margin as we continue to take leadership positions in technologies such as renewables and energy storage.
By 2030, we have almost no direct carbon exposed margin due to three major factors:
ÆOur focus on renewables and low-carbon technologies.
ÆDiversifying our business into growing product lines that put AES at the nexus of the low-carbon transition and customer needs.
ÆFor thermal assets, ensuring their gross margin is largely derived from capacity payments under long-term Power Purchase Agreements (PPA), which are not directly exposed to carbon policy risk.
Our Advanced Energy Networks product line (our utility transmission and distribution platforms and energy management solutions) is pivotal to providing the infrastructure and digitally enabled technologies needed to support a more complex, decentralized grid in a 1.5 - 2°C Scenario. Meanwhile, our Scalable Ecosystems product line enables tremendous growth in renewables, storage and energy management.
By 2030, new margin from our product lines under both scenarios far exceeds our total margin today due to high compounded growth as we reinvest significantly in New Clean Energy while accelerating solutions within our other three product lines. Our growth is aligned with the overall market dynamics of the 1.5 - 2°C Scenario, where renewable power nearly triples to 72% of global generation by 2040 and energy efficiency accounts for more than one-third of the IEA’s projected cumulative CO
2 emissions reductions between the STEPS and SDS through 2030.
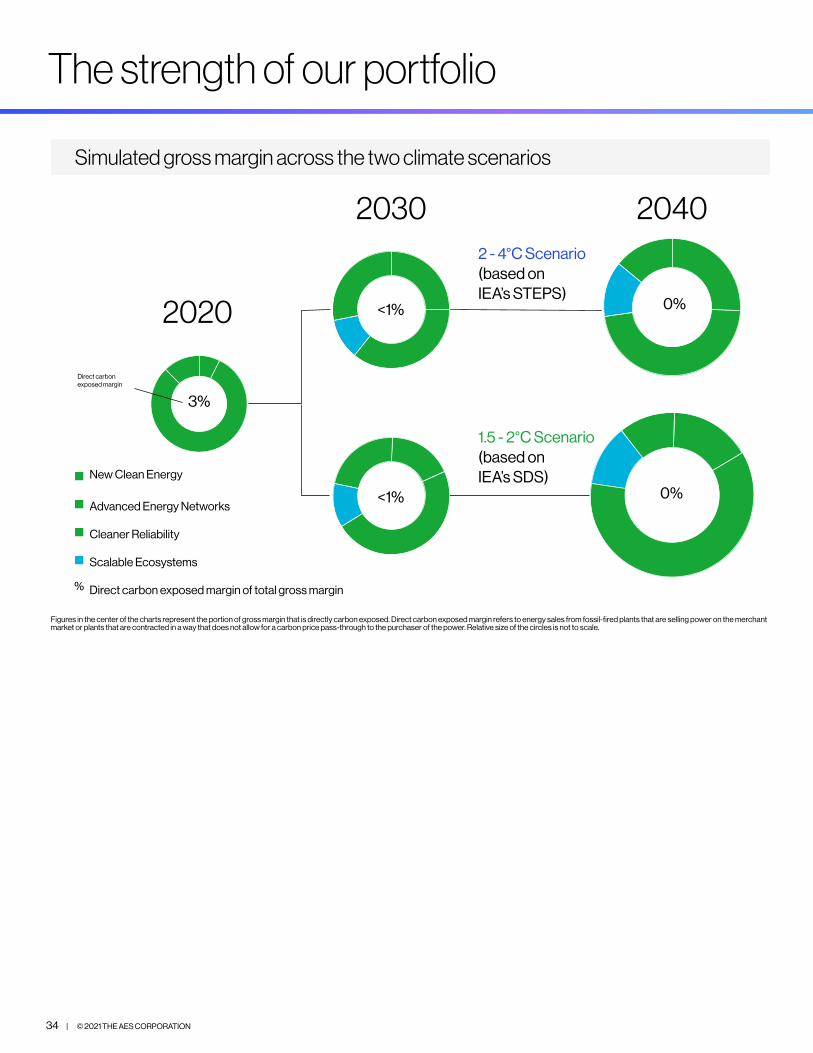
34 | © 2021 THE AES CORPORATION
The strength of our portfolio
Figures in the center of the charts represent the portion of gross margin that is directly carbon exposed. Direct carbon exposed margin refers to energy sales from fossil-fired plants that are selling power on the merchant market or plants that are contracted in a way that does not allow for a carbon price pass-through to the purchaser of the power. Relative size of the circles is not to scale.
Simulated gross margin across the two climate scenarios
New Clean Energy
Advanced Energy Networks
Cleaner Reliability
Scalable Ecosystems
Direct carbon exposed margin of total gross margin%
2020
2030 20402 - 4°C Scenario (based on IEA’s STEPS)
1.5 - 2°C Scenario (based on IEA’s SDS)
3%
<1% 0%
<1% 0%
Direct carbon exposed margin
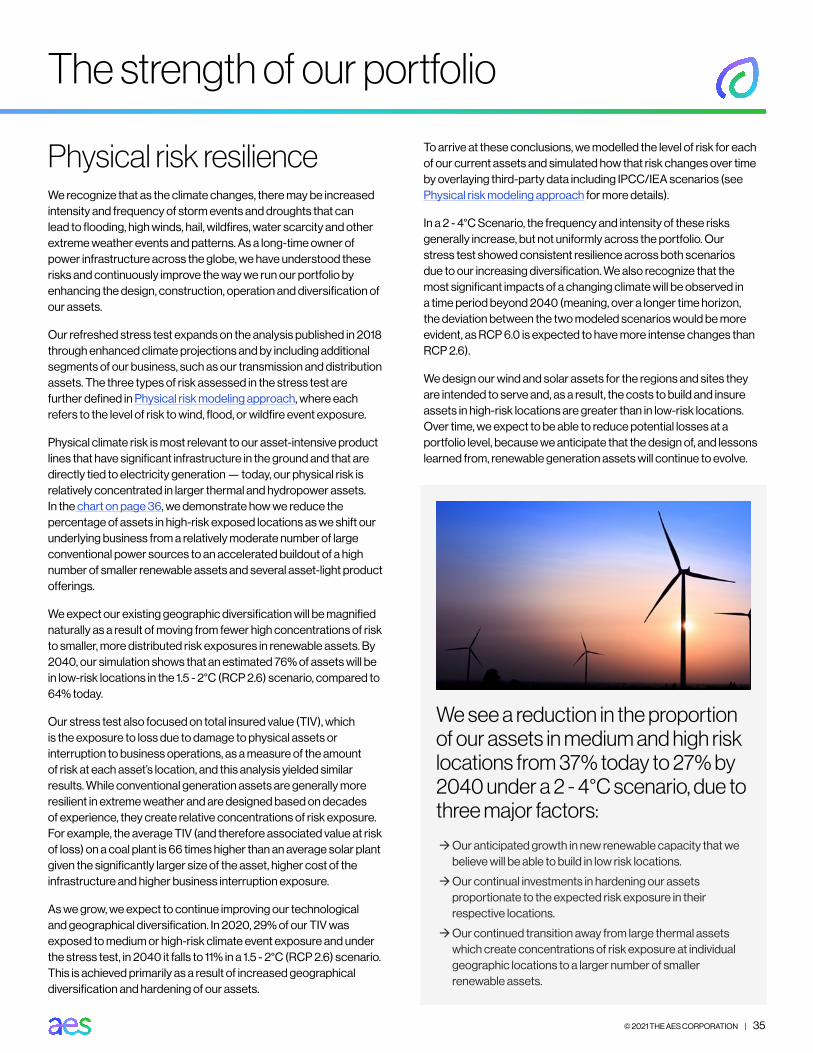
© 2021 THE AES CORPORATION | 35
The strength of our portfolio
Physical risk resilienceWe recognize that as the climate changes, there may be increased intensity and frequency of storm events and droughts that can lead to flooding, high winds, hail, wildfires, water scarcity and other extreme weather events and patterns. As a long-time owner of power infrastructure across the globe, we have understood these risks and continuously improve the way we run our portfolio by enhancing the design, construction, operation and diversification of our assets.
Our refreshed stress test expands on the analysis published in 2018 through enhanced climate projections and by including additional segments of our business, such as our transmission and distribution assets. The three types of risk assessed in the stress test are further defined in Physical risk modeling approach, where each refers to the level of risk to wind, flood, or wildfire event exposure.
Physical climate risk is most relevant to our asset-intensive product lines that have significant infrastructure in the ground and that are directly tied to electricity generation — today, our physical risk is relatively concentrated in larger thermal and hydropower assets. In the chart on page 36, we demonstrate how we reduce the percentage of assets in high-risk exposed locations as we shift our underlying business from a relatively moderate number of large conventional power sources to an accelerated buildout of a high number of smaller renewable assets and several asset-light product offerings.
We expect our existing geographic diversification will be magnified naturally as a result of moving from fewer high concentrations of risk to smaller, more distributed risk exposures in renewable assets. By 2040, our simulation shows that an estimated 76% of assets will be in low-risk locations in the 1.5 - 2°C (RCP 2.6) scenario, compared to 64% today.
Our stress test also focused on total insured value (TIV), which is the exposure to loss due to damage to physical assets or interruption to business operations, as a measure of the amount of risk at each asset’s location, and this analysis yielded similar results. While conventional generation assets are generally more resilient in extreme weather and are designed based on decades of experience, they create relative concentrations of risk exposure. For example, the average TIV (and therefore associated value at risk of loss) on a coal plant is 66 times higher than an average solar plant given the significantly larger size of the asset, higher cost of the infrastructure and higher business interruption exposure.
As we grow, we expect to continue improving our technological and geographical diversification. In 2020, 29% of our TIV was exposed to medium or high-risk climate event exposure and under the stress test, in 2040 it falls to 11% in a 1.5 - 2°C (RCP 2.6) scenario. This is achieved primarily as a result of increased geographical diversification and hardening of our assets.
To arrive at these conclusions, we modelled the level of risk for each of our current assets and simulated how that risk changes over time by overlaying third-party data including IPCC/IEA scenarios (see Physical risk modeling approach for more details).
In a 2 - 4°C Scenario, the frequency and intensity of these risks generally increase, but not uniformly across the portfolio. Our stress test showed consistent resilience across both scenarios due to our increasing diversification. We also recognize that the most significant impacts of a changing climate will be observed in a time period beyond 2040 (meaning, over a longer time horizon, the deviation between the two modeled scenarios would be more evident, as RCP 6.0 is expected to have more intense changes than RCP 2.6).
We design our wind and solar assets for the regions and sites they are intended to serve and, as a result, the costs to build and insure assets in high-risk locations are greater than in low-risk locations. Over time, we expect to be able to reduce potential losses at a portfolio level, because we anticipate that the design of, and lessons learned from, renewable generation assets will continue to evolve.
We see a reduction in the proportion of our assets in medium and high risk locations from 37% today to 27% by 2040 under a 2 - 4°C scenario, due to three major factors:
ÆOur anticipated growth in new renewable capacity that we believe will be able to build in low risk locations.
ÆOur continual investments in hardening our assets proportionate to the expected risk exposure in their respective locations.
ÆOur continued transition away from large thermal assets which create concentrations of risk exposure at individual geographic locations to a larger number of smaller renewable assets.
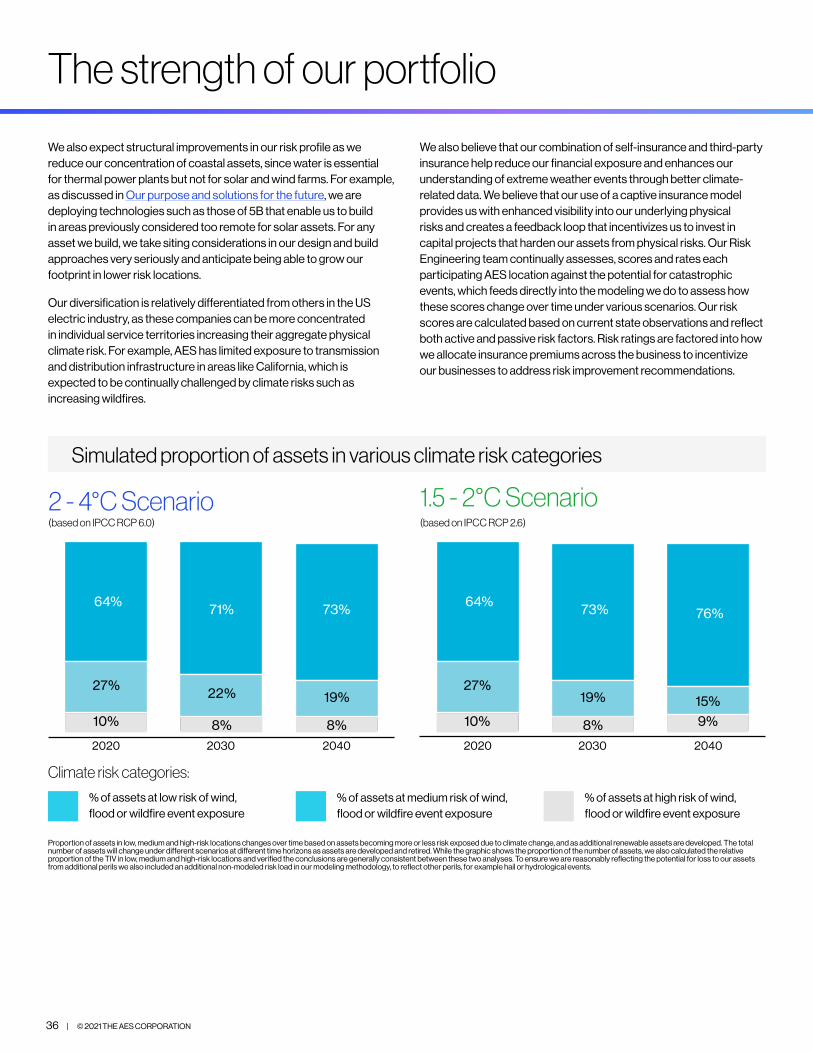
36 | © 2021 THE AES CORPORATION
The strength of our portfolio
We also expect structural improvements in our risk profile as we reduce our concentration of coastal assets, since water is essential for thermal power plants but not for solar and wind farms. For example, as discussed in Our purpose and solutions for the future, we are deploying technologies such as those of 5B that enable us to build in areas previously considered too remote for solar assets. For any asset we build, we take siting considerations in our design and build approaches very seriously and anticipate being able to grow our footprint in lower risk locations.
Our diversification is relatively differentiated from others in the US electric industry, as these companies can be more concentrated in individual service territories increasing their aggregate physical climate risk. For example, AES has limited exposure to transmission and distribution infrastructure in areas like California, which is expected to be continually challenged by climate risks such as increasing wildfires.
We also believe that our combination of self-insurance and third-party insurance help reduce our financial exposure and enhances our understanding of extreme weather events through better climate-related data. We believe that our use of a captive insurance model provides us with enhanced visibility into our underlying physical risks and creates a feedback loop that incentivizes us to invest in capital projects that harden our assets from physical risks. Our Risk Engineering team continually assesses, scores and rates each participating AES location against the potential for catastrophic events, which feeds directly into the modeling we do to assess how these scores change over time under various scenarios. Our risk scores are calculated based on current state observations and reflect both active and passive risk factors. Risk ratings are factored into how we allocate insurance premiums across the business to incentivize our businesses to address risk improvement recommendations.
% of assets at low risk of wind, flood or wildfire event exposure
% of assets at medium risk of wind, flood or wildfire event exposure
% of assets at high risk of wind, flood or wildfire event exposure
Simulated proportion of assets in various climate risk categories
Climate risk categories:
Proportion of assets in low, medium and high-risk locations changes over time based on assets becoming more or less risk exposed due to climate change, and as additional renewable assets are developed. The total number of assets will change under different scenarios at different time horizons as assets are developed and retired. While the graphic shows the proportion of the number of assets, we also calculated the relative proportion of the TIV in low, medium and high-risk locations and verified the conclusions are generally consistent between these two analyses. To ensure we are reasonably reflecting the potential for loss to our assets from additional perils we also included an additional non-modeled risk load in our modeling methodology, to reflect other perils, for example hail or hydrological events.
64% 73% 76%
27%19% 15%
64% 71% 73%
10% 8% 8%2020 2030 2040
2 - 4°C Scenario (based on IPCC RCP 6.0)
27% 22% 19%
10% 8% 9%
2020 2030 2040
1.5 - 2°C Scenario(based on IPCC RCP 2.6)

© 2021 THE AES CORPORATION | 37
Conclusion
At AES, we believe our solutions are well positioned to create significant value and positive impact in a 1.5-2°C scenario. Our comprehensive product lines are designed to support the critical elements needed to successfully transition the economy in line with the Paris Agreement.
Our New Clean Energy products will expand renewable energy capacity that not only helps lower the carbon intensity of the electricity grid, but also proactively helps our customers achieve their ambitious sustainability targets. Our technologically and geographically diverse portfolio, paired with energy storage, will lead to increased grid reliability. These products will capitalize on the tremendous market opportunity associated with the low carbon transition as we meet our customers desires for green energy.
Building out our Advanced Energy Networks capabilities will help us further foster a low-carbon transition. Through our utilities and digital platforms, we are building a grid that is more resilient, reliable and flexible. The grid of the future will smoothly integrate renewables and allow customers increased visibility and control over the energy they consume. Our Advanced Energy Networks expand our businesses, leading to new ways to support customers through digital solutions, and an increase in rate-based investments for our regulated businesses.
Our Cleaner Reliability product lines provide the capacity support to increase the buildout of renewables and position us at the forefront of helping countries that have historically been dependent on carbon intensive fuels. We are adapting our generation fleet in ways that support customers, communities and electricity markets. Our fuel logistics business has the potential to propel AES to the forefront of deploying hydrogen based synthetic fuels of the future.
Our Scalable Ecosystems bring the best innovations to the broader energy industry, not just to a few companies. Uplight’s software solutions connect energy customers to the decarbonization goals of power providers while helping customers save energy and lower costs. Fluence is building a more resilient grid with storage solutions and enabling the more efficient use of storage and renewables through its digital capabilities. With 5B, we can build solar three times faster using half the land. Collectively, Scalable Ecosystems empower businesses with access to the tools and networks that enable an adaptable, flexible approach to investing in green energy solutions.
We are accelerating the future of energy by combining the rapid buildout of renewable generation and storage, with digital capabilities, and the fuel logistics required to decarbonize difficult-to-electrify sectors. Our climate stress test demonstrated that our strategy is resilient across scenarios by both reducing our direct risks from climate policies or physical events, while simultaneously positioning us for growth.
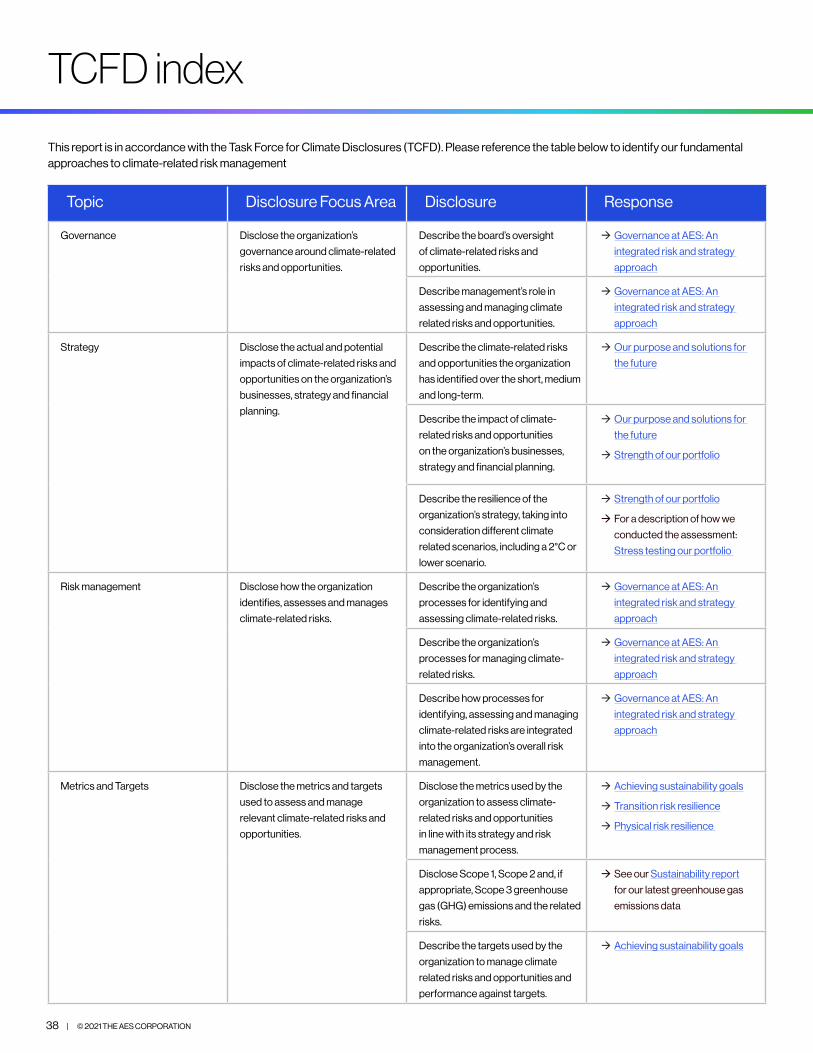
38 | © 2021 THE AES CORPORATION
TCFD index
This report is in accordance with the Task Force for Climate Disclosures (TCFD). Please reference the table below to identify our fundamental approaches to climate-related risk management
Topic Disclosure Focus Area Disclosure Response
Governance Disclose the organization’s
governance around climate-related
risks and opportunities.
Describe the board’s oversight
of climate-related risks and
opportunities.
Æ Governance at AES: An
integrated risk and strategy
approach
Describe management’s role in
assessing and managing climate
related risks and opportunities.
Æ Governance at AES: An
integrated risk and strategy
approach
Strategy Disclose the actual and potential
impacts of climate-related risks and
opportunities on the organization’s
businesses, strategy and financial
planning.
Describe the climate-related risks
and opportunities the organization
has identified over the short, medium
and long-term.
Æ Our purpose and solutions for
the future
Describe the impact of climate-
related risks and opportunities
on the organization’s businesses,
strategy and financial planning.
Æ Our purpose and solutions for
the future
Æ Strength of our portfolio
Describe the resilience of the
organization’s strategy, taking into
consideration different climate
related scenarios, including a 2°C or
lower scenario.
Æ Strength of our portfolio
Æ For a description of how we
conducted the assessment:
Stress testing our portfolio
Risk management Disclose how the organization
identifies, assesses and manages
climate-related risks.
Describe the organization’s
processes for identifying and
assessing climate-related risks.
Æ Governance at AES: An
integrated risk and strategy
approach
Describe the organization’s
processes for managing climate-
related risks.
Æ Governance at AES: An
integrated risk and strategy
approach
Describe how processes for
identifying, assessing and managing
climate-related risks are integrated
into the organization’s overall risk
management.
Æ Governance at AES: An
integrated risk and strategy
approach
Metrics and Targets Disclose the metrics and targets
used to assess and manage
relevant climate-related risks and
opportunities.
Disclose the metrics used by the
organization to assess climate-
related risks and opportunities
in line with its strategy and risk
management process.
Æ Achieving sustainability goals
Æ Transition risk resilience
Æ Physical risk resilience
Disclose Scope 1, Scope 2 and, if
appropriate, Scope 3 greenhouse
gas (GHG) emissions and the related
risks.
Æ See our Sustainability report
for our latest greenhouse gas
emissions data
Describe the targets used by the
organization to manage climate
related risks and opportunities and
performance against targets.
Æ Achieving sustainability goals

The AES Corporation4300 Wilson BoulevardArlington, VA 22203USA
703-522-1315 www.aes.com
Related Documents