Inclusive, Resilient and Sustainable Housing for Urban Poor Sector Project in Tamil Nadu (RRP IND 53067-004) Climate Risk and Vulnerability Assessment August 2021 India: Inclusive, Resilient, and Sustainable Housing for the Urban Poor Sector Project in Tamil Nadu

Welcome message from author
This document is posted to help you gain knowledge. Please leave a comment to let me know what you think about it! Share it to your friends and learn new things together.
Transcript
Inclusive, Resilient and Sustainable Housing for Urban Poor Sector Project in Tamil Nadu (RRP IND 53067-004)
Climate Risk and Vulnerability Assessment
August 2021
India: Inclusive, Resilient, and Sustainable Housing for the Urban Poor Sector Project in Tamil Nadu
CONTENTS
Pages
I. INTRODUCTION 1 Project Description 1 Climate Vulnerability 1 Addressing climate vulnerabilities in the design of social housing 3
II. CLIMATE CHANGE RISK ASSESSMENT 4 Baseline climate 4 Climate change scenarios 11 Climate Futures approach 12 Climate risks 13 Thermal comfort and overheating risks 14 Water resources risks 16 Risks related to Tropical Cyclones (high winds and heavy rainfall) 17
III. ADAPTATION ASSESSMENT 19 Thermal Comfort 23 Energy Efficiency 24 Water services 25 Greenbelt 30 Roads 30 Disaster Risk Management Plans 31 Institutional development and capacity building 31 Summary 31
IV. REFERENCES 38
TABLES:
1. Site screening information on new urban developments and relocation sites 3 2. Climate exposure of each site (*key sites with detailed information available) 1 3. Climate sensitivity: Social housing 2 4. Generalised project vulnerability (sensitivity x exposure) to climate variables and climate-
related hazards highlighting areas of risk assessment (red) 3 5. Groundwater status in selected Tamil Nadu Districts based on Ministry of Water
Resources Reports (from 2007 onwards) 8 6. Simplified Climate Futures for risk assessment (2050s time period) 12 7. High level climate risk scorecard for three simplified climate change scenarios 13 8. Impacts of heat on different types of dwellings (DU – Dwelling Unit) 15 9: ASHRAE 2005 design conditions for Tirruchchirapalli, India and the potential increase in
frequency of extreme hot conditions 16 10. Summary of proposed climate adaptation measures in site concept plans and potential
enhanced adaptation (1-Reddiyarpatti, 2-Kalanivasal, 3-Vallam) 19 11. Summary of the climate risks and vulnerability of the project components 32 12. Summary of mitigation and adaptation activities and justification of adaptation costs 35
FIGURES:
APPENDIXES: 1. Further Information on Project Resettlement Sites 2. Climate Information for Tamil Nadu 3. Good Practice Guidance in Including Climate Change in Social Housing Projects 4. Costed Adaptation Measures
1. An overview of the Project Outputs and climate vulnerability context 2 2. Location of new development sites across Tamil Nadu 1 3. Tropical Cyclone and Wind Hazard in Tamil Nadu (3 sites shown as red diamonds) 1 4. Baseline precipitation and temperature (a) FAO Climate data files (1971-2000) for two
sites in Tamil Nadu; (b) seasonal precipitation (1984-2017) and (c) rainfall by season in the Cauvery Delta Area 6
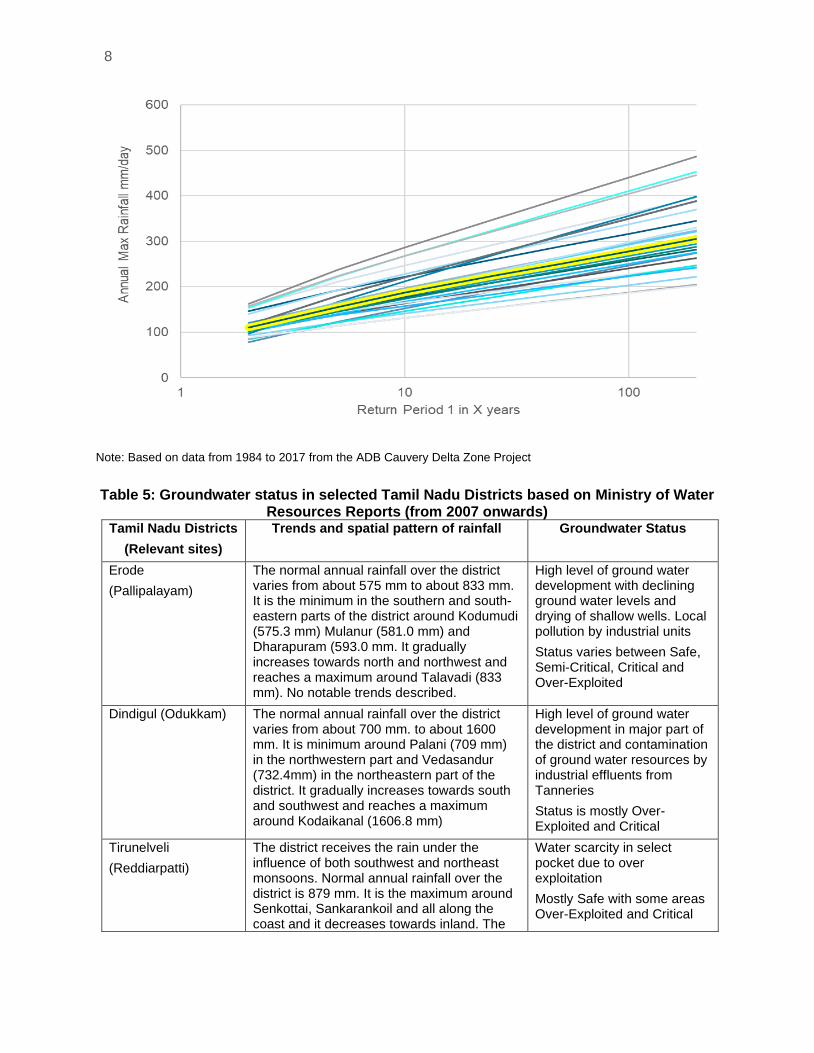
5. Rainfall Extreme Value Analysis for 29 sites in Central Tamil Nadu (24-hour rainfall totals, most relevant for site 3) 7
6. Example temperature anomalies oC (above 1986-2005 average) 10 7. NASA statistically downscaled CMIP5 projections of changes in maximum rainfall and
average temperatures for the mid-term and long-term future 12 8. ASHRAE 2005 design conditions for Tirruchchirapalli (dark blue), India and the potential
impact of climate change on dry bulb temperature under three 2050s scenarios 16 9. Tropical cyclones which formed in the north Indian Ocean, or moved into that basin from
the northwest Pacific Ocean, from 1970 to 2005. 17 10. Number of Tropical Depressions and Storms in the North Indian Basin 19 11. Example of thermal modelling studies for the development in Vallam 24 12. Example of Vallam water treatment and recycling process 27 13. Design of stormwater systems and recharge pits 28
ABBREVIATIONS
ADB – Asian Development Bank BREEAM
– Building Research Establishment Environmental Assessment Method
CMIP –
Coupled Model Intercomparison Project (number that follows is the phase)
CRA – Climate risk assessment CRVA – Climate Risk and Vulnerability Assessment CRMF – Climate Risk Management Framework ECBD – Energy Conservation Building Directives (ECBD 2017 and 2018) EDGE
– Green building certification system promoted by International Finance Corporation (IFC)
ECMWF – European Centre for Medium Range Weather Forecasting ENSO – El Niño Southern Oscillation ERA5 – Fifth‐generation global climate reanalysis of the ECMWF ESRL – Earth System Research Laboratory GCM – Global Climate Model GDP – Gross Domestic Product GHG – Greenhouse gas GIS – Geographic Information System GRIHA – Green Rating for Integrated Habitat Assessment IDB – InterAmerican Development Bank IPCC – Intergovernmental Panel on Climate Change NASA – National Aeronautics and Space Administration (US) NDC – Nationally Determined Contribution PET – Potential evapotranspiration Tamil Nadu Slum Clearance Board PPTA – Project Preparation Technical Assistance RCM – Regional Climate Model RCP – Representative Concentration Pathway SDCC – Sustainable Development and Climate Change Department SDG – Sustainable Development Goal TNSAPCC – Tamil Nadu State Action Plan on Climate Change TNSCB – Tamil Nadu Slum Clearance Board WASH – Water, sanitation, and hygiene WMO – World Meteorological Organization
EXECUTIVE SUMMARY 1. This report provides a Climate Change Risk and Vulnerability Assessment (CRVA) for the proposed loan for the Inclusive, Resilient, and Sustainable Housing for the Urban Poor Sector Project in Tamil Nadu; a number of social housing projects will relocate vulnerable communities living in high risk areas to social housing that is designed to provide access to essential services and buildings that are resilient to regional hazards including heatwaves, tropical cyclones, floods and droughts. A. Climate trends in Tamil Nadu
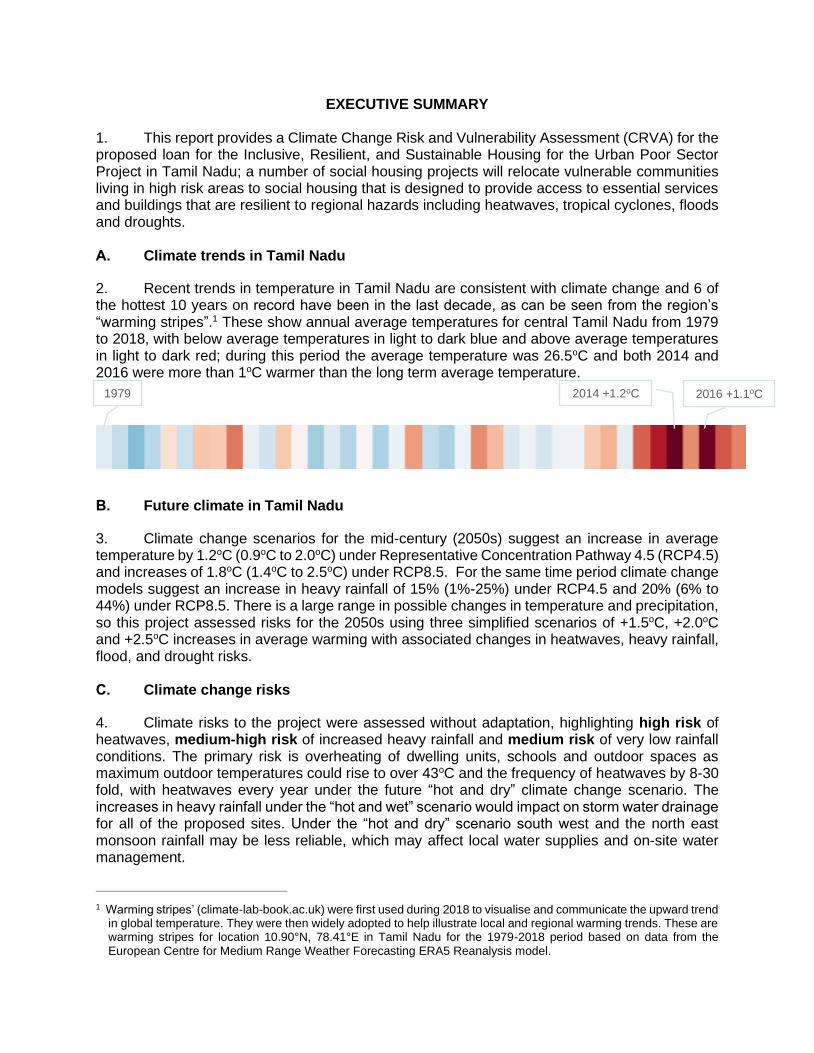
2. Recent trends in temperature in Tamil Nadu are consistent with climate change and 6 of the hottest 10 years on record have been in the last decade, as can be seen from the region’s “warming stripes”.1 These show annual average temperatures for central Tamil Nadu from 1979 to 2018, with below average temperatures in light to dark blue and above average temperatures in light to dark red; during this period the average temperature was 26.5oC and both 2014 and 2016 were more than 1oC warmer than the long term average temperature.
B. Future climate in Tamil Nadu
3. Climate change scenarios for the mid-century (2050s) suggest an increase in average temperature by 1.2oC (0.9oC to 2.0oC) under Representative Concentration Pathway 4.5 (RCP4.5) and increases of 1.8oC (1.4oC to 2.5oC) under RCP8.5. For the same time period climate change models suggest an increase in heavy rainfall of 15% (1%-25%) under RCP4.5 and 20% (6% to 44%) under RCP8.5. There is a large range in possible changes in temperature and precipitation, so this project assessed risks for the 2050s using three simplified scenarios of +1.5oC, +2.0oC and +2.5oC increases in average warming with associated changes in heatwaves, heavy rainfall, flood, and drought risks. C. Climate change risks
4. Climate risks to the project were assessed without adaptation, highlighting high risk of heatwaves, medium-high risk of increased heavy rainfall and medium risk of very low rainfall conditions. The primary risk is overheating of dwelling units, schools and outdoor spaces as maximum outdoor temperatures could rise to over 43oC and the frequency of heatwaves by 8-30 fold, with heatwaves every year under the future “hot and dry” climate change scenario. The increases in heavy rainfall under the “hot and wet” scenario would impact on storm water drainage for all of the proposed sites. Under the “hot and dry” scenario south west and the north east monsoon rainfall may be less reliable, which may affect local water supplies and on-site water management.
1 Warming stripes’ (climate-lab-book.ac.uk) were first used during 2018 to visualise and communicate the upward trend
in global temperature. They were then widely adopted to help illustrate local and regional warming trends. These are warming stripes for location 10.90°N, 78.41°E in Tamil Nadu for the 1979-2018 period based on data from the European Centre for Medium Range Weather Forecasting ERA5 Reanalysis model.
2014 +1.2oC 2016 +1.1oC 1979
ii
D. Climate adaptation
5. The masterplans for social housing have a strong emphasis on sustainable building design and some aspects of detailed design can be aligned to the principles of India’s green building rating systems,2 particularly the use of passive cooling, water efficiency measures and stormwater drainage design. 6. The main linkages between project activities and climate vulnerabilities are in the “climate sensitive” designs of the social housing that includes passive cooling, the provision of at least 15% green belt, water recycling and efficiency measures, stormwater drainage, and disaster risk management planning. In addition, the slum clearance sites will include the clearance of urban waterways and the project will support improved regional planning, including improved strategies, guidelines and standards for climate adaptation. 7. Stronger links could be made between project designs and future climate change, however a suitable framework for mainstreaming climate adaptation in social housing should be developed as part of Output 3 of the Regional Plan Development. This could enhance adaptation by (i) making a stronger linkage between increases in heavy rainfall and stormwater design, (ii) greater greenspace and provision of shade in schools and other community buildings, and (iii) introducing further water efficiency measures within the dwelling units. E. Mitigation Assessment
8. The design features include daylighting, use of LEDs for lighting and the consideration of biogas reactors to turn solid waste into renewable energy and fertiliser products at each site. Good access is provided to public transport, which can reduce the use of private vehicles. F. Climate Finance
9. The CRVA estimates Climate Finance of 22% of the total funding (Asian Development Bank [ADB] loan and co-funding) if the adaptation and mitigation activities were all considered as part of the ADB loan.3 This report reviewed the proposed climate adaptation activities, including Bills of Quantities for one resettlement site, and found that this preliminary estimate for Climate Action was reasonable based on the information available, particularly due to the number of climate adaptation activities that were promoted in the site masterplans and features already included in the conceptual plans, which aligned to relevant national and international sustainable building codes.4
2 Energy Conservation Building Directives (ECBD 2017 and 2018) and Green Rating for Integrated Habitat Assessment:
https://www.grihaindia.org/self-evaluation-checklist. https://asiandevbank.sharepoint.com/:b:/r/teams/grp_sard_psg/Shared%20Documents/53067-004%20IND%20TNIRSHUP/For%20External%20Sharing/Kalanivasal_Final%20PPT_Final_Sent%20to%20ADB_20191227_compresssed.pdf?csf=1&web=1&e=xTCmMc
3 The Project Concept Paper (July 2020) allocated 23% of the overall funding to climate mitigation and adaptation. 4 Several Multi-lateral Development Banks (MDBs) have developed approaches for accounting for climate finance in
buildings under the so-called MDB Common Framework, which assign values to climate finance based on adherence to sustainable building codes and standards. For example: Towards 30% of climate finance: how can buildings contribute to it: guide for the incorporation and accounting of mitigation and adaptation measures to climate change /Livia Minoja, Luz Fernández, Rossemary Yurivilca. p. cm. — (IDB Technical Note ; 1458)
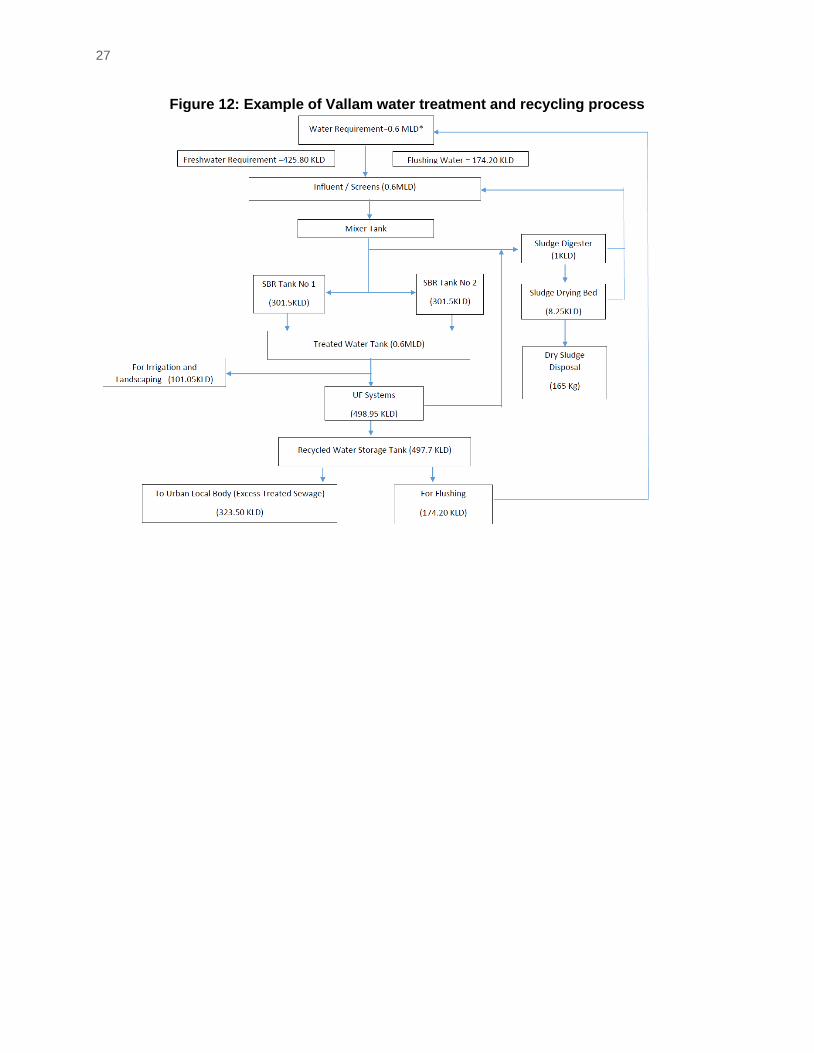
1
I. INTRODUCTION
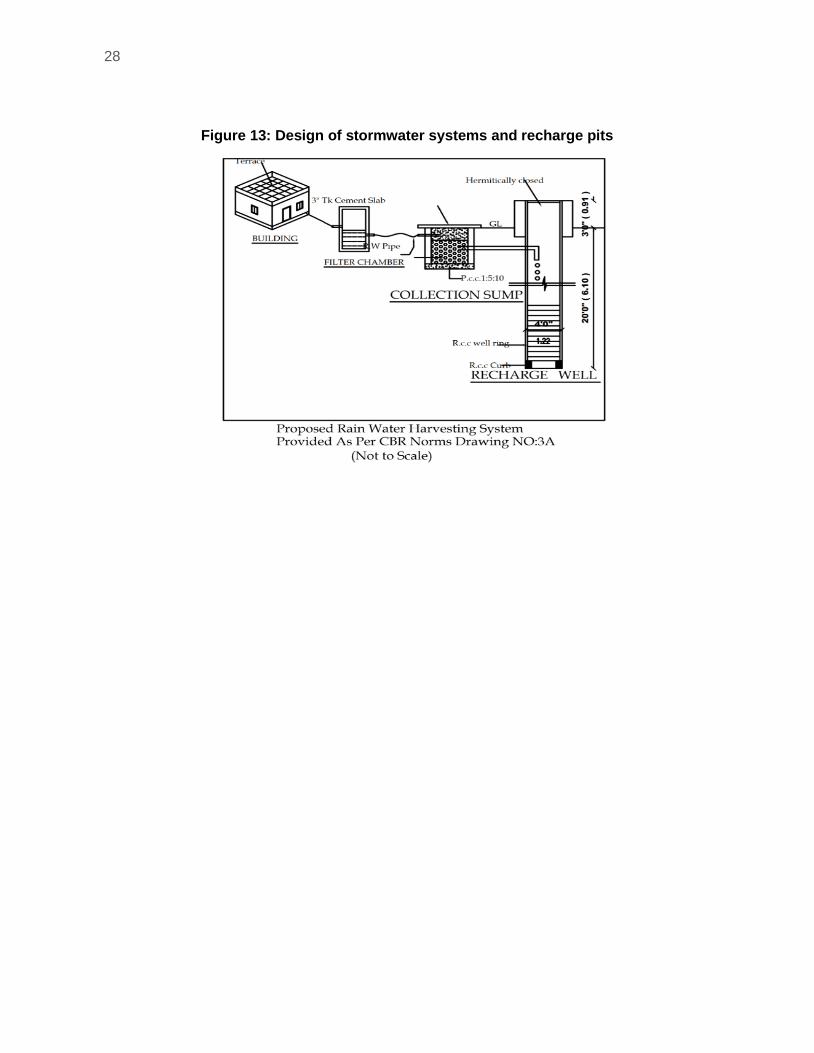
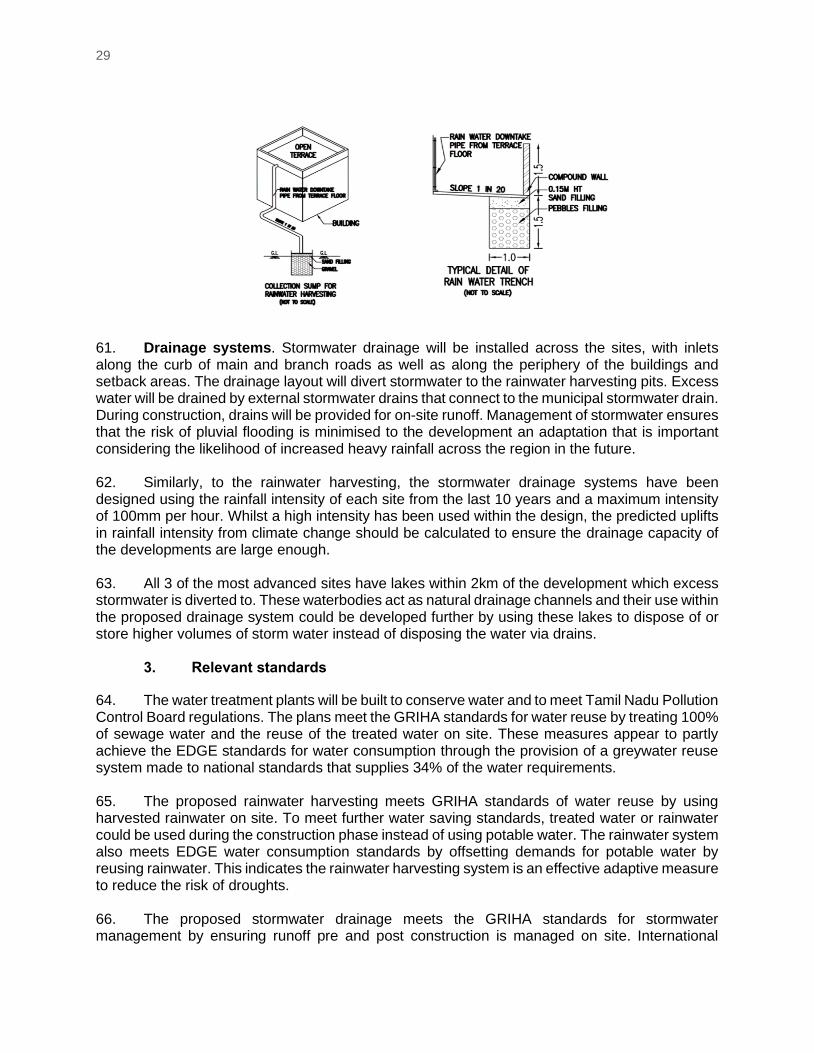
1. This report provides a Climate Change Risk and Vulnerability Assessment (CRVA) for proposed social housing projects in Tamil Nadu, India that will relocate vulnerable communities living in high-risk areas to sustainable social housing that is designed to provide access to essential services and buildings that are resilient to regional hazards including heatwaves, tropical cyclones, floods and droughts.
(i) Section 1 provides a project description, the broad climate vulnerability context and the project’s clear intent to develop sustainable social housing with strong green buildings and climate resilience features.
(ii) Section 2 provides a climate change risk assessment, including a description of the current climate, recent trends and climate change scenarios for Tamil Nadu based on the Intergovernmental Panel on Climate Change (IPCC) Fifth Assessment Report and Tamil Nadu climate change strategy documents.
(iii) Section 3 provides an adaptation assessment that links the climate risks with project activities and proposed adaptation measures that are included in the concept design documents.
2. Further information and background material are provided in the Appendices:
(i) Appendix 1 includes further information about each project site. (ii) Appendix 2 includes further climate information for Tamil Nadu. (iii) Appendix 3 includes good practice guidance on including climate change in social
housing projects based on international best practice. (iv) Appendix 4 summarises assumptions related to the Climate Finance calculations.
Project Description
3. The proposed project aims to increase the access to inclusive housing stock for the urban poor and migrant workers in Tamil Nadu. The project outputs are summarised in Figure 1, with an emphasis on the climate vulnerability context. The total project cost is $215 million, including taxes and duties and other contingencies. The Asian Development Bank (ADB) is providing a loan of 70%, $150 million. In the ADB Concept Paper (July 2020) the total climate financing was estimated at $50 million (23.2% of overall costs), with the exact ADB share to be confirmed during project preparation. Adaptation measures are those to be incorporated into the building design, provision of greenspace and improved climate resilient regional development, whereas climate mitigation measures are focused on promoting energy saving through ‘daylighting’ and passive cooling, the use of renewable energy and proper management of waste, which are essentially greenhouse gas emission reductions. The Government of Tamil Nadu through the Housing and Urban Development Department will be the executing agency responsible for overall project management. The Tamil Nadu Slum Clearance Board (TNSCB) will be the implementing agency for Output 1; the Tamil Nadu Infrastructure Fund Management Corporation for Output 2; and the Directorate of Town and Country Planning for Output 3.
4. The Third, Fourth and the Fifth Assessment Reports of the IPCC have all recognized that residents of informal settlements are at a higher risk to climate change-related events due to poor quality of their housing, inadequate services and location on hazardous sites such as low-lying areas, marshy lands and hill-slopes. In addition, informal housing areas can be highly dense and without open spaces or green cover that can mitigate urban heat impacts. From this perspective,
2
slum clearance could be considered as a significant climate adaptation activity5 to the project, as well as the incremental or proportional costs of adaptation of buildings, co-benefits of water clearance and capacity building activities.
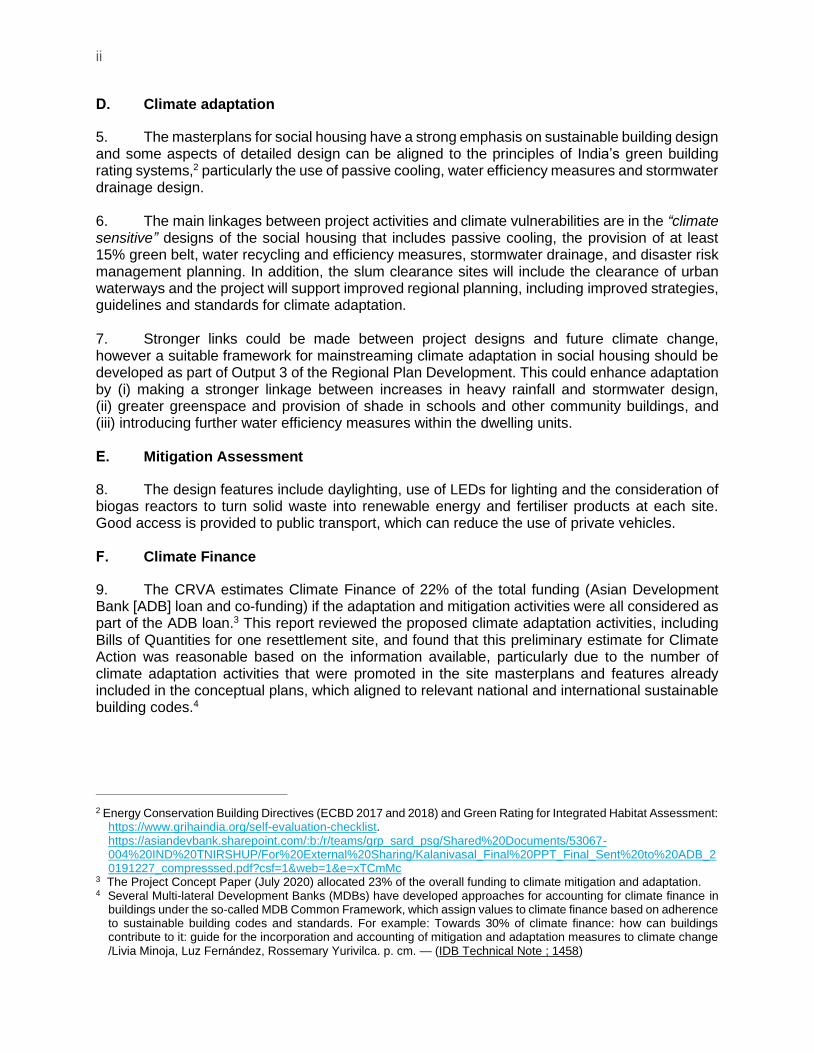
Figure 1: An overview of the Project Outputs and climate vulnerability context
5. The project framework can accommodate both climate mitigation and adaptation indicators related to both the removal of vulnerable communities from hazardous locations (canals, riverbanks, areas with no sanitation) (Output 1) and the provision of high-quality sustainable housing with green features, such a passive cooling, shade, green space and sustainable drainage systems (Outputs 1 and 2). The provision of spatial planning and suitable “net zero” construction and climate adaptation guidelines under Output 3 could embed Climate Action successfully into future social housing projects in Tamil Nadu. At this stage most information is available for Output 1 and it was assumed that activities related to Output 2 would provide the same level of climate resilience, adaptation and mitigation.
1. Site locations for Output 1
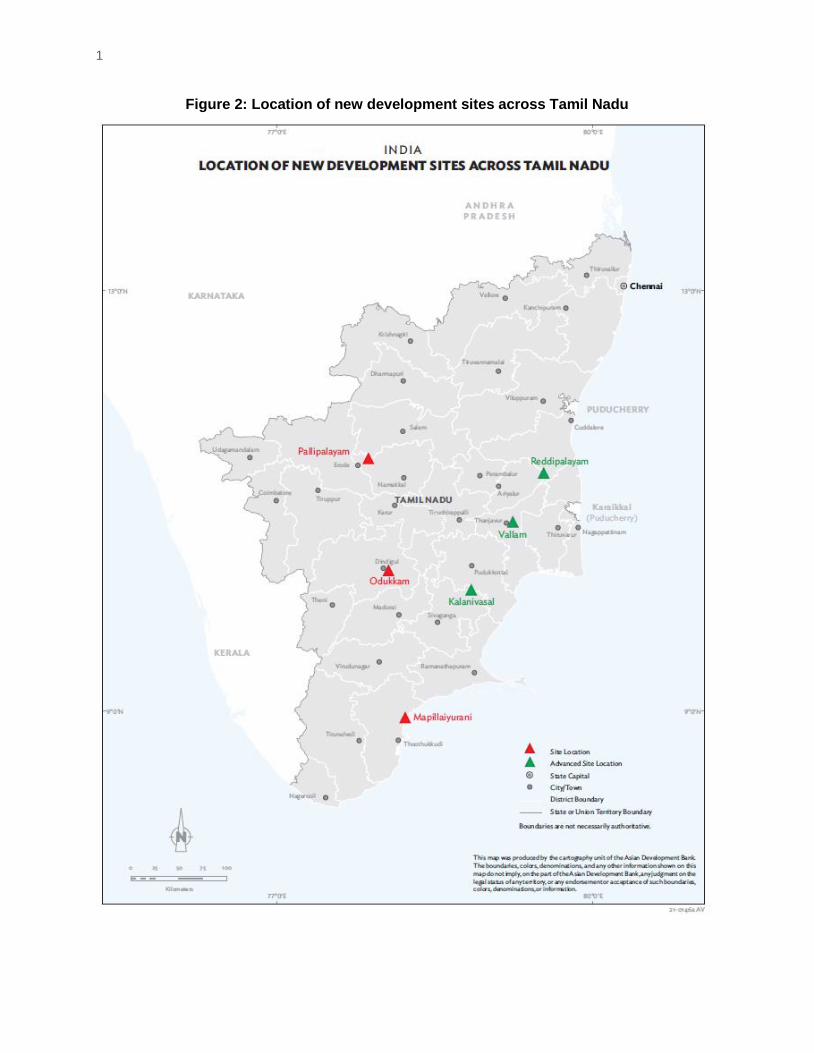
6. Site locations being proposed for Output 1 are summarised in Table 1 and are shown in Figure 2. The ‘relocation’ sites, that people will be removed from, are generally informal settlements in areas with very poor-quality land including locations in canals and other waterways where people are exposed to flooding and health risks. Potential development sites are located throughout the state of Tamil Nadu with most of them on open scrubland adjacent to other housing or industrial areas (Appendix 1 for site information).
7. There were six potential resettlement sites at the time of writing, but the report is focused on the most advanced sites of Vallam, Kalanivasal and Reddiarpatti that have Conceptual Plans. Other sites are spread across the state and away from the coastline, so sea level rise is not considered in detail.
5 Cited from Mahadevia et al., 2020. Climate Change, Heat Waves and Thermal Comfort—Reflections on Housing Policy in India. Environment and Urbanization ASIA 11(1) 29–50, 2020. DOI: 10.1177/0975425320906249
Output 1: Affordable housing for vulnerable
communities
• Relocation from slums to safer locations, improved design and O&M, increased participation from vulnerable groups
• Those living in slums have high exposure to hazards (e.g. extreme heat and floods), and low capacity to cope with climate extremes
• Cleared waterways to restore ecological functions and prevent re-encroachment
Output 2: Affordable housing for urban poor and migrant
workers
• Support to Shelter Fund, PPP to provide affordable housing for working women and industrial workers
• Migrant workers have low awareness of local conditions including environmental hazards and would otherwise locate in affordable but poor quality housing
Output 3: Regional Plan Development
• Support regional planning focused for economic development
• Provision of afforbable and sustainable housing enables green economic growth
• Incorporation of Disaster Risk Management and climate change adaptation into regional planning promotes climate resilient development
3
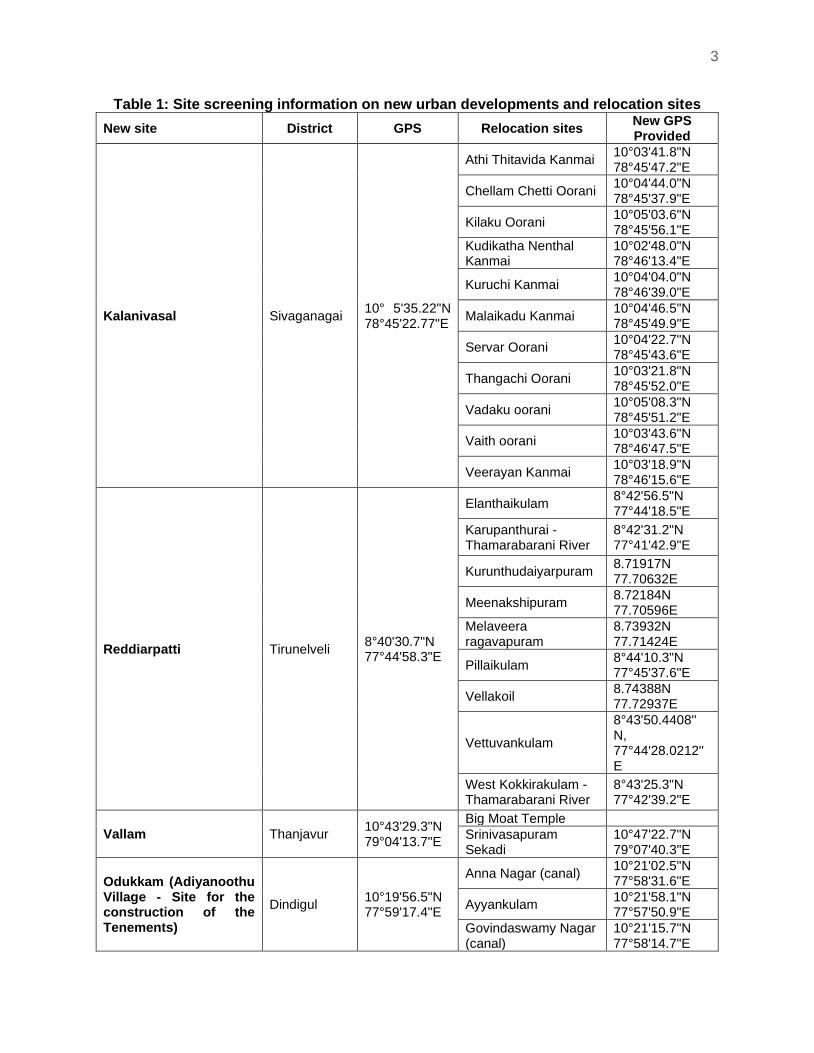
Table 1: Site screening information on new urban developments and relocation sites
New site District GPS Relocation sites New GPS Provided
Kalanivasal Sivaganagai 10° 5'35.22"N 78°45'22.77"E
Athi Thitavida Kanmai 10°03'41.8"N 78°45'47.2"E
Chellam Chetti Oorani 10°04'44.0"N 78°45'37.9"E
Kilaku Oorani 10°05'03.6"N 78°45'56.1"E
Kudikatha Nenthal Kanmai
10°02'48.0"N 78°46'13.4"E
Kuruchi Kanmai 10°04'04.0"N 78°46'39.0"E
Malaikadu Kanmai 10°04'46.5"N 78°45'49.9"E
Servar Oorani 10°04'22.7"N 78°45'43.6"E
Thangachi Oorani 10°03'21.8"N 78°45'52.0"E
Vadaku oorani 10°05'08.3"N 78°45'51.2"E
Vaith oorani 10°03'43.6"N 78°46'47.5"E
Veerayan Kanmai 10°03'18.9"N 78°46'15.6"E
Reddiarpatti Tirunelveli 8°40'30.7"N 77°44'58.3"E
Elanthaikulam 8°42'56.5"N 77°44'18.5"E
Karupanthurai - Thamarabarani River
8°42'31.2"N 77°41'42.9"E
Kurunthudaiyarpuram 8.71917N 77.70632E
Meenakshipuram 8.72184N 77.70596E
Melaveera ragavapuram
8.73932N 77.71424E
Pillaikulam 8°44'10.3"N 77°45'37.6"E
Vellakoil 8.74388N 77.72937E
Vettuvankulam
8°43'50.4408'' N, 77°44'28.0212'' E
West Kokkirakulam - Thamarabarani River
8°43'25.3"N 77°42'39.2"E
Vallam Thanjavur 10°43'29.3"N 79°04'13.7"E
Big Moat Temple
Srinivasapuram Sekadi
10°47'22.7"N 79°07'40.3"E
Odukkam (Adiyanoothu Village - Site for the construction of the Tenements)
Dindigul 10°19'56.5"N 77°59'17.4"E
Anna Nagar (canal) 10°21'02.5"N 77°58'31.6"E
Ayyankulam 10°21'58.1"N 77°57'50.9"E
Govindaswamy Nagar (canal)
10°21'15.7"N 77°58'14.7"E
4
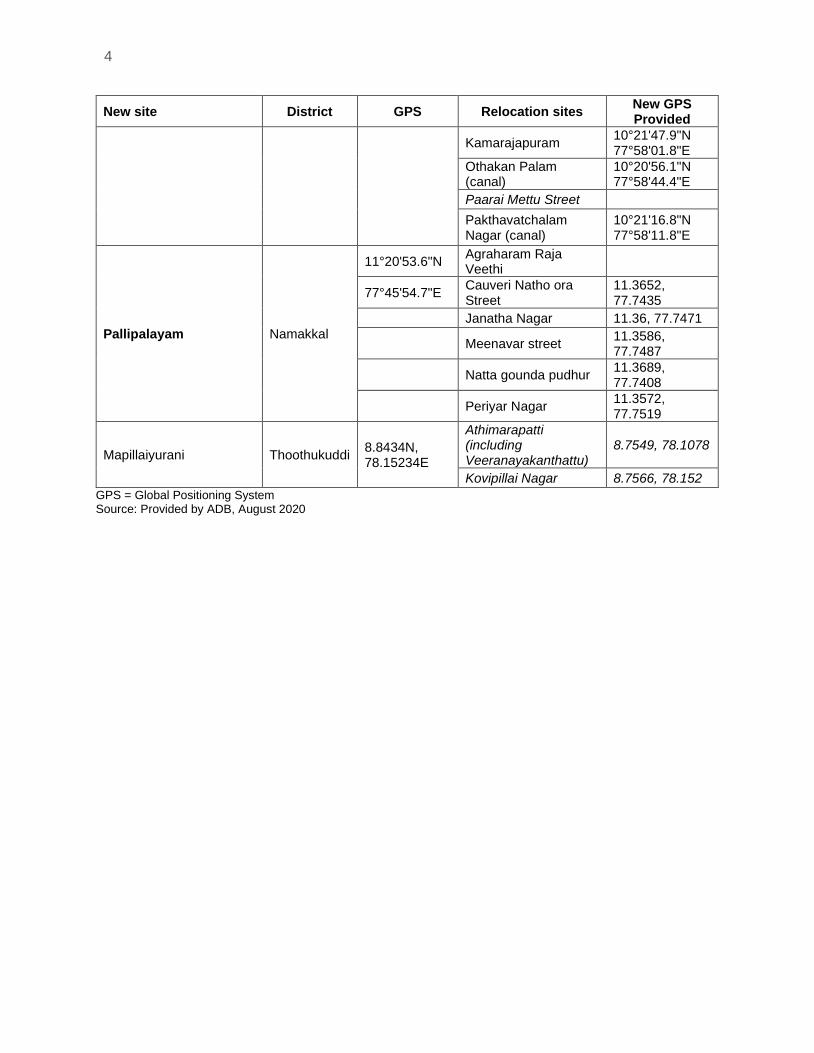
New site District GPS Relocation sites New GPS Provided
Kamarajapuram 10°21'47.9"N 77°58'01.8"E
Othakan Palam (canal)
10°20'56.1"N 77°58'44.4"E
Paarai Mettu Street
Pakthavatchalam Nagar (canal)
10°21'16.8"N 77°58'11.8"E
Pallipalayam Namakkal
11°20'53.6"N Agraharam Raja Veethi
77°45'54.7"E Cauveri Natho ora Street
11.3652, 77.7435
Janatha Nagar 11.36, 77.7471
Meenavar street 11.3586, 77.7487
Natta gounda pudhur 11.3689, 77.7408
Periyar Nagar 11.3572, 77.7519
Mapillaiyurani Thoothukuddi 8.8434N, 78.15234E
Athimarapatti (including Veeranayakanthattu)
8.7549, 78.1078
Kovipillai Nagar 8.7566, 78.152
GPS = Global Positioning System Source: Provided by ADB, August 2020
1
Figure 2: Location of new development sites across Tamil Nadu

1
Climate Vulnerability
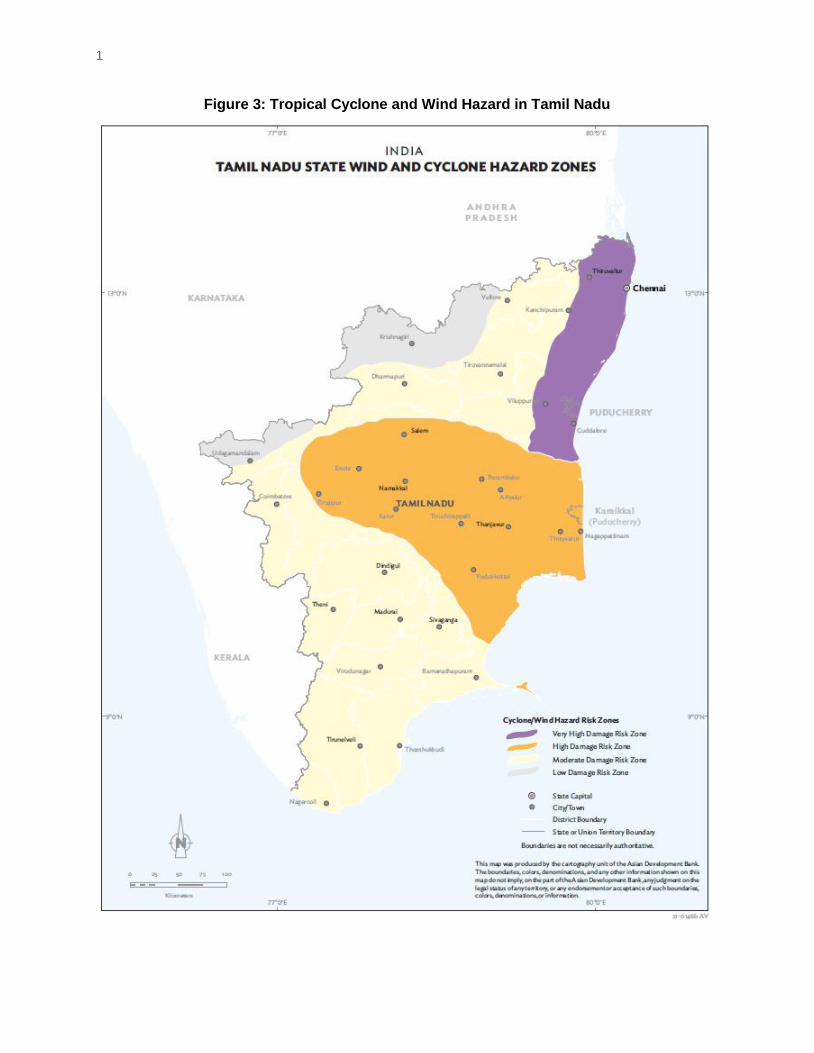
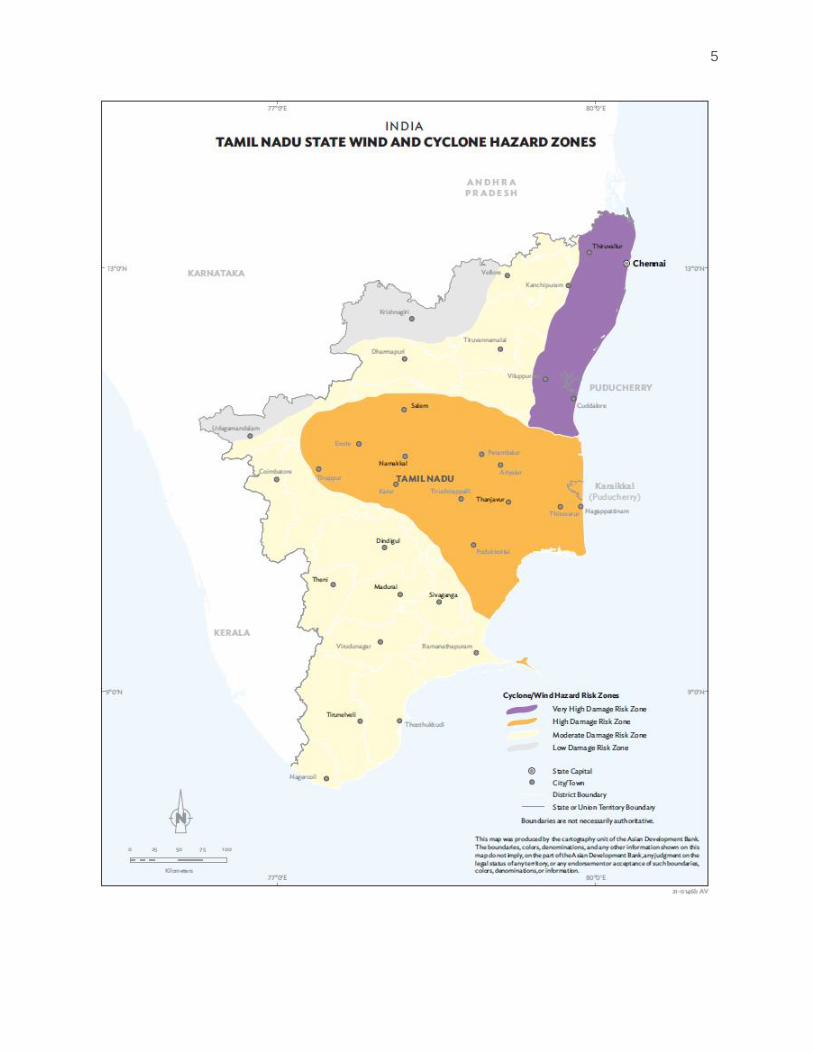
8. The Tamil Nadu State Action Plan for Climate Change (TN-SAPCC) describes the climate as a dry, sub humid to semi-arid tropical climate, which is strikingly different from the rest of India, receiving its maximum rainfall later in the year during October, November, and December (post-monsoon) and suffering from tropical cyclones and their associated storm surges. Tamil Nadu is known for high inter- and intra-seasonal rainfall variability and frequently subjected to extreme weather conditions such as floods and droughts.6 9. The project areas can receive heavy rainfall during both the South West and North East Monsoon periods as well as very high temperatures and heatwaves in the pre-monsoon season. Coastal sites and some central areas of Tamil Nadu are exposed to tropical cyclones and high winds (Figure 3). The climate varies across the state with greater rainfall along the coast and the highest rainfall and humidity in the north east, particularly along the coast. South Eastern Tamil Nadu is drier with more arid conditions than the north east.
6 http://tnsccc.in/policy_brief.php

1
Figure 3: Tropical Cyclone and Wind Hazard in Tamil Nadu

1
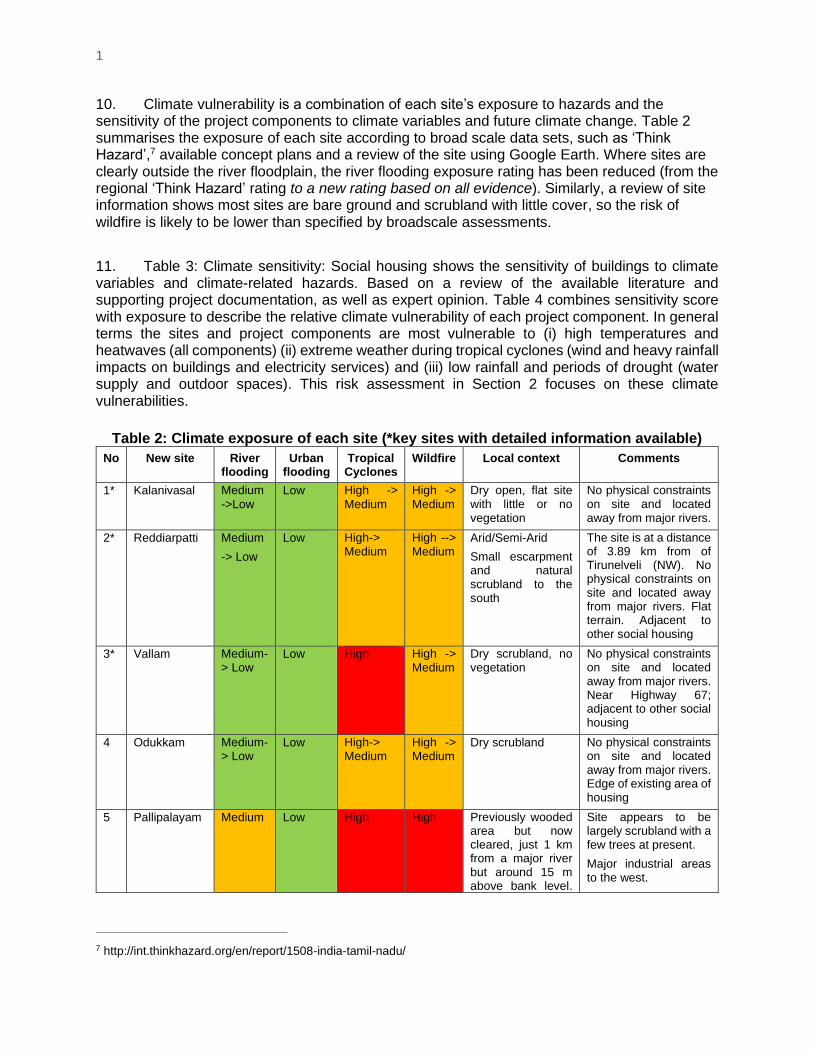
10. Climate vulnerability is a combination of each site’s exposure to hazards and the sensitivity of the project components to climate variables and future climate change. Table 2 summarises the exposure of each site according to broad scale data sets, such as ‘Think Hazard’,7 available concept plans and a review of the site using Google Earth. Where sites are clearly outside the river floodplain, the river flooding exposure rating has been reduced (from the regional ‘Think Hazard’ rating to a new rating based on all evidence). Similarly, a review of site information shows most sites are bare ground and scrubland with little cover, so the risk of wildfire is likely to be lower than specified by broadscale assessments.
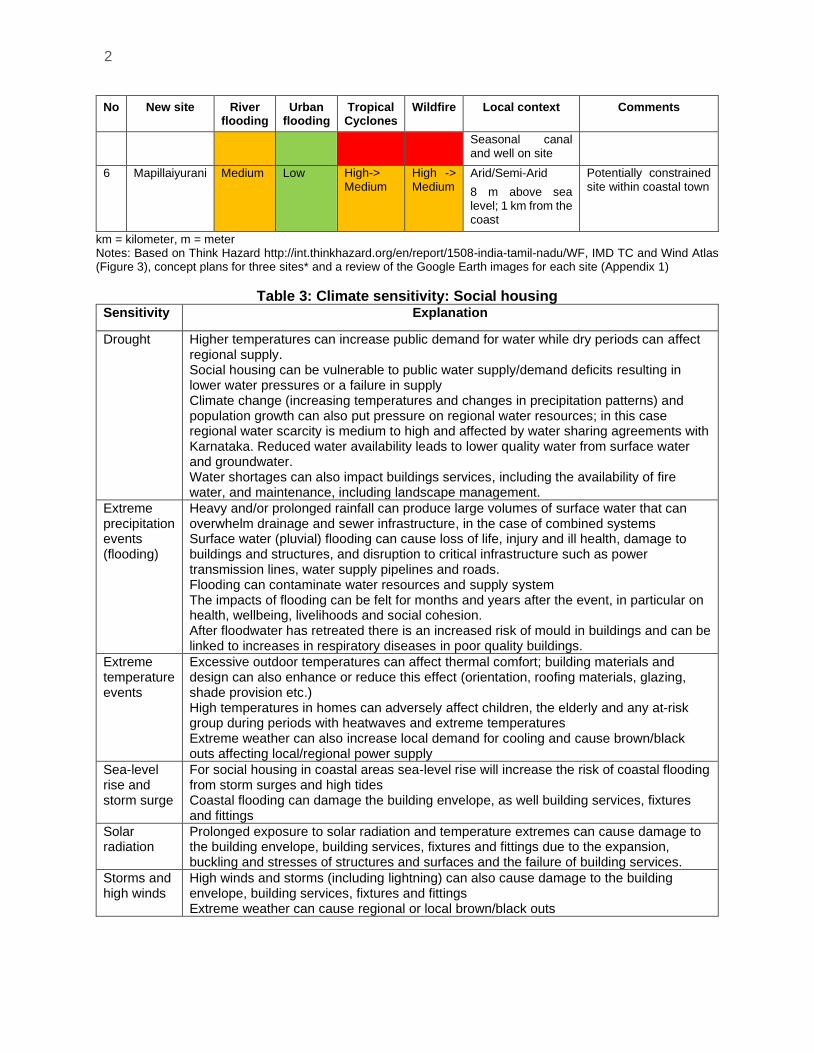
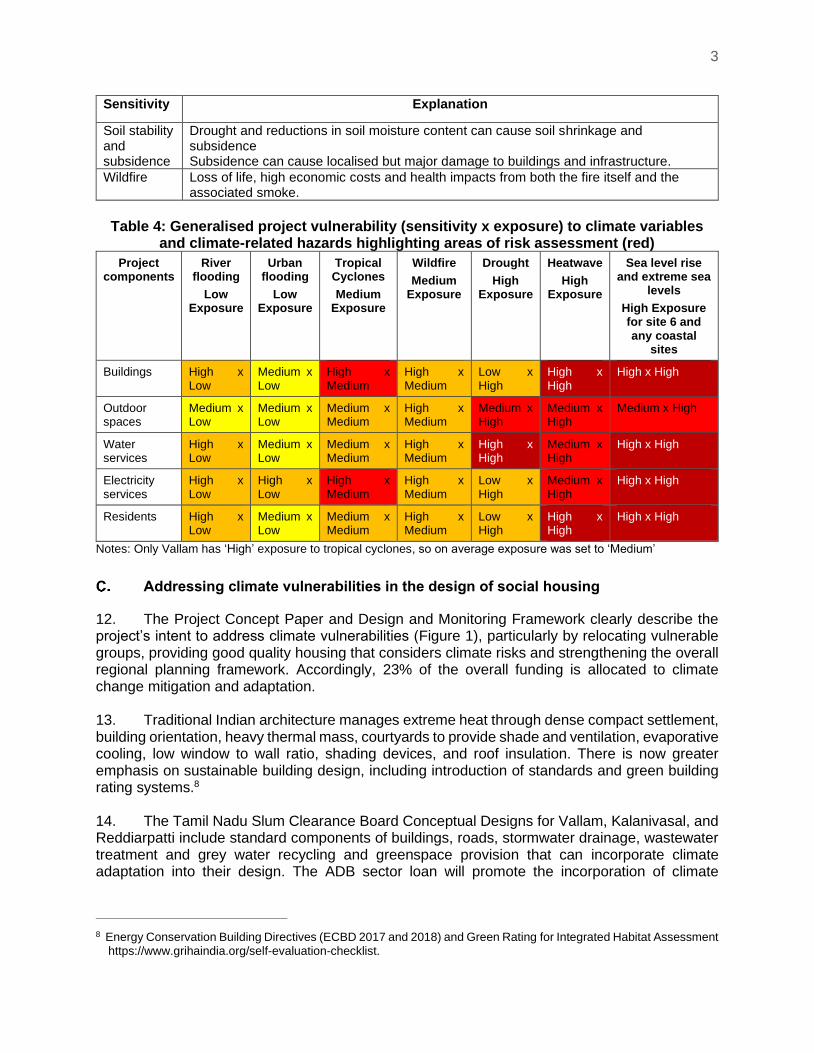
11. Table 3: Climate sensitivity: Social housing shows the sensitivity of buildings to climate variables and climate-related hazards. Based on a review of the available literature and supporting project documentation, as well as expert opinion. Table 4 combines sensitivity score with exposure to describe the relative climate vulnerability of each project component. In general terms the sites and project components are most vulnerable to (i) high temperatures and heatwaves (all components) (ii) extreme weather during tropical cyclones (wind and heavy rainfall impacts on buildings and electricity services) and (iii) low rainfall and periods of drought (water supply and outdoor spaces). This risk assessment in Section 2 focuses on these climate vulnerabilities.
Table 2: Climate exposure of each site (*key sites with detailed information available)
No New site River flooding
Urban flooding
Tropical Cyclones
Wildfire Local context Comments
1* Kalanivasal
Medium
->Low Low High ->
Medium
High ->
Medium
Dry open, flat site with little or no vegetation
No physical constraints on site and located away from major rivers.
2* Reddiarpatti Medium
-> Low
Low High-> Medium
High --> Medium
Arid/Semi-Arid
Small escarpment and natural scrubland to the south
The site is at a distance of 3.89 km from of Tirunelveli (NW). No physical constraints on site and located away from major rivers. Flat terrain. Adjacent to other social housing
3* Vallam Medium-> Low
Low High High -> Medium
Dry scrubland, no vegetation
No physical constraints on site and located away from major rivers. Near Highway 67; adjacent to other social housing
4 Odukkam Medium-> Low
Low High-> Medium
High -> Medium
Dry scrubland No physical constraints on site and located away from major rivers. Edge of existing area of housing
5 Pallipalayam Medium Low High High Previously wooded area but now cleared, just 1 km from a major river but around 15 m above bank level.
Site appears to be largely scrubland with a few trees at present.
Major industrial areas to the west.
7 http://int.thinkhazard.org/en/report/1508-india-tamil-nadu/
2
No New site River flooding
Urban flooding
Tropical Cyclones
Wildfire Local context Comments
Seasonal canal and well on site
6 Mapillaiyurani Medium Low High-> Medium
High -> Medium
Arid/Semi-Arid
8 m above sea level; 1 km from the coast
Potentially constrained site within coastal town
km = kilometer, m = meter Notes: Based on Think Hazard http://int.thinkhazard.org/en/report/1508-india-tamil-nadu/WF, IMD TC and Wind Atlas (Figure 3), concept plans for three sites* and a review of the Google Earth images for each site (Appendix 1)
Table 3: Climate sensitivity: Social housing Sensitivity Explanation
Drought Higher temperatures can increase public demand for water while dry periods can affect regional supply. Social housing can be vulnerable to public water supply/demand deficits resulting in lower water pressures or a failure in supply Climate change (increasing temperatures and changes in precipitation patterns) and population growth can also put pressure on regional water resources; in this case regional water scarcity is medium to high and affected by water sharing agreements with Karnataka. Reduced water availability leads to lower quality water from surface water and groundwater. Water shortages can also impact buildings services, including the availability of fire water, and maintenance, including landscape management.
Extreme precipitation events (flooding)
Heavy and/or prolonged rainfall can produce large volumes of surface water that can overwhelm drainage and sewer infrastructure, in the case of combined systems Surface water (pluvial) flooding can cause loss of life, injury and ill health, damage to buildings and structures, and disruption to critical infrastructure such as power transmission lines, water supply pipelines and roads. Flooding can contaminate water resources and supply system The impacts of flooding can be felt for months and years after the event, in particular on health, wellbeing, livelihoods and social cohesion. After floodwater has retreated there is an increased risk of mould in buildings and can be linked to increases in respiratory diseases in poor quality buildings.
Extreme temperature events
Excessive outdoor temperatures can affect thermal comfort; building materials and design can also enhance or reduce this effect (orientation, roofing materials, glazing, shade provision etc.) High temperatures in homes can adversely affect children, the elderly and any at-risk group during periods with heatwaves and extreme temperatures Extreme weather can also increase local demand for cooling and cause brown/black outs affecting local/regional power supply
Sea-level rise and storm surge
For social housing in coastal areas sea-level rise will increase the risk of coastal flooding from storm surges and high tides Coastal flooding can damage the building envelope, as well building services, fixtures and fittings
Solar radiation
Prolonged exposure to solar radiation and temperature extremes can cause damage to the building envelope, building services, fixtures and fittings due to the expansion, buckling and stresses of structures and surfaces and the failure of building services.
Storms and high winds
High winds and storms (including lightning) can also cause damage to the building envelope, building services, fixtures and fittings Extreme weather can cause regional or local brown/black outs
3
Sensitivity Explanation
Soil stability and subsidence
Drought and reductions in soil moisture content can cause soil shrinkage and subsidence Subsidence can cause localised but major damage to buildings and infrastructure.
Wildfire Loss of life, high economic costs and health impacts from both the fire itself and the associated smoke.
Table 4: Generalised project vulnerability (sensitivity x exposure) to climate variables
and climate-related hazards highlighting areas of risk assessment (red)
Project components
River flooding
Low Exposure
Urban flooding
Low Exposure
Tropical Cyclones
Medium Exposure
Wildfire
Medium Exposure
Drought
High Exposure
Heatwave
High Exposure
Sea level rise and extreme sea
levels
High Exposure for site 6 and any coastal
sites
Buildings High x Low
Medium x Low
High x Medium
High x Medium
Low x High
High x High
High x High
Outdoor spaces
Medium x Low
Medium x Low
Medium x Medium
High x Medium
Medium x High
Medium x High
Medium x High
Water services
High x Low
Medium x Low
Medium x Medium
High x Medium
High x High
Medium x High
High x High
Electricity services
High x Low
High x Low
High x Medium
High x Medium
Low x High
Medium x High
High x High
Residents High x Low
Medium x Low
Medium x Medium
High x Medium
Low x High
High x High
High x High
Notes: Only Vallam has ‘High’ exposure to tropical cyclones, so on average exposure was set to ‘Medium’
Addressing climate vulnerabilities in the design of social housing
12. The Project Concept Paper and Design and Monitoring Framework clearly describe the project’s intent to address climate vulnerabilities (Figure 1), particularly by relocating vulnerable groups, providing good quality housing that considers climate risks and strengthening the overall regional planning framework. Accordingly, 23% of the overall funding is allocated to climate change mitigation and adaptation. 13. Traditional Indian architecture manages extreme heat through dense compact settlement, building orientation, heavy thermal mass, courtyards to provide shade and ventilation, evaporative cooling, low window to wall ratio, shading devices, and roof insulation. There is now greater emphasis on sustainable building design, including introduction of standards and green building rating systems.8 14. The Tamil Nadu Slum Clearance Board Conceptual Designs for Vallam, Kalanivasal, and Reddiarpatti include standard components of buildings, roads, stormwater drainage, wastewater treatment and grey water recycling and greenspace provision that can incorporate climate adaptation into their design. The ADB sector loan will promote the incorporation of climate
8 Energy Conservation Building Directives (ECBD 2017 and 2018) and Green Rating for Integrated Habitat Assessment
https://www.grihaindia.org/self-evaluation-checklist.
4
adaptation in the design of buildings, including passive cooling, stormwater drainage and water efficiency. 15. A good example in the Concept Masterplan Presentation for Site 1, Kalanivasal, which presents a “climate responsive open space network” of building and outdoor space, which considers heat gain and shade to optimise building layout and orientation, which contributes to both mitigation (passive cooling and daylighting) and adaptation. It includes open green space, shaded courtyards, a green buffer around the site, livestock shelters and access to water in functional courtyards. 16. In addition, the Concept Masterplan for Pallipalayam9 promotes health and wellness with a strong emphasis on natural habitat and the multi-purpose use of greenspace to create social and community spaces. Its design aims to create well ventilated housing and cool outdoor space, reduce solar heat gain and allow sufficient daylighting to avoid use of electrical lighting. These masterplans highlight several activities to promote climate resilience which could contribute to sustainable buildings credentials that are widely used as a proxy for climate adaptation in buildings.10 Adaptation activities are assessed in detail in Section 3.
II. CLIMATE CHANGE RISK ASSESSMENT
Baseline climate
17. This section provides a summary of the baseline climate based on information from the Tamil Nadu State Action Plan on Climate Change, available local observations, global databases and climate model reanalysis. Data are not available from all potential locations, so this section presents data that are available from long term observations sites, such as Tiruchchirapalli and Madurai, in central Tamil Nadu. Further information for Reddiarpatti in Southern Tamil Nadu is summarised in Appendix 1.
(i) The interior part of northern Tamil Nadu is categorized as a tropical semi-arid climate, while the coastal parts are categorized as dry sub-humid climate; further south it is drier and semi-arid in places.
(ii) The region’s mean annual temperature is around 25°C and the maximum summer temperatures are around 34oC (March to May) but individual sites experience higher temperatures; both Tiruchchirapalli and Madurai have long term average maximum summer temperatures greater than 37oC and in recent years maximum temperatures have exceeded 40oC.
(iii) Rainfall is highly variable across the region, with much higher monsoon rainfall on the coast compared to inland. The highest rainfall is in the North East Monsoon season (October-December).
(iv) Windspeeds and potential for wind damage are high in the northern coastal zone and medium high in the central area (Figure 3: Tropical Cyclone and Wind Hazard in Tamil Nadu
9 Concept Masterplan for Pallipalayam provided by Seetha Raghupathy 19 June 2020. 10 The Inter-American Development Bank (IDB) used the EDGE sustainable buildings system to assign up to 100%
climate finance to accredited buildings (link) and other banks are adopting a proportional approach based on the number of adaptation and mitigation features.
5
6
(v) Reference evapotranspiration (ETo) rates are higher inland due to lower relative humidity and reach 250 mm per month in June/July.
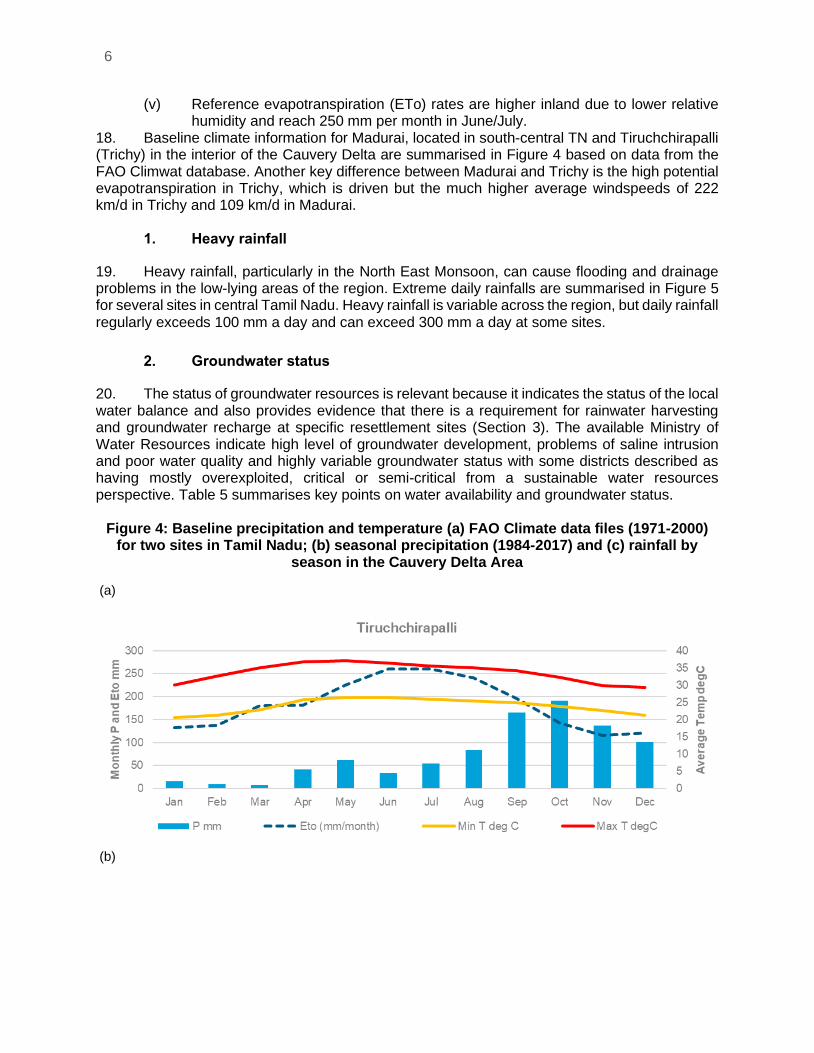
18. Baseline climate information for Madurai, located in south-central TN and Tiruchchirapalli (Trichy) in the interior of the Cauvery Delta are summarised in Figure 4 based on data from the FAO Climwat database. Another key difference between Madurai and Trichy is the high potential evapotranspiration in Trichy, which is driven but the much higher average windspeeds of 222 km/d in Trichy and 109 km/d in Madurai.
1. Heavy rainfall
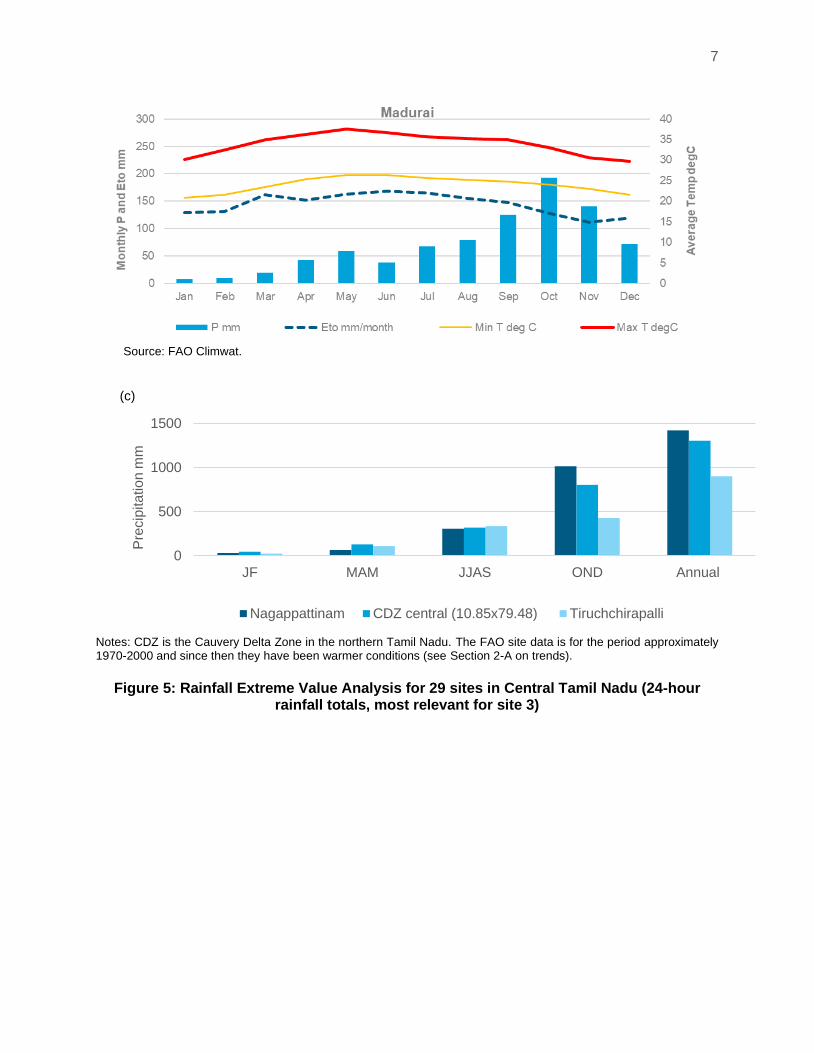
19. Heavy rainfall, particularly in the North East Monsoon, can cause flooding and drainage problems in the low-lying areas of the region. Extreme daily rainfalls are summarised in Figure 5 for several sites in central Tamil Nadu. Heavy rainfall is variable across the region, but daily rainfall regularly exceeds 100 mm a day and can exceed 300 mm a day at some sites.
2. Groundwater status
20. The status of groundwater resources is relevant because it indicates the status of the local water balance and also provides evidence that there is a requirement for rainwater harvesting and groundwater recharge at specific resettlement sites (Section 3). The available Ministry of Water Resources indicate high level of groundwater development, problems of saline intrusion and poor water quality and highly variable groundwater status with some districts described as having mostly overexploited, critical or semi-critical from a sustainable water resources perspective. Table 5 summarises key points on water availability and groundwater status.
Figure 4: Baseline precipitation and temperature (a) FAO Climate data files (1971-2000) for two sites in Tamil Nadu; (b) seasonal precipitation (1984-2017) and (c) rainfall by
season in the Cauvery Delta Area
(a)
(b)
7
(c)
Notes: CDZ is the Cauvery Delta Zone in the northern Tamil Nadu. The FAO site data is for the period approximately 1970-2000 and since then they have been warmer conditions (see Section 2-A on trends).
Figure 5: Rainfall Extreme Value Analysis for 29 sites in Central Tamil Nadu (24-hour
rainfall totals, most relevant for site 3)
0
500
1000
1500
JF MAM JJAS OND Annual
Pre
cip
ita
tio
n m
m
Nagappattinam CDZ central (10.85x79.48) Tiruchchirapalli
Source: FAO Climwat.
8
Note: Based on data from 1984 to 2017 from the ADB Cauvery Delta Zone Project
Table 5: Groundwater status in selected Tamil Nadu Districts based on Ministry of Water
Resources Reports (from 2007 onwards) Tamil Nadu Districts
(Relevant sites)
Trends and spatial pattern of rainfall Groundwater Status
Erode
(Pallipalayam)
The normal annual rainfall over the district varies from about 575 mm to about 833 mm. It is the minimum in the southern and south-eastern parts of the district around Kodumudi (575.3 mm) Mulanur (581.0 mm) and Dharapuram (593.0 mm. It gradually increases towards north and northwest and reaches a maximum around Talavadi (833 mm). No notable trends described.
High level of ground water development with declining ground water levels and drying of shallow wells. Local pollution by industrial units
Status varies between Safe, Semi-Critical, Critical and Over-Exploited
Dindigul (Odukkam) The normal annual rainfall over the district varies from about 700 mm. to about 1600 mm. It is minimum around Palani (709 mm) in the northwestern part and Vedasandur (732.4mm) in the northeastern part of the district. It gradually increases towards south and southwest and reaches a maximum around Kodaikanal (1606.8 mm)
High level of ground water development in major part of the district and contamination of ground water resources by industrial effluents from Tanneries
Status is mostly Over-Exploited and Critical
Tirunelveli
(Reddiarpatti)
The district receives the rain under the influence of both southwest and northeast monsoons. Normal annual rainfall over the district is 879 mm. It is the maximum around Senkottai, Sankarankoil and all along the coast and it decreases towards inland. The
Water scarcity in select pocket due to over exploitation
Mostly Safe with some areas Over-Exploited and Critical
9
Tamil Nadu Districts
(Relevant sites)
Trends and spatial pattern of rainfall Groundwater Status
areas around Ambasamudram, Tirunelveli and Kadayanallur receive minimum rainfall.
Thanjuvar
(Vallam)
Within the Thanjavur district the rainfall is uneven. The annual normal (1988 – 1996) varies partially from 1179 mm (Lower Anaicut) to 763 mm (Budalur). The rainfall is high on the eastern part of the district compared to the western part. The district receives major portion of its annual rainfall during north-eastern monsoon (Oct-Dec). A moderate amount of rainfall is received during the southeast monsoon period (Jan-Sept). Since the northeast monsoon rainfall is dominating, its effect is felt on the eastern part of the district (Kumbakonam-698 mm, Aduthurai-611 mm, Lower Anicut-706 mm). The intensity decreases gradually towards west and the western most part of the district (Thiruvaiyaru-387 mm, Budalur-377 mm).
The quality of ground water in the coastal region is poor and unsuitable both for domestic and irrigation purposes. In the Tertiary aquifers there is freshwater zone below saline zone
Varied groundwater status: Safe, Semi-Critical, Critical and Over-Exploited
Thoothukudi
(site 6)
The district receives the rain under the influence of both southwest and northeast monsoons. The southwest monsoon rainfall is highly erratic and summer rains are negligible. Normal annual rainfall over the district varies from about 570 mm to 740 mm. It is the minimum around Arasadi (577.4 mm) and Thoothukkudi (582.8 mm) in the central eastern part of the district. It gradually increases towards south, west and north and attains a maximum around Kayattar (722.5 mm) and Kovilpatti (734.8 mm) in the north-western part.
Saline intrusion and poor water quality
Mostly Over-Exploited groundwater status
mm = millimeter. Sources:http://cgwb.gov.in/District_Profile/TamilNadu/Dindigul.pdf
http://cgwb.gov.in/District_Profile/TamilNadu/Trichy.pdf http://cgwb.gov.in/District_Profile/TamilNadu/Tirunelveli.pdf http://cgwb.gov.in/District_Profile/TamilNadu/Thanjavur.pdf
http://cgwb.gov.in/District_Profile/TamilNadu/Thoothukudi.pdf
3. Trends
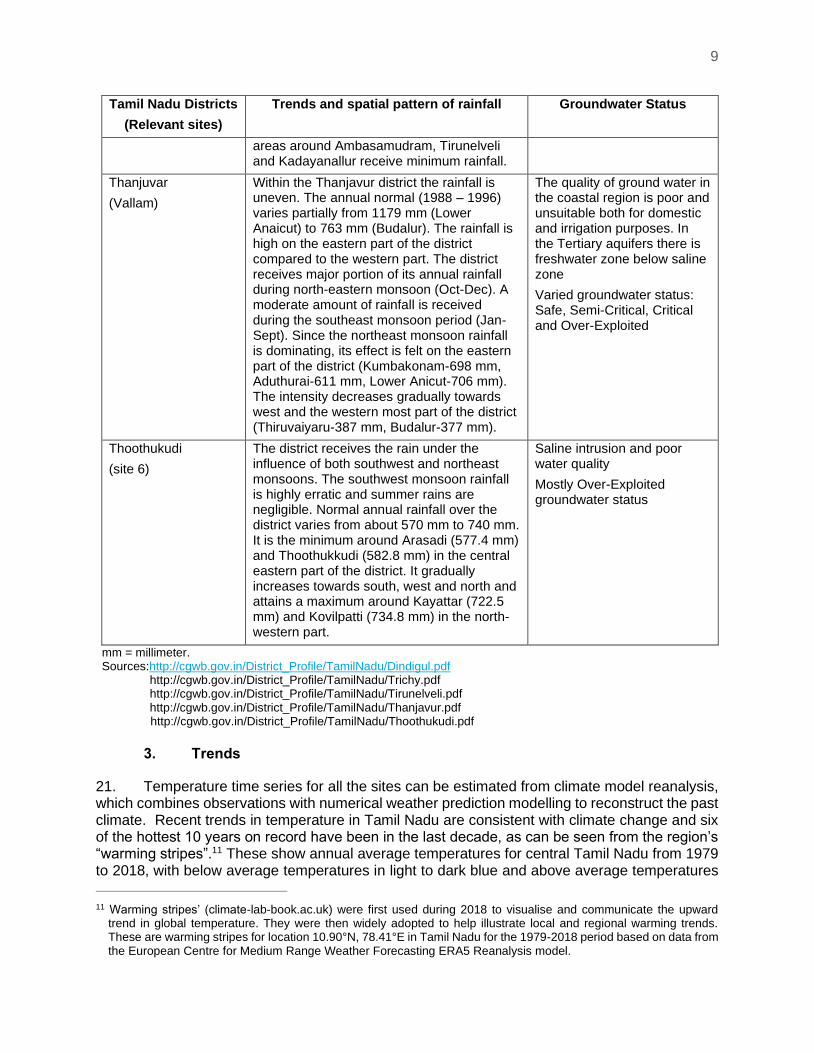
21. Temperature time series for all the sites can be estimated from climate model reanalysis, which combines observations with numerical weather prediction modelling to reconstruct the past climate. Recent trends in temperature in Tamil Nadu are consistent with climate change and six of the hottest 10 years on record have been in the last decade, as can be seen from the region’s “warming stripes”.11 These show annual average temperatures for central Tamil Nadu from 1979 to 2018, with below average temperatures in light to dark blue and above average temperatures
11 Warming stripes’ (climate-lab-book.ac.uk) were first used during 2018 to visualise and communicate the upward
trend in global temperature. They were then widely adopted to help illustrate local and regional warming trends. These are warming stripes for location 10.90°N, 78.41°E in Tamil Nadu for the 1979-2018 period based on data from the European Centre for Medium Range Weather Forecasting ERA5 Reanalysis model.
10
in light to dark red; during this period average temperature was 26.5 oC and both 2014 and 2016 were more than 1oC warmer than the long-term average temperatures.
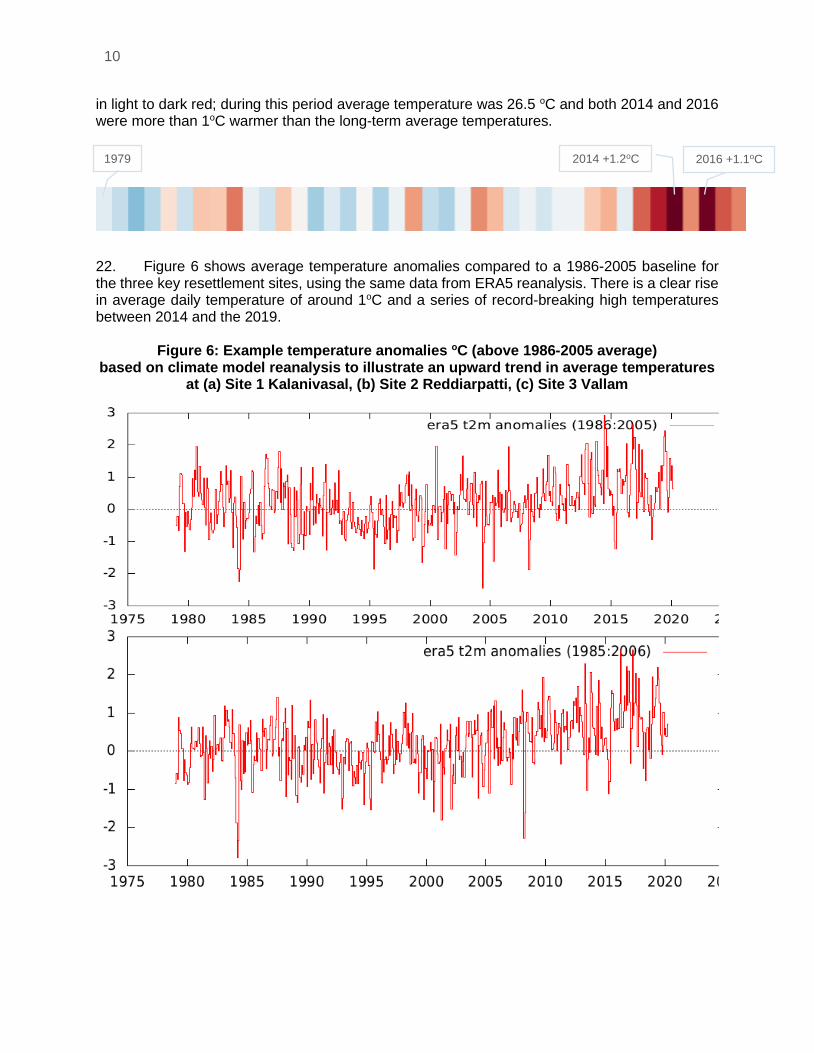
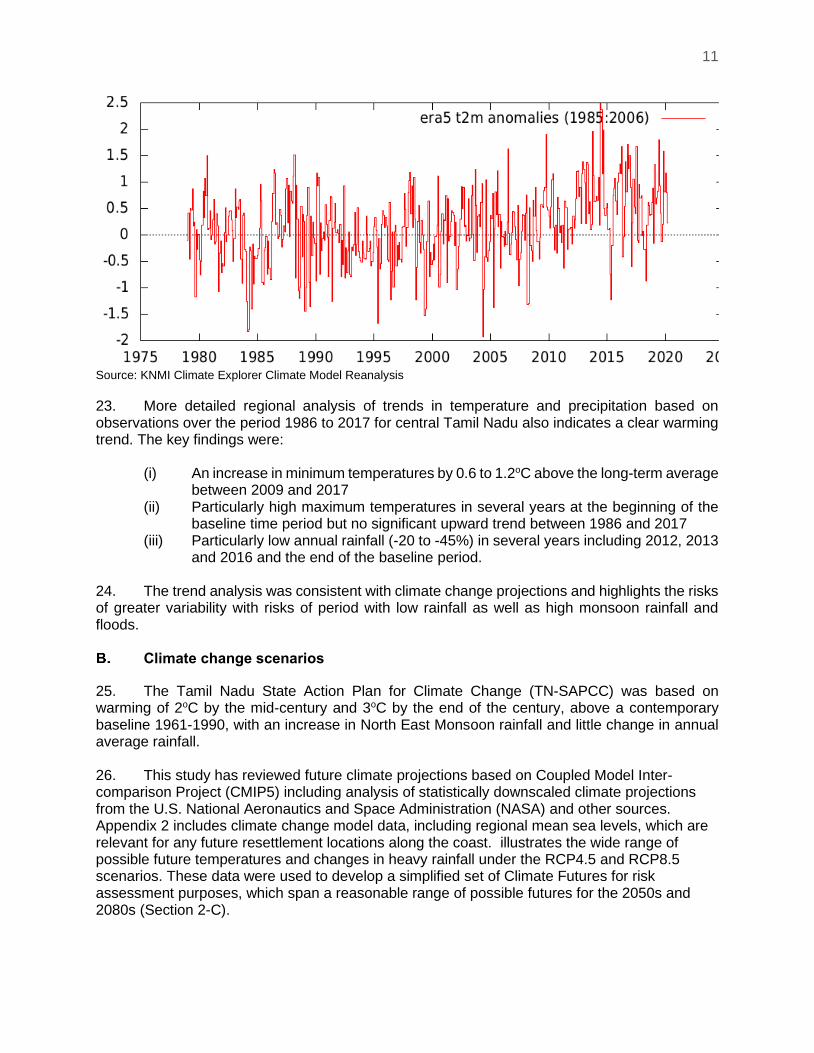
22. Figure 6 shows average temperature anomalies compared to a 1986-2005 baseline for the three key resettlement sites, using the same data from ERA5 reanalysis. There is a clear rise in average daily temperature of around 1oC and a series of record-breaking high temperatures between 2014 and the 2019.
Figure 6: Example temperature anomalies oC (above 1986-2005 average)
based on climate model reanalysis to illustrate an upward trend in average temperatures at (a) Site 1 Kalanivasal, (b) Site 2 Reddiarpatti, (c) Site 3 Vallam
2014 +1.2oC 2016 +1.1oC 1979
11
Source: KNMI Climate Explorer Climate Model Reanalysis
23. More detailed regional analysis of trends in temperature and precipitation based on observations over the period 1986 to 2017 for central Tamil Nadu also indicates a clear warming trend. The key findings were:
(i) An increase in minimum temperatures by 0.6 to 1.2oC above the long-term average between 2009 and 2017
(ii) Particularly high maximum temperatures in several years at the beginning of the baseline time period but no significant upward trend between 1986 and 2017
(iii) Particularly low annual rainfall (-20 to -45%) in several years including 2012, 2013 and 2016 and the end of the baseline period.
24. The trend analysis was consistent with climate change projections and highlights the risks of greater variability with risks of period with low rainfall as well as high monsoon rainfall and floods.
Climate change scenarios
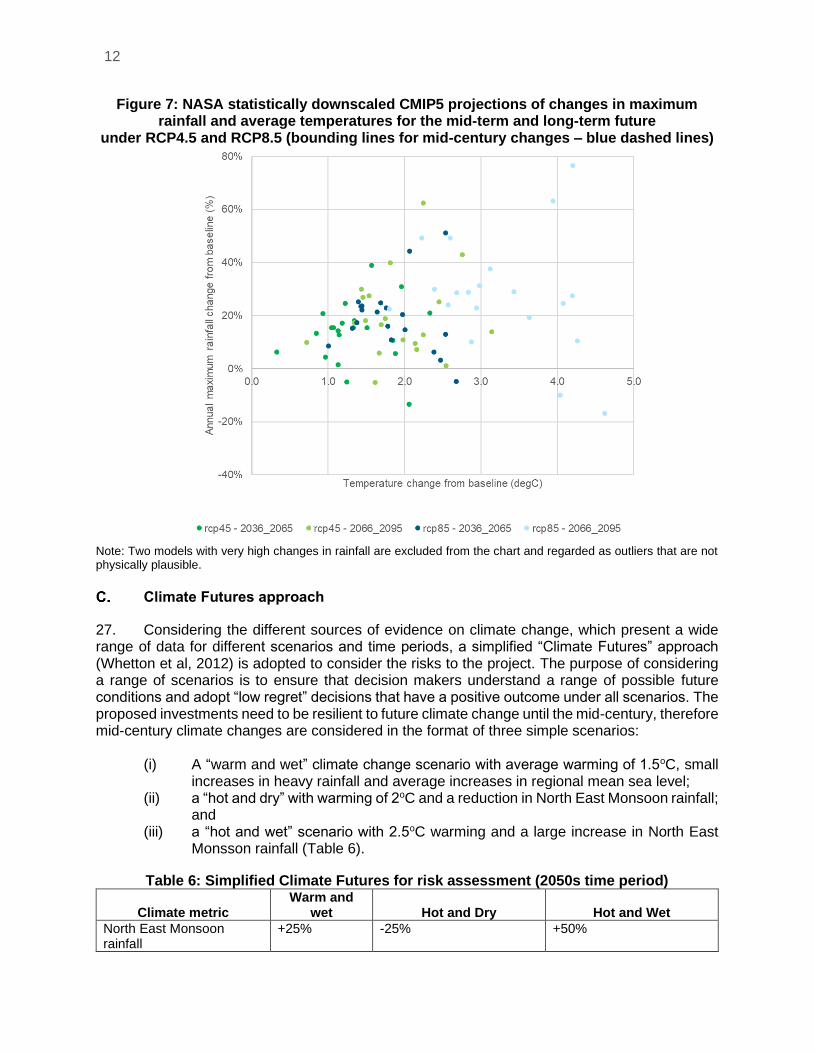
25. The Tamil Nadu State Action Plan for Climate Change (TN-SAPCC) was based on warming of 2oC by the mid-century and 3oC by the end of the century, above a contemporary baseline 1961-1990, with an increase in North East Monsoon rainfall and little change in annual average rainfall. 26. This study has reviewed future climate projections based on Coupled Model Inter-comparison Project (CMIP5) including analysis of statistically downscaled climate projections from the U.S. National Aeronautics and Space Administration (NASA) and other sources. Appendix 2 includes climate change model data, including regional mean sea levels, which are relevant for any future resettlement locations along the coast. illustrates the wide range of possible future temperatures and changes in heavy rainfall under the RCP4.5 and RCP8.5 scenarios. These data were used to develop a simplified set of Climate Futures for risk assessment purposes, which span a reasonable range of possible futures for the 2050s and 2080s (Section 2-C).
12
Figure 7: NASA statistically downscaled CMIP5 projections of changes in maximum rainfall and average temperatures for the mid-term and long-term future
under RCP4.5 and RCP8.5 (bounding lines for mid-century changes – blue dashed lines)
Note: Two models with very high changes in rainfall are excluded from the chart and regarded as outliers that are not physically plausible.
Climate Futures approach
27. Considering the different sources of evidence on climate change, which present a wide range of data for different scenarios and time periods, a simplified “Climate Futures” approach (Whetton et al, 2012) is adopted to consider the risks to the project. The purpose of considering a range of scenarios is to ensure that decision makers understand a range of possible future conditions and adopt “low regret” decisions that have a positive outcome under all scenarios. The proposed investments need to be resilient to future climate change until the mid-century, therefore mid-century climate changes are considered in the format of three simple scenarios:
(i) A “warm and wet” climate change scenario with average warming of 1.5oC, small increases in heavy rainfall and average increases in regional mean sea level;
(ii) a “hot and dry” with warming of 2oC and a reduction in North East Monsoon rainfall; and
(iii) a “hot and wet” scenario with 2.5oC warming and a large increase in North East Monsson rainfall (Table 6).
Table 6: Simplified Climate Futures for risk assessment (2050s time period)
Climate metric Warm and
wet Hot and Dry Hot and Wet
North East Monsoon rainfall
+25% -25% +50%
13
Climate metric Warm and
wet Hot and Dry Hot and Wet
No. of rain days + No change ++
Maximum temperatures + 2 oC +2.5 oC +3.0 oC
Average temperatures +1.5 oC +2.0 oC +2.5 oC
Annual Maximum Rainfall +15% +20% +40%
Rainfall drought No change Reduction in reliable rainfall
Increase in rainfall reliability
Sea Level Rise +25 cm + 50 cm + 50 cm cm = centimeter Note: Reliable rainfall based on the reliability of SW and NE monsoon rainfall and is normally calculated based on the 80th percentile or rainfall exceeded 4 years out of 5 years. A reduction in reliability implies late and/or reduced monsoon rainfall.
Climate risks
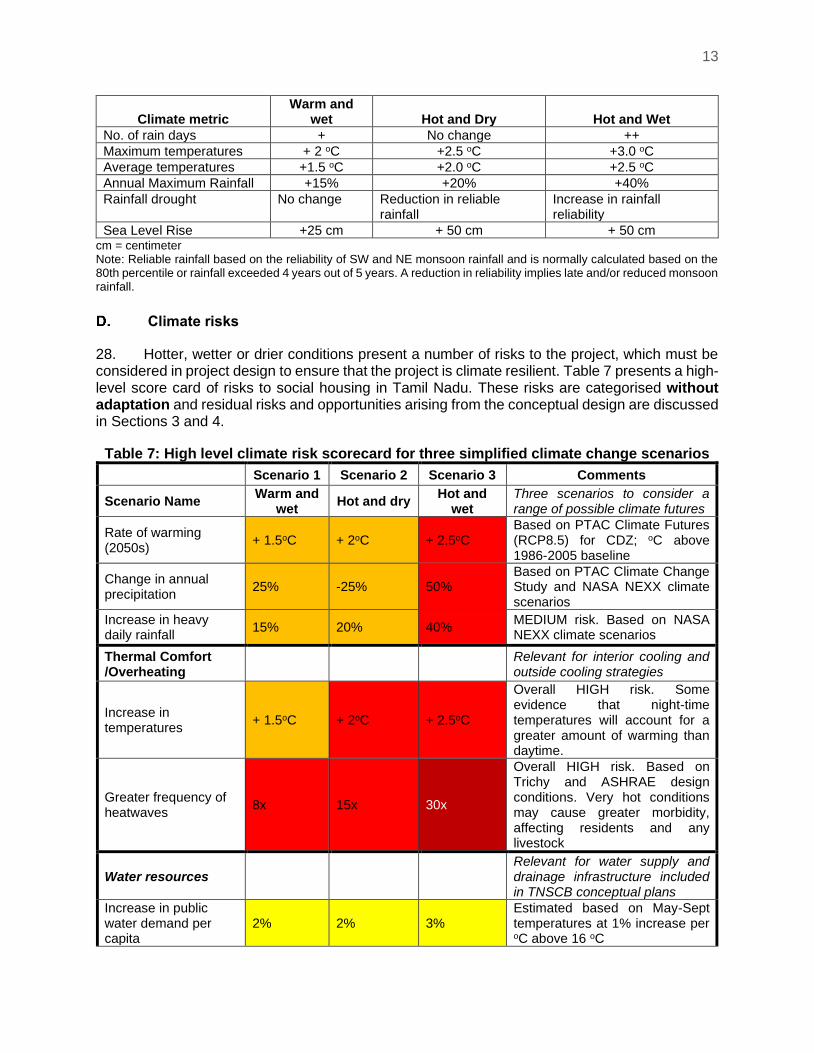
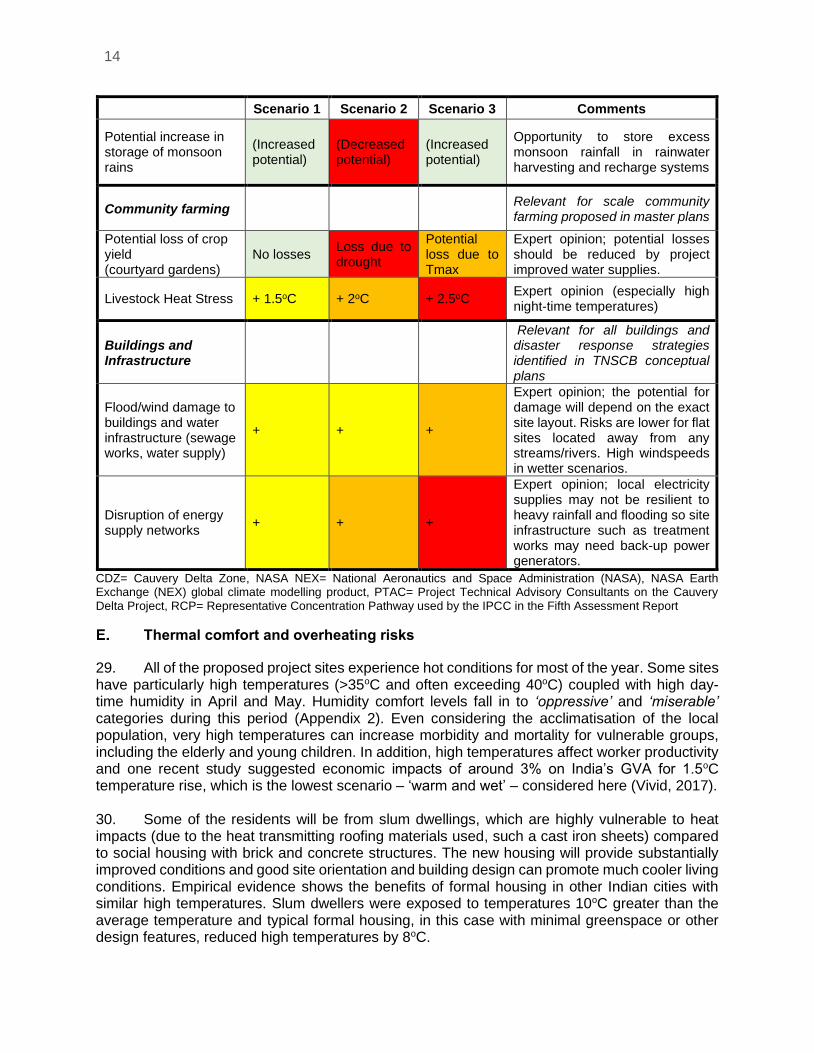
28. Hotter, wetter or drier conditions present a number of risks to the project, which must be considered in project design to ensure that the project is climate resilient. Table 7 presents a high-level score card of risks to social housing in Tamil Nadu. These risks are categorised without adaptation and residual risks and opportunities arising from the conceptual design are discussed in Sections 3 and 4.
Table 7: High level climate risk scorecard for three simplified climate change scenarios
Scenario 1 Scenario 2 Scenario 3 Comments
Scenario Name Warm and
wet Hot and dry
Hot and wet
Three scenarios to consider a range of possible climate futures
Rate of warming (2050s)
+ 1.5oC + 2oC + 2.5oC Based on PTAC Climate Futures (RCP8.5) for CDZ; oC above 1986-2005 baseline
Change in annual precipitation
25% -25% 50% Based on PTAC Climate Change Study and NASA NEXX climate scenarios
Increase in heavy daily rainfall
15% 20% 40% MEDIUM risk. Based on NASA NEXX climate scenarios
Thermal Comfort /Overheating
Relevant for interior cooling and outside cooling strategies
Increase in temperatures
+ 1.5oC + 2oC + 2.5oC
Overall HIGH risk. Some evidence that night-time temperatures will account for a greater amount of warming than daytime.
Greater frequency of heatwaves
8x 15x 30x
Overall HIGH risk. Based on Trichy and ASHRAE design conditions. Very hot conditions may cause greater morbidity, affecting residents and any livestock
Water resources Relevant for water supply and drainage infrastructure included in TNSCB conceptual plans
Increase in public water demand per capita
2% 2% 3% Estimated based on May-Sept temperatures at 1% increase per oC above 16 oC
14
Scenario 1 Scenario 2 Scenario 3 Comments
Potential increase in storage of monsoon rains
(Increased potential)
(Decreased potential)
(Increased potential)
Opportunity to store excess monsoon rainfall in rainwater harvesting and recharge systems
Community farming Relevant for scale community farming proposed in master plans
Potential loss of crop yield (courtyard gardens)
No losses Loss due to drought
Potential loss due to Tmax
Expert opinion; potential losses should be reduced by project improved water supplies.
Livestock Heat Stress + 1.5oC + 2oC + 2.5oC Expert opinion (especially high night-time temperatures)
Buildings and Infrastructure
Relevant for all buildings and disaster response strategies identified in TNSCB conceptual plans
Flood/wind damage to buildings and water infrastructure (sewage works, water supply)
+ + +
Expert opinion; the potential for damage will depend on the exact site layout. Risks are lower for flat sites located away from any streams/rivers. High windspeeds in wetter scenarios.
Disruption of energy supply networks
+ + +
Expert opinion; local electricity supplies may not be resilient to heavy rainfall and flooding so site infrastructure such as treatment works may need back-up power generators.
CDZ= Cauvery Delta Zone, NASA NEX= National Aeronautics and Space Administration (NASA), NASA Earth Exchange (NEX) global climate modelling product, PTAC= Project Technical Advisory Consultants on the Cauvery Delta Project, RCP= Representative Concentration Pathway used by the IPCC in the Fifth Assessment Report
Thermal comfort and overheating risks
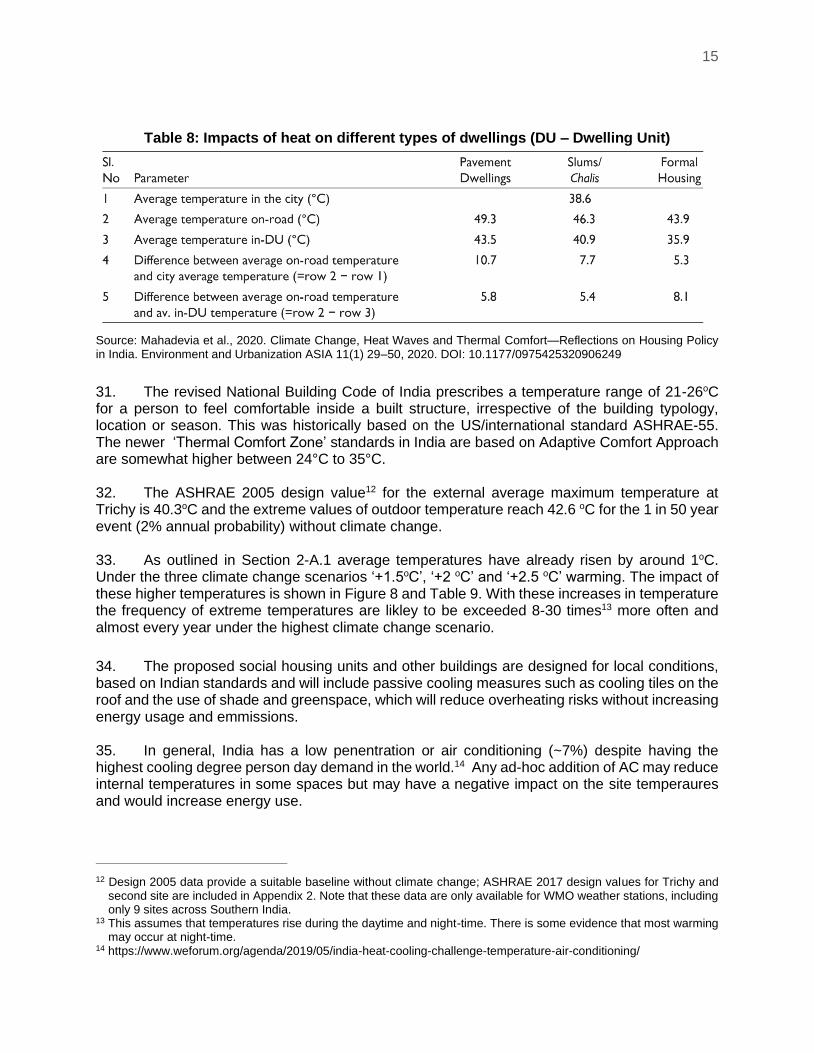
29. All of the proposed project sites experience hot conditions for most of the year. Some sites have particularly high temperatures (>35oC and often exceeding 40oC) coupled with high day-time humidity in April and May. Humidity comfort levels fall in to ‘oppressive’ and ‘miserable’ categories during this period (Appendix 2). Even considering the acclimatisation of the local population, very high temperatures can increase morbidity and mortality for vulnerable groups, including the elderly and young children. In addition, high temperatures affect worker productivity and one recent study suggested economic impacts of around 3% on India’s GVA for 1.5oC temperature rise, which is the lowest scenario – ‘warm and wet’ – considered here (Vivid, 2017). 30. Some of the residents will be from slum dwellings, which are highly vulnerable to heat impacts (due to the heat transmitting roofing materials used, such a cast iron sheets) compared to social housing with brick and concrete structures. The new housing will provide substantially improved conditions and good site orientation and building design can promote much cooler living conditions. Empirical evidence shows the benefits of formal housing in other Indian cities with similar high temperatures. Slum dwellers were exposed to temperatures 10oC greater than the average temperature and typical formal housing, in this case with minimal greenspace or other design features, reduced high temperatures by 8oC.
15
Table 8: Impacts of heat on different types of dwellings (DU – Dwelling Unit)
Source: Mahadevia et al., 2020. Climate Change, Heat Waves and Thermal Comfort—Reflections on Housing Policy in India. Environment and Urbanization ASIA 11(1) 29–50, 2020. DOI: 10.1177/0975425320906249
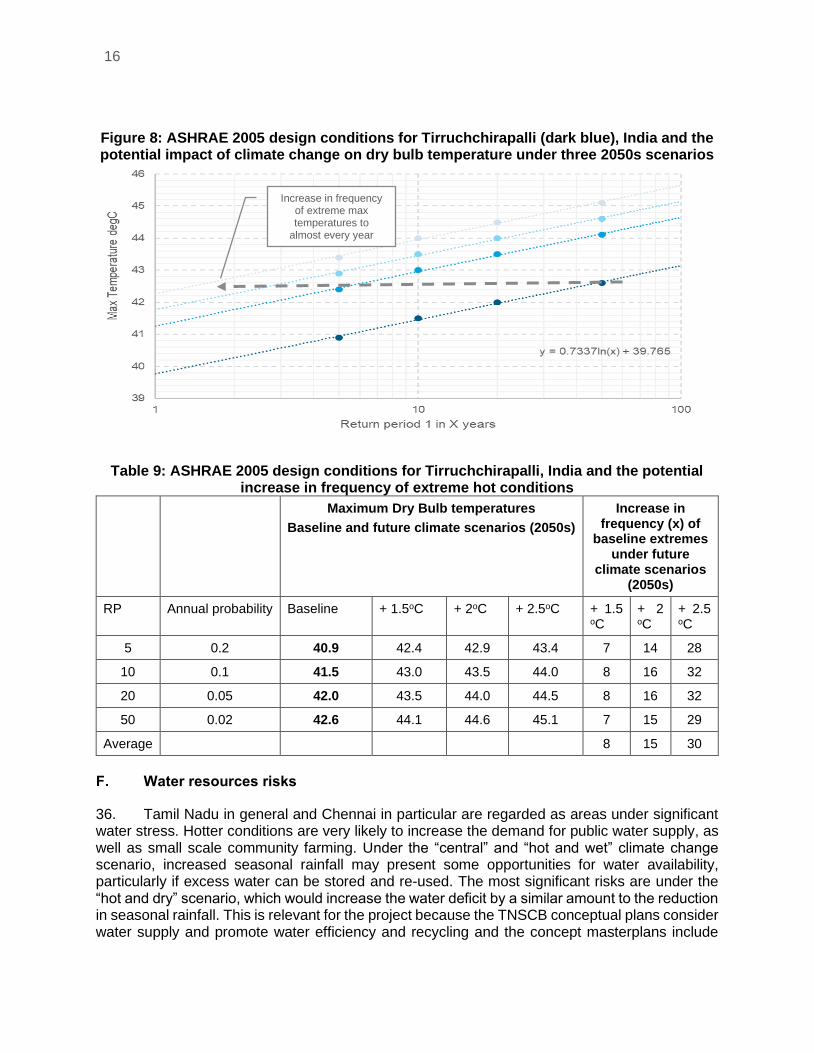
31. The revised National Building Code of India prescribes a temperature range of 21-26oC for a person to feel comfortable inside a built structure, irrespective of the building typology, location or season. This was historically based on the US/international standard ASHRAE-55. The newer ‘Thermal Comfort Zone’ standards in India are based on Adaptive Comfort Approach are somewhat higher between 24°C to 35°C. 32. The ASHRAE 2005 design value12 for the external average maximum temperature at Trichy is 40.3oC and the extreme values of outdoor temperature reach 42.6 oC for the 1 in 50 year event (2% annual probability) without climate change. 33. As outlined in Section 2-A.1 average temperatures have already risen by around 1oC. Under the three climate change scenarios ‘+1.5oC’, ‘+2 oC’ and ‘+2.5 oC’ warming. The impact of these higher temperatures is shown in Figure 8 and Table 9. With these increases in temperature the frequency of extreme temperatures are likley to be exceeded 8-30 times13 more often and almost every year under the highest climate change scenario.
34. The proposed social housing units and other buildings are designed for local conditions, based on Indian standards and will include passive cooling measures such as cooling tiles on the roof and the use of shade and greenspace, which will reduce overheating risks without increasing energy usage and emmissions. 35. In general, India has a low penentration or air conditioning (~7%) despite having the highest cooling degree person day demand in the world.14 Any ad-hoc addition of AC may reduce internal temperatures in some spaces but may have a negative impact on the site temperaures and would increase energy use.
12 Design 2005 data provide a suitable baseline without climate change; ASHRAE 2017 design values for Trichy and
second site are included in Appendix 2. Note that these data are only available for WMO weather stations, including only 9 sites across Southern India.
13 This assumes that temperatures rise during the daytime and night-time. There is some evidence that most warming may occur at night-time.
14 https://www.weforum.org/agenda/2019/05/india-heat-cooling-challenge-temperature-air-conditioning/
16
Figure 8: ASHRAE 2005 design conditions for Tirruchchirapalli (dark blue), India and the potential impact of climate change on dry bulb temperature under three 2050s scenarios
Table 9: ASHRAE 2005 design conditions for Tirruchchirapalli, India and the potential increase in frequency of extreme hot conditions
Maximum Dry Bulb temperatures
Baseline and future climate scenarios (2050s)
Increase in frequency (x) of
baseline extremes under future
climate scenarios (2050s)
RP Annual probability Baseline + 1.5oC + 2oC + 2.5oC + 1.5 oC
+ 2 oC
+ 2.5 oC
5 0.2 40.9 42.4 42.9 43.4 7 14 28
10 0.1 41.5 43.0 43.5 44.0 8 16 32
20 0.05 42.0 43.5 44.0 44.5 8 16 32
50 0.02 42.6 44.1 44.6 45.1 7 15 29
Average
8 15 30
Water resources risks
36. Tamil Nadu in general and Chennai in particular are regarded as areas under significant water stress. Hotter conditions are very likely to increase the demand for public water supply, as well as small scale community farming. Under the “central” and “hot and wet” climate change scenario, increased seasonal rainfall may present some opportunities for water availability, particularly if excess water can be stored and re-used. The most significant risks are under the “hot and dry” scenario, which would increase the water deficit by a similar amount to the reduction in seasonal rainfall. This is relevant for the project because the TNSCB conceptual plans consider water supply and promote water efficiency and recycling and the concept masterplans include
Increase in frequency of extreme max temperatures to
almost every year
17
proposals for small scale community gardens and livestock shelters as well as open greenspace and trees with some water requirements. 37. In Appendix 2 a baseline water balance is shown using average rainfall and potential evapotranspiration for the Trichy area. There is a large potential water deficit pre- North East monsoon and irrigation demands for green areas and any community farming will be high in the growing season from June to Sept and also post-monsoon in January.
Risks related to Tropical Cyclones (high winds and heavy rainfall)
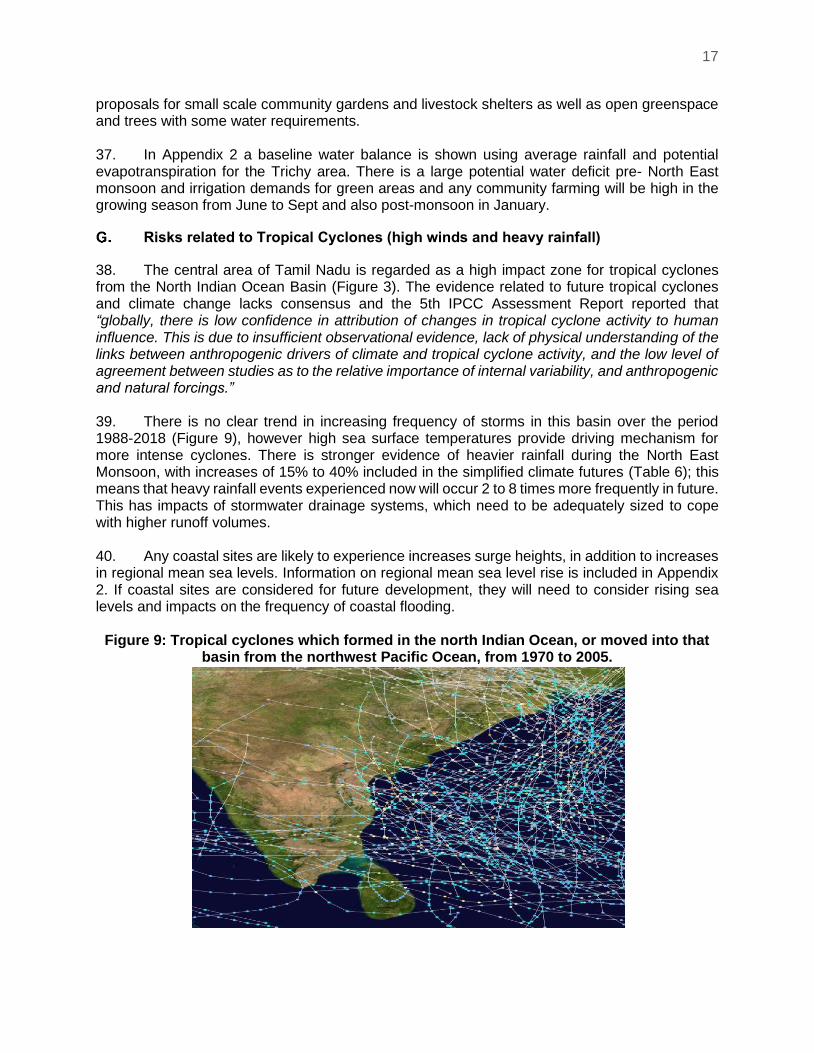
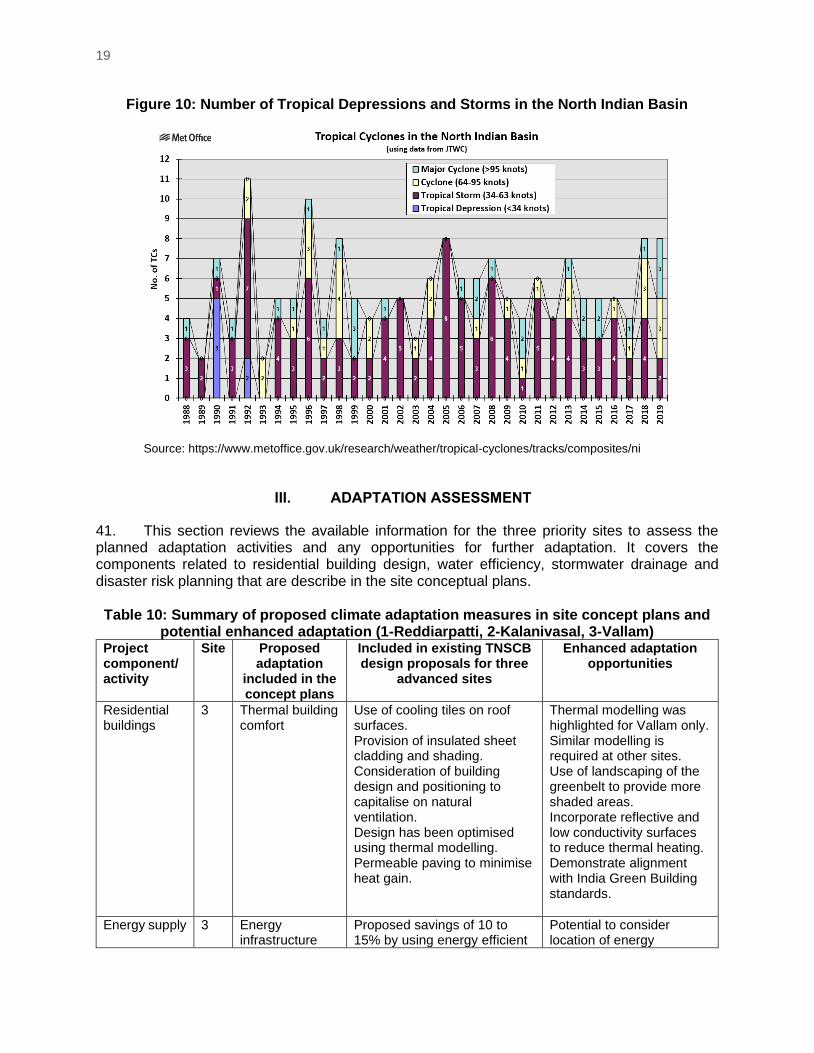
38. The central area of Tamil Nadu is regarded as a high impact zone for tropical cyclones from the North Indian Ocean Basin (Figure 3). The evidence related to future tropical cyclones and climate change lacks consensus and the 5th IPCC Assessment Report reported that “globally, there is low confidence in attribution of changes in tropical cyclone activity to human influence. This is due to insufficient observational evidence, lack of physical understanding of the links between anthropogenic drivers of climate and tropical cyclone activity, and the low level of agreement between studies as to the relative importance of internal variability, and anthropogenic and natural forcings.” 39. There is no clear trend in increasing frequency of storms in this basin over the period 1988-2018 (Figure 9), however high sea surface temperatures provide driving mechanism for more intense cyclones. There is stronger evidence of heavier rainfall during the North East Monsoon, with increases of 15% to 40% included in the simplified climate futures (Table 6); this means that heavy rainfall events experienced now will occur 2 to 8 times more frequently in future. This has impacts of stormwater drainage systems, which need to be adequately sized to cope with higher runoff volumes. 40. Any coastal sites are likely to experience increases surge heights, in addition to increases in regional mean sea levels. Information on regional mean sea level rise is included in Appendix 2. If coastal sites are considered for future development, they will need to consider rising sea levels and impacts on the frequency of coastal flooding.
Figure 9: Tropical cyclones which formed in the north Indian Ocean, or moved into that basin from the northwest Pacific Ocean, from 1970 to 2005.

18
Source:https://commons.wikimedia.org/wiki/File:North_Indian_cyclone_tracks.jpg
19
Figure 10: Number of Tropical Depressions and Storms in the North Indian Basin
Source: https://www.metoffice.gov.uk/research/weather/tropical-cyclones/tracks/composites/ni
III. ADAPTATION ASSESSMENT
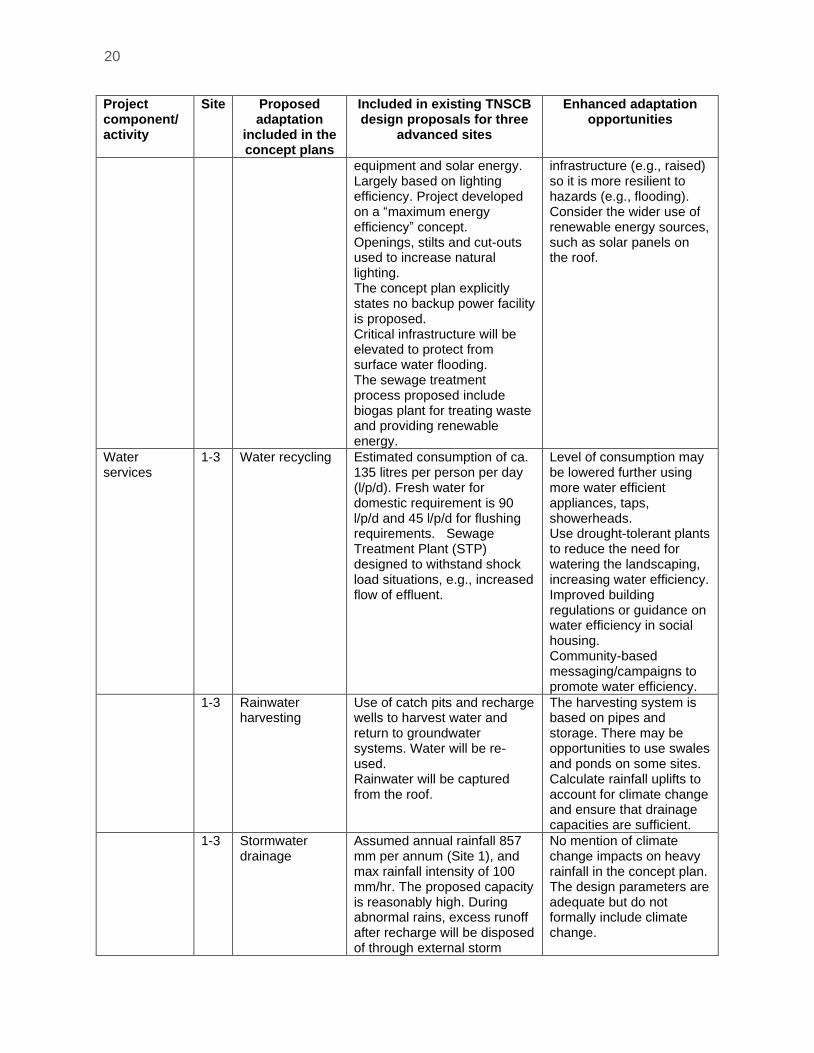
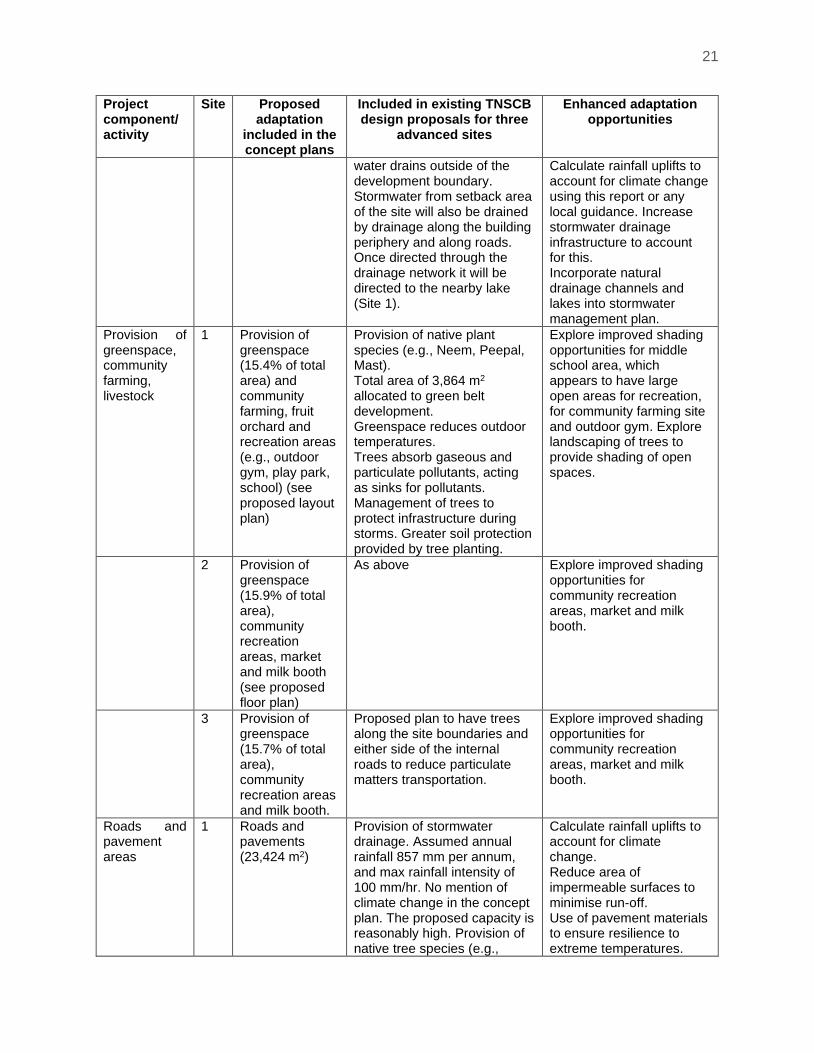
41. This section reviews the available information for the three priority sites to assess the planned adaptation activities and any opportunities for further adaptation. It covers the components related to residential building design, water efficiency, stormwater drainage and disaster risk planning that are describe in the site conceptual plans. Table 10: Summary of proposed climate adaptation measures in site concept plans and
potential enhanced adaptation (1-Reddiarpatti, 2-Kalanivasal, 3-Vallam) Project component/ activity
Site Proposed adaptation
included in the concept plans
Included in existing TNSCB design proposals for three
advanced sites
Enhanced adaptation opportunities
Residential buildings
3 Thermal building comfort
Use of cooling tiles on roof surfaces. Provision of insulated sheet cladding and shading. Consideration of building design and positioning to capitalise on natural ventilation. Design has been optimised using thermal modelling. Permeable paving to minimise heat gain.
Thermal modelling was highlighted for Vallam only. Similar modelling is required at other sites. Use of landscaping of the greenbelt to provide more shaded areas. Incorporate reflective and low conductivity surfaces to reduce thermal heating. Demonstrate alignment with India Green Building standards.
Energy supply 3 Energy infrastructure
Proposed savings of 10 to 15% by using energy efficient
Potential to consider location of energy
20
Project component/ activity
Site Proposed adaptation
included in the concept plans
Included in existing TNSCB design proposals for three
advanced sites
Enhanced adaptation opportunities
equipment and solar energy. Largely based on lighting efficiency. Project developed on a “maximum energy efficiency” concept. Openings, stilts and cut-outs used to increase natural lighting. The concept plan explicitly states no backup power facility is proposed. Critical infrastructure will be elevated to protect from surface water flooding. The sewage treatment process proposed include biogas plant for treating waste and providing renewable energy.
infrastructure (e.g., raised) so it is more resilient to hazards (e.g., flooding). Consider the wider use of renewable energy sources, such as solar panels on the roof.
Water services
1-3 Water recycling
Estimated consumption of ca. 135 litres per person per day (l/p/d). Fresh water for domestic requirement is 90 l/p/d and 45 l/p/d for flushing requirements. Sewage Treatment Plant (STP) designed to withstand shock load situations, e.g., increased flow of effluent.
Level of consumption may be lowered further using more water efficient appliances, taps, showerheads. Use drought-tolerant plants to reduce the need for watering the landscaping, increasing water efficiency. Improved building regulations or guidance on water efficiency in social housing. Community-based messaging/campaigns to promote water efficiency.
1-3 Rainwater harvesting
Use of catch pits and recharge wells to harvest water and return to groundwater systems. Water will be re-used. Rainwater will be captured from the roof.
The harvesting system is based on pipes and storage. There may be opportunities to use swales and ponds on some sites. Calculate rainfall uplifts to account for climate change and ensure that drainage capacities are sufficient.
1-3 Stormwater drainage
Assumed annual rainfall 857 mm per annum (Site 1), and max rainfall intensity of 100 mm/hr. The proposed capacity is reasonably high. During abnormal rains, excess runoff after recharge will be disposed of through external storm
No mention of climate change impacts on heavy rainfall in the concept plan. The design parameters are adequate but do not formally include climate change.
21
Project component/ activity
Site Proposed adaptation
included in the concept plans
Included in existing TNSCB design proposals for three
advanced sites
Enhanced adaptation opportunities
water drains outside of the development boundary. Stormwater from setback area of the site will also be drained by drainage along the building periphery and along roads. Once directed through the drainage network it will be directed to the nearby lake (Site 1).
Calculate rainfall uplifts to account for climate change using this report or any local guidance. Increase stormwater drainage infrastructure to account for this. Incorporate natural drainage channels and lakes into stormwater management plan.
Provision of greenspace, community farming, livestock
1 Provision of greenspace (15.4% of total area) and community farming, fruit orchard and recreation areas (e.g., outdoor gym, play park, school) (see proposed layout plan)
Provision of native plant species (e.g., Neem, Peepal, Mast). Total area of 3,864 m2 allocated to green belt development. Greenspace reduces outdoor temperatures. Trees absorb gaseous and particulate pollutants, acting as sinks for pollutants. Management of trees to protect infrastructure during storms. Greater soil protection provided by tree planting.
Explore improved shading opportunities for middle school area, which appears to have large open areas for recreation, for community farming site and outdoor gym. Explore landscaping of trees to provide shading of open spaces.
2 Provision of greenspace (15.9% of total area), community recreation areas, market and milk booth (see proposed floor plan)
As above Explore improved shading opportunities for community recreation areas, market and milk booth.
3 Provision of greenspace (15.7% of total area), community recreation areas and milk booth.
Proposed plan to have trees along the site boundaries and either side of the internal roads to reduce particulate matters transportation.
Explore improved shading opportunities for community recreation areas, market and milk booth.
Roads and pavement areas
1 Roads and pavements (23,424 m2)
Provision of stormwater drainage. Assumed annual rainfall 857 mm per annum, and max rainfall intensity of 100 mm/hr. No mention of climate change in the concept plan. The proposed capacity is reasonably high. Provision of native tree species (e.g.,
Calculate rainfall uplifts to account for climate change. Reduce area of impermeable surfaces to minimise run-off. Use of pavement materials to ensure resilience to extreme temperatures.
22
Project component/ activity
Site Proposed adaptation
included in the concept plans
Included in existing TNSCB design proposals for three
advanced sites
Enhanced adaptation opportunities
Neem, Peepal, Mast) along roads.
Use of permeable materials that provide additional cooling benefits.
2 Roads and pavements (1,217 m2)
^^ ^^
3 Roads and pavements (6,923 m2)
Provision of stormwater drainage to Vallam Lake. Assumed annual rainfall 984 mm per annum, and max rainfall intensity of 100 mm/hr. No mention of climate change in the concept plan. The proposed capacity is reasonably high. Provision of native tree species and green cover (e.g., Neem, Peepal, Mast) along roads.
^^
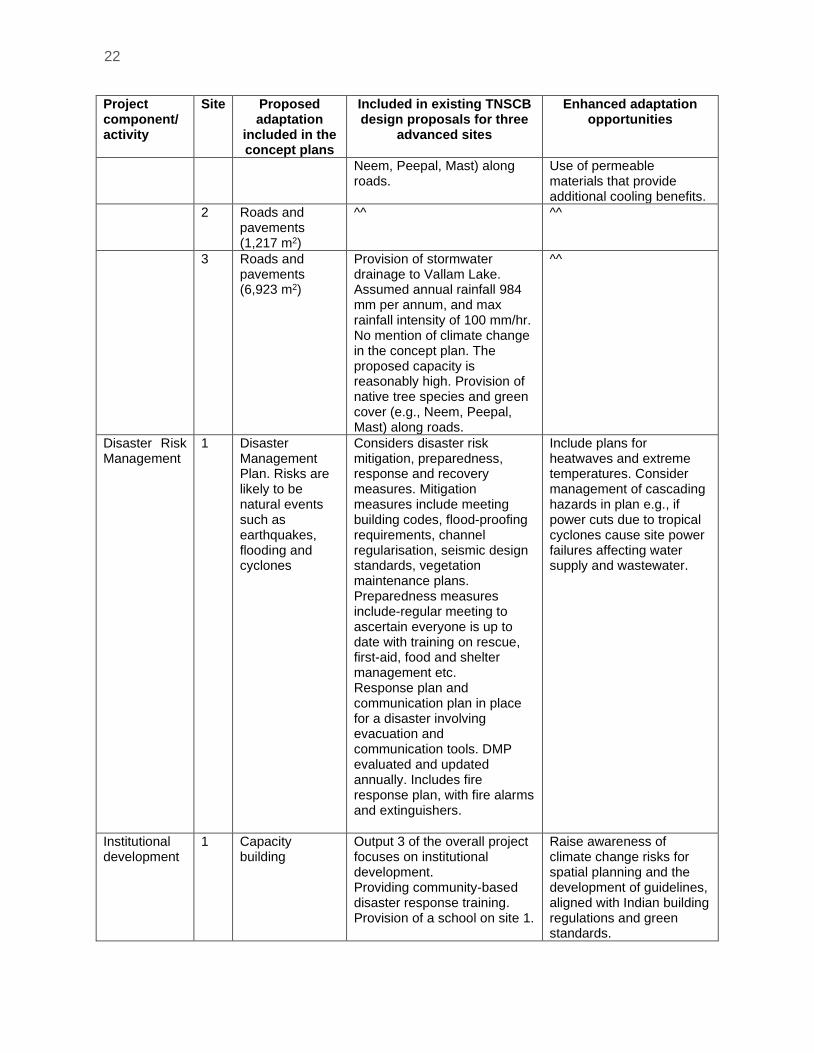
Disaster Risk Management
1 Disaster Management Plan. Risks are likely to be natural events such as earthquakes, flooding and cyclones
Considers disaster risk mitigation, preparedness, response and recovery measures. Mitigation measures include meeting building codes, flood-proofing requirements, channel regularisation, seismic design standards, vegetation maintenance plans. Preparedness measures include-regular meeting to ascertain everyone is up to date with training on rescue, first-aid, food and shelter management etc. Response plan and communication plan in place for a disaster involving evacuation and communication tools. DMP evaluated and updated annually. Includes fire response plan, with fire alarms and extinguishers.
Include plans for heatwaves and extreme temperatures. Consider management of cascading hazards in plan e.g., if power cuts due to tropical cyclones cause site power failures affecting water supply and wastewater.
Institutional development
1 Capacity building
Output 3 of the overall project focuses on institutional development. Providing community-based disaster response training. Provision of a school on site 1.
Raise awareness of climate change risks for spatial planning and the development of guidelines, aligned with Indian building regulations and green standards.
23
Project component/ activity
Site Proposed adaptation
included in the concept plans
Included in existing TNSCB design proposals for three
advanced sites
Enhanced adaptation opportunities
Local people will be employed as service providers/maintenance staff
Proposed socio-economic benefits from a new development such as job opportunities and further development of a commercial area.
m2 = square meter
Thermal Comfort
42. Traditional Indian architecture manages extreme heat through dense compact settlement, building orientation, heavy thermal mass, courtyards to provide shade and ventilation, evaporative cooling, low window to wall ratio, shading devices and roof insulation. Modern building design includes reference to Indian standards and green building rating systems15 and in international guidelines there is also further guidelines in international green building standards (Appendix 3).
1. Climate adaptation
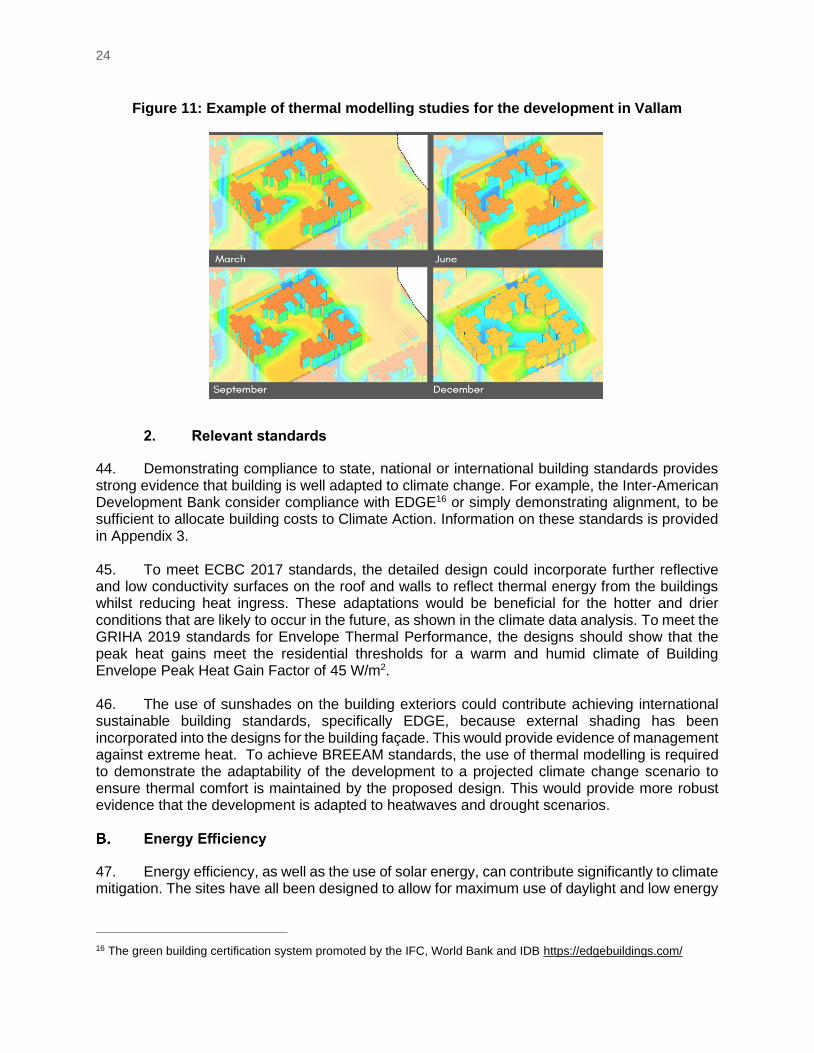
43. The social housing developments have considered adaptations for thermal comfort through the use of cooling tiles on roofs and insulated sheet cladding and sunshades to reduce heat ingress inside the buildings. Exterior window overhangs and interior curtains will further prevent heat ingress throughout the building. Similarly, the position of the buildings will ensure protection from sun and utilise natural ventilation by being built parallel to the predominant wind direction. This creates wind channels and equal ventilation to all housing units. The use of natural ventilation will help to maintain thermal comfort as a cooling mechanism and use no energy. These measures will help to ensure the residents are thermally comfortable during heatwaves which are likely to increase in frequency and temperature in the region in the future. To further incorporate thermal comfort measures, stilts, openings and the use of a variety of building heights are proposed to facilitate wind flow through the sites. The site concept for Vallam included thermal modelling for current conditions (Figure 11).
15 Energy Conservation Building Directives (ECBD 2017 and 2018) and Green Rating for Integrated Habitat
Assessment https://www.grihaindia.org/self-evaluation-checklist.
24
Figure 11: Example of thermal modelling studies for the development in Vallam
2. Relevant standards
44. Demonstrating compliance to state, national or international building standards provides strong evidence that building is well adapted to climate change. For example, the Inter-American Development Bank consider compliance with EDGE16 or simply demonstrating alignment, to be sufficient to allocate building costs to Climate Action. Information on these standards is provided in Appendix 3. 45. To meet ECBC 2017 standards, the detailed design could incorporate further reflective and low conductivity surfaces on the roof and walls to reflect thermal energy from the buildings whilst reducing heat ingress. These adaptations would be beneficial for the hotter and drier conditions that are likely to occur in the future, as shown in the climate data analysis. To meet the GRIHA 2019 standards for Envelope Thermal Performance, the designs should show that the peak heat gains meet the residential thresholds for a warm and humid climate of Building Envelope Peak Heat Gain Factor of 45 W/m2. 46. The use of sunshades on the building exteriors could contribute achieving international sustainable building standards, specifically EDGE, because external shading has been incorporated into the designs for the building façade. This would provide evidence of management against extreme heat. To achieve BREEAM standards, the use of thermal modelling is required to demonstrate the adaptability of the development to a projected climate change scenario to ensure thermal comfort is maintained by the proposed design. This would provide more robust evidence that the development is adapted to heatwaves and drought scenarios.
Energy Efficiency
47. Energy efficiency, as well as the use of solar energy, can contribute significantly to climate mitigation. The sites have all been designed to allow for maximum use of daylight and low energy
16 The green building certification system promoted by the IFC, World Bank and IDB https://edgebuildings.com/
25
LED lighting. In addition, the resilience of energy infrastructure on site has been considered, which contributes to climate adaptation.
1. Climate mitigation
48. To incorporate energy efficiency, the buildings will be spaced apart in a way that will allow natural sunlight to be received by all units during both summer and winter seasons. This indicates energy efficient design by utilising sunlight, to illuminate the buildings sufficiently during the day. This use of solar energy contributes approximately 6% to the total energy savings of 10-15%. These savings are also made through the use of LED bulbs and using copper wound transformers. The buildings will be designed to maximise the use of natural daylight using stilts, openings and windows in corridors or corner block to allow greater light penetration. The masterplan for Pallipalayam shows that the GRIHA standards for useful daylight illuminance (UDI) should be met with 61% of the total areas meeting UDI criteria.
2. Climate adaptation
49. To adapt to the increased risk of flood from heavy rainfall in the future, the placement of energy infrastructure is important to avoid any outage due to shallow surface water flooding. No backup source of power is stated in the concept plans apart from onsite diesel generators, the location of these is not specified however it is stated that critical infrastructure will be built in elevated areas to prevent flood risk alongside regular monitoring of stormwater drains.
3. Relevant standards
50. To meet further GRIHA standards, the lighting installed outside and in communal areas should have an efficacy of 80lm/W and transformers used should be BEE 3-star rated. To ensure further energy efficiency, ECBC 2017 standards recommend the diesel generators to be BEE 3 star rated and saving roof space for renewable energy, such as solar panels, for future requirements. To achieve, international standards such as BREEAM,17 external lighting requires an efficacy of 60 lm/W and to be automatically controlled in daylight. The passive design and free cooling of the building helps to lower its overall energy demand by relying on natural light and ventilation instead of energy intensive alternatives. 51. To reach international BREEAM standards of surface runoff management, all electrical infrastructures should be at least 600 mm above the projected flood zone, or in this case runoff depths during heavy storms.
Water services
52. The concept plans outline climate adaptations related to water scarcity and low rainfall as well as flood risk and heavy rainfall. The introduction of potential Biomethanisaton Plants provides a form of renewable energy on each site. Water re-use also has climate mitigation benefits as it reduces water treatment and pumping to the site, reducing local energy use.
1. Climate mitigation
17 Building Research Establishment Environmental Assessment Method https://www.thenbs.com/knowledge/what-is-
breeam.
26
53. Solid Waste. Potentially biomethanisation plants can be used to treat solid waste from wastewater and other sources and produce biogas, which is an important form of renewable energy and can used for cooking or other purposes. It can make an important contribution to the protection and improvement of natural resources and environment. Slurry, a residue from the process, is a high-grade fertilizer which can be used in community gardens and other greenspace.
2. Climate adaptation
54. Water re-use. All the developments propose use of a sequencing batch reactor (SBR) technology to treat the total wastewater volume and this process can treat up to 28% of wastewater, allowing re-use for flushing water . The remaining treated water will be disposed of into the rainwater harvesting pits or the underground sewer line when there is excess. 55. Figure 12 depicts the treatment and recycling process for the Vallam. Water recycling in this way reduces the need for potable water and as such reduces the impacts of droughts and heatwaves that are likely to increase in the future in a water scarce area. 56. Rainwater Harvesting. Rainwater will be harvested from the roofs of the developments in order to conserve water. The rainwater will be treated, stored and reused when required. Rainwater will drain from roofs and ground level inlets along the main roads, into filtration chambers/catch basins. These treat the rainwater before it will be stored in collection sumps. The overflow from these collection sumps will feed into recharge wells that will help to recharge shallow groundwater sources. This process is illustrated in Figure13. 57. Rainwater harvesting will help the developments adapt to droughts by protecting local water sources in a water scarce area and in a region that will expect higher frequencies of drought in the future. 58. This proposal is broadly based on the average rainfall intensity of each site over the past 10 years and in accordance with Indian standards, which typically focus on 1 in 2-year rainfall depths. 59. With heavy rainfall events likely to occur more frequently in this area, the rain harvesting system should reflect this in its design, such as increasing the system’s capacity. The harvesting system proposed is based on pipes and storage. There may be opportunities to use swales and ponds on site as more natural alternatives which could help to store more water and recharge groundwater as water soaks into the ground. 60. Furthermore, the plans mention development of water conservation schemes although provides no further detail of this. Community-based messaging or campaigns to encourage water efficiency around the development could promote/teach water saving practices to residents to reduce the impacts of drought.
27
Figure 12: Example of Vallam water treatment and recycling process
28
Figure 13: Design of stormwater systems and recharge pits
29
61. Drainage systems. Stormwater drainage will be installed across the sites, with inlets along the curb of main and branch roads as well as along the periphery of the buildings and setback areas. The drainage layout will divert stormwater to the rainwater harvesting pits. Excess water will be drained by external stormwater drains that connect to the municipal stormwater drain. During construction, drains will be provided for on-site runoff. Management of stormwater ensures that the risk of pluvial flooding is minimised to the development an adaptation that is important considering the likelihood of increased heavy rainfall across the region in the future. 62. Similarly, to the rainwater harvesting, the stormwater drainage systems have been designed using the rainfall intensity of each site from the last 10 years and a maximum intensity of 100mm per hour. Whilst a high intensity has been used within the design, the predicted uplifts in rainfall intensity from climate change should be calculated to ensure the drainage capacity of the developments are large enough. 63. All 3 of the most advanced sites have lakes within 2km of the development which excess stormwater is diverted to. These waterbodies act as natural drainage channels and their use within the proposed drainage system could be developed further by using these lakes to dispose of or store higher volumes of storm water instead of disposing the water via drains.
3. Relevant standards
64. The water treatment plants will be built to conserve water and to meet Tamil Nadu Pollution Control Board regulations. The plans meet the GRIHA standards for water reuse by treating 100% of sewage water and the reuse of the treated water on site. These measures appear to partly achieve the EDGE standards for water consumption through the provision of a greywater reuse system made to national standards that supplies 34% of the water requirements. 65. The proposed rainwater harvesting meets GRIHA standards of water reuse by using harvested rainwater on site. To meet further water saving standards, treated water or rainwater could be used during the construction phase instead of using potable water. The rainwater system also meets EDGE water consumption standards by offsetting demands for potable water by reusing rainwater. This indicates the rainwater harvesting system is an effective adaptive measure to reduce the risk of droughts. 66. The proposed stormwater drainage meets the GRIHA standards for stormwater management by ensuring runoff pre and post construction is managed on site. International
30
standards such as BREEAM require runoff calculations to explicitly allow for climate change. The use of swales and natural channels to store stormwater is a measure that could help to achieve international BREEAM standards of drainage by reducing the volume of stormwater, hence minimising localised flood risk. 67. Another adaptation to be considered is the use of more permeable road surfaces across the development, to reduce the volume of runoff on the sites, allowing percolation into the ground. This would help to recharge the groundwater sources whilst minimising flood risk and volume of water within the drainage system. This measure is recommended in the GRIHA standards, as a measure to reduce the urban heat island effect (through evaporative cooling).
Greenbelt
68. All three developments contain designs for greenbelt that consists of around 15% of the total site area. These areas will be reserved for tree planting. Within these plantations, native tree species will be planted such as Neem, Peepal, Mast species, helping to restore natural habitats. The layout for the greenbelts is not specific but would consist of planting around the site boundary and along internal roads at least. 69. As the sites are generally barren land with little vegetation so the planting of these species would improve the previous vegetation cover as well as providing protection to the topsoil, which can be degraded with reduced soil moisture observed during droughts. Dense tree planting will provide relief from heat across the site areas by creating shade. Alongside tree planting, pergola seating areas will be used to minimise heat effects. As the developments are in areas prone to cyclones, trees and shrubs will be under regular management to ensure they do not damage the surrounding buildings during periods of high winds such as cyclones. 70. Proposed community spaces such as schools, fruit orchards and markets spaces could be further adapted for thermal comfort in heatwaves by including further planning to shade exposed, open spaces such as the schools and outdoor gym. Shading can be provided through building design and position as well as using trees to reduce open cover whilst allowing in light.
Roads
71. As previously mentioned, the roads will have stormwater drain inlets along the curbs to drain to the rainwater pits which will reduce surface water flooding risk from heavy rainfall. Also mentioned previously, the roads will be lined with trees, to reduce transmission of pollutants from traffic but this may also shade roads which can reduce the risk of buckling under extreme heat. 72. Further adaptations to more frequent cyclones and heavy rainfall, include building roads with permeable materials to allow infiltration of this will further reduce runoff on site during heavy rainfall. This aligns with GRIHA standards to maximise soft paved areas to minimise the urban heat island effect which reduces the impact of heatwaves. To reduce risks of heatwaves, the roads should be reinforced to ensure it can withstand exposure to very high temperatures. 73. The project is well connected to by road, rail and air and the projects will include bus bays for public buses. This meets the GRIHA standard for proximity to transport and basic services because these are situated less than 500m from the site entrance. Further measures could include providing facilities for cycling.
31
Disaster Risk Management Plans
74. Disaster Management Plans (DMP) are included within the concept plans and consider mitigation, preparedness, response and recovery measures. Mitigation measures include meeting building codes, flood-proofing requirements, channel regularisation, seismic design standards and vegetation maintenance plans. Preparedness measures include the training of residents in disaster and emergency situations with regular meeting to ascertain everyone is up to date with training on rescue, first-aid, food and shelter management. A response plan will be provided to residents detailing evacuation and a communication plan will be in place with wireless communication tools. DMP will be evaluated and updated annually and after a disaster occurs. An Emergency Action Committee will be created to prepare disaster procedures and communicate information to residents as well as aiding recovery after a disaster. 75. The DMPs ensure that the buildings will be built to current flood-proofing and cyclone wind-proofing requirements as well as using zoning to maintain development away from higher risk areas. This indicates that the buildings are adapted to current climate hazards however they do not mention climate change in these plans or how to prepare for cascading hazards. To meet international standards, evidence from local authority and statutory bodies should be used to understand the known and predicted impacts of climate change on the site; this kind of information could be developed as part of Output 3 on institutional development and capacity building. 76. Fire protection measures for the development will be designed to local standards, NBC and Engineering Design Standards. This comprises of a piping system, fire water static storage, pumping system, hydrant system and sprinkler system alongside fire extinguishers and alarms. To meet GRIHA standards, the fire systems should be Halon free.
Institutional development and capacity building
77. Output 3 of the project will support the development of Regional Plans. It will include provisions for economic development and affordable housing to balance growth throughout the State with regard to infrastructure development, environmental protection, and disaster risk management. The regional plan development can promote climate change adaptation and mitigation, e.g., by making better use of more detailed hazard mapping or through promotion of building design guidelines and good practice, which include climate change factors in drainage design, introduce greater passive cooling and use of multipurpose greenspace and promote water efficiency and reuse. 78. Each individual housing project will assist capacity building and job creation by providing employment opportunities as service providers and maintenance staff on site. Each development may stimulate commercial developments leading to improvement of the local economy and improved living standards. Further, the conceptual plans propose community-based disaster response training and provision of an onsite school on one site. By providing disaster response training, residents will be prepared for natural hazards such as flooding and cyclones. The Disaster Management Plan (DMP) could be extended to provide further information or training for coping with extreme temperatures.
Summary
79. The Climate Change Risk and Vulnerability Assessment has considered the exposure of proposed social housing projects to hazards including heatwaves, heavy rainfall and droughts and assessed future risks based on a wide range of climate change scenarios for the 2050s. It
32
reviewed the proposed adaptation actions for the project as a whole, particularly sustainable building features, which were included in the concept designs for the first three project resettlement sites. It reviewed the Bill of Quantities for one site to determine the percent of capital expenditure that could be attributed to Climate Action. A summary of the climate change assessment is included in Table 11.
Table 11: Summary of the climate risks and vulnerability of the project components
A. Sensitivity of Project Component(s) to Climate or Weather Conditions and the Sea Level
The project will provide affordable social housing for vulnerable people living in slums as well as migrant workers. The slum clearance sites are located in hazardous areas with low environmental quality and a lack of sanitation and other basic services with increased exposure and vulnerability to climate hazards, particularly extreme heat and flood risk. The resettlement sites include social housing, associated services, school buildings and the provision of greenspace; these sites are sensitive to the following:
• Construction of multi-storey dwellings. Buildings, pavements and roads are sensitive to extremely high temperatures, which affect thermal comfort and may damage built infrastructure18
• Construction of stormwater drainage systems. High rainfall in the monsoon season could overwhelm storm drainage systems, leading to surface water flooding on site and in the local area.
• Development of greenspace. The provision of greenspace, community gardening and tree planting may be affected by low rainfall or drought conditions in pre-monsoon season or unreliable south west monsoon rainfall.
B. Climate Risk Screening
Screening based on climate vulnerability (sensitivity and exposure) of the resettlement sites to hazards, indicated that individual components are vulnerable to heatwaves, tropical cyclones or drought. This assessment was based on local information and site characterisation in the conceptual plans for the most advanced three sites as well as the ‘ThinkHazard’ tool that provides district level data.
• Construction of multi-storey dwellings. An increase in extreme high temperatures could raise internal temperatures to above the comfort threshold of 35 oC
• Construction of dwellings and associated services infrastructure: Some resettlement sites are in the high impact zone for Tropical Cyclones, which can cause damage due to high winds and associated heavy rainfall, causing surface water flooding.
• Water supply for residents and outdoor space. Extreme low rainfall periods could threaten water supplies for residents, any livestock, community gardening and greenspace.
C. Climate Risk and Adaptation Assessment
A risk classification for three Climate Futures for the 2050s is summarised in Table 6.
The risk assessment considered project components that had a high vulnerability to extreme weather and future climate change. The assessment was based on desk study using the available baseline data, climate change projections, project documents, three resettlement site concept plans, two masterplans and research literature. It included a review of the Tamil Nadu Climate Action Plan. Climate scenarios were developed based on NASA statistically downscaled CMIP5 climate change models and summarised as three simple scenarios with warming of 1.5, 2.0 and 3.0oC by the 2050s.
Additional data sources included FAO CLIMWAT climate data, detailed European Centre for Medium Range Weather Forecasting (ECMWF) reanalysis and observed daily rainfall data from the ADB Cauvery Delta Zone projects.
Key assumptions were that the range of climate scenarios under Representative Concentration Pathways (RCPs) 4.5 and 8.5 could be simplified to three scenarios for risk assessment and that the adaptation options
18 The ‘Thermal Comfort Zone’ guidelines in India based on Adaptive Comfort Approach prescribe an acceptable range
of maximum internal temperatures of 24°C to 35°C. Outdoor temperatures can already exceed 40 oC and may rise another 3oC by the 2050s due to climate change.
33
presented for the first 3 resettlement sites would be repeated for all future sector developments. With Output 3 focused on capacity building it was assumed that this would enable enhanced adaptation in some of the future developments, for example by promoting climate change guidelines and best practice in sustainable building design as part of regional planning.
Climate risks were assessed without adaptation, highlighting high risk of heatwaves, medium-high risk of increased heavy rainfall and medium risk of very low rainfall conditions. The overall climate risk classification is medium.
The key findings of the risk assessment were as follows:
(i) Recent trends in temperature in Tamil Nadu are consistent with climate change and six of the hottest 10 years on record have been in the last decade; during the 1979-2018 period average temperature was 26.5oC and both 2014 and 2016 were more than 1oC warmer than the long-term average temperatures.
(ii) For the mid-century (2050s) climate change models suggest an increase in average temperature by 1.2oC (0.9 to 2.0 oC) under RCP4.5 and increases of 1.8oC (1.4 to 2.5 oC) under RCP8.5.
(iii) For the same time period climate change models suggest an increase in heavy rainfall of 15% (1%-25%) under RCP4.5 and 20% (6% to 44%) under RCP8.5.
(iv) The primary risk is overheating of dwelling units, schools and outdoor spaces as maximum outdoor temperatures could rise to over 43oC and the frequency of heatwaves by 8-30 fold, with heatwaves every year under the hot and dry scenario.
(v) Heavy daily rainfall is likely to increase by between 15% and 40% as outlined in the simplified climate futures (Table 6); this means that heavy rainfall events experienced now will occur 2 to 8 times more frequently in future. This has impacts of stormwater drainage systems, which need to be adequately sized to cope with higher runoff volumes.
Adaptation Assessment
The adaptation assessment was focused on the resettlement sites, but the project also includes adaptation activities in the slum clearance, which will open up and clear waterways thereby reducing flood risks, and Output 3 on regional planning, which may enable improved spatial planning and climate resilient guidelines. Key adaptations at resettlement sites include:
(i) Provision of roof cooling tiles, cladding and shade on buildings to manage overheating using passive cooling techniques.
(ii) Orientation of buildings to create shade and ventilation while still enabling daylight to illuminate properties to reduce the use of lighting.
(iii) Provision of shaded courtyards and at least 15% greenspace to promote cooling as well outdoor community farming and recreation.
(iv) Wastewater and stormwater recycling measures to reduce the water demand
(v) Stormwater drainage to cope with drainage on site and promote recharge to shallow groundwater for re-use
(vi) ‘Daylighting’ and provision of solar energy also contributes to climate mitigation by reducing energy use.
(vii) Overall, the conceptual designs include some sustainable buildings features that are aligned with GRIHA – Green Rating for Integrated Habitat Assessment, India’s green building rating assessment and go some way to meeting international standards, such as EDGE.
In order to enhance adaption further, Output 3 should integrate climate change adaption and resilience into regional planning, by focusing on selected activities that are achievable during the project time scale, e.g.
(i) Developing high quality masterplans that promote passive cooling, daylighting and provision of greenspace that demonstrates some alignment with GRIHA and sustainable buildings standards.
(ii) Incorporation of climate change allowances into drainage design to ensure that the drainage systems have sufficient capacity and can capture water for groundwater recharge and re-use
(iii) Further promotion of water demand management, including promotion of water efficiency through use of water monitoring/auditing, use low water appliances and awareness campaigns.
34
Mitigation Assessment
The design features include daylighting, use of LEDs and the introduction of biogas reactors to turn solid waste into renewable energy and fertiliser products at each site. Good access is provided to public transport, which can reduce the use of private vehicles.
D. Climate Risk Screening Tool and/or Procedure Used
Early in the project’s development the ADB AWARE tool was used to screen climate risks but this only provides provisional guidance, which has been substantially updated as part of this CRVA. This study also used the ThinkHazard tool, local information and existing climate change studies to review the exposure to hazards and potential risks.
Notes: NASA is the National Aeronautics and Space Administration; CMIP5 is the Coupled Model Inter-comparison Project of the International Panel on Climate Change; RCP is Representative Concentration Pathway used by the IPCC in the Fifth Assessment Report. Source{s}: CRVA
1. Contribution to Climate Action
80. The project’s contribution to Climate Action was estimated as $50 million USD in the July 2020 ADB Concept Paper, which is 23.2% of the total investment and 33% of the ADB contribution to the project. Based on a review of the Bill of Quantities for one resettlement site up to 25% of the costs on development sites (Output 1) could be attributed to Climate Action (Table A.3.3) using an incremental approach but this figure could be higher. Based on a more proportional approach and considering the number climate adaptation activities promoted in the site conceptual plans up to 26% of the costs could be attributed to Climate Action. Output 3 can also have a strong climate change adaptation and mitigation focus. Table 12 provides the basis for this estimate of Climate Finance is percentage terms so that it can be applied to more detailed costings, as and when these become available. 81. The estimated GHG emission reduction is based on energy savings from the use of solar energy, natural daylight utilisation, LED lights and copper wound transformers within the development sites. The estimated energy savings as described in the concept plans for Reddiarpatti, Kalanivasal and Vallam range from 230-336 KW which results in energy savings of 10-15%. The IPCC states that actual residential emissions are strongly depend on emission factors of electricity production due to the large share of indirect emissions within the sector (Lucon et al., 2014). The Government of India has not published a residential emissions factor however it has published the ‘Combined Margin Emission Factor” for the Indian Grid (2018/19), which is 0.92 t CO2/MWh. Using these components, the following equation provided by ADB was used ‘Energy savings/year x emission factor = GHG emissions reduction’ to calculate the estimated GHG reduction.
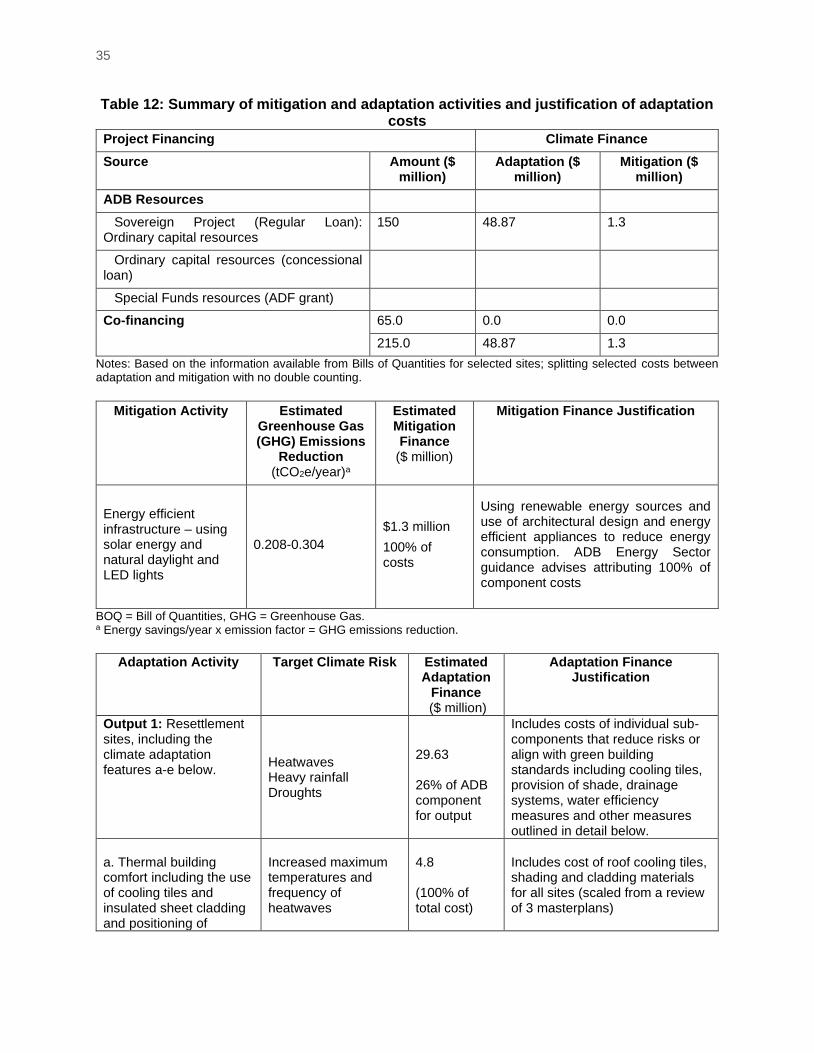
35
Table 12: Summary of mitigation and adaptation activities and justification of adaptation costs
Project Financing Climate Finance
Source Amount ($ million)
Adaptation ($ million)
Mitigation ($ million)
ADB Resources
Sovereign Project (Regular Loan): Ordinary capital resources
150 48.87 1.3
Ordinary capital resources (concessional loan)
Special Funds resources (ADF grant)
Co-financing 65.0 0.0 0.0
215.0 48.87 1.3
Notes: Based on the information available from Bills of Quantities for selected sites; splitting selected costs between adaptation and mitigation with no double counting.
Mitigation Activity Estimated Greenhouse Gas (GHG) Emissions
Reduction (tCO2e/year)a
Estimated Mitigation Finance
($ million)
Mitigation Finance Justification
Energy efficient infrastructure – using solar energy and natural daylight and LED lights
0.208-0.304
$1.3 million
100% of costs
Using renewable energy sources and use of architectural design and energy efficient appliances to reduce energy consumption. ADB Energy Sector guidance advises attributing 100% of component costs
BOQ = Bill of Quantities, GHG = Greenhouse Gas. a Energy savings/year x emission factor = GHG emissions reduction.
Adaptation Activity Target Climate Risk Estimated
Adaptation Finance
($ million)
Adaptation Finance Justification
Output 1: Resettlement sites, including the climate adaptation features a-e below.
Heatwaves Heavy rainfall Droughts
29.63 26% of ADB component for output
Includes costs of individual sub-components that reduce risks or align with green building standards including cooling tiles, provision of shade, drainage systems, water efficiency measures and other measures outlined in detail below.
a. Thermal building comfort including the use of cooling tiles and insulated sheet cladding and positioning of
Increased maximum temperatures and frequency of heatwaves
4.8 (100% of total cost)
Includes cost of roof cooling tiles, shading and cladding materials for all sites (scaled from a review of 3 masterplans)
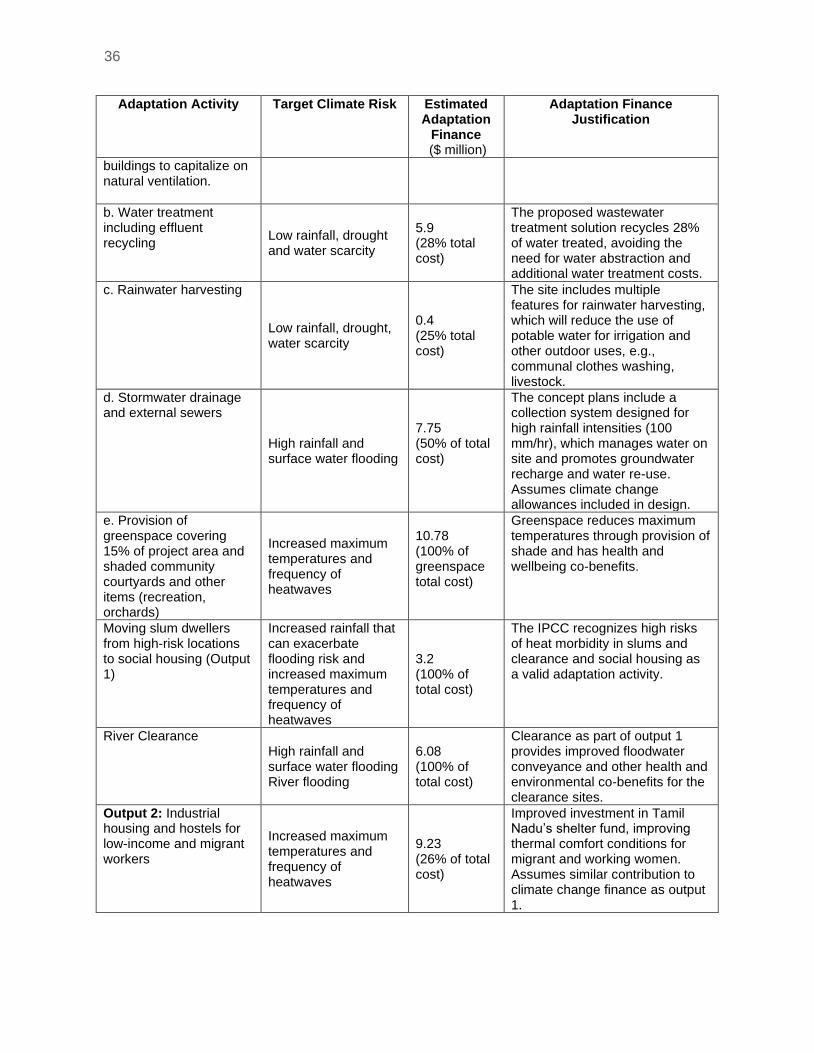
36
Adaptation Activity Target Climate Risk Estimated Adaptation
Finance ($ million)
Adaptation Finance Justification
buildings to capitalize on natural ventilation.
b. Water treatment including effluent recycling
Low rainfall, drought and water scarcity
5.9 (28% total cost)
The proposed wastewater treatment solution recycles 28% of water treated, avoiding the need for water abstraction and additional water treatment costs.
c. Rainwater harvesting
Low rainfall, drought, water scarcity
0.4 (25% total cost)
The site includes multiple features for rainwater harvesting, which will reduce the use of potable water for irrigation and other outdoor uses, e.g., communal clothes washing, livestock.
d. Stormwater drainage and external sewers
High rainfall and surface water flooding
7.75 (50% of total cost)
The concept plans include a collection system designed for high rainfall intensities (100 mm/hr), which manages water on site and promotes groundwater recharge and water re-use. Assumes climate change allowances included in design.
e. Provision of greenspace covering 15% of project area and shaded community courtyards and other items (recreation, orchards)
Increased maximum temperatures and frequency of heatwaves
10.78 (100% of greenspace total cost)
Greenspace reduces maximum temperatures through provision of shade and has health and wellbeing co-benefits.
Moving slum dwellers from high-risk locations to social housing (Output 1)
Increased rainfall that can exacerbate flooding risk and increased maximum temperatures and frequency of heatwaves
3.2 (100% of total cost)
The IPCC recognizes high risks of heat morbidity in slums and clearance and social housing as a valid adaptation activity.
River Clearance High rainfall and surface water flooding River flooding
6.08 (100% of total cost)
Clearance as part of output 1 provides improved floodwater conveyance and other health and environmental co-benefits for the clearance sites.
Output 2: Industrial housing and hostels for low-income and migrant workers
Increased maximum temperatures and frequency of heatwaves
9.23 (26% of total cost)
Improved investment in Tamil Nadu’s shelter fund, improving thermal comfort conditions for migrant and working women. Assumes similar contribution to climate change finance as output 1.
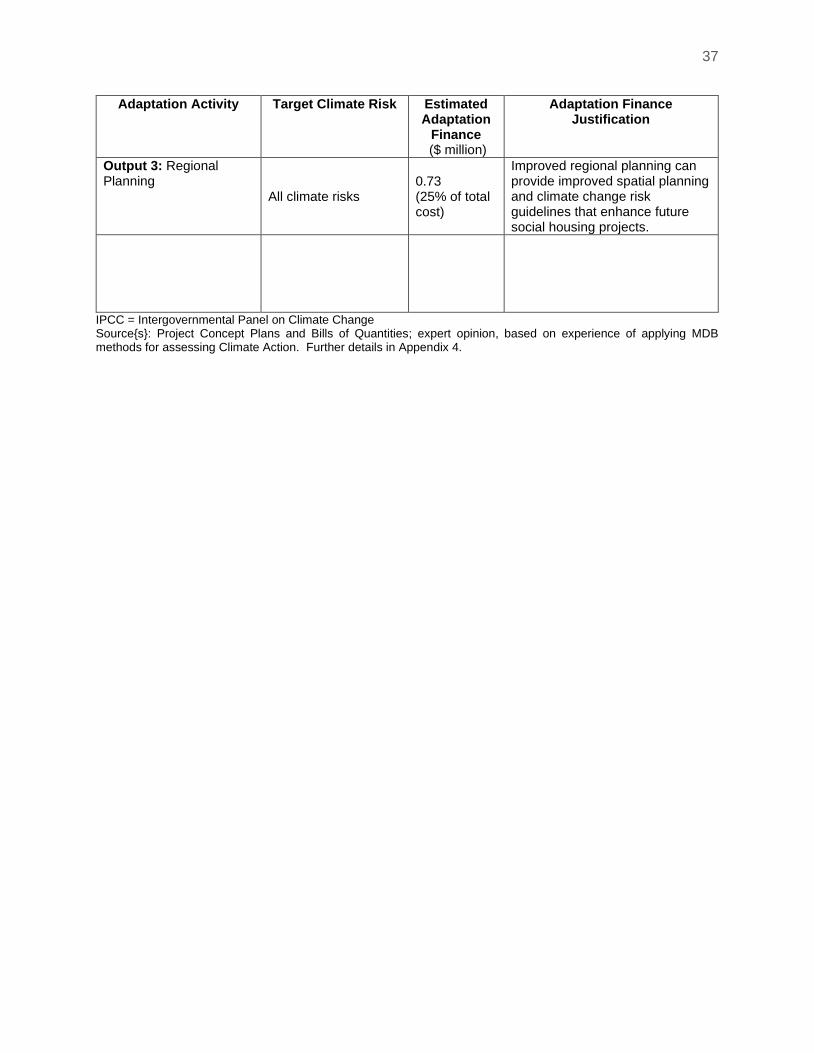
37
Adaptation Activity Target Climate Risk Estimated Adaptation
Finance ($ million)
Adaptation Finance Justification
Output 3: Regional Planning
All climate risks 0.73 (25% of total cost)
Improved regional planning can provide improved spatial planning and climate change risk guidelines that enhance future social housing projects.
IPCC = Intergovernmental Panel on Climate Change Source{s}: Project Concept Plans and Bills of Quantities; expert opinion, based on experience of applying MDB methods for assessing Climate Action. Further details in Appendix 4.
38
IV. REFERENCES
ADB 2018. Compendium of Information Sources to Support ADB Climate Risk Assessments and Management. Technical Note, August 2018.
ADB. 2015a. Climate Risk Management in ADB Projects. Manila, Philippines.
ADB. 2016b. Guidelines for Climate-Proofing Investment in the Water Sector: Water Supply and Sanitation. Manila, Philippines
Fung, F. 2018. How to Bias Correct, UKCP18 Guidance, Met Office https://www.metoffice.gov.uk/binaries/content/assets/metofficegovuk/pdf/research/ukcp/ukcp18-guidance---how-to-bias-correct.pdf
Government of Tamil Nadu Department of Environment. 2018. Climate Change Risk and Vulnerability Assessment. In: Tamil Nadu State Action Plan on Climate Change. Pp. 90-128.
GRIHA Council and The Energy and Resources Institute. 2019. GRIHA v. 2019 ABRIDGED MANUAL. TERI Press, New Delhi, India. Pp.37-38.
Holgate, S.J., Andrew Matthews, Philip L. Woodworth, Lesley J. Rickards, Mark E. Tamisiea, Elizabeth Bradshaw, Peter R. Foden, Kathleen M. Gordon, Svetlana Jevrejeva, and Jeff Pugh (2013) New Data Systems and Products at the Permanent Service for Mean Sea Level. Journal of Coastal Research: Volume 29, Issue 3: pp. 493 – 504. doi:10.2112/JCOASTRES-D-12-00175.1.
IPCC (Intergovernmental Panel on Climate Change), 2012. Summary for policymakers. In: Managing the risks of extreme events and disasters to advance climate change adaptation, eds., Field, C.B., Barros, V., Stocker, T.F., Qin, D., Dokken, D.J., Ebi, K.L., Mastrandrea, M.D., Mach, K.J., Plattner, G.K., Allen, S.K., Tignor, M. and Midgley, P.M. A Special Report of Working Groups I and II of the Intergovernmental Panel on Climate Change. Cambridge University Press, Cambridge, UK, and New York, NY, USA. Pp. 1–19.
IPCC (Intergovernmental Panel on Climate Change), 2014. Climate change 2014: Impacts, adaptation, and vulnerability. Part B: Regional aspects. Contribution of Working Group II to the Fifth Assessment Report of the Intergovernmental Panel on Climate Change, eds., Barros, V.R., Field, C.B., Dokken, D.J., Mastrandrea, M.D., Mach, K.J., Bilir, T.E., Chatterjee, M., Ebi, K.L., Estrada, Y.O., Genova, R.C., Girma, B., Kissel, E.S., Levy, A.N., MacCracken, S., Mastrandrea, P.R. and White, L.L. Cambridge, United Kingdom, and New York, NY, USA: Cambridge University Press. 688p.
IPCC (Intergovernmental Panel on Climate Change), 2018. Global Warming of 1.5 °C. An IPCC special report on the impacts of global warming of 1.5 °C above pre-industrial levels and related global greenhouse gas emission pathways, in the context of strengthening the global response to the threat of climate change, sustainable development, and efforts to eradicate poverty. Summary for Policymakers. Dated 6 October 2018. http://report.ipcc.ch/sr15/pdf/sr15_spm_final.pdf
Lowe, J.A., Bernie, D., Bett, P., Bricheno, L., Brown, S., Calvert, D., Clark, R., Eagle, K., Edwards, T., Fosser, G., Fung, F., Gohar, L., Good, P., Gregory, J., Harris, G., Howard, T., Kaye, N., Kendon, E., Krijnen, J., Maisey, P., McDonald, R., McInnes, R., McSweeney, C., Mitchell, J.F.B., Murphy, J., Palmer, M., Roberts, C., Rostron, J., Sexton, D., Thornton, H., Tinker, T., Tucker, S., Yamazaki, K. and Stephen Belcher. 2018. UKCP18 Science Overview Report – updated March 2018. Available at: https://www.metoffice.gov.uk/pub/data/weather/uk/ukcp18/science-reports/UKCP18-Overview-report.pdf
Lucon O., D. Ürge-Vorsatz, A. Zain Ahmed, H. Akbari, P. Bertoldi, L.F. Cabeza, N. Eyre, A. Gadgil, L.D.D. Harvey, Y. Jiang, E. Liphoto, S. Mirasgedis, S. Murakami, J. Parikh, C. Pyke, and M.V. Vilariño, 2014: Buildings. In: Climate Change 2014: Mitigation of Climate Change. Contribution of Working Group III to the Fifth Assessment Report of the Intergovernmental Panel on Climate Change [Edenhofer, O., R. Pichs-Madruga, Y. Sokona, E. Farahani, S. Kadner, K. Seyboth, A. Adler, I. Baum, S.Brunner, P. Eickemeier, B.
39
Kriemann, J. Savolainen, S. Schlömer, C. von Stechow, T. Zwickel and J.C. Minx (eds.)]. Cambridge University Press, Cambridge, United Kingdom and New York, NY, USA.
Mahadevia et al., 2020. Climate Change, Heat Waves and Thermal Comfort—Reflections on Housing Policy in India. Environment and Urbanization ASIA 11(1) 29–50, 2020. DOI: 10.1177/0975425320906249
McDermid et al., 2016. The impacts of climate change on Tamil Nadu rainfed maize production: a multi-model approach to identify sensitivities and uncertainties. CURRENT SCIENCE, VOL. 110, NO. 7, 10 APRIL 2016
Pandve, H.T.2009. India’s National Action Plan on Climate. Indian Journal of Occupational and Environmental Medicine. 13(1), pp17-19.
Raghupathy, S. 2020. Concept Masterplan for Pallipalayam. [Powerpoint Presentation].
Raju et al., 2013 Revisiting climatic classification in India: a district-level analysis. Current Science, Vol. 105, No. 4 (25 August 2013), pp. 492-495 Stable URL: https://www.jstor.org/stable/24098002A
Saravanakumar, V. 2015. Impact of Climate Change on Yield of Major Food Crops in Tamil Nadu, India (SANDEE Working Papers, ISSN 1893-1891; WP 91–15) ISBN: 978-9937-596-21-3
Thrasher, B., Maurer, E. P., McKellar, C., & Duffy, P. B., 2012: Technical Note: Bias correcting Climate model simulated daily temperature extremes with quantile mapping. Hydrology and Earth System Sciences, 16(9), 3309-3314
Viswanathan, K.R. 2015. State Action Plans for Climate Change. An Overview of the Assessments [Powerpoint presentation]. ‘Road to Paris: Readiness of key countries for COP 21 and beyond’, Policy Research Workshop, 6-7 January 2015.
Vivid Economics (2017) Impacts of higher temperatures on labour productivity and value for money adaptation: lessons from five DFID priority country case studies. Report prepared for the UK Department for International Development
Whetton P.H., Hennessy, K., Clarke, J., McInnes, K., and Kent, D. (2012) Use of Representative Climate Futures in impact and adaptation assessment. Climate Change, 115, 433-442.
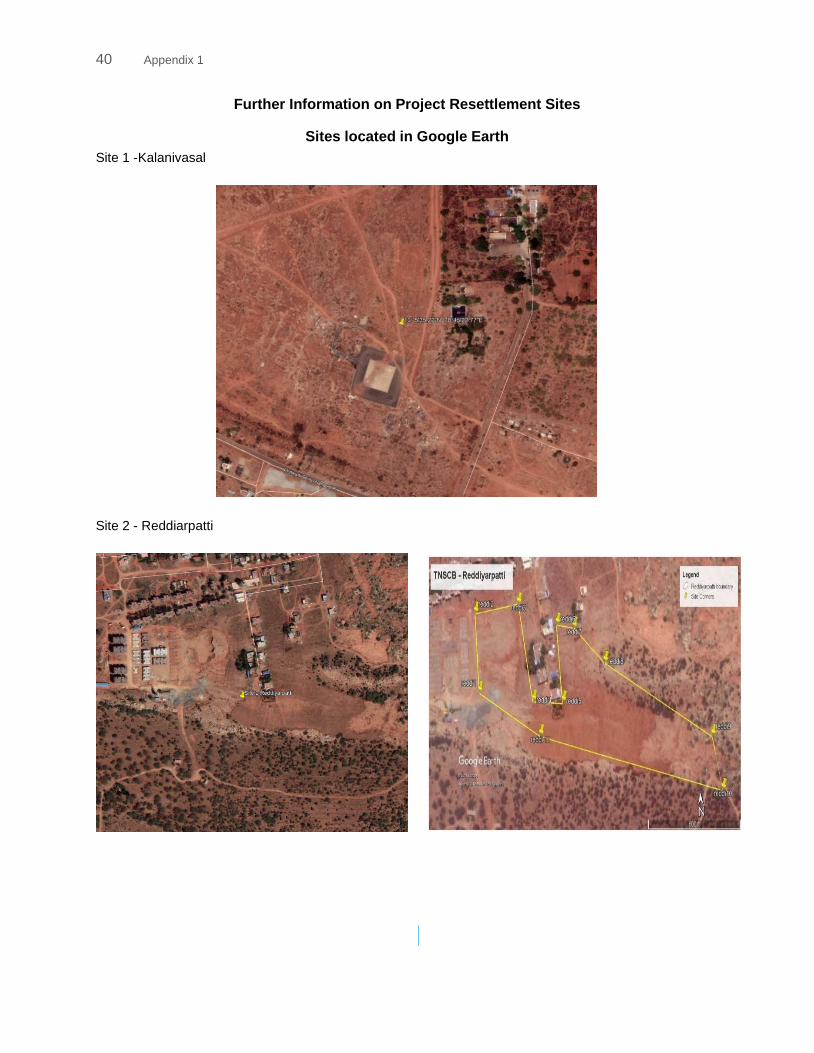
40 Appendix 1
Further Information on Project Resettlement Sites
Sites located in Google Earth
Site 1 -Kalanivasal
Site 2 - Reddiarpatti
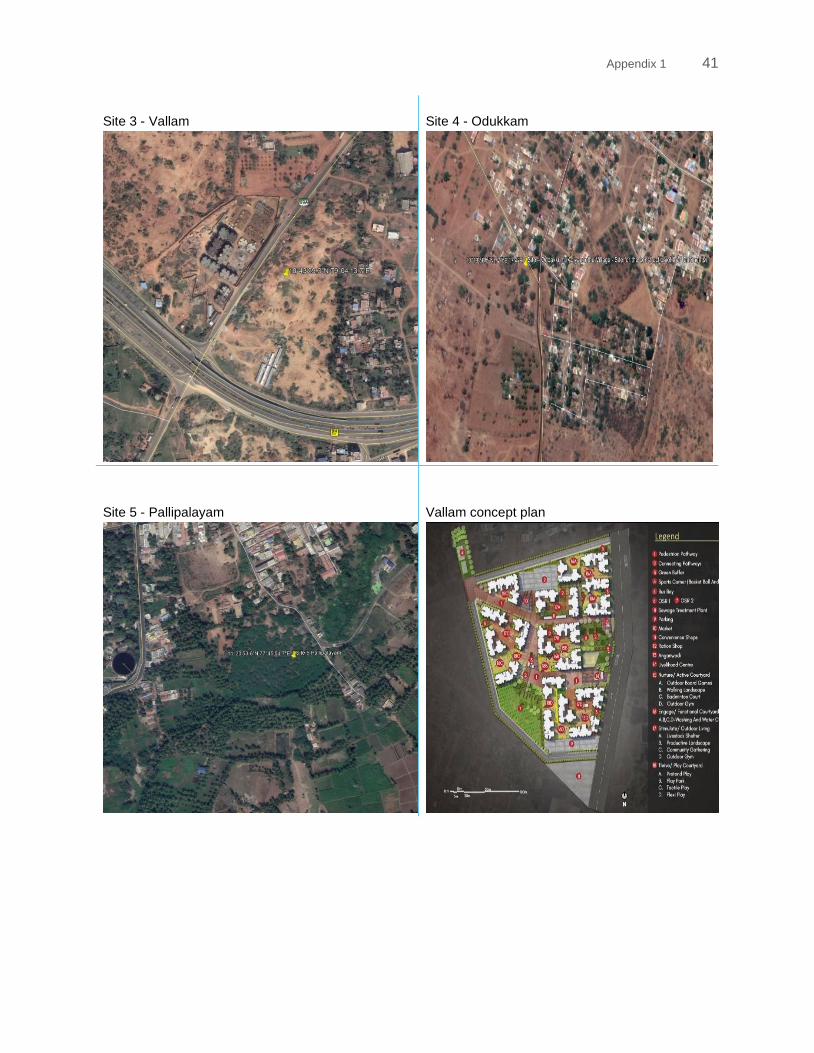
Appendix 1 41
Site 3 - Vallam
Site 4 - Odukkam
Site 5 - Pallipalayam
Vallam concept plan
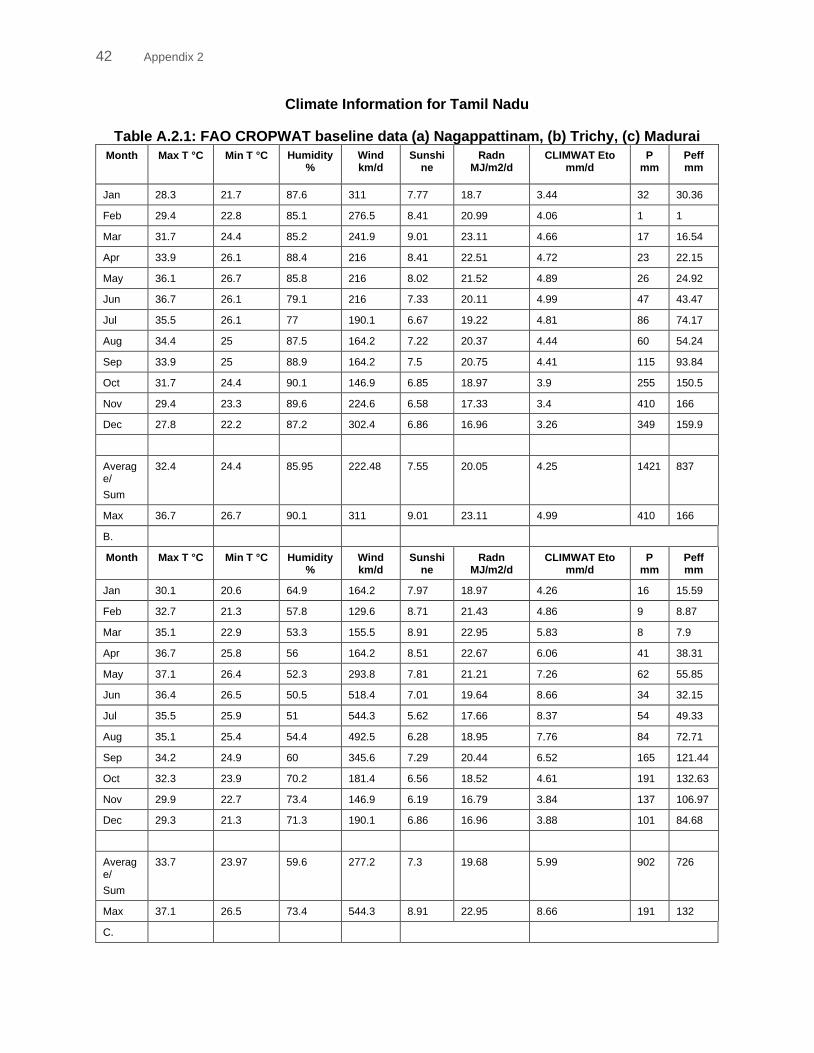
42 Appendix 2
Climate Information for Tamil Nadu
Table A.2.1: FAO CROPWAT baseline data (a) Nagappattinam, (b) Trichy, (c) Madurai
Month Max T °C Min T °C Humidity %
Wind km/d
Sunshine
Radn MJ/m2/d
CLIMWAT Eto mm/d
P mm
Peff mm
Jan 28.3 21.7 87.6 311 7.77 18.7 3.44 32 30.36
Feb 29.4 22.8 85.1 276.5 8.41 20.99 4.06 1 1
Mar 31.7 24.4 85.2 241.9 9.01 23.11 4.66 17 16.54
Apr 33.9 26.1 88.4 216 8.41 22.51 4.72 23 22.15
May 36.1 26.7 85.8 216 8.02 21.52 4.89 26 24.92
Jun 36.7 26.1 79.1 216 7.33 20.11 4.99 47 43.47
Jul 35.5 26.1 77 190.1 6.67 19.22 4.81 86 74.17
Aug 34.4 25 87.5 164.2 7.22 20.37 4.44 60 54.24
Sep 33.9 25 88.9 164.2 7.5 20.75 4.41 115 93.84
Oct 31.7 24.4 90.1 146.9 6.85 18.97 3.9 255 150.5
Nov 29.4 23.3 89.6 224.6 6.58 17.33 3.4 410 166
Dec 27.8 22.2 87.2 302.4 6.86 16.96 3.26 349 159.9
Average/
Sum
32.4 24.4 85.95 222.48 7.55 20.05 4.25 1421 837
Max 36.7 26.7 90.1 311 9.01 23.11 4.99 410 166
B.
Month Max T °C Min T °C Humidity %
Wind km/d
Sunshine
Radn MJ/m2/d
CLIMWAT Eto mm/d
P mm
Peff mm
Jan 30.1 20.6 64.9 164.2 7.97 18.97 4.26 16 15.59
Feb 32.7 21.3 57.8 129.6 8.71 21.43 4.86 9 8.87
Mar 35.1 22.9 53.3 155.5 8.91 22.95 5.83 8 7.9
Apr 36.7 25.8 56 164.2 8.51 22.67 6.06 41 38.31
May 37.1 26.4 52.3 293.8 7.81 21.21 7.26 62 55.85
Jun 36.4 26.5 50.5 518.4 7.01 19.64 8.66 34 32.15
Jul 35.5 25.9 51 544.3 5.62 17.66 8.37 54 49.33
Aug 35.1 25.4 54.4 492.5 6.28 18.95 7.76 84 72.71
Sep 34.2 24.9 60 345.6 7.29 20.44 6.52 165 121.44
Oct 32.3 23.9 70.2 181.4 6.56 18.52 4.61 191 132.63
Nov 29.9 22.7 73.4 146.9 6.19 16.79 3.84 137 106.97
Dec 29.3 21.3 71.3 190.1 6.86 16.96 3.88 101 84.68
Average/
Sum
33.7 23.97 59.6 277.2 7.3 19.68 5.99 902 726
Max 37.1 26.5 73.4 544.3 8.91 22.95 8.66 191 132
C.
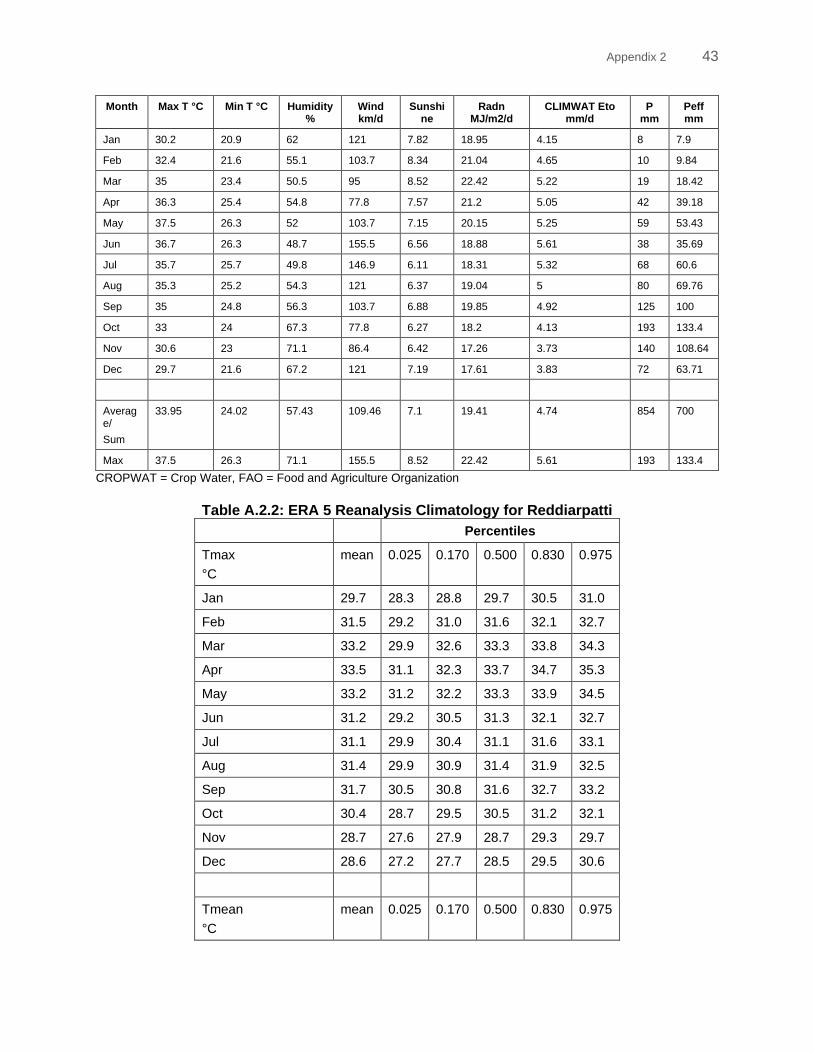
Appendix 2 43
Month Max T °C Min T °C Humidity %
Wind km/d
Sunshine
Radn MJ/m2/d
CLIMWAT Eto mm/d
P mm
Peff mm
Jan 30.2 20.9 62 121 7.82 18.95 4.15 8 7.9
Feb 32.4 21.6 55.1 103.7 8.34 21.04 4.65 10 9.84
Mar 35 23.4 50.5 95 8.52 22.42 5.22 19 18.42
Apr 36.3 25.4 54.8 77.8 7.57 21.2 5.05 42 39.18
May 37.5 26.3 52 103.7 7.15 20.15 5.25 59 53.43
Jun 36.7 26.3 48.7 155.5 6.56 18.88 5.61 38 35.69
Jul 35.7 25.7 49.8 146.9 6.11 18.31 5.32 68 60.6
Aug 35.3 25.2 54.3 121 6.37 19.04 5 80 69.76
Sep 35 24.8 56.3 103.7 6.88 19.85 4.92 125 100
Oct 33 24 67.3 77.8 6.27 18.2 4.13 193 133.4
Nov 30.6 23 71.1 86.4 6.42 17.26 3.73 140 108.64
Dec 29.7 21.6 67.2 121 7.19 17.61 3.83 72 63.71
Average/
Sum
33.95 24.02 57.43 109.46 7.1 19.41 4.74 854 700
Max 37.5 26.3 71.1 155.5 8.52 22.42 5.61 193 133.4
CROPWAT = Crop Water, FAO = Food and Agriculture Organization
Table A.2.2: ERA 5 Reanalysis Climatology for Reddiarpatti
Percentiles
Tmax
°C
mean 0.025 0.170 0.500 0.830 0.975
Jan 29.7 28.3 28.8 29.7 30.5 31.0
Feb 31.5 29.2 31.0 31.6 32.1 32.7
Mar 33.2 29.9 32.6 33.3 33.8 34.3
Apr 33.5 31.1 32.3 33.7 34.7 35.3
May 33.2 31.2 32.2 33.3 33.9 34.5
Jun 31.2 29.2 30.5 31.3 32.1 32.7
Jul 31.1 29.9 30.4 31.1 31.6 33.1
Aug 31.4 29.9 30.9 31.4 31.9 32.5
Sep 31.7 30.5 30.8 31.6 32.7 33.2
Oct 30.4 28.7 29.5 30.5 31.2 32.1
Nov 28.7 27.6 27.9 28.7 29.3 29.7
Dec 28.6 27.2 27.7 28.5 29.5 30.6
Tmean
°C
mean 0.025 0.170 0.500 0.830 0.975
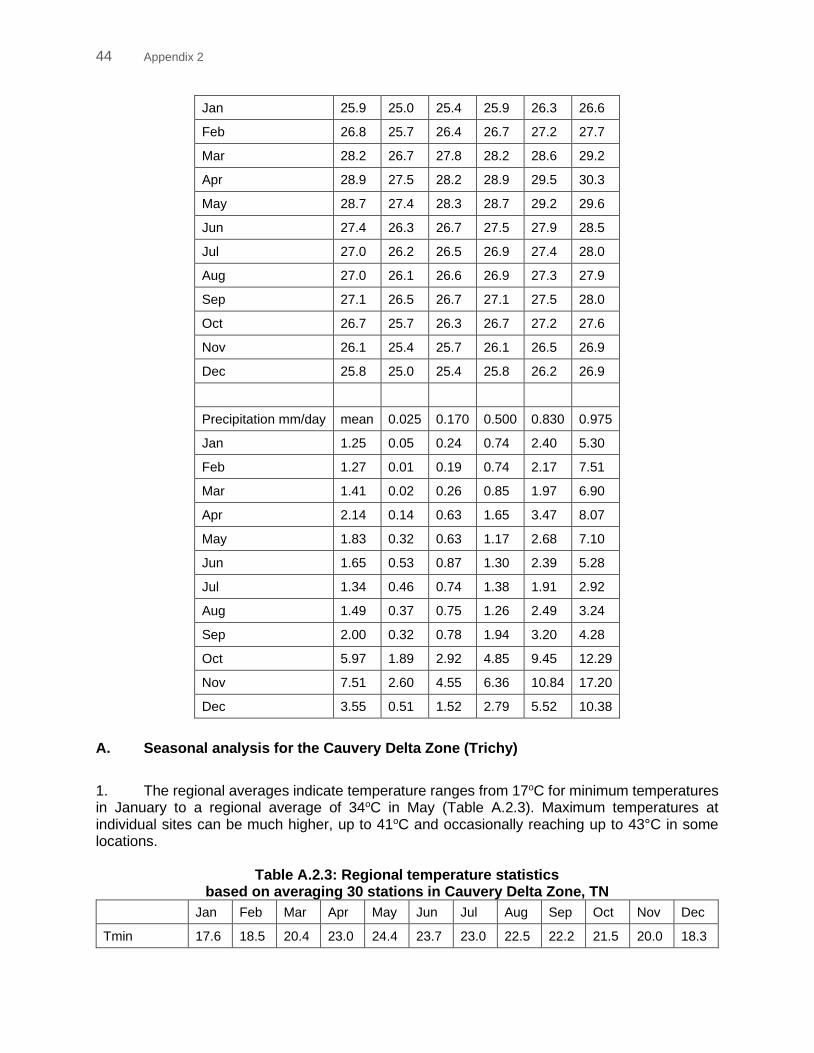
44 Appendix 2
Jan 25.9 25.0 25.4 25.9 26.3 26.6
Feb 26.8 25.7 26.4 26.7 27.2 27.7
Mar 28.2 26.7 27.8 28.2 28.6 29.2
Apr 28.9 27.5 28.2 28.9 29.5 30.3
May 28.7 27.4 28.3 28.7 29.2 29.6
Jun 27.4 26.3 26.7 27.5 27.9 28.5
Jul 27.0 26.2 26.5 26.9 27.4 28.0
Aug 27.0 26.1 26.6 26.9 27.3 27.9
Sep 27.1 26.5 26.7 27.1 27.5 28.0
Oct 26.7 25.7 26.3 26.7 27.2 27.6
Nov 26.1 25.4 25.7 26.1 26.5 26.9
Dec 25.8 25.0 25.4 25.8 26.2 26.9
Precipitation mm/day mean 0.025 0.170 0.500 0.830 0.975
Jan 1.25 0.05 0.24 0.74 2.40 5.30
Feb 1.27 0.01 0.19 0.74 2.17 7.51
Mar 1.41 0.02 0.26 0.85 1.97 6.90
Apr 2.14 0.14 0.63 1.65 3.47 8.07
May 1.83 0.32 0.63 1.17 2.68 7.10
Jun 1.65 0.53 0.87 1.30 2.39 5.28
Jul 1.34 0.46 0.74 1.38 1.91 2.92
Aug 1.49 0.37 0.75 1.26 2.49 3.24
Sep 2.00 0.32 0.78 1.94 3.20 4.28
Oct 5.97 1.89 2.92 4.85 9.45 12.29
Nov 7.51 2.60 4.55 6.36 10.84 17.20
Dec 3.55 0.51 1.52 2.79 5.52 10.38
A. Seasonal analysis for the Cauvery Delta Zone (Trichy)
1. The regional averages indicate temperature ranges from 17oC for minimum temperatures in January to a regional average of 34oC in May (Table A.2.3). Maximum temperatures at individual sites can be much higher, up to 41oC and occasionally reaching up to 43°C in some locations.
Table A.2.3: Regional temperature statistics based on averaging 30 stations in Cauvery Delta Zone, TN
Jan Feb Mar Apr May Jun Jul Aug Sep Oct Nov Dec
Tmin 17.6 18.5 20.4 23.0 24.4 23.7 23.0 22.5 22.2 21.5 20.0 18.3
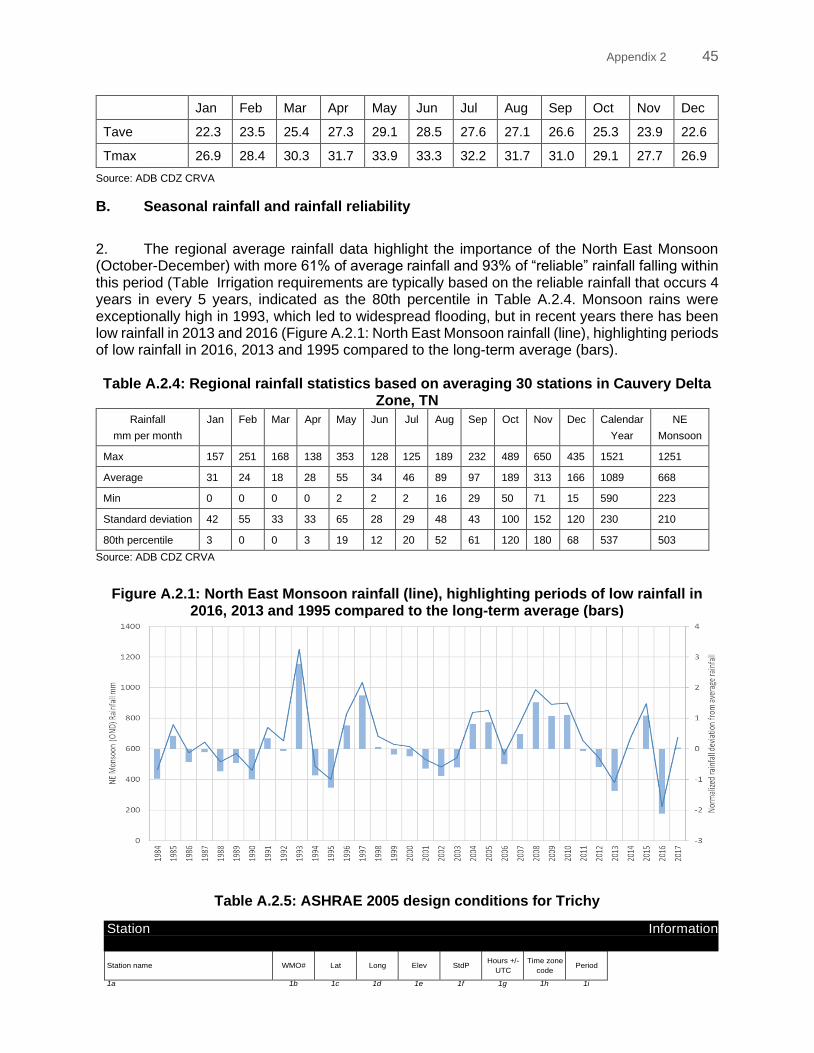
Appendix 2 45
Jan Feb Mar Apr May Jun Jul Aug Sep Oct Nov Dec
Tave 22.3 23.5 25.4 27.3 29.1 28.5 27.6 27.1 26.6 25.3 23.9 22.6
Tmax 26.9 28.4 30.3 31.7 33.9 33.3 32.2 31.7 31.0 29.1 27.7 26.9
Source: ADB CDZ CRVA
B. Seasonal rainfall and rainfall reliability
2. The regional average rainfall data highlight the importance of the North East Monsoon (October-December) with more 61% of average rainfall and 93% of “reliable” rainfall falling within this period (Table Irrigation requirements are typically based on the reliable rainfall that occurs 4 years in every 5 years, indicated as the 80th percentile in Table A.2.4. Monsoon rains were exceptionally high in 1993, which led to widespread flooding, but in recent years there has been low rainfall in 2013 and 2016 (Figure A.2.1: North East Monsoon rainfall (line), highlighting periods of low rainfall in 2016, 2013 and 1995 compared to the long-term average (bars). Table A.2.4: Regional rainfall statistics based on averaging 30 stations in Cauvery Delta
Zone, TN
Rainfall
mm per month
Jan Feb Mar Apr May Jun Jul Aug Sep Oct Nov Dec Calendar
Year
NE
Monsoon
Max 157 251 168 138 353 128 125 189 232 489 650 435 1521 1251
Average 31 24 18 28 55 34 46 89 97 189 313 166 1089 668
Min 0 0 0 0 2 2 2 16 29 50 71 15 590 223
Standard deviation 42 55 33 33 65 28 29 48 43 100 152 120 230 210
80th percentile 3 0 0 3 19 12 20 52 61 120 180 68 537 503
Source: ADB CDZ CRVA
Figure A.2.1: North East Monsoon rainfall (line), highlighting periods of low rainfall in 2016, 2013 and 1995 compared to the long-term average (bars)
Table A.2.5: ASHRAE 2005 design conditions for Trichy
Station Information Station name
WMO#
Lat
Long
Elev
StdP
Hours +/-
UTC
Time zone
code
Period
1a 1b 1c 1d 1e 1f 1g 1h 1i
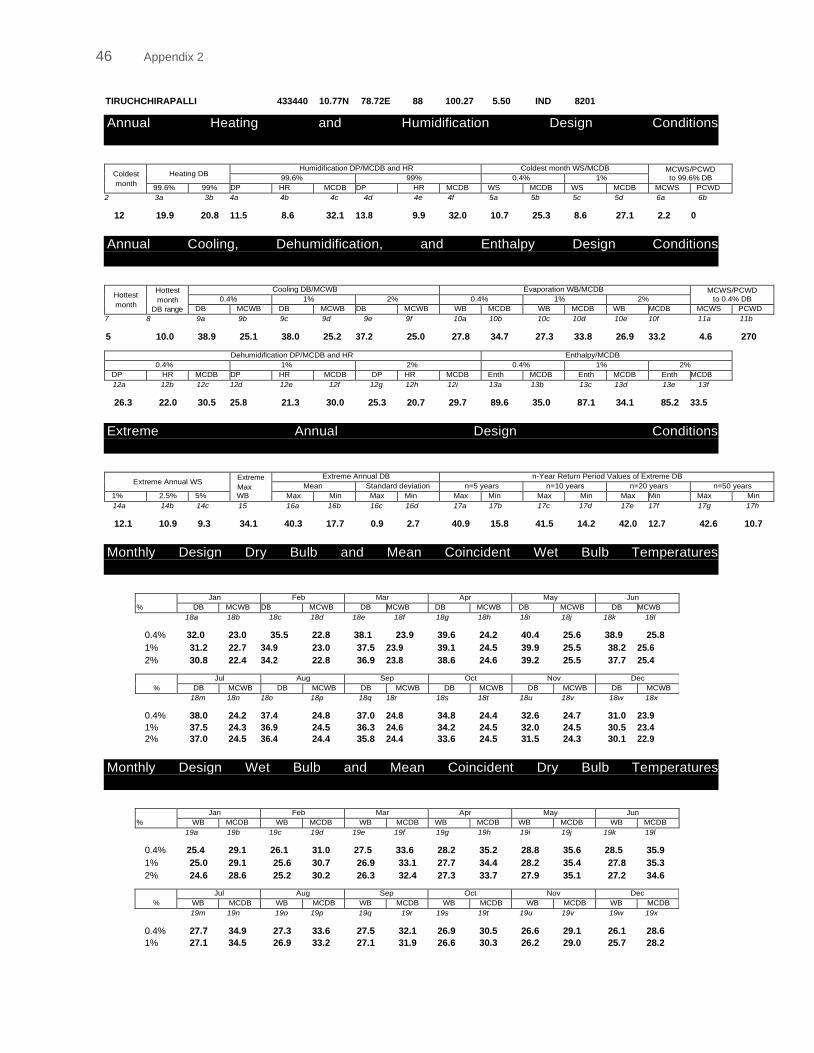
46 Appendix 2
TIRUCHCHIRAPALLI 433440 10.77N 78.72E 88 100.27 5.50 IND 8201
Annual Heating and Humidification Design Conditions
Coldest
month
Heating DB Humidification DP/MCDB and HR Coldest month WS/MCDB MCWS/PCWD
to 99.6% DB 99.6% 99% 0.4% 1%
99.6% 99% DP HR MCDB DP HR MCDB WS MCDB WS MCDB MCWS PCWD
2 3a 3b 4a 4b 4c 4d 4e 4f 5a 5b 5c 5d 6a 6b
12 19.9 20.8 11.5 8.6 32.1 13.8 9.9 32.0 10.7 25.3 8.6 27.1 2.2 0
Annual Cooling, Dehumidification, and Enthalpy Design Conditions
Hottest
month
Hottest
month
DB range
Cooling DB/MCWB Evaporation WB/MCDB MCWS/PCWD
to 0.4% DB 0.4% 1% 2% 0.4% 1% 2%
DB MCWB DB MCWB DB MCWB WB MCDB WB MCDB WB MCDB MCWS PCWD
7 8 9a 9b 9c 9d 9e 9f 10a 10b 10c 10d 10e 10f 11a 11b
5 10.0 38.9 25.1 38.0 25.2 37.2 25.0 27.8 34.7 27.3 33.8 26.9 33.2 4.6 270
Dehumidification DP/MCDB and HR Enthalpy/MCDB
0.4% 1% 2% 0.4% 1% 2%
DP HR MCDB DP HR MCDB DP HR MCDB Enth MCDB Enth MCDB Enth MCDB
12a 12b 12c 12d 12e 12f 12g 12h 12i 13a 13b 13c 13d 13e 13f
26.3 22.0 30.5 25.8 21.3 30.0 25.3 20.7 29.7 89.6 35.0 87.1 34.1 85.2 33.5
Extreme Annual Design Conditions
Extreme Annual WS Extreme
Max
WB
Extreme Annual DB n-Year Return Period Values of Extreme DB
Mean Standard deviation n=5 years n=10 years n=20 years n=50 years
1% 2.5% 5% Max Min Max Min Max Min Max Min Max Min Max Min
14a 14b 14c 15 16a 16b 16c 16d 17a 17b 17c 17d 17e 17f 17g 17h
12.1 10.9 9.3 34.1 40.3 17.7 0.9 2.7 40.9 15.8 41.5 14.2 42.0 12.7 42.6 10.7
Monthly Design Dry Bulb and Mean Coincident Wet Bulb Temperatures
%
Jan Feb Mar Apr May Jun
DB MCWB DB MCWB DB MCWB DB MCWB DB MCWB DB MCWB
0.4%
18a
32.0
18b
23.0
18c
35.5
18d
22.8
18e
38.1
18f
23.9
18g
39.6
18h
24.2
18i
40.4
18j
25.6
18k
38.9
18l
25.8
1% 31.2 22.7 34.9 23.0 37.5 23.9 39.1 24.5 39.9 25.5 38.2 25.6
2% 30.8 22.4 34.2 22.8 36.9 23.8 38.6 24.6 39.2 25.5 37.7 25.4
18m 18n 18o 18p 18q 18r 18s 18t 18u 18v 18w 18x
0.4% 38.0 24.2 37.4 24.8 37.0 24.8 34.8 24.4 32.6 24.7 31.0 23.9
1% 37.5 24.3 36.9 24.5 36.3 24.6 34.2 24.5 32.0 24.5 30.5 23.4
2% 37.0 24.5 36.4 24.4 35.8 24.4 33.6 24.5 31.5 24.3 30.1 22.9
Monthly Design Wet Bulb and Mean Coincident Dry Bulb Temperatures
%
Jan Feb Mar Apr May Jun
WB MCDB WB MCDB WB MCDB WB MCDB WB MCDB WB MCDB
0.4%
19a
25.4
19b
29.1
19c
26.1
19d
31.0
19e
27.5
19f
33.6
19g
28.2
19h
35.2
19i
28.8
19j
35.6
19k
28.5
19l
35.9
1% 25.0 29.1 25.6 30.7 26.9 33.1 27.7 34.4 28.2 35.4 27.8 35.3
2% 24.6 28.6 25.2 30.2 26.3 32.4 27.3 33.7 27.9 35.1 27.2 34.6
19m 19n 19o 19p 19q 19r 19s 19t 19u 19v 19w 19x
0.4% 27.7 34.9 27.3 33.6 27.5 32.1 26.9 30.5 26.6 29.1 26.1 28.6
1% 27.1 34.5 26.9 33.2 27.1 31.9 26.6 30.3 26.2 29.0 25.7 28.2
%
Jul Aug Sep Oct Nov Dec
DB MCWB DB MCWB DB MCWB DB MCWB DB MCWB DB MCWB
%
Jul Aug Sep Oct Nov Dec
WB MCDB WB MCDB WB MCDB WB MCDB WB MCDB WB MCDB
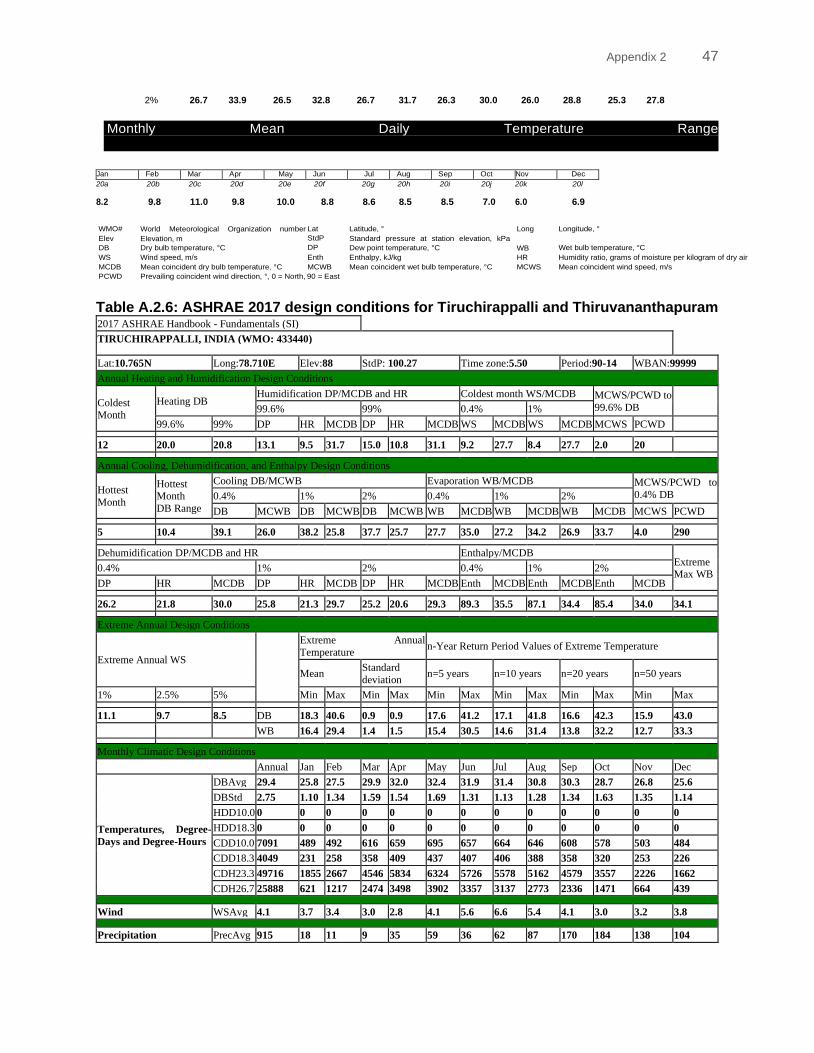
Appendix 2 47
2% 26.7 33.9 26.5 32.8 26.7 31.7 26.3 30.0 26.0 28.8 25.3 27.8
Monthly Mean Daily Temperature Range
Jan Feb Mar Apr May Jun Jul Aug Sep Oct Nov Dec
20a 20b 20c 20d 20e 20f 20g 20h 20i 20j 20k 20l
8.2 9.8 11.0 9.8 10.0 8.8 8.6 8.5 8.5 7.0 6.0 6.9
WMO#
Elev
DB
World Meteorological Organization number
Elevation, m
Dry bulb temperature, °C
Lat
StdP
DP
Latitude, °
Standard pressure at station elevation, kPa
Dew point temperature, °C
Long
WB
Longitude, °
Wet bulb temperature, °C
WS Wind speed, m/s Enth Enthalpy, kJ/kg HR Humidity ratio, grams of moisture per kilogram of dry air
MCDB Mean coincident dry bulb temperature, °C MCWB Mean coincident wet bulb temperature, °C MCWS Mean coincident wind speed, m/s
PCWD Prevailing coincident wind direction, °, 0 = North, 90 = East
Table A.2.6: ASHRAE 2017 design conditions for Tiruchirappalli and Thiruvananthapuram 2017 ASHRAE Handbook - Fundamentals (SI)
TIRUCHIRAPPALLI, INDIA (WMO: 433440)
Lat:10.765N Long:78.710E Elev:88 StdP: 100.27 Time zone:5.50 Period:90-14 WBAN:99999
Annual Heating and Humidification Design Conditions
Coldest Month
Heating DB Humidification DP/MCDB and HR Coldest month WS/MCDB MCWS/PCWD to
99.6% DB
99.6% 99% 0.4% 1%
99.6% 99% DP HR MCDB DP HR MCDB WS MCDB WS MCDB MCWS PCWD
12 20.0 20.8 13.1 9.5 31.7 15.0 10.8 31.1 9.2 27.7 8.4 27.7 2.0 20
Annual Cooling, Dehumidification, and Enthalpy Design Conditions
Hottest
Month
Hottest Month
DB Range
Cooling DB/MCWB Evaporation WB/MCDB MCWS/PCWD to
0.4% DB 0.4% 1% 2% 0.4% 1% 2%
DB MCWB DB MCWB DB MCWB WB MCDB WB MCDB WB MCDB MCWS PCWD
5 10.4 39.1 26.0 38.2 25.8 37.7 25.7 27.7 35.0 27.2 34.2 26.9 33.7 4.0 290
Dehumidification DP/MCDB and HR Enthalpy/MCDB Extreme Max WB
0.4% 1% 2% 0.4% 1% 2%
DP HR MCDB DP HR MCDB DP HR MCDB Enth MCDB Enth MCDB Enth MCDB
26.2 21.8 30.0 25.8 21.3 29.7 25.2 20.6 29.3 89.3 35.5 87.1 34.4 85.4 34.0 34.1
Extreme Annual Design Conditions
Extreme Annual WS
Extreme Annual
Temperature n-Year Return Period Values of Extreme Temperature
Mean Standard
deviation n=5 years n=10 years n=20 years n=50 years
1% 2.5% 5% Min Max Min Max Min Max Min Max Min Max Min Max
11.1 9.7 8.5 DB 18.3 40.6 0.9 0.9 17.6 41.2 17.1 41.8 16.6 42.3 15.9 43.0 WB 16.4 29.4 1.4 1.5 15.4 30.5 14.6 31.4 13.8 32.2 12.7 33.3
Monthly Climatic Design Conditions Annual Jan Feb Mar Apr May Jun Jul Aug Sep Oct Nov Dec
Temperatures, Degree-
Days and Degree-Hours
DBAvg 29.4 25.8 27.5 29.9 32.0 32.4 31.9 31.4 30.8 30.3 28.7 26.8 25.6
DBStd 2.75 1.10 1.34 1.59 1.54 1.69 1.31 1.13 1.28 1.34 1.63 1.35 1.14
HDD10.0 0 0 0 0 0 0 0 0 0 0 0 0 0
HDD18.3 0 0 0 0 0 0 0 0 0 0 0 0 0
CDD10.0 7091 489 492 616 659 695 657 664 646 608 578 503 484
CDD18.3 4049 231 258 358 409 437 407 406 388 358 320 253 226
CDH23.3 49716 1855 2667 4546 5834 6324 5726 5578 5162 4579 3557 2226 1662
CDH26.7 25888 621 1217 2474 3498 3902 3357 3137 2773 2336 1471 664 439
Wind WSAvg 4.1 3.7 3.4 3.0 2.8 4.1 5.6 6.6 5.4 4.1 3.0 3.2 3.8
Precipitation PrecAvg 915 18 11 9 35 59 36 62 87 170 184 138 104
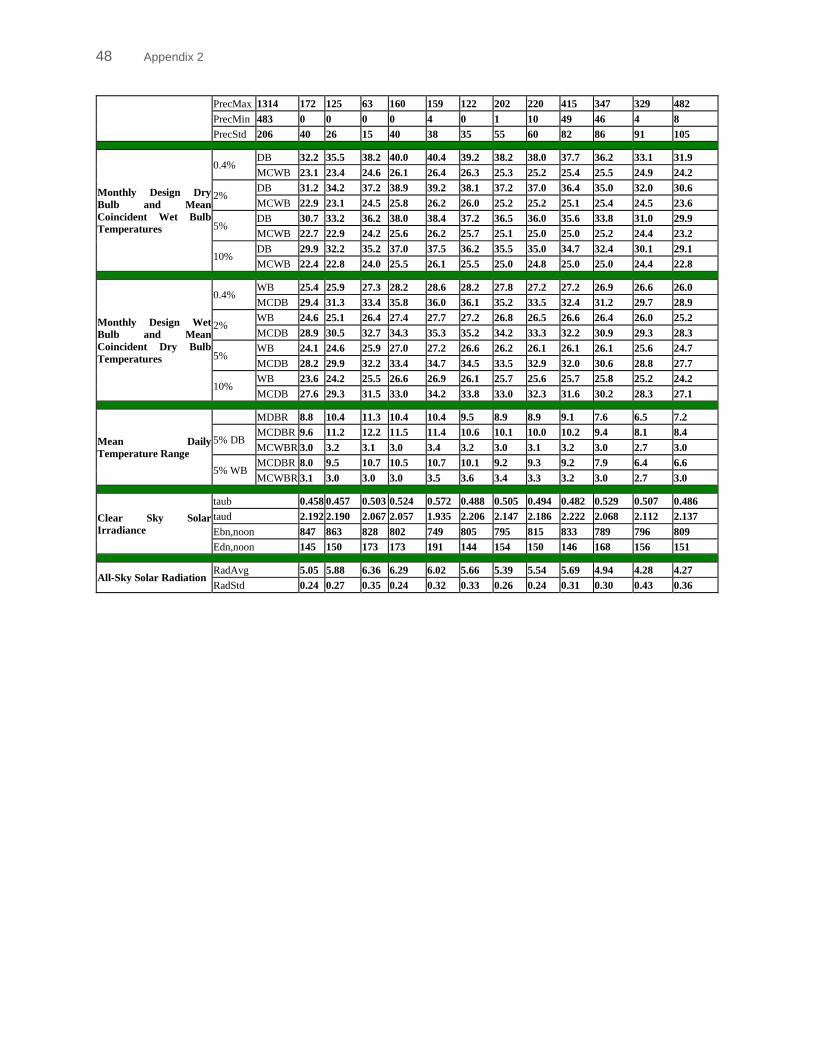
48 Appendix 2
PrecMax 1314 172 125 63 160 159 122 202 220 415 347 329 482
PrecMin 483 0 0 0 0 4 0 1 10 49 46 4 8
PrecStd 206 40 26 15 40 38 35 55 60 82 86 91 105
Monthly Design Dry
Bulb and Mean
Coincident Wet Bulb
Temperatures
0.4% DB 32.2 35.5 38.2 40.0 40.4 39.2 38.2 38.0 37.7 36.2 33.1 31.9
MCWB 23.1 23.4 24.6 26.1 26.4 26.3 25.3 25.2 25.4 25.5 24.9 24.2
2% DB 31.2 34.2 37.2 38.9 39.2 38.1 37.2 37.0 36.4 35.0 32.0 30.6
MCWB 22.9 23.1 24.5 25.8 26.2 26.0 25.2 25.2 25.1 25.4 24.5 23.6
5% DB 30.7 33.2 36.2 38.0 38.4 37.2 36.5 36.0 35.6 33.8 31.0 29.9
MCWB 22.7 22.9 24.2 25.6 26.2 25.7 25.1 25.0 25.0 25.2 24.4 23.2
10% DB 29.9 32.2 35.2 37.0 37.5 36.2 35.5 35.0 34.7 32.4 30.1 29.1
MCWB 22.4 22.8 24.0 25.5 26.1 25.5 25.0 24.8 25.0 25.0 24.4 22.8
Monthly Design Wet
Bulb and Mean
Coincident Dry Bulb
Temperatures
0.4% WB 25.4 25.9 27.3 28.2 28.6 28.2 27.8 27.2 27.2 26.9 26.6 26.0
MCDB 29.4 31.3 33.4 35.8 36.0 36.1 35.2 33.5 32.4 31.2 29.7 28.9
2% WB 24.6 25.1 26.4 27.4 27.7 27.2 26.8 26.5 26.6 26.4 26.0 25.2
MCDB 28.9 30.5 32.7 34.3 35.3 35.2 34.2 33.3 32.2 30.9 29.3 28.3
5% WB 24.1 24.6 25.9 27.0 27.2 26.6 26.2 26.1 26.1 26.1 25.6 24.7
MCDB 28.2 29.9 32.2 33.4 34.7 34.5 33.5 32.9 32.0 30.6 28.8 27.7
10% WB 23.6 24.2 25.5 26.6 26.9 26.1 25.7 25.6 25.7 25.8 25.2 24.2
MCDB 27.6 29.3 31.5 33.0 34.2 33.8 33.0 32.3 31.6 30.2 28.3 27.1
Mean Daily
Temperature Range
MDBR 8.8 10.4 11.3 10.4 10.4 9.5 8.9 8.9 9.1 7.6 6.5 7.2
5% DB MCDBR 9.6 11.2 12.2 11.5 11.4 10.6 10.1 10.0 10.2 9.4 8.1 8.4
MCWBR 3.0 3.2 3.1 3.0 3.4 3.2 3.0 3.1 3.2 3.0 2.7 3.0
5% WB MCDBR 8.0 9.5 10.7 10.5 10.7 10.1 9.2 9.3 9.2 7.9 6.4 6.6
MCWBR 3.1 3.0 3.0 3.0 3.5 3.6 3.4 3.3 3.2 3.0 2.7 3.0
Clear Sky Solar
Irradiance
taub 0.458 0.457 0.503 0.524 0.572 0.488 0.505 0.494 0.482 0.529 0.507 0.486
taud 2.192 2.190 2.067 2.057 1.935 2.206 2.147 2.186 2.222 2.068 2.112 2.137
Ebn,noon 847 863 828 802 749 805 795 815 833 789 796 809
Edn,noon 145 150 173 173 191 144 154 150 146 168 156 151
All-Sky Solar Radiation RadAvg 5.05 5.88 6.36 6.29 6.02 5.66 5.39 5.54 5.69 4.94 4.28 4.27
RadStd 0.24 0.27 0.35 0.24 0.32 0.33 0.26 0.24 0.31 0.30 0.43 0.36
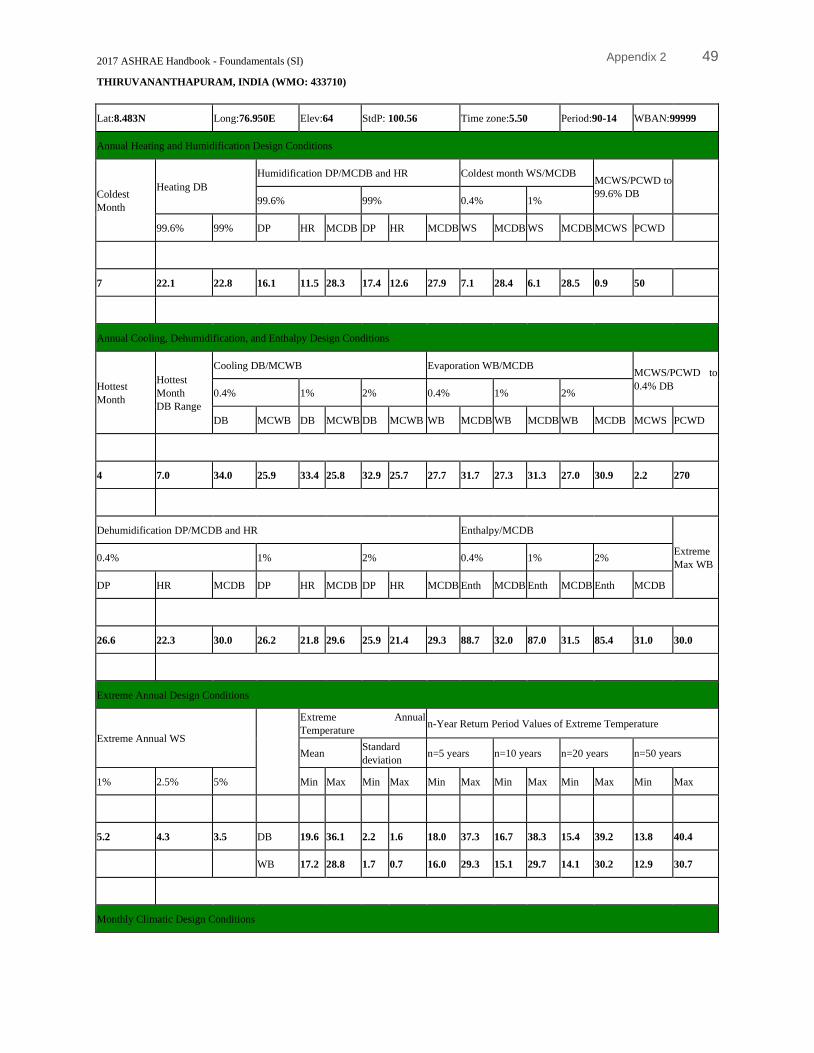
Appendix 2 49
2017 ASHRAE Handbook - Foundamentals (SI)
THIRUVANANTHAPURAM, INDIA (WMO: 433710)
Lat:8.483N Long:76.950E Elev:64 StdP: 100.56 Time zone:5.50 Period:90-14 WBAN:99999
Annual Heating and Humidification Design Conditions
Coldest
Month
Heating DB
Humidification DP/MCDB and HR Coldest month WS/MCDB MCWS/PCWD to
99.6% DB
99.6% 99% 0.4% 1%
99.6% 99% DP HR MCDB DP HR MCDB WS MCDB WS MCDB MCWS PCWD
7 22.1 22.8 16.1 11.5 28.3 17.4 12.6 27.9 7.1 28.4 6.1 28.5 0.9 50
Annual Cooling, Dehumidification, and Enthalpy Design Conditions
Hottest
Month
Hottest
Month
DB Range
Cooling DB/MCWB Evaporation WB/MCDB MCWS/PCWD to
0.4% DB 0.4% 1% 2% 0.4% 1% 2%
DB MCWB DB MCWB DB MCWB WB MCDB WB MCDB WB MCDB MCWS PCWD
4 7.0 34.0 25.9 33.4 25.8 32.9 25.7 27.7 31.7 27.3 31.3 27.0 30.9 2.2 270
Dehumidification DP/MCDB and HR Enthalpy/MCDB
Extreme
Max WB 0.4% 1% 2% 0.4% 1% 2%
DP HR MCDB DP HR MCDB DP HR MCDB Enth MCDB Enth MCDB Enth MCDB
26.6 22.3 30.0 26.2 21.8 29.6 25.9 21.4 29.3 88.7 32.0 87.0 31.5 85.4 31.0 30.0
Extreme Annual Design Conditions
Extreme Annual WS
Extreme Annual
Temperature n-Year Return Period Values of Extreme Temperature
Mean Standard
deviation n=5 years n=10 years n=20 years n=50 years
1% 2.5% 5% Min Max Min Max Min Max Min Max Min Max Min Max
5.2 4.3 3.5 DB 19.6 36.1 2.2 1.6 18.0 37.3 16.7 38.3 15.4 39.2 13.8 40.4
WB 17.2 28.8 1.7 0.7 16.0 29.3 15.1 29.7 14.1 30.2 12.9 30.7
Monthly Climatic Design Conditions
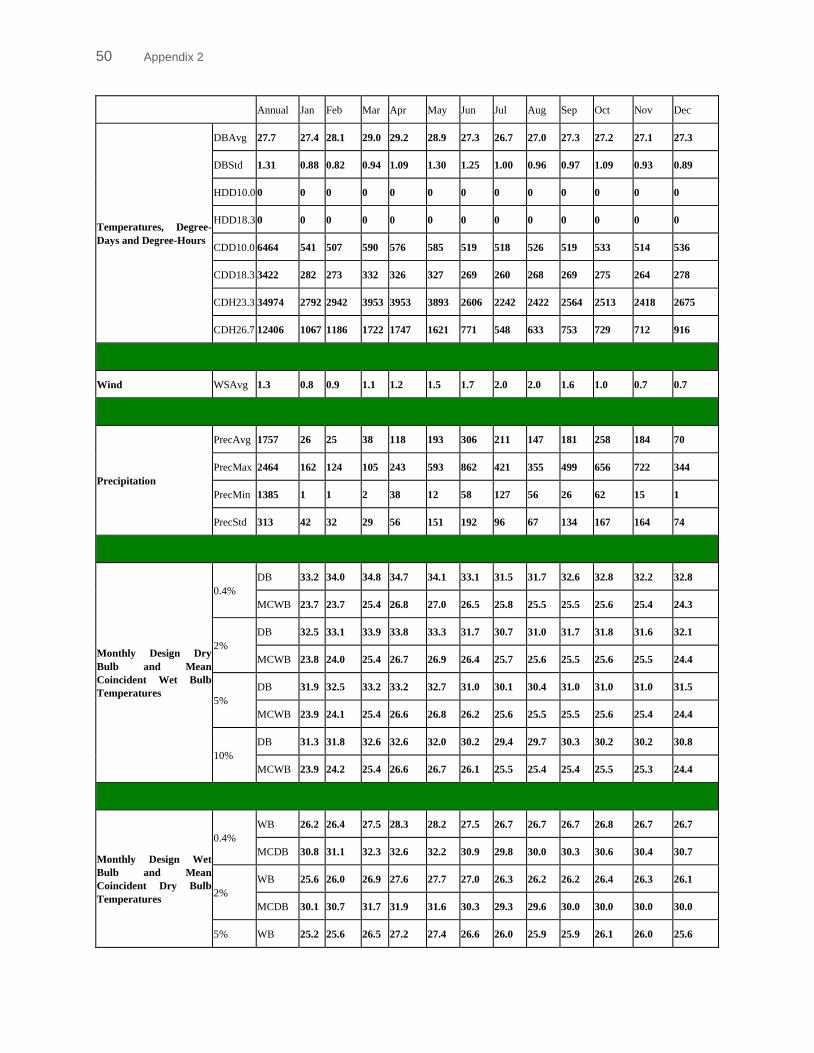
50 Appendix 2
Annual Jan Feb Mar Apr May Jun Jul Aug Sep Oct Nov Dec
Temperatures, Degree-
Days and Degree-Hours
DBAvg 27.7 27.4 28.1 29.0 29.2 28.9 27.3 26.7 27.0 27.3 27.2 27.1 27.3
DBStd 1.31 0.88 0.82 0.94 1.09 1.30 1.25 1.00 0.96 0.97 1.09 0.93 0.89
HDD10.0 0 0 0 0 0 0 0 0 0 0 0 0 0
HDD18.3 0 0 0 0 0 0 0 0 0 0 0 0 0
CDD10.0 6464 541 507 590 576 585 519 518 526 519 533 514 536
CDD18.3 3422 282 273 332 326 327 269 260 268 269 275 264 278
CDH23.3 34974 2792 2942 3953 3953 3893 2606 2242 2422 2564 2513 2418 2675
CDH26.7 12406 1067 1186 1722 1747 1621 771 548 633 753 729 712 916
Wind WSAvg 1.3 0.8 0.9 1.1 1.2 1.5 1.7 2.0 2.0 1.6 1.0 0.7 0.7
Precipitation
PrecAvg 1757 26 25 38 118 193 306 211 147 181 258 184 70
PrecMax 2464 162 124 105 243 593 862 421 355 499 656 722 344
PrecMin 1385 1 1 2 38 12 58 127 56 26 62 15 1
PrecStd 313 42 32 29 56 151 192 96 67 134 167 164 74
Monthly Design Dry
Bulb and Mean
Coincident Wet Bulb
Temperatures
0.4%
DB 33.2 34.0 34.8 34.7 34.1 33.1 31.5 31.7 32.6 32.8 32.2 32.8
MCWB 23.7 23.7 25.4 26.8 27.0 26.5 25.8 25.5 25.5 25.6 25.4 24.3
2%
DB 32.5 33.1 33.9 33.8 33.3 31.7 30.7 31.0 31.7 31.8 31.6 32.1
MCWB 23.8 24.0 25.4 26.7 26.9 26.4 25.7 25.6 25.5 25.6 25.5 24.4
5%
DB 31.9 32.5 33.2 33.2 32.7 31.0 30.1 30.4 31.0 31.0 31.0 31.5
MCWB 23.9 24.1 25.4 26.6 26.8 26.2 25.6 25.5 25.5 25.6 25.4 24.4
10%
DB 31.3 31.8 32.6 32.6 32.0 30.2 29.4 29.7 30.3 30.2 30.2 30.8
MCWB 23.9 24.2 25.4 26.6 26.7 26.1 25.5 25.4 25.4 25.5 25.3 24.4
Monthly Design Wet
Bulb and Mean
Coincident Dry Bulb
Temperatures
0.4%
WB 26.2 26.4 27.5 28.3 28.2 27.5 26.7 26.7 26.7 26.8 26.7 26.7
MCDB 30.8 31.1 32.3 32.6 32.2 30.9 29.8 30.0 30.3 30.6 30.4 30.7
2%
WB 25.6 26.0 26.9 27.6 27.7 27.0 26.3 26.2 26.2 26.4 26.3 26.1
MCDB 30.1 30.7 31.7 31.9 31.6 30.3 29.3 29.6 30.0 30.0 30.0 30.0
5% WB 25.2 25.6 26.5 27.2 27.4 26.6 26.0 25.9 25.9 26.1 26.0 25.6
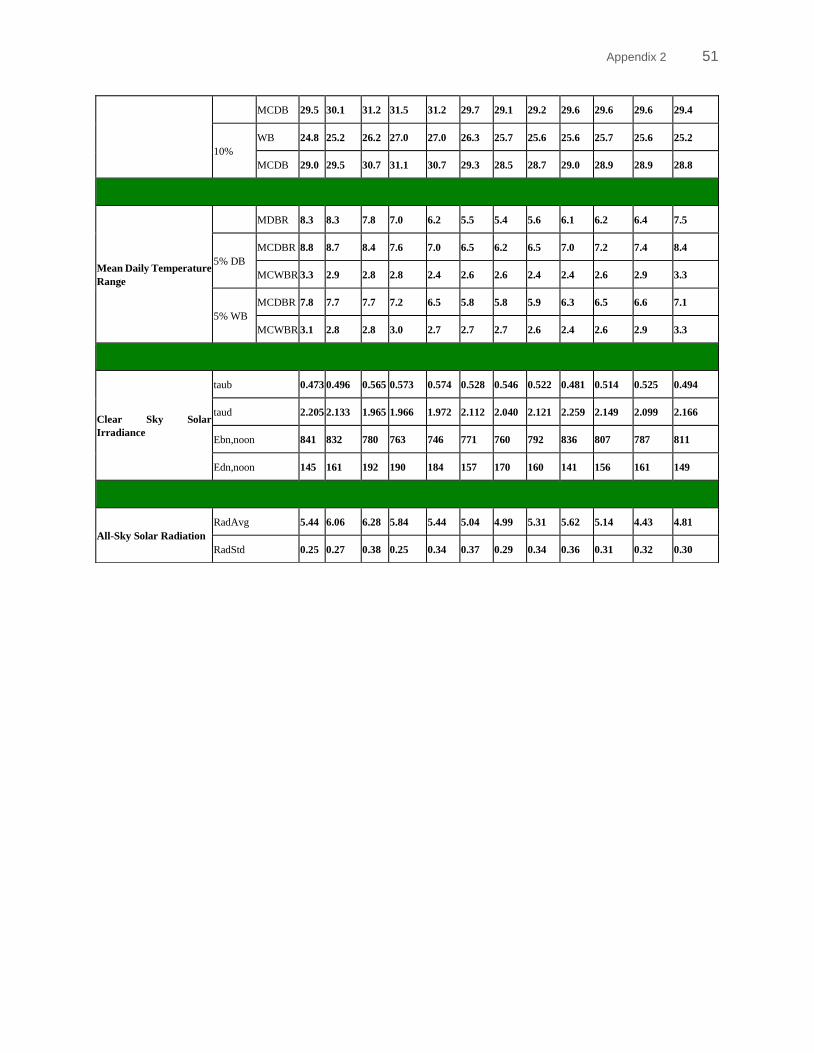
Appendix 2 51
MCDB 29.5 30.1 31.2 31.5 31.2 29.7 29.1 29.2 29.6 29.6 29.6 29.4
10%
WB 24.8 25.2 26.2 27.0 27.0 26.3 25.7 25.6 25.6 25.7 25.6 25.2
MCDB 29.0 29.5 30.7 31.1 30.7 29.3 28.5 28.7 29.0 28.9 28.9 28.8
Mean Daily Temperature
Range
MDBR 8.3 8.3 7.8 7.0 6.2 5.5 5.4 5.6 6.1 6.2 6.4 7.5
5% DB
MCDBR 8.8 8.7 8.4 7.6 7.0 6.5 6.2 6.5 7.0 7.2 7.4 8.4
MCWBR 3.3 2.9 2.8 2.8 2.4 2.6 2.6 2.4 2.4 2.6 2.9 3.3
5% WB
MCDBR 7.8 7.7 7.7 7.2 6.5 5.8 5.8 5.9 6.3 6.5 6.6 7.1
MCWBR 3.1 2.8 2.8 3.0 2.7 2.7 2.7 2.6 2.4 2.6 2.9 3.3
Clear Sky Solar
Irradiance
taub 0.473 0.496 0.565 0.573 0.574 0.528 0.546 0.522 0.481 0.514 0.525 0.494
taud 2.205 2.133 1.965 1.966 1.972 2.112 2.040 2.121 2.259 2.149 2.099 2.166
Ebn,noon 841 832 780 763 746 771 760 792 836 807 787 811
Edn,noon 145 161 192 190 184 157 170 160 141 156 161 149
All-Sky Solar Radiation
RadAvg 5.44 6.06 6.28 5.84 5.44 5.04 4.99 5.31 5.62 5.14 4.43 4.81
RadStd 0.25 0.27 0.38 0.25 0.34 0.37 0.29 0.34 0.36 0.31 0.32 0.30
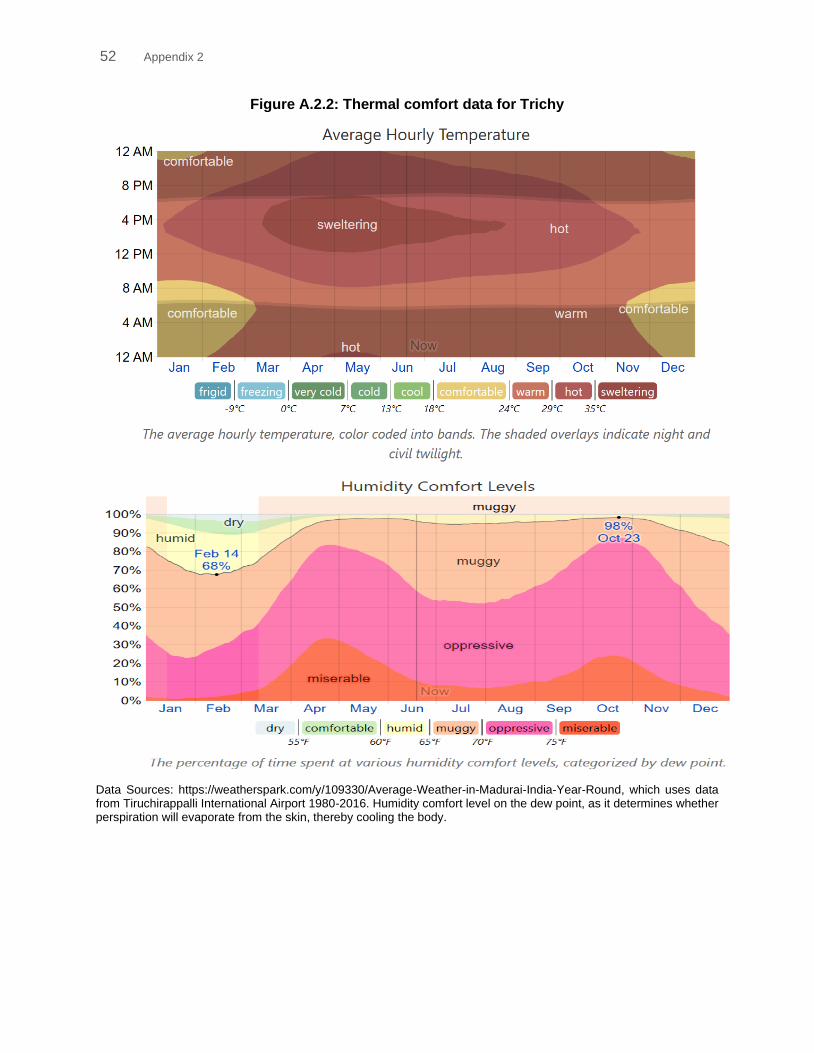
52 Appendix 2
Figure A.2.2: Thermal comfort data for Trichy
Data Sources: https://weatherspark.com/y/109330/Average-Weather-in-Madurai-India-Year-Round, which uses data from Tiruchirappalli International Airport 1980-2016. Humidity comfort level on the dew point, as it determines whether perspiration will evaporate from the skin, thereby cooling the body.
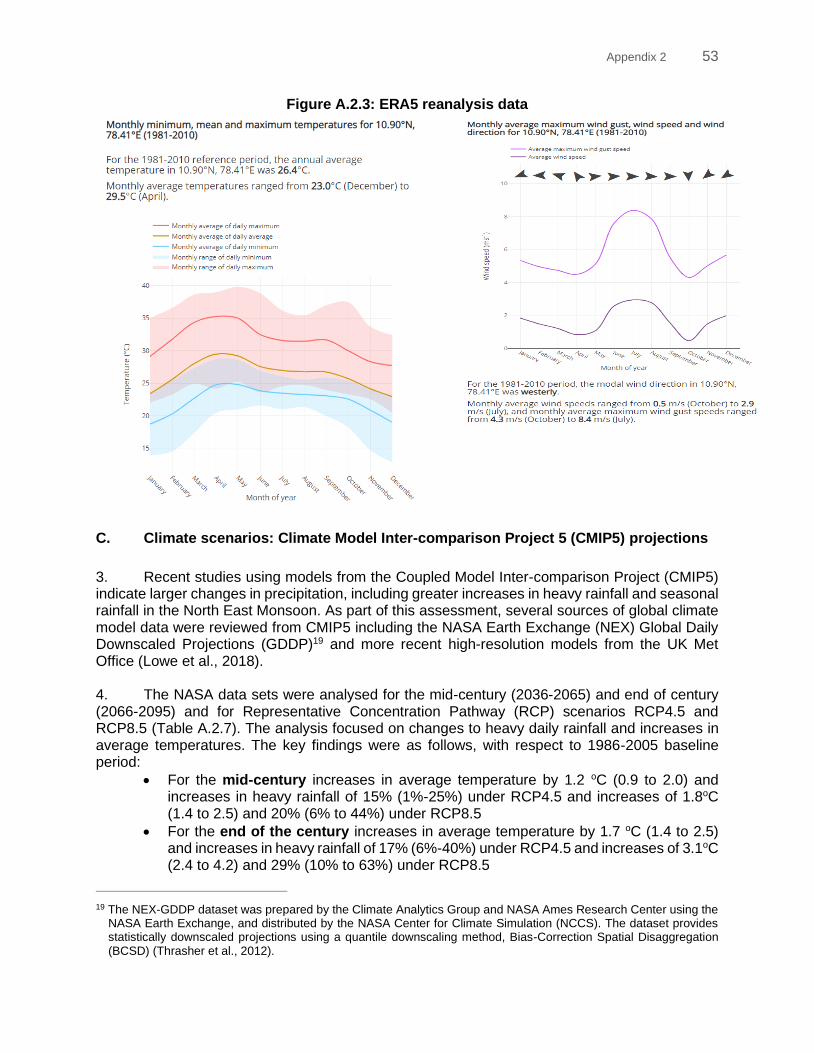
Appendix 2 53
Figure A.2.3: ERA5 reanalysis data
C. Climate scenarios: Climate Model Inter-comparison Project 5 (CMIP5) projections
3. Recent studies using models from the Coupled Model Inter-comparison Project (CMIP5) indicate larger changes in precipitation, including greater increases in heavy rainfall and seasonal rainfall in the North East Monsoon. As part of this assessment, several sources of global climate model data were reviewed from CMIP5 including the NASA Earth Exchange (NEX) Global Daily Downscaled Projections (GDDP)19 and more recent high-resolution models from the UK Met Office (Lowe et al., 2018). 4. The NASA data sets were analysed for the mid-century (2036-2065) and end of century (2066-2095) and for Representative Concentration Pathway (RCP) scenarios RCP4.5 and RCP8.5 (Table A.2.7). The analysis focused on changes to heavy daily rainfall and increases in average temperatures. The key findings were as follows, with respect to 1986-2005 baseline period:
• For the mid-century increases in average temperature by 1.2 oC (0.9 to 2.0) and increases in heavy rainfall of 15% (1%-25%) under RCP4.5 and increases of 1.8oC (1.4 to 2.5) and 20% (6% to 44%) under RCP8.5
• For the end of the century increases in average temperature by 1.7 oC (1.4 to 2.5) and increases in heavy rainfall of 17% (6%-40%) under RCP4.5 and increases of 3.1oC (2.4 to 4.2) and 29% (10% to 63%) under RCP8.5
19 The NEX-GDDP dataset was prepared by the Climate Analytics Group and NASA Ames Research Center using the
NASA Earth Exchange, and distributed by the NASA Center for Climate Simulation (NCCS). The dataset provides statistically downscaled projections using a quantile downscaling method, Bias-Correction Spatial Disaggregation (BCSD) (Thrasher et al., 2012).
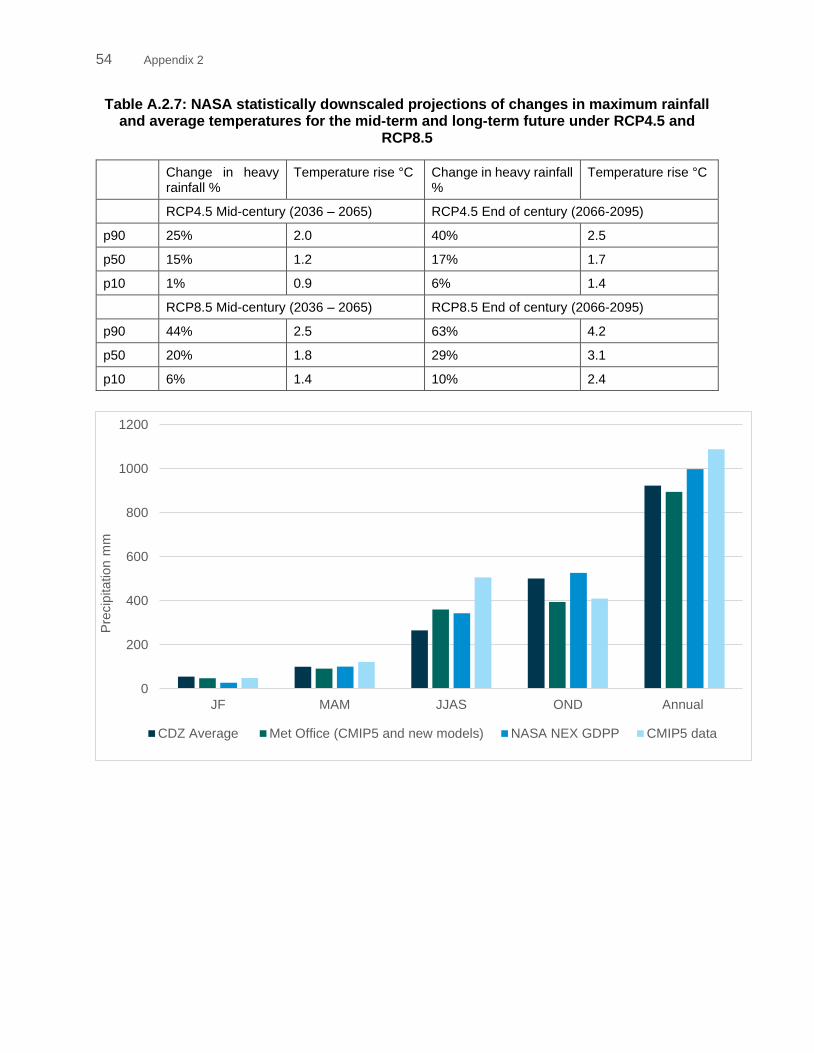
54 Appendix 2
Table A.2.7: NASA statistically downscaled projections of changes in maximum rainfall and average temperatures for the mid-term and long-term future under RCP4.5 and
RCP8.5
0
200
400
600
800
1000
1200
JF MAM JJAS OND Annual
Pre
cip
itation m
m
CDZ Average Met Office (CMIP5 and new models) NASA NEX GDPP CMIP5 data
Change in heavy rainfall %
Temperature rise °C Change in heavy rainfall %
Temperature rise °C
RCP4.5 Mid-century (2036 – 2065) RCP4.5 End of century (2066-2095)
p90 25% 2.0 40% 2.5
p50 15% 1.2 17% 1.7
p10 1% 0.9 6% 1.4
RCP8.5 Mid-century (2036 – 2065) RCP8.5 End of century (2066-2095)
p90 44% 2.5 63% 4.2
p50 20% 1.8 29% 3.1
p10 6% 1.4 10% 2.4
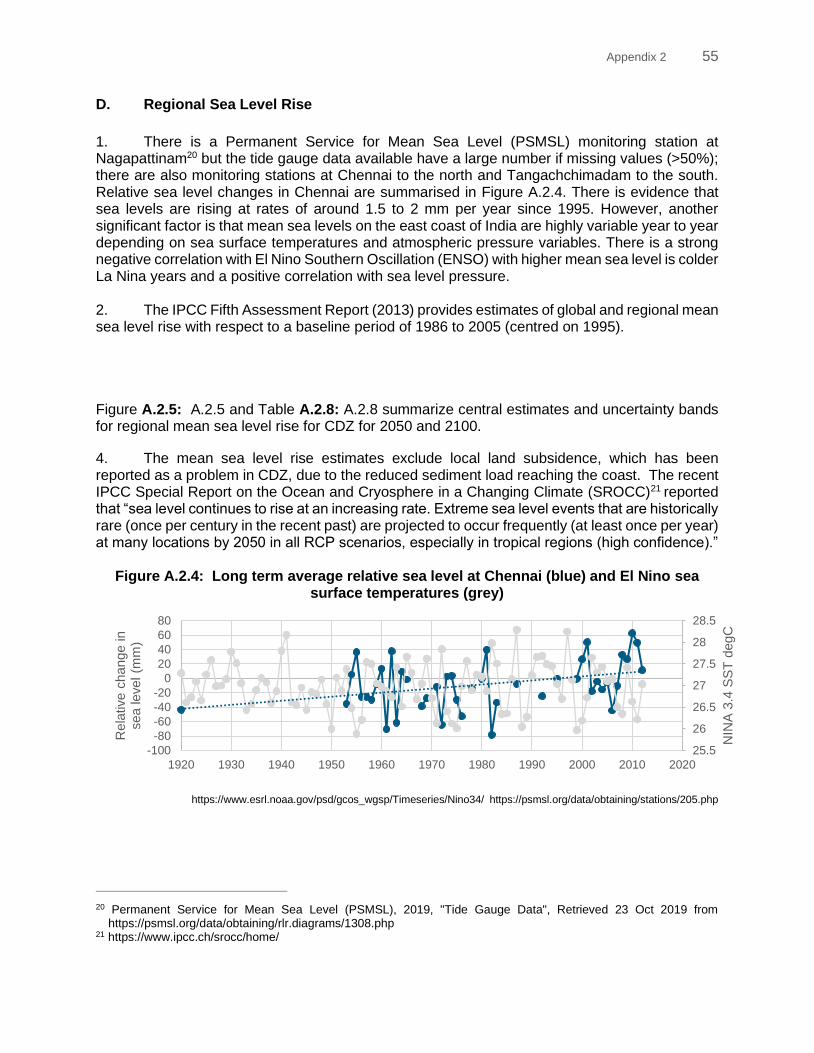
Appendix 2 55
D. Regional Sea Level Rise
1. There is a Permanent Service for Mean Sea Level (PSMSL) monitoring station at Nagapattinam20 but the tide gauge data available have a large number if missing values (>50%); there are also monitoring stations at Chennai to the north and Tangachchimadam to the south. Relative sea level changes in Chennai are summarised in Figure A.2.4. There is evidence that sea levels are rising at rates of around 1.5 to 2 mm per year since 1995. However, another significant factor is that mean sea levels on the east coast of India are highly variable year to year depending on sea surface temperatures and atmospheric pressure variables. There is a strong negative correlation with El Nino Southern Oscillation (ENSO) with higher mean sea level is colder La Nina years and a positive correlation with sea level pressure. 2. The IPCC Fifth Assessment Report (2013) provides estimates of global and regional mean sea level rise with respect to a baseline period of 1986 to 2005 (centred on 1995).
Figure A.2.5: A.2.5 and Table A.2.8: A.2.8 summarize central estimates and uncertainty bands for regional mean sea level rise for CDZ for 2050 and 2100.
4. The mean sea level rise estimates exclude local land subsidence, which has been reported as a problem in CDZ, due to the reduced sediment load reaching the coast. The recent IPCC Special Report on the Ocean and Cryosphere in a Changing Climate (SROCC)21 reported that “sea level continues to rise at an increasing rate. Extreme sea level events that are historically rare (once per century in the recent past) are projected to occur frequently (at least once per year) at many locations by 2050 in all RCP scenarios, especially in tropical regions (high confidence).”
Figure A.2.4: Long term average relative sea level at Chennai (blue) and El Nino sea surface temperatures (grey)
https://www.esrl.noaa.gov/psd/gcos_wgsp/Timeseries/Nino34/ https://psmsl.org/data/obtaining/stations/205.php
20 Permanent Service for Mean Sea Level (PSMSL), 2019, "Tide Gauge Data", Retrieved 23 Oct 2019 from
https://psmsl.org/data/obtaining/rlr.diagrams/1308.php 21 https://www.ipcc.ch/srocc/home/
25.5
26
26.5
27
27.5
28
28.5
-100
-80
-60
-40
-20
0
20
40
60
80
1920 1930 1940 1950 1960 1970 1980 1990 2000 2010 2020
NIN
A 3
.4 S
ST
degC
Rela
tive c
hange in
sea level (m
m)
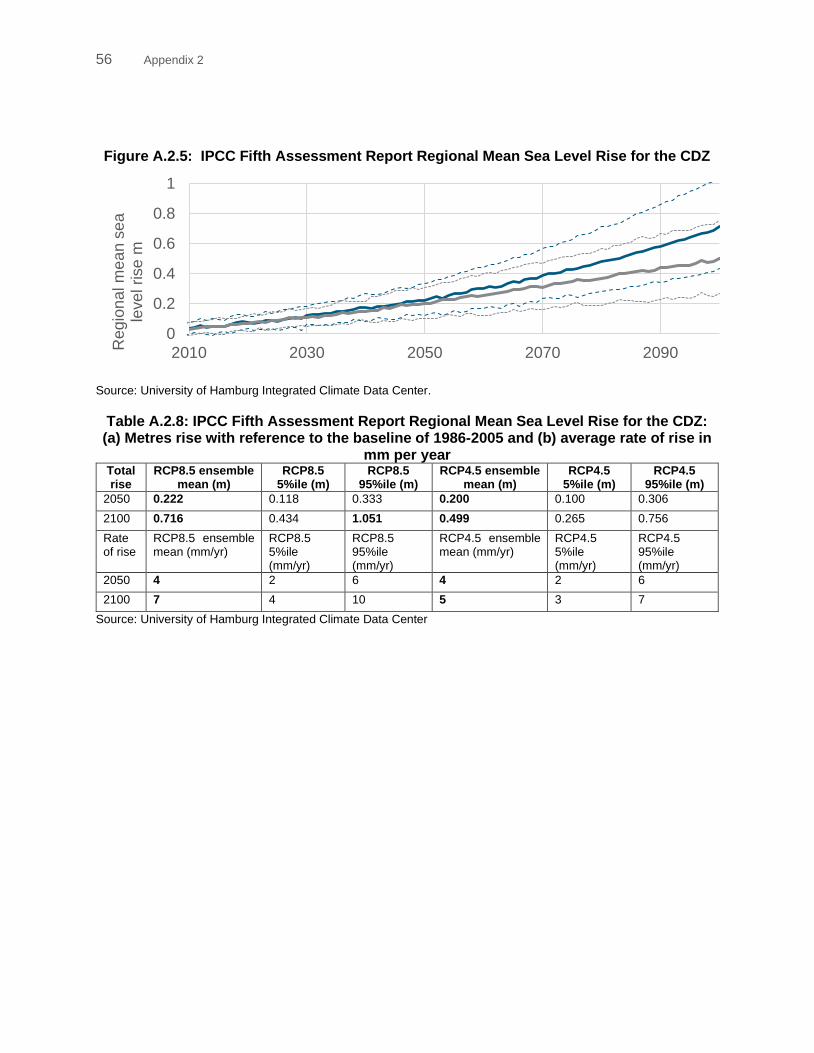
56 Appendix 2
Figure A.2.5: IPCC Fifth Assessment Report Regional Mean Sea Level Rise for the CDZ
Source: University of Hamburg Integrated Climate Data Center.
Table A.2.8: IPCC Fifth Assessment Report Regional Mean Sea Level Rise for the CDZ: (a) Metres rise with reference to the baseline of 1986-2005 and (b) average rate of rise in
mm per year Total rise
RCP8.5 ensemble mean (m)
RCP8.5 5%ile (m)
RCP8.5 95%ile (m)
RCP4.5 ensemble mean (m)
RCP4.5 5%ile (m)
RCP4.5 95%ile (m)
2050 0.222 0.118 0.333 0.200 0.100 0.306
2100 0.716 0.434 1.051 0.499 0.265 0.756
Rate of rise
RCP8.5 ensemble mean (mm/yr)
RCP8.5 5%ile (mm/yr)
RCP8.5 95%ile (mm/yr)
RCP4.5 ensemble mean (mm/yr)
RCP4.5 5%ile (mm/yr)
RCP4.5 95%ile (mm/yr)
2050 4 2 6 4 2 6
2100 7 4 10 5 3 7
Source: University of Hamburg Integrated Climate Data Center
0
0.2
0.4
0.6
0.8
1
2010 2030 2050 2070 2090Regio
na
l m
ea
n s
ea
le
ve
l rise
m
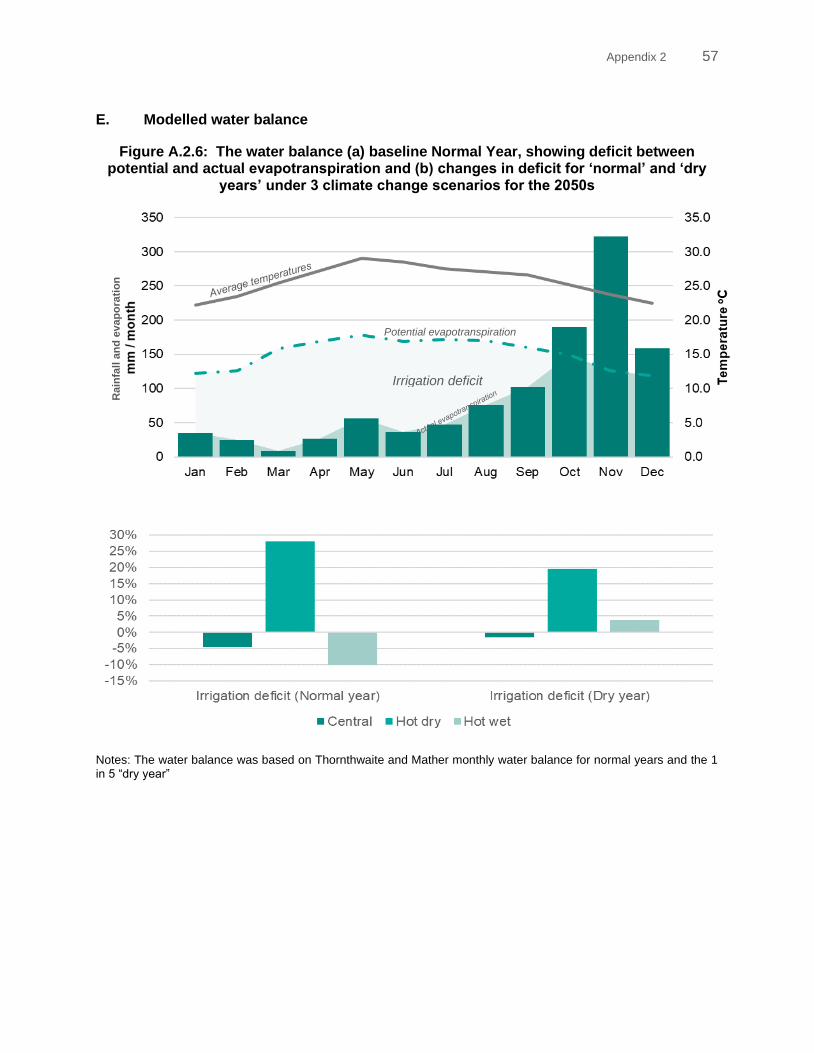
Appendix 2 57
E. Modelled water balance
Figure A.2.6: The water balance (a) baseline Normal Year, showing deficit between potential and actual evapotranspiration and (b) changes in deficit for ‘normal’ and ‘dry
years’ under 3 climate change scenarios for the 2050s
Notes: The water balance was based on Thornthwaite and Mather monthly water balance for normal years and the 1 in 5 “dry year”
Irrigation deficit
Potential evapotranspiration
ration
Rain
fall a
nd
evap
ora
tio
n
rati
on
58 Appendix 3
Good Practice Guidance in Including Climate Change in Social Housing Projects
A. Building codes, standards and certifications
1. Building codes and standards
1.1. International standards
1. While there is no specific international standard for adaptation in buildings, there are a growing number of adaptation-related international standards. Those which have recently been published include ISO 14090 Adaptation to climate change – principles requirements and guidelines22 and ISO 14091 Adaptation to climate change – vulnerability, impacts and risk assessment is soon to be published.23 Other international standards also provide the opportunity to consider the adaptation of buildings, if the robust consideration of climate change is integrated into the decision-making process. These include Quality Management (ISO 9001), Environmental Management (ISO 14001) and Asset-Management (ISO 55000).24
1.2. European standards (Eurocodes)25
2. The Eurocodes comprise 10 European Standards (EN 1990 – EN 1999) which specify structural codes for buildings in Europe. Eurocodes cover building construction & civil engineering works and since 2010 they have been a legal requirement for building in Europe. Eurocodes stipulate how structural design should enable the safety of the design of building and civil engineering works and safety in use. They specify ‘loadings’ (for example pressure loads imposed by wind and thermal loads from heat) and how designers take these into account in the development of structures. Eurocodes also include recommended values for all parameters but allow countries to define their own parameters, to suit local geographical, geological and climatic conditions. However, these ‘loadings’ and parameters are based on observed weather patterns. Other European Standards refer to how buildings and civil engineering works are managed and maintained or can relate to specifications for equipment such as air conditioning, and acceptable temperature ranges for electrical control equipment. However, no guidance is provided on the consideration of climate change. The Eurocodes are currently under review in order to address the variety of new methods, new materials, new regulatory requirements and new societal needs developing and to extend harmonisation. This review includes taking better account of future climate change, by reviewing the weather parameters used and including guidance on flooding and drainage. It is expected to be completed in 2020.26
1.3. Indian National and Tamil Nadu State Standards
3. GRIHA – Green Rating for Integrated Habitat Assessment - is India’s green building rating assessment. It assesses buildings based on their energy consumption, waste generation, renewable energy adoption based on national standards to evaluate buildings’ environmental
22 https://www.iso.org/standard/68507.html 23 https://www.iso.org/standard/68508.html 24https://www.ebrd.com/documents/climate-finance/climate-change-standards-and-their-role-in-improving-the-climate-resilience-of-infrastructure-investments.pdf?blobnocache=true 25https://www.ebrd.com/documents/climate-finance/climate-change-standards-and-their-role-in-improving-the-climate-resilience-of-infrastructure-investments.pdf?blobnocache=true 26 https://eurocodes.jrc.ec.europa.eu/showpage.php?id=63
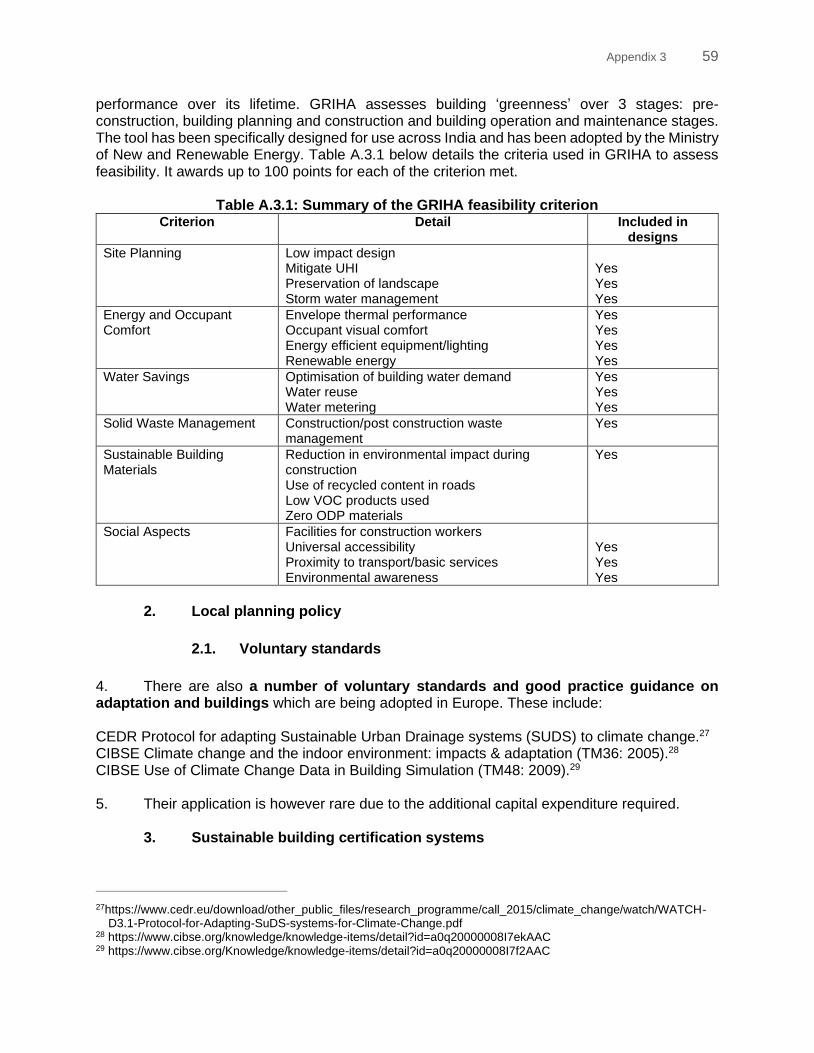
Appendix 3 59
performance over its lifetime. GRIHA assesses building ‘greenness’ over 3 stages: pre-construction, building planning and construction and building operation and maintenance stages. The tool has been specifically designed for use across India and has been adopted by the Ministry of New and Renewable Energy. Table A.3.1 below details the criteria used in GRIHA to assess feasibility. It awards up to 100 points for each of the criterion met.
Table A.3.1: Summary of the GRIHA feasibility criterion Criterion Detail Included in
designs
Site Planning Low impact design Mitigate UHI Preservation of landscape Storm water management
Yes Yes Yes
Energy and Occupant Comfort
Envelope thermal performance Occupant visual comfort Energy efficient equipment/lighting Renewable energy
Yes Yes Yes Yes
Water Savings Optimisation of building water demand Water reuse Water metering
Yes Yes Yes
Solid Waste Management Construction/post construction waste management
Yes
Sustainable Building Materials
Reduction in environmental impact during construction Use of recycled content in roads Low VOC products used Zero ODP materials
Yes
Social Aspects Facilities for construction workers Universal accessibility Proximity to transport/basic services Environmental awareness
Yes Yes Yes
2. Local planning policy
2.1. Voluntary standards
4. There are also a number of voluntary standards and good practice guidance on adaptation and buildings which are being adopted in Europe. These include: CEDR Protocol for adapting Sustainable Urban Drainage systems (SUDS) to climate change.27 CIBSE Climate change and the indoor environment: impacts & adaptation (TM36: 2005).28 CIBSE Use of Climate Change Data in Building Simulation (TM48: 2009).29 5. Their application is however rare due to the additional capital expenditure required.
3. Sustainable building certification systems
27https://www.cedr.eu/download/other_public_files/research_programme/call_2015/climate_change/watch/WATCH-
D3.1-Protocol-for-Adapting-SuDS-systems-for-Climate-Change.pdf 28 https://www.cibse.org/knowledge/knowledge-items/detail?id=a0q20000008I7ekAAC 29 https://www.cibse.org/Knowledge/knowledge-items/detail?id=a0q20000008I7f2AAC
60 Appendix 3
6. Sustainable building certification systems are increasingly considering climate change, but uncertainty remains over the degree that such certifications robustly consider and adequately drive adaptation into building projects. This section reviews the most prominent sustainable building certification systems (BREEAM, DGNB, EDGE, Green Star, LEED, and RELi) to answer this question and to better inform the EIB’s appraisal of these projects from an adaptation perspective. 7. Sustainable buildings certifications comprise a number of individual credits which are either mandatory, or voluntary, and can be combined to achieve the overall certification. Within some certifications, there are examples of specific adaptation credits. BREEAM, is one of the world’s leading sustainable building certification schemes, is widely used across Europe. It awards an exemplary adaptation credit for those projects demonstrating that a holistic approach to adaptation has been undertaken in either building design or community master planning. 8. RELi is a comprehensive and holistic multi-hazard resilience-based rating system for neighbourhoods, buildings, homes and infrastructure that has been developed to complement LEED. RELi includes credits for ‘Hazard Preparedness’ and ‘Hazard Mitigation + Adaptation’ however (aside from sea-level rise) it’s not clear if the requirements mandate that climate change be factored into the design. Outside the EU, the EIB will require that building projects achieve EDGE certification or an equivalent. The EDGE tool is also currently piloting a process for assessing the climate resilience of building projects in the Philippines. 9. Beyond these, there is generally a lack of an explicit or holistic consideration of climate change in sustainable building certification systems. The fact that a building has been awarded a sustainable building certificate does not, by itself, ensure that climate change has been adequately considered, or that a building has integrated appropriate adaptation measures. Irrespective of the rating or level of certification achieved, the specific credits awarded, criteria achieved to obtain that particular credit, and physical climate risks faced need to be examined to understand the extent a building has been adapted to climate change. The award of a sustainable building certification requires developers to provide a detailed evidence of how the project meets each of the credit criteria being targeted. Although evidence requirements vary, this should allow the EIB to reflect on and record whether adaptation has been robustly considered. 10. Within different certification systems, the award of credits for water efficiency, thermal comfort and flood and surface water management can demonstrate that the building has been adapted to specific physical climate risks. This is however dependent on whether it’s clear that climate change has been factored into the design; or it can be demonstrated how the design has been, or could be, appropriately adapted. For selected sustainable building certification systems.
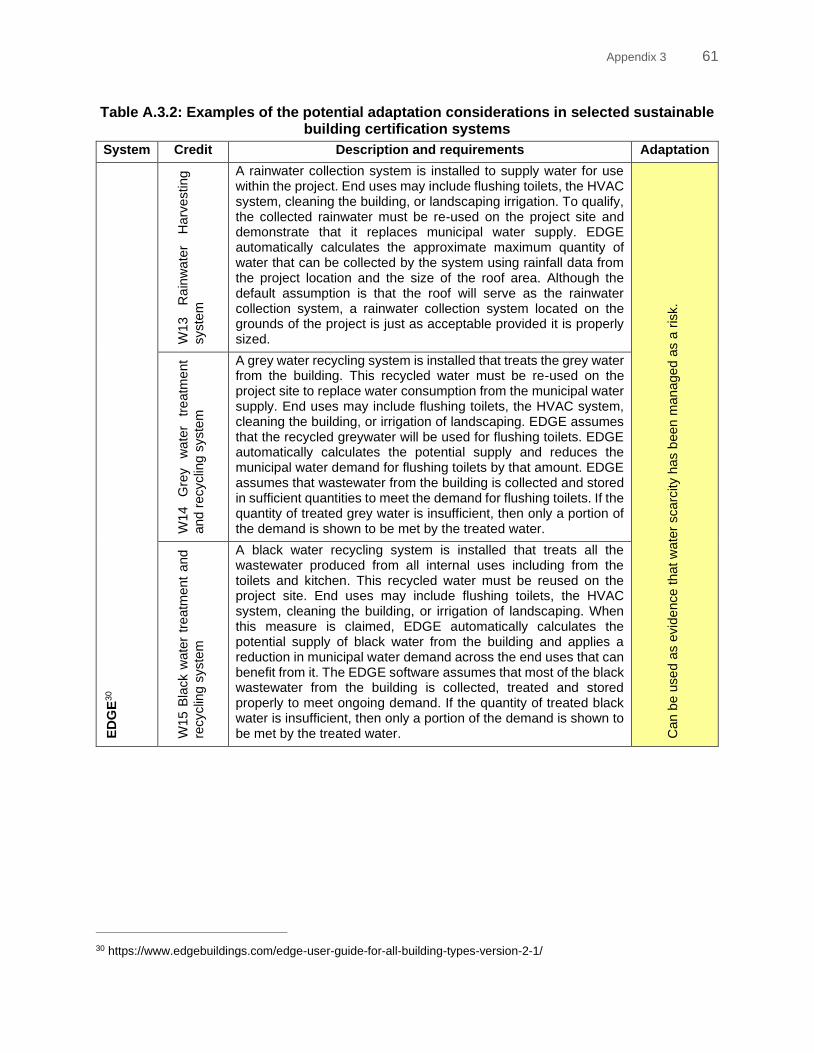
Appendix 3 61
Table A.3.2: Examples of the potential adaptation considerations in selected sustainable building certification systems
System Credit Description and requirements Adaptation
ED
GE
30
W13
Ra
inw
ate
r H
arv
esting
syste
m
A rainwater collection system is installed to supply water for use within the project. End uses may include flushing toilets, the HVAC system, cleaning the building, or landscaping irrigation. To qualify, the collected rainwater must be re-used on the project site and demonstrate that it replaces municipal water supply. EDGE automatically calculates the approximate maximum quantity of water that can be collected by the system using rainfall data from the project location and the size of the roof area. Although the default assumption is that the roof will serve as the rainwater collection system, a rainwater collection system located on the grounds of the project is just as acceptable provided it is properly sized.
Can b
e u
se
d a
s e
vid
ence t
hat w
ate
r scarc
ity h
as b
een
man
age
d a
s a
ris
k.
W14
G
rey
wa
ter
tre
atm
ent
and r
ecyclin
g s
yste
m
A grey water recycling system is installed that treats the grey water from the building. This recycled water must be re-used on the project site to replace water consumption from the municipal water supply. End uses may include flushing toilets, the HVAC system, cleaning the building, or irrigation of landscaping. EDGE assumes that the recycled greywater will be used for flushing toilets. EDGE automatically calculates the potential supply and reduces the municipal water demand for flushing toilets by that amount. EDGE assumes that wastewater from the building is collected and stored in sufficient quantities to meet the demand for flushing toilets. If the quantity of treated grey water is insufficient, then only a portion of the demand is shown to be met by the treated water.
W15 B
lack w
ate
r tr
eatm
ent
and
recyclin
g s
yste
m
A black water recycling system is installed that treats all the wastewater produced from all internal uses including from the toilets and kitchen. This recycled water must be reused on the project site. End uses may include flushing toilets, the HVAC system, cleaning the building, or irrigation of landscaping. When this measure is claimed, EDGE automatically calculates the potential supply of black water from the building and applies a reduction in municipal water demand across the end uses that can benefit from it. The EDGE software assumes that most of the black wastewater from the building is collected, treated and stored properly to meet ongoing demand. If the quantity of treated black water is insufficient, then only a portion of the demand is shown to be met by the treated water.
30 https://www.edgebuildings.com/edge-user-guide-for-all-building-types-version-2-1/
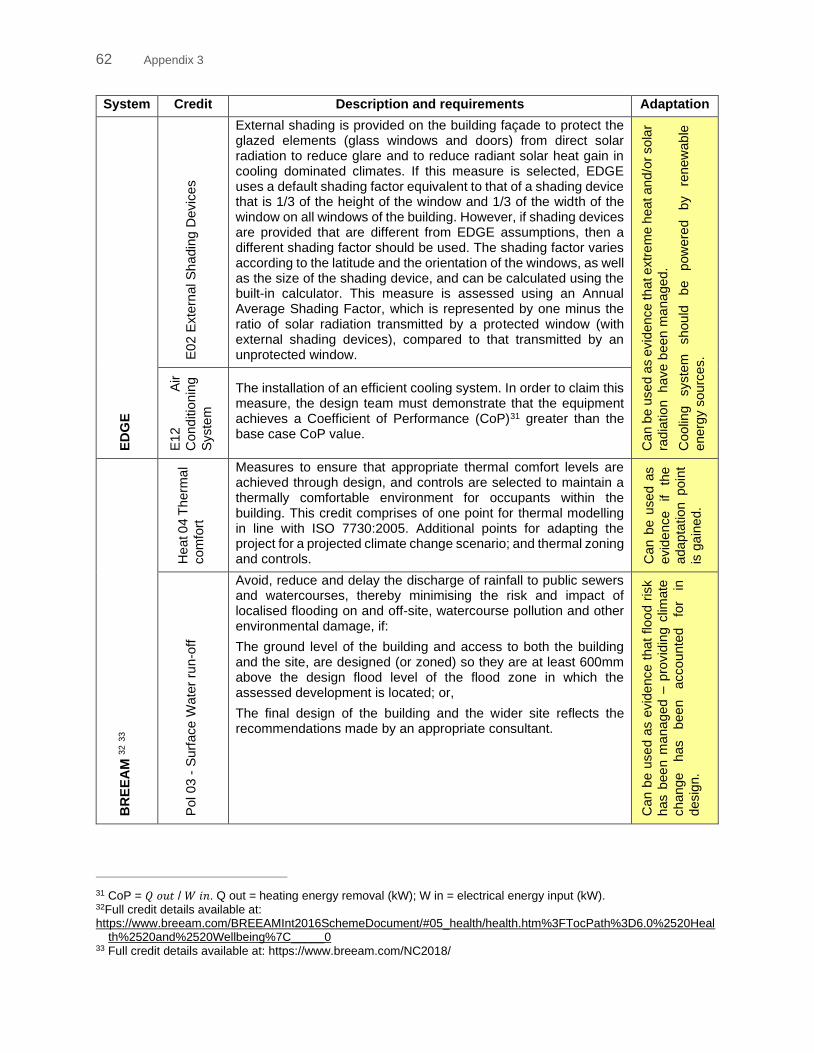
62 Appendix 3
System Credit Description and requirements Adaptation
ED
GE
E02 E
xte
rnal S
hadin
g D
evic
es
External shading is provided on the building façade to protect the glazed elements (glass windows and doors) from direct solar radiation to reduce glare and to reduce radiant solar heat gain in cooling dominated climates. If this measure is selected, EDGE uses a default shading factor equivalent to that of a shading device that is 1/3 of the height of the window and 1/3 of the width of the window on all windows of the building. However, if shading devices are provided that are different from EDGE assumptions, then a different shading factor should be used. The shading factor varies according to the latitude and the orientation of the windows, as well as the size of the shading device, and can be calculated using the built-in calculator. This measure is assessed using an Annual Average Shading Factor, which is represented by one minus the ratio of solar radiation transmitted by a protected window (with external shading devices), compared to that transmitted by an unprotected window.
Can
be
use
d a
s e
vid
ence
th
at extr
em
e h
eat an
d/o
r sola
r
radia
tio
n h
ave b
een m
ana
ged.
Coolin
g
syste
m
shou
ld
be
pow
ere
d
by
renew
ab
le
energ
y s
ourc
es.
E12
Air
Cond
itio
nin
g
Syste
m
The installation of an efficient cooling system. In order to claim this measure, the design team must demonstrate that the equipment achieves a Coefficient of Performance (CoP)31 greater than the base case CoP value.
BR
EE
AM
32 3
3
Heat 0
4 T
herm
al
com
fort
Measures to ensure that appropriate thermal comfort levels are achieved through design, and controls are selected to maintain a thermally comfortable environment for occupants within the building. This credit comprises of one point for thermal modelling in line with ISO 7730:2005. Additional points for adapting the project for a projected climate change scenario; and thermal zoning and controls. C
an b
e u
sed a
s
evid
ence
if
the
adap
tation poin
t
is g
ain
ed.
Pol 03 -
Surf
ace W
ate
r ru
n-o
ff
Avoid, reduce and delay the discharge of rainfall to public sewers and watercourses, thereby minimising the risk and impact of localised flooding on and off-site, watercourse pollution and other environmental damage, if:
The ground level of the building and access to both the building and the site, are designed (or zoned) so they are at least 600mm above the design flood level of the flood zone in which the assessed development is located; or,
The final design of the building and the wider site reflects the recommendations made by an appropriate consultant.
Can b
e u
se
d a
s e
vid
ence t
hat
floo
d r
isk
has b
ee
n m
ana
ged –
pro
vid
ing c
limate
change
has
bee
n
accou
nte
d
for
in
desig
n.
31 CoP = 𝑄 𝑜𝑢𝑡 / 𝑊 𝑖𝑛. Q out = heating energy removal (kW); W in = electrical energy input (kW). 32Full credit details available at: https://www.breeam.com/BREEAMInt2016SchemeDocument/#05_health/health.htm%3FTocPath%3D6.0%2520Heal
th%2520and%2520Wellbeing%7C_____0 33 Full credit details available at: https://www.breeam.com/NC2018/
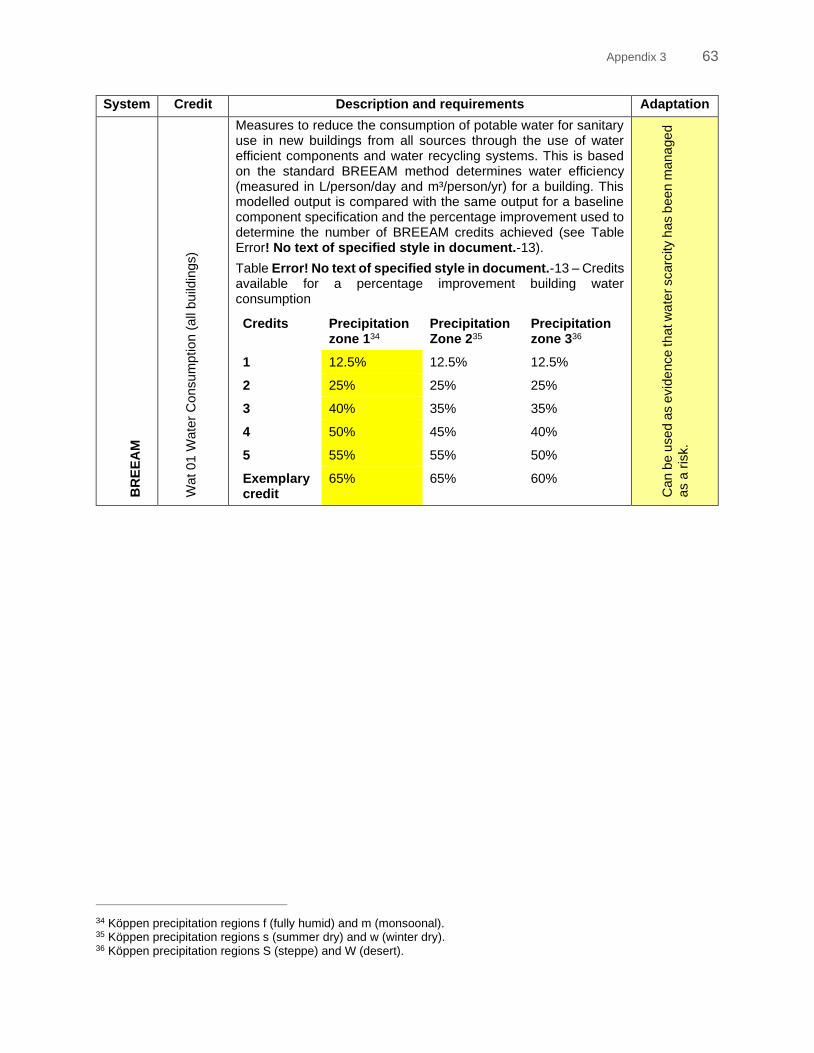
Appendix 3 63
System Credit Description and requirements Adaptation B
RE
EA
M
Wat
01 W
ate
r C
onsu
mptio
n (
all
bu
ildin
gs)
Measures to reduce the consumption of potable water for sanitary use in new buildings from all sources through the use of water efficient components and water recycling systems. This is based on the standard BREEAM method determines water efficiency (measured in L/person/day and m³/person/yr) for a building. This modelled output is compared with the same output for a baseline component specification and the percentage improvement used to determine the number of BREEAM credits achieved (see Table Error! No text of specified style in document.-13).
Table Error! No text of specified style in document.-13 – Credits available for a percentage improvement building water consumption
Credits Precipitation zone 134
Precipitation Zone 235
Precipitation zone 336
1 12.5% 12.5% 12.5%
2 25% 25% 25%
3 40% 35% 35%
4 50% 45% 40%
5 55% 55% 50%
Exemplary credit
65% 65% 60%
Can b
e u
sed
as e
vid
ence th
at w
ate
r scarc
ity h
as b
een
mana
ge
d
as a
ris
k.
34 Köppen precipitation regions f (fully humid) and m (monsoonal). 35 Köppen precipitation regions s (summer dry) and w (winter dry). 36 Köppen precipitation regions S (steppe) and W (desert).
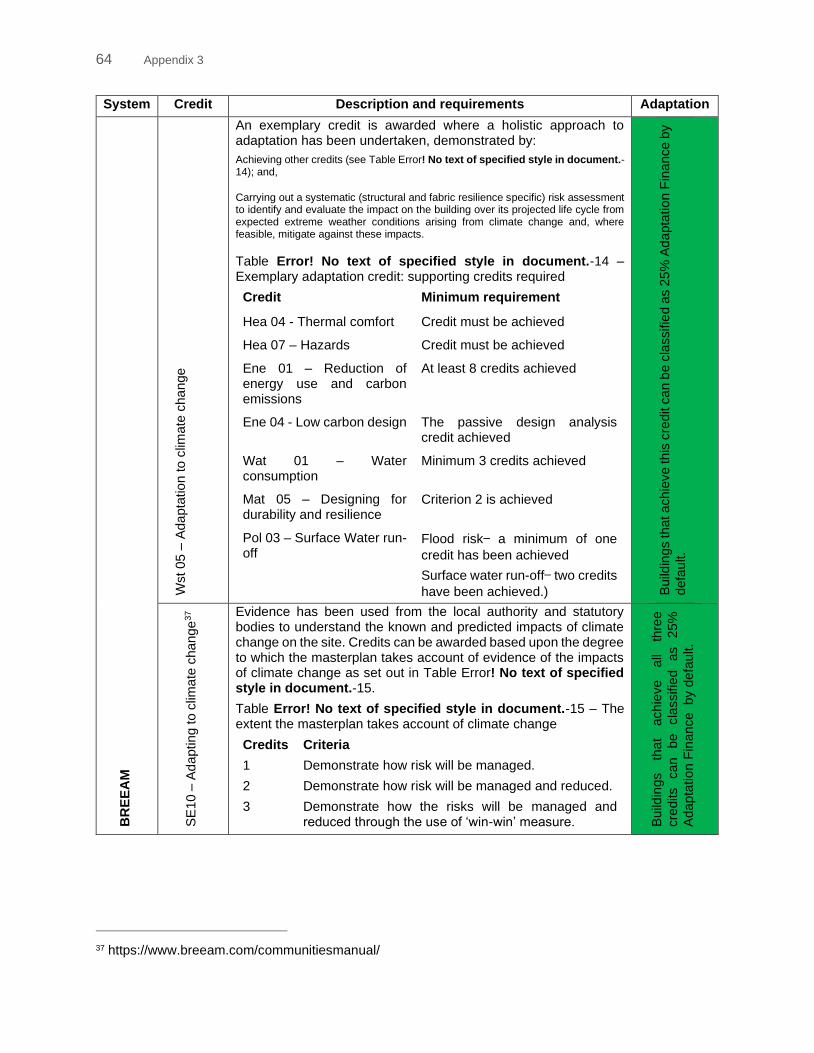
64 Appendix 3
System Credit Description and requirements Adaptation
BR
EE
AM
Wst 05 –
Ada
pta
tio
n to c
limate
cha
nge
An exemplary credit is awarded where a holistic approach to adaptation has been undertaken, demonstrated by:
Achieving other credits (see Table Error! No text of specified style in document.-14); and,
Carrying out a systematic (structural and fabric resilience specific) risk assessment to identify and evaluate the impact on the building over its projected life cycle from expected extreme weather conditions arising from climate change and, where feasible, mitigate against these impacts.
Table Error! No text of specified style in document.-14 – Exemplary adaptation credit: supporting credits required
Credit Minimum requirement
Hea 04 - Thermal comfort Credit must be achieved
Hea 07 – Hazards Credit must be achieved
Ene 01 – Reduction of energy use and carbon emissions
At least 8 credits achieved
Ene 04 - Low carbon design The passive design analysis credit achieved
Wat 01 – Water consumption
Minimum 3 credits achieved
Mat 05 – Designing for durability and resilience
Criterion 2 is achieved
Pol 03 – Surface Water run-off
Flood risk— a minimum of one
credit has been achieved
Surface water run-off— two credits
have been achieved.)
Build
ings that ach
ieve this
cre
dit c
an b
e c
lassifie
d a
s 2
5%
Ad
apta
tion F
ina
nce b
y
defa
ult.
SE
10 –
Ad
apting to c
lima
te c
hange
37 Evidence has been used from the local authority and statutory
bodies to understand the known and predicted impacts of climate change on the site. Credits can be awarded based upon the degree to which the masterplan takes account of evidence of the impacts of climate change as set out in Table Error! No text of specified style in document.-15.
Table Error! No text of specified style in document.-15 – The extent the masterplan takes account of climate change
Credits Criteria
1 Demonstrate how risk will be managed.
2 Demonstrate how risk will be managed and reduced.
3 Demonstrate how the risks will be managed and reduced through the use of ‘win-win’ measure.
Build
ings
that
achie
ve
all
thre
e
cre
dits
can
be
cla
ssifie
d
as
25%
Ada
pta
tio
n F
inance
by d
efa
ult.
37 https://www.breeam.com/communitiesmanual/
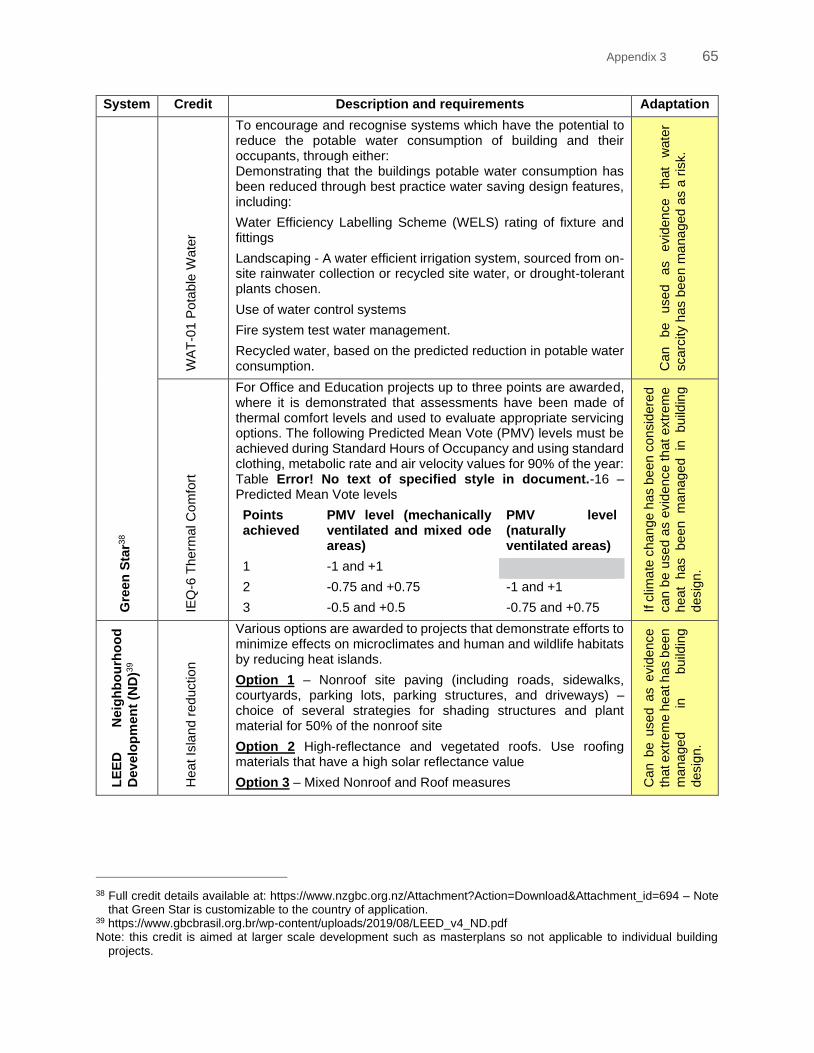
Appendix 3 65
System Credit Description and requirements Adaptation
Gre
en
Sta
r38
WA
T-0
1 P
ota
ble
Wate
r
To encourage and recognise systems which have the potential to reduce the potable water consumption of building and their occupants, through either: Demonstrating that the buildings potable water consumption has been reduced through best practice water saving design features, including:
Water Efficiency Labelling Scheme (WELS) rating of fixture and fittings
Landscaping - A water efficient irrigation system, sourced from on-site rainwater collection or recycled site water, or drought-tolerant plants chosen.
Use of water control systems
Fire system test water management.
Recycled water, based on the predicted reduction in potable water consumption. C
an
be
use
d
as
evid
en
ce
that
wate
r
scarc
ity h
as b
ee
n m
ana
ged
as a
ris
k.
IEQ
-6 T
herm
al C
om
fort
For Office and Education projects up to three points are awarded, where it is demonstrated that assessments have been made of thermal comfort levels and used to evaluate appropriate servicing options. The following Predicted Mean Vote (PMV) levels must be achieved during Standard Hours of Occupancy and using standard clothing, metabolic rate and air velocity values for 90% of the year: Table Error! No text of specified style in document.-16 – Predicted Mean Vote levels
Points achieved
PMV level (mechanically ventilated and mixed ode areas)
PMV level (naturally ventilated areas)
1 -1 and +1
2 -0.75 and +0.75 -1 and +1
3 -0.5 and +0.5 -0.75 and +0.75
If c
lima
te c
han
ge h
as b
een c
onsid
ere
d
can b
e u
sed a
s e
vid
ence t
hat
extr
em
e
heat
has be
en
ma
nag
ed
in
bu
ildin
g
desig
n.
LE
ED
N
eig
hb
ou
rho
od
Develo
pm
en
t (N
D)3
9
Heat Is
lan
d r
ed
uctio
n
Various options are awarded to projects that demonstrate efforts to minimize effects on microclimates and human and wildlife habitats by reducing heat islands.
Option 1 – Nonroof site paving (including roads, sidewalks, courtyards, parking lots, parking structures, and driveways) – choice of several strategies for shading structures and plant material for 50% of the nonroof site
Option 2 High-reflectance and vegetated roofs. Use roofing materials that have a high solar reflectance value
Option 3 – Mixed Nonroof and Roof measures Can b
e u
sed a
s e
vid
ence
that extr
em
e h
eat h
as b
een
mana
ge
d
in
build
ing
desig
n.
38 Full credit details available at: https://www.nzgbc.org.nz/Attachment?Action=Download&Attachment_id=694 – Note
that Green Star is customizable to the country of application. 39 https://www.gbcbrasil.org.br/wp-content/uploads/2019/08/LEED_v4_ND.pdf Note: this credit is aimed at larger scale development such as masterplans so not applicable to individual building
projects.
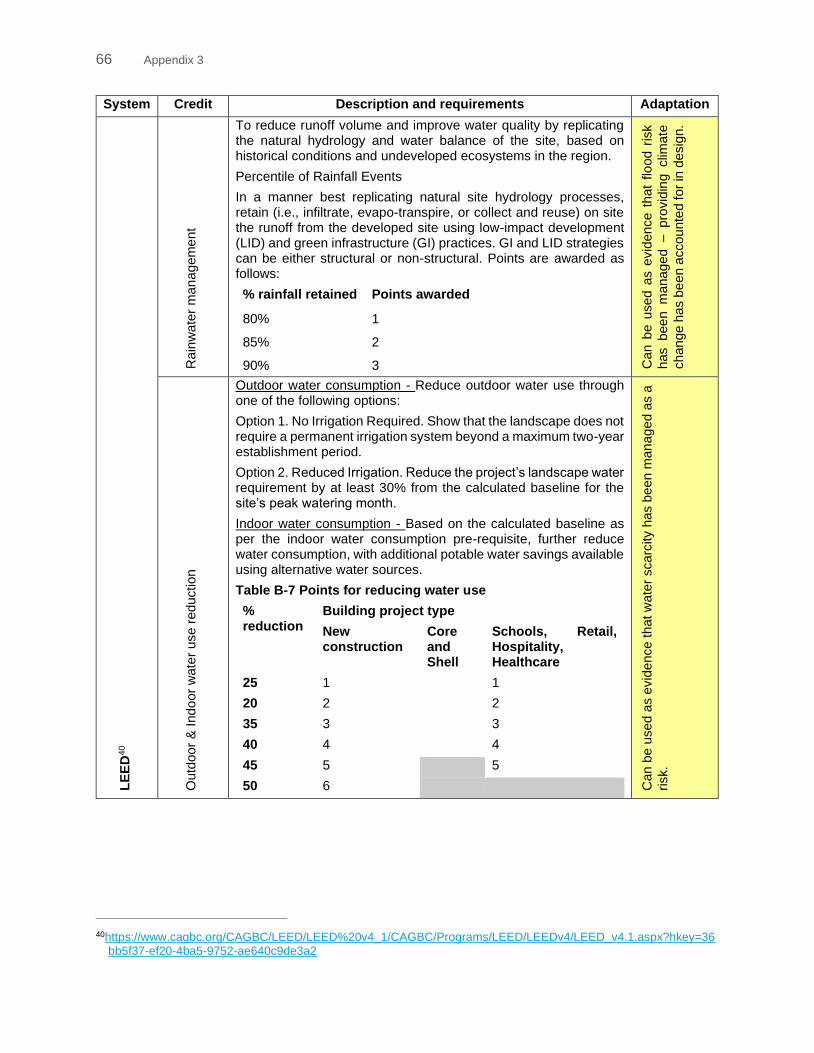
66 Appendix 3
System Credit Description and requirements Adaptation
LE
ED
40
Rain
wate
r m
an
ag
em
ent
To reduce runoff volume and improve water quality by replicating the natural hydrology and water balance of the site, based on historical conditions and undeveloped ecosystems in the region.
Percentile of Rainfall Events
In a manner best replicating natural site hydrology processes, retain (i.e., infiltrate, evapo-transpire, or collect and reuse) on site the runoff from the developed site using low-impact development (LID) and green infrastructure (GI) practices. GI and LID strategies can be either structural or non-structural. Points are awarded as follows:
% rainfall retained Points awarded
80% 1
85% 2
90% 3
Can b
e u
sed a
s e
vid
ence
that
flo
od r
isk
has bee
n m
ana
ged – pro
vid
ing clim
ate
change
has b
een a
ccounte
d for
in d
esig
n.
Outd
oor
& I
ndo
or
wate
r use r
eduction
Outdoor water consumption - Reduce outdoor water use through one of the following options:
Option 1. No Irrigation Required. Show that the landscape does not require a permanent irrigation system beyond a maximum two-year establishment period.
Option 2. Reduced Irrigation. Reduce the project’s landscape water requirement by at least 30% from the calculated baseline for the site’s peak watering month.
Indoor water consumption - Based on the calculated baseline as per the indoor water consumption pre-requisite, further reduce water consumption, with additional potable water savings available using alternative water sources.
Table B-7 Points for reducing water use
% reduction
Building project type
New construction
Core and Shell
Schools, Retail, Hospitality, Healthcare
25 1 1
20 2 2
35 3 3
40 4 4
45 5 5
50 6
Can b
e u
sed a
s e
vid
ence
that w
ate
r scarc
ity h
as b
een
man
ag
ed a
s a
risk.
40https://www.cagbc.org/CAGBC/LEED/LEED%20v4_1/CAGBC/Programs/LEED/LEEDv4/LEED_v4.1.aspx?hkey=36
bb5f37-ef20-4ba5-9752-ae640c9de3a2
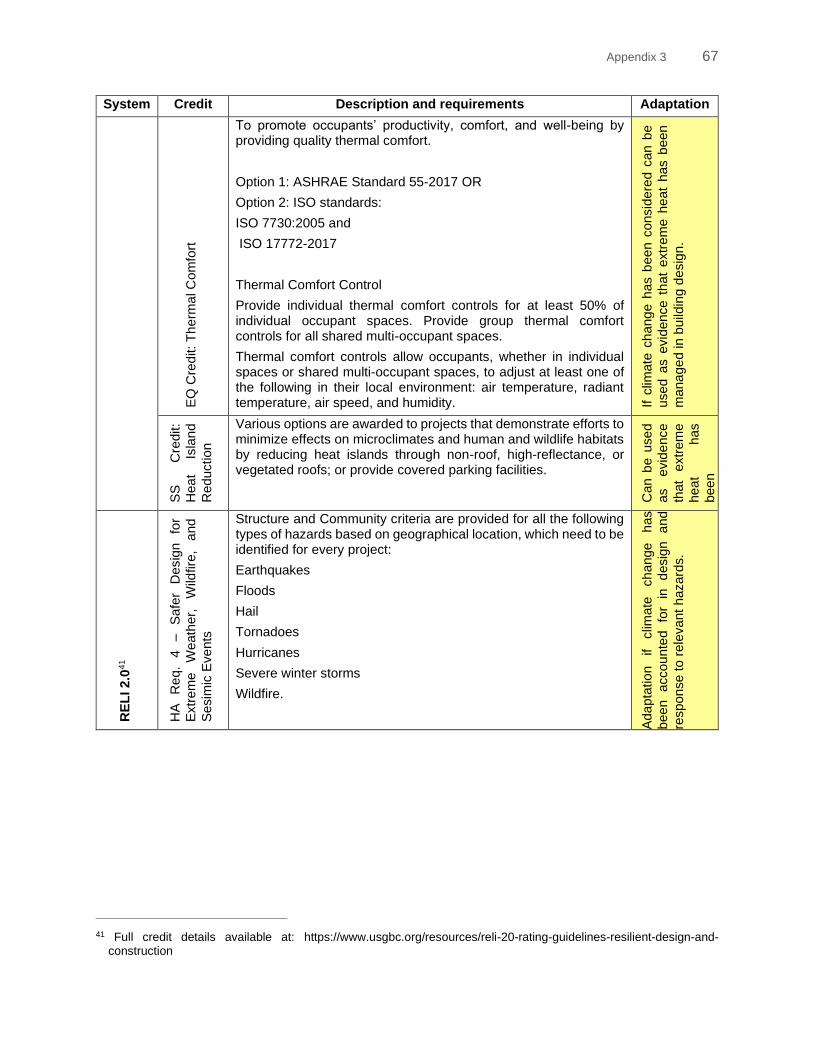
Appendix 3 67
System Credit Description and requirements Adaptation
EQ
Cre
dit: T
herm
al C
om
fort
To promote occupants’ productivity, comfort, and well-being by providing quality thermal comfort.
Option 1: ASHRAE Standard 55-2017 OR
Option 2: ISO standards:
ISO 7730:2005 and
ISO 17772-2017
Thermal Comfort Control
Provide individual thermal comfort controls for at least 50% of individual occupant spaces. Provide group thermal comfort controls for all shared multi-occupant spaces.
Thermal comfort controls allow occupants, whether in individual spaces or shared multi-occupant spaces, to adjust at least one of the following in their local environment: air temperature, radiant temperature, air speed, and humidity. If
clim
ate
ch
ang
e h
as b
ee
n c
onsid
ere
d c
an
be
used a
s e
vid
ence
th
at
extr
em
e h
eat
has b
een
mana
ge
d in b
uild
ing d
esig
n.
SS
C
redit:
Heat
Isla
nd
Reduction
Various options are awarded to projects that demonstrate efforts to minimize effects on microclimates and human and wildlife habitats by reducing heat islands through non-roof, high-reflectance, or vegetated roofs; or provide covered parking facilities.
Can b
e u
se
d
as
evid
ence
that
extr
em
e
heat
has
been
mana
ge
d
in
build
ing
desig
n.
RE
LI 2.0
41
HA
R
eq.
4
–
Safe
r D
esig
n
for
Extr
em
e
Weath
er,
W
ildfire
, a
nd
Sesim
ic E
ve
nts
Structure and Community criteria are provided for all the following types of hazards based on geographical location, which need to be identified for every project:
Earthquakes
Floods
Hail
Tornadoes
Hurricanes
Severe winter storms
Wildfire.
Ada
pta
tio
n
if
clim
ate
ch
ange
h
as
been
accou
nte
d
for
in
desig
n
and
response to
rele
vant
hazard
s.
41 Full credit details available at: https://www.usgbc.org/resources/reli-20-rating-guidelines-resilient-design-and-
construction
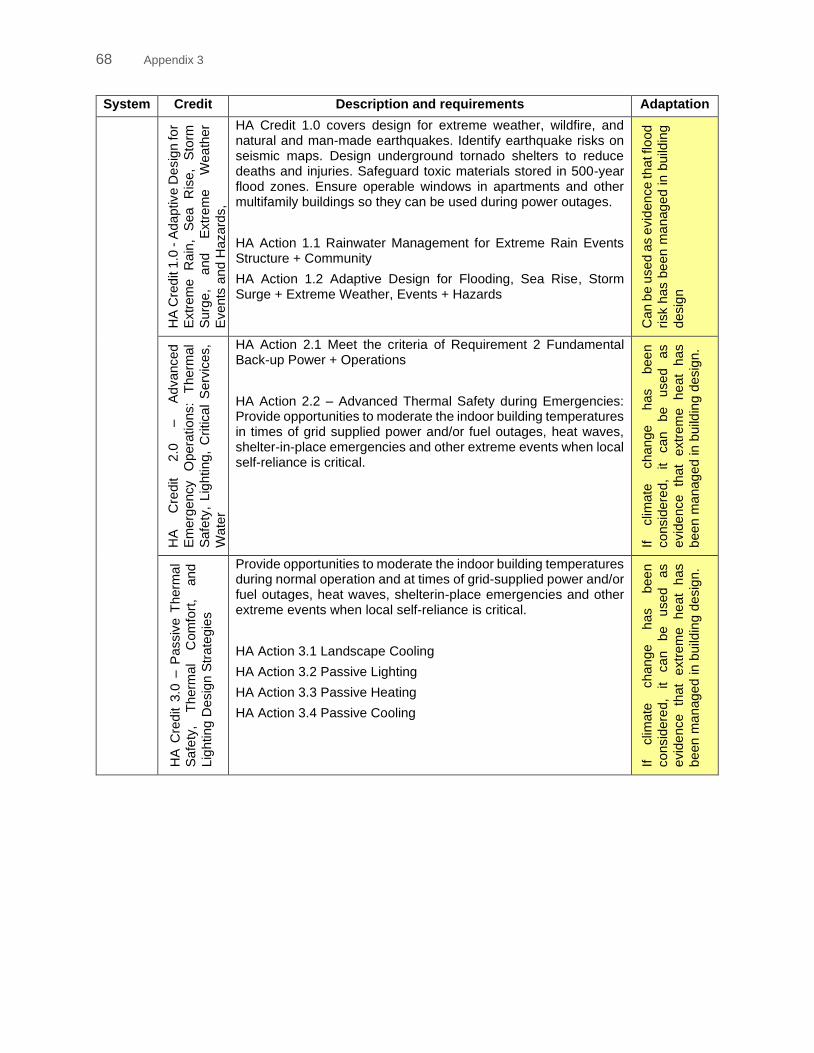
68 Appendix 3
System Credit Description and requirements Adaptation
HA
Cre
dit 1
.0 -
Ada
ptive D
esig
n for
Extr
em
e
Ra
in,
Sea
Ris
e,
Sto
rm
Surg
e,
and
Extr
em
e
Wea
ther
Events
and H
azard
s,
HA Credit 1.0 covers design for extreme weather, wildfire, and natural and man-made earthquakes. Identify earthquake risks on seismic maps. Design underground tornado shelters to reduce deaths and injuries. Safeguard toxic materials stored in 500-year flood zones. Ensure operable windows in apartments and other multifamily buildings so they can be used during power outages.
HA Action 1.1 Rainwater Management for Extreme Rain Events Structure + Community
HA Action 1.2 Adaptive Design for Flooding, Sea Rise, Storm Surge + Extreme Weather, Events + Hazards
Can b
e u
sed a
s e
vid
ence th
at flood
risk h
as b
een
ma
nag
ed in
build
ing
desig
n
HA
C
redit
2.0
–
Ad
vanced
Em
erg
ency
Opera
tions:
Therm
al
Safe
ty,
Lig
hting,
Critica
l S
erv
ices,
Wate
r
HA Action 2.1 Meet the criteria of Requirement 2 Fundamental Back-up Power + Operations
HA Action 2.2 – Advanced Thermal Safety during Emergencies: Provide opportunities to moderate the indoor building temperatures in times of grid supplied power and/or fuel outages, heat waves, shelter-in-place emergencies and other extreme events when local self-reliance is critical.
If
clim
ate
chan
ge
has
bee
n
consid
ere
d,
it
can
be
u
sed
as
evid
ence
that
extr
em
e
he
at
has
been
ma
nag
ed in b
uild
ing d
esig
n.
HA
Cre
dit 3
.0 –
Passiv
e T
herm
al
Safe
ty,
Therm
al
Com
fort
, and
Lig
hting D
esig
n S
trate
gie
s
Provide opportunities to moderate the indoor building temperatures during normal operation and at times of grid-supplied power and/or fuel outages, heat waves, shelterin-place emergencies and other extreme events when local self-reliance is critical.
HA Action 3.1 Landscape Cooling
HA Action 3.2 Passive Lighting
HA Action 3.3 Passive Heating
HA Action 3.4 Passive Cooling
If
clim
ate
chan
ge
has
bee
n
consid
ere
d,
it
can
be
u
sed
as
evid
ence
that
extr
em
e
he
at
has
been
ma
nag
ed in b
uild
ing d
esig
n.
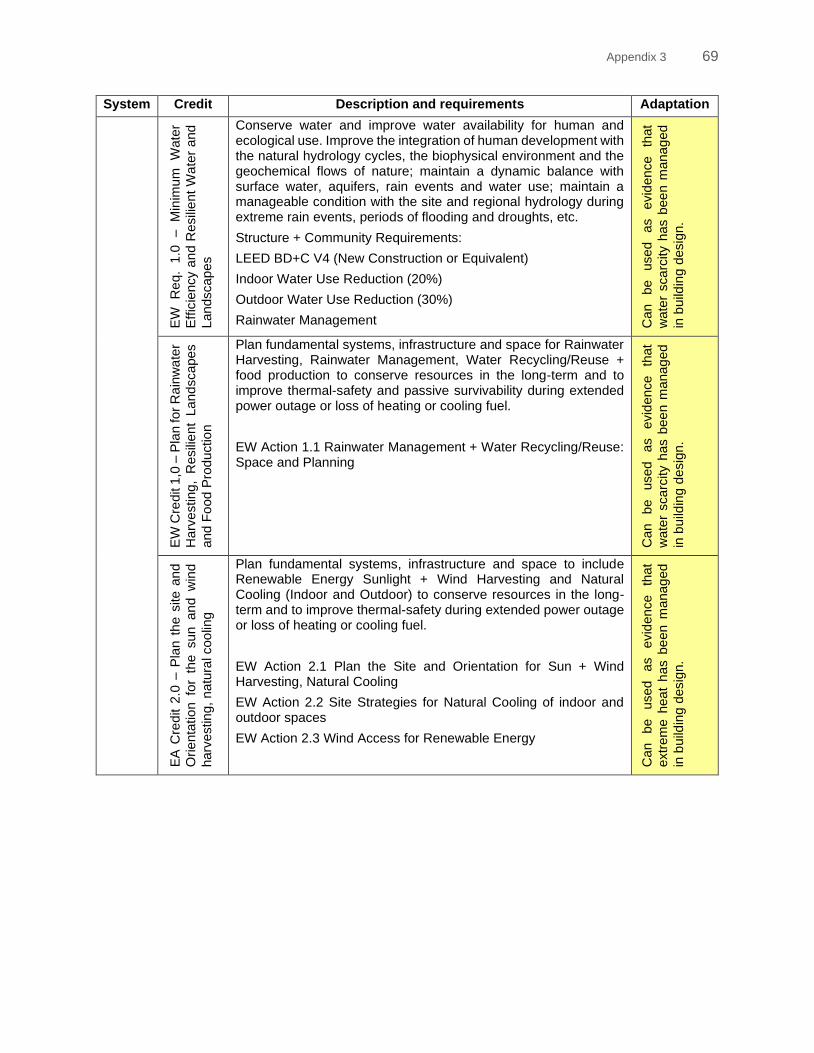
Appendix 3 69
System Credit Description and requirements Adaptation
EW
R
eq.
1.0
–
M
inim
um
W
ate
r
Effic
iency a
nd R
esili
ent
Wa
ter
and
Landscap
es
Conserve water and improve water availability for human and ecological use. Improve the integration of human development with the natural hydrology cycles, the biophysical environment and the geochemical flows of nature; maintain a dynamic balance with surface water, aquifers, rain events and water use; maintain a manageable condition with the site and regional hydrology during extreme rain events, periods of flooding and droughts, etc.
Structure + Community Requirements:
LEED BD+C V4 (New Construction or Equivalent)
Indoor Water Use Reduction (20%)
Outdoor Water Use Reduction (30%)
Rainwater Management Can
be
used
as
evid
en
ce
that
wate
r sca
rcity h
as b
ee
n m
anag
ed
in b
uild
ing d
esig
n.
EW
Cre
dit 1
,0 –
Pla
n for
Ra
inw
ate
r
Harv
esting
, R
esili
ent
La
nd
scapes
and F
ood P
rod
uctio
n
Plan fundamental systems, infrastructure and space for Rainwater Harvesting, Rainwater Management, Water Recycling/Reuse + food production to conserve resources in the long-term and to improve thermal-safety and passive survivability during extended power outage or loss of heating or cooling fuel.
EW Action 1.1 Rainwater Management + Water Recycling/Reuse: Space and Planning
Can
be
used
as
evid
en
ce
that
wate
r scarc
ity h
as b
ee
n m
anag
ed
in b
uild
ing d
esig
n.
EA
Cre
dit 2
.0 –
Pla
n t
he s
ite a
nd
Orienta
tio
n fo
r th
e sun an
d w
ind
harv
estin
g, n
atu
ral coo
ling
Plan fundamental systems, infrastructure and space to include Renewable Energy Sunlight + Wind Harvesting and Natural Cooling (Indoor and Outdoor) to conserve resources in the long-term and to improve thermal-safety during extended power outage or loss of heating or cooling fuel.
EW Action 2.1 Plan the Site and Orientation for Sun + Wind Harvesting, Natural Cooling
EW Action 2.2 Site Strategies for Natural Cooling of indoor and outdoor spaces
EW Action 2.3 Wind Access for Renewable Energy
Can
be
used
as
evid
en
ce
that
extr
em
e h
ea
t h
as b
een m
anag
ed
in b
uild
ing d
esig
n.
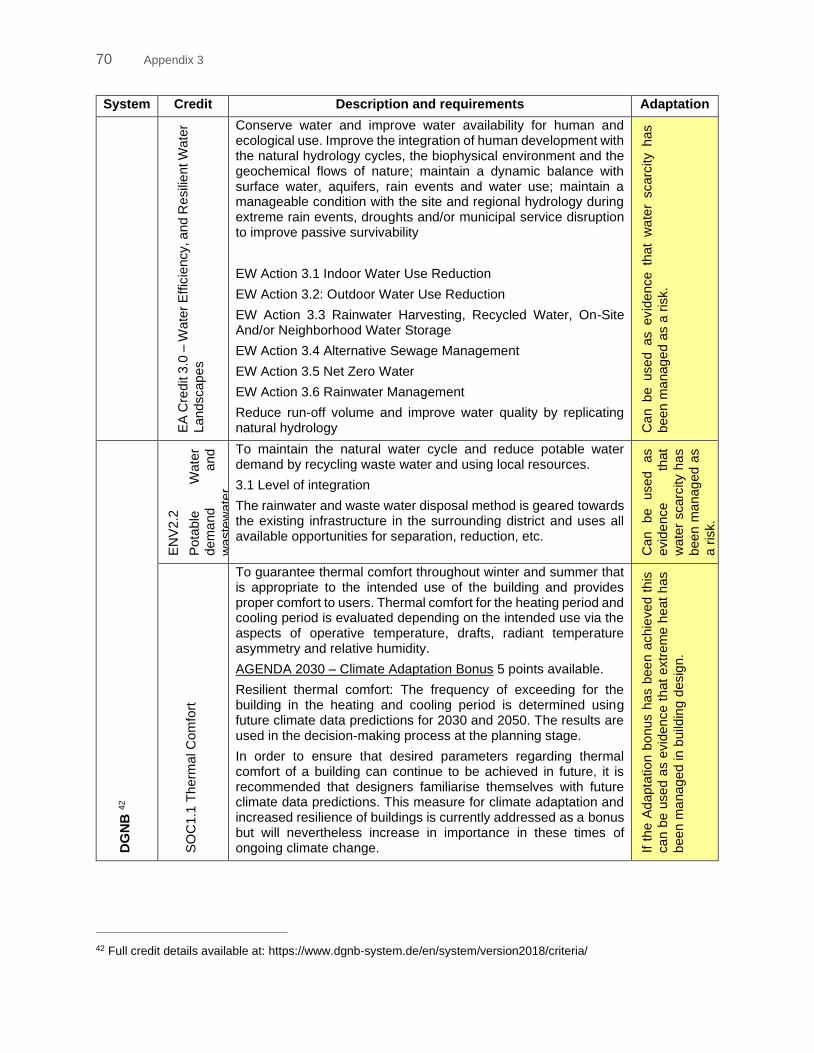
70 Appendix 3
System Credit Description and requirements Adaptation
EA
Cre
dit 3
.0 –
Wate
r E
ffic
iency, and R
esili
ent W
ate
r
Landscap
es
Conserve water and improve water availability for human and ecological use. Improve the integration of human development with the natural hydrology cycles, the biophysical environment and the geochemical flows of nature; maintain a dynamic balance with surface water, aquifers, rain events and water use; maintain a manageable condition with the site and regional hydrology during extreme rain events, droughts and/or municipal service disruption to improve passive survivability
EW Action 3.1 Indoor Water Use Reduction
EW Action 3.2: Outdoor Water Use Reduction
EW Action 3.3 Rainwater Harvesting, Recycled Water, On-Site And/or Neighborhood Water Storage
EW Action 3.4 Alternative Sewage Management
EW Action 3.5 Net Zero Water
EW Action 3.6 Rainwater Management
Reduce run-off volume and improve water quality by replicating natural hydrology C
an be used
as evid
ence
th
at
wa
ter
scarc
ity h
as
been
ma
nag
ed a
s a
ris
k.
DG
NB
42
EN
V2.2
Pota
ble
W
ate
r
dem
and
and
waste
wate
r
volu
me
To maintain the natural water cycle and reduce potable water demand by recycling waste water and using local resources.
3.1 Level of integration
The rainwater and waste water disposal method is geared towards the existing infrastructure in the surrounding district and uses all available opportunities for separation, reduction, etc.
Can
be
used
as
evid
ence
that
wate
r scarc
ity h
as
been
ma
nag
ed a
s
a r
isk.
SO
C1.1
Therm
al C
om
fort
To guarantee thermal comfort throughout winter and summer that is appropriate to the intended use of the building and provides proper comfort to users. Thermal comfort for the heating period and cooling period is evaluated depending on the intended use via the aspects of operative temperature, drafts, radiant temperature asymmetry and relative humidity.
AGENDA 2030 – Climate Adaptation Bonus 5 points available.
Resilient thermal comfort: The frequency of exceeding for the building in the heating and cooling period is determined using future climate data predictions for 2030 and 2050. The results are used in the decision-making process at the planning stage.
In order to ensure that desired parameters regarding thermal comfort of a building can continue to be achieved in future, it is recommended that designers familiarise themselves with future climate data predictions. This measure for climate adaptation and increased resilience of buildings is currently addressed as a bonus but will nevertheless increase in importance in these times of ongoing climate change. If
th
e A
dapta
tion
bo
nus h
as b
ee
n a
chie
ved
th
is
can b
e u
sed a
s e
vid
ence t
hat
extr
em
e h
eat
has
been
ma
nag
ed in b
uild
ing d
esig
n.
42 Full credit details available at: https://www.dgnb-system.de/en/system/version2018/criteria/
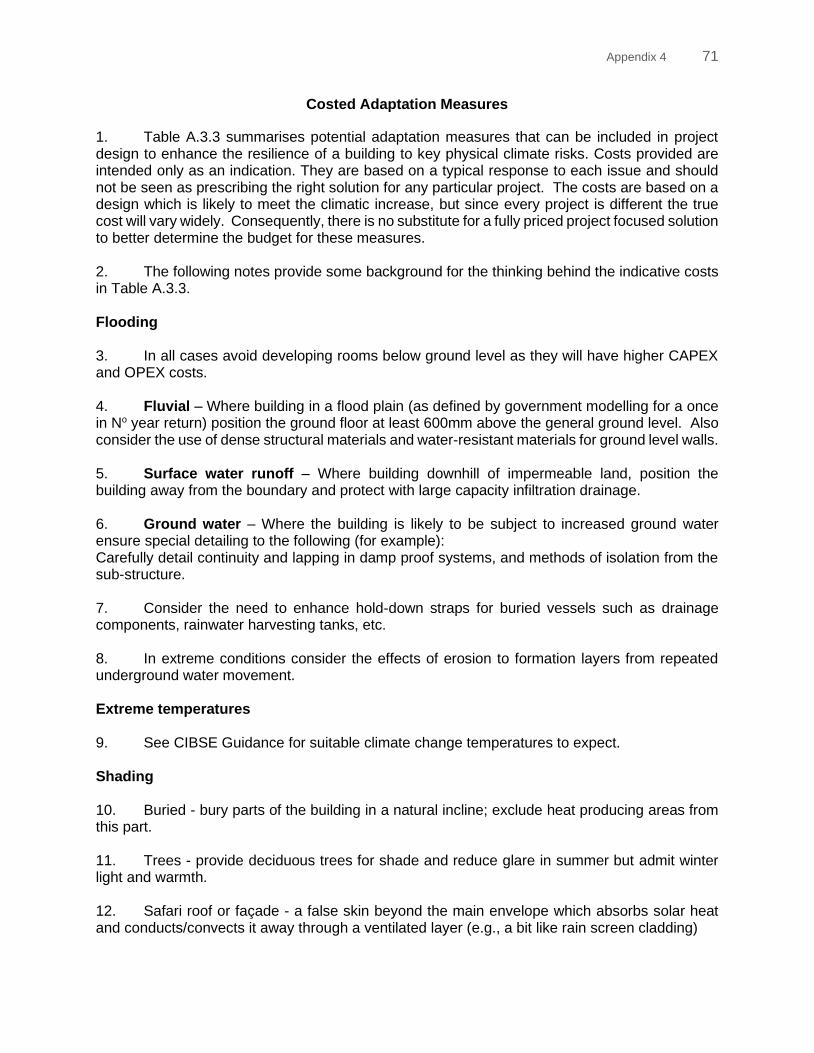
Appendix 4 71
Costed Adaptation Measures
1. Table A.3.3 summarises potential adaptation measures that can be included in project design to enhance the resilience of a building to key physical climate risks. Costs provided are intended only as an indication. They are based on a typical response to each issue and should not be seen as prescribing the right solution for any particular project. The costs are based on a design which is likely to meet the climatic increase, but since every project is different the true cost will vary widely. Consequently, there is no substitute for a fully priced project focused solution to better determine the budget for these measures. 2. The following notes provide some background for the thinking behind the indicative costs in Table A.3.3. Flooding 3. In all cases avoid developing rooms below ground level as they will have higher CAPEX and OPEX costs. 4. Fluvial – Where building in a flood plain (as defined by government modelling for a once in No year return) position the ground floor at least 600mm above the general ground level. Also consider the use of dense structural materials and water-resistant materials for ground level walls. 5. Surface water runoff – Where building downhill of impermeable land, position the building away from the boundary and protect with large capacity infiltration drainage. 6. Ground water – Where the building is likely to be subject to increased ground water ensure special detailing to the following (for example): Carefully detail continuity and lapping in damp proof systems, and methods of isolation from the sub-structure. 7. Consider the need to enhance hold-down straps for buried vessels such as drainage components, rainwater harvesting tanks, etc. 8. In extreme conditions consider the effects of erosion to formation layers from repeated underground water movement. Extreme temperatures 9. See CIBSE Guidance for suitable climate change temperatures to expect. Shading 10. Buried - bury parts of the building in a natural incline; exclude heat producing areas from this part. 11. Trees - provide deciduous trees for shade and reduce glare in summer but admit winter light and warmth. 12. Safari roof or façade - a false skin beyond the main envelope which absorbs solar heat and conducts/convects it away through a ventilated layer (e.g., a bit like rain screen cladding)
72 Appendix 4
13. Fenestration - optimise window sizes for good daylight, but low heat gain, especially on south façade. Building form 14. Orientation - position the building to maximise winter sun; use surroundings summer sun. 15. Courtyards - useful for natural ventilation; also helpful with evaporative cooling from water features. 16. Concealed structure - avoid use of expressed structure which transmits heat back into the building fabric. Increase insulation 17. Building services - consider optimum thickness or better installed insulation to building services. 18. Increase air tightness - use <3 m3/m2hr to contain energised air; also consider revolving entrance doors. Internal gains 19. Equipment – don't reject heat internally but conduct to outside by ducts or pumps. 20. Efficiency - use high efficiency equipment to ensure energy is not wasted or leaks away. Free cooling 21. Natural ventilation - use shallow plan building to allow simple cross flow and use of ‘towers’ on stairwells to encourage air movement by ‘stack effect’. 22. Earth tubes - draw fresh air in through large convoluted buried tubes to allow pre-cooling of ventilation air. 23. Night-time cooling – consider automatic window systems to allow draft of cool night air to ventilate rooms. Mechanical cooling 24. Surface water - heat exchange with a nearby water source such as a river, canal, or lake. 25. Ground source heat pumps - consider “open loop”: allows storage of cold energy ready for summer (opposite in winter) if the geology is suitable (e.g., sandstone aquifer about 120m down). 26. Condensers - select heat rejection plant for higher external temperatures. Solar radiation
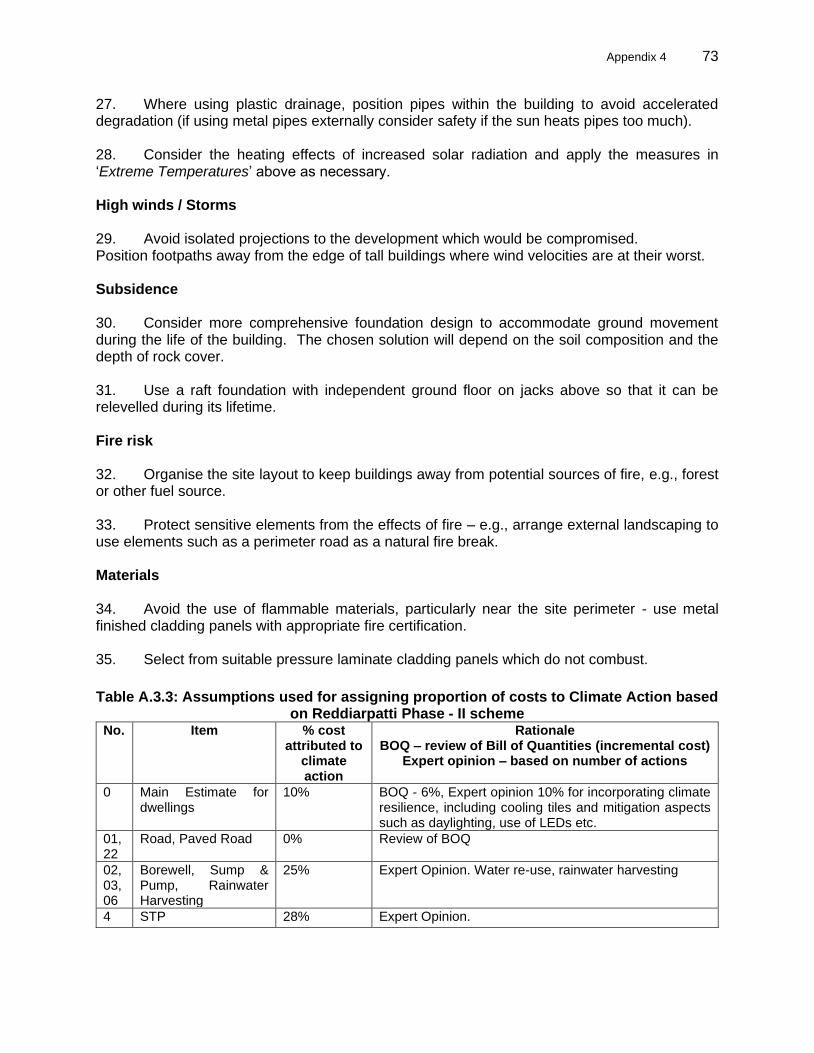
Appendix 4 73
27. Where using plastic drainage, position pipes within the building to avoid accelerated degradation (if using metal pipes externally consider safety if the sun heats pipes too much). 28. Consider the heating effects of increased solar radiation and apply the measures in ‘Extreme Temperatures’ above as necessary. High winds / Storms 29. Avoid isolated projections to the development which would be compromised. Position footpaths away from the edge of tall buildings where wind velocities are at their worst. Subsidence 30. Consider more comprehensive foundation design to accommodate ground movement during the life of the building. The chosen solution will depend on the soil composition and the depth of rock cover. 31. Use a raft foundation with independent ground floor on jacks above so that it can be relevelled during its lifetime. Fire risk 32. Organise the site layout to keep buildings away from potential sources of fire, e.g., forest or other fuel source. 33. Protect sensitive elements from the effects of fire – e.g., arrange external landscaping to use elements such as a perimeter road as a natural fire break. Materials 34. Avoid the use of flammable materials, particularly near the site perimeter - use metal finished cladding panels with appropriate fire certification. 35. Select from suitable pressure laminate cladding panels which do not combust.
Table A.3.3: Assumptions used for assigning proportion of costs to Climate Action based on Reddiarpatti Phase - II scheme
No. Item % cost attributed to
climate action
Rationale BOQ – review of Bill of Quantities (incremental cost)
Expert opinion – based on number of actions
0 Main Estimate for dwellings
10% BOQ - 6%, Expert opinion 10% for incorporating climate resilience, including cooling tiles and mitigation aspects such as daylighting, use of LEDs etc.
01, 22
Road, Paved Road 0% Review of BOQ
02, 03, 06
Borewell, Sump & Pump, Rainwater Harvesting
25% Expert Opinion. Water re-use, rainwater harvesting
4 STP 28% Expert Opinion.
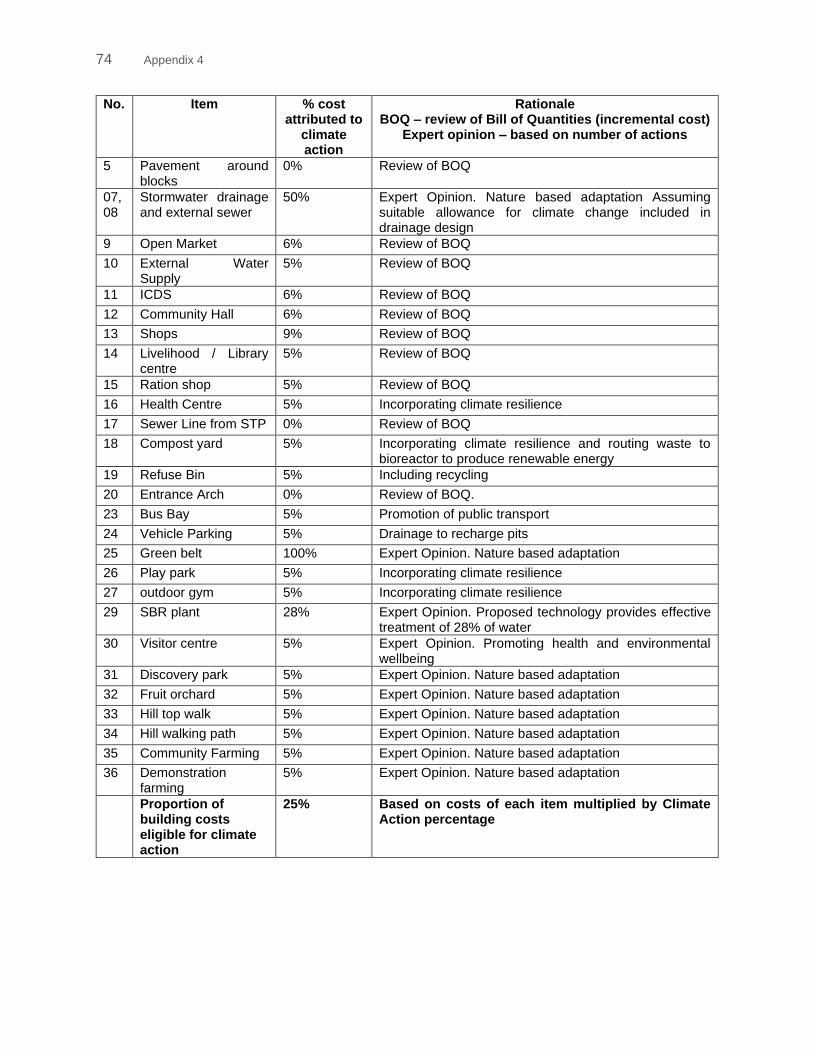
74 Appendix 4
No. Item % cost attributed to
climate action
Rationale BOQ – review of Bill of Quantities (incremental cost)
Expert opinion – based on number of actions
5 Pavement around blocks
0% Review of BOQ
07, 08
Stormwater drainage and external sewer
50% Expert Opinion. Nature based adaptation Assuming suitable allowance for climate change included in drainage design
9 Open Market 6% Review of BOQ
10 External Water Supply
5% Review of BOQ
11 ICDS 6% Review of BOQ
12 Community Hall 6% Review of BOQ
13 Shops 9% Review of BOQ
14 Livelihood / Library centre
5% Review of BOQ
15 Ration shop 5% Review of BOQ
16 Health Centre 5% Incorporating climate resilience
17 Sewer Line from STP 0% Review of BOQ
18 Compost yard 5% Incorporating climate resilience and routing waste to bioreactor to produce renewable energy
19 Refuse Bin 5% Including recycling
20 Entrance Arch 0% Review of BOQ.
23 Bus Bay 5% Promotion of public transport
24 Vehicle Parking 5% Drainage to recharge pits
25 Green belt 100% Expert Opinion. Nature based adaptation
26 Play park 5% Incorporating climate resilience
27 outdoor gym 5% Incorporating climate resilience
29 SBR plant 28% Expert Opinion. Proposed technology provides effective treatment of 28% of water
30 Visitor centre 5% Expert Opinion. Promoting health and environmental wellbeing
31 Discovery park 5% Expert Opinion. Nature based adaptation
32 Fruit orchard 5% Expert Opinion. Nature based adaptation
33 Hill top walk 5% Expert Opinion. Nature based adaptation
34 Hill walking path 5% Expert Opinion. Nature based adaptation
35 Community Farming 5% Expert Opinion. Nature based adaptation
36 Demonstration farming
5% Expert Opinion. Nature based adaptation
Proportion of building costs eligible for climate action
25% Based on costs of each item multiplied by Climate Action percentage

Appendix 4 75
Table A.3.4: General assumptions for all sites
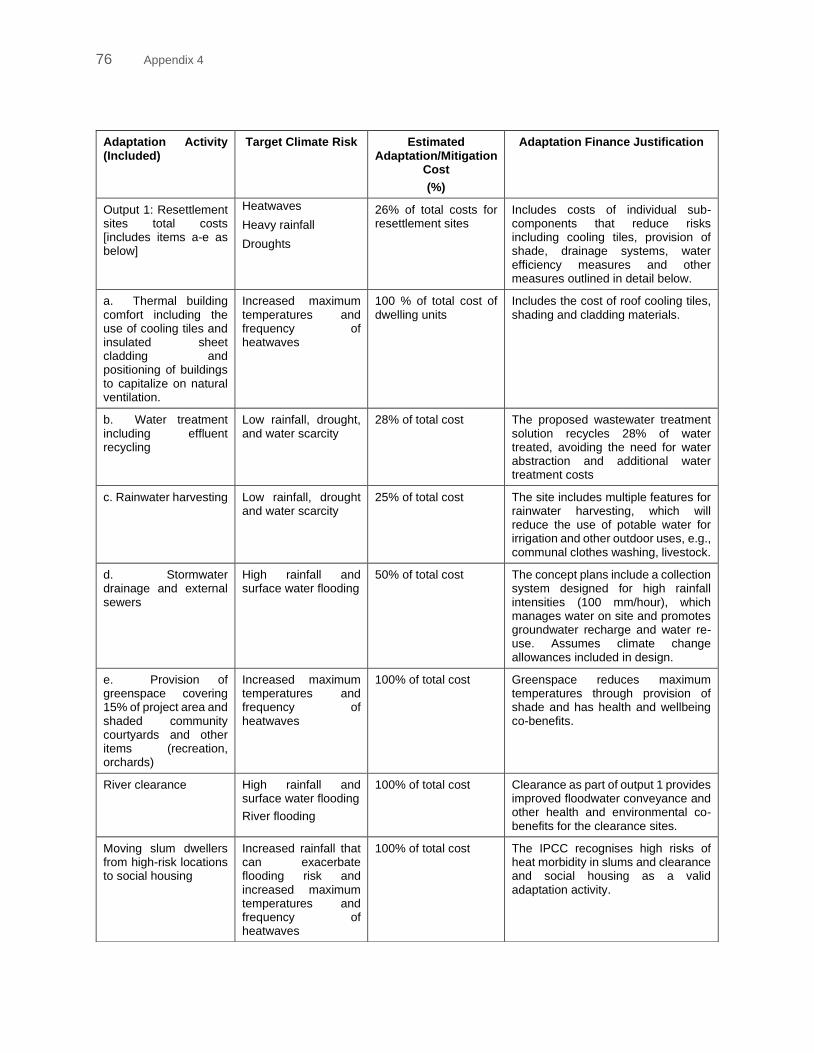
76 Appendix 4
Adaptation Activity (Included)
Target Climate Risk Estimated Adaptation/Mitigation
Cost
(%)
Adaptation Finance Justification
Output 1: Resettlement sites total costs [includes items a-e as below]
Heatwaves
Heavy rainfall
Droughts
26% of total costs for resettlement sites
Includes costs of individual sub-components that reduce risks including cooling tiles, provision of shade, drainage systems, water efficiency measures and other measures outlined in detail below.
a. Thermal building comfort including the use of cooling tiles and insulated sheet cladding and positioning of buildings to capitalize on natural ventilation.
Increased maximum temperatures and frequency of heatwaves
100 % of total cost of dwelling units
Includes the cost of roof cooling tiles, shading and cladding materials.
b. Water treatment including effluent recycling
Low rainfall, drought, and water scarcity
28% of total cost The proposed wastewater treatment solution recycles 28% of water treated, avoiding the need for water abstraction and additional water treatment costs
c. Rainwater harvesting Low rainfall, drought and water scarcity
25% of total cost The site includes multiple features for rainwater harvesting, which will reduce the use of potable water for irrigation and other outdoor uses, e.g., communal clothes washing, livestock.
d. Stormwater drainage and external sewers
High rainfall and surface water flooding
50% of total cost The concept plans include a collection system designed for high rainfall intensities (100 mm/hour), which manages water on site and promotes groundwater recharge and water re-use. Assumes climate change allowances included in design.
e. Provision of greenspace covering 15% of project area and shaded community courtyards and other items (recreation, orchards)
Increased maximum temperatures and frequency of heatwaves
100% of total cost Greenspace reduces maximum temperatures through provision of shade and has health and wellbeing co-benefits.
River clearance High rainfall and surface water flooding
River flooding
100% of total cost Clearance as part of output 1 provides improved floodwater conveyance and other health and environmental co-benefits for the clearance sites.
Moving slum dwellers from high-risk locations to social housing
Increased rainfall that can exacerbate flooding risk and increased maximum temperatures and frequency of heatwaves
100% of total cost The IPCC recognises high risks of heat morbidity in slums and clearance and social housing as a valid adaptation activity.
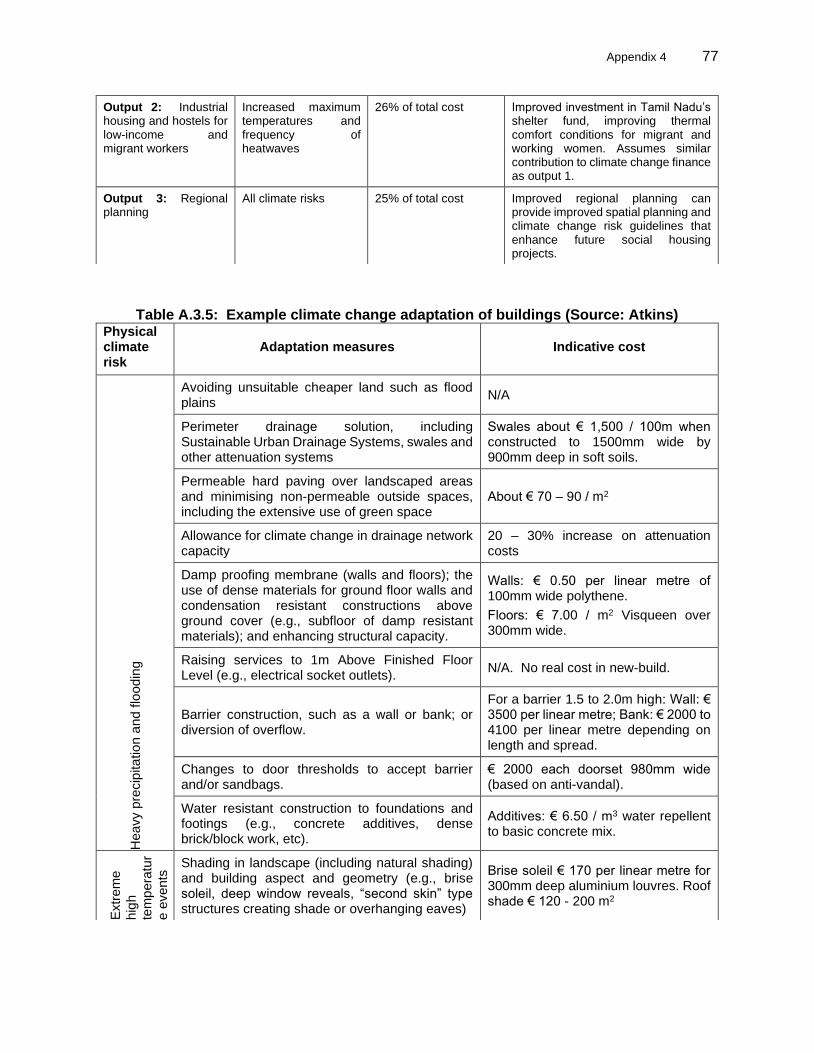
Appendix 4 77
Table A.3.5: Example climate change adaptation of buildings (Source: Atkins)
Output 2: Industrial housing and hostels for low-income and migrant workers
Increased maximum temperatures and frequency of heatwaves
26% of total cost Improved investment in Tamil Nadu’s shelter fund, improving thermal comfort conditions for migrant and working women. Assumes similar contribution to climate change finance as output 1.
Output 3: Regional planning
All climate risks 25% of total cost Improved regional planning can provide improved spatial planning and climate change risk guidelines that enhance future social housing projects.
Physical climate risk
Adaptation measures Indicative cost
Heavy p
recip
ita
tio
n a
nd f
loodin
g
Avoiding unsuitable cheaper land such as flood plains
N/A
Perimeter drainage solution, including Sustainable Urban Drainage Systems, swales and other attenuation systems
Swales about € 1,500 / 100m when constructed to 1500mm wide by 900mm deep in soft soils.
Permeable hard paving over landscaped areas and minimising non-permeable outside spaces, including the extensive use of green space
About € 70 – 90 / m2
Allowance for climate change in drainage network capacity
20 – 30% increase on attenuation costs
Damp proofing membrane (walls and floors); the use of dense materials for ground floor walls and condensation resistant constructions above ground cover (e.g., subfloor of damp resistant materials); and enhancing structural capacity.
Walls: € 0.50 per linear metre of 100mm wide polythene.
Floors: € 7.00 / m2 Visqueen over 300mm wide.
Raising services to 1m Above Finished Floor Level (e.g., electrical socket outlets).
N/A. No real cost in new-build.
Barrier construction, such as a wall or bank; or diversion of overflow.
For a barrier 1.5 to 2.0m high: Wall: € 3500 per linear metre; Bank: € 2000 to 4100 per linear metre depending on length and spread.
Changes to door thresholds to accept barrier and/or sandbags.
€ 2000 each doorset 980mm wide (based on anti-vandal).
Water resistant construction to foundations and footings (e.g., concrete additives, dense brick/block work, etc).
Additives: € 6.50 / m3 water repellent to basic concrete mix.
Extr
em
e
hig
h
tem
pera
tur
e e
vents
Shading in landscape (including natural shading) and building aspect and geometry (e.g., brise soleil, deep window reveals, “second skin” type structures creating shade or overhanging eaves)
Brise soleil € 170 per linear metre for 300mm deep aluminium louvres. Roof shade € 120 - 200 m2
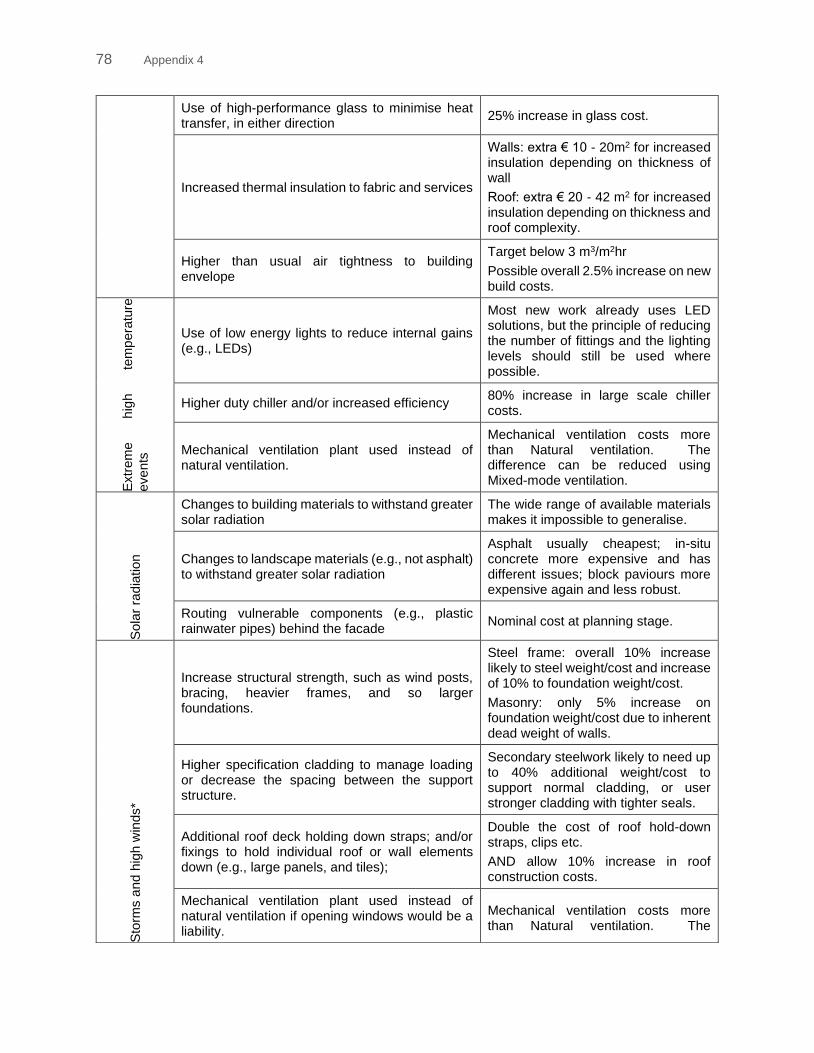
78 Appendix 4
Use of high-performance glass to minimise heat transfer, in either direction
25% increase in glass cost.
Increased thermal insulation to fabric and services
Walls: extra € 10 - 20m2 for increased insulation depending on thickness of wall
Roof: extra € 20 - 42 m2 for increased insulation depending on thickness and roof complexity.
Higher than usual air tightness to building envelope
Target below 3 m3/m2hr
Possible overall 2.5% increase on new build costs.
Extr
em
e
hig
h
tem
pera
ture
events
Use of low energy lights to reduce internal gains (e.g., LEDs)
Most new work already uses LED solutions, but the principle of reducing the number of fittings and the lighting levels should still be used where possible.
Higher duty chiller and/or increased efficiency 80% increase in large scale chiller costs.
Mechanical ventilation plant used instead of natural ventilation.
Mechanical ventilation costs more than Natural ventilation. The difference can be reduced using Mixed-mode ventilation.
Sola
r ra
dia
tion
Changes to building materials to withstand greater solar radiation
The wide range of available materials makes it impossible to generalise.
Changes to landscape materials (e.g., not asphalt) to withstand greater solar radiation
Asphalt usually cheapest; in-situ concrete more expensive and has different issues; block paviours more expensive again and less robust.
Routing vulnerable components (e.g., plastic rainwater pipes) behind the facade
Nominal cost at planning stage.
Sto
rms a
nd h
igh w
inds*
Increase structural strength, such as wind posts, bracing, heavier frames, and so larger foundations.
Steel frame: overall 10% increase likely to steel weight/cost and increase of 10% to foundation weight/cost.
Masonry: only 5% increase on foundation weight/cost due to inherent dead weight of walls.
Higher specification cladding to manage loading or decrease the spacing between the support structure.
Secondary steelwork likely to need up to 40% additional weight/cost to support normal cladding, or user stronger cladding with tighter seals.
Additional roof deck holding down straps; and/or fixings to hold individual roof or wall elements down (e.g., large panels, and tiles);
Double the cost of roof hold-down straps, clips etc.
AND allow 10% increase in roof construction costs.
Mechanical ventilation plant used instead of natural ventilation if opening windows would be a liability.
Mechanical ventilation costs more than Natural ventilation. The
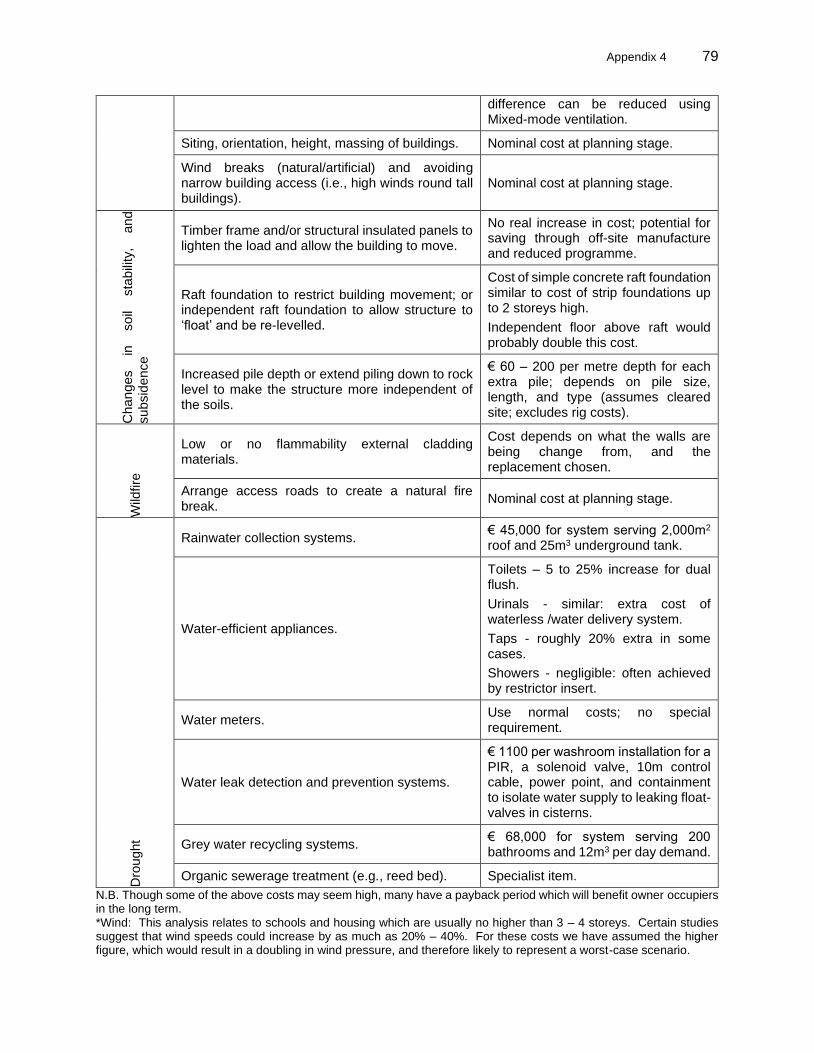
Appendix 4 79
N.B. Though some of the above costs may seem high, many have a payback period which will benefit owner occupiers in the long term. *Wind: This analysis relates to schools and housing which are usually no higher than 3 – 4 storeys. Certain studies suggest that wind speeds could increase by as much as 20% – 40%. For these costs we have assumed the higher figure, which would result in a doubling in wind pressure, and therefore likely to represent a worst-case scenario.
difference can be reduced using Mixed-mode ventilation.
Siting, orientation, height, massing of buildings. Nominal cost at planning stage.
Wind breaks (natural/artificial) and avoiding narrow building access (i.e., high winds round tall buildings).
Nominal cost at planning stage.
Chan
ges
in
so
il sta
bili
ty,
and
subsid
ence
Timber frame and/or structural insulated panels to lighten the load and allow the building to move.
No real increase in cost; potential for saving through off-site manufacture and reduced programme.
Raft foundation to restrict building movement; or independent raft foundation to allow structure to ‘float’ and be re-levelled.
Cost of simple concrete raft foundation similar to cost of strip foundations up to 2 storeys high.
Independent floor above raft would probably double this cost.
Increased pile depth or extend piling down to rock level to make the structure more independent of the soils.
€ 60 – 200 per metre depth for each extra pile; depends on pile size, length, and type (assumes cleared site; excludes rig costs).
Wild
fire
Low or no flammability external cladding materials.
Cost depends on what the walls are being change from, and the replacement chosen.
Arrange access roads to create a natural fire break.
Nominal cost at planning stage.
Dro
ught
Rainwater collection systems. € 45,000 for system serving 2,000m2 roof and 25m3 underground tank.
Water-efficient appliances.
Toilets – 5 to 25% increase for dual flush.
Urinals - similar: extra cost of waterless /water delivery system.
Taps - roughly 20% extra in some cases.
Showers - negligible: often achieved by restrictor insert.
Water meters. Use normal costs; no special requirement.
Water leak detection and prevention systems.
€ 1100 per washroom installation for a PIR, a solenoid valve, 10m control cable, power point, and containment to isolate water supply to leaking float-valves in cisterns.
Grey water recycling systems. € 68,000 for system serving 200 bathrooms and 12m3 per day demand.
Organic sewerage treatment (e.g., reed bed). Specialist item.

80 Appendix 4
All costs based on models created using Spons Measured Work price books, and other similarly sourced published information.
Related Documents


