Climate mitigation through efficiency in the road freight transport sector: vehicle approach and policy recommendations Jacques Leonardi Pedro J. Pérez- Martínez Transport Studies Group Christophe Rizet Dept. for Transport Economy and Sociology Roger W. Worth

Climate mitigation through efficiency in the road freight transport sector: vehicle approach and policy recommendations Jacques Leonardi Pedro J. Pérez-Martínez.
Dec 18, 2015
Welcome message from author
This document is posted to help you gain knowledge. Please leave a comment to let me know what you think about it! Share it to your friends and learn new things together.
Transcript
Climate mitigation through efficiency in the road freight
transport sector:
vehicle approach and policy recommendations
Jacques Leonardi Pedro J. Pérez-Martínez
Transport Studies Group
Christophe Rizet Dept. for Transport Economy and Sociology Roger W. Worth
Introduction and background
• Many open scientific questions and a wide debate on freight transport, energy and climate
• Domestic actions tackling climate change• Dualities that would have to be linked:
– Organisation and technology solutions– Impacts and measures– Survey methods and vehicles data– Company approach and policy approach– Decisions and limitations

Scientific questions
• How people behave with existing solutions?• What are the main barriers for an
implementation of mitigation strategies?• What could we suggest to overcome them?• A holistic approach is impossible
Define a feasible, pragmatic approach
Objectives of the vehicle approach
• to observe, quantify and understand energy consumption parameters and changes at a disaggregate vehicle level
• to understand how a behavioural change is leading to a net decrease in final energy use or CO2-emissions of the vehicle
• to understand how this change can be (potentially) supported by vehicle related measures taken by decision-makers in companies and in the public sector
Definition
The vehicle approach is:• Field oriented, but it needs modelisation to
start• Applying and defining survey methods• Looking to impacts on transport & energy
parameters• Using interviews, data collection and statistics
analysis
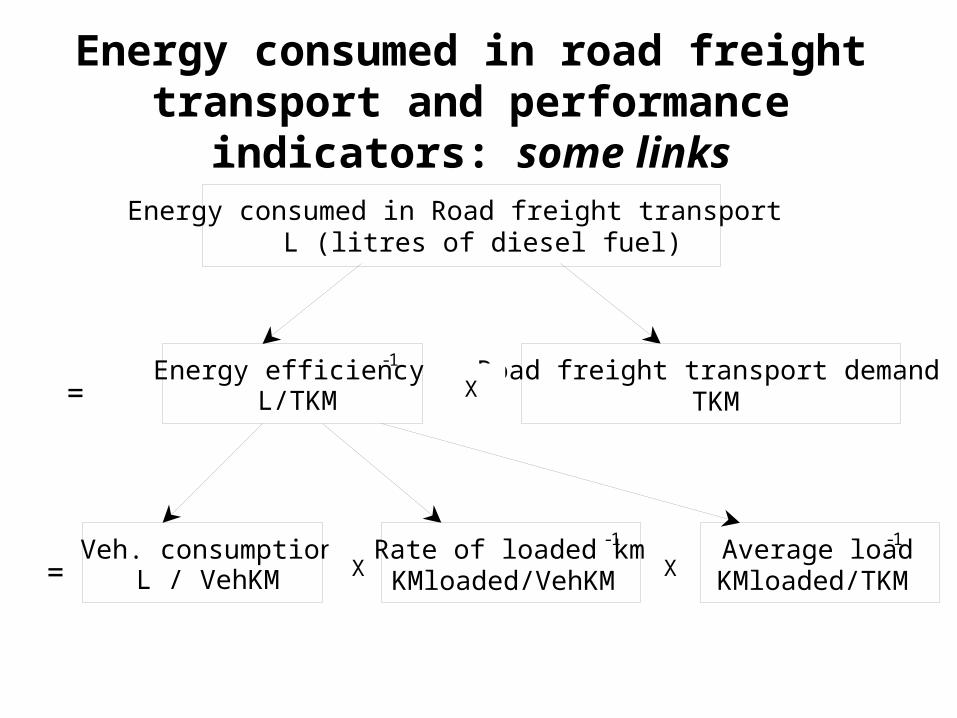
Energy consumed in road freight transport and performance indicators: some links
Energy efficiency-1 L/TKM
Energy consumed in Road freight transport L (litres of diesel fuel)
Road freight transport demand TKM X
Veh. consumption L / VehKM
Rate of loaded km-1 KMloaded/VehKM
Average load-1 KMloaded/TKM X X
=
=
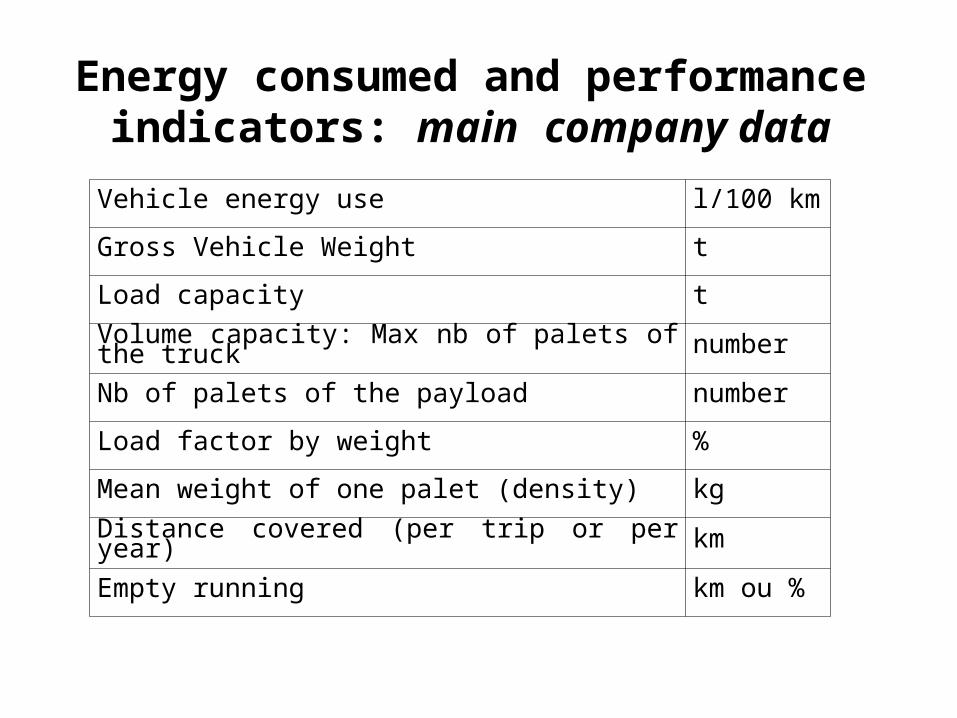
Energy consumed and performance indicators: main company data
Vehicle energy use l/100 km
Gross Vehicle Weight t
Load capacity t
Volume capacity: Max nb of palets of the truck number
Nb of palets of the payload number
Load factor by weight %
Mean weight of one palet (density) kg
Distance covered (per trip or per year) km
Empty running km ou %
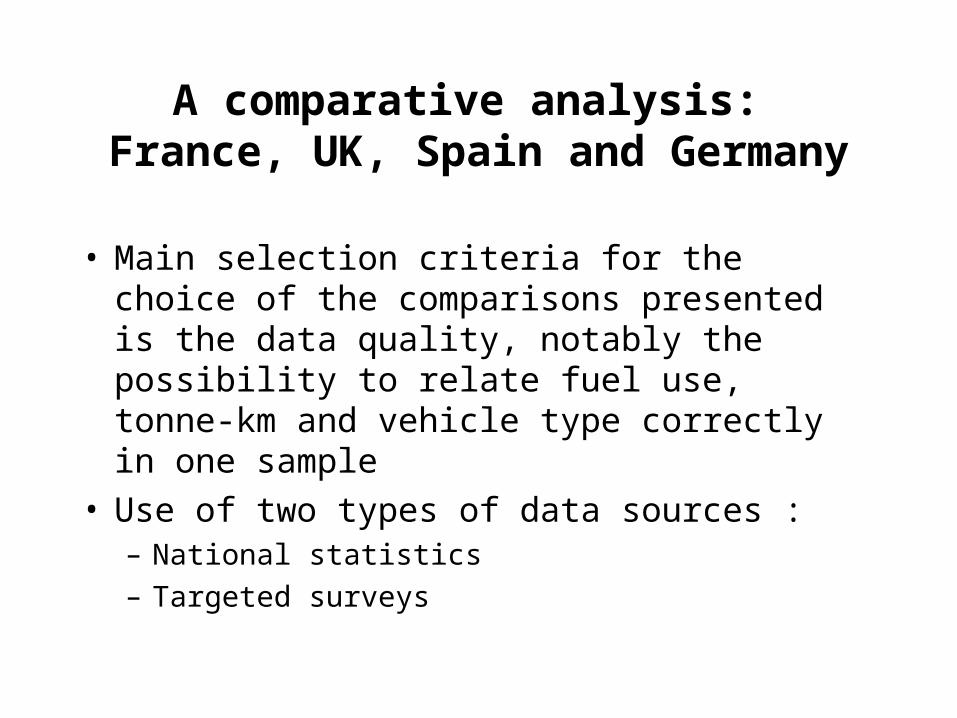
A comparative analysis: France, UK, Spain and Germany
• Main selection criteria for the choice of the comparisons presented is the data quality, notably the possibility to relate fuel use, tonne-km and vehicle type correctly in one sample
• Use of two types of data sources : – National statistics– Targeted surveys
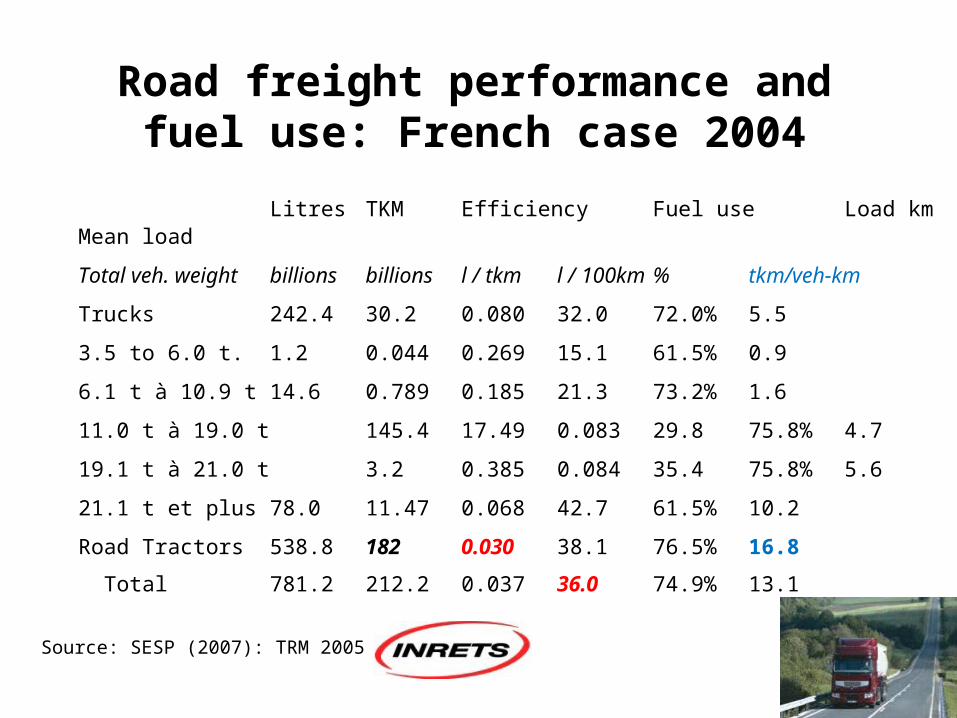
Litres TKM Efficiency Fuel use Load km Mean load
Total veh. weight billions billions l / tkm l / 100km % tkm/veh-km
Trucks 242.4 30.2 0.080 32.0 72.0% 5.5
3.5 to 6.0 t. 1.2 0.044 0.269 15.1 61.5% 0.9
6.1 t à 10.9 t 14.6 0.789 0.185 21.3 73.2% 1.6
11.0 t à 19.0 t 145.4 17.49 0.083 29.8 75.8% 4.7
19.1 t à 21.0 t 3.2 0.385 0.084 35.4 75.8% 5.6
21.1 t et plus 78.0 11.47 0.068 42.7 61.5% 10.2
Road Tractors 538.8 182 0.030 38.1 76.5% 16.8
Total 781.2 212.2 0.037 36.0 74.9% 13.1
Road freight performance and fuel use: French case 2004
Source: SESP (2007): TRM 2005
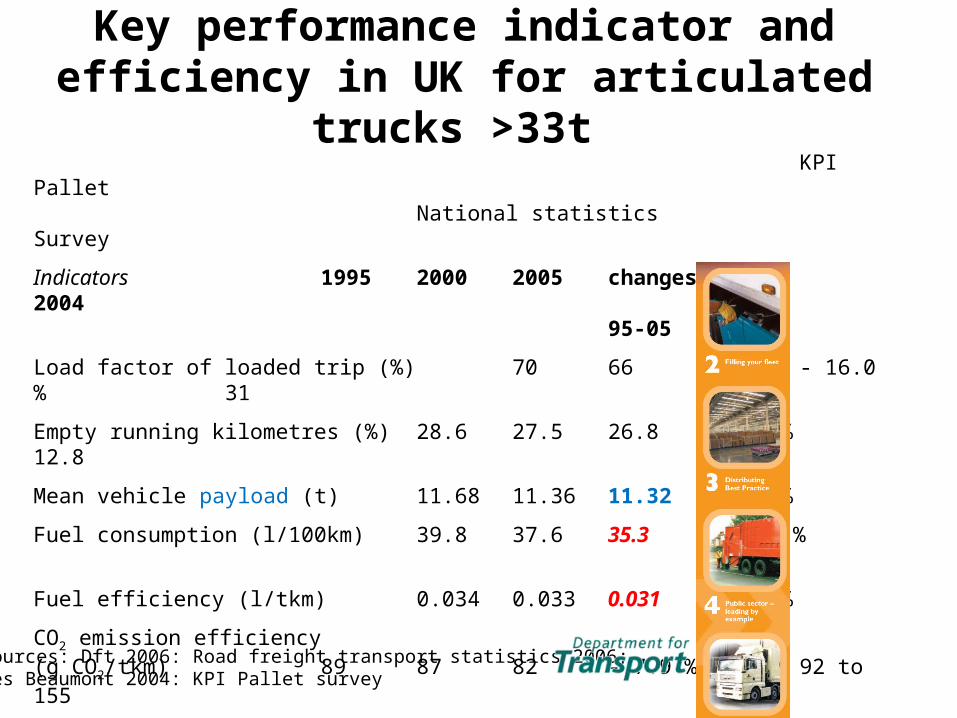
Key performance indicator and efficiency in UK for articulated trucks >33t
KPI Pallet National statistics Survey
Indicators 1995 2000 2005 changes 200495-05
Load factor of loaded trip (%) 70 66 59 - 16.0 % 31
Empty running kilometres (%) 28.6 27.5 26.8 - 6.3 % 12.8
Mean vehicle payload (t) 11.68 11.36 11.32 - 2.7 %
Fuel consumption (l/100km) 39.8 37.6 35.3 - 11.3 %
Fuel efficiency (l/tkm) 0.034 0.033 0.031 - 7.9 %
CO2 emission efficiency (g CO2/tkm) 89 87 82 - 7.9 % 92 to 155
Transport content (km/ton) 12.08 11.79 10.97 - 9.2 %
Mean length of haul (km per trip) 142 135 124 - 12.7 % 156
Sources: Dft 2006: Road freight transport statistics 2006; Les Beaumont 2004: KPI Pallet survey
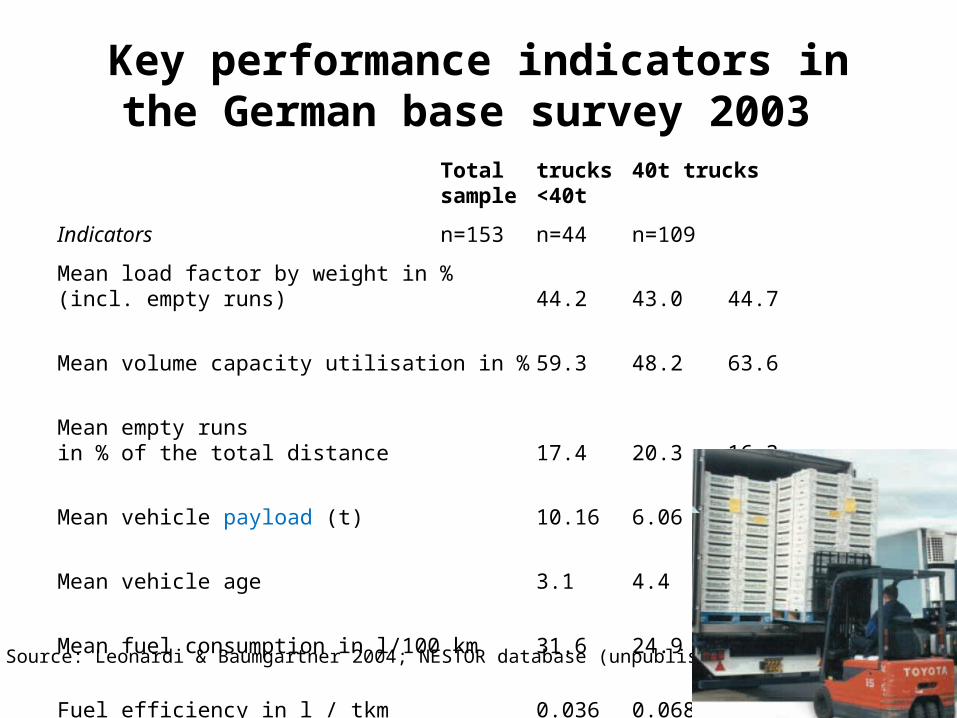
Total trucks 40t trucks sample <40t
Indicators n=153 n=44 n=109
Mean load factor by weight in % (incl. empty runs) 44.2 43.0 44.7
Mean volume capacity utilisation in % 59.3 48.2 63.6
Mean empty runs in % of the total distance 17.4 20.3 16.3
Mean vehicle payload (t) 10.16 6.06 11.01
Mean vehicle age 3.1 4.4 2.5
Mean fuel consumption in l/100 km 31.6 24.9 33.1
Fuel efficiency in l / tkm 0.036 0.068 0.030
CO2 efficiency in g CO2 /tkm (means) 96 181 80
Key performance indicators in the German base survey 2003
Source: Leonardi & Baumgartner 2004; NESTOR database (unpublished)
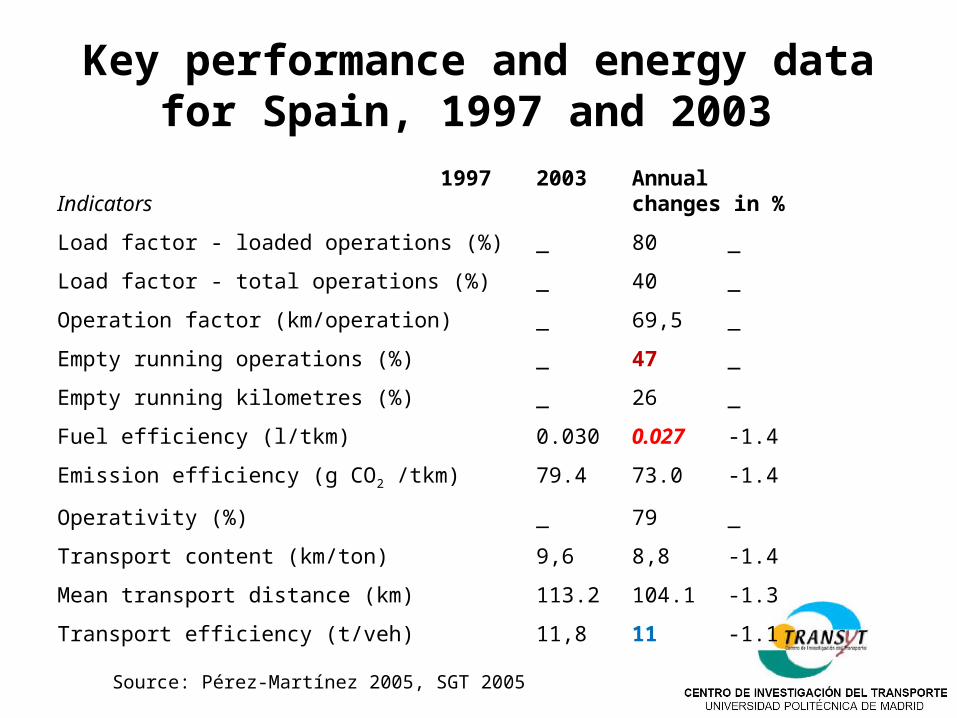
Key performance and energy data for Spain, 1997 and 2003
1997 2003 Annual Indicators changes in %
Load factor - loaded operations (%) _ 80 _
Load factor - total operations (%) _ 40 _
Operation factor (km/operation) _ 69,5 _
Empty running operations (%) _ 47 _
Empty running kilometres (%) _ 26 _
Fuel efficiency (l/tkm) 0.030 0.027 -1.4
Emission efficiency (g CO2 /tkm) 79.4 73.0 -1.4
Operativity (%) _ 79 _
Transport content (km/ton) 9,6 8,8 -1.4
Mean transport distance (km) 113.2 104.1 -1.3
Transport efficiency (t/veh) 11,8 11 -1.1
Source: Pérez-Martínez 2005, SGT 2005
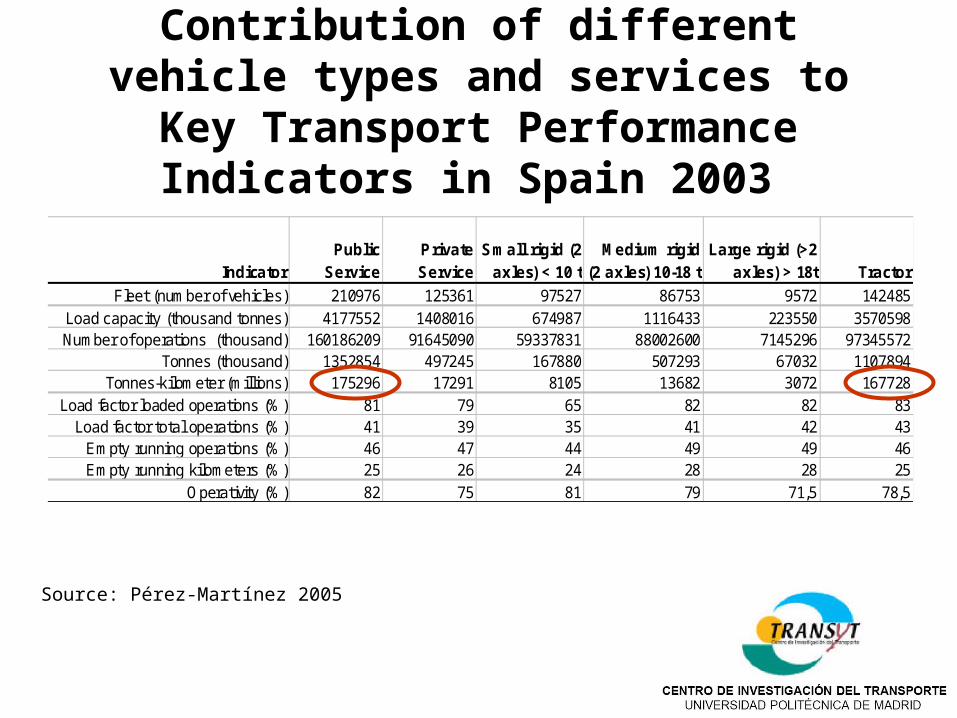
Type IndicatorPublic
ServicePrivate Service
Small rigid (2 axles) < 10 t
Medium rigid (2 axles) 10-18 t
Large rigid (>2 axles) > 18t Tractor
DI Fleet (number of vehicles) 210976 125361 97527 86753 9572 142485DI Load capacity (thousand tonnes) 4177552 1408016 674987 1116433 223550 3570598DI Number of operations (thousand) 160186209 91645090 59337831 88002600 7145296 97345572DI Tonnes (thousand) 1352854 497245 167880 507293 67032 1107894DI Tonnes-kilometer (millions) 175296 17291 8105 13682 3072 167728
KPI1 Load factor loaded operations (%) 81 79 65 82 82 83KPI1 Load factor total operations (%) 41 39 35 41 42 43KPI1 Empty running operations (%) 46 47 44 49 49 46KPI1 Empty running kilometers (%) 25 26 24 28 28 25KPI2 Operativity (%) 82 75 81 79 71,5 78,5
Contribution of different vehicle types and services to Key Transport
Performance Indicators in Spain 2003
Source: Pérez-Martínez 2005
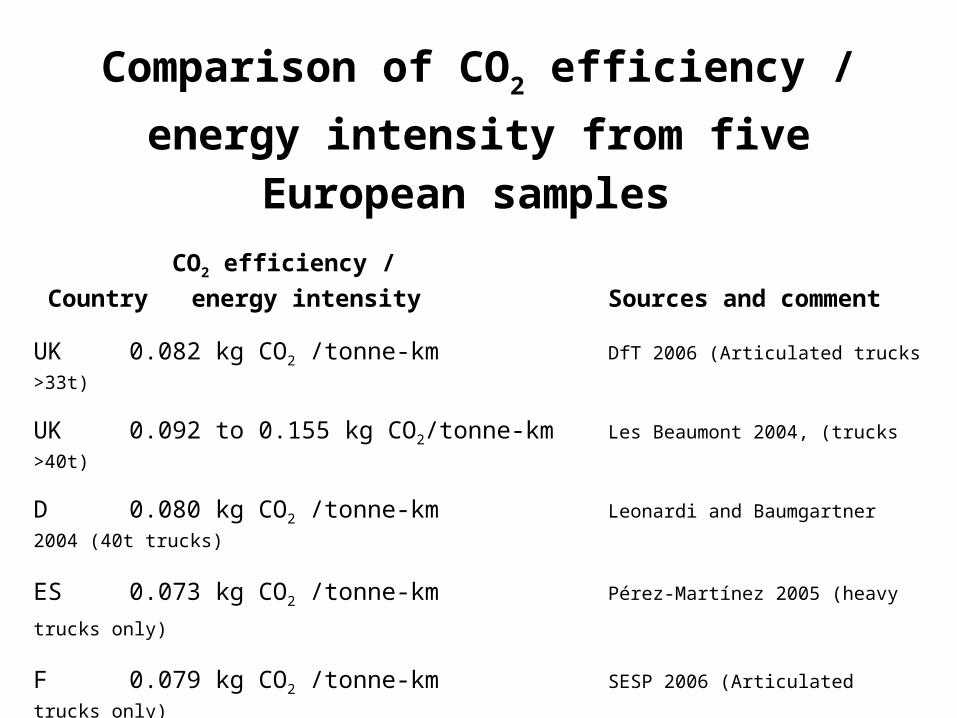
Comparison of CO2 efficiency / energy
intensity from five European samples
CO2 efficiency /
Country energy intensity Sources and comment
UK 0.082 kg CO2 /tonne-km DfT 2006 (Articulated trucks >33t)
UK 0.092 to 0.155 kg CO2/tonne-km Les Beaumont 2004, (trucks >40t)
D 0.080 kg CO2 /tonne-km Leonardi and Baumgartner 2004 (40t trucks)
ES 0.073 kg CO2 /tonne-km Pérez-Martínez 2005 (heavy trucks only)
F 0.079 kg CO2 /tonne-km SESP 2006 (Articulated trucks only)
Why these differences and similarities?
• Different transport patterns in the four countries?
• Different samples?• Different survey methods?
Transport, traffic and national business conditions
(typical logistics decision parameters)
• Commodity types• Type of transport operation • Trip distance • Fleet size and truck types • Driving conditions
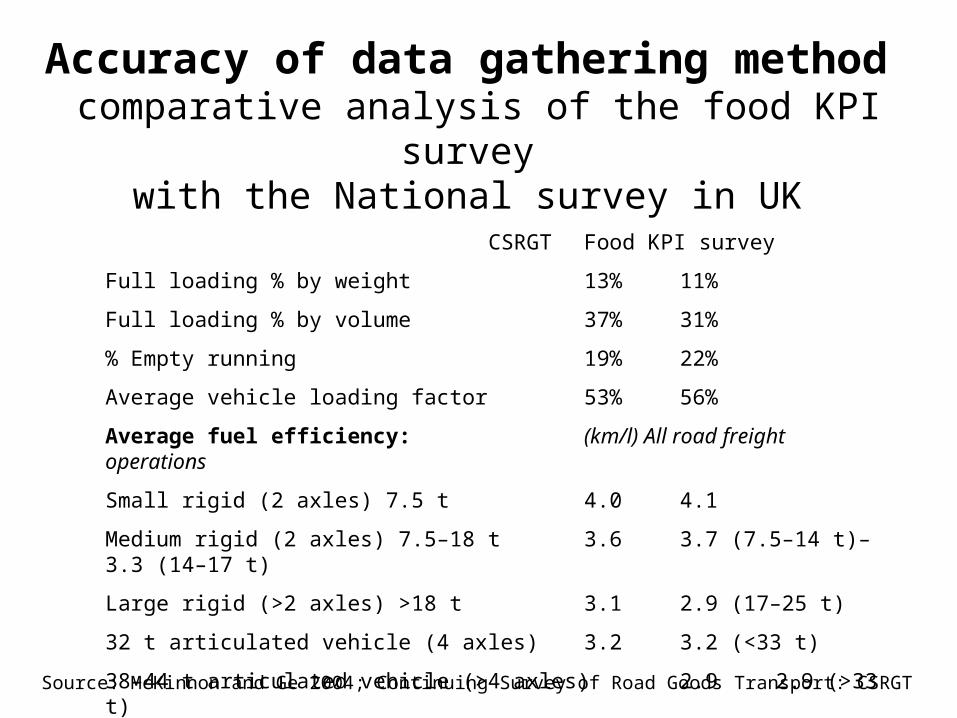
Accuracy of data gathering method comparative analysis of the food KPI survey
with the National survey in UK
CSRGT Food KPI survey
Full loading % by weight 13% 11%
Full loading % by volume 37% 31%
% Empty running 19% 22%
Average vehicle loading factor 53% 56%
Average fuel efficiency: (km/l) All road freight operations
Small rigid (2 axles) 7.5 t 4.0 4.1
Medium rigid (2 axles) 7.5–18 t 3.6 3.7 (7.5–14 t)–3.3 (14–17 t)
Large rigid (>2 axles) >18 t 3.1 2.9 (17–25 t)
32 t articulated vehicle (4 axles) 3.2 3.2 (<33 t)
38–44 t articulated vehicle (>4 axles) 2.9 2.9 (>33 t)
Source: McKinnon and Ge 2004; Continuing Survey of Road Goods Transport: CSRGT
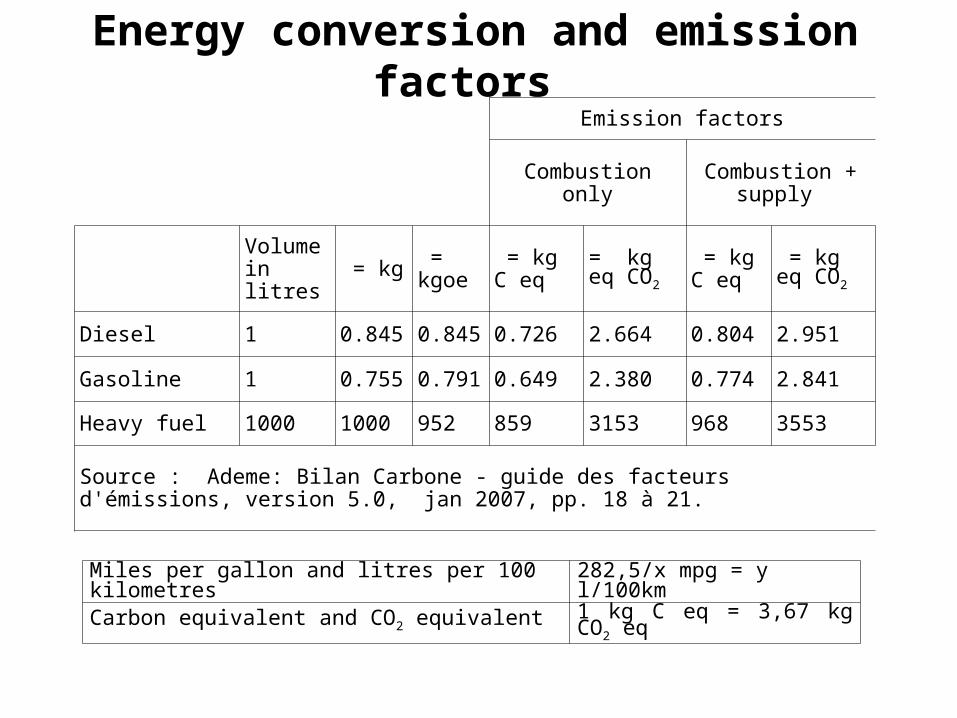
Energy conversion and emission factors Emission factors
Combustion only Combustion + supply
Volume in litres = kg =
kgoe = kg C eq
= kg eq CO2
= kg C eq
= kg eq CO2
Diesel 1 0.845 0.845 0.726 2.664 0.804 2.951
Gasoline 1 0.755 0.791 0.649 2.380 0.774 2.841
Heavy fuel 1000 1000 952 859 3153 968 3553
Source : Ademe: Bilan Carbone - guide des facteurs d'émissions, version 5.0, jan 2007, pp. 18 à 21.
Miles per gallon and litres per 100 kilometres 282,5/x mpg = y l/100km
Carbon equivalent and CO2 equivalent 1 kg C eq = 3,67 kg CO2 eq

Limitations
• Several limitations are hampering the quality of the comparative study
• The surveys were not designed for the purpose of this study, but were aiming at establishing other scientific results and reports
• in some cases, the efficiency indicator was build on original primary data from surveys, in other cases, on secondary, calculated data from at least two different sources

‘everything else remains stable’
• One central condition for scientific comparison is that ”..” excepting the differences in the objects of the analysis.
• This situation is not given, since business conditions and countries economies are changing from year to year.
• Therefore many external factors, not related to vehicles, and not mentioned in the explanations, could have been influencing the results: – Influence of cabotage, – logistics decision making and – other non technological factors
• discussed in McKinnon (2003)
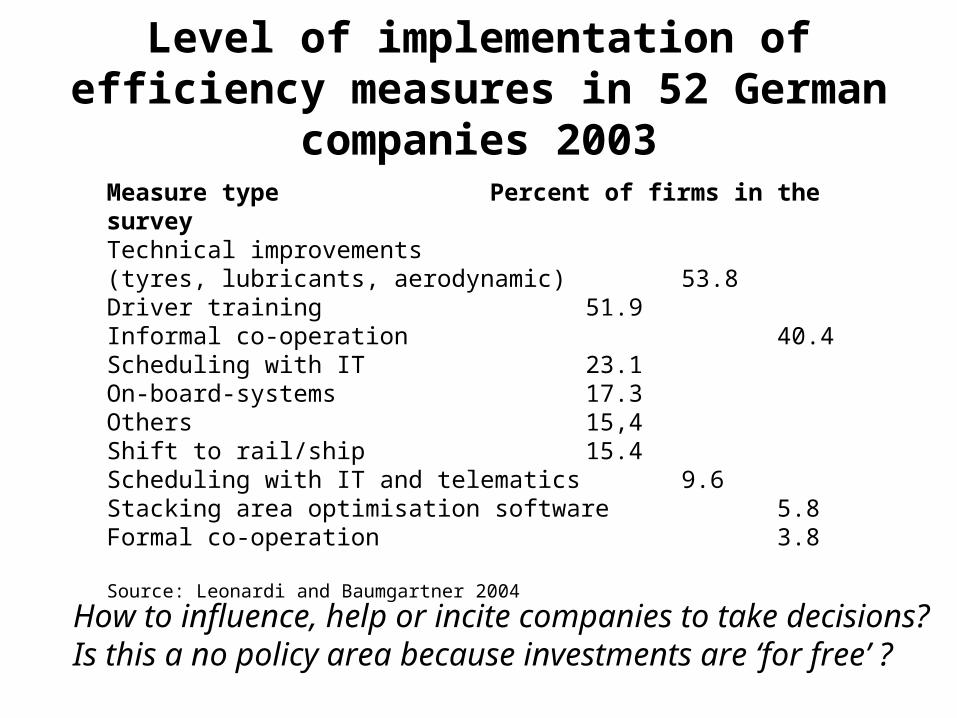
Measure type Percent of firms in the surveyTechnical improvements (tyres, lubricants, aerodynamic) 53.8Driver training 51.9Informal co-operation 40.4Scheduling with IT 23.1On-board-systems 17.3Others 15,4Shift to rail/ship 15.4Scheduling with IT and telematics 9.6Stacking area optimisation software 5.8Formal co-operation 3.8
Source: Leonardi and Baumgartner 2004
Level of implementation of efficiency measures in 52 German companies 2003
How to influence, help or incite companies to take decisions? Is this a no policy area because investments are ‘for free’ ?
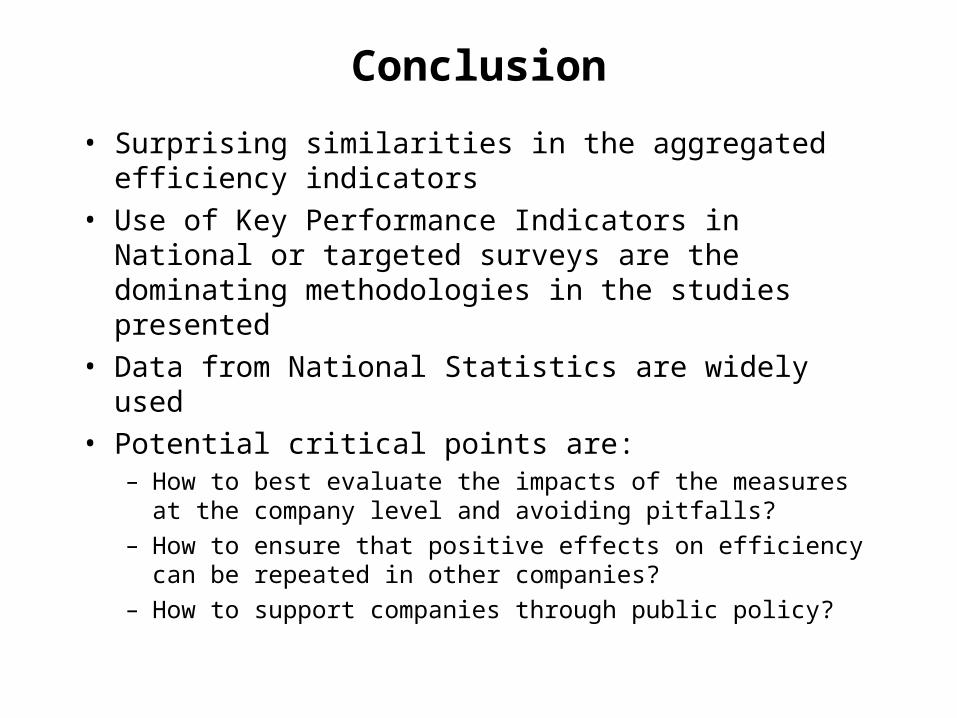
Conclusion
• Surprising similarities in the aggregated efficiency indicators
• Use of Key Performance Indicators in National or targeted surveys are the dominating methodologies in the studies presented
• Data from National Statistics are widely used• Potential critical points are:
– How to best evaluate the impacts of the measures at the company level and avoiding pitfalls?
– How to ensure that positive effects on efficiency can be repeated in other companies?
– How to support companies through public policy?
Related Documents


