CLIMATE RESEARCH Clim Res Vol. 35: 147–157, 2007 doi: 10.3354/cr00721 Published December 31 1. INTRODUCTION Over the past 2 decades spring temperature has increased in the Northern Hemisphere temperate regions (Trenberth et al. 2007). These ongoing global climate changes have disturbed usual phenological patterns of distribution and abundance of resources. Phenology of biological systems is the expression of selective pressures forcing organisms to match their energy requirements to seasonal variations in resource availability. There is already compelling evidence that plants and animals are affected by climate changes, particularly by modifying their phenological patterns (e.g. Myneni et al. 1997, Roy & Sparks 2000, Root et al. 2003, Cleland et al. 2006, Grosbois et al. 2006, Rivalan et al. 2007). For example, many bird species lay eggs earlier in spring to adapt to changes in prey pheno- logies (Crick et al. 1997, Crick & Sparks 1999, Both & © Inter-Research 2007 · www.int-res.com *Corresponding author. Email: [email protected] Climate changes and post-nuptial migration strategy by two reedbed passerines Guillaume Péron 1, 2 , Pierre-Yves Henry 1, 3 , Pascal Provost 4 , Olivier Dehorter 1 , Romain Julliard 1, * 1 UMR 5173 MNHN-CNRS-UPMC, Centre de Recherche sur la Biologie des Populations d’Oiseaux, CP51, 55 rue Buffon, 75005 Paris, France 2 UMR 5175, Centre d’Ecologie Fonctionnelle et Evolutive, Centre National de la Recherche Scientifique, 1919 route de Mende, 34293 Montpellier Cedex 5, France 3 UMR 7179 MNHN-CNRS, Département Ecologie et Gestion de la Biodiversité, Muséum National d’Histoire Naturelle, 1 avenue du Petit Château, 91800 Brunoy, France 4 Maison de l’Estuaire, Observatoire Avifaune de la ZPS Estuaire et Marais de la Basse Seine, Réserve Naturelle Nationale de l’Estuaire de la Seine, 20 rue Jean Caurret, 76600 Le Havre, France ABSTRACT: Phenology of biological systems is the expression of selective pressures forcing organ- isms to match their energy requirements to seasonal variations in resource availability. For long- distance migrant organisms, migration strategy is shaped by the availability and quality of stopovers during a precise time period. Ongoing climate changes alter the usual spatial and temporal distribu- tion of resources, and, as a result, migrant species return earlier to their breeding grounds. Less is known on the evolution and determinants of timing of departure to wintering grounds, i.e. post- breeding migration. We analysed timing of post-nuptial migration and stopover strategy with cap- ture–mark–recapture (CMR) data in 2 reedbed insectivorous passerines: the sedge warbler Acro- cephalus schoenobaenus, specialised on a thermo-dependant prey, and the generalist reed warbler A. scirpaceus. Spring temperatures increased through years (0.16 ± 0.047°C yr –1 ), and studied species migrated earlier in recent years (–0.73 ± 0.086 d yr –1 ). Autumnal migration phenology was negatively related to spring (March) temperature (–2.54 ± 0.19 d °C –1 ), whereas it was not related to autumnal temperatures. We suggest that this results from a major time shift (i.e. advance) in biomass produc- tion caused by global warming. Stopover duration (estimated by CMR analysis) was positively related to body mass gain, with a trend for a stronger effect in the specialised species. However, nei- ther stopover duration nor body mass gain were related to spring temperature, suggesting that the advance in migration timing efficiently adapted bird phenology to temporal variations in resources. KEY WORDS: Climate change · Stopover duration · Optimal migration · Acrocephalus scirpaceus · Acrocephalus schoenobaenus · Capture–Mark–Recapture Resale or republication not permitted without written consent of the publisher OPEN PEN ACCESS CCESS

Welcome message from author
This document is posted to help you gain knowledge. Please leave a comment to let me know what you think about it! Share it to your friends and learn new things together.
Transcript
CLIMATE RESEARCHClim Res
Vol. 35: 147–157, 2007doi: 10.3354/cr00721
Published December 31
1. INTRODUCTION
Over the past 2 decades spring temperature hasincreased in the Northern Hemisphere temperateregions (Trenberth et al. 2007). These ongoing globalclimate changes have disturbed usual phenologicalpatterns of distribution and abundance of resources.Phenology of biological systems is the expression ofselective pressures forcing organisms to match their
energy requirements to seasonal variations in resourceavailability. There is already compelling evidence thatplants and animals are affected by climate changes,particularly by modifying their phenological patterns(e.g. Myneni et al. 1997, Roy & Sparks 2000, Root et al.2003, Cleland et al. 2006, Grosbois et al. 2006, Rivalanet al. 2007). For example, many bird species lay eggsearlier in spring to adapt to changes in prey pheno-logies (Crick et al. 1997, Crick & Sparks 1999, Both &
© Inter-Research 2007 · www.int-res.com*Corresponding author. Email: [email protected]
Climate changes and post-nuptial migrationstrategy by two reedbed passerines
Guillaume Péron1, 2, Pierre-Yves Henry1, 3, Pascal Provost4, Olivier Dehorter1, Romain Julliard1,*
1UMR 5173 MNHN-CNRS-UPMC, Centre de Recherche sur la Biologie des Populations d’Oiseaux, CP51, 55 rue Buffon, 75005 Paris, France
2UMR 5175, Centre d’Ecologie Fonctionnelle et Evolutive, Centre National de la Recherche Scientifique, 1919 route de Mende, 34293 Montpellier Cedex 5, France
3UMR 7179 MNHN-CNRS, Département Ecologie et Gestion de la Biodiversité, Muséum National d’Histoire Naturelle, 1 avenue du Petit Château, 91800 Brunoy, France
4Maison de l’Estuaire, Observatoire Avifaune de la ZPS Estuaire et Marais de la Basse Seine, Réserve Naturelle Nationale de l’Estuaire de la Seine, 20 rue Jean Caurret, 76600 Le Havre, France
ABSTRACT: Phenology of biological systems is the expression of selective pressures forcing organ-isms to match their energy requirements to seasonal variations in resource availability. For long-distance migrant organisms, migration strategy is shaped by the availability and quality of stopoversduring a precise time period. Ongoing climate changes alter the usual spatial and temporal distribu-tion of resources, and, as a result, migrant species return earlier to their breeding grounds. Less isknown on the evolution and determinants of timing of departure to wintering grounds, i.e. post-breeding migration. We analysed timing of post-nuptial migration and stopover strategy with cap-ture–mark–recapture (CMR) data in 2 reedbed insectivorous passerines: the sedge warbler Acro-cephalus schoenobaenus, specialised on a thermo-dependant prey, and the generalist reed warblerA. scirpaceus. Spring temperatures increased through years (0.16 ± 0.047°C yr–1), and studied speciesmigrated earlier in recent years (–0.73 ± 0.086 d yr–1). Autumnal migration phenology was negativelyrelated to spring (March) temperature (–2.54 ± 0.19 d °C–1), whereas it was not related to autumnaltemperatures. We suggest that this results from a major time shift (i.e. advance) in biomass produc-tion caused by global warming. Stopover duration (estimated by CMR analysis) was positivelyrelated to body mass gain, with a trend for a stronger effect in the specialised species. However, nei-ther stopover duration nor body mass gain were related to spring temperature, suggesting that theadvance in migration timing efficiently adapted bird phenology to temporal variations in resources.
KEY WORDS: Climate change · Stopover duration · Optimal migration · Acrocephalus scirpaceus ·Acrocephalus schoenobaenus · Capture–Mark–Recapture
Resale or republication not permitted without written consent of the publisher
OPENPEN ACCESSCCESS

Clim Res 35: 147–157, 2007
Visser 2001, Both et al. 2005). As migration dates aremost likely plastically adjusted to experienced envi-ronmental conditions, rapid adjustments of migrationphenology to changing environmental conditions areexpected. Rapid changes of migration timing werequantified from spring phenology of long-distancemigrants (Lehikoinen et al. 2004, Jonzén et al. 2006,Rubolini et al. 2007, this issue, and references therein).Furthermore, since migration date also has a geneticbasis (Møller 2001), climate change could induce aheritable, evolutionary response of migration timing.
There is less information available on the impact ofclimate change on the timing and ecology of autumnal,post-nuptial migration (Gatter 1992, Sokolov et al.1999, Sparks & Braslavska 2001, Cotton 2003, Jenni &Kéry 2003, Lehikoinen et al. 2004, Gordo & Sanz 2006,Sokolov 2006). Every possible pattern of change ofpost-breeding migration timing (no change, laterdeparture date, earlier departure date) has beenreported (e.g. Lehikoinen et al. 2004). Inter-annualvariation in post-breeding behaviour seems to dependon ecology and life-history traits of bird species. Forinstance, short-distance migrants and species withvariable reproductive effort left later in recent warmeryears (Jenni & Kéry 2003), suggesting that these spe-cies possibly benefit from climate warming throughincreased reproductive effort. Some species adjust thechoice of their wintering ground to new temperatureconditions (Austin & Rehfisch 2005, Rivalan et al.2007), or increase the time spent on their breedinggrounds (Gordo & Sanz 2006). On the opposite hand,among long-distance migrants, the date of departurefrom breeding grounds decreased throughout the 20thcentury, but this relationship is controversial: althoughseveral studies report earlier departure of some long-distance migrants in recent warmer years, most foundthat migrants did not change or even delayed theirdeparture date (review in Lehikoinen et al. 2004,Sokolov 2006). Response of migrant birds to warmer,longer autumn is hence contrasted. Few studiesanalysed the effect of temperature, and, among thosethat did, most attempted to correlate autumnal migra-tion timing to temperatures in autumn or during thebreeding season (e.g. Gordo & Sanz 2006). However,spring temperatures are likely a better determinant ofautumnal migration timing than summer or autumnaltemperatures (Sokolov et al. 1999, Sokolov 2006) under2 main hypotheses that we will develop in the presentstudy: (1) fitness benefits from early arrival at winter-ing grounds and (2) a temporal constraint results fromthe phenology of food availability at stopover sites.
The first objective of this study was to test foran advance in post-breeding migration date and, iffound, to determine which temperatures from spring orautumn were the best predictors. The second objective
was to test the 2 hypotheses that explain why birds donot take advantage of climate change to spend moretime on the breeding grounds and eventually lay moreclutches. The third objective was to address whichpatterns of phenotypic plasticity and/or natural selec-tion are most likely to explain the observed temporalchanges in migration phenology, under the assumptionthat if plasticity is mainly involved, the observedchanges in stopover ecology should be better ex-plained by a physical explanatory variable, such astemperature, than by a linear year effect (Jonzén et al.2006).
These predictions were explored by correlativeanalysis of the effects of monthly mean temperatureson post-breeding migration timing in 2 trans-Saharanmigrant birds: the sedge warbler Acrocephalusschoenobaenus (SW) and the reed warbler A. scirpa-ceus (RW). SW diet during post-breeding migration ismainly composed of reed aphids Hyalopterus pruni(Bibby & Green 1981), whereas RW is a generalistinsectivore (Bibby & Green 1981, Idrissi et al. 2004).These inter-specific diet differences are used hereafterto discriminate the 2 hypotheses about which mecha-nisms select for advanced migration in response towarmer years. We acknowledge that no causal rela-tionship between diet and behaviour can be formallytested in the present study. Experimental manipula-tions of food availability and/or comparative analysisinvolving more species would be required to validatethe interpretations of correlative results proposedhereafter.
In the first hypothesis, early arrival at winteringgrounds increases fitness, possibly through acquisitionof a better wintering territory (Marra et al. 1998,Salewski et al. 2002, Studds & Marra 2007, this issue).As long-distance migrants arrive earlier at their breed-ing grounds, and breed earlier, in warmer springs(likely for RW, Bergmann 1999, Crick & Sparks 1999,Schaefer et al. 2005, and, for SW, Crick & Sparks 1999;demonstrated for numerous other Palearctic insectivo-rous passerine migrants: Jonzén et al. 2006), migrantsshould also depart earlier in autumn, once breeding isachieved, in order to reach their wintering grounds assoon as possible. In this hypothesis, timing of autumnalmigration should be at least partly, if not mainly, deter-mined by spring temperatures, and both studied spe-cies should migrate earlier in autumns following warmsprings. This is analogue to a complete time shift in theannual life cycle of long-distance migrants (Cotton2003, and see Fig. 2 in Gordo 2007, this issue).
In the second hypothesis, timing of autumn migra-tion is determined by availability of food resources enroute. In this hypothesis, the birds are constrained totrack the changes in the phenology of their insect prey.Following Bibby & Green (1981), we suppose that
148
Péron et al.: Climate changes and post-breeding migration
warmer springs induce earlier appearance of the aphidabundance peak in autumn, because all primary pro-duction (Cleland et al. 2006) and hence secondary pro-duction is advanced by warmer springs. The constraintis then stronger for SW (the aphid specialist) becauseaphid populations are characterised by a short periodof availability. Hence, under this hypothesis, SWshould depart breeding grounds earlier in warmeryears to track resource availability at stopover sites,and onset of its migration should be correlated tospring temperatures. Because of its generalist diet, RWshould be less affected by among-year variations instopover condition, and its migration timing should notcorrelate to spring temperatures. In terms of predic-tions, the second hypothesis predicts that spring tem-perature will correlate to migration timing in SW only,or at least more strongly in SW, whereas the firsthypothesis predicts no interaction between speciesand temperature. In both hypotheses, we furthermorecompared the effects of temperature and year to deter-mine the extent to which plasticity is involved (Jonzénet al. 2006), and evaluated the extent to which a warmautumn can release the constraint by comparing mod-els in which spring and autumn temperatures interact.
To further investigate response of these 2 migrants toa changing stopover environment, we estimated 2other variables of the stopover ecology: stopover dura-tion (SOD) and daily mass gain (DMG). These 2 vari-ables are linked in the frame of optimal migrationtheory (OMT; Alerstam & Lindström 1990). Intuitively,the higher the food availability, the quicker birdsfatten, and the quicker they leave the stopover site.However, OMT predicts the opposite pattern: indi-viduals should continue to store fat as long as the DMGat the site is higher than the average expected DMG atforthcoming sites, further south in the case of post-breeding migration of RW and SW (Bibby & Green1981, Alerstam & Lindström 1990, Hedenström et al.2007, this issue). This strategy should be stronger inSW: if the populations of aphids peak during a specifictime frame that is linked with spring temperature, SWthat encounter high food availability should not movefurther south, where the resource is likely to alreadybe scarce; whereas, for RW, the constraint is weakerbecause they rely on a broader spectrum of foodresources likely to be more uniformly distributed alongtheir migration route (Bibby & Green 1981, Schaub &Jenni 2001, Idrissi et al. 2004). The prediction is thenthat variation in site quality (as experienced by thebirds at the time they stop at the site), quantified by aproxy (daily DMG), will correlate more strongly tostopover duration for SW than for RW. This predictionis likely to be impacted by climate change if migrantsdo not efficiently track the changes in their en routefood resource phenology: if migrants arrive at stopover
sites after the abundance peak of their prey, we predicta decrease in DMG and in SOD, particularly for SW(the aphid specialist); however, if the advance inmigration timing is sufficient, there should be no suchdecrease because the experienced food availabilitydoes not change.
2. METHODS
2.1. Study species
Acrocephalus schoenobaenus (SW) and A. scirpaceus(RW) are small (10 to 14 g in the breeding season), in-sectivorous passerines breeding in wetlands of thePalearctic. The populations concerned in the presentstudy breed in north-western Europe. They migratethrough coastal western France from late July to lateSeptember and stopover essentially in reedbeds. Theirwinter quarters are located in sub-Saharan Africa, wherethey occupy grasslands and wetlands (Cramp 1992).
2.2. Data collection
Reedbed passerines post-nuptial migration wasmonitored by capture–mark–recapture (CMR), usingmist-nets, at 3 sites that represent the most importantreedbeds in coastal western France: Marais duHode (Site S76: Seine river estuary, 49° 27’ N, 0° 26’ E;19 912 SW and 31 864 RW between 1983 and 2005;stopover analysis was performed from 1994 onward be-cause recaptures were too few in earlier years), Etang deTrunvel (Site S29: Audierne’s Bay, 47° 55’ N, 04° 19’ W;33 271 SW and 13 416 RW between 1994 and 2005;Bargain et al. 2002) and Île du Massereau (Site S44:Loire river estuary, 47° 14’ N, 01° 55’ W; 37 208 SW and21 409 RW between 1994 and 2006; Caillat et al. 2005).
At S76, capture sessions lasted 16 d on average (SD =7.0) in the period from 1 August to 5 September. Cap-ture dates (i.e. dates at which nets were opened)advanced with years (–0.58 ± 0.077 [SE] d yr–1, r2 =0.74, p < 0.01), with the mean capture date on 22August (SD = 4.0). At S44, capture sessions lasted 46 don average (SD = 15) between 15 July and 15 Septen-ber. Capture sessions were earlier in recent years(–1.13 ± 0.30 [SE] d yr–1, r2 = 0.55, p < 0.01), with themean capture date on 18 August (SD = 5.9). At S29,capture sessions lasted 50 d on average (SD = 9.6)between 15 July and 15 September. Capture sessiondates were similar through years (p > 0.5), with themean capture date on 16 August (SD = 2.1). The catch-ing effort per day, i.e. number of mist-nets and dura-tion of CMR sessions in days, varied within and amongyears. The dependent variable used to quantify the
149
Clim Res 35: 147–157, 2007
migration flux per species was therefore a captureindex, noted Np and computed as the number of indi-viduals captured per meter of net per day.
Temperature data were obtained from the MeteoFrance stations of Cap de la Hève (49° 30’ 36’’ N,0° 04’ 12’’ E) for S76, Pointe de Pen Marc’h (47° 47’ 48’’ N,4° 22’ 24’’ W) for S29, and Saint-Nazaire Montoir(47° 19’ 00’’ N, 2° 10’ 00’’ W) for S44. Monthly means(computed from daily means) are hereafter referredto as Ti standing for temperature in the i th month.Temporal trends on monthly mean temperatures weretested with linear regressions.
2.3. Data analysis
2.3.1. Migration phenology, peak dates andcorrelations with temperature
Timing of migration was characterised each year forSite S76 by the migration peak dates, i.e. the estimateddates at which Np was maximum. The trapped birdswere most likely heterogeneous in origin, age andquality; hence multimodality in the abundance patterncould be expected. However, visual examination of thedata reveals that 1 mode of Np dominated. A modellingmethod assuming unimodality thus seemed reasonableto extract the main information on timing of migration.The variation in session durations and dates madenecessary the use of a method able to estimate peakdate even if the peak occurred outside of one givencapture session. For this purpose, 3 alternative non-linear models were fitted to daily Np data, with theleast-squares method. We have used the followingparametric functions (where t is the time in days and a,b and c are the parameters to be estimated):
ƒ(x) = ax2e–x2, where x = (t – b )/c (1)ƒ(x) = (ae–x)/(1+ e–x)2, where x = (t – b )/c (2)ƒ(t) = at2 + bt + c (3)
(t varying between 1 [1 August] and 36 [5 September]).These functions were considered as possible forms of theabundance curve of the species: Function (1) is asym-metrical with post-peak abundance decreasing moreslowly than it increased before peak abundance; Func-tion (2) models a narrow window of high abundance,with few early and late-migrating individuals; andFunction (3) models a parabolic curve of abundance.Separately for each year and for each species, we used,among the 3 models, the one with the lowest deviance tocompute the date of maximum Np (and associated SE). Ifthe computation process failed for all 3 models for agiven species-year dataset, indicating inappropriate fit ofall the models to the data, then no estimate of peak datewas available for subsequent analyses.
Theoretically, the above-described method correctlyestimated peak dates, even outside of the capturesession. To check for the robustness of peak dateestimates, we generated 3 simulated datasets, withthe migration peak dateset on 5, 17 and 28 August,and a random, normally distributed error with stan-dard deviation taken as the maximum Np /10. Thesesimulated datasets were analysed through the same3 models and with the same dates of capture as thereal dataset. Each of the 3 simulations was repeated10 times.
Estimated migration peak dates per species and peryear were then used as dependent variables in a linearregression analysis to identify the best predictors ofobserved among-year variations in migration timing.The accurateness of peak date estimates was ac-counted for by including 1/SE2 as a weight of thedependent variable in the regression. Explanatoryvariables were: species (Sp, 2 modalities), year (Y,taken as a continuous variable), monthly mean tem-peratures at the given site (Ti for temperature in the i thmonth, i varying between 02 for February to 09 forSeptember). Preliminary to formal analysis, we testedfor a linear temporal change in migration peak datethroughout the study period for each species, whichcould be taken as indicative of a possible effect of cli-mate change. Afterward, the analysis relied on aninformation theoretic approach (Burnham & Anderson2002), where the influence of effects on migration peakdate was evaluated by multimodel inference. Torestrict the number of candidate models to its mini-mum, models that were a priori biologically meaning-less and models with interactions involving 3 terms ormore were not considered. Step 1 of the selection pro-cedure was the model with a linear effect of year only.We then compared this model with the model includ-ing temperature as an explanatory variable. Step 2 wasthen the exploratory analysis of the effect of tempera-ture in different months of the year on migration peakdate. Because of the lack of strong prior knowledge onwhich temperature should be most influential, we hadto consider a relatively high number of models: 8 mod-els of the form Sp × Ti. Tj hereafter refers to the besttemperature as selected by this procedure. We com-pared the model Sp × Tj and the model with a temporaltrend to evaluate if temperature was a better predictorof temporal changes than a simple directional changethroughout the study period. Our model selection pro-cedure then followed 4 more steps (1 model per step).Step 3: the interaction Sp × Tj was removed to deter-mine if the effect of temperature differed among spe-cies. Step 4: interaction terms among spring andautumn temperature effects were added to assess thepossible interplay of spring and autumnal tempera-ture. If a spring temperature was selected as the best
150
Péron et al.: Climate changes and post-breeding migration
predictor, the interaction with the temperature at thetime of capture (August) was added to the model; ifAugust temperature was selected, we added the inter-action with all spring temperatures. Step 5: a lineareffect of year was added to the selected temperatureeffect to evaluate if plastic adaptation alone (no effectof year) to temperature is the main mechanismexplaining the observed change in migration peakdate, or if directional natural selection was also likelyto have a role (effect of year; cf. prediction from Jonzénet al. 2007 Section 1, this issue). Finally, in Step 6, wecompared our final model to the model with the meancapture date as a unique explanatory variable. Thisallowed us to check whether biological determinantsof the temporal change in migration peak date werenot confounded by the possible methodological biasdue to among-year changes in capture session dates.At each step, the best model was identified as the onewith the lowest AIC (Akaike’s information criterion),with a 2 point AIC difference when compared to othermodels (Burnham & Anderson 1998). When models dif-fered by <2 points of AIC, their respective probabilitywas assessed by Akaike’s weight wi; wi gives the prob-ability that a model is the real model, given the dataand given that the real model is among those includedin the model selection (Burnham & Anderson 1998,p. 124). At the end of this procedure, estimates andstandard deviations of the slopes were presented. Theinfluence of effects of interest is evaluated withAkaike’s weights. Goodness of fit (GOF) was assessedby testing the normality of residuals of the best modelwith a Shapiro-Wilk test and through the dispersioncoefficient (residual deviance/residual degree of free-dom). All analyses were performed with R (R CoreDevelopment Team 2005).
2.3.2. Stopover duration, body mass gain andcorrelates
Average stopover durations per species per year persite were estimated with the software SODA 2.1.2(Schaub et al. 2001). This CMR modelling of stopoverdata is advantageous because it gives access to the‘true’ stopover duration, i.e. estimating the total timespent at the stopover site by summing estimates of thetime spent at the site before (since arrival) and after(up to departure) the first capture, while it adjusts SODestimates for potentially confounding variations in cap-ture probability (hereafter noted P ). Thus, it providesrobust, daily, local survival (hereafter noted Φ; Lebre-ton et al. 1992) and SOD estimates. Note that theSODA method assumes that the stopover duration isconstant among birds (within seasons). Efford (2005)suggested that stopover duration may indeed vary
among individuals, following a Poisson distribution. Inthis case, SODA estimates are shown to be twice thereal SOD, and the average time of survival after firstcapture is a better estimate of the average SOD thanSODA estimates. In the present study, we chose to relyon SODA and not on ‘local survival’ analysis for 3 rea-sons. (1) According to what is known about behav-ioural and meteorological determinants of migrationwaves in small passerines (in Pradel et al. 2005), SODis likely to be closer to constancy among birds ratherthan to following a Poisson distribution (Efford 2005);thus SODA seems likely to perform better than Efford’smethod in a wider range of situations. (2) No statisticalmethod allows us to identify the true distribution ofSOD (Pradel et al. 2005); thus, in our case, nothing sup-ports that the ‘life expectancy’ parameter (Efford 2005)would be a better approximation of SOD than SODAestimates. (3) Our parameter of interest is the SOD, i.e.the resultant of both immigration and emigration prob-abilities (as modelled by SODA), and not only the emi-gration part of the SOD strategy (Efford 2005). Notethat no CMR method can account for the likely depen-dency of the emigration probability on the time spentat a stopover site. This is a major caveat of SODapproaches with CMR data, indicating that all studies,including ours, are to be considered exploratory(Pradel et al. 2005).
GOF was tested with the software U-Care 2.2.3(Choquet et al. 2005) for the model [Φ(species × site ×year × t), P(species × site × year × t)] to detect transients(Test 3.SR) and trap dependence (Test 3.CT). Overdis-persion was tested using the overall test computedfrom the 4 components. Afterward, for the sake of sim-plicity, daily local survival was assumed to be constantwithin years, but varied across years, site and species,and recapture probability was assumed to vary amongdays and among years {model [Φ(species × site × year),P(species × site × year × t)]}.
DMG was calculated for individuals that were cap-tured more than once during a single migration period.DMG is the difference in body mass divided by thenumber of days between 2 consecutive capture events(in g d–1; averaged per individual if >1 recapture eventwas available).
Estimates of SOD per species, per site and per yearwere then used as dependent variables in a linearregression analysis based on model selection (sameprocedure and criteria as for the migration peak dateanalysis). The accurateness of SOD estimates wasaccounted for by including 1/SD2 as a weight of thedependent variable in the regression. In a first step, wecomputed separate univariate linear regressions foreach species to obtain comparable estimates of theslope of the effect of DMG on SOD (potentially usefulfor future analysis). We also tested the relationship
151
Clim Res 35: 147–157, 2007
between DMG and Ti with separate linear models. Wethen compared a set of models including the effect ofDMG in addition to the effects of temperature, site andspecies. Step 1: we departed from the model S + Sp ×DMG, i.e. the model with no temperature or yeareffect. The exploratory analysis of the effect of temper-ature was conducted in Step 2, where we compared 8models of the form S + Sp × Ti + Sp × DMG (S for site,other effects noted as in the previous section), whereonly the effect monthly temperature was allowed tochange. Tk refers to the temperature selected duringthis first phase. The model S + Sp × Tk + Sp × DMG wascompared to the model of Step 1 to evaluate theimportance of temperature as a determinant of SOD.Then, inference was based on 7 more steps of modelselection (1 model per step). Step 3: a model withoutthe DMG effect was compared to the model selectedin Step 2 to confirm that DMG was an important pre-dictor of the SOD. Step 4: a model with a linear effectof year alone was compared to the model selected inStep 2 to confirm that the predicted plastic adaptationof SOD to DMG and Tk was a better determinant of theestimated SOD than a directional change throughoutthe study period. Step 5: the interaction Sp × Tk wasremoved from model S + Sp × Tk + Sp × DMG to deter-mine if species responded differently to temperature.Step 6: the interaction Sp × DMG was removed toevaluate if species adjusted their SOD to DMG differ-ently. Step 7: a linear effect of year was added to amodel S + Sp × Tk + Sp × DMG, where the interactionsnot selected in Steps 3 and 4 had been removed. Ifplastic adaptation to the experienced conditions, asapproximated by DMG and Tk, is the only componentof the observed variations, the temporal trend shouldnot be selected. Step 8: the interaction S × DMG wasadded to check whether the effect of DMG differedamong sites. Finally, Step 9: the interaction Tk × DMGwas added to determine if DMG mediated the effect oftemperature on SOD. At the end of this procedure,estimates and SD were presented. GOF was assessedby testing the normality of residuals of the best modelwith a Shapiro-Wilks test and through the dispersioncoefficient (residual deviance/residual degree of free-dom).
3. RESULTS
3.1. Evolution of mean monthly temperatures
Mean temperatures in February, March, April andSeptember were positively correlated to year (all r2 > 0.3and p < 0.01). Slopes were, respectively, 0.25 ± 0.072,0.16 ± 0.047, 0.09 ± 0.031 and 0.11 ± 0.033°C yr–1. Meantemperature in August was not related to year (p > 0.5).
3.2. Phenology, peak date and temperature
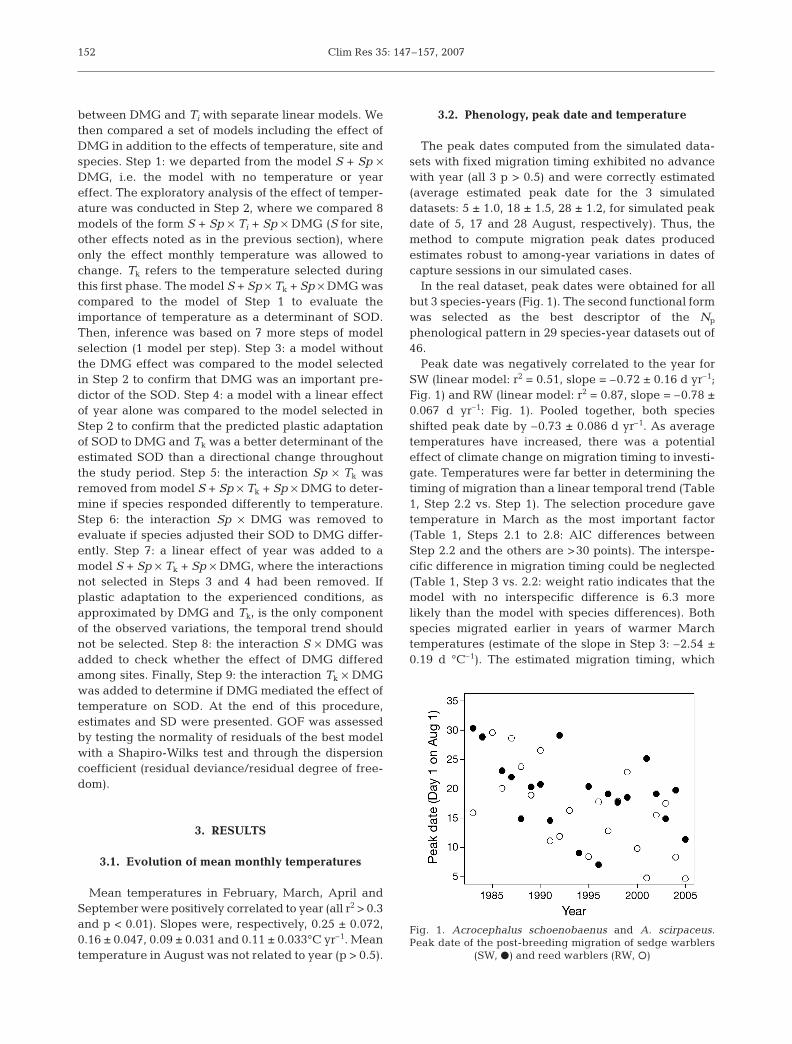
The peak dates computed from the simulated data-sets with fixed migration timing exhibited no advancewith year (all 3 p > 0.5) and were correctly estimated(average estimated peak date for the 3 simulateddatasets: 5 ± 1.0, 18 ± 1.5, 28 ± 1.2, for simulated peakdate of 5, 17 and 28 August, respectively). Thus, themethod to compute migration peak dates producedestimates robust to among-year variations in dates ofcapture sessions in our simulated cases.
In the real dataset, peak dates were obtained for allbut 3 species-years (Fig. 1). The second functional formwas selected as the best descriptor of the Np
phenological pattern in 29 species-year datasets out of46.
Peak date was negatively correlated to the year forSW (linear model: r2 = 0.51, slope = –0.72 ± 0.16 d yr–1;Fig. 1) and RW (linear model: r2 = 0.87, slope = –0.78 ±0.067 d yr–1: Fig. 1). Pooled together, both speciesshifted peak date by –0.73 ± 0.086 d yr–1. As averagetemperatures have increased, there was a potentialeffect of climate change on migration timing to investi-gate. Temperatures were far better in determining thetiming of migration than a linear temporal trend (Table1, Step 2.2 vs. Step 1). The selection procedure gavetemperature in March as the most important factor(Table 1, Steps 2.1 to 2.8: AIC differences betweenStep 2.2 and the others are >30 points). The interspe-cific difference in migration timing could be neglected(Table 1, Step 3 vs. 2.2: weight ratio indicates that themodel with no interspecific difference is 6.3 morelikely than the model with species differences). Bothspecies migrated earlier in years of warmer Marchtemperatures (estimate of the slope in Step 3: –2.54 ±0.19 d °C–1). The estimated migration timing, which
152
Fig. 1. Acrocephalus schoenobaenus and A. scirpaceus.Peak date of the post-breeding migration of sedge warblers
(SW, d) and reed warblers (RW, s)
Péron et al.: Climate changes and post-breeding migration
mainly takes place in August, may thus be influencedby the interaction of March and August temperatures.However, comparing Step 3 vs. Step 4 provides weaksupport for such an interaction effect of August tem-peratures: the model with interaction is about as likelyas the model without interaction. The model includingthe interactions suggests that warm August tempera-ture tended to moderate the effect of warm March tem-peratures (Table 2: interaction term in the model ~T03 ×T08), with no apparent additive effect of August tem-peratures. The additive temporal trend did notmarkedly improve the fit (Step 5 vs. Step 3): the modelwithout temporal trend was slightly (1.6 times) morelikely than the model with the trend. It suggests thatmost among-year variation was explained by tempera-ture.
The effect of capture dates was not selected (weightof Step 6 <0.01 in Table 1), further emphasising thatthe true temporal variations in migration peak datewere not strongly biased by changing capture datesamong years. Finally, a linear temporal trend alonewas a worse predictor of among-year variations inmigration peak date when compared to the predictivepower of temperature models, with a probability <0.01(weight of Step 1 in Table 1). All models including ayear effect (Steps 1 and 5) had a summed weight of0.23.
3.3. Stopover duration, body mass gain andtemperature
Some lack of fit of the general model used for SODestimation [Φ(species × site × year × t), P(species × site× year × t)] due to the excess of individuals capturedonly once (transience, Test 3.SR) was detected in 18species by site by year subsets out of 62 (p < 0.05 inTable 3). If we corrected these GOF tests for multipletesting, the detected lack of fit would be even morerestricted. Moreover, transience in itself is a biologi-cally meaningful phenomenon in the context ofmigration stopover, since individuals migratingthrough the area without remaining for a stopover arede facto transients. Thus, models were not adjusted todiscard transients from SOD estimates (Schaub et al.2001). No other source of lack of fit of the generalmodel to the data was detected (trap-dependence,Test 3.CT: all p > 0.05; overall fit, global tests: all p >0.05, indicating absence of overdispersion).
153
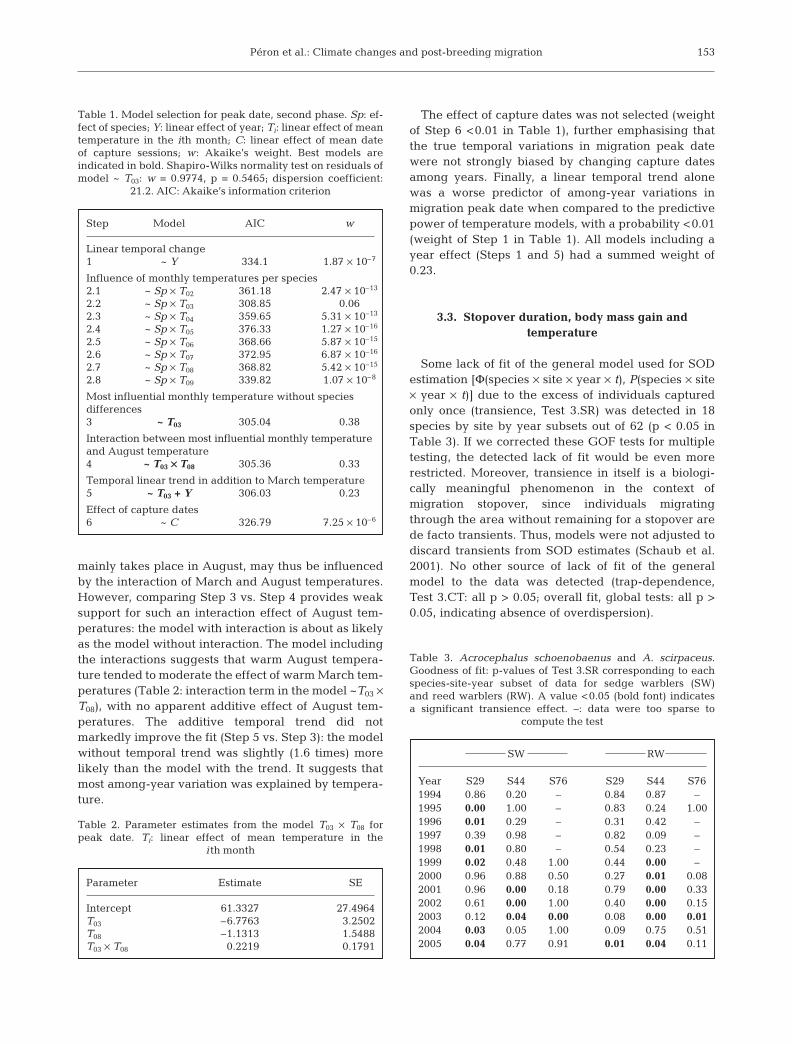
Table 1. Model selection for peak date, second phase. Sp: ef-fect of species; Y: linear effect of year; Ti: linear effect of meantemperature in the ith month; C: linear effect of mean dateof capture sessions; w: Akaike’s weight. Best models areindicated in bold. Shapiro-Wilks normality test on residuals ofmodel ~ T03: w = 0.9774, p = 0.5465; dispersion coefficient:
21.2. AIC: Akaike’s information criterion
Step Model AIC w
Linear temporal change1 ~ Y 334.1 1.87 × 10⁻⁷
Influence of monthly temperatures per species2.1 ~ Sp × T02 361.18 2.47 × 10⁻¹³
2.2 ~ Sp × T03 308.85 0.062.3 ~ Sp × T04 359.65 5.31 × 10⁻¹³
2.4 ~ Sp × T05 376.33 1.27 × 10⁻¹⁶
2.5 ~ Sp × T06 368.66 5.87 × 10⁻¹⁵
2.6 ~ Sp × T07 372.95 6.87 × 10⁻¹⁶
2.7 ~ Sp × T08 368.82 5.42 × 10⁻¹⁵
2.8 ~ Sp × T09 339.82 1.07 × 10⁻⁸
Most influential monthly temperature without speciesdifferences3 ~ T03 305.04 0.38
Interaction between most influential monthly temperatureand August temperature4 ~ T03 ×× T08 305.36 0.33
Temporal linear trend in addition to March temperature5 ~ T03 + Y 306.03 0.23
Effect of capture dates6 ~ C 326.79 7.25 × 10⁻⁶
Table 2. Parameter estimates from the model T03 × T08 forpeak date. Ti: linear effect of mean temperature in the
i th month
Parameter Estimate SE
Intercept 61.3327 27.4964T03 –6.7763 3.2502T08 –1.1313 1.5488T03 × T08 0.2219 0.1791
Table 3. Acrocephalus schoenobaenus and A. scirpaceus.Goodness of fit: p-values of Test 3.SR corresponding to eachspecies-site-year subset of data for sedge warblers (SW)and reed warblers (RW). A value <0.05 (bold font) indicatesa significant transience effect. –: data were too sparse to
compute the test
SW RW
Year S29 S44 S76 S29 S44 S761994 0.86 0.20 – 0.84 0.87 –1995 0.00 1.00 – 0.83 0.24 1.001996 0.01 0.29 – 0.31 0.42 –1997 0.39 0.98 – 0.82 0.09 –1998 0.01 0.80 – 0.54 0.23 –1999 0.02 0.48 1.00 0.44 0.00 –2000 0.96 0.88 0.50 0.27 0.01 0.082001 0.96 0.00 0.18 0.79 0.00 0.332002 0.61 0.00 1.00 0.40 0.00 0.152003 0.12 0.04 0.00 0.08 0.00 0.012004 0.03 0.05 1.00 0.09 0.75 0.512005 0.04 0.77 0.91 0.01 0.04 0.11
Clim Res 35: 147–157, 2007
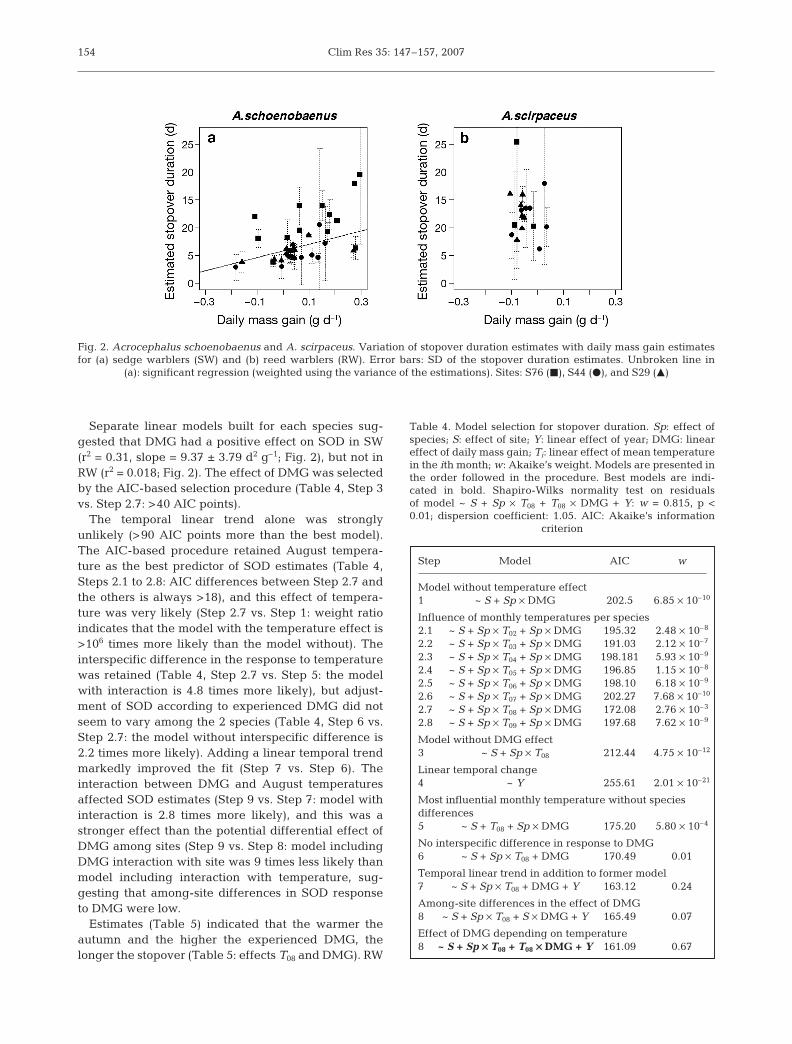
Separate linear models built for each species sug-gested that DMG had a positive effect on SOD in SW(r2 = 0.31, slope = 9.37 ± 3.79 d2 g–1; Fig. 2), but not inRW (r2 = 0.018; Fig. 2). The effect of DMG was selectedby the AIC-based selection procedure (Table 4, Step 3vs. Step 2.7: >40 AIC points).
The temporal linear trend alone was stronglyunlikely (>90 AIC points more than the best model).The AIC-based procedure retained August tempera-ture as the best predictor of SOD estimates (Table 4,Steps 2.1 to 2.8: AIC differences between Step 2.7 andthe others is always >18), and this effect of tempera-ture was very likely (Step 2.7 vs. Step 1: weight ratioindicates that the model with the temperature effect is>106 times more likely than the model without). Theinterspecific difference in the response to temperaturewas retained (Table 4, Step 2.7 vs. Step 5: the modelwith interaction is 4.8 times more likely), but adjust-ment of SOD according to experienced DMG did notseem to vary among the 2 species (Table 4, Step 6 vs.Step 2.7: the model without interspecific difference is2.2 times more likely). Adding a linear temporal trendmarkedly improved the fit (Step 7 vs. Step 6). Theinteraction between DMG and August temperaturesaffected SOD estimates (Step 9 vs. Step 7: model withinteraction is 2.8 times more likely), and this was astronger effect than the potential differential effect ofDMG among sites (Step 9 vs. Step 8: model includingDMG interaction with site was 9 times less likely thanmodel including interaction with temperature, sug-gesting that among-site differences in SOD responseto DMG were low.
Estimates (Table 5) indicated that the warmer theautumn and the higher the experienced DMG, thelonger the stopover (Table 5: effects T08 and DMG). RW
154
Fig. 2. Acrocephalus schoenobaenus and A. scirpaceus. Variation of stopover duration estimates with daily mass gain estimatesfor (a) sedge warblers (SW) and (b) reed warblers (RW). Error bars: SD of the stopover duration estimates. Unbroken line in
(a): significant regression (weighted using the variance of the estimations). Sites: S76 (J), S44 (d), and S29 (M)
Table 4. Model selection for stopover duration. Sp: effect ofspecies; S: effect of site; Y: linear effect of year; DMG: lineareffect of daily mass gain; Ti: linear effect of mean temperaturein the ith month; w: Akaike’s weight. Models are presented inthe order followed in the procedure. Best models are indi-cated in bold. Shapiro-Wilks normality test on residualsof model ~ S + Sp × T08 + T08 × DMG + Y: w = 0.815, p <0.01; dispersion coefficient: 1.05. AIC: Akaike’s information
criterion
Step Model AIC w
Model without temperature effect1 ~ S + Sp × DMG 202.5 6.85 × 10⁻¹⁰
Influence of monthly temperatures per species2.1 ~ S + Sp × T02 + Sp × DMG 195.32 2.48 × 10⁻⁸
2.2 ~ S + Sp × T03 + Sp × DMG 191.03 2.12 × 10⁻⁷
2.3 ~ S + Sp × T04 + Sp × DMG 198.181 5.93 × 10⁻⁹
2.4 ~ S + Sp × T05 + Sp × DMG 196.85 1.15 × 10⁻⁸
2.5 ~ S + Sp × T06 + Sp × DMG 198.10 6.18 × 10⁻⁹
2.6 ~ S + Sp × T07 + Sp × DMG 202.27 7.68 × 10⁻¹⁰
2.7 ~ S + Sp × T08 + Sp × DMG 172.08 2.76 × 10⁻³
2.8 ~ S + Sp × T09 + Sp × DMG 197.68 7.62 × 10⁻⁹
Model without DMG effect3 ~ S + Sp × T08 212.44 4.75 × 10⁻¹²
Linear temporal change4 ~ Y 255.61 2.01 × 10⁻²¹
Most influential monthly temperature without speciesdifferences5 ~ S + T08 + Sp × DMG 175.20 5.80 × 10⁻⁴
No interspecific difference in response to DMG6 ~ S + Sp × T08 + DMG 170.49 0.01
Temporal linear trend in addition to former model7 ~ S + Sp × T08 + DMG + Y 163.12 0.24
Among-site differences in the effect of DMG8 ~ S + Sp × T08 + S × DMG + Y 165.49 0.07
Effect of DMG depending on temperature8 ~ S + Sp ×× T08 + T08 ×× DMG + Y 161.09 0.67
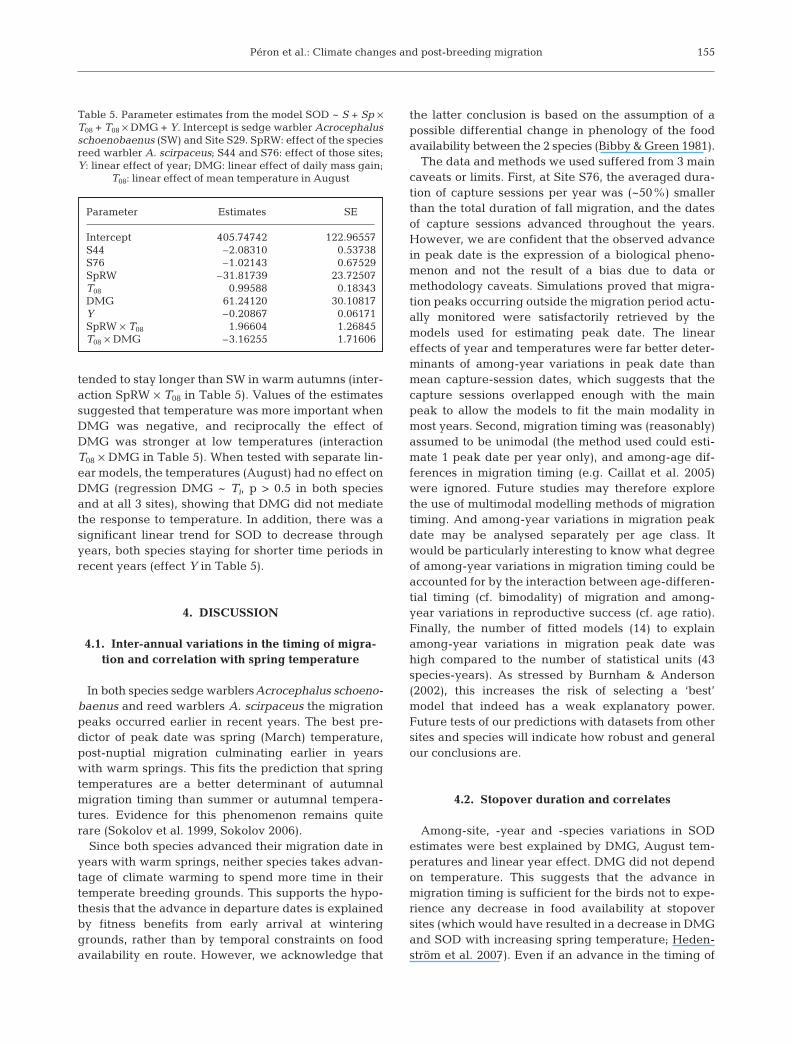
Péron et al.: Climate changes and post-breeding migration
tended to stay longer than SW in warm autumns (inter-action SpRW × T08 in Table 5). Values of the estimatessuggested that temperature was more important whenDMG was negative, and reciprocally the effect ofDMG was stronger at low temperatures (interactionT08 × DMG in Table 5). When tested with separate lin-ear models, the temperatures (August) had no effect onDMG (regression DMG ~ Ti, p > 0.5 in both speciesand at all 3 sites), showing that DMG did not mediatethe response to temperature. In addition, there was asignificant linear trend for SOD to decrease throughyears, both species staying for shorter time periods inrecent years (effect Y in Table 5).
4. DISCUSSION
4.1. Inter-annual variations in the timing of migra-tion and correlation with spring temperature
In both species sedge warblersAcrocephalus schoeno-baenus and reed warblers A. scirpaceus the migrationpeaks occurred earlier in recent years. The best pre-dictor of peak date was spring (March) temperature,post-nuptial migration culminating earlier in yearswith warm springs. This fits the prediction that springtemperatures are a better determinant of autumnalmigration timing than summer or autumnal tempera-tures. Evidence for this phenomenon remains quiterare (Sokolov et al. 1999, Sokolov 2006).
Since both species advanced their migration date inyears with warm springs, neither species takes advan-tage of climate warming to spend more time in theirtemperate breeding grounds. This supports the hypo-thesis that the advance in departure dates is explainedby fitness benefits from early arrival at winteringgrounds, rather than by temporal constraints on foodavailability en route. However, we acknowledge that
the latter conclusion is based on the assumption of apossible differential change in phenology of the foodavailability between the 2 species (Bibby & Green 1981).
The data and methods we used suffered from 3 maincaveats or limits. First, at Site S76, the averaged dura-tion of capture sessions per year was (~50%) smallerthan the total duration of fall migration, and the datesof capture sessions advanced throughout the years.However, we are confident that the observed advancein peak date is the expression of a biological pheno-menon and not the result of a bias due to data ormethodology caveats. Simulations proved that migra-tion peaks occurring outside the migration period actu-ally monitored were satisfactorily retrieved by themodels used for estimating peak date. The lineareffects of year and temperatures were far better deter-minants of among-year variations in peak date thanmean capture-session dates, which suggests that thecapture sessions overlapped enough with the mainpeak to allow the models to fit the main modality inmost years. Second, migration timing was (reasonably)assumed to be unimodal (the method used could esti-mate 1 peak date per year only), and among-age dif-ferences in migration timing (e.g. Caillat et al. 2005)were ignored. Future studies may therefore explorethe use of multimodal modelling methods of migrationtiming. And among-year variations in migration peakdate may be analysed separately per age class. Itwould be particularly interesting to know what degreeof among-year variations in migration timing could beaccounted for by the interaction between age-differen-tial timing (cf. bimodality) of migration and among-year variations in reproductive success (cf. age ratio).Finally, the number of fitted models (14) to explainamong-year variations in migration peak date washigh compared to the number of statistical units (43species-years). As stressed by Burnham & Anderson(2002), this increases the risk of selecting a ‘best’model that indeed has a weak explanatory power.Future tests of our predictions with datasets from othersites and species will indicate how robust and generalour conclusions are.
4.2. Stopover duration and correlates
Among-site, -year and -species variations in SODestimates were best explained by DMG, August tem-peratures and linear year effect. DMG did not dependon temperature. This suggests that the advance inmigration timing is sufficient for the birds not to expe-rience any decrease in food availability at stopoversites (which would have resulted in a decrease in DMGand SOD with increasing spring temperature; Heden-ström et al. 2007). Even if an advance in the timing of
155
Table 5. Parameter estimates from the model SOD ~ S + Sp ×T08 + T08 × DMG + Y. Intercept is sedge warbler Acrocephalusschoenobaenus (SW) and Site S29. SpRW: effect of the speciesreed warbler A. scirpaceus; S44 and S76: effect of those sites;Y: linear effect of year; DMG: linear effect of daily mass gain;
T08: linear effect of mean temperature in August
Parameter Estimates SE
Intercept 405.74742 122.96557S44 –2.08310 0.53738S76 –1.02143 0.67529SpRW –31.81739 23.72507T08 0.99588 0.18343DMG 61.24120 30.10817Y –0.20867 0.06171SpRW × T08 1.96604 1.26845T08 × DMG –3.16255 1.71606
Clim Res 35: 147–157, 2007
food abundance en route is not the driving force of theadvanced timing of migration, this advance seems suf-ficient to track the possible changes in the phenologyof autumn food resources and to avoid any decrease inthe experienced food abundance. If the advance inpeak date with increasing T03 had not been sufficient,birds (and especially SW) would potentially have expe-rienced a decrease in autumn food resources and weshould have observed a decrease of DMG and SODwith T03. This decrease is not observed, suggestingthat birds efficiently adapted to the newly experiencedconditions. This interpretation lays on the assumptionthat there is a modification of food resource phenology.Even if this assumption is not verified, our results stillsupport that recent climate warming did not affect thestopover duration.
The fact that the relationship between SOD andDMG is positive is in agreement with theoretical workon time-minimising migrants using a discrete environ-ment (Alerstam & Lindström 1990, Hedenström et al.2007). The significance threshold reached in SW onlybrings to the fore the influence of diet involved in oursecond hypothesis: SW was predicted to be more con-strained than RW and, as a result, to respond morestrongly to variations in its experienced DMG, becausewhen the resource peaks somewhere, it is alreadyscarce further south. This result is in agreement withprevious findings by Schaub & Jenni (2001) thatbetween-site variation of SOD is much greater for SWthan for species with a more reliable food resource.However, when analysing both species with a singlemodel, the interspecific difference was not significant.The much higher variability of DMG in SW than in RWmay mask this difference.
4.3. Observed temporal trend: Phenotypic plasticityor natural selection?
For both species, migration timing is better predictedby a physical variable (March temperature) than by alinear year effect alone. Among-year adjustment ofmigration timing to temperature conditions suggeststhat the observed changes in migration behaviourwould be essentially plastic (Jonzén et al. 2006). Sinceno temporal linear change in migration date is foundafter correction for temperature, then directional selec-tion for earlier migration either does not operate, or istoo weak to be detected. The influence of August tem-peratures on migration timing (through its interactionwith March temperature) and on SOD further supportthat SOD and migration date are adjusted to experi-enced conditions thanks to phenotypic plasticity ratherthan by natural selection—August temperatures notbeing correlated to year.
However, both species show a significant decreasein stopover duration with year that is explained neitherby DMG nor by temperatures. This result is more diffi-cult to interpret. The linear year effect might integratesome other factors that we did not include in this analy-sis. Since DMG did not depend on year or on tempera-ture, we do not think that site quality decreases withyear.
Particularly for SW, the DMG might be the integra-tive clue used by individuals to plastically adapt theirstopover duration to local conditions. DMG is muchmore variable in this species, and this may be due to itsspecialised diet (Bibby & Green 1981, Schaub & Jenni2001). As our results suggest that the advance inmigration timing does not occur in response to the tem-poral shift in food availability, mistiming betweenmigration and appearance of the aphid peak is pos-sible in the coming years. The future evolution of thesystem will allow further testing of this hypothesis. Wewill need to quantify the temporal variations in aphidabundance and their relationships with spring andautumn temperatures, as well as with the diet andstopover duration of both warblers in relationship toaphid availability.
Acknowledgements. We warmly thank all ringers who col-lected data, and F. Jiguet and J.-M. Moisselin (Meteo France)for providing temperature data. Ringing licenses were deliv-ered by CRBPO, Muséum National d’Histoire Naturelle. Weare grateful to 4 anonymous reviewers for their constructivecomments, and to R. Choquet and O. Gimenez for their helpin data analysis.
LITERATURE CITED
Alerstam T, Lindström A (1990) Optimal bird migration: therelative importance of time, energy and safety. In: Gwin-ner E (ed) Bird migration: physiology and ecophysiology.Springer-Verlag, Berlin, p 331–351
Austin GE, Rehfisch MM (2005) Shifting nonbreeding distrib-utions of migratory fauna in relation to climatic change.Glob Change Biol 11:31–38
Bargain B, Vansteenwegen C, Henry J (2002) Importance desmarais de la Baie d’Audierne (Bretagne) pour la migrationdu Phragmite des joncs Acrocephalus schoenobaenus.Alauda 70:37–55
Bergmann F (1999) Long-term increase in numbers of early-fledged reed warblers (Acrocephalus scirpaceus) at LakeConstance (southern Germany). J Ornithol 140:81–86
Bibby CJ, Green RE (1981) Autumn migration strategies ofreed and sedge warblers. Ornis Scand 12:1–12
Both C, Visser ME (2001) Adjustment to climate change isconstrained by arrival date in a long-distance migrantbird. Nature 411:296–298
Both C, Bijlsma RG, Visser ME (2005) Climatic effects on tim-ing of spring migration and breeding in a long-distancemigrant, the pied flycatcher Ficedula hypoleuca. J AvianBiol 36:368–373
Burnham KP, Anderson DR (1998) Model selection and infer-ence: a practical information-theoretic approach. Springer-Verlag, New York
156
Péron et al.: Climate changes and post-breeding migration
Burnham KP, Anderson DR (2002) Model selection andmultimodel inference: a practical information-theoreticapproach, 2nd edn. Springer-Verlag, New York
Caillat M, Dugué H, Leray G, Gentric A, Pourreau J, JulliardR, Yésou P (2005) Résultat de 10 années de baguage defauvettes paludicoles Acrocephalus sp. dans l’estuaire dela Loire. Alauda 73:375–388
Choquet R, Reboulet AM, Lebreton JD, Gimenez O, Pradel R(2005) U-CARE 22 user’s manual. CEFE, Montpellier
Cleland EE, Chiariello NR, Loarie SR, Mooney HA, Field CB(2006) Diverse responses of phenology to global changesin a grassland ecosystem. Proc Natl Acad Sci USA 103:13740–13744
Cotton PA (2003) Avian migration phenology and global cli-mate change. Proc Natl Acad Sci USA 100:12219–12222
Cramp S (1992) The birds of the western Palearctic, Vol 6.Oxford University Press
Crick HQP, Sparks TH (1999) Climate change related to egg-laying trends. Nature 399:423–424
Crick HQP, Dudley C, Glue DE, Thomson DL (1997) UK birdsare laying eggs earlier. Nature 388:526
Efford MG (2005) Migrating birds stop over longer than usu-ally thought. Comment. Ecology 86:3415–3418
Gatter W (1992) Timing and patterns of visible autumnmigration—Can effects of global warming be detected?J Ornithol 133:427–436
Gordo O (2007) Why are bird migration dates shifting? Areview of weather and climate effects on avian migratoryphenology. Clim Res 35:37–58
Gordo O, Sanz JJ (2006) Climate change and bird phenology:a long-term study in the Iberian Peninsula. Glob ChangeBiol 12:1993–2004
Grosbois V, Henry PY, Blondel J, Perret P, Lebreton JD,Thomas DW, Lambrechts MM (2006) Climate impacts onMediterranean blue tit survival: an investigation acrossseasons and spatial scales. Glob Change Biol 12:2235–2249
Hedenström A, Barta Z, Helm B, Houston AI, McNamara JM,Jonzén N (2007) Migration speed and scheduling ofannual events by migrating birds in relation to climatechange. Clim Res 35:79–91
Idrissi HR, Lefebvre G, Poulin B (2004) Diet of reed warblersAcrocephalus scirpaceus at two stopover sites in Moroccoduring autumn migration. Rev Ecol (Terre Vie) 59:491–502
Jenni L, Kéry M (2003) Timing of autumn bird migrationunder climate change: advances in long-distance migrants,delays in short-distance migrants. Proc R Soc Lond B BiolSci 270:1467–1471
Jonzén N, Linden A, Ergon T, Knudsen E and others (2006)Rapid advance of spring arrival dates in long-distancemigratory birds. Science 312:1959–1961
Jonzén N, Ergon T, Lindén A, Stenseth NC (2007) Bird migra-tion and climate: the general picture and beyond. ClimRes 35:177–180
Lebreton JD, Burnham KP, Clobert J, Anderson DR (1992)Modeling survival and testing biological hypotheses usingmarked animals—a unified approach with case-studies.Ecol Monogr 62:67–118
Lehikoinen E, Sparks TH, Zalakevicius M (2004) Arrival anddeparture dates. In: Møller AP, Fiedler W, Berthold P (eds)Birds and climate change. Adv Ecol Res 35:1–31
Marra PP, Hobson KA, Holmes RT (1998) Linking winter andsummer events in a migratory bird by using stable-carbonisotopes. Science 282:1884–1886
Møller AP (2001) Heritability of arrival date in a migratorybird. Proc R Soc Lond B Biol Sci 268:203–206
Myneni RB, Keeling CD, Tucker CJ, Asrar G, Nemani RR(1997) Increased plant growth in the northern high lati-tudes from 1981 to 1991. Nature 386:698–702
Pradel R, Schaub M, Jenni L, Lebreton JD (2005) Migratingbirds stop over longer than usually thought. Reply. Ecol-ogy 86:3418–3419
R Core Development Team (2005) R: a language and environ-ment for statistical computing. R Foundation for StatisticalComputing, Vienna. Available at http://www.R-project.org
Rivalan P, Frederiksen M, Loïs G, Julliard R (2007) Contrast-ing responses of migration strategies in two Europeanthrushes to climate change. Glob Change Biol 13:275–287
Root TL, Price JT, Hall KR, Schneider SH, Rosenzweig C,Pounds JA (2003) Fingerprints of global warming on wildanimals and plants. Nature 421:57–60
Roy DB, Sparks TH (2000) Phenology of British butterflies andclimate change. Glob Change Biol 6:407–416
Rubolini D, Møller AP, Rainio K, Lehikoinen E (2007)Intraspecific consistency and geographic variability intemporal trends of spring migration phenology amongEuropean bird species. Clim Res 35:135–146
Salewski V, Bairlein F, Leisler B (2002) Different winteringstrategies of two Palearctic migrants in West Africa—Aconsequence of foraging strategies? Ibis 144:85–93
Schaefer T, Ledebur G, Beier J, Leisler B (2005) Reproductiveresponses of two related coexisting songbird species toenvironmental changes: global warming, competition,and population sizes. J Ornithol 147:47–56
Schaub M, Jenni L (2001) Variation of fuelling rates amongsites, days and individuals in migrating passerine birds.Funct Ecol 15:584–594
Schaub M, Pradel R, Jenni L, Lebreton JD (2001) Migratingbirds stop over longer than usually thought: an improvedcapture–recapture analysis. Ecology 82:852–859
Sokolov L (2006) Effect of global warming on the timing ofmigration and breeding of passerine birds in the 20th cen-tury. Entomol Rev 86:S59–S81
Sokolov LV, Markovets MY, Morozov YG (1999) Long-termtrends in the timing of spring migration of passerines onthe Courish Spit of the Baltic Sea. Avian Ecol Behav 2:1–18
Sparks TH, Braslavska O (2001) The effects of temperature,altitude and latitude on the arrival and departure dates ofthe swallow Hirundo rustica in the Slovak Republic. Int JBiometeorol 45:212–216
Studds CE, Marra PP (2007) Linking fluctuations in rainfallto nonbreeding season performance in a long-distancemigratory bird, Setophaga ruticilla. Clim Res 34:115–122
Trenberth KE, Jones PD, Ambenje P, Bojariu R and others (2007)Observations: surface and atmospheric climate change. In:Solomon S, Qin DM, Chen Z, Marquis M, Averyt KB, MillerHL (eds) Climate change 2007: the physical science basis.Contribution of Working Group I to the 4th Assessment Re-port of the Intergovernmental Panel on Climate Change.Cambridge University Press, Cambridge
157
Submitted: April 28, 2007; Accepted: October 30, 2007 Proofs received from author(s): December 14, 2007
Related Documents