Climate Change – The Other Climate Change – The Other Theories! Theories! Bruce Peachey, P.Eng. Bruce Peachey, P.Eng. September 18, 2003 September 18, 2003 Petroleum Society of CIM Petroleum Society of CIM Lloydminster Section Lloydminster Section

Climate Change – The Other Theories! Bruce Peachey, P.Eng. September 18, 2003 Petroleum Society of CIM Lloydminster Section.
Dec 21, 2015
Welcome message from author
This document is posted to help you gain knowledge. Please leave a comment to let me know what you think about it! Share it to your friends and learn new things together.
Transcript

Climate Change – The Other Climate Change – The Other Theories!Theories!
Bruce Peachey, P.Eng.Bruce Peachey, P.Eng.September 18, 2003September 18, 2003
Petroleum Society of CIMPetroleum Society of CIMLloydminster Section Lloydminster Section
What is Causing the Climate Change? What is the latest data?
• IPCC Science Working Group – Technical Summary
How do the theories stack up against the data?
• What theories eliminated or reduced?Of the remaining theories which is more
strongly supported?What are the implications?

Latest Data Indicates
Globally atmospheric GHGs are up.• Large unexplained CO2 sink in North America reported
Globally average temperatures are higher• Northern Hemisphere higher especially last 10 years
• Night-time lows increasing more than day-time highs
• More over land than over oceans. Cooling in some areas.
Growing Season – Increase by 1 to 4 days per decade in northern hemisphere
Latest Data Indicates
Precipitation increases (5-10%) over most land areas in mid to high latitudes of Northern Hemisphere
• No observed increase in southern hemisphere• Correlated to increases in clouds and extreme weather.
Heavy precipitation events increased in northern latitudes
• Likely a 2 to 4% increase in the frequency of heavy precipitation events in last 50 years in Northern Hemisphere
Latest Data Indicates
Atmospheric Water Vapour Increased in Northern Hemisphere by several percent per decade
Cloud cover in Northern Hemisphere increased by 2%• Positively correlated with decrease in diurnal
temperature range
Latest Data Indicates Sea-Ice in Northern Hemisphere decreasing
• No trends in Antarctic sea ice apparent. Non-polar glaciers – Widespread retreat
except in coastal areas. El Nino Events – More frequent, persistent
and intense over the last 30 years. Coral bleaching – Increased esp. during El
Nino. No acceleration in sea level rise detected
over last century

Seven Climate Change Views Warming is Not Happening Real Problem is Waste of Fossil Fuels GHGs Trapping Solar Radiation Energy Use Warming Atmosphere Human Impact Minor or Beneficial Can’t Afford the Solutions Water Emissions - Main Climate Change
Driver

Warming Not Happening?
High Uncertainty
Likely

Waste of Fossil Fuels
Should be a real concern. Even coal wouldn’t last for ever. A good reason on its own to reduce fossil
fuel use. Much of the use is for status or convenience
not need. Root problem is societal. “Live for today
attitude”
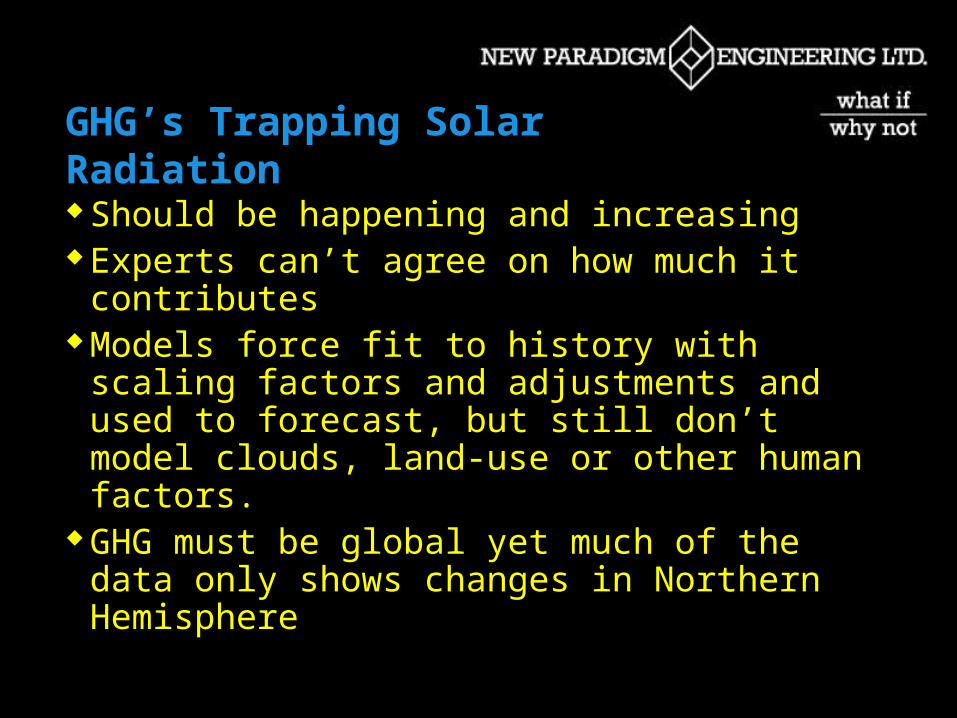
GHG’s Trapping Solar Radiation Should be happening and increasing Experts can’t agree on how much it
contributes Models force fit to history with scaling factors
and adjustments and used to forecast, but still don’t model clouds, land-use or other human factors.
GHG must be global yet much of the data only shows changes in Northern Hemisphere

Energy Use Warming Atmosphere
Total anthropogenic energy generation is about 550 ExaJoules/yr enough to warm atmosphere 1 degree C per year.
Most energy is turned into heat and reradiated, so would not build up enough.
Some turned into water vapour• Combustion or from Cooling Towers.
Summary – not a major impact.

Human Impact Minor or Beneficial Growing evidence that it is not minor and
that it has been rapidly growing in the last 30-50 years.
Cost vs. Benefits tough to balance• More growing days and warmer north
• More severe storms, loss of natural habitat
• Increases in severity where losses are greatest in people, property or sensitive environments
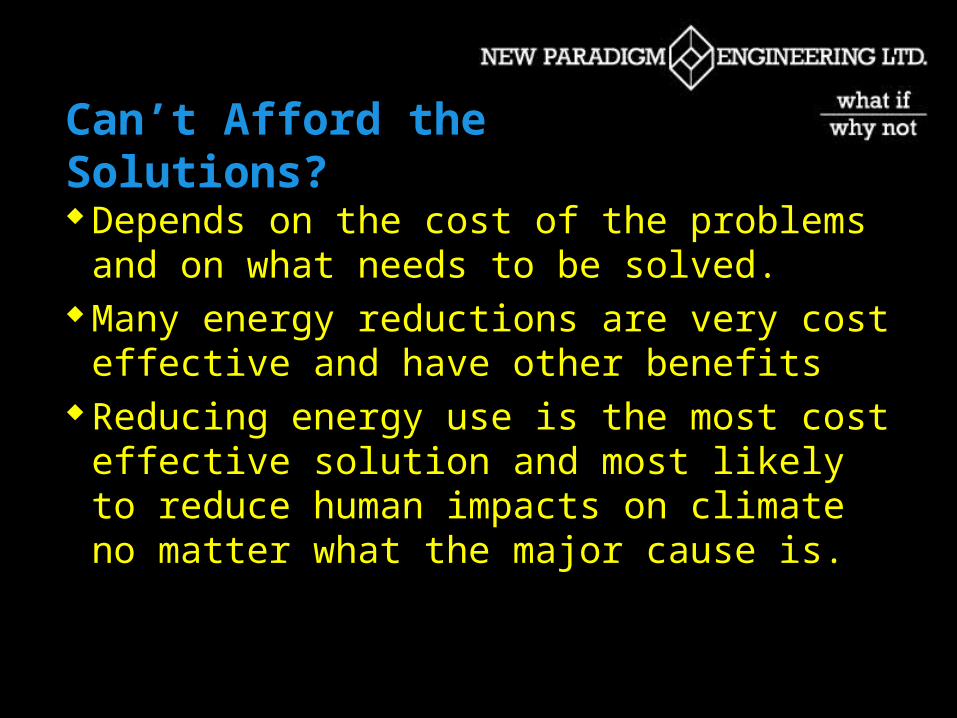
Can’t Afford the Solutions?
Depends on the cost of the problems and on what needs to be solved.
Many energy reductions are very cost effective and have other benefits
Reducing energy use is the most cost effective solution and most likely to reduce human impacts on climate no matter what the major cause is.

It’s The WATER!
The New Paradigm View

Global Water Cycle (km3 x 103/yr = Tt/yr)
Land Ocean
11171
40 (–10% due to human water use)
40
425 385
+4
What is the impact of this!
Source: Global Warming – The Complete Briefing – John Houghton
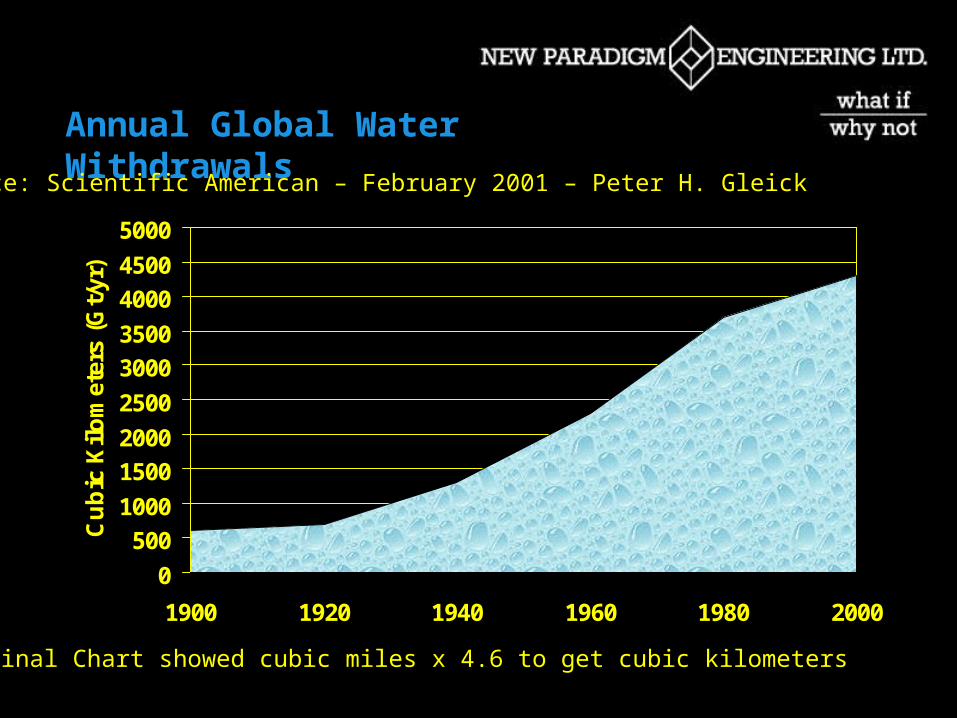
Annual Global Water Withdrawals
0
500
1000
1500
2000
2500
3000
3500
4000
4500
5000
1900 1920 1940 1960 1980 2000
Cu
bic
Kil
om
eter
s (G
t/yr
)
Source: Scientific American – February 2001 – Peter H. Gleick
Original Chart showed cubic miles x 4.6 to get cubic kilometers
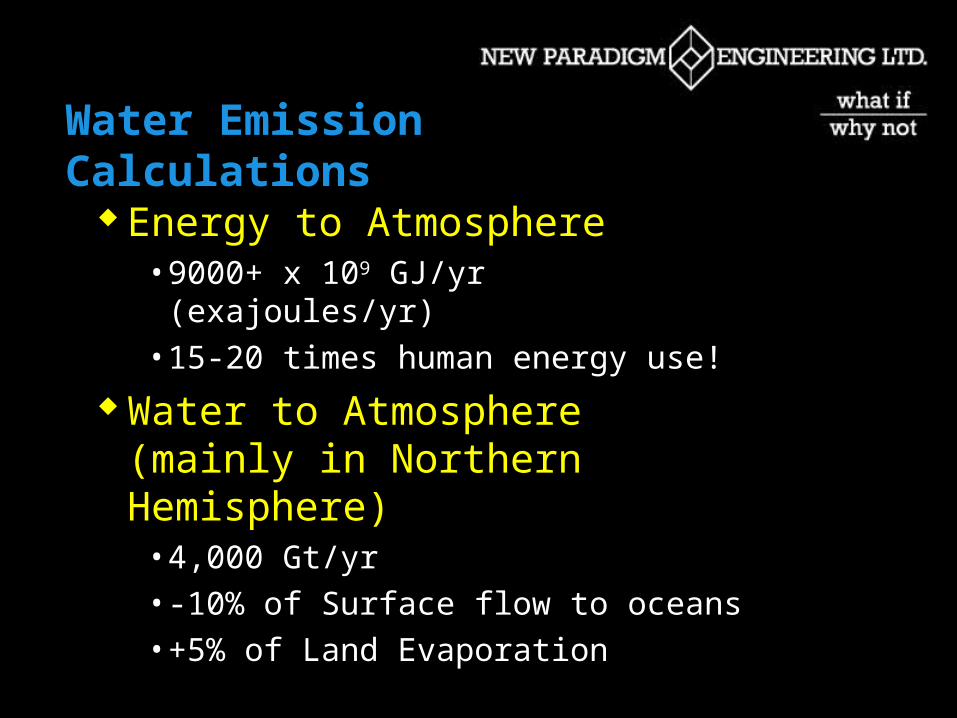
Water Emission Calculations
Energy to Atmosphere• 9000+ x 109 GJ/yr (exajoules/yr)• 15-20 times human energy use!
Water to Atmosphere (mainly in Northern Hemisphere)
• 4,000 Gt/yr• -10% of Surface flow to oceans• +5% of Land Evaporation
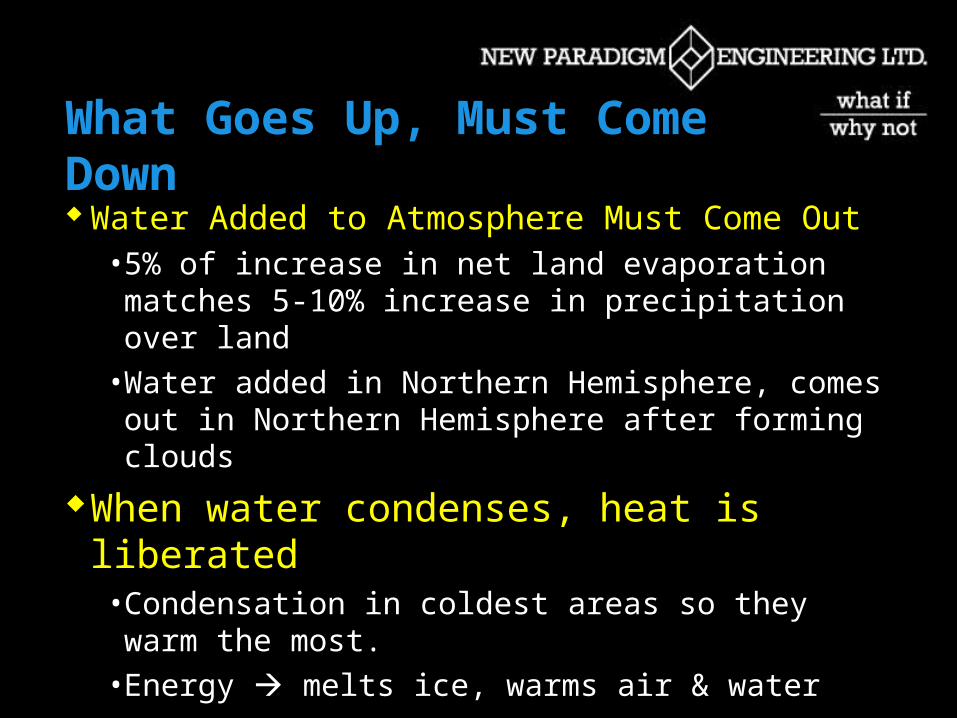
What Goes Up, Must Come Down Water Added to Atmosphere Must Come Out
• 5% of increase in net land evaporation matches 5-10% increase in precipitation over land
• Water added in Northern Hemisphere, comes out in Northern Hemisphere after forming clouds
When water condenses, heat is liberated• Condensation in coldest areas so they warm the most.
• Energy melts ice, warms air & water
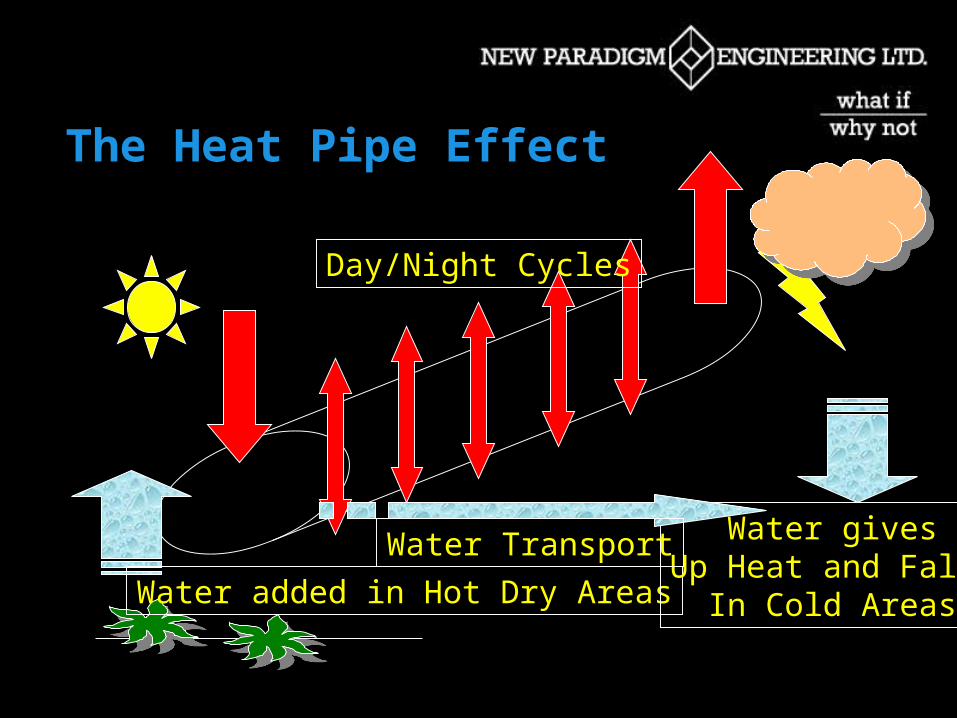
The Heat Pipe Effect
Water added in Hot Dry Areas
Water givesUp Heat and Falls
In Cold Areas
Day/Night Cycles
Water Transport
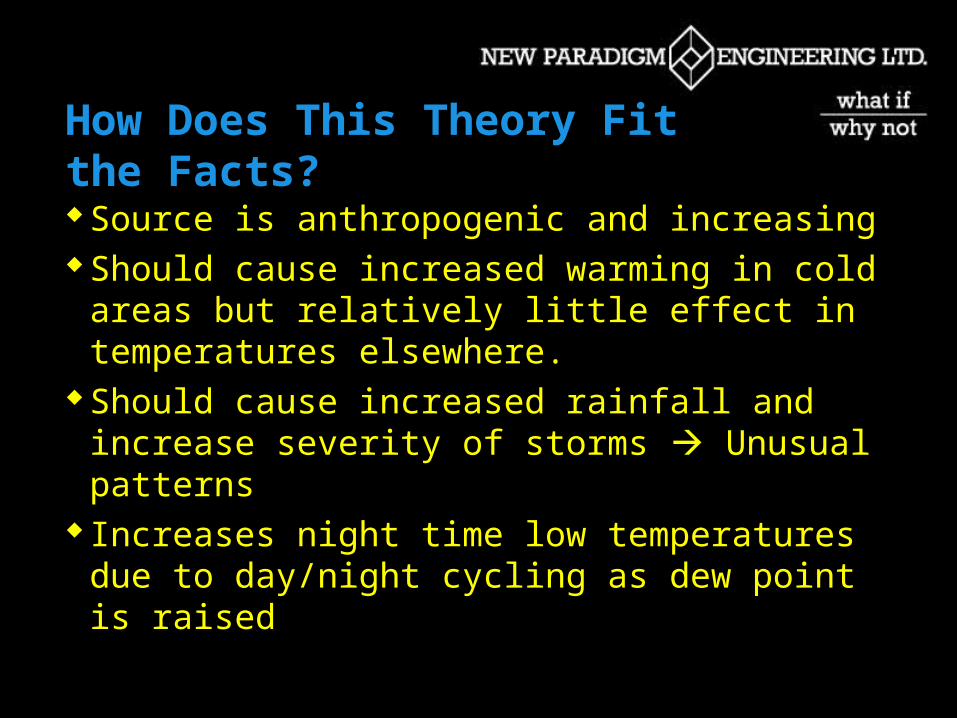
How Does This Theory Fit the Facts? Source is anthropogenic and increasing Should cause increased warming in cold
areas but relatively little effect in temperatures elsewhere.
Should cause increased rainfall and increase severity of storms Unusual patterns
Increases night time low temperatures due to day/night cycling as dew point is raised
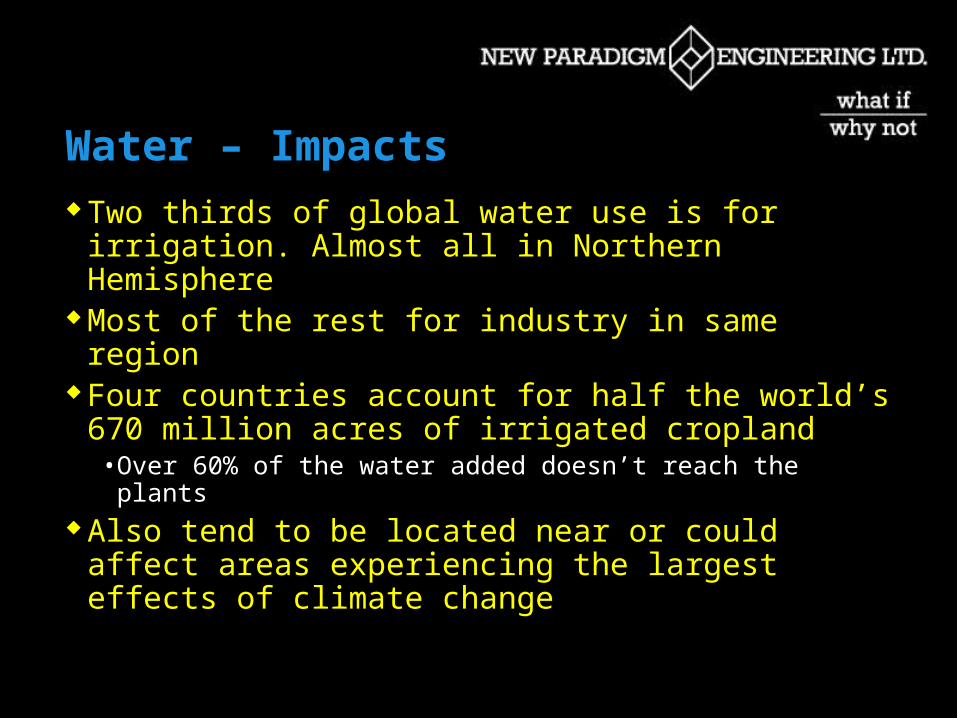
Water – Impacts
Two thirds of global water use is for irrigation. Almost all in Northern Hemisphere
Most of the rest for industry in same region Four countries account for half the world’s
670 million acres of irrigated cropland• Over 60% of the water added doesn’t reach the
plants Also tend to be located near or could affect
areas experiencing the largest effects of climate change
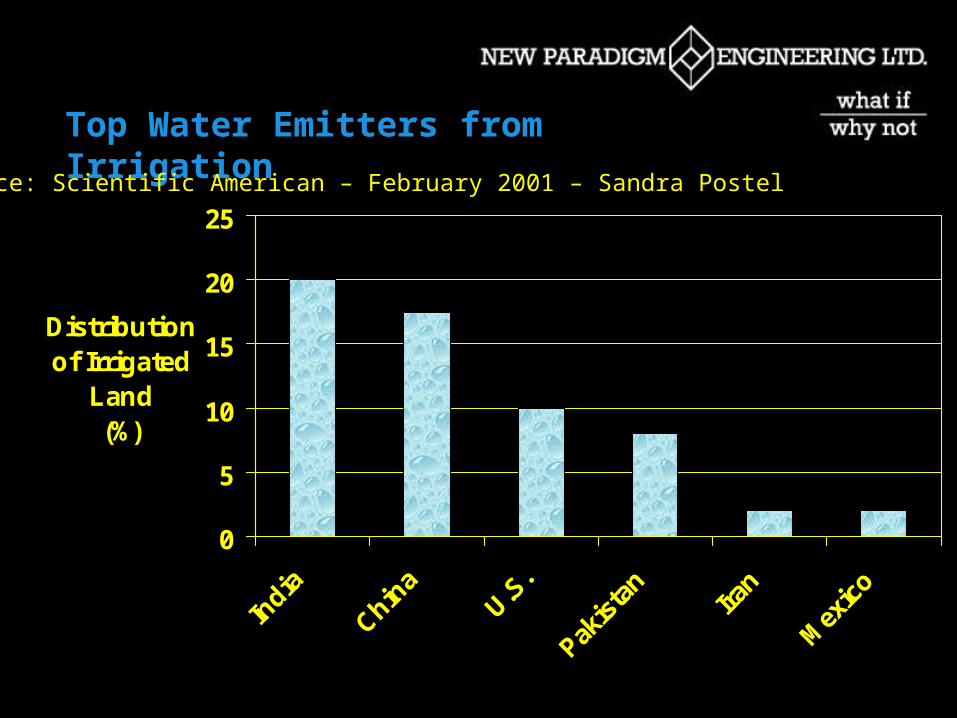
Top Water Emitters from Irrigation
0
5
10
15
20
25
Distribution of Irrigated
Land(%)
Source: Scientific American – February 2001 – Sandra Postel

Feeding El Nino & Arctic Warming?
El Nino
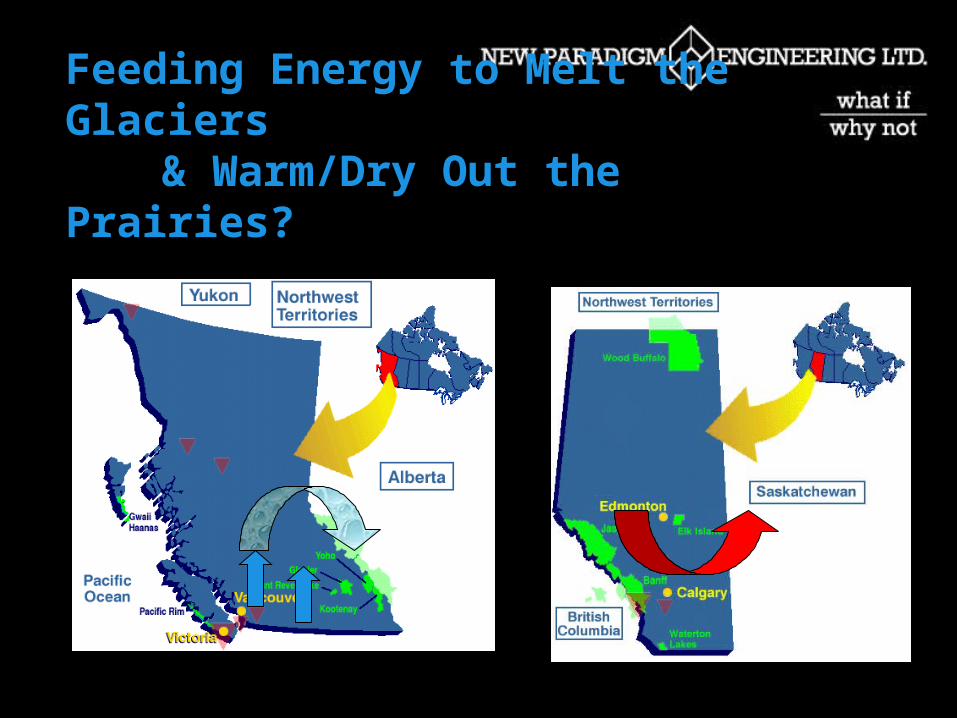
Feeding Energy to Melt the Glaciers
& Warm/Dry Out the Prairies?
Water – Implications
Improvements in irrigation practices may be more important than GHG reductions
• Reduce wasteful irrigation methods; • Select crops that suit the local climate• These changes could be made with a fraction of
the expenditures for GHG mitigation. Focus on the Agriculture Industry Many responses to GHG theory proposed
make water situation worse• Dams, water transfers south, biomass energy,
nuclear power

The Balance of Evidence - Says... Human Enhanced Water Evaporation
SHOULD BE THE major factor in Climate Change Equation
GHG impacts may still be a concern and are an indicator of energy waste so should still be reduced by reducing energy use
Finding the right solutions means addressing the right problem.

Does It Matter Which Theory is Right? Likely no theory is entirely right. Best strategy is to find “Robust Solutions”
which:• Minimize Water added to atmosphere• Reduce Energy Waste Fossil Fuel
Consumption Reduce GHG emissions
• Create Wealth (improve standard of living)

New Paradigms? Not Really Sustainable Development is based on:Reduce
• Waste of energy, water and other resources on trivial wants so they are there when future generations need them.
Reuse – Resources more than once Recycle – If you can’t do the first two. Replace – Feel good placebo in last place. Wasting
“Renewable” Power is still a waste of resources • Is it really green?

Summary of Our Choices
We have the ability to choose our responses
We should make the choices proactively We should ensure the right actions are
taken rather than the politically correct or expedient ones.
“There is more to life than increasing it’s speed.” - Mahatma Ghandi

Contact Information
New Paradigm Engineering Ltd.
10444 - 20 Avenue
Edmonton, Alberta
Canada T6J 5A2
tel: 780.448-9195
fax: 780.462.7297
email: [email protected]
web: www.newparadigm.ab.ca

Extra SlidesExtra Slides
Bruce Peachey, P.Eng.Bruce Peachey, P.Eng.President, New Paradigm Engineering President, New Paradigm Engineering
Ltd.Ltd.

Global Temperature Increases
Changes in measurement, motivation & technology, might have caused two step changes upwards in temperatures
1800 - 1920 best global readings would be near water - No demand for accuracy, just how does it feel (how hot and how cold)
Three temperature scales in use Reaumer close to Centigrade
• (0oR= 0oC; 80oR= 100oC so Reaumer gives lower readings)• Was there confusion between units in early records?

Global Temperature Increases
Step 1 - 1917 recognized that tropical and arctic air masses exist and mapping movement of the fronts allows better weather forecasts.
Focus on humidity and accurate temperatures Awareness of wet-bulb/dry-bulb grows.
• Before this did people care if the thermometer was wet?• Wet thermometers give lower average readings
Link to airports inland instead of seaports on the coast. Standardization of procedures, temperature scales,
and higher frequency of readings.
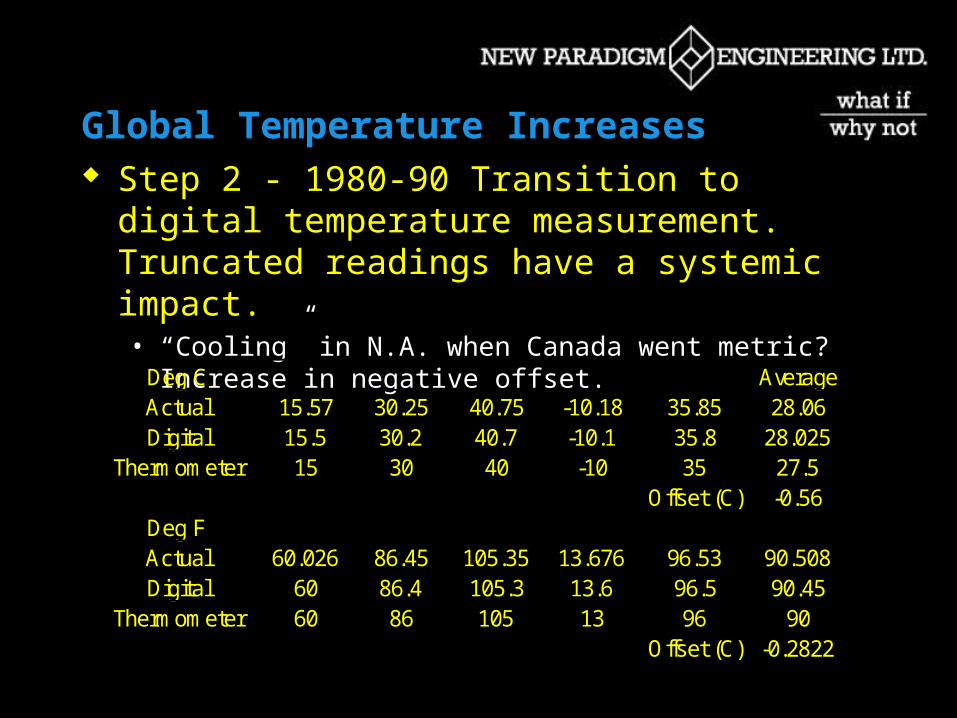
Global Temperature Increases Step 2 - 1980-90 Transition to digital temperature
measurement. Truncated readings have a systemic impact. • “Cooling” in N.A. when Canada went metric? Increase in
negative offset.Deg C AverageActual 15.57 30.25 40.75 -10.18 35.85 28.06Digital 15.5 30.2 40.7 -10.1 35.8 28.025
Thermometer 15 30 40 -10 35 27.5Offset (C) -0.56
Deg FActual 60.026 86.45 105.35 13.676 96.53 90.508Digital 60 86.4 105.3 13.6 96.5 90.45
Thermometer 60 86 105 13 96 90Offset (C) -0.2822
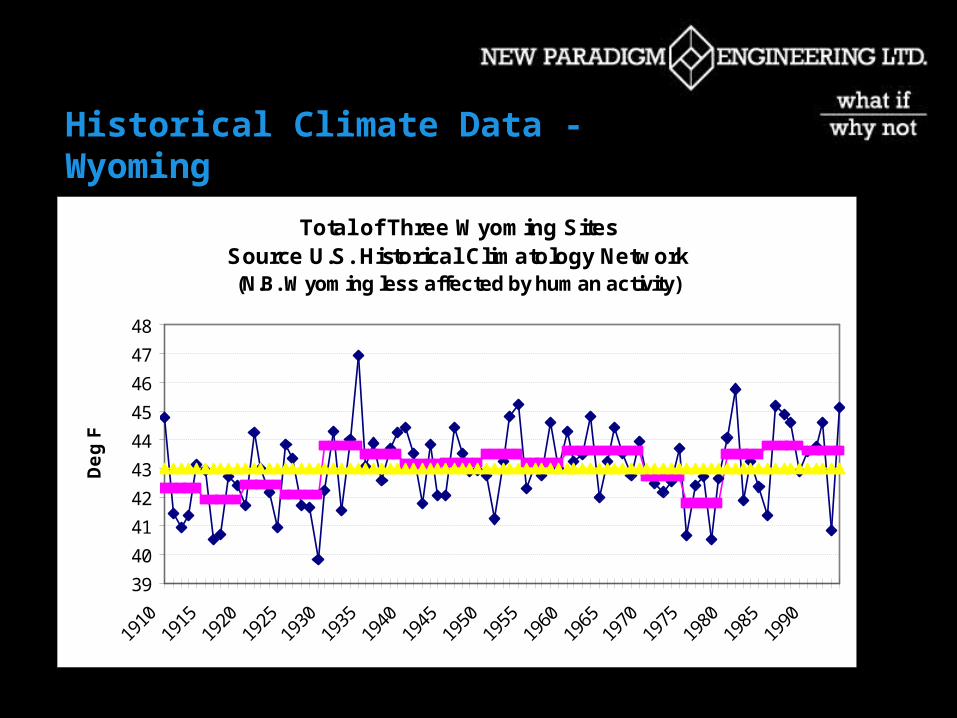
Historical Climate Data - Wyoming
Total of Three Wyoming SitesSource U.S. Historical Climatology Network(N.B. Wyoming less affected by human activity)
39
40
41
42
43
44
45
46
47
48
1910
1915
1920
1925
1930
1935
1940
1945
1950
1955
1960
1965
1970
1975
1980
1985
1990
De
g F
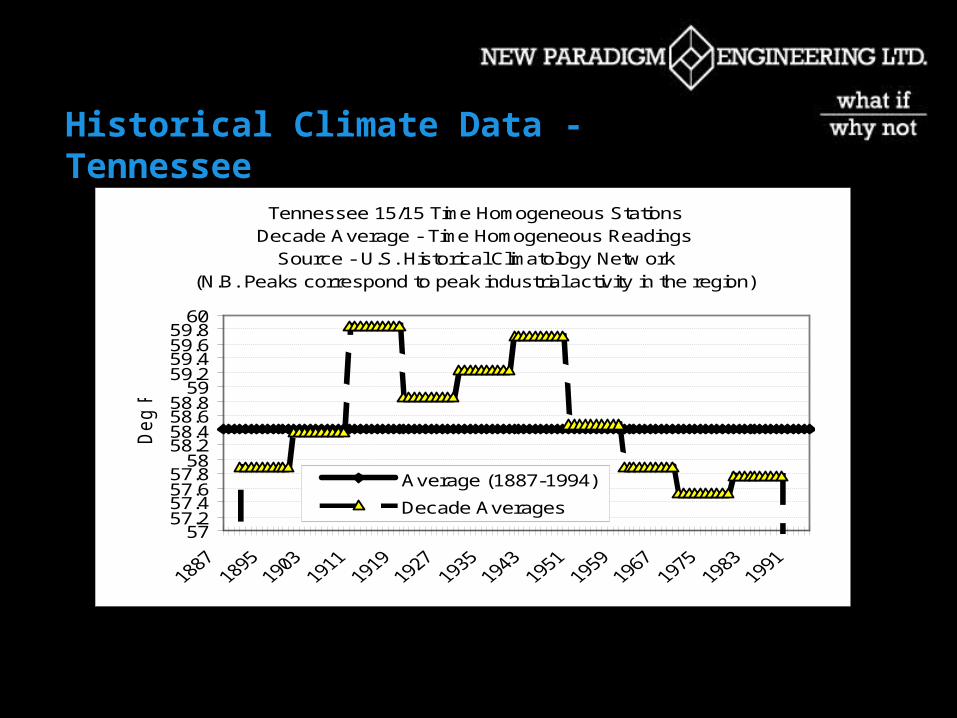
Historical Climate Data - Tennessee
Tennessee 15/15 Time Homogeneous StationsDecade Average - Time Homogeneous Readings
Source - U.S. Historical Climatology Netw ork(N.B. Peaks correspond to peak industrial activity in the region)
5757.257.457.657.8
5858.258.458.658.8
5959.259.459.659.8
60
Deg F
Average (1887-1994)
Decade Averages

Petroleum Exports = 79 Mt/yr
Natural Gas Exports = 62 Mt/yr
Alberta Overall Carbon Balance
Alberta Carbon Inventory All Sources = 300,000+ Mt (?)
Agri & Wood Exports = 6 Mt/yr
Petro-ChemicalsExports = 7 Mt/yr
Net to Atmosphere = 31 Mt/yr
Coal Exports = 11 Mt/yr
Alberta can continue to supply for 1500 years based on total carbon..But only 50 years based on economic reserves!
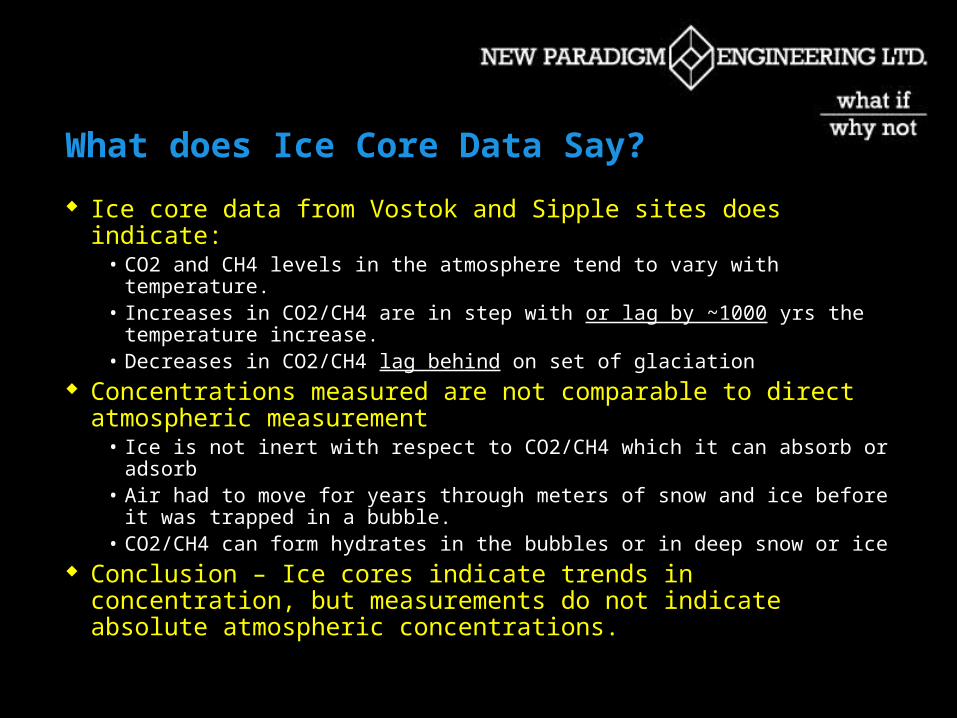
What does Ice Core Data Say?
Ice core data from Vostok and Sipple sites does indicate:• CO2 and CH4 levels in the atmosphere tend to vary with temperature.• Increases in CO2/CH4 are in step with or lag by ~1000 yrs the
temperature increase.• Decreases in CO2/CH4 lag behind on set of glaciation
Concentrations measured are not comparable to direct atmospheric measurement
• Ice is not inert with respect to CO2/CH4 which it can absorb or adsorb• Air had to move for years through meters of snow and ice before it was
trapped in a bubble.• CO2/CH4 can form hydrates in the bubbles or in deep snow or ice
Conclusion – Ice cores indicate trends in concentration, but measurements do not indicate absolute atmospheric concentrations.

The Case of the “Missing Carbon”The Facts
Global Carbon Emissions:• Emissions fossil fuel and cement = 5.4 Gt/yr• Deforestation & land-use = 0.5-2.5 Gt/yr
Carbon Accumulation in Atmosphere: • Calculated increase = 3.4 Gt/yr
Remainder (2-4 Gt/yr) is Missing!• Unexplained sink of CO2 in the northern hemisphere
Are we already sequestering carbon?• Do we get credits for it?

The Textbook Carbon Cycle
Oceans39,100 Gt
Fossil Fuels& Shale
19,300 Gt Vegetation &Humus
1,760 Gt
Atmosphere700 Gt
100 GtCombustion
.5 to 2 Gt
Combustion5 Gt
113 Gt
Source: “Introduction to Environmental Science”

Reality is More Complicated
Oceans39,100 Gt
“Fossil” Fuels& Shale
19,300 Gt Vegetation &Humus
1,760 Gt
Atmosphere700 Gt
100 GtCombustion
.5 to 2 Gt
Combustion5 Gt
113 GtHomes/Landfills etc.
Sewers 1-1.5 Gt
0.6 Gt
(-.4 Gt?)
+/-?
+/-?
? Gt subducted sediments? Gt subsea seeps
? Gt Sedimentation and formation of carbonates

Compare the Numbers Fossil Fuel
Combustion Energy to Atmosphere
• 500 - 750 x 109 GJ/yr• 500 – 750 EJ/yr (exajoules)• Mainly a one shot deal as energy
radiated
Water to Atmosphere• 7.5 – 10 Gt/yr• 1 t CH4 2 t H2O• 1 t Oil 1 t H2O
Carbon to Atmosphere• 3.4 Gt/yr - Net Measured from all
sources. (What portion is due to combustion?)
Water Losses (2/3 irrigation)
Energy to Atmosphere• 9000+ x 109 GJ/yr• 9000+ EJ/yr (exajoules)• Keeps on giving until it reaches
the ocean! Water to Atmosphere
• 4,000 Gt/yr• -10% of Surface flow to oceans• +5% of Land Evaporation
Carbon to Atmosphere• Unknown (+/-) due to plant
growth vs. decay in new agricultural areas under irrigation
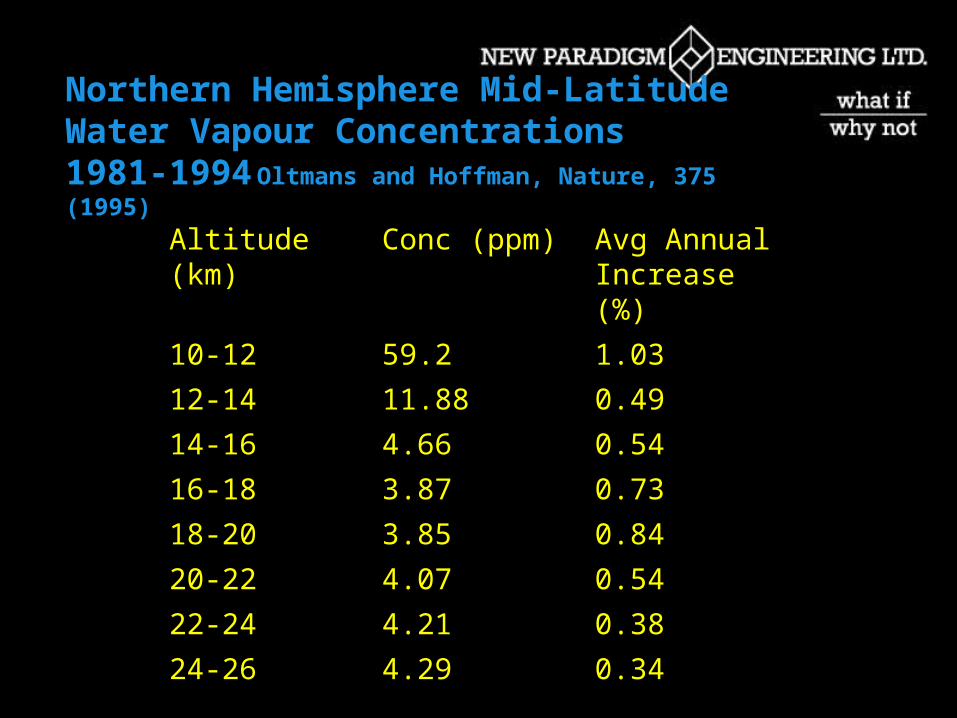
Northern Hemisphere Mid-Latitude Water Vapour Concentrations1981-1994 Oltmans and Hoffman, Nature, 375 (1995)
Altitude (km) Conc (ppm) Avg Annual Increase (%)
10-12 59.2 1.03
12-14 11.88 0.49
14-16 4.66 0.54
16-18 3.87 0.73
18-20 3.85 0.84
20-22 4.07 0.54
22-24 4.21 0.38
24-26 4.29 0.34
Related Documents