Climate Change Induced Vulnerability to Malaria and Cholera in the Lake Victoria Region A Final Report Submitted to Assessments of Impacts and Adaptations to Climate Change (AIACC), Project No. AF 91

Welcome message from author
This document is posted to help you gain knowledge. Please leave a comment to let me know what you think about it! Share it to your friends and learn new things together.
Transcript
Climate Change Induced Vulnerability to Malaria and Cholera in the Lake Victoria
Region
A Final Report Submitted to Assessments of Impacts and Adaptations to Climate Change (AIACC), Project No. AF 91

(Page intentionally left blank)
Climate Change Induced Vulnerability to Malaria and Cholera in the Lake Victoria
Region
A Final Report Submitted to Assessments of Impacts and
Adaptations to Climate Change (AIACC), Project No. AF 91
Submitted by Shem O. Wandiga
Kenya National Academy of Sciences, Nairobi, Kenya.
2006
Published by The International START Secretariat
2000 Florida Avenue, NW Washington, DC 20009 USA
www.start.org
Contents About AIACC…………………………………………………………………….page vi Summary Project information………………………………………………….page vii Executive Summary……………………………………………………………...page ix 1 Introduction..................................................................................................................................................1
2 Characterisation of Current Climate and Scenarios of Future Climate Change ........................2 2.1 GEOGRAPHICAL AND CLIMATIC SETTING...........................................................................................2
2.1.1 Malaria and climate overview ..................................................................................................3 2.1.2 Cholera and climate Overview.................................................................................................4
2.2 ACTIVITIES CONDUCTED .......................................................................................................................5 2.3 DESCRIPTION OF SCIENTIFIC METHODS AND DATA...........................................................................5
2.3.1 Selection of malaria and cholera study sites ..........................................................................5 2.3.2 Treatment of climatic and hydrological data.........................................................................8
2.4 MALARIA STUDY ....................................................................................................................................8 2.4.1 General climate and hydrological characteristics of the study sites.................................9 2.4.2 Interlinkages between climatic factors, hydrology, and incidence of malaria .............26 2.4.3 Modeling malaria transmission..............................................................................................31 2.4.4 Conclusion...................................................................................................................................32
2.5 CHOLERA STUDY..................................................................................................................................32 2.5.1 Climate and hydrological characteristics of the study site ...............................................32 2.5.2 Regional signals of cholera and El Niño linkages ..............................................................42 2.5.3 Case studies ................................................................................................................................45 2.5.4 Synthesis of biophysical results..............................................................................................49
3 Socio-Economic Futures ..........................................................................................................................51 3.1 MALARIA STUDY ..................................................................................................................................51
3.1.1 Description of scientific and data collection methods .......................................................51 3.1.2 Results ..........................................................................................................................................52
3.2 CHOLERA STUDY..................................................................................................................................54 3.2.1 Description of scientific and data collection methods .......................................................54 3.2.2 Results ..........................................................................................................................................54
4 Impacts and Vulnerability......................................................................................................................56 4.1 MALARIA EPIDEMICS ...........................................................................................................................56
4.1.1 Self medication ...........................................................................................................................56 4.1.2 Knowledge of disease ...............................................................................................................57
4.2 CHOLERA EPIDEMICS...........................................................................................................................57 4.3 VULNERABLE COMMUNITIES ..............................................................................................................60 4.4 CONCLUSIONS ......................................................................................................................................61
5 Adaptation ..................................................................................................................................................62 5.1 ACTIVITIES CONDUCTED .....................................................................................................................62 5.2 CONCLUSIONS ......................................................................................................................................62
6 Capacity Building Outcomes and Remaining Needs......................................................................66
7 National Communications, Science-Policy Linkages and Stakeholder Engagement.............67

8 Outputs of the Project ..............................................................................................................................69 8.1 OTHER PUBLICATIONS.........................................................................................................................69 8.2 PRESENTATIONS ...................................................................................................................................69
9 References ...................................................................................................................................................71
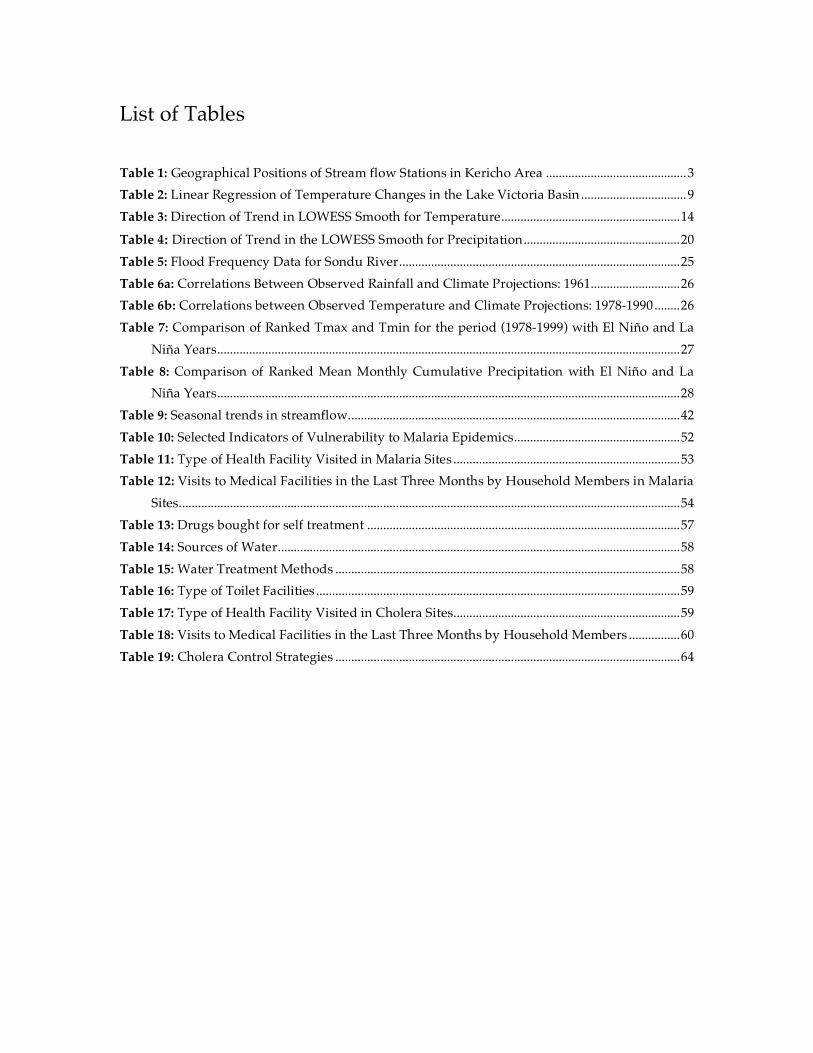
List of Tables Table 1: Geographical Positions of Stream flow Stations in Kericho Area ............................................3 Table 2: Linear Regression of Temperature Changes in the Lake Victoria Basin .................................9 Table 3: Direction of Trend in LOWESS Smooth for Temperature........................................................14 Table 4: Direction of Trend in the LOWESS Smooth for Precipitation.................................................20 Table 5: Flood Frequency Data for Sondu River........................................................................................25 Table 6a: Correlations Between Observed Rainfall and Climate Projections: 1961............................26 Table 6b: Correlations between Observed Temperature and Climate Projections: 1978-1990........26 Table 7: Comparison of Ranked Tmax and Tmin for the period (1978-1999) with El Niño and La
Niña Years.................................................................................................................................................27 Table 8: Comparison of Ranked Mean Monthly Cumulative Precipitation with El Niño and La
Niña Years.................................................................................................................................................28 Table 9: Seasonal trends in streamflow........................................................................................................42 Table 10: Selected Indicators of Vulnerability to Malaria Epidemics....................................................52 Table 11: Type of Health Facility Visited in Malaria Sites .......................................................................53 Table 12: Visits to Medical Facilities in the Last Three Months by Household Members in Malaria
Sites.............................................................................................................................................................54 Table 13: Drugs bought for self treatment ..................................................................................................57 Table 14: Sources of Water..............................................................................................................................58 Table 15: Water Treatment Methods ............................................................................................................58 Table 16: Type of Toilet Facilities ..................................................................................................................59 Table 17: Type of Health Facility Visited in Cholera Sites.......................................................................59 Table 18: Visits to Medical Facilities in the Last Three Months by Household Members ................60 Table 19: Cholera Control Strategies ............................................................................................................64
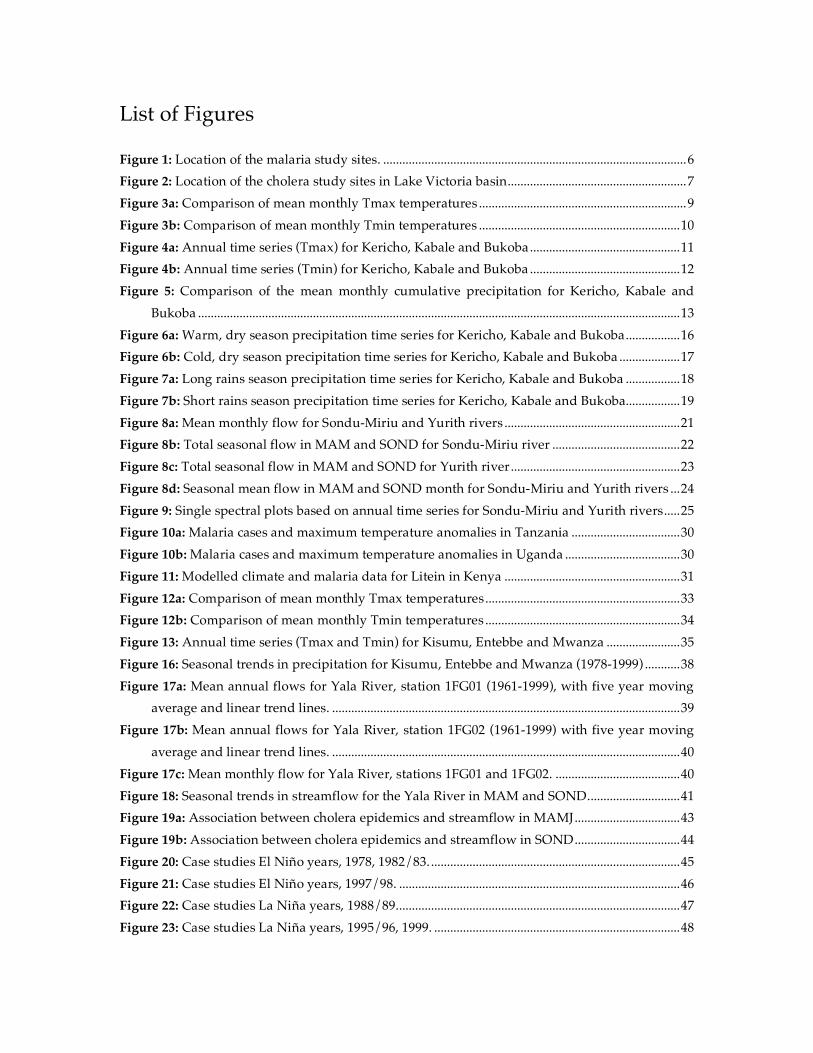
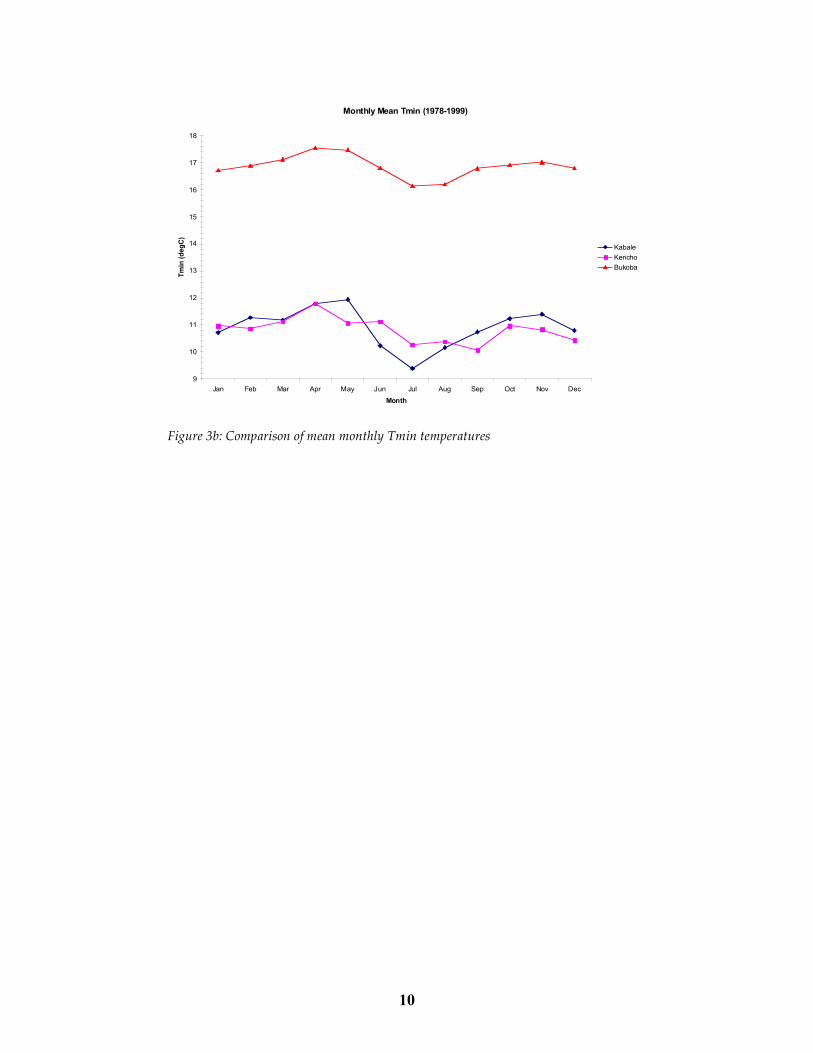
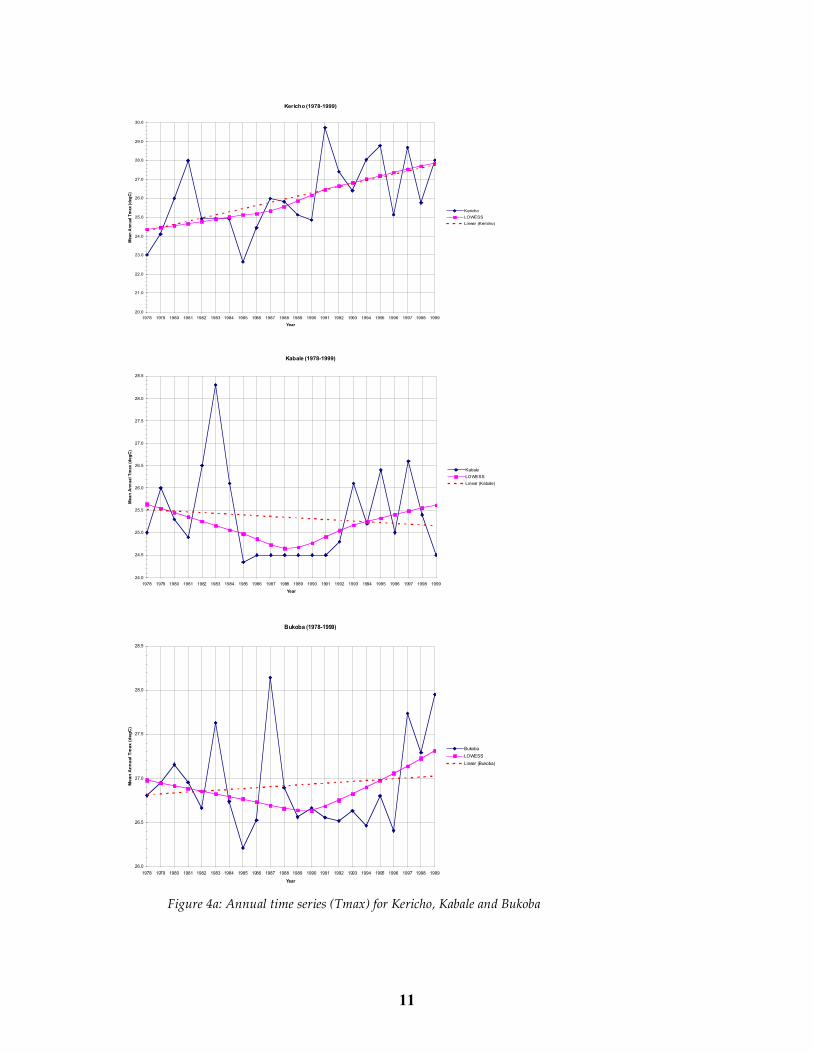
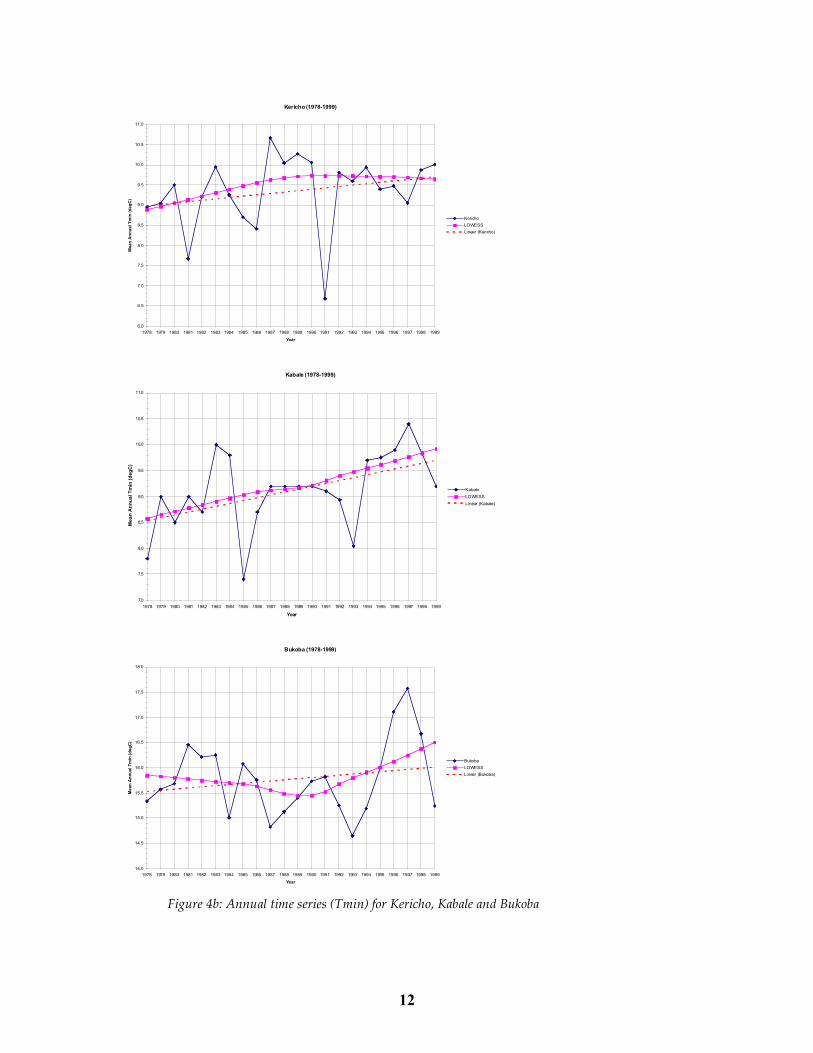
List of Figures Figure 1: Location of the malaria study sites. ...............................................................................................6 Figure 2: Location of the cholera study sites in Lake Victoria basin........................................................7 Figure 3a: Comparison of mean monthly Tmax temperatures .................................................................9 Figure 3b: Comparison of mean monthly Tmin temperatures ...............................................................10 Figure 4a: Annual time series (Tmax) for Kericho, Kabale and Bukoba...............................................11 Figure 4b: Annual time series (Tmin) for Kericho, Kabale and Bukoba ...............................................12 Figure 5: Comparison of the mean monthly cumulative precipitation for Kericho, Kabale and
Bukoba .......................................................................................................................................................13 Figure 6a: Warm, dry season precipitation time series for Kericho, Kabale and Bukoba.................16 Figure 6b: Cold, dry season precipitation time series for Kericho, Kabale and Bukoba ...................17 Figure 7a: Long rains season precipitation time series for Kericho, Kabale and Bukoba .................18 Figure 7b: Short rains season precipitation time series for Kericho, Kabale and Bukoba.................19 Figure 8a: Mean monthly flow for Sondu-Miriu and Yurith rivers .......................................................21 Figure 8b: Total seasonal flow in MAM and SOND for Sondu-Miriu river ........................................22 Figure 8c: Total seasonal flow in MAM and SOND for Yurith river.....................................................23 Figure 8d: Seasonal mean flow in MAM and SOND month for Sondu-Miriu and Yurith rivers ...24 Figure 9: Single spectral plots based on annual time series for Sondu-Miriu and Yurith rivers.....25 Figure 10a: Malaria cases and maximum temperature anomalies in Tanzania ..................................30 Figure 10b: Malaria cases and maximum temperature anomalies in Uganda ....................................30 Figure 11: Modelled climate and malaria data for Litein in Kenya .......................................................31 Figure 12a: Comparison of mean monthly Tmax temperatures.............................................................33 Figure 12b: Comparison of mean monthly Tmin temperatures .............................................................34 Figure 13: Annual time series (Tmax and Tmin) for Kisumu, Entebbe and Mwanza .......................35 Figure 16: Seasonal trends in precipitation for Kisumu, Entebbe and Mwanza (1978-1999) ...........38 Figure 17a: Mean annual flows for Yala River, station 1FG01 (1961-1999), with five year moving
average and linear trend lines. .............................................................................................................39 Figure 17b: Mean annual flows for Yala River, station 1FG02 (1961-1999) with five year moving
average and linear trend lines. .............................................................................................................40 Figure 17c: Mean monthly flow for Yala River, stations 1FG01 and 1FG02. .......................................40 Figure 18: Seasonal trends in streamflow for the Yala River in MAM and SOND.............................41 Figure 19a: Association between cholera epidemics and streamflow in MAMJ.................................43 Figure 19b: Association between cholera epidemics and streamflow in SOND.................................44 Figure 20: Case studies El Niño years, 1978, 1982/83...............................................................................45 Figure 21: Case studies El Niño years, 1997/98. ........................................................................................46 Figure 22: Case studies La Niña years, 1988/89.........................................................................................47 Figure 23: Case studies La Niña years, 1995/96, 1999. .............................................................................48
vi
About AIACC Assessments of Impacts and Adaptations to Climate Change (AIACC) enhances capabilities in the developing world for responding to climate change by building scientific and technical capacity, advancing scientific knowledge, and linking scientific and policy communities. These activities are supporting the work of the United Nations Framework Convention on Climate Change (UNFCCC) by adding to the knowledge and expertise that are needed for national communications of parties to the Convention.
Twenty-four regional assessments have been conducted under AIACC in Africa, Asia, Latin America and small island states of the Caribbean, Indian and Pacific Oceans. The regional assessments include investigations of climate change risks and adaptation options for agriculture, grazing lands, water resources, ecological systems, biodiversity, coastal settlements, food security, livelihoods, and human health.
The regional assessments were executed over the period 2002-2005 by multidisciplinary, multi-institutional regional teams of investigators. The teams, selected through merit review of submitted proposals, were supported by the AIACC project with funding, technical assistance, mentoring and training. The network of AIACC regional teams also assisted each other through collaborations to share methods, data, climate change scenarios and expertise. More than 340 scientists, experts and students from 150 institutions in 50 developing and 12 developed countries participated in the project.
The findings, methods and recommendations of the regional assessments are documented in the AIACC Final Reports series, as well as in numerous peer-reviewed and other publications. This report is one report in the series.
AIACC, a project of the Global Environment Facility (GEF), is implemented by the United Nations Environment Programme (UNEP) and managed by the Global Change SysTem for Analysis, Research and Training (START) and the Third World Academy of Sciences (TWAS). The project concept and proposal was developed in collaboration with the Intergovernmental Panel on Climate Change (IPCC), which chairs the project steering committee. The primary funding for the project is provided by a grant from the GEF. In addition, AIACC receives funding from the Canadian International Development Agency, the U.S. Agency for International Development, the U.S. Environmental Protection Agency, and the Rockefeller Foundation. The developing country institutions that executed the regional assessments provided substantial in-kind support.
For more information about the AIACC project, and to obtain electronic copies of AIACC Final Reports and other AIACC publications, please visit our website at www.aiaccproject.org.
vii
Summary Project Information Regional Assessment Project Title and AIACC Project No.
Climate Change-Induced Vulnerability to Malaria and Cholera in the Lake Victoria Region (AF 91)
Abstract
Endemic malaria in most of the hot and humid African climates is the leading cause of morbidity and mortality in the continent. In the last twenty or so years the incidence of malaria has been aggravated by the resurgence of highland malaria epidemics which hitherto had been rare. The communities in the highlands that have had less exposure to malaria are more vulnerable than their counterparts in the lowlands due to lack of immunity. However, the vulnerability of human health to climate variability is influenced by the coping and adaptive capacities of an individual or community. Surveys conducted among six communities in the East African highlands and lowlands reveal that the interplay of poverty and other socio-economic variables have intensified the vulnerability of these communities to the impacts of malaria and cholera. Analyses of past climate (temperature and precipitation), hydrological and health data (1961-2001), and socio-economics status of communities from the East African Highlands confirm the link between climate variability and the incidence and severity of malaria epidemics.
Cholera epidemics have recorded history in eastern Africa region dating back to 1836. Cholera is now endemic in the Lake Victoria basin, at least since the early 1970s. Thus in 1998 more than 72% of global total number of cholera cases was reported in Africa.
Analyses of climate parameters (precipitation and temperatures) over the period 1978-2002 has been coupled with the analyses of hydrological characteristics of River Yala that serves as a suitable proxy for the Kisumu cholera study site. Other sites had no gauged rivers. The results of these analyses have been correlated to the incidences of cholera epidemics. The analyses show that seasonal trend analysis of high peak flows are closely associated with cholera epidemics whose mortality and morbidity is several orders of magnitude more intense than the hygienic cholera episodes. The incidences of high cholera epidemics coincide with high flow peaks and high temperatures before and during El Niño years. Cholera epidemic coincidence with stream flow is not evident in the other non El Niño years.
Administering Institutions
Kenya National Academy of Sciences, Utalii House, Room 801 Utalii Street, P. O. Box 39450, Nairobi, Kenya; University of Dar es Salaam Institute for Resources Assessment, P.O. Box 35097, Dar es Salaam, Tanzania; and Uganda National Academy of Sciences (UNAS), 10th Floor, Uganda House, Kampala Road, P. O. Box 23911, Kampala, Uganda.
Participating Stakeholder Institutions
Ministry of Environment and Natural Resource, National Environment Management Authority, Climate Change (UNFCCC) Communication Contact: P.O. Box 67839, Nairobi, Kenya; Kenya Medical Research Institute, P.O. 54840 Nairobi, Nairobi, Kenya; Division of Environment, Vice President’s Office, Climate Change (UNFCCC) Communication Contact, Dar es Salaam, Tanzania; District Councils Muleba and Biharamulo Districts, Kagera Region,Tanzania; and Department of Meteorology Climate Change (UNFCCC) Communication Contact, P.O. Box 7025, Kampala, Uganda.
Countries of Primary Focus
Kenya, Tanzania and Uganda
viii
Case Study Areas
Kenya: Kericho and Kisumu; Uganda: Kampala and Kabale: and Tanzania: Biharamulo and Muleba.
Systems and Sectors Studied
Human health and socio-economic status
Groups Studied
Women, men, children, elderly, rural poor.
Sources of Stress and Change
Changes in mean annual and seasonal climate and Hydrology; extreme climate events; disease epidemics and socio-economic indicators.
Project Funding and In-kind Support
AIACC: US$ 224,800 grant; USAID: US$ 15,000 supplemental grant for Capacity Building and/or Stakeholder Engagement; US$ 60,000: The Kenya National Academy of Sciences, Uganda National Academy of Sciences, the University of Nairobi, Makerere University, Drought Monitoring Centre-Nairobi, Clark University, and the Institute of Resource Assessment, University of Dar Es Salaam; and Fulbright Fellowship to support Michael Marshall, a student on the project.
Investigators
Principal Investigator: Shem O. Wandiga Kenya National Academy of Sciences, Utalii House, Room 802, Utalii Street, P. O. Box 39450, Nairobi, Kenya. Tel: +254 020 315540; Fax: +254 020 247301; email: [email protected]
Other Investigators: Maggie Opondo and James Kathuri, Department of Geography, University of Nairobi, P. O. Box 30197, Nairobi, Kenya; Daniel Olago, Eugene Apindi and Lydia Olaka, Department of Geology, University of Nairobi, P. O. Box 30197, Nairobi, Kenya; Andrew Githeko, Kenya Medical Research Institute, P. O. Box 54540 Kisumu, Kenya; Faith Githui, Alfred Opere, and Laban Ogallo, Department of Meteorology, University of Nairobi, P.O. Box 30197, Nairobi, Kenya; Michael Marshall and Tim Downs, Clark University, International Development, Community, and Environment Department, 950 Main Street, Worcester, MA 01610-1477; Pius Z. Yanda, Richard Kangalawe and Rehema Sigalla, Instituted of Resource Assessment, University of Dar es Salaam, P. O. Box 35097 Dar-es Salaam, Tanzania; Robert Kabumbuli and Edward Kiramura, Department of Sociology, Makerere University, P.O. Box 7062, Kampala, Uganda; Paul Mugambi, Robinah Nanyunja, and Timothy Baguma, Department of Mathematics, Makerere University, P.O. Box 7062, Kampala, Uganda; and Pius Achola, Private Medical Consultant, P.O. Box 44368-00100, Nairobi.
ix
Executive Summary Research problem and objectives Malaria in tropical Africa is the leading cause of morbidity and mortality in the continent. In the last two decades the incidence of malaria has been aggravated by the resurgence of highland malaria epidemics, which hitherto had been rare. A close association between malaria epidemics and climate variability has been reported but not universally accepted. Similarly, the relationship between climate variability, intensity of disease mortality and morbidity coupled with socio-economic factors has been mooted but not proven.
The focus of this study is to improve the understanding of the relationship between climate change parameters (precipitation, hydrology and temperature) and the incidences of malaria and cholera in the Lake Victoria region (Kenya, Uganda and Tanzania).
Approach The study began with the characterization of baseline temperature and precipitation variability and applied existing climate models and scenarios to estimate possible perturbations to these conditions. The hydrological characteristics and GIS layer maps of the study sites were constructed using historical precipitation data, river flows and surveyed socio-economic data. Time series analyses were used to correlate the relationship between climate, hydrology and disease incidences. In order to assess vulnerability of pilot groups, the teams used participatory methodologies and socioeconomic analysis tools, including retrospective and prospective data analysis to estimate the excess risk of malaria and cholera that may be attributable to future climate change.
The study team identified priority risk groups based on exposure potential, worked with pilot populations (representative of priority risk groups) to distinguish risk management strategies and selected preferred options to inform policy.
Scientific findings The analyses of climate (temperature and precipitation) and hydrological data reveal the following:
The ranked Tmax and Tmin values indicate that high Tmax years are associated with El Niño occurrences, strongly suggesting that positive excursions in maximum temperature are significantly linked to ENSO. Only two low Tmax years were observed in 1978 and 1985 in Kericho and in 1985 in Bukoba, suggesting that these occurrences are more related to variability in local conditions rather than to the larger scale synoptic weather patterns. Further the Tmin years point to possible influences by the strong El Niño’s of 1982-83 and 1997-98 in Kabale and Bukoba areas, but not in the Kericho site. The Kericho site appears to have its own peculiar microclimate whose influence sometimes overrides the more regional temperature enhancing or cooling effects of El Niño and La Niña, respectively. The low Tmin years are invariably affected by milder El Niño’s, and there is higher variability in local responses to such El Niño’s amongst the three sites. This suggests that during mild El Niño’s, the increased regional temperature effect is effectively muted, and also counteracted by increased and persistent widespread but heterogeneous cloudiness in the lake region. The year 1985 is interesting in that it is associated with low Tmax in Kericho area, low Tmin in Kabale area, and generally was a dry year as reflected by low flows in the rivers.
Evidence for a decadal cycle that influences climate (temperature) variability as indicated by the LOWESS (Locally Weighted Scatter plot Smooth) curve is supported by the synchronicity of the trend changes in the temperature records (maxima or minima) occurring in the Tmax (Kabale and Bukoba, minimum) and Tmin (Kericho, maximum; Bukoba, minimum), and by inflections in the strongly significant and tightly coupled LOWESS and linear regression curves for Kericho (Tmax) and Kabale (Tmin) in the years 1988/89. Such a decadal cycle has also been observed in the
x
hydrological records for the Kericho site, which appears to have its most pronounced influence during the ‘short rains’ season, though it is also observed during the long rains season. Its variable influence around the lake basin is probably dictated by meso- to micro-scale differences in weather patterns. The influence of El Niño years and/or the effect of the Indian Ocean dipole reversal that also leads to high temperatures and precipitation in eastern Africa are clearly evidenced by the sharp positive excursions in temperature. The results concur with previous studies that determined an increasing trend in Tmin and Tmax over the majority of East Africa, with a few stations along Lake Victoria shoreline showing decreasing Tmin or ‘no trend’ characteristics. Locations along the lake have strong thermally induced meso-scale circulation, which together with local moisture sources can often modify large-scale circulation patterns, such as El Niño.
The ranked mean monthly cumulative precipitation data (1978-1999) show that in Kericho, wet years occur either during El Niño and La Niña years. While the strong El Niño of 1982-83 affected Kericho, the one of 1997-98 was not significantly wetter than other years in the period of analysis. In Kabale, wet years appear to be associated more with La Niña and El Niño, but more consistently with La Niña. This may indicate the much stronger coupling of Kabale area with Atlantic airstreams and a relatively weaker influence of the southwest Indian monsoon that appears to predominate in Kericho and Bukoba. In Bukoba, wet years are associated with El Niño and one occurrence of high rainfall has been observed during a non-El Niño/La Niña year (1985). The response to El Niño at this site is, however, more erratic and more widely spaced in time. Dry years in Kericho occur during El Niño and non-El Niño/La Niña years. In Kabale, dry years occur during El Niño, and there are single occurrences of such dry years during a La Niña and non-El Niño/La Niña year. In Bukoba, dry years are associated with non-El Niño/La Niña years, but it is significant that during the strong El Niño of 1982-83, Bukoba was generally dry, but experienced a ‘normal’ rainfall season in SOND (September, October, November and December).
While rainfall in East Africa tends to be above normal during ENSO years and rainfall deficits tend to occur in the ENSO (+1) years, the highlands often experience deficits during the boreal summer and the short-rain season of ENSO years and above normal rainfall during these months in the ENSO (+1) years. The observed heterogeneity in the rainfall patterns around Lake Victoria may be partly accounted for, to varying degrees, by a combination of factors such as differences in topography and aspect, changes in land use, the influence of Lake Victoria, and land-ocean interaction.
The communities in the highlands that have had less exposure to malaria are more vulnerable than their counterparts in the lowlands due to lack of immunity. However, the vulnerability of human health to climate variability is influenced by the coping and adaptive capacities of an individual or community. Surveys conducted among three communities in the East African highlands reveal that the interplay of poverty and other socio-economic variables have intensified the vulnerability of these communities to the impacts of malaria. Analyses of past climate (temperature and precipitation), hydrological and health data (1961-2001), and socio-economics status of communities from the East African Highlands confirm the link between climate variability and the incidence and severity of malaria epidemics.
Cholera epidemics have been recorded in history in the eastern Africa region, dating back to 1836. Each cholera epidemic incidence inflicts a high toll on human lives. However, the decline in cholera epidemic incidences between 1836 and 1970 caused a relaxation in public medical health preparedness until it resurfaced after 1970. Cholera is now endemic in the Lake Victoria basin, at least since the early 1970s (Rees, 2000), and in East Africa outbreaks have been reported to the World Health Organization (WHO) since 1972. Cholera epidemics within the East Africa region in recent decades occurred during the following years: 1978 (All), 1980 (All), 1981 (Kenya, Tanzania), 1982 (All), 1988 (Tanzania), 1991 (Tanzania, Uganda), 1992 (All), and 1997 (All). Thus, in 1998, more than 72% of the total global cholera cases were reported in Africa. The Lake Victoria region has one of the poorest populations of 30 million people and it is projected to increase to 53 million by 2025.
Climate in equatorial eastern Africa is complex and influenced by large scale tropical controls which include several major convergence zones superimposed upon regional factors associated
xi
with lakes, topography and the maritime influence. The inter-annual variability of rainfall is remarkably coherent throughout most of eastern Africa despite quite diverse climatic mean conditions. The largest portion of this variability is accounted for by the “short rains” season of October-December. Analyses of climate parameters (precipitation and temperatures) over the period 1978-2002 has been coupled with the analyses of hydrological characteristics of River Yala that serves as a suitable proxy for the Kisumu cholera study site. The other lowland sites had no gauged rivers. The results of these analyses have been correlated to the incidences of cholera epidemics and socio economic characteristics of the communities.
The results show that the seasonal trend analysis of high peak flows is closely associated with cholera epidemics, whose morbidity is several orders of magnitude more intense than the non-epidemic (hygienic) cholera episodes. The incidences of high cholera epidemics coincide with high flow peaks during El Niño years. Cholera epidemic coincidence with streamflow is not evident in the other non El Niño years. Furthermore, during the El Niño year the stream flow during the short rains season exceeds that in the long rains season. In addition, Tmax appears to influence the onset of cholera epidemics. In the years that cholera epidemics occurred (1982/3 and 1997/8), high above normal temperatures were recorded. Sustained high above normal temperatures during the first season, January, February and March (JFM) followed by a slight cooling in the second season, June, July and August (JJA) and above normal warming during the third season, September, October, November and December (SOND) triggers an outbreak of a cholera epidemic. Above normal precipitation and flooding alone without the above normal temperatures do not trigger outbreaks of cholera epidemics. The hygienic cholera outbreaks are associated with long rains season or short rains season when there is above normal rainfall and temperatures during the season but the casualties of such outbreaks are low compared to the cholera epidemic years.
Capacity building outcomes and remaining needs
From the experiences gained, the project encouraged the implementation of preferred adaptation strategies in communities to strengthen local coping capacity and monitor performance. The study incorporated capacity building in global change research in all of its activities, by training young scientists and engaging stakeholders and research scientists in the region.
The project trained the following persons: Two PhD students - Robert Kabumbuli and Faith Githui, both continuing their studies; one Fulbright Fellow - Michael Marshall; three Masters students - Rehema Sigalla (M.A. completed), Eugene Apindi (MSc ongoing) and Lydia Olaka (MSc ongoing); and two graduate assistants - Robinah Nanyunja and Timothy Baguma. In addition to the students, the capacities of the community leaders at each of the six study sites were improved with respect to knowledge of disease vulnerability and adaptation strategies.
National communications, science-policy linkages and stakeholder engagement
The project has been captured in the Kenya’s second national communication report on vulnerability and adaptation.
Policy implications and future directions The research results have been factored into the national policies of the three East African countries’ malaria and cholera programs.
1
1 Introduction This report is an outcome of the AIACC AF-91 Project, which looks at the impacts, vulnerability and adaptations to climate change-induced malaria and cholera in the Lake Victoria Region, East Africa. Malaria is endemic to the region and has been creeping upwards from lowlands to highlands. Cholera is also common in the region particularly in areas around the lakeshore. Climate change combined with land use changes and human population may aggravate the malaria and diarrhoeal diseases in the lake region.
Scientific evidence shows that East Africa is not shielded from global environmental change taking place in all regions. Both climatic and environmental changes have resulted in declining agricultural productivity, deterioration of water quality and quantity and loss of biodiversity. Increasing human and animal population and other activities has resulted in changes in land use, land cover, desertification and general environmental degradation (Hulme, 1996).
Global climate change, and its interactive components such as water availability, related vulnerability of natural and socio-economic systems and health, changes in land use, as well as water policies, is the major issues affecting availability, quality, quantity and human well-being. The apparent correlation between disease outbreaks such as malaria, cholera, rift valley fever and meningitis (all of which are sensitive to climate variability (IPCC, 2001) and the strong El Niño years e.g. 1982-83 and the 1997-98 events indicate a causal link between climate and health. Integrated climate-disease models show that rates of infections can be affected by climatic anomalies.
Malaria and cholera epidemics have occurred to varying degrees in the East African region in the last decades. As a consequence health authorities have had a problem in deciding which of these factors are the most important and therefore which policy interventions to institute. It is critical to know what to expect in the future in terms of disease trends so that adaptive measures can be put in place. Equally, it is important to establish the population’s adaptive capacity in terms of the ability to prevent and treat climate related illnesses. According to IPCC Report (2001), adaptation refers to adjustments in ecological, social, or economic systems in response to actual or expected climatic stimuli and their effects or impacts. It refers to changes in process, practices and structures to moderate potential damages or benefits from opportunities associated with climate change. The adaptive capacity of a community is determined by its socio-economic characteristics.
The report explains the vulnerability to climate change, impacts and adaptation to malaria and cholera by the local communities in the Lake Victoria Region with specific case study from Tanzania, Kenya and Uganda. Future projections of climate for the Lake Victoria region have been downscaled from model outputs using SRES emission scenarios. These projections together with (i) relevant socio-economic information and (ii) knowledge gathered from the database analyses forms the foundation for an analyses of linkages between climate and disease, impacts and adaptation strategies for climate change induced malaria and cholera. This is an initiative towards the development of capacity in the regional climate change research, particularly as it relates to vulnerability and adaptations to climate change. It also aims at informing policy related to malaria and cholera in the advent of climate change.
2
2 Characterisation of Current Climate and Scenarios of Future Climate Change
This study had two components: 1) to study unstable malaria epidemics in the highland regions of Lake Victoria basin, and; 2) to study cholera epidemics in the lowland regions of Lake Victoria basin. The methods used in addressing the climate and scenarios of future climate change are the same for both components of the study. These are therefore addressed in a composite manner.
2.1 Geographical and Climatic Setting The Lake Victoria basin (0°21’N – 3°
0’S; E) has a catchment area of 181,000 km2 and a total water
area of 68,800 km2. The catchment area is shared by Kenya, Uganda, Tanzania, Rwanda, and Burundi, while the lake itself is shared by Kenya, Uganda and Tanzania, with each owning six, fifty-one and forty-three percent respectively. The human population is high, estimated to be about 30 million (World Bank, 1996), growing rapidly, and heavily concentrated near the lake (Cohen et al., 1996). The lake basin supports one of the densest (well over 100/km2, and up to 1200/ km2) and poorest rural populations in the world (Hoekstra and Corbett, 1995; Cohen et al., 1996). The population of the region is expected to double within the next two decades (World Bank 1999).
Meteorologically, equatorial eastern Africa is one of the most complex sectors of the African continent (Nicholson, 1996). The large-scale topical controls, which include several major convergence zones, are superimposed upon regional factors associated with lakes, topography and the maritime influence (Nicholson, 1996). As a result, the climatic patterns are markedly complex and change rapidly over short distances (Nicholson, 1996). Over East Africa, the annual temperature range is 2°C, with the lowest values in March to April and the highest in July to August, while the diurnal temperature range is of the order of 10 to 20°C, far exceeding the former (Hastenrath, 1984). The mean annual net radiation in East Africa is between 450 and 550 cals/cm2/day (received on a horizontal surface); the mean annual bright sunshine amounts to <7 to 8 hours per day in the highlands and 8 to >9 hours per day in the lowlands (Thompson, 1965).
The catchment, therefore, has broadly homogeneous weather conditions typified by short and long rainy seasonal patterns with intermittent convectional rains that are influenced by the lake’s microclimate. The spectrum for rainfall for the East African region is dominated by a strong peak at 5 to 6 years. This is also a dominant timescale for the ‘El-Niño-Southern Oscillation (ENSO)’ phenomenon and for ‘Sea-Surface Temperatures (SSTs)’ fluctuations in the equatorial Indian and Atlantic Oceans. Rainfall variability is closely linked to both ENSO and SSTs in the Indian and Atlantic Oceans, and it tends to be enhanced in East Africa during ENSO years (Ropelewski and Halpert, 1987; Ogallo, 1989). Significant peaks at about 3.5 and 2.3 years are also evident (Nicholson, 1996). One characteristic of the inter-annual variability is its extreme magnitude in individual years, for example the conditions of 1961, when Lake Victoria rose several meters and reached levels unattained since the nineteenth century (Nicholson, 1996). The 1961 and the 1997/98 events that have traditionally been linked to El Niño have now been found to have been most strongly influenced by Indian Ocean SST dipole reversals (cf. Conway, 2002). The inter-annual variability of rainfall is remarkably coherent throughout most of eastern Africa despite quite diverse climatic mean conditions; the largest portion of this variability is accounted for by the ‘short rains’ season of October-December (Nicholson, 1996). In relation to malaria, such climate variability may have an influence on the availability of breeding grounds for the mosquitoes.
Recent studies show that ENSO and to a larger degree Indian Ocean anomalies account for a significant portion of variability in the short-rain season (Anyamba et al. 2002; Mutai et al. 1998; Latif and Dommengent 1999). During El Niño years, Lake Victoria rainfall is expected on average to increase 15-25% (Janowiak 1988). In the 1997-1998 El Niño, however, warm SST anomalies in western equatorial Indian Ocean combined with a warm ENSO led to an increase in precipitation of more than 200% (Birkett et al. 1999).
3
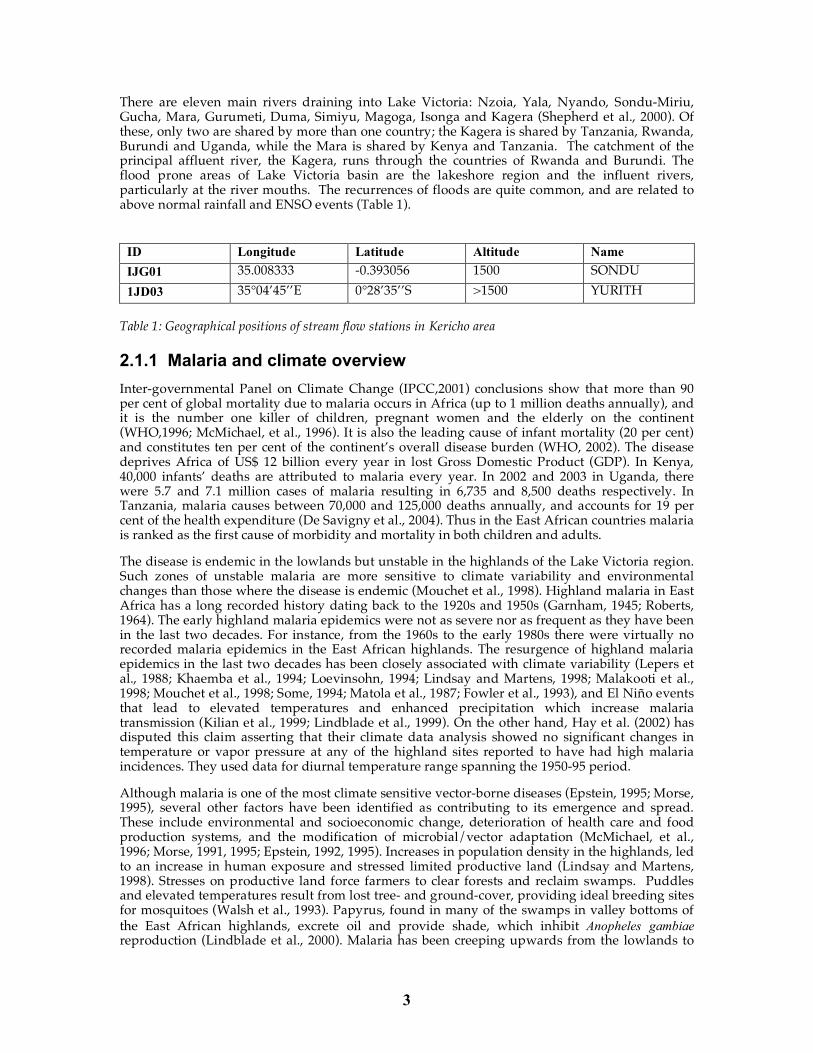
There are eleven main rivers draining into Lake Victoria: Nzoia, Yala, Nyando, Sondu-Miriu, Gucha, Mara, Gurumeti, Duma, Simiyu, Magoga, Isonga and Kagera (Shepherd et al., 2000). Of these, only two are shared by more than one country; the Kagera is shared by Tanzania, Rwanda, Burundi and Uganda, while the Mara is shared by Kenya and Tanzania. The catchment of the principal affluent river, the Kagera, runs through the countries of Rwanda and Burundi. The flood prone areas of Lake Victoria basin are the lakeshore region and the influent rivers, particularly at the river mouths. The recurrences of floods are quite common, and are related to above normal rainfall and ENSO events (Table 1).
ID Longitude Latitude Altitude Name IJG01 35.008333 -0.393056 1500 SONDU 1JD03 35°04’45’’E 0°28’35’’S >1500 YURITH
Table 1: Geographical positions of stream flow stations in Kericho area
2.1.1 Malaria and climate overview Inter-governmental Panel on Climate Change (IPCC,2001) conclusions show that more than 90 per cent of global mortality due to malaria occurs in Africa (up to 1 million deaths annually), and it is the number one killer of children, pregnant women and the elderly on the continent (WHO,1996; McMichael, et al., 1996). It is also the leading cause of infant mortality (20 per cent) and constitutes ten per cent of the continent’s overall disease burden (WHO, 2002). The disease deprives Africa of US$ 12 billion every year in lost Gross Domestic Product (GDP). In Kenya, 40,000 infants’ deaths are attributed to malaria every year. In 2002 and 2003 in Uganda, there were 5.7 and 7.1 million cases of malaria resulting in 6,735 and 8,500 deaths respectively. In Tanzania, malaria causes between 70,000 and 125,000 deaths annually, and accounts for 19 per cent of the health expenditure (De Savigny et al., 2004). Thus in the East African countries malaria is ranked as the first cause of morbidity and mortality in both children and adults.
The disease is endemic in the lowlands but unstable in the highlands of the Lake Victoria region. Such zones of unstable malaria are more sensitive to climate variability and environmental changes than those where the disease is endemic (Mouchet et al., 1998). Highland malaria in East Africa has a long recorded history dating back to the 1920s and 1950s (Garnham, 1945; Roberts, 1964). The early highland malaria epidemics were not as severe nor as frequent as they have been in the last two decades. For instance, from the 1960s to the early 1980s there were virtually no recorded malaria epidemics in the East African highlands. The resurgence of highland malaria epidemics in the last two decades has been closely associated with climate variability (Lepers et al., 1988; Khaemba et al., 1994; Loevinsohn, 1994; Lindsay and Martens, 1998; Malakooti et al., 1998; Mouchet et al., 1998; Some, 1994; Matola et al., 1987; Fowler et al., 1993), and El Niño events that lead to elevated temperatures and enhanced precipitation which increase malaria transmission (Kilian et al., 1999; Lindblade et al., 1999). On the other hand, Hay et al. (2002) has disputed this claim asserting that their climate data analysis showed no significant changes in temperature or vapor pressure at any of the highland sites reported to have had high malaria incidences. They used data for diurnal temperature range spanning the 1950-95 period.
Although malaria is one of the most climate sensitive vector-borne diseases (Epstein, 1995; Morse, 1995), several other factors have been identified as contributing to its emergence and spread. These include environmental and socioeconomic change, deterioration of health care and food production systems, and the modification of microbial/vector adaptation (McMichael, et al., 1996; Morse, 1991, 1995; Epstein, 1992, 1995). Increases in population density in the highlands, led to an increase in human exposure and stressed limited productive land (Lindsay and Martens, 1998). Stresses on productive land force farmers to clear forests and reclaim swamps. Puddles and elevated temperatures result from lost tree- and ground-cover, providing ideal breeding sites for mosquitoes (Walsh et al., 1993). Papyrus, found in many of the swamps in valley bottoms of the East African highlands, excrete oil and provide shade, which inhibit Anopheles gambiae reproduction (Lindblade et al., 2000). Malaria has been creeping upwards from the lowlands to
4
the highlands in the Lake Victoria region in East Africa, and indications are that it has been aggravated by climate variability and change, and poverty.
Temperature and precipitation in the highlands, as a result of predicted climate change, are expected to rise above the minimum temperature and precipitation thresholds of malaria transmission in various parts of the region (Githeko et al., 2000). In addition to temperature and precipitation, other physical variables, such as soil moisture or its proxies (e.g. stream flow), improve transmission modeling, as they explain the interaction between precipitation, temperature, and the ground (Patz et al., 1998). This study explores the interplay between climate change, hydrology, socioeconomic factors, and the incidence of epidemic malaria in target populations living in the highlands of the Lake Victoria basin. In addition, the paper examines the vulnerability and coping strategies of these target populations, as well as the excess risk to which they are exposed as a result of climate change.
2.1.2 Cholera and climate overview In East Africa, a cholera epidemic was first reported in 1836; this was constrained along the Indian Ocean coast, killing as many as 20,000 people in Zanzibar alone, and almost depopulated the coastal towns of Lamu, Malindi and Kilwa (Rees, 2000). Between the years 1870 and 1970 there were no reported cases of cholera in Africa (Waiyaki, 1996). Thus, the trend in cholera cases in Africa appeared to be on the decline until major outbreaks began spreading across the continent: in 1970, outbreaks were reported in west Africa (Guinea) and the horn of Africa (Ethiopia, Somalia and Sudan) and reached Kenya in 1971 (Waiyaki, 1996). The most severe cholera outbreak on the African continent was in 1998, accounting for more than 72% of the global total number of cholera cases. The countries most severely affected by the 1998 epidemic were the Democratic Republic of Congo, Kenya, Mozambique, Uganda, and the United Republic of Tanzania (WHO 2000). Cholera is now endemic in the Lake Victoria basin, at least since the early 1970s (Rees, 2000), and in East Africa the outbreaks have been reported to the World Health Organization (WHO) since 1972. Cholera epidemics within the East Africa region in recent decades occurred during the following years: 1978 (All), 1980 (All), 1981 (Kenya, Tanzania), 1982 (All), 1988 (Tanzania), 1991 (Tanzania, Uganda), 1992 (All), and 1997 (All).
Cholera is an acute, often fatal intestinal infectious disease caused by Vibrio cholera: it may be endemic or epidemic, and most infections occurring over the last three decades or so have been predominantly due to Vibrio cholerae biotype E1 (Waiyaki, 1996). Well over 100 years ago, Snow (summarized in Waiyaki, 1996) established that cholera was transmitted through the fecal-oral route, and attributed its transmission to the following factors: ingestion of contaminated water and food; and lack of scrupulous attention to personal cleanliness especially hand washing following contact with bedding and other materials used by those with cholera. Snow asserted that poverty and poor hygienic practices among the working class tended to promote transmission. Snow proposed the following strategies for control of malaria: supply of good clean water; good drainage; improved housing and less crowding; provision of public toilets; public health education on the importance of personal and domestic cleanliness; and screening of sick persons. These measures proposed by Snow are still valid today (Waiyaki, 1996). A recent study in Lake Victoria basin (Shapiro et al., 1999) noted that the specific risk factors for cholera in the region include: drinking water from Lake Victoria or from a stream, sharing food with a person with watery diarrhea, and attending funeral feasts. In addition to these factors, Shapiro et al. (1999) found that cholera was more common amongst those living in villages bordering Lake Victoria, compared with those who lived in the hinterland. As early as the late 19
th century,
cholera outbreaks were associated with heavy rains, as Christie (1876) observed that most cholera epidemics along the East African coast started during the monsoons. In more recent years, cholera epidemics have been attributed to the seasonality of sea surface temperatures (Patz 2002). This is because the SST is related to the rainfall. Vibrio cholerae prefers to attach itself to chitinaceous zooplankton and shellfish. Zooplankton and shellfish increase in numbers, following large bursts of phytoplankton associated with warm sea surface temperatures (Colwell 1996). Other factors, such as ENSO and disease levels prior to an epidemic have also been found to significantly regulate the onset of cholera outbreaks (Pascual 2000). The daily admissions for diarrhea and possibly cholera appear to be exacerbated during the onset of El Niño, as cases can
5
increase more than 200% (Checkley 2000). A study in Chesapeake Bay found the link between temperature and cholera in suboptimal environments (freshwater and high salinity) was weak (Louis et al. 2003). However, the authors concluded their findings were based on a limited time record (2 years). In addition, indicators associated with nutrient load and zooplankton (e.g. discharge and precipitation) were not included in the analysis. Precipitation via intensity and discharge via distribution could also affect exposure to cholera.
Extreme and predictable events, such as El Niño, may promote favorable conditions for zooplankton and ultimately Vibrio cholerae in villages along the Lake Victoria shores. Studies in which Vibrio cholerae are related spatially and temporally to El Niño, or its proxies and predictors, may be an effective way to prevent exposure to cholera (Lipp 2002).
2.2 Activities Conducted Daily minimum and maximum temperature, and daily precipitation data for the six study sites (Kericho and Kisumu in Kenya; Kabale and Gaba in Uganda; and Muleba and Buharamulo in Tanzania) were obtained from the National Meteorological Departments in the respective countries. Hydrological data was obtained for some rivers from Ministries of Water in both Kenya and Uganda. There were no gauged rivers in or close to the study sites in Tanzania.
2.3 Description of Scientific Methods and Data The multidisciplinary nature of the malaria and cholera studies is reflected in the multiple methodologies employed. This approach enabled generation of various datasets related to different variables linking climate change, hydrology, socioeconomic characteristics and health.
2.3.1 Selection of malaria and cholera study sites One characteristic of highland malaria epidemic is that the affected communities have not yet developed resistance/immunity in their systems. This is due to the fact that the disease has not been endemic to the area since it was formerly a high altitude cold region where malaria vectors could not survive. Therefore high altitude formed one of the criteria for site selection. The communities selected were therefore located at altitudes higher than 1,100m above sea level, an altitude at which existence of malaria vectors are limited due to cold temperatures.
The communities selected were therefore located at various altitudes (valley bottom, hill side and hill top) but higher than 1,100m above sea level. It was important to include households from different elevations because previous studies (Githeko, 2002) have shown that prevalence of highland malaria is differentiated by elevation, with 70%, 40% and 30% in valley bottom, hillside and hilltop respectively. Other factors considered in the selection of sites were proximity to a hospital(s) and a meteorological station with reliable data.
Availability of reliable health data at a nearby hospital was a second criterion for selection. All the three sites selected have reliable government or missionary hospital records and a nearby meteorological station with good weather/climate data. Kabale, Kericho and Muleba were selected as study sites (Figure 1). These sites not only have a recorded history of malaria epidemics in the last two decades but have also been experiencing climate variability and change since the turn of the 20
th century.
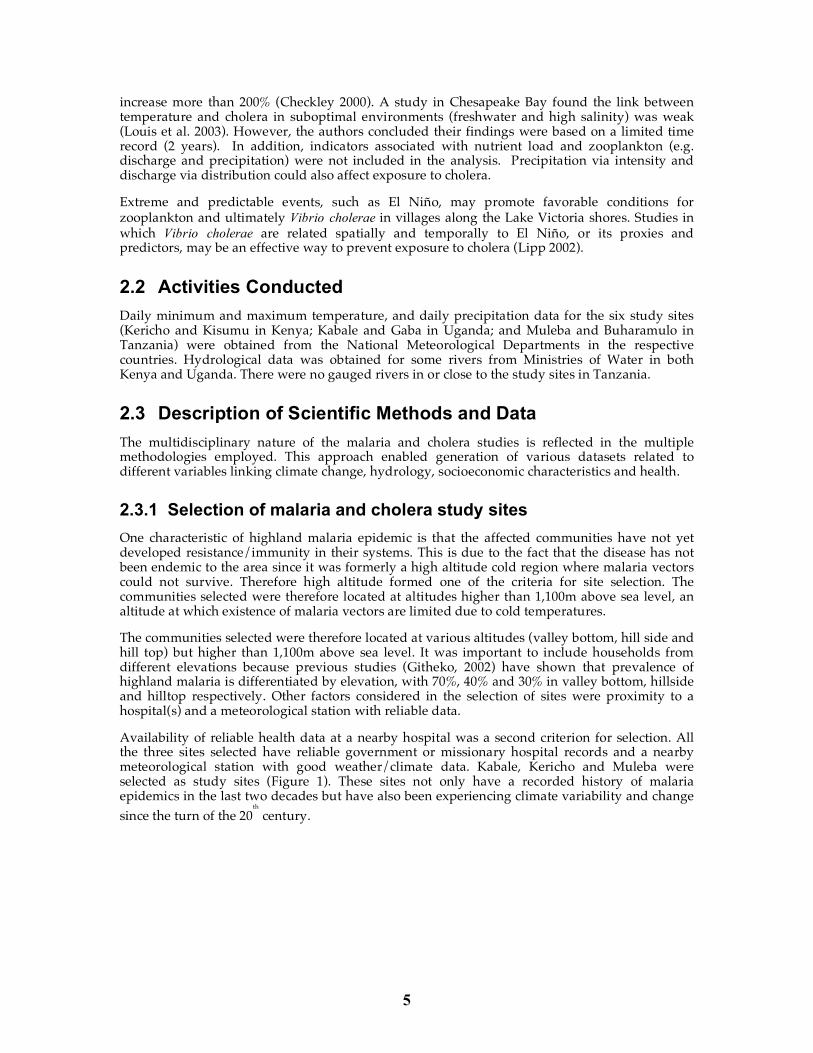
6
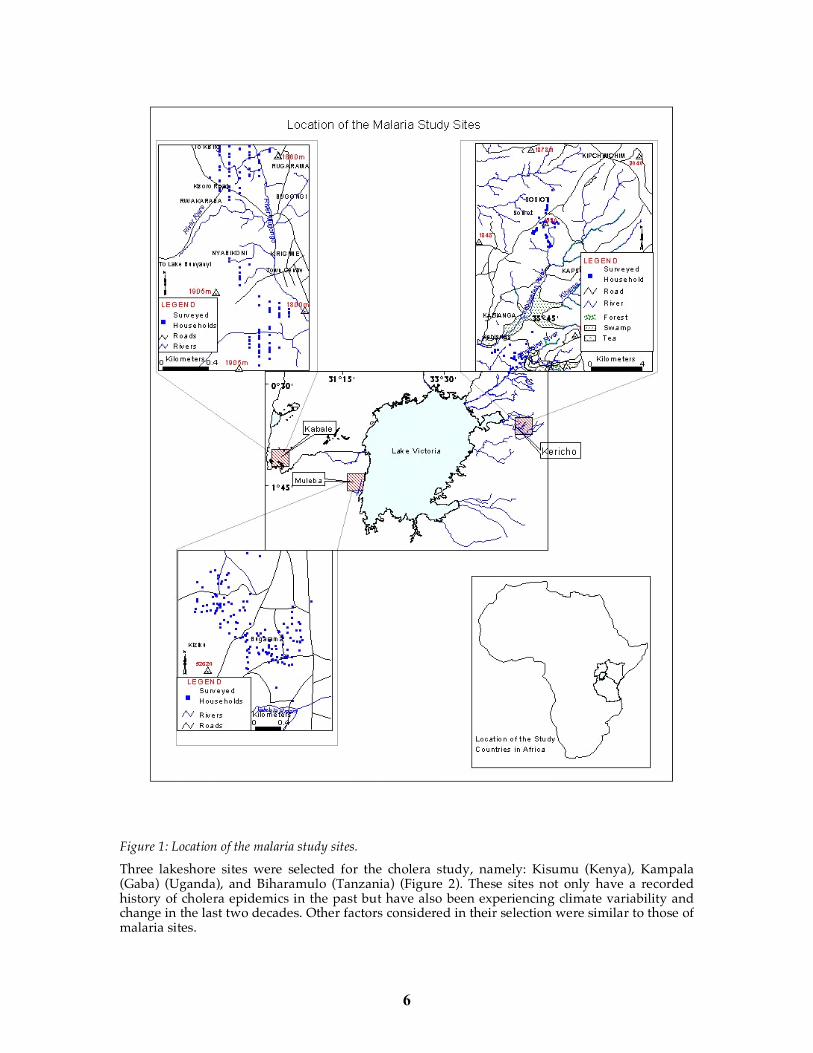
Figure 1: Location of the malaria study sites. Three lakeshore sites were selected for the cholera study, namely: Kisumu (Kenya), Kampala (Gaba) (Uganda), and Biharamulo (Tanzania) (Figure 2). These sites not only have a recorded history of cholera epidemics in the past but have also been experiencing climate variability and change in the last two decades. Other factors considered in their selection were similar to those of malaria sites.
7
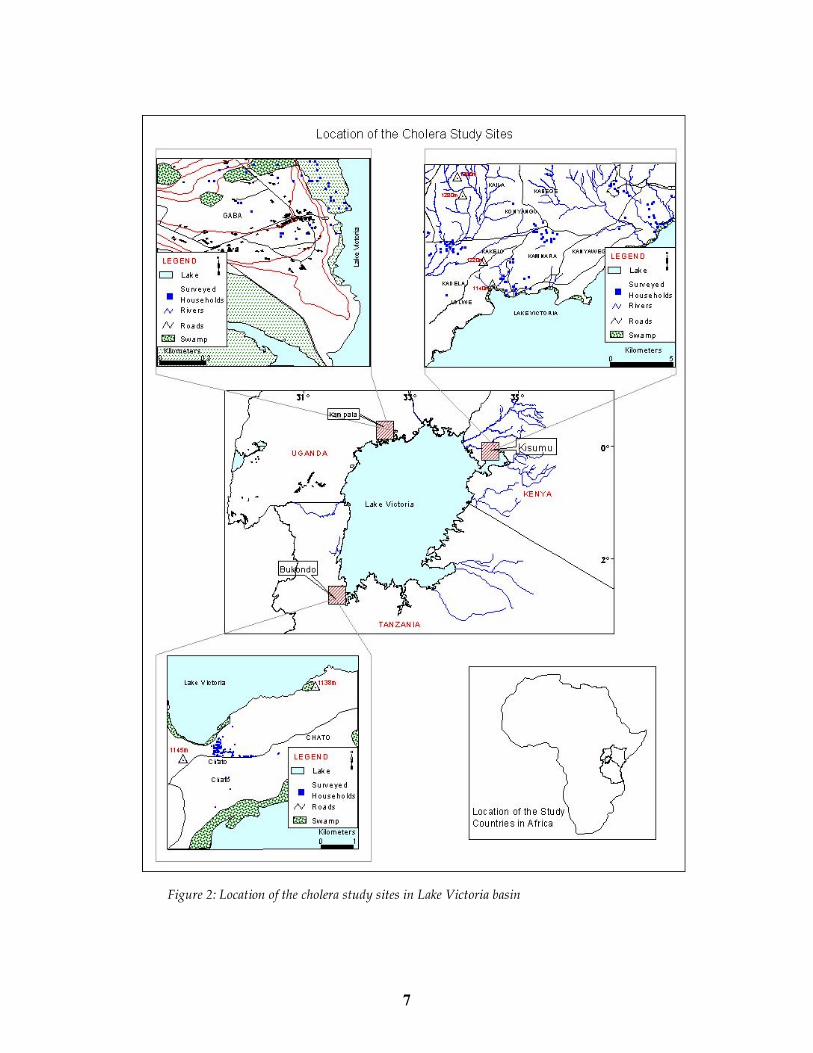
Figure 2: Location of the cholera study sites in Lake Victoria basin
8
2.3.2 Treatment of climatic and hydrological data In many cases data from several meteorological stations were truncated, having several data gaps, or was too short for the period of intended analysis. However, we were able to get some stations with good and continuous daily data, and these were selected to represent the study sites. In some cases only aggregated monthly data was available. Where no station was situated within the study site itself, we used the most proximal ones that had the required data quality and assurance. In general, the temporally longest dataset covered the period 1960 to 2002.
Although some of the datasets cover the period from 1961 to 2001, the period selected for analysis of the climate data was from 1978 to 1999, based on the shortest records, primarily due to the need to compare the datasets from the six sites without any temporal biases, such as in the determination of the magnitude of change. The longer period datasets are used basically to provide the longer-term contexts within which the selected analysis period is nested.
Due to lack of highly correlated nearby stations, daily temperature data from the Kenya sites were treated according to Kemp et al. (1983) and were aggregated to monthly values. Monthly temperature and precipitation data from Uganda and Tanzania were filled using the same method. Missing monthly precipitation data were filled using linear regression with the most highly correlated neighboring station (Tabony 1983).
Stream flow data, covering the period from 1961 to 2001 was obtained from National Water Ministries or Meteorological Agencies, for rivers crossing in or close to the study sites in Kenya and Uganda. Stream flow data was obtained as follows: Sondu-Miriu and Yurith Rivers for the Kericho (Kenya) site; the Yala and Nyando Rivers which are about 20km distance from the Kisumu (Kenya) site; and Kiruruma North and South Rivers for the Kabale (Uganda) site. The rivers close to Kabale area had major quality-control problems, and it was not possible to carry out site visits to establish the reasons behind these apparent discrepancies. Rivers at or near the Tanzanian sites are unguaged and therefore no stream flow data was available. Thus, only stream flow data from the Kenya sites (Rivers Sondu-Miriu, Yurith, Yala and Nyando), covering the period 1961 to 1991, were used in the analysis (Table 1). Data gaps were filled in using the MOVE1 (moment of variance extension) method of flow estimation (Hirsch, 1982), based on a matching dataset of three years length to five years length. Flood frequency, spectral and cross-spectral (stream flow and precipitation) analyses were also carried out.
The period 1978 to 1999 was selected to study the relationship between climate, hydrology and cholera outbreaks because all related stations and cholera case data in this temporal range have continuous time series. Trend analysis for the maximum and minimum temperatures was performed from the annual averages, in addition to LOWESS (Locally Weighted Scatter plot Smooth) (Helsel and Hirsch 2002). In the cases that a trend in the LOWESS smooth was identified, a linear regression was also performed on the series, so that the magnitude of the trends could be quantified. The slopes of the regression were tested at the 95% significance level.
2.4 Malaria Study The data were first analysed for consistency and treatment of gaps according to the methods of Kemp et al. (1983) and Tabony (1983). Linear regression and Locally Weighted Scatterplot Smooth (LOWESS) methods (Helsel and Hirsch, 2002) were used to determine trends.
Rainfall and temperature projections data for the Lake Victoria basin were obtained from the IPCC Data Centre. The models that were used are Australian Commonwealth Scientific and Industrial Research Organization (CSIRO) and CCSRNIES with a horizontal resolution of 64 x 56 and 64 x 32 grid points respectively. The scenarios extracted were A1 and A2 for both the models.

9
2.4.1 General climate and hydrological characteristics of the study sites
Invariably, in the tropical regions, Tmax occurs during the day and Tmin during the night (Figures 3a), reflecting the dominance of diurnal fluctuations in temperature on the local to meso-scale regional climate and weather in the tropics, in contrast to the higher latitudes where diurnal cycles are much less pronounced than seasonal fluctuations (Hastenrath, 1991). Both lowland and highland sites show increases in Tmax and Tmin over the various lengths of period for the temperature datasets (Table 2 and Figures 4a&b). Of note is the marked increase in Tmax (3.6ºC) in Kericho (a highland site).
STATION PERIOD OF ANALYSIS TEMPERATURE CHANGE (ºC) Kericho 1978-2001 Max 3.6 Min 0.5 Kabale 1960-2003 Max 1.1 Min 1.6 Bukoba 1960-2002 Max 0.7 Min 1.1
Table 2: Linear regression of temperature changes in the Lake Victoria basin
Monthly Mean Tmax (1978-1999)
21
22
23
24
25
26
27
Jan Feb Mar Apr May Jun Jul Aug Sep Oct Nov Dec
Month
Tm
ax (
deg
C)
Kabale
Kericho
Bukoba
Figure 3a: Comparison of mean monthly Tmax temperatures
10
Monthly Mean Tmin (1978-1999)
9
10
11
12
13
14
15
16
17
18
Jan Feb Mar Apr May Jun Jul Aug Sep Oct Nov Dec
Month
Tm
in (
deg
C)
Kabale
Kericho
Bukoba
Figure 3b: Comparison of mean monthly Tmin temperatures
11
Kericho (1978-1999)
20.0
21.0
22.0
23.0
24.0
25.0
26.0
27.0
28.0
29.0
30.0
1978 1979 1980 1981 1982 1983 1984 1985 1986 1987 1988 1989 1990 1991 1992 1993 1994 1995 1996 1997 1998 1999
Year
Mean
An
nu
al T
max (
deg
C)
Kericho
LOWESS
Linear (Kericho)
Kabale (1978-1999)
24.0
24.5
25.0
25.5
26.0
26.5
27.0
27.5
28.0
28.5
1978 1979 1980 1981 1982 1983 1984 1985 1986 1987 1988 1989 1990 1991 1992 1993 1994 1995 1996 1997 1998 1999
Year
Mean
An
nu
al T
max (
deg
C)
Kabale
LOWESS
Linear (Kabale)
Bukoba (1978-1999)
26.0
26.5
27.0
27.5
28.0
28.5
1978 1979 1980 1981 1982 1983 1984 1985 1986 1987 1988 1989 1990 1991 1992 1993 1994 1995 1996 1997 1998 1999
Year
Mean
An
nu
al T
max (
deg
C)
Bukoba
LOWESS
Linear (Bukoba)
Figure 4a: Annual time series (Tmax) for Kericho, Kabale and Bukoba
12
Kericho (1978-1999)
6.0
6.5
7.0
7.5
8.0
8.5
9.0
9.5
10.0
10.5
11.0
1978 1979 1980 1981 1982 1983 1984 1985 1986 1987 1988 1989 1990 1991 1992 1993 1994 1995 1996 1997 1998 1999
Year
Mean
An
nu
al T
min
(d
eg
C)
Kericho
LOWESS
Linear (Kericho)
Kabale (1978-1999)
7.0
7.5
8.0
8.5
9.0
9.5
10.0
10.5
11.0
1978 1979 1980 1981 1982 1983 1984 1985 1986 1987 1988 1989 1990 1991 1992 1993 1994 1995 1996 1997 1998 1999
Year
Mean
An
nu
al T
min
(d
eg
C)
Kabale
LOWESS
Linear (Kabale)
Bukoba (1978-1999)
14.0
14.5
15.0
15.5
16.0
16.5
17.0
17.5
18.0
1978 1979 1980 1981 1982 1983 1984 1985 1986 1987 1988 1989 1990 1991 1992 1993 1994 1995 1996 1997 1998 1999
Year
Mean
An
nu
al T
min
(d
eg
C)
Bukoba
LOWESS
Linear (Bukoba)
Figure 4b: Annual time series (Tmin) for Kericho, Kabale and Bukoba
13
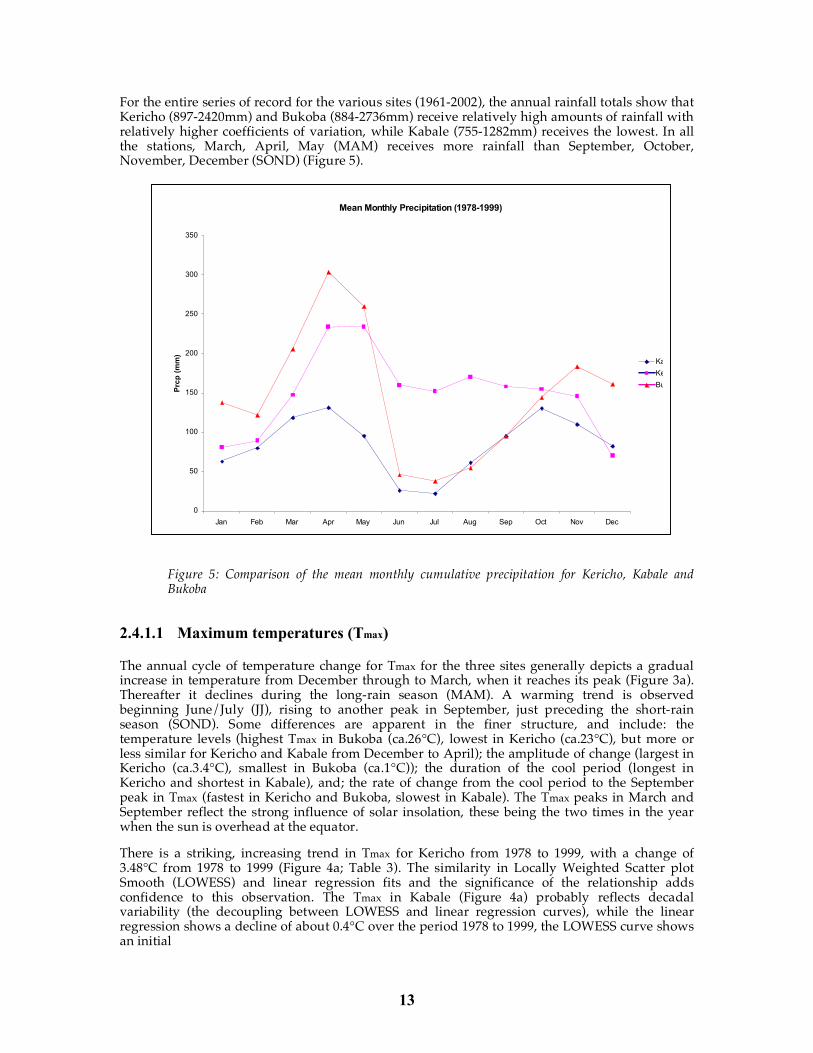
For the entire series of record for the various sites (1961-2002), the annual rainfall totals show that Kericho (897-2420mm) and Bukoba (884-2736mm) receive relatively high amounts of rainfall with relatively higher coefficients of variation, while Kabale (755-1282mm) receives the lowest. In all the stations, March, April, May (MAM) receives more rainfall than September, October, November, December (SOND) (Figure 5).
Figure 5: Comparison of the mean monthly cumulative precipitation for Kericho, Kabale and Bukoba
2.4.1.1 Maximum temperatures (Tmax)
The annual cycle of temperature change for Tmax for the three sites generally depicts a gradual increase in temperature from December through to March, when it reaches its peak (Figure 3a). Thereafter it declines during the long-rain season (MAM). A warming trend is observed beginning June/July (JJ), rising to another peak in September, just preceding the short-rain season (SOND). Some differences are apparent in the finer structure, and include: the temperature levels (highest Tmax in Bukoba (ca.26°C), lowest in Kericho (ca.23°C), but more or less similar for Kericho and Kabale from December to April); the amplitude of change (largest in Kericho (ca.3.4°C), smallest in Bukoba (ca.1°C)); the duration of the cool period (longest in Kericho and shortest in Kabale), and; the rate of change from the cool period to the September peak in Tmax (fastest in Kericho and Bukoba, slowest in Kabale). The Tmax peaks in March and September reflect the strong influence of solar insolation, these being the two times in the year when the sun is overhead at the equator.
There is a striking, increasing trend in Tmax for Kericho from 1978 to 1999, with a change of 3.48°C from 1978 to 1999 (Figure 4a; Table 3). The similarity in Locally Weighted Scatter plot Smooth (LOWESS) and linear regression fits and the significance of the relationship adds confidence to this observation. The Tmax in Kabale (Figure 4a) probably reflects decadal variability (the decoupling between LOWESS and linear regression curves), while the linear regression shows a decline of about 0.4°C over the period 1978 to 1999, the LOWESS curve shows an initial
Mean Monthly Precipitation (1978-1999)
0
50
100
150
200
250
300
350
Jan Feb Mar Apr May Jun Jul Aug Sep Oct Nov Dec
Month
Prc
p (
mm
)
Kabale
Kericho
Bukoba
14
decline of about 1°C from 1978 to 1988, followed by a rise of similar magnitude from 1988 to 1999. In Bukoba, Tmax also shows variability with an increase of 0.4°C for the period 1978-1999 indicated by linear regression, but with a similar LOWESS curve as that for Kabale, with temperatures declining by about 0.4°C from 1978 to 1989, and then rising by about 1.7°C from 1989 to 1999 (Figure 4a).
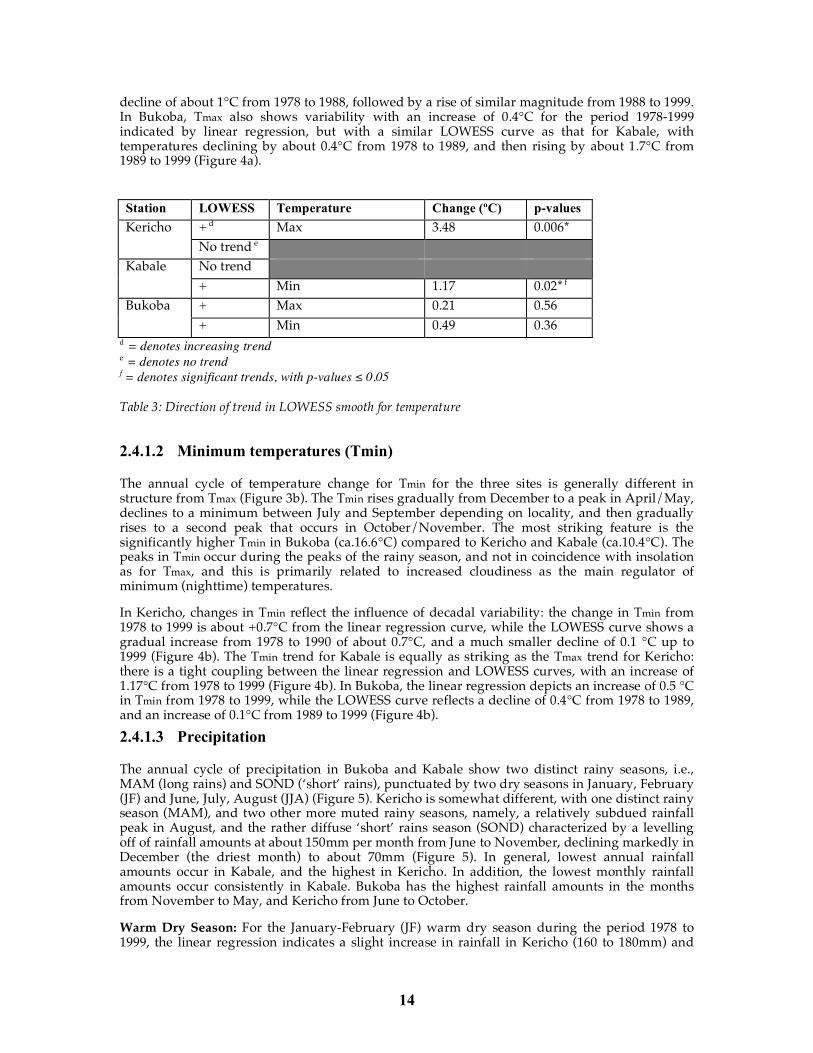
Station LOWESS Temperature Change (ºC) p-values
+ d Max 3.48 0.006* Kericho No trend e No trend Kabale + Min 1.17 0.02* f + Max 0.21 0.56 Bukoba + Min 0.49 0.36
d = denotes increasing trend e = denotes no trend f = denotes significant trends, with p-values ≤ 0.05
Table 3: Direction of trend in LOWESS smooth for temperature 2.4.1.2 Minimum temperatures (Tmin)
The annual cycle of temperature change for Tmin for the three sites is generally different in structure from Tmax (Figure 3b). The Tmin rises gradually from December to a peak in April/May, declines to a minimum between July and September depending on locality, and then gradually rises to a second peak that occurs in October/November. The most striking feature is the significantly higher Tmin in Bukoba (ca.16.6°C) compared to Kericho and Kabale (ca.10.4°C). The peaks in Tmin occur during the peaks of the rainy season, and not in coincidence with insolation as for Tmax, and this is primarily related to increased cloudiness as the main regulator of minimum (nighttime) temperatures.
In Kericho, changes in Tmin reflect the influence of decadal variability: the change in Tmin from 1978 to 1999 is about +0.7°C from the linear regression curve, while the LOWESS curve shows a gradual increase from 1978 to 1990 of about 0.7°C, and a much smaller decline of 0.1 °C up to 1999 (Figure 4b). The Tmin trend for Kabale is equally as striking as the Tmax trend for Kericho: there is a tight coupling between the linear regression and LOWESS curves, with an increase of 1.17°C from 1978 to 1999 (Figure 4b). In Bukoba, the linear regression depicts an increase of 0.5 °C in Tmin from 1978 to 1999, while the LOWESS curve reflects a decline of 0.4°C from 1978 to 1989, and an increase of 0.1°C from 1989 to 1999 (Figure 4b). 2.4.1.3 Precipitation
The annual cycle of precipitation in Bukoba and Kabale show two distinct rainy seasons, i.e., MAM (long rains) and SOND (‘short’ rains), punctuated by two dry seasons in January, February (JF) and June, July, August (JJA) (Figure 5). Kericho is somewhat different, with one distinct rainy season (MAM), and two other more muted rainy seasons, namely, a relatively subdued rainfall peak in August, and the rather diffuse ‘short’ rains season (SOND) characterized by a levelling off of rainfall amounts at about 150mm per month from June to November, declining markedly in December (the driest month) to about 70mm (Figure 5). In general, lowest annual rainfall amounts occur in Kabale, and the highest in Kericho. In addition, the lowest monthly rainfall amounts occur consistently in Kabale. Bukoba has the highest rainfall amounts in the months from November to May, and Kericho from June to October.
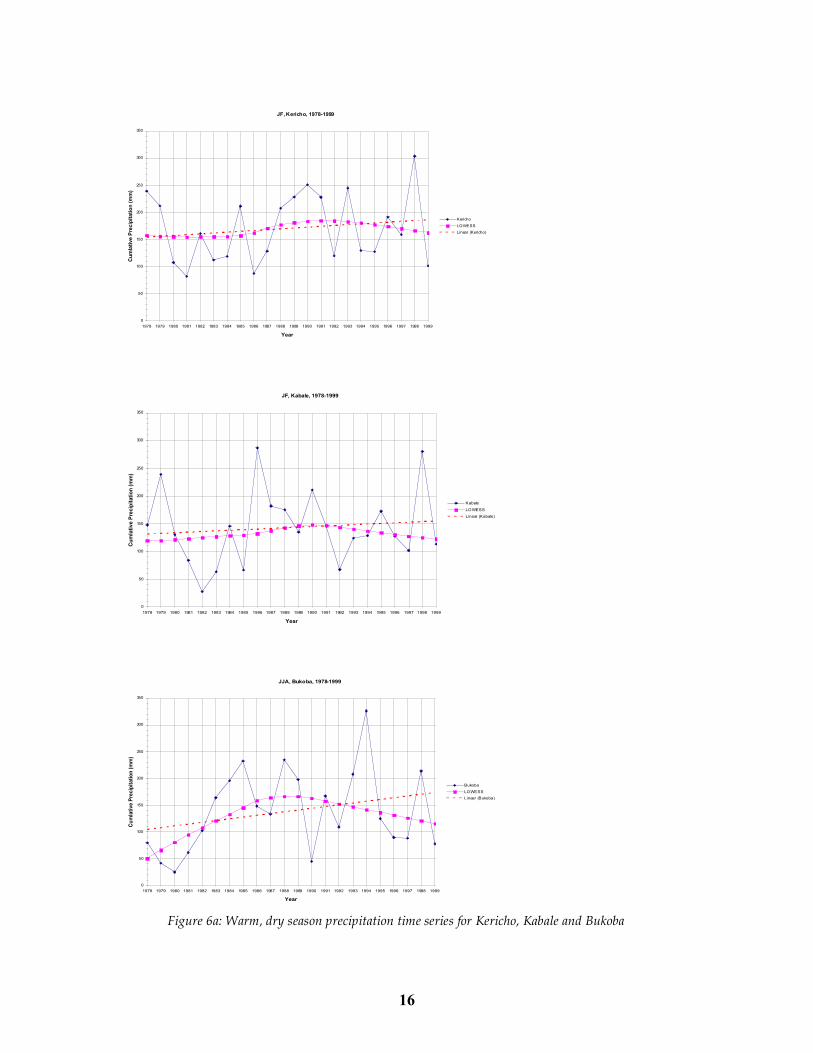
Warm Dry Season: For the January-February (JF) warm dry season during the period 1978 to 1999, the linear regression indicates a slight increase in rainfall in Kericho (160 to 180mm) and

15
Kabale (130 to 155mm), and a large increase in Bukoba (215 to 305mm) (Figure 6a, b). The LOWESS curves for all three sites show a gradual rise in precipitation, peaking in 1990, and declining thereafter. Both Kabale and Bukoba have distinct convex shapes, while that for Kericho is characterised by an initial ‘no change’ period extending from 1978 to 1985, before rising to the 1990 maximum that characterises the three sites. The convex shape for precipitation displays the following relationships with temperature: an inverse correlation with mean annual Tmax in Kabale and Bukoba; a positive correlation with Tmin in Kericho, and; an inverse correlation with Tmin in Bukoba (see Figure 4a&b).
16
JF, Kericho, 1978-1999
0
50
100
150
200
250
300
350
1978 1979 1980 1981 1982 1983 1984 1985 1986 1987 1988 1989 1990 1991 1992 1993 1994 1995 1996 1997 1998 1999
Year
Cu
mla
tive P
recip
itati
on
(m
m)
Kericho
LOWESS
Linear (Kericho)
JF, Kabale, 1978-1999
0
50
100
150
200
250
300
350
1978 1979 1980 1981 1982 1983 1984 1985 1986 1987 1988 1989 1990 1991 1992 1993 1994 1995 1996 1997 1998 1999
Year
Cu
mla
tive P
recip
itati
on
(m
m)
Kabale
LOWESS
Linear (Kabale)
JJA, Bukoba, 1978-1999
0
50
100
150
200
250
300
350
1978 1979 1980 1981 1982 1983 1984 1985 1986 1987 1988 1989 1990 1991 1992 1993 1994 1995 1996 1997 1998 1999
Year
Cu
mla
tive P
recip
itati
on
(m
m)
Bukoba
LOWESS
Linear (Bukoba)
Figure 6a: Warm, dry season precipitation time series for Kericho, Kabale and Bukoba
17
JJA, Kericho, 1978-1999
0
100
200
300
400
500
600
700
800
1978 1979 1980 1981 1982 1983 1984 1985 1986 1987 1988 1989 1990 1991 1992 1993 1994 1995 1996 1997 1998 1999
Year
Cu
mla
tive P
recip
itati
on
(m
m)
Kericho
LOWESS
Linear (Kericho)
JJA, Kabale, 1978-1999
0
50
100
150
200
250
300
1978 1979 1980 1981 1982 1983 1984 1985 1986 1987 1988 1989 1990 1991 1992 1993 1994 1995 1996 1997 1998 1999
Year
Cu
mla
tive P
recip
itati
on
(m
m)
Kabale
LOWESS
Linear (Kabale)
JF, Bukoba, 1978-1999
0
100
200
300
400
500
600
1978 1979 1980 1981 1982 1983 1984 1985 1986 1987 1988 1989 1990 1991 1992 1993 1994 1995 1996 1997 1998 1999
Year
Cu
mla
tive P
recip
itati
on
Bukoba
LOWESS
Linear (Bukoba)
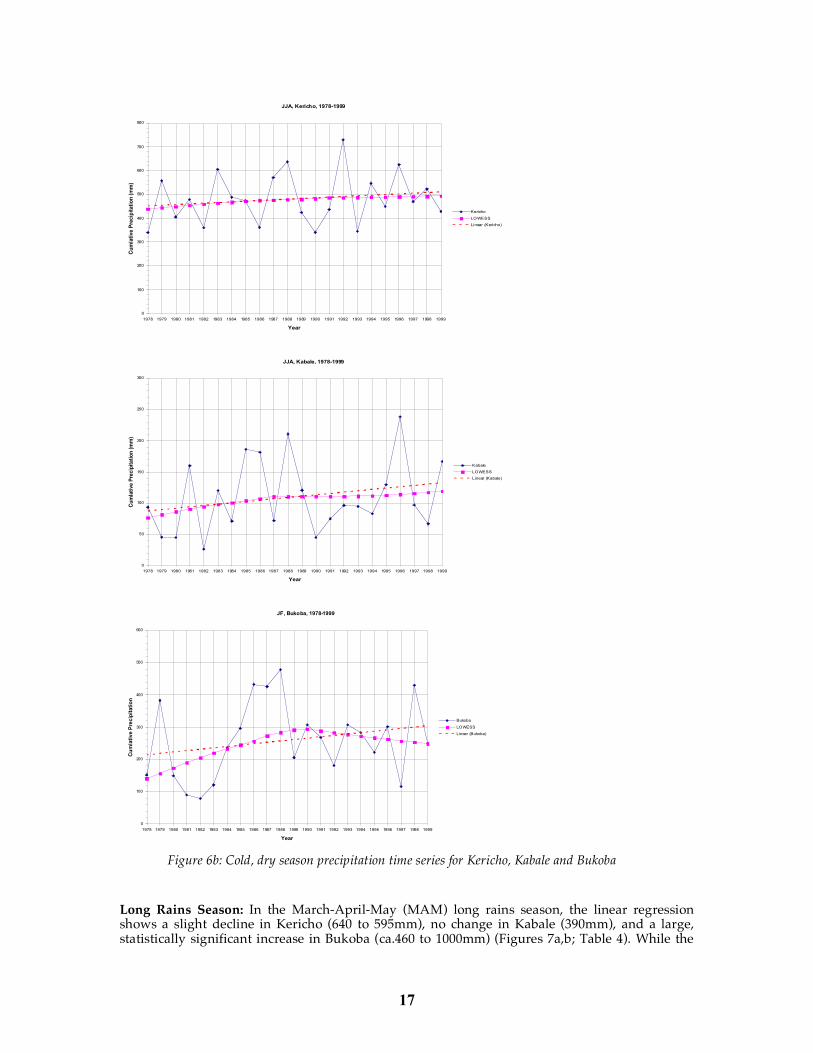
Figure 6b: Cold, dry season precipitation time series for Kericho, Kabale and Bukoba
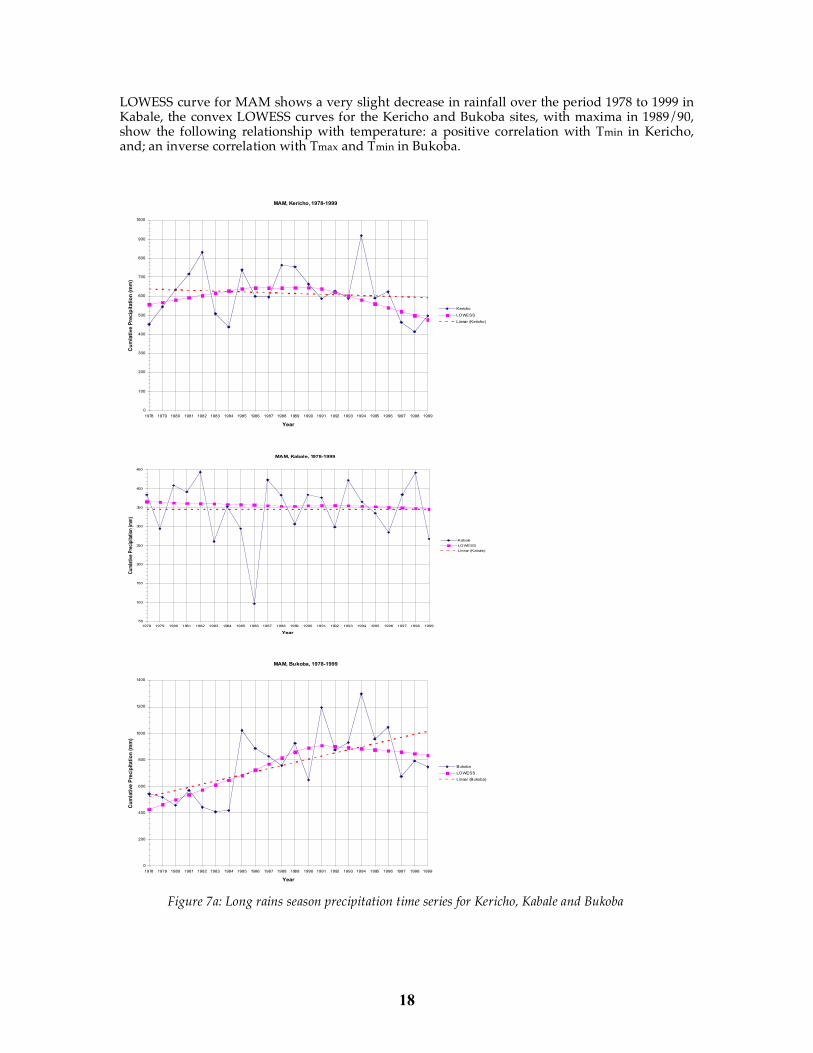
Long Rains Season: In the March-April-May (MAM) long rains season, the linear regression shows a slight decline in Kericho (640 to 595mm), no change in Kabale (390mm), and a large, statistically significant increase in Bukoba (ca.460 to 1000mm) (Figures 7a,b; Table 4). While the
18
LOWESS curve for MAM shows a very slight decrease in rainfall over the period 1978 to 1999 in Kabale, the convex LOWESS curves for the Kericho and Bukoba sites, with maxima in 1989/90, show the following relationship with temperature: a positive correlation with Tmin in Kericho, and; an inverse correlation with Tmax and Tmin in Bukoba.
MAM, Kericho, 1978-1999
0
100
200
300
400
500
600
700
800
900
1000
1978 1979 1980 1981 1982 1983 1984 1985 1986 1987 1988 1989 1990 1991 1992 1993 1994 1995 1996 1997 1998 1999
Year
Cu
mla
tive P
recip
itati
on
(m
m)
Kericho
LOWESS
Linear (Kericho)
MAM, Kabale, 1978-1999
50
100
150
200
250
300
350
400
450
1978 1979 1980 1981 1982 1983 1984 1985 1986 1987 1988 1989 1990 1991 1992 1993 1994 1995 1996 1997 1998 1999
Year
Cum
lativ
e P
reci
pita
tion
(mm
)
Kabale
LOWESS
Linear (Kabale)
MAM, Bukoba, 1978-1999
0
200
400
600
800
1000
1200
1400
1978 1979 1980 1981 1982 1983 1984 1985 1986 1987 1988 1989 1990 1991 1992 1993 1994 1995 1996 1997 1998 1999
Year
Cu
mla
tive P
recip
itati
on
(m
m)
Bukoba
LOWESS
Linear (Bukoba)
Figure 7a: Long rains season precipitation time series for Kericho, Kabale and Bukoba
19
SOND, Kericho, 1978-1999
0
100
200
300
400
500
600
700
800
900
1978 1979 1980 1981 1982 1983 1984 1985 1986 1987 1988 1989 1990 1991 1992 1993 1994 1995 1996 1997 1998 1999
Year
Cu
mla
tive P
recip
itati
on
(m
m)
Kericho
LOWESS
Linear (Kericho)
SOND, Kabale, 1978-1999
200
250
300
350
400
450
500
550
600
1978 1979 1980 1981 1982 1983 1984 1985 1986 1987 1988 1989 1990 1991 1992 1993 1994 1995 1996 1997 1998 1999
Year
Cu
mla
tive P
recip
itati
on
(m
m)
Kabale
LOWESS
Linear (Kabale)
SOND, Bukoba, 1978-1999
0
200
400
600
800
1000
1200
1978 1979 1980 1981 1982 1983 1984 1985 1986 1987 1988 1989 1990 1991 1992 1993 1994 1995 1996 1997 1998 1999
Year
Cu
mla
tive P
recip
itati
on
(m
m)
Bukoba
LOWESS
Linear (Bukoba)
Figure 7b: Short rains season precipitation time series for Kericho, Kabale and Bukoba
20
Station Season LOWESS Percent Change p-values
JF No trend Kericho MAM No trend
JJA + j 13.0 0.45 SOND + 51.6 0.08
JF No trend k MAM - -0.2 0.99 JJA + 51.6 0.28
Kabale
SOND + 12.5 0.46 JF No trend MAM + 94.5 0.003* l JJA No trend
Bukoba
SOND + 49.8 0.09 j = denotes increasing trend k = denotes no trend l = denotes significant trends, with p-values ≤ 0.05
Table 4: Direction of trend in the LOWESS smooth for precipitation
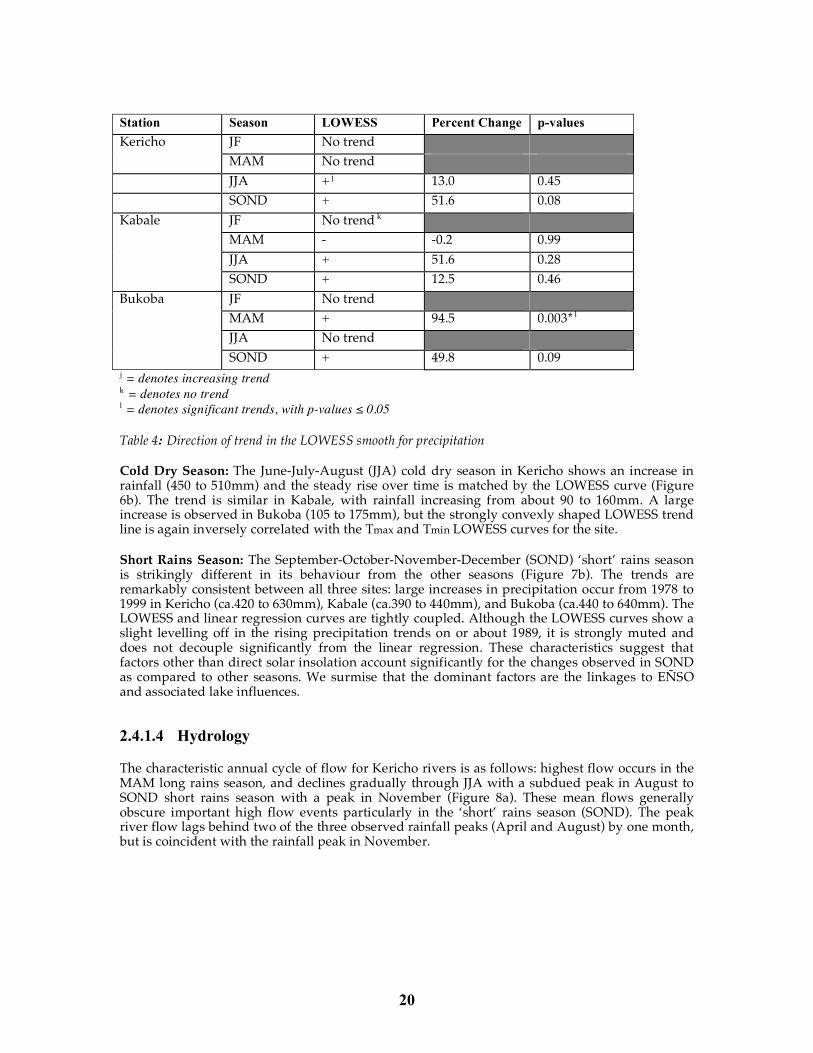
Cold Dry Season: The June-July-August (JJA) cold dry season in Kericho shows an increase in rainfall (450 to 510mm) and the steady rise over time is matched by the LOWESS curve (Figure 6b). The trend is similar in Kabale, with rainfall increasing from about 90 to 160mm. A large increase is observed in Bukoba (105 to 175mm), but the strongly convexly shaped LOWESS trend line is again inversely correlated with the Tmax and Tmin LOWESS curves for the site.
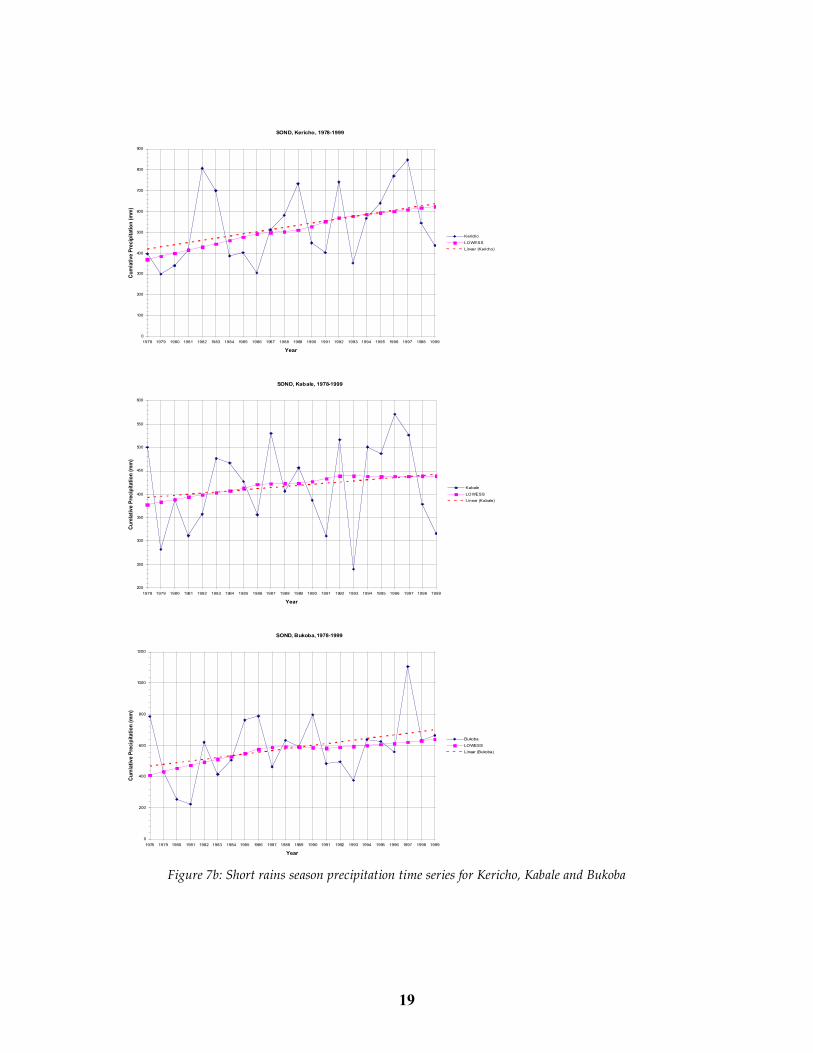
Short Rains Season: The September-October-November-December (SOND) ‘short’ rains season is strikingly different in its behaviour from the other seasons (Figure 7b). The trends are remarkably consistent between all three sites: large increases in precipitation occur from 1978 to 1999 in Kericho (ca.420 to 630mm), Kabale (ca.390 to 440mm), and Bukoba (ca.440 to 640mm). The LOWESS and linear regression curves are tightly coupled. Although the LOWESS curves show a slight levelling off in the rising precipitation trends on or about 1989, it is strongly muted and does not decouple significantly from the linear regression. These characteristics suggest that factors other than direct solar insolation account significantly for the changes observed in SOND as compared to other seasons. We surmise that the dominant factors are the linkages to EÑSO and associated lake influences. 2.4.1.4 Hydrology
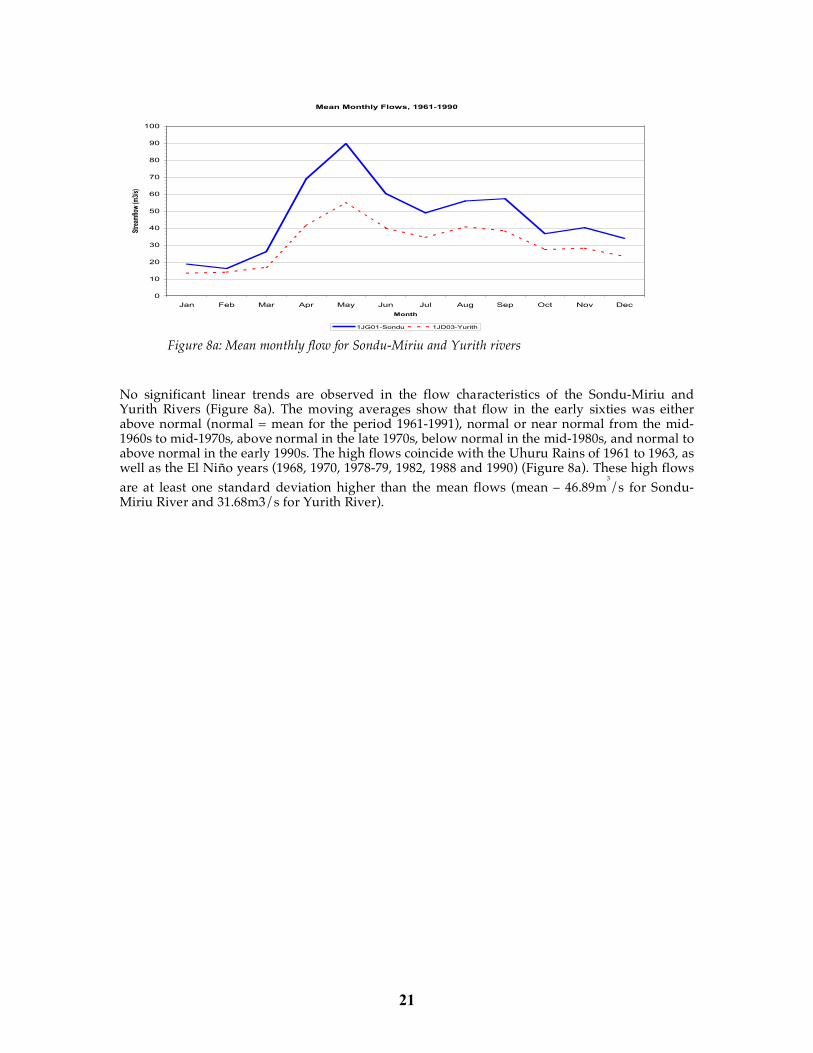
The characteristic annual cycle of flow for Kericho rivers is as follows: highest flow occurs in the MAM long rains season, and declines gradually through JJA with a subdued peak in August to SOND short rains season with a peak in November (Figure 8a). These mean flows generally obscure important high flow events particularly in the ‘short’ rains season (SOND). The peak river flow lags behind two of the three observed rainfall peaks (April and August) by one month, but is coincident with the rainfall peak in November.
21
Mean Monthly Flows, 1961-1990
0
10
20
30
40
50
60
70
80
90
100
Jan Feb Mar Apr May Jun Jul Aug Sep Oct Nov Dec
Month
Stre
amflo
w (m
3/s)
1JG01-Sondu 1JD03-Yurith Figure 8a: Mean monthly flow for Sondu-Miriu and Yurith rivers
No significant linear trends are observed in the flow characteristics of the Sondu-Miriu and Yurith Rivers (Figure 8a). The moving averages show that flow in the early sixties was either above normal (normal = mean for the period 1961-1991), normal or near normal from the mid-1960s to mid-1970s, above normal in the late 1970s, below normal in the mid-1980s, and normal to above normal in the early 1990s. The high flows coincide with the Uhuru Rains of 1961 to 1963, as well as the El Niño years (1968, 1970, 1978-79, 1982, 1988 and 1990) (Figure 8a). These high flows are at least one standard deviation higher than the mean flows (mean – 46.89m
3/s for Sondu-
Miriu River and 31.68m3/s for Yurith River).
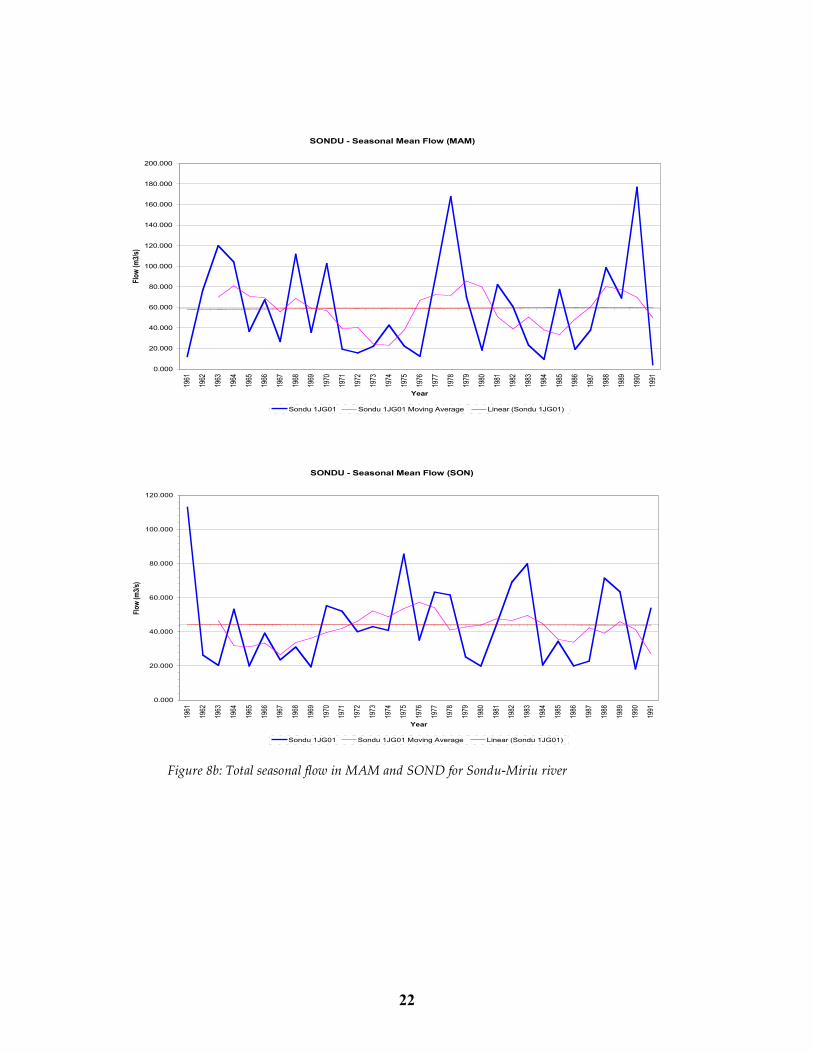
22
Figure 8b: Total seasonal flow in MAM and SOND for Sondu-Miriu river
SONDU - Seasonal Mean Flow (MAM)
0.000
20.000
40.000
60.000
80.000
100.000
120.000
140.000
160.000
180.000
200.000
1961
1962
1963
1964
1965
1966
1967
1968
1969
1970
1971
1972
1973
1974
1975
1976
1977
1978
1979
1980
1981
1982
1983
1984
1985
1986
1987
1988
1989
1990
1991
Year
Flo
w (
m3/
s)
Sondu 1JG01 Sondu 1JG01 Moving Average Linear (Sondu 1JG01)
SONDU - Seasonal Mean Flow (SON)
0.000
20.000
40.000
60.000
80.000
100.000
120.000
1961
1962
1963
1964
1965
1966
1967
1968
1969
1970
1971
1972
1973
1974
1975
1976
1977
1978
1979
1980
1981
1982
1983
1984
1985
1986
1987
1988
1989
1990
1991
Year
Flow
(m3/
s)
Sondu 1JG01 Sondu 1JG01 Moving Average Linear (Sondu 1JG01)
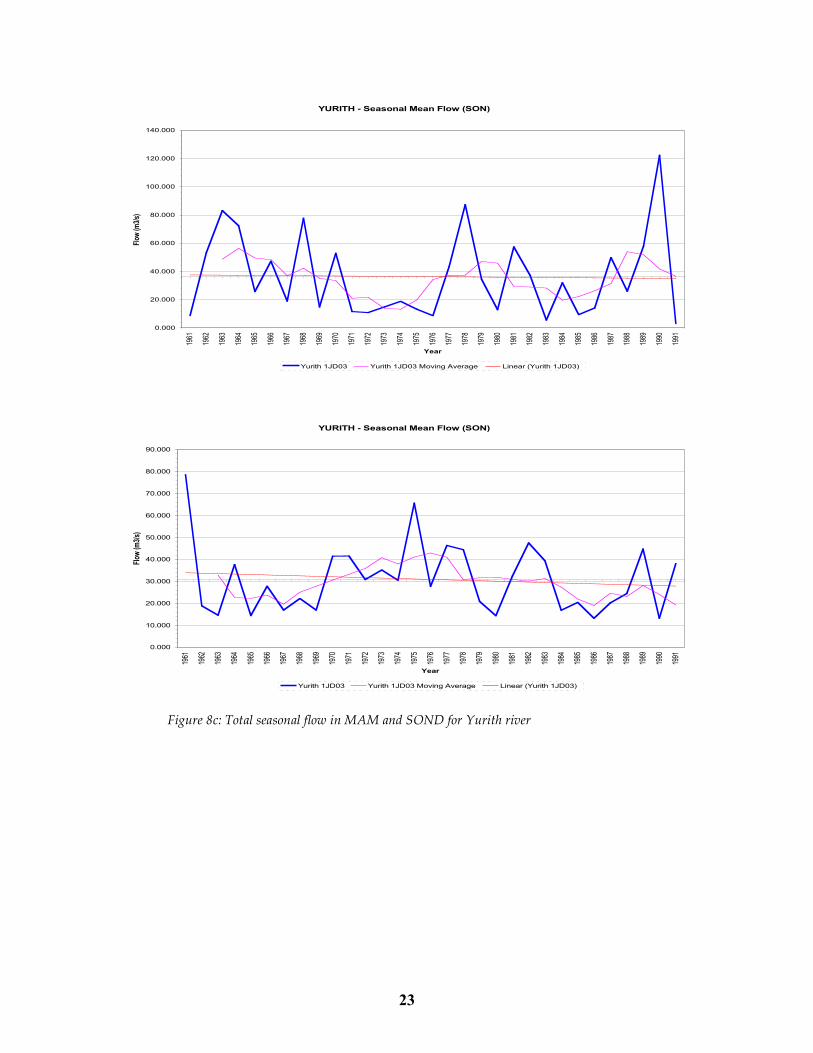
23
YURITH - Seasonal Mean Flow (SON)
0.000
20.000
40.000
60.000
80.000
100.000
120.000
140.000
1961
1962
1963
1964
1965
1966
1967
1968
1969
1970
1971
1972
1973
1974
1975
1976
1977
1978
1979
1980
1981
1982
1983
1984
1985
1986
1987
1988
1989
1990
1991
Year
Flow
(m3/
s)
Yurith 1JD03 Yurith 1JD03 Moving Average Linear (Yurith 1JD03)
YURITH - Seasonal Mean Flow (SON)
0.000
10.000
20.000
30.000
40.000
50.000
60.000
70.000
80.000
90.000
1961
1962
1963
1964
1965
1966
1967
1968
1969
1970
1971
1972
1973
1974
1975
1976
1977
1978
1979
1980
1981
1982
1983
1984
1985
1986
1987
1988
1989
1990
1991
Year
Flow
(m3/
s)
Yurith 1JD03 Yurith 1JD03 Moving Average Linear (Yurith 1JD03) Figure 8c: Total seasonal flow in MAM and SOND for Yurith river
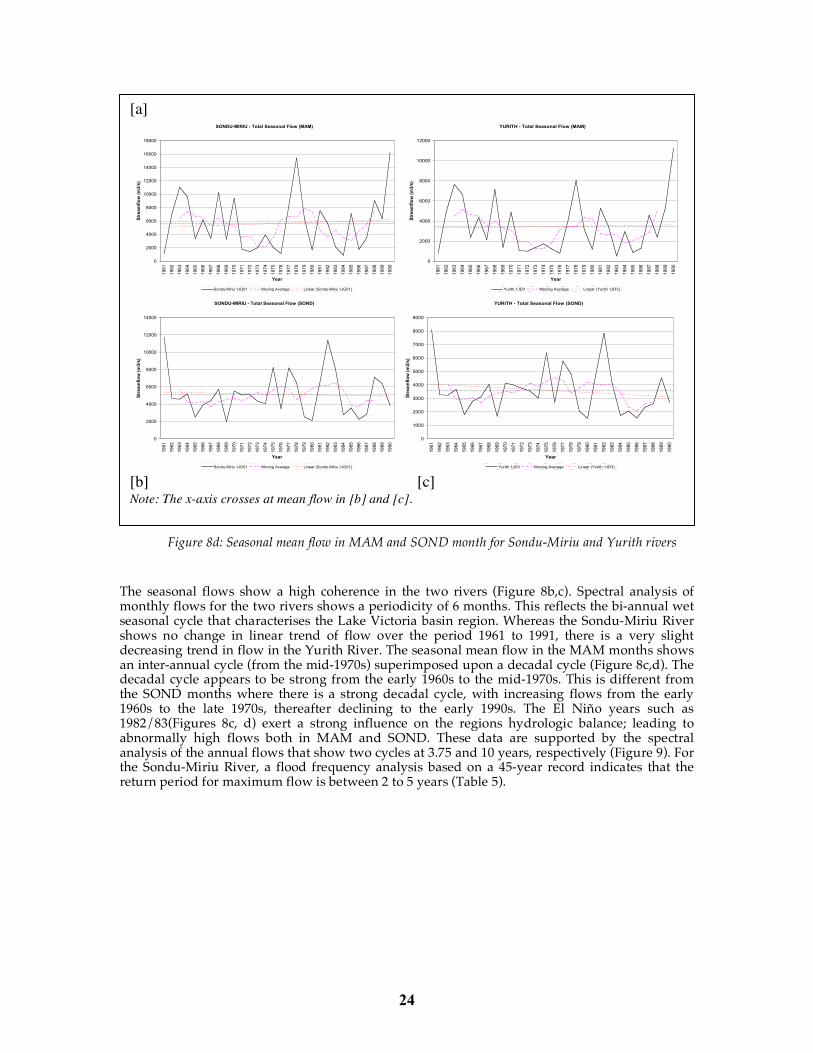
24
Figure 8d: Seasonal mean flow in MAM and SOND month for Sondu-Miriu and Yurith rivers
The seasonal flows show a high coherence in the two rivers (Figure 8b,c). Spectral analysis of monthly flows for the two rivers shows a periodicity of 6 months. This reflects the bi-annual wet seasonal cycle that characterises the Lake Victoria basin region. Whereas the Sondu-Miriu River shows no change in linear trend of flow over the period 1961 to 1991, there is a very slight decreasing trend in flow in the Yurith River. The seasonal mean flow in the MAM months shows an inter-annual cycle (from the mid-1970s) superimposed upon a decadal cycle (Figure 8c,d). The decadal cycle appears to be strong from the early 1960s to the mid-1970s. This is different from the SOND months where there is a strong decadal cycle, with increasing flows from the early 1960s to the late 1970s, thereafter declining to the early 1990s. The El Niño years such as 1982/83(Figures 8c, d) exert a strong influence on the regions hydrologic balance; leading to abnormally high flows both in MAM and SOND. These data are supported by the spectral analysis of the annual flows that show two cycles at 3.75 and 10 years, respectively (Figure 9). For the Sondu-Miriu River, a flood frequency analysis based on a 45-year record indicates that the return period for maximum flow is between 2 to 5 years (Table 5).
[a] SONDU-MIRIU - Total Seasonal Flow (MAM)
0
2000
4000
6000
8000
10000
12000
14000
16000
18000
19
61
19
62
19
63
19
64
19
65
19
66
19
67
19
68
19
69
19
70
19
71
19
72
19
73
19
74
19
75
19
76
19
77
19
78
19
79
19
80
19
81
19
82
19
83
19
84
19
85
19
86
19
87
19
88
19
89
19
90
Year
Str
ea
mfl
ow
(m
3/s
)
Sondu-Miriu 1JG01 Moving Average Linear (Sondu-Miriu 1JG01)
YURITH - Total Seasonal Flow (MAM)
0
2000
4000
6000
8000
10000
12000
19
61
19
62
19
63
19
64
19
65
19
66
19
67
19
68
19
69
19
70
19
71
19
72
19
73
19
74
19
75
19
76
19
77
19
78
19
79
19
80
19
81
19
82
19
83
19
84
19
85
19
86
19
87
19
88
19
89
19
90
Year
Str
ea
mfl
ow
(m
3/s
)
Yurith 1JD3 Moving Average Linear (Yurith 1JD3) SONDU-MIRIU - Total Seasonal Flow (SOND)
0
2000
4000
6000
8000
10000
12000
14000
19
61
19
62
19
63
19
64
19
65
19
66
19
67
19
68
19
69
19
70
19
71
19
72
19
73
19
74
19
75
19
76
19
77
19
78
19
79
19
80
19
81
19
82
19
83
19
84
19
85
19
86
19
87
19
88
19
89
19
90
Year
Str
ea
mfl
ow
(m
3/s
)
Sondu-Miriu 1JG01 Moving Average Linear (Sondu-Miriu 1JG01)
YURITH - Total Seasonal Flow (SOND)
0
1000
2000
3000
4000
5000
6000
7000
8000
9000
19
61
19
62
19
63
19
64
19
65
19
66
19
67
19
68
19
69
19
70
19
71
19
72
19
73
19
74
19
75
19
76
19
77
19
78
19
79
19
80
19
81
19
82
19
83
19
84
19
85
19
86
19
87
19
88
19
89
19
90
Year
Str
ea
mfl
ow
(m
3/s
)
Yurith 1JD3 Moving Average Linear (Yurith 1JD3) [b] [c] Note: The x-axis crosses at mean flow in [b] and [c].
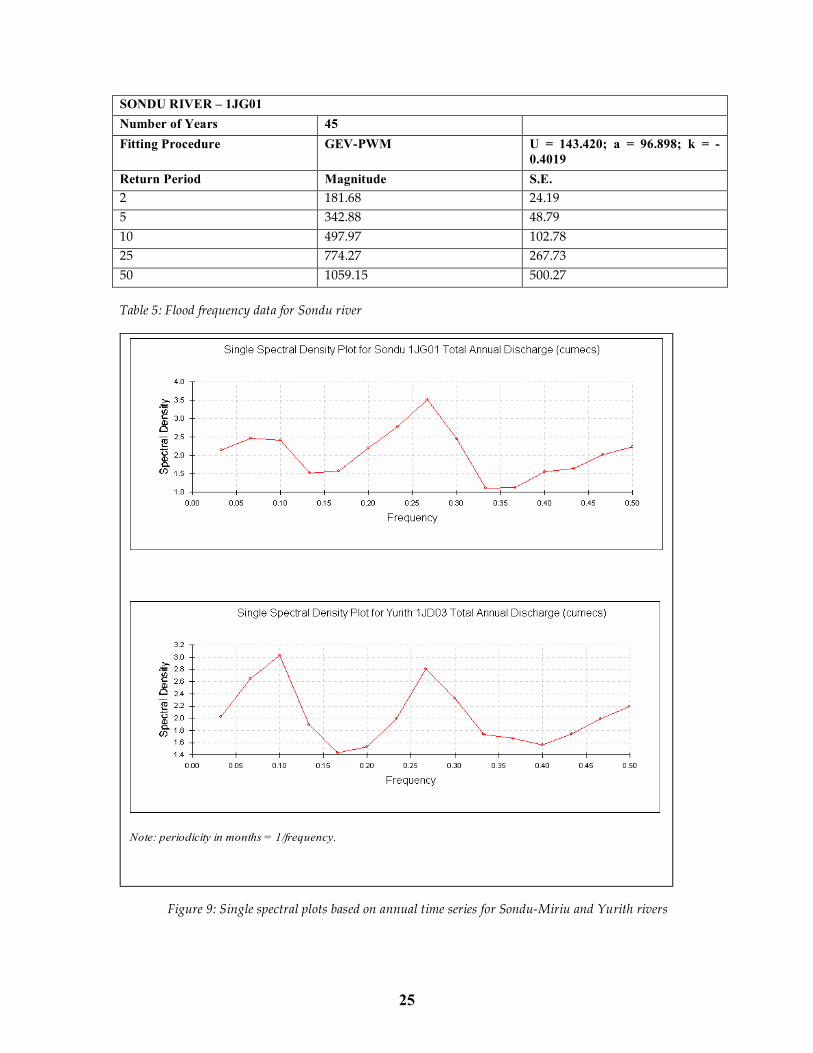
25
SONDU RIVER – 1JG01 Number of Years 45 Fitting Procedure GEV-PWM U = 143.420; a = 96.898; k = -
0.4019 Return Period Magnitude S.E. 2 181.68 24.19 5 342.88 48.79 10 497.97 102.78 25 774.27 267.73 50 1059.15 500.27
Table 5: Flood frequency data for Sondu river
Note: periodicity in months = 1/frequency.
Figure 9: Single spectral plots based on annual time series for Sondu-Miriu and Yurith rivers
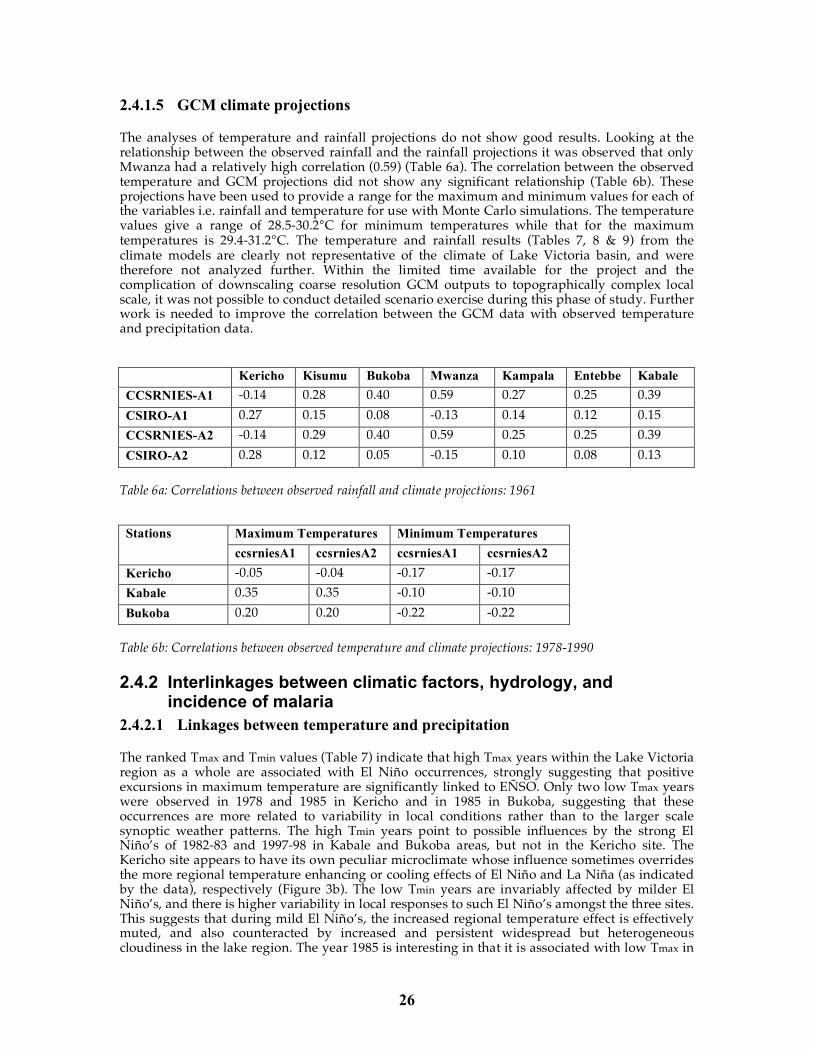
26
2.4.1.5 GCM climate projections
The analyses of temperature and rainfall projections do not show good results. Looking at the relationship between the observed rainfall and the rainfall projections it was observed that only Mwanza had a relatively high correlation (0.59) (Table 6a). The correlation between the observed temperature and GCM projections did not show any significant relationship (Table 6b). These projections have been used to provide a range for the maximum and minimum values for each of the variables i.e. rainfall and temperature for use with Monte Carlo simulations. The temperature values give a range of 28.5-30.2°C for minimum temperatures while that for the maximum temperatures is 29.4-31.2°C. The temperature and rainfall results (Tables 7, 8 & 9) from the climate models are clearly not representative of the climate of Lake Victoria basin, and were therefore not analyzed further. Within the limited time available for the project and the complication of downscaling coarse resolution GCM outputs to topographically complex local scale, it was not possible to conduct detailed scenario exercise during this phase of study. Further work is needed to improve the correlation between the GCM data with observed temperature and precipitation data.
Kericho Kisumu Bukoba Mwanza Kampala Entebbe Kabale CCSRNIES-A1 -0.14 0.28 0.40 0.59 0.27 0.25 0.39 CSIRO-A1 0.27 0.15 0.08 -0.13 0.14 0.12 0.15 CCSRNIES-A2 -0.14 0.29 0.40 0.59 0.25 0.25 0.39 CSIRO-A2 0.28 0.12 0.05 -0.15 0.10 0.08 0.13
Table 6a: Correlations between observed rainfall and climate projections: 1961 Stations Maximum Temperatures Minimum Temperatures ccsrniesA1 ccsrniesA2 ccsrniesA1 ccsrniesA2 Kericho -0.05 -0.04 -0.17 -0.17 Kabale 0.35 0.35 -0.10 -0.10 Bukoba 0.20 0.20 -0.22 -0.22
Table 6b: Correlations between observed temperature and climate projections: 1978-1990
2.4.2 Interlinkages between climatic factors, hydrology, and incidence of malaria
2.4.2.1 Linkages between temperature and precipitation
The ranked Tmax and Tmin values (Table 7) indicate that high Tmax years within the Lake Victoria region as a whole are associated with El Niño occurrences, strongly suggesting that positive excursions in maximum temperature are significantly linked to EÑSO. Only two low Tmax years were observed in 1978 and 1985 in Kericho and in 1985 in Bukoba, suggesting that these occurrences are more related to variability in local conditions rather than to the larger scale synoptic weather patterns. The high Tmin years point to possible influences by the strong El Niño’s of 1982-83 and 1997-98 in Kabale and Bukoba areas, but not in the Kericho site. The Kericho site appears to have its own peculiar microclimate whose influence sometimes overrides the more regional temperature enhancing or cooling effects of El Niño and La Niña (as indicated by the data), respectively (Figure 3b). The low Tmin years are invariably affected by milder El Niño’s, and there is higher variability in local responses to such El Niño’s amongst the three sites. This suggests that during mild El Niño’s, the increased regional temperature effect is effectively muted, and also counteracted by increased and persistent widespread but heterogeneous cloudiness in the lake region. The year 1985 is interesting in that it is associated with low Tmax in
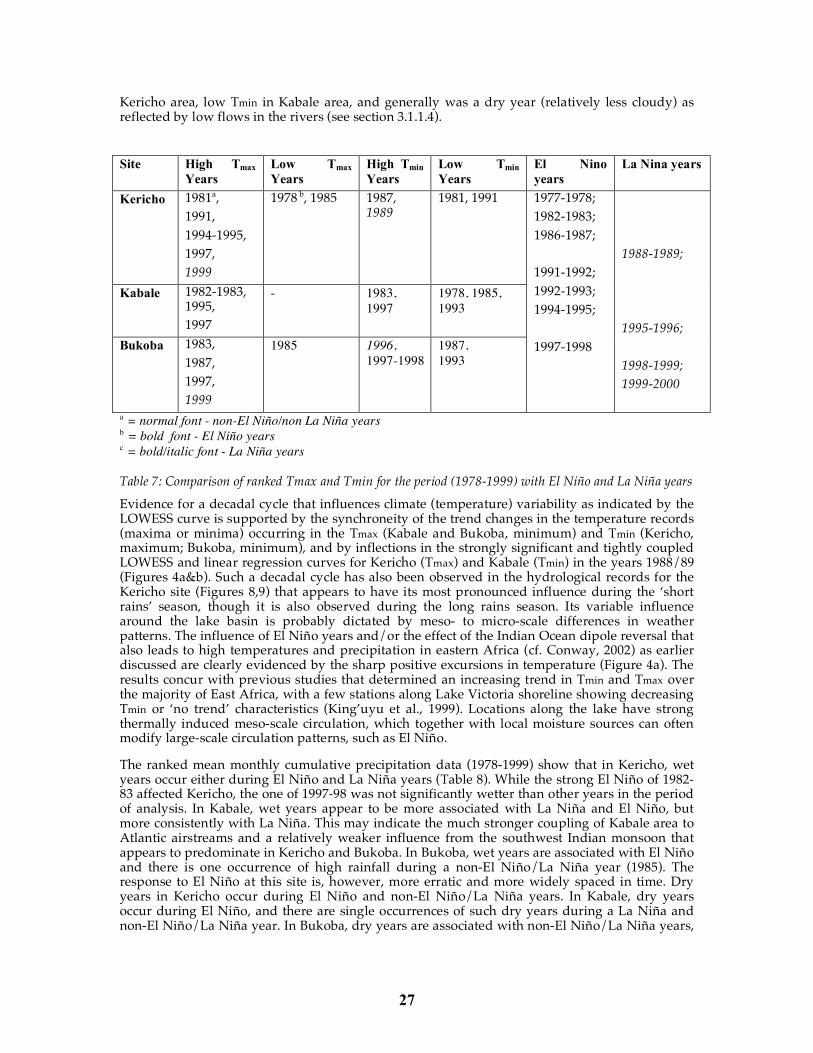
27
Kericho area, low Tmin in Kabale area, and generally was a dry year (relatively less cloudy) as reflected by low flows in the rivers (see section 3.1.1.4).
Site High Tmax
Years Low Tmax Years
High Tmin Years
Low Tmin Years
El Nino years
La Nina years
Kericho 1981a, 1991, 1994-1995, 1997, 1999
1978 b, 1985 1987, 1989
1981, 1991
Kabale 1982-1983, 1995, 1997
- 1983, 1997
1978, 1985, 1993
Bukoba 1983, 1987, 1997, 1999
1985 1996, 1997-1998
1987, 1993
1977-1978; 1982-1983; 1986-1987; 1991-1992; 1992-1993; 1994-1995; 1997-1998
1988-1989; 1995-1996; 1998-1999; 1999-2000
a = normal font - non-El Niño/non La Niña years b = bold font - El Niño years c = bold/italic font - La Niña years
Table 7: Comparison of ranked Tmax and Tmin for the period (1978-1999) with El Niño and La Niña years Evidence for a decadal cycle that influences climate (temperature) variability as indicated by the LOWESS curve is supported by the synchroneity of the trend changes in the temperature records (maxima or minima) occurring in the Tmax (Kabale and Bukoba, minimum) and Tmin (Kericho, maximum; Bukoba, minimum), and by inflections in the strongly significant and tightly coupled LOWESS and linear regression curves for Kericho (Tmax) and Kabale (Tmin) in the years 1988/89 (Figures 4a&b). Such a decadal cycle has also been observed in the hydrological records for the Kericho site (Figures 8,9) that appears to have its most pronounced influence during the ‘short rains’ season, though it is also observed during the long rains season. Its variable influence around the lake basin is probably dictated by meso- to micro-scale differences in weather patterns. The influence of El Niño years and/or the effect of the Indian Ocean dipole reversal that also leads to high temperatures and precipitation in eastern Africa (cf. Conway, 2002) as earlier discussed are clearly evidenced by the sharp positive excursions in temperature (Figure 4a). The results concur with previous studies that determined an increasing trend in Tmin and Tmax over the majority of East Africa, with a few stations along Lake Victoria shoreline showing decreasing Tmin or ‘no trend’ characteristics (King’uyu et al., 1999). Locations along the lake have strong thermally induced meso-scale circulation, which together with local moisture sources can often modify large-scale circulation patterns, such as El Niño.
The ranked mean monthly cumulative precipitation data (1978-1999) show that in Kericho, wet years occur either during El Niño and La Niña years (Table 8). While the strong El Niño of 1982-83 affected Kericho, the one of 1997-98 was not significantly wetter than other years in the period of analysis. In Kabale, wet years appear to be more associated with La Niña and El Niño, but more consistently with La Niña. This may indicate the much stronger coupling of Kabale area to Atlantic airstreams and a relatively weaker influence from the southwest Indian monsoon that appears to predominate in Kericho and Bukoba. In Bukoba, wet years are associated with El Niño and there is one occurrence of high rainfall during a non-El Niño/La Niña year (1985). The response to El Niño at this site is, however, more erratic and more widely spaced in time. Dry years in Kericho occur during El Niño and non-El Niño/La Niña years. In Kabale, dry years occur during El Niño, and there are single occurrences of such dry years during a La Niña and non-El Niño/La Niña year. In Bukoba, dry years are associated with non-El Niño/La Niña years,
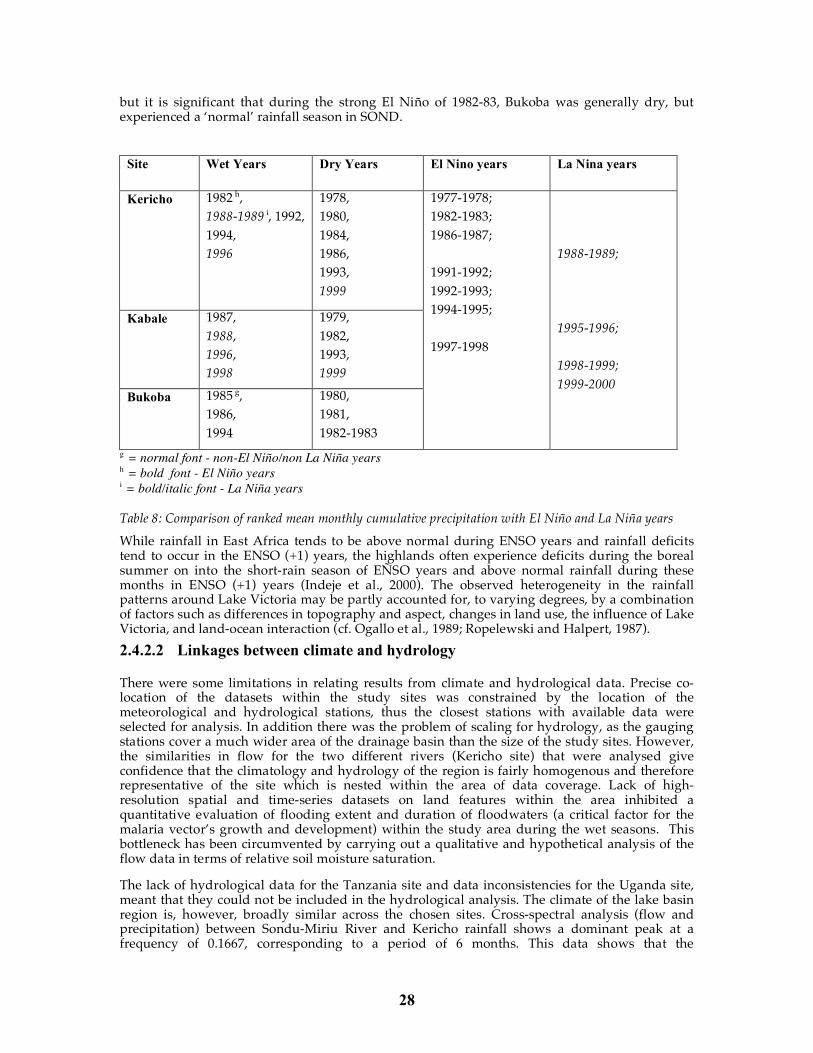
28
but it is significant that during the strong El Niño of 1982-83, Bukoba was generally dry, but experienced a ‘normal’ rainfall season in SOND.
Site Wet Years Dry Years El Nino years La Nina years
Kericho 1982 h, 1988-1989 i, 1992, 1994, 1996
1978, 1980, 1984, 1986, 1993, 1999
Kabale 1987, 1988, 1996, 1998
1979, 1982, 1993, 1999
Bukoba 1985 g, 1986, 1994
1980, 1981, 1982-1983
1977-1978; 1982-1983; 1986-1987; 1991-1992; 1992-1993; 1994-1995; 1997-1998
1988-1989; 1995-1996; 1998-1999; 1999-2000
g = normal font - non-El Niño/non La Niña years h = bold font - El Niño years i = bold/italic font - La Niña years
Table 8: Comparison of ranked mean monthly cumulative precipitation with El Niño and La Niña years While rainfall in East Africa tends to be above normal during ENSO years and rainfall deficits tend to occur in the ENSO (+1) years, the highlands often experience deficits during the boreal summer on into the short-rain season of EÑSO years and above normal rainfall during these months in ENSO (+1) years (Indeje et al., 2000). The observed heterogeneity in the rainfall patterns around Lake Victoria may be partly accounted for, to varying degrees, by a combination of factors such as differences in topography and aspect, changes in land use, the influence of Lake Victoria, and land-ocean interaction (cf. Ogallo et al., 1989; Ropelewski and Halpert, 1987). 2.4.2.2 Linkages between climate and hydrology
There were some limitations in relating results from climate and hydrological data. Precise co-location of the datasets within the study sites was constrained by the location of the meteorological and hydrological stations, thus the closest stations with available data were selected for analysis. In addition there was the problem of scaling for hydrology, as the gauging stations cover a much wider area of the drainage basin than the size of the study sites. However, the similarities in flow for the two different rivers (Kericho site) that were analysed give confidence that the climatology and hydrology of the region is fairly homogenous and therefore representative of the site which is nested within the area of data coverage. Lack of high-resolution spatial and time-series datasets on land features within the area inhibited a quantitative evaluation of flooding extent and duration of floodwaters (a critical factor for the malaria vector’s growth and development) within the study area during the wet seasons. This bottleneck has been circumvented by carrying out a qualitative and hypothetical analysis of the flow data in terms of relative soil moisture saturation.
The lack of hydrological data for the Tanzania site and data inconsistencies for the Uganda site, meant that they could not be included in the hydrological analysis. The climate of the lake basin region is, however, broadly similar across the chosen sites. Cross-spectral analysis (flow and precipitation) between Sondu-Miriu River and Kericho rainfall shows a dominant peak at a frequency of 0.1667, corresponding to a period of 6 months. This data shows that the
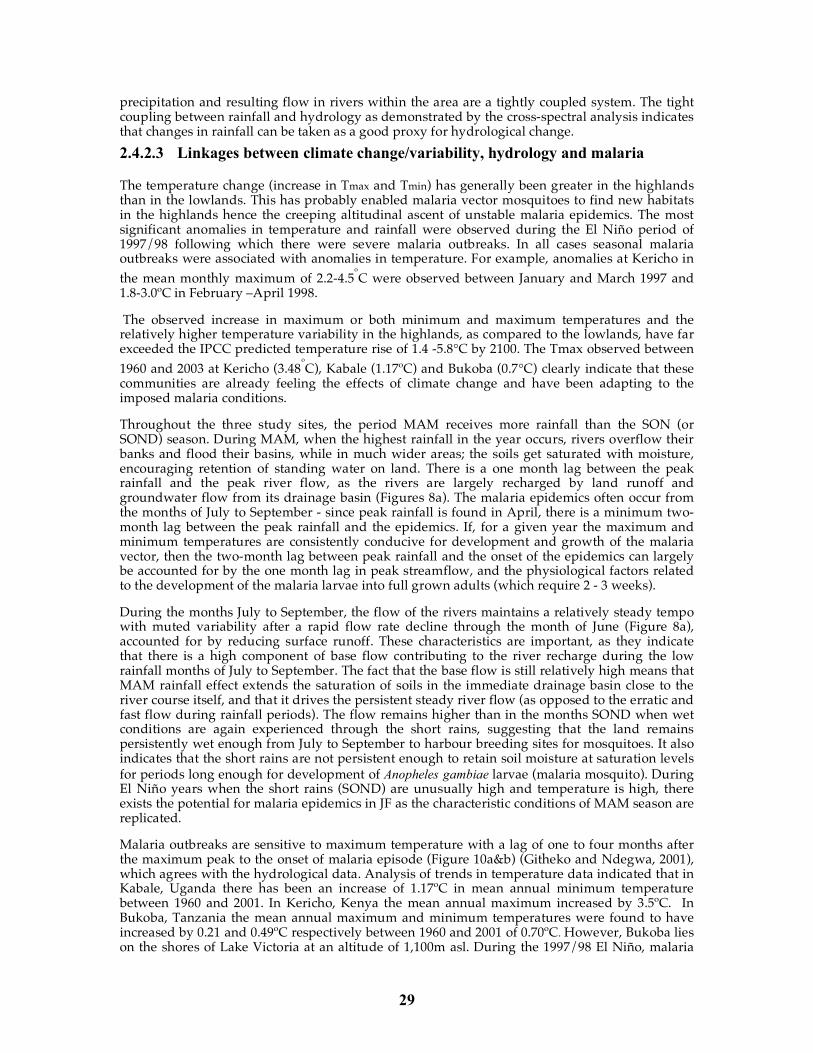
29
precipitation and resulting flow in rivers within the area are a tightly coupled system. The tight coupling between rainfall and hydrology as demonstrated by the cross-spectral analysis indicates that changes in rainfall can be taken as a good proxy for hydrological change. 2.4.2.3 Linkages between climate change/variability, hydrology and malaria
The temperature change (increase in Tmax and Tmin) has generally been greater in the highlands than in the lowlands. This has probably enabled malaria vector mosquitoes to find new habitats in the highlands hence the creeping altitudinal ascent of unstable malaria epidemics. The most significant anomalies in temperature and rainfall were observed during the El Niño period of 1997/98 following which there were severe malaria outbreaks. In all cases seasonal malaria outbreaks were associated with anomalies in temperature. For example, anomalies at Kericho in the mean monthly maximum of 2.2-4.5
oC were observed between January and March 1997 and
1.8-3.0ºC in February –April 1998.
The observed increase in maximum or both minimum and maximum temperatures and the relatively higher temperature variability in the highlands, as compared to the lowlands, have far exceeded the IPCC predicted temperature rise of 1.4 -5.8°C by 2100. The Tmax observed between 1960 and 2003 at Kericho (3.48
oC), Kabale (1.17ºC) and Bukoba (0.7°C) clearly indicate that these
communities are already feeling the effects of climate change and have been adapting to the imposed malaria conditions.
Throughout the three study sites, the period MAM receives more rainfall than the SON (or SOND) season. During MAM, when the highest rainfall in the year occurs, rivers overflow their banks and flood their basins, while in much wider areas; the soils get saturated with moisture, encouraging retention of standing water on land. There is a one month lag between the peak rainfall and the peak river flow, as the rivers are largely recharged by land runoff and groundwater flow from its drainage basin (Figures 8a). The malaria epidemics often occur from the months of July to September - since peak rainfall is found in April, there is a minimum two-month lag between the peak rainfall and the epidemics. If, for a given year the maximum and minimum temperatures are consistently conducive for development and growth of the malaria vector, then the two-month lag between peak rainfall and the onset of the epidemics can largely be accounted for by the one month lag in peak streamflow, and the physiological factors related to the development of the malaria larvae into full grown adults (which require 2 - 3 weeks).
During the months July to September, the flow of the rivers maintains a relatively steady tempo with muted variability after a rapid flow rate decline through the month of June (Figure 8a), accounted for by reducing surface runoff. These characteristics are important, as they indicate that there is a high component of base flow contributing to the river recharge during the low rainfall months of July to September. The fact that the base flow is still relatively high means that MAM rainfall effect extends the saturation of soils in the immediate drainage basin close to the river course itself, and that it drives the persistent steady river flow (as opposed to the erratic and fast flow during rainfall periods). The flow remains higher than in the months SOND when wet conditions are again experienced through the short rains, suggesting that the land remains persistently wet enough from July to September to harbour breeding sites for mosquitoes. It also indicates that the short rains are not persistent enough to retain soil moisture at saturation levels for periods long enough for development of Anopheles gambiae larvae (malaria mosquito). During El Niño years when the short rains (SOND) are unusually high and temperature is high, there exists the potential for malaria epidemics in JF as the characteristic conditions of MAM season are replicated.
Malaria outbreaks are sensitive to maximum temperature with a lag of one to four months after the maximum peak to the onset of malaria episode (Figure 10a&b) (Githeko and Ndegwa, 2001), which agrees with the hydrological data. Analysis of trends in temperature data indicated that in Kabale, Uganda there has been an increase of 1.17ºC in mean annual minimum temperature between 1960 and 2001. In Kericho, Kenya the mean annual maximum increased by 3.5ºC. In Bukoba, Tanzania the mean annual maximum and minimum temperatures were found to have increased by 0.21 and 0.49ºC respectively between 1960 and 2001 of 0.70ºC. However, Bukoba lies on the shores of Lake Victoria at an altitude of 1,100m asl. During the 1997/98 El Niño, malaria
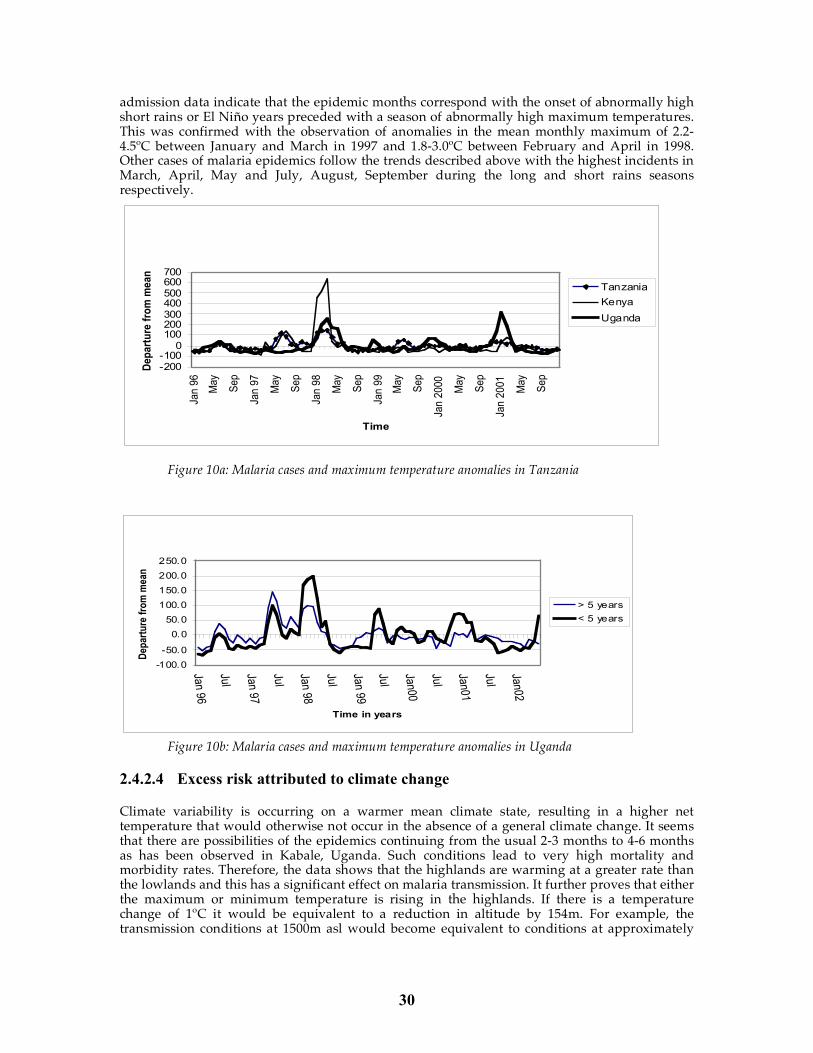
30
admission data indicate that the epidemic months correspond with the onset of abnormally high short rains or El Niño years preceded with a season of abnormally high maximum temperatures. This was confirmed with the observation of anomalies in the mean monthly maximum of 2.2-4.5ºC between January and March in 1997 and 1.8-3.0ºC between February and April in 1998. Other cases of malaria epidemics follow the trends described above with the highest incidents in March, April, May and July, August, September during the long and short rains seasons respectively.
-200-100
0100200300400500600700
Jan
96
May
Se
p
Jan
97
May
Se
p
Jan
98
May
Se
p
Jan
99
May
Se
p
Jan
20
00
May
Se
p
Jan
20
01
May
Se
p
Time
De
pa
rtu
re f
rom
me
an
Tanzania
Kenya
Uganda
Figure 10a: Malaria cases and maximum temperature anomalies in Tanzania
-100.0
-50.0
0.0
50.0
100.0
150.0
200.0
250.0
Jan 96
Jul
Jan 97
Jul
Jan 98
Jul
Jan 99
Jul
Jan00
Jul
Jan01
Jul
Jan02
Time in years
Dep
artu
re f
rom
mea
n
> 5 years
< 5 years
Figure 10b: Malaria cases and maximum temperature anomalies in Uganda
2.4.2.4 Excess risk attributed to climate change
Climate variability is occurring on a warmer mean climate state, resulting in a higher net temperature that would otherwise not occur in the absence of a general climate change. It seems that there are possibilities of the epidemics continuing from the usual 2-3 months to 4-6 months as has been observed in Kabale, Uganda. Such conditions lead to very high mortality and morbidity rates. Therefore, the data shows that the highlands are warming at a greater rate than the lowlands and this has a significant effect on malaria transmission. It further proves that either the maximum or minimum temperature is rising in the highlands. If there is a temperature change of 1ºC it would be equivalent to a reduction in altitude by 154m. For example, the transmission conditions at 1500m asl would become equivalent to conditions at approximately
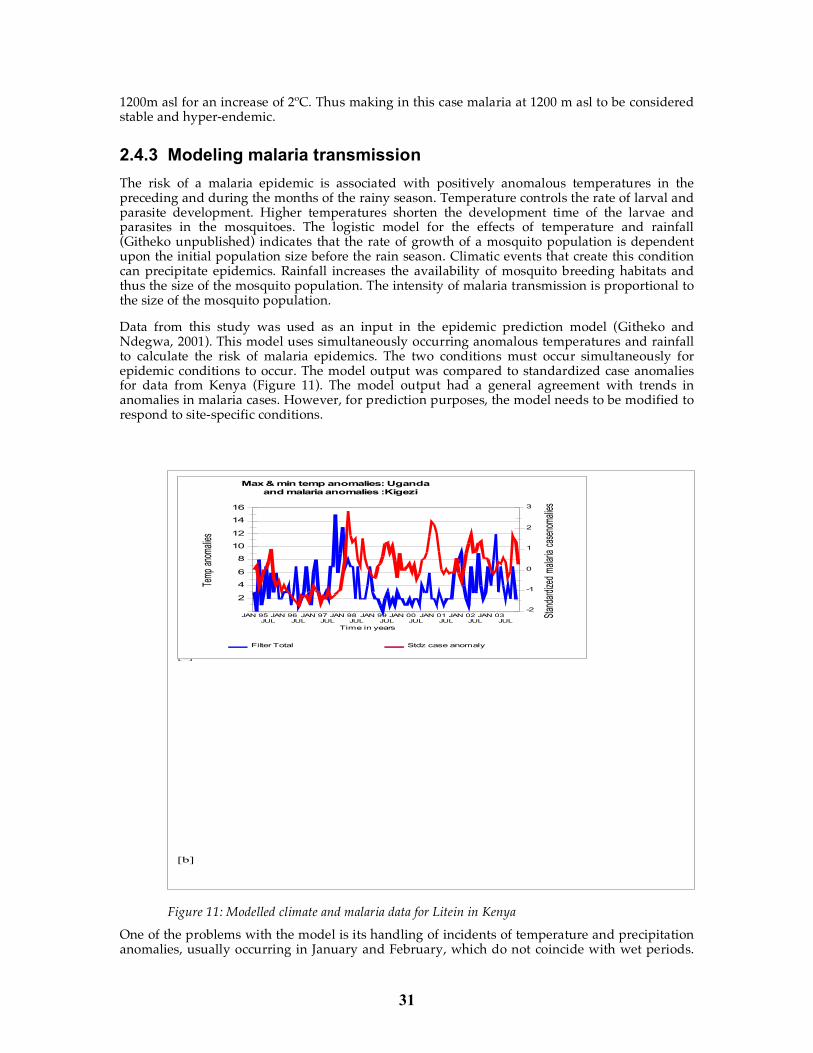
31
1200m asl for an increase of 2ºC. Thus making in this case malaria at 1200 m asl to be considered stable and hyper-endemic.
2.4.3 Modeling malaria transmission The risk of a malaria epidemic is associated with positively anomalous temperatures in the preceding and during the months of the rainy season. Temperature controls the rate of larval and parasite development. Higher temperatures shorten the development time of the larvae and parasites in the mosquitoes. The logistic model for the effects of temperature and rainfall (Githeko unpublished) indicates that the rate of growth of a mosquito population is dependent upon the initial population size before the rain season. Climatic events that create this condition can precipitate epidemics. Rainfall increases the availability of mosquito breeding habitats and thus the size of the mosquito population. The intensity of malaria transmission is proportional to the size of the mosquito population.
Data from this study was used as an input in the epidemic prediction model (Githeko and Ndegwa, 2001). This model uses simultaneously occurring anomalous temperatures and rainfall to calculate the risk of malaria epidemics. The two conditions must occur simultaneously for epidemic conditions to occur. The model output was compared to standardized case anomalies for data from Kenya (Figure 11). The model output had a general agreement with trends in anomalies in malaria cases. However, for prediction purposes, the model needs to be modified to respond to site-specific conditions.
-2
-1
0
1
2
3
4
5
6
7
8
9
10
11
12
Total
anom
aly
-2
0
2
4
6
8
10
Stad
ardi
zed
case
anom
alis
Jan 95
July
Jan 96
July
Jan 97
July
Jan 98
July
Jan 99
July
Jan 00
July
Jan 01
July
Jan 02
Time (Years)
Filter Totals Std case anomaly
Max and Min Temp anomalies, Tanzania
and Malaria cases anomalies: Muleba
[a]
2
4
6
8
10
12
14
16
Tem
p an
omali
es
-2
-1
0
1
2
3
Stan
dard
ized
mala
ria c
asen
omali
es
JAN 95JUL
JAN 96JUL
JAN 97JUL
JAN 98JUL
JAN 99JUL
JAN 00JUL
JAN 01JUL
JAN 02JUL
JAN 03JUL
Time in years
Filter Total Stdz case anomaly
Max & min temp anomalies: Uganda
and malaria anomalies :Kigezi
[b]
Figure 11: Modelled climate and malaria data for Litein in Kenya
One of the problems with the model is its handling of incidents of temperature and precipitation anomalies, usually occurring in January and February, which do not coincide with wet periods.
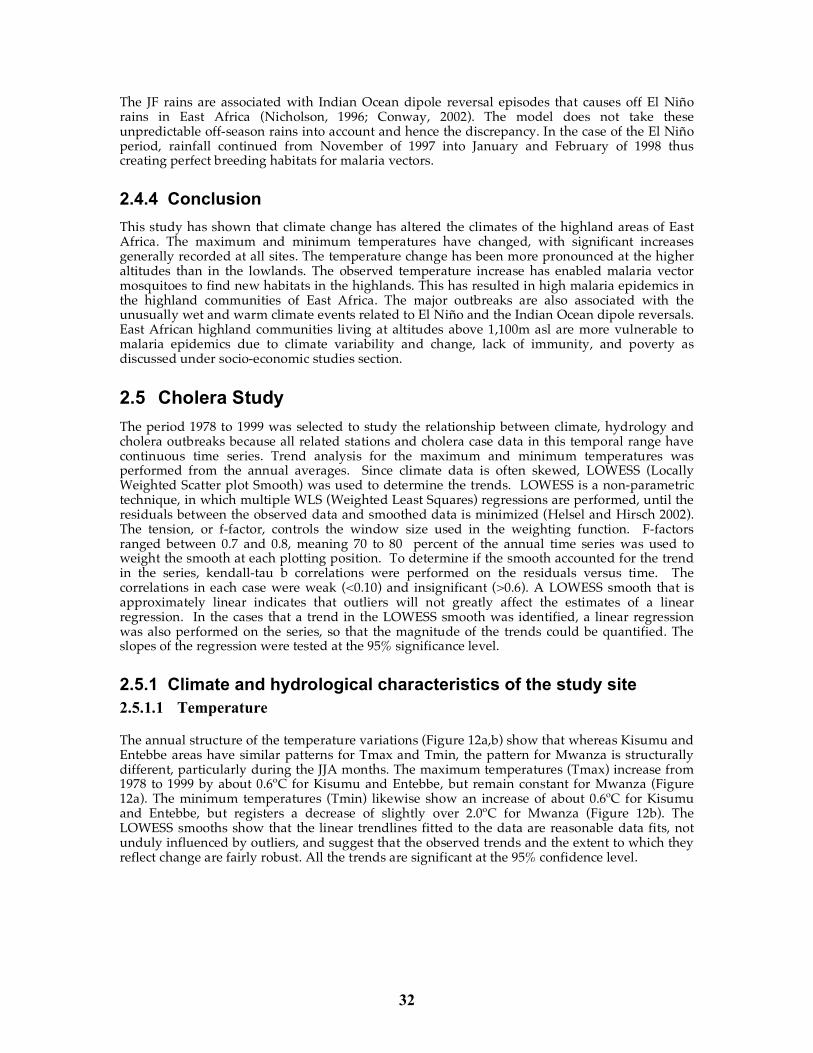
32
The JF rains are associated with Indian Ocean dipole reversal episodes that causes off El Niño rains in East Africa (Nicholson, 1996; Conway, 2002). The model does not take these unpredictable off-season rains into account and hence the discrepancy. In the case of the El Niño period, rainfall continued from November of 1997 into January and February of 1998 thus creating perfect breeding habitats for malaria vectors.
2.4.4 Conclusion This study has shown that climate change has altered the climates of the highland areas of East Africa. The maximum and minimum temperatures have changed, with significant increases generally recorded at all sites. The temperature change has been more pronounced at the higher altitudes than in the lowlands. The observed temperature increase has enabled malaria vector mosquitoes to find new habitats in the highlands. This has resulted in high malaria epidemics in the highland communities of East Africa. The major outbreaks are also associated with the unusually wet and warm climate events related to El Niño and the Indian Ocean dipole reversals. East African highland communities living at altitudes above 1,100m asl are more vulnerable to malaria epidemics due to climate variability and change, lack of immunity, and poverty as discussed under socio-economic studies section.
2.5 Cholera Study The period 1978 to 1999 was selected to study the relationship between climate, hydrology and cholera outbreaks because all related stations and cholera case data in this temporal range have continuous time series. Trend analysis for the maximum and minimum temperatures was performed from the annual averages. Since climate data is often skewed, LOWESS (Locally Weighted Scatter plot Smooth) was used to determine the trends. LOWESS is a non-parametric technique, in which multiple WLS (Weighted Least Squares) regressions are performed, until the residuals between the observed data and smoothed data is minimized (Helsel and Hirsch 2002). The tension, or f-factor, controls the window size used in the weighting function. F-factors ranged between 0.7 and 0.8, meaning 70 to 80 percent of the annual time series was used to weight the smooth at each plotting position. To determine if the smooth accounted for the trend in the series, kendall-tau b correlations were performed on the residuals versus time. The correlations in each case were weak (<0.10) and insignificant (>0.6). A LOWESS smooth that is approximately linear indicates that outliers will not greatly affect the estimates of a linear regression. In the cases that a trend in the LOWESS smooth was identified, a linear regression was also performed on the series, so that the magnitude of the trends could be quantified. The slopes of the regression were tested at the 95% significance level.
2.5.1 Climate and hydrological characteristics of the study site 2.5.1.1 Temperature
The annual structure of the temperature variations (Figure 12a,b) show that whereas Kisumu and Entebbe areas have similar patterns for Tmax and Tmin, the pattern for Mwanza is structurally different, particularly during the JJA months. The maximum temperatures (Tmax) increase from 1978 to 1999 by about 0.6ºC for Kisumu and Entebbe, but remain constant for Mwanza (Figure 12a). The minimum temperatures (Tmin) likewise show an increase of about 0.6ºC for Kisumu and Entebbe, but registers a decrease of slightly over 2.0ºC for Mwanza (Figure 12b). The LOWESS smooths show that the linear trendlines fitted to the data are reasonable data fits, not unduly influenced by outliers, and suggest that the observed trends and the extent to which they reflect change are fairly robust. All the trends are significant at the 95% confidence level.
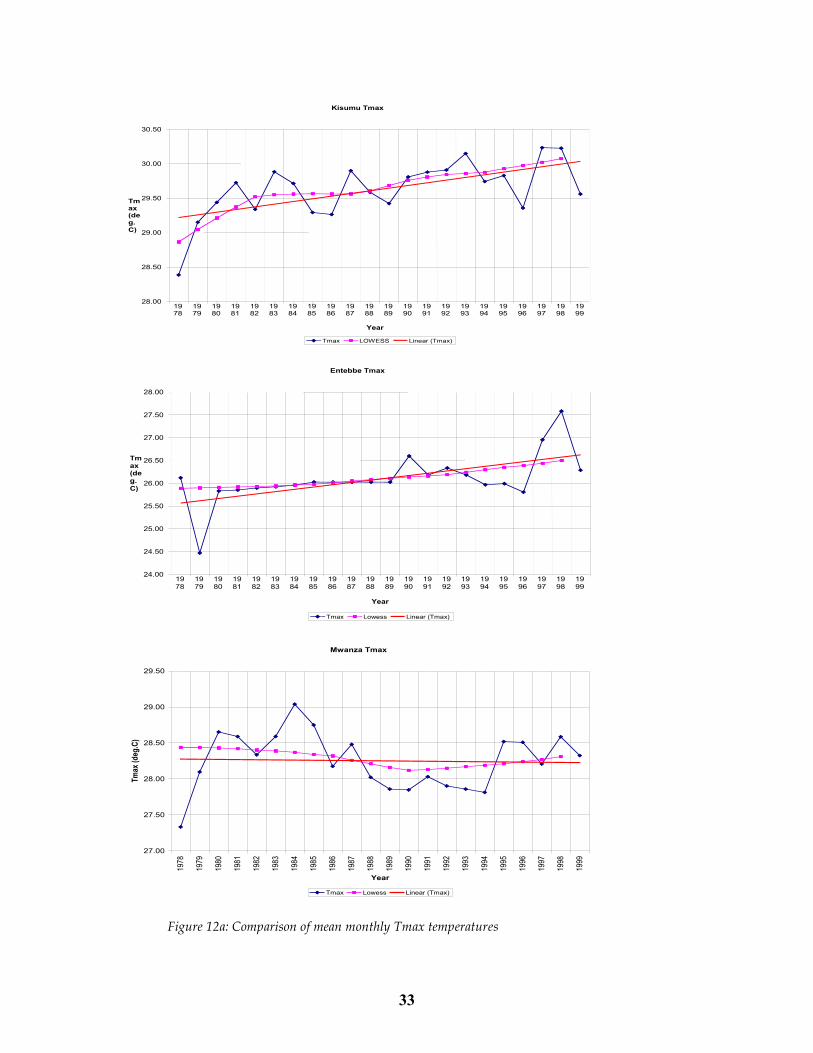
33
Kisumu Tmax
28.00
28.50
29.00
29.50
30.00
30.50
1978
1979
1980
1981
1982
1983
1984
1985
1986
1987
1988
1989
1990
1991
1992
1993
1994
1995
1996
1997
1998
1999
Tmax(deg.
C)
Year
Tmax LOWESS Linear (Tmax)
Entebbe Tmax
24.00
24.50
25.00
25.50
26.00
26.50
27.00
27.50
28.00
1978
1979
1980
1981
1982
1983
1984
1985
1986
1987
1988
1989
1990
1991
1992
1993
1994
1995
1996
1997
1998
1999
Year
Tmax(deg.
C)
Tmax Lowess Linear (Tmax)
Mwanza Tmax
27.00
27.50
28.00
28.50
29.00
29.50
1978
1979
1980
1981
1982
1983
1984
1985
1986
1987
1988
1989
1990
1991
1992
1993
1994
1995
1996
1997
1998
1999
Year
Tm
ax (
deg
.C)
Tmax Lowess Linear (Tmax) Figure 12a: Comparison of mean monthly Tmax temperatures
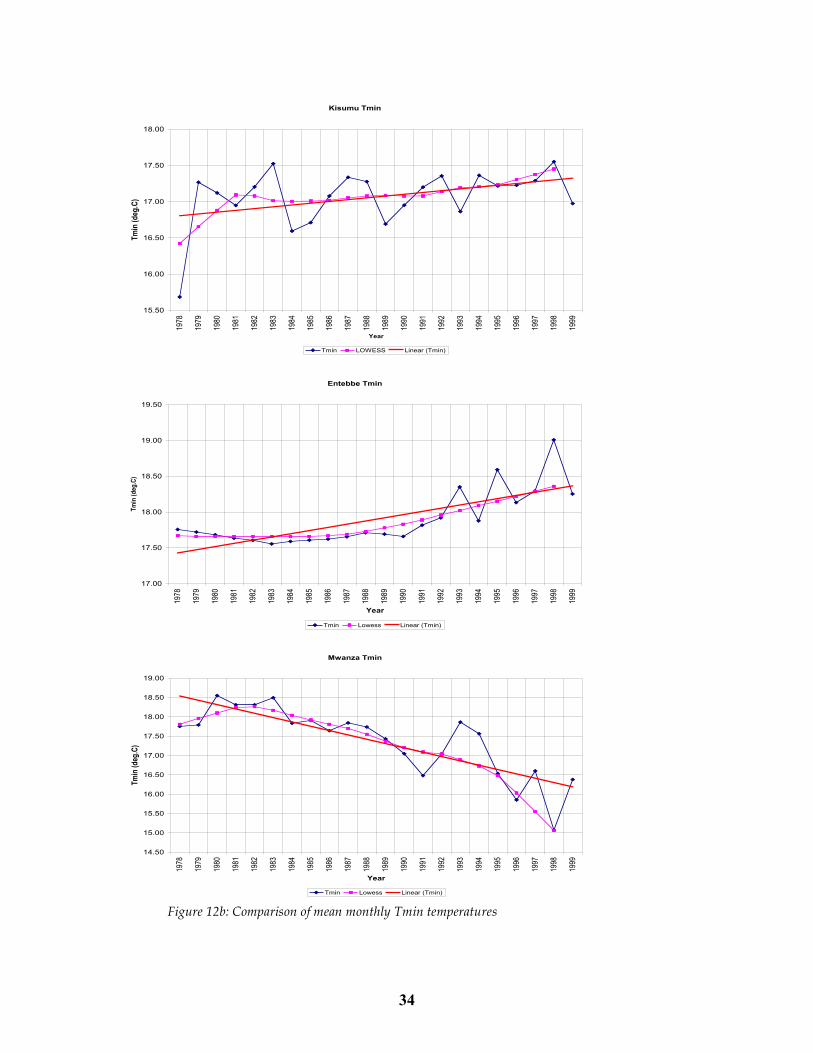
34
Kisumu Tmin
15.50
16.00
16.50
17.00
17.50
18.00
1978
1979
1980
1981
1982
1983
1984
1985
1986
1987
1988
1989
1990
1991
1992
1993
1994
1995
1996
1997
1998
1999
Year
Tm
in (
deg
.C)
Tmin LOWESS Linear (Tmin)
Entebbe Tmin
17.00
17.50
18.00
18.50
19.00
19.50
1978
1979
1980
1981
1982
1983
1984
1985
1986
1987
1988
1989
1990
1991
1992
1993
1994
1995
1996
1997
1998
1999
Year
Tm
in (
deg
.C)
Tmin Lowess Linear (Tmin)
Mwanza Tmin
14.50
15.00
15.50
16.00
16.50
17.00
17.50
18.00
18.50
19.00
1978
1979
1980
1981
1982
1983
1984
1985
1986
1987
1988
1989
1990
1991
1992
1993
1994
1995
1996
1997
1998
1999
Year
Tm
in (
deg
.C)
Tmin Lowess Linear (Tmin) Figure 12b: Comparison of mean monthly Tmin temperatures
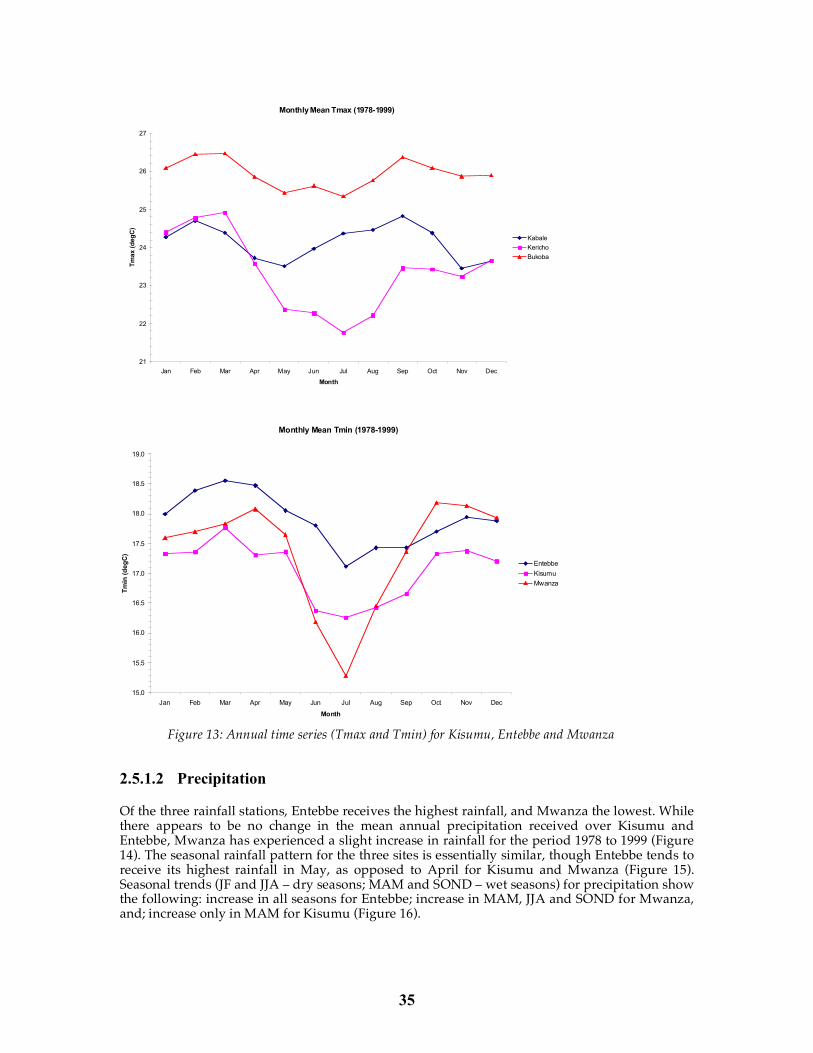
35
Monthly Mean Tmax (1978-1999)
21
22
23
24
25
26
27
Jan Feb Mar Apr May Jun Jul Aug Sep Oct Nov Dec
Month
Tm
ax (
deg
C)
Kabale
Kericho
Bukoba
Figure 13: Annual time series (Tmax and Tmin) for Kisumu, Entebbe and Mwanza 2.5.1.2 Precipitation
Of the three rainfall stations, Entebbe receives the highest rainfall, and Mwanza the lowest. While there appears to be no change in the mean annual precipitation received over Kisumu and Entebbe, Mwanza has experienced a slight increase in rainfall for the period 1978 to 1999 (Figure 14). The seasonal rainfall pattern for the three sites is essentially similar, though Entebbe tends to receive its highest rainfall in May, as opposed to April for Kisumu and Mwanza (Figure 15). Seasonal trends (JF and JJA – dry seasons; MAM and SOND – wet seasons) for precipitation show the following: increase in all seasons for Entebbe; increase in MAM, JJA and SOND for Mwanza, and; increase only in MAM for Kisumu (Figure 16).
Monthly Mean Tmin (1978-1999)
15.0
15.5
16.0
16.5
17.0
17.5
18.0
18.5
19.0
Jan Feb Mar Apr May Jun Jul Aug Sep Oct Nov Dec
Month
Tm
in (
deg
C)
Entebbe
Kisumu
Mwanza
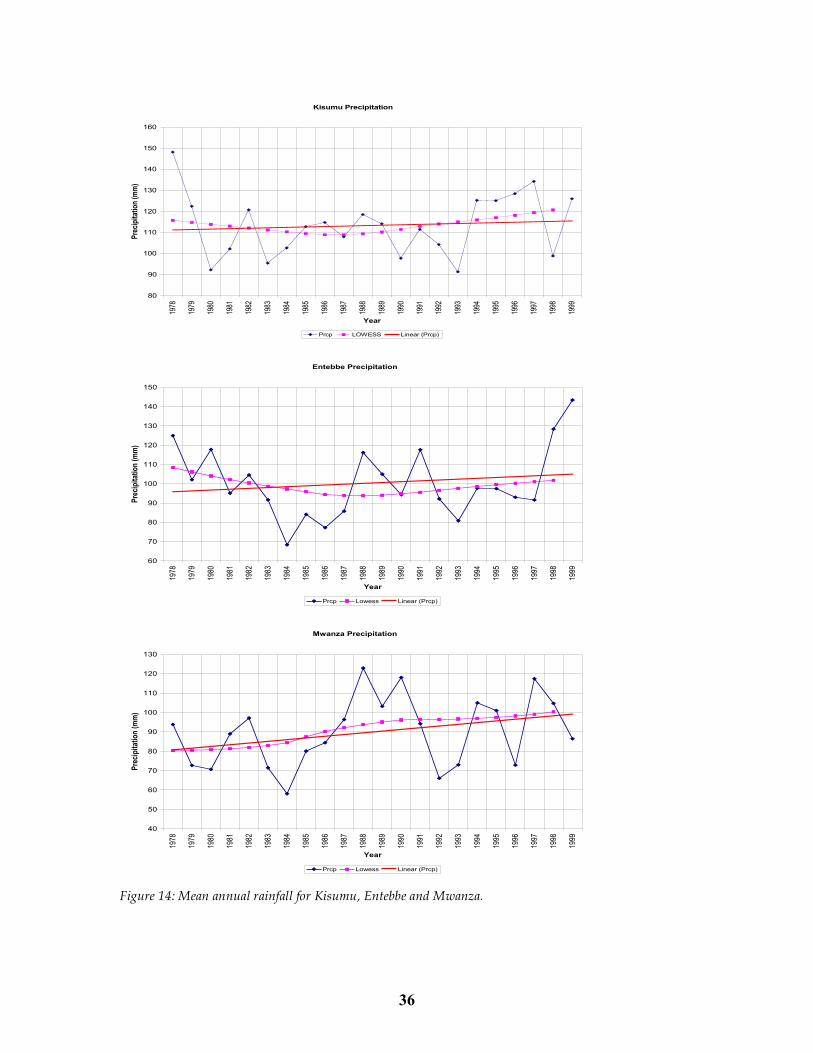
36
Kisumu Precipitation
80
90
100
110
120
130
140
150
160
1978
1979
1980
1981
1982
1983
1984
1985
1986
1987
1988
1989
1990
1991
1992
1993
1994
1995
1996
1997
1998
1999
Year
Pre
cip
itat
ion
(m
m)
Prcp LOWESS Linear (Prcp)
Entebbe Precipitation
60
70
80
90
100
110
120
130
140
150
1978
1979
1980
1981
1982
1983
1984
1985
1986
1987
1988
1989
1990
1991
1992
1993
1994
1995
1996
1997
1998
1999
Year
Pre
cip
itat
ion
(m
m)
Prcp Lowess Linear (Prcp)
Mwanza Precipitation
40
50
60
70
80
90
100
110
120
130
1978
1979
1980
1981
1982
1983
1984
1985
1986
1987
1988
1989
1990
1991
1992
1993
1994
1995
1996
1997
1998
1999
Year
Pre
cip
itat
ion
(m
m)
Prcp Lowess Linear (Prcp)
Figure 14: Mean annual rainfall for Kisumu, Entebbe and Mwanza.
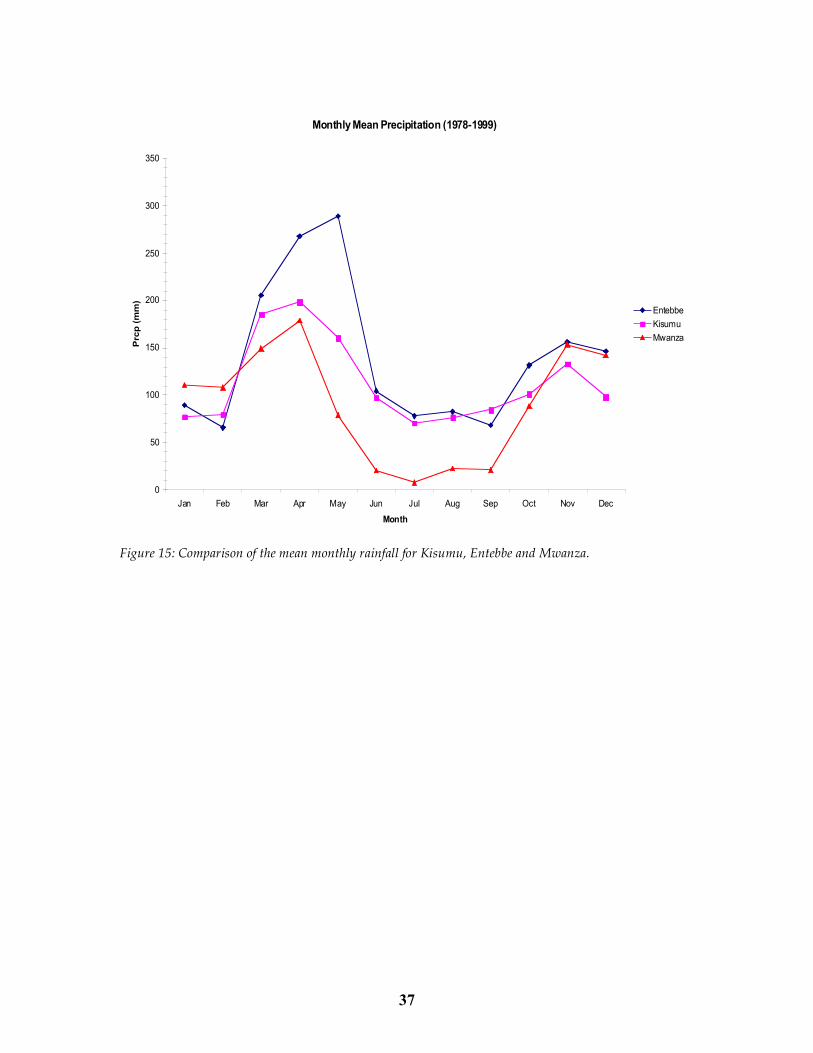
37
Figure 15: Comparison of the mean monthly rainfall for Kisumu, Entebbe and Mwanza.
Monthly Mean Precipitation (1978-1999)
0
50
100
150
200
250
300
350
Jan Feb Mar Apr May Jun Jul Aug Sep Oct Nov Dec
Month
Prc
p (
mm
)
Entebbe
Kisumu
Mwanza
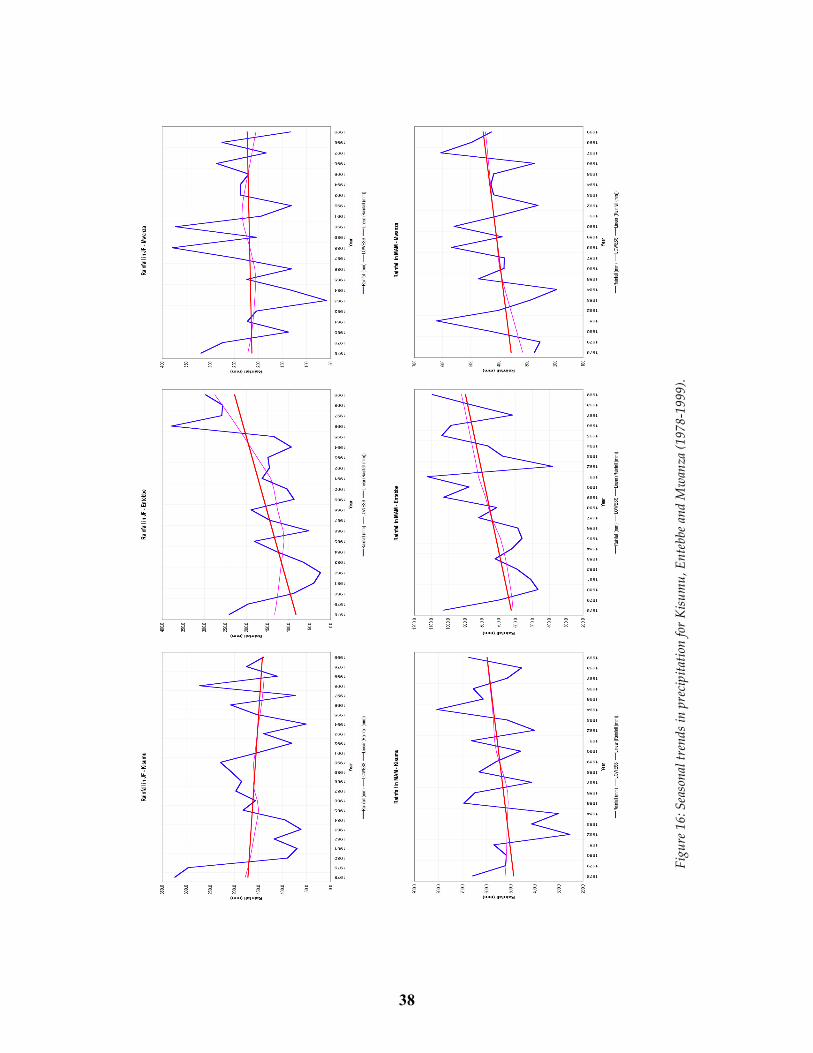
38
Fi
gure
16:
Sea
sona
l tre
nds i
n pr
ecip
itatio
n fo
r Kisu
mu,
Ent
ebbe
and
Mw
anza
(197
8-19
99).
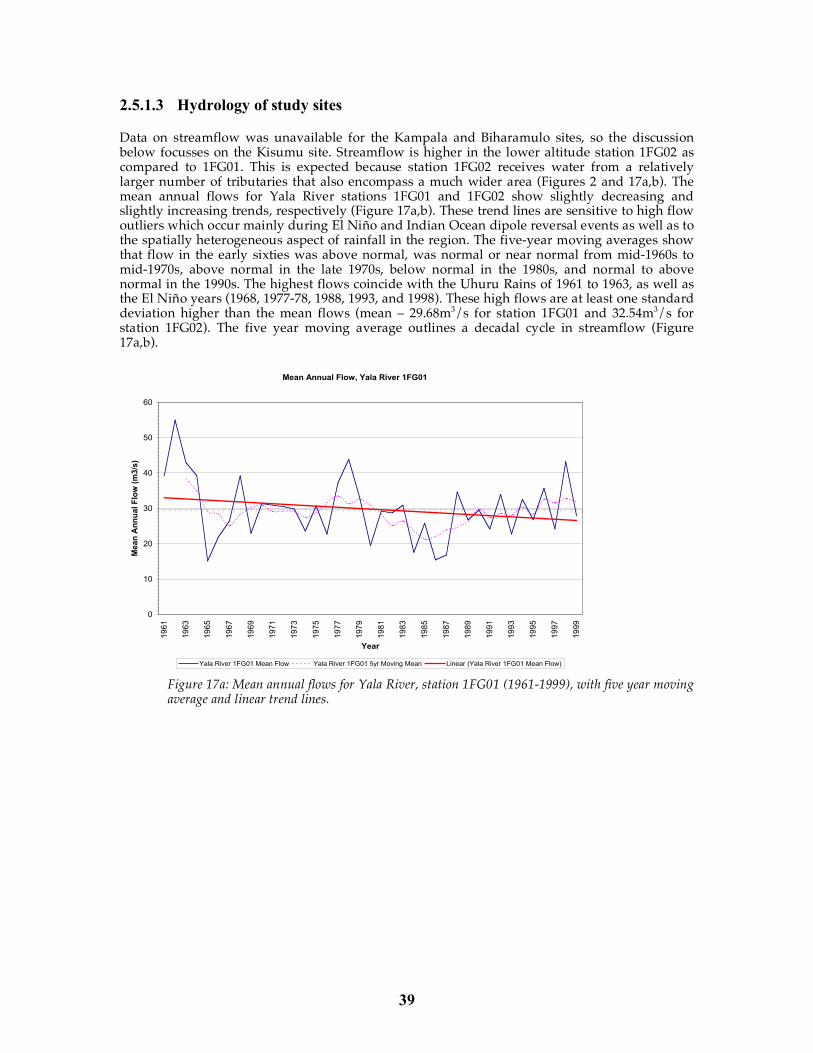
39
2.5.1.3 Hydrology of study sites
Data on streamflow was unavailable for the Kampala and Biharamulo sites, so the discussion below focusses on the Kisumu site. Streamflow is higher in the lower altitude station 1FG02 as compared to 1FG01. This is expected because station 1FG02 receives water from a relatively larger number of tributaries that also encompass a much wider area (Figures 2 and 17a,b). The mean annual flows for Yala River stations 1FG01 and 1FG02 show slightly decreasing and slightly increasing trends, respectively (Figure 17a,b). These trend lines are sensitive to high flow outliers which occur mainly during El Niño and Indian Ocean dipole reversal events as well as to the spatially heterogeneous aspect of rainfall in the region. The five-year moving averages show that flow in the early sixties was above normal, was normal or near normal from mid-1960s to mid-1970s, above normal in the late 1970s, below normal in the 1980s, and normal to above normal in the 1990s. The highest flows coincide with the Uhuru Rains of 1961 to 1963, as well as the El Niño years (1968, 1977-78, 1988, 1993, and 1998). These high flows are at least one standard deviation higher than the mean flows (mean – 29.68m3/s for station 1FG01 and 32.54m3/s for station 1FG02). The five year moving average outlines a decadal cycle in streamflow (Figure 17a,b).
Mean Annual Flow, Yala River 1FG01
0
10
20
30
40
50
60
19
61
19
63
19
65
19
67
19
69
19
71
19
73
19
75
19
77
19
79
19
81
19
83
19
85
19
87
19
89
19
91
19
93
19
95
19
97
19
99
Year
Mea
n A
nn
ual
Flo
w (
m3/s
)
Yala River 1FG01 Mean Flow Yala River 1FG01 5yr Moving Mean Linear (Yala River 1FG01 Mean Flow) Figure 17a: Mean annual flows for Yala River, station 1FG01 (1961-1999), with five year moving average and linear trend lines.
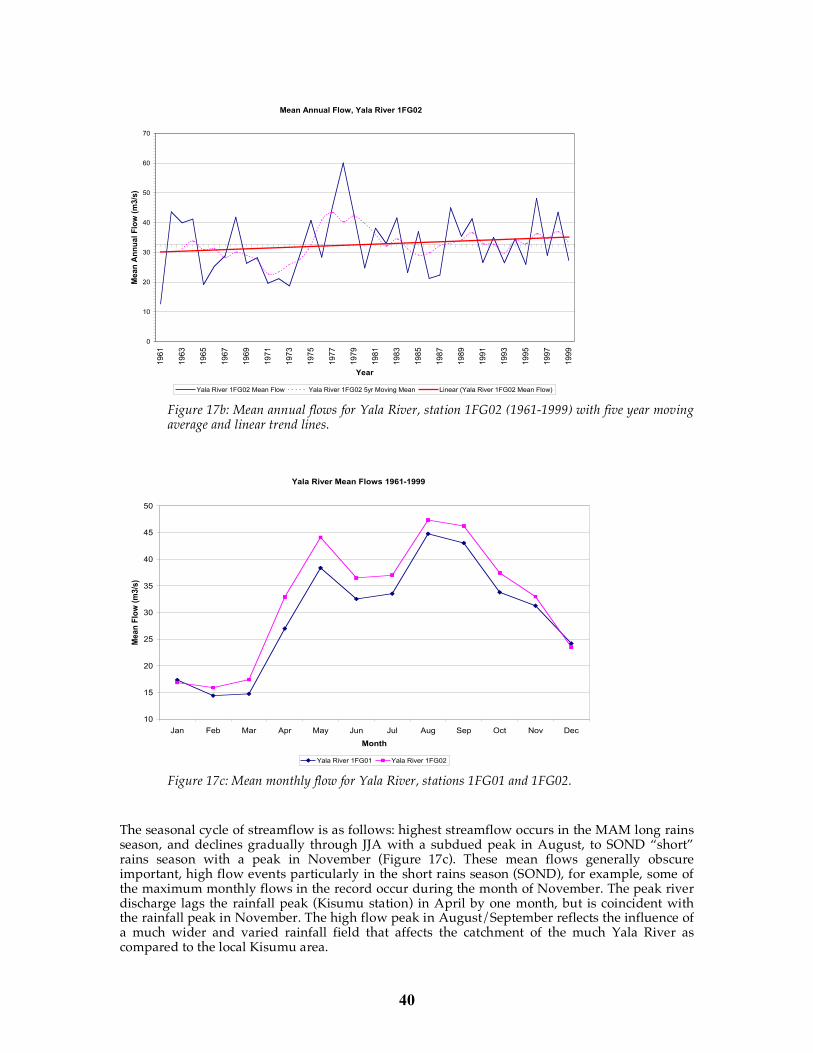
40
Mean Annual Flow, Yala River 1FG02
0
10
20
30
40
50
60
70
19
61
19
63
19
65
19
67
19
69
19
71
19
73
19
75
19
77
19
79
19
81
19
83
19
85
19
87
19
89
19
91
19
93
19
95
19
97
19
99
Year
Me
an
An
nu
al
Flo
w (
m3
/s)
Yala River 1FG02 Mean Flow Yala River 1FG02 5yr Moving Mean Linear (Yala River 1FG02 Mean Flow) Figure 17b: Mean annual flows for Yala River, station 1FG02 (1961-1999) with five year moving average and linear trend lines.
Yala River Mean Flows 1961-1999
10
15
20
25
30
35
40
45
50
Jan Feb Mar Apr May Jun Jul Aug Sep Oct Nov Dec
Month
Me
an
Flo
w (
m3
/s)
Yala River 1FG01 Yala River 1FG02 Figure 17c: Mean monthly flow for Yala River, stations 1FG01 and 1FG02.
The seasonal cycle of streamflow is as follows: highest streamflow occurs in the MAM long rains season, and declines gradually through JJA with a subdued peak in August, to SOND “short” rains season with a peak in November (Figure 17c). These mean flows generally obscure important, high flow events particularly in the short rains season (SOND), for example, some of the maximum monthly flows in the record occur during the month of November. The peak river discharge lags the rainfall peak (Kisumu station) in April by one month, but is coincident with the rainfall peak in November. The high flow peak in August/September reflects the influence of a much wider and varied rainfall field that affects the catchment of the much Yala River as compared to the local Kisumu area.
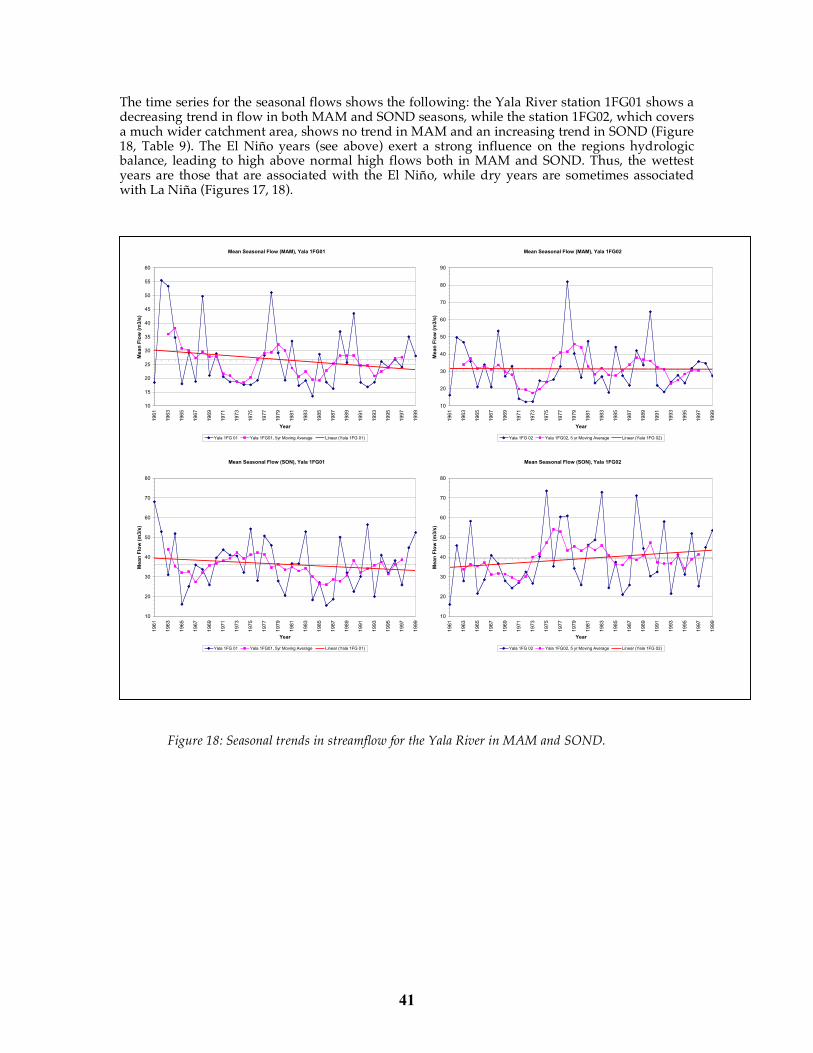
41
The time series for the seasonal flows shows the following: the Yala River station 1FG01 shows a decreasing trend in flow in both MAM and SOND seasons, while the station 1FG02, which covers a much wider catchment area, shows no trend in MAM and an increasing trend in SOND (Figure 18, Table 9). The El Niño years (see above) exert a strong influence on the regions hydrologic balance, leading to high above normal high flows both in MAM and SOND. Thus, the wettest years are those that are associated with the El Niño, while dry years are sometimes associated with La Niña (Figures 17, 18).
Figure 18: Seasonal trends in streamflow for the Yala River in MAM and SOND.
Mean Seasonal Flow (MAM), Yala 1FG01
10
15
20
25
30
35
40
45
50
55
60
1961
1963
1965
1967
1969
1971
1973
1975
1977
1979
1981
1983
1985
1987
1989
1991
1993
1995
1997
1999
Year
Me
an
Flo
w (
m3
/s)
Yala 1FG 01 Yala 1FG01, 5yr Moving Average Linear (Yala 1FG 01)
Mean Seasonal Flow (SON), Yala 1FG01
10
20
30
40
50
60
70
80
1961
1963
1965
1967
1969
1971
1973
1975
1977
1979
1981
1983
1985
1987
1989
1991
1993
1995
1997
1999
Year
Me
an
Flo
w (
m3
/s)
Yala 1FG 01 Yala 1FG01, 5yr Moving Average Linear (Yala 1FG 01)
Mean Seasonal Flow (MAM), Yala 1FG02
10
20
30
40
50
60
70
80
90
1961
1963
1965
1967
1969
1971
1973
1975
1977
1979
1981
1983
1985
1987
1989
1991
1993
1995
1997
1999
Year
Me
an
Flo
w (
m3
/s)
Yala 1FG 02 Yala 1FG02, 5 yr Moving Average Linear (Yala 1FG 02)
Mean Seasonal Flow (SON), Yala 1FG02
10
20
30
40
50
60
70
80
1961
1963
1965
1967
1969
1971
1973
1975
1977
1979
1981
1983
1985
1987
1989
1991
1993
1995
1997
1999
Year
Me
an
Flo
w (
m3
/s)
Yala 1FG 02 Yala 1FG02, 5 yr Moving Average Linear (Yala 1FG 02)
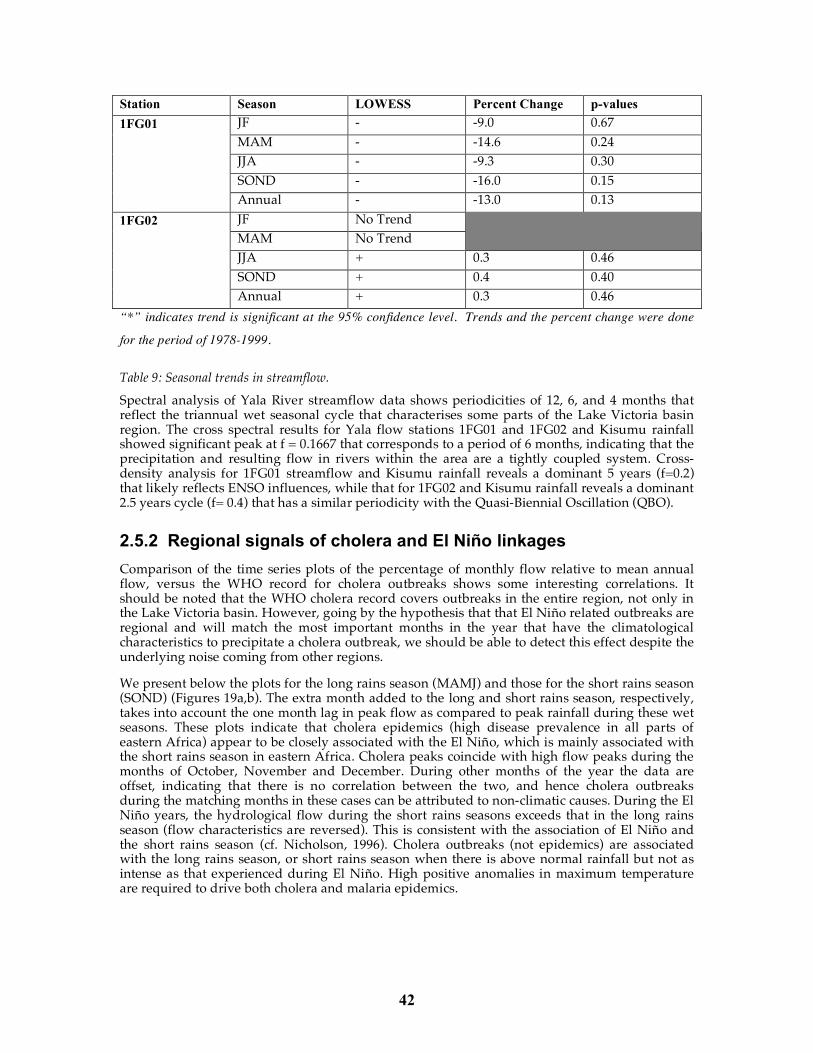
42
Station Season LOWESS Percent Change p-values JF - -9.0 0.67 MAM - -14.6 0.24 JJA - -9.3 0.30 SOND - -16.0 0.15
1FG01
Annual - -13.0 0.13 JF No Trend MAM No Trend
JJA + 0.3 0.46 SOND + 0.4 0.40
1FG02
Annual + 0.3 0.46 “*” indicates trend is significant at the 95% confidence level. Trends and the percent change were done
for the period of 1978-1999.
Table 9: Seasonal trends in streamflow. Spectral analysis of Yala River streamflow data shows periodicities of 12, 6, and 4 months that reflect the triannual wet seasonal cycle that characterises some parts of the Lake Victoria basin region. The cross spectral results for Yala flow stations 1FG01 and 1FG02 and Kisumu rainfall showed significant peak at f = 0.1667 that corresponds to a period of 6 months, indicating that the precipitation and resulting flow in rivers within the area are a tightly coupled system. Cross-density analysis for 1FG01 streamflow and Kisumu rainfall reveals a dominant 5 years (f=0.2) that likely reflects ENSO influences, while that for 1FG02 and Kisumu rainfall reveals a dominant 2.5 years cycle (f= 0.4) that has a similar periodicity with the Quasi-Biennial Oscillation (QBO).
2.5.2 Regional signals of cholera and El Niño linkages Comparison of the time series plots of the percentage of monthly flow relative to mean annual flow, versus the WHO record for cholera outbreaks shows some interesting correlations. It should be noted that the WHO cholera record covers outbreaks in the entire region, not only in the Lake Victoria basin. However, going by the hypothesis that that El Niño related outbreaks are regional and will match the most important months in the year that have the climatological characteristics to precipitate a cholera outbreak, we should be able to detect this effect despite the underlying noise coming from other regions.
We present below the plots for the long rains season (MAMJ) and those for the short rains season (SOND) (Figures 19a,b). The extra month added to the long and short rains season, respectively, takes into account the one month lag in peak flow as compared to peak rainfall during these wet seasons. These plots indicate that cholera epidemics (high disease prevalence in all parts of eastern Africa) appear to be closely associated with the El Niño, which is mainly associated with the short rains season in eastern Africa. Cholera peaks coincide with high flow peaks during the months of October, November and December. During other months of the year the data are offset, indicating that there is no correlation between the two, and hence cholera outbreaks during the matching months in these cases can be attributed to non-climatic causes. During the El Niño years, the hydrological flow during the short rains seasons exceeds that in the long rains season (flow characteristics are reversed). This is consistent with the association of El Niño and the short rains season (cf. Nicholson, 1996). Cholera outbreaks (not epidemics) are associated with the long rains season, or short rains season when there is above normal rainfall but not as intense as that experienced during El Niño. High positive anomalies in maximum temperature are required to drive both cholera and malaria epidemics.
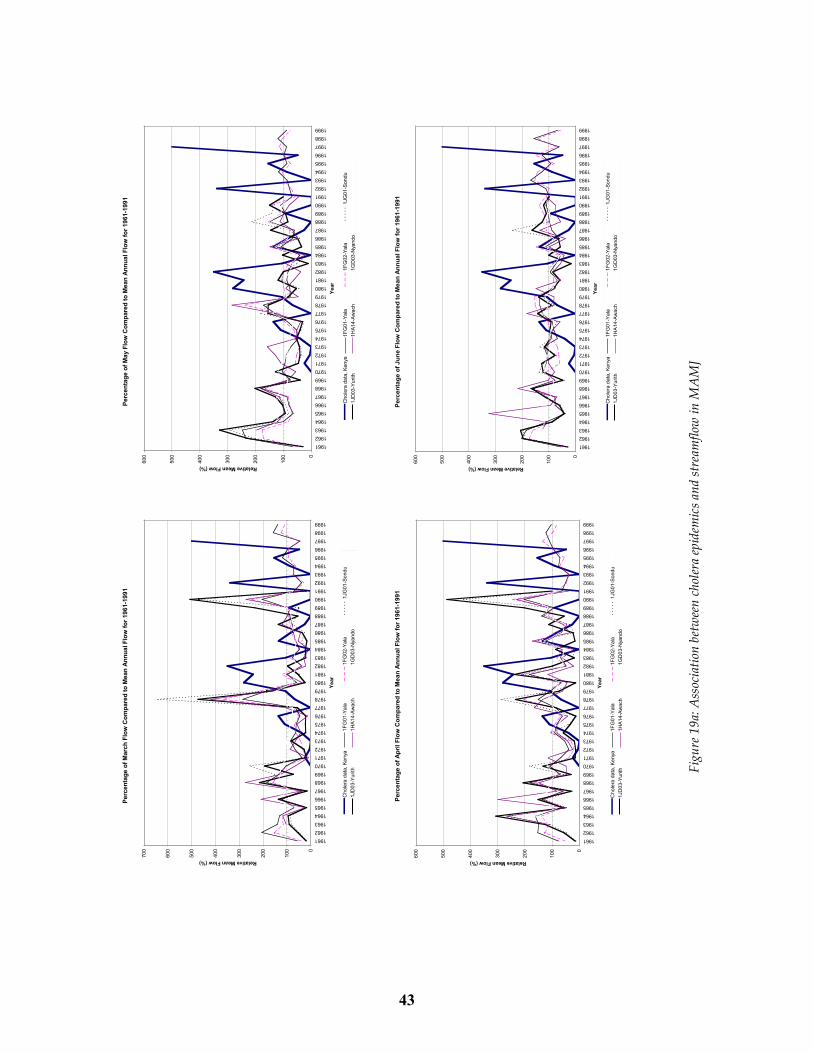
43
Perc
en
tag
e o
f M
arc
h F
low
Co
mp
are
d t
o M
ean
An
nu
al F
low
fo
r 1961-1
991
0
10
0
20
0
30
0
40
0
50
0
60
0
70
0
1961
1962
1963
1964
1965
1966
1967
1968
1969
1970
1971
1972
1973
1974
1975
1976
1977
1978
1979
1980
1981
1982
1983
1984
1985
1986
1987
1988
1989
1990
1991
1992
1993
1994
1995
1996
1997
1998
1999
Ye
ar
Relative Mean Flow (%)
Ch
ole
ra d
ata
, K
en
ya1
FG
01
-Ya
la1
FG
02
-Ya
la1
JG
01
-So
nd
u
1JD
03
-Yu
rith
1H
A1
4-A
wa
ch
1G
D0
3-N
yan
do
Perc
en
tag
e o
f M
ay F
low
Co
mp
are
d t
o M
ean
An
nu
al F
low
fo
r 1961-1
991
0
10
0
20
0
30
0
40
0
50
0
60
0
1961
1962
1963
1964
1965
1966
1967
1968
1969
1970
1971
1972
1973
1974
1975
1976
1977
1978
1979
1980
1981
1982
1983
1984
1985
1986
1987
1988
1989
1990
1991
1992
1993
1994
1995
1996
1997
1998
1999
Ye
ar
Relative Mean Flow (%)
Ch
ole
ra d
ata
, K
en
ya1
FG
01
-Ya
la1
FG
02
-Ya
la1
JG
01
-So
nd
u
1JD
03
-Yu
rith
1H
A1
4-A
wa
ch
1G
D0
3-N
yan
do
Perc
en
tag
e o
f A
pri
l F
low
Co
mp
are
d t
o M
ean
An
nu
al F
low
fo
r 1961-1
991
0
10
0
20
0
30
0
40
0
50
0
60
0
1961
1962
1963
1964
1965
1966
1967
1968
1969
1970
1971
1972
1973
1974
1975
1976
1977
1978
1979
1980
1981
1982
1983
1984
1985
1986
1987
1988
1989
1990
1991
1992
1993
1994
1995
1996
1997
1998
1999
Ye
ar
Relative Mean Flow (%)
Ch
ole
ra d
ata
, K
en
ya1
FG
01
-Ya
la1
FG
02
-Ya
la1
JG
01
-So
nd
u
1JD
03
-Yu
rith
1H
A1
4-A
wa
ch
1G
D0
3-N
yan
do
Perc
en
tag
e o
f Ju
ne F
low
Co
mp
are
d t
o M
ean
An
nu
al F
low
fo
r 1961-1
991
0
10
0
20
0
30
0
40
0
50
0
60
0
1961
1962
1963
1964
1965
1966
1967
1968
1969
1970
1971
1972
1973
1974
1975
1976
1977
1978
1979
1980
1981
1982
1983
1984
1985
1986
1987
1988
1989
1990
1991
1992
1993
1994
1995
1996
1997
1998
1999
Ye
ar
Relative Mean Flow (%)
Ch
ole
ra d
ata
, K
en
ya
1F
G0
1-Y
ala
1F
G0
2-Y
ala
1JG
01
-So
nd
u
1JD
03
-Yu
rith
1H
A1
4-A
wa
ch
1G
D0
3-N
ya
nd
o
Fi
gure
19a
: Ass
ocia
tion
betw
een
chol
era
epid
emic
s and
stre
amflo
w in
MA
MJ
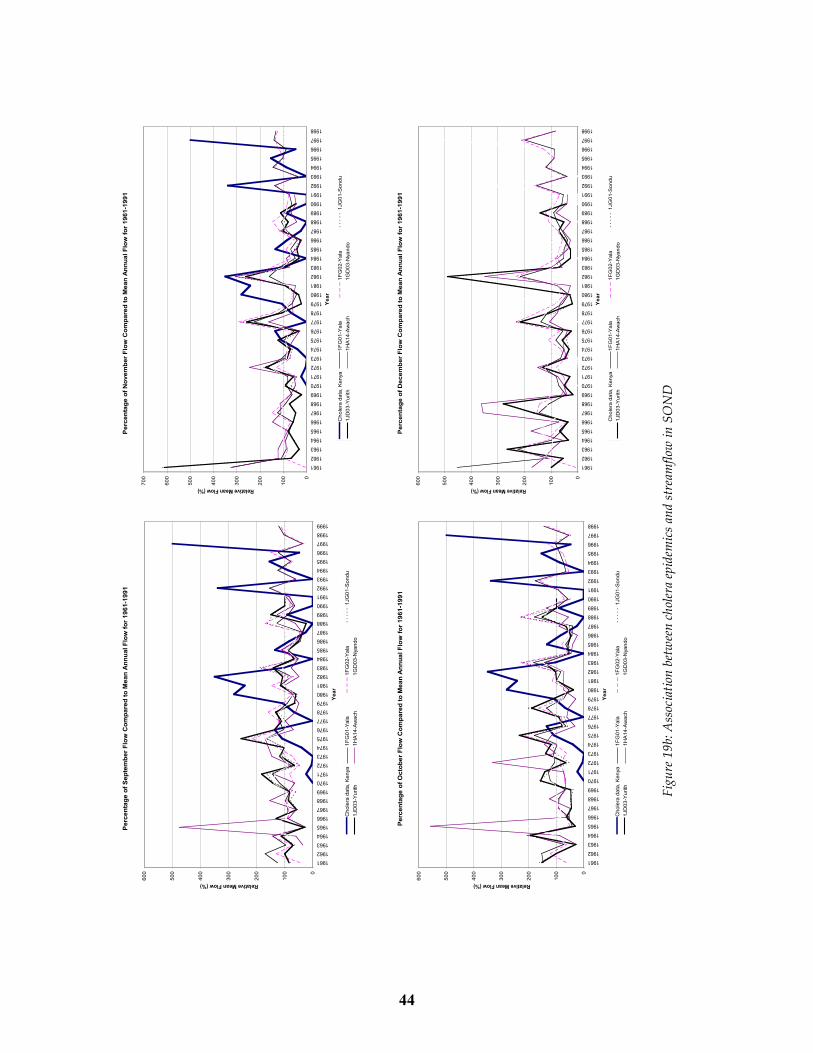
44
Perc
en
tag
e o
f S
ep
tem
ber
Flo
w C
om
pare
d t
o M
ean
An
nu
al F
low
fo
r 1961-1
991
0
10
0
20
0
30
0
40
0
50
0
60
0
1961
1962
1963
1964
1965
1966
1967
1968
1969
1970
1971
1972
1973
1974
1975
1976
1977
1978
1979
1980
1981
1982
1983
1984
1985
1986
1987
1988
1989
1990
1991
1992
1993
1994
1995
1996
1997
1998
1999
Ye
ar
Relative Mean Flow (%)
Ch
ole
ra d
ata
, K
en
ya
1F
G0
1-Y
ala
1F
G0
2-Y
ala
1JG
01
-So
nd
u
1JD
03
-Yu
rith
1H
A1
4-A
wa
ch
1G
D0
3-N
ya
nd
o
Perc
en
tag
e o
f N
ovem
ber
Flo
w C
om
pare
d t
o M
ean
An
nu
al F
low
fo
r 1961-1
991
0
10
0
20
0
30
0
40
0
50
0
60
0
70
0
1961
1962
1963
1964
1965
1966
1967
1968
1969
1970
1971
1972
1973
1974
1975
1976
1977
1978
1979
1980
1981
1982
1983
1984
1985
1986
1987
1988
1989
1990
1991
1992
1993
1994
1995
1996
1997
1998
Ye
ar
Relative Mean Flow (%)
Ch
ole
ra d
ata
, K
en
ya
1F
G0
1-Y
ala
1F
G0
2-Y
ala
1JG
01
-So
nd
u
1JD
03
-Yu
rith
1H
A1
4-A
wa
ch
1G
D0
3-N
ya
nd
o
Perc
en
tag
e o
f O
cto
ber
Flo
w C
om
pare
d t
o M
ean
An
nu
al F
low
fo
r 1961-1
991
0
10
0
20
0
30
0
40
0
50
0
60
0
1961
1962
1963
1964
1965
1966
1967
1968
1969
1970
1971
1972
1973
1974
1975
1976
1977
1978
1979
1980
1981
1982
1983
1984
1985
1986
1987
1988
1989
1990
1991
1992
1993
1994
1995
1996
1997
1998
Ye
ar
Relative Mean Flow (%)
Ch
ole
ra d
ata
, K
en
ya
1F
G0
1-Y
ala
1F
G0
2-Y
ala
1JG
01
-So
nd
u
1JD
03
-Yu
rith
1H
A1
4-A
wa
ch
1G
D0
3-N
ya
nd
o
Perc
en
tag
e o
f D
ecem
ber
Flo
w C
om
pare
d t
o M
ean
An
nu
al F
low
fo
r 1961-1
991
0
10
0
20
0
30
0
40
0
50
0
60
0
1961
1962
1963
1964
1965
1966
1967
1968
1969
1970
1971
1972
1973
1974
1975
1976
1977
1978
1979
1980
1981
1982
1983
1984
1985
1986
1987
1988
1989
1990
1991
1992
1993
1994
1995
1996
1997
1998
Ye
ar
Relative Mean Flow (%)
Ch
ole
ra d
ata
, K
en
ya
1F
G0
1-Y
ala
1F
G0
2-Y
ala
1JG
01
-So
nd
u
1JD
03
-Yu
rith
1H
A1
4-A
wa
ch
1G
D0
3-N
ya
nd
o
Figu
re 1
9b: A
ssoc
iatio
n be
twee
n ch
oler
a ep
idem
ics an
d st
ream
flow
in S
ON
D
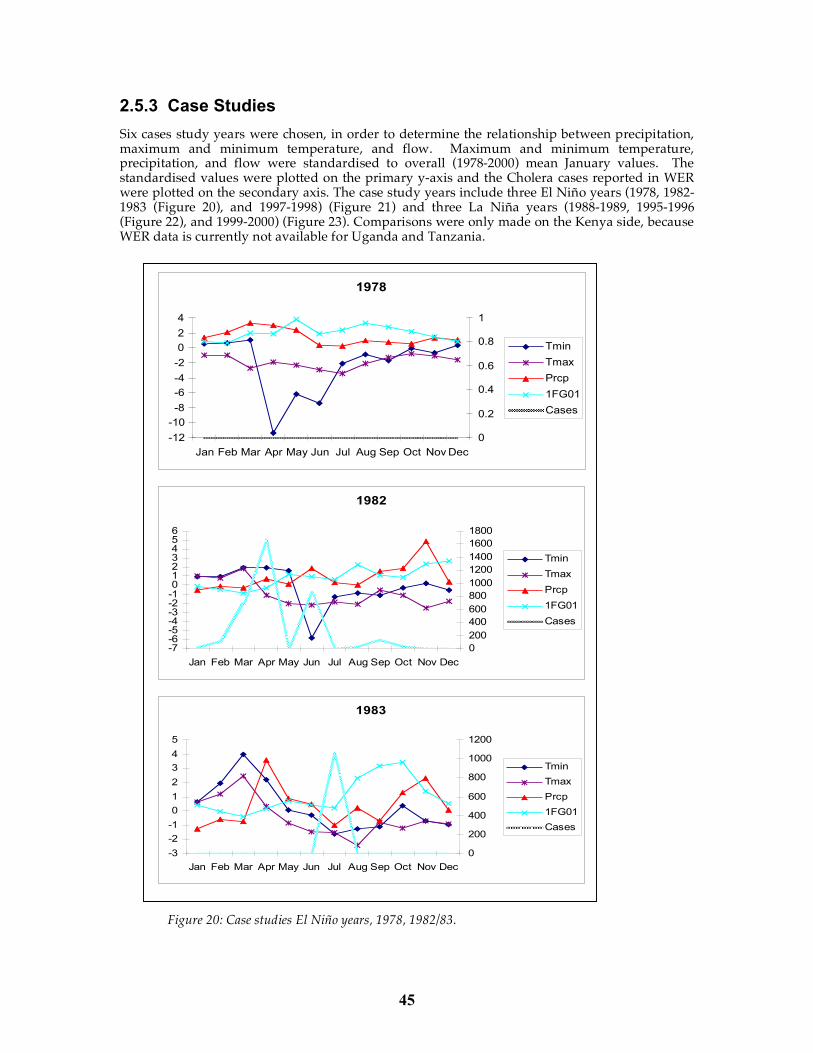
45
2.5.3 Case Studies Six cases study years were chosen, in order to determine the relationship between precipitation, maximum and minimum temperature, and flow. Maximum and minimum temperature, precipitation, and flow were standardised to overall (1978-2000) mean January values. The standardised values were plotted on the primary y-axis and the Cholera cases reported in WER were plotted on the secondary axis. The case study years include three El Niño years (1978, 1982-1983 (Figure 20), and 1997-1998) (Figure 21) and three La Niña years (1988-1989, 1995-1996 (Figure 22), and 1999-2000) (Figure 23). Comparisons were only made on the Kenya side, because WER data is currently not available for Uganda and Tanzania.
Figure 20: Case studies El Niño years, 1978, 1982/83.
1978
-12-10-8-6-4-2024
Jan Feb Mar Apr May Jun Jul Aug Sep Oct NovDec0
0.2
0.4
0.6
0.8
1
TminTmaxPrcp1FG01Cases
1982
-7-6-5-4-3-2-10123456
Jan Feb Mar Apr May Jun Jul Aug Sep Oct Nov Dec
0
200
400
600
800
1000
1200
1400
1600
1800
Tmin
Tmax
Prcp
1FG01
Cases
1983
-3
-2
-1
0
1
2
3
4
5
Jan Feb Mar Apr May Jun Jul Aug Sep Oct Nov Dec
0
200
400
600
800
1000
1200
Tmin
Tmax
Prcp
1FG01
Cases
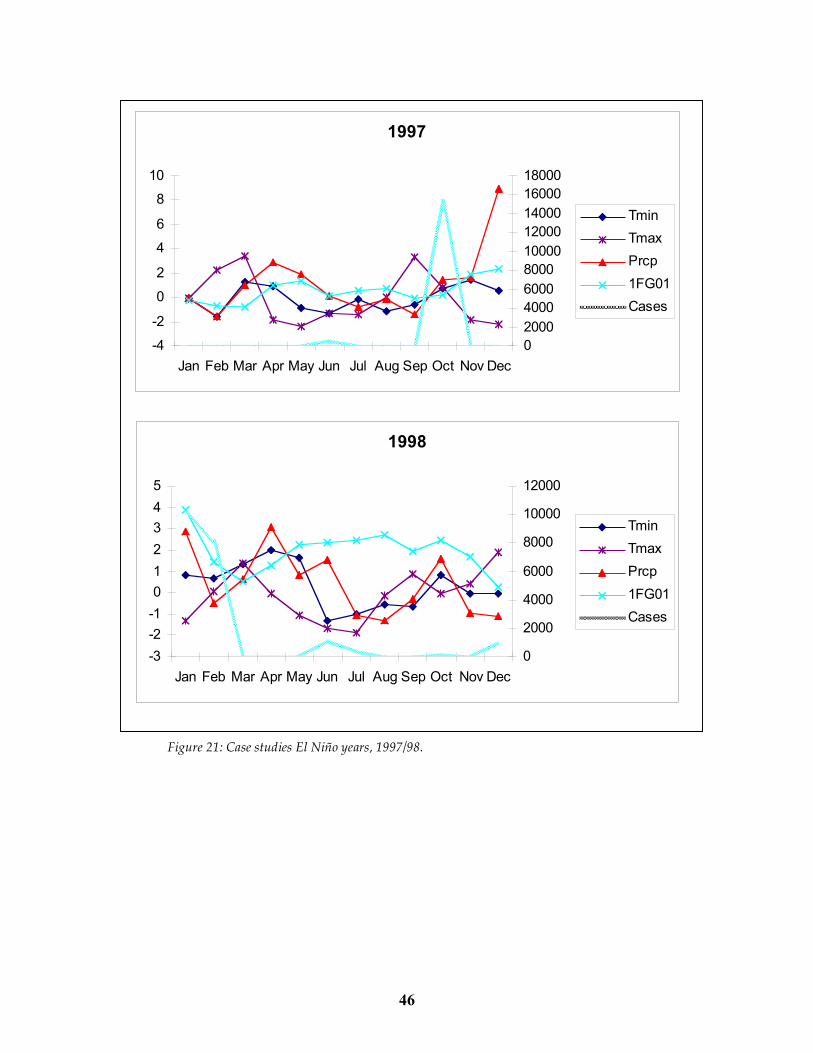
46
Figure 21: Case studies El Niño years, 1997/98.
1997
-4
-2
0
2
4
6
8
10
Jan Feb Mar Apr May Jun Jul Aug Sep Oct Nov Dec
0
2000
4000
6000
8000
10000
12000
14000
16000
18000
Tmin
Tmax
Prcp
1FG01
Cases
1998
-3
-2
-1
0
1
2
3
4
5
Jan Feb Mar Apr May Jun Jul Aug Sep Oct Nov Dec
0
2000
4000
6000
8000
10000
12000
Tmin
Tmax
Prcp
1FG01
Cases
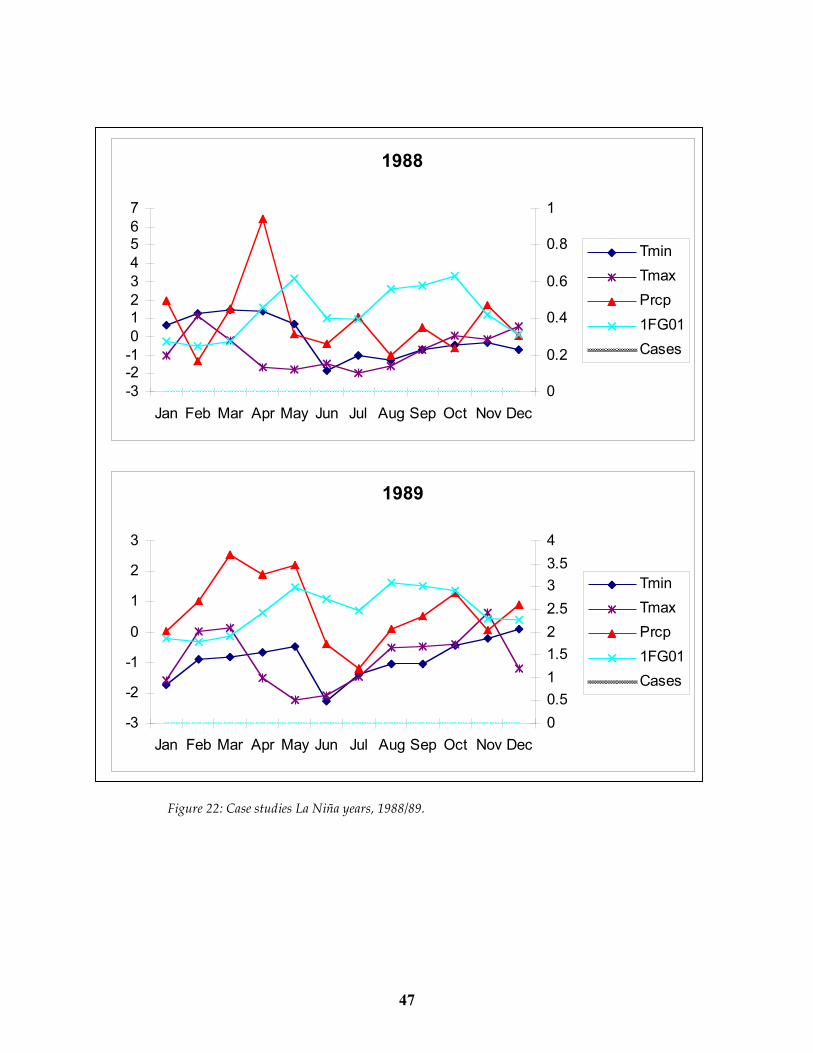
47
Figure 22: Case studies La Niña years, 1988/89.
1988
-3
-2-1
0
12
3
4
56
7
Jan Feb Mar Apr May Jun Jul Aug Sep Oct Nov Dec
0
0.2
0.4
0.6
0.8
1
Tmin
Tmax
Prcp
1FG01
Cases
1989
-3
-2
-1
0
1
2
3
Jan Feb Mar Apr May Jun Jul Aug Sep Oct Nov Dec
0
0.5
1
1.5
2
2.5
3
3.5
4
Tmin
Tmax
Prcp
1FG01
Cases
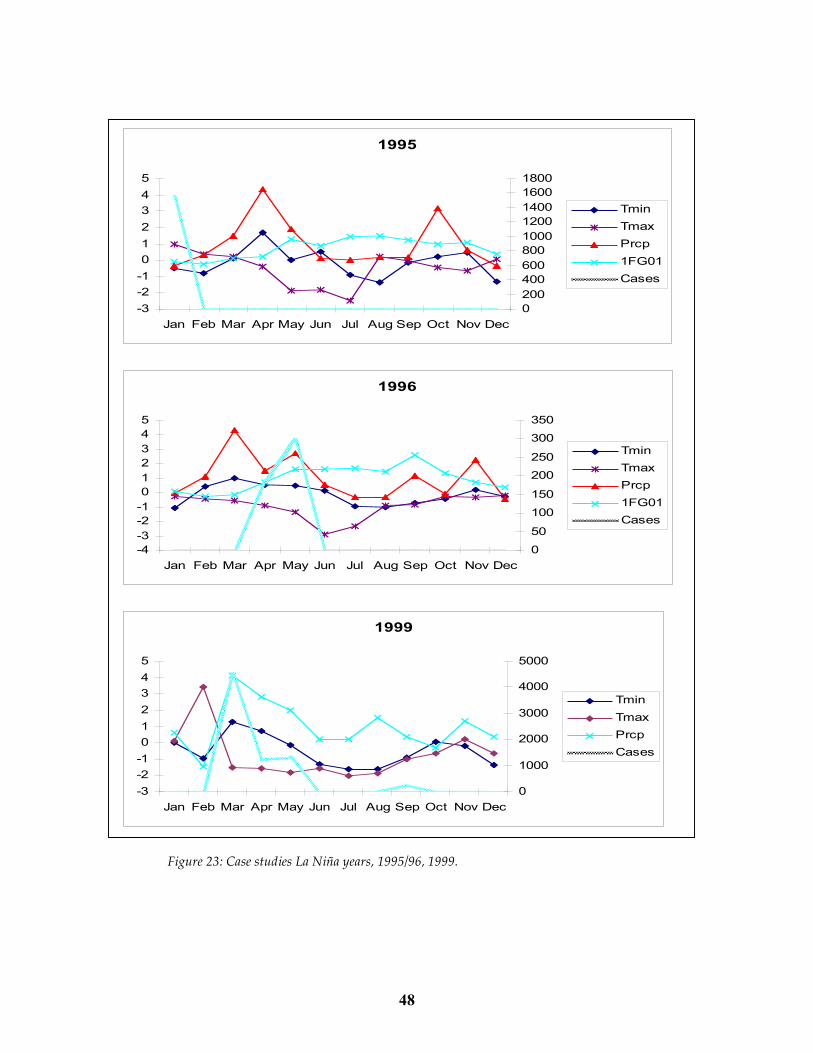
48
Figure 23: Case studies La Niña years, 1995/96, 1999.
1995
-3
-2
-1
0
1
2
3
4
5
Jan Feb Mar Apr May Jun Jul Aug Sep Oct Nov Dec
0
200
400
600
800
1000
1200
1400
1600
1800
Tmin
Tmax
Prcp
1FG01
Cases
1996
-4
-3
-2
-1
0
1
2
3
4
5
Jan Feb Mar Apr May Jun Jul Aug Sep Oct Nov Dec
0
50
100
150
200
250
300
350
Tmin
Tmax
Prcp
1FG01
Cases
1999
-3
-2
-1
0
1
2
3
4
5
Jan Feb Mar Apr May Jun Jul Aug Sep Oct Nov Dec
0
1000
2000
3000
4000
5000
Tmin
Tmax
Prcp
Cases
49
2.5.3.1 Case study of El Niño Years
In 1978, there is above normal precipitation and flow throughout the year. Minimum and maximum temperatures, however, are below normal throughout the year. Without an extended period of above normal temperatures, perhaps Cholera does not have the ability to multiply to levels at which humans are at risk.
In 1982, Cholera cases began following an extended period (3 Months) of above normal (greater than one standard deviation) maximum and minimum temperatures, and at the beginning of above normal precipitation (greater than zero, but less than one standard deviation). Following the April peak in 1982, there is a sharp decline in cases, most likely due to intervention. However, by June, there is another peak, which coincides with above normal flow and precipitation. Since temperatures were low during this time, June most likely reflects the dispersion of the April onset throughout the catchment. 1983 showed even greater than normal maximum and minimum temperatures, and precipitation in April, however Cholera cases were not reported until July.
In 1997, Cholera cases began in October, again following above normal maximum and minimum temperatures and precipitation, however, the same April pattern in 1982 is also evident in 1997, without Cholera cases reported. By November there appears to have been intervention, coincident with high precipitation and flow, and low temperatures, which is again indicative of dispersion of Cholera throughout the catchment in January and February of 1998. 2.5.3.2 Case study of La Niña Years
In 1988, Cholera cases were not reported. Although there were some remarkable peeks in precipitation and flow throughout the year, maximum temperatures remained below normal. This is again reflected in 1989. In 1995, the large peak was characterised by above normal precipitation and flow, however maximum temperature was below normal, and minimum temperature was above average. This is again reflected in 1996, with much fewer cases reported. In 1999, there is a pattern similar to that in 1982. The peak follows above normal maximum temperature, followed by high precipitation and flow.
2.5.4 Synthesis of biophysical results Regionally, the cholera epidemics are associated with the anomalously warm and wet El Nino years, such as in 1982 and 1997. More locally in the Lake Victoria basin, the cholera epidemics/outbreaks tend to occur anytime in the year from April to December, following periods of mainly sustained anomalous high temperatures in the months of January, February and March.
In conclusion this study describes trends in maximum, Tmax, and minimum, Tmin, temperatures for the East African sites selected for the study of cholera epidemics. It shows that Tmax and Tmin for Kisumu and Entebbe had similar and positive increase (0.6°C) while Tmin for Mwanza was large and negative decrease
(2.0°C) between 1978-1999. Increased rainfall trend was recorded for Entebbe wile Mwanza had the lowest recorded rainfall for the same period. Seasonal rainfall pattern was similar for the three stations, Kisumu, Mwanza and Entebbe, with a one month onset of rainfall lag between Entebbe (May) and Kisumu and Mwanza (April). Mwanza had increased precipitation trend in all seasons while the other two stations recorded two (Entebbe) and one (Kisumu) seasons respectively.
The hydrological characteristics of the Kisumu site showed high flows in the Yala River low altitude station, 1FG02, which receives many small tributaries than the high altitude station 1FG01. The mean annual flow for the same river had both slightly increasing and decreasing trends. The trends correlated to the onset of El Niño and the Indian Ocean Dipole invasion rains. The seasonal steamflows occurred during the long rains season (MAM) followed by the short rains season (SOND). However the mean flows hide some of the high flow events that occur
50
during short rains season, SOND. Some of the maximum flows were recorded during the month of November. A second hidden event is that the peak river discharge lags behind by one month the rainfall peak in April but is coincident with the rainfall peak in November. The seasonal flows trend show a decreasing trend at high altitude station while the low altitude station showed no trend in MAM and SOND. The above normal rainfall events associated with El Niño exerts a strong influence on the hydrologic balance. The spectral analysis of streamflows and rainfall show strong coupling with a frequency period of 6 months associated with seasonal rains and 5 years associated with El Niño events.
Seasonal trend analysis of high peak flows are closely associated with cholera epidemics whose morbidity is several orders of magnitude more intense than the hygienic cholera episodes. The incidences of high cholera epidemics coincide with high flow peaks during El Niño years. Cholera epidemic coincidence with streamflow is not evident in the other non El Niño years. Furthermore, during the El Niño year the streamflow during the short rains season exceeds that in the long rains season. In addition, Tmax appears to influence the onset of cholera epidemics. In the years that cholera epidemics occurred (1982/3 and 1997/8), high above normal temperatures were recorded. A sustained high above normal temperatures during the first season (JFM) followed by a slight cooling in the second season (JJA) and above normal warming during the third season (SOND) triggers an outbreak of a cholera epidemic. Above normal precipitation and flooding alone without the above normal temperatures do not trigger outbreaks of cholera epidemics (confer Table 10 and Figure 21). The non epidemics (hygienic) cholera outbreaks are associated with long rains season or short rains season when there is above normal rainfall and temperatures during the season but the casualties of such outbreaks are low compared to the cholera epidemics years.
51
3 Socio-Economic Futures
3.1 Malaria Study
3.1.1 Description of scientific and data collection methods An integrated approach using both quantitative and qualitative techniques was employed in assessing the vulnerability and adaptability of the highland communities to malaria epidemics. A household survey of 150 semi-structured interviews (SSIs)1
was conducted in each study site at
Kabale, Kericho and Muleba. The survey sought to establish the health, demographic and socio-economic characteristics of the affected communities. The key variables collected include: location (valley bottom, hillside and hilltop); socio-demographic data (gender, age, level of education, marital status, and household composition); incomes (sources and monthly totals); household food security (types and regularity of meals, subsistence and cash crop farming); wealth indicators (ownership of livestock, land, radio, bicycle, house type and ability to buy newspapers); health issues (distance and frequency of visits to health facilities and type of facility); knowledge of disease (causes, prevention, treatment and relationship to weather); and coping mechanisms.
Secondary health data was obtained from local hospitals with reliable patients’ health records. Hospital records of the number of monthly cases of malaria (both in- and out-patient) were collected for Kabale, Kericho and Muleba over a 30 year period (1971-2001). However, analysis of the health data was done for a six year period (1996-2001), this is because the data prior to 1996 had gaps that could not be corrected. At the same time a trial check on some of the earlier data indicates that it does not vary with seasons. An alarming 750% increase in malaria cases in Kericho has been reported over a 13-year period from 1986-1998 (Shanks, et al. 2000). Similarly in Kabale malaria cases increased from 17 -24 per 1,000 victims per month between 1992-1996 and 1997-1998 respectively (Kilan et al., 1999; Lindblade et al., 1999) and yet this is not reflected in the health data collected. This is an indication of poor records, because it is only in the last decade that highland malaria epidemics have been recognized as a national health concern by the government. Health data for Kabale, Kericho and Muleba were collected from Kabale Regional Referral hospital, Litein Mission Hospital and Rubya District hospital respectively and which are all within the study sites.
The first level of quantitative analysis involved the development of a coding scheme, which was used to transform and store the data in an electronic format. This database was consequently analysed using SPSS for Windows Version 10.0. The first round of analysis involved the generation of frequency tables. Cross-tabulation of the key variables (e.g. use of ITNs by income) was subsequently done to establish existing correlations and identify vulnerable groups. The secondary health data was analyzed statistically using normalized standard deviation of mean cases of malaria patients against temperature anomalies.
The SSIs were complemented with qualitative data derived from focus group discussions (FGDs) and participatory stakeholder meetings held with primary stakeholders such as the communities, health and local administrative officials. A total of 12 FGDs (four in each study site) were conducted with communities where the household interviews had been conducted. Although deliberate efforts were made to have same-sex FGDs a few of the FGDs comprised of both male and female participants. The interaction and group dynamics of the participants appeared to enhance group cohesiveness, which is an important step towards encouraging community-based adaptation strategies. Two participatory stakeholder meetings each were conducted in Kabale, Kericho and Muleba. In these forums the stakeholders were encouraged to play an active role and articulate their knowledge, values and preferences regarding vulnerability and adaptation to malaria epidemics. Focus group discussions provide a good complement to semi-structured interviews (SSIs) since the information derived from SSIs can be used as a springboard to more extensive discussions in focus groups. The issues discussed included: indicators of wealth; knowledge of disease; attitude, practice and impact of disease; coping mechanisms and
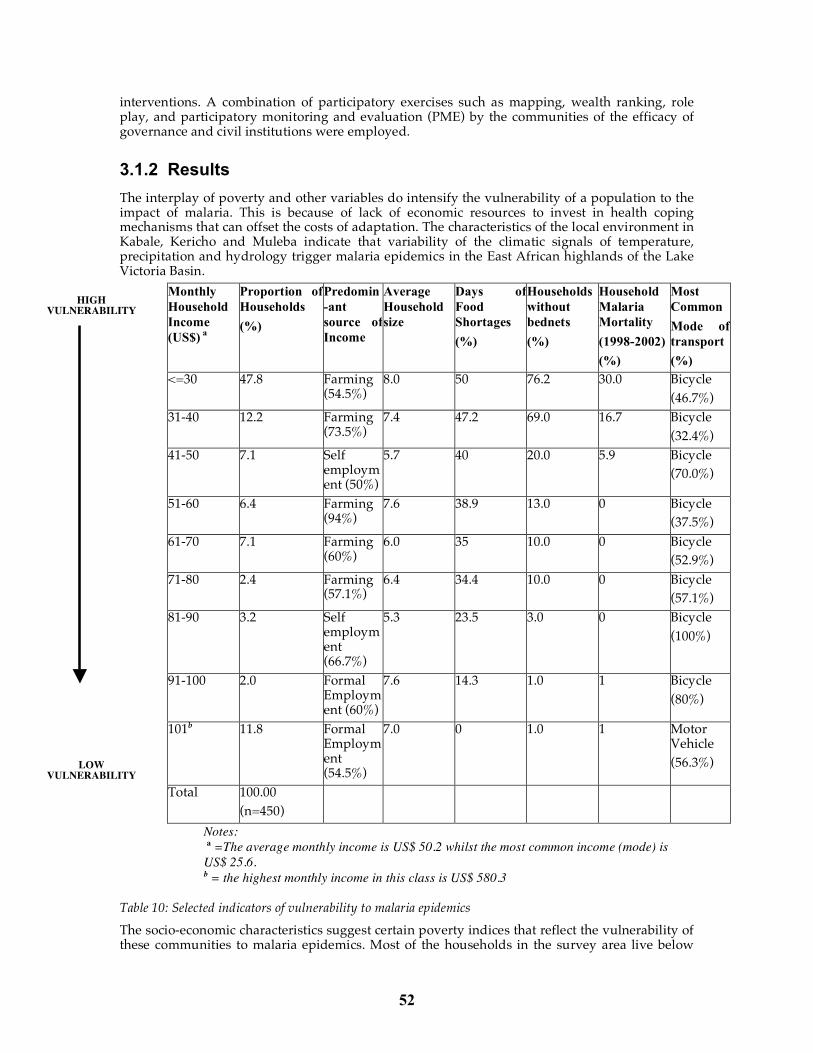
52
interventions. A combination of participatory exercises such as mapping, wealth ranking, role play, and participatory monitoring and evaluation (PME) by the communities of the efficacy of governance and civil institutions were employed.
3.1.2 Results The interplay of poverty and other variables do intensify the vulnerability of a population to the impact of malaria. This is because of lack of economic resources to invest in health coping mechanisms that can offset the costs of adaptation. The characteristics of the local environment in Kabale, Kericho and Muleba indicate that variability of the climatic signals of temperature, precipitation and hydrology trigger malaria epidemics in the East African highlands of the Lake Victoria Basin.
Monthly Household Income (US$) a
Proportion of Households (%)
Predomin-ant source of Income
Average Household size
Days of Food Shortages (%)
Households without bednets (%)
Household Malaria Mortality (1998-2002) (%)
Most Common Mode of transport (%)
<=30
47.8 Farming (54.5%)
8.0 50 76.2 30.0 Bicycle (46.7%)
31-40
12.2 Farming (73.5%)
7.4 47.2 69.0 16.7 Bicycle (32.4%)
41-50
7.1 Self employment (50%)
5.7 40 20.0 5.9 Bicycle (70.0%)
51-60
6.4 Farming (94%)
7.6 38.9 13.0 0 Bicycle (37.5%)
61-70
7.1 Farming (60%)
6.0 35 10.0 0 Bicycle (52.9%)
71-80
2.4 Farming (57.1%)
6.4 34.4 10.0 0 Bicycle (57.1%)
81-90
3.2 Self employment (66.7%)
5.3 23.5 3.0 0 Bicycle (100%)
91-100
2.0 Formal Employment (60%)
7.6 14.3 1.0 1 Bicycle (80%)
101b
11.8 Formal Employment (54.5%)
7.0 0 1.0 1 Motor Vehicle (56.3%)
Total
100.00 (n=450)
Notes: a =The average monthly income is US$ 50.2 whilst the most common income (mode) is US$ 25.6. b = the highest monthly income in this class is US$ 580.3
Table 10: Selected indicators of vulnerability to malaria epidemics The socio-economic characteristics suggest certain poverty indices that reflect the vulnerability of these communities to malaria epidemics. Most of the households in the survey area live below
HIGH VULNERABILITY
LOW VULNERABILITY
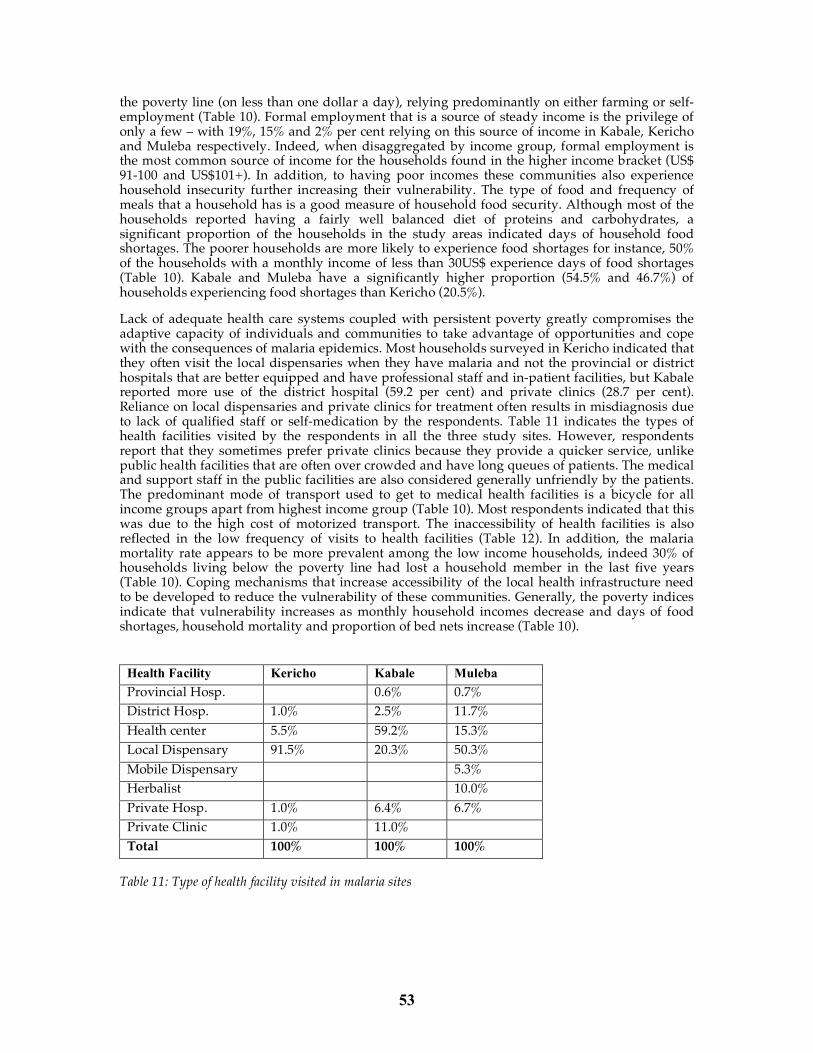
53
the poverty line (on less than one dollar a day), relying predominantly on either farming or self-employment (Table 10). Formal employment that is a source of steady income is the privilege of only a few – with 19%, 15% and 2% per cent relying on this source of income in Kabale, Kericho and Muleba respectively. Indeed, when disaggregated by income group, formal employment is the most common source of income for the households found in the higher income bracket (US$ 91-100 and US$101+). In addition, to having poor incomes these communities also experience household insecurity further increasing their vulnerability. The type of food and frequency of meals that a household has is a good measure of household food security. Although most of the households reported having a fairly well balanced diet of proteins and carbohydrates, a significant proportion of the households in the study areas indicated days of household food shortages. The poorer households are more likely to experience food shortages for instance, 50% of the households with a monthly income of less than 30US$ experience days of food shortages (Table 10). Kabale and Muleba have a significantly higher proportion (54.5% and 46.7%) of households experiencing food shortages than Kericho (20.5%).
Lack of adequate health care systems coupled with persistent poverty greatly compromises the adaptive capacity of individuals and communities to take advantage of opportunities and cope with the consequences of malaria epidemics. Most households surveyed in Kericho indicated that they often visit the local dispensaries when they have malaria and not the provincial or district hospitals that are better equipped and have professional staff and in-patient facilities, but Kabale reported more use of the district hospital (59.2 per cent) and private clinics (28.7 per cent). Reliance on local dispensaries and private clinics for treatment often results in misdiagnosis due to lack of qualified staff or self-medication by the respondents. Table 11 indicates the types of health facilities visited by the respondents in all the three study sites. However, respondents report that they sometimes prefer private clinics because they provide a quicker service, unlike public health facilities that are often over crowded and have long queues of patients. The medical and support staff in the public facilities are also considered generally unfriendly by the patients. The predominant mode of transport used to get to medical health facilities is a bicycle for all income groups apart from highest income group (Table 10). Most respondents indicated that this was due to the high cost of motorized transport. The inaccessibility of health facilities is also reflected in the low frequency of visits to health facilities (Table 12). In addition, the malaria mortality rate appears to be more prevalent among the low income households, indeed 30% of households living below the poverty line had lost a household member in the last five years (Table 10). Coping mechanisms that increase accessibility of the local health infrastructure need to be developed to reduce the vulnerability of these communities. Generally, the poverty indices indicate that vulnerability increases as monthly household incomes decrease and days of food shortages, household mortality and proportion of bed nets increase (Table 10).
Health Facility Kericho Kabale Muleba Provincial Hosp. 0.6% 0.7% District Hosp. 1.0% 2.5% 11.7% Health center 5.5% 59.2% 15.3% Local Dispensary 91.5% 20.3% 50.3% Mobile Dispensary 5.3% Herbalist 10.0% Private Hosp. 1.0% 6.4% 6.7% Private Clinic 1.0% 11.0% Total 100% 100% 100%
Table 11: Type of health facility visited in malaria sites
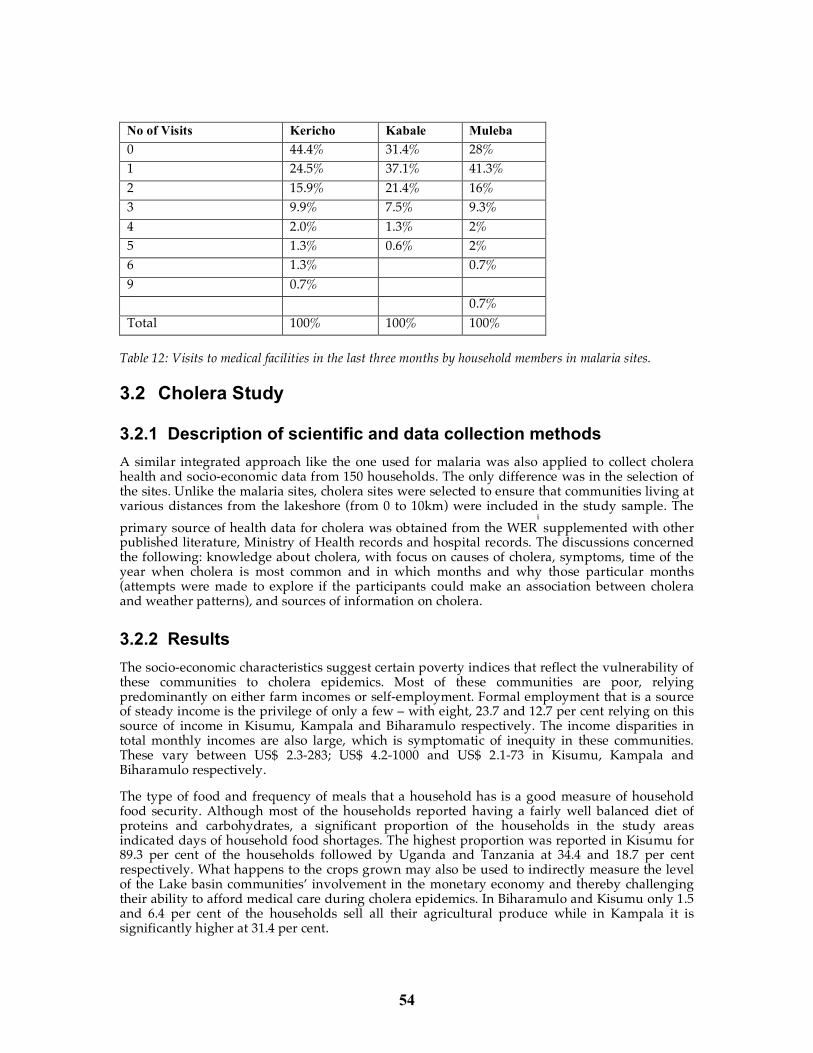
54
No of Visits Kericho Kabale Muleba 0 44.4% 31.4% 28% 1 24.5% 37.1% 41.3% 2 15.9% 21.4% 16% 3 9.9% 7.5% 9.3% 4 2.0% 1.3% 2% 5 1.3% 0.6% 2% 6 1.3% 0.7% 9 0.7% 0.7% Total 100% 100% 100%
Table 12: Visits to medical facilities in the last three months by household members in malaria sites.
3.2 Cholera Study
3.2.1 Description of scientific and data collection methods A similar integrated approach like the one used for malaria was also applied to collect cholera health and socio-economic data from 150 households. The only difference was in the selection of the sites. Unlike the malaria sites, cholera sites were selected to ensure that communities living at various distances from the lakeshore (from 0 to 10km) were included in the study sample. The primary source of health data for cholera was obtained from the WER
i supplemented with other
published literature, Ministry of Health records and hospital records. The discussions concerned the following: knowledge about cholera, with focus on causes of cholera, symptoms, time of the year when cholera is most common and in which months and why those particular months (attempts were made to explore if the participants could make an association between cholera and weather patterns), and sources of information on cholera.
3.2.2 Results The socio-economic characteristics suggest certain poverty indices that reflect the vulnerability of these communities to cholera epidemics. Most of these communities are poor, relying predominantly on either farm incomes or self-employment. Formal employment that is a source of steady income is the privilege of only a few – with eight, 23.7 and 12.7 per cent relying on this source of income in Kisumu, Kampala and Biharamulo respectively. The income disparities in total monthly incomes are also large, which is symptomatic of inequity in these communities. These vary between US$ 2.3-283; US$ 4.2-1000 and US$ 2.1-73 in Kisumu, Kampala and Biharamulo respectively.
The type of food and frequency of meals that a household has is a good measure of household food security. Although most of the households reported having a fairly well balanced diet of proteins and carbohydrates, a significant proportion of the households in the study areas indicated days of household food shortages. The highest proportion was reported in Kisumu for 89.3 per cent of the households followed by Uganda and Tanzania at 34.4 and 18.7 per cent respectively. What happens to the crops grown may also be used to indirectly measure the level of the Lake basin communities’ involvement in the monetary economy and thereby challenging their ability to afford medical care during cholera epidemics. In Biharamulo and Kisumu only 1.5 and 6.4 per cent of the households sell all their agricultural produce while in Kampala it is significantly higher at 31.4 per cent.
55
Most residential houses in the survey areas are ‘semi-permanent’ (iron roofs and mud walls), accounting for 54.7, 68 and 63.3 per cent of the respondents’ houses in Kisumu, Kampala and Biharamulo respectively. Kisumu and Kampala which are both cities do not reflect an urban infrastructure (such as a greater density of permanent houses – stone/brick walls and tiled roofs) commensurate with their city status. Coupled with other factors such as income levels and food insecurity, this is an indication of the low socio-economic status inherent in these communities.
56
4 Impacts and Vulnerability
4.1 Malaria Epidemics The data did not show significant annual trends in malaria cases over the period 1996-2001. However the data from Litein, Kenya and Muleba, Tanzania showed a declining trend in malaria cases while data from Kabale showed a slightly increasing trend (Figure 24). Data from the three countries were compared by regression analysis to determine the degree of association. Data of Tanzania and Kenya had the best association (R
2 = 0.59) while R
2 for Kenya and Uganda was 0.3
and for Uganda and Tanzania was 0.29. Trends in malaria cases for children under five years old and individuals over five years old indicated that children under five years old were highly susceptible to malaria attacks compared to older individuals (Figure 11b). Children less than five years old were one-and-half times more likely to be admitted than older individuals. This is consistent with the fact that young children have lower immunity. Figure 24: Malaria outbreaks in Kenya, Uganda and Tanzania.
The first upsurge in malaria casesii in Tanzania was observed in May to July, and in Kenya from
June to July 1997. In Uganda the number of cases during this period remained below normal (Figure 24). The most significant change in seasonal outbreaks was observed from January-March 1998 in Tanzania and Kenya but the trends extended to May of the same year in Kabale, Uganda. The extended departure implies that the epidemic lasted for six months. In Tanzania the epidemic caused a peak increase in cases of 146% while in Kenya and Uganda the increase was 630% and 256% respectively. The peak month for admissions in all countries was March. It should be noted that in Kenya the government hospitals were on strike and so most of the malaria cases were treated in Mission hospitals. The Kenyan hospital used in this study is a Mission hospital and therefore the cases reported include those that should have been admitted in Kericho District Hospital. It is more likely that the increase in malaria cases in Tanzania and Uganda reflect the true trends.
Uganda had further malaria cases outbreaks in November–December 1999 (with epidemic increase of 63%) and again in December 2000 to February 2001 when the outbreak peaked at 312% in January. A small outbreak was observed in Kenya (with an increase of 78%) in February 2001. Data from Uganda indicates that outbreaks are more common after the short rain season in September – November.
4.1.1 Self medication In Kericho, Kenya residents were asked which drugs they used for malaria treatment at home. The majority of the people (49 per cent) (Table 13) used chloroquine a drug in which 85 per cent of the malaria parasites are resistant. The next most popular drug used by 39 per cent of the people was Fansidar (Sulfurdoxine pyrimethamine, SP). The parasite resistance level for Fansidar is about 50 per cent. Other drugs used were quinine and antibiotics and these are prescription drugs. The data indicates that people treating themselves in Kericho are at a high risk of developing severe and complicated malaria due to drug failure or under dosage. This can result in high morbidity and mortality particularly in populations with low immunity. Self medication in the treatment of cholera is not as pronounced as in the case of malaria. Those who treat cholera at home use correct preventive measures such as administering oral rehydration salts and/or tetracycline.
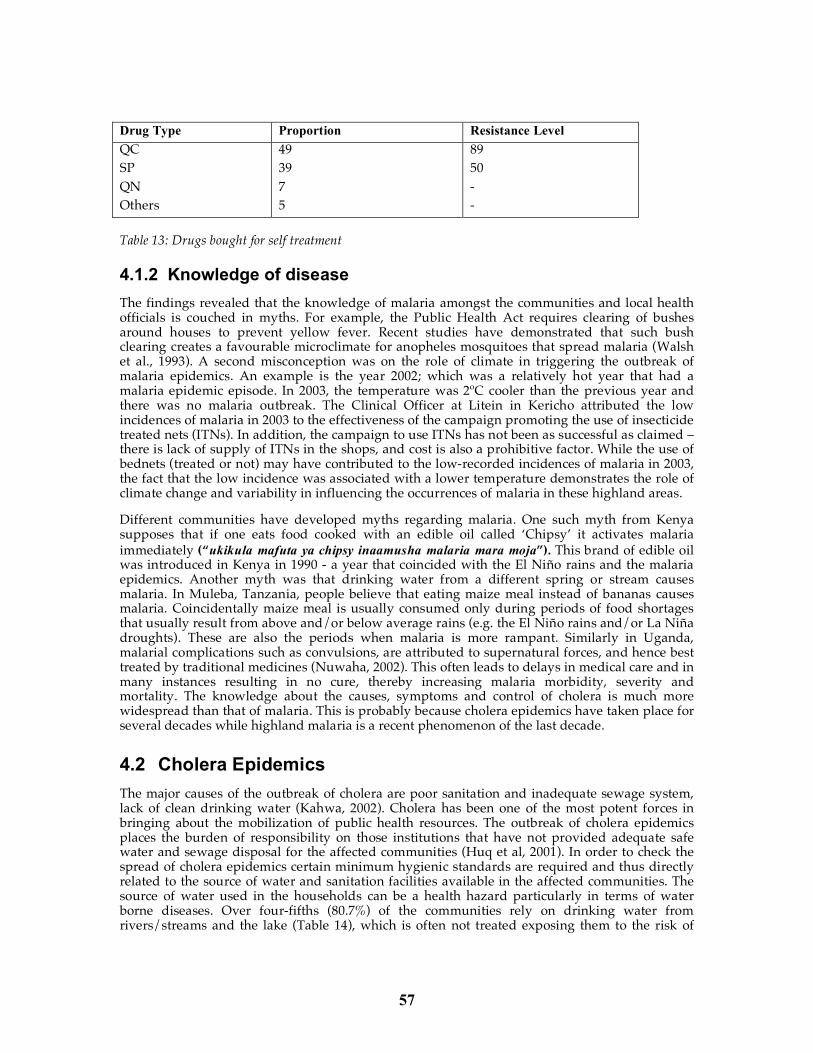
57
Drug Type Proportion Resistance Level QC SP QN Others
49 39 7 5
89 50 - -
Table 13: Drugs bought for self treatment
4.1.2 Knowledge of disease The findings revealed that the knowledge of malaria amongst the communities and local health officials is couched in myths. For example, the Public Health Act requires clearing of bushes around houses to prevent yellow fever. Recent studies have demonstrated that such bush clearing creates a favourable microclimate for anopheles mosquitoes that spread malaria (Walsh et al., 1993). A second misconception was on the role of climate in triggering the outbreak of malaria epidemics. An example is the year 2002; which was a relatively hot year that had a malaria epidemic episode. In 2003, the temperature was 2ºC cooler than the previous year and there was no malaria outbreak. The Clinical Officer at Litein in Kericho attributed the low incidences of malaria in 2003 to the effectiveness of the campaign promoting the use of insecticide treated nets (ITNs). In addition, the campaign to use ITNs has not been as successful as claimed – there is lack of supply of ITNs in the shops, and cost is also a prohibitive factor. While the use of bednets (treated or not) may have contributed to the low-recorded incidences of malaria in 2003, the fact that the low incidence was associated with a lower temperature demonstrates the role of climate change and variability in influencing the occurrences of malaria in these highland areas.
Different communities have developed myths regarding malaria. One such myth from Kenya supposes that if one eats food cooked with an edible oil called ‘Chipsy’ it activates malaria immediately (“ukikula mafuta ya chipsy inaamusha malaria mara moja”). This brand of edible oil was introduced in Kenya in 1990 - a year that coincided with the El Niño rains and the malaria epidemics. Another myth was that drinking water from a different spring or stream causes malaria. In Muleba, Tanzania, people believe that eating maize meal instead of bananas causes malaria. Coincidentally maize meal is usually consumed only during periods of food shortages that usually result from above and/or below average rains (e.g. the El Niño rains and/or La Niña droughts). These are also the periods when malaria is more rampant. Similarly in Uganda, malarial complications such as convulsions, are attributed to supernatural forces, and hence best treated by traditional medicines (Nuwaha, 2002). This often leads to delays in medical care and in many instances resulting in no cure, thereby increasing malaria morbidity, severity and mortality. The knowledge about the causes, symptoms and control of cholera is much more widespread than that of malaria. This is probably because cholera epidemics have taken place for several decades while highland malaria is a recent phenomenon of the last decade.
4.2 Cholera Epidemics The major causes of the outbreak of cholera are poor sanitation and inadequate sewage system, lack of clean drinking water (Kahwa, 2002). Cholera has been one of the most potent forces in bringing about the mobilization of public health resources. The outbreak of cholera epidemics places the burden of responsibility on those institutions that have not provided adequate safe water and sewage disposal for the affected communities (Huq et al, 2001). In order to check the spread of cholera epidemics certain minimum hygienic standards are required and thus directly related to the source of water and sanitation facilities available in the affected communities. The source of water used in the households can be a health hazard particularly in terms of water borne diseases. Over four-fifths (80.7%) of the communities rely on drinking water from rivers/streams and the lake (Table 14), which is often not treated exposing them to the risk of
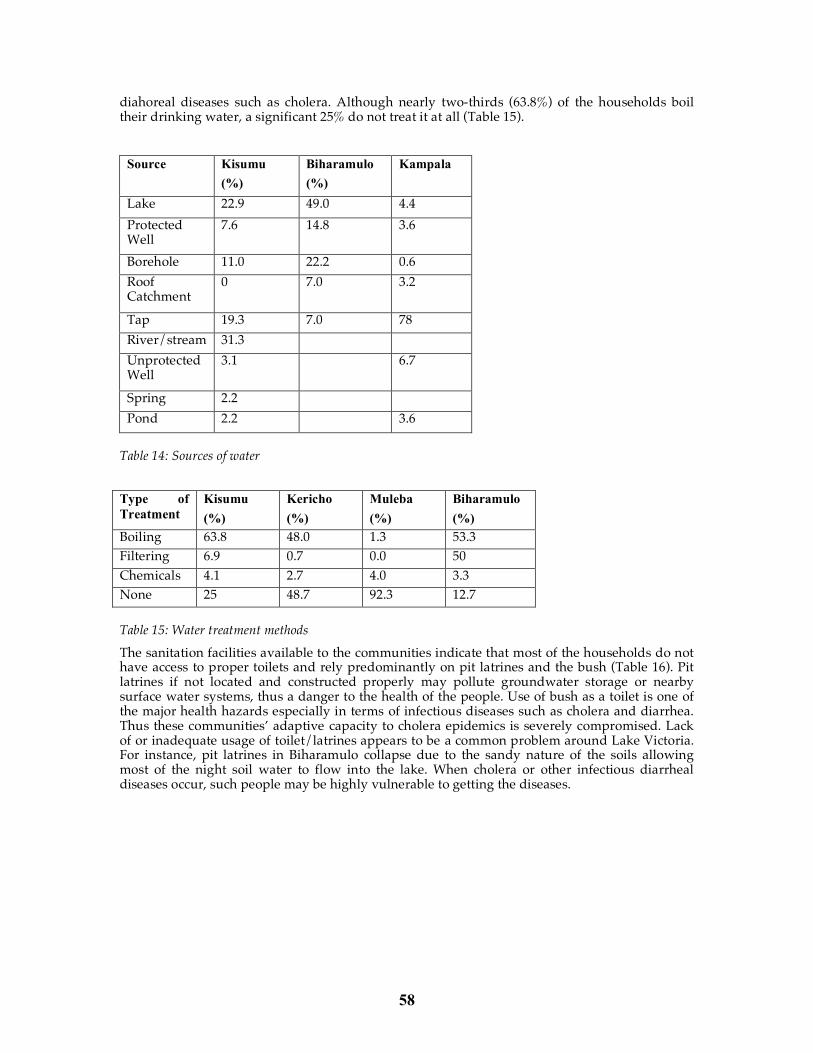
58
diahoreal diseases such as cholera. Although nearly two-thirds (63.8%) of the households boil their drinking water, a significant 25% do not treat it at all (Table 15).
Source Kisumu
(%) Biharamulo (%)
Kampala
Lake 22.9 49.0 4.4 Protected Well
7.6 14.8 3.6
Borehole 11.0 22.2 0.6 Roof Catchment
0 7.0 3.2
Tap 19.3 7.0 78 River/stream 31.3 Unprotected Well
3.1 6.7
Spring 2.2 Pond 2.2 3.6
Table 14: Sources of water Type of Treatment
Kisumu (%)
Kericho (%)
Muleba (%)
Biharamulo (%)
Boiling 63.8 48.0 1.3 53.3 Filtering 6.9 0.7 0.0 50 Chemicals 4.1 2.7 4.0 3.3 None 25 48.7 92.3 12.7
Table 15: Water treatment methods The sanitation facilities available to the communities indicate that most of the households do not have access to proper toilets and rely predominantly on pit latrines and the bush (Table 16). Pit latrines if not located and constructed properly may pollute groundwater storage or nearby surface water systems, thus a danger to the health of the people. Use of bush as a toilet is one of the major health hazards especially in terms of infectious diseases such as cholera and diarrhea. Thus these communities’ adaptive capacity to cholera epidemics is severely compromised. Lack of or inadequate usage of toilet/latrines appears to be a common problem around Lake Victoria. For instance, pit latrines in Biharamulo collapse due to the sandy nature of the soils allowing most of the night soil water to flow into the lake. When cholera or other infectious diarrheal diseases occur, such people may be highly vulnerable to getting the diseases.
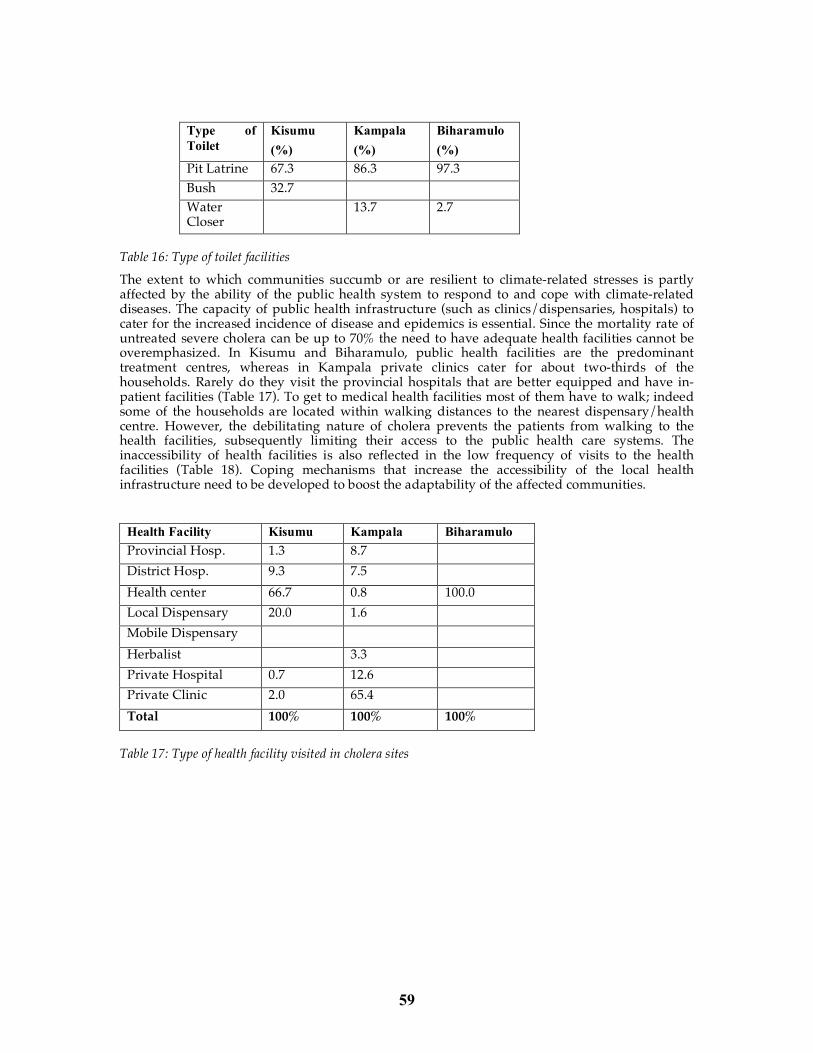
59
Type of Toilet
Kisumu (%)
Kampala (%)
Biharamulo (%)
Pit Latrine 67.3 86.3 97.3 Bush 32.7 Water Closer
13.7 2.7
Table 16: Type of toilet facilities The extent to which communities succumb or are resilient to climate-related stresses is partly affected by the ability of the public health system to respond to and cope with climate-related diseases. The capacity of public health infrastructure (such as clinics/dispensaries, hospitals) to cater for the increased incidence of disease and epidemics is essential. Since the mortality rate of untreated severe cholera can be up to 70% the need to have adequate health facilities cannot be overemphasized. In Kisumu and Biharamulo, public health facilities are the predominant treatment centres, whereas in Kampala private clinics cater for about two-thirds of the households. Rarely do they visit the provincial hospitals that are better equipped and have in-patient facilities (Table 17). To get to medical health facilities most of them have to walk; indeed some of the households are located within walking distances to the nearest dispensary/health centre. However, the debilitating nature of cholera prevents the patients from walking to the health facilities, subsequently limiting their access to the public health care systems. The inaccessibility of health facilities is also reflected in the low frequency of visits to the health facilities (Table 18). Coping mechanisms that increase the accessibility of the local health infrastructure need to be developed to boost the adaptability of the affected communities.
Health Facility Kisumu Kampala Biharamulo Provincial Hosp. 1.3 8.7 District Hosp. 9.3 7.5 Health center 66.7 0.8 100.0 Local Dispensary 20.0 1.6 Mobile Dispensary Herbalist 3.3 Private Hospital 0.7 12.6 Private Clinic 2.0 65.4 Total 100% 100% 100%
Table 17: Type of health facility visited in cholera sites
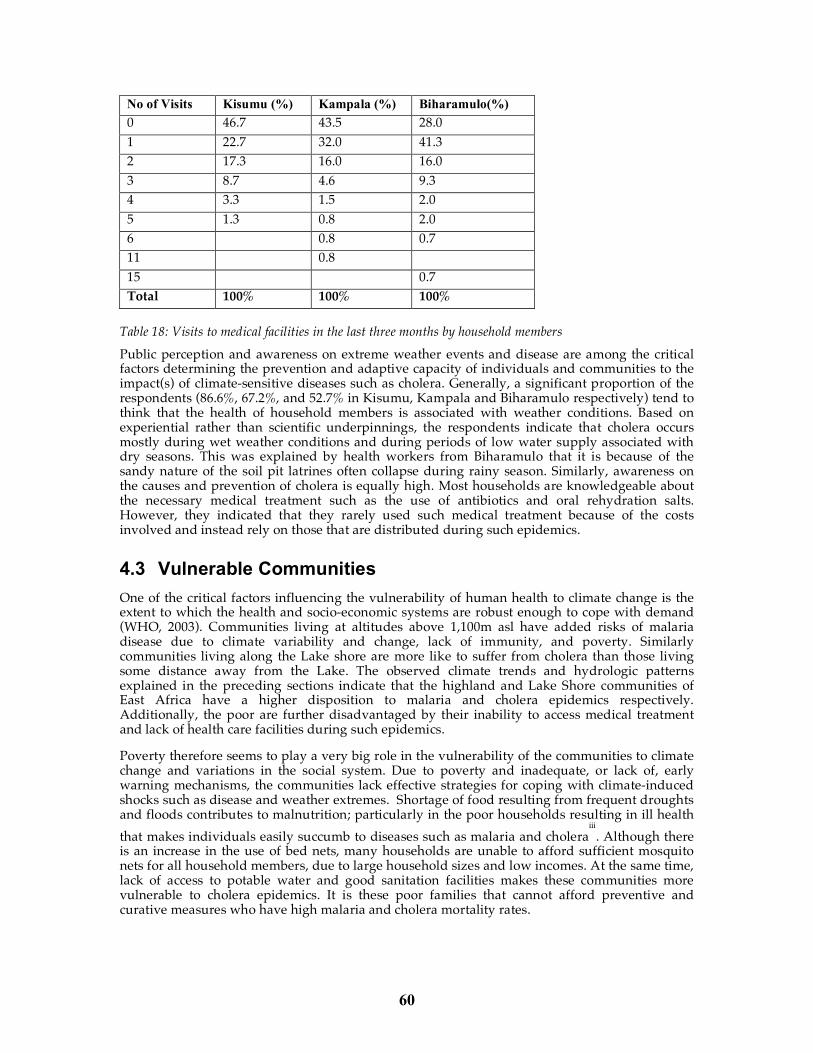
60
No of Visits Kisumu (%) Kampala (%) Biharamulo(%) 0 46.7 43.5 28.0 1 22.7 32.0 41.3 2 17.3 16.0 16.0 3 8.7 4.6 9.3 4 3.3 1.5 2.0 5 1.3 0.8 2.0 6 0.8 0.7 11 0.8 15 0.7 Total 100% 100% 100%
Table 18: Visits to medical facilities in the last three months by household members Public perception and awareness on extreme weather events and disease are among the critical factors determining the prevention and adaptive capacity of individuals and communities to the impact(s) of climate-sensitive diseases such as cholera. Generally, a significant proportion of the respondents (86.6%, 67.2%, and 52.7% in Kisumu, Kampala and Biharamulo respectively) tend to think that the health of household members is associated with weather conditions. Based on experiential rather than scientific underpinnings, the respondents indicate that cholera occurs mostly during wet weather conditions and during periods of low water supply associated with dry seasons. This was explained by health workers from Biharamulo that it is because of the sandy nature of the soil pit latrines often collapse during rainy season. Similarly, awareness on the causes and prevention of cholera is equally high. Most households are knowledgeable about the necessary medical treatment such as the use of antibiotics and oral rehydration salts. However, they indicated that they rarely used such medical treatment because of the costs involved and instead rely on those that are distributed during such epidemics.
4.3 Vulnerable Communities One of the critical factors influencing the vulnerability of human health to climate change is the extent to which the health and socio-economic systems are robust enough to cope with demand (WHO, 2003). Communities living at altitudes above 1,100m asl have added risks of malaria disease due to climate variability and change, lack of immunity, and poverty. Similarly communities living along the Lake shore are more like to suffer from cholera than those living some distance away from the Lake. The observed climate trends and hydrologic patterns explained in the preceding sections indicate that the highland and Lake Shore communities of East Africa have a higher disposition to malaria and cholera epidemics respectively. Additionally, the poor are further disadvantaged by their inability to access medical treatment and lack of health care facilities during such epidemics.
Poverty therefore seems to play a very big role in the vulnerability of the communities to climate change and variations in the social system. Due to poverty and inadequate, or lack of, early warning mechanisms, the communities lack effective strategies for coping with climate-induced shocks such as disease and weather extremes. Shortage of food resulting from frequent droughts and floods contributes to malnutrition; particularly in the poor households resulting in ill health that makes individuals easily succumb to diseases such as malaria and cholera
iii. Although there
is an increase in the use of bed nets, many households are unable to afford sufficient mosquito nets for all household members, due to large household sizes and low incomes. At the same time, lack of access to potable water and good sanitation facilities makes these communities more vulnerable to cholera epidemics. It is these poor families that cannot afford preventive and curative measures who have high malaria and cholera mortality rates.
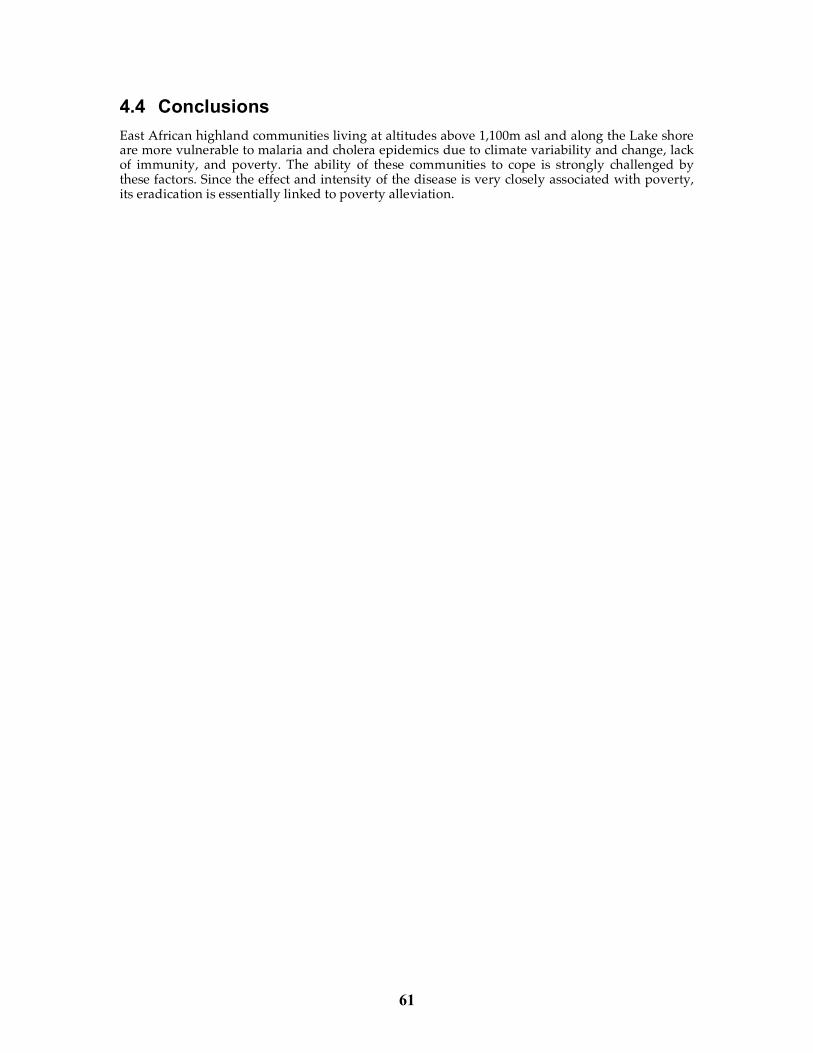
61
4.4 Conclusions East African highland communities living at altitudes above 1,100m asl and along the Lake shore are more vulnerable to malaria and cholera epidemics due to climate variability and change, lack of immunity, and poverty. The ability of these communities to cope is strongly challenged by these factors. Since the effect and intensity of the disease is very closely associated with poverty, its eradication is essentially linked to poverty alleviation.
62
5 Adaptation
5.1 Activities Conducted Activities conducted were part of the integrated approach described in the section entitled “Description of Scientific and Data Collection Methods”.
5.2 Conclusions The survey reveals that there are very few coping mechanisms available for the households. The respondents indicate that in the likely event that a malaria epidemic does occur then in order to cover the cost of treatment the majority (75.5 per cent) sell their food crops. Other ways of coping include borrowing or relying on remittances from relatives. In Kabale focus group discussions revealed that a number of people have resorted to selling land in order to cope with malaria. Out of the 30 participants in the discussion, 13 reported to have sold land at some stage in the last eight years in order to cope with malaria in the family. The stated coping mechanisms deplete respondents’ resources and may lead to increased food shortage, debts and poverty.
Among the adaptations to highland malaria has been the use of traditional curative measures (using local herbs as insect repellents or anti-malarials). It appears that this is a crucial adaptation strategy in Muleba, Kericho and Kabale, particularly given the high poverty levels in the area. Surveys carried out by the National Institute for Medical Research (NIMR) in Tanzania noted that traditional healers have knowledge and skills useful for malaria disease management (diagnosis, treatment, and prevention). Further, NIMR laboratory analyses of traditional herbs established their efficacy and safety. Toxicity varied from low to very high (Mwisongo and Borg, 2002).
The use of insecticide treated mosquito nets (ITNs) is one of the preventive measures advocated by the Malaria Global Control Strategy as well as the national malaria control programmes in East Africa
3. However, the survey revealed that the use of ITNs is not very widespread,
particularly among the poorer households with monthly incomes of less than 30 US$ and US$ 31-40 where 76.2% and 69% do not have bed nets (Table 10). A further illustration of the possible influence of income on bed net use is derived from Kabale, where the proportion of household members sleeping under a bed net increases with the increase in average income. Farming and self-employment were the most common source of income generation, but these are largely unpredictable and unreliable, especially in the context of the East African rural communities that are characterized by a weak economic base. Such sources of income leave the communities vulnerable to external shocks and to seasonal and climatic variability and change
4. In such
circumstances, it is formal employment, which can guarantee an income to the household even in times of sickness. Therefore this means that the poor groups, who also have poor nutrition, are more vulnerable to malaria than the well-off households.
The World Health Organization’s (WHO) program on “Roll back malaria” has been adopted by most countries in Africa. The three East African governments actively promote this program whose objectives towards malaria eradication are: increase the use of ITNs; early diagnosis and treatment of malaria and use of effective anti-malarial drugs. This program has attracted several local and international civil societies. One such non-governmental organization active in East Africa is Population Services International (PSI), which receives financial support from both the British and American Governments. Its stated objective is to increase the use, ownership and availability of ITNs in Kenya, Uganda and Tanzania within 15 minutes walk in the malaria endemic areas. As such marketing promotions of ITNs is prevalent in most market centers in East Africa. However, the cost of a subsidized ITN which is US$ 1.50 is beyond the reach of those households living below the poverty line (Table 10).
Despite the wide spread promotion of the use of bed nets, the survey revealed that majority of households do not use ITNs. This has implications on the “Roll back Malaria” program for two
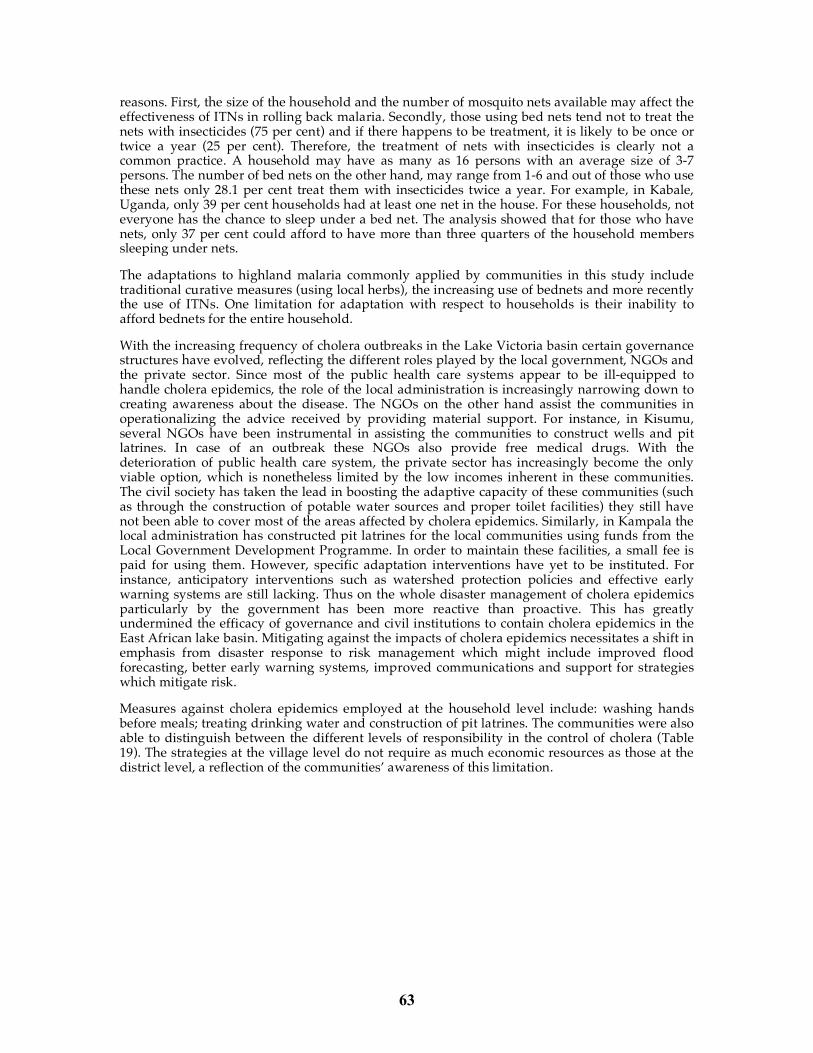
63
reasons. First, the size of the household and the number of mosquito nets available may affect the effectiveness of ITNs in rolling back malaria. Secondly, those using bed nets tend not to treat the nets with insecticides (75 per cent) and if there happens to be treatment, it is likely to be once or twice a year (25 per cent). Therefore, the treatment of nets with insecticides is clearly not a common practice. A household may have as many as 16 persons with an average size of 3-7 persons. The number of bed nets on the other hand, may range from 1-6 and out of those who use these nets only 28.1 per cent treat them with insecticides twice a year. For example, in Kabale, Uganda, only 39 per cent households had at least one net in the house. For these households, not everyone has the chance to sleep under a bed net. The analysis showed that for those who have nets, only 37 per cent could afford to have more than three quarters of the household members sleeping under nets.
The adaptations to highland malaria commonly applied by communities in this study include traditional curative measures (using local herbs), the increasing use of bednets and more recently the use of ITNs. One limitation for adaptation with respect to households is their inability to afford bednets for the entire household.
With the increasing frequency of cholera outbreaks in the Lake Victoria basin certain governance structures have evolved, reflecting the different roles played by the local government, NGOs and the private sector. Since most of the public health care systems appear to be ill-equipped to handle cholera epidemics, the role of the local administration is increasingly narrowing down to creating awareness about the disease. The NGOs on the other hand assist the communities in operationalizing the advice received by providing material support. For instance, in Kisumu, several NGOs have been instrumental in assisting the communities to construct wells and pit latrines. In case of an outbreak these NGOs also provide free medical drugs. With the deterioration of public health care system, the private sector has increasingly become the only viable option, which is nonetheless limited by the low incomes inherent in these communities. The civil society has taken the lead in boosting the adaptive capacity of these communities (such as through the construction of potable water sources and proper toilet facilities) they still have not been able to cover most of the areas affected by cholera epidemics. Similarly, in Kampala the local administration has constructed pit latrines for the local communities using funds from the Local Government Development Programme. In order to maintain these facilities, a small fee is paid for using them. However, specific adaptation interventions have yet to be instituted. For instance, anticipatory interventions such as watershed protection policies and effective early warning systems are still lacking. Thus on the whole disaster management of cholera epidemics particularly by the government has been more reactive than proactive. This has greatly undermined the efficacy of governance and civil institutions to contain cholera epidemics in the East African lake basin. Mitigating against the impacts of cholera epidemics necessitates a shift in emphasis from disaster response to risk management which might include improved flood forecasting, better early warning systems, improved communications and support for strategies which mitigate risk.
Measures against cholera epidemics employed at the household level include: washing hands before meals; treating drinking water and construction of pit latrines. The communities were also able to distinguish between the different levels of responsibility in the control of cholera (Table 19). The strategies at the village level do not require as much economic resources as those at the district level, a reflection of the communities’ awareness of this limitation.
64
Village Level District Level 1. Construction and use of improved toilets Awareness campaigns on how to
prevent cholera outbreaks 2. Use of clean and safe water (boiled) Outbreak preparedness – (districts
need to have plans for controlling cholera in the event of outbreaks)
3. Use of clean and safe water (boiling cooking and drinking water)
Outbreak preparedness
4. Proper collection and disposal of wastes Collecting solid wastes in pits and burying the pit when they fill-up Burning the wastes, where possible
Planning for cholera control strategies in cooperation with community leaders Provide equipments necessary to keep the environment clean and improve the hygienic conditions
5. Protection and proper management of water sources
Recruit more health staff.
6. Cost sharing in the management of water sources 4 Washing hands before taking any food/meals Undertake environmental assessment
to ascertain causes of problems and how to control the situation
7 Washing fruits before eating 8 Washing hands every after visiting toilets 9 Cleanliness of household utensils Establish temporary camps for
patients during cholera outbreaks 10 Community to report promptly when there is a
cholera outbreak. To ensure prompt response to cholera outbreak
11 Sick people to report promptly at health centres and hospitals for treatment
Undertake laboratory analysis to confirm outbreak
Table 19: Cholera control strategies On the other hand, strategies for cholera mainly include, boiling drinking water and observing good practices in personal hygiene. Modern medical treatment, though an effective adaptation method, is out of reach of most households due to cost and distance to the nearest health centre. Strategies that reduce poverty will significantly enhance adaptation to malaria and cholera epidemics.
The East African governments have no comprehensive programs or fiscal facilities to deal with climate variability and extremes. Malaria and cholera preventive and curative programs run by civil societies or governments predominantly rely on external sources of assistance, whose long term sustainability is not guaranteed. Therefore, the local capacity to develop adaptive strategies to cope with climate variations and extremes is still very low, at all levels, and remains a big challenge.
It has been proposed that private expenditures for treatment and prevention, increased urbanization, and increased funding for government control can reduce malaria transmission (Sachs and Malaney, 2002). It is clear that under the current economic environment, the three east African countries are ill placed to react in such a manner. Sachs and Malaney (2002) also note that economic development alone without breakthroughs in medical prevention and treatment cannot eradicate the disease. Due to poverty and lack of adequate early warning mechanisms, communities have limited capacity to respond to climate disasters and hence cannot develop effective strategies for coping with climate-induced shocks such as disease and weather extremes. There is also lack of tested and reliable information systems to communicate predictable effects of
65
climate variation. The East African governments have weak economies that are dependent on external assistance. In the face of recurrent climate disasters, the East African governments have been unprepared and are consequently reactive, slow and late in their response. Such strategies exacerbate the impact of climate-induced diseases such as malaria and cholera. There is an urgent need to develop sustainable adaptive strategies and early warning systems that will address future climate changes challenges. Combined efforts that improve adaptation to climate change, early warning systems, knowledge of disease, medical health infrastructure and provision of services, and socio-economic status would reduce the existing malaria situation in East Africa.
Future adaptation programs should take into account the diversity of factors that influence a society’s capacity to cope with the changes. Such programs should take into consideration the demographic trends and socio-economic factors, since these have an effect on land use, which may in turn accelerate or compound the effect of climate change. Trends in demographic, socio-economic development would definitely have a dampening effect on the potential consequences of climate change. HIV/AIDS, malaria, diarrheal diseases, respiratory diseases and others play an important role in the people’s health, productivity and responsiveness to external threats. The programs dealing with these diseases must therefore be factored into the analysis of the future effects of climate change on the vulnerable system.
66
6 Capacity Building Outcomes and Remaining Needs With the backing of resources availed to the AF 91 project, it was possible to build a pool of climate change researchers in East Africa. That the research expertise built by this project is of international repute is evident by the recent offer to some members of the AF91 project to conduct similar research. The Kenyan research team was awarded a project funded by GEF. This project is entitled “Integrating Vulnerability and Adaptation to Climate Change into Sustainable Development Policy Planning and Implementation in Southern and Eastern Africa”.
Capacity building of post-graduate students in climate change research was also achieved. One graduate student has successfully completed her Masters’ degree studies with support from the project. At present two on-going PhD and two MSc students are continuing their studies started under the project. Rosemary Owigar participated in the Advanced Institute on Vulnerability to Global Environmental Change and was awarded a small research project grant on malaria in the Kenyan Highlands. Further the project was able to train one Fulbright Fellow and several graduate assistants. At local level field assistants and other local stakeholders have been exposed to the analysis of issues related to vulnerability and adaptability to climate change. Through the participation in AF 91 workshops and meetings, the project was able to create awareness on climate induced health issues to a variety of stakeholders such as:
• Vulnerable communities in the Lake Basin region of East Africa;
• Local, national and regional decision and policy makers;
• Scientific communities in the respective East African countries.
The project was able to identify several areas that need to be addressed in the area of climate change research, these include:
• Assessments of adaptation strategies (both conventional and traditional) so as to bridge the science/policy interface;
• Conducting comparative studies in different localities (apart from Lake Victoria basin) to establish similarities or differences in terms of climatic and malaria and cholera patterns;
• The gendered impact of vulnerability to climate induced diseases;
• Investigation of the potential impact of non Persistent Organic Pollutants (POPS) in controlling malaria.
• Development of climate and socio-economic scenarios.
67
7 National Communications, Science-Policy Linkages and Stakeholder Engagement
Kenya- Prof. Wandiga is chair of the national communications committee on “Vulnerability and Adaptation to climate Change”. The findings of the AF_91 project have been disseminated to this committee and will be contained in its report. Similarly, the project findings were presented at a stakeholders’ workshop held in May 2005 to prepare report on Kenya’s capacity needs to implement article 6, of the United Nations Framework Convention on Climate Change.
Stakeholder meetings were held with the opinion leaders (such as teachers, women’s group members, NGOs, local administrative personnel, etc) drawn from the local communities where the research had been conducted. These workshops presented the feedback of research results and in consultation with community stakeholders it was possible to identify risk groups, coping mechanisms and adaptation strategies for malaria and cholera epidemics. The risk groups in the cholera study site include: the poor (those living on less than a dollar a day); beach communities; children and the old. Whilst those in the malaria study site include: the poor; infants; expectant mothers and the old. The participants were also able to identify specific target persons or organisations which could help in creating awareness at the community level. Some of these include: the participants; community health workers from the Ministry of Health; women’s groups; beach management units; and churches. Two National consultative meetings which brought together the research teams, government policy-makers (Ministries of Health, Environment and Natural Resources) and UNFCC communication contact person (s) were held in Kenya, Uganda and Tanzania. The first series of meetings which took place in the initial phase of the project, sought to create awareness about the project, find out the kind of information that would be useful to them as decision makers, and seek their assistance in accessing health data and institutions involved in combating malaria and cholera epidemics. The second series of meetings were mainly to disseminate the research findings and feed into the development of adaptation strategies.
Vulnerability to human health was accepted as one of the areas for activities in the second communications activities. The Kenya Government officials in the Ministries of Health and Environment and Natural Resources have received full briefing on malaria and cholera findings. The reception was very positive and the Kenya team of AF 91 in conjunction with the National Environmental Management Authority (NEMA) has initiated a follow-up action on adaptation to malaria and subsequently submitted a proposal to GEF. The proposed GEF project is entitled “Demonstration of efficacy, cost effectiveness and sustainability of alternatives for malaria control and development of adaptation mechanisms to climate change induced malarial episodes policy in selected Kenyan districts”. Some of the immediate actions, which the Kenya government has initiated include reducing the price of the ITNs from US$ 3 to US$ 0.70 and availing the same at no cost to all infants and pregnant mothers visiting government health institutions. This is due to cumulative scientific evidence on vulnerable groups based on research by AF 91 and others. The provision on ITNs in Kenya is being funded by UNICEF in collaboration with the government.
The UNFCCC Focal Point for Kenya designated the KNAS (which had also housed the AF91 project) as the implementer of a GEF funded, UNEP and African Centre for Technology Studies (ACTS) executed project. The project is entitled “KENYA Pilot Project Design: Increasing Community Resilience to Drought in Makueni District”: The objective of this project is twofold: 1. To reduce community vulnerability to Drought exacerbated by climate change in the Makueni District by implementing a field demonstration project to produce tangible benefits to the community and, 2) to gather information from the field and related to the information needs of policy makers in order to effect changes in relevant policies, in particular the Arid and Semi Arid Lands Development Programme (ASAL) and the draft local level disaster management policy. This decision was based on our AF_91 project results.

68
Three of the project team members are contributors to the IPCC 4th Assessment Report. Dan
Olago is a contributor to Chapter 6 on Climate, while Andrew Githeko and Pius Yanda are contributors to Chapter 9 on Africa Region.
69
8 Outputs of the Project
8.1 Other Publications P. Z. Yanda, R.Y.M. Kangalawe and R.J. Sigalla (2005). Climatic and Socio-Economic Influences on Malaria and Cholera Risks in the Lake Victoria Region of Tanzania. AIACC Working Paper No. 12, http://www.aiaccproject.org/working_papers/working_papers.html.
Shem O. Wandiga1*
, Maggie Opondo2
, Daniel Olago3
, Andrew Githeko4
, Faith Githui5
, Michael Marshall
6, Tim Downs
6, Alfred Opere
5, Pius Z. Yanda
7, Richard Kangalawe
7, Robert Kabumbuli
8,
Edward Kirumira8, James Kathuri
2, Eugene Apindi
3, Lydia Olaka
3, Laban Ogallo
5, Paul
Mugambi9, Rehema Sigalla
7, Robinah Nanyunja
9, Timothy Baguma
9, Pius Achola
10 (2005).
Vulnerability to epidemic malaria in the highlands of Lake Victoria basin: the role of climate change/variability, hydrology, health and socio-economic factors. Climate Change J. Submitted.
Pius Z. Yanda, Shem O. Wandiga, Richard Y.M. Kangalawe, Maggie Opondo, Dan Olago, Andrew Githeko, Tim Downs, Robert Kabumbuli, Alfred Opere, Faith Githui, James Kathuri, Lydia Olaka, Eugene Apindi, Michael Marshall, Laban Ogallo, Paul Mugambi, Edward Kirumira, Robinah Nanyunja, Timothy Baguma, Rehema Sigalla, Pius (2005). Adaptation to climate change - induced malaria and cholera in the Lake Victoria region. AIACC Adaptation Synthesis book, submitted
Daniel Olago1
, Michael Marshall1
, Shem O. Wandiga*2
, Maggie Opondo3
, Eugene Apindi1
, Faith Githui
4, Pius Z. Yanda
5, Richard Kangalawe
5, Andrew Githeko
6, Tim Downs
7, Alfred Opere
4,
Edward Kirumira8, Robert Kabumbuli
8, James Kathuri
3, Lydia Olaka
1, Laban Ogallo
4, Paul
Mugambi9, Rehema Sigalla
5, Robinah Nanyunja
9, Timothy Baguma
9, Pius Achola
10 (2005).
Vulnerability to Climate Induced Cholera in the Lake Victoria Basin. Ambio. Paper under preparation.
Paul Mugambi, Edward K. Kirumira, Robert Kabumbuli, Timothy Baguma and Robinah Nanyunja (2005): Learning to cope: Community response to highland malaria in Uganda. Paper under preparation.
8.2 Presentations Shem O. Wandiga (2005). The right to access to healthcare. A paper presented at The International Conference “BIOETHICS & INTERNATIONAL LAW”: Contribution to an International Declaration on Bioethics. 25-26 February. Institute Curie, 25, rue d’Ulm 75005 Paris, France. Organised by: The French Commission for UNESCO and the International Association for Law, Ethics and Science (IALES)
Shem O. Wandiga1, Maggie Opondo
2* (Speaker), Dan Olago
3, Andrew Githeko
4, Michael
Marshall5, Tim Downs
5, Alfred Opere
6, Faith Githui
76 Pius Z. Yanda
7 Richard Kangalawe
7,
Edward Kirumira8
, Robert Kabumbuli,9
James Kathuri2
, Lydia Olaka3
, Eugene Apindi3
, Laban Ogallo
7
, Paul Mugambi,8
Edward Kirumira,9
Robinah Nanyunja,8
Timothy Baguma,8
Rehema Sigalla
6
, Pius Achola10
(2005). Vulnerability to climate induced highland malaria in east Africa. Vulnerability Synthesis Paper, Presented at the AIACC workshop, 14-21 March 2005, Bellagio, Italy.
Richard Kangalawe (Speaker),P.Z. Yanda and R.J. Sigalla (2004). Vulnerability and adaptation to climate change induced malaria and cholera in the East Africa region. In: Messages from Dakar:
70
Report of the Second AIACC Regional Workshop for Africa and the Indian Ocean Islands., Dakar, Senegal, 24-27 March, pp5-6.
Dan Olago (2004). Climate and Hydrological variability and extremes in Lake Victoria Basin. In: Messages from Dakar: Report of the Second AIACC Regional Workshop for Africa and the Indian Ocean Islands., Dakar, Senegal, 24-27 March, pp5-9.
Shem Wandiga (Speaker) and Maggie Opondo (2004). Community stakeholders’ discussions and workshops in the Lake Victoria region. In: Messages from Dakar: Report of the Second AIACC Regional Workshop for Africa and the Indian Ocean Islands., Dakar, Senegal, 24-27 March, pp5-19.
Maggie Opondo (2004). “The fallacy of Policy: Roll Back Malaria in East Africa”. In: Messages from Dakar: Report of the Second AIACC Regional Workshop for Africa and the Indian Ocean Islands., Dakar, Senegal, 24-27 March, pp5-18
Shem Wandiga (Speaker), Andrew Githeko, Maggie Opondo (2004). Variability of Malaria Epidemics in East Africa: Need for Policy Change and New Adaptation Strategies. Paper presented at the ANCAP Regional Workshop, 26th-27th April, Kampala , Uganda.
Dan Olago (2005). Climate Change and Malaria in Lake Victoria Basin Paper presented at the CICERO, ACTS and IIED-UK Policy Consultation on "Vulnerability to CLimate Stress - Local and Regional Perspectives" held at ACTS, World Agroforestry Research Centre Campus, Nairobi, January 27-28th.
71
9 References Anon., (2004). Where do some Mbugani residents go for their 'long calls'? Mazingira Newsletter,
Anyamba, A., Tucker, C.J., and Mahoney, R. (2002). From El Nino to La Nina: vegetation response patterns over East and Southern Africa during the 19972000 period. Journal of Climate 15: 3096-3103.
Armstrong Schellenberg, J.R.M. et al.: 2001 ‘Effect of Large-Scale Social Marketing of Insecticide-Treated Nets on Child Survival in Rural Tanzania’, Lancet 357, 1241-1247. August, 2004 Issue. Available at: http://www.mwanzacommunity.org/mazingiranews.html
Birkett, C., Murtugudde, R., and Allan, T. (APR 15 1999). Indian Ocean climate event brings floods to East Africa’s lakes and the Sudd Marsh. Geophysical Research Letters (8): 1031-1034.
Center for Ecology and Hydrology (2001). Floods version 1.1 regional frequency analysis software. Operation Manual App A, Wallingford (United Kingdom).
Central Bureau of Statistics (CBS) [Kenya] Ministry of Health (MOH) [Kenya] and ORC Macro.: 2004, Kenya Demographic and Health Survey 2003, CBS MOH and OCR Macro, Maryland.
Checkley W., Epstein, L.D., Gilman, R.H., Figueroa, D., Cama, R.I., Patz, J.A., and Black, R.E. (FEB 5 2000). Effects of El Nino and ambient temperature on hospital admissions for diarrhoeal diseases in Peruvian children. The Lancet 355: 442-450.
Cohen, A. S., L. Kaufman and R. Ogutu-Ohwayo, 1996. Anthropogenic threats, impacts and conservation strategies in the African Great, Lakes: A review. In:
T. C. Johnson and E. Odada (eds.) The Limnology, Climatology and Paleoclimatology of the East African Lakes. Gordon and Breach, Toronto. pp 575–624
Colwell, R. (DEC 20 1996). Global climate and infectious disease: the cholera paradigm. Science 274 (5295): 2025-2032. Conway Declan .:2002, ‘Extreme Rainfall Events and Lake Level Changes in East Africa: Recent events and Historical Precedents’, in Odada, E.O. and Olago,
D. (eds.), The East African Great Lakes: Limnology, Palaeolimnology and Biodiverity, Kluwer Academic Publ., Dordrecht, pp. 64-92.
De Savigny, D, Mewageni, E., Mayombana, C., Masanja, H., Minhaji, A., Momburi, D., Mkilindi, Y., Mbuya, C., Kasale, H., Reid, H., Mshinda, H.:(2004). ‘Care Seeking Patterns in Fatal Malaria: Evidence from Tanzania’, Tanzania Essential Health Interventions Project (TEHIP), Rufiji Demographic Surveillance System, Tanzania, Ifakara Health Research and Development Centre, Tanzania, Tanzania Ministry of Health and International Development Research Centre (IDRC), Canada.
De Savigny, D, Mewageni, E., Mayombana, C., Masanja, H., Minhaji, A., Momburi, D., Mkilindi, Y., Mbuya, C., Kasale, H., Reid, H., Mshinda, H. (2004). ‘Highland Malaria in Uganda: Prospective Analysis of an Epidemic Associated with El Nino’, Transactions of the Royal Society of Tropical Medicine and Hygiene, 93, 480-487.
Epstein, P. R.: 1992 ‘Cholera and Environment’, Lancet, 339, 1167 – 1168. Epstein, P. R.: 1995, ‘Emerging Diseases and Ecosystem Instability: New Threats to
Public Health’, American Journal of Public Health, 85 (2),168 – 172. extdr/offrep/afr. Fowler, V.G. Jr., Lemnge, M., Irare, S.G., Malecela, E., Mhina, J., Mtui, S., Mashaka,
72
M., Mtoi, R.:1993, ‘Efficacy of Chloroquine on Plasmodium Falciparum Transmitted at Amani, Eastern Usambara Mountains, North-East Tanzania: An Area where Malaria has Recently become Endemic’, Journal of Tropical Medicine & Hygiene, 6, 337-45.
Garnham, P.C.C.: 1945, ‘Malaria Epidemics at Exceptionally High Altitudes in Kenya’, The British Medical Journal, 11, 45-47.
Githeko A. K. and Ndegwa, W.: 2001, ‘Predicting Malaria Epidemics in the Kenyan Highlands Using Climate Data: A Tool for Decision Makers’, Global change and Human Health, 2, 54-63.
Githeko, A.K., Lindsay, S.W., Confaloniero, U.E. and Patz, J.A.: 2000, ‘Climate Change and Vector-Borne Disease: A Regional Analysis’, Bulletin of the World Health Organization, 78 (9), 1136-1147.
Greenwood, B.: 2004, ‘Between Hope and a Hard Place’, Nature 430, 926-927.
Hay, S.I., Simba. M., Busolo, M., Noor, A.M., Guyatt, H.L., Ochola, S.A., Snow, R.W.: 2002, ‘Defining and Detecting Malaria Epidemics in the Highlands of Western Kenya’, Emerging Infectious Diseases 8, 555-62.
Helsel, D.R. and Hirsch, R.M. (2002). Statistical Methods in Water Resources. U.S. Geological Survey TWRI Book 4, pp. 323-344.
Hirsch, RM (1982). A comparison of four stream flow record extension techniques. Water Resources Research 18 (4): 1081-1088.
Hoekstra, D and Corbett, J. 1995. Sustainable Agricultural Growth for Highlands of East and Central Africa: Prospects to 2020. Paper presented at the Ecoregions of the Developing world: A lens for Assessing Food, Agriculture and the Environment to the year 2020, held at Washington DC, USA. Organised by the International Food Policy Research Institute.
Huq, A., Sack., R.B. and Colwell, R. 2001. Cholera and Global Ecosystems. In: Aron,
J.L. and Patz, J.A. (eds.) Ecosystem Change and Public Health – A Global Perspective: 2001. The John Hopkins University Press: 327-352. Indeje, M., Semazzi, F.H.M., and Ogallo, L.J. (2000). ENSO signals in East African rainfall seasons. International Journal of Climate 20: 19-26.
Intergovermental Panel on Climate Change (IPCC): 2001, ‘Impacts, Adaptation and Vulnerability’, in McCarthy. J., Canziani. O. F., Leary. N., Docken. D., and White, K.S. (eds.) Contribution of Working Group II to the Third Assessment Report, Cambridge University Press, UK.
Janowiak, J.E. (1988). An investigation of interannual rainfall variability in Africa. Journal of Climate 1: 240-255.
Johnson, T.C. and Odada, E. (eds). Gordon and Breach, Toronto, pp. 575-624.
Kahwa, R. (2002). The Main Disaster in Tanzania. Disaster Management Department. Available at: http://www.oosa.unvienna.org/SAP/stdm/2002_africa/presentations/session02 /speaker01.pdf (viewed: 26/11/2004)
Kemp, W.P., Burnell, D.G., Everson, D.O. and Thomson, A.J.: 1983, ‘Estimating Missing Daily Maximum and Minimum Temperatures’, Journal of the American Meteorological Society, 1587-1593.
Khaemba B.M., Mutani, A. and Bett, M.K.: 1994, ‘Studies of Anopheline Mosquitoes Transmitting Malaria in a Newly Developed Highland Urban Area: A Case Study of Moi University and its Environs’, East African Medical Journal, 3, 159-64.
73
Kilian, A.H.D., Langi, P., Talisuna A. and Kabagambe, G.: 1999, ‘Rainfall Pattern, El Nino and Malaria in Uganda’, Transactions of the Royal Society of Tropical Medicine and Hygiene, 93, 22-23.
King’uyu, S.M., Ogallo, L.A., and Anyamba, E.K. (2000). Recent trends of minimum and maximum surface temperatures over Eastern Africa. Journal of Climate
31: 2876-2886.
Latif, M. and Dommenget, D., Dima, M., and Grotzner, A. (DEC 1999). The role of Indian Ocean sea surface temperature in forcing East African rainfall anomalies during December-January 1997/1998. Journal of the American Meteorological Association 12: 3497-3504.
Legros, D., McCormick, M., Mugero, C., Skinnider, M., Bek’obita, D.D. and Okware, S.I. (2000). Epidemiology of cholera outbreak in Kampala, Uganda. East African Medical Journal, 77 (7): 347-349.
Lepers, J.P., Deloron, P., Fontenille, D. and Coulanges, P.: 1988, ‘Reappearance of Falciparum Malaria in Central Highland Plateaux of Madagascar’, Lancet, 12, (1), 585-586.
Lindblade, K.A., Walker, E.D., Onapa, A.W., Katunge, J. and Wilson, M.L.: 2000, ‘Land Use Change Alters Malaria Transmission Parameters by Modifying Temperatures in a Highland Area of Uganda’, Tropical Medicine and International Health, 5 (4), 263-274.
Lindsay, S. W. and Martens, W. J. M.: 1998, ‘Malaria in the African Highlands: Past, Present and Future’, Bullentin of the World Health Organization, 76, 33-45.
Lipp, E.K., Huq, A., and Colwell, R.R. (OCT 2002). Effects of global climate on infectious disease: the cholera model. Clinical Microbiology Reviews 15 (4): 757-770.
Loevinsohn, M. E.: 1994, ‘Climate Warming and Increased Malaria in Rwanda’, Lancet, 343, 714-748.
Lorenzoni, I., Jordan, A., Hulme, M., Turner, R.K. and O’Riordan T.: 2000, ‘A Co-Evolutionary Approach to Climate Change Impact Assessment: Part I, Integrating Socio-Economic and Climate Change Scenarios’, Global Environmental Change, 10, 57-68.
Louis, V.R., Russek-Cohen, E., Choopun, N., Rivera, I.N., Gangle, B., Jiang, S.C., Rubin, A., Patz, J.A., Huq, A., and Colwell, R. (MAY 2003) Predictability of Vibrio cholerae in Chesapeake Bay. Applied and Environmental Microbiology 69 (5): 2773-2785.
Malakooti, M.A., Biomndo, K. and Shanks, G.D.: 1998, ‘Reemergence of Epidemic Malaria in the Highlands of Western Kenya’, Emerging Infectious Diseases, 4, 671-676.
Matola, Y.G, White, G.B. and Magayuka, S.A.: 1987, ‘The Changed Pattern of Malaria Endemicity and Transmission at Amani in the Eastern Usambara Mountains, North-Eastern Tanzania’, Journal of Tropical Medicine and Hygiene, 3, 127-134.
McMichael, A.J., Hames, A., Scooff, R. and Covats, S. (eds).: 1996, ‘Climate Change and Human Health: An assessment’, Prepared by a Task Group on behalf of the World Health Organization, the World Meteorological Organization and the United Nations Environment Programme, Geneva.
Mganga, F. (2003). Geita schools face shortage of latrines. Mazingira Newsletter, August 2003 Issue. Available at: http://www.mwanzacommunity.org/mazingiranews.html
Mhalu, F. S., Mntenga, W.M., Mtango, F.D. (1987). Seasonality of cholera in Tanzania: possible role of rainfall in disease transmission. East Afr Med J. 64(6):378-87
Morse, S.S.: 1995, ‘Factors in the Emergence of Infectious Diseases’, Emerging Infections Diseases, 1, 7-15.
74
Mouchet, J., Manuin, S., Sircoulon, S., Laventure, S., Faye, O., Onapa, A.W., Carnavale, P., Julvez, J. and Fontenille, D.: 1998, ‘Evolution of Malaria for the Past 40 years: Impact of Climate and Human Factors’, Journal of American Mosquitoe Control Association, 14, 121-130
Mutai, C.C. Ward, M.N., and Colman, A.W. (1998). Towards the prediction of the East Africa short rains based on sea-surface temperature-atmosphere coupling. International Journal of Climate 18: 975-997.
Nicholson, S. E. (1996). ‘A Review of Climate Dynamics and Climate Variability in Eastern Africa’, in Johnson, T. C. and Odada, E. O. (eds), The Limnology, Climatology and Palaeoclimatology of East African Lakes, pp. 25-56. Gordon and Breach Publishers, Australia.
Nuwaha, F.: 2002, ‘People’s Perceptions of Malaria in Mbarara, Uganda’, Tropical Medicine and International Health, 7 (5), 462-470. Office of the President – Ministry of Economic and Planning.: 2004, Tanzania Poverty and Human Development Report 2003, Office of the President – Ministry of Economic and Planning, Dar es Salaam.
Ogallo, L., et al.:1989, ‘The Spatial and Temporal Patterns of the East African Rainfall Derived from Principal Components Analysis’. International Journal for Climate, 9, 145-167.
Pascual, M., Xavier, R., Ellner, S.P., Colwell, R., and Bouma, M.J. (SEP 08 2000). Cholera dynamics and El Nino—Southern Oscillation. Science 289 (5485): 1766-1769.
Patz, J. (2002). A human disease indicator for the effects of recent global climate change. PNAS 99 (20): 12506-12508.
Patz, J.A., Strzepek, K., Lele, S., Hedden, M., Greene, S., Noden, B., Hay, S.I., Kalkstein, L. and Beier, J.C.: (1998). ‘Predicting Key Malaria Transmission Factors, Biting, and Entomological Inoculation Rates, Using Modeled Soil Moisture in Kenya’, Tropical Medicine and International Health, 3, 818-827.
Roberts, J. M. D.: 1964, ‘Control of Epidemic Malaria in the Highlands of Western Kenya, Part I Before the Campaign’, Journal of Tropical Medicine and Hygiene, 61, 161-168.
Ropelewski, C.F. and Halpert, M.S.: 1987, ‘Global and Regional Scale Precipitation Patterns Associated with the El Niño/Southern Oscillation’, Montreal Weather Review, 115, 1606-1626.
Sachs, J. and Malaney, P.: 2002, ‘The Economic and Social Burden of Malaria’, Nature, 415, 680-685.
Shapiro R.L., Otieno, M.R., Adcock, P.M., Phillips-Howard, P.A., Hawley, W.A., Kumar, L., Waiyaki, P., Nahlen, B.L., and Slutsker, L. (1999). Transmission of epidemic Vibrio colerae 01 in rural western Kenya associated with drinking water from Lake Victoria: an environmental reservoir for cholera? American Journal of Tropical Medicine and Hygiene 60(2): 271-276.
Shretta, R., Omumbo, J., and Snow, R.W.: 1998, ‘Community Based Healthcare and its Relationship to Insecticide Treated Bednets in Kenya’. Report for the Kenyan Ministry of Health, Nairobi.
Some, E.S.: 1994, ‘Effects and Control of Highland Malaria Epidemic in Uasin Gishu District, Kenya’. East African Medical Journal, 71, 2-8.
Stedinger, J.R. and Thomas, W.O., Jr. (1985). Low-flow frequency estimation using base-flow measurements. U.S. Geological Open-File Report 85-95: 21.
Tabony, R.C.: 1983, ‘The Estimation of Missing Climatological Data’, Journal of Climatology, 3, 297-314. The Limnology, Climatology and Paleoclimatology of the East African Lakes.
75
Uganda Bureau of Statistics (UBOS).: 2001, Uganda National Household Survey 1991/2000: Report of the Socio-Economic Survey, UBOS, Entebbe.
United Nations Development Programme, Global Environment Facility (UNDP/GEF).: 2003, ‘Developing Socio-Economic Scenarios: For Use in Vulnerability and Adaptation Assessments’, National Communications Support Unit Handbook.
Verschuren, D, Johnson, T.C., Kling, H. J., Edgington, D.N., Leavitt, P.K., Brown, E.T., Talbot M.R. and Hecky, R.E.: 2002, ‘History and Timing of Human Impact of Lake Victoria, East Africa’, Proc. Roy. Soc. London B, 269, 289294.
Waiyaki, P.G. (1996). Cholera: Its story in Africa with special reference to Kenya and other East African countries. East African Medical Journal 73 (1): 40-43.
Walsh, J.F., Molyneux, D.H., and Birley, M.H.: 1993, ‘Deforestation: Effects on Vector-Borne Disease’, Parasitology, 106, S55-S75.
WHO: World Health Report: 1996. Fighting Diseases, Fostering Development. World Health Organization, Geneva.
WHO Regional Office for Europe: 2003, Methods for Assessing Human Health Vulnerability and Public Health Adaptation to Climate Change, (Health and Global Environmental Change Series No. 1), Copenhagen, WHO Regional Office for Europe.
WHO. 2002. ‘Roll Back Malaria’, http://www.rbm.who.int
World Bank. 1999. Country Profiles (Burundi, D.R. Congo, Tanzania, Zambia). (http://www.worldbank.org.html.extdr/offrep/afr)
76
i International Health Regulations require national health administrators to report the number of indigenous and imported cholera cases and deaths to the World Health Organization (WHO), within 24 hours of receiving such information. These cases and deaths of cholera are then reported in the Weekly Epidemiological Review (WER) detailing the date and geographical location. ii
In all the three countries the most reliable health data records were from 1996. The data prior to that year had gaps that could not be corrected. Initially the trends in inpatient malaria cases were expressed at standardized anomalies. However, in order to reach a wide audience of end users it was necessary to simplify the analysis. Consequently, the data was reanalyzed to indicate departure of mean monthly inpatient admissions from long-term means (6 years) obtained from inpatient cases from 1996-2001 (Figure 11a). The results were then expressed as a percent departure from the long-term mean. The data was assessed for seasonal departures from the mean long-term mean and for long-term trends from 1996-2001. A monthly increase of 50% in malaria admissions was taken as a threshold for malaria epidemic outbreaks. iii
Subsistence farmers in Kabale for instance are worried that they can no longer accurately predict the onset of rains, and that even the rains have reduced in amount. This is affecting their agricultural productivity, income and nutritional status, hence vulnerability to climate-related diseases.
For copies of final reports from the AIACC project and other information about the project, please contact:
AIACC Project Office
The International START Secretariat 2000 Florida Avenue, NW, Suite 200
Washington, DC 20009 USA Tel. +1 202 462 2213 Fax. +1 202 457 5859 Email: [email protected]
Or visit the AIACC website at:
www.aiaccproject.org
Related Documents