Uniting agriculture and nature for poverty reduction Climate change impacts on water quantity and quality: Implications for agriculture Claudia Ringler, IFPRI (with Tingju Zhu, Hua Xie & Mark Rosegrant and the IMPACT Food model team) Water Policy for Food Security UC Davis, October 5-6

Welcome message from author
This document is posted to help you gain knowledge. Please leave a comment to let me know what you think about it! Share it to your friends and learn new things together.
Transcript
Uniting agriculture and nature for poverty reduction
Climate change impacts on water quantity and quality: Implications for agriculture
Claudia Ringler, IFPRI
(with Tingju Zhu, Hua Xie & Mark Rosegrant andthe IMPACT Food model team)
Water Policy for Food SecurityUC Davis, October 5-6

1. Higher emissions increase water-related risks (exposure to
water shortages but also floods)
2. Impact of climate-induced water variability on agriculture as
part of climate change has yet to be assessed
3. Impact of climate change on water pollution remains under-
studied
4. Trade has a key role to play in addressing agricultural
impacts from climate change (i.e. food prices)
5. CBA of water-based adaptation options versus agriculture-
focused options versus non-agriculture focused options (i.e.
trade) under variability and change have yet to be studied in
a comprehensive manner
Key messages
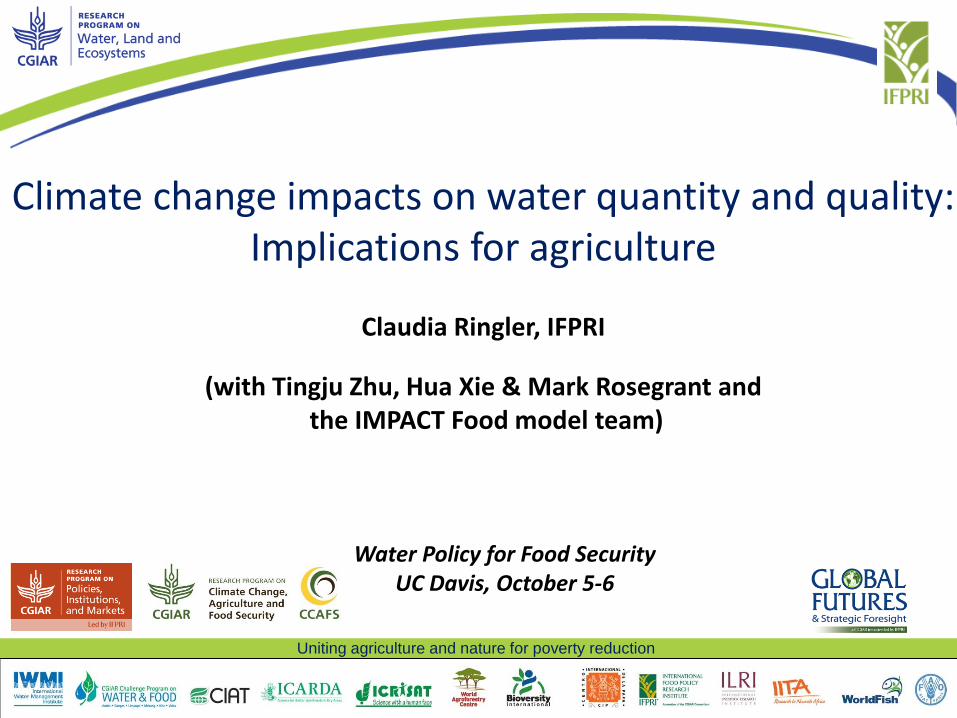
The IMPACT modeling suite
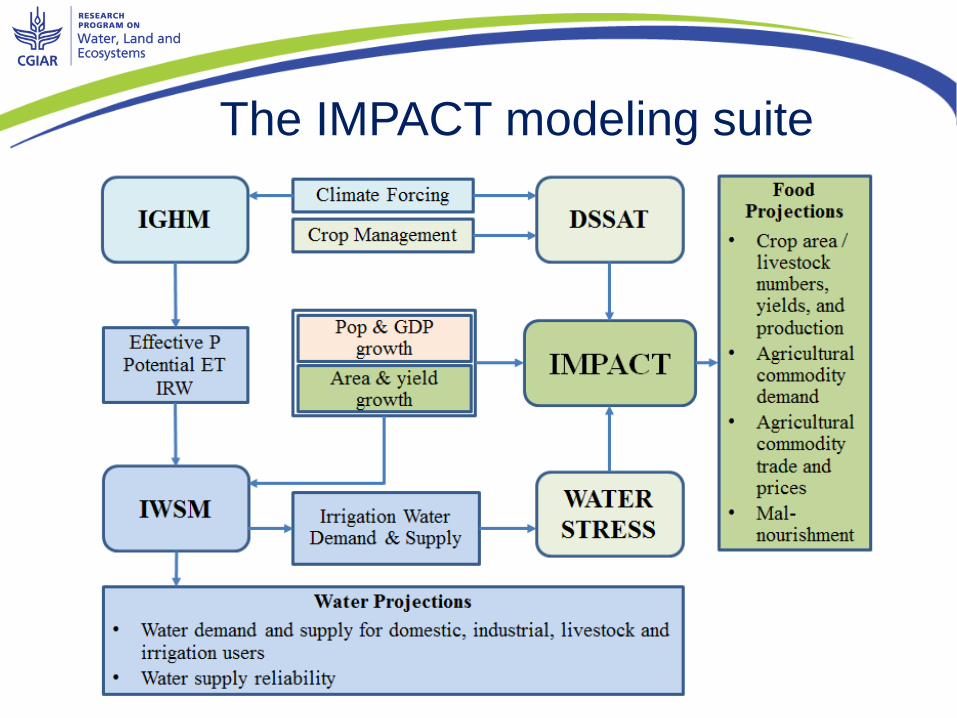
Change of Mean Annual Runoff by 2050 – HadGEM2-RCP6.0 Scenario
Notes: 2040-2070 future period relative to the 1951-2000 historical period.
The impact of climate change on water
resources
Source: IFPRI, IMPACT version 3.2, 8 September 2015
For every 1 degree of warming, another 7% of the pop experiences a 20% decline in wateravailability; today already 30-40% exposed to water shortages; also population exposed to100-year flood triples from low to high emissions scenarios
0.58
0.6
0.62
0.64
0.66
0.68
0.7
0.72
0.74
0.76
0.78
2000 2030 2050
base
CSI_a1
CSI_b1
MIR_a1
MIR_b1
0.5
0.6
0.7
0.8
0.9
1
2000 2030 2050
NAE
0.5
0.6
0.7
0.8
0.9
1
2000 2030 2050
ESAP
0.5
0.6
0.7
0.8
0.9
1
2000 2030 2050
SSA
0.5
0.6
0.7
0.8
0.9
1
2000 2030 2050
CWANA
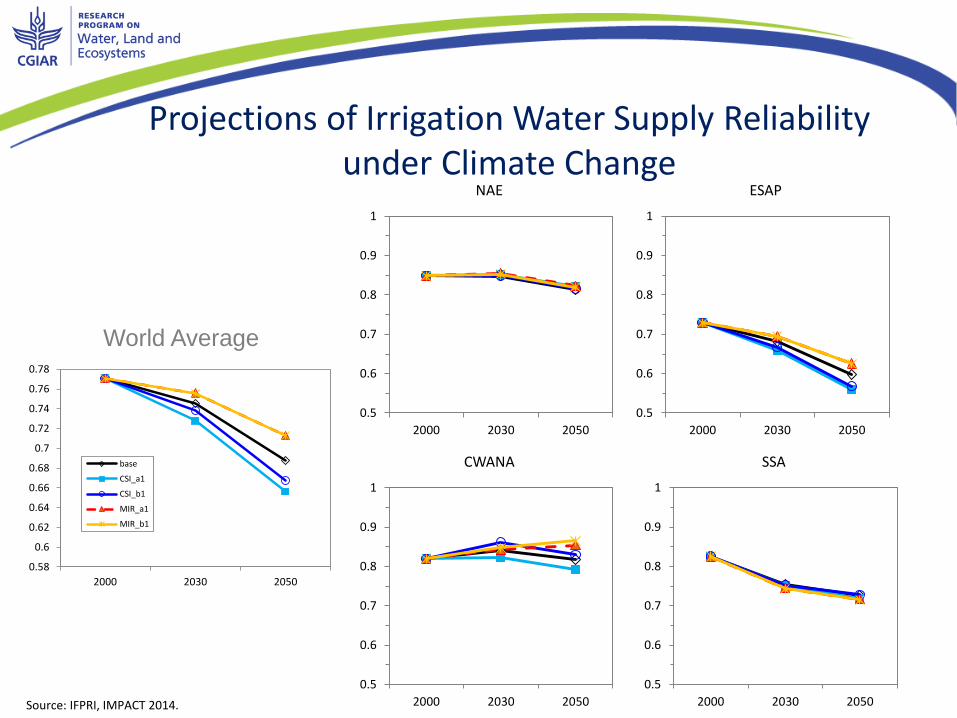
World Average
Projections of Irrigation Water Supply Reliability under Climate Change
Source: IFPRI, IMPACT 2014.
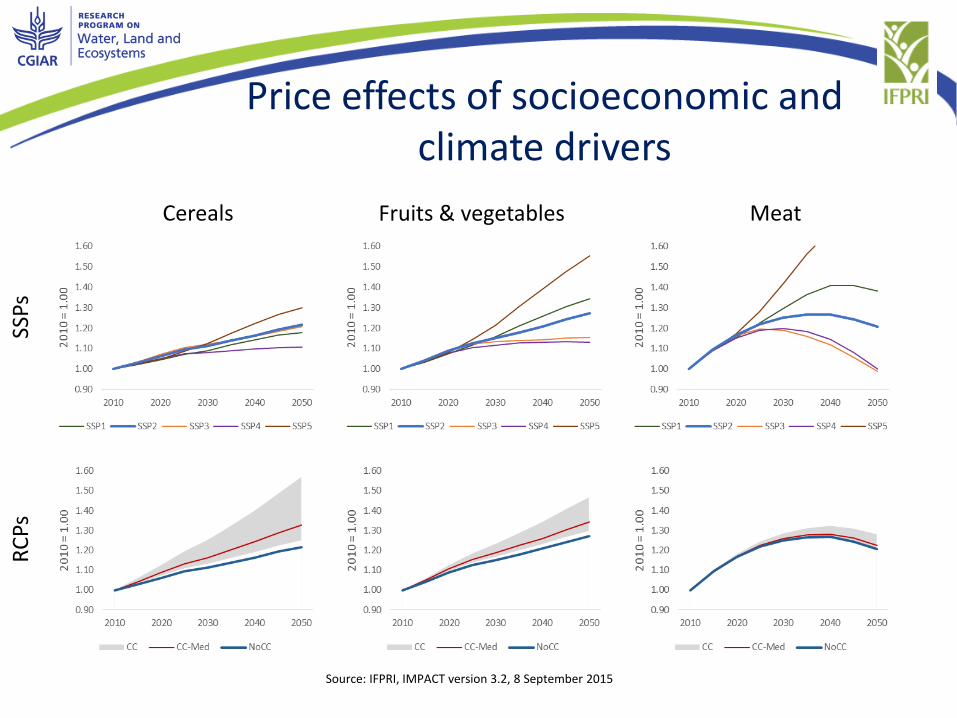
Price effects of socioeconomic andclimate drivers
Source: IFPRI, IMPACT version 3.2, 8 September 2015
Cereals Fruits & vegetables Meat
SSP
sR
CPs
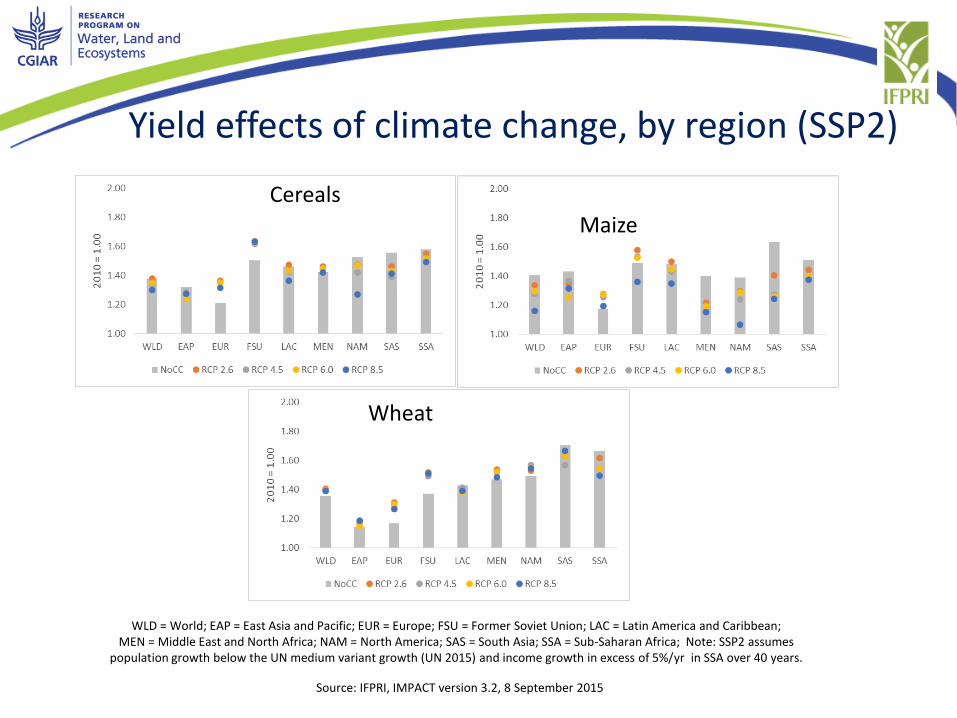
Yield effects of climate change, by region (SSP2)
Source: IFPRI, IMPACT version 3.2, 8 September 2015
Cereals
Maize
Wheat
WLD = World; EAP = East Asia and Pacific; EUR = Europe; FSU = Former Soviet Union; LAC = Latin America and Caribbean; MEN = Middle East and North Africa; NAM = North America; SAS = South Asia; SSA = Sub-Saharan Africa; Note: SSP2 assumes
population growth below the UN medium variant growth (UN 2015) and income growth in excess of 5%/yr in SSA over 40 years.
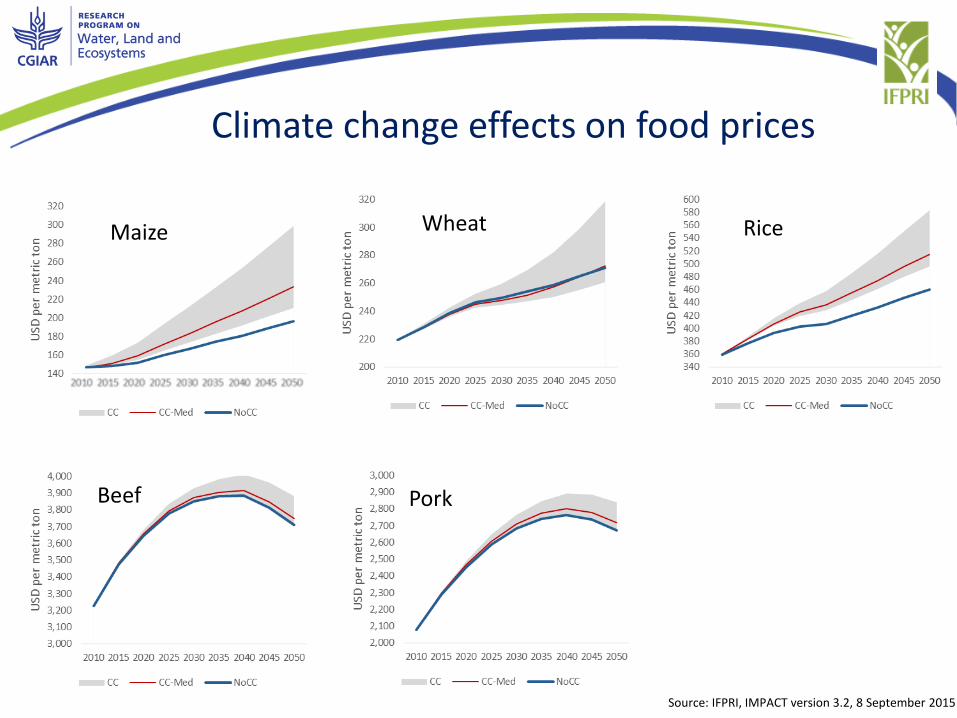
Climate change effects on food prices
Source: IFPRI, IMPACT version 3.2, 8 September 2015
Maize Wheat Rice
Beef Pork

Source: IFPRI, IMPACT version 3.2, 8 September 2015
Rice
Wheat
Maize
Impact of CC on net cereal trade (SSP2,
RCP 8.5)
DVG = Developing Countries; EAP = East Asia and Pacific; SAS = South Asia; FSU = Former Soviet Union;MEN = Middle East and North Africa; SSA = Sub-Saharan Africa; LAC = Latin America and Caribbean; NAM: North America; Note: SSP2 assumes population growth below the
UN medium variant growth (UN 2015) and income growth in excess of 5%/yr in SSA over 40 years.

Population at risk of hunger (SSP2, RCP8.5)
Source: IFPRI, IMPACT version 3.2, 8 September 2015
EAP = East Asia and Pacific; SAS = South Asia; FSU = Former Soviet Union; MEN = Middle East and North Africa; SSA = Sub-Saharan Africa; LAC = Latin America and Caribbean; Note: SSP2 assumes population growth below the UN medium variant growth (UN
2015) and income growth in excess of 5%/yr in SSA over 40 years.

How to address water variability?
1. Enhance rainfed water management (watershed level
management, RWH, joint management of inputs on farm,
agricultural R&D – breeding)
2. Increase water storage (above, below ground and in the soil)
3. Address water variability in irrigation systems
4. Improve the enabling environment (water and land rights,
incentives to use water sustainably)
5. Focus on non-water policies and assess their impact on
water (trade policy, ag R&D, energy development, input and
output support policies)

Uniting agriculture and nature for poverty reduction
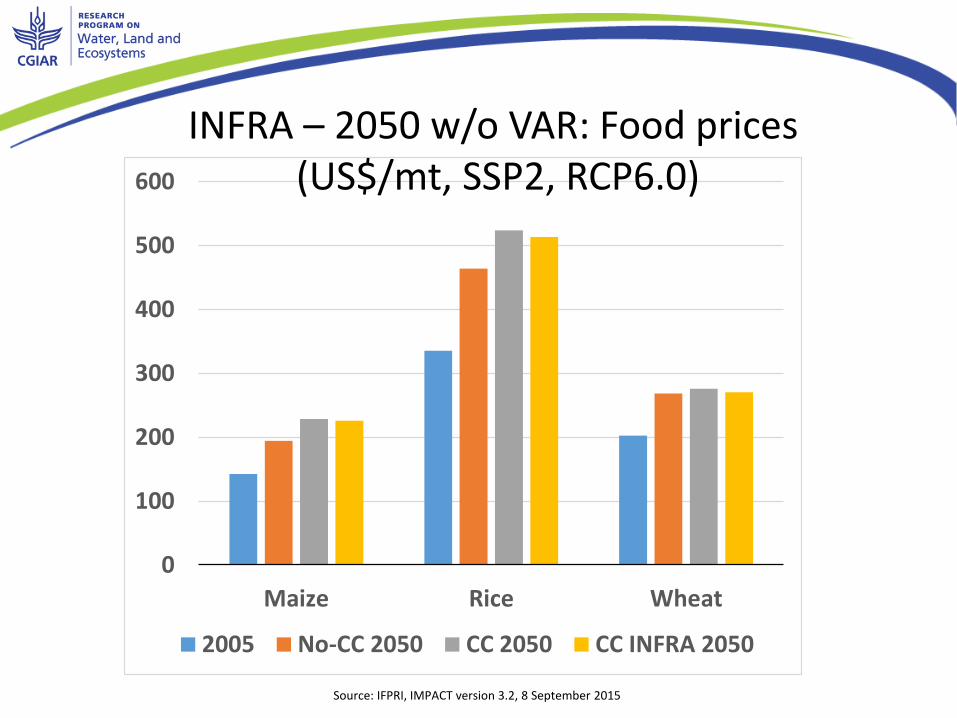
Global Production and Price Effects of Removing Economic Water Scarcity through Infrastructure Investment
Simulated 2010 production and prices under baseline and infrastructure scenario
INFRA: adequate investment in surface water infrastructure
INFRA retains GW withdrawal limits
In SSA, irrigated maize yield increases by 32% on average, and more in bad years, under INFRA
Probability that rice price could exceed US$400 reduced from 21% to 0.7%
Source: Sadoff et al. (2015)
0
100
200
300
400
500
600
Maize Rice Wheat
2005 No-CC 2050 CC 2050 CC INFRA 2050
INFRA – 2050 w/o VAR: Food prices(US$/mt, SSP2, RCP6.0)
Source: IFPRI, IMPACT version 3.2, 8 September 2015
0
20
40
60
80
100
120
140
East Asia South Asia SSA LAC MENA
No-CC 2050 CC 2050 CC INFRA 2050
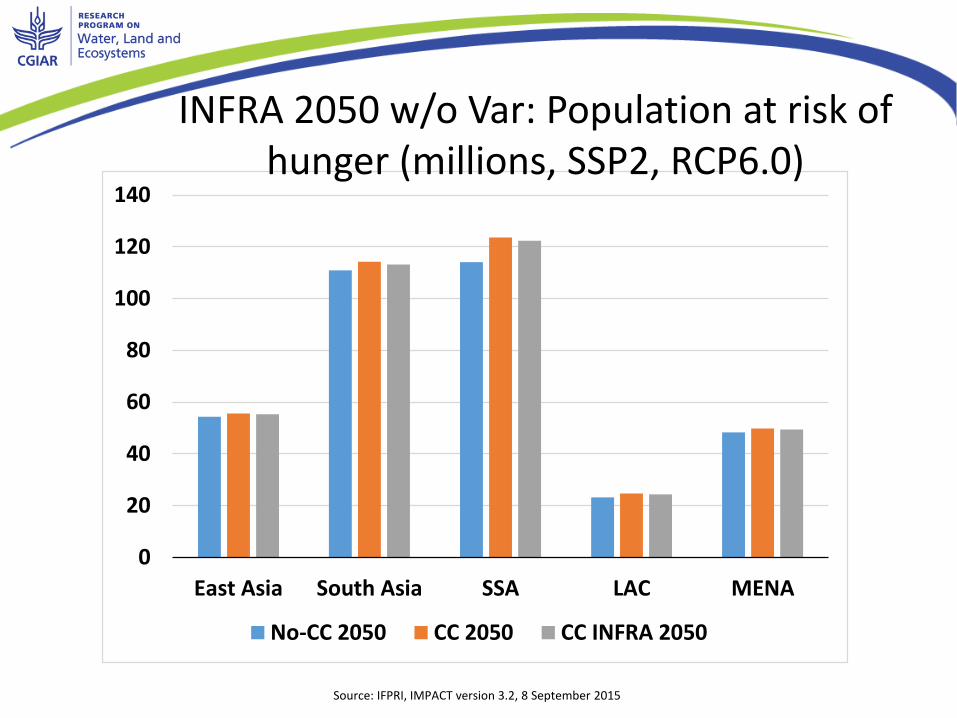
INFRA 2050 w/o Var: Population at risk of hunger (millions, SSP2, RCP6.0)
Source: IFPRI, IMPACT version 3.2, 8 September 2015
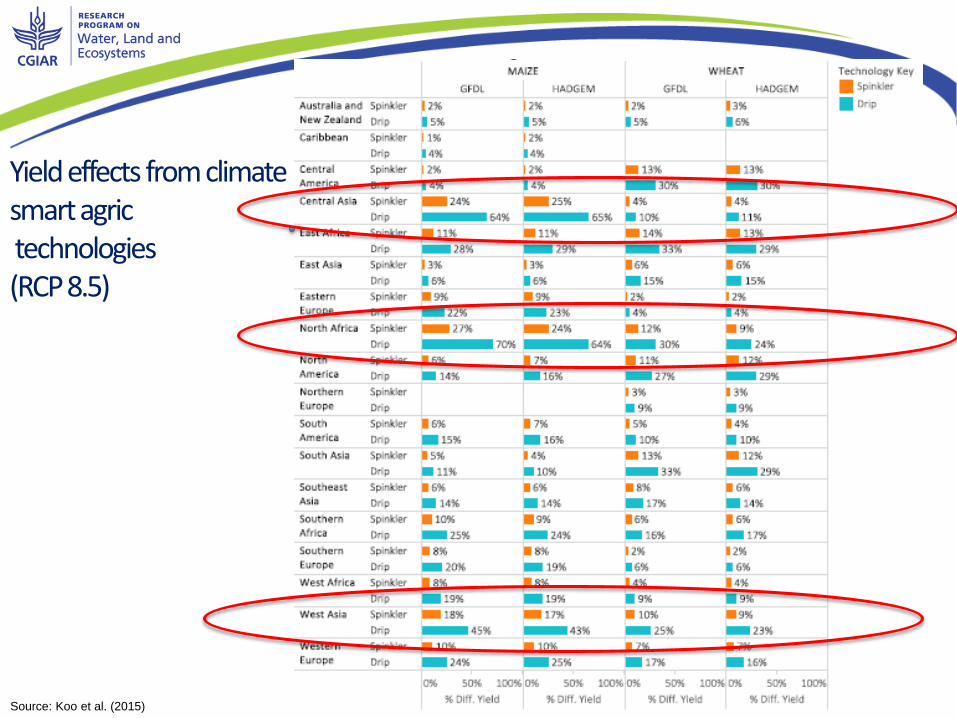
Yield effects from climate smart agrictechnologies(RCP 8.5)
Source: Koo et al. (2015)

Uniting agriculture and nature for poverty reduction
Climate change impacts and trade
Impacts of climate change and trade policy on yields, area, production, exports and prices of five commodities, (% deviation from baseline values in 2050 without climate change)
SSP1, RCP4.5 SSP3, RCP8.5
Source: Wiebe et al. (ERL 2015)

Impact of growing water pollution
Source: IFPRI-Veolia (2015).
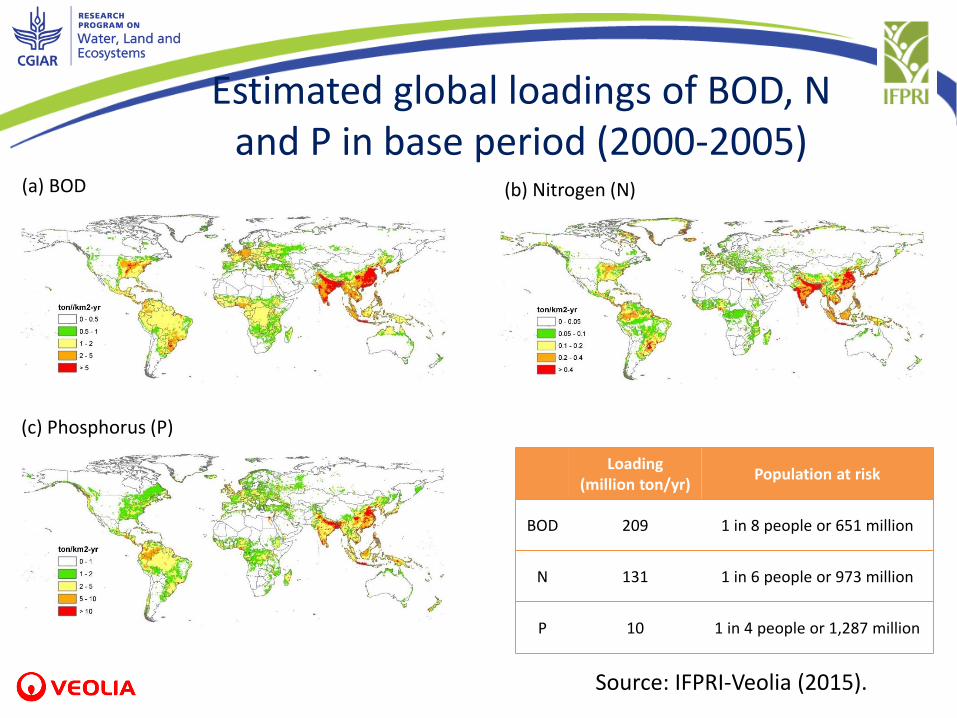
Estimated global loadings of BOD, N and P in base period (2000-2005)
Source: IFPRI-Veolia (2015).
(a) BOD (b) Nitrogen (N)
(c) Phosphorus (P)
Loading(million ton/yr)
Population at risk
BOD 209 1 in 8 people or 651 million
N 131 1 in 6 people or 973 million
P 10 1 in 4 people or 1,287 million
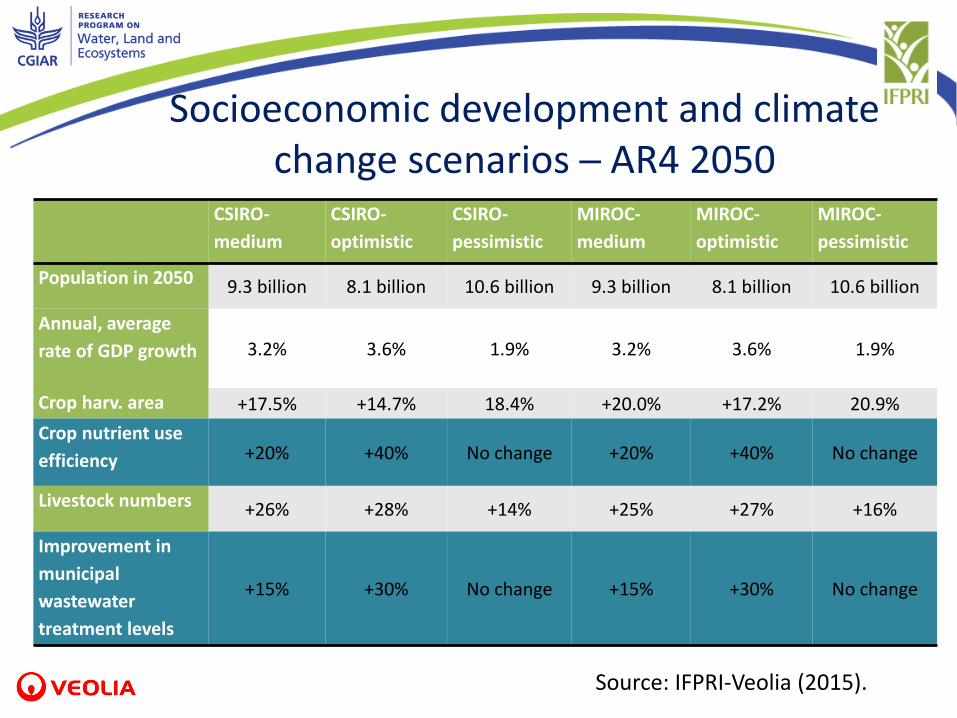
CSIRO-
medium
CSIRO-
optimistic
CSIRO-
pessimistic
MIROC-
medium
MIROC-
optimistic
MIROC-
pessimistic
Population in 2050 9.3 billion 8.1 billion 10.6 billion 9.3 billion 8.1 billion 10.6 billion
Annual, average
rate of GDP growth 3.2% 3.6% 1.9% 3.2% 3.6% 1.9%
Crop harv. area +17.5% +14.7% 18.4% +20.0% +17.2% 20.9%
Crop nutrient use
efficiency +20% +40% No change +20% +40% No change
Livestock numbers +26% +28% +14% +25% +27% +16%
Improvement in
municipal
wastewater
treatment levels
+15% +30% No change +15% +30% No change
Socioeconomic development and climate change scenarios ─ AR4 2050
Source: IFPRI-Veolia (2015).

Increases in loading volumes under alternative climate change and socioeconomic scenarios
Source: IFPRI-Veolia (2015).
209
248227
270252
231
275
131
187 177197 202 191
21210
12.411.5
13.1 13.312.4
14.1
0
2
4
6
8
10
12
14
16
0
50
100
150
200
250
300
Base period CSIRO_medium CSIRO_optimistic CSIRO_pessimistic MIROC_medium MIROC_optimistic MIROC_pessimistic
P lo
adin
g (m
illio
n t
on
/yr)
BO
D &
N lo
adin
g (m
illio
n
ton
/yr)
BOD N Pad4 P
USA
Brazil
China
India
2050 CSIRO-medium 2050 MIROC-medium
BOD1 in 5 people or 1,589
million1 in 6 people or 1,372
million
N1 in 3 people or 2,645
million1 in 4 people or 2,311
million
P1 in 3 people or 2,948
million1 in 3 people or 2,522
million
Source: IFPRI-Veolia (2015).
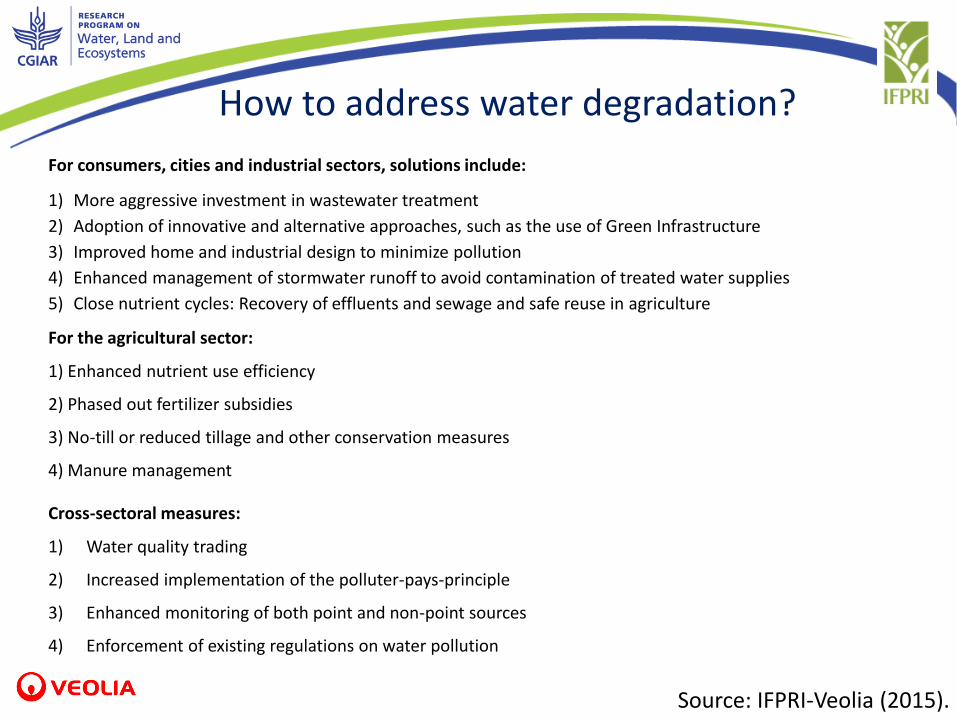
How to address water degradation?
For consumers, cities and industrial sectors, solutions include:
1) More aggressive investment in wastewater treatment
2) Adoption of innovative and alternative approaches, such as the use of Green Infrastructure
3) Improved home and industrial design to minimize pollution
4) Enhanced management of stormwater runoff to avoid contamination of treated water supplies
5) Close nutrient cycles: Recovery of effluents and sewage and safe reuse in agriculture
For the agricultural sector:
1) Enhanced nutrient use efficiency
2) Phased out fertilizer subsidies
3) No-till or reduced tillage and other conservation measures
4) Manure management
Cross-sectoral measures:
1) Water quality trading
2) Increased implementation of the polluter-pays-principle
3) Enhanced monitoring of both point and non-point sources
4) Enforcement of existing regulations on water pollution

1. Climate change increases a host of water and related
impacts: wetter wet seasons and drier dry seasons;
increased crop water demand; increased reliance on storage
2. Climate smart practices can increase or reduce adverse
water [energy] impacts (neg: biofuel development; pos:
manure management)
3. Water-based [storage/drip]; water-related [nitrogen-use
efficiency, no till, DT/HT, reforestation, WUAs, water
markets]; non-water measures [trade, pop/econ growth, ag
input and output support policies, PHL] are all important
pieces in addressing growing water variability, shortages and
degradation
Concluding thoughts
Related Documents