June 1, 2008 Document of the World Bank Report No. 43946-IN Climate Change Impacts in Drought and Flood Affected Areas: Case Studies in India South Asia Region India Country Management Unit Sustainable Development Department Social, Environment and Water Resources Management Unit Public Disclosure Authorized Public Disclosure Authorized Public Disclosure Authorized Public Disclosure Authorized Public Disclosure Authorized Public Disclosure Authorized Public Disclosure Authorized Public Disclosure Authorized

Welcome message from author
This document is posted to help you gain knowledge. Please leave a comment to let me know what you think about it! Share it to your friends and learn new things together.
Transcript
June 1, 2008
Document of the World Bank
Report N
o. 43946-IN
Clim
ate Change Im
pacts in Drought and Flood A
ffected Areas: C
ase Studies in India
Report No. 43946-IN
Climate Change Impacts in Drought and FloodAffected Areas: Case Studies in India
South Asia RegionIndia Country Management UnitSustainable Development DepartmentSocial, Environment and Water Resources Management Unit
Pub
lic D
iscl
osur
e A
utho
rized
Pub
lic D
iscl
osur
e A
utho
rized
Pub
lic D
iscl
osur
e A
utho
rized
Pub
lic D
iscl
osur
e A
utho
rized
Pub
lic D
iscl
osur
e A
utho
rized
Pub
lic D
iscl
osur
e A
utho
rized
Pub
lic D
iscl
osur
e A
utho
rized
Pub
lic D
iscl
osur
e A
utho
rized
Disclaimer
This report has been discussed with the Government o f India but does not bear their approval for al l its contents, especially where the Bank has stated i t s judgment/opinion/policy recommendations. The findings, interpretations, and conclusions expressed in this paper are based on staff analysis and recommendations and do not necessarily reflect the views o f the Executive Directors o f The World Bank.
... 111
Table o f Contents Abbreviations and Acronyms
Conversions
Disclaimer
Acknowledgments ........................................................................................................................................ x
Glossary .................................................................................................................................................... xiii
Executive Summary .................................................................................................................................... 1
...
1 .
2 .
3 .
4 .
A . Background to the Study ................................................................................................................. 1
C . Elements of a Strategy for Adaptation to Drought Conditions ........................................................ 6 B . Coping with and Adapting to Drought Conditions .......................................................................... 4
D . Climate Change and Vulnerability to Floods ................................................................................ 10
E . Elements of a Strategy for Building Flood Resilience .................................................................. 11 F . Conclusions and Recommendations: ............................................................................................. 13
Introduction, Context, and Objectives ....................................................................................... 16 1.1 Introduction ........................................................................................................................... 16
1.2 Context: Climate Variability. a Development Challenge ...................................................... 17
1.3 Objectives. Process. and Approach ....................................................................................... 20
India’s Climate: Background, Trends, and Projection Tools .................................................. 25
India’s Current Climate. I t s Variability. and Trends ............................................................. 25 2.1
2.2
2.3
Future Climate Change Projections ....................................................................................... 26
Methodology o f the Study ..................................................................................................... 27 Climate Variability and Change:A Case Study in Drought-Prone Andhra Pradesh ............ 36
Introduction and Background ................................................................................................ 36
Characteristics of Study Area ................................................................................................ 36
Impact o f Drought ................................................................................................................. 40
Pulling Together the Pieces: Policy Implications .................................................................. 49 Climate Variability and Change: A Case Study in Drought-Prone Maharashtra ................. 56
Introduction and Background ................................................................................................ 56
Impact o f Drought ................................................................................................................. 60
Future Prospects under Climate Change ................................................................................ 61
Pulling Together the Pieces: Policy Implications .................................................................. 66
3.1
3.2
3.3
3.4
3.5
Future Prospects under Climate Change ................................................................................ 43
4.1
4.2
4.3
4.4
4.5
Characteristics o f Study Area ................................................................................................ 57
iv
5 .
6 .
Climate Variability and Change: A Case Study in Flood-Prone Orissa ................................. 72 5.1
5.2
5.3
5.4
Introduction and Background ................................................................................................ 72
Characteristics o f Study Area ................................................................................................ 72
Impacts o f Floods .................................................................................................................. 75
Future Prospects under Climate Change ................................................................................ 78
5.5 Policy Implications ................................................................................................................ 81
Strengthening Climate Information Systems and Mechanisms ............................................. 88
Fostering Climate-Resilient Reforms in Agnculture and Water Resource Management ...... 88
A Way Forward ............................................................................................................................ 87 6.1
6.2
6.3 Economic Mechanisms and Instruments to Promote Income Diversification ....................... 89
6.4 Improving Institutional Capacities and Program Linkages ................................................... 89
6.5 Future Work ........................................................................................................................... 90 Appendix A Integrated Modeling System-Framework and Analysis ........................................................ 93
Appendix B Methodology used for the Design and Analysis o f Household Surveys and Data .............. 100 Appendix C International Conference on Adaptation to Climate Variability and Change ...................... 106
Appendix D Programs that Address Droughts and Floods in the Case Studies ....................................... 112
Appendix F Program for Stakeholders Consultation ................................................................................ 125
Appendix G Description o f the Economic Model .................................................................................... 127
Bibliography .............................................................................................................................................. 143
Boxes
Box 2.1 Emission Scenarios Selected for the Study .................................................................................... 31
Box 2.2 Structure ofthe Farm Economic Model ........................................................................................ 33
Appendix E A Conceptual Framework for Maharashtra Drought Adaptation Pilot in Rainfed Areas .... 116
Appendix H Maps o f Location and Climate Change Impacts in Study Areas ......................................... 136
Box 1.1 Working Group I1 o f IPCC: Summary o f Rural Impacts ............................................................... 18
Box 3.1 Groundwater Crisis Looms Large over Anantapur and Chittoor Districts .................................... 37
Box 3.2 Illustration o f Trends in Crop Responses in the Pennar Basin, Andhra Pradesh ........................... 46
Box 3.3 Andhra Pradesh Drought Adaptation Initiative: Putting Adaptation into Practice ........................ 49 Box 3.4 Andhra Pradesh Sectoral Programs: Comprehensive Base to Build Adaptation Approaches ....... 50
Box 3.6 Livestock Systems ......................................................................................................................... 54
Box 4.1 Rainfall Distribution in Maharashtra ............................................................................................. 57
Box 4.3 Short-Term Coping Measures and Responses to Drought in Maharashtra .................................... 60
Box 3.5 Weather-Indexed Insurance for Apculture in India ..................................................................... 52
Box 4.2 Unsustainable Groundwater Development Poses Problems for Ahmednagar and Nashik ............ 59
V
Box 4.4 Sugarcane Yield and Climate Change in Ahmednagar: EPIC Model Projections ........................ 65
Box 4.5 Role o f Community Institutions and Participatory Water Resource Management in Drought
Box 4.6 Snapshot o f Sectoral Programs in Maharashtra ............................................................................. 71
Adaptation .......................................................................................................................................... 69
B o x 5.1 Flood Coping Strategies in Study Area ......................................................................................... 77
Box 5.2 Flood Management in ~ s s a ......................................................................................................... 82
B o x 5.3 Poland Flood Emergency Project (1997-2005): Good Practice in Nonstructural Measures for
B o x A I Stochastic Weather Generator ....................................................................................................... 97
Flood Management ............................................................................................................................. 84
B o x A2 Regional Climate Models vs . Global Climate Models .................................................................. 99
Figures
Figure 1.2 Study Framework ................................................................................................................. 24
Figure 2.1 All-India Average Surface Temperature 1948-1998 ................................................................. 25
Figure 2.2 Variation o f All-India Monsoon Rainfall 18 13-2003 ................................................................ 26
Figure 3.1 Location M a p o f Study Villages in Chittoor District ................................................................. 38
Figure 1 . 1 Elements o f Vulnerability to Climate in Rural Areas o f India ................................................... 20
Figure 2.3 I M S System Architecture ........................................................................................................... 32
Figure 3.2 Location M a p o f Study Villages in Anantapur District ............................................................. 38
Figure 3.3 Household Percentage with Irngation Access (by Source & Landholding) .............................. 39
Figure 3.4 Impact o f Drought on Income .................................................................................................... 40 Figure 3.5 Determinants of Income Volati l i ty ............................................................................................ 41
Change Scenarios) .............................................................................................................................. 44 Figure 3.6 Spatial Distribution o f Average Annual Rainfall in the Pennar Basin (Baseline and Climate
Figure 3.7 Yields o f Rice, Groundnut, and Jowar under Different Climate Scenarios, Anantapur ............ 45
Figure 3.8a Per Hectare Average Profits in Baseline Scenario, Talupula Block, Anantapur ...................... 47 Figure 3.8b Area Allocation in Baseline Scenario, Talupula Block, Anantapur ......................................... 47
Figure 3.9a Per Hectare Profits in Climate Change Scenarios, Anantapur ................................................. 47
Figure 3.9b Total Profits in Climate Change Scenarios, Anantapur ........................................................... 47
Figure 3.10 Acreage Comparison between Projections o f the Farm Economic Model and Data f i o m Household Surveys ............................................................................................................................. 48
Figure 3.1 1 Yield-Rainfall Correlation in Anantapur in A2 Scenario ........................................................ 53
Figure 3.12 Cropping Pattern in Anantap ur ................................................................................................ 54 Figure 3.13 Proposed Crop Diversification ................................................................................................. 54
Figure 4.1 Location M a p of Study Villages in Ahmednagar District ......................................................... 58
Figure 4.2 Location M a p o f Study Villages in Nashik District ................................................................... 58
vi
Figure 4.3a Percentage o f Households with Irrigation Access: Normal Year ............................................. 59
Figure 4.3b Percentage o f Households with Irrigation Access: Drought Year ........................................... 59
Figure 4.4 Drought Impact o n Income ........................................................................................................ 60
Figure 4.5 Nonincome Impacts on Households .......................................................................................... 60
Figure 4.6 Spatial Distribution o f Average Annual Rainfall in the Godavari Basin (Baseline and Climate Change Scenarios) .............................................................................................................................. 63
Figure 4.7a Bajra: Average Yields, Nashik ................................................................................................. 64
Figure 4.7b Bajra: Distribution o f Yields. Nashik ...................................................................................... 64
Figure 4.8a Sugarcane: Average Yields ...................................................................................................... 65
Figure 4.8b Sugarcane: Distribution o f Yields ............................................................................................ 65
Figure 4.9 Sugarcane Productivity Trend in Ahmednagar (Tonnes per Hectare) ....................................... 68
Figure 5.1 Location o f Study Villages in Jagatsinghpur District ................................................................ 75
Figure 5.2 Location o f Study Villages in Puri District ................................................................................ 75
Figure 5.3 Average Percentage o f Sources o f Income in Total Monthly Income in Sampled Households (by Landholding Size) ........................................................................................................................ 75
Figure 5.4 Changes in Agricultural and Nonagricultural Incomes as a Result of a Flood Event ................ 76
Figure 5.5 Spatial Distribution o f Average Annual Rainfall in Lower Mahanadi Basin (Baseline and Climate Change Scenarios) ................................................................................................................ 79
Figure 5.6 Exceedance Probability Curves for Annual Peak Flows at Naraj Gauge Station ...................... 79
Figure 5.7a Yie ld Changes in A2 and B 2 by Crop, Puri District ................................................................ 80
Figure 5.7b Distribution o f Yields under Climate Change. Puri District .................................................... 80
Figure 5.8 Impact o f Climate Change on Farmer Profits Derived from Selected Crops. Puri District ....... 81
Figure A . 1 F low o f Data and Information in the Integrated Model ing System .......................................... 94
Figure A.2 Interface for Installation o f the Application .............................................................................. 95
Figure A.3 I M S Toolbar in Arc V iew ......................................................................................................... 95
Figure A.4 Crop Yields Shown Using Bar Charts ...................................................................................... 96
Figure A.5 Spatial Representation of Average Crop Yie ld in the Chittoor District .................................... 96
Figure B . 1 Spatial Representation o f Average Crop Yie ld in the Chittoor District .................................. 104
Figure E . 1 Maharashtra Drought Adaptation Pilot and Convergence with Ongoing Programs ............... 119
Figure G.l Distribution o f Groundnut Yields in Andra Pradesh ............................................................... 131
Figure G.2 Area Alloction and Water Supply, Medium Farm, Andra Pradesh ........................................ 132
Figure G.3 Profits and Levels o f Water Shortage in A2 Scenario in Andra Pradesh ................................ 132
Figure G.4 Mi l le t Farm Profits and Shortage o f Water in Maharashtra .................................................... 132
Figure H.l Andra Pradesh Study Area ...................................................................................................... 136
Figure H.2 Maharashtra Study Area .......................................................................................................... 136
Figure H.3 Orissa Study Area ................................................................................................................... 137
vii
Figure H.4 Average Annual Rainfall in Four Districts in Andra Pradesh ................................................. 138
Figure H.5 Average Rainfall in Khar i f Season in Four Districts in Andra Pradesh .................................. 138
Figure H.6 Average Maximum Temperature in Khar i f Season in Four Districts in Andra Pradesh ........ 139
Figure H.7 Average Khar i f Season Rainfall in Five Districts in Maharashtra .......................................... 140
Figure H.8 Average Annual Rainfall in Six Coastal Districts in Orissa ................................................... 141
Figure H.9 Average Rainfall in Khar i f Season in Six Coastal Districts in Orissa .................................... 141
Figure H.10 Average Maximum Temperature in Khar i f Season in Six Coastal Districts in Orissa ......... 142
Tables Table 1.1 Selected Indicators o f Changes in the Earth's Climate in the 20th and early 21st Cen tury ........ 17
Table 2.1 Results o f Ricardian Assessments o f Climate Change Impacts on Crops in India ..................... 28
Table 2.2 Agronomic Assessments o f Climate Change Impacts on Agriculture in India (by Source and Region) ............................................................................................................................................... 29
Table 3.1 Socioeconomic Profile o f Sampled Households by Landholding Size ....................................... 39
Table 3.2 Average Share o f Sources o f Income in Total Income in Sampled Households, 2003-04 ......... 39 Table 3.3 Percentage of Households with h g a t i o n Access ...................................................................... 42
Table 4.1 Socioeconomic Profile o f Surveyed Households in Maharashtra ............................................... 58
Table 4.2 Outlays and Expenditures for Drought Rel ief and Sectoral Programs , ....................................... 67
Table 5.1 Floods and Resulting Damage in Orissa 2001-2007 .................................................................. 74
Table 5.2 Socioeconomic Characteristics o f Puri and Jagatsinghpur Districts Compared to Orissa State . 74
Table 5.3 Average Seasonal Crop Production in the Surveyed Households ............................................... 76
Table 5.4a Orissa: Outlays and Expenditures for Sectoral Programs 2002-2007 (Rs billion) ................... 83
Table 5.4b Onssa: Allocation and Expenditures for Drought and Flood Relief 2002-2006 (Rs billion) .. 83
Table 6.1 Summary Recommendations for Adaptation .............................................................................. 92
Table B . 1 Definitions o f Vulnerability ...................................................................................................... 100
Table E . 1 Potential Impacts and Responses for Addressing Vulnerability to Climatet Variability and
Table G.l Critical Precentage Changes for Diversificiation out o f Groundut in Andra Pradesh .............. 129
Climate Change in Maharashtra ....................................................................................................... 124
Table G.2 Risk Aversion and Cropping Mix in Andra Pradesh ................................................................ 130
Table G.3 Competitive Crop Prices, Fertilization Cost and User Charge o f Water in Maharashtra .......... 130
Table G.4 Risk Aversion and Cropping Mix in Maharashtra ................................................................... 130
Table G.5 Farmers' Knowledge o f Climate Events and Cropping Mix .................................................... 131
Table G.6 Andra Pradesh- OLS Regressions ............................................................................................ 133 Table G.7 Maharashtra- OLS Regressions ................................................................................................ 134
Table G.8 Descriptive Statistics for Andra Pradesh .................................................................................. 134
... V l l l
Table G.9 Correlation Matr ix for Andra Pradesh ...................................................................................... 134
Table G.10 Descriptive Statistics for Maharashtra .................................................................................... 135
Table G . 1 1 Correlation Matr ix for Maharashtra ...................................................................................... 135
Table G . 12 Description o f Variables ......................................................................................................... 135
ix
Acknowledgments This report i s the product o f a collaborative effort between the World Bank and the Government o f India under the overall leadership o f the Ministry o f Environment and Forests (MoEF). The report has also received significant support from several ministries and agencies o f the Government o f India; and the state governments o f Andhra Pradesh, Maharashtra, and Orissa. Special gratitude i s extended to the following government officials: Dr. Prodipto Ghosh, Former Secretary, J.M. Mauskar, Additional Secretary, Rajshree Ray, Deputy Secretary, MoEF, Mr. J.C. Saharia, Former Secretary and Dr. K.S. Vatsa, Former Secretary, both from the Department o f Rural Development and Water Conservation, Government o f Maharashtra (GoM); and Mr. Aurobindo Behera, Principal Secretary, Department o f Water Resources, Government o f Orissa (GOO). Significant contributions from various representatives from Non-Government Organizations (NGOs), central and state sectoral agencies during meetings and workshops held at various stages o f the study and their technical support to the study consultants through data and information, are gratefully acknowledged. This report has received funding from the U.K. Department for International Development (DFID), although the views expressed within do not necessarily reflect official policy.
We would l i ke to especially thank the Technical Advisory Group (TAG) members that participated in the consultative process and guided the design o f the study: The TAG members include Dr R. K. Pachauri, The Energy and Resources Institute, Dr. A. Patwardhan, Technology Information Forecasting and Assessment Council (TIFAC), Delhi; Dr. P. K. Aggarwal, Indian Agricultural Research Institute, Delhi; Dr. K. S. Kavikumar, Madras School o f Economics, Chennai; Dr. Rupa Kohli, Indian Institute for Tropical Meteorology, Pune; Dr. Santosh Kumar, National Institute o f Disaster Management, Delhi; Prof. A. K. Gossain. Indian Institute o f Technology, Delhi; and Dr. Ajay Mathur, Bureau o f Energy Efficiency, Ministry o f Power, Delhi. Our gratitude i s extended to Dr. David Radcliffe, Senior Rural Livelihoods Advisor from DFID, Government o f U.K., for h is continuous support to this activity.
The contributions and written comments received from a number o f experts deserve special mention and are gratefully acknowledged, especially Dr. K. S. Kavikumar from the Madras School o f Economics for detailed comments and advice. Gratitude i s also extended for comments, data and inputs from: Dr. Charles Batchelor, Dr. Stephen Foster, Dr. V. P. Dimri and Dr. D. Muralidharan from the National Geophysical Research Institute, Hyderabad; Mr. A. K. Jain and Mr. Pradeep Raj from the Groundwater Department, Government o f Andhra Pradesh; Dr. Himanshu Kulkami from the Advanced Centre for Water Resources and Development and Management, Pune; Dr. S. P. Bagde, Groundwater Survey and Development Agency, GoM; and finally, Dr. S. Umarikar, Department o f Water Supply and Sanitation, GoM.
The World Bank team was initially led by Bi la l Rahill and in the subsequent phase by Richard Damania with Priti Kumar as co-task-team-leader. The team included Suphachol Suphachalasai, Carla Vale and Kumudni Choudhary. Other Bank staff who contributed to the production o f this report were Sanjay Pahuja, Ranjan Samantaray, Bela Varma, Rachel Susan Palmer and Vinod Ghosh. Technical background reports were produced by a team o f consultants from the Risk Management Solutions India (RMSI) Pvt. Ltd. led by Satya Priya and Murthy Bachu; The Energy and Resources Institute (TERI) led by Preety Bhandari and Suruchi Bhadwal with
X
support from Sreeja Nair, Souvik Bhattacharya, Meena Sehgal and Kadambari Anantram; and Pragmatix Research and Advisory Services Pvt. Ltd. led by A. J. James.
Peer reviewers are Gretel Gambarelli, Chandrasekar Govindarajalu and Willem Janssen o f the World Bank. Helpful comments and contributions were received from World Bank staff representing several sectors and regions, including Ernest0 Sanchez-Triana, Michel Pommier, Siet Meijer, Charles Cornier, Malcolm Jansen, Martien Van Nieuwkoop and Winston Yu. Special thanks are due to Kseniya Lvovsky and Karin Kemper for detailed and insightful comments on the draft report and for their support. The support and contribution o f Robert Watson for his guidance on scoping out the study; and Ian Noble for guiding the overall climate modeling exercise are also acknowledged. Finally, we would l ike to express our sincere appreciation to Michael Carter, Former Country Director for India, Jeffrey Racki, Former Acting Sector Director, South Asia Environment and Social Development Unit, and Fayez Omar, Senior Manager, India Program, for their overall guidance and support to this activity.
Thanks are due to John Dawson and Allison Russell for their meticulous contributions in editing the report and appendices, respectively.
The opinions presented here and any errors are the sole responsibility o f the authors and should not be attributed to the individuals or institutions acknowledged above.
x i
Glossary aquaculture. Breeding and rearing fish, shellfish, etc. or growing plants for food in special ponds.
adaptation. A process by which strategies to moderate, cope with, and take advantage o f the consequences o f climatic events are enhanced, developed, and implemented. Types o f adaptation include anticipatory and reactive adaptation, private and public adaptation, and autonomous and planned adaptation.
adaptive measures or responses. Actions taken that result in building the capacity o f communities and boosting their long-term resilience to climatic shocks or stress. See also coping measures . adaptation strategy. A broad plan o f action that i s implemented through policies and measures. Strategies can be comprehensive, focusing on national, cross-sectoral scales; or targeted, focusing on specific sectors, regions, or measures.
adaptability. The degree to which adjustments are possible in practices, processes, or structures o f systems to projected or actual changes o f climate (IPCC 1995, Working Group 11).
adaptive capacity. The ability o f a system to adjust to climate change (including climate variability and extremes), to moderate potential damages, to take advantage o f opportunities, and to cope with the consequences. Adaptive capacity i s limited by existing information, technology, and the resources o f the system under consideration (IPCC 2001, Working Group 11).
adaptive potential. A theoretical upper boundary o f responses based o n global expertise and anticipated developments within the planning horizon o f the assessment (UNDP 2004b).
basin. The drainage area o f a stream, river, or lake.
biophysical vulnerability. Sensitivity o f a natural system to an exposure to a hazard.
block or mandal. An administrative subdivision o f a district, which in turn i s a subdivision o f a state.
C4 plant. A land plant that uses a so-called C4 fixation method to transform carbon dioxide into sugar. Chemically speaking, the method allows for binding the gaseous molecules to dissolved compounds inside the plant for sugar production through photosynthesis. C4 fixation i s an improvement over the simpler and more ancient C3 carbon fixation strategy used by most plants. The intermediate compounds o f the process contain four carbon atoms, hence the name C4.
climate change. Following the Intergovernmental Panel on Climate Change (IPCC), any change in climate over time, whether due to natural variability or as a result o f human activity. This usage differs from that in the United Nations Framework Convention on Climate Change (UNFCCC), which defines climate change as “a change o f climate which i s attributed directly or indirectly to human activity that alters the composition o f the global atmosphere and which i s in addition to natural climate variability observed over comparable time periods.” See also climate variability . climate prediction or climate forecast. The result o f an attempt to produce a most l ikely description or estimate o f the actual evolution o f the climate in the future.
xi i
climate projection. A forecast o f the response o f the climate system to emission or concentration scenarios o f greenhouse gases and aerosols, or radiative forcing scenarios, often based upon simulations by climate models. Climate projections differ from climate predictions in that they depend upon the emission, concentration, or radiative forcing scenario used, which are based on assumptions concerning, for example, h tu re socioeconomic and technological developments that may or may not be realized and are therefore subject to substantial uncertainty.
climate variability. The variation in the mean state and other statistics (such as standard deviations and the occurrence o f extremes) o f the climate o n al l temporal and spatial scales beyond that o f individual weather events. Variability may result from natural internal processes within the climate system (internal variability) or from variations in natural or human-induced external forcing (external variability) (IPCC 2001).
coping measures or responses. Actions taken in the short te rm by households and communities that result in diminishing the impacts o f climatic shocks or stress on them temporarily and which help to tide them over the stress period.
drought. It i s defined in many ways and includes the phenomenon that results when precipitation is significantly below normal recorded levels, causing serious hydrological imbalances that adversely affect land resource production systems. In the case o f India, the definition o f what is considered “precipitation below normal” varies from agency to agency.
event or impact year. The year in which an event such as a drought or flood takes place.
emission scenario. A plausible representation o f the future development o f emissions o f greenhouse gases and aerosols based on a coherent and internally consistent set o f assumptions about driving forces (such as demographic and socioeconomic development and technological change) and their key relationships. In 1992, the IPCC presented a set o f emission scenarios that were used as a basis for the climate projections in the Second Assessment Report (IPCC 1995). These emission scenarios are referred to as the IS92 scenarios. For the Third Assessment Report (IPCC 2001) new emission scenarios, namely the SRES scenarios (Special Report on Emission Scenarios o f the IPCC), were published. These are known as the Al, A2, B1, and B 2 scenarios and were also utilized in the preparation o f the Fourth Assessment Report (IPCC 2007a, 2007b, 2007c; final report in preparation).
evapotranspiration. The combined process o f evaporation from the Earth’s surface and transpiration from vegetation.
extreme weather event. An event that i s rare within i t s statistical reference distribution in a particular place. Definitions o f “rare” vary, but an extreme weather event would normally be as rare as or rarer than the 10th or 90th percentile. By definition, the characteristics o f what i s called extreme weather may vary from place to place. An extreme climate event occurs when the same considerations apply to an average o f a number o f weather events over a certain period o f time (e.g. rainfall over a season).
flood. A phenomenon that occurs when an increase in precipitation, which i s above normal recorded levels in a specific timeframe, leads to the volume o f water within a body o f water, such as a river or lake, to surpass the total holding capacity o f that body. A s a result, some o f the water flows sit outside their normal perimeter, potentially causing serious damage and adversely affecting people and land resource production systems.
x i i i
impact of climate. Consequences o f climate change on natural and human systems that usually affect people and communities in a negative way (though they could also have beneficial effects).
(climate) impact assessment. The practice o f identifying and evaluating the detrimental and beneficial consequences o f climate change on natural and human systems.
intensity. A measure o f the physical strength o f a damage-causing event, such as a flood.
irrigation. A method o f purposely providing land with water, other than rainwater, by artificial means.
normal year. Any year in which an extreme event, such as drought or flood, does not impact a geographic area.
policies and measures. Means o f addressing the need o f climate adaptation in distinct but sometimes overlapping ways. Policies typically refer to the courses o f action that governments can adopt to change economic and other behaviors through, for example, such instruments as taxation, command-control regulations, market mechanisms, incentives, and information gathering or dissemination. Measures are usually specific actions amenable to implementation, such as reengineering irrigation systems, planting different crops, or initiating a new industry. Many projects can also be termed measures.
resilience. The ability to exploit opportunities, and to resist as well as recover from negative shocks. I t i s also defined as the amount o f change a system can undergo without changing i t s state.
risk (climate related). The result o f the interaction o f physically defined hazards with the properties o f the exposed systems in terms o f their sensitivity or (social) vulnerability. Risk can also be considered as the combination o f an event, its likelihood, and its consequences; that is, risk equals the probability o f a climate hazard multiplied by a given system’s vulnerability (Lim et al. 2005).
runoff. Surface f low occurring when the precipitation rate exceeds the infiltration rate o f the soil or other surface material.
sensitivity. The degree to which a system will respond, either adversely or beneficially, to a given change in climate (or other external pressures).
socioeconomic vulnerability. An aggregate measure o f human welfare that integrates environmental, social, economic, and political exposure to a range o f harmful perturbations. Can also be defined as the sensitivity o f the human system to an exposure to a hazard.
stakeholders. Any persons with interest in a particular decision, either as individuals or as representatives o f a group. This includes people who influence a decision or can influence it, as wel l as those who are affected by it.
thermal expansion. In connection with sea level rise, this refers to the increase in volume (and decrease in density) that results from the warming o f water. A warming o f the ocean leads to an expansion o f the ocean volume and hence an increase in sea level.
vulnerability. See appendix B
xiv
Executive Summary
A. Background to the Study A.1 Climate Variability and Change
1. With alpine conditions, arid deserts and tropical regions, India’s climate is as varied as its landscape. The summer monsoon marks the most important event in the economic calendar o f rural India. Over 70% o f the annual precipitation falls between the months o f June and September and a good monsoon heralds a bountiful harvest and financial security. But when monsoons fail, or are excessive, suffering and economic loss can be widespread. Climate variability has been the source o f both misery and prosperity for much o f rural India. India is already experiencing the effects o f climate variability. I t i s at r i s k o f considerably deeper impacts if climate projections are indicative o f what may actually happen.
2. Recognizing the significance o f climate variability on growth and development, the Government o f India has established a range o f programs, policies and institutions to moderate the impacts o f climate-related risks. These long-standing programs have done much to unleash the development potential o f agriculture and have helped build resilience to climate shocks. India’s disaster management programs rank among the most comprehensive in the world and have achieved considerable success in countering the most severe effects o f extreme events. When floods or drought descend, an elaborate relief machinery springs into operation, with rapidly arranged protective policies that include employment schemes, cash and food disbursements, and emergency health care.
Fiscal Burden of Climate Extremes The extensive re l ie f systems have come at a substantial price on the public purse. Several state governments spend significantly more on relief and damages than on core rural development programs. In the state o f Maharashtra, a single drought (2003) and flood (2005) absorbed more o f the budget (Rs 175 billion), than the entire planned expenditure (Rs 152 billion) on irrigation, agriculture, and rural development from 2002-2007. Climate change i s expected to increase the frequency o f extreme events in ways that are outside the realm o f experience, so relief measures and their financing may not be sustainable, particularly if droughts and floods concomitantly become more severe. This i s already beginning to compromise the effectiveness o f many development programs. Though relief can be strengthened and wil l continue to remain a vital part o f the defense against climate extremes, in the long term there i s a clear fiscal and development imperative to strengthen climate resilience o f the rural economy by addressing the root causes o f vulnerability.
Vulnerability of Agriculture With an emerging gap between the languishing perfonnance o f agriculture and the accelerating growth o f industry, the Government o f India has assigned the highest priority to supporting development in the agriculture sector in the Eleventh Five Year Plan period (2007-2012), with targeted growth o f 4%. However, delivering on the promise o f faster agricultural growth wil l be difficult, given the multiple constraints facing the sector including, fragmented landholdings, inadequate market access and
3.
4.
1
rapidly depleting natural resources. This will be made more challenging by the impacts and consequences o f ongoing and future climate change. For the poor and marginal’ farmers clustered along the poverty line, even small climatic shocks could impose large and irreversible losses, triggering poverty and destitution. Reaching development targets will therefore require priority investments in building the climate resilience o f vulnerable rural communities with a portfolio o f adaptation options that can address climate risks.2
Geographic Diversity: A Further Challenge for Adaptation India’s immense geographic diversity adds to the complexity o f developing an adaptation strategy. Projections indicate that climate variations in India wil l be varied and heterogeneous, with some regions experiencing more intense precipitation and increased flood risks, while others encounter sparser rainfall and prolonged droughts. The impacts will vary across sectors, locations and populations. The implication for a country so diverse i s that broad generalizations on ways to promote adaptation to climate change wil l be misleading. Consequently, there can be no one-size-fits-all approach to developing a climate r i s k management strategy: approaches wil l need to be tailored to fit local vulnerabilities and conditions. All o f this renders adaptation pol icy making complex and difficult.
5.
A.11 Objectives of the Study
6. I t i s in this context that the Government o f India has acknowledged the need to develop adaptation strategies to deal with the possible human tol l and economic costs o f climate variability and change. The aim o f this study i s to assist the government in this endeavor by focusing on selected priorities. The overarching objective o f this report i s to promote the mainstreaming and integration o f climate related risks in India’s development policies and processes, where this is appropriate. The objectives and scope o f work were developed in close consultation with the Ministry o f Environment and Forests as the primary counterpart, a cross-section o f concerned ministries and departments in the central government and in three selected states, and scientific experts from academic, policy and research institutions. In the states, the Department o f Water Resources, Government o f Orissa, and the Department o f Rural Development and Water Conservation, Government o f Maharashtra, supported these assessments, reflecting a multisectoral interest in and demand for adaptation solutions.
The focus o f this report i s on vulnerabilities in natural resources and rural livelihoods, which stand at the front line o f climate change impact^.^ The approach was dictated by government priorities, which indicated the need to (a) assess climate risks to agriculture and livelihoods in areas facing elevated and increasing exposure to droughts and floods; (b) generate better information on current coping and climate risk management strategies in response to droughts and floods; (c) develop and demonstrate the use o f a climate
7.
Marginal farmers are defined as those who own less than 1 acre o f land. 1
* These concerns have been echoed in the Planning Commission’s working documents for the Eleventh Five Year Plan.
The study builds upon and takes forward many o f the recommendations o f an earlier W o r l d Bank assessment o f the impacts o f droughts in the state o f Andhra Pradesh (Wor ld Bank 20069.
2
modeling framework that could be used to identify future climate risks and (d) use the information to assist in developing the key elements o f a forward-looking adaptation plan that can help improve climate resilience and adaptive capacity.
A.111 The Approach
8. Responding to these needs, the assessment is focused on drought-prone regions o f Andhra Pradesh and Maharashtra, and select flood-prone districts in Orissa. The study adopts multiple approaches to meet its objectives:
0 First, it learns lessons from the past and present by gathering statistical information to understand how rural communities in the study areas cope with and build resilience to extreme climate events.
which identifies pol icy and administrative gaps and strengths in addressing climate risks.
magnitude from current climate patterns. So lessons from the past may be o f limited relevance in guiding future policy. Looking forward, the study builds an integrated modeling system ( IMS) to assess future climate r isks and vulnerabilities in the study regions.
promoting adaptation and building climate resilience o f rural communities in the study areas.
The modeling framework used in this study i s a complex but powerful tool that generates information on future climate scenarios and the l ikely impacts on agriculture. The system integrates a climate model with a hydrological water balance model. Together these feed information (on temperature, precipitation, and soil moisture) into an agronomic (crop growth) model that simulates the impacts on crop yields. A custom-built farm-level economic model assesses the financial consequences for farmers and determines cost- effective adaptation strategies. The development o f the farm economic model represents an innovation o f this study and provides a tool that can be used to assess the financial effects o f different policies and scenarios.
Before delving into the main results, a number o f caveats and qualifications are in order. First, neither the issues, nor the locations, examined in this report are intended to provide an exhaustive account o f adaptation to climate variability and change in a country as large and varied as India. With a focus on droughts and floods, the case studies are indicative o f “hotspots” and regions at the edge o f climate tolerance limits. These zones constitute about one-third o f the country comprising many o f the “lagging regions” with a large population, who are disproportionately poor, and most at risk from climate change. There are other regions such as the fragile Himalayas, the biodiverse Western Ghats, the vast coastal areas, and the prolific agricultural lands o f the Gangetic plains that are not covered in this study and need to be considered in subsequent work.
Second, as in al l matters relating to climate change, there are long and uncertain time frames. Forecasting climate events, or the economy, even a few years into the future remains an imprecise and hazardous exercise. By its nature the analysis o f climate change
0 This i s complemented by a review of governmental programs and institutions,
0 The impacts o f climate variability and change are projected to differ in kind and
e Finally, the report synthesizes the results and articulates a way forward for
9.
10.
11.
3
must look ahead many decades. The model projections should be interpreted with caution and viewed as indications o f the possible direction and magnitude o f changes rather than as precise forecasts. Despite these uncertainties, policy makers are compelled to respond to climate r isks and make decisions on matters that will be affected by future climate events. Modeling exercises can help pol icy makers to generate informed decisions based on scientific assessments o f risks, outcomes, and policy impacts. Nevertheless, it needs to be emphasized that model simulations are not predictions but scenarios based on a host o f assumptions.
B. B.1
Coping with and Adapting to Drought Conditions Consequences of and Responses to Drought
12. India has a long history o f addressing droughts, so the study begins by exploring how farmers in selected drought-prone areas o f Andhra Pradesh and Maharashtra are affected by and respond to droughts. The immediate consequence o f drought i s a predictable and often precipitous decline in agricultural production and income. This igni tes an ominous chain o f events - indebtedness, distress sales, asset depletion, and deteriorating health - all o f which perpetuate poverty and deprivation. However, in any community certain households are less affected by drought than others, irrespective o f landholding, wealth, or location.
13. What explains why some exhibit greater resilience to drought than others? The answer lies in the interplay o f key factors: the availability o f water, a critical farm input; economic incentives that shape the way farmers react to climate risks; and the opportunities created by pol icy and circumstance. Among these the following variables are found to have a disproportionate bearing on vulnerability to droughts:
Reliable irrigation supplies, in particular groundwater, can provide insurance against income losses due to meager rainfall. Beyond this self-evident link, the assessment finds more nuanced impacts. The availability o f irrigation supplies tends to promote greater reliance on lucrative and water-intensive crops such as rice and sugarcane. If irrigation supplies are assured through a drought, then agricultural incomes are protected. Conversely, when water sources become depleted there is a more dramatic fal l in incomes, with debilitating consequences. In broad terms, holding other factors constant, a household with access to irrigation during a drought year in Andhra Pradesh earns about 50% more income. The clear implication is that judicious and sustainable water use can provide an indispensable buffer against deficient rainfall. For this to occur there i s an overwhelming need to tackle the unrestrained competition for groundwater. . Household indebtedness is another major consequence o f drought in communities facing heightened climate r i sks in areas with degraded and scarce natural resources. The assessment finds that once encumbered by high debt, households are locked into agriculture and remain more exposed to climate risks. Obvious remedies such as debt-forgiveness schemes may help to appease suffering, but they do not address one o f the root causes o f the problem - an overreliance on rainfall-dependent sources o f income. This suggests scope for
4
introducing cost-effective pol icy instruments that simultaneously tackle the problem o f indebtedness and provide incentives for j ob mobility.
Finally, the provision o f local public goods, notably infrastmcture and education, provide opportunities for income diversification, thereby limiting the exposure to drought risks. Infrastructure and education in climate-vulnerable communities yields a double dividend - they generate well-recognized development benefits in the near term and simultaneously build resilience to drought in the longer term. In particular education exhibits increasing returns in building climate resilience, whereas infrastructure stimulates economic activity and enhances employment and business opportunity. The pol icy implication is that climate vulnerabilities need to be integrated into decisions that guide the location and design o f public investments and infrastmcture.
.
B.11 14.
Future Prospects for Drought-Prone Regions under Climate Change What does future climate change hold for these regions? The modeling framework developed in this study i s used to generate projections o f climate events based on two commonly used emission scenarios developed by the Intergovernmental Panel o n Climate Change (IPCC) for the period 2070-2100.4 The assessment distinguishes between the influence o f climate on agriculture, from other possible shifts in the economy (such as prices, economic structure and te~hnology).~ The projections find considerable variability o f impacts across regions and crops. In dry areas most crops respond favorably to higher precipitation and elevated levels o f carbon dioxide (termed carbon fertilization). But these can be offset by higher temperatures. The net effect i s determined by the magnitude o f changes and baseline conditions.
Drought-Prone Districts of Andhra Pradesh In the arid study regions o f Andhra Pradesh the climate projections indicate substantially higher temperatures (2.3"C -3.4"C, on average) and a modest but more erratic increase in rainfall (of about 4% to 8% at the basin level). With high prevailing baseline temperatures these changes generate deteriorating agroclimatic conditions, with declining yields for the major crops (rice, groundnut, and jowar). Though al l yields decline, conditions are more favorable to groundnut, which is already prevalent in the area, reflecting farm-level adjustments to arid conditions. Despite groundnut's suitability to these harsh conditions there are well-recognized risks that prolonged monocropping brings: pests, disease, and fertility loss. Projections suggest that declining yields o f major dryland crops are mirrored in lower agriculture incomes. In the harsher climate change scenarios, farm incomes could decline substantially (by over 20%), suggesting that agriculture as currently practiced may not be capable o f sustaining large populations on
15.
The f i rst (termed A2) depicts a gloomy and pessimistic world where high greenhouse gas emissions result in severe climate change. The other (termed B2) emphasizes sustainability, global cooperation, and lower greenhouse gas emissions.
Damages due to changes in climate would call for different remedies from impacts due to variations in economic conditions. Hence the study presents results for key climate change scenarios, holding economic and technical factors constant. I t then tests the l imi ts and sensitivity o f the projections by allowing for wide changes in economic and technical variables. The report focuses on results that appear robust to substantial variations in parameters.
4
5
small rain-fed farms. Recognizing these limits the Government o f Andhra Pradesh has initiated numerous programs to encourage agricultural and occupational diversification and a forward-looking drought adaptation program supported by the World Bank.
Drought-Prone Districts of Maharashtra
The drought-prone belt in Maharashtra (specifically Nashik and Ahmednagar districts) offers a striking contrast. The climate projections suggest a significant, though more variable, increase in rainfall (approximately 20% to 30% at the basin level) accompanied by higher temperatures o f about 2.4"C to 3.8"C, on average. As a result the yield o f several dryland crops (including the millet varieties o f jowar and bajra) exhibit small improvements and provide a measure o f re l ie f to rain-fed farmers with a boost o f about 8% to 15% in incomes. Prospects for other crops are less certain. Sugarcane i s widely grown on irrigated farms in arid regions o f the state. Under the climate change scenarios sugarcane yields are expected to decline considerably (by nearly 30%) as a result o f increased heat stress caused by the warmer climate.
Negative trends in sugarcane production are already visible across the state. Sugarcane i s generously subsidized and has been implicated in the overabstraction o f groundwater. There is mounting evidence o f a significant reduction in the output and yields, due in part to increasing levels o f environmental degradation. Climate change pressures would reinforce the many current benefits from encouraging a shift from sugarcane to less water intensive crops.
16.
17.
C. 18.
Elements o f a Strategy for Adaptation to Drought Conditions I s there a need for additional policy and public investments to promote adaptation to climate change? Vulnerabilities to climate extremes and change are often related to poverty. So i t may be argued that as India grows more prosperous, i t will inevitably build greater resilience to climate risks. The myriad government programs that deal with education, infrastructure, and job creation also serve a complementary objective o f reducing community exposure to climate risks. In this context, adaptation pol icy can be viewed as an adjunct to good development policies that promote equitable growth. All o f this might suggest that adaptation to climate change requires no additional pol icy priority or interventions.
There are, however, high r isks associated with complacency that could magnify the costs o f climate variability and change. The projections in this report suggest a considerable and mounting human to l l from climate change and highlight the need and urgency for mitigating the avoidable costs, particularly among the vulnerable sections o f society. Incomes on the small rain-fed farms in Andhra Pradesh could decline by 5% under modest climate change and by over 20% under harsher conditions, bringing farmers closer to, and in many cases under, the poverty line. The escalating fiscal strain o f the current drought relief system reinforces the need to tackle the root causes o f drought vulnerability as a priority in the development process.
This report suggests that building greater climate resilience requires a combination o f measures packaged with the right incentives and implemented at multiple levels o f government (local, state, and national). Reactive or singular approaches to droughts, such as relief and emergency assistance or debt r e l i e f alone for that matter, are essential to
19.
20.
6
appease suffering, but could generate perverse incentives that perpetuate climate risks and impede appropriate adaptation. Consequently these should be complemented with a combination o f other initiatives that promote longer-term climate resilience.
C.1 Policy Approaches
Policies to Build Adaptive Capacity and Resilience to Climate Risks 2 1. A strategy to build climate resilience and ignite growth needs to take account o f a
region’s comparative advantage, resource constraints, and the impending changes brought about by climate. The exact policies and interventions wil l differ by location and circumstance, with emphasis given to four overarching strategies: (a) the need for pol icy and investment decisions to be based on sound scientific knowledge o f risks, calling for the use o f diagnostic risk assessment tools to generate policy-relevant information; (b) innovations and reforms in agriculture and water management that promote more climate resilient cropping systems; (c) cost-effective and efficient management o f climate r isks to promote income diversification through economic instruments; and (d) institutional structures to facilitate these changes. These strategies are formulated on the basis o f the study findings in combination with a review o f the literature and a consultative process with government officials and NGOs, and are discussed below.
Strengthening Climate Risk Information and Tools to Match Needs
Climate change wil l have heterogeneous and spatially variable impacts. The first step in building adaptation policy i s to identify vulnerabilities and risks to determine priorities for investment and policy. A recent Bank assessment has also emphasized the need for such informed decision making (World Bank 20060.
There are two immediate areas where climate risk information i s required:
22.
23. 0 First, climate change could have important ramifications for assets with long lead
times and long design lives. The location, construction and refurbishment o f these wil l need to incorporate climate risk information. This i s particularly important for arid regions where changing water flows or rainfall patterns could require modification or relocation o f vital irrigation infrastructure.
infrastructure) play a powerful role in enhancing climate resilience. Consequently climate r isks need to be integrated into pol icy decisions in these sectors, calling for the use o f diagnostic r i s k assessment tools to determine how much to invest and where to invest.
The capacity to generate this information rests with national research centers, while the need and demand for the information l i e with affected communities and the government. This argues in favor o f a recent suggestion by the Planning Commission to build a climate information system at the national level to disseminate information for planning and management to end users (Planning Commission 2007). This initiative will also need to be supported by improved meteorological information at the subbasin and local levels (blocks and subblocks) to improve forecasting and monitoring capabilities.
0 Second, the assessment finds that local public goods (notably education and
24.
7
Innovation and Reforms in Agriculture
Water Management
In drought-prone areas water scarcity i s the limiting factor o f production and plays a key role in shaping the fortunes o f agriculture. Much has been done across the country to address water shortages, with a particular focus on supply-side remedies, including large infrastructure, watershed, rainwater harvesting and water conservation programs, and a host o f community initiatives. However, water management s t i l l remains a formidable challenge. The climate change projections indicate that even when farmers have largely adapted to arid cropping patterns, increased demand and consequent water stress could severely jeopardize livelihoods and diminish agricultural productivity. There is an overwhelming case for more aggressively pursuing water conservation in semi-arid and arid regions. Greater attention must be given to hybrid approaches that emphasize the efficiency o f groundwater use and increase the effectiveness o f watershed activities to conserve soil moisture and harvest water. Such measures are not a substitute for pricing policies and water policy reform, which would need to focus on the demand side, for example by strengthening incentives and controlling groundwater demand at the wider geographic scale necessary for effective management. However, they provide interim and feasible measures for reducing vulnerabilities (DFID 2005a).
Research and Extension
25.
26. The study makes a strong case for a shift in agricultural systems in order to overcome future climate change pressures. I t i s clear that small and medium farmers in dryland areas will need greater support with knowledge and policy assistance to make this transition work on a large scale. Much is already occurring across the country and there i s research in dryland farming for rice, horticulture and numerous other crops. Strengthened support for agricultural research and extension i s essential to promote more sustainable modes o f dryland farming. This could include looking at opportunities in farm services associated with low costs o f production and intensifying ago-forestry and livestock- based production systems suitable to dryland areas, among others.
“Smart Subsidies” and Incentives
In the medium to near term, alternative mechanisms are needed to deliver support to farmers more effectively, with the resulting savings being used to increase public investment in ways that reduce the exposure to climate risks. This would also require complementary measures that address the farm-level incentives (including subsidies and regulations) that have implici t ly encouraged the production o f water-intensive crops (such as sugarcane) in arid regions. Experience elsewhere suggests that the use o f interim smart subsidies may offer a pragmatic way to shift incentives and, thus, cropping patterns to modes that are better suited to agroclimatic conditions. Smart subsidies recognize that there are costs to altering cropping patterns and provide incentives to change the crop mix by shifting support from environmentally degrading activities to more benign forms o f production. As an example, moving price support from water-intensive agriculture to dryland crops could help counteract the current incentives to cultivate water-thirsty crops.
27.
8
28.
29.
30.
Financial and Economic Instruments to Promote Income Diversification In semi-arid and arid areas where the natural productivity o f agriculture i s low and threatened by droughts, income diversification remains the most obvious and effective way o f reducing exposure to climate risks. This brings new and unfamiliar transition risks to farmers that can be tackled through a variety o f financial incentives that facilitate the shift to nonfarm activities and promote j ob diversification.
Debt Relief Coupled with Other Instruments
Farmer indebtedness i s among the major impediments to occupational mobility. An important priority and challenge for pol icy i s to find cost-effective ways o f reaching poorer farmers to help reduce their r i s k exposure. Coupling debt rel ief with new risk mitigation instruments is an obvious way to prevent a debt-induced poverty trap. Two innovations merit further pol icy consideration and scrutiny:
0 The rel ief o f old debt could be coupled with the provision o f capital for a new business. This would simultaneously reduce indebtedness and lower the transaction costs o f occupational shifts by providing new opportunities. The myriad ongoing micro-credit schemes provide a vehicle to pi lot such schemes.
the initial r isks o f shifting from farming to other businesses and provide protection against new and unfamiliar sources o f risk.6
0 A variant o f this approach would have debt re l ie f coupled with insurance to cover
Institutional Change: Convergence and Synergy between Programs There are a large number o f central- and state-sponsored programs for addressing drought r isks that are implemented under different guidelines and by various implementing and coordinating agencies. Synergies between these programs could be enhanced through an integrated approach to coordinate priorities and fill gaps in these programs. This remains a challenging task, as i t requires considerable institutional dexterity to synchronize diverse programs managed at different levels o f government within a common framework. There are several institutions at the central level, including the National Rainfed Area Authority and National Disaster Management Authority, that are capable o f assuming the role o f an apex coordinating agency whose convening power could be harnessed to coordinate the different planning and implementation processes. Furthermore, enlarging existing schemes, such as the state Employment Guarantee Scheme (EGS) and the National Rural Employment Guarantee Scheme (NREGS) to include resilience-building activities would be a fruitfbl pol icy measure to encourage sustainable farming systems in rain-fed areas. Finally states could build in a adaptatiodclimate change dimension into the district agricultural plans7 which would go a long way in mainstreaming the climate risk management agenda as wel l as creating
Variants o f both approaches are suggested in World Bank 2006f.
The National Development Council Resolution o f May 2007 under the chairmanship o f the Prime Minister o f India gives high priority to incentivising states to develop comprehensive district agricultural plans that w i l l include livestock, fishing, minor irrigation, rural development works and other schemes for water harvesting and conservation.
9
enabling conditions for translating the recommendations o f the report into actions on the ground.
D. D.1 31.
Climate Change and Vulnerability to Floods Consequences of and Responses to Floods
Floods are a natural feature o f India’s river basins. They replenish groundwater, deliver topsoil and nutrients to support agriculture in otherwise infert i le regions, and sustain valuable ecosystems. Excessive flooding poses risks to human l i f e and is a major contributor to the poverty and vulnerability o f marginalized communities. I t is estimated that the flood-affected area has more than doubled in size from about 5% (19 mi l l ion hectares) to about 12% (40 mi l l ion hectares) o f India’s geographic area in the past five decades. This has occurred despite generous and rising government spending on a multitude o f flood protection programs.
Orissa i s among the most flood-affected states in the country. Frequently i t has coped with simultaneous droughts in one part o f the state and extensive floods in another, as wel l as with cyclones and other natural calamities. Two flood-prone districts - Puri and Jagatsinghpur - are the focus o f this study. Households in the study areas endure harsh conditions. Villagers are accustomed to moving homes and losing crops and property because o f flood. Livelihoods and occupations have responded and adjusted to the predictable r isks o f flood damage. Rice, which i s among the most flood-resistant o f crops, dominates agriculture. There i s also an emphasis on cultivation in the dry rabi months, when flooding can often improve yields by delivering nutrients and soil moisture.
The communities have diversified into a range o f more flood-resilient activities, such as aquaculture, fishing, dairy, and petty business, though the scale o f these activities i s s t i l l minor. Despite significant levels o f adaptation, floods continue to disrupt and devastate communities, with the impact bearing disproportionately upon the poorer segments o f the community (the small farmers and the landless). Even when the poor diversify into nonagricultural activities, they remain more vulnerable to floods. W h i l e the nonagricultural income o f the large landholders falls by a meager 5% in a flood, that o f the landless declines by about 14%, reflecting their fragile economic status as unskilled, casual workers.
Future Prospects for Flood-Prone Areas under Climate Change
Adding to these already high risks, the climate projections suggest that temperatures, precipitation, and flooding are likely to increase, with adverse impacts on crop yields and farm incomes. Among the more substantial effects i s a spatial shift in the pattern o f rainfall towards the already flood-prone coastal areas. Climate change i s also projected to bring a dramatic increase in the incidence o f flooding. As an example o f the implied magnitudes, the probability that the discharge might exceed 25,000 cubic meters per second (cumecs) (at the measuring station at Naraj on the Mahanadi River in Orissa), i s currently low - about 2%. But under climate change, this is projected to rise dramatically to over 10%. This suggests a clear need for improved and accurate forecasting tools to guide the appropriate location and design for flood protection infrastructure and other high-value assets.
32.
33.
D.11 34.
10
35. In the study districts o f Pun and Jagatsinghpur, the assessment finds that rice yields could decline by 5% to 12% and profits by 6% to 8% under climate change. With the dominance o f rice and high levels o f preadaptation to floods, there is little that can be done to build flood resilience through adjustments in cropping patterns and farming practices. There i s a need to further strengthen current flood protection initiatives and develop a proactive, comprehensive, and anticipatory flood management strategy.
Orissa has established a wide-ranging flood management pol icy with an emphasis on re l ie f and protection. When floods strike, an elaborate re l ie f machinery provides employment, cash, food, health care, and shelter. There is also a comprehensive action plan that envisions a host o f structural measures such as a cascade o f reservoirs, dams, raising and strengthening o f embankments, and interbasin transfer o f water. Despite the substantial fiscal burden o f the flood r e l i e f and protection system floods continue to encumber livelihoods and impede development. With the prospect o f much more severe and intense flooding under climate change, i t is necessary to ask how the system could be strengthened to build greater flood resilience in communities.
There is no single remedy for mitigating flood damage and site-specific measures are required to address particular vulnerabilities. Experience suggests the need to integrate hard and soft engineering approaches through three components:
36.
37.
0 Advanced systems for the detection and forecasting o f floods;
Anticipatory and proactive actions designed to minimize flood risks and build
Reactive actions that deal with the aftermath o f floods and include compensation
0
capacity to withstand flood events;
and relief. 0
E. E.1 38.
Elements of a Strategy for Building Flood Resilience Strengthening Systems for Detection and Forecasting Floods With the projected future changes in the spatial distribution, intensity, and frequency o f floods more advanced forecasting and risk diagnostic tools will be needed to guide the location o f high-value investments and the engineering design o f flood protection structures. The system’s effectiveness could be enhanced by combining data collection, telemetry, flood forecasting, and flood warnin! elements into one integrated f lood management and information system for a basin. Flood inundation mapping i s another important planning tool that i s needed to guide zoning and investment decisions, but its use across India i s limited. There is growing recognition in Government o f India that generating such information should be a high policy priority.
As an example the Hirakud Dam, which i s the main control structure on the Mahanadi, was originally designed for a flood o f 42,500 cumecs, whereas more recent calculations indicate that the maximum probable flood i s 69,500 cumecs. Floods need to be partially regulated by advance reservoir depletion, which may have impacts on water availability for irrigation, and this in turn calls for a basinwide flood forecasting and management system.
8
11
E.11 39.
40.
41.
42.
43.
44.
Strengthening Anticipatory Measures Although technology can help detect and even forecast floods in a timely way, the information needs to be integrated into planning and policy for longer-term measures that reduce (a) the magnitude o f the flood; and (b) vulnerability to a flood o f any given magnitude.
The Assault on Floods: Importance of Structural Protection
Structural defenses are an indispensable tool in controlling flood damage, but with prohibitive costs and design limits they cannot offer full protection. Economic considerations argue for an emphasis towards the protection o f the higher-value assets (for example urban areas, infrastructure), with greater importance given to building adaptability and flood resilience elsewhere. I t i s unlikely that floods can be totally subdued, so careful monitoring and planning o f new settlements in these flood-prone areas must remain a priority for government authorities. This has been recognized in a number o f reportsg. There is a need to strengthen incentives and institutional systems for strategic asset management so that infrastructure investments are rendered more sustainable. This must be accompanied by changes in budget priorities to enhance community resilience to floods.
The Accommodation of Floods: Importance of Nonstructural Resilience Building
Building flood resilience in agriculture. Flood-resilient agriculture provides a way to insulate incomes against flood damage. Numerous pilots have been attempted with more rainfall-tolerant or short-duration varieties o f certain crops to minimize flood-related losses. Though economically viable solutions remain elusive, these initiatives have potential and warrant continuing support and dissemination. A further shift in agriculture to the dry (rabi) season could be promoted by increasing access to irrigation in the dry months.
Income diversification. Income diversification provides a robust way o f mitigating flood risks. The economic instruments that are relevant for encouraging income diversification for drought management - such as credit and insurance schemes linked to j ob diversification - are equally pertinent in the context o f floods. The spread o f self-help groups in Orissa provides a potential community base for launching such schemes.
Adapting to floods. There are already numerous and successful pilots in Orissa that aim to promote flood-based livelihoods. This i s the quintessential form o f flood adaptation. With the escalating demand for fish in India, aquaculture has considerable promise for unleashing rural growth. To further develop this potential there i s a need to address supply chain obstacles to improve the marketing o f a highly perishable commodity.
Primacy of planning and zoning. The combined pressures o f rapid population growth, land scarcity, and intensifying flood r isks call for strengthened and more careful planning and flood zoning. Land use planning and water management need to be combined into a synthesized plan with coordination between various departments and levels o f
These include a World Bank report on the Northeast (World Bank 2007a) and numerous government documents including: Planning Commission 2002; Planning Commission 2001; and Shukla 1997.
12
government. A greater challenge i s the implementation o f a plan that would affect many interests and would need processes that involve public participation and stakeholder engagement.
F. Conclusions and Recommendations: 45. With an ambitious growth target o f 8% to 10% for the medium term, the Government o f
India recognizes that accelerating the productivity and sustainability o f the agricultural sector will be a prerequisite to achieving i t s poverty reduction and development goals. The challenges are substantial and will call not only for the familiar investments in agriculture (such as price stability, connectivity, marketability and irrigation), but also for addressing the new and unprecedented risks emerging from climate change. This report demonstrates that climate change wil l continue to affect the lives and production systems o f the millions in India who reside in high-risk rural areas, with a mounting human tol l that falls disproportionately upon the poor. Consequently there i s an urgent need for action now to avoid higher future costs and missed opportunities associated with a development path that compromises on climate risk management. Fostering a shared vision o f the nature o f climate change and the implications for the country’s development prospects will be critical in catalyzing a policy commitment and also helping to integrate climate risks in development programs over the coming decades.
Fortunately, many o f the pol icy actions required to build resilience to the impending changes in climate are wholly consistent with, and supportive of, current development objectives. Adaptation actions and investments provide a cost-effective way o f addressing future climate risks. India has considerable technical and scientific expertise to understand, analyze and act upon climate risks. There are many encouraging initiatives and policy reforms that are moving in the right direction. These provide an ideal foundation for developing a comprehensive strategy for promoting adaptation to climate change and building systemic resilience in vulnerable communities. The table on the next page summarizes the pol icy actions and interventions suggested by the study.
46.
13
Summary Recommendations for Adaptation"
Strengthening publicly accessible climate information systems/mechanisms and related management tools to match needs
Establish a climate information management system at central level for developing climate diagnostic and risk assessment tools with feedback mechanisms to end users. This would include: enhanced data collection systems at local level, hydrogeological data collection, information for groundwater management, and systems for improved detection and forecasting o f floods.
Build climate risk assessment as a requirement for a l l relevant high value and long-lived infrastructure projects.
Fostering climate-resilient reforms in agriculture and water resource management
Promote agricultural research and extension services towards systems and cultivars better suited to local climate and i t s variabil ity
Targeted implementation and development o f basin level water resource management integrating groundwater resources and applying instruments that deliver economic, social and legal incentives to increase water productivity, using participatory approaches where appropriate
Supporting the management of climate risks through economic mechanisms and instruments that promote efficiency
Explore new innovative financial instruments to promote
9 d e b t rel ief instruments coupled with credit for j o b
>debt rel ief coupled with insurance for new business
> community-based r isk financing schemes
income diversification, such as
diversification
risks
Introduce interim smart farm subsidies to encourage switch to more suitable and climate resilient cropping practices
Expected Outcomes
Baseline information for the integration o f climate risks into policy, planning and investment decisions
Promote climate resilience o f agriculture and reduce risks
Promote income and j o b diversification to reduce climate vulnerability
''A number o f recent projects supported by the Wor ld Bank have incorporated some elements o f these recommendations in operations. Examples include: the Hydrology I (1 995 - 2003), which focused o n nine states including Andhra Pradesh, Maharashtra and Orissa), Hydrology I1 (2004 - 2010), which currently covers five n e w states. These include enhanced information systems as project components. The National Agriculture Innovation Project (2006 - 2012) and the National Agriculture Competitiveness Project (under preparation at the t ime o f writing) recognize and build in elements o f climate risk.
14
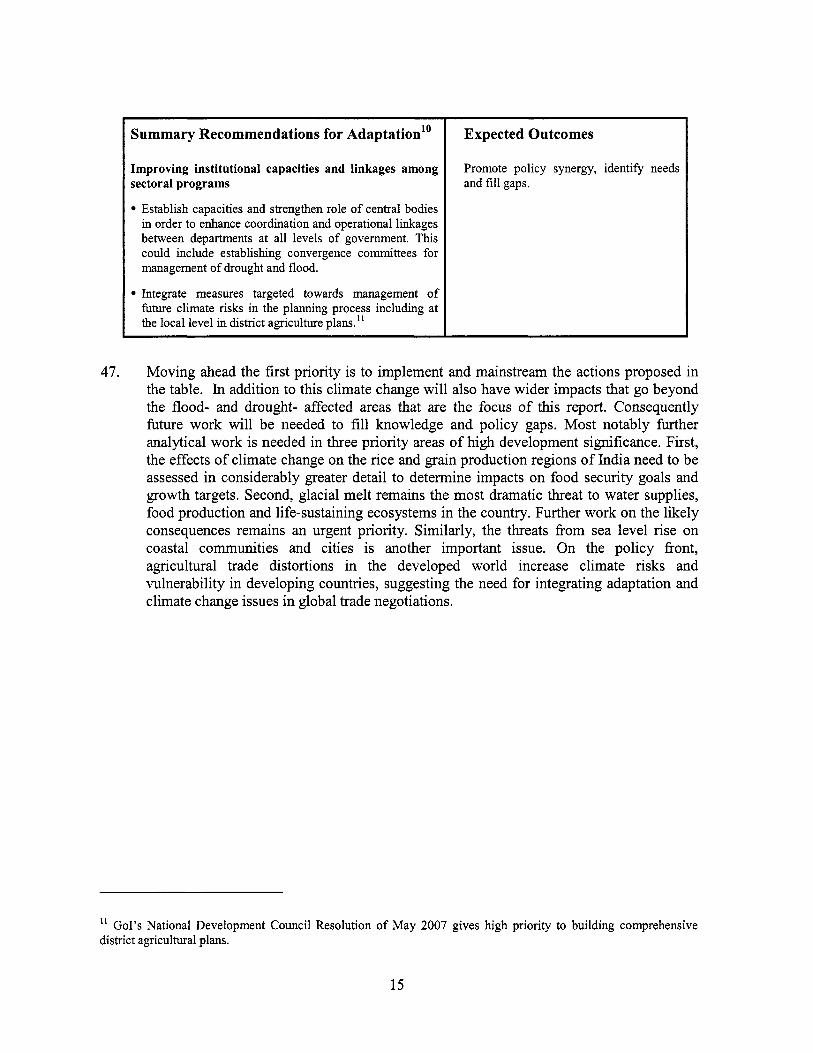
Summary Recommendations for Adaptation" Expected Outcomes I I Improving institutional capacities and linkages among sectoral programs
Establish capacities and strengthen role o f central bodies in order to enhance coordination and operational linkages between departments at al l levels o f government. This could include establishing convergence committees for management o f drought and flood.
Integrate measures targeted towards management o f future climate r isks in the planning process including at the local level in district agriculture plans."
Promote policy synergy, identify needs and f i l l gaps.
47. Moving ahead the f i rst priority is to implement and mainstream the actions proposed in the table. In addition to this climate change wil l also have wider impacts that go beyond the flood- and drought- affected areas that are the focus o f this report. Consequently future work wil l be needed to f i l l knowledge and pol icy gaps. Most notably further analytical work i s needed in three priority areas o f high development significance. First, the effects o f climate change on the rice and grain production regions o f India need to be assessed in considerably greater detail to determine impacts on food security goals and growth targets. Second, glacial melt remains the most dramatic threat to water supplies, food production and life-sustaining ecosystems in the country. Further work on the likely consequences remains an urgent priority. Similarly, the threats from sea level r ise on coastal communities and cities is another important issue. On the policy front, agricultural trade distortions in the developed world increase climate r isks and vulnerability in developing countries, suggesting the need for integrating adaptation and climate change issues in global trade negotiations.
" GoI's National Development Council Resolution o f May 2007 gives high priority to building comprehensive district agricultural plans.
15
1. Introduction, Context, and Objectives
1.1 Introduction 1. Adapting to climate variability and change has long been part o f the human development
agenda. Countries and dynasties have risen and fallen because o f climate-related issues, particularly those associated with the scarcity o f natural resources.12 However, the current pace o f change in the world’s climate is unprecedented in recent human history and experiences accumulated to date are unlikely to be sufficient to provide a clear way forward. The challenges will be particularly acute in developing countries, where large and still growing populations l ive in high-risk areas or rely on rain-fed lands for their livelihoods.
Recognizing the significance o f climate variability for growth and development, the Government o f India has established a range o f programs, policies, and institutions that have reduced the exposure o f rural populations to climate risks. These long-standing programs have done much to unleash the development potential o f agriculture. India has achieved i t s food security goals, produced a food surplus and developed much prosperous farming communities. Policies have also helped to build resilience to extreme climate events over the years: when floods or droughts descend, the numerous rel ief programs provide a safety net for the poor and assure a more rapid recovery. India’s disaster management programs rank among the most comprehensive and effective in the world. However, accelerating climate change i s expected to increase the frequency o f extreme climate events in ways that are outside the realm o f experience. Therefore, there i s a need to address the costs associated with climate change, emphasizing complementary policies and actions that can integrate climate resilience and enhance the sustainability o f rural livelihoods.
I t i s in this context that the Government o f India has acknowledged the need to develop a strengthened information base to assist in planning and mitigating the consequences o f increased climate variability and change. India’s Ministry o f Environment and Forests i s preparing i t s second formal communication on climate change, reflecting i t s commitment to the United Nations Framework Convention on Climate Change (UNFCCC).’3 Further, in articulating i t s Eleventh Five Year Plan, the Planning Commission o f India has recognized the need for proactive adaptation, particularly in the agricultural sector, which stands to be most affected by climate change (Planning Commission 2007). The objective o f this study i s to assist the Government o f India in these endeavors. The study focuses on three particularly vulnerable states - Andhra Pradesh, Maharashtra, and Orissa. The main audience for the study i s therefore the Government o f India and the three state governments involved in the process.
The focus o f this report is on vulnerable rural communities that face current and h t u r e risks from extreme and frequent droughts and floods. The study aims to develop the elements o f an adaptation strategy that would assist in a better integration o f climate risk
2.
3.
4.
See Diamond 2005. 12
l3 This i s the Second National Communication on Climate Change to the UNFCC.
16
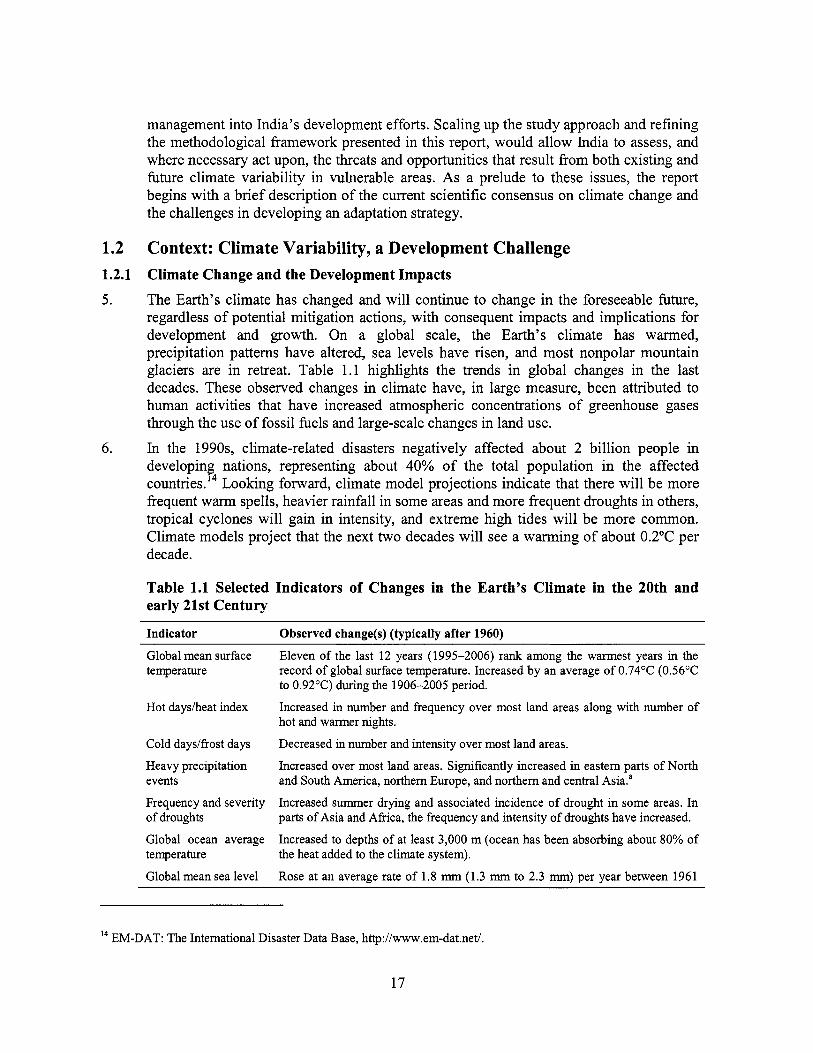
management into India's development efforts. Scaling up the study approach and refining the methodological framework presented in this report, would allow India to assess, and where necessary act upon, the threats and opportunities that result from both existing and future climate variability in vulnerable areas. As a prelude to these issues, the report begins with a br ief description o f the current scientific consensus on climate change and the challenges in developing an adaptation strategy.
1.2 1.2.1 5.
Context: Climate Variability, a Development Challenge Climate Change and the Development Impacts The Earth's climate has changed and wil l continue to change in the foreseeable future, regardless o f potential mitigation actions, with consequent impacts and implications for development and growth. On a global scale, the Earth's climate has warmed, precipitation patterns have altered, sea levels have risen, and most nonpolar mountain glaciers are in retreat. Table 1.1 highlights the trends in global changes in the last decades. These observed changes in climate have, in large measure, been attributed to human activities that have increased atmospheric concentrations o f greenhouse gases through the use o f fossil fuels and large-scale changes in land use.
In the 199Os, climate-related disasters negatively affected about 2 bi l l ion people in developing nations, representing about 40% o f the total population in the affected c~un t r i es . ' ~ Looking forward, climate model projections indicate that there will be more frequent warm spells, heavier rainfall in some areas and more frequent droughts in others, tropical cyclones wil l gain in intensity, and extreme high tides wil l be more common. Climate models project that the next two decades will see a warming o f about 0.2"C per decade.
6.
Table 1.1 Selected Indicators of Changes in the Earth's Climate in the 20th and early 21st Century
Indicator Observed change(s) (typically after 1960)
Global mean surface temperature
H o t daysheat index
Cold daydfrost days
Heavy precipitation events
Frequency and severity o f droughts
Global ocean average temperature
Global mean sea level
Eleven o f the last 12 years (1995-2006) rank among the warmest years in the record o f global surface temperature. Increased by an average o f 0.74"C (0.56OC to 0.92OC) during the 1906-2005 period.
Increased in number and frequency over most land areas along with number o f ho t and warmer nights.
Decreased in number and intensity over most land areas.
Increased over most land areas. Significantly increased in eastern parts o f N o r t h and South America, northern Europe, and northern and central Asia.'
Increased summer drylng and associated incidence o f drought in some areas. In parts o f Asia and Africa, the frequency and intensity o f droughts have increased.
Increased to depths o f at least 3,000 m (ocean has been absorbing about 80% o f the heat added to the climate system).
Rose at an average rate o f 1.8 mm (1.3 mm to 2.3 mm) per year between 1961
~~~
EM-DAT: The International Disaster Data Base, http://www.em-dat.net/. 14
17
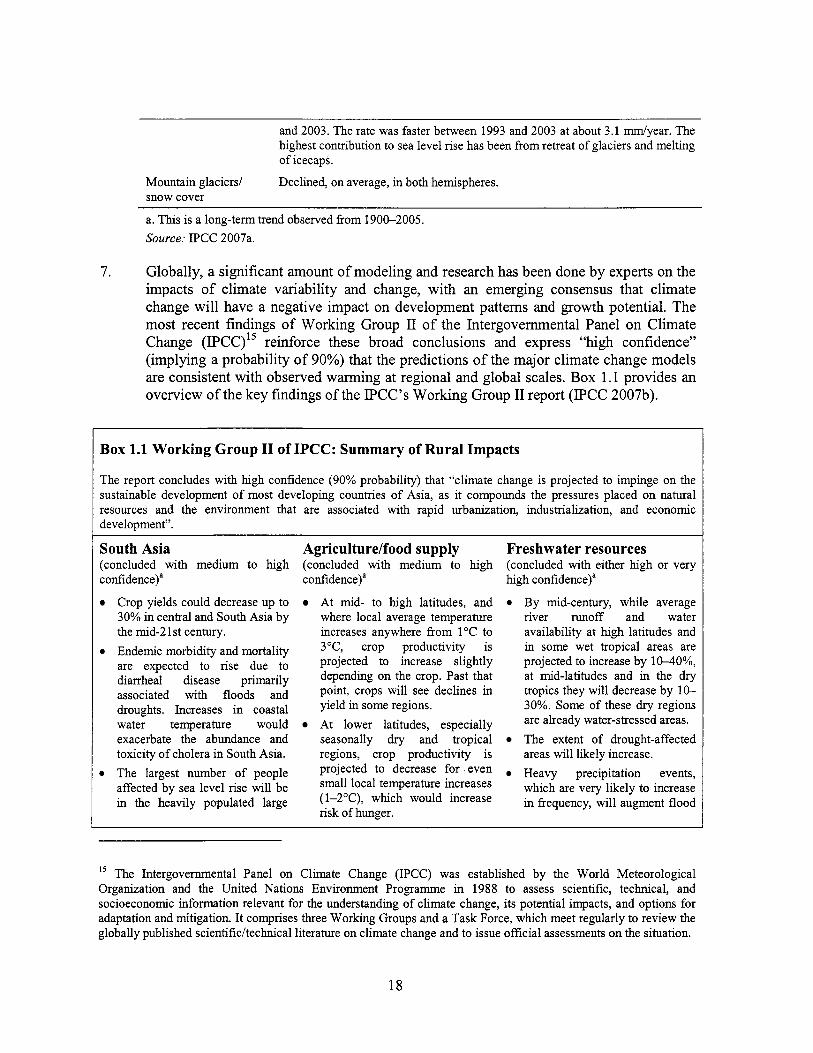
7.
and 2003. The rate was faster between 1993 and 2003 at about 3.1 &year. The highest contribution to sea level rise has been f rom retreat o f glaciers and melting o f icecaps.
Declined, o n average, in both hemispheres. Mountain glaciers1 snow cover
a. T h i s i s a long-term trend observed f rom 1900-2005. Source: IPCC 2007a.
Globally, a significant amount o f modeling and research has been done by experts on the impacts o f climate variability and change, with an emerging consensus that climate change will have a negative impact on development patterns and growth potential. The most recent findings o f Working Group I1 o f the Intergovemmental Panel on Climate Change (IPCC)” reinforce these broad conclusions and express “high confidence” (implying a probability o f 90%) that the predictions o f the major climate change models are consistent with observed warming at regional and global scales. Box 1.1 provides an overview o f the key findings o f the IPCC’s Working Group I1 report (IPCC 2007b).
Box 1.1 Working Group I1 of IPCC: Summary of Rural Impacts
The report concludes with high confidence (90% probability) that “climate change i s projected to impinge o n the sustainable development o f most developing countries o f Asia, as it compounds the pressures placed o n natural resources and the environment that are associated with rapid urbanization, industrialization, and economic development”.
South Asia (concluded with medium to high confidence)a
Crop yields could decrease up to 30% in central and South Asia by the mid-2 1 st century. Endemic morbidity and mortality are expected to rise due to diarrheal disease primarily associated with floods and droughts. Increases in coastal water temperature would exacerbate the abundance and toxicity o f cholera in South Asia. The largest number o f people affected by sea level rise wil l be in the heavily populated large
Agriculture/food supply (concluded with medium to high confidence)a
At mid- to high latitudes, and where local average temperature increases anywhere f r o m 1°C to 3”C, crop productivity i s projected to increase slightly depending o n the crop. Past that point, crops will see declines in yield in some regions. At lower latitudes, especially seasonally dry and tropical regions, crop productivity i s projected to decrease for even small local temperature increases (1-2”C), which would increase risk o f hunger.
Freshwater resources (concluded with either h igh o r very high confidence)a
By mid-century, while average r iver runof f and water availability at h igh latitudes and in some wet tropical areas are projected to increase by 10-40%, at mid-latitudes and in the dry tropics they wil l decrease by 10- 30%. Some o f these dry regions are already water-stressed areas. The extent o f drought-affected areas wil l l ikely increase. Heavy precipitation events, which are very l ike ly to increase in frequency, wil l augment f lood
The Intergovemmental Panel o n Climate Change (IPCC) was established by the Wor ld Meteorological Organization and the Uni ted Nations Environment Programme in 1988 to assess scientific, technical, and socioeconomic information relevant for the understanding o f climate change, its potential impacts, and options for adaptation and mitigation. I t comprises three Working Groups and a Task Force, which meet regularly t o review the globally published scientific/technical literature o n climate change and to issue off icial assessments on the situation.
15
18
deltas o f Asia (and Africa). Glacier melt in the Himalayas is projected to increase flooding and rock avalanches f rom destabilized slopes, and affect water resources within the next two to three decades. Th is will be fol lowed by decreased r iver f lows as glaciers recede. Freshwater availability, particularly in large r iver basins, i s projected to decrease, which, along with population growth and increasing demand arising f rom higher standards o f l iving, could adversely affect more than a b i l l i on people by 2050.
Globally, the potential for food production i s projected to go up as long as local average temperature rise does not exceed 3°C; above this, it i s projected to decrease. Increases in the frequency o f droughts and floods are projected to affect local production negatively, especially in subsistence sectors at l o w . latitudes.
. risk. In the course o f the century, water supplies stored in glaciers and snow coverage are projected to decline. Th is will reduce water availability in regions supplied by meltwater f rom major mountain ranges, which are home to more than 1 b i l l i on people. Sea level rise is expected to exacerbate inundation, storm surge, erosion, and other coastal hazards, thus threatening vital infrastructure, settlements, and facilities that support the l ivelihood o f island communities.
a. Very h igh confidence implies that the statement has at least a 9 out o f 10 chance o f being correct; high confidence implies an 8 out o f 10 chance; and medium confidence a 5 out o f 10 chance.
1.2.2 8.
Local Variability: A Challenge for Adaptation in India
For India, climate change poses particular challenges due to i t s vast geographic diversity. Climate projections for India suggest that impacts are l ikely to be varied and heterogeneous, with some regions experiencing more intense rainfall and flood risks, while others encounter sparser rainfall and prolonged droughts (see chapter 2 for details).I6 Even though a vast body o f knowledge exists on the impacts o f climate variability and change, l i t t le i s known about the impacts at the meso (districthubdistrict) and micro (revenue village) levels or about specific adaptation strategies at the local levels that can diminish the risks associated with climate variability and change.
There is growing recognition that the impact o f climate change i s highly disaggregated and wil l vary across sectors, locations, and populations. In India, the climate vulnerability o f agriculture and livelihoods depends on a suite o f interconnected factors that vary locally, including (a) physical factors such as differences in soil conditions, water supplies and infrastructure; (b) economic factors such as local prices and technology that determine cropping patterns and farm management strategies; and (c) policies (for example taxes, price support, subsidies) and institutions (figure 1.1). The implication for a country as vast and varied as India is that broad generalizations on ways to promote adaptation wil l be misleading if they neglect local conditions. Consequently, there can be no “one-size-fits-all” approach to developing a climate risk management strategy; approaches wil l need to be tailored to fit local conditions.
9.
l6 The climate projections are summarized in India’s off icial In i t ia l National Communication on Climate Change to the UNFCCC.
19
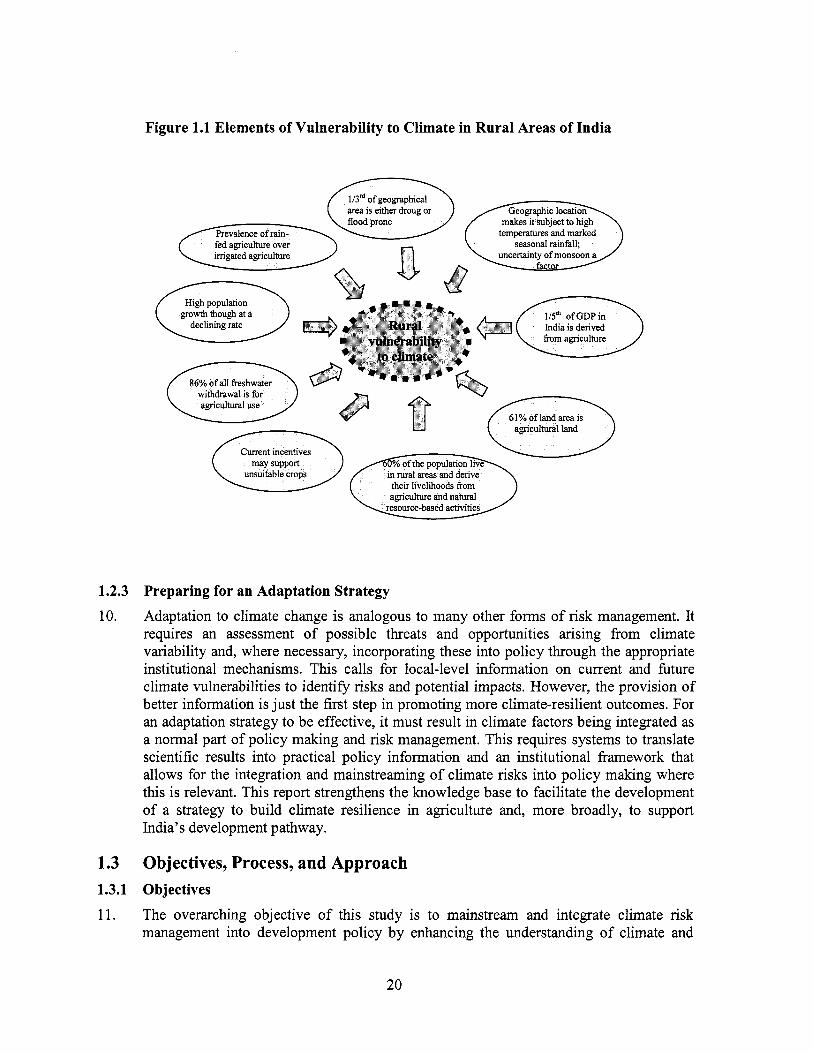
Figure 1.1 Elements of Vulnerability to Climate in Rural Areas of India
makes it subject to high
India IS denved growth though at a
61% of land area is
Current incentives
1.2.3 Preparing for an Adaptation Strategy 10. Adaptation to climate change i s analogous to many other forms o f risk management. I t
requires an assessment o f possible threats and opportunities arising from climate variability and, where necessary, incorporating these into pol icy through the appropriate institutional mechanisms. This calls for local-level information on current and h tu re climate vulnerabilities to identify r isks and potential impacts. However, the provision o f better information is just the first step in promoting more climate-resilient outcomes. For an adaptation strategy to be effective, i t must result in climate factors being integrated as a normal part o f pol icy making and risk management. This requires systems to translate scientific results into practical pol icy information and an institutional framework that allows for the integration and mainstreaming o f climate r isks into pol icy making where this i s relevant. This report strengthens the knowledge base to facilitate the development o f a strategy to build climate resilience in agriculture and, more broadly, to support India’s development pathway.
1.3 Objectives, Process, and Approach 1.3.1 Objectives 11. The overarching objective o f this study is to mainstream and integrate climate risk
management into development pol icy by enhancing the understanding o f climate and
20
climate-related issues in the agricultural sector. The scope o f the study and choice o f sector was dictated by government priorities, which indicated the need to assess the climate risks in regions where vulnerability was high and potentially increasing. The recommended focus was on areas facing greater exposure to droughts and floods. The study responds to the following specific needs that were determined in consultation with the Government o f India:
0 To generate better information and understanding on the current coping and
To understand government responses and their effectiveness in supporting both
To develop and demonstrate the use o f a climate modeling framework to identify
To use this information to assist in identifying the key elements o f an adaptation
climate r isk management strategies in response to droughts and floods;
coping and adaptation measures;
future climate risks in selected areas o f India;
plan that can help improve climate resilience and adaptive capacity in selected areas o f India;
and stakeholders.
0
0
0
0 To further raise awareness o f the problem and effective solutions among al l actors
1.3.2 Approach 12. To achieve these objectives the study has adopted multiple approaches:
(a) First, i t gathers information from selected areas o f India on current coping and adaptation measures to learn lessons from the past and present to understand (i) how rural communities cope with and build resilience to extreme climate events; and (ii) to identify the key determinants o f vulnerabilities to climate risks among farmers.
This i s complemented by a review o f governmental programs and institutions and climate-related r i s k management strategies in the case study states. The review identifies pol icy and administrative gaps and strengths in addressing climate r isks and suggests ways to complement existing approaches to deal more effectively with climate risks.
Looking forward, the study builds a modeling framework to assess future climate r isks and vulnerabilities in the study regions.
Finally, the study synthesizes the results o f the modeling framework and the other components to suggest a framework for pol icy options and actions to address adaptation in India.
The assessment i s focused on regions in the states o f Andhra Pradesh, Maharashtra, and Orissa, where a countrywide vulnerability assessment found climate risks o f droughts or floods to be high and increasing (appendix A). The case study areas are typical o f many parts o f Indian agriculture at the edge o f climate tolerance limits, but cannot be representative o f the vast geographic and climatic variability across the entire country. For example, other important areas o f vulnerability include the fragile mountain
(b)
(c)
(d)
13.
21
ecosystems in the Himalayan ranges and the Western Ghats, coastal zones, and urban areas o f India.
1.3.3 Process 14. The primary counterpart in the study has been the Ministry o f Environment and Forests
o f the Government o f India. The scope and objectives were developed in close consultation with the Ministry and a wider cross-section o f other concerned ministries and departments in both the central government and in selected states. This included consultation in Andhra Pradesh, Maharashtra, and Orissa with relevant departments. A panel o f scientific experts from academic, policy, and research institutions in India provided guidance on the study approach and acted as a quality fi l ter to review the technical results. This was complemented by extensive discussions and workshops at the state level with various government agencies, culminating in an international conference on adaptation to climate variability and change held in New Delhi in December 2006 (see appendix C for details).
A key feature o f this study has been extensive consultations in the states on the methodology and emerging findings. The focus states for deepening the engagement were Maharashtra and Orissa, as the Bank’s involvement in Andhra Pradesh was recognized to be on strong grounds through a separate pi lot initiative on drought adaptation. As a result o f the consultations, the state governments o f Maharashtra and Orissa requested rapid assessments o f government programs focused on climate-related issues in general, and drought and flood re l ie f management in particular, which were supported by the study. The Department o f Water Resources, Government o f Orissa, and the Department o f Rural Development and Water Conservation, Government o f Maharashtra, provided hll cooperation and support to these assessments. Further, the study developed a conceptual framework for a drought adaptation program in collaboration with senior officials from the Department o f Rural Development and Water Conservation as an example o f an operational program on adaptation. Appendix F presents the conceptual framework for a drought adaptation initiative.
15.
1.3.4 Operational Context 16. The report i s part o f a wider program o f engagement on climate change being undertaken
by the World Bank. Recognizing the development significance o f promoting adaptation to climate change, a significant portfolio o f activities are planned and under way, especially in Latin America, Afr ica and China. A bulk o f the portfolio focuses on technical assistance and knowledge management activities. In Africa, pi lot projects to mainstream adaptation into the Bank operations are being developed in Burkina Faso, Kenya, and Tanzania, while in China an adaptation project associated with the irrigation sector is under preparation. In Latin America, a pi lot project in coastal areas o f some islands in the Caribbean is being implemented and another pilot, which aims to address glacier retreat in the Andean region, is under preparation. This study is most closely related to and extends the modeling framework and approach developed in an earlier study on drought adaptation strategies for Andhra Pradesh, India (World Bank 20060. The Andhra Pradesh study has led to a pi lot drought adaptation initiative in Andhra Pradesh, which i s testing innovative approaches related to farming systems and
22
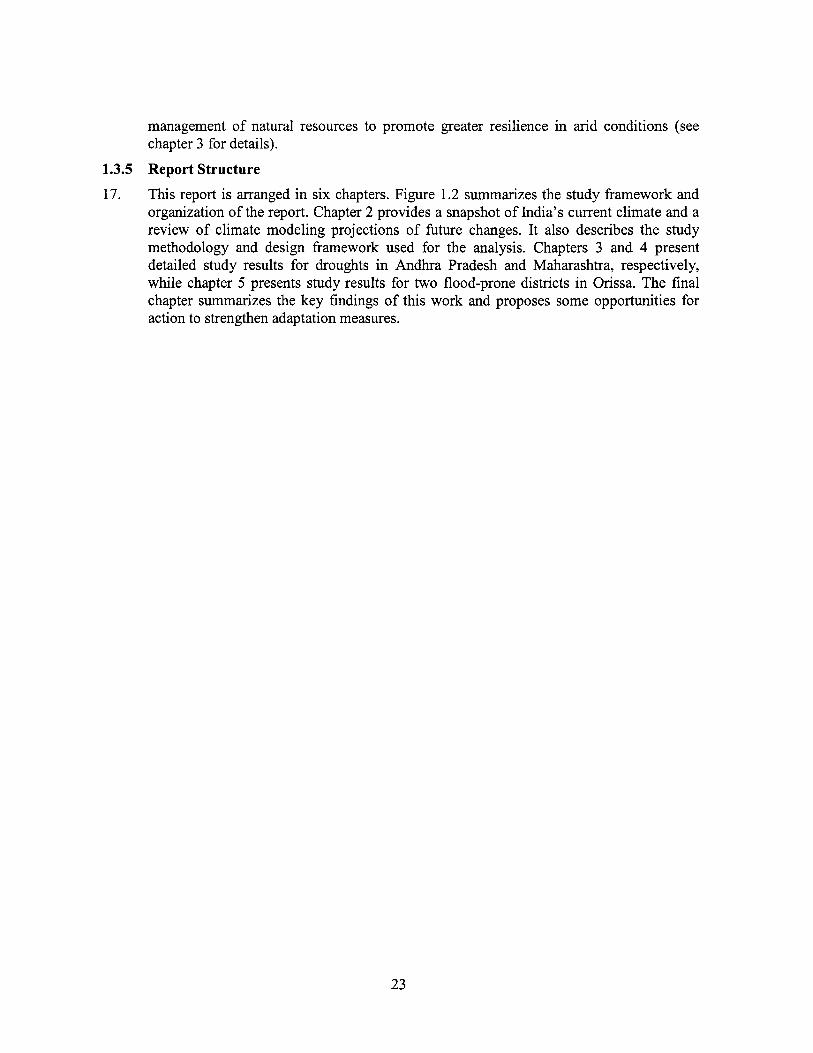
management o f natural resources to promote greater resilience in arid conditions (see chapter 3 for details).
1.3.5 Report Structure
17. This report is arranged in six chapters. Figure 1.2 summarizes the study framework and organization o f the report. Chapter 2 provides a snapshot o f India’s current climate and a review o f climate modeling projections o f future changes. I t also describes the study methodology and design framework used for the analysis. Chapters 3 and 4 present detailed study results for droughts in Andhra Pradesh and Maharashtra, respectively, while chapter 5 presents study results for two flood-prone districts in Orissa. The final chapter summarizes the key findings o f this work and proposes some opportunities for action to strengthen adaptation measures.
23
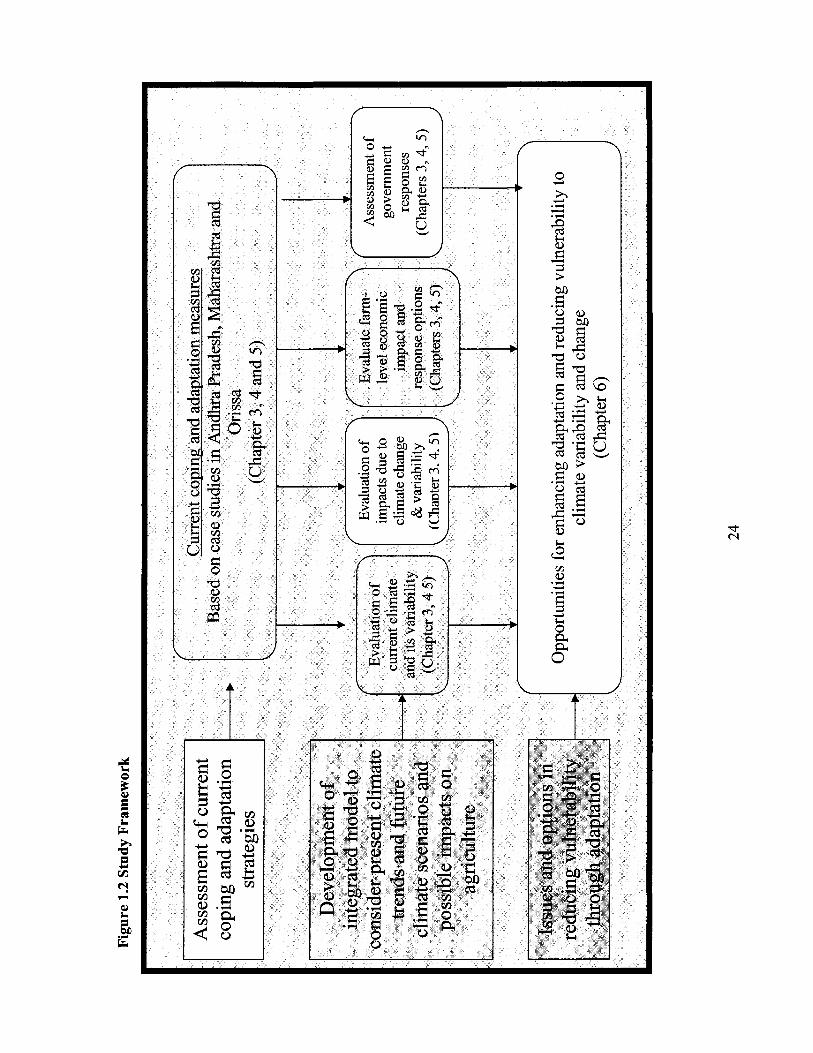
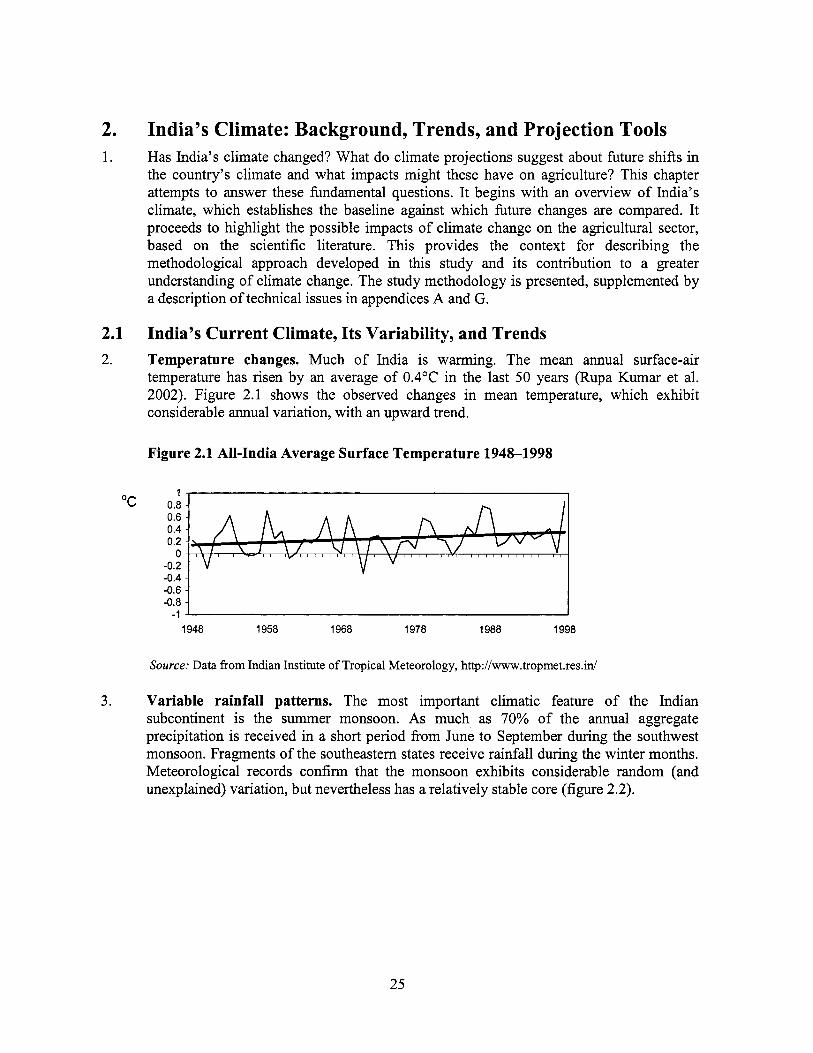
2. India's Climate: Background, Trends, and Projection Tools 1. Has India's climate changed? What do climate projections suggest about future shifts in
the country's climate and what impacts might these have on agriculture? This chapter attempts to answer these hndamental questions. I t begins with an overview o f India's climate, which establishes the baseline against which fbture changes are compared. I t proceeds to highlight the possible impacts o f climate change on the agricultural sector, based on the scientific literature. This provides the context for describing the methodological approach developed in this study and i t s contribution to a greater understanding o f climate change. The study methodology is presented, supplemented by a description o f technical issues in appendices A and G.
2.1 India's Current Climate, Its Variability, and Trends 2. Temperature changes. Much o f India i s warming. The mean annual surface-air
temperature has risen by an average o f 0.4"C in the last 50 years (Rupa Kumar et al. 2002). Figure 2.1 shows the observed changes in mean temperature, which exhibit considerable annual variation, with an upward trend.
Figure 2.1 All-India Average Surface Temperature 1948-1998
1 "c 0.8 0.6 0.4 0.2
0 -0.2 -0.4 -0.6 -0.8
-1 1948 1958 1968 1978 1988 1998
Source: Data from Indian Institute o f Tropical Meteorology, http://www.tropmet.res.in/
3. Variable rainfall patterns. The most important climatic feature o f the Indian subcontinent i s the summer monsoon. As much as 70% o f the annual aggregate precipitation i s received in a short period from June to September during the southwest monsoon. Fragments o f the southeastern states receive rainfall during the winter months. Meteorological records confirm that the monsoon exhibits considerable random (and unexplained) variation, but nevertheless has a relatively stable core (figure 2.2).
25
Figure 2.2 Variation of All-India Monsoon Rainfall 1813-2003
4.
5.
2.2 6.
7.
--I I I
Source: Data up to 2000 from Indian Institute o f Tropical Meteorology, http://www.tropmet.res.id. Subsequent data from newspaper reports o f rainfall.
Higher frequency o f droughts. Because o f the dominance o f the monsoon, India’s climate and weather exhibit the heaviest seasonal concentration o f precipitation in the world. Almost 20% o f India’s total land area i s drought prone. The frequency o f droughts has been increasing over time: there were six droughts between 1900 and 1950 compared to 12 in the following 50 years, and 3 droughts have already occurred since the beginning o f the 2 1 st ~entury.’~ Escalating levels o f ecological degradation, resulting from such factors as deforestation, receding water tables and overgrazing have increased the vulnerability o f ecosystems to drought.
Increased frequency of floods. The Ganges-Brahmaputra and Indus river systems are highly prone to flooding. The magnitude o f flooding has increased in recent decades, from approximately 19 mi l l ion hectares affected 50 years ago to 40 mi l l ion hectares in 2003, about 12% o f India’s geographic area. Floods have occurred almost every year since 1980, and their extent substantially increased in 2003 due to widespread rains, which affected even some o f the most drought-prone areas. In recent years an increase in population in vulnerable areas, inadequate drainage and deforestation have al l contributed to the r ise in flood damage.
Future Climate Change Projections What might the future hold for India’s climate? Projecting future climate i s a complex and uncertain exercise. The global models that generate projections have technical limitations, such as the level o f resolution and data inputs. The inherently uncertain nature o f socioeconomic scenarios and responses adds to the challenges o f projecting future greenhouse gas emissions and the associated climate impacts. Nevertheless, projections are needed to assess possible future hazards, risks, and opportunities, without which i t would be impossible to develop a coherent climate risk management program.
The most widely quoted projections for climate change in India are those derived from the Hadley Centre regional climate model (HadRM2), which provides simulated
l7 EM-DAT: The OFDNCRED International Disaster Database, http://www.em-dat.net, see also Winrock 2005.
26
2.3 2.3.1 8.
9.
10.
outcomes for a range o f scenarios. Projections are available for the period 2041-2060 and suggest: ' 0 An increase in average surface temperatures across al l seasons, with an increase
More variable precipitation during the monsoon season, with a possible decrease
An overall increase in rainfall intensity by 1-4 millimeters per day, accompanied
o f 2°C to 4°C south o f latitude 25", and in excess o f 4°C in the northern region;
towards the west and an increase over the Indian Ocean and the Western Ghats;
by an increase in the highest one-day rainfall. However, given the country's varied geography, some parts o f northwest India could also witness a decrease in extreme rainfall;
0
0
0 Glacial retreat caused by warming, though the extent remains uncertain;
A rise in sea level, which would threaten economic assets, coastal cities, and large 0
coast-dwelling populations.
Methodology o f the Study Approaches to Measuring Climate Change Impacts on Crop Yields
Given the scale and magnitude o f these changes, there are concerns that climate change could compromise agricultural productivity in India, threaten food security goals and undermine development efforts. The unease i s not without reason: a large and growing rural population live in high-risk areas, agricultural output and water supplies depend on the monsoons, and much farming i s on rain-fed lands. Consequently there have been numerous attempts to assess possible impacts o f climate variability and change on agricultural productivity.
Measuring the impacts o f climate change on agriculture i s a complex and challenging exercise as there is much uncertainty in moving from climate change to physical impacts on crops and market responses. Two approaches have evolved to determine crop responses to climate change: statistical methods (termed the Ricardian approach) and agronomic crop growth models.
Statistical assessments
The statistical approach examines how farmers in a certain climate scenario perform relative to similar farmers in different climate scenarios. This generates estimates o f farm performance across different climate zones that can be used to infer the consequences o f climate change. Table 2.1 summarizes the results from the statistical studies o f the impacts o f climate change in India. These suggest that a temperature increase o f 2°C would generate a modest loss o f between 3% and 9% o f current agricultural income. But for a 3°C rise in temperature, the studies predict a wide range o f losses from 3% to 26% o f income. These estimates are broad and approximate averages, based on the assumption that temperature and rainfall impacts are uniformly distributed across the country. Furthermore, while statistical approaches capture current and observed farm-level
** Note that the dates do not correspond to particular calendar years, but represent probable climate events that are predicted to emerge within that period.
27
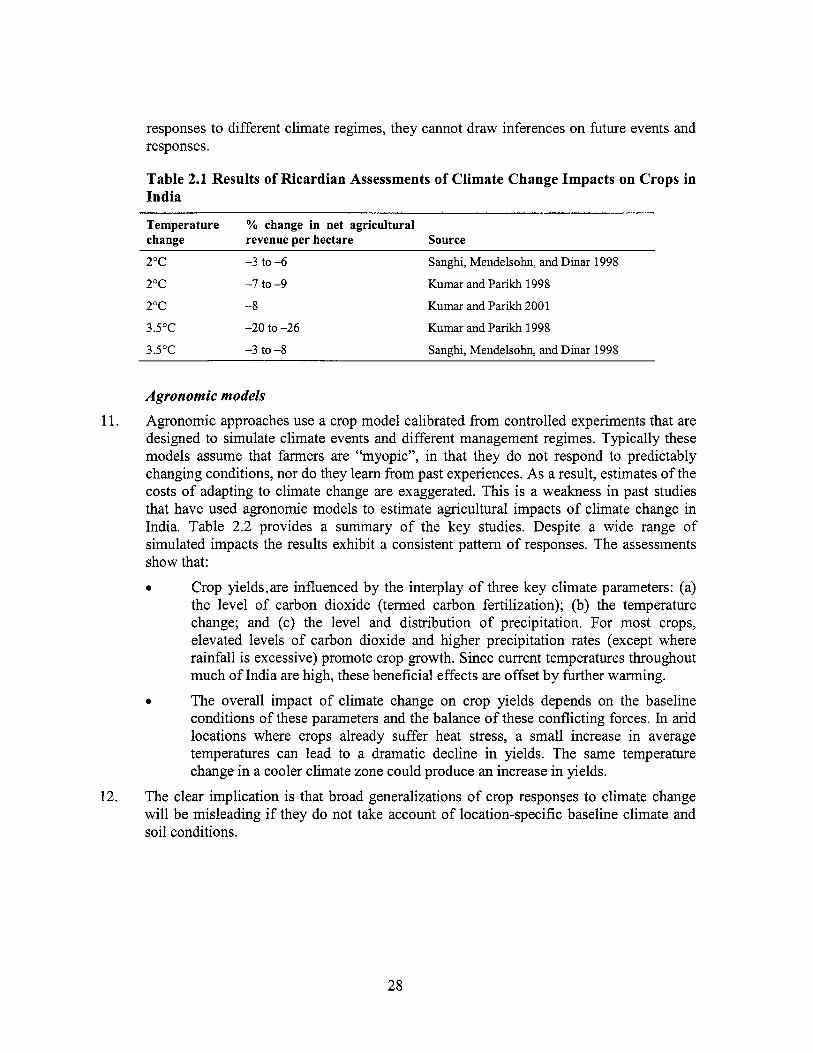
responses to different climate regimes, they cannot draw inferences on future events and responses.
Table 2.1 Results of Ricardian Assessments of Climate Change Impacts on Crops in India
Temperature change revenue per hectare Source
% change in net agricultural
2°C -3 to -6
2°C -7 to -9
2°C -8
3.5”C -20 to -26
3.5”C -3 to -8
Sanghi, Mendelsohn, and Dinar 1998
Kumar and Parikh 1998
Kumar and Parikh 2001
Kumar and Parikh 1998
Sanghi, Mendelsohn, and Dinar 1998
Agronomic models
Agronomic approaches use a crop model calibrated from controlled experiments that are designed to simulate climate events and different management regimes. Typically these models assume that farmers are “myopic”, in that they do not respond to predictably changing conditions, nor do they learn from past experiences. As a result, estimates o f the costs o f adapting to climate change are exaggerated. This i s a weakness in past studies that have used agronomic models to estimate agricultural impacts o f climate change in India. Table 2.2 provides a summary o f the key studies. Despite a wide range o f simulated impacts the results exhibit a consistent pattern o f responses. The assessments show that:
11.
0 Crop yields-are influenced by the interplay o f three key climate parameters: (a) the level o f carbon dioxide (termed carbon fertilization); (b) the temperature change; and (c) the level and distribution o f precipitation. For most crops, elevated levels o f carbon dioxide and higher precipitation rates (except where rainfall is excessive) promote crop growth. Since current temperatures throughout much o f India are high, these beneficial effects are offset by further warming.
conditions o f these parameters and the balance o f these conflicting forces. In arid locations where crops already suffer heat stress, a small increase in average temperatures can lead to a dramatic decline in yields. The same temperature change in a cooler climate zone could produce an increase in yields.
The clear implication is that broad generalizations o f crop responses to climate change wil l be misleading if they do not take account o f location-specific baseline climate and soil conditions.
0 The overall impact o f climate change on crop yields depends on the baseline
12.
28
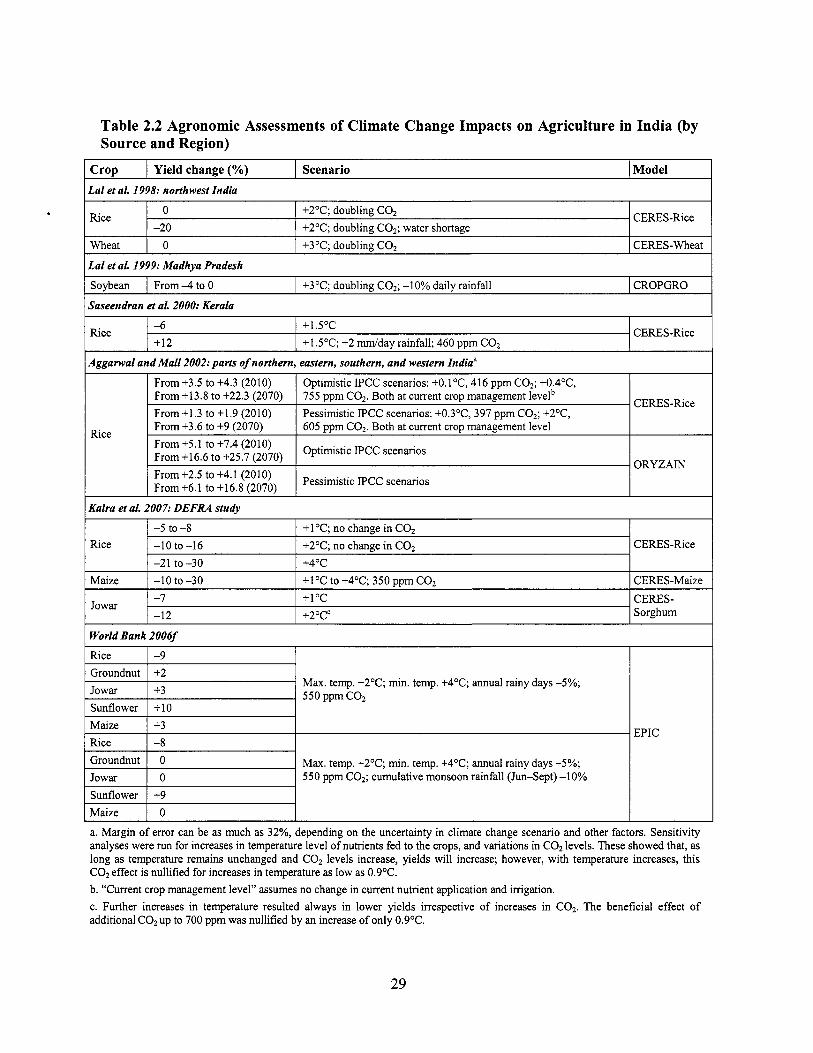
Table 2.2 Agronomic Assessments of Climate Change Impacts on Agriculture in India (by Source and Region)
Rice
Wheat
I Crop I Yield change (%) I Scenario
CERES-Rice 0 +2OC; doubling C02
0 +3"C: doubling CO, CERES-Wheat -20 +2"C; doubling C02; water shortage
1 Model
From+3.5 to +4.3 (2010) From +13.8 to +22.3 (2070) From +I .3 to +1.9 (2010) From +3.6 to +9 (2070)
Optimistic IPCC scenarios: +0.loC, 416 ppm C02; +0.4"C, 755 ppm C02. Both at current crop management levelb Pessimistic IPCC scenarios: +0.3"C, 397 ppm C02; +2"C, 605 mm CO,. Both at current croD management level
I La1 et aL 1999: Madhya Pradesh
1.11..
From +5.1 to +7.4 (2010) From +16.6 to +25.7 (2070)
From +2.5 to +4.1 (2010) From +6.1 to +16.8 (2070)
I Soybean I From-4 to 0 I +3"C; doubling CO,; -10% daily rainfall I CROPGRO
Optimistic Ipcc ORY Z AIN
Pessimistic IPCC scenarios
/ Saseendran et aL 2000: Kerala
Rice
Maize
CERES-Rice -6 I +1.5"C +12
Rice
Agganval and Mall 2002:parts of northern, eastern, southern, and western India"
I +1.5"C; +2 &day rainfall; 460 ppm C02
-5 to -8 -10 to-16 +2"C; no change in C02 CERES-Rice -21 to -30 +4"C -10 to-30
+l"C; no change in C02
CERES-Maize +1"C to +4"C; 350 ppm C02 -7 I +1"C
Jowar -12 I +2"CC
CERES-Rice
CERES- Sorghum
Groundnut Jowar
I Kalra et al. 2007: DEFRA study
+2 +3
Max. temp. +2"C; min. temp. +4"C; annual rainy days -5%; , 550ppmC02
I World Bank 2006f
Groundnut I 0 Jowar I o
Max. temp. +2"C; min. temp. +4"C; annual rainy days -5%; 550 ppm CO,; cumulative monsoon rainfall (Jun-Sept) -10%
I Sunflower I +IO 1 -
Sunflower Maize
I Maize 1 +3 I
+9 0
1 Rice I -8 I EPIC
a. Margin o f error can be as much as 32%, depending on the uncertainty in climate change scenario and other factors. Sensitivity analyses were run for increases in temperature level o f nutrients fed to the crops, and variations in C02 levels. These showed that, as long as temperature remains unchanged and C02 levels increase, yields wil l increase; however, with temperature increases, this C02 effect i s nullified for increases in temperature as low as 0.9"C. b. "Current crop management level" assumes no change in current nutrient application and irrigation. c. Further increases in temperature resulted always in lower yields irrespective o f increases in C02. The beneficial effect o f additional C02 up to 700 ppm was nullified by an increase o f only 0.9OC.
29
2.3.2 13.
14.
15.
16.
Methodology for Climate Impact Analysis The approach developed in this study incorporates the lessons from these studies and advances the approach to assessing climate change impacts. The agronomic models for India provide a plausible description o f crop responses to climate change. However, they fai l to capture adaptive responses to climate change at the farm level. Experience shows that farmers can and do adapt to climate variations, which allows them to moderate some o f the adverse effects. Consequently, crop losses from past studies that have used agronomic models are likely to be overestimated. The framework developed in this study addresses this problem by linking a farm economic model to the agronomic model to estimate economically prudent responses o f farmers to changing climate conditions. Recognizing the country’s enormous heterogeneity and the varied climate impacts, i t focuses on selected vulnerable areas.
Study areas. Since droughts and floods are predicted to increase in frequency and intensity, the focus i s on districts in drought-affected areas o f the Pennar basin in Andhra Pradesh, the Godavari basin in Maharashtra, and the flood-prone area o f the lower Mahanadi basin in Orissa. The choice o f districts and blocks was determined through a risk mapping exercise (see appendix B), which identified areas where agriculture i s already stressed and where current trends indicate worsening conditions. The selection o f villages was based on a purposive sampling approach aimed at capturing the impacts o f irrigation coverage and infrastructure on adaptive capacity”. To assure a representative coverage o f the population, household surveys were conducted on samples o f households stratified across landholding categories. This approach differs from the Ricardian studies that compare agricultural productivity across a wide spectrum o f climate zones. The focus here i s on understanding adaptive responses in areas already stressed by droughts or floods. Therefore, the results complement other approaches.
Learning from the past and present. The study begins by exploring current coping practices and identifying factors that influence the vulnerability o f farmers to climate r isks in the selected study areas. I t uses data from household surveys to explore how farmers respond to current climate risks by comparing outcomes in a “normal” year with those in a drought or flood year. The statistical exercise i s useful in illuminating the factors that help communities insulate livelihoods from climate r isks and the effectiveness o f different coping mechanisms. Complementing the statistical assessment i s a review o f governmental programs and institutions for managing climate risks. The review identifies the strengths and gaps in addressing climate risks and suggests ways to enhance the synergies and effectiveness o f government programs.
Looking to the future. With i t s focus on the past, the above approach i s limiting, since many o f the predicted impacts o f climate change are expected to differ in kind and magnitude from current climate patterns. Accordingly, an integrated modeling system (IMS) was developed to generate climate scenarios and assess the impacts on agriculture. The results o f the I M S exercise, in conjunction with the above assessments, assist in the development o f a framework o f appropriate adaptation responses and policies to build climate resilience.
The study design has intended to take into account two contrasting districts per state and selected villages accordingly from these districts.
30
17. Details of modeling using the IMS. The I M S i s based on the two most widely used IPCC scenarios in India, termed A2 and B 2 (box 2.1). The former describes a pessimistic world with higher levels o f greenhouse gases and more aggressive climate impacts, while the latter depicts a more benign scenario with milder climate change. The system architecture i s presented in figure 2.3. The system comprises the following linked subcomponents : 0 A regional climate model (HadRM3) provides results for a spatial resolution o f 50
km x 50 km and generates climate projections f rom 2070 to 2100 at the regional level;
(blocklmandal) level;
climate change on water resources;
and soil moisture and predicts crop yields;
cl imate change on farmers and determines effective adaptation strategies.
0 A stochastic weather generator projects these climate impacts to the local
A hydrological water resource model (SWAT 2000) evaluates the effects o f
An agronomic model (EPIC) uses these estimates o f temperature, precipitation,
A custom-built farm-level economic model assesses the financial impacts o f
0
0
0
I Box 2.1 Emission Scenarios Selected for the Study In order to predict future climate change, a projection o f how anthropogenic emissions o f greenhouse gases (and other constituents) w i l l change in the future i s needed. A range o f emission scenarios has been developed by the IPCC). In this study, A2 and B2 were selected to run projections''. The conditions assumed in the scenarios are as follows: (see the table below for a summary o f the main assumptions in each scenario):
A2 describes a very heterogeneous world. The underlying theme is self-reliance and preservation o f local identities. Fertility patterns across regions converge very slowly, which results in continuously increasing population. Economic development i s primarily regionally oriented and per capita economic growth and technological change are more fragmented and slower than in other scenarios.
B2 describes a world in which the emphasis is on local solutions to economic, social, and environmental sustainability. I t i s a world wi th a continuously increasing global population at a rate lower than A2, intermediate levels o f economic development, and less rapid and more diverse technological change than in the B 1 and A1 scenarios. While the scenario i s also oriented toward environmental protection and social equity, i t focuses on local and regional levels.
Main Assumptions of Climate Change Scenarios A2 and B2
World GDP Annual C 0 2 Cumulative C 0 2 (lO"12 1990 (gigatonnedyear) (gigatonnes o f USD/year) carbon)
Population (billion)
Scenario 2050 2100 2050 2100 2050 2100 (1990 -2100)
A2 11.3 15.1 82 243 17.4 29.1 1,862
B 2 9.3 10.4 110 235 11 13.3 1,164
I Source: IPCC 1998. I 18. The climate projections are from the third-generation Hadley Centre model (HadRM3),
produced at a 50-kilometer resolution, and are the most recent simulations available for India. The stochastic weather generator filters these coarse projections down to the block level, while preserving the statistical properties o f the regional data. The water resource
B e i n g the f i rst o f i t s kind study f o r I nd ia for w h i c h a methodo logy h a d to b e developed, it was decided to focus o n the two future scenarios prescr ibed by IPCC.
31
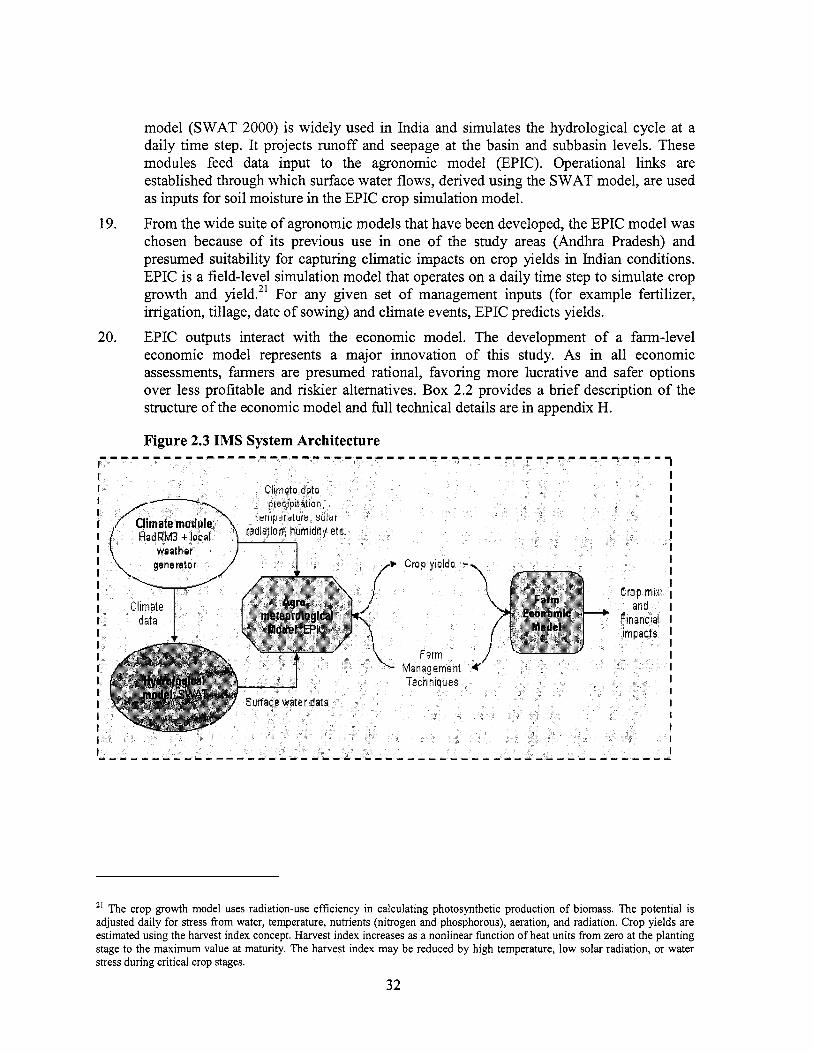
model (SWAT 2000) i s widely used in India and simulates the hydrological cycle at a daily time step. I t projects runoff and seepage at the basin and subbasin levels. These modules feed data input to the agronomic model (EPIC). Operational links are established through which surface water flows, derived using the SWAT model, are used as inputs for soil moisture in the EPIC crop simulation model.
From the wide suite o f agronomic models that have been developed, the EPIC model was chosen because o f i t s previous use in one o f the study areas (Andhra Pradesh) and presumed suitability for capturing climatic impacts on crop yields in Indian conditions. EPIC i s a field-level simulation model that operates on a daily time step to simulate crop growth and yield.21 For any given set o f management inputs (for example fertilizer, irrigation, tillage, date o f sowing) and climate events, EPIC predicts yields.
EPIC outputs interact with the economic model. The development o f a farm-level economic model represents a major innovation o f this study. As in al l economic assessments, farmers are presumed rational, favoring more lucrative and safer options over less profitable and riskier alternatives. Box 2.2 provides a brief description o f the structure o f the economic model and fbll technical details are in appendix H.
19.
20.
Figure 2.3 I M S System Architecture
2' The crop growth model uses radiation-use efficiency in calculating photosynthetic production o f biomass. The potential is adjusted daily for stress from water, temperature, nutrients (nitrogen and phosphorous), aeration, and radiation. Crop yields are estimated using the harvest index concept. Harvest index increases as a nonlinear function o f heat units from zero at the planting stage to the maximum value at maturity. The harvest index may be reduced by high temperature, l ow solar radiation, or water stress during critical crop stages.
32
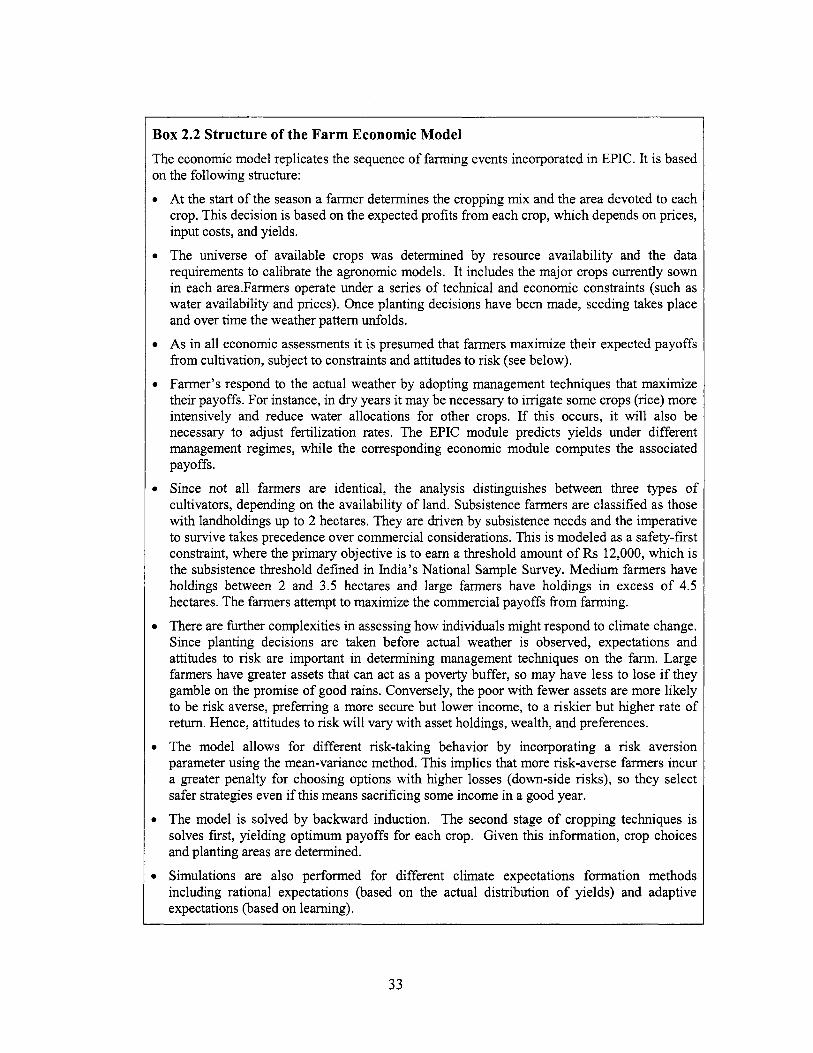
Box 2.2 Structure of the Farm Economic Model The economic model replicates the sequence o f farming events incorporated in EPIC. It i s based on the following structure:
At the start o f the season a farmer determines the cropping mix and the area devoted to each crop. This decision i s based o n the expected profits f rom each crop, which depends on prices, input costs, and yields.
The universe o f available crops was determined by resource availability and the data requirements to calibrate the agronomic models. It includes the major crops currently sown in each area.Fanners operate under a series o f technical and economic constraints (such as water availability and prices). Once planting decisions have been made, seeding takes place and over time the weather pattern unfolds.
As in al l economic assessments it i s presumed that farmers maximize their expected payoffs f rom cultivation, subject to constraints and attitudes to r i s k (see below).
Farmer’s respond to the actual weather by adopting management techniques that maximize their payoffs. For instance, in dry years it may be necessary to irrigate some crops (rice) more intensively and reduce water allocations for other crops. If this occurs, i t will also be necessary to adjust fertilization rates. The EPIC module predicts yields under different management regimes, while the corresponding economic module computes the associated payoffs.
Since not a l l farmers are identical, the analysis distinguishes between three types o f cultivators, depending on the availability o f land. Subsistence farmers are classified as those with landholdings up to 2 hectares. They are driven by subsistence needs and the imperative to survive takes precedence over commercial considerations. This i s modeled as a safety-first constraint, where the primary objective i s to earn a threshold amount o f Rs 12,000, which i s the subsistence threshold defined in India’s National Sample Survey. Med ium farmers have holdings between 2 and 3.5 hectares and large farmers have holdings in excess o f 4.5 hectares. The farmers attempt to maximize the commercial payoffs fiom farming.
There are further complexities in assessing how individuals might respond to climate change. Since planting decisions are taken before actual weather i s observed, expectations and attitudes to risk are important in determining management techniques o n the farm. Large farmers have greater assets that can act as a poverty buffer, so may have less to lose i f they gamble on the promise o f good rains. Conversely, the poor with fewer assets are more l ikely to be risk averse, preferring a more secure but lower income, to a r i she r but higher rate o f return. Hence, attitudes to r i sk will vary with asset holdings, wealth, and preferences.
The model allows for different risk-taking behavior by incorporating a risk aversion parameter using the mean-variance method. T h i s implies that more risk-averse farmers incur a greater penalty for choosing options with higher losses (down-side risks), so they select safer strategies even if this means sacrificing some income in a good year.
The model i s solved by backward induction. The second stage o f cropping techniques i s solves first, yielding optimum payoffs for each crop. Given this information, crop choices and planting areas are determined.
Simulations are also performed for different climate expectations formation methods including rational expectations (based on the actual distribution o f yields) and adaptive expectations (based o n learning).
33
21.
22.
23.
24.
25.
Qualifications. The I M S system provides a powerful tool for developing alternative climate and economic scenarios that generate information on physical responses o f crops and the economic consequences at the farm level. But as with al l modeling exercises there are well-known limitations and caveats that need to be recognized when the information i s used to guide decisions.
Scenarios are not forecasts. The model outputs are outcomes o f assumed scenarios rather than precise predictions o f the future. Unforeseen changes may occur in input prices, technology, land, and labor markets. To predict changes in crop prices requires a global model o f demand and supply for each crop and information on the likely trade interventions that might apply in the future. Unfortunately, global crop models generate poor forecasts, so there i s no robust and reliable way o f determining crop price changes. All o f this suggests considerable uncertainty in developing projections and the need for caution when generating and interpreting them22.
However, uncertainty need not render the assessments useless and can be addressed in various ways. Two approaches were followed in this study. First, sensitivity analysis was performed to test the robustness o f various results. This was done for most economic variables (prices, risk aversion parameters, and expectations mechanisms) by testing the limits beyond which the results change significantly. A second more important approach was to create the model in a user-friendly (Excel) interface that would allow other analysts to develop and simulate different economic scenarios.
Assumptions about water. The hydrological model used in the study includes a simulation o f the groundwater component in the hydrological cycle. However, the model makes the assumption that the vegetation cover (including agricultural crops in the winter (rabi) and summer (kharif) seasons) in regions that are not covered by surface irrigation is maintained, and implici t ly relies on groundwater storage. Groundwater abstraction is not explicitly modeled. Therefore, the model i s l ikely to underestimate the negative impact o f decreasing groundwater availability on the agricultural crop cover, especially in areas where groundwater abstraction exceeds the average annual infiltration.
Modeling necessarily entails simplifications that are imposed either by data availability or technical limitations. In this context, assumptions relating to the treatment o f irrigation in the model warrant discussion. Water availability for crops in EPIC (the agronomic model) comes from three sources: rainfall as determined by the weather generator; runoff and percolation as simulated by the hydrological model; and an exogenous (predetermined) supply o f irrigation water. The agronomic model does not distinguish between the sources o f irrigation water, such as groundwater or surface water. In the context o f projecting plant growth this is, arguably, a plausible simplification, since crop yields depend on the level o f soil moisture rather than the source from which moisture i s obtained. But in the context o f economics and long-term sustainability, the sources o f irrigation do matter. Overabstraction o f groundwater could jeopardize water availability and thus lead to different cropping patterns and crop yields. These l i n k s have not been developed in the model due to the high complexity and scale o f the issues. Accommodating these concerns is beyond the scope o f current modeling capacity and must await further understanding.
22 At a global and national scale climate change will affect production levels and prices. Determining these impacts is beyond the scope o f this report and t h i s is left to future work.
34
26. Assumptions about crop mix: The agronomic analysis is based on the assumption that the crop-mix remains the same and only their proportions may vary under different climate scenarios. This i s a limitation caused by the difficulty and inordinate expense of parameterizing the agronomic model and shared in much o f the literature. I t was not possible within the resource envelope to incorporate more crops in the analysis and hence the focus was on crops that dominate in the chosen areas.
Need for information on climate risks. As argued in this chapter, the model projections should be interpreted with caution and viewed as indications o f the possible direction and magnitude o f changes, rather than as precise forecasts. Despite these uncertainties, pol icy makers are compelled to respond to climate risks and must make routine decisions o n matters that will be affected by fbture climate events, such as investment in infrastructure. Modeling exercises provide the only known way to generate some o f the information that i s needed to assess r isks and policy impacts, and thereby improve decision making.
27.
35
3. Climate Variability and Change: A Case Study in Drought- Prone Andhra Pradesh
3.1 Introduction and Background 1. Situated in southern India, Andhra Pradesh i s the fifth largest state in the country, both in
terms o f geography and population. With much o f the state lying in the arid parts o f the Indian peninsula, the specter o f drought i s a recurring threat to rural livelihoods. Surface water resources are limited, with modest scope for fkrther increase in supplies. High levels o f groundwater abstraction, coupled with low and variable rainfall, have led to sharp declines in the water table in most parts o f the state. Consequently, water availability has emerged as one o f the binding constraints on farming systems and associated livelihoods in the drought-prone areas.
The government o f Andhra Pradesh has an impressive array o f programs that tackle drought exposure and deficient rainfall in the state. These range from short-term r e l i e f schemes to strategic initiatives that include watershed area programs, crop diversification incentives, and water conservation schemes. Yet the human impacts o f drought continue to be devastating for affected rural communities, suggesting that the low-hanging frui ts o f drought policy have been harvested, leavin more complex and intractable problems that take time to address (World Bank 20060. Climate change has raised concerns that the situation could worsen if droughts become more frequent or intense across the state. Thus the need for an assessment o f current and future climate risks and vulnerability in the rural sector has become more urgent.
This chapter takes a closer look at how affected communities respond and cope with drought in selected areas o f the state. It uses household surveys to investigate the impacts o f drought, coping mechanisms and to identify the key factors that promote greater drought resilience among households. The chapter then explores the prospective trends in agriculture and incomes under projected future climate change scenarios. I t uses the integrated modeling system (IMS, described in chapter 2) to explore how the yields o f key crops and incomes might change under future climate patterns and uncertain water supplies. Finally, i t synthesizes the findings to recommend some strategic priorities to address drought adaptation that complement and support the state’s development objectives.
2.
2 f
3.
3.2 Characteristics o f Study Area 3.2.1 Climate and Geography 4. The focus o f the study i s on two districts o f Andhra Pradesh - Anantapur and Chittoor.
Both districts are arid, especially susceptible to drought, and found to be highly vulnerable to further climate variability because o f the limited adaptive capacity o f most o f its residents, due to l ow incomes and restricted alternative employment opportunities.
23 An overview o f programs i s presented later in this chapter.
36
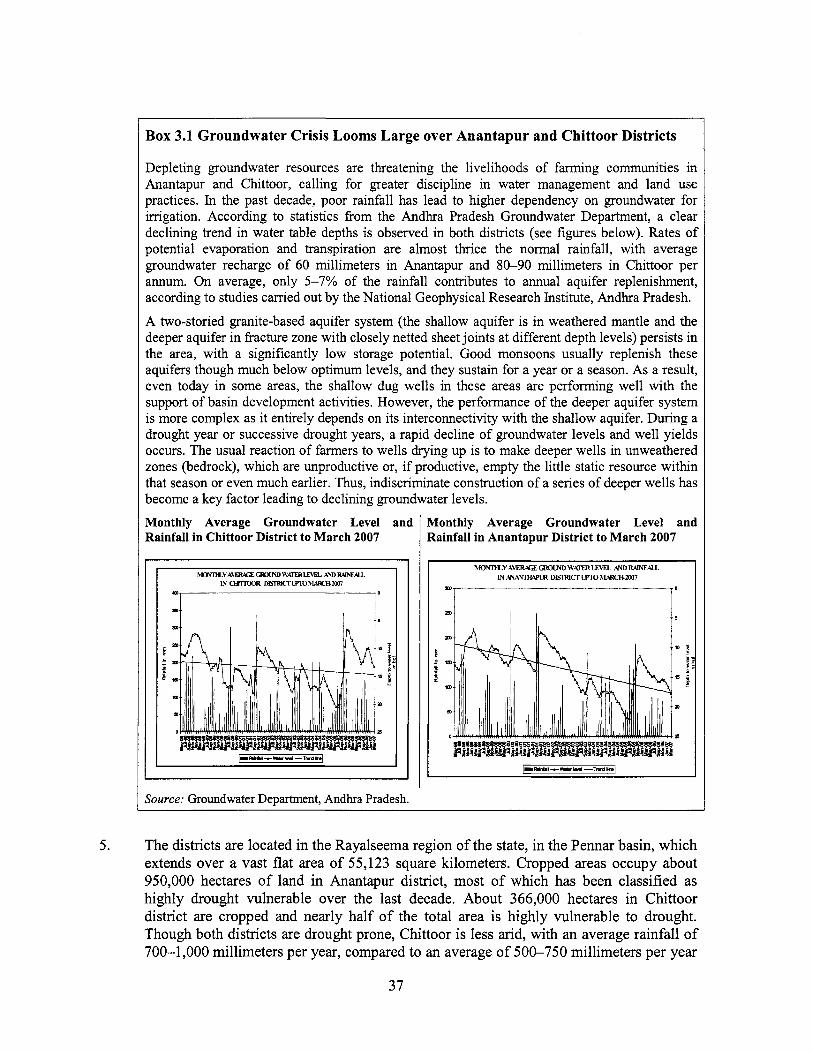
5.
box 3.1 Groundwater Crisis Looms Large over Anantapur and Chittoor Districts
Iepleting groundwater resources are threatening the livelihoods o f farming communities in inantapur and Chittoor, calling for greater discipline in water management and land use lractices. In the past decade, poor rainfall has lead to higher dependency on groundwater for nigation. According to statistics f rom the Andhra Pradesh Groundwater Department, a clear .eclining trend in water table depths i s observed in both districts (see figures below). Rates o f lotential evaporation and transpiration are almost thrice the normal rainfall, with average roundwater recharge o f 60 millimeters in Anantapur and 80-90 millimeters in Chittoor per mum. On average, only 5-7% o f the rainfall contributes to annual aquifer replenishment, ccording to studies carried out by the National Geophysical Research Institute, Andhra Pradesh.
i two-storied granite-based aquifer system (the shallow aquifer i s in weathered mantle and the .eeper aquifer in fracture zone with closely netted sheet joints at different depth levels) persists in he area, with a significantly l o w storage potential. Good monsoons usually replenish these quifers though much below optimum levels, and they sustain for a year or a season. As a result, ven today in some areas, the shallow dug wells in these areas are performing wel l with the upport o f basin development activities. However, the performance o f the deeper aquifer system 3 more complex as it entirely depends on its interconnectivity with the shallow aquifer. During a rought year or successive drought years, a rapid decline o f groundwater levels and wel l yields ~ccurs. The usual reaction o f farmers to wells drying up i s to make deeper wells in unweathered ones (bedrock), which are unproductive or, if productive, empty the l itt le static resource within hat season or even much earlier. Thus, indiscriminate construction o f a series o f deeper wells has lecome a key factor leading to declining groundwater levels.
Ionthly Average Groundwater Level and lainfall in Chittoor District to March 2007
*t I I I, I
ource: Groundwater Department, Andhra Pradesh.
fonthly Average Groundwater Level and .ainfall in Anantapur District to March 2007
A 1 /k
’he districts are located in the Rayalseema region o f the state, in the Pennar basin, which xtends over a vast flat area o f 55,123 square kilometers. Cropped areas occupy about
,i50,000 hectares o f land in Anantapur district, most o f which has been classified as highly drought vulnerable over the last decade. About 366,000 hectares in Chittoor district are cropped and nearly hal f o f the total area i s highly vulnerable to drought. Though both districts are drought prone, Chittoor i s less arid, with an average rainfall o f 700-1,000 millimeters per year, compared to an average o f 500-750 millimeters per year
37
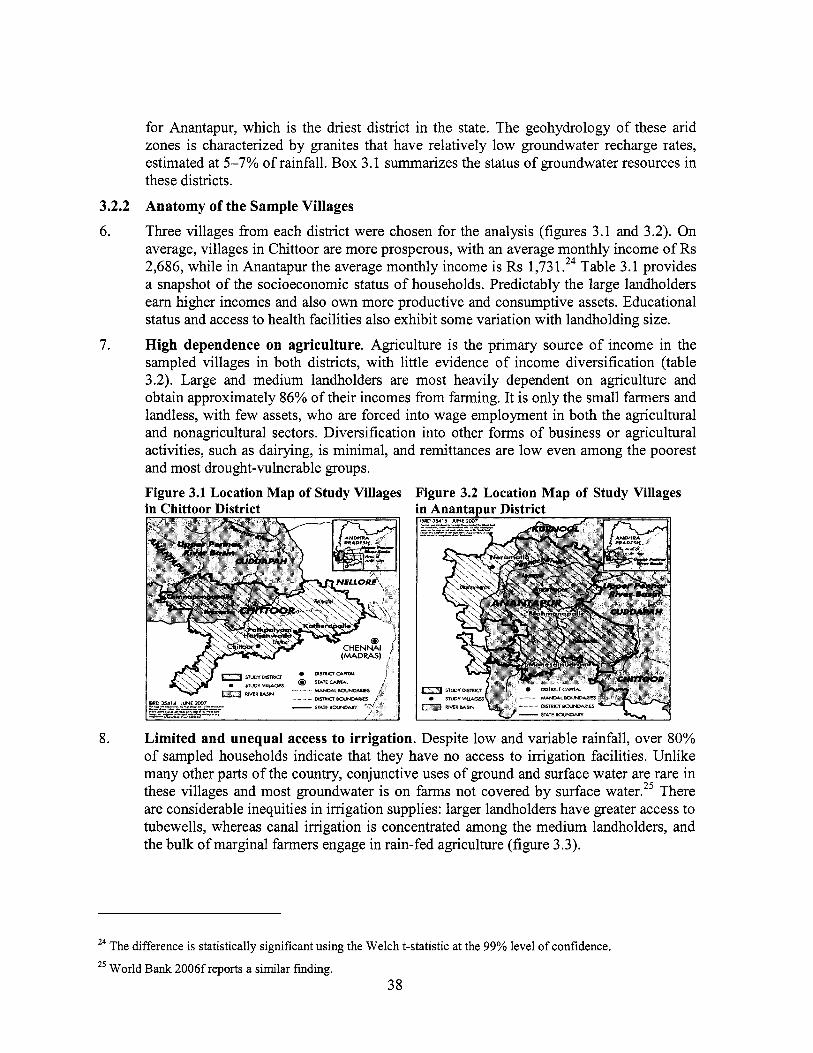
for Anantapur, which i s the driest district in the state. The geohydrology o f these arid zones is characterized by granites that have relatively l ow groundwater recharge rates, estimated at 5-7% o f rainfall. Box 3.1 summarizes the status o f groundwater resources in these districts.
Anatomy of the Sample Villages
Three villages from each district were chosen for the analysis (figures 3.1 and 3.2). On average, villages in Chittoor are more prosperous, with an average monthly income o f Rs 2,686, while in Anantapur the average monthly income i s Rs 1,73 1 .24 Table 3.1 provides a snapshot o f the socioeconomic status o f households. Predictably the large landholders earn higher incomes and also own more productive and consumptive assets. Educational status and access to health facilities also exhibit some variation with landholding size.
High dependence on agriculture. Agriculture i s the primary source o f income in the sampled villages in both districts, with little evidence o f income diversification (table 3.2). Large and medium landholders are most heavily dependent on agriculture and obtain approximately 86% o f their incomes from farming. I t i s only the small farmers and landless, with few assets, who are forced into wage employment in both the agricultural and nonagricultural sectors. Diversification into other forms o f business or agricultural activities, such as dairying, i s minimal, and remittances are l ow even among the poorest and most drought-vulnerable groups.
Figure 3.1 Location Map of Study Villages Figure 3.2 Location Map of Study Villages in Chittoor District in Anantapur District
3.2.2 6.
7.
G2;9 s--= * usrR)i7cAmu s , u o . , y ~ s @ Sm’EtU.(w -eQ!J?.xw%es SRDVWrRKl
8. Limited and unequal access to irrigation. Despite low and variable rainfall, over 80% o f sampled households indicate that they have no access to irrigation facilities. Unl ike many other parts o f the country, conjunctive uses o f ground and surface water are rare in these villages and most groundwater i s on farms not covered by surface water.25 There are considerable inequities in irrigation supplies: larger landholders have greater access to tubewells, whereas canal irrigation i s concentrated among the medium landholders, and the bulk o f marginal farmers engage in rain-fed agriculture (figure 3.3).
24 The difference i s statistically significant using the Welch t-statistic at the 99% level o f confidence.
World Bank 2006 f reports a similar finding. 25
38
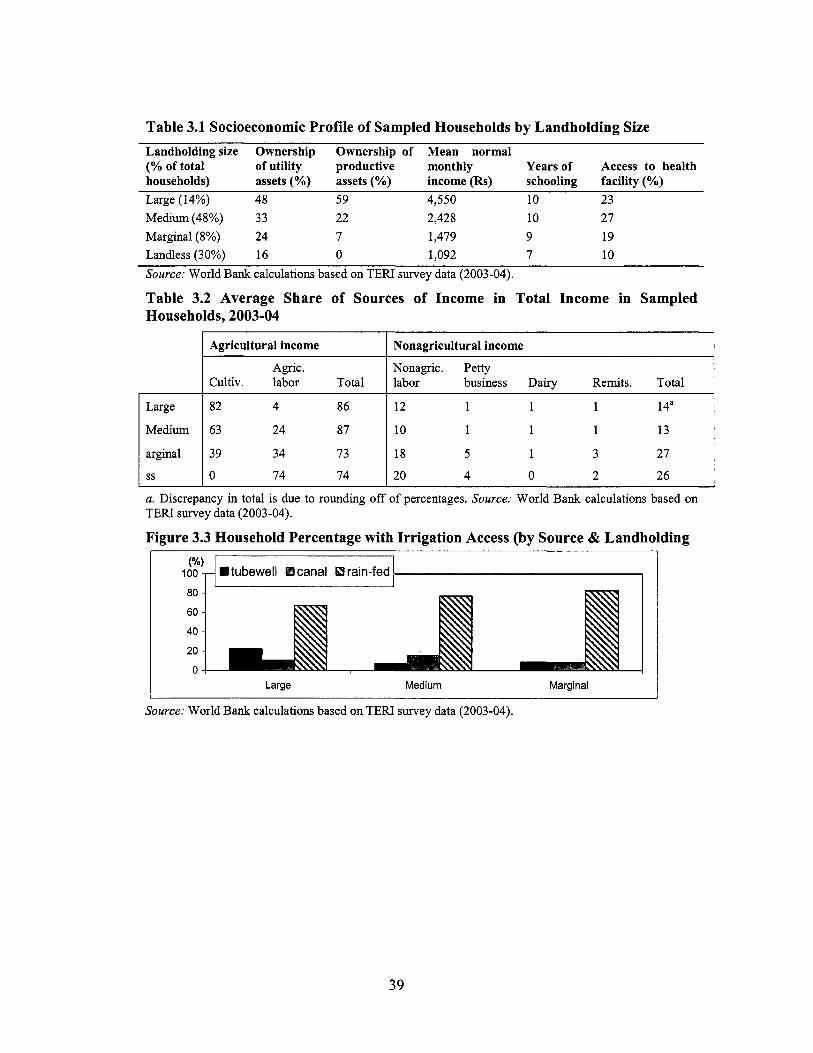
Table 3.1 Socioeconomic Profile of Sampled Households by Landholding Size Landholding size Ownership Ownership of Mean normal (% of total of utility productive monthly Years of Access to health households) assets (YO) assets (YO) income (Rs) schooling facility (YO) Large (14%) 48 59 4,550 10 23 Medium (48%) 33 22 2,428 10 27 Marginal (8%) 24 7 1,479 9 19 Landless (30%) 16 0 1,092 7 10
Table 3.2 Average Share of Sources o f Income in Total Income in Sampled Households, 2003-04
Source: World Bank calculations based on TEN survey data (2003-04).
Agricultural income
Agric. Cultiv. labor Total
Nonagricultural income
Nonagric. Petty labor business Dairy Remits. Total
Large
Medium
arginal
ss
I a0
60
40
20
0
82 4 86 12 1 1 1 14"
63 24 87 10 1 1 1 13
39 34 73 18 5 1 3 27
0 74 74 20 4 0 2 26
Large Medium Marginal
Source: World Bank calculations based on TERI survey data (2003-04).
39
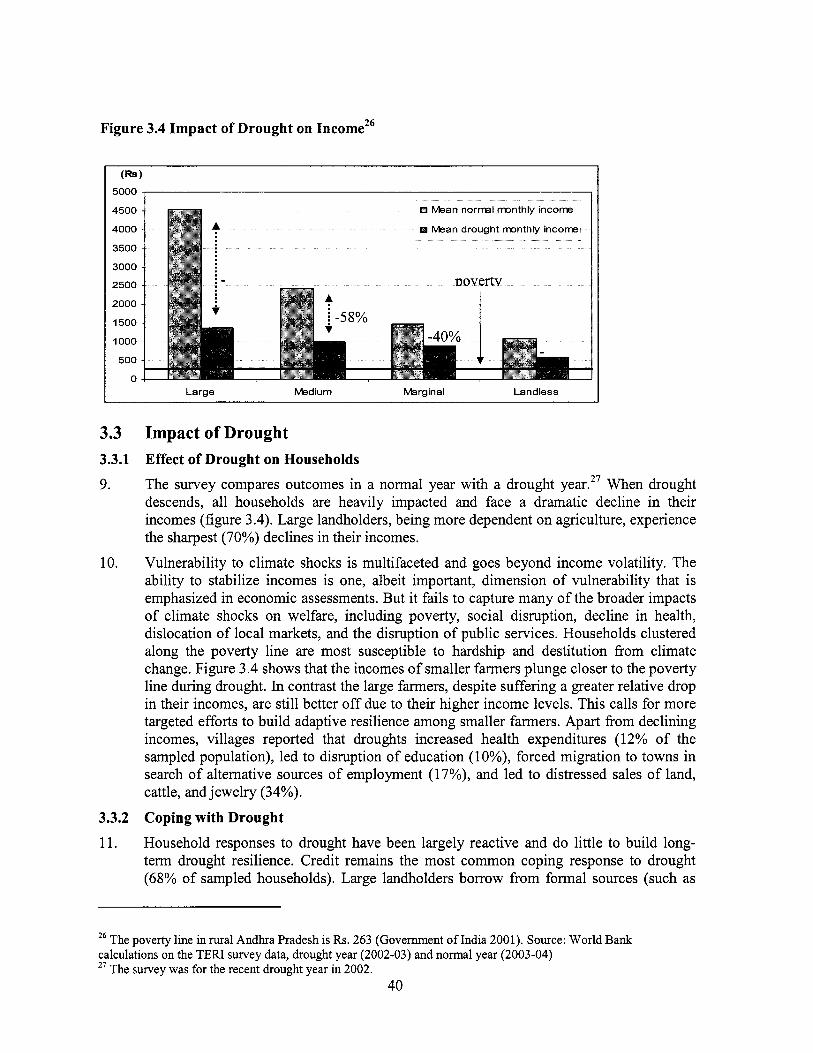
Figure 3.4 Impact of Drought on Income26
(e) 5000
4500
4000
3500
3000
2500
2000
1500
1000
500
0
~?II Mean normal monthly income
I Mean drought rrunthly income
Large Medium Marginal Landless I
3.3 3.3.1 9.
10.
3.3.2 11.
Impact o f Drought Effect o f Drought on Households The survey compares outcomes in a normal year with a drought year.27 When drought descends, al l households are heavily impacted and face a dramatic decline in their incomes (figure 3.4). Large landholders, being more dependent on agriculture, experience the sharpest (70%) declines in their incomes.
Vulnerability to climate shocks i s multifaceted and goes beyond income volatility. The ability to stabilize incomes is one, albeit important, dimension o f vulnerability that i s emphasized in economic assessments. But it fails to capture many o f the broader impacts o f climate shocks on welfare, including poverty, social disruption, decline in health, dislocation o f local markets, and the disruption o f public services. Households clustered along the poverty l ine are most susceptible to hardship and destitution from climate change. Figure 3.4 shows that the incomes o f smaller farmers plunge closer to the poverty line during drought. In contrast the large farmers, despite suffering a greater relative drop in their incomes, are st i l l better o f f due to their higher income levels. This calls for more targeted efforts to build adaptive resilience among smaller farmers. Apart from declining incomes, villages reported that droughts increased health expenditures (12% o f the sampled population), led to disruption o f education (lo%), forced migration to towns in search o f alternative sources o f employment (17%), and led to distressed sales o f land, cattle, and jewelry (34%).
Coping with Drought
Household responses to drought have been largely reactive and do little to build long- term drought resilience. Credit remains the most common coping response to drought (68% o f sampled households). Large landholders borrow from formal sources (such as
26 The poverty l i n e in rural Andhra Pradesh i s Rs. 263 (Government o f India 2001). Source: World Bank calculations on the TEN survey data, drought year (2002-03) and normal year (2003-04) 27 The survey was for the recent drought year in 2002.
40
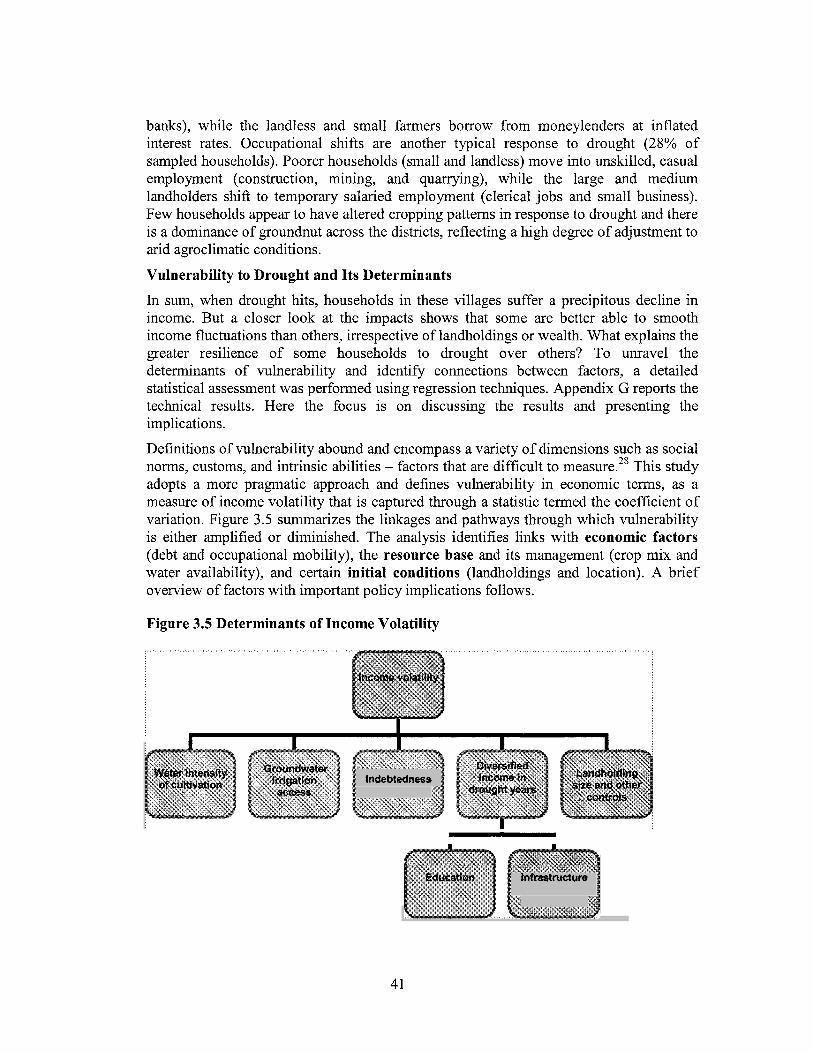
banks), while the landless and small farmers borrow from moneylenders at inflated interest rates. Occupational shifts are another typical response to drought (28% o f sampled households). Poorer households (small and landless) move into unskilled, casual employment (construction, mining, and quarrying), while the large and medium landholders shift to temporary salaried employment (clerical jobs and small business). Few households appear to have altered cropping patterns in response to drought and there i s a dominance o f groundnut across the districts, reflecting a high degree o f adjustment to arid agroclimatic conditions.
Vulnerability to Drought and I t s Determinants
In sum, when drought hits, households in these villages suffer a precipitous decline in income. But a closer look at the impacts shows that some are better able to smooth income fluctuations than others, irrespective o f landholdings or wealth. What explains the greater resilience o f some households to drought over others? To unravel the determinants o f vulnerability and identify connections between factors, a detailed statistical assessment was performed using regression techniques. Appendix G reports the technical results. Here the focus i s on discussing the results and presenting the implications.
Definitions o f vulnerability abound and encompass a variety o f dimensions such as social norms, customs, and intrinsic abilities - factors that are difficult to measure.28 This study adopts a more pragmatic approach and defines vulnerability in economic terms, as a measure o f income volatility that i s captured through a statistic termed the coefficient o f variation. Figure 3.5 summarizes the linkages and pathways through which vulnerability i s either amplified or diminished. The analysis identifies l i n k s with economic factors (debt and occupational mobility), the resource base and i t s management (crop mix and water availability), and certain initial conditions (landholdings and location). A brief overview o f factors with important pol icy implications follows.
Figure 3.5 Determinants of Income Volatility
Indebtedness
infrastructure
41
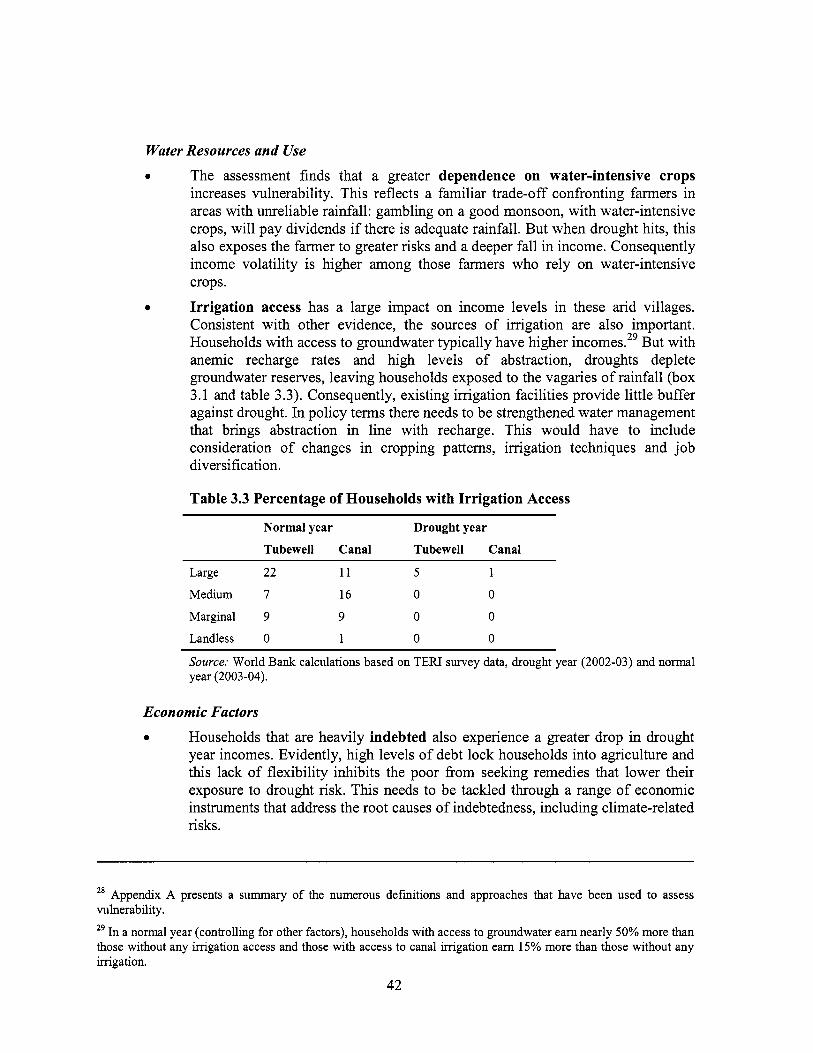
Water Resources and Use
0 The assessment finds that a greater dependence on water-intensive crops increases vulnerability. This reflects a familiar trade-off confronting farmers in areas with unreliable rainfall: gambling on a good monsoon, with water-intensive crops, will pay dividends if there i s adequate rainfall. But when drought hits, this also exposes the farmer to greater r isks and a deeper fa l l in income. Consequently income volatility i s higher among those farmers who rely on water-intensive crops.
Irrigation access has a large impact on income levels in these arid villages. Consistent with other evidence, the sources o f irrigation are also important. Households with access to groundwater typically have higher incomes.*’ But with anemic recharge rates and high levels o f abstraction, droughts deplete groundwater reserves, leaving households exposed to the vagaries o f rainfall (box 3.1 and table 3.3). Consequently, existing irrigation facilities provide little buffer against drought. In policy terms there needs to be strengthened water management that brings abstraction in l ine with recharge. This would have to include consideration o f changes in cropping patterns, irrigation techniques and job diversification.
0
Table 3.3 Percentage of Households with Irrigation Access
Normal year Drought year
Tubewell Canal Tubewell Canal
Large 22 11 5 1
Medium 7 16 0 0
Marginal 9 9 0 0
Landless 0 1 0 0
Source; World Bank calculations based on TEN survey data, drought year (2002-03) and normal year (2003-04).
Economic Factors
0 Households that are heavily indebted also experience a greater drop in drought year incomes. Evidently, high levels o f debt lock households into agriculture and this lack o f flexibility inhibits the poor from seeking remedies that lower their exposure to drought risk. This needs to be tackled through a range o f economic instruments that address the root causes o f indebtedness, including climate-related risks.
Appendix A presents a summary o f the numerous definitions and approaches that have been used to assess vulnerability.
29 In a normal year (controlling for other factors), households with access to groundwater earn nearly 50% more than those without any irrigation access and those with access to canal irrigation earn 15% more than those without any irrigation.
42
0 The ability to diversify income out o f agriculture i s an effective strategy for insulating incomes against drought. The analysis finds that there are two key factors that promote income diversification: infrastructure and education.
o Infrastructure stimulates broader regional development, thus permitting greater income diversification, which reduces income volatility.
o Education builds human capital and hence provides additional earning capacity to households, as wel l as the ability to cope with drought.
The implication is that these interventions bring additional cobenefits by building climate resilience. But these investments have a long lead time, so there is a need to develop tools to identify r isks and create systems to assure proactive interventions in vulnerable areas3'
3.4 14.
Future Prospects under Climate Change The assessment so far has focused on the past and has identified the determinants o f vulnerability and the common coping responses to drought. Looking forward, many o f the predicted effects o f climate change are expected to differ in kind and magnitude from current climate patterns. So history may offer only limited guidance on how to mitigate or prepare for these future risks. Accordingly this section uses the I M S to explore future climate scenarios and its impact on agricultural outputs and incomes. I t begins with a brief description o f climate projections and the resulting crop responses in the study area. I t then uses the economic model to ask how these changes might influence farming behavior, cropping patterns, and farm incomes. The following section explores possible strategic interventions that could help ameliorate some o f the adverse consequences.
3.4.1 Projections of Climate Change
15. Results are presented for two climate scenarios: A2 and B 2 and these are compared to a baseline that describes 30 weather events from 1961 to 1990.31 The system generates predictions for the Pennar basin in Andhra Pradesh, which includes the districts o f Anantapur and Chittoor. Looking to the future the climate model projects: e An average increase in annual precipitation o f about 8% (to approximately 709
millimeters) in the A2 scenario and 4% (to about 683 millimeters) in the B2 scenario.
This i s accompanied by increases in both the annual and kharif minimum and maximum temperatures. The average increase in the former could range from 2.5"C (B2) to 3.4"C (M), while the latter could range from 2.3 "C (B2) to 3.1"C
0
(W. There is also greater variability o f rainfall, both within and between years, and 0
this i s reflected in more erratic runoff with significantly reduced flows in dry years. Importantly, this greater variability implies a greater frequency o f l o w rainfall years that would be categorized as drought events under current criteria.
30 Other controls include landholding size, village variables, etc. as detailed in the tables in Appendix G.
31 A 2 and B 2 are the IPCC scenarios. Projections are from 2071 to 2100. A 2 defines a wor ld o f high and r ising greenhouse gas levels with correspondingly more severe climate change. The B 2 wor ld i s one with a greater emphasis on sustainability and involves lower emissions (see box 2.2, chapter 2).
43
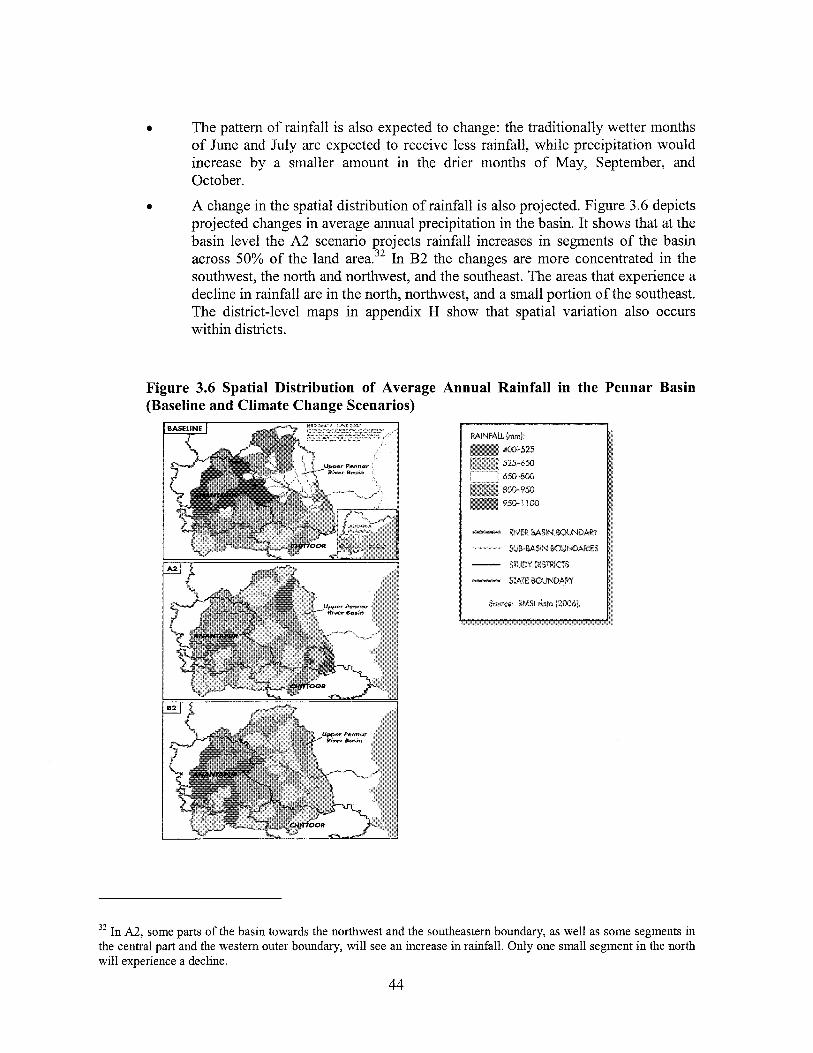
0 The pattern o f rainfall i s also expected to change: the traditionally wetter months o f June and July are expected to receive less rainfall, while precipitation would increase by a smaller amount in the drier months o f May, September, and October.
projected changes in average annual precipitation in the basin. I t shows that at the basin level the A2 scenario projects rainfall increases in segments o f the basin across 50% o f the land area.32 In B2 the changes are more concentrated in the southwest, the north and northwest, and the southeast. The areas that experience a decline in rainfall are in the north, northwest, and a small portion o f the southeast. The district-level maps in appendix H show that spatial variation also occurs within districts.
0 A change in the spatial distribution o f rainfall i s also projected. Figure 3.6 depicts
Figure 3.6 Spatial Distribution of Average Annual Rainfall in the Pennar Basin (Baseline and Climate Change Scenarios)
- RIVER
- STATE EOUNDARY
32 In A2, some parts o f the basin towards the northwest and the southeastern boundary, as we l l as some segments in the central part and the western outer boundary, wil l see an increase in rainfall. Only one small segment in the north wi l l experience a decline.
44
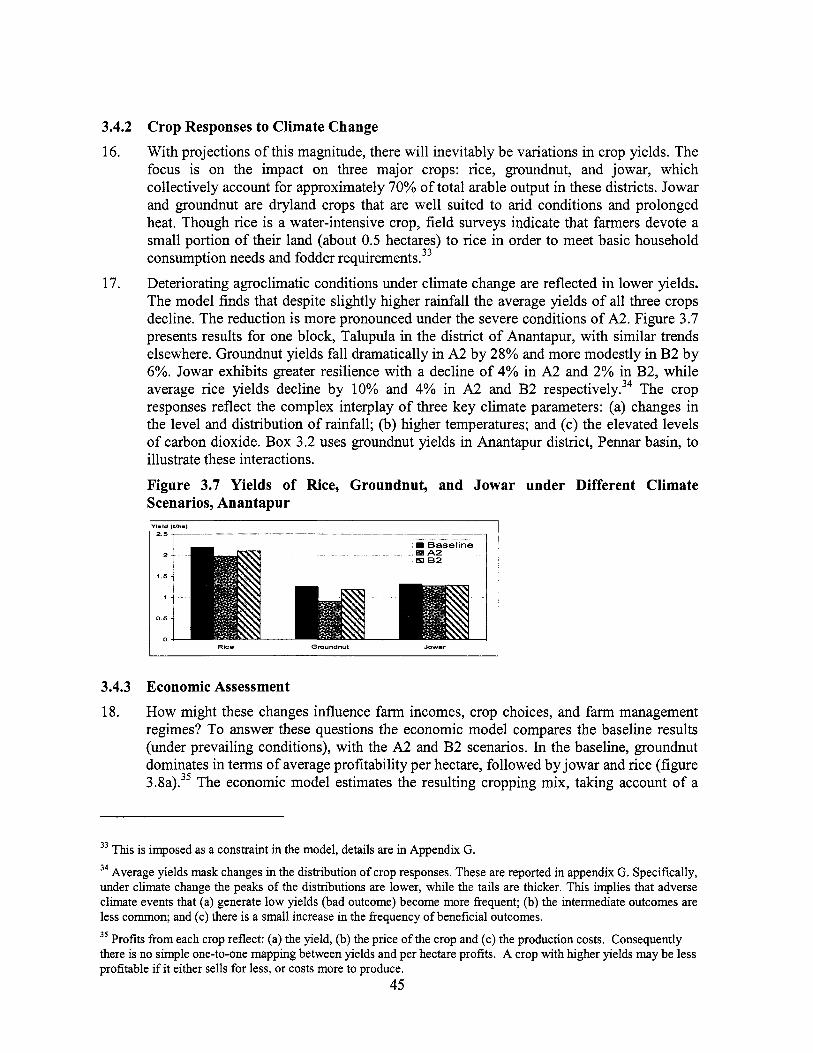
3.4.2 16.
17.
3.4.3 18.
Crop Responses to Climate Change
With projections o f this magnitude, there wil l inevitably be variations in crop yields. The focus i s on the impact on three major crops: rice, groundnut, and jowar, which collectively account for approximately 70% o f total arable output in these districts. Jowar and groundnut are dryland crops that are well suited to arid conditions and prolonged heat. Though rice is a water-intensive crop, field surveys indicate that farmers devote a small portion o f their land (about 0.5 hectares) to rice in order to meet basic household consumption needs and fodder requirement^.^^ Deteriorating agroclimatic conditions under climate change are reflected in lower yields. The model finds that despite slightly higher rainfall the average yields o f all three crops decline. The reduction is more pronounced under the severe conditions o f A2. Figure 3.7 presents results for one block, Talupula in the district o f Anantapur, with similar trends elsewhere. Groundnut yields fal l dramatically in A2 by 28% and more modestly in B 2 by 6%. Jowar exhibits greater resilience with a decline o f 4% in A2 and 2% in B2, while average rice yields decline by 10% and 4% in A2 and B 2 re~pect ive ly .~~ The crop responses reflect the complex interplay o f three key climate parameters: (a) changes in the level and distribution o f rainfall; (b) higher temperatures; and (c) the elevated levels o f carbon dioxide. Box 3.2 uses groundnut yields in Anantapur district, Pennar basin, to illustrate these interactions.
Figure 3.7 Yields of Rice, Groundnut, and Jowar under Different Climate Scenarios, Anantapur
I Baseline 2
I 5
1
0 5
Economic Assessment How might these changes influence farm incomes, crop choices, and farm management regimes? To answer these questions the economic model compares the baseline results (under prevailing conditions), with the A2 and B 2 scenarios. In the baseline, groundnut dominates in terms o f average profitability per hectare, followed by jowar and rice (figure 3.8a).35 The economic model estimates the resulting cropping mix, taking account o f a
33 T h i s is imposed as a constraint in the model, details are in Appendix G.
34 Average yields mask changes in the distribution o f crop responses. These are reported in appendix G. Specifically, under climate change the peaks o f the distributions are lower, while the ta i l s are thicker. T h i s implies that adverse climate events that (a) generate l o w yields (bad outcome) become more frequent; (b) the intermediate outcomes are less common; and (c) there i s a s m a l l increase in the frequency o f beneficial outcomes.
Profits f r o m each crop reflect: (a) the yield, (b) the price o f the crop and (c) the production costs. Consequently there i s no simple one-to-one mapping between yields and per hectare profits. A crop with higher yields may be less profitable if it either sells for less, o r costs more to produce.
45
35
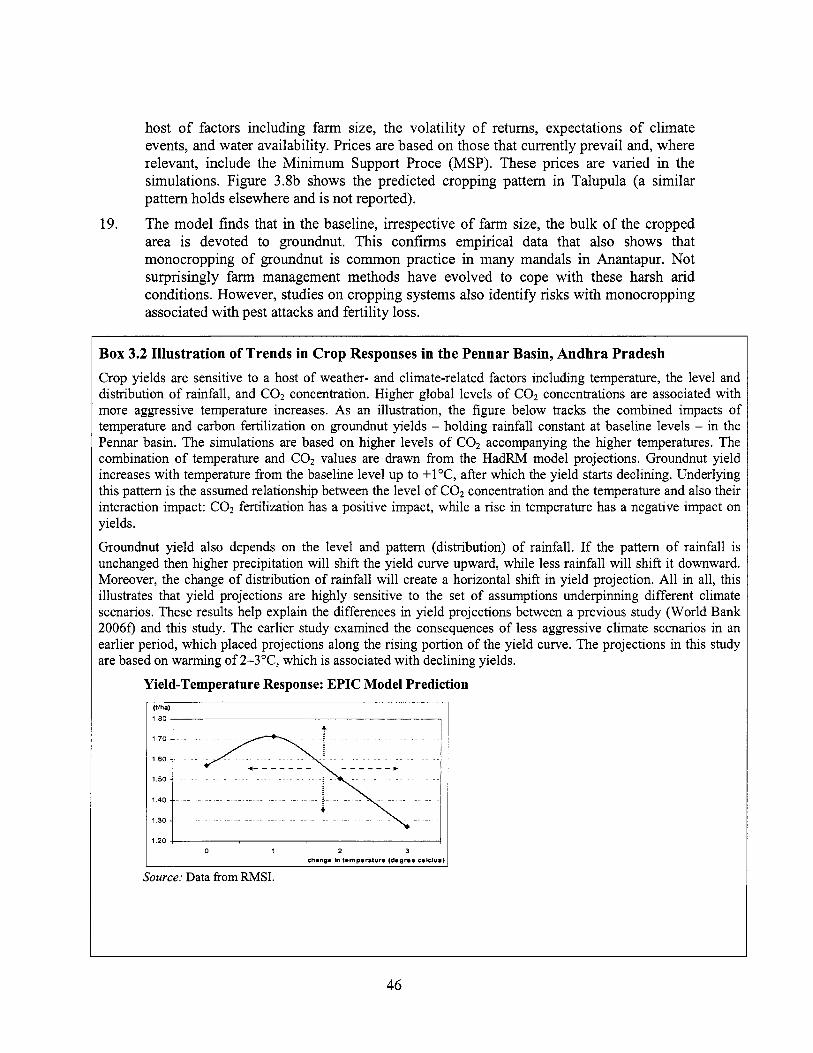
host o f factors inc lud ing farm size, the vo lat i l i ty o f returns, expectations o f c l imate events, and water availabil ity. Prices are based on those that current ly p reva i l and, where relevant, include the Minimum Support Proce (MSP). These prices are var ied in the simulations. F igure 3.8b shows the predicted cropping pattern in Talupula (a s imi lar pattern ho lds elsewhere and i s not reported).
The m o d e l f inds that in the baseline, irrespective o f farm size, the bulk o f the cropped area i s devoted to groundnut. Th is conf i rms empir ical data that also shows that monocropping o f groundnut i s c o m m o n practice in many mandals in Anantapur. Not surpr is ingly farm management methods have evolved to cope with these harsh arid conditions. However, studies on cropping systems also i den t i f y r isks with monocropping associated with pest attacks and fer t i l i ty loss.
19.
Box 3.2 Illustration of Trends in Crop Responses in the Pennar Basin, Andhra Pradesh Crop yields are sensitive to a host o f weather- and climate-related factors including temperature, the level and distribution o f rainfall, and COz concentration. Higher global levels o f C02 concentrations are associated with more aggressive temperature increases. As an illustration, the figure below tracks the combined impacts o f temperature and carbon fertilization on groundnut yields - holding rainfall constant at baseline levels - in the Pennar basin. The simulations are based o n higher levels o f C02 accompanying the higher temperatures. The combination o f temperature and C02 values are drawn from the HadRM model projections. Groundnut yield increases with temperature f rom the baseline level up to +l"C, after which the y ield starts declining. Underlying this pattern i s the assumed relationship between the level o f C 0 2 concentration and the temperature and also their interaction impact: C02 fertilization has a positive impact, while a rise in temperature has a negative impact on yields.
Groundnut y ie ld also depends on the level and pattern (distribution) o f rainfall. If the pattern o f rainfall i s unchanged then higher precipitation will shift the y ield curve upward, while less rainfall will shift it downward. Moreover, the change o f distribution o f rainfall will create a horizontal shift in yield projection. All in all, this illustrates that y ie ld projections are highly sensitive to the set o f assumptions underpinning different climate scenarios. These results help explain the differences in yield projections between a previous study (World Bank 20060 and this study. The earlier study examined the consequences o f less aggressive climate scenarios in an earlier period, which placed projections along the rising portion o f the yield curve. The projections in this study are based on warming o f 2-3"C, which i s associated with declining yields.
Yield-Temperature Response: EPIC Model Prediction
1 8 0 -
1 70 -
160 -
150 -
140 -
1 30 -
120 7
46
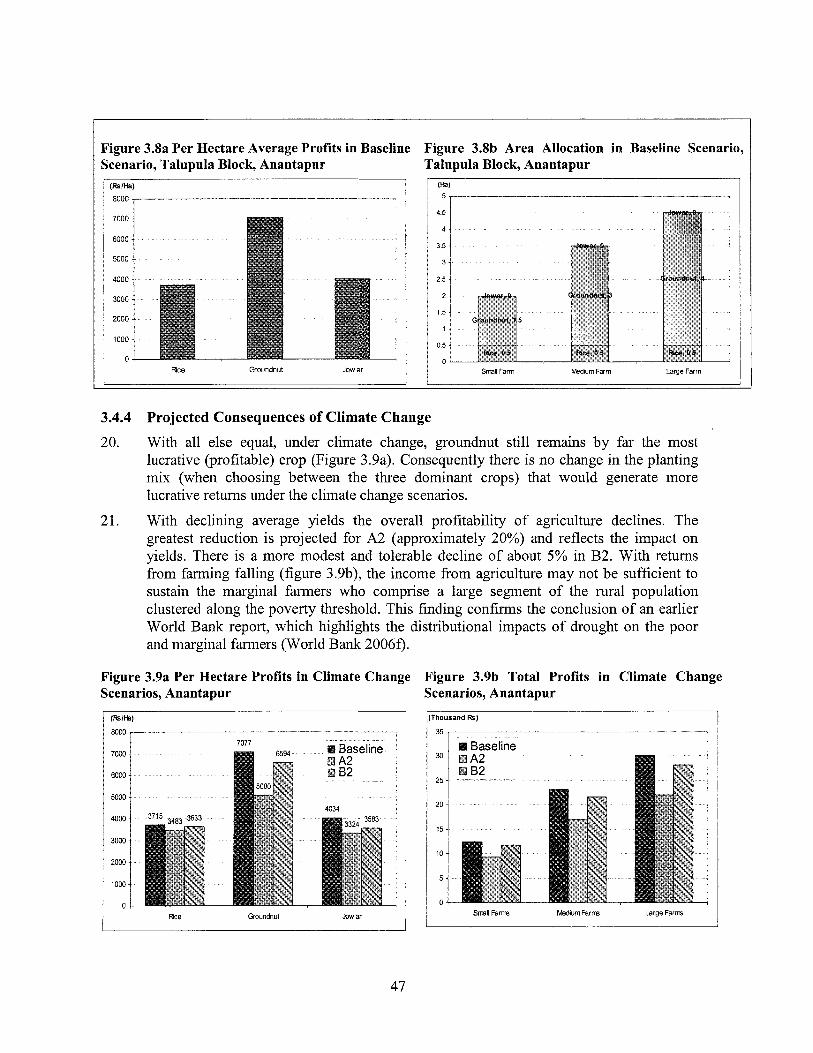
Figure 3.8a Per Hectare Average Profits in Baseline Figure 3.8b Area Allocation in Baseline Scenario, Scenario, Talupula Block, Anantapur T i u p u l a Block, Anantapur
- - - - I 7000
6000
5000
4000
3000
2000
1000
0 Rce Groundnut Jowar Small Farm Wdium Farm Large Farm
3.4.4 20.
Projected Consequences of Climate Change
With all else equal, under climate change, groundnut st i l l remains by far the most lucrative (profitable) crop (Figure 3.9a). Consequently there is no change in the planting mix (when choosing between the three dominant crops) that would generate more lucrative returns under the climate change scenarios.
21. With declining average yields the overall profitability o f agriculture declines. The greatest reduction i s projected for A2 (approximately 20%) and reflects the impact on yields. There i s a more modest and tolerable decline o f about 5% in B2. With returns from farming falling (figure 3.9b), the income from agriculture may not be sufficient to sustain the marginal farmers who comprise a large segment o f the rural population clustered along the poverty threshold. This finding confirms the conclusion o f an earlier World Bank report, which highlights the distributional impacts o f drought on the poor and marginal farmers (World Bank 20060.
Figure 3.9a Per Hectare Profits in Climate Change Figure 3.9b Total Profits in Climate Change Scenarios, Anantapur Scenarios, Anantapur
7000
6000
5000
4000
3000
2OW
1000
0 Rice Groundnut .bw ai
(Thousand Rs) 35 ,- ___
.
I
I I Smll Farm MedwmFarm Large Farm I
47
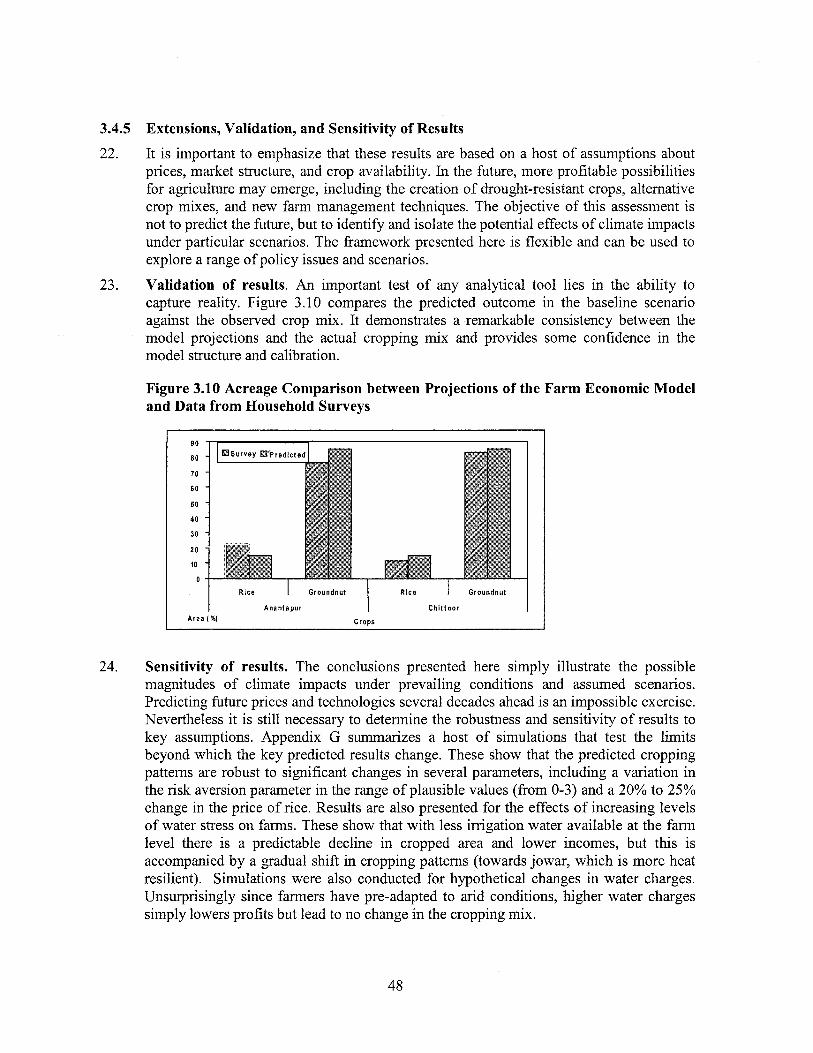
3.4.5 22.
23.
24.
Extensions, Validation, and Sensitivity of Results
I t i s important to emphasize that these results are based on a host o f assumptions about prices, market structure, and crop availability. In the future, more profitable possibilities for agriculture may emerge, including the creation o f drought-resistant crops, alternative crop mixes, and new farm management techniques. The objective o f th i s assessment is not to predict the future, but to identify and isolate the potentia1 effects o f climate impacts under particular scenarios. The framework presented here i s flexible and can be used to explore a range o f policy issues and scenarios.
Validation of results. An important test o f any analytical tool lies in the ability to capture reality. Figure 3.10 compares the predicted outcome in the baseline scenario against the observed crop mix. It demonstrates a remarkable consistency between the model projections and the actual cropping m i x and provides some confidence in the model structure and calibration.
Figure 3.1 0 Acreage Comparison between Projections of the F a r m Economic Model and Data from Household Surveys
90
80
7 0
6 0
50
40
30
20
10
0 R i c e I Groundnut
Ch i t t oor
Rice I Groundnut
Anantapur 1 Area C r a m
Sensitivity of results. The conclusions presented here simply illustrate L e possible magnitudes o f climate impacts under prevailing conditions and assumed scenarios. Predicting future prices and technologies several decades ahead i s an impossible exercise. Nevertheless i t i s s t i l l necessary to determine the robustness and sensitivity o f results to key assumptions. Appendix G summarizes a host o f simulations that test the limits beyond which the key predicted results change. These show that the predicted cropping patterns are robust to significant changes in several parameters, including a variation in the r isk aversion parameter in the range o f plausible values (from 0-3) and a 20% to 25% change in the price o f rice. Results are also presented for the effects o f increasing levels o f water stress on farms. These show that with less imgation water available at the farm level there i s a predictable decline in cropped area and lower incomes, but this i s accompanied by a gradual shift in cropping patterns (towards jowar, which is more heat resilient). Simulations were also conducted for hypothetical changes in water charges. Unsurprisingly since farmers have pre-adapted to arid conditions, higher water charges simply lowers profits but lead to no change in the cropping mix.
48
3.5 25.
26.
27.
Pulling Together the Pieces: Policy Implications I s there a need for addi t ional policy to promote adaptation? The ability to cope with adverse cl imate events depends on the leve l o f weal th and the economic and social infrastructure o f communities. So as Andhra Pradesh grows m o r e prosperous, i t wil l generate m o r e job opportunities and inev i tab ly build greater immunity to c l imate fluctuations. T h e m y r i a d government programs that deal with education, infrastructure, and job creation also serve a complementary object ive o f building c l imate r i s k resilience. In this context, adaptation policy can b e v i e w e d as an adjunct to good development pol ic ies that promote equitable growth. All o f th is might suggest that adaptation to c l imate change requires no addi t ional policy priority or interventions.
In spite o f this, there are high r isks associated with complacency that cou ld magnify the costs o f c l imate change. Though the project ions in this report are broad, they suggest a considerable and mounting human toll from cl imate change and highlight the need and urgency for mitigating the avoidable costs, part icular ly among the vulnerable sections o f society.
Box 3.3 Andhra Pradesh Drought Adaptation Initiative: Putting Adaptation into Practice A Drought Adaptation Initiative pi lot i s being implemented in selected villages o f Mahabubnagar and Anantapur districts by the Society for the Elimination o f Rural Poverty and the Watershed Support Services and Activities Network, in collaboration with district collectors in the pi lot districts and under the oversight o f the state Department o f Rural Development. A state government interdepartmental steering committee and a convergence committee comprising the commissioner for rural development and National Rural Employment Guarantee Scheme representatives have been set up to oversee project implementation. The initiative will be implemented over a period o f three years with technical assistance from the Wor ld Bank and seeks to (a) identify gaps and missing links in the ongoing drought-related programs and activities in Andhra Pradesh; (b) facilitate institutional integration at state, district, and community levels for delivering drought-related assistance; (c) design and test the innovative methods and instruments for helping selected communities to adapt to drought, targeting different groups within these communities; and (d) improve awareness o f drought adaptation options and approaches and disseminate the results o f the pi lot efforts to build support and demand for wider replication.
The Drought Adaptation Initiative pi lot focuses i t s resources o n four areas o f interventions: (a) management o f common natural resources, dealing with pro-poor water resource (particular groundwater) and common land management; (b) production systems, focusing on diversification and intensification in agnculture, livestock, and horticulture, with technology innovation; (c) economic instruments and marketing, with a focus on improved access to markets, credit, and insurance for new and innovative activities specifically designed for drought adaptation; and (d) institutional support and capacity building, with a focus on institutional strengthening o f farmers and other villager organizations, including such community-based organizations as self-help groups, watershed committees, and credit committees. Pending successful outcomes, the p i lo t i s expected to build support and demand for wider replication in Andhra Pradesh and provide lessons to other semiarid states.
T h e Government o f Andhra Pradesh assigns a high priority and commi tmen t to strengthening development outcomes, as indicated by i t s support to robust r e l i e f machinery and recent strategies to build long- term resil ience to c l imate r isks among rural
49
28.
communities. Under the oversight o f the Department o f Rural Development the state i s implementing an innovative drought adaptation pilot initiative in dryland areas (box 3.3). In addition, there are a number o f sectoral programs in irrigation, agriculture, water conservation, rural development, and forestry that provide a comprehensive and varied platform for strengthening adaptation outcomes on the basis o f more effective synergy and coordination (box 3.4). This foundation can be considerably strengthened through additional and complementary initiatives and approaches that would strengthen and harmonize many o f the existing initiatives.
The focus would be on four priority areas: (a) diagnostic risk assessment tools to generate information for integrating climate r isks in policy; (b) management o f natural resources - water and agriculture; (c) management o f climate risks through economic instruments; and (d) institutional changes to manage climate risks.
3.5.1 29.
Box 3.4 Andhra Pradesh Sectoral Programs: Comprehensive Base to Build Adaptation Approaches Andhra Pradesh has several long-standing governmental programs are currently in operation that address parts o f a comprehensive drought adaptation strategy. These government programs are briefly reviewed below. 0 Water resources programs. Apart from a number o f medium irrigation projects that are
planned or under way, numerous community tanks (small surface water reservoirs) are being revived and expanded to improve tank system-based livelihoods through the Department o f Irrigation. In addition, the state launched a micro-irrigation scheme to promote the use o f drips, sprinklers, and rain guns on farmer fields.
0 Watershed programs. Centrally sponsored watershed programs in drought-prone areas are supplemented by state-sponsored programs, which are sometimes donor assisted. State government watershed programs include the Andhra Pradesh Rural Livelihoods Program, assisted by the Department for International Development, Government o f U.K.; the Integrated Watershed Development Program; and the Employment Guarantee Scheme, which uses relief-time labor to construct soil and water conservation structures.
0 Agriculture and forestry. Special programs on crop diversification and sustainable dryland farming combined with incentives (for example seed subsidies) are underway. The state i s considering incentive mechanisms for farmers that adopt the system o f rice intensification practices to encourage wider adoption o f this water-saving technology, especially in the rabi season. The vana samrakshana samitis in Andhra Pradesh, as part o f the Government o f India’s forestry programs, promote community participation in protecting existing forests and new plantations, supported by bans on open grazing and promotion o f stall feeding.
0 Rural livelihoods. Swarnajayanti Gram Swarozgar Yojana, the centrally sponsored self- employment program for nonfarm-based livelihoods, i s complemented by state government programs that support rural livelihoods, including the Andhra Pradesh Rural Livelihoods Program and the Indira Krant i Patham. Bo th are statewide poverty reduction projects aimed at building strong institutions for the poor and enhancing their livelihood opportunities through community investment funds. Through these programs, the feasibility o f strengthening the employment components in the National Rural Employment Guarantee Scheme through the inclusion o f innovative activities (for example fodder production, farm composting, and tank desiltation) in rain-fed farming systems i s being explored.
Information on Vulnerabilities and Risks The impacts o f climate change are expected to be heterogeneous and spatially variable, suggesting the need for tools to identify local vulnerabilities, potential impacts, and risks. A recent Bank assessment has also emphasized the need for such assessments (World
50
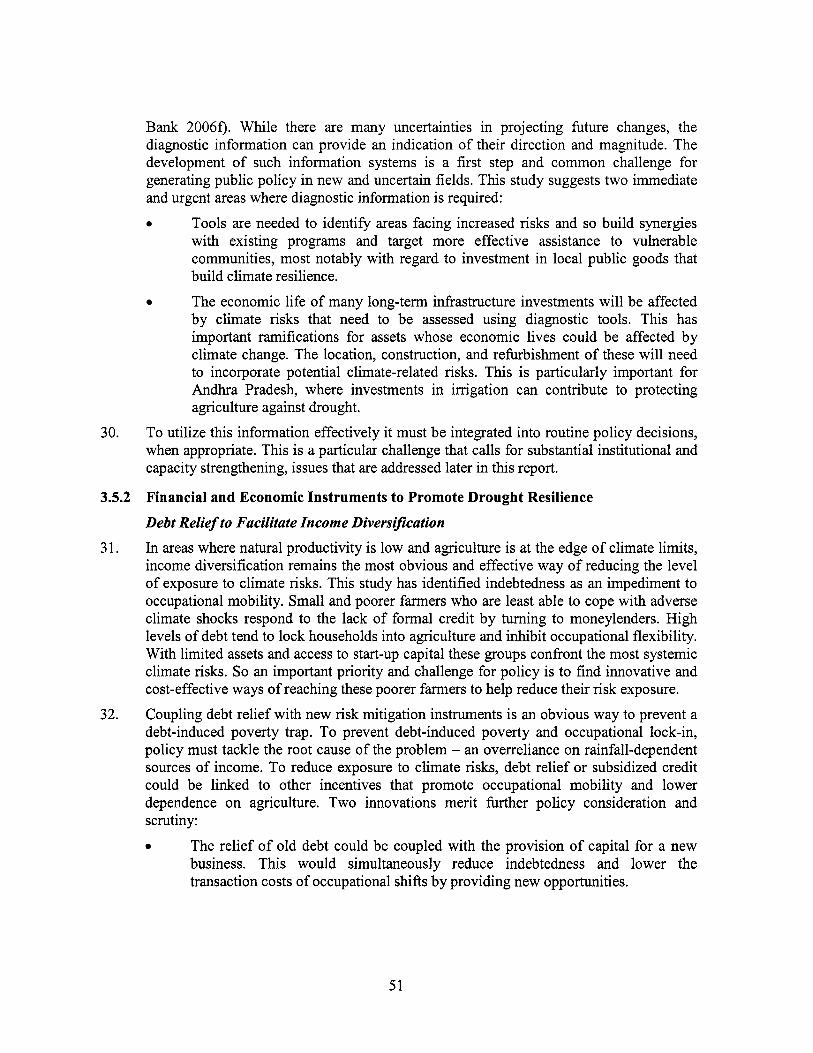
Bank 20060. While there are many uncertainties in projecting future changes, the diagnostic information can provide an indication o f their direction and magnitude. The development o f such information systems i s a first step and common challenge for generating public pol icy in new and uncertain fields. This study suggests two immediate and urgent areas where diagnostic information is required: e Tools are needed to identify areas facing increased risks and so build synergies
with existing programs and target more effective assistance to vulnerable communities, most notably with regard to investment in local public goods that build climate resilience.
by climate r isks that need to be assessed using diagnostic tools. This has important ramifications for assets whose economic lives could be affected by climate change. The location, construction, and refurbishment o f these wil l need to incorporate potential climate-related risks. This i s particularly important for Andhra Pradesh, where investments in irrigation can contribute to protecting agriculture against drought.
To utilize this information effectively i t must be integrated into routine pol icy decisions, when appropriate. This i s a particular challenge that calls for substantial institutional and capacity strengthening, issues that are addressed later in this report.
Financial and Economic Instruments to Promote Drought Resilience
Debt Relief to Facilitate Income Diversification
In areas where natural productivity i s l ow and agriculture is at the edge o f climate limits, income diversification remains the most obvious and effective way o f reducing the level o f exposure to climate risks. This study has identified indebtedness as an impediment to occupational mobility. Small and poorer farmers who are least able to cope with adverse climate shocks respond to the lack o f formal credit by turning to moneylenders. High levels o f debt tend to lock households into agriculture and inhibit occupational flexibility. With limited assets and access to start-up capital these groups confront the most systemic climate risks. So an important priority and challenge for pol icy i s to find innovative and cost-effective ways o f reaching these poorer farmers to help reduce their risk exposure.
Coupling debt rel ief with new risk mitigation instruments i s an obvious way to prevent a debt-induced poverty trap. To prevent debt-induced poverty and occupational lock-in, policy must tackle the root cause o f the problem - an overreliance on rainfall-dependent sources o f income. To reduce exposure to climate risks, debt r e l i e f or subsidized credit could be linked to other incentives that promote occupational mobil i ty and lower dependence on agriculture. Two innovations merit further pol icy consideration and scrutiny:
e The economic l i f e o f many long-term infrastructure investments wil l be affected
30.
3.5.2
3 1.
32.
e The rel ief o f o ld debt could be coupled with the provision o f capital for a new business. This would simultaneously reduce indebtedness and lower the transaction costs o f occupational shifts by providing new opportunities.
51
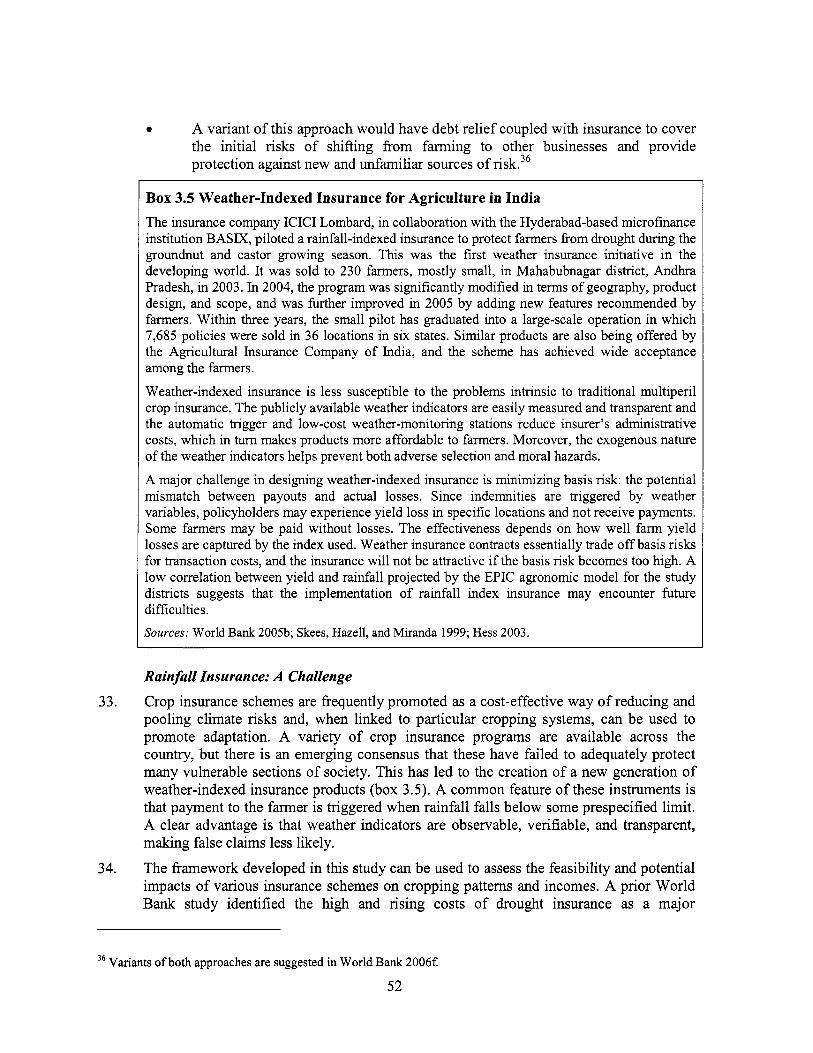
33.
34.
0 A variant o f th is approach would have debt r e l i e f coupled with insurance t o cover the initial r isks o f shi f t ing from farming to other businesses and prov ide protect ion against n e w and unfamiliar sources o f risk.36
Box 3.5 Weather-Indexed Insurance for Agriculture in India The insurance company I C I C I Lombard, in collaboration with the Hyderabad-based microfinance institution BASIX, piloted a rainfall-indexed insurance to protect farmers f rom drought during the groundnut and castor growing season. This was the f i rs t weather insurance initiative in the developing world. It was sold to 230 farmers, mostly small, in Mahabubnagar district, Andhra Pradesh, in 2003. In 2004, the program was significantly modified in terms o f geography, product design, and scope, and was further improved in 2005 by adding new features recommended by farmers. Within three years, the small p i lot has graduated into a large-scale operation in which 7,685 policies were sold in 36 locations in six states. Similar products are also being offered by the Agncultural Insurance Company o f India, and the scheme has achieved wide acceptance among the farmers.
Weather-indexed insurance i s less susceptible to the problems intrinsic to traditional multiperil crop insurance. The publicly available weather indicators are easily measured and transparent and the automatic trigger and low-cost weather-monitoring stations reduce insurer’s administrative costs, which in turn makes products more affordable to farmers. Moreover, the exogenous nature o f the weather indicators helps prevent both adverse selection and moral hazards.
A major challenge in designing weather-indexed insurance i s minimizing basis r isk: the potential mismatch between payouts and actual losses. Since indemnities are triggered by weather variables, policyholders may experience yield loss in specific locations and not receive payments. Some farmers may be paid without losses. The effectiveness depends on how wel l farm y ie ld losses are captured by the index used. Weather insurance contracts essentially trade o f f basis r i sks for transaction costs, and the insurance will not be attractive if the basis r i sk becomes too high. A l o w correlation between yield and rainfall projected by the EPIC agronomic model for the study districts suggests that the implementation o f rainfall index insurance may encounter future difficulties. Sources: World Bank 2005b; Skees, Hazell, and Miranda 1999; Hess 2003.
Rainfall Insurance: A Challenge Crop insurance schemes are f requent ly p romoted as a cost-effective way o f reducing and poo l i ng c l imate r isks and, w h e n l i nked to part icular cropping systems, can b e used to promote adaptation. A var iety o f crop insurance programs are available across the country, but there i s an emerging consensus that these have fai led t o adequately protect many vulnerable sections o f society. Th i s has l e d to the creation o f a n e w generation o f weather-indexed insurance products (box 3.5). A common feature o f these instruments i s that payment to the farmer i s triggered w h e n rainfall fa l ls b e l o w some prespecified limit. A clear advantage i s that weather indicators are observable, verif iable, and transparent, making false c la ims less l ikely.
The f ramework developed in this study can b e used to assess the feasibi l i ty and potent ia l impacts o f various insurance schemes on cropping patterns and incomes. A prior World Bank study ident i f ied the high and r i s i n g costs o f drought insurance as a major
Variants o f both approaches are suggested in World Bank 2006f 36
52
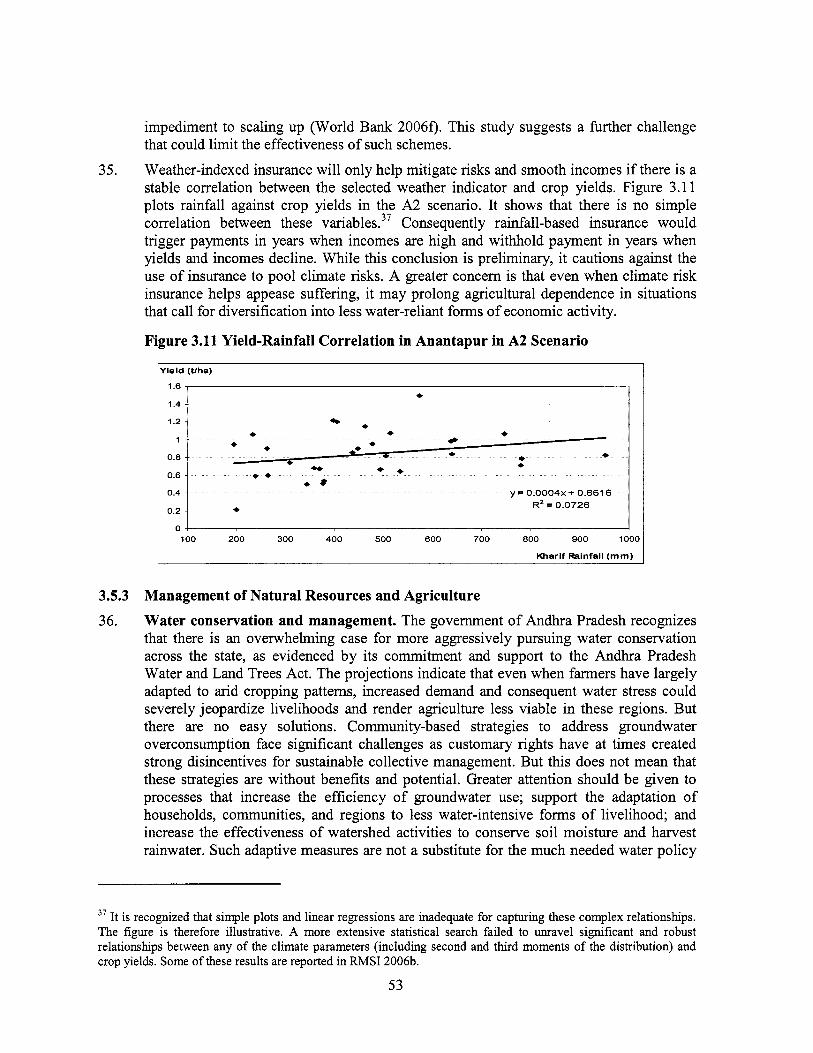
impediment to scaling up (World Bank 20060. This study suggests a further challenge that could limit the effectiveness o f such schemes.
Weather-indexed insurance wil l only help mitigate risks and smooth incomes if there i s a stable correlation between the selected weather indicator and crop yields. Figure 3.11 plots rainfall against crop yields in the A2 scenario. I t shows that there i s no simple conelation between these variables.37 Consequently rainfall-based insurance would trigger payments in years when incomes are high and withhold payment in years when yields and incomes decline. While this conclusion is preliminary, it cautions against the use o f insurance to pool climate risks. A greater concern is that even when climate r i s k insurance helps appease suffering, it may prolong agricultural dependence in situations that call for diversification into less water-reliant forms o f economic activity.
Figure 3.11 Yield-Rainfall Correlation in Anantapur in A2 Scenario
35.
/Yield (tlha)
1.6
1.4
1.2
1
0.8
0.6
0.4
0.2
y=O.OOO4x+O.6616 R2 = 0.0726
0 4 I 100 200 300 400 500 600 700 800 900 1000
Kharlf Rainfall (mm)
3.5.3 Management of Natural Resources and Agriculture 36. Water conservation and management. The government o f Andhra Pradesh recognizes
that there i s an overwhelming case for more aggressively pursuing water conservation across the state, as evidenced by its commitment and support to the Andhra Pradesh Water and Land Trees Act. The projections indicate that even when farmers have largely adapted to arid cropping patterns, increased demand and consequent water stress could severely jeopardize livelihoods and render agriculture less viable in these regions. But there are no easy solutions. Community-based strategies to address groundwater overconsumption face significant challenges as customary r i gh ts have at times created strong disincentives for sustainable collective management. But this does not mean that these strategies are without benefits and potential. Greater attention should be given to processes that increase the efficiency o f groundwater use; support the adaptation o f households, communities, and regions to less water-intensive forms o f livelihood; and increase the effectiveness o f watershed activities to conserve soil moisture and harvest rainwater. Such adaptive measures are not a substitute for the much needed water pol icy
37 I t i s recognized that simple plots and linear regressions are inadequate for capturing these complex relationships. The figure is therefore illustrative. A more extensive statistical search failed to unravel significant and robust relationships between any o f the climate parameters (including second and third moments o f the distribution) and crop yields. Some o f these results are reported in R M S I 2006b.
53
reform that would l ikely enable the control o f groundwater demand at the wider geographic scale necessary for effective management. However, they provide feasible interim measures for reducing vulnerabilities.
Agriculture diversification. There is already much evidence that farmers in Anantapur and Chittoor have adjusted to arid conditions by growing groundnut. Though groundnut i s well suited to arid conditions, increased rnonocropping and declining diversity can increase vulnerability to disease and pests, unreliable rainfall, and price fluctuations. This suggests the need for extension o f support systems in rain-fed areas that promote alternative and equally profitable dryland cropping systems. Recognizing these risks, the government o f Andhra Pradesh has initiated a pi lot scheme to encourage diversification into less water intensive crops, such as maize, oilseeds, soybean, Bengal gram, and pulses. Figure 3.12 and 3.13 illustrate the current cultivation patterns and the government’s diversification target for Anantapur.
Water-intensive rice, currently grown in these areas, serves an essential subsistence need for food and fodder. Research and extension on various forms o f dry paddy irrigation are warranted. Emerging methods o f rice cultivation, such as the system o f rice intensification (SRI) currently being piloted in the state, are innovative and hold promise for scaling up. Indigenous inputs and community-managed support systems for services and inputs appropriate for dryland farming also offer further potential for promoting climate resilience in agriculture. Ongoing nonpesticide management practices supported by the government and the maintenance o f community seed buffers for diverse crops are additional strategies that would reduce the cost o f cultivation and consequently also the debt burden o f farmers. In addition, the importance o f livestock to rural livelihoods in marginal cropping systems is increasingly being recognized as a short term response, but i t comes with risks (box 3.6).
Figure 3.12 Cropping Pattern in Anantapur
37.
38.
Figure 3.13 Proposed Crop Diversification I I I I
100%
90%
80%
70%
60%
50%
40%
30%
20%
10%
0%
Anantapur: Total area proposed for crop diversification during kharif and rabi 2005106
(in hectares)
5%
- 95%
B1 Groundnut. Kharif 2005/06 I Paddy - Rabi 2005/06 1 199697 1997-98 m a 9 9 1999-w 2000.01
b
Source: Department o f Agriculture. Source: Department of Agricul ture
Box 3.6 Livestock Systems Ownership o f livestock, especially in arid, semiarid and other noncongenial rain-fed settings, i s a critical component o f livelihood security. Being more drought resistant than crops, livestock can provide a safety net against drought, spreading the r isks and providing a more even stream o f income to eliminate seasonal hunger. But there i s mounting evidence that increased reliance on livestock dryland pastures could be counterproductive if it leads to further overgrazing and land
54
3.5.4 39.
degradation.
International experience points out that on arid lands rainfall fluctuations occur (a) f rom year to year; and (b) in cycles o f dry years followed by wetter years. This makes it diff icult to devise strategies and grazing management plans to cope with such variability. The light stoclung required to match average rainfall can reduce the risk o f forage deficit and financial loss due to death and starvation o f animals in l o w rainfall years. But this implies lower incomes in good years, although conserving forage may produce healthier animals that command higher prices. Instead, livestock policies in arid areas should facilitate rapid destocking in bad years through opportunistic herding strategies that rapidly adjust grazing pressures to ecological conditions, instead o f assuming that a single stoclung rate will be appropriate for a l l years. But the larger message i s that sustainability o f livestock management must be enhanced in volatile environments by developing support systems for water-resilient livestock systems and paying close attention to ecosystem productivity and sustainability.
In areas such as Anantapur, farmers tend to have a large number o f small ruminants, which, though drought resilient, can be more damaging to pastures. However, the market for this produce i s growing. Sheep and goats comprise roughly 70% o f the livestock population in these areas, with the remainder as mi lch animals. There i s much global evidence o f the pasture damage that can occur with an overreliance on goats. The strategy used by the smallholder mixed (crop- livestock) communities i s to purchase animals during the rainy season, when fodder i s available, and sel l them during the summer season when there i s a shortage o f fodder. But the greater incidence o f drought in recent years has contributed to a sharp decline in livestock populations. There i s a need for biomass intensification targeting small ruminants in these rain-fed areas for more secure and productive livestock systems. Other solutions include promoting the production o f fodder-yielding crops, the development o f fodder banks, and the chopping o f fodder by farmers under rain-fed or irrigated conditions to overcome the shortage o f green fodder during rabi, when the rainy season ends. Agriculture-embedded livestock systems have a strategic advantage and yield multiple benefits.
Institutional Needs and Priorities
There are a large number o f central- and state-sponsored programs for addressing drought in Andhra Pradesh that are being implemented under different guidelines and by various implementing and coordinating agencies. These include the watershed and river basin programs under the Drought-Prone Areas Programme, rural livelihood projects, and farmer schools under the Department o f Agriculture. Since natural boundaries seldom coincide with administrative borders, synergies are lost and these fragmented and uncoordinated approaches have rendered strategic management o f river basins and natural resources difficult. Programmatic approaches to drought adaptation are needed to coordinate priorities and fill gaps in these programs. This remains a challenging task as i t requires integration o f diverse programs within a common framework, not only with respect to financial allocation but also with institutions that operate at different levels o f government. While the foundation o f empowering community-based institutions (for example mandal samakhayas) has been promoted by a number o f rural livelihood programs in the state, further building their adaptive capacity to manage climate risks would only strengthen them in the right direction. The state’s current efforts to explore opportunities to strengthen the labor dimensions in the National Rural Employment Guarantee Scheme and i t s linkages with other programs holds great potential to catalyze sustainable development in rain-fed areas and set an example for other semiarid states o f India.
55
4. Climate Variability and Change: A Case Study in Drought- Prone Maharashtra
4.1 Introduction and Background 1. About a quarter o f India’s drought-prone districts are in Maharashtra, with 73% o f i t s
geographic area classified as semiarid. The state i s the second most populous in India with 98 mi l l ion people. I t has a large urban population, a literacy rate o f 77% (compared to the national average o f 65%), and an economy that contributes 20% o f the country’s manufacturing sector output and 13% o f its gross domestic product. Industry and services are wel l developed and the state remains the financial hub o f the country. But paradoxically, almost 47% o f i t s population lives below the poverty line. Acute poverty has largely retreated to the rural areas and reflects the l ow productivity o f the rural economy, on which 56 mi l l ion people s t i l l depend for employment and income.
Several factors account for the languishing state o f agriculture in Maharashtra: heavy monocropping in some areas, limited value addition to support agribusinesses, a degrading resource base, excessive withdrawal o f groundwater, and unfavorable market conditions. Furthermore, irrigation, which covers only 16% o f the total agricultural area, i s accessible mainly to larger farmers that have access to power and i s widely used for the cultivation o f sugarcane, a water-intensive cash crop (World Bank 2002a).
The drought proneness o f the state i s a critical additional stress factor that adversely affects productivity, livelihoods, and the rural economy. Ironically, the cultivated areas l i e predominantly in drought-affected districts (Ahmednagar, Solapur, Nashik, Pune, Sangli, Satara, Aurangabad, Beed, Osmanabad, Dhule, Jalgaon, and Buldhana), which account for 60% o f the net sown area. These areas l i e in the rain shadow region east o f the Sahayadri mountain ranges in Maharashtra and the adjacent Marathwada region. Aridity appears to be encroaching upon adjacent areas: districts that previously had moderately assured rainfall, such a Vidarbha, have been afflicted by declining and unpredictable rainfall with debilitating impacts on the local economy (box 4.1). Maharashtra experienced severe and successive years o f drought in 1970-1974 and 2000-2004.38 The state Employment Guarantee Scheme (EGS), a relief and rehabilitation program o f state support, was introduced in 1972 in response to a devastating drought.
Large tracts o f rain-fed agricultural land in the state have become unremunerative. The agrarian crisis has become acute, with signs o f a breakdown o f coping mechanisms among vulnerable groups whose exposure to drought appear to be increasing. For these reasons Maharashtra represents an important case for assessing the coping capacities o f communities and the underlying vulnerabilities associated with droughts.
2.
3.
4.
38 These periods refer to the fiscal years 197011, 197112, 197213, and 197314, and 200011, 200112, 200213, and 200314, respectively.
56
I Box 4.1 Rainfall Distribution in Maharashtra I Maharashtra is divided into 35 districts split among five regions: Vidarbha (in the northeast), Marathwada (in the south-central region), Khandesh (in the northwest), the rain shadow region (extending from the northeast to the southeast between the coatal districts and Marathwada), and Konkan/Western Ghats (in the southwest, on the coast). There i s a wide variation in the distribution o f rainfall across the state, with the coastal belt, the Konkan region, receiving more than 2,000 millimeters annually, with the second highest rainfall being recorded in the Vidarbha region. Overall, rainfall in Maharashtra increases steadily towards the east and average rainfall in the easternmost districts i s about 1,400 millimeters. The rain shadow and Marathwada regions are the drought-prone areas o f the state, with an annual average rainfall of less than 600 millimeters. These regions are generally characterized by extreme aridity, hot climate, and acute deficiency in water availability. More recently areas in Vidarbha, which usually have reliable rainfall, have experienced variable and reduced precipitation (Planning Commission
4.2 Characteristics of Study Area 4.2.1 Climate and Geography 5. The two drought-prone districts o f Nashik and Ahmednagar, located in the Godavari
basin, were chosen for the case study based on a vulnerability profiling exercise (see appendix B for details). Five villages from the drought-prone belts o f the Ahmednagar and Nashik districts were identified for the study (figures 4.1 and 4.2), and a total o f 420 households were selected within these villages. Though both districts are located in drought-prone zones, they are substantially different: Nashik i s located closer to the higher rainfall Western Ghat region and i s the more ferti le and moist area. I t receives an average annual rainfall o f about 1,000 millimeters, and only 25% o f i t s area is fully affected by drought. In contrast, the district of Ahmednagar i s arid and lies in the scarce rainfall zone. The district is hot and dry with an average annual rainfall o f 579 millimeters, the lowest in the state. All 14 blocks o f the district are partially or fully affected by drought. Around 25% o f the cultivated area is irrigated. The major food crops include wheat, mil lets (jowar and bajra), and pulses. Commercial crops grown in certain areas include sugarcane, groundnut, and cotton.
4.2.2 Anatomy of the Sample Villages 6. In both districts agriculture is the primary source o f income. Reflecting agroclimatic
conditions, there are great differences in average incomes between the districts: sampled villages in Nashik are much more prosperous with an average monthly income o f Rs 22,500, whereas in the arid Ahmednagar villages the average monthly income is Rs 3,455. Large and medium farmer households are more dependent on agricultural sources o f income, draw much higher incomes, and own more assets than their marginal and landless counterparts (table 4.1). The standard o f education and accessibility to health facilities are similar among most households, except for many of the landless households. There is no significant livestock ownership except in one village in Ahmednagar (Karegaon), where al l the households owned livestock.
Access to irrigation i s o f considerable importance to agriculturalists in drought-affected areas. In the sampled households, the quantity and quality o f irrigation varies with
7.
57
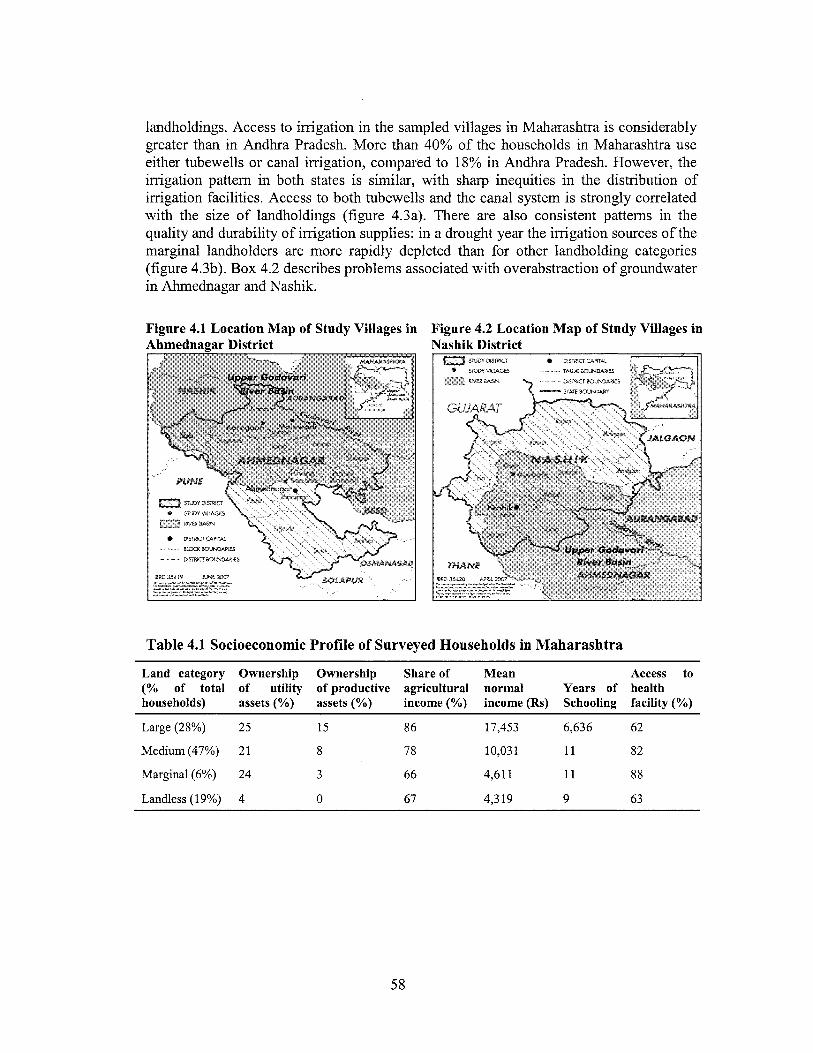
landholdings. Access to irrigation in the sampled villages in Maharashtra is considerably greater than in Andhra Pradesh. More than 40% o f the households in Maharashtra use either tubewells or canal irrigation, compared to 18% in Andhra Pradesh. However, the irrigation pattern in both states i s similar, with sharp inequities in the distribution o f irrigation facilities. Access to both tubewells and the canal system i s strongly correlated with the size o f landholdings (figure 4.3a). There are also consistent patterns in the quality and durability o f irrigation supplies: in a drought year the irrigation sources o f the marginal landholders are more rapidly depleted than for other landholding categories (figure 4.3b). Box 4.2 describes problems associated with overabstraction o f groundwater in Ahmednagar and Nashik.
Figure 4.1 Location Map o f Study Villages in Figure 4.2 Location M a p of Study Villages in ashik District
Table 4.1 Socioeconomic Profile of Surveyed Households in Maharashtra
L a n d category (% of total households)
Large (28%)
Medium (47%)
Marginal (6%)
Landless (19%)
Ownership Ownership Share of M e a n Access to o f utility of productive agricultural normal Years of health assets (%) assets (%) income (%) income (Rs) Schooling facility (%)
25 15 86 17,453 6,636 62
21 8 78 10,03 1 11 82
24 3 66 4,611 11 88
4 0 67 4,319 9 63
58
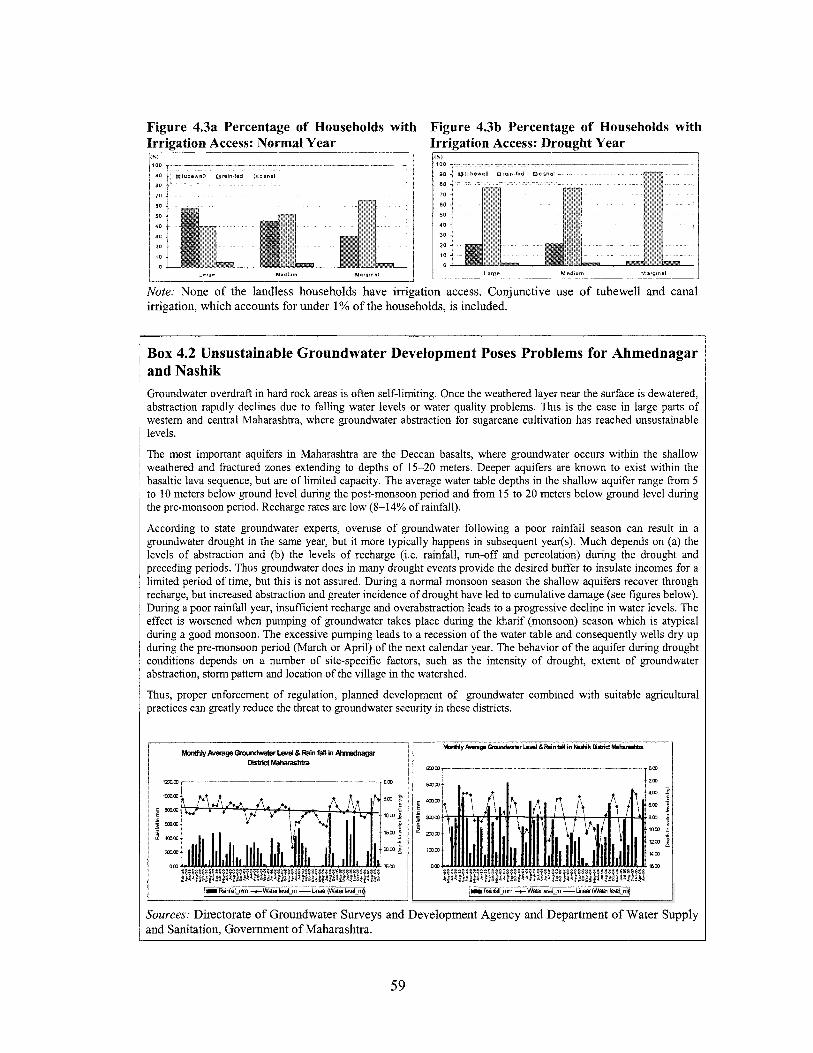
Figure 4.3a Percentage of Households with Figure 4.3b Percentage of Households with Irrigation Access: Normal Year Irrigation Access: Drought Year
Modivm Msrginal I
Note: N o n e o f the landless households have i r r iga t ion access. Conjunct ive use o f tubewel l and canal irrigation, w h i c h accounts for under 1% of the households, i s included.
Box 4.2 Unsustainable Groundwater Development Poses Problems for Ahmednagar and Nashik Groundwater overdraft in hard rock areas i s often self-limiting. Once the weathered layer near the surface is dewatered, abstraction rapidly declines due to falling water levels or water quality problems. T h i s i s the case in large parts o f western and central Maharashtra, where groundwater abstraction for sugarcane cultivation has reached unsustainable levels.
The most important aquifers in Maharashtra are the Deccan basalts, where groundwater occurs within the shallow weathered and fractured zones extending to depths o f 15-20 meters. Deeper aquifers are known to exist within the basaltic lava sequence, but are o f limited capacity. The average water table depths in the shallow aquifer range &om 5 to 10 meters below ground level during the post-monsoon period and from 15 to 20 meters below ground level during the pre-monsoon period. Recharge rates are l ow (8-14% o f rainfall).
According to state groundwater experts, overuse o f groundwater following a poor rainfall season can result in a groundwater drought in the same year, but it more typically happens in subsequent year(s). Much depends on (a) the levels o f abstraction and (b) the levels o f recharge (i.e. rainfall, run-off and percolation) during the drought and preceding periods. Thus groundwater does in many drought events provide the desired buffer to insulate incomes for a limited period o f time, but this i s not assured. During a normal monsoon season the shallow aquifers recover through recharge, but increased abstraction and greater incidence o f drought have led to cumulative damage (see figures below). During a poor rainfall year, insufficient recharge and overabstraction leads to a progressive decline in water levels. The effect is worsened when pumping o f groundwater takes place during the kharif (monsoon) season which is atypical during a good monsoon. The excessive pumping leads to a recession o f the water table and consequently wells dry up during the pre-monsoon period (March or April) o f the next calendar year. The behavior o f the aquifer during drought conditions depends on a number o f site-specific factors, such as the intensity o f drought, extent o f groundwater abstraction, storm pattern and location o f the village in the watershed.
Thus, proper enforcement o f regulation, planned development o f groundwater combined with suitable agricultural practices can greatly reduce the threat to groundwater security in these districts.
Sources: Directorate o f Groundwater Surveys and Development Agency and Department o f Water Supp ly and Sanitation, Government o f Maharashtra.
59
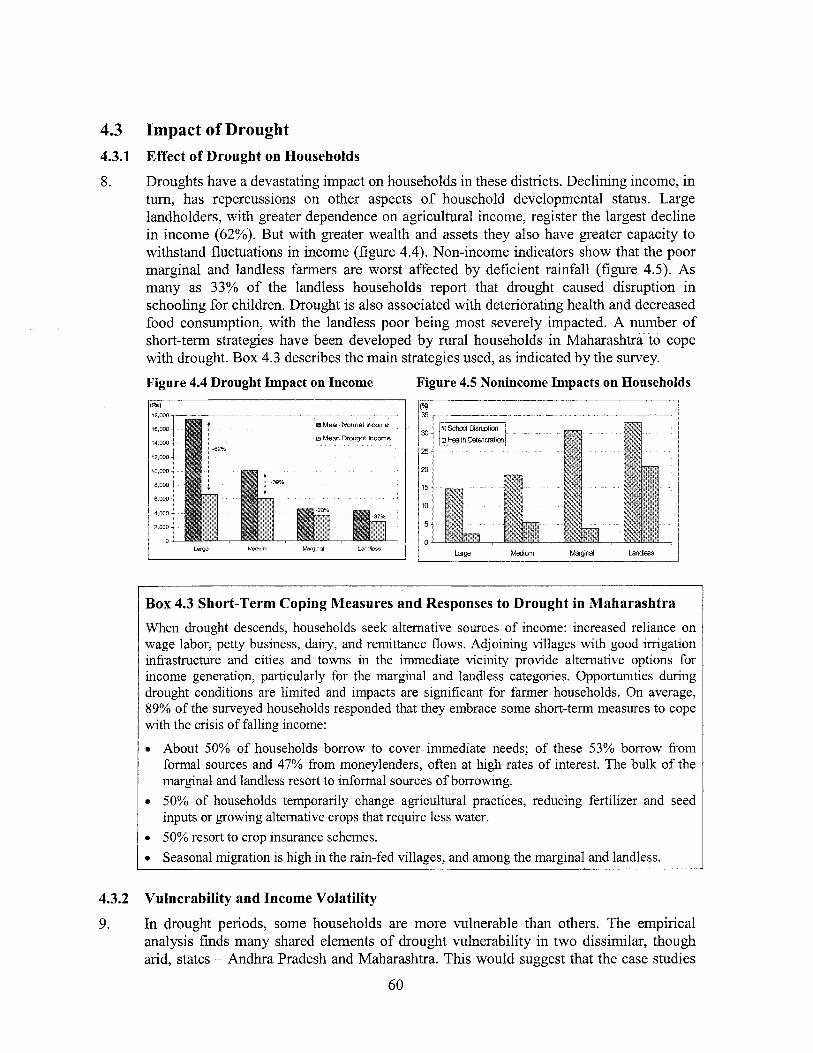
4.3 Impact o f Drought 4.3.1
8.
Effect of Drought on Households Droughts have a devastating impact on households in these districts. Declining income, in turn, has repercussions on other aspects o f household developmental status. Large landholders, with greater dependence on agricultural income, register the largest decline in income (62%). But with greater wealth and assets they also have greater capacity to withstand fluctuations in income (figure 4.4). Non-income indicators show that the poor marginal and landless farmers are worst affected by deficient rainfall (f igure 4.5). As many as 33% o f the landless households report that drought caused disruption in schooling for children. Drought i s also associated with deteriorating health and decreased food consumption, with the landless poor being most severely impacted. A number o f short-term strategies have been developed by rural households in Maharashtra to cope with drought. Box 4.3 describes the main strategies used, as indicated by the survey.
Figure 4.4 Drought Impact o n Income Figure 4.5 Nonincome Impacts o n Households
P P) - _. _ . 183 000
16 Ow
14 ow
12 ow
5Mean Normal Income
0 Mean Drought Income I S 25
10 wo 20
15
10
5
0 0
8 w o
6 WO
4000
2 OD0
Medium
/Box 4.3 Short-Term Coping Measures and Responses to Drought in Maharashtra 1 When drought descends, households seek alternative sources o f income: increased reliance o n wage labor, petty business, dairy, and remittance flows. Adjoining villages with good irrigation infrastructure and cities and towns in the immediate vicinity provide alternative options for income generation, particularly for the marginal and landless categories. Opportunities during drought conditions are l imited and impacts are significant for farmer households. On average, 89% o f the surveyed households responded that they embrace some short-term measures to cope with the crisis o f falling income:
0 About 50% o f households borrow to cover immediate needs; o f these 53% borrow f rom formal sources and 47% from moneylenders, often at high rates o f interest. The bulk o f the marginal and landless resort to informal sources o f borrowing.
0 50% o f households temporarily change agricultural practices, reducing fertilizer and seed inputs or growing alternative crops that require less water.
0 50% resort to crop insurance schemes. 0 Seasonal migration i s high in the rain-fed villages, and among the marginal and landless.
4.3.2 Vulnerability and Income Volatility
9. In drought periods, some households are more vulnerable than others. The empirical analysis finds many shared elements o f drought vulnerability in two dissimilar, though arid, states - Andhra Pradesh and Maharashtra. This would suggest that the case studies
60
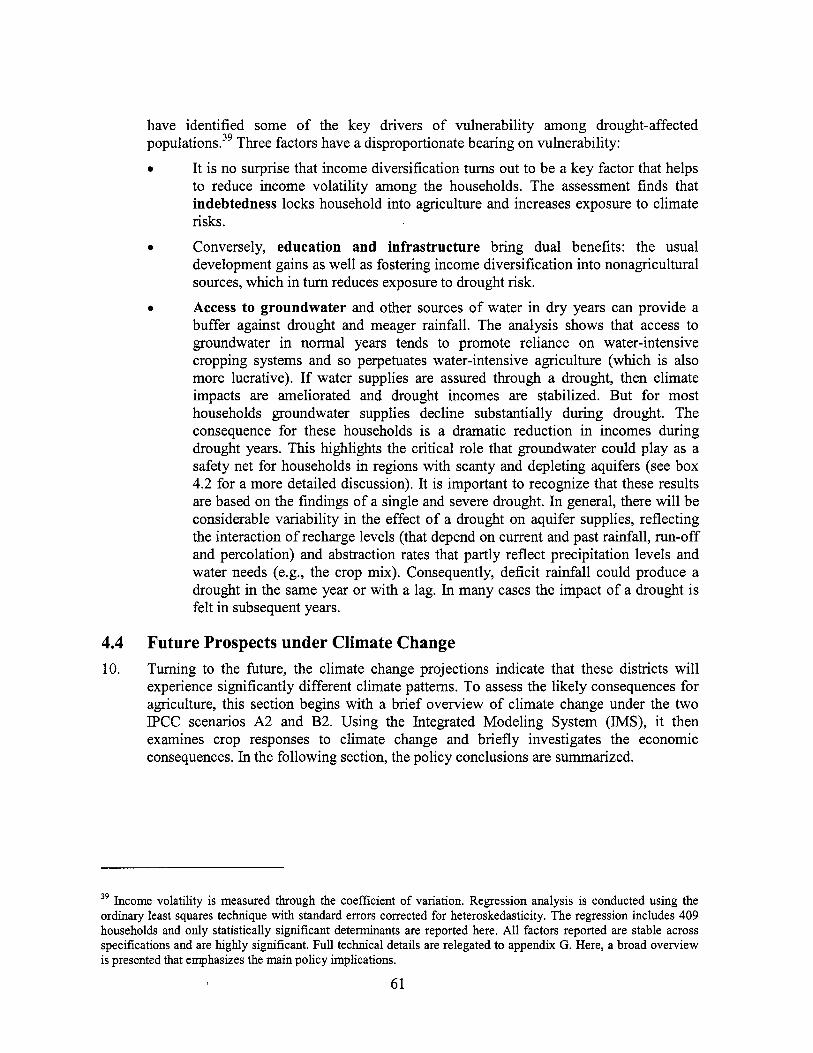
have identified some o f the key drivers o f vulnerability among drought-affected population^.^^ Three factors have a disproportionate bearing on vulnerability:
e It is no surprise that income diversification tu rns out to be a key factor that helps to reduce income volatility among the households. The assessment finds that indebtedness locks household into agriculture and increases exposure to climate risks.
development gains as well as fostering income diversification into nonagricultural sources, which in turn reduces exposure to drought risk.
buffer against drought and meager rainfall. The analysis shows that access to groundwater in normal years tends to promote reliance on water-intensive cropping systems and so perpetuates water-intensive agriculture (which i s also more lucrative). If water supplies are assured through a drought, then climate impacts are ameliorated and drought incomes are stabilized. But for most households groundwater supplies decline substantially during drought. The consequence for these households i s a dramatic reduction in incomes during drought years. This highlights the critical role that groundwater could play as a safety net for households in regions with scanty and depleting aquifers (see box 4.2 for a more detailed discussion). It i s important to recognize that these results are based on the findings o f a single and severe drought. In general, there wil l be considerable variability in the effect o f a drought on aquifer supplies, reflecting the interaction o f recharge levels (that depend on current and past rainfall, run-off and percolation) and abstraction rates that partly reflect precipitation levels and water needs (e.g., the crop mix). Consequently, deficit rainfall could produce a drought in the same year or with a lag. In many cases the impact o f a drought i s fe l t in subsequent years.
e Conversely, education and infrastructure bring dual benefits: the usual
e Access to groundwater and other sources o f water in dry years can provide a
4.4 10.
Future Prospects under Climate Change Turning to the future, the climate change projections indicate that these districts wil l experience significantly different climate patterns. To assess the likely consequences for agriculture, this section begins with a brief overview o f climate change under the two P C C scenarios A2 and B2. Using the Integrated Modeling System (&IS), it then examines crop responses to climate change and briefly investigates the economic consequences. In the following section, the policy conclusions are summarized.
39 Income volati l i ty i s measured through the coefficient o f variation. Regression analysis i s conducted using the ordinary least squares technique with standard errors corrected for heteroskedasticity. The regression includes 409 households and only statistically significant determinants are reported here. All factors reported are stable across specifications and are lughly significant. Full technical details are relegated to appendix G. Here, a broad overview i s presented that emphasizes the main pol icy implications.
61
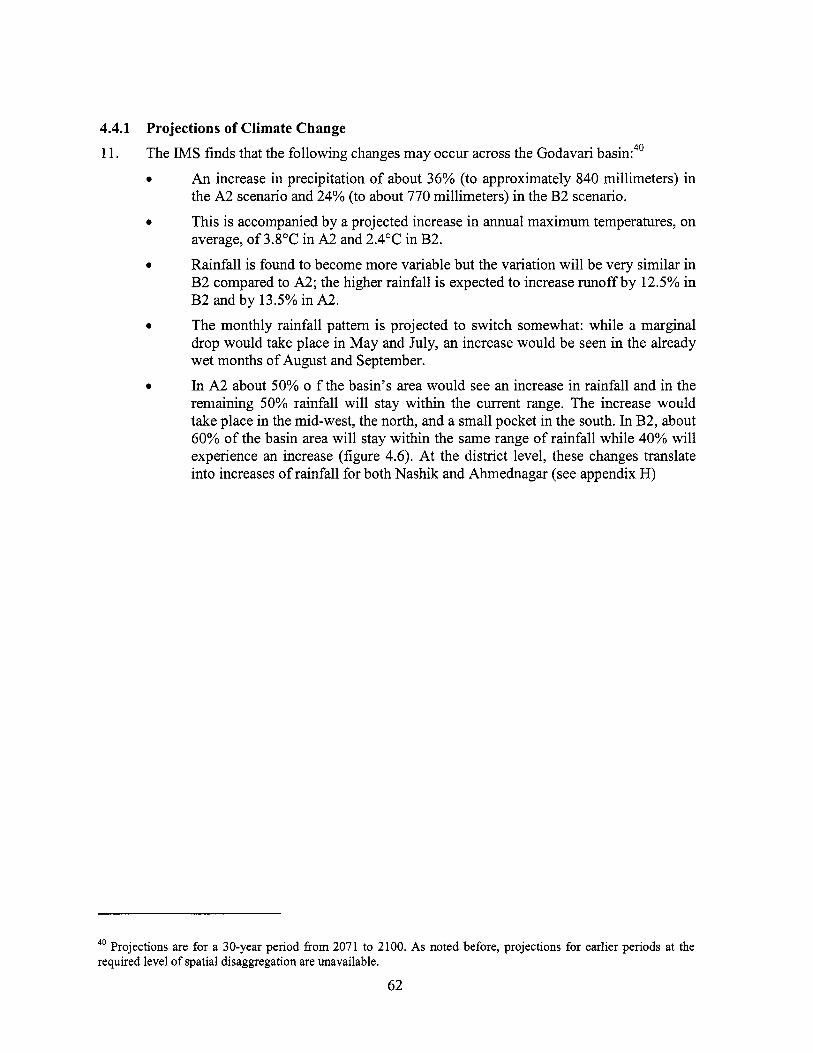
4.4.1 Projections of Climate Change
1 1. The I M S finds that the following changes may occur across the Godavari basin:40
0 An increase in precipitation o f about 36% (to approximately 840 millimeters) in
This i s accompanied by a projected increase in annual maximum temperatures, on
Rainfall i s found to become more variable but the variation wil l be very similar in
the A2 scenario and 24% (to about 770 millimeters) in the B2 scenario.
average, o f 3.8"C in A2 and 2.4"C in B2.
B2 compared to A2; the higher rainfall i s expected to increase runoff by 12.5% in B2 and by 13.5% in A2.
drop would take place in M a y and July, an increase would be seen in the already wet months o f August and September.
In A2 about 50% o f the basin's area would see an increase in rainfall and in the remaining 50% rainfall wil l stay within the current range. The increase would take place in the mid-west, the north, and a small pocket in the south. In B2, about 60% o f the basin area wil l stay within the same range o f rainfall while 40% will experience an increase (figure 4.6). At the district level, these changes translate into increases o f rainfall for both Nashik and Ahmednagar (see appendix H)
0
0
0 The monthly rainfall pattern i s projected to switch somewhat: while a marginal
0
40 Projections are for a 30-year period from 2071 to 2100. As noted before, projections for earlier periods at the required level o f spatial disaggregation are unavailable.
62
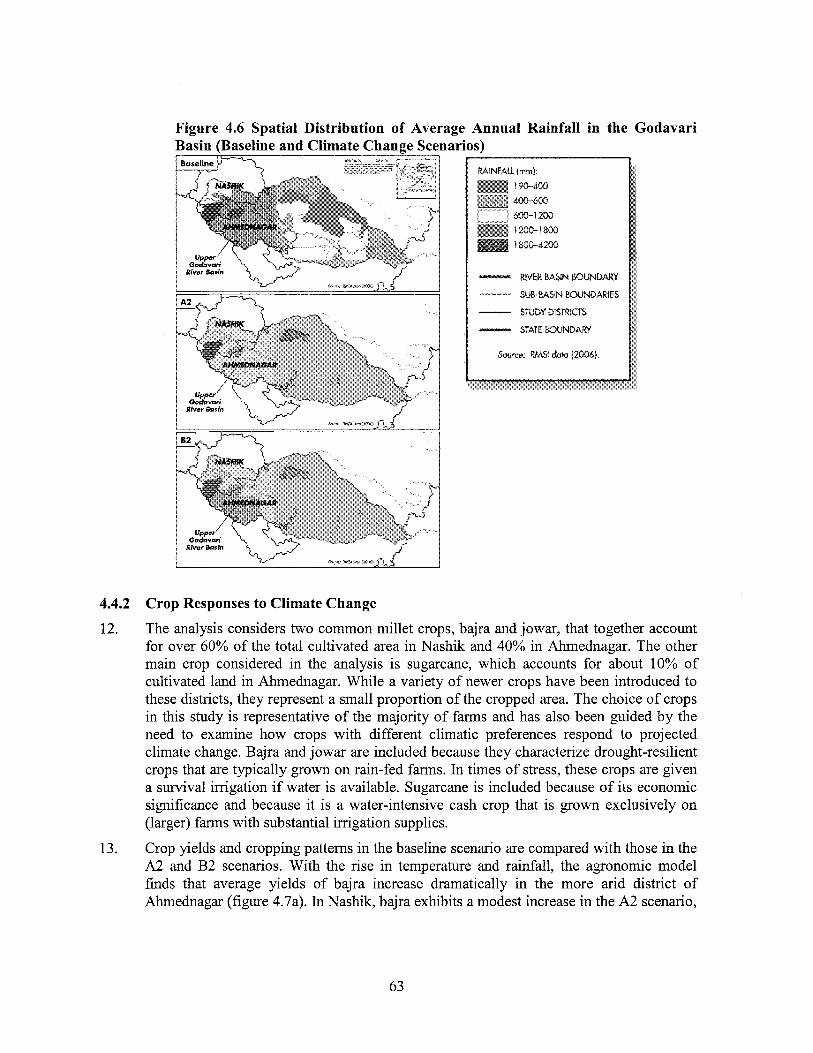
Figure 4.6 Spatial Distribution of Average Annual Rainfall in the Godavari Basin (Baseline and Climate ChanEe Scenarios)
4.4.2 Crop Responses to Climate Change
12. The analysis considers two common millet crops, bajra and jowar, that together account for over 60% o f the total cultivated area in Nashik and 40% in Ahmednagar. The other main crop considered in the analysis is sugarcane, which accounts for about 10% o f cultivated land in Ahmednagar. While a variety o f newer crops have been introduced to these districts, they represent a small proportion o f the cropped area. The choice o f crops in this study i s representative o f the majority o f farms and has also been guided by the need to examine how crops with different climatic preferences respond to projected climate change. Bajra and jowar are included because they characterize drought-resilient crops that are typically grown on rain-fed farms. In times o f stress, these crops are given a survival irrigation if water is available. Sugarcane i s included because o f i ts economic significance and because i t is a water-intensive cash crop that i s grown exclusively on (larger) farms with substantial irrigation supplies.
13. Crop yields and cropping patterns in the baseline scenario are compared with those in the A2 and B2 scenarios. With the rise in temperature and rainfall, the agronomic model finds that average yields o f bajra increase dramatically in the more arid district o f Ahmednagar (figure 4.7a). In Nashik, bajra exhibits a modest increase in the A2 scenario,
63
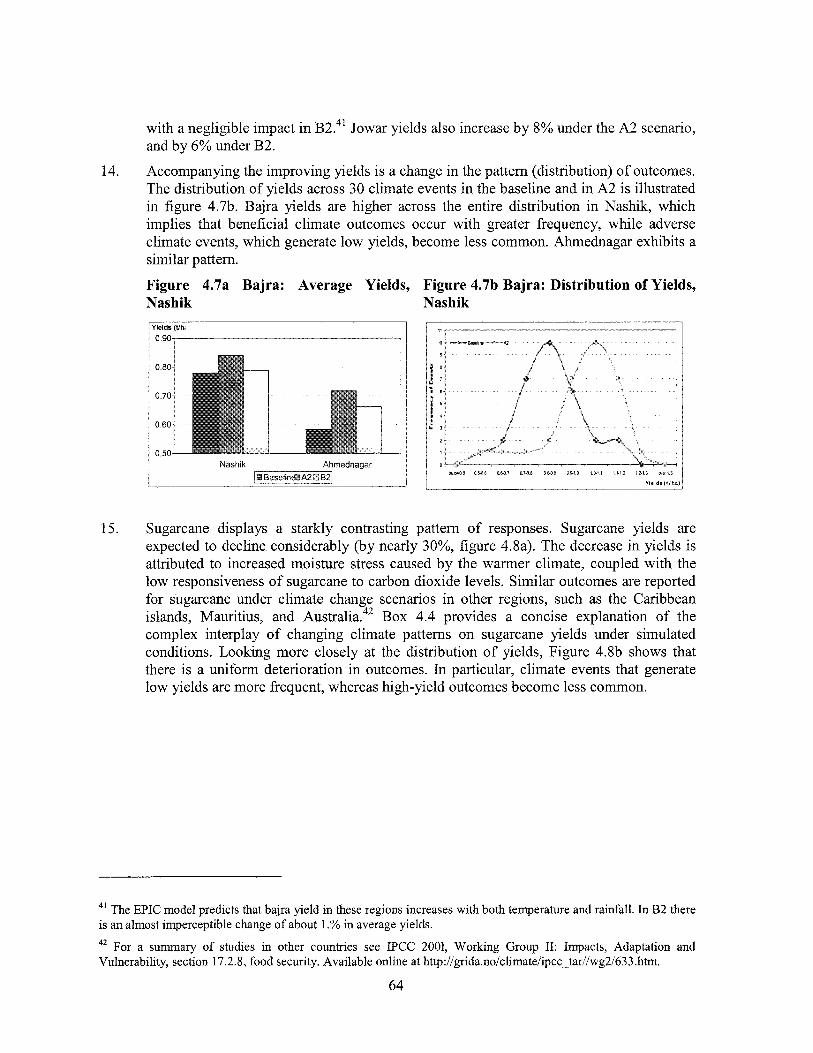
with a negligible impact in B2.41 Jowar yields also increase by 8% under the A2 scenario, and by 6% under B2.
Accompanying the improving yields i s a change in the pattern (distribution) o f outcomes. The distribution o f yields across 30 climate events in the baseline and in A2 i s illustrated in figure 4.7b. Bajra yields are higher across the entire distribution in Nashik, which implies that beneficial climate outcomes occur with greater frequency, while adverse climate events, which generate low yields, become less common. Ahmednagar exhibits a similar pattern.
Figure 4.7a Bajra: Average Yields, Figure 4.7b Bajra: Distribution of Yields,
14.
Nashik Nashik
15.
lields ( t h
0.90
0 80
0 70
0 60
0 50 Nashik Ahmednagar
Sugarcane displays a starkly contrasting pattern o f responses. Sugarcane yields are expected to decline considerably (by nearly 30%, figure 4.8a). The decrease in yields i s attributed to increased moisture stress caused by the warmer climate, coupled with the low responsiveness o f sugarcane to carbon dioxide levels. Similar outcomes are reported for sugarcane under climate change scenarios in other regions, such as the Caribbean islands, Mauritius, and Australia.42 Box 4.4 provides a concise explanation o f the complex interplay o f changing climate patterns on sugarcane yields under simulated conditions. Looking more closely at the distribution o f yields, Figure 4.8b shows that there i s a uniform deterioration in outcomes. In particular, climate events that generate low yields are more frequent, whereas high-yield outcomes become less common.
4 ' The EPIC model predicts that bajra yield in these regions increases with both temperature and rainfall. In B2 there i s an almost imperceptible change o f about I.% in average yields.
42 For a summary o f studies in other countries see IPCC 2001, Work ing Group 11: Impacts, Adaptation and Vulnerability, section 17.2.8, food security. Available online at http:llgrida.nolclimatelipcc~tarllwg2/633 .htm.
64
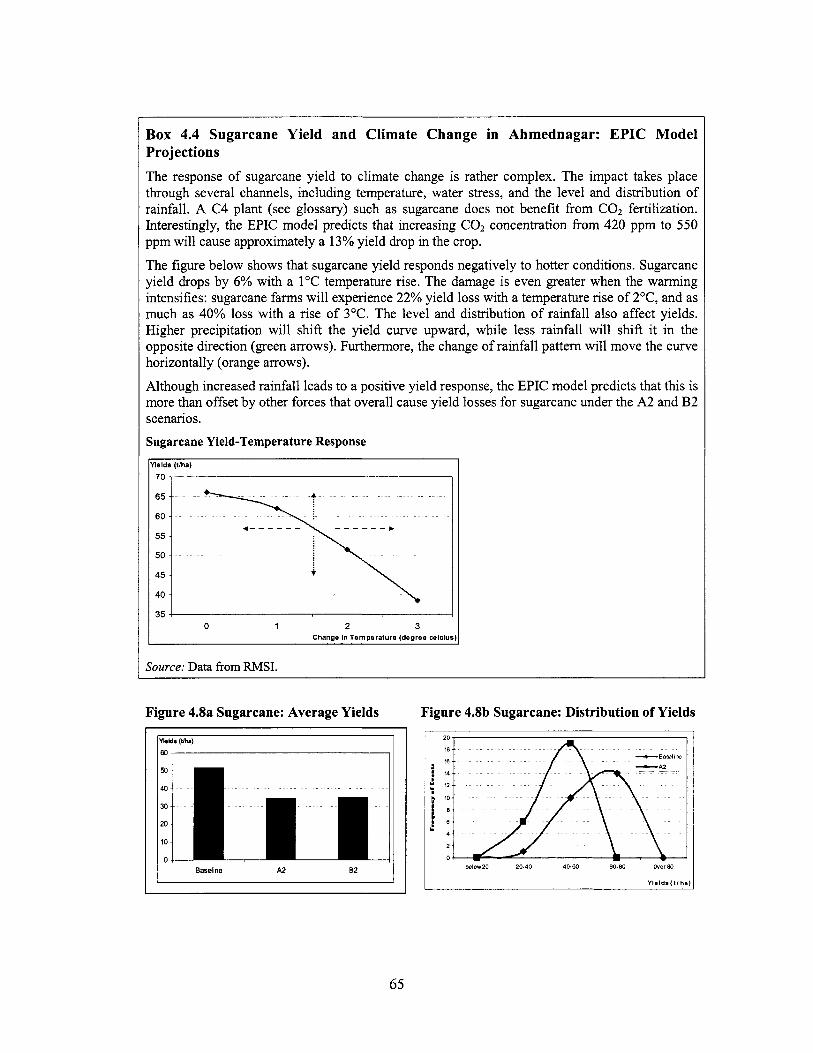
Box 4.4 Sugarcane Yield and Climate Change in Ahmednagar: EPIC Model Projections The response o f sugarcane yield to climate change i s rather complex. The impact takes place through several channels, including temperature, water stress, and the level and distribution o f rainfall. A C4 plant (see glossary) such as sugarcane does not benefit f rom C02 fertilization. Interestingly, the EPIC model predicts that increasing COz concentration f rom 420 ppm to 550 ppm will cause approximately a 13% yield drop in the crop.
The figure below shows that sugarcane yield responds negatively to hotter conditions. Sugarcane yield drops by 6% with a 1°C temperature rise. The damage i s even greater when the warming intensifies: sugarcane farms will experience 22% yield loss with a temperature rise o f 2"C, and as much as 40% loss with a rise o f 3°C. The level and distribution o f rainfall also affect yields. Higher precipitation will shift the yield curve upward, while less rainfall wi l l shift it in the opposite direction (green arrows). Furthermore, the change o f rainfall pattern will move the curve horizontally (orange arrows).
Although increased rainfall leads to a positive y ie ld response, the EPIC model predicts that this i s more than offset by other forces that overall cause yield losses for sugarcane under the A2 and B2 scenarios.
Sugarcane Yield-Temperature Response
'lelda (tha)
70
35 4 0 1 2 3
Change In Temperature (degree mlcius:
I I Source: Data from RMSI.
Figure 4.8a Sugarcane: Average Yields Figure 4.8b Sugarcane: Distribution o f Yields
IF";"" 1
I Baseline A2
65
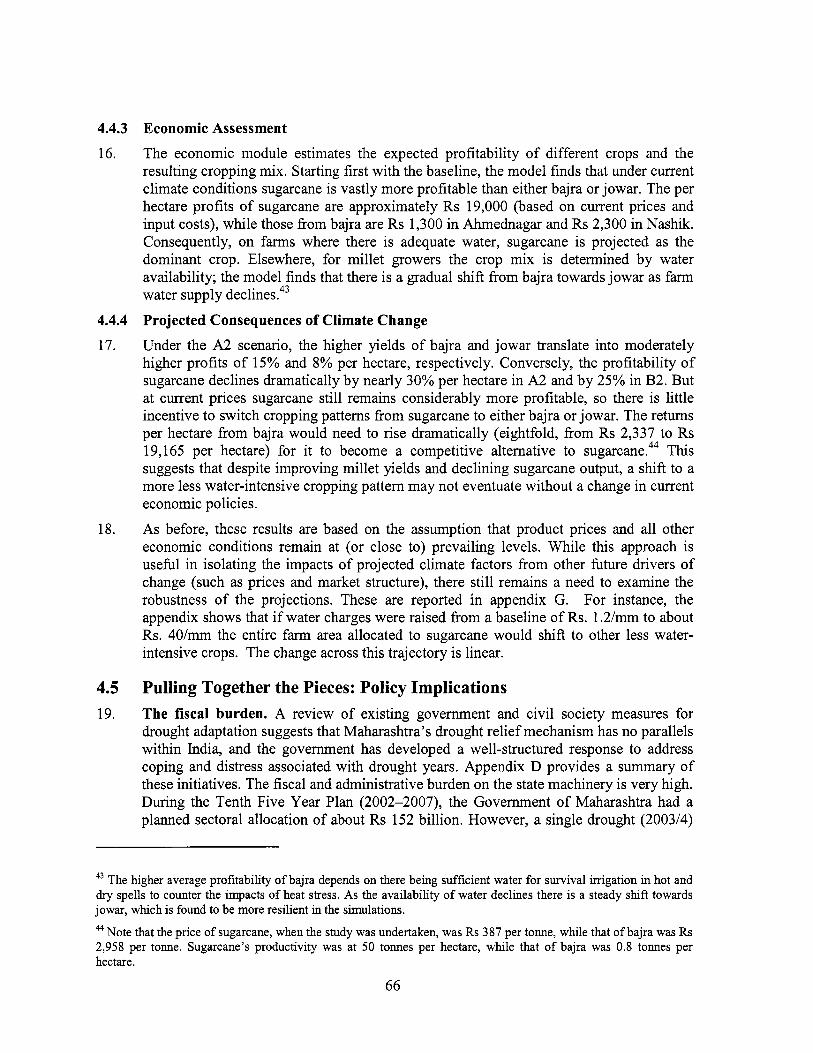
4.4.3 16.
4.4.4 17.
18.
4.5 19.
Economic Assessment
The economic module estimates the expected profitability o f different crops and the resulting cropping mix. Starting f i rs t with the baseline, the model finds that under current climate conditions sugarcane i s vastly more profitable than either bajra or jowar. The per hectare profits o f sugarcane are approximately Rs 19,000 (based on current prices and input costs), while those from bajra are Rs 1,300 in Ahmednagar and Rs 2,300 in Nashik. Consequently, on farms where there i s adequate water, sugarcane i s projected as the dominant crop. Elsewhere, for millet growers the crop m i x i s determined by water availability; the model finds that there i s a gradual shift from bajra towards jowar as farm water supply declines.43
Projected Consequences of Climate Change Under the A2 scenario, the higher yields o f bajra and jowar translate into moderately higher profits o f 15% and 8% per hectare, respectively. Conversely, the profitability o f sugarcane declines dramatically by nearly 30% per hectare in A2 and by 25% in B2. But at current prices sugarcane s t i l l remains considerably more profitable, so there i s little incentive to switch cropping patterns from sugarcane to either bajra or jowar. The returns per hectare from bajra would need to r ise dramatically (eightfold, from Rs 2,337 to Rs 19,165 per hectare) for i t to become a competitive alternative to sugarcane.44 This suggests that despite improving millet yields and declining sugarcane output, a shift to a more less water-intensive cropping pattern may not eventuate without a change in current economic policies.
As before, these results are based on the assumption that product prices and al l other economic conditions remain at (or close to) prevailing levels. W h i l e this approach i s useful in isolating the impacts o f projected climate factors from other future drivers o f change (such as prices and market structure), there s t i l l remains a need to examine the robustness o f the projections. These are reported in appendix G. For instance, the appendix shows that if water charges were raised from a baseline o f Rs. 1.2/mm to about Rs. 40/mm the entire farm area allocated to sugarcane would shift to other less water- intensive crops. The change across this trajectory i s linear.
Pulling Together the Pieces: Policy Implications The fiscal burden. A review o f existing government and c iv i l society measures for drought adaptation suggests that Maharashtra’s drought rel ief mechanism has no parallels within India, and the government has developed a well-structured response to address coping and distress associated with drought years. Appendix D provides a summary o f these initiatives. The fiscal and administrative burden on the state machinery i s very high. During the Tenth Five Year Plan (2002-2007), the Government o f Maharashtra had a planned sectoral allocation o f about Rs 152 billion. However, a single drought (2003/4)
43 The higher average profitabil ity o f bajra depends o n there being sufficient water for survival irrigation in hot and dry spells to counter the impacts o f heat stress. As the availabil ity o f water declines there is a steady s h i f t towards jowar, which i s found to be more resilient in the simulations.
Note that the price o f sugarcane, when the study was undertaken, was Rs 387 per tonne, while that o f bajra was Rs 2,958 per tonne. Sugarcane’s productivity was at 50 tonnes per hectare, w h l e that o f bajra was 0.8 tonnes per hectare.
66
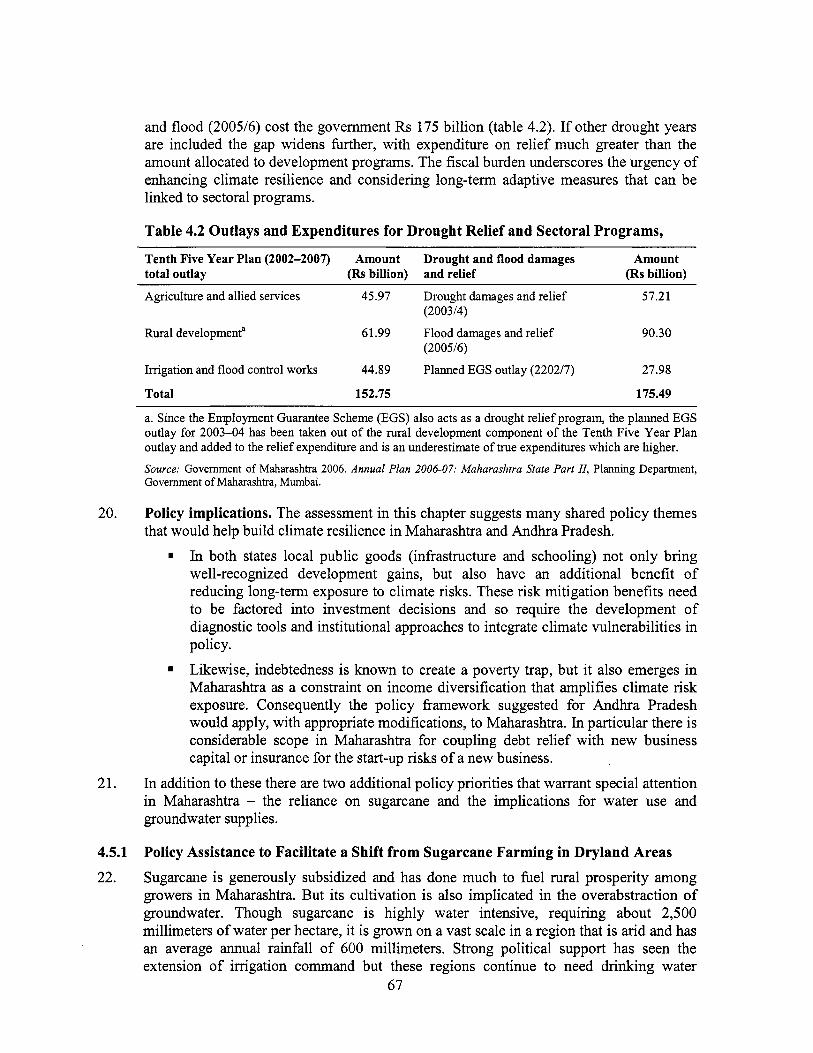
and flood (2005/6) cost the government Rs 175 bi l l ion (table 4.2). If other drought years are included the gap widens further, with expenditure on r e l i e f much greater than the amount allocated to development programs. The fiscal burden underscores the urgency o f enhancing climate resilience and considering long-term adaptive measures that can be linked to sectoral programs.
Table 4.2 Outlays and Expenditures for Drought Relief and Sectoral Programs,
Tenth Five Year Plan (2002-2007) Amount Drought and flood damages Amount total outlay (Rs billion) and relief (Rs billion)
~~~ ~
Agriculture and all ied services 45.97 Drought damages and rel ief 57.21 (2003/4)
Rural developmenta 61.99 Flood damages and re l ie f 90.30 (200516)
Irrigation and f lood control works 44.89 Planned EGS outlay (2202/7) 27.98
Total 152.75 175.49
a. Since the Employment Guarantee Scheme (EGS) also acts as a drought re l ie f program, the planned EGS outlay for 2003-04 has been taken out o f the rural development component o f the Tenth F ive Year Plan outlay and added to the rel ief expenditure and i s an underestimate o f true expenditures wh ich are higher.
Source: Government o f Maharashtra 2006. Annual Plan 2006-07: Maharashtra State Part 11, Planning Department, Government o f Maharashtra, Mumbai.
20. Policy implications. The assessment in this chapter suggests many shared pol icy themes that would help build climate resilience in Maharashtra and Andhra Pradesh.
In both states local public goods (infrastructure and schooling) not only bring well-recognized development gains, but also have an additional benefit o f reducing long-term exposure to climate risks. These risk mitigation benefits need to be factored into investment decisions and so require the development o f diagnostic tools and institutional approaches to integrate climate vulnerabilities in policy.
Likewise, indebtedness i s known to create a poverty trap, but it also emerges in Maharashtra as a constraint on income diversification that amplifies climate risk exposure. Consequently the policy framework suggested for Andhra Pradesh would apply, with appropriate modifications, to Maharashtra. In particular there i s considerable scope in Maharashtra for coupling debt rel ief with new business capital or insurance for the start-up r isks o f a new business.
In addition to these there are two additional policy priorities that warrant special attention in Maharashtra - the reliance on sugarcane and the implications for water use and groundwater supplies.
.
.
21.
4.5.1 22.
Policy Assistance to Facilitate a Shift from Sugarcane Farming in Dryland Areas Sugarcane i s generously subsidized and has done much to fue l rural prosperity among growers in Maharashtra. But its cultivation is also implicated in the overabstraction o f groundwater. Though sugarcane is highly water intensive, requiring about 2,500 millimeters o f water per hectare, it is grown on a vast scale in a region that i s arid and has an average annual rainfall o f 600 millimeters. Strong political support has seen the extension o f irrigation command but these regions continue to need drinking water
67
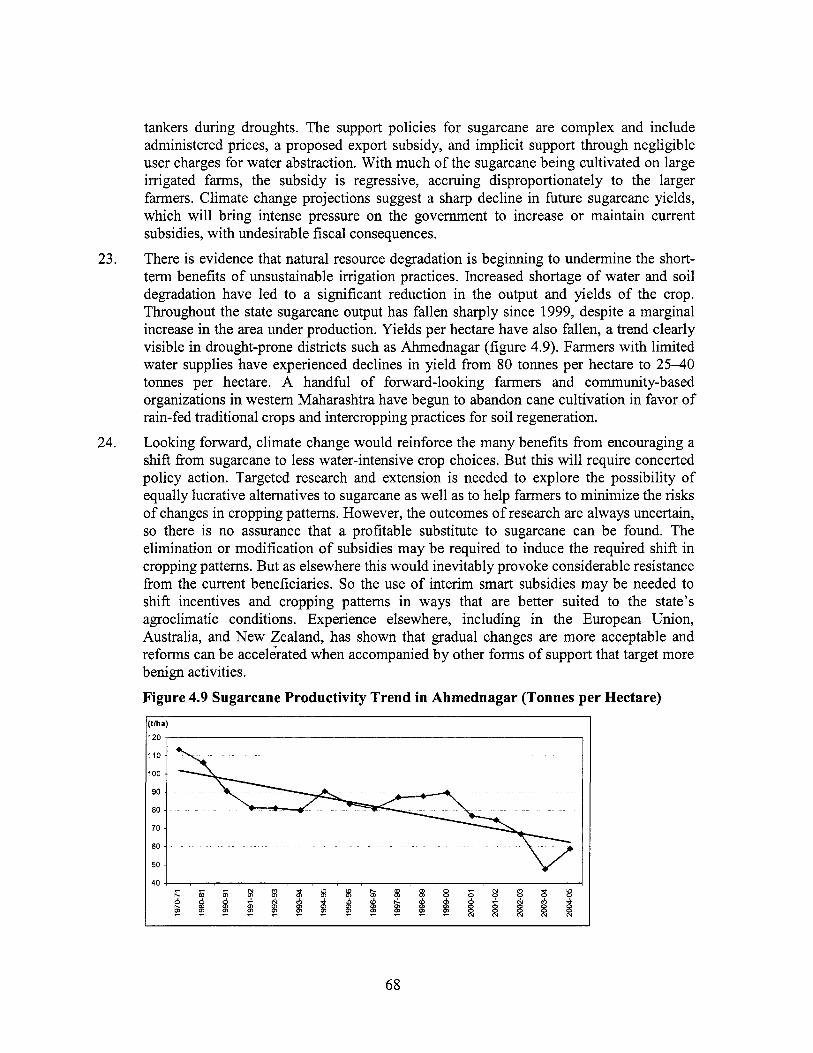
23.
24.
tankers during droughts. The support policies for sugarcane are complex and include administered prices, a proposed export subsidy, and implici t support through negligible user charges for water abstraction. With much o f the sugarcane being cultivated on large irrigated farms, the subsidy i s regressive, accruing disproportionately to the larger farmers. Climate change projections suggest a sharp decline in future sugarcane yields, which wil l bring intense pressure on the government to increase or maintain current subsidies, with undesirable fiscal consequences.
There i s evidence that natural resource degradation i s beginning to undermine the short- term benefits o f unsustainable irrigation practices. Increased shortage o f water and soil degradation have led to a significant reduction in the output and yields o f the crop. Throughout the state sugarcane output has fallen sharply since 1999, despite a marginal increase in the area under production. Yields per hectare have also fallen, a trend clearly visible in drought-prone districts such as Ahmednagar (figure 4.9). Farmers with limited water supplies have experienced declines in yield from 80 tomes per hectare to 25-40 tomes per hectare. A handful o f forward-looking farmers and community-based organizations in western Maharashtra have begun to abandon cane cultivation in favor o f rain-fed traditional crops and intercropping practices for soil regeneration.
Looking forward, climate change would reinforce the many benefits from encouraging a shift from sugarcane to less water-intensive crop choices. But this will require concerted policy action. Targeted research and extension is needed to explore the possibility o f equally lucrative alternatives to sugarcane as wel l as to help farmers to minimize the risks o f changes in cropping patterns. However, the outcomes o f research are always uncertain, so there is no assurance that a profitable substitute to sugarcane can be found. The elimination or modification o f subsidies may be required to induce the required shift in cropping patterns. But as elsewhere this would inevitably provoke considerable resistance from the current beneficiaries. So the use o f interim smart subsidies may be needed to shift incentives and cropping patterns in ways that are better suited to the state's agroclimatic conditions. Experience elsewhere, including in the European Union, Australia, and New Zealand, has shown that gradual changes are more acceptable and reforms can be accelerated when accompanied by other forms o f support that target more benign activities.
Figure 4.9 Sugarcane Productivity Trend in Ahmednagar (Tonnes per Hectare) (t/ha) 120, 1
110
100
90
80
70
60
50
68
4.5.2 25.
Managing Groundwater Resources As in Andhra Pradesh, integrated water management remains a n overarching priority b o t h for current and fbture agricultural development. Despi te the projected increase in ra infa l l and runoff it i s u n l i k e l y that water avai labi l i ty for agriculture will increase in the future with the growing demands o f industry, demography, and expanding urban centers. Groundwater cou ld play a m a j o r ro le in h e l i n g sustainable ru ra l economic growth. But for this to occur, abstractions need to b e brought in l i n e with recharge. T h e analysis in this report has shown that contrary to intent, groundwater dependence has fa i led to prov ide a bu f fe r to many farmers in t imes o f def ic i t rainfall. Unrestrained compet i t ion for groundwater has promoted water-intensive agriculture, leading to overabstraction and increased vulnerabi l i ty to drought risks. F o r agr icul ture to become sustainable and drought resistant there i s an urgent need to p romote jud ic ious water management, emphasizing both demand- and supply-side options.
Box 4.5 Role of Community Institutions and Participatory Water Resource Management in Drought Adaptation Several landmark examples can be cited f rom Maharashtra o f community-managed water resource management initiatives that have resulted in significant local benefits to communities, including improved natural resource management and livelihoods in l o w rainfall environments.
Located in Ahmednagar district, the village o f Hiwre Bazaar i s not covered by any major irrigation program; years ago, i t was similar to thousands o f other villages in the same b lock without access to any irrigation. However, effective watershed development and management over the last 15 years have transformed the earlier conditions and reaped positive developments in terms o f ecosystem restoration (for example improved soil moisture content) and assured incomes from agriculture even during drought years. T h i s has also reduced outward migration. The village has developed i t s own water regulations l inked to i t s crop plans, which promote a mix o f vegetable and mi l let crops. Annual decisions on cropping intensity ensure efficient management o f the resource and i t s equitable distribution for crop growth.
In Korhate village in Nashik, water user associations W A S ) administer water resource sharing for irrigation in major projects. Water allocations are entirely based o n cropping patterns and associated volumetric allocations. The WUAs have been found to function effectively and to distribute water equitably, ensuring allocations to small and marginal farmers. Drip irrigation for horticulture crops i s promoted. The government o f Maharashtra further strengthened local bodies during 2005, empowering WUAs with full legal authority to manage water distribution, maintain irrigation channels, and resolve conflicts.
Initiated in the 1970s, the Pani Panchayat initiative in Pune district prioritized hnlung water in the village and restricted the cultivation o f water-intensive crops. There are currently 25 pani panchayat schemes in Maharashtra, based on either a groundwater or surface water communal source. Within a pani panchayat village, nearly a third o f the village land i s typically brought under the scheme, which i s managed under the principles o f delinking land and water rights and cultivation o f only seasonal crops. Hydrological parameters, such as groundwater level or rainfall, are used to assess the amount o f water that can be used during the year for crop irrigation. These schemes have survived several droughts successfully, but more recently there i s evidence that some o f these initiatives may be endangered by gradual overabstraction in the surrounding areas. Sources: TERI 2007; DFID 2005a.
69
26. Solutions to the problem o f groundwater overdraft are difficult to design and implement, as there are significant technical and institutional challenges in the management o f groundwater at the higher aquifer or watershed levels where community-based management might occur. These include:
0 Monitoring data are lacking and there are limitations in technical ability to quantify hydrological parameters such as flows, recharge, and water balance, which impede effective groundwater management. A wide array o f watershed programs is in place across the country but their long-term impacts are poorly documented, including with respect to their ability to reverse the problem o f groundwater overdraft.
necessary for aquifer management remains a challenge, and financing models for these local management institutions s t i l l remain elusive.
power to enforce regulations or penalties for violating the rules. So incentives for enforcing sustainability remain weak.
Recognizing these problems, numerous attempts are being piloted in Maharashtra to promote livelihood-focused adaptive approaches that provide community incentives to directly manage resources (box 4.5).
4.5.3 Strengthened Integration with Ongoing State Programs
28. There i s potential in Maharashtra to build upon a wide range o f relevant programs (box 4.6). But adaptive remedies and programs must endeavor to strengthen convergence with these ongoing programs to focus the impact o f these programs on drought adaptation. For instance, the state has close to ten different watershed programs, each o f which are implemented under a different set o f guidelines and by different agencies. There i s scope to integrate these guidelines into a unified framework for implementation to enhance outcomes with respect to financial allocation and institutions at various levels. The implementation o f such programs can be encouraged by a consortium o f organizations that have established models for scaling up innovative experiences in the states. Further, there is scope for enhancing synergies with the state Employment Guarantee Scheme (EGS) and the National Rural Employment Guarantee Scheme (NREGS) by integrating into the schemes a range o f allied drought-proofing activities, including public works, the repair o f tanks and community water storage facilities, land development, soil and water conservation, crop planning, and agroforestry.
Credit availability and poor marketing systems are crucial impediments to progress in drought-affected areas o f Maharashtra. The small farmers remain dependent on moneylenders for routine credit required for inputs such as seeds, fertilizers, and pesticides. Efforts are needed to strengthen the availability o f credit from public and private microfinance institutions to ensure effective access to credit. I t is recognized, however, that several administrative bottlenecks impede effective access, as demonstrated in the low disbursal o f the drought relief credit package announced by the government o f Maharashtra for farmers in the Vidarbha region. But as suggested in the previous chapter, debt rel ief does little to tackle the root causes o f the problem and needs to be accompanied by complementary mechanisms that provide incentives for income
0 The creation o f institutions and organizations capable o f functioning at the level
0 Despite fairly robust groundwater regulations, system managers have l imited
27.
29.
70
diversif ication. So there remains scope to pilot schemes that l o w e r the costs o f job mobility and income diversif ication, especially among the poor and vulnerable.
Box 4.6 Snapshot of Sectoral Programs in Maharashtra Water Resource Programs
Investment in irrigation infrastructure i s large and growing, yet the irrigated area has stagnated at 16%. In addition, while irrigation potential has increased, actual reservoir storage has declined significantly, f rom 71% in 2000/1 to 59% during the peak drought year o f 2003/4, primarily due to siltation, poor maintenance, and l o w rainfall. Funding i s f rom a variety o f sources, including through state government funds and centrally sponsored schemes, such as the Accelerated Irrigation Benefits Programme, the Command Area Development Programme, and the Rural Infrastructure Development Fund. The ongoing Maharashtra Water Sector Improvement Project i s assisted by the Wor ld Bank.
Watershed Programs
There are close to ten central and state-sponsored watershed programs in the state, many o f which operate in drought-prone areas. In addition, the newly formed Marathwada and Vidarbha Watershed Missions in Maharashtra aim to develop fallow and underdeveloped land and groundwater tables in rain-fed areas. In addition, a number o f nongovernmental organizations, including the Water Organizations Trust, the Bharatiya Agro Industries Foundation, Marathwada Sheti Sahyog Mandal, and Act ion for Agricultural Renewal in Maharashtra run their own watershed programs in limited pockets. The watershed programs include measures such as improved surface runof f collection structures, better groundwater recharge, drainage l ine treatment, and increases in vegetation cover.
Agriculture
Developing drought-resistant varieties has not been a major initiative o f the Department o f Agriculture. However, dryland horticulture ( h i t crops requiring less water) has been promoted with some success by the Horticulture Development Programme and i s l inked with the state Employment Guarantee Scheme. Since 2005/6 this state-sponsored scheme has been merged with the National Horticulture Mission, with funding being shared with the central and state funds. The district-level agricultural technology management agencies responsible for decentralized program planning provide a useful vehicle for linkages and promotion o f innovative activities.
Rural Livelihoods
Swarnajayanti Gram Swarozgar Yojana i s the single unified centrally sponsored self-employment program for nonfarm-based livelihoods. It aims to establish a large number o f sustainable micro- enterprises. The program targets families in rural areas that l ive below the poverty line, providing them with income-generating assets through a mix o f bank credit and governmental subsidy.
71
5.
5.1 1.
2.
3.
5.2 5.2.1 4.
5.
Climate Variability and Change: A Case Study in Flood-Prone Orissa
Introduction and Background Floods are a natural feature o f India’s river basins. Seasonal floods are necessary to support agriculture, deliver topsoil and nutrients to farmland in otherwise infert i le regions, sustain valuable ecosystems, and contribute to groundwater replenishment. But excessive flooding comes at a considerable cost and causes great havoc and damage. Floods are a major contributor to the poverty and vulnerability o f communities.
I t i s estimated that about 12% o f India’s geographic area (40 mi l l ion hectares) i s affected by floods.45 This is almost double the estimated 19 mi l l ion hectares affected by floods in India about five decades ago. This has occurred despite rising government spending on flood protection, which has increased dramatically from Rs 0.13 mi l l ion in the First Five Year Plan (1951-1956) to Rs 106 bi l l ion in the Tenth Five Year Plan (2002-2007), while 39% (15.8 mi l l ion hectares) o f flood-prone land i s protected with embankments, drainage channels, bunds, and similar structures (Sekhar 2007; Planning Commission 2002). Yet frequent breaches o f embankments and other protective structures are a common occurrence.
Orissa i s among the most flood-affected states in the country and i s the focus o f this chapter.46 The chapter examines the impact o f floods on selected districts in Orissa and explores the consequences o f climate change and variability for agriculture. The assessment i s in two districts: Jagatsinghpur and Puri. The analysis draws upon field surveys and fkture climate projections derived using the I M S described in chapter 2 and appendix A.
Characteristics of Study Area Climate and Geography
Orissa is located in eastern India, with a coastline that extends over 480 kilometers. I t s geography has rendered it highly vulnerable to natural calamities and extreme weather events such as cyclones, droughts, floods, and storm surges. Between 1965 and 2006, the state experienced about 17 droughts, over 20 floods, 8 cyclones, and a super cyclone in 1999, which had devastating consequence^.^^ To compound these problems, there are years in which the state simultaneously endures droughts and extensive floods.
The state’s population o f 37 mi l l ion resides mainly in rural areas (85%), with a large population o f marginal farmers. The average size o f landholdings i s less than 1 acre (0.4 hectare). The main crop i s rice, often grown in a two-crop combination with oilseeds,
45 According to the National Flood Commission (Rashtriya Barh Ayog) t h i s estimate reflects the maximum flood- affected area.
46 The focus on floods and not on other natural disasters such as cyclonic storms, w h c h are also frequent in this state, emanated from the consultative process, as noted in chapter 1. After all, cyclones tend to lead to flooding and are, therefore, regarded as being part o f the flood dimension rather than separate from it.
47 Data compiled from the International Disaster Database (http://www.em-dat.net/) and TEN 2006.
72
pulses, groundnut and jute. The state is located within the Mahanadi basin, which drains about 42% o f its total area. Large tracts o f cultivated land in the state have no access to irrigation, with 75% o f the cultivated area being rainfall dependent. O f the state’s territory, 21% (3.34 mi l l ion hectares) is considered f lood prone (Government o f Orissa 2 0 0 6 ~ ) . ~ ~ The population most affected by floods is in the diara lands o f the deltaic region and other low-lying areas.
Assessing the full impact o f floods on communities i s a challenging exercise. There are both direct and indirect costs associated with flooding. The direct costs are closely connected to a flood event: the magnitude, extent, and duration determine the resulting physical damage. By contrast, indirect costs are incurred over an extended time period in the aftermath o f a flood. They include loss o f opportunity, reduction in property values, foregone tax revenue, and disturbance to ecosystems. Measuring these i s more difficult.49 The focus here i s on the direct costs, but even for these more visible impacts accurate measurements remain elusive and are difficult to verify against actual expenditures and losses.
Table 5.1 shows that the extent o f flood damage in Orissa has varied greatly from year to year. A feature o f the flood damage i s that public property losses are far greater than either agricultural or private property losses. This suggests scope for better protection o f public assets through improved planning and climate r isk assessments, an issue that i s addressed later in this chapter.
5.2.2 Anatomy of the Sample Villages 8. The choice o f districts selected for this case study i s based on a vulnerability profile
developed for the state, which found the districts o f Puri and Jagatsinghpur to be especially susceptible to the impacts o f climate change because o f the regular occurrence o f floods (see appendix B for details). The districts are located on the state’s eastern coast. Puri has a long coastline o f 155 kilometers, which i s almost twice that o f Jagatsinghpur. Both districts are very similar in terms o f socioeconomic indicators (table 5.2). Puri has an average annual rainfall o f 1,449 millimeters per year compared to Jagatsinghpur’s slightly higher average o f 1,501 millimeters per year. For the purposes o f this case study, three villages were selected from each district (see figures 5.1 and 5.2 for ~ocation).~’
6.
7.
48 O f these flood-prone areas, 75% spread across eight coastal districts; Cuttack, Kendrapara, Jagatsinghpur, Puri, Balasore, Bhadrak, Jeypore, and Ganjam
l k s i s because it requires modeling hypothetical scenarios that would have eventuated in the absence o f floods.
50 The villages are Naugaon, Tarasah, and Sunadiakandha in Jagatsinghpur; and Raibidhar, Gadasampat, and Deipur in Puri. In these villages surveys using stratified sampling were conducted to inventory the existing coping strategies and to assess adapting capacities and vulnerability o f communities across villages and landholding categories.
73
49
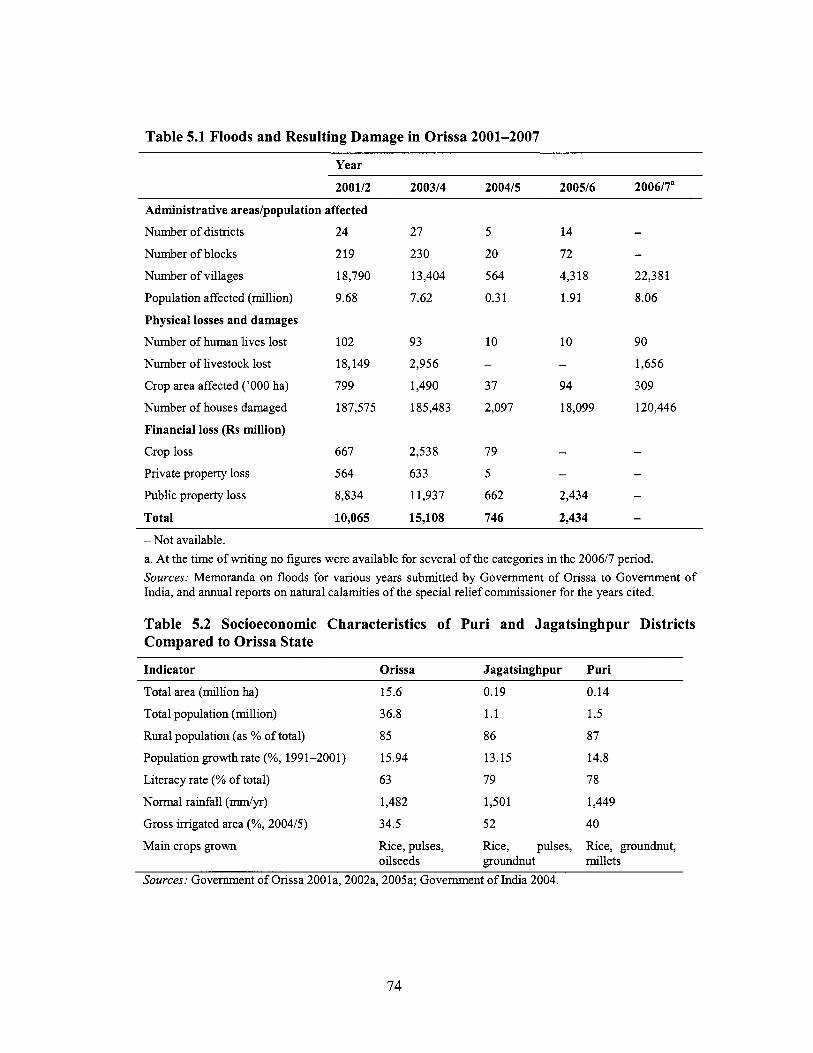
Table 5.1 Floods and Resulting Damage in Orissa 2001-2007
Year
200112 200314 200415 200516 200617"
Administrative areaslpopulation affected Number o f districts 24 27 5 14 - Number o f blocks
Number o f villages
219 230 20 72 - 18,790 13,404 5 64 4,318 22,381
Population affected (million) 9.68 7.62 0.3 1 1.91 8.06
Physical losses and damages
Number o f human lives lost 102 93 10 10 90
Number o f livestock lost 18,149 2,956 - - 1,656
Crop area affected ('000 ha) 799 1,490 37 94 309
Number o f houses damaged 187,575 185,483 2,097 18,099 120,446
Financial loss (Rs million) Crop loss 667 2,538 79 - - Private property loss
Public property loss
- - 564 633 5
8,834 1 1,937 662 2,434 -
Total 10,065 15,108 746 2,434 - - Not available. a. At the time o f writing no figures were available for several o f the categories in the 2006/7 period. Sources: Memoranda on floods for various years submitted by Government o f Orissa to Government o f India, and annual reports on natural calamities o f the special re l i e f commissioner for the years cited.
Table 5.2 Socioeconomic Characteristics of Puri and Jagatsinghpur Districts Compared to Orissa State
Indicator Orissa Jagatsinghpur Puri
Total area (million ha) 15.6 0.19 0.14
Total population (million) 36.8 1.1 1.5
Rural population (as % o f total) 85 86 87
Population growth rate (%, 1991-2001) 15.94 13.15 14.8
Literacy rate (% o f total)
Normal rainfall (mm/yr)
63 79 78
1,482 1,501 1,449
Gross irrigated area (%,2004/5) 34.5 52 40
Main crops grown Rice, pulses, Rice, pulses, Rice, groundnut, oilseeds groundnut mi l le ts
Sources: Government o f Orissa 2001a, 2002a, 2005a; Government o f India 2004.
74
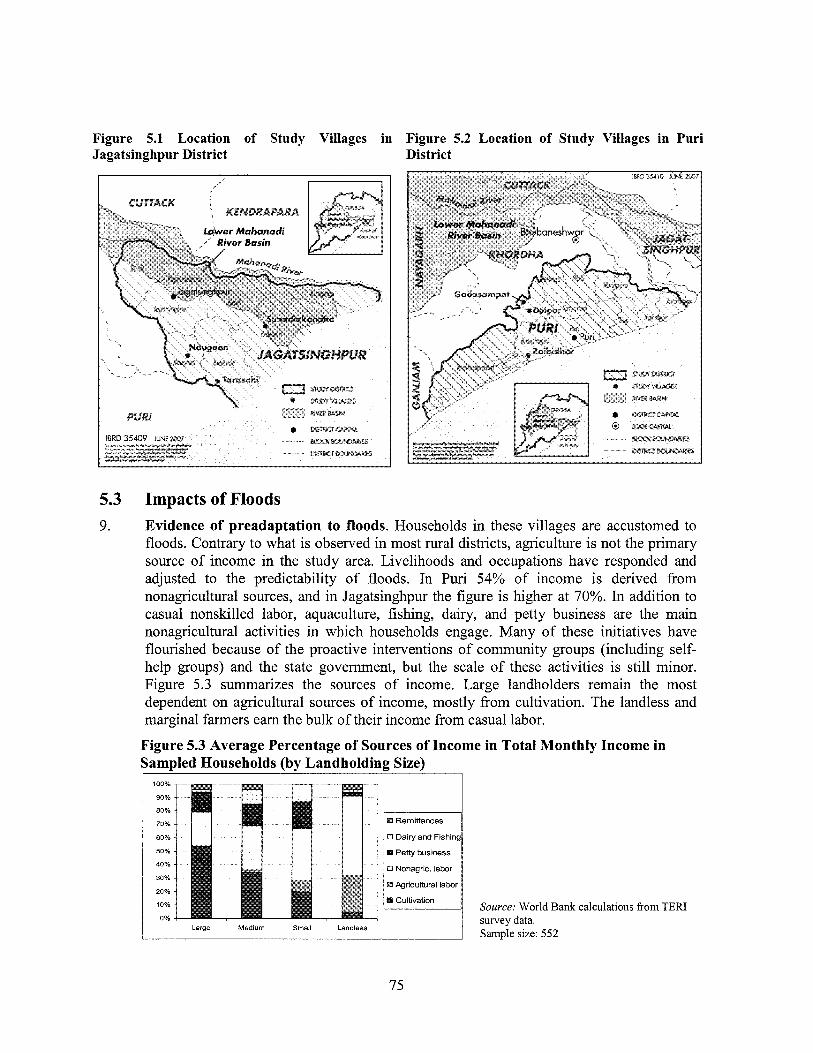
Figure 5.1 Location o f Study Villages in Jagatsinghpur District
Figure 5.2 Location of Study Villages in Puri District
5.3 Impacts o f Floods 9. Evidence o f preadaptation to floods. Households in these villages are accustomed to
floods. Contrary to what is observed in most rural districts, agriculture i s not the primary source o f income in the study area. Livelihoods and occupations have responded and adjusted to the predictability o f floods. In Puri 54% o f income is derived from nonagricultural sources, and in Jagatsinghpur the figure i s higher at 70%. In addition to casual nonskilled labor, aquaculture, fishing, dairy, and petty business are the main nonagricultural activities in which households engage. Many o f these initiatives have flourished because o f the proactive interventions o f community groups (including self- help groups) and the state government, but the scale o f these activities i s st i l l minor. Figure 5.3 summarizes the sources o f income. Large landholders remain the most dependent on agricultural sources o f income, mostly from cultivation. The landless and marginal farmers earn the bulk o f their income from casual labor.
Figure 5.3 Average Percentage of Sources of Income in Total Monthly Income in Sampled Households (by Landholding Size)
Source. World Bank calculations from TERI survey data Sample size' 552
75
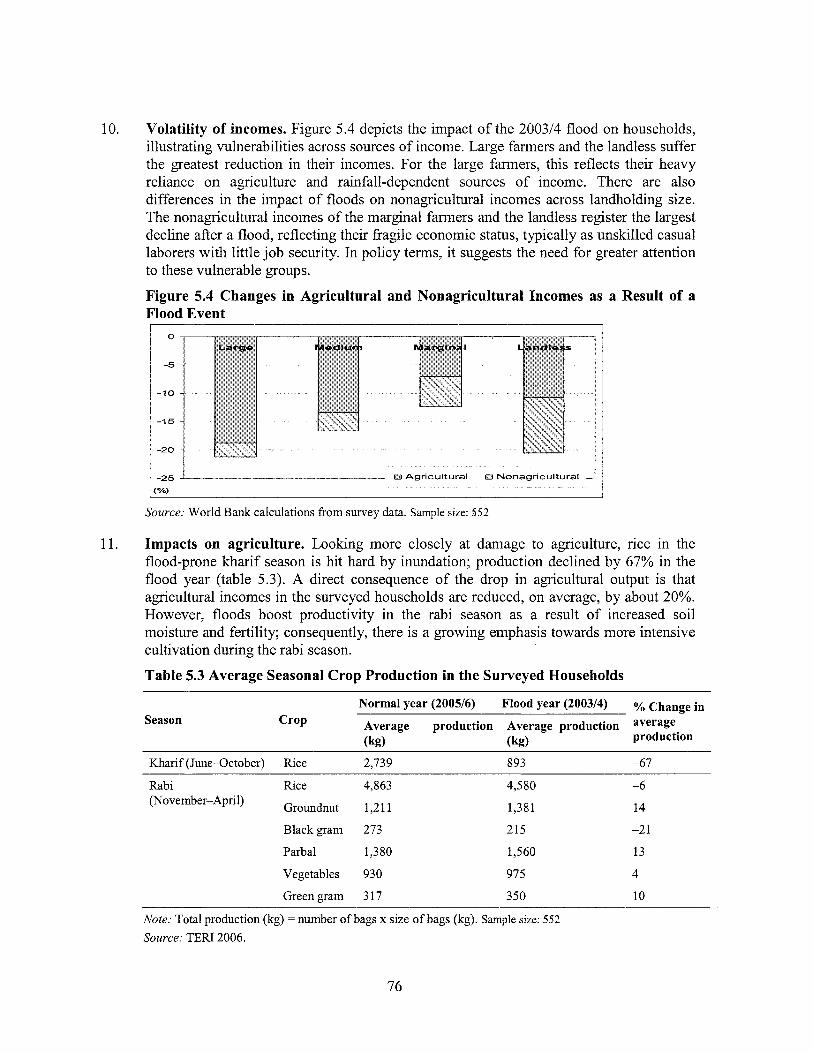
10. Volatility of incomes. Figure 5.4 depicts the impact o f the 2003/4 flood on households, illustrating vulnerabilities across sources o f income. Large farmers and the landless suffer the greatest reduction in their incomes. For the large farmers, this reflects their heavy reliance o n agriculture and rainfall-dependent sources o f income. There are also differences in the impact o f floods on nonagricultural incomes across landholding size. The nonagricultural incomes o f the marginal farmers and the landless register the largest decline after a flood, reflecting their fragile economic status, typically as unskilled casual laborers with little j ob security. In policy terms, i t suggests the need for greater attention to these vulnerable groups.
Figure 5.4 Changes in Agricultural and Nonagricultural Incomes as a Result of a Flood Event
1
Source; Wor ld Bank calculations f rom survey data. Sample size: 552
Impacts on agriculture. Looking more closely at damage to agriculture, rice in the flood-prone kharif season i s hit hard by inundation; production declined by 67% in the flood year (table 5.3). A direct consequence o f the drop in agricultural output i s that agricultural incomes in the surveyed households are reduced, on average, by about 20%. However, floods boost productivity in the rabi season as a result o f increased soil moisture and fertility; consequently, there i s a growing emphasis towards more intensive cultivation during the rabi season.
Table 5.3 Average Seasonal Crop Production in the Surveyed Households
Season Normal year (2005/6) Flood year (2003/4) % Change in
Average production Average production average Crop production (kg) (kg)
Khar i f (June-October) Rice 2,739 893 -67
Rabi Rice 4,863 (November-April) Groundnut 1,2 1 1
B lackg ram 273
Parbal 1,380
Vegetables 930
Greengram 317
4,580
1,381
215
1,560
975
350
-6
14
-2 1
13
4
10
Note; Total production (kg) = number ofbags x size o f bags (kg). Sample size: 552 Source: TERI 2006.
76
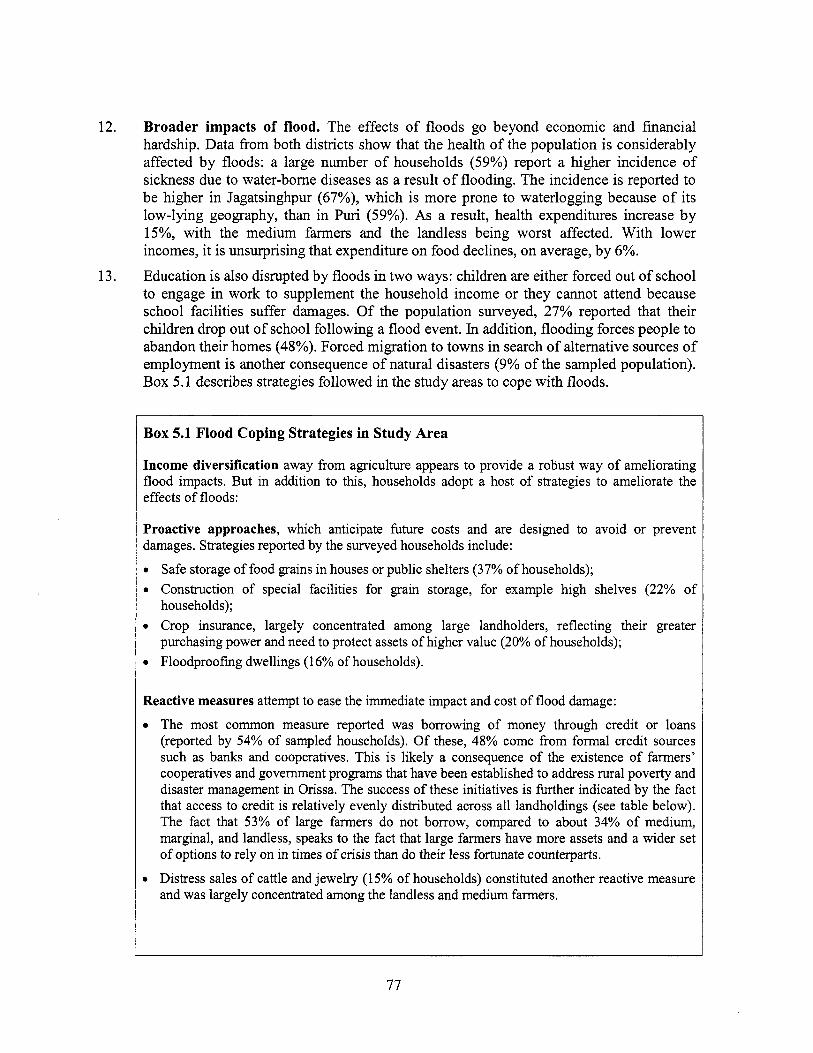
12.
13.
Broader impacts of flood. The effects o f f loods go beyond economic and f inancia l hardship. Data from both districts show that the heal th o f the population i s considerably affected by floods: a large number o f households (59%) report a h igher incidence o f sickness due to water-borne diseases as a result o f flooding. T h e incidence i s reported to b e h ighe r in Jagatsinghpur (67%), w h i c h i s m o r e prone to water logging because o f i t s low-lying geography, than in Puri (59%). As a result, heal th expenditures increase by 15%, with the m e d i u m farmers and the landless be ing worst affected. With l o w e r incomes, i t i s unsurpr is ing that expenditure on food declines, on average, by 6%. Education i s also disrupted by f loods in two ways: chi ldren are either forced out o f school to engage in work to supplement the household income or they cannot attend because school faci l i t ies suffer damages. Of the population surveyed, 27% reported that the i r ch i ldren drop out o f school following a f l o o d event. In addition, flooding forces people to abandon thei r homes (48%). Forced migration to towns in search o f alternative sources o f employment i s another consequence o f natural disasters (9% o f the sampled population). Box 5.1 describes strategies fo l l owed in the study areas to cope with floods.
Box 5.1 Flood Coping Strategies in Study Area
Income diversification away from agnculture appears to provide a robust way o f ameliorating flood impacts. But in addition to this, households adopt a host o f strategies to ameliorate the effects o f floods:
Proactive approaches, which anticipate future costs and are designed to avoid or prevent damages. Strateges reported by the surveyed households include:
0 Safe storage o f food grains in houses or public shelters (37% o f households); 0 Construction o f special facilities for grain storage, for example high shelves (22% o f
households); 0 Crop insurance, largely concentrated among large landholders, reflecting their greater
purchasing power and need to protect assets o f higher value (20% o f households); 0 Floodproofing dwellings (1 6% o f households).
Reactive measures attempt to ease the immediate impact and cost o f f lood damage:
0 The most common measure reported was borrowing o f money through credit or loans (reported by 54% o f sampled households). O f these, 48% come from formal credit sources such as banks and cooperatives. This i s l ikely a consequence o f the existence o f farmers’ cooperatives and government programs that have been established to address rural poverty and disaster management in h s s a . The success o f these initiatives i s further indicated by the fact that access to credit i s relatively evenly distributed across al l landholdings (see table below). The fact that 53% o f large farmers do not borrow, compared to about 34% o f medium, marginal, and landless, speaks to the fact that large farmers have more assets and a wider set o f options to rely on in times o f crisis than do their less fortunate counterparts.
0 Distress sales o f cattle and jewelry (15% o f households) constituted another reactive measure and was largely concentrated among the landless and medium farmers.
77
5.4 14.
5.4.1 15.
16.
Distribution o f Credit across Landholding Size
Source of Large Medium Small Marginal Total credit (% of households)
~ ~~~ ~
Informal(%) 6.4 6.0 3.9 3.9 7.1
Formal(%) 40.0 57.3 62.7 62.7 49.1
No loan (%) 53.6 36.7 33.3 33.3 43.8
Sample size: 552
Future Prospects under Climate Change Turning to the future, the I M S projects the impacts that a changing climate may have on the agricultural sector. The projections are for the lower Mahanadi basin in the A2 and B 2 scenarios. The basin-level projections are illustrated in figure 5.4.
Projections o f Climate Change The model projections indicate:
0 In the coastal districts located on the deltaic area the model projects a 23% increase, on average, in the annual mean rainfall in A2 and 19% in B 2 (see appendix H).
wetter months o f M a y and July (kharif planting season), and less rainfall from October to December (rabi). The implication i s clear - heightened flood r isks in the kharif season in the six districts studied.
central section o f the basin becomes somewhat drier but the already flood-prone areas on the coast will receive more rain.
increase in both scenarios by between 2.4"C and 3.7"C, but in A2 the increase i s more pronounced than in B2. Minimum temperatures are projected to increase by an even greater amount - as much as 4.2"C in A2.
The assessment suggests that the probability o f flood frequency and i t s intensity could increase dramatically. The hydrological model projects daily outflow discharges at a gauge station (located in Naraj northwest o f Jagatsinghpur and Pun). The results show that in the A2 and B 2 scenarios, the probability o f flooding wil l increase substantially. As an example o f the implied magnitudes, the probability that the discharge might exceed, say, 25,000 cumecs (cubic meters per second) i s l ow (about two to three times in 100 events) in the baseline. But under climate change, this i s projected to rise to about ten times in every 100 events (figure 5.6). Changes o f this scale wil l have significant implications for the type and location o f hydrological infrastructure that wil l be needed to protect communities and their assets and highlight the need for better forecasting tools to identify priorities for structural interventions.
0 A projected shift in the monthly rainfall patterns, with more rainfall in the already
0 There are also important changes in the spatial distribution o f rainfall, as the
0 At the district level, average annual maximum temperatures are expected to
78
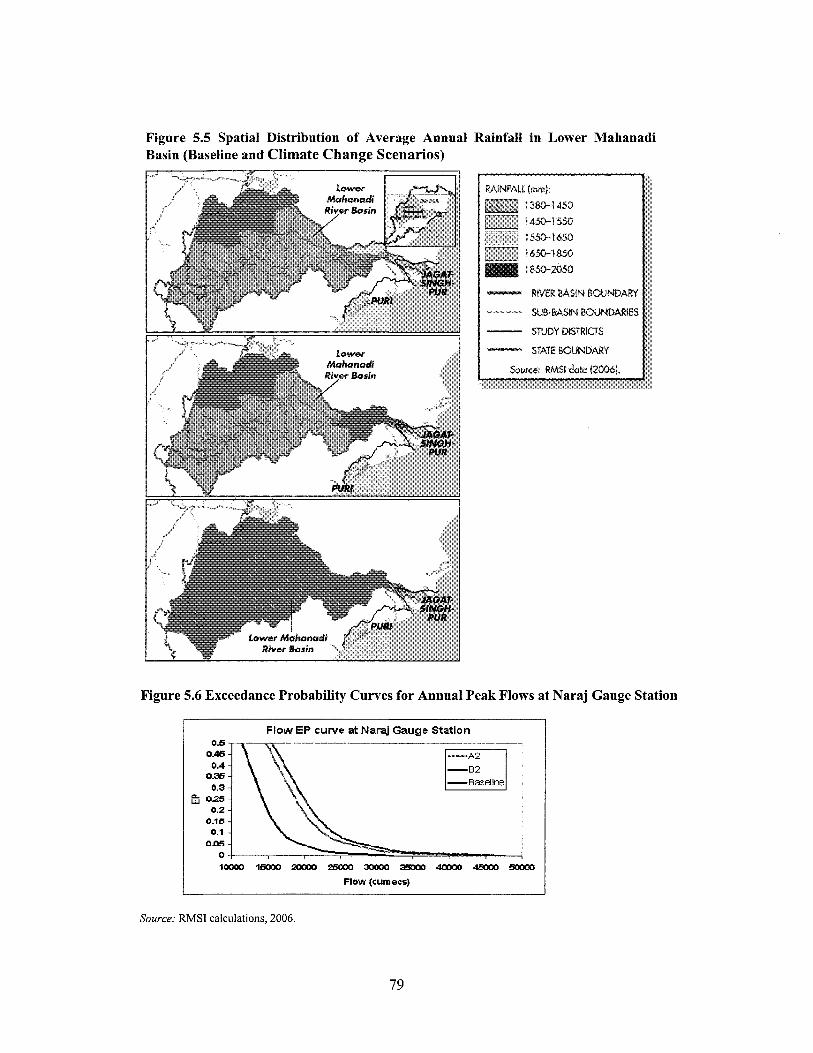
Figure 5.5 Spatial Distribution of Average Annual Rainfall in Lower Mahanadi Basin (Baseline and Climate Change Scenarios)
I
RAINFALL [mm).
STUDY MSTRICTS
STATE ~ ~ U N ~ A ~ ~
Figure 5.6 Exceedance Probability Curves for Annual Peak Flows at Naraj Gauge Station
E w
Flow EP curve at Namj Gauge Station 0.5
0.45 0.4
0% 0.3
025 0.2
0.15 0.1
0 a m
IDOOO 1- mm 25oM 3oM[I 001wXl4Emm ?zmm Flow (cumecs)
Source: R M S I calculations, 2006.
79
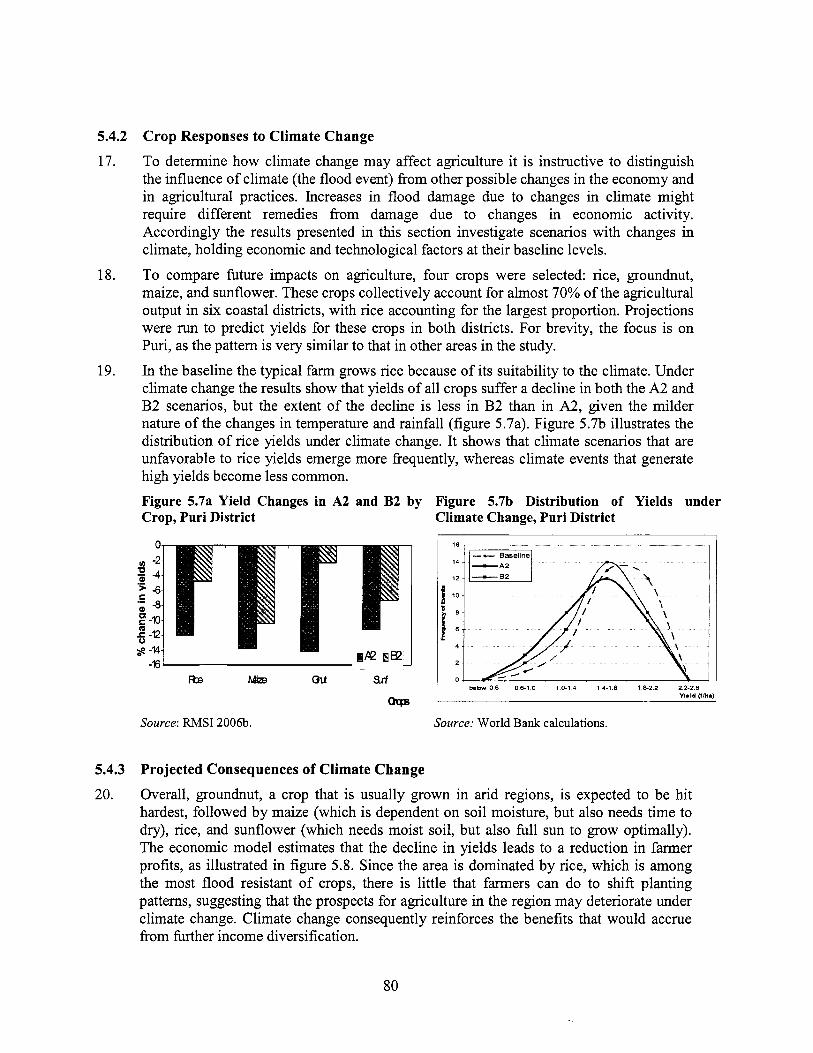
5.4.2 17.
18.
19.
5.4.3 20.
Crop Responses to Climate Change To determine how climate change may affect agriculture i t i s instructive to distinguish the influence o f climate (the flood event) from other possible changes in the economy and in agricultural practices. Increases in flood damage due to changes in climate might require different remedies from damage due to changes in economic activity. Accordingly the results presented in this section investigate scenarios with changes in climate, holding economic and technological factors at their baseline levels.
To compare future impacts on agriculture, four crops were selected: rice, groundnut, maize, and sunflower. These crops collectively account for almost 70% o f the agricultural output in six coastal districts, with rice accounting for the largest proportion. Projections were run to predict yields for these crops in both districts. For brevity, the focus is on Puri, as the pattern is very similar to that in other areas in the study.
In the baseline the typical farm grows rice because o f i t s suitability to the climate. Under climate change the results show that yields o f al l crops suffer a decline in both the A2 and B2 scenarios, but the extent o f the decline i s less in B2 than in A2, given the milder nature o f the changes in temperature and rainfall (figure 5.7a). Figure 5.7b illustrates the distribution o f rice yields under climate change. It shows that climate scenarios that are unfavorable to rice yields emerge more frequently, whereas climate events that generate high yields become less common.
Figure 5.7a Yield Changes in A2 and B2 by Figure 5.7b Distribution of Yields under Crop, Puri District Climate Change, Puri District
I -c Baselinel I
b e b w O 6 0 5 1 0 1 G 1 4 14-18 18-22 22-26
Source: R M S I 2006b.
I
Source: World Bank calculations.
Ybld (Ilk.) Qqs
Projected Consequences of Climate Change Overall, groundnut, a crop that is usually grown in arid regions, is expected to be hit hardest, followed by maize (which i s dependent on soil moisture, but also needs time to dry), rice, and sunflower (which needs moist soil, but also full sun to grow optimally). The economic model estimates that the decline in yields leads to a reduction in farmer profits, as illustrated in figure 5.8. Since the area i s dominated by rice, which i s among the most flood resistant o f crops, there is little that farmers can do to shift planting patterns, suggesting that the prospects for agriculture in the region may deteriorate under climate change. Climate change consequently reinforces the benefits that would accrue from further income diversification.
80
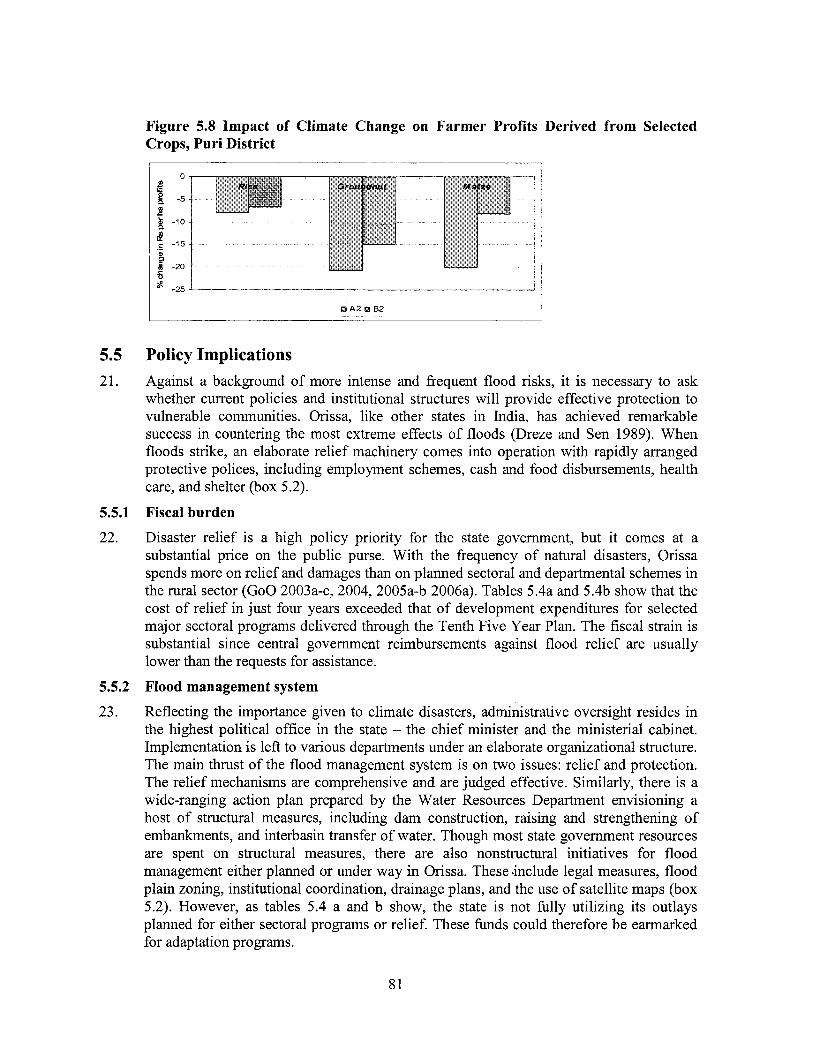
Figure 5.8 Impact o f Climate Change on Farmer Profits Derived from Selected Crops, Puri District
5.5 21.
5.5.1 22.
5.5.2 23.
Policy Implications Against a background o f more intense and frequent flood risks, i t is necessary to ask whether current policies and institutional structures will provide effective protection to vulnerable communities. Orissa, l ike other states in India, has achieved remarkable success in countering the most extreme effects o f floods (Dreze and Sen 1989). W h e n floods strike, an elaborate relief machinery comes into operation with rapidly arranged protective polices, including employment schemes, cash and food disbursements, health care, and shelter (box 5.2).
Fiscal burden
Disaster r e l i e f is a high policy priority for the state government, but it comes at a substantial price on the public purse. With the frequency o f natural disasters, Orissa spends more on relief and damages than on planned sectoral and departmental schemes in the rural sector (Go0 2003a-c, 2004, 2005a-b 2006a). Tables 5.4a and 5.4b show that the cost o f relief in just four years exceeded that o f development expenditures for selected major sectoral programs delivered through the Tenth Five Year Plan. The fiscal strain i s substantial since central government reimbursements against flood rel ief are usually lower than the requests for assistance.
Flood management system
Reflecting the importance given to climate disasters, administrative oversight resides in the highest political office in the state - the chief minister and the ministerial cabinet. Implementation is l e f t to various departments under an elaborate organizational structure. The main thrust o f the flood management system i s on two issues: rel ief and protection. The relief mechanisms are comprehensive and are judged effective. Similarly, there is a wide-ranging action plan prepared by the Water Resources Department envisioning a host o f structural measures, including dam construction, raising and strengthening o f embankments, and interbasin transfer o f water. Though most state government resources are spent on structural measures, there are also nonstructural initiatives for f lood management either planned or under way in Orissa. These include legal measures, f lood plain zoning, institutional coordination, drainage plans, and the use o f satellite maps (box 5.2). However, as tables 5.4 a and b show, the state i s not fully utilizing its outlays planned for either sectoral programs or relief. These funds could therefore be earmarked for adaptation programs.
81
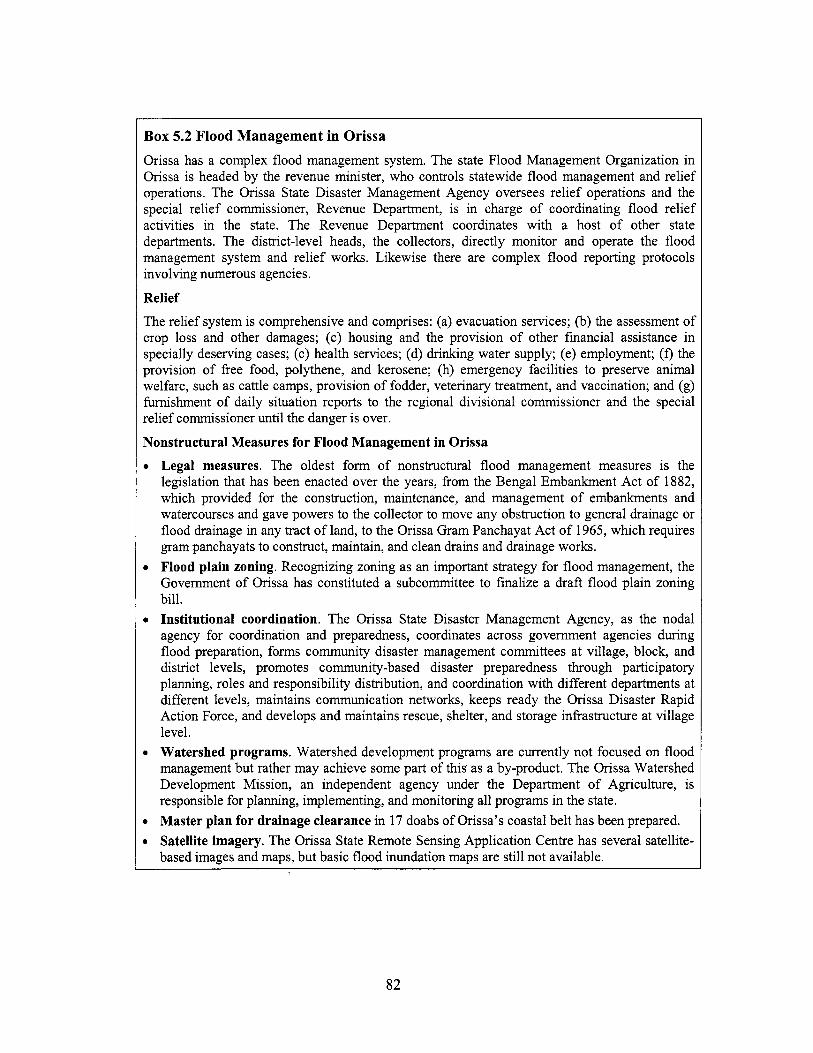
Box 5.2 Flood Management in Orissa Orissa has a complex flood management system. The state Flood Management Organization in Orissa i s headed by the revenue minister, who controls statewide flood management and rel ief operations. The Onssa State Disaster Management Agency oversees rel ief operations and the special re l ief commissioner, Revenue Department, i s in charge o f coordinating flood rel ief activities in the state. The Revenue Department coordinates with a host o f other state departments. The district-level heads, the collectors, directly monitor and operate the flood management system and rel ief works. Likewise there are complex flood reporting protocols involving numerous agencies.
Relief
The relief system i s comprehensive and comprises: (a) evacuation services; (b) the assessment o f crop loss and other damages; (c) housing and the provision o f other financial assistance in specially deserving cases; (c) health services; (d) drinking water supply; (e) employment; (f) the provision o f free food, polythene, and kerosene; (h) emergency facilities to preserve animal welfare, such as cattle camps, provision o f fodder, veterinary treatment, and vaccination; and (g) furnishment o f daily situation reports to the regional divisional commissioner and the special relief commissioner until the danger i s over.
Nonstructural Measures for Flood Management in Orissa
Legal measures. The oldest form o f nonstructural f lood management measures i s the legislation that has been enacted over the years, f rom the Bengal Embankment Ac t o f 1882, which provided for the construction, maintenance, and management o f embankments and watercourses and gave powers to the collector to move any obstruction to general drainage or flood drainage in any tract o f land, to the Onssa Gram Panchayat Ac t o f 1965, which requires gram panchayats to construct, maintain, and clean drains and drainage works. Flood plain zoning. Recognizing zoning as an important strategy for f lood management, the Government o f Onssa has constituted a subcommittee to finalize a draft f lood plain zoning bill. Institutional coordination. The Onssa State Disaster Management Agency, as the nodal agency for coordination and preparedness, coordinates across government agencies during flood preparation, forms community disaster management committees at village, block, and district levels, promotes community-based disaster preparedness through participatory planning, roles and responsibility distribution, and coordination with different departments at different levels, maintains communication networks, keeps ready the OIlssa Disaster Rapid Action Force, and develops and maintains rescue, shelter, and storage infrastructure at village level. Watershed programs. Watershed development programs are currently not focused on flood management but rather may achieve some part o f this as a by-product. The Orissa Watershed Development Mission, an independent agency under the Department o f Agriculture, i s responsible for planning, implementing, and monitoring a l l programs in the state. Master plan for drainage clearance in 17 doabs o f Orissa’s coastal belt has been prepared. Satellite imagery. The Orissa State Remote Sensing Application Centre has several satellite- based images and maps, but basic flood inundation maps are s t i l l not available.
82
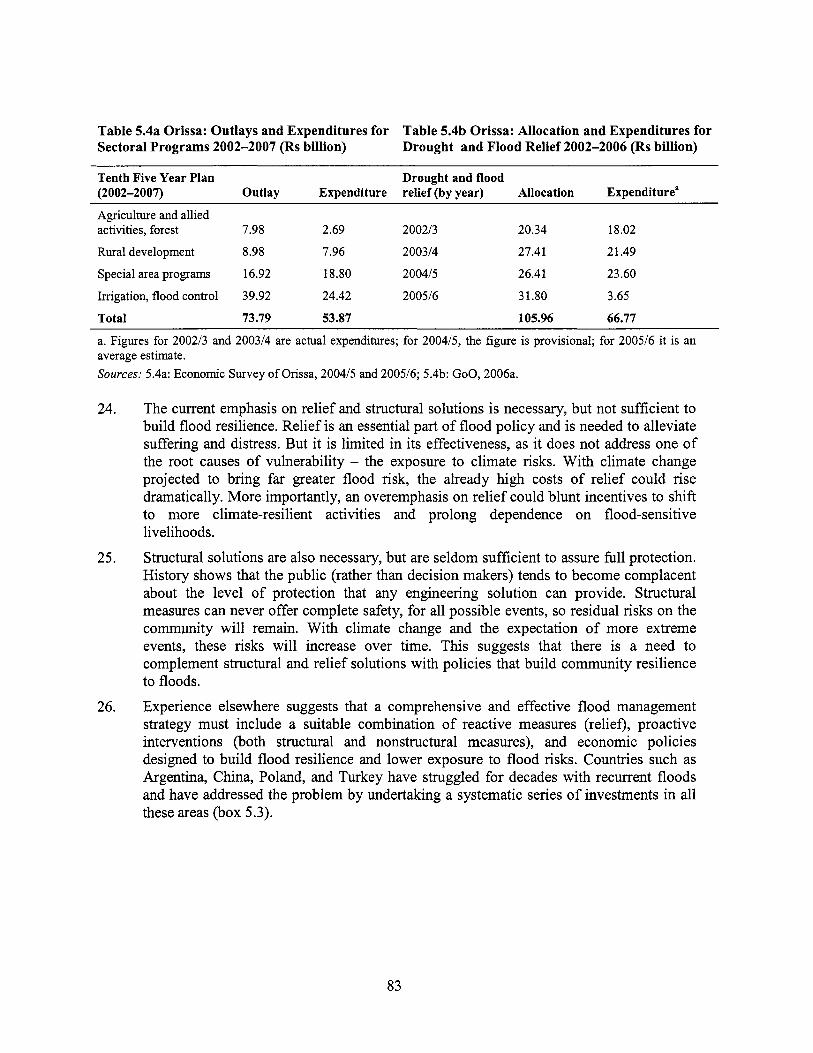
Table 5.4a Orissa: Outlays and Expenditures for Table 5.4b Orissa: Allocation and Expenditures for Sectoral Programs 2002-2007 (Rs billion) Drought and Flood Relief 2002-2006 (Rs billion)
Tenth Five Year Plan (2002-2007) Outlay Expenditure relief (by year) Allocation Expenditurea Agriculture and allied activities, forest 7.98 2.69 200213 20.34 18.02
Rural development 8.98 7.96 200314 27.41 2 1.49
Special area programs 16.92 18.80 200415 26.41 23.60
Irrigation, flood control 39.92 24.42 200516 3 1.80 3.65
Total 73.79 53.87 105.96 66.77
a. Figures for 200213 and 200314 are actual expenditures; for 200415, the figure i s provisional; for 200516 it i s an average estimate. Sources: 5.4a: Economic Survey o f Orissa, 200415 and 200516; 5.4b: GOO, 2006a.
Drought and flood
24.
25.
26.
The current emphasis on relief and structural solutions i s necessary, but not sufficient to build flood resilience. Relief i s an essential part o f flood pol icy and i s needed to alleviate suffering and distress. But i t is limited in its effectiveness, as it does not address one o f the root causes o f vulnerability - the exposure to climate risks. With climate change projected to bring far greater flood risk, the already high costs o f relief could rise dramatically. More importantly, an overemphasis on rel ief could blunt incentives to shift to more climate-resilient activities and prolong dependence on flood-sensitive livelihoods.
Structural solutions are also necessary, but are seldom sufficient to assure full protection. History shows that the public (rather than decision makers) tends to become complacent about the level o f protection that any engineering solution can provide. Structural measures can never offer complete safety, for a l l possible events, so residual risks on the community will remain. With climate change and the expectation o f more extreme events, these risks wil l increase over time. This suggests that there i s a need to complement structural and re l ie f solutions with policies that build community resilience to floods.
Experience elsewhere suggests that a comprehensive and effective flood management strategy must include a suitable combination o f reactive measures (relief), proactive interventions (both structural and nonstructural measures), and economic policies designed to build flood resilience and lower exposure to flood risks. Countries such as Argentina, China, Poland, and Turkey have struggled for decades with recurrent floods and have addressed the problem by undertaking a systematic series o f investments in al l these areas (box 5.3).
83
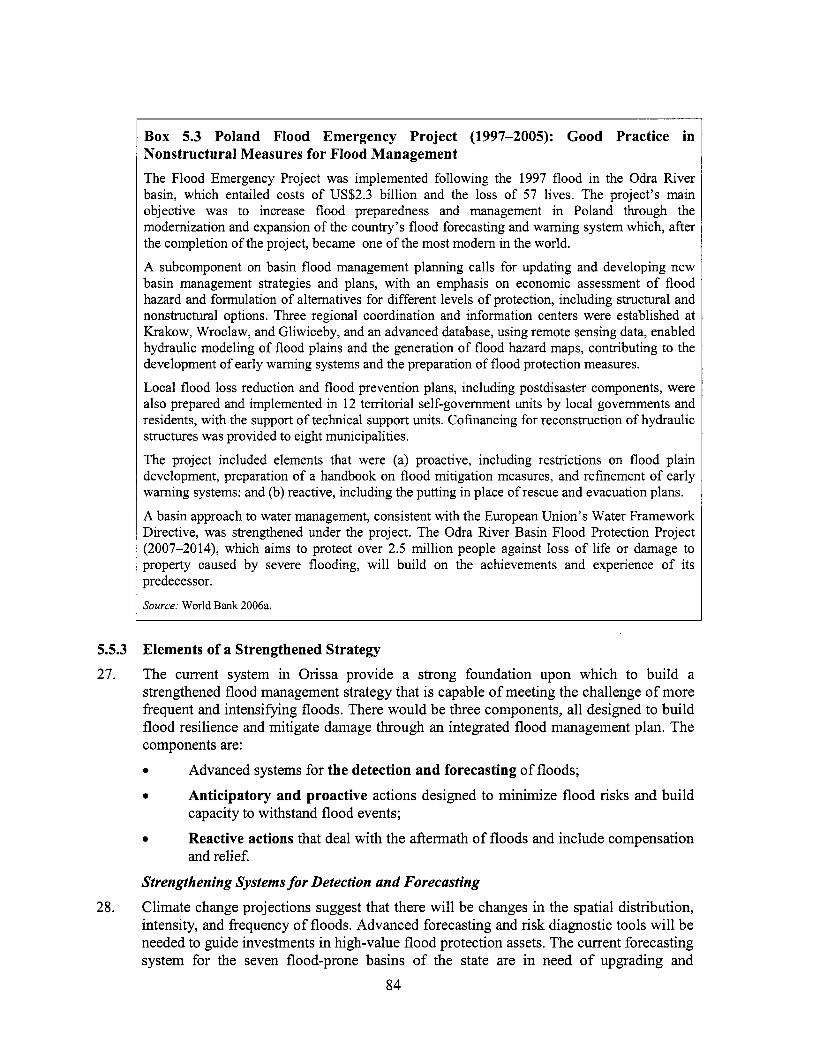
5.5.3
Box 5.3 Poland Flood Emergency Project (1997-2005): Good Practice in Nonstructural Measures for Flood Management The Flood Emergency Project was implemented following the 1997 flood in the Odra k v e r basin, which entailed costs o f US$2.3 b i l l ion and the loss o f 57 lives. The project’s main objective was to increase flood preparedness and management in Poland through the modernization and expansion o f the country’s flood forecasting and warning system which, after the completion o f the project, became one o f the most modem in the world.
A subcomponent on basin flood management planning calls for updating and developing new basin management strategies and plans, with an emphasis on economic assessment o f f lood hazard and formulation o f alternatives for different levels o f protection, including structural and nonstructural options. Three regional coordination and information centers were established at Krakow, Wroclaw, and Gliwiceby, and an advanced database, using remote sensing data, enabled hydraulic modeling o f flood plains and the generation o f f lood hazard maps, contributing to the development o f early warning systems and the preparation o f f lood protection measures.
Local f lood loss reduction and flood prevention plans, including postdisaster components, were also prepared and implemented in 12 territorial self-government u n i t s by local governments and residents, with the support o f technical support units. Cofinancing for reconstruction o f hydraulic structures was provided to eight municipalities.
The project included elements that were (a) proactive, including restrictions on flood plain development, preparation o f a handbook o n flood mitigation measures, and refinement o f early warning systems: and (b) reactive, including the putting in place o f rescue and evacuation plans.
A basin approach to water management, consistent with the European Union’s Water Framework Directive, was strengthened under the project. The Odra k v e r Basin Flood Protection Project (2007-2014), which aims to protect over 2.5 mi l l ion people against loss o f l i fe or damage to property caused by severe flooding, wil l build on the achievements and experience o f i t s predecessor.
Source: World Bank 2006a.
Elements of a Strengthened Strategy 27. The current system in Orissa provide a strong foundation upon which to build a
strengthened flood management strategy that is capable o f meeting the challenge o f more frequent and intensifying floods. There would be three components, a l l designed to build flood resilience and mitigate damage through an integrated flood management plan. The components are:
0 Advanced systems for the detection and forecasting o f floods;
Anticipatory and proactive actions designed to minimize flood risks and build
Reactive actions that deal with the aftermath o f floods and include compensation
0
capacity to withstand flood events;
and relief. 0
Strengthening Systems for Detection and Forecasting
Climate change projections suggest that there wil l be changes in the spatial distribution, intensity, and frequency o f floods. Advanced forecasting and risk diagnostic tools wil l be needed to guide investments in high-value flood protection assets. The current forecasting system for the seven flood-prone basins o f the state are in need o f upgrading and
28.
84
29.
30.
31.
improvement to match the scale o f risks that climate change could bring. The forecasting authority (Central Water Commission) employs a single hydrograph for a very large basin and uses an insufficient number o f forecast points. The system’s effectiveness could be enhanced by combining data collection, telemetry, flood forecasting, and flood warning elements into one integrated flood management and information system for the basin.51 Flood inundation mapping is another important planning tool and provides local authorities with important information for emergency flood responses. Generating such data for the Mahanadi delta area should be a priority for the Government o f Orissa.
Strengthening Anticipatory Measures Although technology can help detect and even forecast floods in a timely way, the information needs to be integrated into planning and policy for longer-term measures that reduce (a) the magnitude o f the flood; and (b) vulnerability to a f lood o f any given magnitude.
The assault on floods: importance of structural protection. Any improvements made to existing facilities, or construction o f new ones, will need to take into account the prospect o f more intense flooding and spatial shiRs in flood incidence. Improvements (where needed) and expansion (where possible) o f flood control infrastructure are vital in reducing flood damage. The Government o f Orissa has been prudent in recognizing that absolute protection to al l flood areas, for al l magnitudes o f floods and for different probabilities o f occurrence, is neither possible nor economic. Economic considerations argue for an emphasis towards the protection o f the higher-value assets (for example urban areas, infrastructure), with greater importance given to building adaptability and flood resilience elsewhere. So carehl monitoring and planning o f new settlements in these flood-prone areas needs to remain a priority for government authorities.
The accommodation o f floods: Importance of nonstructural resilience building.52 A number o f measures may be considered within this context:
0 Agricultural adaptation. Flood-resilient agriculture provides a way to insulate incomes against flood damage. Numerous pilots have been attempted with more rainfall-tolerant or short-duration varieties o f certain crops to minimize flood- related losses. Though economically viable solutions remain elusive, these initiatives have potential and warrant continued support, as the benefits f rom research and extension are always uncertain and take time to produce results. A greater emphasis on rubi cultivation could be hr ther facilitated by improving irrigation access in the drier months.
Economic instruments. agricultural wages, the situation i s more challenging. The economic instruments that are relevant for encouraging income diversification for drought management - such as credit and insurance schemes linked to j ob diversification - are equally
0 For those with few or no assets, who depend on
As an example the Hirakud Dam, which i s the main control structure on the Mahanadi, was originally designed for a flood o f 42,500 cumecs, whereas more recent calculations indicate that the maximum probable flood i s 69,500 cumecs. Therefore, floods need to be partially regulated by advance reservoir depletion, which in turn calls for a basinwide flood forecasting system.
51
Many o f the arguments presented here echo and extend those in World Bank 2007a. 52
85
pertinent in the context o f floods. The spread o f self-help groups in Orissa provides a potential community base for launching such schemes.
Orissa that aim to promote flood-based livelihoods. This i s the quintessential form o f flood adaptation. Aquaculture i s one option with considerable promise for unleashing rural growth. With the escalating demand for f i sh in India, and across the world, there i s scope to increase aquaculture production in flood-prone areas. But for this to eventuate, two obstacles need to be addressed. First, research and extension on biological sustainability, environmental impacts (externalities), fish productivity, and the choice o f species i s in its infancy and requires considerable further investment. A second and more important constraint arises from the outdated marketing system for perishables. Investments in addressing both the research and supply chain obstacles are obvious pol icy priorities for the flood- prone regions.
growth and land scarcity coupled with intensifying flood risks there i s a need for better and more careful planning and flood zoning. Land use planning and water management need to be combined into a synthesized plan and call for coordination between various departments and levels o f government. A greater challenge i s the implementation o f a plan that would affect many interests and would need processes that involve public participation and stakeholder engagement.
into account flood management as an explicit design practice. International experience shows that planning watersheds upstream in the river basin can significantly contribute to improved flood management.
0 Income diversification. There are already numerous and successful pilots in
0 The primacy of planning and zoning. With the pressures o f rapid population
0 Improved watershed programs. Watershed development programs should take
5.5.4 Reactive Strategies
32. In terms o f reactive policies, India has established disaster rel ief systems that are among the most comprehensive in the world (box 5.2). There effectiveness could be improved through further fine tuning. But ultimately adapting to floods remains the most sustainable and effective way to protect communities and harness rural growth. Improvements in the rel ief system might include the following:
0 Improved training o f panchayats and communities in flood preparedness. Community contingency plans for rel ief have been prepared through government initiatives but in many cases the plans have not been updated and have lost their relevance as circumstances change.
implemented on the ground (for example, what medical facilities are provided), largely due to poor accountability and monitoring o f rel ief work.
in the l i s t o f disaster preparedness actions at the state, district, or subdistrict levels. Safe shelters have been constructed in the coastal belt primarily to protect the coastal communities against cyclones, not floods. The maintenance and effectiveness o f these shelters are therefore a concern.
0 There i s a gap between what i s being planned for rel ief and what is being
0 The protection o f critical infrastructure and shelters, surprisingly, does not figure
86
6. A Way Forward
1. India has achieved impressive economic growth in the past decade but its farm sector has languished, with stagnating yields, l o w productivity, and pockets o f poverty and indebtedness. Aware o f the growing disparity between agrarian and industrial India, the government has assigned the highest priority to revitalize the farm sector to its fullest potential in the Eleventh Five Year Plan period (2007-2012). Targeted growth o f 4% per year in the agricultural sector is deemed necessary to achieve the aims o f poverty reduction, inclusiveness, and increased income opportunities, with a special focus o n rain-fed areas. But this i s a challenging task and i s made more so by the impacts and consequences o f ongoing and future climate variability and change.
2. There is a litany o f factors that account for agriculture’s slow growth. These include fragmented landholdings, prevalence o f subsistence and marginal farming, inadequate levels o f technology, poor market access, and a shrinking natural resource base, endangering agricultural productivity and farm livelihoods across India. Added to this, projections indicate that climate variability and change wil l be characterized by more frequent and severe droughts and floods, posing significant economic, environmental, and social risks. Since 60% o f India’s workforce depends on agriculture and natural resources for livelihood, employment, and income, they are highly vulnerable to future climate risks and have limited adaptive capacity to effectively deal with the increasing unpredictability o f climate change.
Delivering o n the promise o f faster and more inclusive growth will therefore require investment strategies that more effectively capture the potential effects o f future climate trends and are accompanied by a portfolio o f adaptation options that can diminish the associated risks. Living up to th is commitment will require proactive and integrated tools, and interventions and pol icy measures, that are specifically targeted and tailored to the high-risk and vulnerable areas. Improvements in institutional capacities must also be met at an equal pace to facilitate adaptation.
This report suggests that adaptation to climate variability and change can be tackled through a comprehensive climate r i s k management approach, starting with the most severe vulnerabilities arising in regions that are subjected to frequent, intense and damaging climate events. Using this approach, the report makes a strong case for moving towards integrated risk management solutions for enhancing the resilience and adaptive capabilities o f rural residents in selected areas o f semiarid India. The report emphasizes that there is no single adaptation solution. Effective and sustainable adaptation to climate variability and change requires a combination o f measures that must be implemented at multiple levels (national, regional, local, and community).
The study findings and recommendations coupled with a rigorous review o f the literature and consultations with government officials and NGOs suggest four interrelated strategies that would help lower the exposure to climate r isks and build adaptive resilience:
3.
4.
5.
e Strengthening climate information systems and mechanisms and related management tools to match current and future needs;
e Fostering climate-resilient reforms in agriculture and water resource management;
87
0 Supporting the management o f climate risks with economic mechanisms and
Improving institutional capacities and linkages among sectoral programs.
instruments;
0
6.1 6.
Strengthening Climate Information Systems and Mechanisms The study has shown that climate change projections are characterized by a high degree o f spatial variability in rainfall and temperature trends, which translates into spatial heterogeneity in drought and flood incidence. Generating high-resolution climate information i s an important first step to factor climate risk into development decisions in the states. This can be done with more localized meteorological data and climate models, which can help to better identify areas at risk. In dealing with floods, there is an overwhelming case for strengthening the current flood forecasting system to guide investments in high-value flood protection assets and to support more effective development and targeting o f nonstructural approaches. The effectiveness o f such a system can be strengthened by combining data collection, telemetry, flood forecasting, and flood warning elements into an integrated flood management and information system for the basin. Developing more robust flood inundation maps for planning and use by local authorities i s another important priori ty that would facilitate risk assessment in zoning and planning decisions.
However, climate and meteorological data processing is complex and lies at the frontiers o f climate change research. The capacity to generate climate information rests with research centers, while the need and demand for such information and products lies with local communities in risky areas. This argues in favor o f a climate information system at the national or state level to disseminate information for planning and management to end users, such as irrigation or farm sector managers. This i s also recognized in the Planning Commission’s working documents for the Eleventh Five Year Plan.
7.
8.
6.2 Fostering Climate-Resilient Reforms in Agriculture and Water Resource Management
9. There i s a strong case for more aggressively pursuing water conservation across drought- prone states. The projections indicate that even when farmers have largely adapted to arid cropping patterns, increased demand and consequent water stress could severely jeopardize livelihoods and render agriculture less viable in these regions. Reliance on supply-side approaches does l i t t le to curb the escalating and unsustainable demand for groundwater. Greater attention must therefore be given to hybrid approaches that emphasize the efficiency o f groundwater use and increase the effectiveness o f watershed activities to conserve soil moisture and harvest rainwater. Such adaptive measures are not a substitute for much needed economic incentives to enhance the productivity o f water and water pol icy reform aimed at, the control o f groundwater demand at the wider geographical scale necessary for effective management. However, they provide interim and feasible measures for reducing vulnerabilities.
The study makes a strong case for a shift in agriculture systems in order to overcome h t u r e climate change pressures. I t recognizes that there are many needs and opportunities related to farming systems. The use o f interim smart subsidies may help shift incentives and cropping patterns to modes that are better suited to state-level agroclimatic
10.
88
conditions. Additional measures, including strengthened support for agricultural research and extension and opportunities for reduction in costs o f production, are essential to promote more sustainable modes o f dryland farming, for example, water-efficient processes for paddy cultivation, promotion o f millets, oilseeds, and pulses and use o f low-external inputs in agriculture.
There are other ways in which rain-fed farming systems can be made more sustainable in semiarid areas. I t i s not within the scope o f this report to examine these in detail, but some innovative methods include non-pesticide management, intensification o f biomass used by small ruminants, water-saving composting methods, seed production, livelihood opportunities associated with agro-forestry and livestock-based production systems, and pooling o f farm bore wells, packaged with appropriate incentives.
In the case o f floods, solutions in the water sector would involve a combination o f infrastructure and nonstructural approaches such as flood plain zoning, institutional and community coordination, and drainage planning measures. This i s not to diminish the importance o f structural measures, but as indicated earlier, flood forecasting systems can guide such investments to maintain long-term performance and efficacy.
1 1.
12.
6.3 Economic Mechanisms and Instruments to Promote Income Diversification
13. This study has emphasized the need for innovative and cost-effective ways o f reaching poorer farmers to help reduce their risk exposure. Indebtedness has been identified as one o f the major impediments to occupational mobility. Debt instruments offer the potential to protect many vulnerable sections o f society and overcome the limitations o f crop insurance schemes. The study has also suggested caution in the design o f insurance schemes arising from the potential mismatch between payouts and actual losses. Coupling debt relief with new business start-up capital provides a way o f encouraging income diversification by lowering risks and transaction costs. These initiatives could be channeled through public and private microfinance institutions.
6.4 Improving Institutional Capacities and Program Linkages
14. Several government programs provide a r ich and varied platfonn upon which to build comprehensive adaptation strategies. But the programs are largely uncoordinated and operate in isolation. Integration is needed to harmonize the essential ingredients o f drought adaptation by building upon and facilitating synergy with ongoing programs, for example those m by the state departments o f water conservation, rural development, agriculture, and water resources.
Apex bodies, such as the National Rainfed Area Authority and the National Disaster Management Authority, could play a strong role in coordination, planning, and identifying gaps and synergies in programs. The panchayati raj institutions and community-based organizations have an important role to play in harnessing opportunities and building appropriate capacities for employment security and asset building, while ensuring the effective use o f such assets in reducing the adverse impacts o f droughts and floods.
15.
89
16.
17.
6.5 18.
19.
20.
Numerous opportunities exist to build climate resilience within current programs. For example, states could build in an adaptatiodclimate change dimension into the district agricultural planss3 which would go a long way in mainstreaming the climate risk management agenda as well as in enabling conditions for translating the recommendations o f the report into actions on the ground. Furthermore, there i s scope to introduce innovative activities for rain-fed farming systems in the National Rural Employment Guarantee Scheme. States could also integrate improved agricultural technology into watershed development programs. A number o f state and centrally sponsored schemes being implemented under different guidelines and by different agencies can be brought under a common framework with the dual purpose o f strengthening development outcomes and building climate resilience.
As regards floods, the institutional set-up for r e l i e f operations i s comprehensive and operational. But adaptation to floods requires greater integration across different sectors, including water resources and irrigation, housing and land development, and forestry and agriculture. Since adaptation i s a new and emerging concept, there is a role for creating state-level climate risk management committees as a first step in facilitating synergy and planning for adaptation activities.
Future Work In conclusion, there i s a clear recognition o f the need for, and commitment to, moving forward with a development strategy that can take into account future climate risks, as indicated by the many central and state programs that include climate risk components, and the emerging policies embodied in the Eleventh Five Year Plan o f the Government o f India. This study has developed, through analysis and consultation, a series o f adaptation options (with associated time frames) that support the development priorities to build a more climate-resilient and sustainable India. These are summarized in table 6.1.
Strategic actions including barrier removal activities are required by the Government o f India to implement the recommendations o f this report. These would include greater investments in climate forecasting and dissemination activities; economic incentives to promote income diversification in the form o f both insurance and credit services in order to give farmers incentives to shift to long-term viable non-farm activities and price stabilization interventions by the government for rain-fed and drought-resistant crop varieties, and finally market-based and demand-driven mechanisms to help farmers with assured sales o f their crops and livestock.
Climate change will have wider impacts that go beyond the flood- and drought-affected areas that are the focus o f this report. Most notably future work i s needed in areas o f high development significance. First, glacial melt remains the most dramatic risk that could threaten the water supplies, food production and life-sustaining ecosystems upon which millions in the Indo-Gangetic plains depend. There i s an urgent need to assess the magnitude o f these risks, the economic implications and identify cost-effective adaptation responses. Independent o f this, changing rainfall and temperatures will affect the
53 The National Development Council Resolution o f M a y 2007 under the chairmanship o f the Prime Minister o f India gives high priori ty t o incentivizing states to develop comprehensive district agricultural plans that wil l include livestock, fishing, minor irrigation, rural development works and other schemes for water harvesting and conservation.
90
productivity o f major food supplies in the rice and grain production regions o f India suggesting the need to investigate the impacts on food security goals, livelihoods and agricultural growth targets. Similarly, the threats from sea level rise on coastal communities and cities is another important issue that warrants greater investigations. Finally, though seldom recognized, the interplay between climate risks and agricultural trade needs to be explored in greater detail. Distortions from the protectionist policies in developed countries are likely to increase climate risks in developing countries. These are important issues that need to be addressed in future work.
91
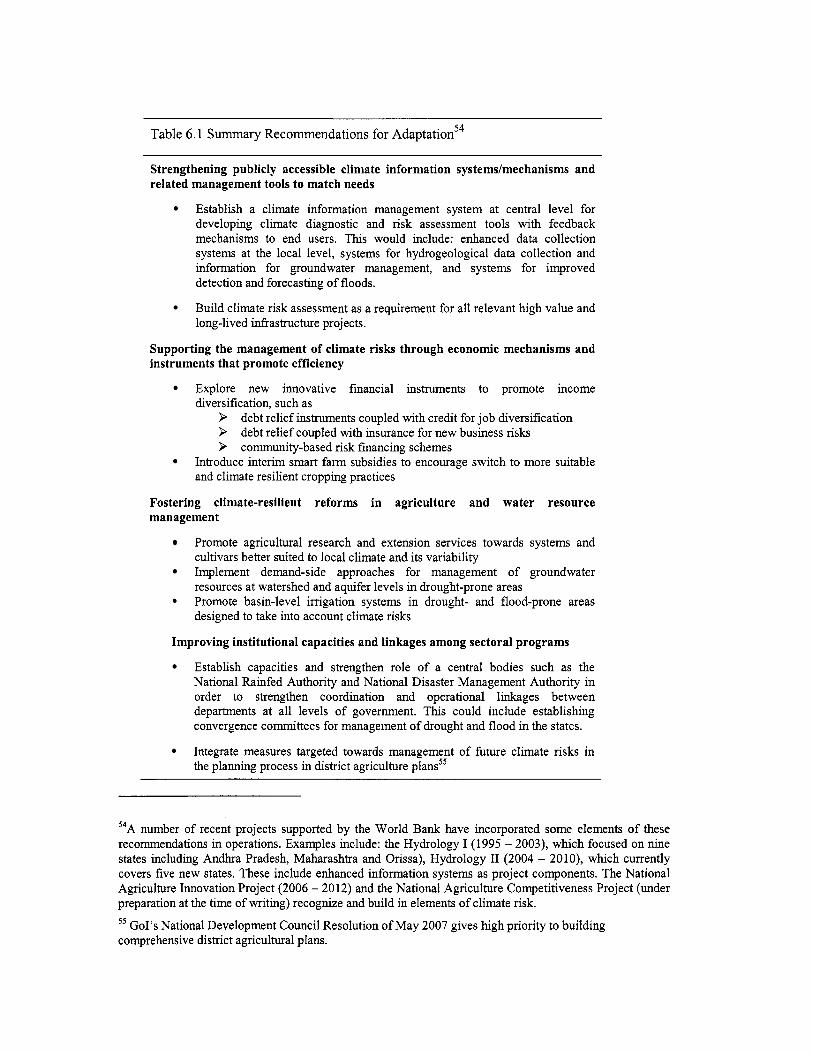
Tab le 6.1 Summary Recommendat ions for Adaptation54
Strengthening publicly accessible climate information systems/mechanisms and related management tools to match needs
Establish a climate information management system at central level for developing climate diagnostic and risk assessment tools with feedback mechanisms to end users. T h i s would include: enhanced data collection systems at the local level, systems for hydrogeological data collection and information for groundwater management, and systems for improved detection and forecasting o f floods.
Build climate risk assessment as a requirement for a l l relevant high value and long-lived infrastructure projects.
Supporting the management of climate risks through economic mechanisms and instruments that promote efficiency
Explore new innovative financial instruments to promote income diversification, such as
P > > community-based risk financing schemes
debt rel ief instruments coupled with credit for j o b diversification debt rel ief coupled with insurance for new business risks
Introduce interim smart farm subsidies to encourage switch to more suitable and climate resilient cropping practices
Fostering climate-resilient reforms in agriculture and water resource management
Promote agricultural research and extension services towards systems and cultivars better suited to local climate and i t s variabil ity Implement demand-side approaches for management o f groundwater resources at watershed and aquifer levels in drought-prone areas
9 Promote basin-level irrigation systems in drought- and flood-prone areas designed to take into account climate r i sks
Improving institutional capacities and linkages among sectoral programs
Establish capacities and strengthen role o f a central bodies such as the National Rainfed Authority and National Disaster Management Authority in order to strengthen coordination and operational linkages between departments at a l l levels o f government. This could include establishing convergence committees for management o f drought and f lood in the states.
Integrate measures targeted towards management o f future climate risks in the planning process in district agriculture plans55
54A number o f recent projects supported by the W o r l d Bank have incorporated some elements o f these recommendations in operations. Examples include: the Hydrology I (1995 - 2003), which focused o n nine states including Andhra Pradesh, Maharashtra and Orissa), Hydrology I1 (2004 - 2010), which currently covers five new states. These include enhanced information systems as project components. The National Agriculture Innovation Project (2006 - 2012) and the National Agriculture Competitiveness Project (under preparation at the time o f writing) recognize and build in elements o f climate risk.
55 GoI’s National Development Counci l Resolution o f M a y 2007 gives high priori ty t o building comprehensive district agricultural plans.
Appendix A: The Integrated Modeling System - Framework and Approach
M o d e l Structure
The Integrated Modeling System (IMS) developed for purposes o f this study consists o f three sub-components - HadRM3 climate data, a hydrological model (SWAT), and an agro-met simulation (EPIC) model - and their functional links. These sub-components are, in turn, linked to the economic model, described in Appendix G. The modeling toolkit and database binds these sub-components into single modeling tool, in a simple and interactive way. The basic components o f the integrated modeling system include a control unit, database management, model- and knowledge-base management, and user interface.
The underlying f low o f data and information in the Integrated Modeling System i s illustrated in figure A. 1. The starting point for the I M S is the generation o f climate data based on the IPCC emissions scenarios. The resulting climate data is then used in the hydrological model, SWAT, to generate surface water data, which are required as inputs to run the agro-meteorological model, EPIC. The latter integrates water and climate data into an agricultural output estimation framework. Detailed information about SWAT and EPIC i s provided later in this annex. Both SWAT and EPIC, are process-based deterministic, each i s governed by a set o f modeling equations. The spatial resolution used in this study i s MandaVBlock resolution. However, calibrations were done with the help o f local scientists - to know more about EPIC and i t s calibration.
The I M S requires a computer running on, at least, Windows 2000. The minimum platform configuration i s a Pentium or equivalent processor running at 100 megahertz with 64 megabytes o f memory, at least 500 Mb o f free disk space, and a display resolution o f at least 1024 x 768. For optimal performance, a Pentium processor running at 400 megahertz, or faster, with at least 128 Mb o f memory, 1Gb o f free disk, and a display resolution o f 1280 x 1024 i s recommended.
93
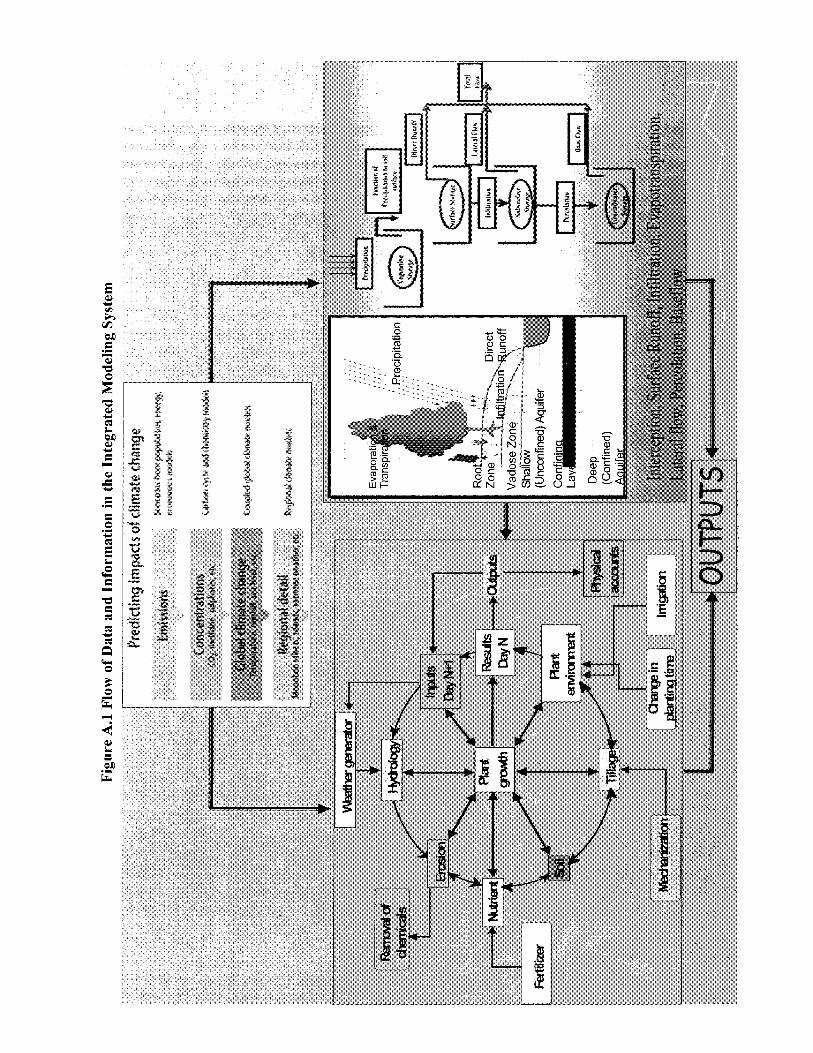
E W c, v) h m M E .3 3
3 E
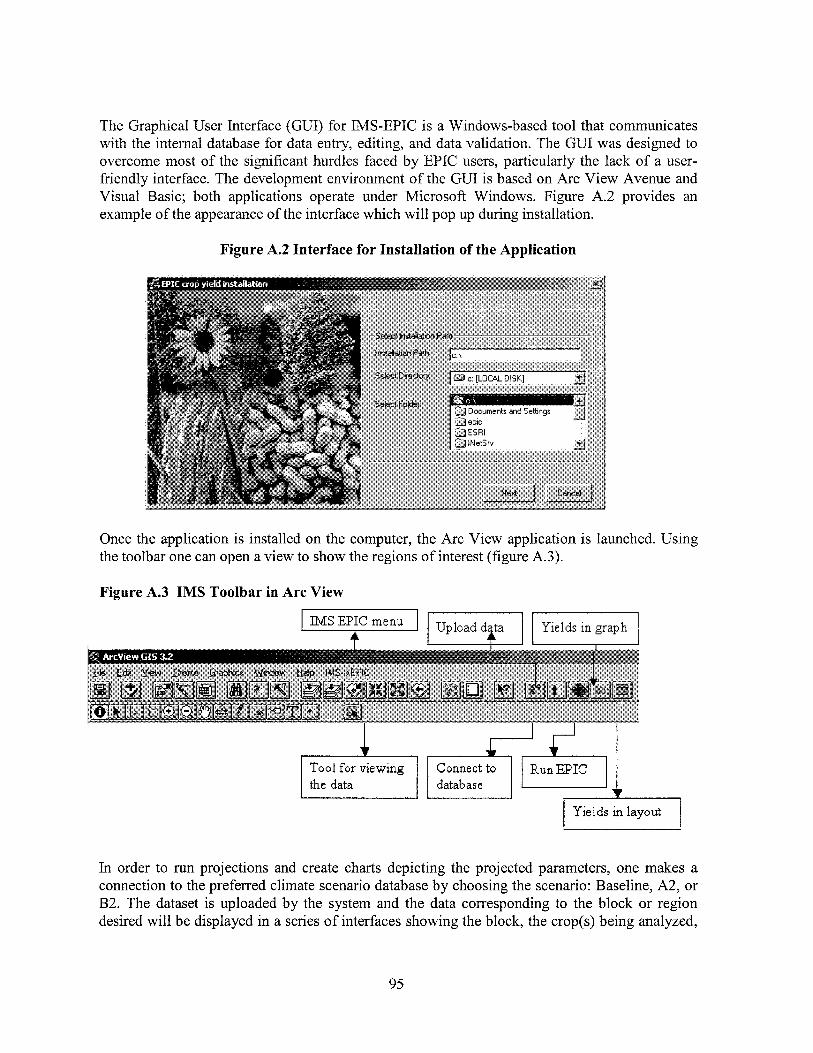
The Graphical User Interface (GUI) for IMS-EPIC is a Windows-based tool that communicates with the internal database for data entry, editing, and data validation. The GUI was designed to overcome most o f the significant hurdles faced by EPIC users, particularly the lack o f a user- friendly interface. The development environment o f the GUI i s based on Arc View Avenue and Visual Basic; both applications operate under Microsoft Windows. Figure A.2 provides an example o f the appearance o f the interface which will pop up during installation.
Figure A.2 Interface for Installation of the Application
Once the application i s installed on the computer, the Arc View application i s launched. Using the toolbar one can open a view to show the regions o f interest (figure A.3).
Figure A.3 I M S Toolbar in Arc View
I I I
~~~1 , Yields in layout
In order to run projections and create charts depicting the projected parameters, one makes a connection to the preferred climate scenario database by choosing the scenario: Baseline, A2, or B2. The dataset i s uploaded by the system and the data corresponding to the block or region desired wil l be displayed in a series o f interfaces showing the block, the crop(s) being analyzed,
95
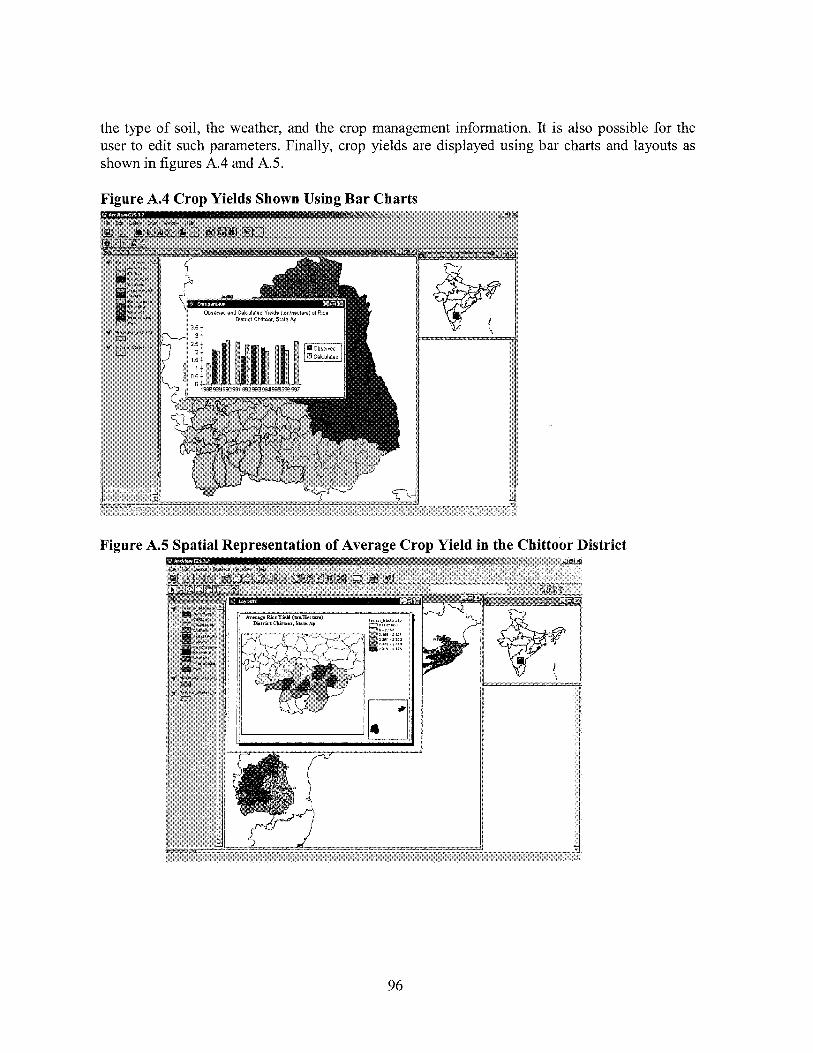
the type o f soil, the weather, and the crop management informat ion. I t i s also possible for the user to edit such parameters. Final ly, crop yields are displayed using bar charts and layouts as shown in figures A.4 and AS.
Figure A.4 Crop Yields Shown Using Bar Charts
Figure A.5 Spatial Representation of Average Crop Yield in the Chittoor District
96
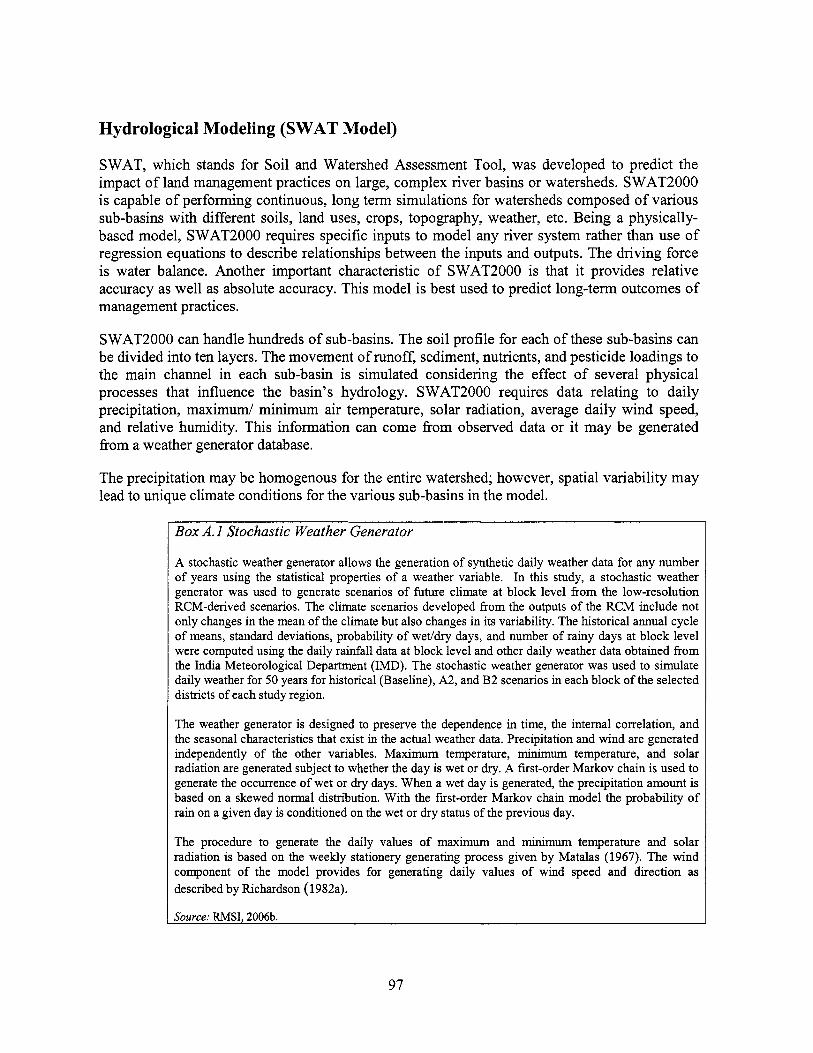
Hydrological Modeling (SWAT Model)
SWAT, which stands for Soil and Watershed Assessment Tool, was developed to predict the impact o f land management practices on large, complex river basins or watersheds. SWAT2000 is capable o f performing continuous, long term simulations for watersheds composed o f various sub-basins with different soils, land uses, crops, topography, weather, etc. Being a physically- based model, SWAT2000 requires specific inputs to model any river system rather than use o f regression equations to describe relationships between the inputs and outputs. The driving force i s water balance. Another important characteristic o f SWAT2000 i s that i t provides relative accuracy as wel l as absolute accuracy. This model i s best used to predict long-term outcomes o f management practices.
SWAT2000 can handle hundreds o f sub-basins. The soil profile for each o f these sub-basins can be divided into ten layers. The movement o f runoff, sediment, nutrients, and pesticide loadings to the main channel in each sub-basin is simulated considering the effect o f several physical processes that influence the basin’s hydrology. SWAT2000 requires data relating to daily precipitation, m a x i m u d minimum air temperature, solar radiation, average dai ly wind speed, and relative humidity. This information can come from observed data or it may be generated from a weather generator database.
The precipitation may be homogenous for the entire watershed; however, spatial variability may lead to unique climate conditions for the various sub-basins in the model.
Box A. I Stochastic Weather Generator
A stochastic weather generator allows the generation o f synthetic daily weather data for any number o f years using the statistical properties o f a weather variable. In this study, a stochastic weather generator was used to generate scenarios o f future climate at block level f rom the low-resolution RCM-derived scenarios. The climate scenarios developed from the outputs o f the R C M include not only changes in the mean o f the climate but also changes in its variability. The historical annual cycle o f means, standard deviations, probability o f weddry days, and number o f rainy days at block level were computed using the daily rainfall data at block level and other daily weather data obtained from the India Meteorological Department (IMD). The stochastic weather generator was used to simulate daily weather for 50 years for historical (Baseline), A2, and B 2 scenarios in each block o f the selected districts o f each study region.
The weather generator i s designed to preserve the dependence in time, the internal correlation, and the seasonal characteristics that exist in the actual weather data. Precipitation and wind are generated independently o f the other variables. Maximum temperature, minimum temperature, and solar radiation are generated subject to whether the day i s wet or dry. A first-order Markov chain i s used to generate the occurrence o f wet or dry days. When a wet day i s generated, the precipitation amount i s based on a skewed normal distribution. With the first-order Markov chain model the probability o f rain on a given day i s conditioned on the wet or dry status o f the previous day.
The procedure to generate the daily values o f maximum and minimum temperature and solar radiation i s based on the weekly stationery generating process given by Matalas (1967). The wind component o f the model provides for generating daily values o f wind speed and direction as described by Richardson (1982a).
Source: RMSI, 2006b.
97
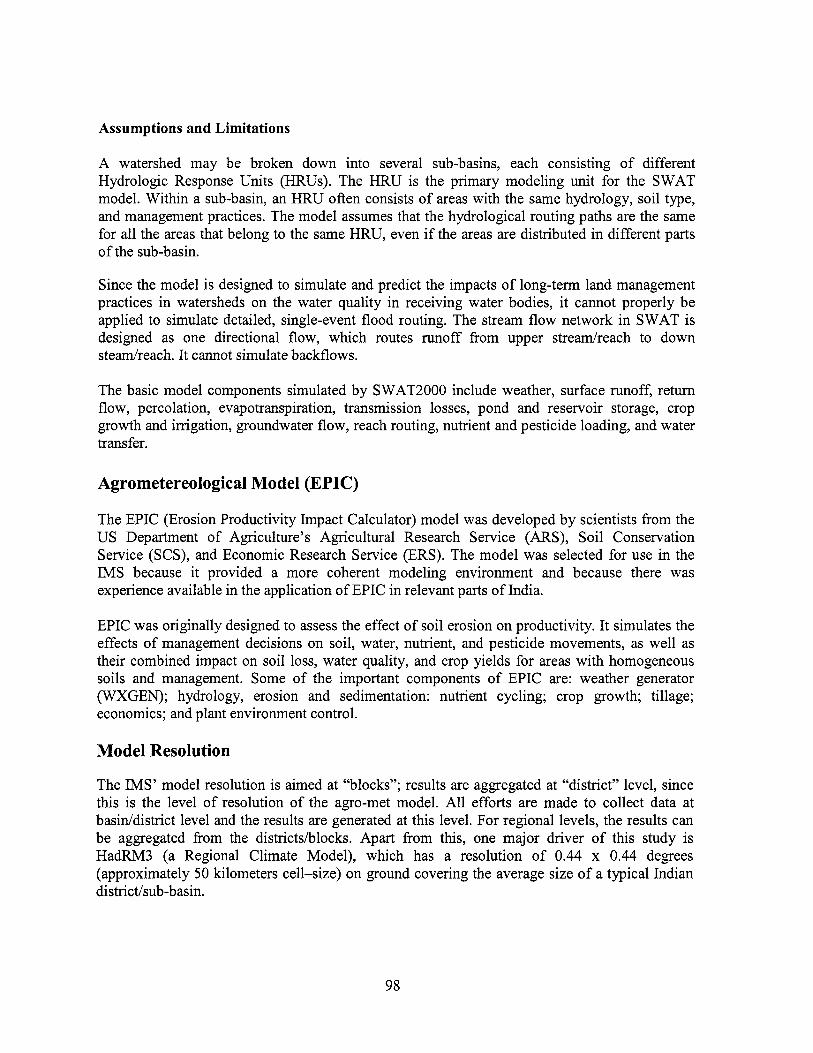
Assumptions and Limitations
A watershed may be broken down into several sub-basins, each consisting o f different Hydrologic Response Units (HRUs). The HRU i s the primary modeling unit for the SWAT model. Within a sub-basin, an HRU often consists o f areas with the same hydrology, soil type, and management practices. The model assumes that the hydrological routing paths are the same for al l the areas that belong to the same HRU, even if the areas are distributed in different parts o f the sub-basin.
Since the model i s designed to simulate and predict the impacts o f long-term land management practices in watersheds on the water quality in receiving water bodies, i t cannot properly be applied to simulate detailed, single-event flood routing. The stream f low network in SWAT i s designed as one directional flow, which routes runoff from upper streadreach to down stedreach. I t cannot simulate backflows.
The basic model components simulated by S WAT2000 include weather, surface runoff, return flow, percolation, evapotranspiration, transmission losses, pond and reservoir storage, crop growth and imgation, groundwater flow, reach routing, nutrient and pesticide loading, and water transfer.
Agrometereological M o d e l (EPIC)
The EPIC (Erosion Productivity Impact Calculator) model was developed by scientists from the U S Department o f Agriculture’s Agricultural Research Service ( A R S ) , Soil Conservation Service (SCS), and Economic Research Service (ERS). The model was selected for use in the I M S because i t provided a more coherent modeling environment and because there was experience available in the application o f EPIC in relevant parts o f India.
EPIC was originally designed to assess the effect o f soil erosion on productivity. I t simulates the effects o f management decisions on soil, water, nutrient, and pesticide movements, as wel l as their combined impact on soil loss, water quality, and crop yields for areas with homogeneous soils and management. Some o f the important components o f EPIC are: weather generator (WXGEN); hydrology, erosion and sedimentation: nutrient cycling; crop growth; tillage; economics; and plant environment control.
M o d e l Resolution
The I M S ’ model resolution i s aimed at “blocks”; results are aggregated at “district” level, since this i s the level o f resolution o f the agro-met model. All efforts are made to collect data at basiddistrict level and the results are generated at this level. For regional levels, the results can be aggregated from the districtshlocks. Apart from this, one major driver o f this study i s HadRM3 (a Regional Climate Model), which has a resolution o f 0.44 x 0.44 degrees (approximately 50 kilometers cell-size) on ground covering the average size o f a typical Indian districthub-basin.
98
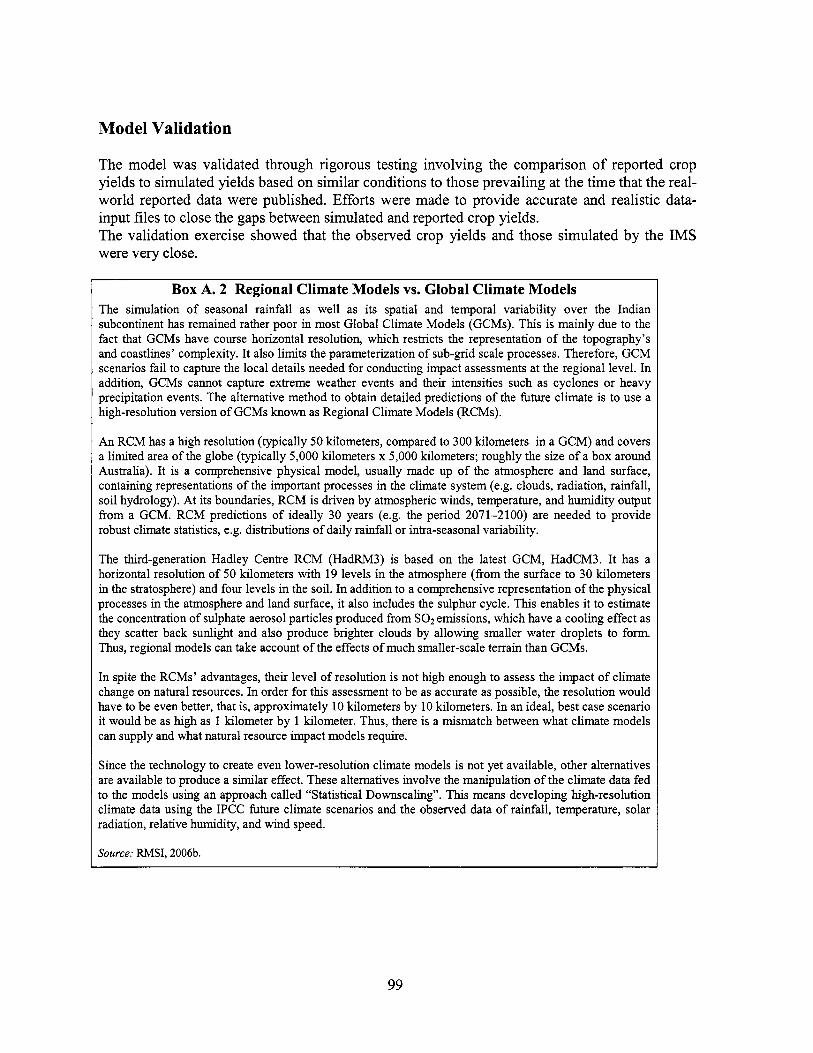
Model Validation
The model was validated through rigorous testing involving the comparison o f reported crop yields to simulated yields based on similar conditions to those prevailing at the time that the real- world reported data were published. Efforts were made to provide accurate and realistic data- input f i les to close the gaps between simulated and reported crop yields. The validation exercise showed that the observed crop yields and those simulated by the I M S were very close.
Box A. 2 Regional Climate Models vs. Global Climate Models The simulation o f seasonal rainfall as we l l as i ts spatial and temporal variabil ity over the Indian subcontinent has remained rather poor in most Global Climate Models (GCMs). This i s main ly due to the fact that GCMs have course horizontal resolution, which restricts the representation o f the topography’s and coastlines’ complexity. I t also l imits the parameterization o f sub-grid scale processes. Therefore, GCM scenarios fai l t o capture the local details needed for conducting impact assessments at the regional level. In addition, GCMs cannot capture extreme weather events and their intensities such as cyclones o r heavy precipitation events. The alternative method to obtain detailed predictions o f the future climate i s t o use a high-resolution version o f GCMs known as Regional Climate Models (RCMs).
An RCM has a high resolution (typically 50 kilometers, compared to 300 kilometers in a GCM) and covers a l imited area o f the globe (typically 5,000 kilometers x 5,000 kilometers; roughly the size of a b o x around Australia). I t i s a comprehensive physical model, usually made up o f the atmosphere and land surface, containing representations o f the important processes in the climate system (e.g. clouds, radiation, rainfall, soi l hydrology). At i ts boundaries, RCM i s driven by atmospheric winds, temperature, and humidity output f rom a GCM. R C M predictions o f ideally 30 years (e.g. the period 2071-2100) are needed to provide robust climate statistics, e.g. distributions o f dai ly rainfall o r intra-seasonal variability.
The third-generation Hadley Centre RCM (HadRM3) i s based o n the latest GCM, HadCM3. It has a horizontal resolution o f 50 kilometers with 19 levels in the atmosphere ( f rom the surface to 30 kilometers in the stratosphere) and four levels in the soil. In addition to a comprehensive representation o f the physical processes in the atmosphere and land surface, i t also includes the sulphur cycle. This enables it to estimate the concentration o f sulphate aerosol particles produced f rom SOz emissions, which have a cool ing effect as they scatter back sunlight and also produce brighter clouds by al lowing smaller water droplets to form. Thus, regional models can take account o f the effects o f much smaller-scale terrain than GCMs.
In spite the RCMs’ advantages, their level o f resolution i s not high enough to assess the impact o f climate change o n natural resources. In order for th is assessment to be as accurate as possible, the resolution would have to be even better, that is, approximately 10 kilometers by 10 kilometers. In an ideal, best case scenario it would be as h igh as 1 kilometer by 1 kilometer. Thus, there is a mismatch between what climate models can supply and what natural resource impact models require.
Since the technology to create even lower-resolution climate models i s not yet available, other alternatives are available to produce a similar effect. These alternatives involve the manipulation o f the climate data fed to the models using an approach called “Statistical Downscaling”. T h ~ s means developing hgh-resolut ion climate data using the IPCC h t u r e climate scenarios and the observed data o f rainfall, temperature, solar radiation, relative humidity, and wind speed.
Source: RMSI, 2006b.
99
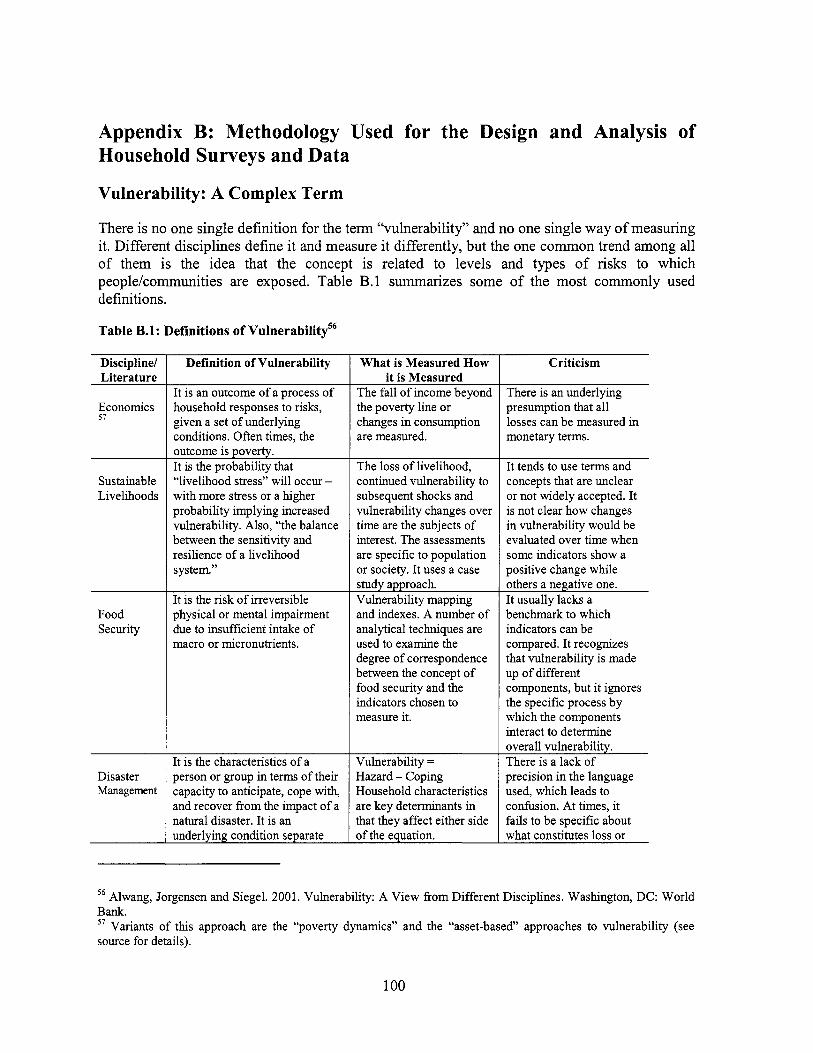
Appendix B: Methodology Used for the Design and Analysis o f Household Surveys and Data
Vulnerability: A Complex Term
There i s no one single definition for the term “vulnerability” and no one single way o f measuring it. Different disciplines define i t and measure i t differently, but the one common trend among al l o f them is the idea that the concept i s related to levels and types o f r isks to which people/communities are exposed. Table B.l summarizes some o f the most commonly used definitions.
Table B.l: Definitions of V~lnerability~~
Discipline/ Literature
Economics 57
Sustainable Livelihoods
Food Security
Disaster Management
Definition of Vulnerability
I t i s an outcome o f a process o f household responses to r isks, given a set o f underlying conditions. Often times, the outcome i s poverty. I t i s the probabil ity that “l ivelihood stress” wil l occur - with more stress or a higher probabil ity implying increased vulnerability. Also, “the balance between the sensitivity and resilience o f a l ivelihood system.”
I t i s the risk o f irreversible physical o r mental impairment due to insufficient intake o f macro or micronutrients.
I t i s the characteristics o f a person or group in terms o f their capacity to anticipate, cope with, and recover f r o m the impact o f a natural disaster. I t i s an underlying condition separate
What i s Measured How it i s Measured
The fa l l o f income beyond the poverty l ine o r changes in consumption are measured.
The loss o f livelihood, continued vulnerability to subsequent shocks and vulnerability changes over time are the subjects of interest. The assessments are specific t o population or society. I t uses a case study approach. Vulnerabil ity mapping and indexes. A number o f analytical techniques are used to examine the degree o f correspondence between the concept o f food security and the indicators chosen to measure it.
Vulnerabil ity = Hazard - Coping Household characteristics are key determinants in that they affect either side o f the equation.
Criticism
There i s an underlying presumption that a l l losses can b e measured in monetary terms.
~~ ~
I t tends to use terms and concepts that are unclear or not widely accepted. I t i s not clear h o w changes in vulnerability would be evaluated over time when some indicators show a positive change while others a negative one. I t usually lacks a b e n c k r k to which indicators can be compared. I t recognizes that vulnerabil ity i s made up o f different components, but i t ignores the specific process by which the components interact t o determine overall vulnerability. There is a lack o f precision in the language used, which leads to confusion. At times, i t fails t o be specific about what constitutes loss or
56 Alwang, Jorgensen and Siegel. 2001. Vulnerability: A V i e w f r o m Different Disciplines. Washington, DC: Wor ld Bank.
Variants o f th is approach are the “poverty dynamics” and the “asset-based” approaches to vulnerabil ity (see source for details).
57
100
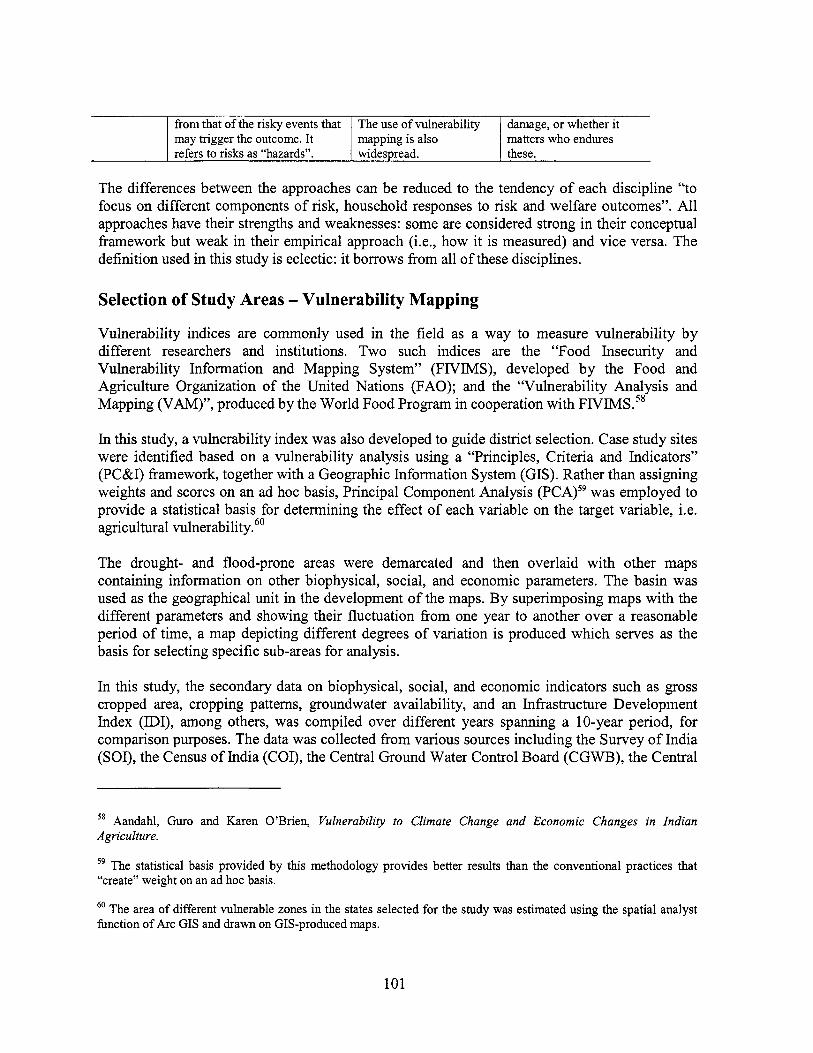
f rom that o f the risky events that may trigger the outcome. I t refers to risks as “hazards”.
The differences between the approaches can be reduced to the tendency o f each discipline “to focus on different components o f risk, household responses to risk and welfare outcomes”. All approaches have their strengths and weaknesses: some are considered strong in their conceptual framework but weak in their empirical approach (i.e., how i t i s measured) and vice versa. The definition used in this study i s eclectic: i t borrows from al l o f these disciplines.
The use o f vulnerability mapping is also widespread. these.
damage, o r whether it matters who endures
Selection o f Study Areas - Vulnerability Mapping
Vulnerability indices are commonly used in the field as a way to measure vulnerability by different researchers and institutions. Two such indices are the “Food Insecurity and Vulnerability Information and Mapping System” (FIVIMS), developed by the Food and Agriculture Organization o f the United Nations (FAO); and the “Vulnerability Analysis and Mapping (VAM)”, produced by the World Food Program in cooperation with FIVIMS.58
In this study, a vulnerability index was also developed to guide district selection. Case study sites were identified based on a vulnerability analysis using a “Principles, Criteria and Indicators” (PC&I) framework, together with a Geographic Information System (GIs). Rather than assigning weights and scores on an ad hoc basis, Principal Component Analysis (PCA)59 was employed to provide a statistical basis for determining the effect o f each variable on the target variable, i.e. agricultural vulnerability.60
The drought- and flood-prone areas were demarcated and then overlaid with other maps containing information on other biophysical, social, and economic parameters. The basin was used as the geographical unit in the development o f the maps. By superimposing maps with the different parameters and showing their fluctuation from one year to another over a reasonable period o f time, a map depicting different degrees o f variation is produced which serves as the basis for selecting specific sub-areas for analysis.
In this study, the secondary data on biophysical, social, and economic indicators such as gross cropped area, cropping patterns, groundwater availability, and an Infrastructure Development Index (IDI), among others, was compiled over different years spanning a 10-year period, for comparison purposes. The data was collected from various sources including the Survey o f India (SOI), the Census o f India (COI), the Central Ground Water Control Board (CGWB), the Central
58 Aandahl, Guro and Karen O’Brien, Vulnerability to Climate Change and Economic Changes in Indian Agriculture.
The statistical basis provided by t h i s methodology provides better results than the conventional practices that 59
“create” weight o n an ad hoc basis.
6o The area o f different vulnerable zones in the states selected for the study was estimated using the spatial analyst function o f A rc GIS and drawn on GIs-produced maps.
101
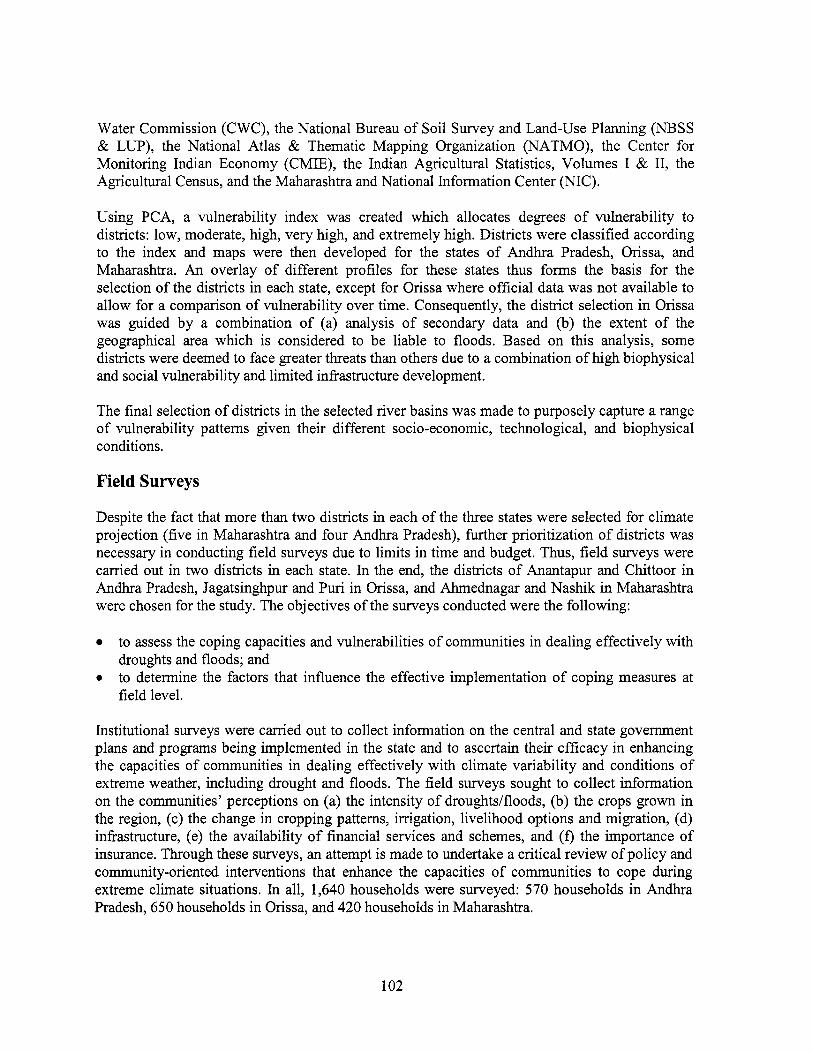
Water Commission (CWC), the National Bureau o f Soil Survey and Land-Use Planning (NBSS & LUP), the National Atlas & Thematic Mapping Organization (NATMO), the Center for Monitoring Indian Economy (CMIE), the Indian Agricultural Statistics, Volumes I & 11, the Agricultural Census, and the Maharashtra and National Information Center (NIC).
Using PCA, a vulnerability index was created which allocates degrees o f vulnerability to districts: low, moderate, high, very high, and extremely high. Districts were classified according to the index and maps were then developed for the states o f Andhra Pradesh, Orissa, and Maharashtra. An overlay o f different profiles for these states thus forms the basis for the selection o f the districts in each state, except for Orissa where official data was not available to allow for a comparison o f vulnerability over time. Consequently, the district selection in Orissa was guided by a combination o f (a) analysis o f secondary data and (b) the extent o f the geographical area which is considered to be liable to floods. Based on this analysis, some districts were deemed to face greater threats than others due to a combination o f high biophysical and social vulnerability and limited infrastructure development.
The final selection o f districts in the selected river basins was made to purposely capture a range o f vulnerability patterns given their different socio-economic, technological, and biophysical conditions.
Field Surveys
Despite the fact that more than two districts in each o f the three states were selected for climate projection (five in Maharashtra and four Andhra Pradesh), further prioritization o f districts was necessary in conducting field surveys due to limits in time and budget. Thus, f ield surveys were carried out in two districts in each state. In the end, the districts o f Anantapur and Chittoor in Andhra Pradesh, Jagatsinghpur and Puri in Orissa, and Ahmednagar and Nashik in Maharashtra were chosen for the study. The objectives o f the surveys conducted were the following:
0
to assess the coping capacities and vulnerabilities o f communities in dealing effectively with droughts and floods; and to determine the factors that influence the effective implementation o f coping measures at field level.
Institutional surveys were carried out to collect information on the central and state government plans and programs being implemented in the state and to ascertain their efficacy in enhancing the capacities o f communities in dealing effectively with climate variability and conditions o f extreme weather, including drought and floods. The field surveys sought to collect information on the communities’ perceptions on (a) the intensity o f droughts/floods, (b) the crops grown in the region, (c) the change in cropping patterns, irrigation, livelihood options and migration, (d) infrastructure, (e) the availability o f financial services and schemes, and (f) the importance o f insurance. Through these surveys, an attempt i s made to undertake a critical review o f pol icy and community-oriented interventions that enhance the capacities o f communities to cope during extreme climate situations. In all, 1,640 households were surveyed: 570 households in Andhra Pradesh, 650 households in Orissa, and 420 households in Maharashtra.
102
Development of Tools for Institutional and Field Surveys
Questionnaires designed for implementation in drought and flood circumstances as wel l as other Participatory Rural Appraisal (PRA) tools were used. Secondary data including sketch maps, transect walk, collation o f time-line information and trend-lines, seasonal cropping calendar mapping, institutional mapping, problem tree analysis, and problem and opportunity ranking was collected. In addition, group discussions, interviews, focus group discussions, and institutional surveys were carried out.
The questionnaires were pre-tested in pi lot surveys in Rajasthan (a drought-prone area). I t provided insights about the available quantitative information and its usefulness for the purpose o f the survey, and i t was improved and modified accordingly.
The lack o f proper recorded information at the village level posed a major constraint to quantitative/statistical analysis.
Selection o f Villages in Identified Districts Based on Analyses of Secondary Data
The selection o f villages in each district was based on the screening o f village-level secondary data collected from the census office. This data was collected for parameters including village land area, land use, cultivated and irrigated land, and availability o f infrastructure including education, bank/credit, society, communication, power facility, and services l ike health care. The data was used for the preliminary selection o f villages within each district. These were later confirmed by discussions with officials in government departments at the district level as wel l as other localized non-governmental organizations and communities at the village level.
Village Classification Based on Irrigation
All villages lying within a district were classified into one o f three levels based on their irrigated area as a percentage o f their total agricultural area: l ow (0-33%), moderate (33-66%), or high (66-100%).
Village Classification Based on Infrastructure Development
An infrastructure index was developed by considering the existence or level o f certain facilities and services at the village level including the availability o f drinking water, education facilities, medical facilities, electricity, banks, agricultural society, and communication linkages.
The villages were assigned to one o f four categories according to their irrigation- and infrastructure-based classification. The purpose o f this categorization was to select villages that were representative o f different contexts which may further the understanding o f the factors underlining the different levels o f vulnerabilities. These broad criteria on irrigation and infrastructure are used to classify the villages in a matrix as the one shown here below.
103
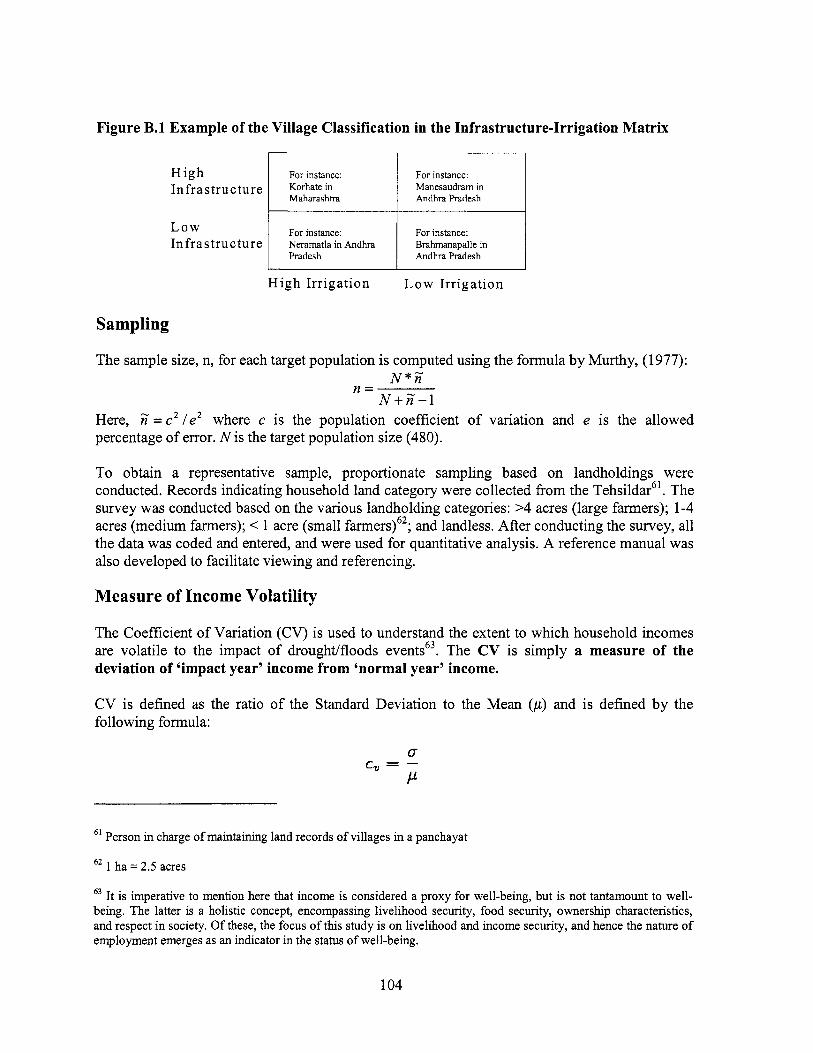
Figure B.l Example o f the Village Classification in the Infrastructure-Irrigation Matr ix
H i g h In fr a s t r u c tu r e
For instance: For instance:
Maharashtra Manesaudram in Andhra Pradesh
Korhate in
L o w Infrastructure
H i g h Irr igat ion L o w I r r igat ion
For instance: For instance: N e r a m a t l a i n h d h r a Brahmanapalle in Pradesh Andhra Pradesh
Sampling
The sample size, n, for each target population i s computed using the formula by Murthy, (1977): N*n"
N+Z-1 n =
Here, n" = c2 /e2 where c is the population coefficient o f variation and e i s the allowed percentage o f error. N i s the target population size (480).
To obtain a representative sample, proportionate sampling based on landholdings were conducted. Records indicating household land category were collected from the Tehsildar61. The survey was conducted based on the various landholding categories: >4 acres (large farmers); 1-4 acres (medium farmers); < 1 acre (small farmers)62; and landless. After conducting the survey, al l the data was coded and entered, and were used for quantitative analysis. A reference manual was also developed to facilitate viewing and referencing.
Measure of Income Volatility
The Coefficient o f Variation (CV) i s used to understand the extent to which household incomes are volatile to the impact o f drought/floods events63. The CV is simply a measure of the deviation of 'impact year' income from 'normal year' income.
C V i s defined as the ratio o f the Standard Deviation to the Mean (p) and is defined by the following formula:
Q- c, = -
P
Person in charge o f maintaining land records o f villages in a panchayat
62 1 ha = 2.5 acres
63 I t i s imperative to mention here that income is considered a proxy for well-being, but i s not tantamount to well- being. The latter i s a holistic concept, encompassing l ivel ihood security, food security, ownership characteristics, and respect in society. O f these, the focus o f t h i s study i s o n l ivelihood and income security, and hence the nature o f employment emerges as an indicator in the status o f well-being.
104
In this formula, 0 is standard deviation and p is average income64. I t i s often represented as a percentage by multiplying the above by 100.
An advantage o f the C V i s that i t i s free from the units o f the variables, and it thus permits comparisons with respect to their variability. The C V i s commonly used since it is a quantity without physical units. Although the C V indicates the magnitude o f variations, i t fails to capture the directional shifts in income. As a substantial majority o f the surveyed households experienced drops in income in an impact year, few 'outlier' households that showed an increase in income during an impact year were segregated out.
64 2 p = (Normal income + Impact income)/2, and 0 =[(Normal income - Mean income)/'2 + (Impact income - mean income)"2]/2.
105
Appendix C: International Conference on Adaptation to Climate Variability and Change-Towards a Strategic Approach
The International Conference on Adaptation to Climate Variability and Climate Change: Towards a Strategic Approach was held in New Delhi, India on December 7 - 8, 2006. It was organized by the World Bank, in collaboration with the Government o f India’s Ministry o f Environment and Forests (MoEF), andthe European Union (EU). The Department for International Development (DFID), the Swiss Agency for Development and Cooperation (SDC), and the German Technical Cooperation Agency (GTZ) co-sponsored and participated in the event. The logistics o f the event were organized by The Energy and Resources Institute (TEN).
The main objective o f the conference was to take stock o f the latest progress in adaptation knowledge and practices, including policy and financing aspects in India and globally. This was made possible through a consultative process involving al l stakeholders, from the donor community to the pol icy makers. The conference provided a forum for the exchange o f information on recent developments, programs, and challenges in India. The aim was to strengthen the commitment to future strategies and programs and to stimulate discussions on a possible action framework for integrating efforts towards strengthening adaptation in India. The outcomes include:
0 an increased awareness o f government officials in India o f the adaptation challenge and i t s implications for the development and implementation o f climate-related policies and programs; the enhanced ability o f participating state governments to develop climate-related adaptation policies and programs; the improvement o f the stakeholders’ knowledge base in climate-related areas; and an enhanced coordination o f adaptation-related work programs among development partners.
0
0
The event was well attended and received coverage in the international and localmedia. The conference’s agenda and the presentations made by participants at the conference can be found at: http://www.teriin.ordevents inside.php?id=l7797. Below i s a summary o f the key points raised at the conference on a session-by-session basis.
Session 1. Inaugural Session
The session highlighted that climate change evokes the need to consolidate and share information on contemporary initiatives aimed at reducing vulnerability and strengthening adaptation. The vulnerabilities o f developing countries to climate change underscore the urgency for taking proactive measures on the mitigation and the adaptation fronts.
Session 2. Adaptation and Sustainable Development
The challenges posed by climate variability and change require prompt action. U s e h l information can be drawn from local communities’ historical and current coping measures in dealing with climate variability and extreme events. The key challenge, however, i s to
106
incorporate principles o f equity and conflict resolution, beneficiary selection and benefit sharing, transparency in project implementation, information sharing, and adequate representation o f minority communities in the decision making processes.
K e y points:
Targeted research and development i s required to enhance adaptive capacities o f communities - some initiatives in th i s context include revitalizing cooperatives and credit institutions, enriching the technological base, and strengthening the insurance system through the promotion o f innovative measures such as index-based, weather-risk insurance. National development policies and government programs need to integrate adaptation initiatives - increase resilience o f livelihood and infrastructure, improve governance, empower communities, and mainstream climate risk management. Watershed development and management should be pushed, especially in rain fed areas - priority intervention areas include provision o f potable water for consumption and o f protective irrigation for crops, while integrating livestock management and considering equity concerns.
Session 3A. Climate Risk Assessment: Emerging Approaches and Tools Screening tools provide a broad overview to project managers and development planners about the key climatic risks that could affect the implementation o f development projects and related investments by the government, donor agencies, and other institutes.
K e y points:
0
0
Screening tools are required to mainstream climate risks into development planning and to provide guidance to project managers and development planners. A framework i s required in order to integrate disaster risk management efforts with climate risk and development concerns. By strengthening adaptive capacities at the macro level, i t i s possible to create win-win situations that result in improvement in overall well-being o f the community/ecosystem.
Session 3B. Sector Impacts: Policy and Economic Implications
The implications o f climate change on the agricultural sector demands urgent attention. Stakeholders, such as scientists and policymakers, wil l be required to work together to integrate research into pol icy successfully.
K e y points:
0
0
There is need for effective pol icy support to bolster the adaptive capacity o f farmers. Autonomous adaptation in the agricultural sector faces constraints such as the time lag in responses, the unpredictability o f extreme events, and the lack o f extension services and technical guidance.
107
0 The cost o f adaptation should include support for building infrastructure to promote research, development o f models for integrated assessments, and provision o f information on pol icy research. There i s a need for structural and non-structural investments in win-win strategies for better preparedness to climatic stress. This includes strengthening the methods for impact prediction o f climatic trends and strengthening public services such as health care, sanitation, disease surveillance, access to vector and disease control services, integration o f health concerns in policies, efficient urban planning, housing regulations, water treatment etc.
Session 4. Adaptation Strategies: Emerging Approaches
Planned and autonomous approaches to adaptation are not unrelated; while some risks, and necessary adaptation, can be identified and planned for, responses to other r isks depend on the inherent flexibility o f systems.
Key points:
0 Resilient systems are better equipped to meet basic environmental, economic, and social needs when faced by sudden climatic extremes.
Adaptation to droughts and floods at the local level depends on certain key factors such as: 0
o the extent to which people are able to diversify into livelihood based on less climate- sensitive sectors;
o the extent to which people have the ability to access information relaying early warnings and transport channels for goods and services;
o the presence o f assets and security such as insurance and the resilience o f key infrastructure;
o the condition o f key environmental resources, such as groundwater in a drought-prone area, and the presence o f institutional arrangements, self-help groups (SHGs), and credit groups;
o the presence o f institutional or se l f financial mechanisms (credit systems or remittances).
Synergies need to be developed between planned and autonomous adaptation by focusing on disaster management strategies, scientific information, and the use o f financing and insurance mechanisms. Targeted sector-wide interventions can be used to reduce the risks associated with climatic variability and extreme conditions. These include:
o water-based intervention - the adoption o f better irrigation practices, the recharging o f groundwater through strengthening water harvesting structures, the revival and restoration o f community-based water conservation measures, and the revitalization o f water user groups;
o land-use-based interventions - control o f soil erosion losses, crop advisory, development o f ago-forestry, and kitchen gardens which can promote nutritional security;
o energy-based interventions - provision o f improved cook-stoves, promotion o f bio- energy crops, and promotion o f briquette making; and
0
108
o livestock-based interventions - livestock management, pasture land development, and development o f fodder banks.
The perceived barriers to adaptation are the lack o f timely weather-forecasting information, o f credit and savings, and o f appropriate technology. Experiences from various fields need to be pooled - including institutional, financial, and technical systems and participatory planning and implementation - to contribute towards livelihood diversification, provision o f a low-cost and input-internalized production system, natural resource management, resolution o f property-rights issues related to land and water, and enhancement o f community-based local institutions’ roles.
0 Communities employ various measures to deal effectively with the consequences o f climate change. These include looking at temporary, i.e. reactive, and permanent, i.e. proactive, models o f response. There is a need to identify and incorporate these measures into the enhancement o f communities’ adaptive capacities. Linkages should be drawn between the local level o f delivery and implementation o f adaptation measures and the efforts to include adaptation in international agreements.
0
Session 5. Mainstreaming Adaptation: Policy Issues and Options
Key vulnerabilities to climate change need to be identified. There i s also a need to strike a balance between adaptation and mitigation.
Key points:
0 Partnerships with other countries (both developing and developed) are required to address the challenges o f sustainable development and climate change in accordance with the goals o f the UNFCCC. There is also need to look at partnerships or linkages between governmental and non-governmental sectors. At the community level, sustainable livelihoods need to be promoted in order to avoid future risks. In the case o f climate-sensitive occupations, income diversification i s the key to resilience. Agro-based industries are critical in providing the support structure. Social capital forms an extremely important factor to enhance community resilience. Also, a balance needs to be struck between finance mechanisms o f credit, savings, increased engagement o f SHGs, development o f insurance structures, asset-building at household and community level, incentive-driven watershed management, and disaster preparedness and mitigation.
0
Session 6. Strengthening Global Cooperation on Adaptation
K e y points: 0 To strengthen global cooperation on adaptation, there i s a need to promote knowledge
sharing and communication platforms among global actors, establish institutional frameworks for adaptation that are in l ine with development priorities, and assist in integrating adaptation in the planning process. Some examples where global collaboration could be forged include the initiation o f small pi lot projects planned to be integrated into ongoing larger scale development programs such as the watershed development programs and early warning systems. This would include r isk
109
assessments, risk management including the development o f a national adaptation strategy, integration into investment programming, and application o f adaptation tools and methods.
0 There needs to be adequate research on the economics o f adaptation, on methods to mainstream adaptation in development, and on the involvement o f other stakeholders.
0 Current sustainable development practices related to rural livelihoods, disaster risk management and urban development need to be strengthened.
Session 7A. EU-India Cooperation on Climate Change and Adaptation Policies: Research and Policy Activities on Adaptation
K e y points:
0 Several EU-India collaborative efforts are already in place and a number o f new funding instruments have also been introduced in addition to individual member state programs. An integrated framework for the assessment o f climatic hazards, vulnerability, and risks, along with spatial planning, mapping, and modeling would be required for development o f robust adaptation and mitigation strategies.
0 For development and implementation o f strong adaptation projects stakeholder engagement i s critical.
0 Uncertainty related to the resolution o f results can often lead to faulty predictions and recommendations; these should be adequately researched before packaging the climate agenda. Time and effort needs to be invested to promote researcher exchanges between India and the EU to build human resource capacity and develop technical expertise. I t i s essential to recognize the obstacles to adaptation including institutional barriers.
0
0
Session 7B. State-Level Dialogue on Adaptation Issues and Options: The Way Forward
The state-level discussions were aimed at attaining a regionallstate-level understanding o f the diverse aspects o f adaptation, including the key components o f a state-level adaptation plan and institutional structures and delivery mechanisms.
Key points:
0 Ecosystem management should be promoted as part o f a multi-pronged adaptation strategy. 0 Before incorporation o f climate change concerns into ongoing programs and plans, an
assessment o f ground situations and requirements should be made. 0 The various innovative adaptation strategies being employed by communities to cope with
current climatic stress need to be documented and f ir ther supported. 0 Prior planning i s essential for efficient adaptation and this can be reflected in terms o f
changes in infrastructure and resource use pattern. 0 Models o f development need to be revisited to reduce unsustainable patterns o f development. 0 Identification o f ‘vulnerability’ hotspots is needed for better preparedness.
110
0 More research i s required in the agricultural sector to promote growth o f tolerant crop varieties and address food security concerns.
0 Weather data management needs to be strengthened at al l levels, as wel l as the requirement for instituting better warning systems.
0 There i s a need to build inter- and intra-departmental cooperation to address the challenges o f climate change in an integrated manner.
111
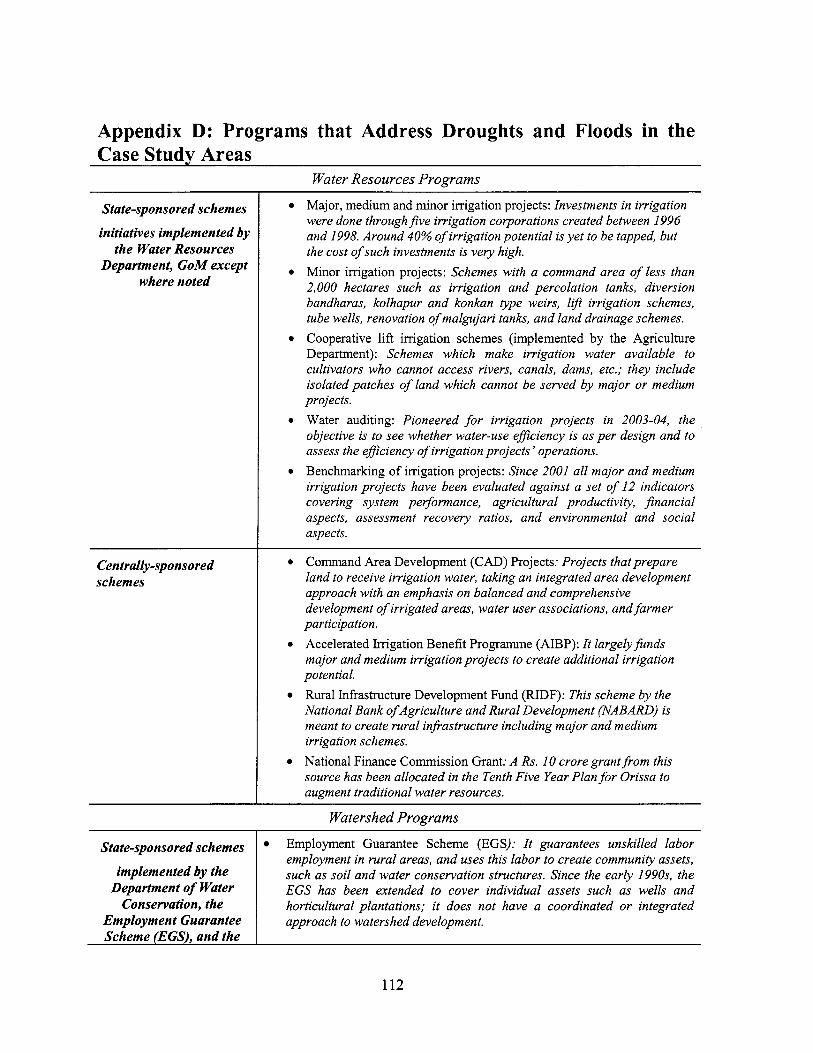
Appendix D: Programs that Address Droughts and Floods in the Case Study Areas
Water Resources Programs
State-sponsored schemes
initiatives implemented by the Water Resources
Department, GoM except where noted
Cen trally-sponsored schemes
Major, medium and minor irrigation projects: Investments in irrigation were done through five irrigation corporations created between 1996 and 1998. Around 40% of irrigation potential is yet to be tapped, but the cost of such investments is very high.
Minor irrigation projects: Schemes with a command area of less than 2,000 hectares such as irrigation and percolation tanks, diversion bandharas, kolhapur and konkan type weirs, lift irrigation schemes, tube wells, renovation of malgujari tanks, and land drainage schemes. Cooperative lift irrigation schemes (implemented by the A p c u l t u r e Department): Schemes which make irrigation water available to cultivators who cannot access rivers, canals, dams, etc.; they include isolated patches of land which cannot be served by major or medium projects. Water auditing: Pioneered for irrigation projects in 2003-04, the objective is to see whether water-use eflciency is as per design and to assess the eflciency of irrigation projects’ operations. Benchmarking o f irrigation projects: Since 2001 al l major and medium irrigation projects have been evaluated against a set of 12 indicators covering system performance, agricultural productivity, financial aspects, assessment recovery ratios, and environmental and social aspects.
Command Area Development (CAD) Projects: Projects that prepare land to receive irrigation water, taking an integrated area development approach with an emphasis on balanced and comprehensive development of irrigated areas, water user associations, and farmer participation.
Accelerated Irrigation Benefit Programme (AIBP): I t largely funds major and medium irrigation projects to create additional irrigation potential. Rural Infrastructure Development Fund (RIDF): This scheme by the National Bank OfAgriculture and Rural Development (NABARD) is meant to create rural infrastructure including major and medium irrigation schemes. National Finance Commission Grant: A Rs. 10 crore grant from this source has been allocated in the Tenth Five Year Plan for Orissa to augment traditional water resources.
Watershed Programs
State-sponsored schemes
implemented by the Department of Water
Conservation, the Employment Guarantee Scheme (EGS), and the
Employment Guarantee Scheme (EGS): I t guarantees unskilled labor employment in rural areas, and uses this labor to create community assets, such as soil and water conservation structures. Since the early 1990s, the EGS has been extended to cover individual assets such as wells and horticultural plantations; i t does not have a coordinated or integrated approach to watershed development.
112
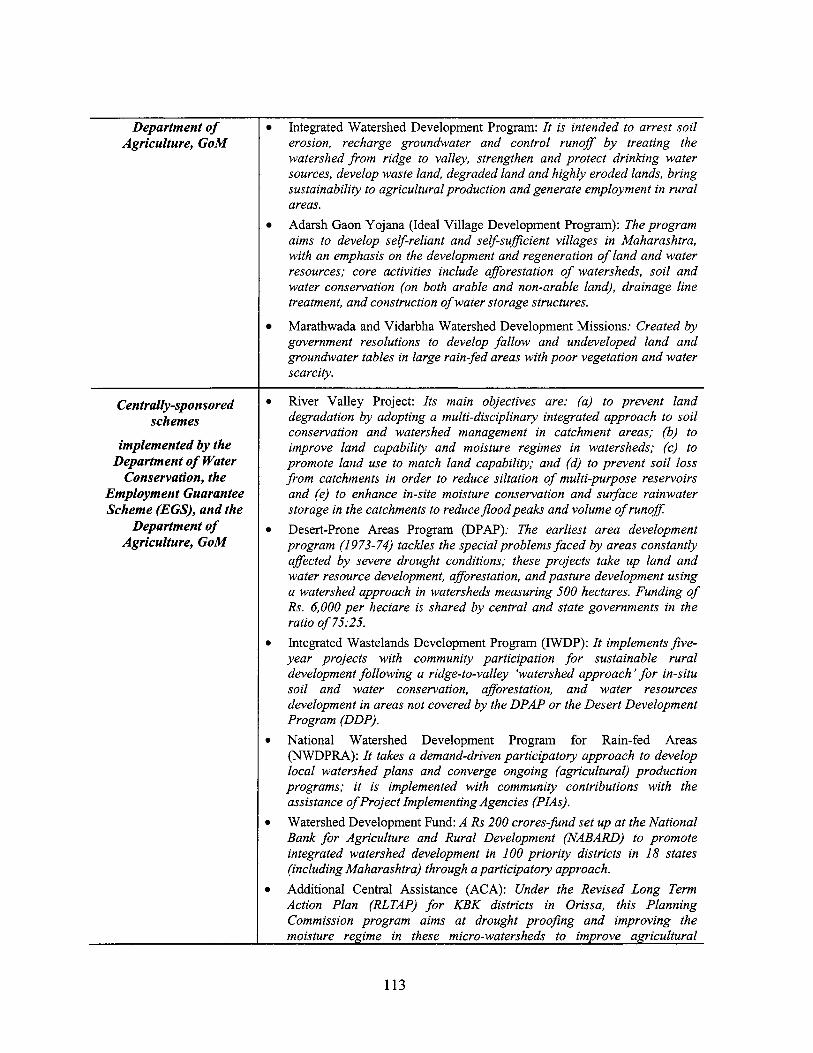
Department of Agriculture, GoM
Cen trally-sponsored schemes
implemented by the Department of Water
Conservation, the Employment Guarantee Scheme (EGS), and the
Department of Agriculture, GoM
Integrated Watershed Development Program: I t is intended to arrest soil erosion, recharge groundwater and control runoff by treating the watershed from ridge to valley, strengthen and protect drinking water sources, develop waste land, degraded land and highly eroded lands, bring sustainability to agricultural production and generate employment in rural areas. Adarsh Gaon Yojana (Ideal Village Development Program): The program aims to develop self-reliant and self-suficient villages in Maharashtra, with an emphasis on the development and regeneration of land and water resources; core activities include afforestation of watersheds, soil and water conservation (on both arable and non-arable land), drainage line treatment, and construction of water storage structures.
Marathwada and Vidarbha Watershed Development Missions: Created by government resolutions to develop fallow and undeveloped land and groundwater tables in large rain-fed areas with poor vegetation and water scarcity.
River Valley Project: Its main objectives are: (a) to prevent land degradation by adopting a multi-disciplinary integrated approach to soil conservation and watershed management in catchment areas: (b) to improve land capability and moisture regimes in watersheds; (c) to promote land use to match land capability; and (d) to prevent soil loss from catchments in order to reduce siltation of multi-purpose reservoirs and (e) to enhance in-site moisture conservation and s u ~ a c e rainwater storage in the catchments to reduce floodpeaks and volume of runoff Desert-Prone Areas Program (DPAP): The earliest area development program (1973-74) tackles the special problems faced by areas constantly affected by severe drought conditions: these projects take up land and water resource development, aforestation, and pasture development using a watershed approach in watersheds measuring 500 hectares. Funding of Rs. 6,000 per hectare is shared by central and state governments in the ratio of 75:25. Integrated Wastelands Development Program (IWDP): I t implements Jive- year projects with community participation for sustainable rural development following a ridge-to-valley ‘watershed approach’ for in-situ soil and water conservation, aforestation, and water resources development in areas not covered by the DPAP or the Desert Development Program (DDP). National Watershed Development Program for Rain-fed Areas (NWDPRA): It takes a demand-driven participatory approach to develop local watershed plans and converge ongoing (agricultural) production programs; i t is implemented with community contributions with the assistance of Project Implementing Agencies (PIAs). Watershed Development Fund: A Rs 200 crores-fund set up at the National Bank for Agriculture and Rural Development (NABARD) to promote integrated watershed development in 100 priority districts in 18 states (including Maharashtra) through a participatory approach. Additional Central Assistance (ACA): Under the Revised Long Term Action Plan (RLTAP) for KBK districts in Orissa, this Planning Commission program aims at drought prooJing and improving the moisture regime in these micro-watersheds to improve agricultural
113
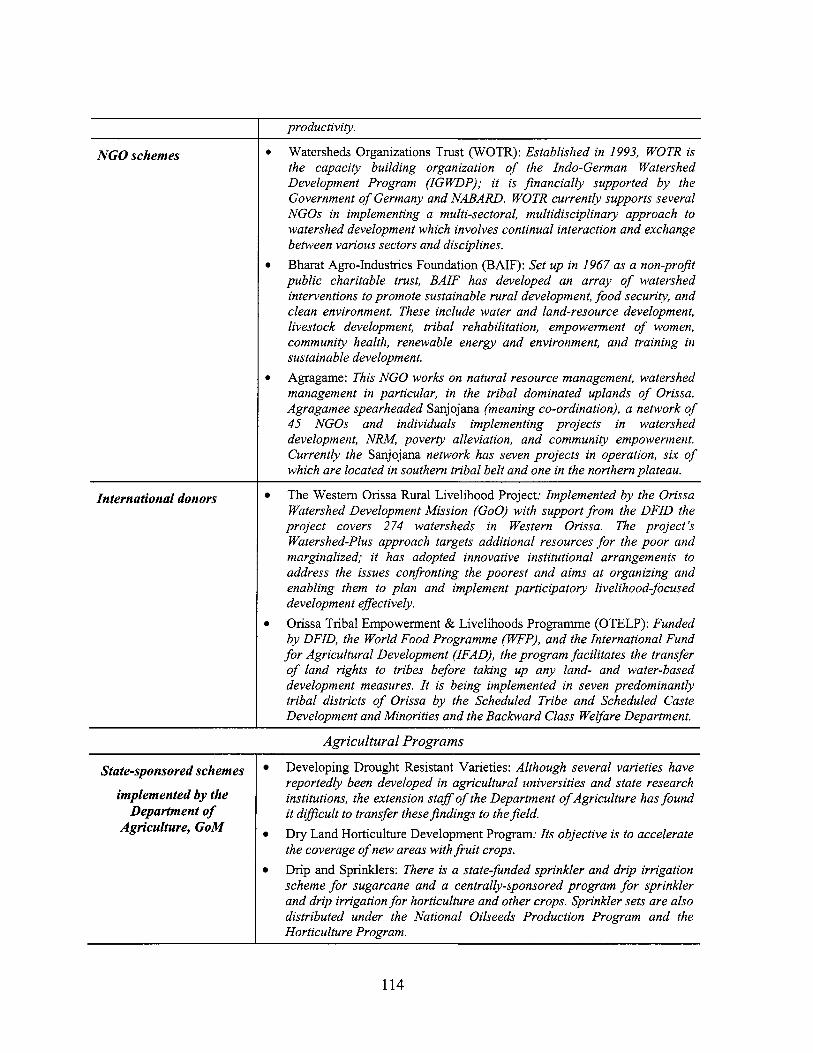
NGO schemes
International donors
productivity.
Watersheds Organizations Trust (WOTR): Established in 1993, WOTR is the capacity building organization of the Indo-German Watershed Development Program (IGFDP); it is financially supported by the Government of Germany and NABARD. WOTR currently supports several NGOs in implementing a multi-sectoral, multidisciplinary approach to watershed development which involves continual interaction and exchange between various sectors and disciplines. Bharat Agro-Industries Foundation (BAIF): Set up in 1967 as a non-profit public charitable trust, BAIF has developed an array of watershed interventions to promote sustainable rural development, food security, and clean environment. These include water and land-resource development, livestock development, tribal rehabilitation, empowerment of women, community health, renewable energy and environment, and training in sustainable development. Agragame: This NGO works on natural resource management, watershed management in particular, in the tribal dominated uplands of Orissa. Agragamee spearheaded Sanjojana (meaning co-ordination), a network of 45 NGOs and individuals implementing projects in watershed development, N M , poverty alleviation, and community empowerment. Currently the Sanjojana network has seven projects in operation, six of which are located in southern tribal belt and one in the northern plateau.
The Western Orissa Rural Livelihood Project: Implemented by the Orissa Watershed Development Mission (GOO) with support from the DFID the
project covers 274 watersheds in Western Orissa. The project’s Watershed-Plus approach targets additional resources for the poor and marginalized; i t has adopted innovative institutional arrangements to address the issues confronting the poorest and aims at organizing and enabling them to plan and implement participatory livelihood-focused development effectively. Orissa Tribal Empowerment & Livelihoods Programme (OTELP): Funded by DFID, the World Food Programme (WFP), and the International Fund for Agricultural Development (IFAD), the program facilitates the transfer of land rights to tribes before taking up any land- and water-based development measures. I t is being implemented in seven predominantly tribal districts of Orissa by the Scheduled Tribe and Scheduled Caste Development and Minorities and the Backward Class Welfare Department,
Agricultural Programs
State-sponsored schemes
implemented by the Department of
Agriculture, GoM
Developing Drought Resistant Varieties: Although several varieties have reportedly been developed in agricultural universities and state research institutions, the extension staff of the Department of Agriculture has found it diflcult to transfer thesefindings to thefield. Dry Land Horticulture Development Program: I t s objective is to accelerate the coverage of new areas with fruit crops. Drip and Sprinklers: There is a state-funded sprinkler and drip irrigation scheme for sugarcane and a centrally-sponsored program for sprinkler and drip irrigation for horticulture and other crops. Sprinkler sets are also distributed under the National Oilseeds Production Program and the Horticulture Program.
114
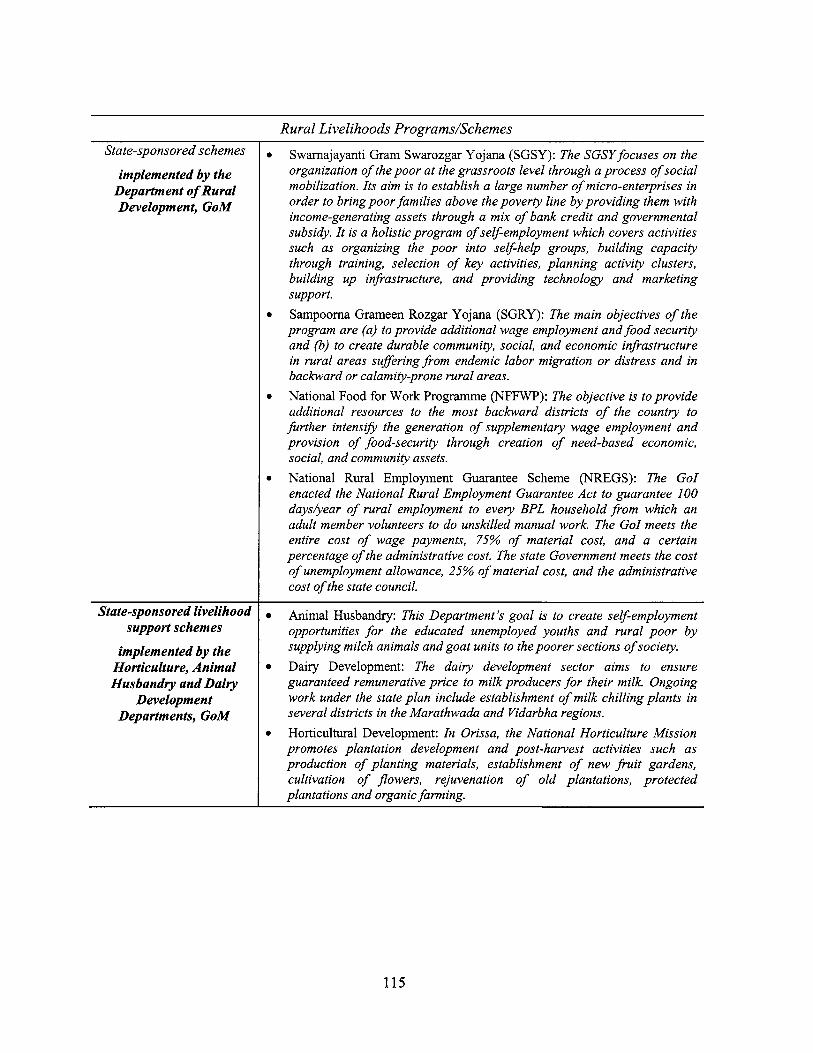
Rural Livelihoods Programs/Schemes
State-sponsored livelihood support schemes
State-sponsored schemes
implemented by the Department of Rural Development, GoM
Swamajayanti Gram Swarozgar Yojana (SGSY): The SGSY focuses on the organization of the poor at the grassroots level through a process of social mobilization. Its aim is to establish a large number of micro-enterprises in order to bring poor families above the poverty line by providing them with income-generating assets through a mix of bank credit and governmental subsidy. I t is a holistic program of self-employment which covers activities such as organizing the poor into self-help groups, building capacity through training, selection of key activities, planning activity clusters, building up infrastructure, and providing technology and marketing support. Sampooma Grameen Rozgar Yojana (SGRY): The main objectives of the program are (a) to provide additional wage employment and food security and (b) to create durable community, social, and economic infrastructure in rural areas suflering from endemic labor migration or distress and in backward or calamity-prone rural areas.
National Food for Work Programme (NFFWP): The objective is to provide additional resources to the most backward districts of the country to further intensifj, the generation of supplementary wage employment and provision of food-security through creation of need-based economic, social, and community assets. National Rural Employment Guarantee Scheme (NREGS): The GoI enacted the National Rural Employment Guarantee Act to guarantee 100 dayslyear of rural employment to every BPL household f rom which an adult member volunteers to do unskilled manual work. The GoI meets the entire cost of wage payments, 75% of material cost, and a certain percentage of the administrative cost. The state Government meets the cost of unemployment allowance, 25% of material cost, and the administrative cost of the state council.
implemented by the Horticulture, Animal Husbandry and Dairy
Development Departments, GoM
Animal Husbandry: This Department’s goal is to create self-employment opportunities for the educated unemployed youths and rural poor by supplying milch animals and goat units to the poorer sections of society. Dairy Development: The dairy development sector aims to ensure guaranteed remunerative price to milk producers for their milk. Ongoing work under the state plan include establishment of milk chilling plants in several districts in the Marathwada and Vidarbha regions.
Horticultural Development: I n Orissa, the National Horticulture Mission promotes plantation development and post-harvest activities such as production of planting materials, establishment of new fruit gardens, cultivation of powers, rejuvenation of old plantations, protected plantations and organic farming.
115
Appendix E: A Conceptual Framework for a Maharashtra Drought Adaptation Pilot in Rain-Fed Areas
This appendix presents a framework for a drought adaptation pilot, using the state o f Maharashtra as an example.
Background
In the drought-prone regions o f Maharashtra, current coping strategies appear to be increasingly inadequate in reducing people’s vulnerability to the effects and impacts o f climate variability and climate change. This suggests an urgent need for more effective integration o f focused interventions to enhance the resilience o f communities to current and potentially more disruptive fkture climate conditions. An ongoing World Bank-supported study entitled Addressing Vulnerability to Climate Variability and Climate Change through an Assessment of Adaptation Issues and Options (hereafter “the Study”) has analyzed issues and options for a more comprehensive integration o f climate-related matters into the Government o f Maharashtra’s operations. This Study also supports the development o f a pol icy framework that integrates climate risk management into the development process.
Preliminary findings o f emerging issues and options from this study were discussed in high-level meetings with Government o f Maharashtra (GoM) officials in M a y and August 2006. These meetings concluded with the recognition that the effects o f climate variability (to be further compounded by climate change) were costing the government significant time and resources, and that current crisis management was both expensive and sub-optimal. G o M officials supported the idea o f looking at opportunities to better address climate-related considerations in Maharashtra’s development programs. To this end, G o M officials requested that the Bank team develop a framework for a state-level pi lot project on drought adaptation, as part o f the ongoing Bank Study. It was agreed that the Department o f Water Conservation would be the designated nodal agency for this exercise, and i t would work in collaboration with other departments, including the rural development, agriculture, and horticulture departments.
A draft conceptual framework was prepared in response to this request and is used as a basis to facilitate fkrther discussions with G o M officials. The note was presented to a group o f senior G o M officials at a meeting chaired by the Secretary o f Water Conservation and EGS in October 2006. Following a detailed discussion, i t was decided that two designated officials, the Director o f Soil Conservation and the Director o f Social Forestry, would prepare responses to the draft document, which would then be integrated into a concept note. Responses were received by February 2007 and have been incorporated into this document.
Development Context and Rationale
About a quarter o f India’s drought-prone districts are in Maharashtra, with 73% o f i t s geographical area classified as hot and semi-arid regions. Maharashtra’s 13 drought-prone districts account for 60% o f i t s net sown area. Even districts in the moderately assured rainfall zone are increasingly affected by vagaries in monsoon rainfall. As a result, a large part o f the state’s predominantly rain-fed cultivable land suffers from crop failures and associated
116
hardships. The state faced consecutive years o f drought from 2001 to 2004, and the agrarian crisis has become so acute that farmers in the rain-fed regions o f the state have resorted to extreme measures, indicating a complete break-down o f coping mechanisms.
At a macro-economic level, state-wide growth in the agricultural sector has been slower than in either the industrial or service sectors, and agricultural productivity i s much lower than the national average. Notwithstanding unfavorable agro-climatic conditions, agriculture appears to be increasingly unproductive or only marginally productive due to a number o f reasons including (a) high and unsustainable input costs (with heavy mono-cropping in some areas), (b) inadequate extension and knowledge services (resulting in suboptimal cropping practices), (c) l i t t le value added to support agri-businesses, (d) inadequate availability o f groundwater and poor soil- moisture conservation, and (e) market policies that do not support the majority o f farmers with small and marginal holdings (less than 5 hectares o f land). Furthermore, irrigation, which covers only 16% o f the total agricultural area, i s mainly accessible to the large farmers due to the inequitable distribution o f water resources governed largely by power subsidies6’. Nonetheless, agriculture continues to be the main source o f livelihood for about 58% o f the state’s population. All this suggests that much greater attention to rain-fed ecosystems and agriculture i s needed in terms o f improved productivity, income, employment, and marketing. More importantly, providing support to nonfarm livelihood approaches and income-generating activities is also needed in rural Maharashtra.
The Government o f Maharashtra supports a number o f development programs aimed at helping poor rural communities during drought episodes. In response to the severe drought o f 1970-73 which affected 15 to 30 mi l l ion people, Maharashtra led the way by introducing (for the f i rst time in the country) the Employment Guarantee Scheme (EGS) to provide gainful employment through rel ief works. Over the past thirty-odd years, the EGS has provided a substantial amount o f demand-led manual employment through labor-intensive public works (roads, percolation tanks, contour and ‘nala’ bunding, horticulture-linked works), especially during off-season periods o f l o w employment opportunities. While the EGS is today considered a successful drought-relief program, it has not made a significant impact on reducing the drought-proneness o f the state. Nor has it reduced poverty through the creation o f productive assets and their maintenance or through building long-term capacity and awareness on drought resilience.
Apart from EGS, there are a number o f state and centrally-sponsored programs that seek to improve community resistance to drought, such as the Drought Area Development Program (DPAP), the Integrated Wasteland Development Programme (IWDP), the National Watershed Development Programme for Rainfed Areas (NWDPRA), the Jalswarajaya Water Supply and Sanitation Programme, the National Food for Work Program (NFFWP), the Swaranajaynati Gram Swarazgar Yojana (SGSY), the Sampoorna Gram Rozgar Yojana (SGRY) , the Jawahar Gram Samridhi Yojana (JGSY), and the recently introduced National Rural Employment Guarantee Scheme (NREGS). There i s also a r ich heritage o f donor and NGO supported watershed development and rural livelihood enhancement programs. Despite these programs, the rural poor appear to be increasingly vulnerable to drought conditions in the state as a whole. This
65 2% o f the farmers in the state have access to 70% o f the irrigation; 80% o f the state’s rural population does not benefit from any irrigation schemes.
117
i s evidenced by significant rural stress, groundwater mining, distress migration, and large and persistent inequalities in incomes and development outcomes.
Overall, lessons learned from ongoing development programs show that there has been a limited degree o f success with the different approaches being implemented by different agencies under various framework and guidelines (e.g. seven different watershed conservation and development programs are currently ongoing in the state). Achievement o f desired adaptation outcomes at the household and community levels has consequently been sub-optimal, even problematic. Therefore, coordinating between the multiplicity o f sectors and agencies involved i s a central challenge for developing a successful adaptation program in Maharashtra. This requires planning o f development programs on the basis o f local priorities and the lessons learned from implementing a variety o f rural development projects. There i s a need for a more strategic and effective integrated programming approach, with proper institutional arrangements, to help communities (a) save and recharge water, (b) adjust farming practices and cropping patterns in view o f water scarcity and market conditions, and (c) provide options other than agriculture for sustaining broader livelihoods.
Links to Ongoing Activities and Added Value
The focus on long-term adaptation strategies in the context o f global climate change and integration o f climate-risk management into developmental planning i s a key area o f cooperation between the World Bank and the Government o f India. The Adaptation Pilot Program outlined in this concept note is in line with the programs o f the Government o f India and Maharashtra which give high priority to measures which would reduce the vulnerability o f rural communities in rain- fed areas to climate-related risks, especially with a view o f reducing and then eliminating rural poverty and regional disparities. The G o M has been allocating significant resources to programs which provide drought re l ie f in affected areas. The pi lot wi l l build upon, and facilitate synergy with, a number o f ongoing and relevant programs chiefly run by the departments o f water conservation, rural development, agriculture, water resources, and forests among others. In choosing areas for a pi lot activity, coordination and complementarities would be established with the ongoing activities in groundwater management and projects in the water supply, irrigation, agriculture, and forestry sectors (figure E.l). The focus o f the pi lot will be on long-term adaptation approaches and outcomes that go much beyond the usual programs for rural development, agriculture, forests, and water resources.
0 b j ec tives
The proposed Drought Adaptation Pilot wil l take an integrated approach to designing and implementing adaptation strategies to droughts in rain-fed areas. The proposed primary objectives o f the Drought Adaptation Pilot concept are the following:
0 identify, analyze, and then recommend measures for state-level policy framework that i s supportive o f drought adaptation in rain-fed regions;
improve institutional and service delivery coordination between government and programs to focus their actions and outcomes on increasing resilience to droughts;
0
118
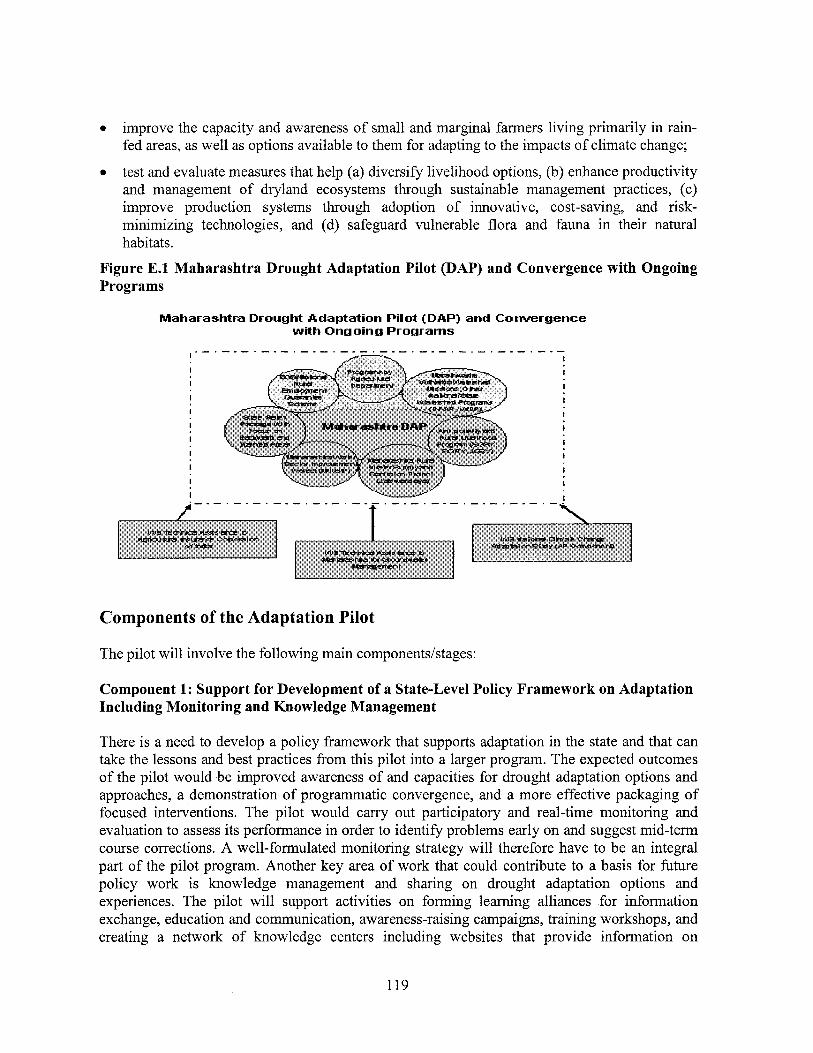
improve the capacity and awareness o f small and marginal farmers living primarily in rain- fed areas, as wel l as options available to them for adapting to the impacts o f climate change;
test and evaluate measures that help (a) diversify livelihood options, (b) enhance productivity and management o f dryland ecosystems through sustainable management practices, (c) improve production systems through adoption o f innovative, cost-saving, and r isk- minimizing technologies, and (d) safeguard vulnerable flora and fauna in their natural habitats.
Figure E.l Maharashtra Drought Adaptation Pilot (DAP) and Convergence with Ongoing Programs
Maharashtca Drought Adaptation Pilot (RAP) and Convergence with Ongoing Programs
Components o f the Adaptation Pilot
The pilot will involve the following main components/stages:
Component 1: Support for Development o f a State-Level Policy Framework on Adaptation Including Monitoring and Knowledge Management
There i s a need to develop a pol icy framework that supports adaptation in the state and that can take the lessons and best practices from this pi lot into a larger program. The expected outcomes o f the pi lot would be improved awareness o f and capacities for drought adaptation options and approaches, a demonstration o f programmatic convergence, and a more effective packaging o f focused interventions. The pi lot would carry out participatory and real-time monitoring and evaluation to assess its performance in order to identify problems early on and suggest mid-term course corrections. A well-formulated monitoring strategy will therefore have to be an integral part o f the pi lot program. Another key area o f work that could contribute to a basis for fbture pol icy work is knowledge management and sharing on drought adaptation options and experiences. The pi lot wil l support activities on forming learning alliances for information exchange, education and communication, awareness-raising campaigns, training workshops, and creating a network o f knowledge centers including websites that provide information on
119
adaptation. Effective monitoring and evaluation and knowledge management systems wil l support drought adaptation activities beyond the period o f the regional pi lot programs.
Component 2: Strengthened Convergence with Ongoing Programs
The pi lot will strengthen convergence with ongoing programs to focus the impact o f these programs on drought adaptation. For instance, the convergence with EGSNational Rural Employment Guarantee Scheme (NREGS) would be established to support a range o f allied activities, including public works, land development, soil and water conservation, crop planning, horticulture, and agro-forestry through people’s participation. Further, convergence through EGS could include renovation and restoration o f communally-owned malgujari tanks, which if repaired could give significant support to farmers. Apart from the EGS/NREGS Program, the pi lot can learn lessons and build upon a plethora o f relevant activities in Maharashtra. These include (a) the existing watershed development programs - the Maratwada and Vidharbha Watershed Missions and the Bank-supported Jalswaraj ya community-based water supply initiative, (b) the aquifer mapping and management pilots and Maharashtra Water Sector Improvement Project, (c) the Department o f Agriculture’s programs for drought-prone area, and (d) the work being done by the Forest Department, which owns a major portion o f the degraded areas o f drought-prone districts in Maharashtra.
Component 3: Institutional Support and Capacity Building
The pilot’s design and implementation would require specialized professional inputs and the participation o f NGOs, l ine departments, local governments, and community-based organizations (e.g. rural cooperatives and self-help groups which could be formed by government department programs for agriculture, rural development, and forestry). In addition, the pilot can aim to develop farmer groups and user groups to take collective action. Further, these institutional groups could be linked with tied grants and micro-finance programs. The capacities and awareness levels o f al l o f these institutional players will be developed through a well- coordinated capacity-building program at the grassroots level. Players in such a sensitization and capacity-building exercise could also include the Social Forestry Directorate, which has on-going outreach work in drought-prone areas.
Component 4: Community-Level Planning and Implementation o f Drought Adaptation Plans
The findings o f the Bank-supported study on climate change and adaptation indicate a strong need for adaptation solutions in Maharashtra. These solutions should be based on multi-sector interventions and take into account the full range o f local conditions. Therefore, i t i s proposed that the planning o f adaptation interventions and packages be done by the communities themselves. This wil l require the development o f micro-plans on drought adaptation, possibly linked with tied grants, taking into account ongoing programs and missing l i n k s and gaps in the village-level activities. Detailed studies on integrated planning methodologies for micro-planning in drought-prone areas would help identify ways to institutionalize such micro-planning activities in future government activities in the field. An ini t ial assessment o f the rain-fed regions in Maharashtra points to the following categories o f interventions, which have the potential to make a difference in building resilience in communities.
120
Management of Common Natural Resources (Water and Land)
In a majority o f the drought affected areas in Maharashtra, the degradation o f the soil in rain-fed cultivate areas due to denudation o f tree and grass cover and the ineffectiveness o f programs to check soil erosion have been major problems. There is a need, therefore, for more efficient use o f local rainfall to improve soil moisture and recharge groundwater. Further expansion o f surface and groundwater irrigation through major or medium irrigation projects and tubewell projects i s not feasible and many o f the irrigation facilities in rain-fed areas require repair and maintenance. Given these circumstances, the central focus o f the pi lot wi l l be on activities at the micro- watershed level, building on the Marathwada and Vidharbha Watershed Missions as a strategic entry point. Specific activities would take into account both surface and groundwater catchmend6 in the early stages o f planning. The focus will be on (a) reducing demand, (b) developing collective protocols and mechanisms for the proper maintenance o f watershed works, and (c) regulating entitlements for equitable access and use o f water and biomass. This wil l be done through technical and participatory management techniques and systems involving Village Self Help Groups (VSHGs), grassroots NGOs, and Panchayati Raj Institutions (PRIs) which endorse the Hariyali Guidelines towards empowerment o f the PRIs. These watershed investment activities wil l also build upon available best-practice models and the promising work o f several NGOs in the state, which chiefly include the work o f the Watershed Organization Trust (WOTR) under the Indo-German Watershed Development Program, BAIF, AFARh4, and MSSM. I t wil l also examine feasible mechanisms for introducing community-led management o f water demand to ensure that additional water, captured through soil and water conservation, i s not used up completely for expansion o f imgated areas or to support water-intensive agriculture.
Also, biodiversity conservation in these drought-prone areas needs to be addressed in a more holistic manner. Given the tough competition for l imited resources, appropriate water and food management i s necessary to reduce the conflicts between human beings and wildlife, such as attacks on human beings and cattle over utilization o f habitat and crop raiding o f agricultural and horticultural fields.
Diversification of Production Systems and Technology Innovation
In certain parts o f the rain-fed regions in Maharashtra, there i s a significant practice o f mono- cropping and utilization o f farming practices (e.g., purchase o f commercial seeds) that are conducive only to imgated conditions and therefore detrimental in terms o f overall productivity. In addition, the use o f pesticides is excessive in some rain-fed areas. These practices result in sub-optimal production levels and low price realization. The pi lot would liaise with ongoing programs to strengthen the advisory and extension support services to farmers in order to suggest ways to improve existing support services for dryland agriculture. The focus o f the extension services could range from recommendations on the timing and quantum o f application o f water and fertilizers, to recommendations on the diversification o f cropping systems to include short- duration, drought-resistant seed varieties and practices that significantly increase the yield
66 There are significant variations in the state’s hydrogeology that wil l have to be considered in order to determine the feasibility of, and potential for, groundwater recharge activities.
121
potential o f coarse cereals, pulses, oilseeds, and fibers that are the backbone o f a rain-fed agriculture.
As part o f this process, the pi lot will organize learning platforms that bring scientists and farmers together in order to extend lessons learned from dryland agriculture research to the farmers’ fields and agricultural projects. The focus o f the entire exercise wil l be on optimizing the available gene pool, minimizing the input costs o f agriculture, and increasing the revenue per unit o f land and per unit o f water in rain-fed areas and irrigated tracts, hence increasing profits from sustainable agriculture overall. In addition to the focus on agricultural development, the pi lot would look at issues such as apiculture, vermi-composting, and the prevention o f forest fires. The pi lot would also develop systems to familiarize rural communities with ‘watershed plus’ activities that attend to end-uses o f harvested rainwater and promote livelihoods, including the development o f fodder banks in order to meet the increased demand for stall feeding and the promotion o f leasing arrangements o f common lands to the landless for the cultivation o f fodder crops and the promotion o f fisheries.
Nonfarm Livelihood DiversiJication
In some drought-prone areas where agriculture i s becoming increasingly unviable, it would be necessary to promote nonfarm livelihoods. This strategy o f income diversification through alternate livelihoods can play an important role in building farmers’ long-term coping abilities during drought conditions. For instance, women SHGs and other collective action groups can be mobilized to plan and implement a variety o f income-generating activities with the assistance o f grassroots NGOs, market-based institutions, and micro-finance institutions. A wide variety o f approaches have been tried throughout different parts o f the country, from which lessons wil l be distilled for locally-appropriate piloting. The emphasis, however, would be on developing institutional and community-based mechanisms to generate and share economically-viable options for livelihood diversification, so as to improve resilience to drought and to reduce stress migration and its attendant strain on urban areas.
Economic Support Tools and Marketing
Poor credit availability and poor marketing systems are crucial impediments in drought-affected areas, as a result o f which the poor farmers suffer on various accounts. The farmers in these regions, among the poorest in the state, usually take out large loans from the informal system, the bulk o f which comprise unlicensed money lenders. In practical terms, credit i s required for the input cost o f seeds, fertilizers, and pesticides. To strengthen the lines o f credit from cooperative banks to farmers, the pi lot wil l look at ways to troubleshoot the existing initiatives o f public and private micro-finance institutions to ensure effective access to credit. For example, the National Bank o f Agriculture and Rural Development (NABARD) has the capacity to create systems for providing credit l ines and training in credit assessment, disbursal, and recovery to smaller nodal agencies which, in turn, can distribute these lines o f credit to individual entities. There are, however, several bottlenecks that impede effective access, as demonstrated in the l ow adoption o f farmers’ insurance, and more recently, in the disbursal problems o f the drought-relief credit package announced for farmers in Vidharbha. The pi lot will also endeavor to develop and test innovative economic instruments for weather-related insurance and other social safety-net funds
122
established as contributory funds at the community level to tide the farmers over during periods o f immediate distress.
Institutional AspectdPartners
The pi lot program will help to further clarify the roles and responsibilities o f different institutions/stakeholders, including state and local governments, NGOs, communities, sector support service agenciedline departments, local banks, and other financial institutions, in implementing such programs on a larger scale. Adaptation success stories often correlate with the presence o f good NGOs, suggesting that grassroots c iv i l society organizations can be made an important part o f an adaptation strategy. To the extent possible, the pi lot wil l try to make use o f existing rural development, agricultural programs, and micro-financing schemes running successfully in the state. Institutional mechanisms for channeling tied grants to community-based groups and PRIs will need to be explored.
Geographical Coverage
A pilot assessment will be performed in two or three districts, representing four to five different agro-climatic zones and geographical and socio-economic conditions, with coordinated inputs from different departments and agencies (e.g., Agriculture, Horticulture, Soil Conservation, Forest, Minor Irrigation, IMD, GSDA), research institutions, and NGOs (e.g. BAIF, AFARM, MSSM, WOTR). The final selection o f districts will be made upon assessing a range o f factors, including:
. the interest o f the districthlock level authorities; . the availability/skill potential o f NGOs and other institutions to participate in the implementation; . the availability o f a range o f geo-hydrological and agro-climatic conditions in the area, so as to be able to test and evaluate a m i x o f interventions; the existence o f relatively successful key programs such as EGS/NREGS and watershed activities in the area; and . the potential to maximize learning value and usehlness o f the pi lot exercise, including the formulation o f a larger program.
Implementation Arrangements
A source o f financing wil l have to be identified to support this pilot. Some financial and/or in- kind contribution wil l be expected from the state government. The overall exercise wil l take place in collaboration with and under the guidance o f the Department o f Water Conservation and EGS. A nodal agencykontact point at the state government level wil l be identified and wil l coordinate/facilitate/oversee the work in the state. Implementation arrangements at the district and block levels will be discussed and identified in consultation with the state nodal agency. Pilot programs wil l involve a range o f stakeholders including state and local governments, NGOs, SHGs, W A S , consulting f i rms (for training), local banks, etc. A steering committee chaired by the Secretary o f the Department o f Water Conservation and EGS could be
123
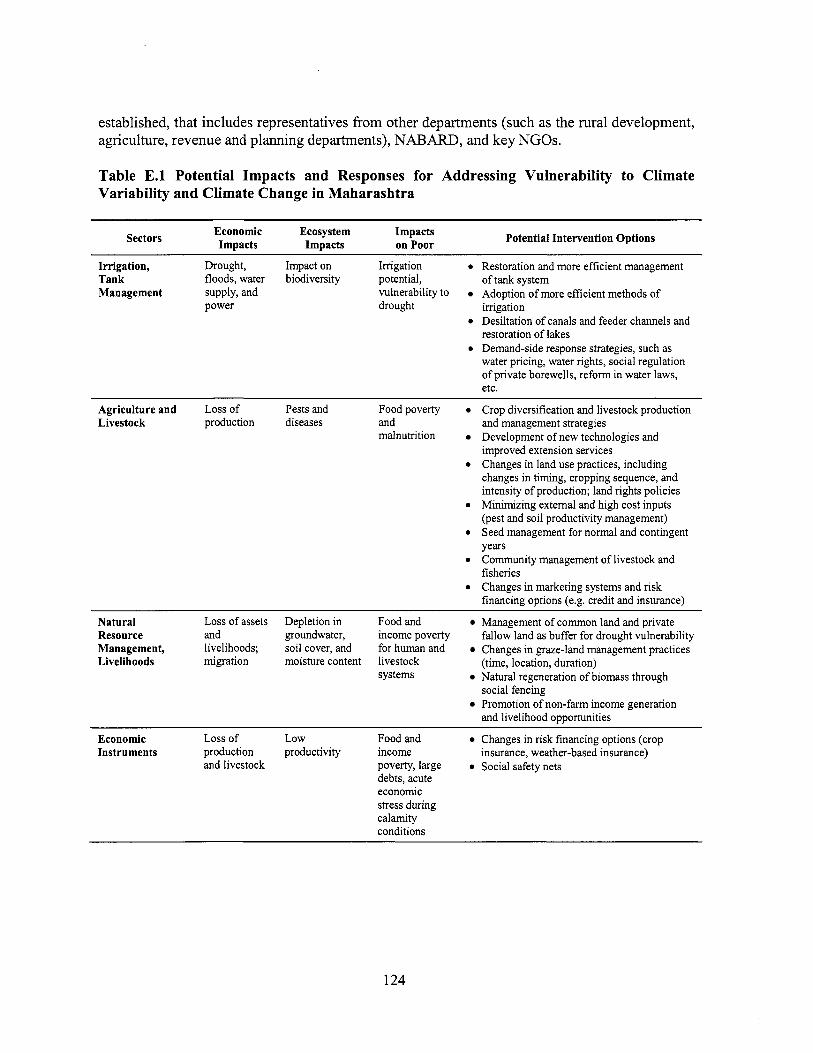
established, that includes representatives from other departments (such as the rura l development, agriculture, revenue and planning departments), NABARD, and k e y NGOs.
Table E.l Potential Impacts and Responses for Addressing Vulnerability to Climate Variability and Climate Change in Maharashtra
Economic Ecosystem Impacts Impacts Impacts on Poor Sectors
Irrigation, Drought, Impact on Irrigation 0
Tank floods, water biodiversity potential, Management supply, and
power vulnerability to drought
0
Potential Intervention Options
Restoration and more efficient management o f tank system Adoption of more efficient methods of irrigation Desiltation of canals and feeder channels and restoration of lakes Demand-side response strategies, such as water pricing, water rights, social regulation of private borewells, reform in water laws, etc.
Agriculture and Loss o f Pests and Foodpoverty Livestock production diseases and
malnutrition
Crop diversification and livestock production and management strategies Development o f new technologies and improved extension services Changes in land use practices, including changes in timing, cropping sequence, and intensity o f production; land rights policies Minimizing external and high cost inputs (pest and soil productivity management) Seed management for normal and contingent years Community management of livestock and fisheries Changes in marketing systems and risk financing options (e.g. credit and insurance)
Natural Loss of assets Depletion in Food and Management of common land and private Resource and groundwater, income poverty fallow land as buffer for drought vulnerability Management, livelihoods; soil cover, and for human and Changes in graze-land management practices Livelihoods migration moisture content livestock (time, location, duration)
systems Natural regeneration of biomass through
Promotion of n o n - f m income generation social fencing
and livelihood opportunities
Economic Loss of Low Food and Changes in risk financing options (crop Instruments production productivity income insurance, weather-based insurance)
and livestock poverty, large Social safety nets debts, acute economic stress during calamity conditions
124
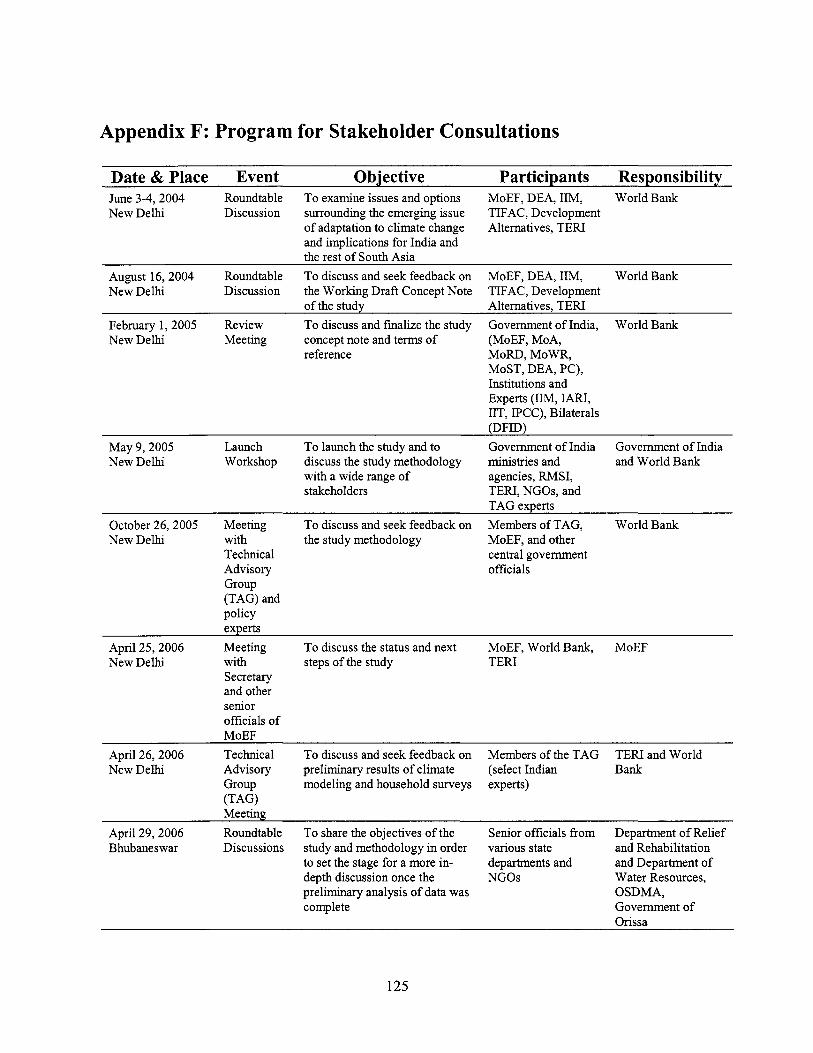
Appendix F: Program for Stakeholder Consultations
Date & Place Event Objective Participants Responsibility June 3-4,2004 Roundtable To examine issues and options MoEF, DEA, IIM, World Bank New Delhi Discussion surrounding the emerging issue TIFAC, Development
of adaptation to climate change and implications for India and the rest of South Asia
Alternatives, TERI
August 16,2004 Roundtable To discuss and seek feedback on MoEF, DEA, IIM, World Bank New Delhi Discussion the Working Draft Concept Note TIFAC, Development
February 1,2005 Review To discuss and finalize the study Government of India, World Bank New Delhi Meeting concept note and terms of (MoEF, MOA,
of the study Alternatives, TERI
reference MoRD, MoWR, MOST, DEA, PC), Institutions and Experts (IIM, MU, IIT, IPCC), Bilaterals (DFID)
May 9,2005 Launch To launch the study and to Government of India Government of India New Delhi Workshop discuss the study methodology ministr ies and and World Bank
with a wide range of stakeholders TERI, NGOs, and
agencies, RMSI,
TAG extlerts October 26,2005 Meeting To discuss and seek feedback on Members o f TAG, World Bank New Delhi with the study methodology MoEF, and other
Techmcal central government Advisory officials Group (TAG) and policy extlerts
April 25,2006 Meeting To discuss the status and next MoEF, World Bank, MoEF New Delhi with steps of the study TERI
Secretary and other senior officials o f MoEF
April 26,2006 Technical To discuss and seek feedback on New Delhi Advisory preliminary results of climate
Group modeling and household surveys (TAG) Meeting
April 29,2006 Roundtable To share the objectives of the Bhubaneswar Discussions study and methodology in order
to set the stage for a more in- depth discussion once the preliminary analysis of data was complete
Members of the TAG (select Indian Bank experts)
TERI and World
Senior officials from various state and Rehabilitation departments and and Department of NGOs Water Resources,
Department of Relief
OSDMA, Government of Orissa
125
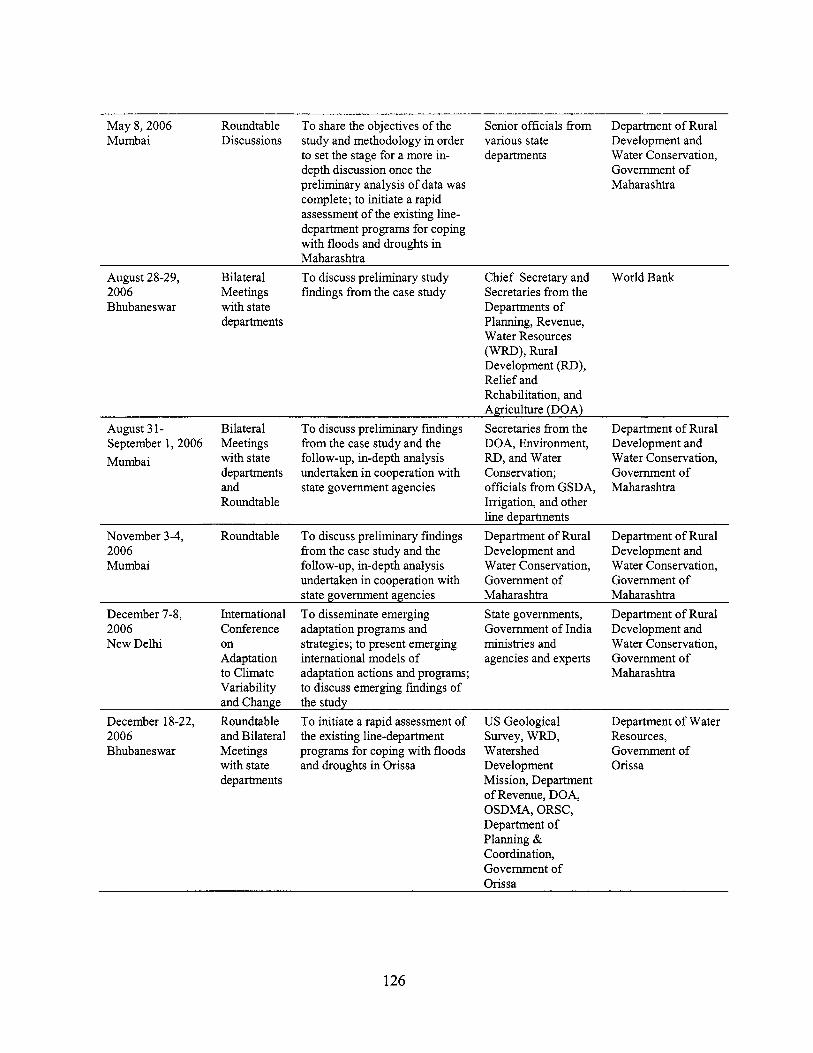
M a y 8,2006 Roundtable To share the objectives o f the Senior officials f r o m Department o f Rural Mumbai Discussions study and methodology in order various state Development and
Water Conservation, Government o f Maharashtra
to set the stage for a more in- depth discussion once the preliminary analysis o f data was complete; to initiate a rapid assessment o f the existing line- department programs for coping with floods and droughts in Maharashtra
departments
August 28-29, Bilateral To discuss preliminary study Chief Secretary and Wor ld Bank 2006 Meetings findings f rom the case study Secretaries f rom the Bhubaneswar with state Departments o f
departments Planning, Revenue, Water Resources (WRD), Rural Development (RD), Rel ie f and Rehabilitation, and Agriculture (DOA)
August 3 1- Bilateral To discuss preliminary findings Secretaries f r o m the Department o f Rural September 1,2006 Meetings f rom the case study and the DOA, Environment, Development and Mumbai with state follow-up, in-depth analysis RD, and Water Water Conservation,
departments undertaken in cooperation with Conservation; Government o f and state government agencies officials f rom GSDA, Maharashtra Roundtable Irrigation, and other
l ine departments November 3-4, Roundtable To discuss preliminary findings Department o f Rura l Department o f Rural 2006 f r o m the case study and the Development and Development and Mumbai follow-up, in-depth analysis Water Conservation, Water Conservation,
undertaken in cooperation with Government o f Government o f state government agencies Maharashtra Maharashtra
December 7-8, International To disseminate emerging State governments, Department o f Rural 2006 Conference adaptation programs and Government o f Ind ia Development and N e w Delh i on strategies; to present emerging ministries and Water Conservation,
Adaptation international models o f agencies and experts Government o f to Climate adaptation actions and programs; Maharashtra Variabil ity and Change the studv
to discuss emerging findings o f
December 18-22, Roundtable To initiate a rapid assessment o f U S Geological Department o f Water 2006 and Bilateral the existing line-department Survey, WRD, Resources, Bhubaneswar Meetings programs for coping with floods Watershed Government o f
with state and droughts in Orissa Development Orissa departments Mission, Department
o f Revenue, DOA, OSDMA, ORSC, Department o f Planning & Coordination, Government o f Orissa
126
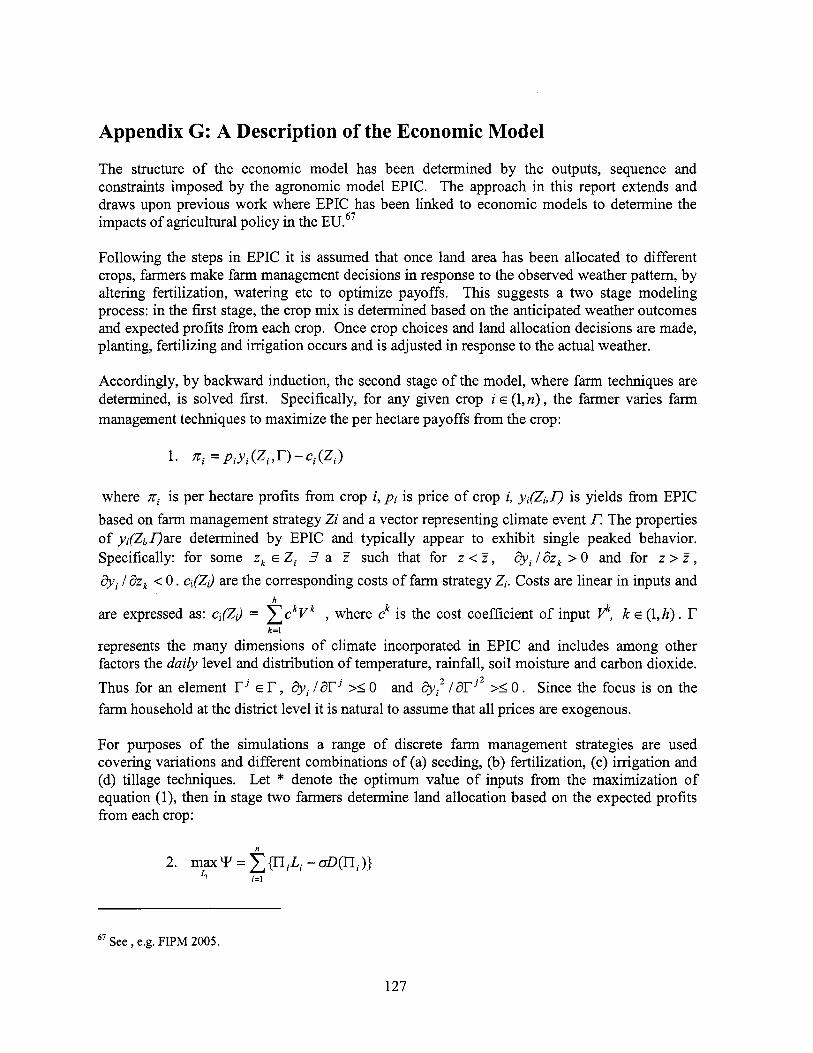
Appendix G: A Description o f the Economic Model
The structure o f the economic model has been determined by the outputs, sequence and constraints imposed by the agronomic model EPIC. The approach in this report extends and draws upon previous work where EPIC has been linked to economic models to determine the impacts o f agricultural pol icy in the EU.67
Following the steps in EPIC it i s assumed that once land area has been allocated to different crops, farmers make farm management decisions in response to the observed weather pattern, by altering fertilization, watering etc to optimize payoffs. This suggests a two stage modeling process: in the first stage, the crop m i x is determined based on the anticipated weather outcomes and expected profits from each crop. Once crop choices and land allocation decisions are made, planting, fertilizing and irrigation occurs and i s adjusted in response to the actual weather.
Accordingly, by backward induction, the second stage o f the model, where farm techniques are determined, is solved first. Specifically, for any given crop i E (1,n), the farmer varies farm management techniques to maximize the per hectare payoffs from the crop:
where xi is per hectare profits from crop i, pi i s price of crop i, yi(Z,O is yields from EPIC based on farm management strategy Zi and a vector representing climate event T. The properties of yi(Zi,Oare determined by EPIC and typically appear to exhibit single peaked behavior. Specifically: for some zk E Zi 3 a Z such that for z < Z, 2$i /dzk > 0 and for z > Z , 2$i / dz, < 0. c@J are the corresponding costs o f farm strategy Zi. Costs are linear in inputs and
are expressed as: ci(ZJ = C c k V k , where ck i s the cost coefficient o f input p, k E (1,h). r represents the many dimensions o f climate incorporated in EPIC and includes among other factors the daily level and distribution o f temperature, rainfall, soil moisture and carbon dioxide.
Thus for an element r j E r , tJyi /dT’ >I 0 and i3yi2 / X j 2 >I 0 . Since the focus is on the farm household at the district level it i s natural to assume that al l prices are exogenous.
h
k=l
For purposes o f the simulations a range o f discrete farm management strategies are used covering variations and different combinations o f (a) seeding, (b) fertilization, (c) irrigation and (d) tillage techniques. Let * denote the optimum value o f inputs from the maximization o f equation (l), then in stage two farmers determine land allocation based on the expected profits from each crop:
67 See, e.g. FIPM 2005.
127
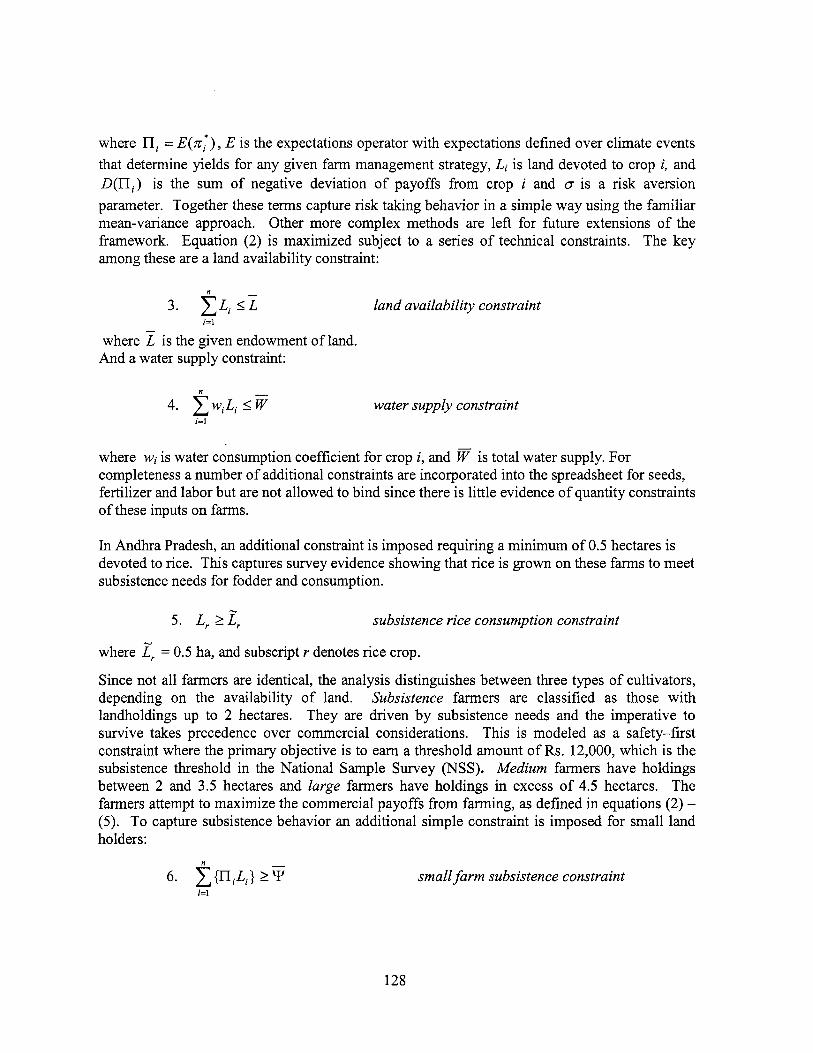
where ni = E(zl:) , E i s the expectations operator with expectations defined over climate events that determine yields for any given farm management strategy, Li i s land devoted to crop i, and D(ni) i s the sum o f negative deviation o f payoffs from crop i and 0 is a risk aversion parameter. Together these terms capture r i s k taking behavior in a simple way using the familiar mean-variance approach. Other more complex methods are le f t for future extensions o f the framework. Equation (2) i s maximized subject to a series o f technical constraints. The key among these are a land availability constraint:
n
3. CLi I L land availability constraint i=l
where z i s the given endowment o f land. And a water supply constraint:
n
4. C W i L i I F water supply constraint i=l
where wi i s water consumption coefficient for crop i , and w is total water supply. For completeness a number o f additional constraints are incorporated into the spreadsheet for seeds, fertilizer and labor but are not allowed to bind since there i s little evidence o f quantity constraints o f these inputs on farms.
In Andhra Pradesh, an additional constraint is imposed requiring a minimum o f 0.5 hectares i s devoted to rice. This captures survey evidence showing that rice i s grown on these farms to meet subsistence needs for fodder and consumption.
- 5. L, 2 L, subsistence rice consumption constraint
where
Since not al l farmers are identical, the analysis distinguishes between three types o f cultivators, depending on the availability o f land. Subsistence farmers are classified as those with landholdings up to 2 hectares. They are driven by subsistence needs and the imperative to survive takes precedence over commercial considerations. This is modeled as a safety-first constraint where the primary objective i s to earn a threshold amount o f Rs. 12,000, which is the subsistence threshold in the National Sample Survey (NSS). Medium farmers have holdings between 2 and 3.5 hectares and large farmers have holdings in excess o f 4.5 hectares. The farmers attempt to maximize the commercial payoffs from farming, as defined in equations (2) - (5). To capture subsistence behavior an additional simple constraint i s imposed for small land holders:
= 0.5 ha, and subscript r denotes rice crop.
n
6. x{niLi} 2Y small farm subsistence constraint i=l
128
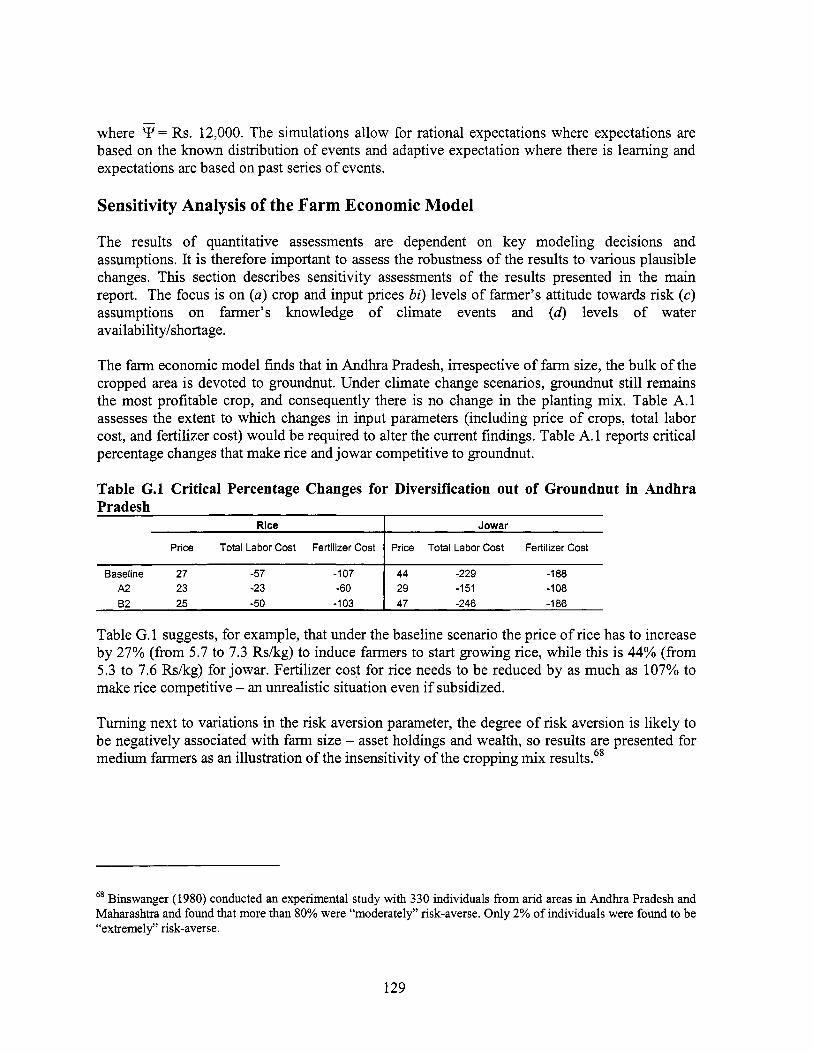
where = Rs. 12,000. The simulations allow for rational expectations where expectations are based on the known distribution o f events and adaptive expectation where there i s learning and expectations are based on past series o f events.
Rice
Price Total Labor Cost Fertilizer Cost
Sensitivity Analysis of the Farm Economic Model
Jowar
Price Total Labor Cost Fertilizer Cost
The results o f quantitative assessments are dependent on key modeling decisions and assumptions. It i s therefore important to assess the robustness o f the results to various plausible changes. This section describes sensitivity assessments o f the results presented in the main report. The focus is on (a) crop and input prices bi) levels o f farmer’s attitude towards risk (e) assumptions on farmer’s knowledge o f climate events and (d) levels o f water availabilityhhortage.
Baseline 27 -57 -107 A2 23 -23 -60 82 25 -50 -1 03
The farm economic model finds that in Andhra Pradesh, irrespective o f farm size, the bulk o f the cropped area i s devoted to groundnut. Under climate change scenarios, groundnut st i l l remains the most profitable crop, and consequently there is no change in the planting mix. Table A.l assesses the extent to which changes in input parameters (including price o f crops, total labor cost, and fertilizer cost) would be required to alter the current findings. Table A. 1 reports critical percentage changes that make rice and jowar competitive to groundnut.
44 -229 -1 88 29 -151 -1 08 47 -246 -1 86
Table G.1 Critical Percentage Changes for Diversification out o f Groundnut in Andhra
Table G. 1 suggests, for example, that under the baseline scenario the price o f rice has to increase by 27% (from 5.7 to 7.3 Rskg) to induce farmers to start growing rice, while this i s 44% (from 5.3 to 7.6 Rskg) for jowar. Fertilizer cost for rice needs to be reduced by as much as 107% to make rice competitive - an unrealistic situation even if subsidized.
Turning next to variations in the risk aversion parameter, the degree o f risk aversion i s l ikely to be negatively associated with farm size - asset holdings and wealth, so results are presented for medium farmers as an illustration o f the insensitivity o f the cropping mix results.68
Binswanger (1980) conducted an experimental study with 330 individuals f r o m arid areas in Andhra Pradesh and Maharashtra and found that more than 80% were “moderately” risk-averse. Only 2% o f individuals were found to b e “extremely” risk-averse.
129
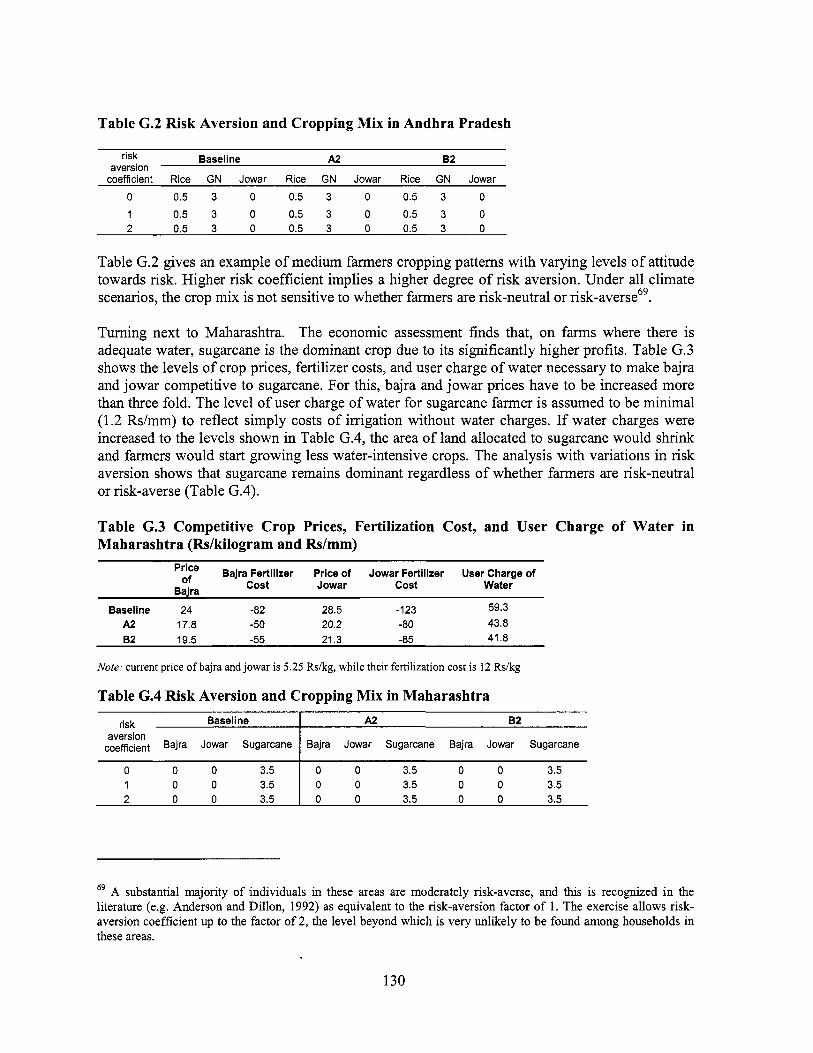
Table G.2 Risk Aversion and Cropping M i x in Andhra Pradesh
risk Baseline aversion
coefficient Bajra Jowar Sugarcane
A2 82 ~ risk ~ Baseline aversion
coefficient Rice GN Jowar Rice GN Jowar Rice GN Jowar
0 0.5 3 0 0.5 3 0 0.5 3 0 1 0.5 3 0 0.5 3 0 0.5 3 0 2 0.5 3 0 0.5 3 0 0.5 3 0
A2 B2
Bajra Jowar Sugarcane Bajra Jowar Sugarcane
Table G.2 gives an example o f medium farmers cropping patterns with varying levels o f attitude towards risk. Higher risk coefficient implies a higher degree o f risk aversion. Under al l climate scenarios, the crop mix i s not sensitive to whether farmers are risk-neutral or r i ~ k - a v e r s e ~ ~ .
0 0 0 3.5 1 0 0 3.5 2 0 0 3.5
Turning next to Maharashtra. The economic assessment finds that, on farms where there i s adequate water, sugarcane i s the dominant crop due to its significantly higher profits. Table G.3 shows the levels o f crop prices, fertilizer costs, and user charge o f water necessary to make bajra and jowar competitive to sugarcane. For this, bajra and jowar prices have to be increased more than three fold. The level o f user charge o f water for sugarcane farmer is assumed to be minimal (1.2 Rs/mm) to reflect simply costs o f irrigation without water charges. If water charges were increased to the levels shown in Table G.4, the area o f land allocated to sugarcane would shr ink and farmers would start growing less water-intensive crops. The analysis with variations in risk aversion shows that sugarcane remains dominant regardless o f whether farmers are risk-neutral or risk-averse (Table G.4).
0 0 3.5 0 0 3.5 0 0 3.5 0 0 3.5 0 0 3.5 0 0 3.5
Table G.3 Competitive Crop Prices, Fertilization Cost, and User Charge of Water in Maharashtra (FWkilogram and Rdmm)
Price Bajra Fertilizer Price of Jowar Fertilizer User Charge of of Bajra cost Jowar cost Water
Baseline 24 -82 28.5 -123 59.3 A2 17.8 -50 20.2 -80 43.8 B2 19.5 -55 21.3 -85 41.8
Note: current price o f bajra and jowar i s 5.25 Rskg, while their fertilization cost i s 12 Rskg
69 A substantial majori ty o f individuals in these areas are moderately risk-averse, and t h i s i s recognized in the literature (e.g. Anderson and Dil lon, 1992) as equivalent t o the risk-aversion factor o f 1. The exercise allows r isk- aversion coefficient up to the factor o f 2, the level beyond which is very unl ikely to b e found among households in these areas.
130
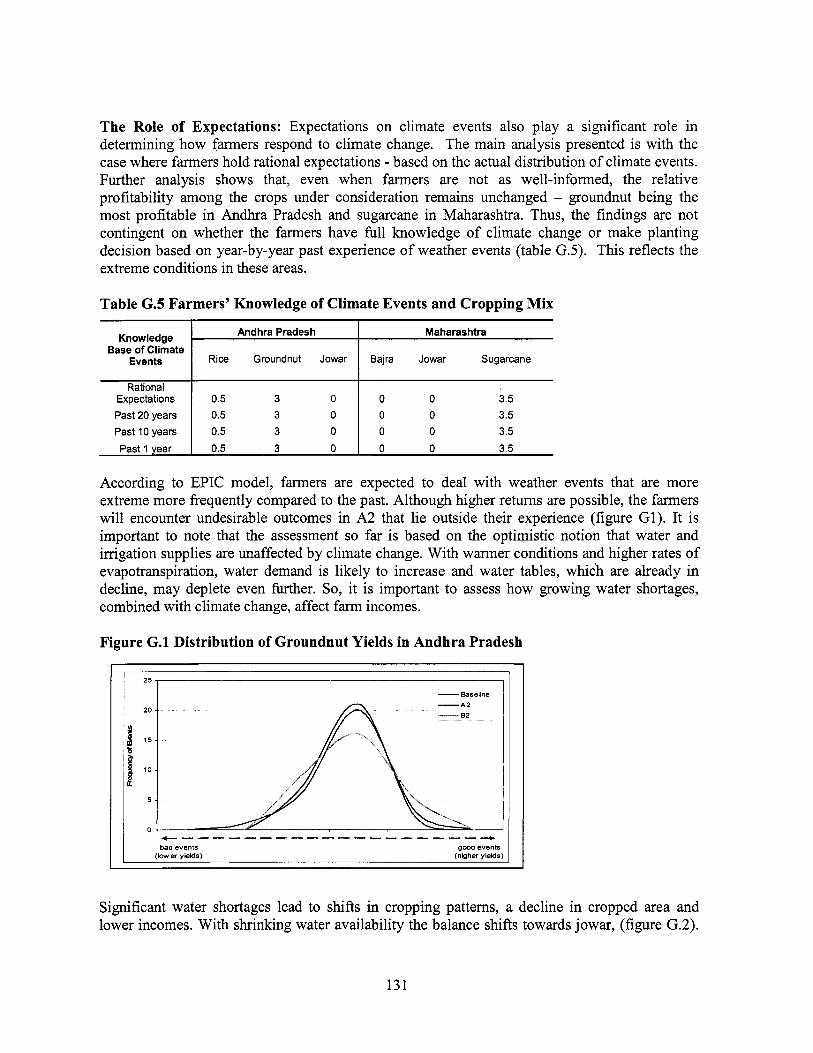
The Role of Expectations: Expectations on climate events also play a significant role in determining how farmers respond to climate change. The main analysis presented i s with the case where farmers hold rational expectations - based on the actual distribution o f climate events. Further analysis shows that, even when fanners are not as well-informed, the relative profitability among the crops under consideration remains unchanged - groundnut being the most profitable in Andhra Pradesh and sugarcane in Maharashtra. Thus, the findings are not contingent on whether the farmers have hll knowledge o f climate change or make planting decision based on year-by-year past experience o f weather events (table G.5). This reflects the extreme conditions in these areas.
Knowledge Base of Climate
Events
Rational Expectations Past 20 years Past 10 years Past 1 year
Table G.5 Farmers’ Knowledge of Climate Events and Cropping M i x
Andhra Pradesh Maharashtra
Rice Groundnut Jowar Bajra Jowar Sugarcane
0.5 3 0 0 0 3.5 0.5 3 0 0 0 3.5 0.5 3 0 0 0 3.5 0.5 3 0 0 0 3.5
According to EPIC model, farmers are expected to deal with weather events that are more extreme more frequently compared to the past. Although higher returns are possible, the farmers will encounter undesirable outcomes in A2 that l i e outside their experience (figure Gl). I t i s important to note that the assessment so far is based on the optimistic notion that water and irrigation supplies are unaffected by climate change. With warmer conditions and higher rates o f evapotranspiration, water demand i s l ikely to increase and water tables, which are already in decline, may deplete even further. So, i t i s important to assess how growing water shortages, combined with climate change, affect farm incomes.
Figure G.l Distribution of Groundnut Yields in Andhra Pradesh
I 2 5 1 I
20
15
10
5
0 --------------------- gow events baa even%
(lower yields) (higher yields)
Significant water shortages lead to shifts in cropping patterns, a decline in cropped area and lower incomes. With shrinking water availability the balance shifts towards jowar, (figure G.2).
131
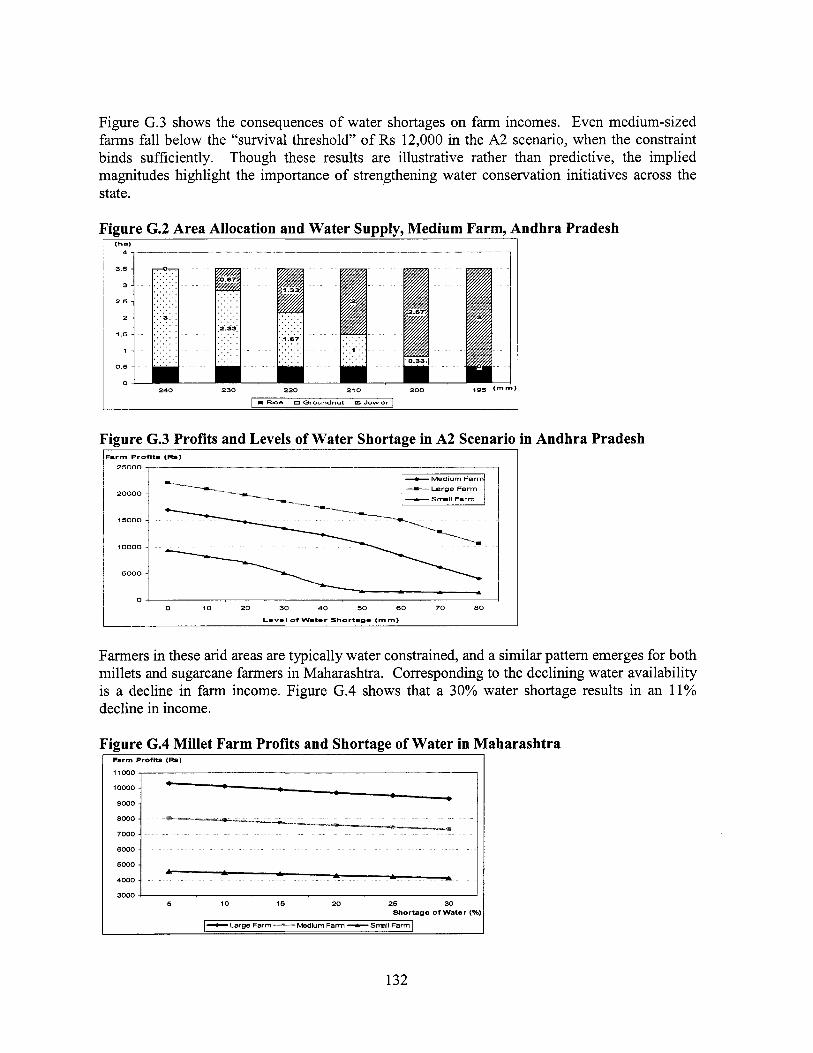
Figure G.3 shows the consequences o f water shortages on farm incomes. Even medium-sized farms fal l below the “survival threshold” o f Rs 12,000 in the A2 scenario, when the constraint binds sufficiently. Though these results are illustrative rather than predictive, the implied magnitudes highlight the importance o f strengthening water conservation initiatives across the state.
Figure G.2 Area Allocation and Water Supply, Medium Farm, Andhra Pradesh (ha)
3 5
3
2 5
2
1 5
1
0 5
0 240 230 220 21 0 200
I Rice 0 aoundnut m Jowar
Figure G.3 Profits and Levels of Water Shortage in A2 Scenario in Andhra Pradesh
20000 -
15000 -
10000 -
5000 -
0 10 20 30 40 50 60 70 80
Level of Want-r S h o r t a m - <mm)
Farmers in these arid areas are typically water constrained, and a similar pattern emerges for both mil lets and sugarcane farmers in Maharashtra. Corresponding to the declining water availability i s a decline in farm income. Figure G.4 shows that a 30% water shortage results in an 11% decline in income.
Figure G.4 Millet Farm Profits and Shortage o f Water in Maharashtra Farm Profits (W)
I l l 0 0 0 , I
10000 I 9ooo/
I 6ooo 1 I
3000 4 I 5 10 15 20 25 30
Shortage of Water (9’4 -Laroe Farm ---n--kdium Farm - c S r r e l l Farm
132
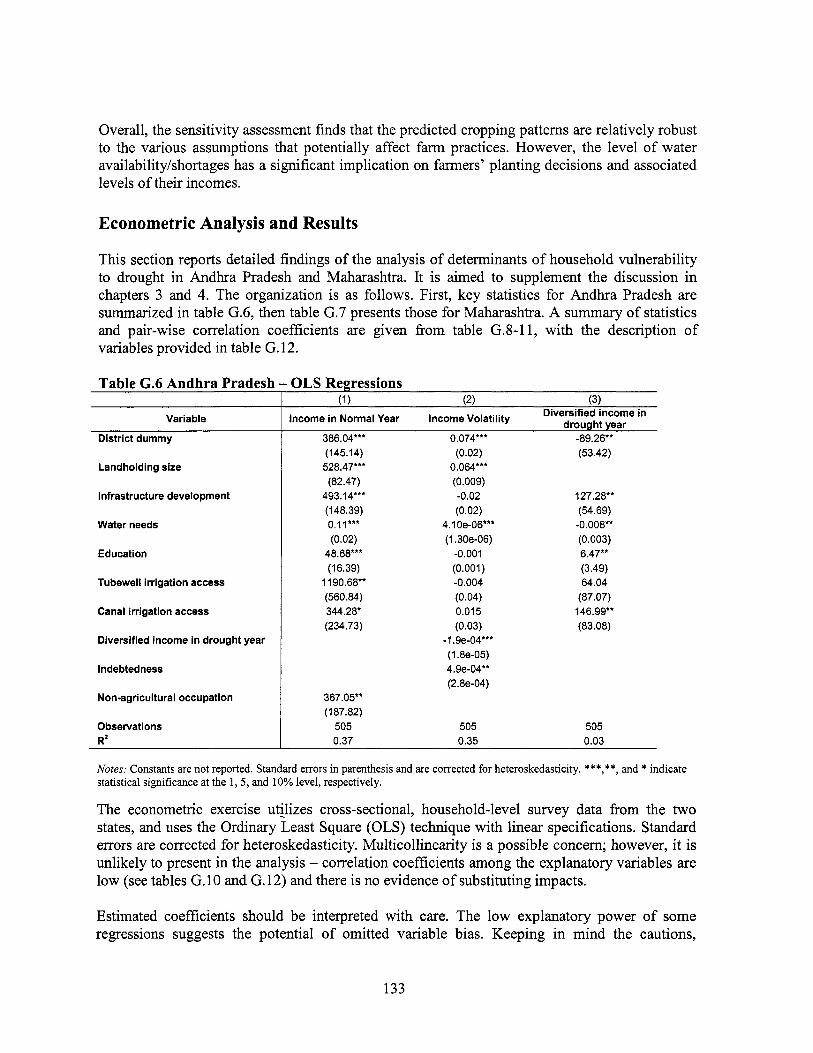
Overall, the sensitivity assessment finds that the predicted cropping patterns are relatively robust to the various assumptions that potentially affect farm practices. However, the level o f water availabilityhhortages has a significant implication on farmers' planting decisions and associated levels o f their incomes.
Econometric Analysis and Results
This section reports detailed findings o f the analysis o f determinants o f household vulnerability to drought in Andhra Pradesh and Maharashtra. I t i s aimed to supplement the discussion in chapters 3 and 4. The organization is as follows. First, key statistics for Andhra Pradesh are summarized in table G.6, then table G.7 presents those for Maharashtra. A summary o f statistics and pair-wise correlation coefficients are given from table G.8-11 , with the description o f variables provided in table G. 12.
Table G.6 Andhra Pradesh - OLS Regressions
Variable
District dummy
Landholding size
Infrastructure development
Water needs
Education
Tubewell irrigation access
Canal irrigation access
Diversified income in drought year
Indebtedness
Nonagricultural occupation
Observations R'
Income in Normal Year Income Volatility Diversified income in drought year 386.04*+* 0.074"* -89.26+* (145.14) 528.47*** (82.47)
493.14"' (I 48.39) 0.11*** (0.02)
48.68*** (16.39) I 190.68** (560.84) 344.28* (234.73)
367.05**
505 0.37
(187.82)
(0.02) 0.064*** (0.009) -0.02 (0.02)
4.1 Oe-06**' (1.30e-06)
-0.001 (0.001) -0.004 (0.04) 0.015 (0.03)
-1.9e-04'** (I .8e-05) 4.9e-04** (2.8e-04)
505 0.35
(53.42)
127.28**
-o.ooa** (54.69)
(0.003) 6.47** (3.49) 64.04
(87.07) 146.99** (83.08)
505 0.03
Notes; Constants are not reported. Standard errors in parenthesis and are corrected for heteroskedasticity. ***,**, and * indicate statistical significance at the 1, 5, and 10% level, respectively.
The econometric exercise utilizes cross-sectional, household-level survey data from the two states, and uses the Ordinary Least Square (OLS) technique with linear specifications. Standard errors are corrected for heteroskedasticity. Multicollinearity is a possible concern; however, i t is unlikely to present in the analysis - correlation coefficients among the explanatory variables are l ow (see tables G. 10 and G. 12) and there i s no evidence o f substituting impacts.
Estimated coefficients should be interpreted with care. The l o w explanatory power o f some regressions suggests the potential o f omitted variable bias. Keeping in mind the cautions,
133
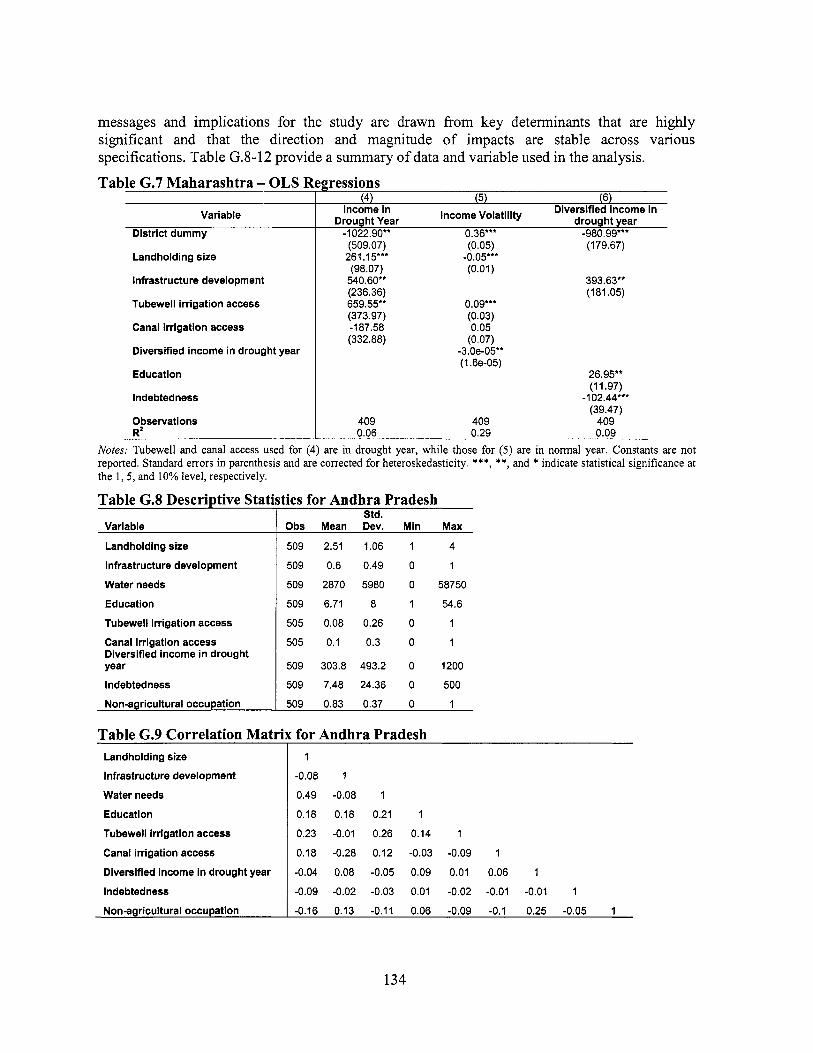
Variable District dummy
Landholding size
Infrastructure development
Tubewell irrigation access
Canal irrigation access
Diversified income in drought year
Education
Indebtedness
Observations R2
(4) (5) (6) Diversified income in
drought year Income Volatility Income in Drought Year
-1022.90'* 0.36"' -980.99*** (509.07) (0.05) (179.67)
261 .I Y* -0.05"* (98.07) (0.01)
540.60** 393.63** (236.36) (181.05) 659.55*' 0.09*** (373.97) (0.03) -187.58 0.05 (332.88) (0.07)
-3.0e-05** (1.6e-05)
26.95" (1 1.97)
(39.47) -102.44"'
409 409 409 0.06 0.29 0.09
Variable
Landholding size
Education
Tubewell irrigation access
Std. Obs Mean Dev. Min Max
509 2.51 1.06 1 4
509 6.71 8 1 54.6
505 0.08 0.26 0 1
Infrastructure development
Water needs 1 505 0.1 0.3 ; 1 Canalrgation acces; Diversified income in drought year 509 303.8 493.2 1200
Indebtedness 509 7.48 24.36 500
Non-a ricultural occu ation 509 0.83 0.37 1
509 0.6 0.49 0 1
509 2870 5980 0 58750
Table G.9 Correlation Matr ix for Andhra Pradesh Landholding sire
Infrastructure development
Water needs
Education
Tubewell irrigation access
Canal irrigation access
Diversified income in drought year
Indebtedness
Non-agricultural occupation
1
-0.08 1
0.49 -0.08 1
0.18 0.18 0.21 1
0.23 -0.01 0.26 0.14 1
0.18 -0.28 0.12 -0.03 -0.09 1
-0.04 0.08 -0.05 0.09 0.01 0.06 1
-0.09 -0.02 -0.03 0.01 -0.02 -0.01 -0.01 1
-0.16 0.13 -0.11 0.06 -0.09 -0.1 0.25 -0.05 1
134
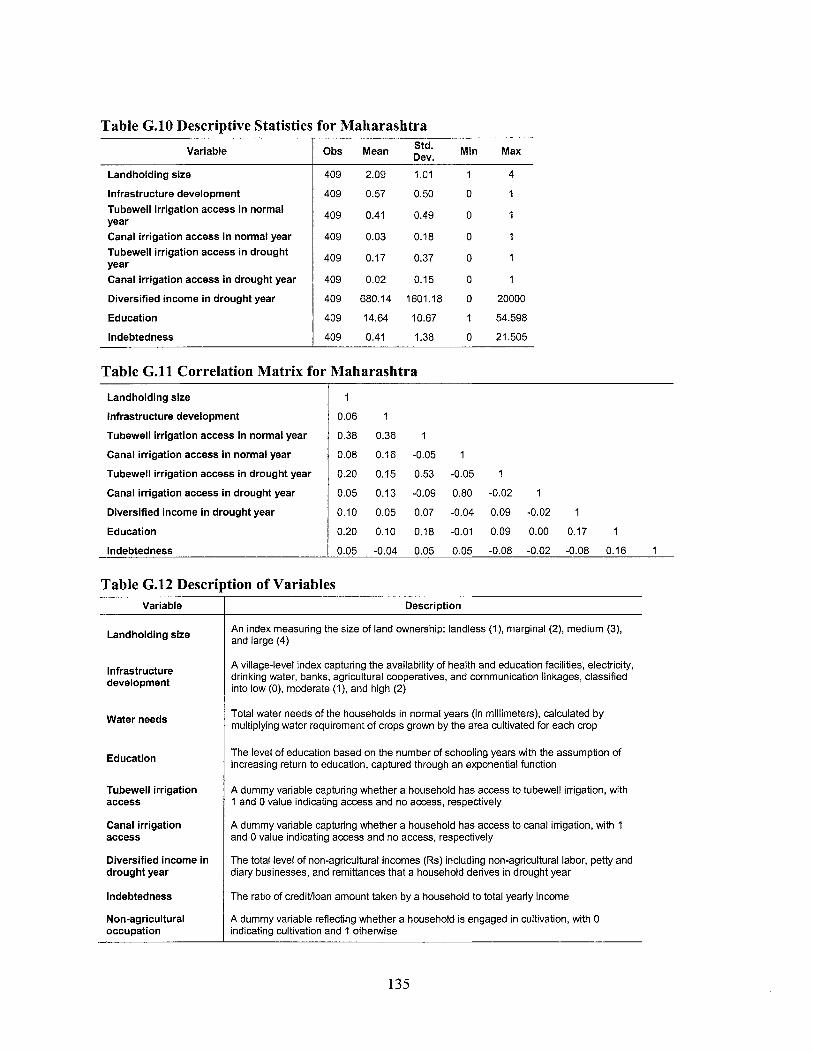
Table G.10 Descriptive Statistics for Maharashtra
Variable
Landholding size
Infrastructure development Tubewell irrigation access in normal year Canal irrigation access in normal year Tubewell irrigation access in drought year Canal irrigation access in drought year
Diversified income in drought year
Education
Indebtedness
Obs Mean Dev, Std* Min Max
409 2.09 1.01 1 4
409 0.57 0.50 0 1
409 0.41 0.49 0 1
409 0.03 0.18 0 1
409 0.17 0.37 0 1
409 0.02 0.15 0 1
409 680.14 1601.18 0 20000
409 14.64 10.67 1 54.598
409 0.41 1.38 0 21.505
Table G.11 Correlation Matr ix for Maharashtra
Landholding size
Infrastructure development
Tubewell irrigation access in normal year
Canal irrigation access in normal year
Tubewell irrigation access in drought year
Canal irrigation access in drought year
Diversified income in drought year
Education
Indebtedness
Table G.12 Descri] Variable
Landholding size
Infrastructure development
Water needs
Education
Tubewell irrigation access
Canal irrigation access
Diversified income in drought year
Indebtedness
Non-agricultural occupation
1
0.06
0.38
0.08
0.20
0.05
0.10
0.20
0.05
1
0.36 1
0.16 -0.05 1
0.15 0.53 -0.05 1
0.13 -0.09 0.80 -0.02 1
0.05 0.07 -0.04 0.09 -0.02 1
0.10 0.18 -0.01 0.09 0.00 0.17 1
-0.04 0.05 0.05 -0.08 -0.02 -0.08 0.16 1
;ion of Variables Description
An index measuring the size of land ownership: landless (I), marginal (2), medium (3), and large (4)
A village-level index capturing the availability of health and education facilities, electricity, drinking water, banks, agricultural cooperatives, and communication linkages, classified into low (0), moderate (I), and high (2)
Total water needs of the households in normal years (in millimeters), calculated by multiplying water requirement of crops grown by the area cultivated for each crop
The level of education based on the number of schooling years with the assumption of increasing return to education, captured through an exponential function
A dummy variable capturing whether a household has access to tubewell irrigation, with 1 and 0 value indicating access and no access, respectively
A dummy variable capturing whether a household has access to canal irrigation, with 1 and 0 value indicating access and no access, respectively
The total level of non-agricultural incomes (Rs) including non-agricultural labor, petty and diary businesses, and remittances that a household derives in drought year
The ratio of crediVloan amount taken by a household to total yearly income
A dummy variable reflecting whether a household is engaged in cultivation, with 0 indicating cultivation and 1 otherwise
135
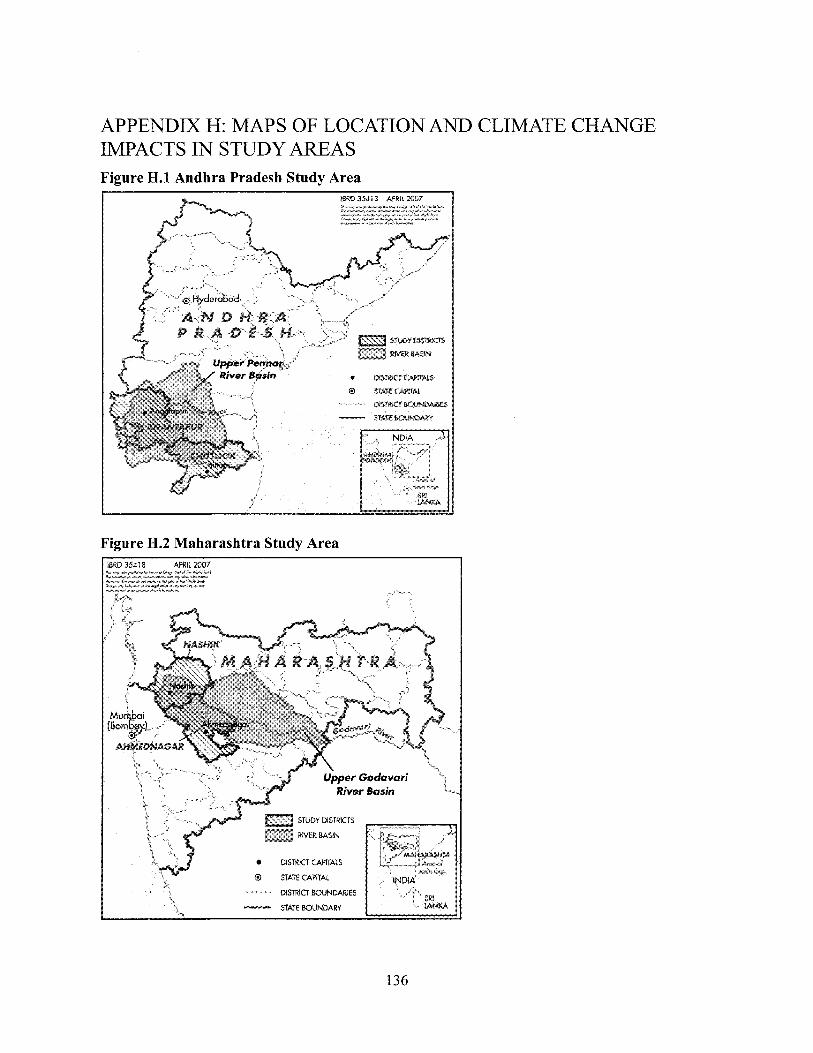
APPENDIX H: MAPS OF LOCATION AND CLIMATE CHANGE IMPACTS IN STUDY AREAS Figure H.l Andhra Pradesh Study Area
Figure H.2 Maharashtra Study Area
SPJDY DISTRICTS
R l M R BASIN
DISTRICT CAPliAlS 0 STATECAPITAL
DISTRICT BOUNDARIES - 3AEBOUNoARY ", 3
136
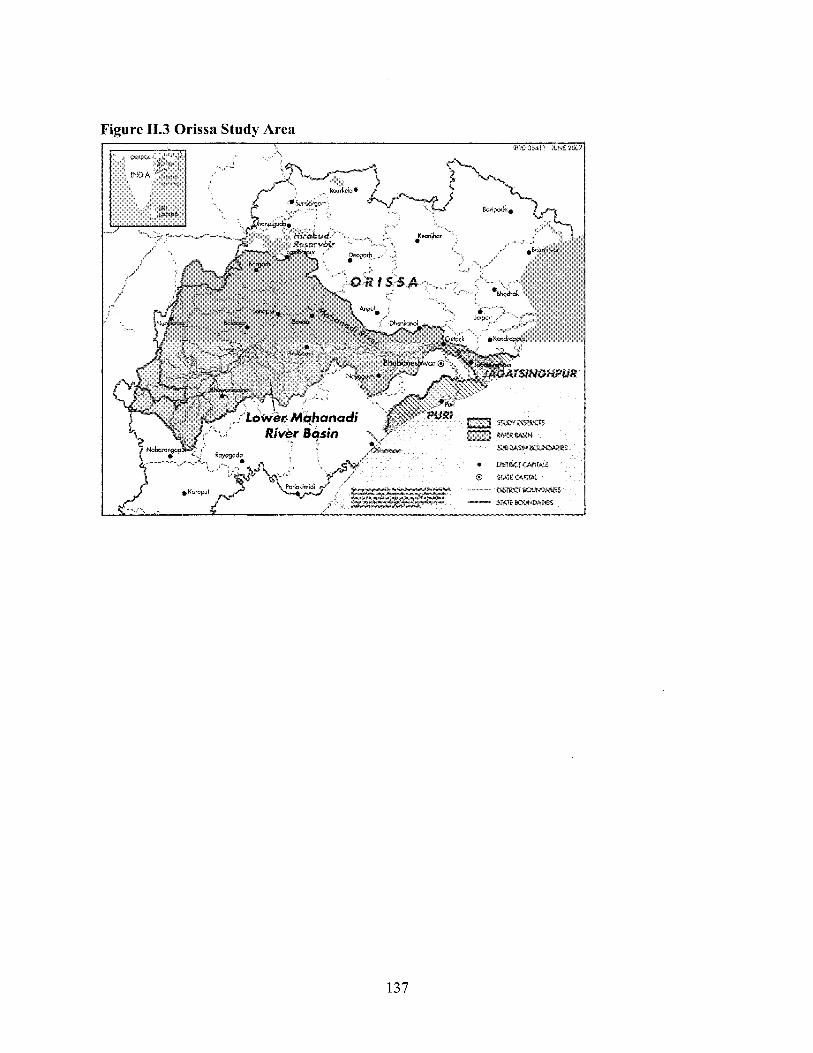
137
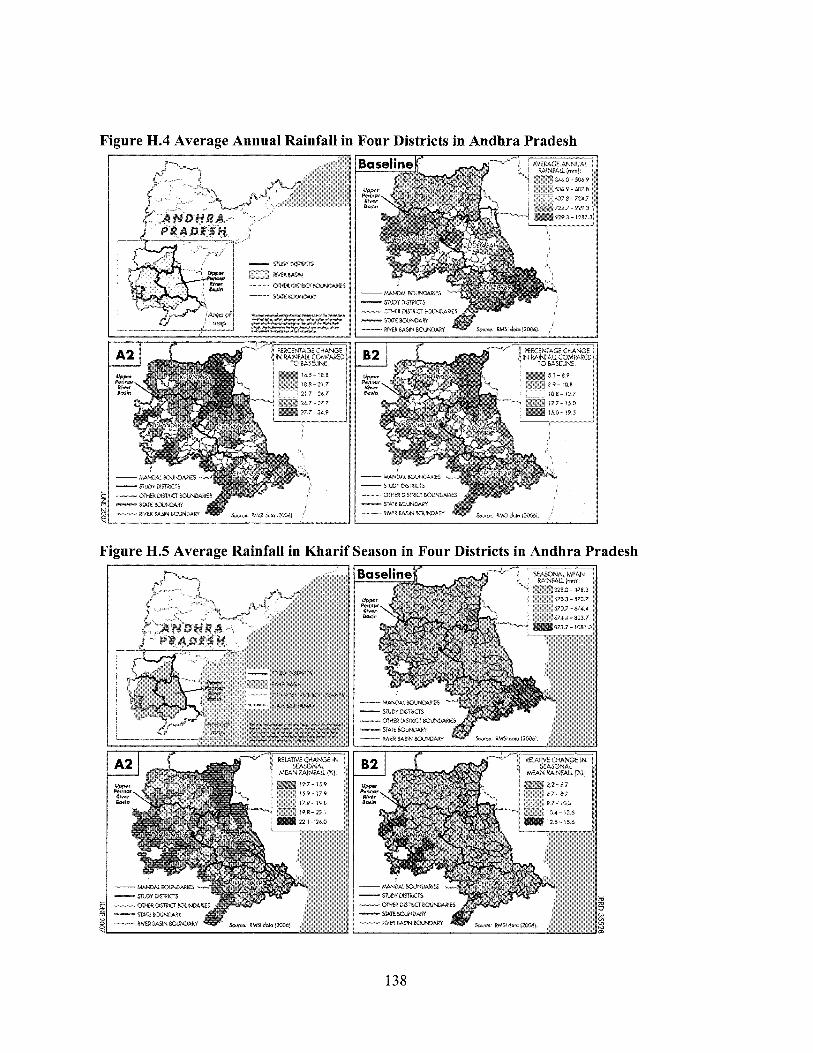
Figure H.4 Average Annual Rainfall in Four Districts in Andhra Pradesh
Figure H.5 Average Rainfall in Kharif Season in Four Districts in Andhra Pradesh
138
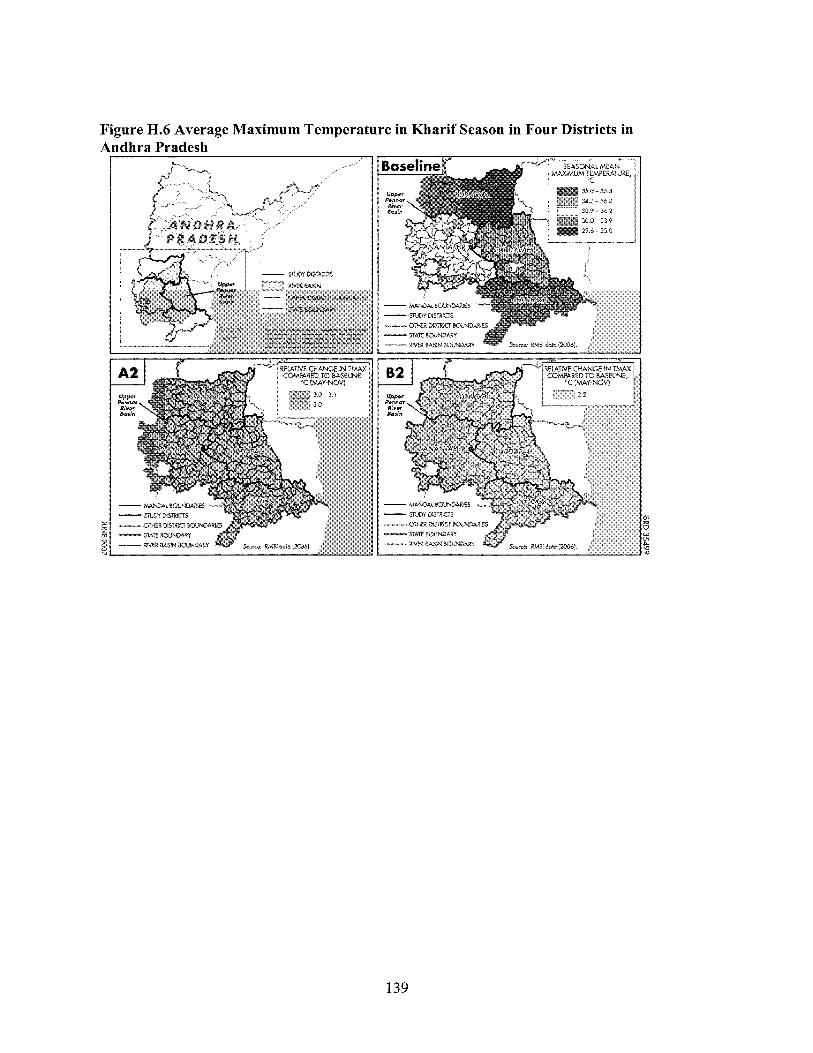
Figure H.6 Average Maximum Temperature in Kharif Season in Four Districts in Andhra Pradesh
139
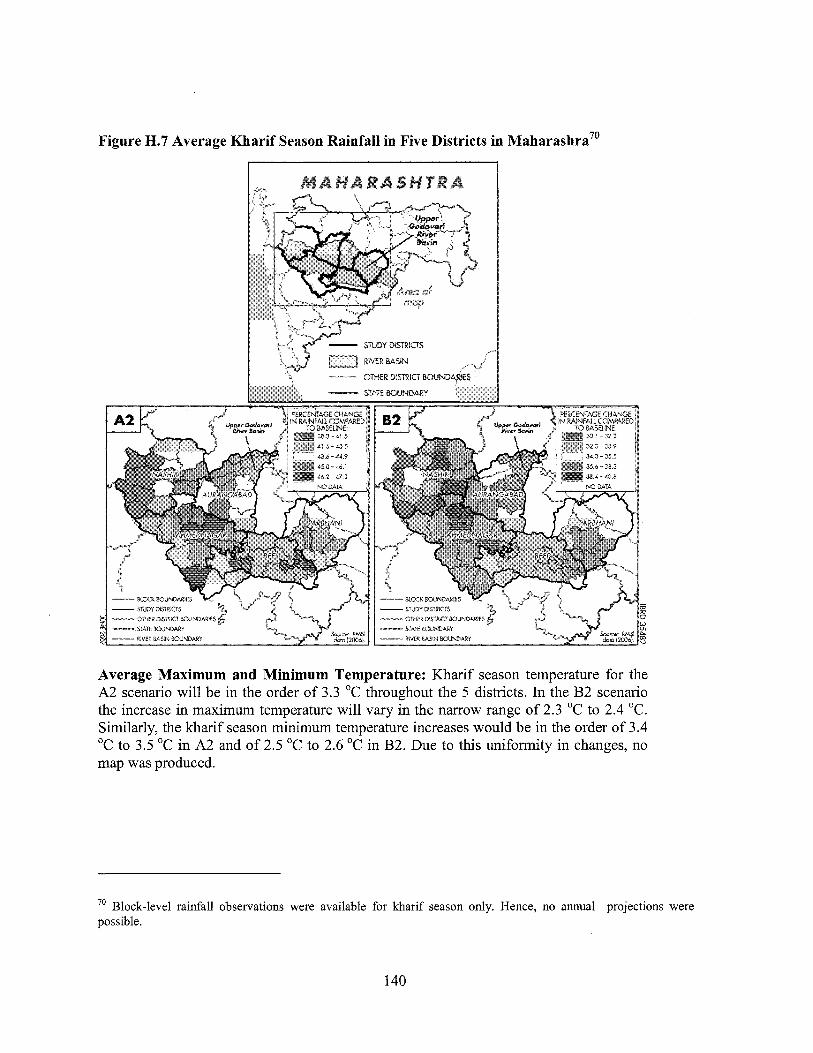
Figure H.7 Average Khari f Season Rainfall in Five Districts in Maharashra"
Average Maximum and Minimum Temperature: Khar i f season temperature for the A2 scenario wil l be in the order o f 3.3 "C throughout the 5 districts. In the B 2 scenario the increase in maximum temperature will vary in the narrow range o f 2.3 "C to 2.4 "C. Similarly, the kharif season minimum temperature increases would be in the order o f 3.4 "C to 3.5 "C in A2 and o f 2.5 "C to 2.6 "C in B2. Due to this uniformity in changes, no map was produced.
Block-level rainfall observations were available for khar i f season only. Hence, no annual projections were 70
possible.
140
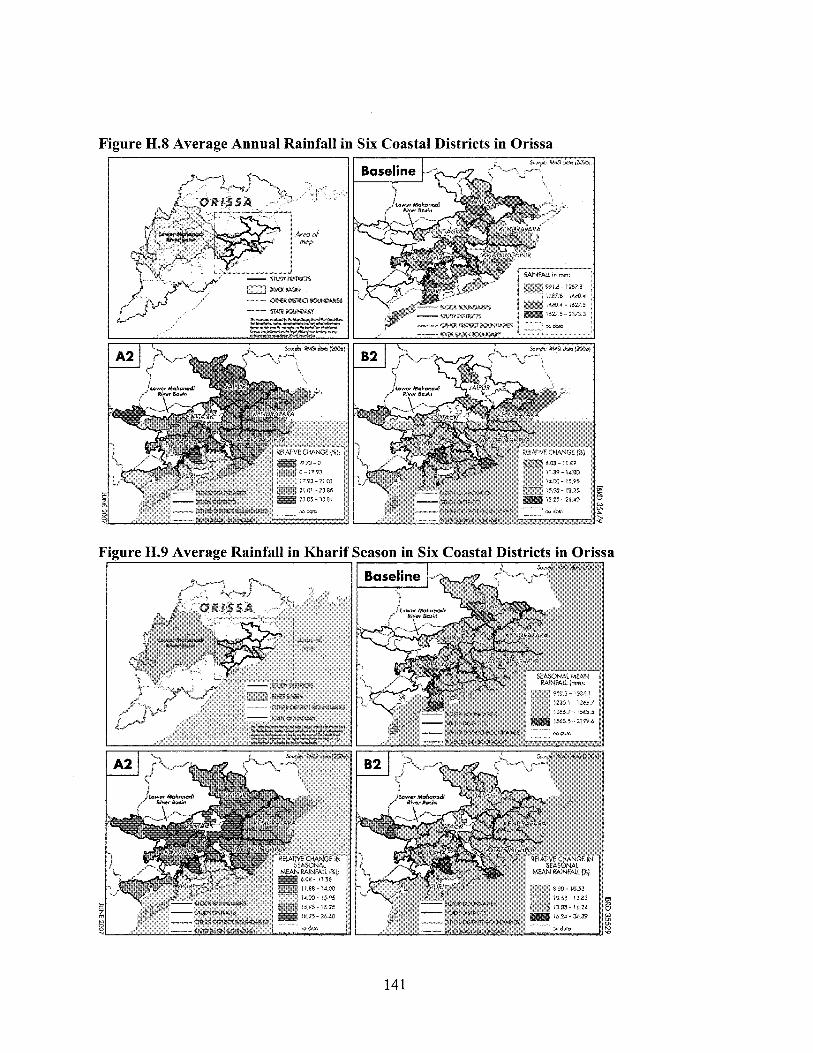
Figure H.8 Average Annual Rainfall in Six Coastal Districts in Orissa
Figure H.9 Average Rainfall in Khari f Season in Six Coastal Districts in Orissa
141
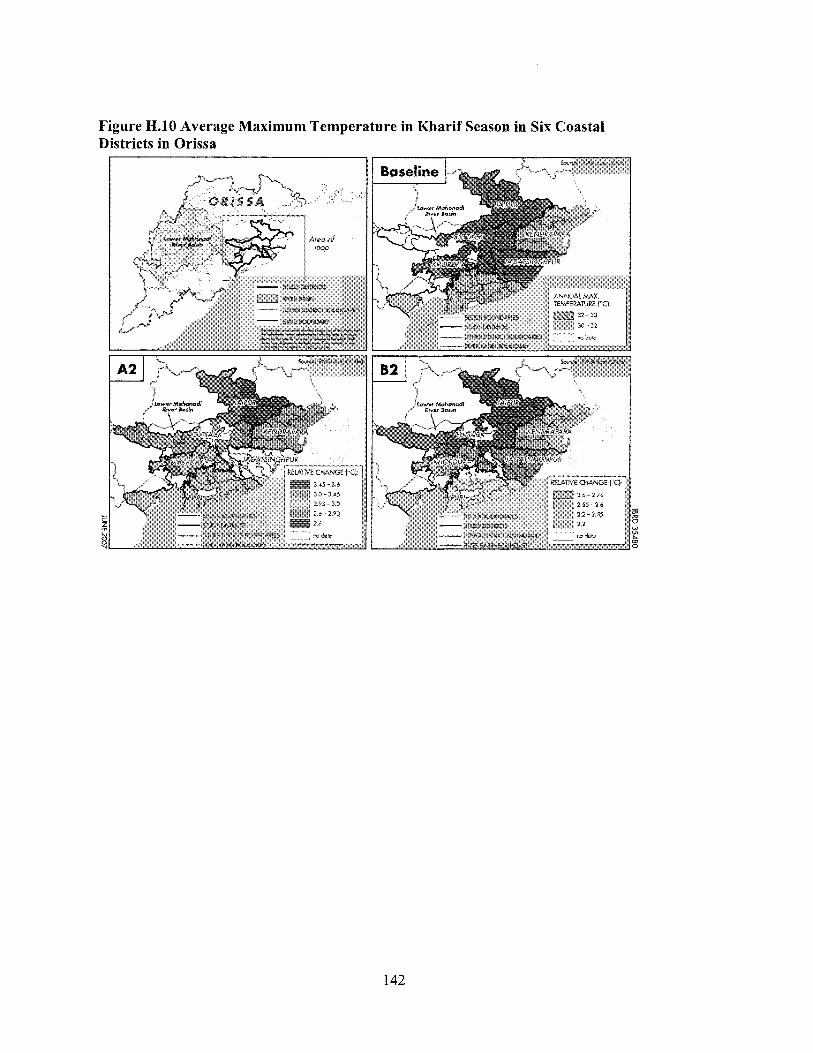
Figure H.10 Average Maximum Temperature in Khari f Season in Six Coastal Districts in Orissa
142
Bibliography Aandahl, Guro, et al. 2004. “Mapping Vulnerability to Multiple Stressors: Climate Change and Globalization in India.” Global Environmental Change 14: 303-1 3.
Anderson, J.R. and Dillon, J.L., 1992. Risk analysis in dryland farming systems, Food and Agriculture Organization, Rome.
Aggarwal, P.K., and R.K. Mall . 2002. “Climate Change and R i c e Yields in Diverse Agro- Environments o f India. 11. Effect o f Uncertainties in Scenarios and Crop Models on Impact Assessment.” Climatic Change 52 (3): 331-43.
Alwang, J., S. Jorgensen, and P.B. Siegel. 2001. Vulnerability: A View from Different Disciplines. Washington, DC: World Bank.
Binswanger, H.P., 1980. “Attitude Toward Risk: Experimental Measurement in Rural India.” American Journal of Agricultural Economics, August, (62): 395-407.
Briscoe, John, and R.P.S. Malik, eds. 2007. Oxford Handbook of Water Resources in India. World Bank. Oxford: Oxford University Press.
DFID (Department for International Development). 2005a. Managing Groundwater Resources in Rural India: the Community and Beyond. Commissioned Report CR/05/35N, British Geological Survey.
DFID (Department for International Development). 2005b. Sustainable Groundwater Development of Hard Rock Aquifers: The Conflict Between Irrigation and Drinking Water Supplies from the Deccan Basalts of India. Technical Report WCf95f52, British Geological Survey.
Diamond, J. 2005. Collapse: How Societies Choose to Fail or Succeed. New York: Viking.
Dinar, A., R. Mendelsohn, R. Evenson, J. Parikh, A. Sanghi, K. Kumar, J. McKinsey, and S. Lonergan, eds. 1998. “Measuring the Impact o f Climate Change on Indian Agriculture.” Technical Paper 402, World Bank, Washington, DC.
Dreze, J., and A. Sen. 1989. Hunger and Public Action. Oxford: Oxford University Press.
Government o f India. 200 1. Household Consumer Expenditure in India, 1999-2000: Key Results. Report 454. New Delhi: NSSO.
Government of India. 2004. Economic Survey of India 2003-2004. New Delhi: Government o f India.
Government o f Maharashtra. 1999. Selected Indicators for Districts in Maharashtra and States in India. Directorate o f Economics and Statistics, Government o f Maharashtra.
Government o f Maharashtra. 2000. Handbook of Basic Statistics of Maharashtra State. Directorate o f Economics and Statistics, Government o f Maharashtra.
Government o f Maharashtra. 2004. Economic Survey of Maharashtra 2003-04. Directorate o f Economics and Statistics, Planning Department, Government o f Maharashtra.
Government o f Maharashtra. 2006. Annual Plan 2006-07: Maharashtra State Part II. Planning Department, Government o f Maharashtra.
3 -
:
143
Government o f Orissa. 2001 a. District Handbook of Jagatsinghpur. Directorate o f Economics and Statistics, Government o f Orissa.
Government o f Orissa. 2001b. Memorandum on Flood Situation in Orissa 2001. Special Re l ie f Commissioner, Revenue Department, Government o f Orissa.
Government o f Orissa. 2002a. District Handbook of Puri. Directorate of Economics and Statistics, Government o f Orissa.
Government o f Orissa. 2002b. A Memorandum on Orissa Drought 2002. Special Re l ie f Commissioner, Revenue Department, Government o f Orissa.
Government o f Orissa. 2003a. Annual Report on Natural Calamities 2002-03. Special Re l ie f Commissioner, Revenue Department, Orissa State Disaster Mitigation Authority, Government o f Orissa.
Government o f Orissa. 2003b. Memorandum on Floods 2003: I. Special Relief Commissioner, Revenue and Disaster Management Department, Government o f Orissa.
Government o f Orissa. 2003c. Memorandum on Floods 2003: I.. Special Relief Commissioner, Revenue and Disaster Management Department, Government o f Orissa.
Government o f Orissa. 2004. Annual Report on Natural Calamities 2003-04. Special Rel ie f Commissioner, Revenue Department, Orissa State Disaster Mitigation Authority, Government o f Orissa.
Government o f Orissa. 2005a. Agricultural Statistics of Orissa 2004-2005. Directorate o f Economics and Statistics, Government o f Orissa.
Government o f Orissa. 2005b. Annual Report on Natural Calamities 2004-05. Special Relief Commissioner, Revenue Department, Orissa State Disaster Mitigation Authority, Government o f Orissa.
Government o f Orissa. 2006a. Annual Report on Natural Calamities 2005-06. Special Rel ie f Commissioner, Revenue and Disaster Management Department, Orissa State Disaster Mitigation Authority, Government o f Orissa.
Government o f Orissa. 2006b. Final Memorandum on Floods 2006. Special Rel ief Commissioner, Revenue and Disaster Management Department, Government o f Orissa.
Government o f Orissa. 2006c. Proposal for Flood Control Sector of Orissa for Eleventh Five Year Plan (2007-12). Department o f Water Resources.
Hess, U. 2003. Innovative Financial Services for Rural India: Monsoon-Indexed Lending and Insurance for Smallholders.” Agriculture and Rural Development Working Paper 9, World Bank, Washington, DC.
IPCC (Intergovernmental Panel on Climate Change). 1995. Climate Change 1995. Contributions o f Working Groups I, 11, and I11 to the Second Assessment Report o f the IPCC. Cambridge, United Kingdom: Cambridge University Press.
IPCC (Intergovernmental Panel on Climate Change). 1998. Summary for Policymakers. Special Report on Emission Scenarios. A Special Report o f Working Group I11 o f the IPCC. United Kingdom: Cambridge University Press.
144
IPCC (Intergovernmental Panel on Climate Change). 2001. Climate Change 2001: Synthesis Report. Contributions o f Working Groups I, 11, and I11 to the Third Assessment Report o f the IPCC. Cambridge, United Kingdom: Cambridge University Press.
IPCC (Intergovernmental Panel on Climate Change). 2007a. Climate Change 2007: The Physical Science Basis. Summary for Policymakers. Contribution o f Working Group I to the Fourth Assessment Report o f the IPCC.
IPCC (Intergovernmental Panel on Climate Change). 2007b. Climate Change 2007: Impacts, Adaptation, and Vulnerability. Summary for Policymakers. Contribution o f Working Group I1 to the Fourth Assessment Report o f the PCC.
IPCC (Intergovernmental Panel on Climate Change). 2007c. Climate Change 2007: Mitigation of Climate Change. Summary for Policymakers. Contribution o f Working Group I11 to the Fourth Assessment Report o f the IPCC.
Kalra, Naveen, et al. 2007. Impacts of Climate Change in India: Agricultural Impacts. Final Report, Joint Indo-UK Programme o f Ministry o f Environment and Forests, India, and Department for Environment, Food and Rural Affairs (DEFRA), United Kingdom. New Delhi: Unit o f Simulation and Informatics, Indian Agricultural Research Institute.
Kumar, K.S., and J. Parikh. 1998. “Climate Change Impacts on Indian Agriculture: The Ricardian Approach.” In Measuring the Impact of Climate Change on Indian Agriculture, eds. A. Dinar, R. Mendelsohn, R. Evenson, J. Parikh, A. Sanghi, K. Kumar, J. McKinsey, and S. Lonergan. Technical Paper 402, World Bank, Washington, DC.
Kumar, K.S., and J. Parikh. 2001. “Indian Agriculture and Climate Sensitivity.” Global Environmental Change 11 (2): 147-54.
Kurukulasuriya, P., et al. 2006. “Will African Agriculture Survive Climate Change?” World Bank Economic Review 20 (3): 367-88.
Lal, M., K.K. Singh, L.S. Rathore, G. Srinivasan, and S.A. Saseendran. 1998. “Vulnerability o f Rice and Wheat Yields in NW India to Future Changes in Climate.” Agricultural and Forest Meteorology 89: 101-14.
La1 M., K.K. Singh, G. Srinivasan, L.S. Rathore, D. Naidu, and C.N. Tripathi. 1999. “Growth and Yield Responses of Soybean in Madhya Pradesh, India, to Climate Variability and Change.” Agric. For. Meteor. 93: 53-70.
Lim, Bo, Erika Spanger-Siegfried, Ian Burton, Elizabeth Malone, and Saleemul Huq, eds. 2005. Adaptation Policy Frameworks for Climate Change: Developing Strategies, Policies and Measures. United Nations Development Programme.
Mendelsohn, R., and A. Dinar. 1999. “Climate Change, Agriculture, and Developing Countries: Does Adaptation Matter?” In Measuring the Impact of Climate Change on Indian Agriculture, eds. A. Dinar et al., 277-93. Technical Paper 402, World Bank, Washington, DC.
Mendelsohn, R., A. Dinar, and L. Williams. 2005. “The Distributional Impact o f Climate Change on Rich and Poor Countries.” Environment and Development Economics 11 (2): 159-78.
Ministry o f Environment and Forests. 2004. India ’s Initial National Communication to the UNFCC. Irrigation and CAD Department, Government o f India, Mahabubnagar.
145
Mishra, S., S. Shroff, D. Shah, V. Deshpande, A.P. Kulkarni, V.S. Deshpande, and P.R. Bhatkule. 2006. Suicide of Farmers in Maharashtra: Background Papers. Mumbai: Indira Gandhi Institute o f Development Research.
Planning Commission 2001 , State Development Report: Orissa, Government o f India, New Delhi.
Planning Commission 2002, Tenth Five Year Plan 2002-2007, Government o f India, New Delhi.
Planning Commission, 2006, Report on Fact Finding Team o f Vidharbha: Regional Disparities and Rural Distress in Maharashtra with a focus on Vidharba, Government o f India, New Delhi
Planning Commission. 2007. Report of the Working Group on Risk Management in Agriculture for the Eleventh Five Year Plan (2007-2012). Planning Commission, Government o f India, New Delhi.
RMSI . 2006a. Draft Final Report on the Economic Component of the Vulnerability to Climate Variability and Change in India: Assessment of Adaptation Issues and Options.
RMSI . 2006b. Draft Final Report on the Integrated Modeling System.
Rupa Kumar, K., K. Krishna Kumar, R.G. Ashrit, S.K. Patwardhan, and G.B. Pant. 2002. “Climate Change in India: Observations and Model Projections.” In Climate Change and India: Issues, Concerns and Opportunities, eds. P.R. Shukla, K. Subodh, S. Sharma, and P.V. Ramana. New Delhi: Tata McGraw-Hill Publishing Company Limited.
Sanghi, A., R. Mendelsohn, and A. Dinar. 1998. “The Climate Sensitivity o f Indian Agriculture.” In Measuring the Impact of Climate Change on Indian Agriculture, eds. A. Dinar, R. Mendelsohn, R. Evenson, J. Parikh, A. Sanghi, K. Kumar, J. McKinsey, and S. Lonergan. Technical Paper 402, World Bank, Washington, DC.
Saseendran, S.A., K.K. Singh, L.S. Rathore, S.V. Singh, and S.K. Sinha. 2000. “Effects o f Climate Change on Rice Production in the Tropical Humid Climate o f Kerala, India.” Climate Change 44: 495-5 14.
Sekhar, A. 2007. “Development and Management Policies, Perspective o f the Planning Commission.” In The Oxford Handbook of Water Resources in India, eds. John Briscoe et al.
Shukla, S. P. 1997, Transforming the Northeast, High Level Commission Report to the Prime Minister, New Delhi.
Skees, J., P. Hazell, and M. Miranda. 1999. New Approaches to Public/Private Crop Yield Insurance in Developing Countries, EPTD Discussion Paper No. 55, Washington, DC: International Food Policy Research Institute.
Stern, Nicholas. 2006. Stern Review Report on the Economics of Climate Change. Cabinet Office, HM Treasury. Cambridge: Cambridge University Press.
Survey o f India. 2002. National Bureau of Soil Survey and Land Use Planning (ICAR). Dehradun and Central Soil and Water Conservation Research and Training Institute, Nagpur, in cooperation with Department o f Agriculture, Government o f Maharashtra.
T E N (The Energy Research Institute). 2006. Fu l l Report on vulnerability to Climate Variability and Change in India: Assessment of Adaptation Issues and Options. Unpublished report.
146
TERI (The Energy Research Institute). 2007. Synthesis Report on Vulnerability to Climate Variability and Change in India: Assessment of Adaptation Issues and Options. Unpublished report.
Tuinhof, Albert, and J.P. Heederik, eds. 2003. Management of Aquifer Recharge and Subsurface Storage. Netherlands National Committee for the International Association o f Hydrogeologists. The Hague. UNDP (United Nations Development Programme). 2004a. Orissa Human Development Report. New Delhi: UNDP. UNDP (United Nations Development Programme). 2004b. User’s Guidebook for the Adaptation Policy Framework.
Verve Consulting. 2007. Living Intelligently with Floods. Draft Report.
Winrock International India. 2005. A Review of Vulnerability to Climate Change and Adaptation strategies in India. Final Report (unpublished).
World Bank. 1999. Come Hell or High Water: Integrating Climate Change Vulnerability and Adaptation into Bank Work, Volume I. Washington, DC: World Bank.
World Bank. 2002. Sustainable Development and the Global Environment: The Experience of the World Bank Group Global Environment Facility Program. Washington, DC: World Bank.
World Bank 2002a. Maharashtra: Reorienting Government to Facilitate Growth and Reduce Poverty, New Delhi.
World Bank. 2003. Climate Change and Agriculture: A Review of Impacts and Adaptations. Environment Department Papers 91, World Bank, Washington, DC.
World Bank. 2003. Poverty and Climate Change: Reducing the Vulnerability of the Poor through Adaptation. Washington, DC: World Bank.
World Bank. 2004a. An Adaptation Mosaic: A Sample of the Emerging World Bank Work in Climate Change Adaptation. Washington, DC: World Bank. World Bank. 2004b. Look before You Leap: A Risk Management Approach for Incorporating Climate Change Adaptation in World Bank Operations. Washington, DC: World Bank.
World Bank. 2005a. “Disaster Risk Management in a Changing Climate.” World Bank Discussion Paper, World Bank, Washington, DC.
World Bank. 2005b. Managing Agricultural Production Risk: Innovations in Developing Countries. Report 32727-GLB. Washington, DC: Agriculture and Rural Development Department, World Bank.
World Bank. 2006a. Core Implementation Completion Report of Poland Flood Emergency Project (1997-2005). Washington, DC: World Bank.
World Bank. 2006b. “Mainstreaming Hazard Risk Management in Rural Projects.” Hazard Risk Management Team Working Paper Series 13, World Bank, Washington, DC.
World Bank. 2006c. Managing Climate Risk: Integrating Adaptation into World Bank Operations. Washington, DC: World Bank.
147
World Bank. 2006d. “Natural Disaster Hot Spots: A Global Risk Analysis.” Disaster Risk management Series 5, World Bank, Washington, DC.
World Bank. 2006e. “Natural Disaster Hot Spots: Case Studies.” Disaster Risk Management Series 6, World Bank, Washington, DC.
World Bank. 2006f Overcoming Drought: Adaptation Strategies for Andhra Pradesh, India. Directions in Development: Environment and Sustainable Development. Washington, DC: World Bank.
World Bank. 2007a. Development and Growth in Northeast India: The Natural Resources, Water, and Environment Nexus. Strategy Report 36397-IN. Washington, DC: World Bank.
World Bank. 2007b. “The Impact o f Sea Level Rise on Developing Countries: A Comparative Analysis.” Policy Research Working Paper 4136, World Bank, Washington, DC.
‘
148
Related Documents


