Climate change, heat stress and labour productivity: A cost methodology for city economies Hélia Costa, Graham Floater, Hans Hooyberghs, Stijn Verbeke and Koen De Ridder July 2016 Centre for Climate Change Economics and Policy Working Paper No. 278 Grantham Research Institute on Climate Change and the Environment Working Paper No. 248

Welcome message from author
This document is posted to help you gain knowledge. Please leave a comment to let me know what you think about it! Share it to your friends and learn new things together.
Transcript

Climate change, heat stress and labour
productivity: A cost methodology for city
economies
Hélia Costa, Graham Floater, Hans Hooyberghs,
Stijn Verbeke and Koen De Ridder
July 2016
Centre for Climate Change Economics and Policy
Working Paper No. 278
Grantham Research Institute on Climate Change and
the Environment
Working Paper No. 248

The Centre for Climate Change Economics and Policy (CCCEP) was established by the University of Leeds and the London School of Economics and Political Science in 2008 to advance public and private action on climate change through innovative, rigorous research. The Centre is funded by the UK Economic and Social Research Council. Its second phase started in 2013 and there are five integrated research themes:
1. Understanding green growth and climate-compatible development 2. Advancing climate finance and investment 3. Evaluating the performance of climate policies 4. Managing climate risks and uncertainties and strengthening climate services 5. Enabling rapid transitions in mitigation and adaptation
More information about the Centre for Climate Change Economics and Policy can be found at: http://www.cccep.ac.uk. The Grantham Research Institute on Climate Change and the Environment was established by the London School of Economics and Political Science in 2008 to bring together international expertise on economics, finance, geography, the environment, international development and political economy to create a world-leading centre for policy-relevant research and training. The Institute is funded by the Grantham Foundation for the Protection of the Environment and the Global Green Growth Institute. It has nine research programmes:
1. Adaptation and development 2. Carbon trading and finance 3. Ecosystems, resources and the natural environment 4. Energy, technology and trade 5. Future generations and social justice 6. Growth and the economy 7. International environmental negotiations 8. Modelling and decision making 9. Private sector adaptation, risk and insurance
More information about the Grantham Research Institute on Climate Change and the Environment can be found at: http://www.lse.ac.uk/grantham. This working paper is intended to stimulate discussion within the research community and among users of research, and its content may have been submitted for publication in academic journals. It has been reviewed by at least one internal referee before publication. The views expressed in this paper represent those of the author(s) and do not necessarily represent those of the host institutions or funders.

1
Climate change, heat stress and labour productivity: A cost
methodology for city economies
Hélia Costa 1, 2, *
Graham Floater 1, 3
Hans Hooyberghs 4
Stijn Verbeke 4
Koen De Ridder 4
1 LSE Cities, London School of Economics and Political Science, Houghton Street, WC2A 2AE,
United Kingdom 2 Grantham Research Institute for Climate Change and the Environment, London School of
Economics and Political Science, Houghton Street, WC2A 2AE, United Kingdom 3 Centre for Trade and Economic Integration, The Graduate Institute, CH 1211 Geneva, Switzerland
4 Vlaamse Instelling voor Technologisch Onderzoek (VITO), Boeretang 200, 2400 Mol, Belgium
* Corresponding author. Contact: [email protected], +44(0) 20 7107 5027.
Acknowledgments
The work described in this paper has received funding from the European Community’s 7th
Framework Program under Grant Agreements Nos. 308497 (RAMSES) and 308299 (NACLIM).The
work in this paper reflects the authors’ views. The European Commission is not liable for any use that
may be made of the information contained therein. We would like to thank Markus Boettle, Koen De
Ridder, Sam Fankhauser, Alistair Ford, Juergen Kropp, Diego Rybski, Gerardo Sanchez Martinez,
Swenja Surminski, Stijn Verbeke, and participants at the ECCA conference in Copenhagen for
valuable comments. We would like to thank Ryan Waters and Joel Parker at Seneca Consultants for
the underlying research on worker productivity loss functions.
Abstract
Cities are particularly vulnerable to heat waves. Despite this, no comprehensive methodology has
been developed to assess the costs of heat stress on city economies either currently or under future
climate change scenarios. Here, we develop a cost methodology that integrates urban climate
modelling with labour productivity and economic production. It is designed to be tailored by policy
makers and transferable from one city to another. As such it provides a potentially powerful policy
tool for assessing the exposure of different economic sectors and the key mechanisms resulting in
urban production losses under climate change. Results show that the impacts of heat on the urban
economy are highly variable and depend on characteristics of production, such as the elasticity of
substitution between capital and labour, and the relative size of different sectors in the economy. We
estimate that in a warm year in the far future (2081-2100), the total losses to the urban economy could
range between 0.4% of Gross Value Added (GVA) for London and 9.5% for Bilbao in the absence of
adaptation. The averted losses due to adaptation measures such as behaviour change, air conditioning,
ventilation, insulation and solar blinds range from -€114 million to over €2.3 billion. The
methodology demonstrates the substantial impact that climate change could have on different sectors
of the city economy, such as the financial services industry in London.
Keywords: climate change, economic, heat, labour, productivity, worker

2
1 Introduction
The impact of temperature on economic productivity and output has been the subject of research for
over a century (see, for example, Huntington 1915). More recently, global warming and the risk of
climate change have generated renewed interest in the topic (see Dell et al. 2014; Heal and Park 2015
for reviews of the literature).
A wide range of studies at the micro level have demonstrated the impact of heat stress on the
productivity of workers by reducing cognitive and physical performance in the workplace (e.g.
Grether 1973; Wyon 1974; Ramsey 1995; Berger 2014). Research has also been undertaken at the
macro level by estimating the impact of increased temperature on income per capita (e.g. Horowitz
2009). Heal and Park (2015) have provided a model of labour supply decisions under heat stress, as
well as the willingness to pay for mitigation, which they test empirically. They use both country level
data and household data.
Using a different approach, Burke et al. (2015) combined micro and macro evidence to examine total
production in an empirical study for a panel of 166 countries for the period 1960-2010. They found
that productivity increased with temperature until approximately 13 degrees Celsius, and then
decreased from that point on. They estimated a reduction as high as 23% of global gross domestic
product (GDP) due to climate change in 2100, based on the Representative Concentration Pathway
(RCP) 8.5 scenario (IPCC, 2013).
While the macro level relationship between temperature and productivity has been studied mainly at
the national level, cities are particularly vulnerable to increases in heat. Built surfaces in cities are
composed of a high percentage of non-reflective and water-resistant construction materials. In
addition, the lack of vegetation and moisture-trapping soils – that would otherwise provide shade and
contribute to cooling the air – means that temperatures in cities tend to be higher than those of
surrounding areas: the so-called urban heat island (UHI) effect. Furthermore, because urban areas
concentrate people and productive activity, productivity losses in cities can be amplified. As the
number of people living in cities continues to increase,1 so does the potential for adverse effects of
increasing temperatures.
Despite the importance of the urban heat island effect, very little research has been undertaken on the
effects of heat waves on city economies (a notable exception is Sabbag 2013). However, if policy
makers are to implement effective measures to support urban adaptation to heat waves, a stronger
evidence base – combined with city-level policy tools - is needed on the scale of potential damages
and the effectiveness of different adaptation strategies.
Here, we develop a cost methodology that allows researchers and policy makers to assess the costs of
heat stress on the urban economy through reduced labour productivity, along with the cost
effectiveness of different adaptation measures. Our model starts from the micro-level evidence that
heat induces a decrease in productivity at the individual level and shows how this decrease aggregates
into production losses at the macro/city level.
We first estimate hourly productivity loss functions for individual workers at different levels of work
intensity based on ISO standards for recommended hourly work rates at different levels of Wet Bulb
1 The urban population is expected to grow by 1 billion people in less developed countries and by 70 million
people in developed countries by 2030 (UN DESA Population Division 2012, as cited in IPCC 2014).

3
Globe Temperature (WBGT). Work intensities are then attributed to different sectors of the
metropolitan economy depending on the energy levels needed by workers to perform different
activities.
We then define constant elasticity of substitution (CES) production functions for each sector that
specifically encompass the productivity loss functions. The production functions are calibrated and
aggregated at the city level according to specific weights given to each sector. This approach allows
us to assess various characteristics of urban production, including the flexibility of the productive
system in terms of the degree of substitutability between labour and capital, its labour intensity, and
the relative importance of different sectors in the economy.
Finally, we use results from Hooyberghs et al. (2016) on projected indoor climatic conditions in an
example office building for the year 2005 and the periods 2026-2045 and 2081-2100. We use this in
order to compute an estimate of future production costs in three case study cities: Antwerp, Bilbao,
and London.
2 Urban heat cost framework
2.1 Climate models at the city level
We model the influence of urban built-up areas on hourly air temperatures, land surface temperatures,
wind speeds and humidity values using the UrbClim model (see De Ridder et al. 2015; Hooyberghs et
al. 2015).
UrbClim is an urban climate model designed to model the urban climate at a spatial resolution of a
few hundred metres. The model scales large-scale weather conditions down to agglomeration-scale
and computes the impact of urban development on the most important weather parameters. It is
composed of a land surface scheme describing the physics of energy and water exchange between the
soil and the atmosphere in the city, coupled to a 3D boundary layer module, which models the
atmospheric dynamics above the urban agglomeration.
To study the future urban climate, UrbClim has been coupled with the output of an ensemble of
eleven global climate models (GCMs) contained in the Coupled Model Intercomparison Project 5
(CMIP5) archive of the IPCC (IPCC, 2013). From the scenarios identified in the IPCC report, we
consider only the RCP8.5 business as usual scenario. This scenario has a large warming potential, but
still assumes emissions well below business as usual (Peters et al. 2013).
Indoor climate was modelled using an illustrative office building, both equipped with an active
cooling system and without (‘free-running’). In reality, thermal properties of different building types
such as offices, factories and industrial plants will vary greatly, and further research should focus on
different building classes. The building was modelled using the open source EnergyPlus simulation
software (v8.2.0, released September 2014), a building energy analysis software which is managed by
USA National Renewable Energy Laboratory (Crawley et al. 2001). A detailed description of the
modelling is provided in Hooyberghs et al. (2015).

4
2.2 Productivity loss functions
In order to estimate the reduction in productivity of individual workers due to physiological heat
stress, we follow previous researchers working at the population level by using internationally agreed
standards for the length of work breaks at different temperatures above a heat stress threshold (e.g.
Kjellstrom et al. 2009; Jay and Kenny 2010). We use ISO standards as the recognised international
benchmark (ISO, 1989). We then test the robustness of results by comparing the ISO standards with
the US standard provided by the National Institute for Occupational Safety and Health (NIOSH).
These international standards, based on previous physiological studies, use Wet Bulb Globe
Temperature (WBGT) (see Yaglou 1956). The WBGT is a combination of three measurements: the
natural wet bulb temperature (Tnwb, measured with a wetted thermometer exposed to the wind and
heat radiation at the site), the black globe temperature (Tg, measured inside a 150 mm diameter black
globe) and the air temperature (Ta, measured with a normal thermometer shaded from direct heat
radiation). For indoor settings, direct solar radiation to the individuals is negligible. Hence the formula
WBGT = 0.7 Tnwb + 0.3 Ta is used for indoor WBGT, while for outdoors WBGT = 0.7 Tnwb + 0.2
Tg + 0.2 Ta is used (NIOSH, 1986).
We define worker productivity as the proportion of a working day that a worker can perform a job
under different heat conditions (Kjellstrom 2000). The productivity of labour for a given work
intensity is a monotonically non-increasing function of the Wet Bulb Globe Temperature between an
upper and a lower bound. Above the upper WBGT bound, worker productivity is zero, while below
the lower bound, productivity is 1. Hourly productivity loss from WBGT, for a given work intensity
(WI) is given by:
PWI = {1 WBGT < Min
f(WBGT) Min ≤ WBGT ≤ Max0 WBGT > Max
(1)
where f(WBGT) is a monotonically decreasing function of WBGT. These PWI functions are then
aggregated into annual productivity loss. Productivity loss for labour (L) in a given sector s, 𝑎𝐿,𝑠, is a
function of WBGT through its effect on hourly productivity loss across all working hours (h) and
working regimes {1, … , 𝐻}, that is, 𝑎𝐿,𝑠 = ∑ ∑ 𝑃𝑊𝐼,ℎ𝑁𝑊𝐼=1ℎ (𝑊𝐵𝐺𝑇).
We derive a productivity loss function for each sector of the economy, based on an estimate of the
average work intensity (WI) required for work in that sector. Sectors are defined according to the
NACE statistical classification of economic activities used in the European Union. More details on the
estimation of these loss functions are provided in the Online Appendix.
2.3 Production function
We define constant elasticity of substitution (CES) production functions for each sector of the
economy that specifically encompass the productivity loss functions. The CES function is a general
form production function that assumes a constant percentage change in factor proportions from a
percentage change in the marginal rate of technical substitution. We use the standard form (Arrow et
al. 1960). Sectoral production in a given time period t is thus the result of a certain level of the inputs
capital (K) and labour (L) in the following manner:

5
𝑌𝑐,𝑠,𝑡 = 𝑓(𝐿𝑐,𝑠,𝑡, 𝐾𝑐,𝑠,𝑡) = 𝐴𝑠,𝑐[𝜃𝑠(𝑎𝐾,𝑠𝐾𝑐,𝑠,𝑡)𝛾𝑠
+ (1 − 𝜃𝑠)(𝑎𝐿,𝑠𝐿𝑐,𝑠,𝑡)𝛾𝑠
] 1
𝛾𝑠 (2)
where 𝑌𝑐,𝑠,𝑡 is a measure of production in sector s in city c at year t, 𝐴𝑠,𝑐 is total factor productivity by
sector and city, 𝜃𝑠 is the share of capital in sector s, 𝛾𝑠 measures the degree of substitution between
production factors and 𝑎𝐾,𝑠 and 𝑎𝐿,𝑠 are, respectively, the productivity of capital and labour in sector
s. For simplicity we normalise 𝑎𝐾,𝑠 to 1, and 𝑎𝐿,𝑠 is the function of WBGT defined in Section 2.3.
The elasticity of substitution in each sector s is given by 𝜌𝑠 =1
(1−𝛾𝑠).
City production is a sum of sectoral production across all N sectors of the urban economy, and given
by:
𝑌𝑐,𝑡 = ∑ 𝑌𝑐,𝑠,𝑡𝑁𝑠=1 (3)
Thus equation (2) can be rewritten as:
𝑌𝑐,𝑡 = ∑ 𝐴𝑠,𝑐[𝜃𝑠(𝑎𝐾,𝑠𝐾𝑐,𝑠,𝑡)𝛾𝑠
+ (1 − 𝜃𝑠)(𝑎𝐿,𝑠(𝑊𝐵𝐺𝑇ℎ)𝐿𝑐,𝑠,𝑡)𝛾𝑠
] 1
𝛾𝑠𝑁𝑠=1 (4)
which gives us city production as a function of WBGT. Because 𝑎𝐿,𝑠(𝑊𝐵𝐺𝑇) is a decreasing function
of WBGT, and WBGT is increasing in temperature, city production is a decreasing function of
workplace temperature. Precisely how production varies with WBGT depends both on the weight of
each sector on total production, as well as on the parameters of each sector’s production function.
The use of an explicit production function for each sector that is aggregated into city Gross Value
Added (GVA) enriches the analysis, as it allows us to track the impact of different economic
structures on the final effect of heat stress on the urban economy. An overview of the full model is
presented in Figure 1.
Figure 1 Model Overview

6
3 Calibration
We calibrate the model to the economies of Antwerp (Belgium), Bilbao (Spain), and London (United
Kingdom. The cities were chosen as case studies by the European RAMSES consortium, of which this
work is part. By comparing three cities of different sizes, economic structures, and location, we are
able to explore the impact of heat waves in different settings. To reduce the computational costs, only
one reference year and four future years are considered in the economic analysis. We use the year
2005 as the reference year, and for each future period (2026-2045 and 2081-2100) and for each city,
we choose a “cool” year (the year with the minimum productivity loss) and a “warm” year (the year
with the maximum productivity loss).
We use the NACE statistical classification of economic activities used in the European Union. To
measure production we use Gross Value Added (GVA) at the sector level. GVA measures the value of
goods and services produced in each sector of the economy minus intermediate consumption. The
total GVA for the reference period for each of the cities varies from €26 billion in Bilbao to €472
billion in London. The distribution of GVA between sectors also varies considerably. For example,
the manufacturing sector accounts for 21.4% of the GVA of Antwerp but only 5.7% of that of
London, while financial and insurance activities account for 38.6% of the GVA of London but only
18.9% of that of Bilbao.
We examine a range of adaptation measures most likely to be effective, based on Floater et al. (2014)
and Kallaos et al. (2015). First, we estimate losses under behavioural adaptation, in the form of
changing working hours. We use three regimes in which work is performed later in the evening, three
in which work is performed earlier in the morning, and one extreme regime that includes early
morning and late afternoon work.
Second, we estimate the effect of an increase in the rate of mechanical ventilation (from 22m3/h/p, the
legal minimum in Belgium, to 50m3/h/p, corresponding to “Medium Indoor Air Quality” according to
the European standards (EN 13779:2007)). In this scenario, the air in the office building is refreshed
twice an hour.
Third, we examine the use of solar blinds on the outside of the building. These blinds are sun blocking
screens that automatically lower if the irradiance on the windows is higher than a certain threshold
value (in this example set to 75 W/m2), thereby effectively reducing the incoming solar radiation
affecting the building.2 Both the external shading and the increased ventilation rates were previously
suggested by Jentsch et al. (2008).
Finally, we examine the effect of an increase in insulation. We assume a reduction in the heat transfer
through the glazing by decreasing the standard U-value of 1.2W/m²/K to 0.8W/m²/K.
For a detailed description of the calibration of the production functions and the productivity loss
functions please refer to the Online Appendix.
2 Although solar radiation affecting the employees directly is negligible for those working indoors, radiation to
the outside of the building increases indoor temperature.

7
4 Results
4.1 Relative size of losses
Based on the assumptions set out in the methodology, estimated losses due to heat stress and
productivity are non-negligible. In a warm year in the far future (2081-2100) they are estimated to be
around 0.4% of GVA in London, 2.1% in Antwerp, and 9.5% in Bilbao. These correspond to total
losses of around €1.9 billion for London, €670 million in Antwerp, and €2.5 billion in Bilbao, in 2005
prices.
Losses vary greatly across sectors, according to each city’s structure. For example, while in Antwerp
losses in the manufacturing sector amount to 24% of all losses, in London they are only 6%. The
construction sector accounts for only 4% and 6% of losses in Antwerp and Bilbao, respectively, while
it accounts for 18% in London. Losses in the financial sector amount to 24% of total losses in
London, 20% in Antwerp and 19% in Bilbao.
Even though the loss to the London economy is substantial, in relative terms it is the lowest. This is
due to a combination of lower temperatures and an economic structure that is less vulnerable to heat
stress (e.g. London’s large financial sector combines low labour intensity and lower impacts of heat
due to lower work intensities). Figure 2 presents losses in the five years for the three cities.
Figure 2 Heat related GVA losses across time
Note: Warm(Cool) Near(Far) years correspond to the warmest(coolest) years in time periods 2026-2045(2081-2100)

8
4.2 Comparative statistics
Production is monotonically non-increasing in WBGT. However, for constant labour and capital
levels (that is, assuming capital and labour are at their optimal level), the shape of the relationship
changes depending on the capital/labour shares (θ) and the elasticity of substitution (measured by γ).
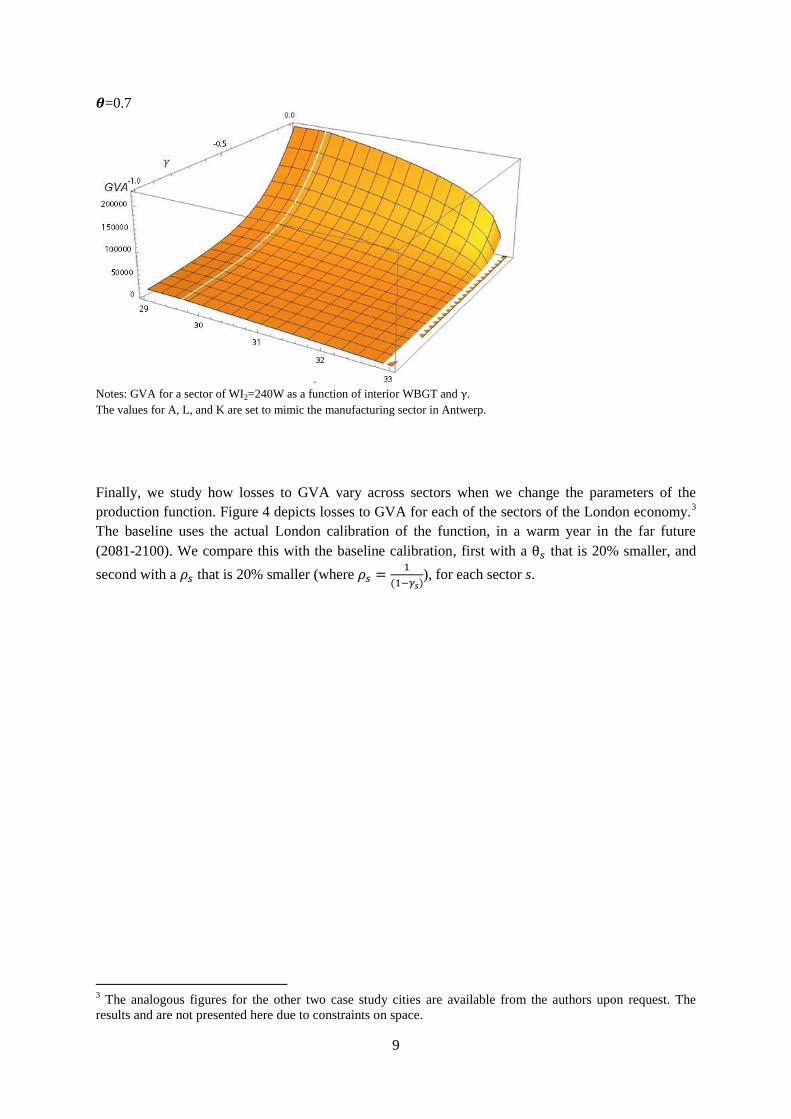
As an example, Figure 3 depicts GVA for a sector of intensity WI2=240W as a function of WBGT and
elasticity, assuming the same temperature is observed for all working hours within each day. GVA is
depicted on the y-axis, WBGT on the x-axis and γ on the z-axis. For expositional purposes, the
production function is calibrated to mimic the manufacturing sector in Antwerp. The first graph uses
capital/labour share θ = 0.4 and the second θ = 0.7. For low values of γ (high elasticity), a decrease
in capital shares reduces the concavity of the function, thereby causing higher decreases in GVA as
temperature increases.
Intuitively, this means that the higher the share of labour input in a given sector, the larger the costs of
heat stress through productivity losses. For a given capital/labour share, decreasing the elasticity of
substitution (i.e., increasing γ) has the same effect. This is intuitive and means that if it is difficult to
substitute labour with capital in production, as labour become less productive, losses increase more
rapidly. This is clear in both figures when comparing the inclinations of the functions at γ = −1 and
γ = 0. Finally, for high values of γ (low elasticity), increasing the share of capital decreases the
responsiveness of GVA to a marginal increase in WBGT for low levels of the latter, but increases the
responsiveness for high levels of WBGT.
Figure 3 GVA as a function of WBGT and elasticity; 𝜽=0.4 and 𝜽=0.7
𝜽=0.4
9
𝜽=0.7
Notes: GVA for a sector of WI2=240W as a function of interior WBGT and γ.
The values for A, L, and K are set to mimic the manufacturing sector in Antwerp.
Finally, we study how losses to GVA vary across sectors when we change the parameters of the
production function. Figure 4 depicts losses to GVA for each of the sectors of the London economy.3
The baseline uses the actual London calibration of the function, in a warm year in the far future
(2081-2100). We compare this with the baseline calibration, first with a θ𝑠 that is 20% smaller, and
second with a 𝜌𝑠 that is 20% smaller (where 𝜌𝑠 =1
(1−𝛾𝑠)), for each sector s.
3 The analogous figures for the other two case study cities are available from the authors upon request. The
results and are not presented here due to constraints on space.

10
Figure 4 Losses to GVA for different parameters; London
Notes: Losses to GVA for the baseline scenario, for a θs that is 20% smaller, and a ρs that is 20% smaller in each sector.
Results for the London economy in a warm year in the far future (2081-2100).
As expected, in all sectors, decreasing capital shares increase losses. Additionally, for all sectors
except agriculture, a decrease in elasticity has an even larger impact on increasing losses. This
highlights the importance of a higher elasticity of substitution in coping with the impact of heat waves
on labour productivity.
The weight of the manufacturing, construction, and public administration and defence sectors in the
total amount of losses decreases for both scenarios, while the weight of all the other sectors increases.
The former are the sectors with the lowest elasticities of substitution, which makes them more
responsive to both changes in capital shares and elasticity itself, as can be inferred from Figure 3.
4.3 Impact of adaptation measures on averted losses
We first focus on behavioural adaptation by estimating the impact of changing working hours in terms
of averted losses for labour productivity. In all three cities, schedules that avoid early afternoon work
tend to result in higher productivity compared to the afternoon schedules. The schedule with the
highest productivity is 7h-11h; 17h-20h for Antwerp and London, and 6h-13h for Bilbao.
Figure 5 presents averted losses from alternative adaptation measures for the three case study cities,
for a warm year in the far future (2081-2100).4 The behavioural change presented is the most efficient
working schedule for each of the three cities. Under the assumptions used, air conditioning, increased
4 Increased insulation resulted in negative benefits (losses) of 114 million euros for Antwerp, and so were left
out of the remainder of the analysis.

11
ventilation and solar blinds all resulted in substantial reductions in productivity losses from heat
stress. It should be noted that the implementation and operating costs of measures have not been
included in these analyses, and these would need to be included if policy makers aimed to examine
cost effectiveness. It is likely that air conditioning, being highly energy intensive, has large operating
costs, in addition to being costly in terms of CO2 production and contribution to further increases in
urban temperature.
For London, solar blinds seem to have almost the same effect of air conditioning without many
obvious drawbacks. For both Antwerp and Bilbao, solar blinds provide similar benefits to those of
increased ventilation, without requiring energy. Furthermore, behavioural change presents itself in
London as a viable alternative to the other measures, as it is able to protect both indoor and outdoor
workers. However, its costs are more difficult to measure than those of other adaptation measures.
Figure 5 Averted losses under alternative adaptation
Note: Warm year in the far future (2081-2100). Values in million €.
Gross averted losses not including implementation costs.
4.4 Robustness: alternative productivity losses
The losses estimated for London in a warm year in the far future (2081-2100) for non-acclimatized
workers are more than twice as high when using US standards than for ISO standards. Figure 6
presents the losses for the three cities and for the three standards, in a warm year in the far future,
across all sectors of the economy. This shows that labour productivity losses are affected substantially
by the standards used. Consequently, further research is required to determine which standards
represent the more realistic estimate of losses.

12
Figure 6 Losses with different heat stress standards
Note: Losses estimated for a warm year in the far future, 2081-2100 (see Section 3 for details). ISO stands for worker
productivity using ISO standards for an average acclimatised worker wearing light clothing, US ac using US standards for
acclimatised workers, and US non-ac using US standards for non-acclimatised workers
5 Discussion
The analysis of the three case study cities demonstrates the substantial impact that climate change
could have on the urban economy. It highlights the exposure of different economic sectors to heat
waves, which result in different magnitudes of costs to the city economy, and the key mechanisms
affecting production losses.
We find that sectors with lower elasticity between labour and capital and those that are more labour
intensive are more exposed to heat waves. This means for example that cities that are highly
dependent on the construction sector, which combines both low elasticity with large labour shares,
could face larger costs.
Furthermore, the methodology allows for a comparison of averted losses from alternative adaptation
measures in the city. An important question arising from the current study is whether effective
adaptation that does not compromise climate mitigation can be designed and implemented. Air
conditioning, for example, can increase outdoor urban temperature when used at a large scale, further
exacerbating the impact of heat stress and potentially further increasing its costs. What is more, unless
the electricity supply is decarbonised, the increase in energy demand will lead to increased carbon
emissions, creating a trade-off between climate adaptation and climate mitigation. This paper can be
used as a basis for further research on these topics.
Our analysis points to behavioural change as a potentially important adaptation measure for the case
of London. Unlike air conditioning, this measure protects both indoor and outdoor work, providing
benefits for cities with large construction sectors. However, an analysis of the costs of behaviour

13
change in the wider economy could be substantial, and while it is beyond the scope of this paper,
further research should be undertaken on the wider costs.
Our results also provide insights into climate impacts on inequality. Poorer individuals tend to provide
non-skilled labour, often in sectors that are more sensitive to temperature stress. Assuming that the
labour market operates with only minor frictions, then wages are set based on worker productivity.
This implies that heat stress could in the long term decrease labour income, in particular where it
already tends to be lower.
Finally, we perform our analysis for cities in Europe with a predominantly oceanic climate. According
to Verisk Maplecroft (2016) the region with the most urban labour at risk due to heat stress over the
next three decades is South East Asia, where they predict 16% of lost labour capacity, followed by the
Caribbean and West Africa. Our methodology to measure the impact across sectors could have even
higher significance in the context of these regions.
If policy makers are to use the cost methodology, it will require tailoring to specific city
circumstances. Assumptions should be refined based on more detailed data held by municipal
governments; examples include more detailed assessments of building types, acclimatisation of
workers over time, and general equilibrium effects across the economy. In addition, the results of the
methodology on labour productivity costs should be combined with other heat-related costs in the
economy, such as direct health costs from mortality and morbidity (Kingsley et al. 2016) and transport
disruptions due to infrastructure damage (Acero et al. 2014). These could have interlinkages and
second order impacts.
In conclusion, the methodology is designed to be accessible to policy makers, readily transferable
from one city to another, and able to be tailored to specific city circumstances with relatively modest
data requirements. As such the methodology provides a potentially powerful policy tool for assessing
the exposure and adaptation options for cities facing increased heat stress from climate change in the
future, both by municipal and regional policy makers, as well as national policy makers who wish to
compare adaptation strategies across different cities.
6 References
Acero, J, Boettle, M, Costa, L, Gudipudi, R, Holsten, A, Kropp, JP, Krummenauer, L, Mendizabal, M,
Olonscheck, M, Prahl, B, Rybski, D, Walther, C (2014) Physical and cost typology for buildings and
infrastructure/project database. Technical Report Deliverable 2.2, RAMSES Project (Grant
Agreement Nr. 308497)
Arrow, KJ, Chenery, HB, Minhas, BS, Solow, RM (1961) Capital-labor substitution and economic
efficiency. Review of Economics and Statistics, 43(3): 225-250
Burke, M, Hsiang, SL, Miguel, E (2015) Global non-linear effect of temperature on economic
production. Nature, 527: 235-289
Crawley DB, Lawrie LK, Winkelmann FC, et al. EnergyPlus: creating a new-generation building
energy simulation program. Energy Build. 2001;33(4):319-331.

14
De Ridder, K, Lauwaet, D, Maiheu, B (2015) UrbClim—A fast urban boundary layer climate model.
Urban Clim., 12, 21–48
Dell, M, Jones, BF, Olken, BA (2014) What do We Learn from the Weather? The New Climate-
Economy Literature. Journal of Economic Literature, 52(3): 740-798
EN 13779:2007 (2007)Ventilation for non-residential buildings. Performance requirements for
ventilation and room-conditioning systems
Floater, G, Bujak, A, Hamill, G, Lee, M (2014) Review of climate change losses and adaptation costs
for city case studies. Technical Report Deliverable 5.1, RAMSES Project (Grant Agreement Nr.
308497)
Grether, WF (1973) Human performance at elevated environmental temperatures. Aerospace
Medicine, 1973
Heal, G, Park, J (2015) Goldilocks Economies? Temperature Stress and the Direct Impacts of Climate
Change. No. w21119, National Bureau of Economic Research.
Hooyberghs H, De Ridder K, Lauwaet D, Lefebvre W, Maiheu B, De Ridder K, González-Aparicio I,
Mendizabal M (2015) Agglomeration-scale urban climate and air quality projections. Technical
Report Deliverable 4.2, RAMSES Project (Grant Agreement Nr. 308497)
Hooyberghs, H, Verbeke, S, Floater, G, Costa, H, De Ridder, K (2016) Influence of climate change on
productivity loss and cooling costs in office buildings. Mimeo
Horowitz, K (2009) The income-temperature relationship in a cross-section of countries and its
implications for global warming. Environmental and Resource Economics, 44(4): 475–493.
Huntington, E (1915) Civilization and Climate. Yale University Press: New Haven and London
IPCC (2013) Climate Change 2013: The Physical Science Basis. Cambridge University Press:
Cambridge, UK; New York, NY, USA
IPCC (2014) Climate Change 2014: Impacts, Adaptation, and Vulnerability, Part A: Global and
Sectoral Aspects. Contribution of Working Group II to the Fifth Assessment Report of the
Intergovernmental Panel on Climate Change, edited by C.B. Field, V.R. Barros, D.J. Dokken et al.
(eds), Cambridge and New York: Cambridge University Press
ISO (1989) Hot environments: estimation of the heat stress on working man, based on the WBGT-
index (wet bulb globe temperature). ISO Standard 7243, Geneva: International Standards
Organization
Jay, O and Kenny, G (2010) Heat exposure in the Canadian workplace. American Journal of
Industrial Medicine, 53(8): 842-853
Jentsch, MF, Bahaj, AS, James, PAB (2008) Climate change future proofing of buildings –
Generation and assessment of building simulation weather files. Energy and Buildings, 40: 2148–
2168

15
Kallaos J, Acre F, Lobaccaro G, Landa N, Ferrara F, Wyckmans A (2015) Adaptation measures and
corresponding indicators for resilient architecture and infrastructure. Technical Report Deliverable
2.4, RAMSES Project (Grant Agreement Nr. 308497)
Kingsley SL, Eliot MN, Gold J, Vanderslice RR, Wellenius GA (2016) Current and projected heat-
related morbidity and mortality in Rhode Island. Environ Health Perspect 124: 460–467
Kjellstrom T (2000) Climate change, heat exposure and labour productivity. Epidemiology, 11: S144
Kjellstrom, T, Holmer, I, Lemke, B (2009) Workplace heat stress, health and productivity – an
increasing challenge for low and middle-income countries during climate change. Global Health
Action, 2: 46-51
NIOSH (1986) Criteria for a recommended standard: occupational exposure to hot environments.
NIOSH Publication No 86-113, Atlanta, GA, USA.
Peters, GP, Andrew, RM, Boden, T, Canadell, JG, Ciais, P, Le Quéré, C, Marland, G, Raupach, MR,
Wilson, C (2013) The challenge to keep global warming below 2ºC, Nature Climate Change, 3: 4-6
Ramsey, JD (1995) Task performance in heat: a review. Ergonomics, 38.1: 154-165
Sabbag, L (2013) Temperature Impacts on Health, Productivity, and Infrastructure in the Urban
Setting, and Options for Adaptation. The Sheltering Series No. 4, Boulder, CO, Institute for Social
and Environmental Transition-International
Verisk Maplecroft (2015) Climate Change and Environmental Risk Analytics 2016 Press release.
Available at: https://maplecroft.com/portfolio/new-analysis/2015/10/28/heat-stress-threatens-cut-
labour-productivity-se-asia-25-within-30-years-verisk-maplecroft/. Accessed on 04-07 2016
Wyon, DP (1974) The effects of moderate heat stress on typewriting performance. Ergonomics, 17(3):
309-18
Yaglou CP, Minard D (1956) Prevention of heat casualties at marine corps training centres. Armed
Services Technical Information Agency Document Service Center AD099920
Related Documents