Abstract—Drought is a natural phenomenon that occurs due to low precipitation conditions. Under the effect of climate change, frequency and magnitude of drought events are aggravated. Drought has negative effects on various fields such as agriculture, environment, ecosystems, economy and society. In this study, drought conditions in Sharjah, United Arab Emirates, were assessed by monthly Rainfall Anomaly Index (RAI) and Aridity Index (AI) using observed and future (projected) rainfall data. Following calculation of the index values, temporal trends were investigated using non-parametric Mann-Kendal trend test. Trend results showed mostly statistically non-significant trends in Sharjah. Only decreasing trends in March was statistically significant for observed RAI values and projected (future) RAI values derived from rainfall data using global climate models including GISS_E2_H, GISS_E2_R and MRI_CGCM3. This study is an outcome of initial stage of a comprehensive drought assessment project, and provides useful information for policymakers in Sharjah, UAE. Index Terms—Climate change, drought, RAI, AI, Sharjah, United Arab Emirates. I. INTRODUCTION Drought is a complex natural phenomenon that results in serious economic, environmental, and social impacts. The effects of drought accumulate slowly and it affects larger geographical area than any other natural hazards [1]. Drought, defined as shortage of water, adversely influences the ecosystems, environment and residents of impacted regions through decrease in crop production, hydropower generation, industry and health. Drought is causing an average $6- $8 billion global damage annually and collectively affecting more people than other natural disasters [2]. There are several reasons behind the drought mechanics. Droughts take place when there are prolonged periods of rainfall non-presence leading decreases in streamflows and water levels in natural and man-made reservoirs. In addition, human activities including deforestation, construction, and agriculture negatively impact the water cycle and cause droughts. Soil moisture levels are also contributor to the drought events [3]. Over the last century, earth is warming in a way, which can’t be explained by natural climate variability. The main Manuscript received May 12, 2019; revised January 2, 2020. Abdullah Gokhan Yilmaz is with University of Sharjah, Australia (e-mail: [email protected]). Arwa Najah and Naseraldin Kayemah are with University of Sharjah, Iraq (e-mail: [email protected], [email protected]). Aysha Hussein and Athra Khamis are with University of Sharjah, United Arab Emirates (e-mail: [email protected], [email protected]). Serter Atabay is with American University of Sharjah, United Kingdom, (e-mail: [email protected]). reason behind current global warming is greenhouse gases (GHG) emission due to human activities. Warming on earth surface results in change in climate variables such as precipitation, humidity and wind speed. Changes in precipitation amount and patterns along with alterations in other climate variables affect streamflows, and consequently flood and drought management. Risk of all types of drought (i.e., meteorological, hydrological and agricultural) increases as temperatures rise and precipitation amount and patterns change due to global warming. Therefore, it is significant to project (future) droughts to develop efficient future drought management policies. There are several studies regarding climate change effects on droughts in the literature. For example, [4] investigated drought hazard in South Korea in the context of climate change. This study reported higher risk levels for future drought frequency and intensity in South Korea. Reference [5] reported that the annual drought severity increases due to climate change are projected in Greece for future time scales of 2020-2050 and 2070-2100. The Middle East and North Africa (MENA) region is one of the most climate change sensitive regions in the world. Reference [6] reported that that the MENA region will likely experience a decrease in rainfall and runoff between 10 and 25%, and between 10 and 40%, respectively, and an increase in evaporation between 5 and 20% by the end of the 21st century. Gulf Cooperation Council (GCC) countries are the most climate change fragile regions in MENA due to very intense water stress and droughts. The United Arab Emirates (UAE) is located in GCC region with annual precipitation below 100 mm. According to climate models, an increase in the UAE’s annual average temperature of around 1°C by 2020, and 1.5 - 2°C by 2040 was projected [7]. Although droughts have major effects on many aspects in UAE, there are only few studies investigating droughts in UAE. Reference [8] showed the effects of El Niño and La Niña on weather patterns and in particular on rainfall in UAE. They adopted effective drought index to quantify droughts, and reported close relationship between El Niño and droughts in UAE. Reference [9] conducted an analysis of rainfall and drought in the UAE, and found that the average drought duration is about 2.8 years in UAE. Also, they reported similar drought patterns over UAE using drought severity index. To the knowledge of authors, there is no study for UAE investigating climate change effects on droughts using projected (future climate data). In this paper, climate change effects on droughts in Sharjah, which is the third largest of the seven emirates in UAE, were investigated through quantification of the droughts by Rainfall Anomaly Index (RAI) and aridity index (AI) using observed and (future) projected rainfall data in Sharjah, and application of trend analysis to observed and projected RAI values. It is expected that this study will make contribution to the climate Climate Change Effects on Drought in Sharjah, UAE Abdullah G. Yilmaz, Arwa Najah, Aysha Hussein, Athra Khamis, Naseraldin Kayemah, and Serter Atabay International Journal of Environmental Science and Development, Vol. 11, No. 3, March 2020 116 doi: 10.18178/ijesd.2020.11.3.1236

Welcome message from author
This document is posted to help you gain knowledge. Please leave a comment to let me know what you think about it! Share it to your friends and learn new things together.
Transcript

Abstract—Drought is a natural phenomenon that occurs due
to low precipitation conditions. Under the effect of climate
change, frequency and magnitude of drought events are
aggravated. Drought has negative effects on various fields such
as agriculture, environment, ecosystems, economy and society.
In this study, drought conditions in Sharjah, United Arab
Emirates, were assessed by monthly Rainfall Anomaly Index
(RAI) and Aridity Index (AI) using observed and future
(projected) rainfall data. Following calculation of the index
values, temporal trends were investigated using non-parametric
Mann-Kendal trend test. Trend results showed mostly
statistically non-significant trends in Sharjah. Only decreasing
trends in March was statistically significant for observed RAI
values and projected (future) RAI values derived from rainfall
data using global climate models including GISS_E2_H,
GISS_E2_R and MRI_CGCM3. This study is an outcome of
initial stage of a comprehensive drought assessment project,
and provides useful information for policymakers in Sharjah,
UAE.
Index Terms—Climate change, drought, RAI, AI, Sharjah,
United Arab Emirates.
I. INTRODUCTION
Drought is a complex natural phenomenon that results in
serious economic, environmental, and social impacts. The
effects of drought accumulate slowly and it affects larger
geographical area than any other natural hazards [1]. Drought,
defined as shortage of water, adversely influences the
ecosystems, environment and residents of impacted regions
through decrease in crop production, hydropower generation,
industry and health. Drought is causing an average $6- $8
billion global damage annually and collectively affecting
more people than other natural disasters [2].
There are several reasons behind the drought mechanics.
Droughts take place when there are prolonged periods of
rainfall non-presence leading decreases in streamflows and
water levels in natural and man-made reservoirs. In addition,
human activities including deforestation, construction, and
agriculture negatively impact the water cycle and cause
droughts. Soil moisture levels are also contributor to the
drought events [3].
Over the last century, earth is warming in a way, which
can’t be explained by natural climate variability. The main
Manuscript received May 12, 2019; revised January 2, 2020.
Abdullah Gokhan Yilmaz is with University of Sharjah, Australia (e-mail:
Arwa Najah and Naseraldin Kayemah are with University of Sharjah, Iraq
(e-mail: [email protected], [email protected]).
Aysha Hussein and Athra Khamis are with University of Sharjah, United
Arab Emirates (e-mail: [email protected],
Serter Atabay is with American University of Sharjah, United Kingdom,
(e-mail: [email protected]).
reason behind current global warming is greenhouse gases
(GHG) emission due to human activities. Warming on earth
surface results in change in climate variables such as
precipitation, humidity and wind speed. Changes in
precipitation amount and patterns along with alterations in
other climate variables affect streamflows, and consequently
flood and drought management. Risk of all types of drought
(i.e., meteorological, hydrological and agricultural) increases
as temperatures rise and precipitation amount and patterns
change due to global warming. Therefore, it is significant to
project (future) droughts to develop efficient future drought
management policies.
There are several studies regarding climate change effects
on droughts in the literature. For example, [4] investigated
drought hazard in South Korea in the context of climate
change. This study reported higher risk levels for future
drought frequency and intensity in South Korea. Reference [5]
reported that the annual drought severity increases due to
climate change are projected in Greece for future time scales
of 2020-2050 and 2070-2100.
The Middle East and North Africa (MENA) region is one
of the most climate change sensitive regions in the world.
Reference [6] reported that that the MENA region will likely
experience a decrease in rainfall and runoff between 10 and
25%, and between 10 and 40%, respectively, and an increase
in evaporation between 5 and 20% by the end of the 21st
century. Gulf Cooperation Council (GCC) countries are the
most climate change fragile regions in MENA due to very
intense water stress and droughts. The United Arab Emirates
(UAE) is located in GCC region with annual precipitation
below 100 mm. According to climate models, an increase in
the UAE’s annual average temperature of around 1°C by
2020, and 1.5 - 2°C by 2040 was projected [7].
Although droughts have major effects on many aspects in
UAE, there are only few studies investigating droughts in
UAE. Reference [8] showed the effects of El Niño and La
Niña on weather patterns and in particular on rainfall in UAE.
They adopted effective drought index to quantify droughts,
and reported close relationship between El Niño and droughts
in UAE. Reference [9] conducted an analysis of rainfall and
drought in the UAE, and found that the average drought
duration is about 2.8 years in UAE. Also, they reported
similar drought patterns over UAE using drought severity
index. To the knowledge of authors, there is no study for
UAE investigating climate change effects on droughts using
projected (future climate data). In this paper, climate change
effects on droughts in Sharjah, which is the third largest of
the seven emirates in UAE, were investigated through
quantification of the droughts by Rainfall Anomaly Index
(RAI) and aridity index (AI) using observed and (future)
projected rainfall data in Sharjah, and application of trend
analysis to observed and projected RAI values. It is expected
that this study will make contribution to the climate
Climate Change Effects on Drought in Sharjah, UAE
Abdullah G. Yilmaz, Arwa Najah, Aysha Hussein, Athra Khamis, Naseraldin Kayemah, and Serter
Atabay
International Journal of Environmental Science and Development, Vol. 11, No. 3, March 2020
116doi: 10.18178/ijesd.2020.11.3.1236

change-drought literature as well as to the successful drought
management in the study area.
II. STUDY AREA AND DATA
The Sharjah Emirate in UAE has a total population of 1.4
million and covers an area of approximately 2,600 km2. It
falls on coordinates of 25.3°N 55.5°E and located along the
southern coast of the Arabian Gulf on the Arabian Peninsula.
Sharjah is classified as a dessert with hot climate and
characterized with its great arid land. Sharjah has mean
temperature of 18–34°C. Rain in Sharjah occur lightly and
infrequently with an average of 100 mm/year. The rainfall
season occurs from November to March, and about
two-thirds of the annual rainfall concentrates between
February and March. Location of Sharjah is shown in Fig. 1.
Fig. 1. Location of Sharjah and Sharjah International Airport station.
Two types of monthly precipitation data sets were used in
this study:
Observed monthly rainfall data over the period of 1981 to
2015.
Future (projected) monthly rainfall data from Global
Climate Models (GCMs) for two different periods: near
future for the period of 2030-2064 and far future for the
period of 2065-2099.
Observed data were received from weather observation
station at the Sharjah International Airport. Future data
projections were obtained from four GCMs including NASA
Goddard Institute for Space Sciences E2 models
(GISS_E2_H and GISS_E2_R), Meteorological Research
Institute model (MRI_CGCM3), and atmospheric coupled
chemistry version of the MIROC_ESM model
(MIROC_ESM_CHEM) (as recommended by [10]) listed in
Coupled Model Intercomparing Project phase 5 (CMIP5)
platform under different scenarios (Representative
Concentration Pathways (RCPs)) including RCPs 2.6, 4.5, 6
and 8.5. RCP 2.6 represents the lowest GHG emission
scenario, whereas RCP 8.5 represents the highest GHG
emission scenario. Detailed explanation of RCPs can be seen
in [11].
III. METHODOLOGY
There are two main parts of the methodology: 1)
calculation of monthly RAIs and AIs using observed and
projected rainfall data, and 2) trend analysis of calculated
monthly RAI values.
A. Rainfall Anomaly Index
Drought indices are essential elements for an efficient
drought monitoring system. RAI is one of the commonly
adopted indices in the literature due to the advantages offered
by RAI for analyzing drought. RAI transforms information of
climatic anomalies in an easy way and allow the assessing
climatic anomalies in terms of their intensity, duration,
frequency and spatial extent [2].
The RAI is a meteorological drought index originally
designed by [12], [13]. The RAI strength lies in that it is easy
to calculate as it only requires one variable, precipitation, to
classify the drought occurrence and severity. It can be
calculated in monthly, seasonal or annual time scale. RAI is
particularly successful to detect persistence of drought
periods [14], and therefore it was adopted by several studies
([15], [16]). The RAI is categorized according to a
classification based on its value, which determines the
severity of the case from extremely wet to extremely dry as
shown in Table I.
TABLE I: RAI CLASSIFICATION
Index Value Character of the weather
4 or more Extremely wet
3 to 3.99 Very wet
2 to 2.99 Moderately wet
1 to 1.99 Slightly wet
0.99 to -0.99 Near normal
-1 to -1.99 Mild drought
-2 to -2.99 Moderate drought
-3 to -3.99 Severe drought
-4 or less Extreme drought
RAI was computed for positive anomalies using (1) and for
negative anomalies using (2).
(1)
(2)
In Equations (1,2), RF is the actual rainfall for a given time
scale, MRF is mean of the total length of record, MH10 is mean
of the ten highest values of rainfall on record, and ML10 is the
ten lowest values of rainfall on record.
B. Aridity Index
One more drought index used in this paper as a benchmark
is the aridity index (AI). AI was developed by UNESCO [17]
and adopted by several studies to categorize the arid lands
[18]. AI represents the aridity in a ratio of precipitation (P) to
potential evapotranspiration (PET) and calculated by:
(3)
In this study, PET is calculated using Thornthwaite method
as done in [19]. Thornthwaite method uses average monthly
International Journal of Environmental Science and Development, Vol. 11, No. 3, March 2020
117
temperature to calculate PET. The AI index classification is
shown in Table II.
TABLE II: AI CLASSIFICATION [20]
Index Value Character of the weather
0.03 or less Hyper-arid
0.03 to 0.20 Arid
0.20 to 0.50 Semi-arid
0.50 to 0.65 Dry sub-humid
C. Trend Analysis
After calculations of RAI and AI values using observed,
and projected near and far future data, non-parametric
Mann-Kendal (MK) test was applied to detect trends in this
study. It should be noted that trend analysis was applied only
for RAI values for the sake of brevity. Non-parametric tests
are usually applied for hydro-meteorological data trend
analysis, since hydro-meteorological data mostly follow
non-normal distribution [10]. The MK test was applied to
detect trends in observed and projected RAIs, since MK test
was used commonly in hydro-meteorological data trend
analysis (e.g., [21-[24]).
MK is a rank based nonparametric test that was developed
to detect linear or non-linear trends [25]. The z test statistics
of MK test can be calculated by:
z= {
(4)
where S is calculated by
S=∑ ∑
(5)
where,
= {
(6)
In Equation (5), xj– xk is the sequential data values, and n is
the number of observations. The Var(S) can be calculated by:
Var(S)=
(7)
In the MK test, positive z-statistics values indicate
increasing trends, whereas negative values indicate
decreasing trends. If the calculated z-statistics is higher than
the critical value at any significance level (i.e., 0.1, 0.05,
0.01), the trend is considered statistically significant at the
same significance level. It should be noted that trend analysis
was applied to monthly index values in this study.
IV. RESULTS AND DISCUSSION
A. RAI and AI Results
TABLE III: MONTHLY MEAN OBSERVED AND FUTURE RAI VALUES
Model Name
Future
Period RCP Jan Feb Mar Apr May Jun Jul Aug Sep Oct Nov Dec
GISS_E2_H
Near
future
2.6 -1.0 -1.1 -0.6 -1.8 -2.9 -3.0 -2.8 -3.0 -2.9 -2.9 -2.4 -1.0
4.5 -1.1 -1.3 -0.5 -1.8 -2.9 -3.0 -2.8 -3.0 -2.9 -2.9 -2.3 -1.0
6 -0.9 -1.2 -0.8 -1.9 -2.9 -3.0 -2.8 -3.0 -2.9 -2.9 -2.2 -0.9
8.5 -1.1 -1.2 -0.6 -1.7 -2.8 -3.0 -2.8 -3.0 -2.9 -2.8 -2.3 -1.0
Far
future
2.6 -1.2 -1.1 -0.4 -1.7 -2.9 -3.0 -2.8 -3.0 -2.9 -2.9 -2.3 -1.3
4.5 -1.3 -0.9 -0.7 -1.9 -2.9 -3.0 -2.8 -3.0 -2.9 -2.9 -2.2 -1.1
6 -1.2 -0.9 -0.7 -1.8 -2.9 -3.0 -2.8 -3.0 -2.9 -2.9 -2.3 -1.0
8.5 -1.2 -0.8 -0.9 -1.8 -2.9 -3.0 -2.8 -3.0 -2.9 -2.8 -2.3 -1.1
GISS_E2_R
Near
future
2.6 -0.7 -0.9 -1.1 -1.9 -2.9 -3.0 -2.8 -3.0 -2.9 -2.8 -2.3 -1.1
4.5 -1.1 -0.9 -0.6 -1.8 -2.9 -3.0 -2.8 -3.0 -3.0 -2.8 -2.3 -1.5
6 -0.9 -0.6 -1.1 -2.1 -2.9 -3.0 -2.8 -3.0 -2.9 -2.8 -2.3 -1.2
8.5 -1.0 -1.0 -0.8 -1.7 -2.9 -3.0 -2.7 -3.0 -2.9 -2.9 -2.3 -1.0
Far
future
2.6 -1.2 -0.8 -0.6 -1.8 -2.9 -3.0 -2.8 -3.0 -3.0 -2.9 -2.2 -1.3
4.5 -1.0 -0.6 -1.6 -1.6 -2.9 -3.0 -2.7 -3.0 -2.9 -2.9 -2.2 -1.2
6 -0.7 -0.9 -0.8 -2.3 -2.9 -3.0 -2.8 -3.0 -2.9 -2.9 -2.3 -1.2
8.5 -0.8 -1.2 -1.0 -2.3 -2.9 -3.0 -2.8 -3.0 -3.0 -2.9 -2.3 -0.8
MIROC_ESM_CHEM
Near
future
2.6 -0.9 -1.1 -0.7 -1.6 -2.9 -3.0 -2.8 -3.0 -2.9 -2.9 -2.4 -1.2
4.5 -1.1 -1.0 -0.6 -1.5 -2.8 -3.0 -2.8 -3.0 -2.9 -2.9 -2.5 -1.2
6 -1.0 -0.8 -0.7 -1.6 -2.9 -3.0 -2.8 -3.0 -2.9 -2.9 -2.5 -1.4
8.5 -1.0 -1.1 -0.5 -1.4 -2.8 -3.0 -2.7 -3.0 -2.9 -2.9 -2.4 -1.5
Far
future
2.6 -1.1 -1.0 -0.5 -1.5 -2.9 -3.0 -2.7 -3.0 -2.9 -2.9 -2.5 -1.4
4.5 -1.0 -1.1 -0.5 -1.5 -2.8 -3.0 -2.7 -3.0 -2.9 -2.9 -2.4 -1.3
6 -1.1 -0.9 -0.6 -1.6 -2.8 -3.0 -2.8 -3.0 -2.9 -2.9 -2.6 -1.3
8.5 -1.1 -1.2 -0.5 -1.4 -2.8 -3.0 -2.7 -3.0 -2.9 -2.9 -2.5 -1.3
MRI_CGCM3
Near
future
2.6 -0.8 -0.9 -1.0 -2.2 -2.9 -3.0 -2.8 -3.0 -2.9 -2.9 -2.1 -1.0
4.5 -0.8 -0.9 -1.0 -2.1 -2.9 -3.0 -2.8 -3.0 -2.9 -2.9 -2.1 -1.0
6 -0.9 -1.0 -0.6 -2.1 -2.9 -3.0 -2.8 -3.0 -2.9 -2.9 -2.1 -1.1
8.5 -0.8 -0.9 -1.0 -2.2 -2.9 -3.0 -2.8 -3.0 -2.9 -2.9 -2.1 -1.0
Far
future
2.6 -1.0 -1.0 -0.9 -2.0 -2.9 -3.0 -2.8 -3.0 -2.9 -2.9 -2.1 -0.9
4.5 -0.8 -0.9 -1.0 -1.9 -2.9 -3.0 -2.8 -3.0 -2.9 -2.8 -2.0 -1.1
6 -1.0 -1.0 -1.0 -2.0 -2.9 -3.0 -2.8 -3.0 -2.9 -2.9 -2.1 -0.8
8.5 -1.0 -0.9 -0.8 -2.2 -2.9 -3.0 -2.8 -3.0 -2.9 -2.9 -2.1 -0.9
Observed -0.9 -0.9 -0.8 -1.8 -2.9 -3.0 -2.8 -3.0 -2.9 -2.9 -2.2 -1.1
International Journal of Environmental Science and Development, Vol. 11, No. 3, March 2020
118

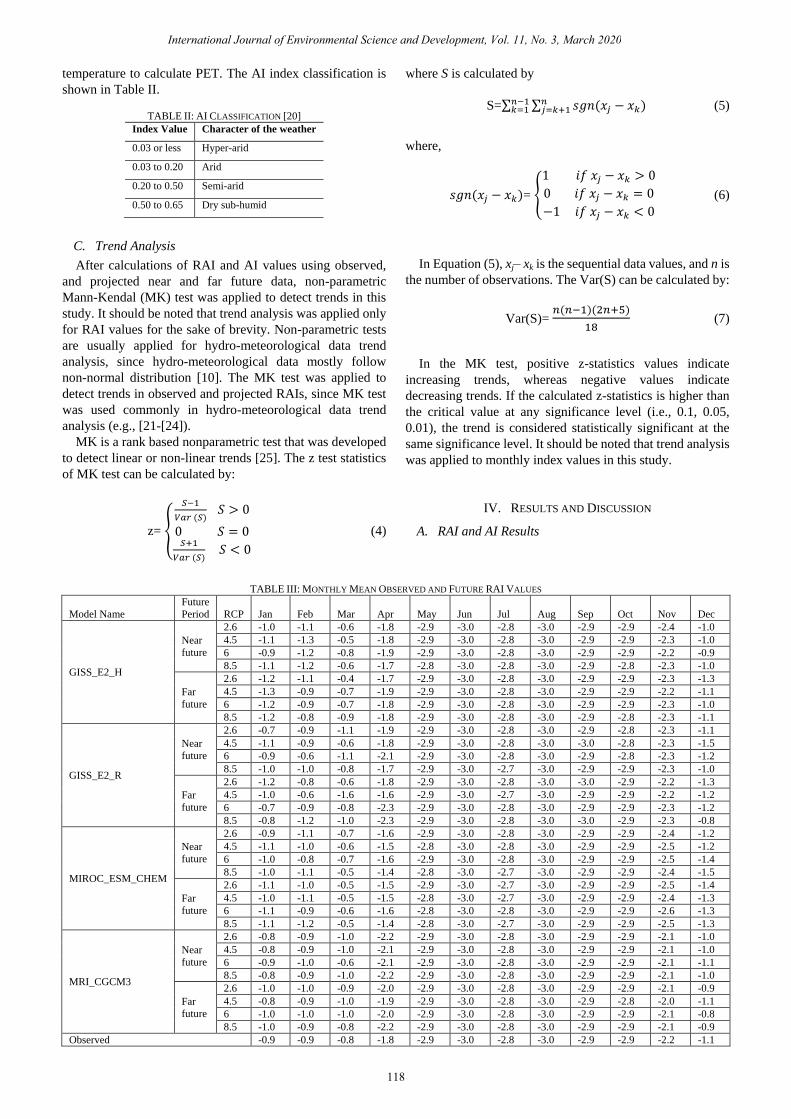
Table III shows monthly average RAI values for observed,
near and far future for four different models (i.e.,
GISS_E2_H, GISS_E2_R, MIROC_ESM_CHEM,
MRI_CGCM3) under four RCPs (2.6, 4.5, 6, 8.5), whereas
Table IV illustrates observed and projected (using data from
three global climate models including GISS_E2_H,
GISS_E2_R and MRI_CGCM3) AI values.
As can be seen from Table III, the RAI values vary
between -0.4 and -3. According to the classification (shown
in Table I), RAI range indicates near normal conditions to
severe drought. The wettest month with the value of -0.4 is
March in the near future according to GISS_E2_H model,
and the lowest RAI value, which indicates a severe drought,
is -3 for June in all years (near and far future) for all models
and all RCPs, since June has zero precipitation for all years.
Fig. 2. Projected and observed RAI values in months December and March.
International Journal of Environmental Science and Development, Vol. 11, No. 3, March 2020
119
TABLE IV: MONTHLY MEAN OBSERVED AND FUTURE AI VALUES
Model Name
Future
Period RCP Jan Feb Mar Apr May Jun Jul Aug Sep Oct Nov Dec
GISS_E2_H
Near
future
2.6 0.8 0.9 1.2 0.2 0.0 0.0 0.0 0.0 0.0 0.0 0.1 0.8
4.5 0.7 0.7 1.4 0.2 0.0 0.0 0.0 0.0 0.0 0.0 0.1 0.7
6 0.8 0.8 1.0 0.1 0.0 0.0 0.0 0.0 0.0 0.0 0.1 0.8
8.5 0.5 0.6 1.0 0.2 0.0 0.0 0.0 0.0 0.0 0.0 0.1 0.6
Far
future
2.6 0.7 1.2 1.9 0.3 0.0 0.0 0.0 0.0 0.0 0.0 0.1 0.7
4.5 0.4 1.1 1.1 0.1 0.0 0.0 0.0 0.0 0.0 0.0 0.1 0.6
6 0.8 0.7 1.0 0.1 0.0 0.0 0.0 0.0 0.0 0.0 0.1 0.7
8.5 0.3 0.8 0.6 0.1 0.0 0.0 0.0 0.0 0.0 0.0 0.0 0.4
GISS_E2_R
Near
future
2.6 1.0 0.7 0.3 0.0 0.0 0.0 0.0 0.0 0.0 0.0 0.0 0.5
4.5 0.7 1.1 0.7 0.1 0.0 0.0 0.0 0.0 0.0 0.0 0.0 0.4
6 0.8 1.1 0.3 0.0 0.0 0.0 0.0 0.0 0.0 0.0 0.0 0.4
8.5 0.6 0.5 0.4 0.1 0.0 0.0 0.0 0.0 0.0 0.0 0.0 0.5
Far
future
2.6 0.5 0.8 0.6 0.1 0.0 0.0 0.0 0.0 0.0 0.0 0.0 0.4
4.5 0.6 0.6 0.4 0.0 0.0 0.0 0.0 0.0 0.0 0.0 0.0 0.3
6 1.1 0.7 0.4 0.0 0.0 0.0 0.0 0.0 0.0 0.0 0.0 0.4
8.5 0.8 0.4 0.3 0.0 0.0 0.0 0.0 0.0 0.0 0.0 0.0 0.6
MRI_CGCM3
Near
future
2.6 0.7 0.6 0.4 0.0 0.0 0.0 0.0 0.0 0.0 0.0 0.1 0.5
4.5 0.7 0.6 0.4 0.0 0.0 0.0 0.0 0.0 0.0 0.0 0.1 0.5
6 0.5 0.5 0.3 0.0 0.0 0.0 0.0 0.0 0.0 0.0 0.1 0.5
8.5 0.7 0.5 0.3 0.0 0.0 0.0 0.0 0.0 0.0 0.0 0.1 0.5
Far
future
2.6 0.6 0.6 0.4 0.0 0.0 0.0 0.0 0.0 0.0 0.0 0.1 0.6
4.5 0.5 0.5 0.3 0.0 0.0 0.0 0.0 0.0 0.0 0.0 0.1 0.4
6 0.5 0.5 0.3 0.0 0.0 0.0 0.0 0.0 0.0 0.0 0.1 0.7
8.5 0.6 0.5 0.2 0.0 0.0 0.0 0.0 0.0 0.0 0.0 0.1 0.5
Observed 0.7 0.7 0.5 0.1 0.0 0.0 0.0 0.0 0.0 0.0 0.0 0.5

No clear pattern was found based on comparison between
mean monthly RAI values derived for future periods and
observed monthly RAI values. Also, comparison between far
future RAI values with near future RAI values resulted in no
clear pattern. It is worth to note that January and August are
the months almost all models (four GCMs) resulted similar
results. In January, far future RAI values are higher than near
future RAI values, whereas in August, near future RAI values
are higher than far future RAI values almost for all models
and RCPs. Tabulated information in Table I, was shown
graphically in Fig. 2 for months December and March (as an
example).
As shown in Table IV, for the months from May to
September, observed AI (derived using observed data)
indicated hyper-arid conditions. In future, there will be no
change in these months in terms of aridity (will stay as hyper
-arid) according to AI projections. Winter season months in
future will stay as humid based on projected AIs (similar to
observed AIs) with minor exceptions including the December
month (according to GISS_E2_R) and January month
(according to GISS_E2_H for far future under RCP 8.5),
which will be semi-arid. GISS_E2_H and GISS_E2_R
models will give more humid conditions in comparison with
MRI_CGCM3 model. AIs showed that, in general, there will
no dramatic pattern change in drought conditions in future.
B. Trend Analysis Results
TABLE V: MK Z-STATISTICS FOR MONTHLY RAI VALUES
Jan Feb Mar Apr May Jun Jul Aug Sep Oct Nov Dec
Observed 0.98 -1.51 -2.357 (0.95) -0.82 -0.60 -0.58 0.00 0.28 -0.01 1.32 -0.57
GIS
S_
E2
_H
RCP 2.5 0.23 -0.90 -1.35 -0.22 -0.44 N/A -0.44 -0.02 0.20 -0.02 1.07 -0.84
RCP 4.5 0.14 -0.38 -2.038 (0.95) -0.74 -0.42 N/A -0.40 0.02 0.22 -0.01 1.15 -0.60
RCP 6 -0.06 -0.63 -1.55 -0.29 -0.43 N/A -0.44 0.02 0.20 -0.01 0.75 -0.63
RCP 8.5 0.34 -0.51 -0.21 -0.86 -0.44 N/A -0.39 0.02 0.22 -0.01 0.77 -0.61
GIS
S_
E2
_R
RCP 2.5 -0.68 -0.90 -1.01 -0.23 -0.43 N/A -0.45 0.02 0.07 -0.02 0.89 -0.96
RCP 4.5 1.04 -0.64 -3.123 (0.01) -0.24 -0.44 N/A -0.38 0.02 0.22 -0.02 1.22 0.13
RCP 6 1.21 -1.53 -0.92 -1.05 -0.44 N/A -0.40 0.02 0.20 -0.36 0.87 -0.57
RCP 8.5 1.18 -1.14 -2.109 (0.05) -1.64 -0.42 N/A -0.42 0.02 0.07 -0.02 0.97 -0.05
MIR
OC
_E
SM
_
CH
EM
RCP 2.5 0.35 -0.81 -1.40 -0.38 -0.42 N/A -0.40 0.02 0.22 -0.01 0.75 -0.87
RCP 4.5 0.99 -1.23 -1.49 -0.47 -0.42 N/A -0.40 0.02 0.21 -0.01 1.14 -0.82
RCP 6 0.40 -1.27 -1.46 -0.52 -0.42 N/A -0.44 0.02 0.20 -0.02 0.79 -0.18
RCP 8.5 0.55 -1.31 -1.53 -0.78 -0.44 N/A -0.44 0.02 0.22 -0.02 0.79 -0.01
MR
I_C
GC
M3
RCP 2.5 0.27 -1.26 -1.43 -0.24 -0.42 N/A -0.45 0.02 0.22 -0.02 0.83 -0.12
RCP 4.5 0.66 -0.92 -1.49 -0.21 -0.44 N/A -0.44 0.02 0.22 -0.01 1.03 -0.59
RCP 6 0.50 -1.27 -2.297 (0.05) -0.26 -0.44 N/A -0.44 -0.02 0.20 -0.02 1.04 0.01
RCP 8.5 0.37 -1.23 -1.26 -0.72 -0.42 N/A -0.45 -0.02 0.21 -0.01 1.05 -0.21
Fig. 3. RAI time series plots for selected months.
-4-3-2-101234
1980 1990 2000 2010
RA
I
Year
(d) Observed RAI Trend in
-4
-2
0
2
4
1980 1990 2000 2010
RA
I
Year
(b) Observed RAI Trend in February
-4
-3
-2
-1
0
1
2
3
1980 1990 2000 2010
RA
I
Year
(a) Observed RAI Trend in January
-4
-2
0
2
4
1980 1990 2000 2010
RA
I
Year
(c) Observed RAI Trend in March
International Journal of Environmental Science and Development, Vol. 11, No. 3, March 2020
120

As explained in the Methodology section, MK trend test
was applied to RAI values in this study. In Table V, MK test
z-statistics were shown for monthly observed and future
(near and far future were analyzed as a single future time
series data) RAI values.
In Table V, z-statistics indicating statistically significant
trends were shown in bold characters along with significance
levels (0.05 [95% significance] and 0.01 [99% significance]).
It should be noted that in June no z-statistics value was found,
since this monthly is completely dry both for observed and
projected future RAIs. Also, for other dry months, MK
z-statistics did not show much variation over years.
Considering MK is a rank based non-parametric test,
z-statistics are not very reliable for the dry months from May
to October.
As can be seen in Table V, decreasing observed and future
RAI trends were found in February, March, April and
December months, whereas increasing RAI trends were
detected in November and January months. However, only
decreasing RAI trends in March for observed, GISS_E2_H
(under RCP 4.5), GISS_E2_R (under RCPs 4.5 and 8.5), and
MRI_CGCM3 (under RCP 6) were statistically significant.
Fig. 3 illustrates time series plots and trend lines for
observed RAI values in January, February, March and
December months.
As explained before, February and March are the wettest
months in Sharjah, and decreasing trends were detected for
RAI values in February and March both for observed and
future periods, and some of the detected decreasing trends in
March is statistically significant. Decreasing trends in RAIs
in wet months indicate further drying in wet season in
Sharjah. This may cause significant adverse effects on
agriculture activities in Sharjah. More negative RAI values
(caused by decreased precipitation) results in lower recharge
of groundwater aquifers in Sharjah.
V. CONCLUSIONS
In this study, drought intensity in Sharjah were assessed
using RAI and AI derived from monthly observed and
projected (through GCMs) rainfall data. The projections were
made for two different future periods: near future for the
period of 2030- 2064 and far future for the period of
2065-2099 under different greenhouse gas emission
scenarios (RCPs). Following calculation of observed and
projected RAIs, MK trend test was used to detect observed
and projected RAI trends.
No clear relationship was found based on comparison of
observed and projected data. It is not possible to state that
future will be drier or wetter for all months. However,
decreasing trends in RAIs (drier future) were detected for
wettest two months (February and March). Drier conditions
in February and March months may cause significant
problems in particular for agricultural activities.
It should be noted that this study is an initial stage of a
project. In further steps, more complex drought indices,
considering streamflow and soil moisture data in calculations,
will be applied. In this study, observed data from a single
station was used. Data from more observation stations over
UAE will be used and drought assessment will be conducted
for entire UAE in future steps of the project. This study
provides useful information to policymakers in UAE for
better drought management in Sharjah, UAE.
CONFLICT OF INTEREST
The authors declare no conflict of interests.
Abdullah G. Yilmaz supervised the analysis and wrote the
paper, Arwa Najah, Aysha Hussein and Athra Khamis
contributed in data collecting and analysis, Naseraldin
Kayemah and Serter Atabay assisted in reviewing the paper.
REFERENCES
[1] M. Azarakhshi, M. Mohammad, A. Hosein, and A. Hasan,
“Assessment of the Palmer drought severity index in arid and semi arid
rangeland: (Case study: Qom province, Iran),” pp. 77-86, Dec. 2011.
[2] D. A. Wilhite, “Drought as a natural hazard: concepts and definitions,”
Drought: A Global Assessment, vol. 1, Routledge, New York, pp. 1–18,
2000.
[3] R. Restuccia, 5 Causes of Drought, 2016.
[4] W. H. Nam, M. J. Hayes, M. D. Svoboda, T. Tadesse, and D. A.
Wilhite, “Drought hazard assessment in the context of climate change
for South Korea,” Agricultural Water Management, vol. 160, pp.
106-117, Oct. 2015.
[5] A. Loukas, L. Vasiliades, and J. Tzabiras, “Climate change effects on
drought severity,” Advances in Geosciences, vol. 17, pp. 23-29, June
2008.
[6] World Bank, Water in the Arab World: Management Perspectives and
Innovations, 2009.
[7] MOCCAE, National Climate Change Plan of the United Arab
Emirates 2017-2050, Abu Dhabi, 2017.
[8] M. AlEbri, H. Arman, and A. Shalaby, “The impact of El Niño and La
Niña on the United Arab Emirates (UAE) rainfall,” General Scientific
Researches, vol. 4, pp. 5-10, 2016.
[9] M. Sherif, M. Almulla, A. Shetty, and R. K. Chowdhury, “Analysis of
rainfall, PMP and drought in the United Arab Emirates,” International
Journal of Climatology, vol. 34, pp. 1318-1328, 2014.
[10] A. G. Yilmaz and A. G. Shabib, “Rainfall and air temperature
projections for Sharjah City, United Arab Emirates,” International
Journal of Water, vol. 13, no. 1, pp. 60-79, 2019.
[11] I. Jubb, P. Canadell, and M. Dix, “Representative concentration
pathways (RCPs),” Australian Government, Department of the
Environment, 2013.
[12] M. P. Rooy, “A rainfall anomaly index (RAI) independent of time and
space,” Notos, vol. 14, pp. 43-48, 1965.
[13] J. Keyantash and J. A. Dracup, “The quantification of drought: an
evaluation of drought indices,” Bulletin of the American
Meteorological Society, vol. 83, pp. 1167-1180, Aug. 2002.
[14] K. Tilahun, “Analysis of rainfall climate and evapo-transpiration in
arid and semi-arid regions of Ethiopia using data over the last half a
century,” Journal of Arid Environments, vol. 64, pp. 474-487, Feb.
2006.
[15] A. Loukas, L. Vasiliades, and N. R. Dalezios, “Intercomparison of
meteorological drought indices for drought assessment and monitoring
in Greece,” in Proc. the International Conference on Environmental
Science and Technology, vol. 2, pp. 484-491, Sep. 2003.
[16] D. Dutta, A. Kundu, N. R. Patel, S. K. Saha, and A. R. Siddiqui,
“Assessment of agricultural drought in Rajasthan (India) using remote
sensing derived Vegetation Condition Index (VCI) and Standardized
Precipitation Index (SPI),” The Egyptian Journal of Remote Sensing
and Space Science, vol. 18, pp. 53-63, Jun. 2015.
[17] UNESCO, “Map of the world distribution of arid regions,” MAB
Techn., Note 7, 1979.
[18] D. Onder, M. Aydin, S. Berberoğlu, S. Onder, and T. Yano. “The use
of aridity index to assess implications of climatic change for land cover
in Turkey,” Turkish Journal of Agriculture and Forestry, vol. 33, pp.
305-314, Aug. 2009.
[19] P. T. Nastos, N. Politi, and J. Kapsomenakis. “Spatial and temporal
variability of the Aridity Index in Greece,” Atmospheric Research, vol.
119, pp. 140-152, Jan, 2013.
[20] R. Maliva and T. Missimer. “Arid lands water evaluation and
management,” Springer Science & Business Media, Jun. 2012.
[21] O. U. Laz, A. Rahman, A. Yilmaz, and K. Haddad. “Trends in
sub-hourly, sub-daily and daily extreme rainfall events in eastern
International Journal of Environmental Science and Development, Vol. 11, No. 3, March 2020
121
AUTHOR CONTRIBUTIONS

Australia,” Journal of Water and Climate Change, vol. 5, pp. 667-675,
Dec. 2014.
[22] A. G. Yilmaz, “The effects of climate change on historical and future
extreme rainfall in Antalya, Turkey,” Hydrological Sciences Journal,
vol. 60, pp. 2148-2162, Dec. 2015
[23] A. G. Yilmaz, “Climate change effects and extreme rainfall
non-stationarity,” in Proc. the Institution of Civil Engineers-Water
Management, vol. 170, pp. 57-65, Mar, 2016.
[24] M. A. Imteaz, W. Mahmood, K. A. Sagar, and A. Yilmaz, “Climate
change fingerprints in lower Euphrates basin: Climate and flow data
trend analysis,” International Journal of Water, vol. 11, pp. 279-293,
Aug. 2017
[25] M. Shadmani, S. Marofi, and M. Roknian, “Trend analysis in reference
evapotranspiration using Mann-Kendall and Spearman’s Rho tests in
arid regions of Iran,” Water Resources Management, vol. 26, pp.
211-224, Jan. 2012.
Copyright © 2020 by the authors. This is an open access article distributed
under the Creative Commons Attribution License which permits unrestricted
use, distribution, and reproduction in any medium, provided the original
work is properly cited (CC BY 4.0).
Abdullah Gokhan Yilmaz has a PhD in civil
(water) engineering from the Swinburne University
of Technology, Australia. He is currently working at
the University of Sharjah in Civil and
Environmental Engineering Department. His
research interests are climate change hydrology,
rainfall-runoff modelling, GIS and remote sensing
applications in water resources management and
extreme rainfall, flood and drought analysis. He has
delivered variety of courses at undergraduate and graduate levels including
water resources engineering, fluid mechanics, hydraulic engineering and
design, engineering economics, irrigation water management and GIS in
water resources engineering.
Arwa Najah is a research student in Civil and
Environmental Engineering Department at
University of Sharjah. She is also working as a
research assistant at University of Sharjah, and she is
assisting projects on climate change hydrology,
drought and flood monitoring and assessment.
Aysha Hussein is a research student in Civil and
Environmental Engineering Department at
University of Sharjah. Her research interests are the
assessment of climate change models, extreme
weather events and spatio-temporal analysis of
hydro-meteorological data in particular using GIS
softwares.
Athra Khamis is a research student in Civil and
Environmental Engineering Department at
University of Sharjah. She is working as a research
assistant with a particular contribution on R
programming language use in drought index
calculation and assessment.
Naseraldin Kayemah is a master of research
student in Civil and Environmental Engineering
Department at University of Sharjah. His research
interests are statistical assessment of
hydro-meteorological variables and groundwater
hydrology. He is currently working as a research
assistant and working on spatio-temporal assessment
of groundwater resources in United Arab Emirates.
Serter Atabay has more than seven years of
professional experience with the UK’s leading
specialists in flood risk and environmental
management. He has taught a variety of courses for
undergraduate students, including fluid mechanics,
water resources engineering, coastal engineering and
statics. His general area of specialization is open
channel hydraulics, and his research interests span
over a few sub-areas of research including
compound channel flow mechanism and boundary shear stress distributions,
and hydraulic structures such us bridges and culverts.
International Journal of Environmental Science and Development, Vol. 11, No. 3, March 2020
122
Related Documents