Climate change as a driver of change in the Great Lakes St. Lawrence River Basin Alana M. Bartolai a,1,2 , Lingli He b,1,3 , Ardith E. Hurst c, ⁎ ,1 , Linda Mortsch d,4 , Robert Paehlke e,5 , Donald Scavia f,6 a University of Minnesota, College of Food, Agriculture, and Natural Resource Sciences, 277 Coffey Hall, St. Paul, MN 55108, USA b University of Michigan, Department of Civil and Environmental Engineering, 126 EWRE, 1351 Beal Ave., Ann Arbor, MI 48109, USA c McGill University, Faculty of Agricultural and Environmental Sciences, 21111 Lakeshore Road, Sainte-Anne-de-Bellevue, Quebec H9X 3V9, Canada d University of Waterloo, Faculty of Environment, Waterloo, ON N2L 3G1, Canada e Trent University, Environmental and Resource Studies, Peterborough, ON K9J 7B8, Canada f University of Michigan, Graham Sustainability Institute, 625 E. Liberty St., Suite 300, Ann Arbor, MI 48104, USA abstract article info Article history: Received 6 November 2013 Accepted 19 November 2014 Available online xxxx Communicated by Robert Hecky Index words: Climate change Mitigation Adaptation Scenarios Temperature increase Precipitation Climate change in the Great Lakes–St. Lawrence River basin is affecting the socio-ecological system, including the residents who depend on the basin for drinking water, energy, and commerce. Over the past 50 years, air temper- atures increased and heavier precipitation events became more frequent, and those trends are projected to con- tinue. Climate change is expected to impact energy supply and demand, governance, and changes in demographics and societal values. More extreme events may exacerbate transport of biological and chemical contaminants and invasive species, and impact lake levels and water quality. We describe historical trends of the regional climate, examine global and regional climate model projections, and explore impacts of climate change with other key drivers of change defined by the Great Lakes Futures Project. Because reducing climate- related damages and economic losses is crucial; we offer three plausible future scenarios of mitigation and adap- tation plans. Recommendations to reach a future Utopian scenario require immediate actions, such as improvements in energy conservation, efficiency and generation, curbs to emissions, preventative infrastructure upgrades, and investments in maintaining and monitoring a healthy ecosystem. © 2014 International Association for Great Lakes Research. Published by Elsevier B.V. All rights reserved. Introduction The Great Lakes-St. Lawrence River basin forms the largest body of fresh water in the world. Water resources are used for drinking, agricul- ture, hydro-electricity production, shipping, recreation, and more. The basin moderates the region's temperatures (Gula and Peltier, 2012) pro- viding a unique climate; however, climate-related ecological and socie- tal changes can have far-reaching economic effects within the region and in the global economy. Climate change due to increasing concentrations of greenhouse gases (GHGs) is an important issue and is explored as a driver of change in this paper. In its Fifth Assessment report, Working Group I of the Intergovern- mental Panel on Climate Change (IPCC) has raised their consensus to it is “highly likely that human influence has been the dominant cause of the observed warming since the mid-20th century” (IPCC, 2013). It also stat- ed “Warming of the climate system is unequivocal, and since the 1950s, many of the observed changes are unprecedented over decades to millennia. The atmosphere and ocean have warmed, the amounts of snow and ice have diminished… and the concentrations of greenhouse gases have increased” (IPCC, 2013). Global changes in climate are projected to continue and impact hydrology (Bates et al., 2008). As part of the Great Lakes Futures Project (GLFP), two periods – his- torical changes in climate since 1963 and climate projections to 2063 – were chosen to provide context for exploring the implications of a changing climate on ecosystems and society within the Great Lakes-St. Lawrence River basin. This article also explores the interactions of cli- mate change with the seven other priority driving forces (energy, eco- nomics, demographics and societal values, geopolitics and governance, aquatic invasive species, biological and chemical contaminants, and water quantity) established by the GLFP leadership team (Laurent et al., in this issue). Responding to climate change includes focusing on both mitigation (reducing or sequestering GHG emissions) and ad- aptation (reducing climate change impacts) and will require an Journal of Great Lakes Research xxx (2015) xxx–xxx ⁎ Corresponding author at: 901 Saint Vincent, Irvine, CA 92618, USA. Tel.: +1 949 394 3505. E-mail addresses: [email protected] (A.M. Bartolai), [email protected] (L. He), [email protected] (A.E. Hurst), [email protected] (L. Mortsch), [email protected] (R. Paehlke), [email protected] (D. Scavia). 1 The Great Lakes Futures Project brought together graduate students and expert men- tors from universities and institutions in Canada and the United States. Each paper re- quired collaboration between a number of authors with many of them sharing co- leadership that we denote using a 1. 2 Tel.: +1 847 894 6113. 3 Tel.: +1 734 355 4397. 4 Tel.: +1 519 888 4567x35495. 5 Tel.: +1 705 741 2158. 6 Tel.: +1 734 615 4860. JGLR-00807; No. of pages: 14; 4C: http://dx.doi.org/10.1016/j.jglr.2014.11.012 0380-1330/© 2014 International Association for Great Lakes Research. Published by Elsevier B.V. All rights reserved. Contents lists available at ScienceDirect Journal of Great Lakes Research journal homepage: www.elsevier.com/locate/jglr Please cite this article as: Bartolai, A.M., et al., Climate change as a driver of change in the Great Lakes St. Lawrence River Basin, J Great Lakes Res (2015), http://dx.doi.org/10.1016/j.jglr.2014.11.012

Welcome message from author
This document is posted to help you gain knowledge. Please leave a comment to let me know what you think about it! Share it to your friends and learn new things together.
Transcript
Journal of Great Lakes Research xxx (2015) xxx–xxx
JGLR-00807; No. of pages: 14; 4C:
Contents lists available at ScienceDirect
Journal of Great Lakes Research
j ourna l homepage: www.e lsev ie r .com/ locate / jg l r
Climate change as a driver of change in the Great Lakes St. Lawrence River Basin
Alana M. Bartolai a,1,2, Lingli He b,1,3, Ardith E. Hurst c,⁎,1, Linda Mortsch d,4, Robert Paehlke e,5, Donald Scavia f,6
a University of Minnesota, College of Food, Agriculture, and Natural Resource Sciences, 277 Coffey Hall, St. Paul, MN 55108, USAb University of Michigan, Department of Civil and Environmental Engineering, 126 EWRE, 1351 Beal Ave., Ann Arbor, MI 48109, USAc McGill University, Faculty of Agricultural and Environmental Sciences, 21111 Lakeshore Road, Sainte-Anne-de-Bellevue, Quebec H9X 3V9, Canadad University of Waterloo, Faculty of Environment, Waterloo, ON N2L 3G1, Canadae Trent University, Environmental and Resource Studies, Peterborough, ON K9J 7B8, Canadaf University of Michigan, Graham Sustainability Institute, 625 E. Liberty St., Suite 300, Ann Arbor, MI 48104, USA
⁎ Corresponding author at: 901 Saint Vincent, Irvine, C3505.
E-mail addresses: [email protected] (A.M. Bartolai),[email protected] (A.E. Hurst), ldmortsch@[email protected] (R. Paehlke), [email protected] (D. Sc
1 The Great Lakes Futures Project brought together gradtors from universities and institutions in Canada and thquired collaboration between a number of authors wleadership that we denote using a 1.
2 Tel.: +1 847 894 6113.3 Tel.: +1 734 355 4397.4 Tel.: +1 519 888 4567x35495.5 Tel.: +1 705 741 2158.6 Tel.: +1 734 615 4860.
http://dx.doi.org/10.1016/j.jglr.2014.11.0120380-1330/© 2014 International Association for Great Lak
Please cite this article as: Bartolai, A.M., et al(2015), http://dx.doi.org/10.1016/j.jglr.2014
a b s t r a c t
a r t i c l e i n f oArticle history:Received 6 November 2013Accepted 19 November 2014Available online xxxx
Communicated by Robert Hecky
Index words:Climate changeMitigationAdaptationScenariosTemperature increasePrecipitation
Climate change in the Great Lakes–St. Lawrence River basin is affecting the socio-ecological system, including theresidentswho depend on the basin for drinkingwater, energy, and commerce. Over the past 50 years, air temper-atures increased and heavier precipitation events became more frequent, and those trends are projected to con-tinue. Climate change is expected to impact energy supply and demand, governance, and changes indemographics and societal values. More extreme events may exacerbate transport of biological and chemicalcontaminants and invasive species, and impact lake levels and water quality. We describe historical trends ofthe regional climate, examine global and regional climate model projections, and explore impacts of climatechange with other key drivers of change defined by the Great Lakes Futures Project. Because reducing climate-related damages and economic losses is crucial; we offer three plausible future scenarios of mitigation and adap-tation plans. Recommendations to reach a future Utopian scenario require immediate actions, such asimprovements in energy conservation, efficiency and generation, curbs to emissions, preventativeinfrastructure upgrades, and investments in maintaining and monitoring a healthy ecosystem.
© 2014 International Association for Great Lakes Research. Published by Elsevier B.V. All rights reserved.
Introduction
The Great Lakes-St. Lawrence River basin forms the largest body offreshwater in theworld.Water resources are used for drinking, agricul-ture, hydro-electricity production, shipping, recreation, and more. Thebasinmoderates the region's temperatures (Gula and Peltier, 2012) pro-viding a unique climate; however, climate-related ecological and socie-tal changes can have far-reaching economic effects within the regionand in the global economy.
A 92618, USA. Tel.: +1 949 394
[email protected] (L. He),erloo.ca (L. Mortsch),avia).uate students and expert men-e United States. Each paper re-ith many of them sharing co-
es Research. Published by Elsevier B
., Climate change as a driver o.11.012
Climate change due to increasing concentrations of greenhouse gases(GHGs) is an important issue and is explored as a driver of change in thispaper. In its Fifth Assessment report,Working Group I of the Intergovern-mental Panel on Climate Change (IPCC) has raised their consensus to it is“highly likely that human influence has been the dominant cause of theobserved warming since the mid-20th century” (IPCC, 2013). It also stat-ed “Warming of the climate system is unequivocal, and since the 1950s,many of the observed changes are unprecedented over decades tomillennia. The atmosphere and ocean have warmed, the amounts ofsnow and ice have diminished… and the concentrations of greenhousegases have increased” (IPCC, 2013). Global changes in climate areprojected to continue and impact hydrology (Bates et al., 2008).
As part of the Great Lakes Futures Project (GLFP), two periods – his-torical changes in climate since 1963 and climate projections to 2063 –
were chosen to provide context for exploring the implications of achanging climate on ecosystems and society within the Great Lakes-St.Lawrence River basin. This article also explores the interactions of cli-mate change with the seven other priority driving forces (energy, eco-nomics, demographics and societal values, geopolitics and governance,aquatic invasive species, biological and chemical contaminants, andwater quantity) established by the GLFP leadership team (Laurentet al., in this issue). Responding to climate change includes focusingon both mitigation (reducing or sequestering GHG emissions) and ad-aptation (reducing climate change impacts) and will require an
.V. All rights reserved.
f change in the Great Lakes St. Lawrence River Basin, J Great Lakes Res
2 A.M. Bartolai et al. / Journal of Great Lakes Research xxx (2015) xxx–xxx
approach that understands and addresses the interdependent nature ofthe driving forces and the impacts of climate change. To aid in futurepolicy decisions, we highlight current regional trends in climate and ex-plore three scenarios – status-quo, dystopian, and utopian futures – forthe region based on the possible mitigation and adaptation strategiesput in place. Recommendedmitigation strategies include improving en-ergy conservation, reducing carbon emissions, increasing sequestrationof GHGs, as well as reducing energy and water demands, while adapta-tion strategies include improving infrastructure resilience, incorporat-ing wetland flood control, and facilitating regional economiccooperation.
A look-back: climate change in the past
The historical changes in temperature and precipitation, both global-ly andwithin the Great Lakes-St. Lawrence River basin, are summarizedin the following section, as well as the resulting impacts from thesechanges, specifically on the basin's ice cover, lake levels, sediment deliv-ery, and pollution.
Air temperature
Average air temperature within the basin region increased by 0.7 °C(1.26 °F) from 1895 to 1999 (Hall et al., 2007; IJC, 2003). Minimum(i.e., nighttime) temperatures warmed more rapidly than maximum,and the range between daily minimum and maximum temperaturehas decreased (Bonsal et al., 2001; Zhang et al., 2000). The number ofdays with extreme low temperatures decreased while the number ofdays with extreme high temperature increased (Bonsal et al., 2001;Brown et al., 2010; Easterling et al., 2000). Additionally, the number offrost-free days increased and the potential growing season lengthened(Brown et al., 2010).
Air temperature increase has not been uniform across the GreatLakes region or the seasons (Kunkel et al., 2009). The northern portionof the basin has seen the largest increases of temperature in winter andearly spring between1900 and 1998 (Andresen et al., 2012; Zhang et al.,2000). However, in some areas of the region (e.g., Michigan), meansummer temperatures decreasedwith time, likely due to intensificationof agriculture, where increased evapotranspiration suppresses daytimemaximum temperatures (Andresen et al., 2012; Pan et al., 2004).
Precipitation
Total precipitation has increased and its distribution across seasonshas changed. Total annual precipitation in theGreat Lakes region has in-creased by 10.7 cm (~13%) between 1955 and 2004, with the majorityof the change occurring during summer and winter (Andresen et al.,2012; Hodgkins et al., 2007). Specifically, the number of heavy eventsincreased in summer, and the number of light events decreased in win-ter (Stone et al., 2000). The ratio of snow to total precipitation decreased(Karl et al., 2009; Zhang et al., 2000) which is consistent with warmerair temperature in late winter and early spring (Davis et al., 1999;Groisman and Easterling, 1994; Zhang et al., 2000).
Extremeprecipitation events have becomemore frequent (Karl et al.,2009). For example, the annual number of days with precipitation ex-ceeding 10.2 cm increased since 1910 over the US; the Great Lakes re-gion, along with the Southwest, Midwest, and Southern Mississippivalley represent areas with the largest increases (Easterling et al.,2000). In the northeast and western Great Lakes regions, the precipita-tion amount with a 100-year recurrence interval increased 4 to 9% perdecade from 1950 to 2007 (DeGaetano, 2009). The trend towardsmore intense precipitation in late winter and spring has contributed toan overall increased risk of flooding, although in some urban areas theincreased flood risk was found to be more closely associated with landcover changes (e.g. more impervious surfaces) than climatological fac-tors (Mao and Cherkauer, 2009). While the total annual precipitation
Please cite this article as: Bartolai, A.M., et al., Climate change as a driver o(2015), http://dx.doi.org/10.1016/j.jglr.2014.11.012
increased, the number of dry periods also increased (Peterson andBaringer, 2009). In Canada, more areas were affected by extreme dryor wet conditions from the 1950–1998 period as compared to the1900–1949 period (Zhang et al., 2000).
Impacts of climate change in the past and present
The basins play a key role in the climate of the region through ex-change of heat and moisture with the atmosphere (Gula and Peltier,2012). Changes in temperature and precipitation have affected andwill continue to impact the physical, chemical, and biological processesof the basin. Several of these impacts are outlined below, and examinedboth in the historical and current context.
Ice cover
Winter ice duration and coverage have decreased over the period1963–2001 (Austin and Colman, 2007), with potential impacts on win-ter evaporation and lake levels (IUGLS, 2009). This change is a result ofwarmer winter air temperatures, warmer lake water temperatures, aswell as a reduced ratio of snow to total precipitation (IJC, 2003; Karlet al., 2009; Zhang et al., 2000). The lake ice season has shortened byone day per decade over the past 150 years, although the rate increasedto 5.3 days per decade between 1975 and 2004 (Jensen et al., 2007). Thefive-year average of maximum ice cover has decreased steadily on theGreat Lakes with Lake Superior showing the largest decrease (IUGLS,2009). The average ice extent has decreased by more than 50% overthe last two decades (Wang et al., 2012). While decreasing ice extenthas been observed over the long-term, January 2014 was the 10thcoldest in the Great Lakes region. Ice coverage reached 75% of the totalGreat Lakes surface area, the highest recorded coverage since 1996(Ballinger et al., 2014; Kennedy, 2014). Changes in theArctic Oscillation,La Nina, and increased melting of arctic ice may have contributed toanomalous cooling over the Great Lakes region influencing ice cover ex-tent (Ballinger et al., 2014; Wang et al., 2010). Ice cover changes influ-ence other physical properties of the basin. Desai et al. (2009) foundthat reduced ice cover on Lake Superior destabilizes the atmosphericsurface layer, decreasing wind speeds by 5% per decade since 1985. Ad-ditionally, changes in ice cover extent and duration have influencedwinter evaporation with potential impacts on basin water levels(IUGLS, 2009).
Lake levels
Fluctuations of the basin water levels are influenced by changes inprecipitation, evaporation, and evapotranspiration. For example, waterlevels typically progress from minima in late winter/early spring tomaxima in the summer/early fall. An earlier onset of the rise in waterlevels in spring and a change in the amplitude of water levels havebeen documented (Argyilan and Forman, 2003; Lenters, 2004). Thismay be related to winter warming, changes in the form of the precipita-tion and earlier springmelt and runoff. Lake levels within the basin alsoexhibit inter-annual and inter-decadal fluctuations; however, the rangefor the period 1918–2012 has beenwithin 2.0m (varying by lake) (DFO,2013a; Wilcox et al., 2007). The record high water levels since 1918 forthe Great Lakes occurred in the mid-1980s with other high levels in themid-1990s. Warm air temperatures and severe drought in 1988 and1998 contributed to a rapid drop in water levels from their relativelyhigh levels (Assel et al., 2004; Hall et al., 2007; IUGLS, 2009). Lakes Su-perior, Michigan, and Huron have been in a period of low water levelsfrom 1998 to 2013, compared to the long-term mean. Record lowmonthly mean levels were set in 2007 (August and September) forLake Superior (DFO, 2007)while LakesMichigan andHuron attained re-cord low levels in December 2012 and January 2013 (DFO, 2013b; EC,2013). Climate change, vertical land movement (i.e. adjustment to re-treat of glaciers), and human modification of the physical system
f change in the Great Lakes St. Lawrence River Basin, J Great Lakes Res
3A.M. Bartolai et al. / Journal of Great Lakes Research xxx (2015) xxx–xxx
(e.g., dredging in the connecting channels) have been identified as po-tential contributing factors (IUGLS, 2012).
Lamon and Stow (2010) and Sellinger et al. (2008) showed a down-ward trend in water levels, particularly since the end of the 20th centu-ry, potentially associated with changes in evaporation and netprecipitation (overlake precipitation minus evaporation) – particularlyon Lakes Michigan and Huron. The International Upper Great LakesStudy (2012) identified shifts in the hydro-climatic regime for the peri-od 1948–2008. Evaporation from the Great Lakes-St. Lawrence Riverbasin has increased since 1948 but a corresponding increase in overlakeprecipitation has offset this loss in most of the Great Lakes. However,while precipitation in the Lake Superior basin has remained relativelyconstant, evaporation increased and as a result water supplies havebeen declining. It is difficult to attribute observed changes in waterlevels, evaporation, and precipitation to human-caused climate changebecausemost observed trends arewithin the range of natural variability(Hayhoe et al., 2010).
Chemical and biological pollution and sediment delivery
Weather and climate play significant roles in the transport and fateof chemicals, nutrients, pathogens, and sediment. Cyanobacteria,which can form harmful algal blooms, favor warmer temperatures andtherefore are advantaged by a warming climate (Michalak et al., 2013;Paerl and Huisman, 2008). Lake Erie's largest harmful algal bloom tookplace in 2011 and was a result of long-term agricultural practices, in-creased precipitation, weak lake circulation and increased residencetimes (Michalak et al., 2013). These factors are expected to occurmore frequently in a warming climate.
Combined sewer and storm water systems allow contaminants toflow directly into lakes and streams when heavy precipitation eventsoverburden the system. While a portion of beach closures are from un-known sources, overflows from combined stormwater and sewage sys-tems due to heavy precipitation events have contributed tomany beachadvisories around the basin (McLellan et al., 2007).
Sedimentation and contaminated bottom sediments are of concernin the basin, although difficult to correlate with climate change. Sedi-mentation affects commercial navigation by reducing the alloweddraft in channels and ports; approximately $20M per year is spent ondredging (Ouyang et al., 2005). Soil erosion data from the US NationalResource Inventory show that agricultural land contributes 65 to 77%of the eroded soil in the basin, and that rates of erosion loss fromagricul-tural lands have decreased in the US portion of the basin over the past20 years due primarily to increased erosion control programs (GLC,2008). Erosion of the bluffs and coastal shorelines of the basin is influ-enced by external controls such as precipitation, storm intensity andfrequency, lake levels, and wave power. Erosion and bluff recessionrates vary both spatially and temporally and lake levels appear to havethe strongest correlation (Brown et al., 2005).
Climate impacts on other driving forces
A changing climate, with fluctuations in temperature, precipitation,ice cover and lake levels will influence the seven other priority driversof change within the basin. Some key impacts are summarized inTable 1.
Impact of other driving forces on climate change
The primary driving forces that contribute to the severity of climatechange are economic, societal, political and government actions that in-fluence GHG emissions and the resulting concentrations in the atmo-sphere. These driving forces' impact on climate change is discussed inmore detail in the following section, and all priority drivers are listedin Table 2.
Please cite this article as: Bartolai, A.M., et al., Climate change as a driver o(2015), http://dx.doi.org/10.1016/j.jglr.2014.11.012
Governance and geopolitics
Governance and geopolitics are keys to addressing climate changethrough policy creation at the global level. The United Nations Frame-work Convention on Climate Change (UNFCCC), and the associatedKyoto Protocol are the most significant global policy initiatives. TheUNFCCC has 195 signatories, including the US and Canada (UNFCCC,2012). However, the US did not sign on to the Kyoto Protocol settingout GHG reduction targets and Canada withdrew in 2011 (UNFCCC,2012). Both countries have submitted non-binding emissions reductionpledges as part of theUNFCCC's 2009Copenhagen Accordwhich aims tolimit the global temperature increase to 2 °C above pre-industrial levelsand to fund climate adaptation in developing countries (UNFCCC, 2009).However, both countries are still exceeding their emissions pledges.
The US and Canadian federal government positions on emission re-ductions can influence actions of other countries as well as impact deci-sions at home. Government climate policies can foster technicalinnovation and corporate environmental strategy (Selin and VanDeveer,2010). Legislation as a tool can have a range of outcomes. For example,legislation did not markedly improve emission control practices for sup-ply chain management (Tsireme et al., 2012), but lack of US GHG emis-sions standards contributed to the discontinuation of a carbon captureand storage initiative for coal-based power generation (AEP, 2011).
Providing funding for climate change science and research on miti-gation and vulnerability, impacts, and adaptation is away to understandthe implications of climate change and drive innovative mitigation andadaptation strategies. The US government increased research funding in2010 to just over $2B to the inter-agency US Global Change ResearchProgram (USDS, 2010).
Fundamental, positive change often starts with small-scale modifica-tions, and progress is being made on many initiatives for mitigation andadaptation at the regional and local levels within the basin. The Provinceof Ontario enacted the Green Energy and Green Economy Act of 2009,which plans to diversify energy supply with one-third renewables(OMoE, 2012). This initiative includes Ontario's Feed-In Tariff Program,which is North America's first comprehensive guaranteed pricing struc-ture for renewable energy (OPA, 2010). It has attracted the single largestdevelopment of renewable energy generation in the province's historyand is anticipated to provide 20,000 more jobs in the renewable energysector (OMoE, 2012). The state of NewYork has a Climate Smart Commu-nities program where individual communities are pledging to reduceemissions and receive expertise and funding to prepare for a variable cli-mate future through infrastructure upgrades (NYSDEC, 2013). At the citylevel, Chicago's Climate Action Plan proposes to reduce emissions by 80%by the year 2050 (Hayhoe et al., 2010). Chicago also implemented a“Green Corps” program, which takes hard-to-employ former inmatesand trains them in environmentally positive jobs such as improvinghome heating efficiency (Paehlke, 2010). The US Conference of Mayors(representing ~89million citizens) presented a Climate Protection Agree-ment, which closely follows the Kyoto Protocol and has been signed by277 mayors in the Great Lakes region (USCM, 2008). The Great Lakesand St. Lawrence Cities Initiative showcases cities within the basintransforming towards sustainability (GLSLCI, 2013). States, provinces,andmunicipalities are demonstrating leadership on climate change issueswithout federal leadership as they acknowledge that it will impact theirbottom lines.
Changing demographics and societal values
Societal values, technological innovation, economic development,and population trends influence GHG emissions as well as the severityof impacts and the potential to adapt (IPCC, 2007). Particularly on theCanadian side, the population has been increasing and more peopleare moving to urban and suburban areas from the countryside. The USportion of the basin is experiencing an out-migration of highly educatedyoung people leaving behind an older, more vulnerable populationwith
f change in the Great Lakes St. Lawrence River Basin, J Great Lakes Res
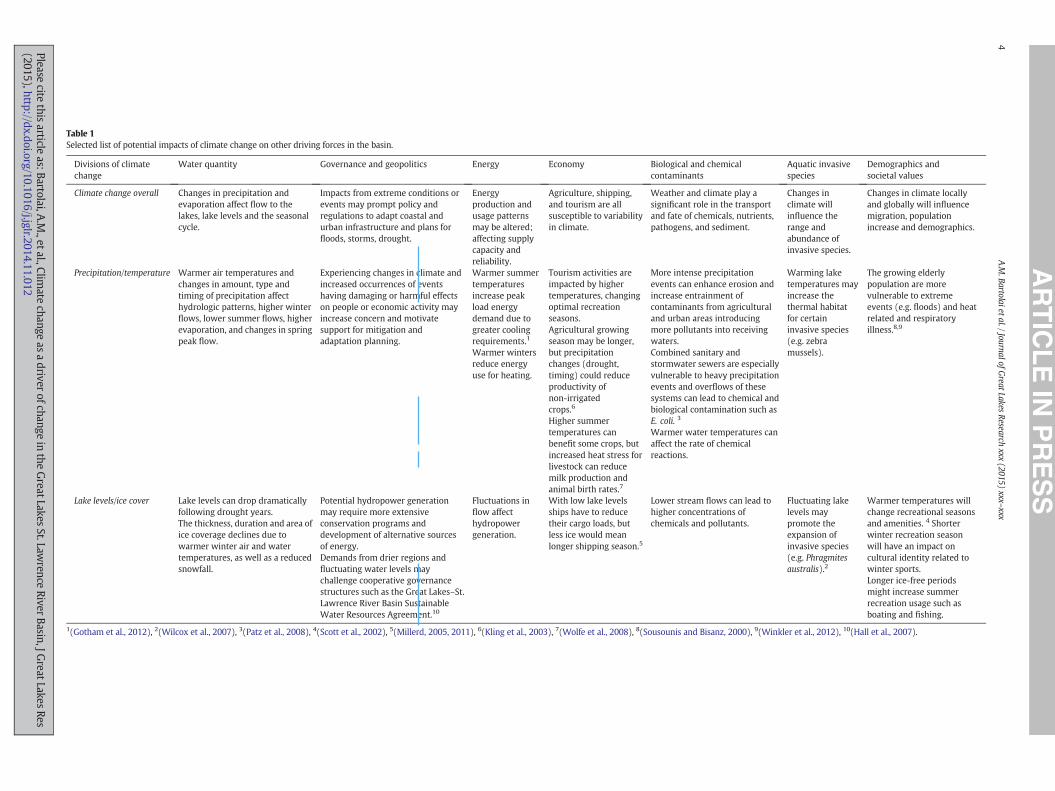
Table 1Selected list of potential impacts of climate change on other driving forces in the basin.
Divisions of climatechange
Water quantity Governance and geopolitics Energy Economy Biological and chemicalcontaminants
Aquatic invasivespecies
Demographics andsocietal values
Climate change overall Changes in precipitation andevaporation affect flow to thelakes, lake levels and the seasonalcycle.
Impacts from extreme conditions orevents may prompt policy andregulations to adapt coastal andurban infrastructure and plans forfloods, storms, drought.
Energyproduction andusage patternsmay be altered;affecting supplycapacity andreliability.
Agriculture, shipping,and tourism are allsusceptible to variabilityin climate.
Weather and climate play asignificant role in the transportand fate of chemicals, nutrients,pathogens, and sediment.
Changes inclimate willinfluence therange andabundance ofinvasive species.
Changes in climate locallyand globally will influencemigration, populationincrease and demographics.
Precipitation/temperature Warmer air temperatures andchanges in amount, type andtiming of precipitation affecthydrologic patterns, higher winterflows, lower summer flows, higherevaporation, and changes in springpeak flow.
Experiencing changes in climate andincreased occurrences of eventshaving damaging or harmful effectson people or economic activity mayincrease concern and motivatesupport for mitigation andadaptation planning.
Warmer summertemperaturesincrease peakload energydemand due togreater coolingrequirements.1
Warmer wintersreduce energyuse for heating.
Tourism activities areimpacted by highertemperatures, changingoptimal recreationseasons.Agricultural growingseason may be longer,but precipitationchanges (drought,timing) could reduceproductivity ofnon-irrigatedcrops.6
Higher summertemperatures canbenefit some crops, butincreased heat stress forlivestock can reducemilk production andanimal birth rates.7
More intense precipitationevents can enhance erosion andincrease entrainment ofcontaminants from agriculturaland urban areas introducingmore pollutants into receivingwaters.Combined sanitary andstormwater sewers are especiallyvulnerable to heavy precipitationevents and overflows of thesesystems can lead to chemical andbiological contamination such asE. coli. 3
Warmer water temperatures canaffect the rate of chemicalreactions.
Warming laketemperatures mayincrease thethermal habitatfor certaininvasive species(e.g. zebramussels).
The growing elderlypopulation are morevulnerable to extremeevents (e.g. floods) and heatrelated and respiratoryillness.8,9
Lake levels/ice cover Lake levels can drop dramaticallyfollowing drought years.The thickness, duration and area ofice coverage declines due towarmer winter air and watertemperatures, as well as a reducedsnowfall.
Potential hydropower generationmay require more extensiveconservation programs anddevelopment of alternative sourcesof energy.Demands from drier regions andfluctuating water levels maychallenge cooperative governancestructures such as the Great Lakes–St.Lawrence River Basin SustainableWater Resources Agreement.10
Fluctuations inflow affecthydropowergeneration.
With low lake levelsships have to reducetheir cargo loads, butless ice would meanlonger shipping season.5
Lower stream flows can lead tohigher concentrations ofchemicals and pollutants.
Fluctuating lakelevels maypromote theexpansion ofinvasive species(e.g. Phragmitesaustralis).2
Warmer temperatures willchange recreational seasonsand amenities. 4 Shorterwinter recreation seasonwill have an impact oncultural identity related towinter sports.Longer ice-free periodsmight increase summerrecreation usage such asboating and fishing.
1(Gotham et al., 2012), 2(Wilcox et al., 2007), 3(Patz et al., 2008), 4(Scott et al., 2002), 5(Millerd, 2005, 2011), 6(Kling et al., 2003), 7(Wolfe et al., 2008), 8(Sousounis and Bisanz, 2000), 9(Winkler et al., 2012), 10(Hall et al., 2007).
4A.M
.Bartolaietal./JournalofGreatLakes
Researchxxx
(2015)xxx–xxx
Pleasecite
thisarticle
as:Bartolai,A.M
.,etal.,Climate
changeas
adriver
ofchangein
theGreatLakes
St.Lawrence
RiverBasin,JG
reatLakesRes
(2015),http://dx.doi.org/10.1016/j.jglr.2014.11.012
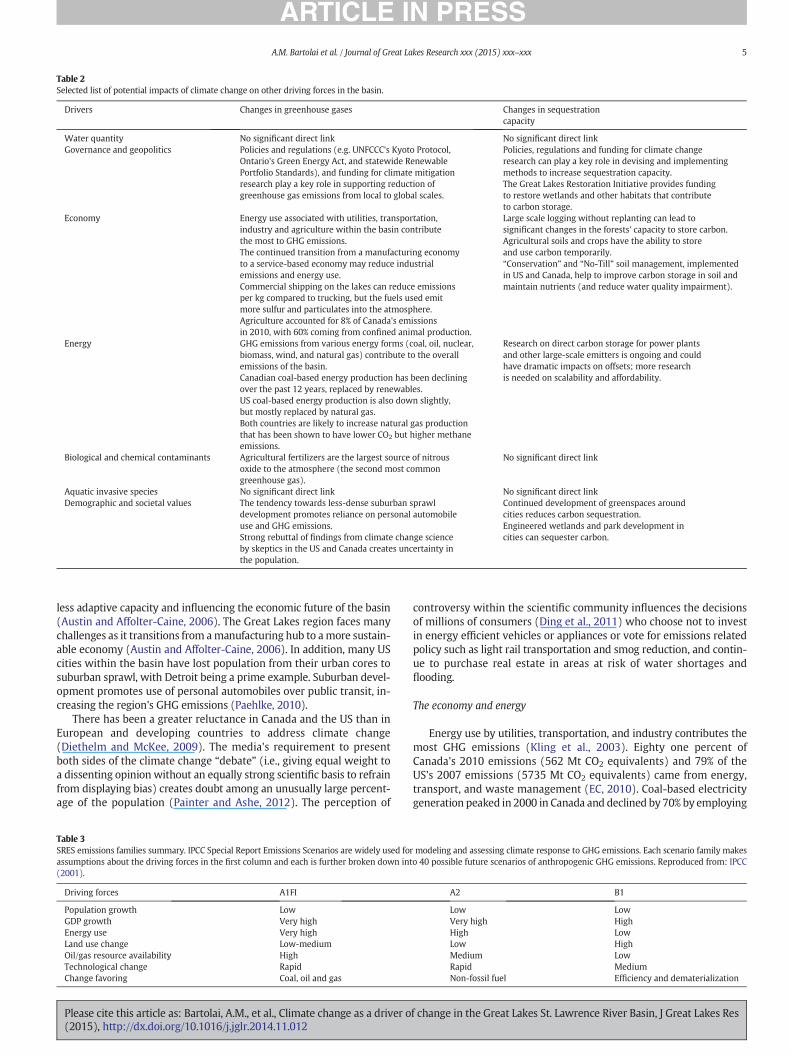
Table 2Selected list of potential impacts of climate change on other driving forces in the basin.
Drivers Changes in greenhouse gases Changes in sequestrationcapacity
Water quantity No significant direct link No significant direct linkGovernance and geopolitics Policies and regulations (e.g. UNFCCC's Kyoto Protocol,
Ontario's Green Energy Act, and statewide RenewablePortfolio Standards), and funding for climate mitigationresearch play a key role in supporting reduction ofgreenhouse gas emissions from local to global scales.
Policies, regulations and funding for climate changeresearch can play a key role in devising and implementingmethods to increase sequestration capacity.The Great Lakes Restoration Initiative provides fundingto restore wetlands and other habitats that contributeto carbon storage.
Economy Energy use associated with utilities, transportation,industry and agriculture within the basin contributethe most to GHG emissions.The continued transition from a manufacturing economyto a service-based economy may reduce industrialemissions and energy use.Commercial shipping on the lakes can reduce emissionsper kg compared to trucking, but the fuels used emitmore sulfur and particulates into the atmosphere.Agriculture accounted for 8% of Canada's emissionsin 2010, with 60% coming from confined animal production.
Large scale logging without replanting can lead tosignificant changes in the forests' capacity to store carbon.Agricultural soils and crops have the ability to storeand use carbon temporarily.“Conservation” and “No-Till” soil management, implementedin US and Canada, help to improve carbon storage in soil andmaintain nutrients (and reduce water quality impairment).
Energy GHG emissions from various energy forms (coal, oil, nuclear,biomass, wind, and natural gas) contribute to the overallemissions of the basin.Canadian coal-based energy production has been decliningover the past 12 years, replaced by renewables.US coal-based energy production is also down slightly,but mostly replaced by natural gas.Both countries are likely to increase natural gas productionthat has been shown to have lower CO2 but higher methaneemissions.
Research on direct carbon storage for power plantsand other large-scale emitters is ongoing and couldhave dramatic impacts on offsets; more researchis needed on scalability and affordability.
Biological and chemical contaminants Agricultural fertilizers are the largest source of nitrousoxide to the atmosphere (the second most commongreenhouse gas).
No significant direct link
Aquatic invasive species No significant direct link No significant direct linkDemographic and societal values The tendency towards less-dense suburban sprawl
development promotes reliance on personal automobileuse and GHG emissions.Strong rebuttal of findings from climate change scienceby skeptics in the US and Canada creates uncertainty inthe population.
Continued development of greenspaces aroundcities reduces carbon sequestration.Engineered wetlands and park development incities can sequester carbon.
5A.M. Bartolai et al. / Journal of Great Lakes Research xxx (2015) xxx–xxx
less adaptive capacity and influencing the economic future of the basin(Austin and Affolter-Caine, 2006). The Great Lakes region faces manychallenges as it transitions from amanufacturing hub to amore sustain-able economy (Austin and Affolter-Caine, 2006). In addition, many UScities within the basin have lost population from their urban cores tosuburban sprawl, with Detroit being a prime example. Suburban devel-opment promotes use of personal automobiles over public transit, in-creasing the region's GHG emissions (Paehlke, 2010).
There has been a greater reluctance in Canada and the US than inEuropean and developing countries to address climate change(Diethelm and McKee, 2009). The media's requirement to presentboth sides of the climate change “debate” (i.e., giving equal weight toa dissenting opinion without an equally strong scientific basis to refrainfrom displaying bias) creates doubt among an unusually large percent-age of the population (Painter and Ashe, 2012). The perception of
Table 3SRES emissions families summary. IPCC Special Report Emissions Scenarios are widely used forassumptions about the driving forces in the first column and each is further broken down int(2001).
Driving forces A1FI
Population growth LowGDP growth Very highEnergy use Very highLand use change Low-mediumOil/gas resource availability HighTechnological change RapidChange favoring Coal, oil and gas
Please cite this article as: Bartolai, A.M., et al., Climate change as a driver o(2015), http://dx.doi.org/10.1016/j.jglr.2014.11.012
controversy within the scientific community influences the decisionsof millions of consumers (Ding et al., 2011) who choose not to investin energy efficient vehicles or appliances or vote for emissions relatedpolicy such as light rail transportation and smog reduction, and contin-ue to purchase real estate in areas at risk of water shortages andflooding.
The economy and energy
Energy use by utilities, transportation, and industry contributes themost GHG emissions (Kling et al., 2003). Eighty one percent ofCanada's 2010 emissions (562 Mt CO2 equivalents) and 79% of theUS's 2007 emissions (5735 Mt CO2 equivalents) came from energy,transport, and waste management (EC, 2010). Coal-based electricitygeneration peaked in 2000 in Canada and declined by 70% by employing
modeling and assessing climate response to GHG emissions. Each scenario family makeso 40 possible future scenarios of anthropogenic GHG emissions. Reproduced from: IPCC
A2 B1
Low LowVery high HighHigh LowLow HighMedium LowRapid MediumNon-fossil fuel Efficiency and dematerialization
f change in the Great Lakes St. Lawrence River Basin, J Great Lakes Res
6 A.M. Bartolai et al. / Journal of Great Lakes Research xxx (2015) xxx–xxx
more renewable energy (OMoE, 2012). Coal-fired energy in the US de-clined from 51.7% of total generation in 2000 to 48% in 2008, primarilydue to generation plants switching to natural gas (USDS, 2010).
Agriculture accounted for 8% of Canada's total GHG emissions in2010. Agriculture was also the most significant contributor of methane,primarily from confined animal production (EC, 2010). The manufac-ture, use, and breakdown of nitrate-based fertilizers are the largestsource of nitrous oxide, the second most common GHG, with 300
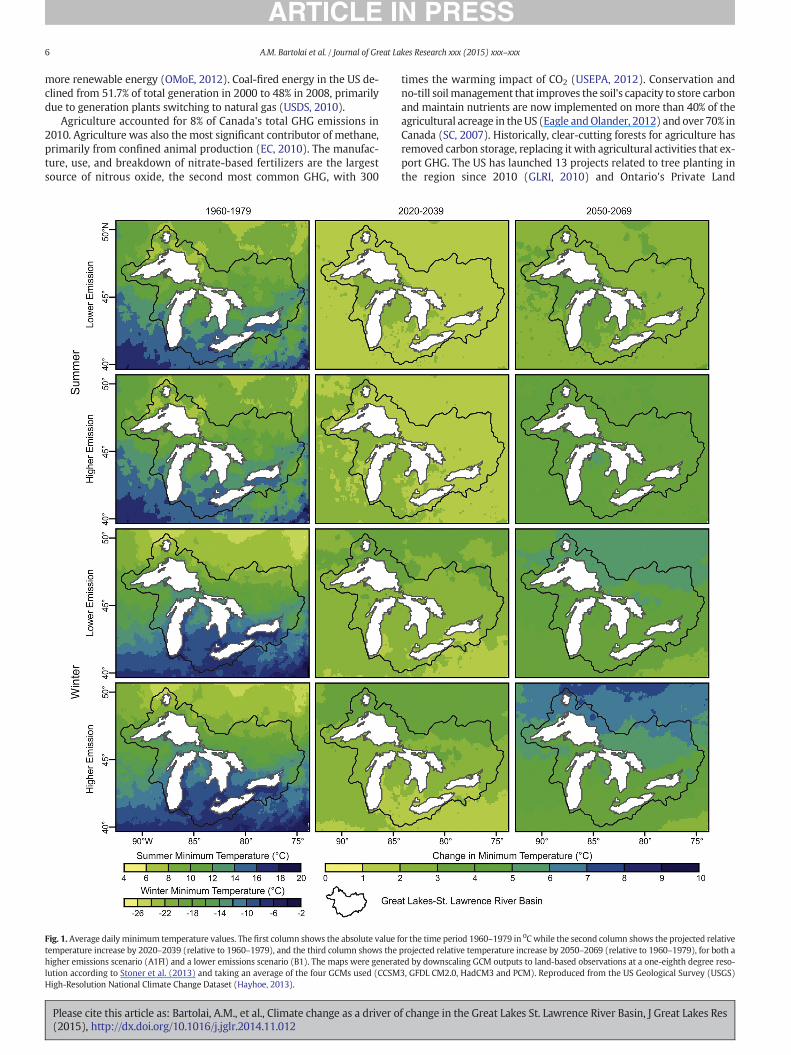
Fig. 1. Average daily minimum temperature values. The first column shows the absolute value ftemperature increase by 2020–2039 (relative to 1960–1979), and the third column shows thehigher emissions scenario (A1FI) and a lower emissions scenario (B1). The maps were generatlution according to Stoner et al. (2013) and taking an average of the four GCMs used (CCSMHigh-Resolution National Climate Change Dataset (Hayhoe, 2013).
Please cite this article as: Bartolai, A.M., et al., Climate change as a driver o(2015), http://dx.doi.org/10.1016/j.jglr.2014.11.012
times the warming impact of CO2 (USEPA, 2012). Conservation andno-till soilmanagement that improves the soil's capacity to store carbonand maintain nutrients are now implemented on more than 40% of theagricultural acreage in theUS (Eagle andOlander, 2012) and over 70% inCanada (SC, 2007). Historically, clear-cutting forests for agriculture hasremoved carbon storage, replacing it with agricultural activities that ex-port GHG. The US has launched 13 projects related to tree planting inthe region since 2010 (GLRI, 2010) and Ontario's Private Land
or the time period 1960–1979 in 0C while the second column shows the projected relativeprojected relative temperature increase by 2050–2069 (relative to 1960–1979), for both aed by downscaling GCM outputs to land-based observations at a one-eighth degree reso-3, GFDL CM2.0, HadCM3 and PCM). Reproduced from the US Geological Survey (USGS)
f change in the Great Lakes St. Lawrence River Basin, J Great Lakes Res
7A.M. Bartolai et al. / Journal of Great Lakes Research xxx (2015) xxx–xxx
Afforestation Program is encouraging farmers to reforest land that ismarginal agricultural land (Bird and Boysen, 2007).
Emissions from theworld's shippingfleetwere estimated to be 3.3% ofanthropogenic emissions in 2007 (IMO, 2009).While there are no specificmeasurements of emissions from the basin's inland navigation, there areefforts to “green” the fleet (Lloyd's Register, 2012). The North AmericanEmission Control Area policy, established under international maritimelaw, includes the waters of the Great Lakes and the St. Lawrence Seaway,and went into effect in August 2012. Among other measures, it requiresthat fuel sulfur content cannot exceed 1%, significantly reducing shipemissions (Lloyd's Register, 2012). While the majority of trade betweenCanada and the US occurs by truck and rail, marine shipping is the mostfuel efficient way of transporting goods to global markets.
A look forward: climate over the next 50 years and future impacts
This article surveys themost recent peer-reviewed literature to pro-vide a summary of the future climate (temperature, precipitation) andselected physical effects. Climate projections are based on both globalclimate model (GCM) and regional climate model (RCM) simulationsusing emissions scenarios from the IPCC Special Report on EmissionsScenarios (SRES) (Table 3) (IPCC, 2000). Three key emissions scenariosare explored: A2 (high population growth, economic development re-gionally oriented), A1FI (business as usual, high fossil fuel use and emis-sions, economic focus on global integration), and B1 (plateauingpopulation growth, global emphasis on environmental cooperation, im-proved technology). This article uses an ensemble of outputs fromGCMs (e.g. 21 GCMs in IPCC AR4) and RCMs from the North AmericanRegional Climate Change Assessment Program to explore a range of cli-mate futures for the basin since no single combination of climate modeland emission scenario can accurately project future outcomes. For theIPCC Fifth Assessment report, four new GHG emission and concentra-tion scenarios were developed called Representative ConcentrationPathways and used in climate projections (IPCC, 2013). Future regionalimpact assessments in the Great Lakes-St. Lawrence River basin will useclimate modeling results based on Representative Concentration Path-ways to develop climate change scenarios.
Temperature
The mean annual temperature across the basin is expected to in-crease 2 to 3 °C bymid-century under A1FI and B1 scenarios respective-ly (Hayhoe et al., 2010; Winkler et al., 2012). Seasonal changes may begreater (Kling et al., 2003) and are obscured by the use of annual aver-ages (Hayhoe et al., 2010). Summer and winter temperatures may in-crease by 7 °C to 8 °C respectively (Winkler et al., 2012). Generallywinters will be warmer, and summers will be moderately warmer,with greater variability of temperatures for spring and fall. Fig. 1 depictsseasonal average daily minimum temperature for the time periods1960–1979 (absolute value), 2020–2039 (change relative to 1960–1979), and 2050–2069 (change relative to 1960–1979), for both thehighest emissions scenario (A1FI) and a lower emissions scenario(B1). There is significant variability across the region, particularly by2063, and it is during winter where the warming trend is most appar-ent. Annual average warming will likely be 1 °C to 3 °C lower directlyover the lakes than the increases over the northwestern and southwest-ern areas of the basin. While winter warming is expected to be thegreatest at higher latitudes, summer warming will be greater in thesouthern and western parts of the basin (Kling et al., 2003).
Trumpickas et al. (2009) found that lakewater temperature changeswere closely correlated to seasonal air temperature changes andprojected water temperature increases from 1.5 °C to 3–4 °C acrossthe basin. The implications were an earlier breakup and an earlieronset of summer lake stratification shortening the overturn period,which circulates critical dissolved oxygen to deeper waters for fishand zooplankton species (Jensen et al., 2007). The period of summer
Please cite this article as: Bartolai, A.M., et al., Climate change as a driver o(2015), http://dx.doi.org/10.1016/j.jglr.2014.11.012
lake stratification could be lengthened by 42 days (Lake Erie underlow emissions influence) to 90 days (Lake Superior under higher emis-sions influence) (Trumpickas et al., 2009), leading to low dissolved ox-ygen levels in bottom waters and potential summer die-off events.
The trend of the frequency and duration of extreme temperatures islikely to continue into the future. The frequency of days below freezingis anticipated to decrease; for example, simulations from RCMs project22 fewer days below freezing by mid-century (Winkler et al., 2012).The occurrence of days above 35 °C is projected to increase by 5 to25 days by mid-century (Winkler et al., 2012). These temperature ex-tremes vary regionally with greater increases within the southern por-tion of the basin.
Precipitation
Projections of precipitation changes over the basin have a higher de-gree of uncertainty than temperature. Annual total precipitation isprojected to slightly increase over the first half of the 21st century,with a change of −2 to +10% (Winkler et al., 2012). However, by theend of the century the projected annual total precipitation shows an in-crease of up to 20% across the region (Hayhoe et al., 2010; Vavrus andVan Dorn, 2010; Winkler et al., 2012).
Similar to temperature, changes in precipitation differ seasonally andregionally. By 2063, the projections from a range of models show consis-tent increases in precipitation (November to March) across the region,while projections of summer precipitation show increases and decreases(Winkler et al., 2012). For example, precipitation projections for Wiscon-sin and Michigan do not appear to change significantly in summer,whereas in Illinois and Indiana precipitation is projected to decrease byup to 24% (Cherkauer and Sinha, 2010). Fig. 2 depicts seasonal cumulativeprecipitation for 1960–1979 (absolute value), 2020–2039 (percentchange from 1960 to 1979), and 2050–2069 (percent change from 1960to 1979), for both the high emissions scenario (A1FI) and a lower emis-sions scenario (B1). It also demonstrates the precipitation variabilityacross the basin, particularly from north to south, but also the projectedshift inmany areas of more summer precipitation and less winter precip-itation by 2050–2069.
With a warming climate, more winter precipitation is likely to fall inthe form of rain rather than snow. Gula and Peltier (2012) project thatby 2050–2060 compared to 1979–2001, a greater decrease in snowfall,up to 20%decrease, in the earliermonths ofwinter (September toDecem-ber) will occur compared to 10% decrease from January to April. This willalso vary spatially with a greater decrease occurring in the southern por-tion of the Great Lakes basin. While the overall proportion of precipita-tion, as snowfall is likely to decrease, the snowbelt region locateddownwind from the Great Lakes basin might have greater snowfall.Lake-effect snow is anticipated to increase with warming through mid-century, as warmer surface waters and a decrease in ice cover releasemore heat and moisture flux to the atmosphere (Gula and Peltier, 2012).
Warmer temperatures andmore evaporation lead to an increase in at-mospheric moisture contributing to more intense precipitation (Winkleret al., 2012). The extent of change in increased intensity of precipitationevents is highly variable depending on the GHG emissions scenario(Winkler et al., 2012). Most models project increases in the frequencyand intensity of extreme precipitation events ranging from 20 to 30% forB1 and A2 emissions scenarios respectively (Mackey, 2012). Higher emis-sions scenarios generate a greater percentage of more intense precipita-tion events. For example, precipitation events greater than 4 cm per dayin Chicago are likely to increase from 25% under low GHG emissions sce-narios to over 60% in high emission scenarios (Vavrus and Van Dorn,2010).
Ice cover
The current overall trend of reduction in lake ice cover is projectedto continue within each of the Great Lakes with climate warming,
f change in the Great Lakes St. Lawrence River Basin, J Great Lakes Res
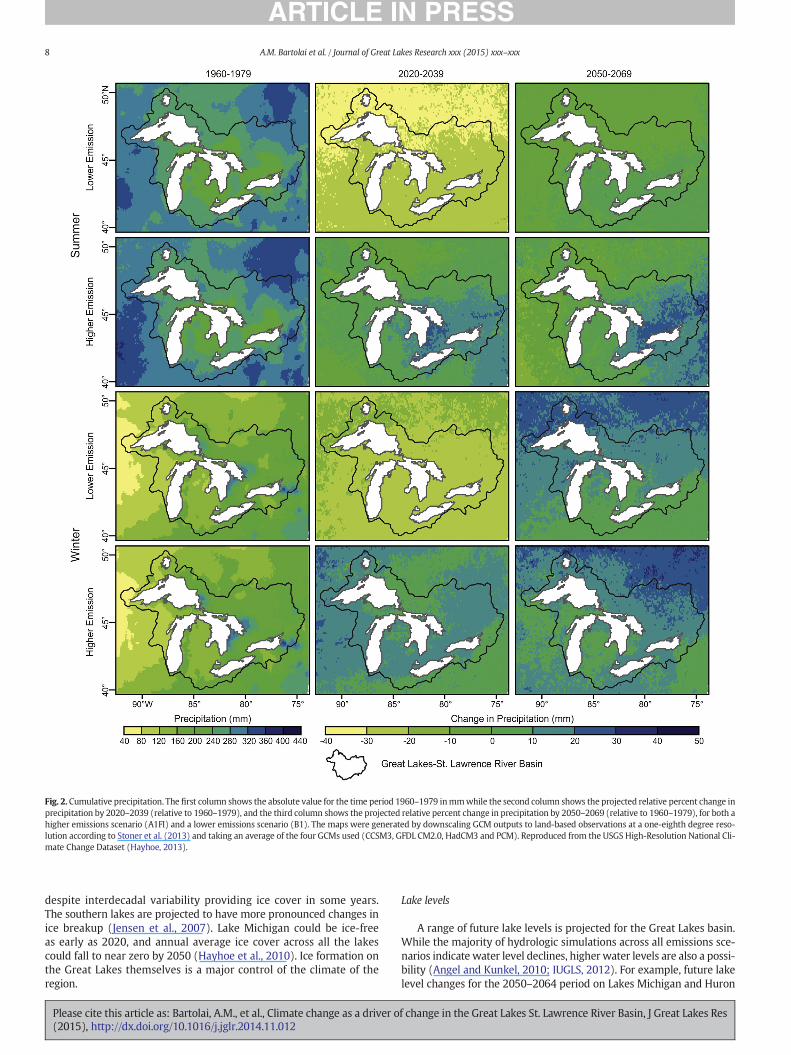
Fig. 2. Cumulative precipitation. The first column shows the absolute value for the time period 1960–1979 inmmwhile the second column shows the projected relative percent change inprecipitation by 2020–2039 (relative to 1960–1979), and the third column shows the projected relative percent change in precipitation by 2050–2069 (relative to 1960–1979), for both ahigher emissions scenario (A1FI) and a lower emissions scenario (B1). The maps were generated by downscaling GCM outputs to land-based observations at a one-eighth degree reso-lution according to Stoner et al. (2013) and taking an average of the four GCMs used (CCSM3, GFDL CM2.0, HadCM3 and PCM). Reproduced from the USGS High-Resolution National Cli-mate Change Dataset (Hayhoe, 2013).
8 A.M. Bartolai et al. / Journal of Great Lakes Research xxx (2015) xxx–xxx
despite interdecadal variability providing ice cover in some years.The southern lakes are projected to have more pronounced changes inice breakup (Jensen et al., 2007). Lake Michigan could be ice-freeas early as 2020, and annual average ice cover across all the lakescould fall to near zero by 2050 (Hayhoe et al., 2010). Ice formation onthe Great Lakes themselves is a major control of the climate of theregion.
Please cite this article as: Bartolai, A.M., et al., Climate change as a driver o(2015), http://dx.doi.org/10.1016/j.jglr.2014.11.012
Lake levels
A range of future lake levels is projected for the Great Lakes basin.While the majority of hydrologic simulations across all emissions sce-narios indicate water level declines, higher water levels are also a possi-bility (Angel and Kunkel, 2010; IUGLS, 2012). For example, future lakelevel changes for the 2050–2064 period on Lakes Michigan and Huron
f change in the Great Lakes St. Lawrence River Basin, J Great Lakes Res
9A.M. Bartolai et al. / Journal of Great Lakes Research xxx (2015) xxx–xxx
range from a decline of around 1.5 m to an increase of more than 1 m(Angel and Kunkel, 2010). Modeling future lake level changes isconstrained by the high degree of uncertainty in estimating lake evapo-ration and watershed evapotranspiration. Previous climate change as-sessments may have overestimated increases in evaporation andassociated decreases in lake levels (IUGLS, 2012). A recent climatechange assessment used an energy-balance approach, coupling the hy-drologic cycle with land, air and water (Lofgren and Gronewold, 2012).These preliminary projections showed similar or slightly increased lakelevels due to an increased frequency of precipitation events for thelower Great Lakes. Nevertheless, the IUGLS (2012) indicated thatwhile future lowerwater levels are likely, the possibility of higher levelsmust also be incorporated in water management and planning.
Water and sediment delivery
Increased occurrences of both floods and droughts are expected by2063 and will influence runoff and sediment delivery (Hayhoe et al.,2010). Average annual total runoff is projected to increase by approxi-mately 7 to 9% over the Great Lakes basin for A1, B1 and A1B emissionsscenarios (Cherkauer and Sinha, 2010). Areas impacted by lake-effectprecipitation will experience larger increases in mid-winter melt andspring melt runoff relative to the rest of the Great Lakes basin by theend of the century (Cherkauer and Sinha, 2010). Summer and fall runoffis more inconsistent and is dependent on emissions scenario. Cherkauerand Sinha (2010) projected that on an annual average basis, regionalprecipitation in winter and spring would be sufficient to erase summerwater deficits, but noted that it would leave the region susceptible todrought conditions into the spring wet season.
Land use change can also influence runoff in a basin. In theMidwestUS, many natural forest and grassland ecosystems became agriculturaland urban landscapes (Lofgren andGronewold, 2012). Increased imper-vious surfaces associatedwith urban development and exposed agricul-tural soils tend to decrease the amount of rainfall that percolates and isabsorbed by soil and vegetation. Changes in agricultural practices (e.g., ashift to irrigation-dependent agriculture due to reduced summer pre-cipitation), might influence the amount of runoff as well (Hall et al.,2007). Irrigation is a consumptive water use, and most water with-drawn does not return to the basin, thus increased irrigation usewill re-duce recharge to groundwater aquifers (Hall et al., 2007).
Sediment delivery to the Great Lakes basin includes sediment loadsfrom contributing tributaries, the land surface and erosion along thecoastline. Extreme precipitation events and projected increases in run-off can increase surface and in-stream erosion that is delivered to theLakes – particularly in the winter and spring when runoff is anticipatedto be greater. Coastal bluff erosion is a concern in the basin as it canoften threaten infrastructure stability along developed shorelines. Re-duced winter ice cover is anticipated to increase wind and wave turbu-lence, accelerating coastal bluff erosion during the winter months(Mackey, 2012) while potentially lower lake levels could leave bluffsless vulnerable to erosion. Polluted sediments are also the main causeof food web contamination in fish advisory warnings.
Biological and chemical contamination
Chemical contaminants can be transported via sediment, water, andatmospheric deposition into the waters of the Great Lakes basin.Projected changes in temperature, precipitation, and atmospheric circu-lation are likely to impact howpathogens and chemicals are transportedand dispersed into the environment (Boxall et al., 2009). Increases inprecipitation intensity will exacerbate the loss of nutrients and pesti-cides from the landscape and promote lake eutrophication (Dalogluet al., 2012).More intense precipitation events interspersedwith longerdry spells would affect the dilution and residence times of these andother pollutants such as metals and pathogens in water bodies(Whitehead et al., 2009). This will most likely occur in spring, when
Please cite this article as: Bartolai, A.M., et al., Climate change as a driver o(2015), http://dx.doi.org/10.1016/j.jglr.2014.11.012
higher precipitation is projected and vegetation cover is low(Dempsey et al., 2008). The resulting excess level of nutrients can leadto abundant algae and eutrophication, affecting drinking water treat-ment facilities, recreational water activities and biota.
Increases in extreme precipitation events can also overburden com-bined sewage overflow systems in the Great Lakes region (which existin over 180 communities), allowing untreated discharge to enterwater bodies (Patz et al., 2008). Contamination events typically occurwhen precipitation amounts exceed 5 to 6.4 cmwithin a 24-hour period(exceedances that are projected to increase in the future). In an assess-ment for Chicago, the frequency of overflow occurrences is expected toincrease from one event every other year to 1 to 1.2 events per yearbased on lower and higher GHG emissions scenarios, respectively(Patz et al., 2008). It is possible that overflows will lead to an increaseof contaminants (e.g. metals, bacteria, pathogens, and pesticides) inwater bodies, causing health concerns (e.g. waterborne diseases) andimpacts to the recreational economy (e.g., beach advisories, recreationalfishing) (Patz et al., 2008).
Ecological impacts on wildlife and vegetation
Changing climate has implications for the flora and fauna of thebasin. The distribution, abundance, and range of species including fish,mammals, and birdswill likely be affected bywarming lake and air tem-peratures. For example, therewill bemore habitats for warm-water fishspecies (native and non-natives) and less for cold-water species; cold-water species will be more stressed (Cline et al., 2013; Magnusonet al., 1997). Changes in ice cover play a significant role in the wintermixing within the lakes, impacting fish and zooplankton communitieswho rely on winter mixing for the delivery of oxygen and food sourcesto the deeper reaches of the lakes (Jensen et al., 2007; Sharma et al.,2011). Ice cover tends to protect near-shore regions from waves anderosion (Wang et al., 2010) and acts as an insulator to keep water tem-perature steady. Near-shore stress from shoreline erosion and fluctuat-ing water levels can have negative ecological impacts on many fishspecies due to high turbidity loads and sedimentation impacts onspawning and nursery habitats (Mackey, 2012).
Increased temperature and CO2 concentrations can change the pro-ductivity and distribution of plant species within the Great Lakesbasin. At present, the basin is 60% forest cover, (51% forest on the USportion and 73% on the Canadian portion) and forest management canlead to significant changes in carbon storage (Wormstead et al., 2009).Millar et al. (2007) suggest that adaptively managing forest resistanceto impacts, resilience in the face of disturbance, and response in theface of changing climate will enable forests to thrive under rapidlychanging conditions. Climate change might also have significant im-pacts on agricultural production and crop yield. Longer growing seasonsand increased CO2 can increase certain crop yields, while extreme cli-mate events may reduce yields and increase dependence on irrigation(Hall, 2012).
Future scenarios
The Great Lakes Futures Project assembled stakeholders from thebasin for aworkshop in January 2013 to explore how different decisionson mitigation and adaptation implementation could unfold over thenext 50 years (Laurent et al., in this issue). Three future histories, fromthe perspective of the year 2063 are developed to present status quo,dystopian, and utopian conditions that we have termed “The Fog”,“TheWreckage”, and “The Lighthouse”, respectively. Each future historypresents a story line consisting of a summary of current conditions andthe mitigation and adaptation options that were utilized or dismissedwithin the region. The resultant future impacts that were discussed ear-lier in this article are seen to have emerged due to the interaction of cli-mate change with other drivers.
f change in the Great Lakes St. Lawrence River Basin, J Great Lakes Res
10 A.M. Bartolai et al. / Journal of Great Lakes Research xxx (2015) xxx–xxx
Status quo: “The Fog”
GHGemissions growth slowed, but did not level off or decrease,whichresulted in atmospheric concentrations continuing to increase. For de-cades, the international and national political environments hindered sig-nificant changes directed at mitigating climate change. Many GHGreduction initiatives in the region faded after a fewyears due to dwindlingpublic interest and budget cuts. Global emissions reductions maintainedearly 21st century GHG concentration levels, slowing the upward trendwithout reversing it; average air temperatures are now 3 °C warmer inthe basin.
MitigationMitigation efforts were started early in the 21st century, but were
not aggressive enough to provide significant changes in emissions orto slow increasing energy demand. Provinces and states enacted renew-able energy portfolio standards requiring a reduction in carbon emis-sions by switching 10 to 30% of energy generation to renewableresources by 2020 or 2030. However, increased energy demand, partic-ularly in summer months, continued to require the use of coal and nat-ural gas to meet peak loads. Several states met their new portfoliorequirements and demand by purchasing renewable energy from out-side of the basin instead of decreasing their fossil fuel generation. Natu-ral gas production reduced more expensive coal use for energy.However, natural gas production came at the expense of low-carbon re-newables as it was more competitively priced due to unchanged fuelsubsidies and no implementation of a continental carbonmarket.With-out a strong consensus to implement stricter carbon emission policies,regional and global GHG emissions continued to increase CO2 in theatmosphere.
AdaptationAwarming of several degrees and other associated changes in climate
had a significant impact on the basin. Without strong, coordinated initia-tives at all scales of governance; adaptationwas ad hoc, slow and difficult.Increased incidence and severity of pests, disease and forest fires reducedforest land cover and damaged field crops. Farmers had to increase pestmanagement efforts, which increased input costs and impacted waterquality. Imported fruits and vegetables became more expensive due todrought and productivity declines in other regions. This created opportu-nities for local farmerswho took advantage of drip irrigationmethods andhigher commodity prices and converted to greenhouse farming. Urbanpopulations continued to grow in the region but sprawl was more com-mon than dense development. Cities used “green infrastructure” to ab-sorb runoff from heavy precipitation events by retaining stormwaterand filtering contaminants but most natural shoreline wetland ecosys-tems were developed, reducing biodiversity. Warmer lake temperaturescreated thermal habitat conducive to the spread of established invasivespecies and many native cold water fish populations were outcompetedby aggressive invasives. The commercial and sports fisheries struggledto remain economically viable despite expensive efforts at managing in-vasive species and restocking. The summer recreation industrywelcomedlonger boating seasons but was affected by lower water levels closingmanymarinas.Warmer, but highly variablewinter temperatures affectedmost outdoor ice skating rinks and reduced cross country skiing opportu-nities. Support for large-scale changes to energy generation and conserva-tion was not evident until many decades into the new century, oncechanges became too large to dispute and economic lossesweremountingacross industries.
A dystopian future: “The Wreckage”
Despite dire warnings from climate scientists, very little progress wasmade in reducingGHGemissions or preparing for an unpredictable futureclimatewithin the basin. GHGemissions continued on their early-centurytrajectory with atmospheric GHG concentrations setting even higher
Please cite this article as: Bartolai, A.M., et al., Climate change as a driver o(2015), http://dx.doi.org/10.1016/j.jglr.2014.11.012
records than expected, raising annual average temperatures by 5 °C.This coincided with a lack of public and government support for im-mediate and lasting changes to the status quo for climate changemitigation. Hope had been placed on finding new GHG reducingtechnologies, but with minimal investment in research and innova-tion, very little has materialized. Similarly, investment in local adap-tation preparation was insufficient. Actual temperature increases,precipitation changes and extreme events (e.g., droughts andheavy rain storms) were more significant locally than projectionsfrom GCMs and RCMs using the IPCC SRES scenarios. Fragmentedand unenforced governmental policy meant the failure of binationalcooperation such as the Great Lakes Water Quality Agreement. Thebasin has experienced many greater than anticipated impacts.
MitigationProgress on climate change policieswas prevented by sluggish econo-
mies and partisan politics.Without federal leadership, the basin's regionalcommunities did not uphold non-binding emissions reduction targets inindustry or energy production. More broadly, developing countries usedfossil fuels for short-termeconomic development offsetting gains in emis-sions reductions by other developed nations. Population growth, in con-junction with more summer heat waves, increased cooling demand andenergy consumption has exceeded development of renewable energysources.
AdaptationWhile the Great Lakes-St. Lawrence River basin is relatively wealthy,
its adaptive capacity is low as there was little investment in research,training or implementation of innovative change. In addition, the basinabsorbed climate refugees from within North America as well as othercountries affected by rising sea levels, severe storms, andwater stress. Cli-mate changes and effects have been significant. The demographics of thebasin became biased towards the very young and oldwho struggledwithrespiratory and heat related illness, while young graduates left for betterjobs elsewhere. Innovative ideas for coping with the drastic weatherchanges have been ignored or not implemented where most needed.Chronic low lake levels have impacted commercial shipping, hydropowergeneration, and access and amenity of lakefront properties. Beaches andmarinas are now separated by mudflats from the water, and farmers arerestricted from lake water irrigation, forcing them to dig deeper forgroundwater. Cities around the basin were required to invest inupgrading drinkingwater treatment andmoving lake intakes at great ex-pense due to declining lake water levels and quality. Many cities that didnot upgrade their stormwater management facilities had to spend manytimes more recovering from damage due to flash floods and collapsedsewers caused bymore intense storm events. Additionally, costs associ-ated with repairing property and infrastructure damage from severeweather events such as flooding has affected many communities andindividuals. Families that could afford them bought household treat-ment systems to cope with more frequent boil water advisories. Mu-nicipal hospitals became overwhelmed with treating rising cases ofwater-borne illnesses such as E.coli after more frequently occurringflood events. Urban sprawl in coastal cities continues unabated andis consuming the remaining wetlands in the region, further remov-ing the abilities of the lakes to absorb increased nutrient and con-taminant loading from industrialized agriculture. Cold water fishspecies were replaced by warm water and invasive species, causinga total collapse of what was left of the fishing industry. Job supplyis decreasing as many employers leave the basin for other regionsthat invested in the future by modernizing infrastructure and wel-coming renewable energy.
A utopian future: “The Lighthouse”
The Lighthouse future represents a concerted global effort to re-spond seriously and rapidly to the threat of climate change through
f change in the Great Lakes St. Lawrence River Basin, J Great Lakes Res
11A.M. Bartolai et al. / Journal of Great Lakes Research xxx (2015) xxx–xxx
mitigation resulting in a significant reduction in GHG emissions, and aneventual decline in GHG concentrations. The magnitude and rate of cli-mate change were reduced with average warming of only 2 °C. Newtechnology provided more effective, low-cost solutions to reducingemissions and improving resilience to climate change. Grassroots sup-port for climate change action allowed for governmental and businesssector change; the region has become a leader in energy conservationand significantly reducing GHG emissions.
MitigationThe Lighthousewas achieved by improving energy efficiency, reduc-
ing GHG emissions through improved technology and pricing struc-tures and was buoyed by significant sequestration programs. Buildingcodes in the region were changed to implement new ultra-efficientstandards such as the Passivhaus and Zero-Energy Building standards(Musall et al., 2010;Wahlström et al., 2012). Local governments provid-ed incentives for renovating and retrofitting commercial and residentialbuildings to reduce energy use by more than half. To compel improve-ments in efficiency, governments created realistic pricing structuresfor energy andwater use in the region including infrastructure, delivery,and water treatment. A new, non-energy intensive method for seques-tration and post-carbon capture reduced the carbon footprint of manyindustries including power plants. Great Lakes states followed Québecand Ontario's leads and joined the Western Climate Initiative and acap and trade market (MDDEP, 2002). Carbon pricing allows the re-newable energy sector to be market-competitive and significantfunding of carbon sequestration technology research was providedto achieve commercial success. Managed development of the chang-ing forests using species diversity controlled disease and fire lossesand contributed to sequestration. Changes in climate are still affect-ing ecosystems and society, but the strict emission reductionshelped curb the rate and magnitude of change and lessened drasticimpacts.
AdaptationAs a society, the Great Lakes basin had significant human and finan-
cial capital to apply to the changing climate relative to other areas of theworld. Investing in multi-disciplinary research expanded the adaptiveknowledge base for the communities and fostered new and innovativetechnology and ideas, with an emphasis on environmental resilience.A dense, long-term environmental monitoring network supportedregional environmental impact modeling and early-detection ofrisk factors. Integrated water resources management made for acommunity-determined, adaptive approach, which used climatemodels to plan infrastructure resilience projects such as water treat-ment plants, dam and levee maintenance, bridges, and roadways. Sepa-rating the aging combined sewer and storm drainage systems reducedwater treatment costs and prevented combined sewer overflows. Natu-ral stormwater and flood control methods, such as wetlands, helped toprotect shoreline habitats and personal property. Consumers becameaware of their water use and carbon footprint through key initiatives.Widespread installation of digital watermetering systems helped to re-duce water demand. Development of the smart-grid for energy trans-mission significantly reduced transmission loss. Adaptive planningsignificantly benefited the region's economy. The states, provinces andFirst Nations communities have developed a holistic, trans-boundaryeconomy facilitating the cross-border movement of goods taking ad-vantage of each community's strengths in manufacturing and laborthereby improving the economic strength of the region. Removing ob-stacles to economic cooperation improved overall transboundary gov-ernance, allowing a continent-wide carbon market to be put in place.There was recognition that surface waters were best managedbinationally on a basin scale instead of existing political boundaries en-suring strong, cooperative, cross-boundary management of shared wa-ters and improving water security for the entire region (Zubrycki et al.,2011). Redevelopment of brownfield sites in the former “Rust Belt”
Please cite this article as: Bartolai, A.M., et al., Climate change as a driver o(2015), http://dx.doi.org/10.1016/j.jglr.2014.11.012
region boosted local economies and idle industrial-zoned land wasrepurposed instead of developing natural areas. Factorieswere convert-ed to manufacture items related to renewable energy, such as solar ar-rays, wind turbines, and new technologies, increasing the viability ofrenewable energy in the region and providingwell-paid jobs. The entireregion united and supported change. The foresight resulted in a regionwith a growing economy, rich in well-paying, green jobs, a safer andcleaner environment than 2013, and regional pride in giving our chil-dren a promising future.
Conclusions and recommendations
The evidence of climate change in the Great Lakes basin can al-ready be seen in reduced lake ice extent and warmer air and watertemperatures. Projections indicate that those trends will continueand might become more extreme in the future. A warmer climatewith more severe precipitation events will exacerbate existingwater resource management issues such as flooding, infrastructurefailure, transport of sediment and contaminants, water quality deg-radation, combined sewer overflows, shoreline erosion, and tempo-rary water shortages. The associated damages and economic losseswill involve substantial monetary costs. The implementation of mit-igation and adaptation strategies will be crucial in shaping the eco-logical, social and economic future of the basin.
Achievement of the Utopian Lighthouse future depends on manyglobal factors, however with the right approach, the citizens of thebasin can have a significant impact on their future and foster hope andchange at a continental if not global scale. Most importantly, this re-quires implementing immediate and continuingmitigation and adapta-tion strategies. Energy consumption must be reduced through energyconservation in homes, buildings and factories' lighting, heating andcooling. Raising fuel efficiency and emissions standards can reduceemissions from vehicles. To encourage both energy conservation andimprovements in efficiency, a government action such as creating a uni-fied carbon market across the basin would price the true cost of fossilfuels and level the playing field for more sustainable energy sources.An improved environmental monitoring network across the basin canassist with future modeling but also help with near-term risk-assessment such as flash flooding. Infrastructure upgrades must incor-porate the implications of a changing climate. Thiswill involve upgradesto urban stormwater systems for dealing with heavy rains, improvingwater treatment plants' capacities, and reexamining drinking watertreatment plants' intakes originating within the lakes. Critical infra-structure such as power plants, transportation (bridges, roads, railways)and hospitals will need to be sited and retrofitted for protection againstnatural hazard events such as flooding. Additionally, there needs to beemergency planning and preparation for dealing with regional disas-ters. Evidence suggests that prevention is much cheaper than a cure;the Federal Emergency Management Agency demonstrated that forevery dollar spent on natural hazard mitigation, four dollars weresaved from damages averted (MMC, 2005). Investments in energy con-servation, efficiency, and infrastructure can immediately boost theeconomy of the region and reduce costs in the long term and shouldnot be seen as costly expenses by business and government interests.An adaptive management approach will help the region iteratively in-corporate lessons learned into the planning and policy process. A sus-tainable Great Lakes region will require a knowledgeable and engagedsociety, with changes in governance and the energy sector that promoteresponsible strategies for maintaining a healthy economy andecosystem.
Acknowledgments
Wewould like to thank Dr. Katharine Hayhoe (Texas Tech Universi-ty) for lending her expertise and sharing the models from her High-Resolution National Climate Change Dataset. We acknowledge the
f change in the Great Lakes St. Lawrence River Basin, J Great Lakes Res
12 A.M. Bartolai et al. / Journal of Great Lakes Research xxx (2015) xxx–xxx
Canada Research Chair (950-228034) and Canadian Network of AquaticEcosystem Services (417353-2011) grants to Dr. Irena Creed (and herstaff J. Miller and D. Aldred) who assisted in editing and preparing themaps of temperature and precipitation in the basin based onmodel out-put. We also acknowledge I. Creed, K. Friedman, K. Laurent and theanonymous reviewers for their reviewing a draft of the manuscript.
References
American Electric Power (AEP), 2011. AEP Places Carbon Capture Commercialization onHold, Citing Uncertain Status of Climate Policy, Weak Economy. AEP CorporateNews Releases. Accessed online 27-09-2013 at. http://www.aep.com/newsroom/newsreleases/Default.aspx?id=1704.
Andresen, J., Hilberg, S., Kunkel, K., 2012. Historical climate and climate trends in themid-western USA. In: Winkler, J., Andresen, J., Hatfield, J., Bidwell, D., Brown, D. (Eds.), USNational Climate Assessment Midwest Technical Input Report (Accessed online 18-01-2013 at: http://glisa.umich.edu/docs/NCA/MTIT_Historical.pdf).
Angel, J.R., Kunkel, K.E., 2010. The response of Great Lakes water levels to future climatescenarios with an emphasis on Lake Michigan–Huron. J. Great Lakes Res. 36, 51–58.
Argyilan, E.P., Forman, S.L., 2003. Lake level response to seasonal climatic variability in theLake Michigan–Huron system from 1920 to 1995. J. Great Lakes Res. 29 (3), 488–500.
Assel, R., Cronk, K., Norton, D., 2003. Recent trends in Laurentian Great Lakes ice cover.Clim. Chang. 57, 185–204.
Assel, R.A., Quinn, F.H., Sellinger, C.E., 2004. Hydroclimatic factors of the recent recorddrop in Laurentian Great Lakes water levels. Bull. Am. Meteorol. Soc. 85, 1143–1151.
Austin, J., Affolter-Caine, B., 2006. The Vital Center: A Federal-State Compact to Renewthe Great Lakes Region. The Brookings Institution Metropolitan Policy Program,Washington, DC (Accessed online 09-26-2014 at: http://www.brookings.edu/~/media/research/files/reports/2006/10/metropolitanpolicy%20austin/20061020_renewgreatlakes.pdf).
Austin, J.A., Colman, S.M., 2007. Lake Superior summer water temperatures are increasingmore rapidly than regional air temperatures: a positive ice-albedo feedback.Geophys. Res. Lett. 34, L06604. http://dx.doi.org/10.1029/2006GL029021.
Ballinger, T.J., Allen, M.J., Rohli, R.V., 2014. Spatiotemporal analysis of the January North-ern Hemisphere circumpolar vortex over the contiguous United States. Geophys.Res. Lett. 41, 3602–3608. http://dx.doi.org/10.1002/2014GL060285.
Bates, B.C., Kundzewicz, Z.W., Wu, S., Palutikof, J.P. (Eds.), 2008. Climate Change andWater. Technical Paper VI of the Intergovernmental Panel on Climate Change. IPCCSecretariat, Geneva, p. 210 (Accessed online 10-08-2014 at: http://www.ipcc.ch/pdf/technical-papers/climate-change-water-en.pdf).
Bird, D.N., Boysen, E., 2007. Climate Change Research Information Note 5: The Carbon Se-questration Potential from Afforestation in Ontario. Ontario Ministry of Natural Re-sources. Accessed online 10-08-2014 at: http://www.climateontario.ca/MNR_Publications/276909.pdf.
Bonsal, B.R., Zhang, X., Vincent, L.A., Hogg,W.D., 2001. Characteristics of daily and extremetemperatures over Canada. J. Clim. 14, 1959–1976.
Boxall, A.B., Hardy, A., Beulke, S., Boucard, T., Burgin, L., Falloon, P.D., Haygarth, P.M.,Hutchinson, T., Kovats, R.S., Leonardi, G., Levy, L.S., Nichols, G., Parsons, S.A., Potts,L., Stone, D., Topp, E., Turley, D.B., Walsh, K., Wellington, E.M.H., Williams, R.J., 2009.Impacts of climate change on indirect human exposure to pathogens and chemicalsfrom agriculture. Environ. Health Perspect. 117, 508–514.
Brown, E.A., Wu, C.H., Mickelson, D.M., Edil, T.B., 2005. Factors controlling rates of bluff re-cession at two sites on Lake Michigan. J. Great Lakes Res. 31, 306–321.
Brown, P.J., Bradley, R.S., Keimig, F.T., 2010. Changes in extreme climate indices for thenortheastern United States, 1870–2005. J. Clim. 23, 6555–6572.
Cherkauer, K.A., Sinha, T., 2010. Hydrologic impacts of projected future climate change inthe Lake Michigan region. J. Great Lakes Res. 36, 33–50.
Cline, T.J., Bennington, V., Kitchell, J.F., 2013. Climate change expands the spatial extentand duration of preferred thermal habitat for Lake Superior fishes. PLoS ONE 8 (4),e62279.
Daloglu, I., Cho, K.H., Scavia, D., 2012. Evaluating causes of trends in long-term dissolvedreactive phosphorus loads to Lake Erie. Environ. Sci. Technol. 46 (19), 10660–10666.
Davis, R.E., Lowit, M.B., Knappenberger, P.C., Legates, D.R., 1999. A climatology of snow-fall–temperature relationships in Canada. J. Geophys. Res. Atmos. 104, 11985–11994.
DeGaetano, A.T., 2009. Time-dependent changes in extreme-precipitation return-periodamounts in the continental United States. J. Appl. Meteorol. Climatol. 48, 2086–2099.
Dempsey, D., Elder, J., Scavia, D., 2008. Great Lakes Restoration and the Threat of GlobalWarming. Prepared for the Healing our Waters-Great Lakes Coalition. Accessed on-line 10-08-2014 at: http://online.nwf.org/site/DocServer/Great_Lakes_Report.pdf?docID=3901.
Department of Fisheries and Oceans Canada (DFO), 2007. Water Levels Great Lakes andMontreal Harbour, Monthly Water Level Bulletin, September 2007. Department ofFisheries and Oceans Canada (DFO) — Canadian Hydrographic Service (Accessed on-line 16-03-2014 at: http://www.waterlevels.gc.ca/C&A/bulletin_e.html).
Department of Fisheries and Oceans Canada (DFO), 2013a. Central and Arctic Region His-torical Water Level Data. Department of Fisheries and Oceans Canada (DFO)— Cana-dian Hydrographic Service (Accessed online 16-03-2014 at: http://www.waterlevels.gc.ca/C&A/network_means.html).
Department of Fisheries and Oceans Canada (DFO), 2013b. Water Levels Great Lakes andMontreal Harbour, Monthly Water Level Bulletin, January, 2013. Department of Fish-eries and Oceans Canada (DFO) — Canadian Hydrographic Service (Accessed online16-03-2014 at: http://www.waterlevels.gc.ca/C&A/bulletin_e.html).
Please cite this article as: Bartolai, A.M., et al., Climate change as a driver o(2015), http://dx.doi.org/10.1016/j.jglr.2014.11.012
Desai, A.R., Austin, J.A., Bennington, V., McKinley, G.A., 2009. Stronger winds over a largelake in response to weakening air-to-lake temperature gradient. Nat. Geosci. 2,855–858.
Diethelm, P., McKee, M., 2009. Denialism: what is it and how should scientists respond?Eur. J. Pub. Health 19, 2–4.
Ding, D., Maibach, E., Zhao, X., Roser-Renouf, C., Leiserowitz, A., 2011. Support for climatepolicy and societal action are linked to perceptions about scientific agreement. Nat.Clim. Chang. 1, 462–466.
Eagle, A.J., Olander, L.P., 2012. Greenhouse gas mitigation with agricultural land manage-ment activities in the United States—a side-by-side comparison of biophysical poten-tial. In: Sparks, D.L. (Ed.), Advances in Agronomy vol. 115. Academic Press, San Diego,CA, pp. 79–139.
Easterling, D.R., Meehl, G.A., Parmesan, C., Changnon, S.A., Karl, T.R., Mearns, L.O.,2000. Climate extremes: observations, modeling, and impacts. Science 289,2068–2074.
Environment Canada (EC), 2010. National Inventory Report 1990–2010: Greenhouse GasSources and Sinks in Canada. Environment Canada. Accessed online 10-08-2014 at.http://unfccc.int/national_reports/annex_i_ghg_inventories/national_inventories_submissions/items/6598.php.
Environment Canada (EC), 2013. Great Lakes–St. Lawrence river water levels, Michigan–Huron sets two new recorded lows in January 2013. Environment Canada: LEVELnews. 21(2) (Accessed online 10-08-2014 at: http://www.ec.gc.ca/eau-water/default.asp?lang=En&n=7AD8D7A7-1).
Gotham, D.J., Angel, J.R., Pryor, S.C., 2012. Vulnerability of the electricity and water sectorsto climate change in the Midwest. In: Pryor, S.C. (Ed.), Climate Change in the Mid-west: Impacts, Risks, Vulnerability and Adaptation. Indiana University Press, Bloom-ington, IN, pp. 192–211.
Great Lakes and St. Lawrence Cities Initiative (GLSLCI), 2013. 10th Anniversary — AnnualReport. Accessed online 10-09-2014 at: http://www.glslcities.org/annual-meetings/2013/2012-13%20Annual%20Report%20Final.pdf.
Great Lakes Commission (GLC), 2008. The Economics of Soil Erosion and Sedimen-tation in the Great Lakes Basin. Prepared for the US Army Corps of EngineersGreat Lakes & Ohio River Division. Accessed online 10-08-2014 at: http://projects.glc.org/tributary/pubs/documents/Economics_of_Soil_Erosion_Final.pdf.
Great Lakes Restoration Initiative (GLRI), 2010. Great Lakes Restoration Initiative Projects.US Environmental Protection Agency. Accessed online 12-08-2012 at: http://greatlakesrestoration.us/projects.html.
Groisman, P.Y., Easterling, D.R., 1994. Variability and trends of total precipitation andsnowfall over the United States and Canada. J. Clim. 7, 184–205.
Gula, J., Peltier, R.W., 2012. Dynamical downscaling over the Great Lakes basin of NorthAmerica using theWRF regional climate model: the impact of the Great Lakes systemon regional greenhouse gases. J. Clim. 25, 7723–7742.
Hall, K., 2012. Climate change in the Midwest: impacts on biodiversity and ecosystems.In: Winkler, J., Andresen, J. (Eds.), US National Climate Assessment, Midwest Techni-cal Input Report (Accessed online 10-08-2014 at: http://glisa.umich.edu/media/files/NCA/MTIT_Biodiversity.pdf).
Hall, N.D., Stuntz, B.B., Schweiger, L., 2007. Climate Change and Great Lakes Water Re-sources. National Wildlife Federation. Accessed online 10-08-2014 at https://www.nwf.org/News-and-Magazines/Media-Center/Reports/Archive/2007/Great-Lakes-Water-Resources.aspx.
Hayhoe, K., 2013. Development and dissemination of a high-resolution national climatechange dataset. Final Report for United States Geological Survey, USGSG10AC00248 (Accessed online 10-08-2014 at: https://nccwsc.usgs.gov/display-project/5050cc22e4b0be20bb30eacc/4f833ee9e4b0e84f608680df).
Hayhoe, K., VanDorn, J., Croley, T., Schlegal, N., Wuebbles, D., 2010. Regional climatechange projections for Chicago and the US Great Lakes. J. Great Lakes Res. 36, 7–21.
Hodgkins, G.A., Dudley, R.W., Aichele, S.S., 2007. Historical changes in precipitation andstreamflow in the U.S. Great Lakes Basin, 1915–2004. U.S. Geological Survey ScientificInvestigations Report, 2007-5118. Accessed online 10-08-2014 at: http://pubs.usgs.gov/sir/2007/5118/pdf/SIR2007-5118.pdf.
Intergovernmental Panel on Climate Change (IPCC), 2000. Special Report on EmissionsScenarios: A Special Report of Working Group III, Section 4.2 SRES Scenario Taxono-my. IPCC. Accessed online 11-26-2012 at: http://www.ipcc.ch/ipccreports/sres/emission/index.php?idp=91.
Intergovernmental Panel on Climate Change (IPCC), 2001. Climate Change 2001: The Sci-entific Basis. Contribution of Working Group I to the Fourth Assessment Report of theIntergovernmental Panel on Climate Change. Cambridge University Press, Cambridge,UK (Accessed online 10-08-2014 at: http://www.ipcc.ch/ipccreports/tar/wg1/pdf/WG1_TAR-FRONT.PDF).
Intergovernmental Panel on Climate Change (IPCC), 2007. Contribution of WorkingGroup II to the Fourth Assessment Report of the Intergovernmental Panel on ClimateChange. Cambridge University Press, Cambridge, UK (Accessed online 10-08-2014 at:http://www.ipcc-wg2.gov/).
Intergovernmental Panel on Climate Change (IPCC), 2013. Summary for policymakers. In:Stocker, T.F., Qin, D., Plattner, G.K., Tignor, M., Allen, S.K., Boschung, J., Nauels, A., Xia,Y., Bex, V., Midgley, P.M. (Eds.), Climate Change 2013: The Physical Science Basis.Contribution of Working Group I to the Fifth Assessment Report of the Intergovern-mental Panel on Climate Change. Cambridge University Press, Cambridge, UK.
International Joint Commission (IJC), 2003. Climate change andwater quality in the GreatLakes Region. Great Lakes Quality Board of the International Joint Commission. ISBN:1-894280-42-3, p. 135.
International Maritime Organization (IMO), 2009. Prevention of air pollution fromships, second IMO GHG study 2009, update of the 2000 IMO GHG study, execu-tive summary. Maritime Environment Protection Committee, 59th Session,Agenda item 4.
f change in the Great Lakes St. Lawrence River Basin, J Great Lakes Res
13A.M. Bartolai et al. / Journal of Great Lakes Research xxx (2015) xxx–xxx
International Upper Great Lakes Study (IUGLS), 2009. Impacts on Upper Great LakesWater Levels. St. Clair River Final Report to the International Joint Commission bythe International Upper Great Lakes Study Board. International Joint Commission,Clair River 978-1-100-14159-6.
International Upper Great Lakes Study (IUGLS), 2012. Lake Superior regulation: address-ing uncertainty in Upper Great Lakes Water Levels. Final Report to the InternationalJoint Commission by the International Upper Great Lakes Study Board. InternationalJoint Commission. ISBN: 978-1-100-20324-9.
Jensen, O.P., Benson, B.J., Magnuson, J.J., Card, V.M., Futter, M.N., Soranno, P.A., Stewart,K.M., 2007. Spatial analysis of ice phenology trends across the Laurentian GreatLakes region during a recent warming period. Limnol. Oceanogr. 52, 2013–2026.
Karl, T.R., Melillo, J.M., Peterson, T.C., 2009. Global Climate Change Impacts in the UnitedStates. Cambridge University Press, Cambridge, UK.
Kennedy, C., 2014. Great Lakes Ice Cover Most Extensive Since Mid-90s. NOAA. Accessedonline 05-31-2014 at: http://www.climate.gov/news-features/event-tracker/great-lakes-ice-cover-most-extensive-mid-90s.
Kling, G.W., Hayhoe, K., Johnson, L.B., Magnuson, J.J., Polasky, S., Robinson, S.K., Shuter, B.J.,Wander, M.M., Wuebbles, D.J., Zak, D.R., 2003. Confronting climate change in theGreat Lakes region. A report of the Union of Concerned Scientists and the EcologicalSociety of America (Accessed online 10-08-2014 at: http://www.ucsusa.org/sites/default/files/legacy/assets/documents/global_warming/greatlakes_final.pdf).
Kunkel, K.E., Ensor, L., Palecki, M., Easterling, D., Robinson, D., Hubbard, K.G., Redmond, K.,2009. A new look at lake-effect snowfall trends in the Laurentian Great Lakes using atemporally homogeneous data set. J. Great Lakes Res. 35, 23–29.
Lamon, E.C., Stow, C.A., 2010. Lake Superior water level fluctuation and climatic factors: adynamic linear model analysis. J. Great Lakes Res. 36, 172–178.
Laurent, K.L., Scavia, D., Friedman, K.B., Krantzberg, G., Creed, I.F., 2014. Critical forcesdirecting the future: how two highly important and highly uncertain axes of analysiscan frame alternate futures for the Great Lakes–St. Lawrence River Basin. J. GreatLakes Res. (in this issue).
Lenters, J.D., 2004. Trends in the Lake Superior water budget since 1948: a weakening sea-sonal cycle. J. Great Lakes Res. 30, 20–40.
Lloyd's Register, 2012. MARPOL Annex VI. An update on the entry into effect of the NorthAmerican Emission Control Area for SOx and particulate matter (ECA-SOx). Interna-tional Maritime Organization.
Lofgren, B., Gronewold, A., 2012. Water Resources. US National Climate Assessment Mid-west Technical Input Report. Accessed online 10-08-2014 at: http://glisa.msu.edu/docs/NCA/MTIT_WaterResources.pdf.
Mackey, S.D., 2012. Great Lakes nearshore and coastal systems. In: Winkler, J., Andresen, J.,Hatfield, J., Bidwell, D., Brown, D. (Eds.), US National Climate Assessment, MidwestTechnical Input Report. Great Lakes Integrated Sciences and Assessments (GLISA)Center.
Magnuson, J.J., Webster, K.E., Assel, R.A., Bowser, C.J., Dillon, P.J., Eaton, J.G., Evans, H.E.,Fee, E.J., Hall, R.I., Mortsch, L.R., Schindler, D.W., Quinn, F.H., 1997. Potential effectsof climate changes on aquatic systems: Laurentian Great Lakes and preCambrianshield region. Hydrol. Process. 11 (8), 825–871.
Mao, D., Cherkauer, K.A., 2009. Impacts of land-use change on hydrologic responses in theGreat Lakes region. J. Hydrol. 374, 71–82.
McLellan, S.L., Hollis, E.J., Depas, M.M., Van Dyke, M., Harris, J., Scopel, C.O., 2007. Dis-tribution and fate of Escherichia coli in Lake Michigan following contaminationwith urban stormwater and combined sewer overflows. J. Great Lakes Res. 33,66–580.
Michalak, A.M., Anderson, E.J., Beletsky, D., Boland, S., Bosch, N.S., Bridgeman, T.B.,Chaffrin, J.D., Cho, K., Confesor, R., Daloglu, I., Definto, J.V., Evans, M.A., Fahnenstiel,G.L., He, L., Ho, J.C., Johengen, T.H., Kuo, K.C., LaPorte, E., Liu, X., McWilliams, M.R.,Moore, M.R., Posselt, D.J., Richards, R.P., Scavia, D., Steiner, A.L., Verhamme, E.,Wright, D.M., Zagorski, M.A., 2013. Record-setting algal bloom in Lake Erie causedby agricultural andmeteorological trends consistent with expected future conditions.Proc. Natl. Acad. Sci. U. S. A. 110 (16), 6448–6452.
Millar, C.I., Stephenson, N.L., Stephens, S.L., 2007. Climate change and forests of the future:managing in the face of uncertainty. Ecol. Appl. 17, 2145–2151.
Millerd, F., 2005. The economic impact of climate change on Canadian commercial navi-gation on the Great Lakes. Can. Water Resour. J. 30 (4), 269–280.
Millerd, F., 2011. The potential impact of climate change on Great Lakes internationalshipping. Clim. Chang. 104 (3–4), 629–652.
Ministère du Développement durable, de l'Environnement et des Parcs (MDDEP), 2002. TheQuébec Cap and Trade System for Greenhouse Gas Emissions Allowances.Gouvernement du Québec, Ministère du Développement durable, de l'Environnementet des Parcs. Accessed online 09-02-2013 at: http://www.mddep.gouv.qc.ca/changements/carbone/Systeme-plafonnement-droits-GES-en.htm.
Multihazard Mitigation Council (MMC), 2005. Hazard Mitigation Saves: An IndependentStudy to Assess the Future Savings from Mitigation Activities. National Institute ofBuilding Sciences, Multihazard Mitigation Council. Accessed online 09-29-2013 at.http://www.nibs.org/?page=mmc_projects#nhms.
Musall, E., Weiss, T., Lenoir, A., Voss, K., Garde, F., Donn, M., 2010. Net Zero energy solarbuildings: an overview and analysis on worldwide building projects. Proceedings ofEuroSun (Accessed online 10-08-2014 at: http://www.enob.info/fileadmin/media/Projektbilder/EnOB/Thema_Nullenergie/EuroSun_Conference_Graz_2010_Net_Zero_Energy_Solar_Buildingsx.pdf).
New York State Department of Environmental Conservation (NYSDEC), 2013. ClimateSmart Communities, Local Action to Combat Climate Change. New York State Depart-ment of Environmental Conservation. Accessed online 18-09-2013 at: http://www.dec.ny.gov/energy/50845.html#Climate.
OntarioMinistry of the Environment (OMoE), 2012. Ontario's Long-term Energy Plan. On-tario Ministry of Energy. Accessed online 08-11-2012 at: http://www.energy.gov.on.ca/en/ltep/energy-in-ontarios-economy-capital-investments/.
Please cite this article as: Bartolai, A.M., et al., Climate change as a driver o(2015), http://dx.doi.org/10.1016/j.jglr.2014.11.012
Ontario Power Authority (OPA), 2010. Feed-in Tariff Program Overview. Ontario Power Au-thority. Accessed online 11-15-2012 at: http://fit.powerauthority.on.ca/Storage/11160_FIT_Program_Overview_August_new_price_version_1.3.1_final_for_posting-oct_27.pdf.
Ouyang, D., Bartholic, J., Selegean, J., 2005. Assessing sediment loading from agriculturalcroplands in the Great Lakes Basin. J. Am. Sci. 1, 14–21.
Paehlke, R.C., 2010. Environmental Policy: New Directions for the Twenty-First Century;Sustainable Development and Urban Life in North America. 7th ed. CQ Press, Wash-ington, DC 0-87289-973-X, p. 420.
Paerl, H.W., Huisman, J., 2008. Blooms like it hot. Science 320, 57–58.Painter, J., Ashe, T., 2012. Cross-national comparison of the presence of climate scepticism
in the print media in six countries, 2007–10. Environ. Res. Lett. 7, 8.Pan, Z.T., Arritt, R.W., Takle, E.S., Gutowski,W.J., Anderson, C.J., Segal, M., 2004. Altered hy-
drologic feedback in a warming climate introduces a “warming hole”. Geophys. Res.Lett. 31 L17109.
Patz, J.A., Vavrus, S.J., Uejio, C.K., McLellan, S.L., 2008. Climate change and waterborne dis-ease risk in the Great Lakes region of the US. Am. J. Prev. Med. 35, 451–458.
Peterson, T.C., Baringer, M.O. (Eds.), 2009. State of the Climate in 2008. Bull. Amer. Mete-or. Soc. 90, pp. S1–S196.
Scott, D., Jones, B., Lemieus, G., McBoyle, B., Mills, S.S., Wall, G., 2002. The vulnerability ofwinter recreation to climate change in Ontario's Lakeland's tourism region. Depart-ment of Geography Publication Series, Occasional Paper No. 18. University of Water-loo, Waterloo, ON (87 pp.).
Selin, H., VanDeveer, S.D., 2010. Environmental Policy: New Directions for the Twenty-First Century; Global Climate Change. CQ Press, Washington, DC.
Sellinger, C.E., Stow, C.A., Lamon, E.C., Qian, S.S., 2008. Recent water level declines in theLake Michigan–Huron system. Environ. Sci. Technol. 42, 367–373.
Sharma, S., Vander Zanden, M.J., Magnuson, J.J., Lyons, J., 2011. Comparing climate changeand species invasions as drivers of coldwater fish population extirpations. PLoS ONE 6(8), e22906.
Sousounis, P., Bisanz, J., 2000. Preparing for a Changing Climate: The Potential Conse-quences of Climate Variability and Change. A Summary by the Great Lakes RegionalAssessment Group. US Environmental Protection Agency, US Global Change ResearchProgram. Accessed online 09-10-2014 at: http://www.nrel.colostate.edu/projects/gpa/gpa_report.pdf.
Statistics Canada (SC), 2007. Tillage Practices used to Prepare Land for Seeding, Canadaand Provinces, Census Years 1991 to 2006. Statistics Canada. Accessed online 01-02-2013 at: http://www.statcan.gc.ca/pub/95-632-x/2007000/t/4129758-eng.htm.
Stone, D.A., Weaver, A.J., Zwiers, F.W., 2000. Trends in Canadian precipitation intensity.Atmosphere-Ocean 38, 321–347.
Stoner, A.M.K., Hayhoe, K., Yang, X., Wuebbles, D.J., 2013. An asynchronous regional re-gression model for statistical downscaling of daily climate variables. Int. J. Climatol.33, 2473–2494.
Trumpickas, J., Shuter, B.J., Minns, C.K., 2009. Forecasting impacts of climate change onGreat Lakes surface water temperatures. J. Great Lakes Res. 35, 454–463.
Tsireme, A.I., Nikolaou, E.I., Georgantzis, N., Tsagarakis, K.P., 2012. The influence of envi-ronmental policy on the decisions of managers to adopt G-SCM practices. CleanTechn. Environ. Policy 14, 953–964.
United Nations Framework Convention on Climate Change (UNFCCC), 2009. CopenhagenAccord. Accessed online 05-12-2012 at: http://unfccc.int/resource/docs/2009/cop15/eng/l07.pdf.
United Nations Framework Convention on Climate Change (UNFCCC), 2012. Backgroundon the UNFCCC: The international response to climate change. United Nations Frame-work Convention on Climate Change. Accessed online 05-11-2012 at: http://unfccc.int/essential_background/items/6031.php.
United States Conference of Mayors (USCM), 2008. US Conference of Mayors Climate Pro-tection Agreement. Washington, DC (Accessed online 08-12-2012 at: http://www.usmayors.org/climateprotection/agreement.htm).
United States Department of State (USDS), 2010. US Climate Action Report 2010. GlobalPublishing Services, Washington, DC.
United States Environmental Protection Agency (USEPA), 2012. Climate change and airquality. Our Nation's Air: Status and Trends Through 2010. U.S. Environmental Pro-tection Agency, Office of Air Quality Planning and Standards, pp. 22–24.
Vavrus, S., Van Dorn, J., 2010. Projected future temperature and precipitation extremes inChicago. J. Great Lakes Res. 36, 22–32.
Wahlström, Å., Käck, K., Permer, A., Åhman, P., 2012. What is needed for a market break-through in the construction of passive houses, and the conversion of existing buildingsto passive houses — analysis from a series of seminars. In: Postmyr, L. (Ed.),PassivhusNorden 2012. Akademika forlag, Tapir Akademisk Forlag, Trondheim, Norway.
Wang, J., Bai, X., Leshkevich, G., Colton, M., Cutes, A., Lofgren, B., 2010. Severe ice cover onGreat Lakes during winter 2008–2009. EOS Trans. Am. Geophys. Union 91, 41–42.
Wang, J., Bai, X.Z., Hu, H.G., Clites, A., Colton, M., Lofgren, B., 2012. Temporal and spatialvariability of Great Lakes ice cover, 1973–2010. J. Clim. 25, 1318–1329.
Whitehead, P.G., Wilby, R.L., Battarbee, R.W., Kernan, M., Wade, A.J., 2009. A review of thepotential impacts of climate change on surfacewater quality. Hydrol. Sci. J. 54, 101–123.
Wilcox, D.A., Thompson, T.A., Booth, R.K., Nicholas, J.R., 2007. Lake-Level Variability andWater Availability in the Great Lakes. Virginia, USGS. National Water Availabilityand Use Program, Circular 1311. Accessed online 10-08-2014 at: http://pubs.usgs.gov/circ/2007/1311/pdf/circ1311_web.pdf.
Winkler, J.A., Arrit, R.W., Pryor, S.C., 2012. Climate projections for the Midwest: availabil-ity, interpretation and synthesis. In: Winkler, J., Andresen, J., Hatfield, J., Bidwell, D.,Brown, D. (Eds.), US National Climate Assessment Midwest Technical Input Report(Accessed online 10-08-2014 at: http://glisa.msu.edu/docs/NCA/MTIT_Future.pdf).
Wolfe, D., Ziska, L., Petzoldt, C., Seaman, A., Chase, L., Hayhoe, K., 2008. Projectedchange in climate thresholds in the Northeastern US: implications forcrops, pests, livestock, and farmers. Mitig. Adapt. Strateg. Glob. Chang. 13,555–575.
f change in the Great Lakes St. Lawrence River Basin, J Great Lakes Res

14 A.M. Bartolai et al. / Journal of Great Lakes Research xxx (2015) xxx–xxx
Wormstead, S., Zuccarino-Crowe, C., Han, M., 2009. Forest Lands — Conservation of Bio-logical Diversity. State of the Great Lakes. Accessed online 10-08-2014 at: http://www.epa.gov/solec/sogl2009/8503forestsoil.pdf.
Zhang, X.B., Vincent, L.A., Hogg, W.D., Niitsoo, A., 2000. Temperature and precipitationtrends in Canada during the 20th century. Atmosphere-Ocean 38, 395–429.
Please cite this article as: Bartolai, A.M., et al., Climate change as a driver o(2015), http://dx.doi.org/10.1016/j.jglr.2014.11.012
Zubrycki, K., Roy, D., Venema, H.D., Brooks, D., 2011. Water Security in Canada: Responsi-bilities of the Federal Government. International Institute for Sustainable Develop-ment, Water Innovation Centre (Accessed online 10-08-2014 at: http://www.iisd.org/pdf/2011/water_security_canada.pdf).
f change in the Great Lakes St. Lawrence River Basin, J Great Lakes Res
Related Documents