Adam Hollingworth © NSW Office of Water Climate change and its impacts on water supply and demand in Sydney Summary report

Welcome message from author
This document is posted to help you gain knowledge. Please leave a comment to let me know what you think about it! Share it to your friends and learn new things together.
Transcript

Adam
Holli
ngw
ort
h ©
NSW
Off
ice
of W
ater
Climate change and its impacts on water supply and demand in Sydney
Summary report
ii | Summary report
Acknowledgements
Chapter 1:
Authors: Wenju Cai (CSIRO), Raj Mehrotra (UNSW),
Contributors: Colette Grigg (NSW Office of Water), Jason Martin (SCA), Yue-Cong Wang (Sydney Water) Chapter 2:
Authors: Wenju Cai (CSIRO), Jason Martin (SCA)
Contributors: Tim Cowan (CSIRO), Arnold Sullivan (CSIRO), Dewi Kirono (CSIRO), Ian Macadam,
(CSIRO) Mahes Maheswaran (SCA), Golam Kibria (SCA) Chapter 3:
Authors: Ashish Sharma (UNSW), Raj Mehrotra (UNSW)
Chapter 4:
Authors: Jason Martin (SCA), Golam Kibria (SCA), Mahes Maheswaran (SCA)
Chapter 5:
Authors: Yue-Cong Wang (Sydney Water), Barry Abrams (Sydney Water) Contributors: Frank Spaninks (Sydney Water), Katherine Beatty (Sydney Water), Matthew Inman
(CSIRO), Andrew Grant (CSIRO), Magnus Moglia (CSIRO)
Chapter 6:
Authors: Colette Grigg (NSW Office of Water)
Contributors: Greg Allen (Sydney Water), Mahes Maheswaran (SCA) Project Coordination: NSW Office of Water
Editorial:
Karen Pearce (Bloom Communications), Alison White (NSW Office of Water), Katy Brady (NSW Office of Water), Colette Grigg (NSW Office of Water), Donna Siemsen (SCA) and Cathy O’Toole (SCA)
A NSW and Australian Government sponsored research project conducted in collaboration between
the Commonwealth Scientific and Industrial Research Organisation, the Australian Government
Department of Climate Change and Energy Efficiency, the NSW Department of Environment, Climate Change and Water, the NSW Office of Water, Sydney Catchment Authority, Sydney Water and the University of NSW.
iii | Summary report
Contents
Executive summary ...........................................................................................................................9
1. Introduction..................................................................................................................................17
Investigating climate change and its impacts on water supply and demand in Sydney..............17
Sydney’s surface water supply ..................................................................................................17
Catchment area ...............................................................................................................17 Reservoir and supply system...........................................................................................18 Sydney Water’s delivery and distribution area .................................................................18
Modelling an uncertain future.....................................................................................................18
Global climate modelling..................................................................................................19 Uncertainty and limitations of climate modelling ..............................................................19
About this study .........................................................................................................................21
Study area .......................................................................................................................21 Current climate and climate change projection timeframes..............................................22 Climate modelling and downscaling methods ..................................................................22 Emission scenarios..........................................................................................................23 Climate variables .............................................................................................................23 Water availability and supply ...........................................................................................24 Water demand .................................................................................................................25
2. Understanding Sydney’s climate................................................................................................26
Current climate observations for Sydney ...................................................................................26
Temperature ....................................................................................................................26 Rainfall ............................................................................................................................27 Inflows ............................................................................................................................29 Evaporation .....................................................................................................................30
Major influences on climate variability for Sydney......................................................................32
Natural influences............................................................................................................32 Human influences on climate...........................................................................................34 Inflows and synoptic classifications .................................................................................35
Implications for run-off and inflows ............................................................................................36
3. Climate change projections for Sydney’s catchments .............................................................37
About these projections .............................................................................................................37
Temperature ..............................................................................................................................37
Projected warming for 2030.............................................................................................37 Projected warming for 2070.............................................................................................37 Extreme temperature: hot days, hot spells and cold spells ..............................................39
Rainfall ......................................................................................................................................39
Projected rainfall changes for 2030 .................................................................................40 Projected rainfall changes for 2070 .................................................................................40 Rainfall intensity, extreme rainfall, wet and dry spells ......................................................41
Evaporation ...............................................................................................................................43
4. Impacts on water availability ......................................................................................................46

iv | Summary report
Estimating the impacts on water availability...............................................................................46
Catchment-scale rainfall, evaporation and inflow projections.....................................................47
Rainfall ............................................................................................................................47 Evaporation .....................................................................................................................48 Inflows ............................................................................................................................49 Summary of impacts on rainfall and inflow.......................................................................51
Impacts of climate change on water supply ...............................................................................52
Changes to water supply system performance ................................................................52
5. Implications for demand .............................................................................................................53
Factors influencing demand.......................................................................................................53
Weather conditions and water use.............................................................................................53
Projected demand for water without climate change..................................................................54
Determining climate demand .....................................................................................................54
Water use, weather and customers .................................................................................55 Demand difference from current climate ..........................................................................55
Modelled changes in water demand due to climate ...................................................................55
Annual average demand..................................................................................................56 Demand variability ...........................................................................................................57
Water conservation programs....................................................................................................57
6. Implications for supply and demand planning..........................................................................58
The challenge of water resource planning in the Sydney context ..............................................58
The Metropolitan Water Plan and adaptive management ..........................................................58
Implications for Sydney’s water supply systems ........................................................................59
Implications for Sydney’s urban water demand..........................................................................60
7. Future research needs ................................................................................................................62
References .......................................................................................................................................63
Appendix 1: Variable convergence score for global climate models ..........................................65
Appendix 2: SRES scenarios..........................................................................................................66
Appendix 3: Maps of the study area...............................................................................................67
Appendix 4: High resolution climate change projections ............................................................69
Appendix 5: Future changes for annual average rainfall..............................................................91
Appendix 6: Sydney Catchment Authority’s water supply planning and assessment ..............92

v | Summary report
Appendix 7: Assumed system configuration in 2010 for water supply.......................................93
Appendix 8: Water supply zones and weather stations used to determine climate demand in this study...............................................................................................................94
Appendix 9: Annual demand increases (GL/year) due to climate change under the A2
scenario, by customer sector by supply zone ......................................................................95
Appendix 10: Related projects........................................................................................................96
Tables
Table 3.1: Projected changes to average seasonal and annual daily maximum temperature (DMT) (ºC) for 2030 and 2070, relative to the current climate. Best estimate (median) change is given, with range of uncertainty (5th and 95th percentile values) in brackets.........................................................................................................38
Table 3.2: Projected changes in the average number of hot days (daily maximum temperature (DMT)>35C), hot spells (DMT>27ºC for 4-7 consecutive days) and cold spells (DMT<10ºC for 4-5 consecutive days) for 2030 and 2070, relative to current climate. Best estimate median change is given, with the range of uncertainty (5th and 95th percentile values) in brackets. ...............................................39
Table 3.3: Projected changes in seasonal and annual number of wet days in years 2030 and 2070. Best estimates (median) percent changes in the number of wet days are given, with range of uncertainty (5th and 95th percentile values) in brackets. .........40
Table 3.4: Projected changes in seasonal and annual rainfall amount (mm) in years 2030 and 2070. Best estimate (median) percentage changes are given, with range of uncertainty (5th and 95th percentile values) in brackets. ...............................................41
Table 3.5: Projected changes in seasonal and annual rainfall intensity (rain per wet day) for 2030 and 2070 under the A1B and A2 scenarios, relative to the current climate. Best estimate (median) percentage changes are given, with range of uncertainty (5th and 95th percentile values) in brackets. ...............................................41
Table 3.6: Projected changes in seasonal and annual number of extreme rainfall days (>40 mm/day) in 2030 and 2070 under the A1B and A2 scenarios, relative to the current climate. Best estimate (median) percentage changes are given, with range of uncertainty (5th and 95th percentile values) in brackets. .................................42
Table 3.7: Projected changes in the number of wet spells (>7 days) and the rainfall amount in them for 2030 and 2070. Best estimate (median) percent changes in both the number of days and rainfall totals are given, with range of uncertainty (5th and 95th percentile values) in brackets. ...............................................................................43
Table 3.8: Projected changes to pan evaporation (PE) for 2030 and 2070 under the A1B and A2 scenarios, relative to the current climate. Best estimate (median) percent changes are given, with range of uncertainty (5th and 95th percentile values) in brackets.........................................................................................................43
Table 3.9: Projected average number of occurrences in a year when pan evaporation (PE) is (a) greater than 9 mm; (b) less than 5 mm for 15 or more consecutive days

vi | Summary report
and; (c) greater than 7 mm for 7 or more consecutive days. Best estimate (median) values are given, with range of uncertainty (5th and 95th percentile values) in brackets.........................................................................................................45
Table 4.1: Changes in annual rainfall (mm/year) for current climate and future climate changes under A1B and A2 emission scenarios for 2030 and 2070 ..............................47
Table 4.2: Annual evaporation (mm/year) for current climate, and A1B and A2 emission scenarios for 2030 and 2070 .........................................................................................49
Table 4.3: Changes in annual inflow (GL/year) for current climate and future climate change under the A2 emissions scenario. .....................................................................50
Table 4.4: Changes in annual inflow (GL/year) for current climate and future climate changes under A1B and A2 emission scenarios for 2030 and 2070. .............................51
Table 4.5: Annual average changes in rainfall (mm/year) and inflow (GL/year) (% change compared to current climate) for A1B and A2 emission scenarios for 2030 and 2070 ..............................................................................................................................52
Table 5.1: Average annual demand increases due to climate changes for different scenarios. The increase is measured against the current water demand without climate change impacts, i.e. 567 GL/year for 2030 and 639 GL/year for 2070...............56
Table 5.2: Annual demand increases (GL/year) due to climate change under the A2 scenario, by customer sector. Figures are the total demand increases totalled across the 14 supply zones. ..........................................................................................56
Table 5.3: Projected annual demand variability for 2030 and 2070 for different climate scenarios. ......................................................................................................................57
Figures
Figure 2.1: Annual mean temperature anomalies (C) for Sydney (33.86oS, 151.21oE) between 1950 and 2009. There is a clear warming trend from around 1970 and a particularly rapid increase in temperatures since 2000. The black line represents the 11-year moving average (middle year) of the measurements. ...............26
Figure 2.2: Observed annual total rainfall trend in terms of percentage of climatological rainfall based on the rainfall data over 1950–2009. Blue colour shows rainfall increase and red indicates rainfall reduction. .................................................................27
Figure 2.3: Total annual rainfall anomaly (mm) for the Sydney region (33.86oS, 151.21oE). The black line represents the 11-year moving (middle year) average of the measurements...............................................................................................................28
Figure 2.4: Sequences of Sydney rainfall for summer, winter, autumn and spring seasons. Dry conditions similar to the recent drought (2000–2007) were observed previously (e.g. 1939–1945 for summer and 1935–1942 for autumn). The zero level indicates the long-term average over 1961–1990, which is used by the IPCC as the baseline to define the present day climate.................................................28
Figure 2.5: Observed and modelled annual inflows (GL/year) for Warragamba Dam, the five metropolitan dams (Cataract, Cordeaux, Avon, Nepean, Woronora) and Tallowa Dam...............................................................................................................................30
vii | Summary report
Figure 2.6: Annual evaporation (mm/year) at Prospect Reservoir from 1909. After a clear increase in evaporation beginning in 1970 there is an apparent reduction from 1979 until recent years (2004–2007) where an increase is observed. ...........................31
Figure 2.7: Distribution of annual pan evaporation at sites across Sydney’s catchments from 1960 to 2002. ........................................................................................................32
Figure 2.8: Time series of the IPO index. Positive values indicate an anomalous warming in the equatorial Pacific Ocean representing an El Niño-like pattern, and negative values a La Niña-like pattern. ........................................................................................33
Figure 2.9: Large-scale annual mean rainfall changes by the year 2070 (mm/day) from an average ensemble of four climate model experiments (two with the A2 emission scenario, one with A1B, and one with B1). ....................................................................35
Figure 3.1: Best estimates (median values) of annual changes in daily maximum temperature (C) for 2030 and 2070 under the A1B and A2 scenarios, relative to the current climate. ........................................................................................................38
Figure 3.2: Best estimates (50th percentiles) of changes in annual pan evaporation (%) for 2030 and 2070 under the A1B and A2 scenarios, relative to the current climate. Blue indicates a higher percentage change in evaporation............................................44
Figure 5.1: Weather conditions and water use, January 2000 and 2001 .........................................53
Figure 5.2: Projected potable water demand (GL/year) 2010 to 2070..............................................54
viii | Summary report
9 | Summary report
Executive summary
The characteristics of variable inflow patterns over the last 120 years are taken into account in the investigation, analysis, design and operation of Sydney’s water supply system. Sydney and its catchment area are subject to infrequent but severe droughts, such as the severe droughts in the 1890s, the 1930–40s and the recent drought of 2001–2007. While there have been periods of low inflows, there have also been numerous large inflow events where storages filled quickly, even when levels were low. In response to these conditions, Sydney has one of the largest per capita storages in the world.
Sydney’s rainfall is much more variable than many other parts of Australia. The recent drought has highlighted the importance of improving our understanding of the implications of climate variability and climate change for the water supply/demand balance of Australia’s largest city. Enhancing our knowledge and capacity to respond to climate variability and climate change will be crucial to sustaining the economic, environmental and social wellbeing of greater Sydney over the long term.
The Climate change and its impacts on supply and demand in Sydney study provides important insights into the potential impacts of climate change on Sydney’s predominantly rain-fed water supply system, and on Sydney’s future demand for urban water by:
investigating if the recent climate fluctuations in Sydney fall within the instrumental record of natural climate variability or whether they can be attributed to the effects of climate change
downscaling climate change projections to the regional scale for use in hydrological modelling, and to assess the changes in the rainfall, temperature and evaporation that are likely to occur under a range of future greenhouse gas emission scenarios.
using regional climate change projections to estimate climate change impacts on inflows, and water availability and supply under a range of future greenhouse gas emission scenarios
determining the likely urban water demand for Sydney under a range of emission scenarios, improving knowledge of the link between key climate variables and understanding the potential impact on future drought response initiatives.
The study also discusses the impacts of natural climate variability on current climate drivers for the Sydney region and their potential impact on water supply and demand. However, it is well-recognised that further research is required before we will better understand what influence climate variability will have on Sydney’s water supply and demand in the future.
The study is a collaboration between the Commonwealth Scientific and Industrial Research Organisation (CSIRO), the Australian Government Department of Climate Change and Energy Efficiency, the NSW Department of Environment, Climate Change and Water, the NSW Office of Water, Sydney Catchment Authority (SCA), Sydney Water and the University of NSW (UNSW).
Current climate observations for Sydney
Climate observations for Sydney show that:
since 1950, annual mean temperature has increased by about 0.7˚C with warming more marked in the inland areas
annual total rainfall is decreasing, mostly as a result of reduced winter rainfall in recent years relative to the very wet years of the early 1950s, 1960s and 1970s. However this trend is within the natural range of climate variability.
In the Sydney catchment area pan evaporation data is only available for a limited number of locations. These data are for a shorter period than the period for rainfall data, however Prospect Reservoir has

10 | Summary report
maintained accurate pan evaporation records since 1909. These records show significant multi-decadal variability over the past 100 years with a marked increase in evaporation rates after 1970 to 1979. After 1979 evaporation rates started to decrease, until recent years (2004–2007) where rates increase.
Evaporation across Sydney’s catchments is largely dependent on geography and wind. Observed records from the past 40 years show annual pan evaporation varying from 900–1900 mm/year, demonstrating the high degree of variability of this climate indicator.
Natural climate drivers have varying impacts on Sydney’s climate. These include, the El Niño-Southern Oscillation (ENSO), Interdecadal Pacific Oscillation (IPO), Southern Annular Mode (SAM) and Indian Ocean Dipole (IOD). Human climate influences, such as carbon dioxide, ozone depletion and northern hemisphere aerosols, also have varying impacts on Sydney’s climate (see chapter two for definitions of the climate drivers).
The dry conditions of the recent drought were in part due to the extended period of time the Pacific Ocean has spent in an El Niño–like state and a shift of the IPO from a negative to positive phase, which has intensified since the 1990s. A synoptic (large scale weather patterns) study (Pepler et al. 2009) of the Sydney region also confirmed that a majority of the summer low flow (1960–2008) events occurred during El Niño years and 80 percent of the low flow events occurred when the Southern Oscillation Index (SOI, see chapter two) was negative.
The synoptic study also concluded that east coast lows (strong cyclonic systems of the east coast of NSW) have the single most significant impact on dam levels. They were responsible for 66 percent of high flow days, including both major dam-filling events since 1992.
About this study
This study focused on determining the impacts of climate change on both water supply and urban water demand at the regional or catchment level. At its commencement in June 2006 the study was the first to investigate climate change impacts on both water supply and demand.
The scientific methodologies used and developed in this study were based on the best available information in Australia, at the time. The outcomes have provided a good basis for investigating climate change impacts on water supply and demand and as the science and modelling capabilities improve, so too will the information available for assessing these impacts.
Area
The study area extends over both Sydney’s drinking water catchments and the urban areas of Sydney where the vast majority of drinking water is consumed (Sydney Water’s area of operations). This area is more than 20,000 km2 in size and includes the Hawkesbury Nepean, Shoalhaven and Georges River basins.
Timeframes and research approach
The climate period for 1960–2002 is used as the baseline in this study as it is representative (at the time of commencing this study) of the recent average climate in the Sydney region. It is referred to as the current climate1. The climate change projections estimate the average climate for two 20-year windows, 2021–2040 (referred to as 2030) and 2061–2080 (referred to as 2070). Comparison of the future climate change impacts in 2070 and 2030 are made against the current climate.
1 The baseline current climate (1960-2002) does not include the recent drought of 2001-2007 as the study commenced before the drought ended.

11 | Summary report
Runs of the CSIRO Mark 3.0 (Mk3) global climate model (GCM) are used in this study because it was the only readily available model which produces continuous daily data of dynamically consistent predictors for both present day and future climates. CSIRO Mk3 has also been found to be one of the best models in simulating Australia’s climate and associated large-scale climate drivers.
Outputs from CSIRO Mk3 GCM runs for three greenhouse gas emission scenarios—representing low, mid and high emission futures (B1, A1B, and A2 respectively) —were downscaled to the local/regional level using statistical techniques developed by UNSW. To project the impacts of climate change on water supply, the downscaled data was put into the SCA’s rainfall/run-off model, Hydrological Simulation Program-FORTAN (HSPF) to generate the run-off data. This data was fed into the SCA’s water supply system simulation model, Water Headwork Network (WATHNET) to estimate the impacts of climate change on water supply availability under future climate scenarios.
Although three emission scenarios were modelled in this study, the findings presented in this report focus primarily on the higher emission A2 scenario as it is now considered more realistic than the low and mid-range scenarios (B1 and A1B).
The possible impact of climate change on urban water demand was estimated by calculating the difference of demand under current climate conditions compared to the demand under future emission scenarios for 2030 and 2070. Population and dwelling projections, water savings (from conservation programs) and downscaled climate conditions from the three emission scenarios were put into a demand model developed by Sydney Water to produce monthly demands under climate change conditions for each demand sector in each of Sydney Water’s water supply zones.
Limitations
While GCMs are the most advanced tools for investigating the causes of observed climate change and projecting future climate change, they are limited in their capacity to model important features, such as the impact of clouds and aerosols. Additionally GCMs do not simulate key forcing parameters, such as solar radiation and volcanic activity, into the future. It is believed that these forcing parameters heavily influence the persistence of low-flow sequences (such as drought).
Another area of uncertainty is that it is not yet possible to estimate future atmospheric greenhouse gas concentrations with great certainty, since this depends on both economic growth rates and the extent that mitigation strategies are adopted internationally. While downscaling provides a better representation of climate impacts at a regional or local level, there are still some major challenges to address in regard to uncertainties and bias associated with GCMs.
However local/regional simulations are still an important part of planning for climate change impacts as long as their limitations are understood and communicated. Nationally and internationally, researchers are working to improve the capabilities of global climate models, and further work has been indentified which will improve our understanding of potential climate change impacts in the Sydney region.
Climate change projections for Sydney’s catchments
Sydney's daily maximum temperature is projected to increase by 0.3C to 0.7C (with a best estimate
of 0.5C) in 2030 and 1.3C to 1.6C (with a best estimate of 1.5C) in 2070. Hot days, where the daily
maximum temperature is above 35C, are projected to increase to around four days each summer in 2030 and seven days each summer in 2070 (up from the current average of three days each summer). The frequency of hot spells (periods when four to seven consecutive days each have a daily maximum temperature greater than 27°C) is projected to increase from around twice every summer to around three times every summer in 2070. The frequency of cold spells (periods of four to five consecutive days when the daily maximum temperature is less than 10°C) will decrease from around once every two winters to once every five winters in 2070.
12 | Summary report
The number of wet days in the Sydney region is projected to change very little in both 2030 and 2070, while the annual rainfall amount is projected to decrease slightly by two percent under both A1B and A2 emission scenarios.
Under the A2 emission scenario, in 2070, the number of extreme rainfall days, where more than 40 mm falls, is likely to increase annually, with a maximum increase of about 18 percent in summer and a decrease of about seven percent in winter. Increased instances of wet spells of seven days or more are likely, mainly in autumn and summer. Rainfall amounts in these longer wet spells are likely to increase in all seasons. Longer dry spells (of 15 days or more) could increase in 2030 and 2070. By 2070 the Sydney region is likely to see longer dry spells interrupted by heavier rainfall events.
Evaporation is projected to increase by two percent in 2030, and 10 percent in 2070. In the Sydney region there are currently 10.4 days in a year where pan evaporation is greater than 9 mm. In a warmer climate, this number is expected to increase to 11.5 in 2030 and 17.4 in 2070. The western part of the study area shows greater sensitivity to the projected climate changes.
The increase in temperature, evaporation and summer rainfall and decrease in winter rainfall under the A2 emission scenario is consistent with the recent findings from the NSW Climate Impact Profile study (DECCW 2010).
Climate change impacts on water availability and supply
The total operating storage of the Sydney dams is about 2,600 gigalitres (GL). The Warragamba catchment is responsible for around 80 percent of the total inflows into Sydney’s water supply, with the dam having a capacity of around 2,027 GL. The majority of the other 20 percent of the inflows come from the Upper Nepean, Woronora and Blue Mountains catchments. Recent changes to the water supply system will see this balance shift to 60–70 percent and 40–30 percent. The contribution of the Shoalhaven catchment varies depending on when pumping occurs. The Blue Mountains Catchment was excluded from the study area for the water availability and supply modelling because its flows represent less than one percent of Warragamba’s inflow.
In general, projections suggest that inland regions (the majority of the Warragamba and Shoalhaven catchments) may get drier, while coastal regions (Upper Nepean, Wingecarribee, eastern section of Warragamba and parts of the Shoalhaven catchments) may tend to be slightly wetter.
The majority of impacts to inflow, under A2 emission scenario, are projected to occur by 2030. Projections under the A2 emissions scenario for 2030 suggest reduced rainfall and inflows in Warragamba and the Shoalhaven, but increases in the region surrounding the four Upper Nepean dams (Cataract, Cordeaux, Avon and Nepean) and Woronora. Projections also indicate evaporation could increase by around three percent at Warragamba, Nepean, and Wingecarribee dams and around seven percent at Goulburn. Warragamba, Nepean and Wingecarribee provide representation of evaporation at major storages and near coastal catchments, while Goulburn provides an indication of the evaporation changes to the inland catchments.
Under the A2 scenario, in 2070 rainfall and inflows may reduce for Warragamba and Shoalhaven and increase for the catchments of the Upper Nepean dams. Evaporation is projected to increase for Warragamba, Nepean, and Wingecarribee dams by around 10 percent and at Goulburn by around 22 percent. Overall for 2030 and 2070 there is a projected decrease in inflows from the downscaled current climate by around 25 percent for Warragamba and Shoalhaven dams and a five percent increase for the Upper Nepean dams.
Sydney’s water supply system is designed to ensure that the annual volume of water supplied does not compromise system security or trigger an unacceptable frequency of water restrictions. Currently the maximum volume of water that can be safely drawn from the system (known as the system yield) is 570 GL/year.

13 | Summary report
The water supply system yield (based on the assumed system configuration for 2010) is projected to reduce by around eight percent per year in 2030 and by around 11 percent per year in 2070 under the A2 scenario. This means that we may experience an increase in the frequency of droughts and imposition of restrictions compared to the current conditions. However, further work is needed to improve our understanding of how future climate conditions will impact on periods of low inflows (a key factor in estimating system yield and managing security of supply). While GCMs can replicate low inflow periods that have occurred in the past, they are not presently able to model such periods in the future, and further work is required before we can more confidently project impacts on future droughts.
Climate change impacts on demand
Household water uses accounts for about 72 percent (50 percent single residential and 22 percent multi-unit) of water used in Sydney. The other 28 percent is used by commercial (10.5 percent), industrial (9.5 percent) and government and other sectors (including agriculture) (eight percent).
Under the A2 scenario the majority of the increase in annual demand is from the residential and commercial sectors. Within the residential sector, single residential dwellings show the largest increase, since the climate impact is mainly from outdoor water uses. Temperature and evaporation increases also impact the use of air conditioners and outdoor water use in the commercial sector.
In general, annual demand increases due to climate change are more severe in 2070 than in 2030 in all sectors. In systems such as Orchard Hills, Prospect North and Macarthur, the annual demand increase in the residential sector is highest for the single residential sector. This is because most of the dwelling growth in these systems is single residential dwellings in the greenfield areas. On the other hand, in Potts Hill water supply system the increase is higher for the multi-residential sector as the majority of growth in this system is multi-dwellings.
The highest increase in average annual demand due to climate change (from the current climate demand of 639GL/year) is about 25 GL/year in 2070, under the A2 emission scenario. This is much less than the estimated range for the variability in annual demand (52 GL/year in 2030 and 73 GL/year in 2070). That is, the increase in water demand for Sydney will be influenced more by natural climate variability than human induced climate change impacts.
Given that the impact of climate change on total demand is around four percent, or 25 GL/year, in 2070, it is difficult to estimate any significant impact on demand hardening2, or the impact of drought
2 Demand hardening – the reduction in effectiveness of measures designed to reduce water consumption in drought periods, due to the uptake overtime of programs/appliances/fittings to improve water efficiency and substitute mains water with alternatives, such as rainwater tanks.
Drinking water consumption by sector
14 | Summary report
restrictions on water use. Importantly, peoples’ attitude to water use, including both their indoor and outdoor water use, will directly impact on the reduction in demand achieved when drought restrictions are implemented. It will therefore be important to monitor peoples’ attitude to water use and drought restrictions.
Climate change will also result in a slight increase in the savings from water conservation programs targeting outdoor use. This would partly offset the increase in water demand due to climate change. It is difficult to quantify this effect since there is no data available to establish the relationship between the savings and key climate variables. However, as the increase is very small it should be interpreted that climate change impacts would not significantly affect the savings achieved by demand management programs.
Implications for supply and demand planning
There is still significant uncertainty regarding the climate in Sydney’s drinking water catchments in the future. However, planning for variable rainfall in the short and longer term is a continuing theme for the Metropolitan Water Plan for greater Sydney.
The findings from this study provide some guidance to key water agencies to understand and plan for the impacts of climate change on Sydney’s dam storage system. The projected decrease in rainfall and inflows to the inland areas of the catchment, and slight increase in rainfall and inflows to the coastal areas, may provide opportunities for future enhancement to the configuration and performance of the storage system.
While there may be slight changes to inter-seasonal variability for rainfall, there is a balance between increasing temperature and evaporation, which may result in little change to the overall variability between seasons in terms of dam inflows.
Increasing summer rainfall intensity could result in increased runoff and associated stream sedimentation and turbidity, while prolonged drought periods may increase the propensity for algal blooms. However, in the short term, there are no foreseen management issues for coping with these projected changes as the Sydney Catchment Authority has the necessary response framework already in place.
Although there may not be a significant increase in urban water demand due to climate change it is still important to have contingency measures in place. The 2010 Metropolitan Water Plan outlines a new, simpler regime of drought restrictions, and measures that could be deployed in extreme drought if needed.
Inter-seasonal variability has been identified as a potential issue for urban water demand, however Sydney Water is already assessing implications through their current climate change and risk assessment adaptation programs. The true impacts are difficult to quantify because of the current limitations in the results.
As a result of the projected increase in extreme rainfall events, Sydney Water has started looking at the potential impacts of increased flows on stormwater infrastructure. Another issue is the long-term coupling of sea-level rise and extreme events on low-lying stormwater assets. Sydney Water has begun looking at the broader issues of potential climate change impacts on its infrastructure and operations with a view to identifying future adaptation options that might be required.
The outcomes of this study were considered in the review of the 2006 Metropolitan Water Plan. However, while the research indicates potential changes to supply and demand under future climate conditions, the relatively low impact of these changes and the lack of certainty in the findings mean that, for the short term, the research has not fundamentally changed water management planning for Sydney.

15 | Summary report
The 2010 Metropolitan Water Plan adopts an adaptive management approach to water planning. This means that, while there is no immediate need to change current management practices to cope with the projected impacts of climate change, the Plan is flexible enough to allow measures to be adjusted in the medium and long-term future, if needed. Through this adaptive management approach the 2010 Plan, has the capacity to:
manage risk by having the appropriate buffer between supply and demand
understand the likely pressure points on the supply and demand balances in the future
respond to changing conditions due to both climate change and climate variability
continue to improve our knowledge of climate change impacts on greater Sydney’s water supply
incorporate this knowledge into future strategies.
Future research
This study was undertaken to better understand the impacts of climate change on Sydney’s water supply system and future urban water demand. It broke new ground in modelling climate change impacts at the regional level and has helped identify the next quantum of research needed to improve the confidence of modelling at the regional scale.
There will always be uncertainty associated with climate change projections, due to uncertainties about future levels of greenhouse gas emissions, the lack of consistent climate data and limitations of global climate models. It is not possible to develop absolutely precise projections of future climate change. However, by adopting a flexible, adaptive approach we can still plan for future water supply even in the absence of perfect information.
One of the elements of adaptive management is to continually review and update the information base. A number of areas of further research have been identified to improve the methods that were used in this study and to the increase the level of confidence in results projecting the impacts of climate change on water supply and demand systems at the regional/local level. These include the need to:
improve the representation of severe climatic extremes in all aspects of current climate modelling
understand why GCMs are unable to simulate sustained anomalies, such as drought (low frequency variability) in future simulations, with the aim of removing this bias
develop a means by which GCM simulations can be dynamically downscaled3 to enhance their representation of low frequency variability
understand how dynamically downscaled climate simulations can be used to develop stochastic (random) downscaling procedures for climate variables such as rainfall, temperature and evaporation, to give accurate representation of drought and high flows in future climate simulations
model future simulations using at least two GCMs and the more pessimistic A1FI greenhouse gas emission scenario
finalise the current study of palaeological information to better understand natural climate variability (wet and dry cycles) and to assess how representative the past 100 years is of the long-term historical hydrological patterns
understand the climate change impact on the synoptic (large scale weather patterns) classifications driving extremely high and low inflows to the Sydney catchments
3 Dynamical downscaling uses regional climate models, driven by GCM outputs, to produce higher resolution results for a small geographic region. This improves the accuracy and spatial patterns of climate variables compared to the GCM but the quality of the results depends on the biases inherited from the GCMs (e.g. the models tendency to produce wet or dry results).

16 | Summary report
make use of advances in climate science and improved climate modelling that will be included in the Intergovernmental Panel for Climate Change’s (IPCC) fifth assessment report.
17 | Summary report
CHAPTER 1
Introduction
Investigating climate change and its impacts on water supply and demand in Sydney
Sydney’s rainfall is much more variable than rainfall in many other parts of Australia. Inflows to the Sydney water supply system are three times more variable than inflows to the Melbourne system (Sydney Water 2007). The recent drought has highlighted the importance of better understanding the implications of climate variability and climate change for the water supply/demand balance of Australia’s largest city. Enhancing our knowledge and capacity to respond to climate variability and climate change will be crucial to sustain the economic, environmental and social wellbeing of greater Sydney over the long term.
This study seeks to provide important insights into the potential impacts of climate change on Sydney’s predominantly rain-fed water supply system, and on Sydney’s future demand for water, by:
investigating if the recent climate fluctuations in Sydney fall within the instrumental record of natural climate variability or whether they can be attributed to the effects of climate change
downscaling climate change projections to the regional scale for use in hydrological modelling, and to assess the changes in the rainfall, temperature and evaporation that are likely to occur under a range of future greenhouse gas emission scenarios (emission scenarios)
using regional climate change projections to estimate climate change impacts on inflows, and water availability and supply under a range of future emission scenarios
determining the likely urban water demand for Sydney under a range of emission scenarios, improving knowledge of the link between key climate variables, and understanding the potential impact on future drought response initiatives.
The study also discusses the impact of natural climate variability on current climate drivers for the Sydney region and the potential impact that this variability has on water supply and urban water demand. It is well-recognised, however, that further research is required before we will understand what influence climate variability will have on Sydney’s water supply and demand in the future.
The study is a collaboration between the Commonwealth Scientific and Industrial Research Organisation (CSIRO), the Australian Government Department of Climate Change and Energy Efficiency, the NSW Department of Environment, Climate Change and Water, the NSW Office of Water, Sydney Catchment Authority (SCA), Sydney Water and the University of NSW (UNSW).
Sydney’s surface water supply
Catchment area
Sydney’s catchment area covers 16,000 km², extending from the headwaters of the Coxs River near Lithgow to the headwaters of the Shoalhaven River near Cooma. It consists of five main river systems:
Warragamba Catchment – this catchment accounts for 80 percent of total inflows into Sydney’s water supply and, with a capacity of 2,027 GL. The other 20 percent of total inflows come from the Upper Nepean, Shoalhaven, Woronora and Blue Mountains catchments. Recent changes to the water supply system will see this balance shift to 60–70 percent and 40–30 percent. Warragamba Dam is one of the largest domestic water supply dams in the world.
18 | Summary report
Upper Nepean Catchment – this catchment lies in one of the highest rainfall regions in NSW. The dams of the Upper Nepean collect water from the catchments of the Cataract, Cordeaux, Avon and Nepean rivers, which are tributaries of the Upper Hawkesbury–Nepean River. The combined storage capacity of the dams is 375 GL. These systems supply water to the Macarthur and Illawarra regions, the Wollondilly Shire, and metropolitan Sydney.
Shoalhaven Catchment - water from Tallowa Dam, and Fitzroy Falls and Wingecarribee reservoirs, is used to supply local communities and supplement supply to Sydney and the Illawarra storages during drought.
Woronora Catchment - Woronora Dam has a storage capacity of 72 GL. It collects water from the catchment of the Woronora River, which drains into the dam and then to Botany Bay. The dam supplies water to residents within the Sutherland Shire in Sydney's south.
Blue Mountains Catchment – the Blue Mountains system comprises two small catchment areas feeding five dams, which provide water for about 41,000 people living in the Blue Mountains region. Water for the Blue Mountains is also sourced from the Fish River Scheme, which originates in Oberon.
Reservoir and supply system
The Sydney Catchment Authority is responsible for delivering a reliable and safe bulk water supply. It manages a total of 21 storage dams (11 of these are defined as major dams) and associated infrastructure that supply raw water to the Sydney Water for treatment and distribution to the Sydney metropolitan area, as well as to two local government areas outside the Sydney Water area of operation. The total operating storage of the dams is about 2,600 GL.
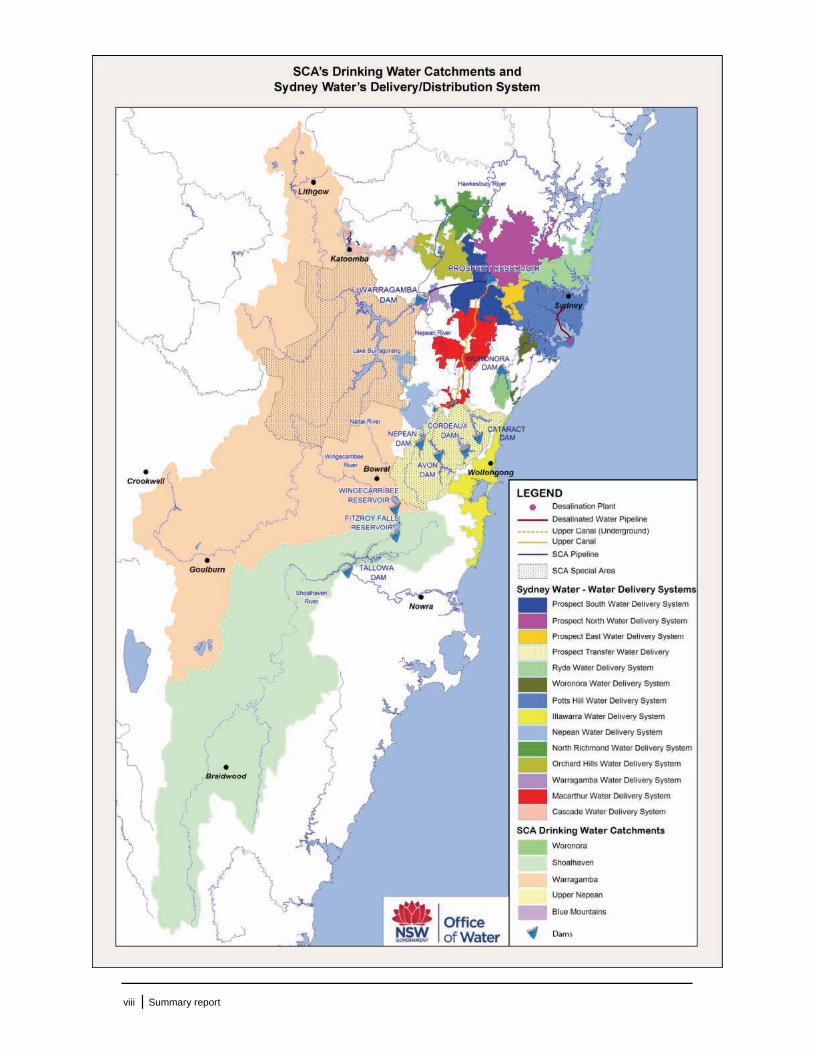
The map in the executive summary shows locations of Sydney Catchment Authority’s water supply infrastructure and drinking water catchments and Sydney Water’s delivery and distribution systems. See Appendix 3 for a more detail representation of the drinking water catchment and delivery and distribution system.
Sydney Water’s delivery and distribution area
Sydney Water provides drinking water, recycled water, wastewater and some stormwater services to over 4.3 million people in Sydney, the Illawarra and the Blue Mountains. This area of operations covers 12,700 km². Sydney Water’s delivery system covers about 3,200 km².
Modelling an uncertain future
The most important information for policy makers in planning for future climate change is to understand the impacts at the local or regional level. This is particularly important for the Sydney region which has a highly variable rainfall and experiences variations in rainfall and run-off across the coastal and inland regions. It is important to understand how climate change may impact on rainfall patterns so that water planners can adjust the system operations or augment supply to adapt to the projected changes.
To project climate change impacts at a broad scale climate scientists use global climate models (GCMs). These models represent physical processes in the global atmosphere, oceans, ice sheets and on the land surface. They also take into account man-made impacts on climate, such as greenhouse gas emissions and aerosols, as well as natural climate influences, such as solar variability and gases from volcanic eruptions.
The broad scale resolution of GCMs is too coarse for driving hydrological models to project changes in rainfall patterns, as local features and dynamics are not well represented at this scale. Therefore, to obtain the finer resolution required for hydrological models, the coarser data outputs from GCMs are downscaled.
This study adopted a statistical downscaling technique to gain a better understanding of climate change on water supply and demand at the local/regional level. When this study began (June 2006) it
19 | Summary report
was the first time this methodology had been applied to project climate change impacts on water supply and demand at the local level.
While downscaling provides a better representation of climate impacts at a local level, it is very difficult to project these impacts with a high level of confidence due to the uncertainties associated with global climate modelling. However local/regional simulations are still an important part of planning for climate change impacts as long as their limitations are understood and communicated.
Global climate modelling
GCMs are the most advanced tools for investigating the causes of observed climate change and projecting future climate change. A GCM is a complex mathematical representation of the earth’s climate system. It relies on the solution of fluid motion and energy algorithms to reflect changes in climatic variables such as wind, temperature, humidity and rainfall. GCMs typically provide outputs at a resolution of around 200 km x 200 km. Worldwide, there are 23 GCMs that attempt to predict the changes in climate under different carbon emission scenarios.
Climate models are able to reproduce the significant features of the observed climate very well (Randall et al. 2007), and there is a high level of confidence in their ability to provide credible quantitative estimates of future climate change, particularly at a broader continental scale and above. The highest confidence is attached to results analysed at the coarsest spatial and temporal scales, such as global or hemispheric annual means. Confidence decreases with finer scales, such as sub-continental or regional daily variability.
Modelling climate change impacts at the local or regional level using GCM outputs is less certain. At finer scales the magnitude of natural climate variability increases and regional climate signals, such as the El Niño-Southern Oscillation and Southern Annular Mode are easily masked. Furthermore, local influences on climate (such as regional topography or processes) become more important at finer spatial scales (CSIRO and Bureau of Meteorology 2007, p. 41).
Uncertainty and limitations of climate modelling
Climate modelling is characterised by uncertainty at three levels:
1. Emission scenarios: It is not possible to estimate future atmospheric greenhouse gas concentrations with great certainty since this depends both on economic growth rates and the extent of mitigation strategies adopted internationally.
2. GCM performance: There remain significant limits in the capability of GCMs to model important features such as the impact of clouds and aerosols. Additionally, key forcing parameters such as solar radiation and volcanic activity cannot be predicted into the future.
3. Downscaling limitations: There remain significant limits in the capability of downscaling methods to estimate climate impacts at the local or regional level.
Emission scenarios
It is not possible to estimate with certainty what the level of greenhouse gases will be at a particular time in the future as this will be determined by rates of economic growth and global mitigation actions.
Recognising this uncertainty around future emissions growth and global atmospheric concentrations of greenhouse gases (GHG), the Intergovernmental Panel on Climate Change (IPCC) developed a range of potential GHG emission scenarios for their Special Report on Emissions Scenarios (SRES 2000). The SRES scenarios are grouped into four scenario families (A1, A2, B1 and B2) that explore different development pathways, covering a wide range of demographic, economic and technological driving forces and resulting GHG emissions (see Appendix 2 for more detail on the scenarios). The emission projections are widely used in the assessment of future climate change, and their underlying

20 | Summary report
assumptions with respect to socio-economic, demographic and technological change serve as inputs to many recent climate change vulnerability and impact assessments.
In 2008, the Garnaut Climate Change Review (Garnaut 2008) concluded that all the IPCC’s emission scenarios may underestimate the future growth in emissions in the early 21st century, with recent science indicating that the A2 scenario may now be seen as a realistic/optimistic scenario rather than pessimistic. Some climate scientists even claim that the A1FI emission scenario is a more realistic scenario than A2, as it is based on more rapid growth in emissions (in line with recent observed emissions growth) and higher GHG concentrations in 2030 and particularly in 2070. Recent analysis of global mean surface temperature also shows that the rate of warming is in the upper range of the IPCC’s climate projections (A1FI).
The A1FI scenario is now being used in Queensland to model potential climate change impacts (see the Urban Water Security Research Alliance project discussed in Appendix 10).
GCM performance
There is some uncertainty in the GCM representation of climate, as we still have much to learn about climate processes and how they are translated in a climate model. Model representations of cloud physics, anthropogenic aerosol effects, chemical ozone and its interactions with climate, and carbon cycles are areas in which significant uncertainty exists. As a consequence the response from one model to another varies vastly, even for the same climate change emission scenario, and it is difficult to place a higher confidence in a particular model.
To help address this issue, UNSW developed the variable convergence score (skill score) for climate variables across a number of GCMs (Appendix 1). A higher score indicates higher consistency of that climate variable across GCMs, and with that, a higher confidence in the use of that variable in downscaling for future climates. The study carried out by UNSW suggests that future rainfall is considerably more difficult to simulate compared to variables such as air pressure or temperature, i.e. rainfall is simulated less consistently than pressure or temperature for future climate by a range of GCMs.
This skill score is an important step in trying to evaluate the accuracy of GCM model outputs for their use in projects aiming to assess future climate change impacts at a regional level.
Climate modellers often use a multi-model ensemble to help address uncertainties associated with GCM output. In a multi-model ensemble many independent models are run for a given set of climate conditions and their results aggregated. Use of a multi-model ensemble cancels out model biases of opposing natures. Further, because each model has its own variability, when aggregated over many models, the variability component is reduced, leaving only the climate change response.
GCMs continue to improve in their ability to reproduce the observed climate and to separate out the impacts of human-induced and natural variability factors. Recently the Program for Climate Model Diagnosis and Intercomparison (PCMDI), an international climate change research group, produced a database of experiments using the 23 available GCMs (see <http://www-pcmdi.llnl.gov/>). This database represents state-of-the-art climate modelling and includes more sophisticated representations of physical and dynamical processes at a finer spatial resolution than has been used in the past.
However, climate models still have some limitations and it is virtually impossible to predict exactly how climate statistics will evolve over the 21st century. Hence our knowledge of relevant processes and deficiencies in our data, methods and models is likely to remain imperfect for the foreseeable future and thus will be an ongoing source of uncertainty (Jones 2000; Visser et al. 2000).
A common methodology in trying to assess the impacts of climate change on water supply is to generate rainfall, evaporation and flows for future climates under assumed greenhouse gas emission scenarios (the approach used in this project). While frequently used, this approach assumes that
21 | Summary report
climate model simulations are unbiased both in a distributional sense (such as means and variance percentiles) as well as in their representation of the sustained anomalies (such as droughts) that define water resource system reliability and security. There is growing evidence to suggest that regional model simulations, over a historical timeframe, misrepresent distributional attributes and low-frequency variability (including drought and high inflows) that characterise long-term persistence in the climate.
A possible reason for this is that the GCM representations for historical climate contain key forcing parameters, including solar radiation and volcanic activity. The GCM runs for future time periods do not contain all these forcing parameters. It is believed that the forcing parameters heavily influence the persistence of flow sequences i.e. low-flow persistence is present in the GCM representation for the historical climate but not for the future GCM representations. To address this issue, statistical techniques were developed in this study to reproduce the historical persistence in the downscaled flow sequences. However, this methodology may also reduce the confidence in the projected impacts of climate change on water supply in the Sydney region.
Future research needed to address the key limitations of using climate modelling to project climate change impacts on water supply at the regional level, is discussed in chapter seven.
Downscaling
Finer resolution outputs to project climate change impacts at the local/regional level are achieved by downscaling GCM outputs. There are three general classes of downscaling techniques: perturbation (daily scaling), statistical and dynamical (physically-based).
Perturbation is the simplest downscaling method. Historical daily rainfall data series are scaled or modified by applying rainfall and evaporation values derived from a GCM. This is done to produce a future daily rainfall series that preserves the historical rainfall pattern (i.e. the temporal sequence of wet days and the frequency/length of wet and dry spells). With this method it is not possible to model droughts longer than those that have been observed. This is an issue for future projections as current science indicates that future droughts may be longer than those experienced in the past.
Statistical downscaling (which was the method applied to this project) relates synoptic (large-scale) atmospheric ‘predictors’ (e.g. humidity, wind speed, sea-level and other atmospheric pressures, air temperature, and previous day’s rainfall) and local climate variables (‘predictands’, e.g. at-site rainfall and temperature) over a specified period, based on analysis of historical data. This relationship (in the form of a series of mathematical models) is then used to downscale atmospheric predictors simulated by a GCM to obtain point rainfall and other local variables.
Dynamical downscaling uses regional climate models, driven by GCM outputs, to produce higher resolution results for a small geographic region. This improves the accuracy and spatial patterns of climate variables compared to the GCM, however the quality of the results depends on the biases inherited from the host GCM/s (e.g. the model’s tendency to produce ‘wet or ‘dry’ results).
The performance of downscaling methods varies across seasons, locations and GCMs, and depends strongly on biases inherited from the driving GCM and the presence and strength of regional features (such as topography, land use and vegetation cover). In general, statistical downscaling methods are more appropriate where point values of extremes are needed for impact studies.
About this study
Study area
The study area extends over both Sydney’s drinking water catchments (Sydney Catchment Authority’s area of operations, excluding the Blue Mountains) and the urban areas of Sydney where the vast majority of drinking water is consumed (Sydney Water’s area of operations). This area is more than 20,000 km2 in size and includes the Hawkesbury-Nepean, Shoalhaven and Georges River basins.
22 | Summary report
Maps of the drinking water catchment and delivery and distribution systems are attached at Appendix 3.
The Blue Mountains Catchment was excluded from the study area for the water supply modelling as it is generally regarded to be implicitly modelled as part of the Orchard Hill demand, especially in terms of a broad scale impact assessment. Its flow represents approximately 0.3 percent of Warragamba’s inflow. The Blue Mountains area was included in the demand modelling.
Current climate and climate change projection timeframes
The climate period for 1960–2002 is used as the baseline in this study as it is representative (at the time of commencing this study) of the recent average climate in the Sydney region. It is referred to as the current climate. High quality data on all major climatological variables are readily available for this period. Comparison of future climate change impacts are made against this baseline.
The simulations for the GCM emission scenarios are undertaken for close to 100 years, with increasing greenhouse gas emissions throughout. The climate change projections estimate the average climate for two 20-year windows, 2021–2040 (referred to as 2030) and 2061–2080 (referred to as 2070). The results for individual years will show some variation from the average for these time slices.
This baseline and 20-year time slices were also used for the hydrological assessments in the study. However, as is discussed later in this chapter, 20-year time slices do not provide an adequate low flow sequence to accurately assess the impacts of drought on future water supply.
Throughout the report there is also reference made to the timeframe of 1961–1990, which is the IPCC baseline to define current climate. This baseline was used when discussing current climate trends for NSW in chapter two.
Climate modelling and downscaling methods
GCM and downscaling
Runs of the CSIRO Mark 3 (Mk3) GCM are used in this study. The statistical downscaling models are calibrated using reanalysis atmospheric data (spatial and temporal interpolation data between actual observations) and observed daily rainfall/evaporation/daily maximum temperature records at ground locations. This information is then validated using current climate (1960–2002) GCM data.
CSIRO Mk3 was chosen because it was the only readily available model which produces continuous
daily data of dynamically consistent predictors for both the present day and future climate. It is also one of the models used in the IPCC’s fourth assessment report, and it has been extensively examined
in terms of its performance. It has been found to be one of the best models in simulating Australian
climate and associated large-scale climate drivers.
Ideally, additional GCMs would have been used to reduce uncertainty in the projections, but these were not readily available in the timeframe of the study. However, the sensitivity of CSIRO Mk3 to
climate change forcing is close to the multi-model ensemble average, in terms of future rainfall change
and the seasonality of the change. In addition, multiple emission scenarios were used to take into account uncertainties arising from varying levels of greenhouse gas emissions, and multi-decadal
long-term averages were used to allow for the uncertainty associated with climate variability.
Downscaling techniques were used by UNSW to transform the coarse resolution GCM outputs from CSIRO Mk3 to a finer spatial scale (around 5km x 5km, or at point locations). The statistical downscaling framework developed by UNSW (Mehrotra and Sharma 2010) consisted of daily mathematical models for rainfall occurrences, rainfall amounts (volume), temperature and pan evaporation based on daily atmospheric variable outputs from the CSIRO Mk3 model. As the skill

23 | Summary report
levels of GCMs for rainfall prediction are low, the downscaling method for this study used variables (other than rainfall) that are predicted well by GCMs, such as temperature and surface pressure.
The downscaled rainfall and evaporation data was put into the SCA’s rainfall/run-off model, Hydrological Simulation Program-FORTAN (HSPF), to generate the run-off data. The run-off and evaporation data was then fed into SCA’s water supply system simulation model, Water Headwork Network (WATHNET), to estimate the impacts of climate change on water supply availability under future climate scenarios.
The downscaled data was also used by Sydney Water in their demand model to determine future climate change impacts on urban water demand.
Catchment based rainfall/run-off models
HSPF was used to estimate streamflow from rainfall and evaporation. The model allows for rainfall distribution within the catchment including soil infiltration rates, vegetation holding capacity, root depth and transpiration rates, return of flows to streams (base-flow) and flows to the deeper groundwater aquifers. Soil moisture accounting in a continuous timescale is of paramount importance for the prediction of inflow changes during periods of drought.
The SCA developed and calibrated four HSPF models to represent the main water supply catchments. Each of these models has sub-catchments within them to allow adequate representation of the spatial variation in meteorological, geological and topographical conditions. A time series of rainfall and evaporation provides the temporal variation.
Demand model
The demand model was built using the relationship between key climate variables and the water demand of individual sectors (single residential, multi-residential, industrial, commercial, primary produce, government and others) developed in this study. To capture the spatial variation of climate the demand model was divided into 14 water supply zones.
The population forecast for the demand modelling is based on the NSW median population forecast of just over five million in 2030 and over six million in 2070 (NSW Department of Planning, 2008, with adjustments made by Sydney Water to reflect the catchment area modelled in this study). This forecast has increased slightly since the 2008 figures, however as the difference between the demands with and without climate change are modelled, the slight increase in population forecasts does not impact on the overall model results.
Emission scenarios
This study used the B1, A1B and A2 emission scenarios, representing low, mid and high emission futures. At the beginning of this study (June 2006) it was considered that the B1, A1B and A2 scenarios would provide an adequate spread of possible futures, ranging from optimistic (B1) through to pessimistic (A2).
However, recent thinking on emission scenarios (as discussed earlier in this chapter) suggests that the A1FI scenario may be the more realistic scenario for future conditions. In consideration of this the report only presents outcomes for the A1B and A2 scenarios. Results for B1 are available in Appendix 4 and associated technical papers (Mehrotra and Sharma 2010; Sydney Catchment Authority 2009 and Sydney Water 2009).
Climate variables
Rainfall frequency and intensity, temperature and evaporation are the key climate variables influencing inflows into Sydney’s catchments (and driving possible changes in water supply demands). In addition to its impact on evaporative losses from water storages, evaporation affects soil moisture and thus the volume of run-off and inflows generated by a rainfall event. Rainfall, temperature and evaporation are
24 | Summary report
also the key climate variables influencing urban water demand. As such they are the key climate variables that are assessed in this study.
Water availability and supply
Sydney’s water supply system is designed to ensure that the annual volume of water supplied does not compromise system security or trigger an unacceptable frequency of water restrictions. Currently,
the dam system has sufficient capacity to store approximately four years of current unrestricted demand (assuming no further inflows during this period). This indicates that the system is able to withstand severe drought conditions (based on drought periods from the historical record).
The maximum volume of water that can be supplied from the system, defined as the system yield, is determined using 200,000 years of synthetically generated flow, based on 100 years of inflow records (1909–2008), thereby ensuring that the system meets the design and performance criteria of security,
reliability and robustness (see Appendix 6 for more detail). The water supply simulation model (WATHNET) is used to represent the complex set of system constraints, environmental and regulatory
releases and operating rules.
To determine the impacts of climate change, a system configuration (detailed at Appendix 7) representing conditions for 2010 is used. The system configuration represents a range of government policy decisions and planned infrastructure, allowing reference to other key planning analyses that
have occurred prior to and in parallel with this study. Two key limitations in this study are the shorter analysis timeframe of 43 years (compared to the 100 years timeframe used to determine the current system yield) and the lack of persistence in the climate change projections.
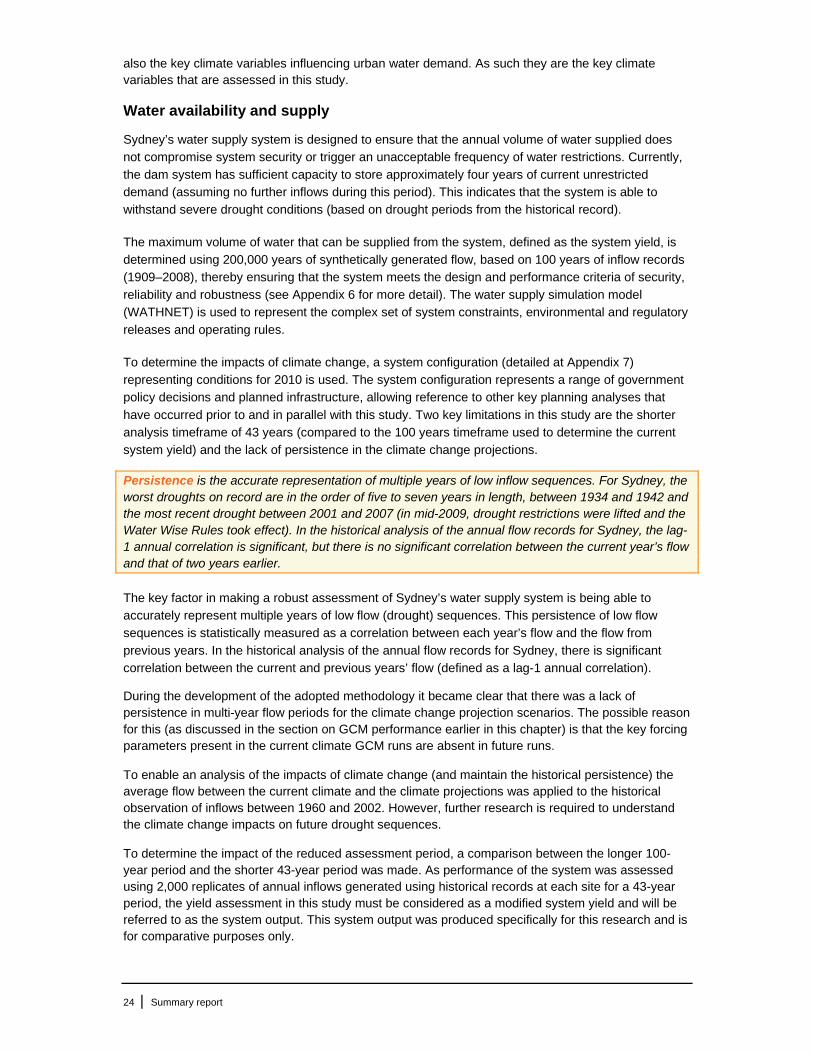
Persistence is the accurate representation of multiple years of low inflow sequences. For Sydney, the worst droughts on record are in the order of five to seven years in length, between 1934 and 1942 and the most recent drought between 2001 and 2007 (in mid-2009, drought restrictions were lifted and the Water Wise Rules took effect). In the historical analysis of the annual flow records for Sydney, the lag-1 annual correlation is significant, but there is no significant correlation between the current year’s flow and that of two years earlier.
The key factor in making a robust assessment of Sydney’s water supply system is being able to accurately represent multiple years of low flow (drought) sequences. This persistence of low flow
sequences is statistically measured as a correlation between each year’s flow and the flow from
previous years. In the historical analysis of the annual flow records for Sydney, there is significant correlation between the current and previous years’ flow (defined as a lag-1 annual correlation).
During the development of the adopted methodology it became clear that there was a lack of persistence in multi-year flow periods for the climate change projection scenarios. The possible reason for this (as discussed in the section on GCM performance earlier in this chapter) is that the key forcing parameters present in the current climate GCM runs are absent in future runs.
To enable an analysis of the impacts of climate change (and maintain the historical persistence) the average flow between the current climate and the climate projections was applied to the historical observation of inflows between 1960 and 2002. However, further research is required to understand the climate change impacts on future drought sequences.
To determine the impact of the reduced assessment period, a comparison between the longer 100-year period and the shorter 43-year period was made. As performance of the system was assessed using 2,000 replicates of annual inflows generated using historical records at each site for a 43-year period, the yield assessment in this study must be considered as a modified system yield and will be referred to as the system output. This system output was produced specifically for this research and is for comparative purposes only.

25 | Summary report
Water demand
The water demand forecast for future scenarios strongly relies on future climate conditions, dwelling and population forecasts, saving estimates of water conservation programs, and the relationship between demand and key climate variables.
The uncertainties of the future climate conditions still remain. Any limitations from the statistical downscaling model will carry through and affect the demand results.
There is no data available to determine the relationship between savings from water conservation programs and key climate variables (such as rainfall and temperature).
Forecasts for non-residential (commercial, industrial, government and others) are not available. As such a simple regression equation was used to estimate the future projections in this study. A better approach could be to improve the forecast of non-residential dwellings and produce a more robust estimate of the total impact from these customer sectors.
The only aspect of demand that can be adequately projected is that component which is influenced by climate. Any other influences, such as behaviour, new appliances or users coming on-line/off-line are not accounted for. This means sectors that are highly dependent on these influences, such as the industrial sector, have models that poorly represent consumption. The industrial sector is likely to be influenced by major users coming on-line or going off-line. Similarly, the commercial sector is likely to be influenced by economic conditions. These factors have not been included in the regression model. Despite this, the regression model is adequate to predict the relative increase of demand due to climate change.

26 | Summary report
CHAPTER 2
Understanding Sydney’s climate
Current climate observations for Sydney
Reliable observational climate records have been kept in Australia since 1910. However, the highest quality data and data reflecting human-induced climate changes are only available from 1950. This study focuses on changes since 1900s for rainfall, inflows and evaporation and changes since 1950s for temperature (as the Bureau of Meteorology does not provide data for the Sydney region before 1950). This chapter outlines how Sydney’s climate has changed in recent times and what factors have driven these changes.
The baseline for current climate commonly used by the Intergovernmental Panel for Climate Change (IPCC) to compare future climate conditions is 1961–1990 (referred to in this chapter, for temperature and rainfall). As discussed in chapter one, the current climate baseline for comparing future climate impacts under this study is 1960–2002.
Temperature
Since 1950 Sydney’s annual mean temperature has increased by about 0.7°C. Warming is more marked in inland areas: averaged across NSW, the annual mean temperature has risen by about 1.1C since 1950 (Figure 2.1). For 11 consecutive years (1997–2007) the annual mean temperature across NSW has been above the 1961–1990 average, with 2007 being the hottest year (averaged across NSW). This persistent warming is unprecedented during the period of record.
Figure 2.1: Annual mean temperature anomalies (C) for Sydney (33.86oS, 151.21oE) between 1950 and 2009. There is a clear warming trend from around 1970 and a particularly rapid increase in temperatures since 2000. The black line represents the 11-year moving average (middle year) of the measurements.
Note that 11-year moving averages are commonly used to indicate inter-decadal signals.

27 | Summary report
Rainfall
Although Australian rainfall is highly variable, long-term changes in rainfall trends have emerged. Since the 1950s, rainfall has been decreasing over eastern and southern Australia. In contrast, there has been a significant increasing trend over north-west Australia (Figure 2.2).
Figure 2.2: Observed annual total rainfall trend in terms of percentage of climatological rainfall based on the rainfall data over 1950–2009. Blue colour shows rainfall increase and red indicates rainfall reduction.
In the Sydney region the average annual rainfall for the past 120 years has been 865 mm in the Warragamba Catchment, 816 mm in the Shoalhaven Catchment, and 1,130 mm in the Upper Nepean Catchment. Since the 1950s there has been an observed decreasing trend in Sydney’s annual rainfall (Figure 2.3). This trend is mostly the result of reduced winter rainfall in recent years relative to the very wet years of the early 1950s. A relatively smaller contribution to the annual rainfall reduction comes from the declining trend in summer rainfall (Figure 2.4). The observed long-term data shows that there is virtually no long-term trend in autumn and spring.

28 | Summary report
Figure 2.3: Total annual rainfall anomaly (mm) for the Sydney region (33.86oS, 151.21oE). The black line represents the 11-year moving (middle year) average of the measurements.
Figure 2.4: Sequences of Sydney rainfall for summer, winter, autumn and spring seasons. Dry conditions similar to the recent drought (2000–2007) were observed previously (e.g. 1939–1945 for summer and 1935–1942 for autumn). The zero level indicates the long-term average over 1961–1990, which is used by the IPCC as the baseline to define the present day climate.
Sydney seasonal rainfall anomaly (mm)
Sydney total annual rainfall anomaly (mm)

29 | Summary report
Inflows
As discussed in the previous section, the rainfall in Sydney’s catchments is unusually variable. Consequently the inflows to Sydney’s catchments vary widely. In fact, the coefficient of variability for Sydney is three times that for Melbourne (Sydney Water 2007). This is reason the storage capacity was built to last around seven years without rain. It has since reduced to four and a half years due to population growth and water demand. As a comparison, the storage capacity for London would last around 11 weeks without rain.
The volume of inflows is affected by the frequency and intensity of rainfall events and by soil moisture, which in turn are affected by temperature and evaporation. The current estimates of inflows are derived from a combination of daily inflow observations at gauged locations (where observed data was available) and monthly mass balances at each dam.
Annual inflows to each of the dams in the three major catchments are shown in Figure 2.5. As the figure shows, inflows into Sydney’s major dams were dominated by high flows in the 1950s, 1960s and 1970s. It should be noted that the inflow data for Tallowa Dam has been derived from models based on the rainfall records, since this dam was only constructed in 1977.
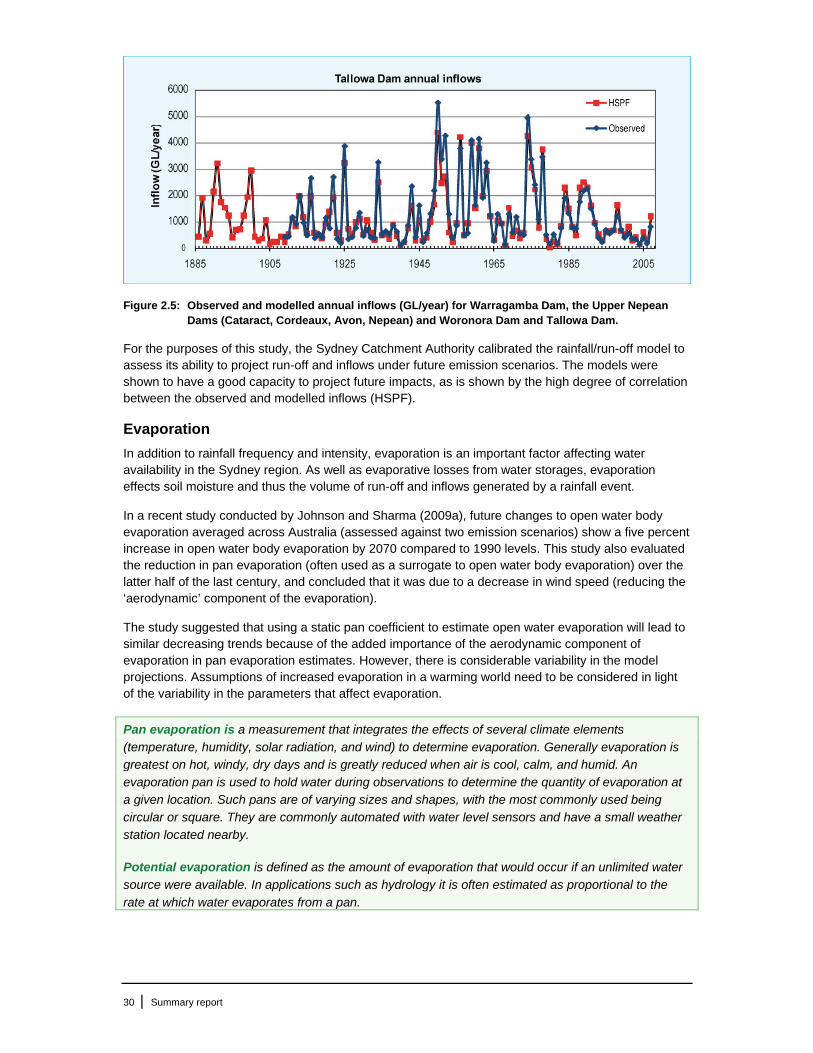
30 | Summary report
Figure 2.5: Observed and modelled annual inflows (GL/year) for Warragamba Dam, the Upper Nepean Dams (Cataract, Cordeaux, Avon, Nepean) and Woronora Dam and Tallowa Dam.
For the purposes of this study, the Sydney Catchment Authority calibrated the rainfall/run-off model to assess its ability to project run-off and inflows under future emission scenarios. The models were shown to have a good capacity to project future impacts, as is shown by the high degree of correlation between the observed and modelled inflows (HSPF).
Evaporation
In addition to rainfall frequency and intensity, evaporation is an important factor affecting water availability in the Sydney region. As well as evaporative losses from water storages, evaporation effects soil moisture and thus the volume of run-off and inflows generated by a rainfall event.
In a recent study conducted by Johnson and Sharma (2009a), future changes to open water body evaporation averaged across Australia (assessed against two emission scenarios) show a five percent increase in open water body evaporation by 2070 compared to 1990 levels. This study also evaluated the reduction in pan evaporation (often used as a surrogate to open water body evaporation) over the latter half of the last century, and concluded that it was due to a decrease in wind speed (reducing the ‘aerodynamic’ component of the evaporation).
The study suggested that using a static pan coefficient to estimate open water evaporation will lead to similar decreasing trends because of the added importance of the aerodynamic component of evaporation in pan evaporation estimates. However, there is considerable variability in the model projections. Assumptions of increased evaporation in a warming world need to be considered in light of the variability in the parameters that affect evaporation.
Pan evaporation is a measurement that integrates the effects of several climate elements
(temperature, humidity, solar radiation, and wind) to determine evaporation. Generally evaporation is greatest on hot, windy, dry days and is greatly reduced when air is cool, calm, and humid. An
evaporation pan is used to hold water during observations to determine the quantity of evaporation at a given location. Such pans are of varying sizes and shapes, with the most commonly used being
circular or square. They are commonly automated with water level sensors and have a small weather
station located nearby.
Potential evaporation is defined as the amount of evaporation that would occur if an unlimited water
source were available. In applications such as hydrology it is often estimated as proportional to the
rate at which water evaporates from a pan.

31 | Summary report
Evapotranspiration is the combination of evaporation of water from land and vegetation and transpiration from vegetation. It is an essential part of the hydrological cycle and its magnitude in terms of mass of water may often exceed that of rainfall.
In the Sydney catchment area pan evaporation data is only available for a limited number of locations. These data are for a shorter period than for rainfall data, however Prospect Reservoir has maintained accurate pan evaporation records since 1909 (Figure 2.6). Significant multi-decadal variability has been observed over the past 100 years with a marked increase after 1970, followed by a gradual decrease, and returning to a marked increase in recent years.
Figure 2.6: Annual evaporation (mm/year) at Prospect Reservoir from 1909. After a clear increase in evaporation beginning in 1970 there is an apparent reduction from 1979 until recent years (2004–2007) where an increase is observed.
Evaporation varies considerably across Sydney’s catchments. Variations in annual pan evaporation over the period 1960–2002 (Figure 2.7) are largely dependent on geography.
For example, the dry and windy conditions at Goulburn reflect the high annual evaporation figures, while the wet and windy conditions in the Wingecarribee and Prospect areas, result in low annual evaporation. Lower evaporation rates are observed in the Warragamba and Nepean areas where conditions are relatively sheltered.
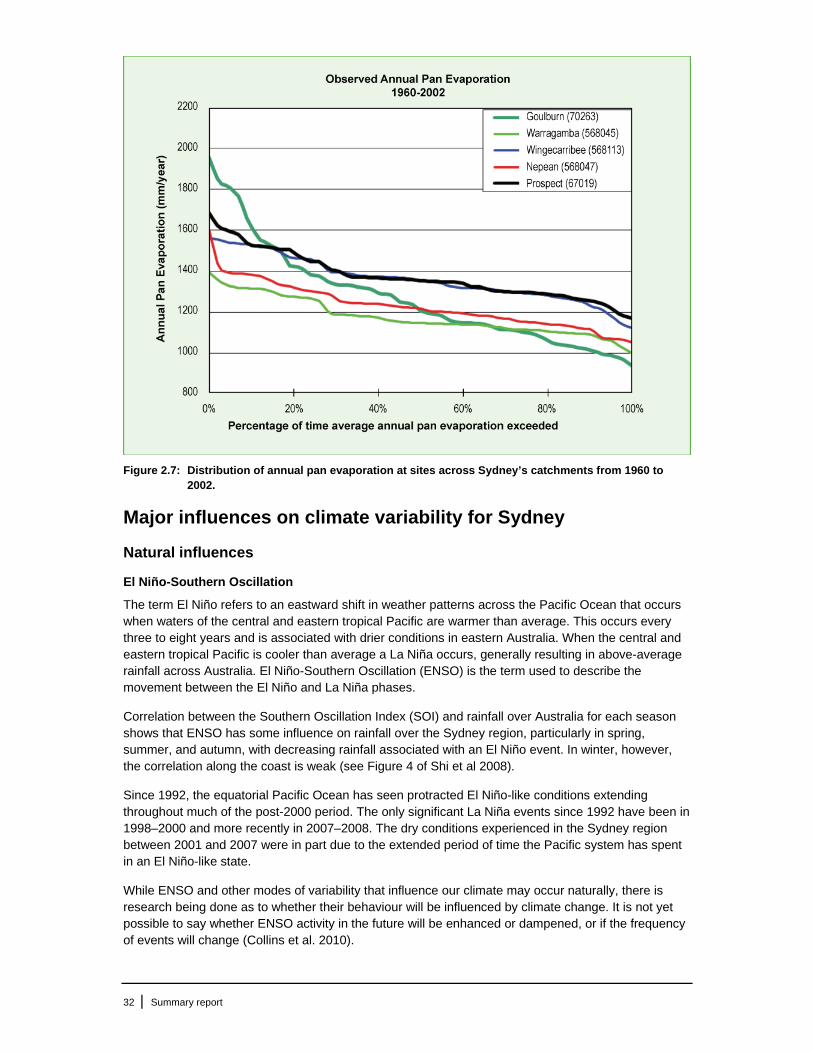
32 | Summary report
Figure 2.7: Distribution of annual pan evaporation at sites across Sydney’s catchments from 1960 to 2002.
Major influences on climate variability for Sydney
Natural influences
El Niño-Southern Oscillation
The term El Niño refers to an eastward shift in weather patterns across the Pacific Ocean that occurs when waters of the central and eastern tropical Pacific are warmer than average. This occurs every three to eight years and is associated with drier conditions in eastern Australia. When the central and eastern tropical Pacific is cooler than average a La Niña occurs, generally resulting in above-average rainfall across Australia. El Niño-Southern Oscillation (ENSO) is the term used to describe the movement between the El Niño and La Niña phases.
Correlation between the Southern Oscillation Index (SOI) and rainfall over Australia for each season shows that ENSO has some influence on rainfall over the Sydney region, particularly in spring, summer, and autumn, with decreasing rainfall associated with an El Niño event. In winter, however, the correlation along the coast is weak (see Figure 4 of Shi et al 2008).
Since 1992, the equatorial Pacific Ocean has seen protracted El Niño-like conditions extending throughout much of the post-2000 period. The only significant La Niña events since 1992 have been in 1998–2000 and more recently in 2007–2008. The dry conditions experienced in the Sydney region between 2001 and 2007 were in part due to the extended period of time the Pacific system has spent in an El Niño-like state.
While ENSO and other modes of variability that influence our climate may occur naturally, there is research being done as to whether their behaviour will be influenced by climate change. It is not yet possible to say whether ENSO activity in the future will be enhanced or dampened, or if the frequency of events will change (Collins et al. 2010).
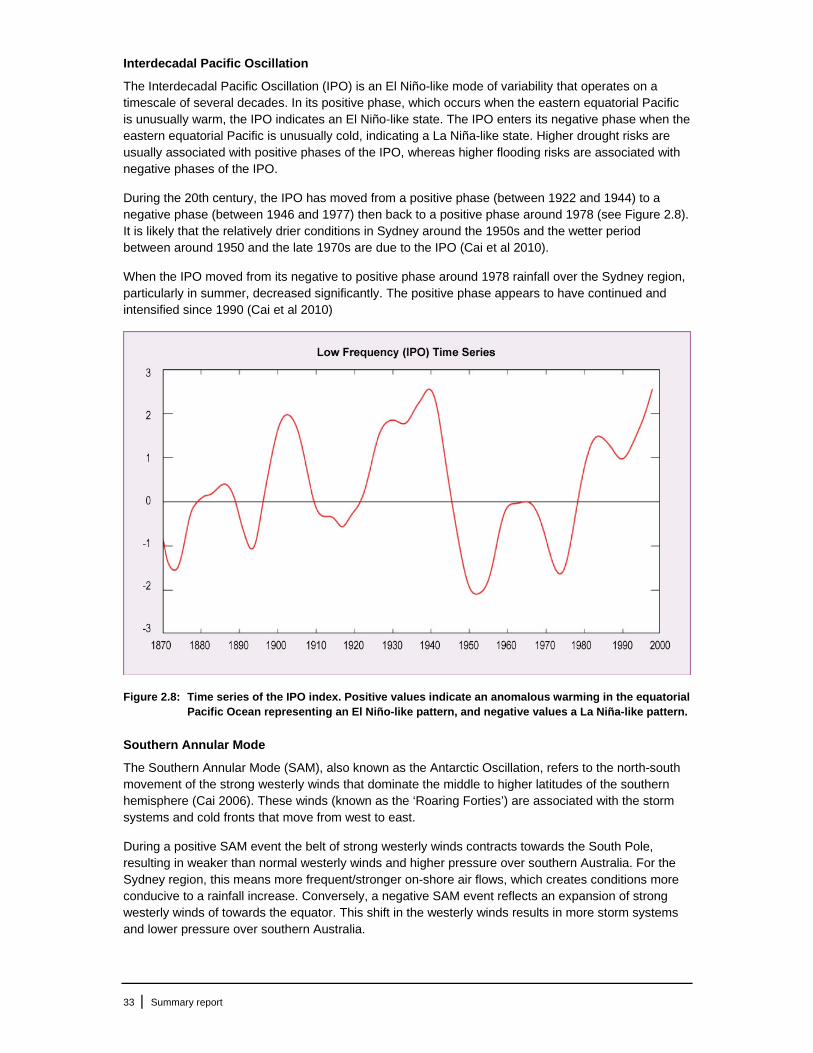
33 | Summary report
Interdecadal Pacific Oscillation
The Interdecadal Pacific Oscillation (IPO) is an El Niño-like mode of variability that operates on a timescale of several decades. In its positive phase, which occurs when the eastern equatorial Pacific is unusually warm, the IPO indicates an El Niño-like state. The IPO enters its negative phase when the eastern equatorial Pacific is unusually cold, indicating a La Niña-like state. Higher drought risks are usually associated with positive phases of the IPO, whereas higher flooding risks are associated with negative phases of the IPO.
During the 20th century, the IPO has moved from a positive phase (between 1922 and 1944) to a negative phase (between 1946 and 1977) then back to a positive phase around 1978 (see Figure 2.8). It is likely that the relatively drier conditions in Sydney around the 1950s and the wetter period between around 1950 and the late 1970s are due to the IPO (Cai et al 2010).
When the IPO moved from its negative to positive phase around 1978 rainfall over the Sydney region, particularly in summer, decreased significantly. The positive phase appears to have continued and intensified since 1990 (Cai et al 2010)
Figure 2.8: Time series of the IPO index. Positive values indicate an anomalous warming in the equatorial Pacific Ocean representing an El Niño-like pattern, and negative values a La Niña-like pattern.
Southern Annular Mode
The Southern Annular Mode (SAM), also known as the Antarctic Oscillation, refers to the north-south movement of the strong westerly winds that dominate the middle to higher latitudes of the southern hemisphere (Cai 2006). These winds (known as the ‘Roaring Forties’) are associated with the storm systems and cold fronts that move from west to east.
During a positive SAM event the belt of strong westerly winds contracts towards the South Pole, resulting in weaker than normal westerly winds and higher pressure over southern Australia. For the Sydney region, this means more frequent/stronger on-shore air flows, which creates conditions more conducive to a rainfall increase. Conversely, a negative SAM event reflects an expansion of strong westerly winds of towards the equator. This shift in the westerly winds results in more storm systems and lower pressure over southern Australia.

34 | Summary report
Since the late 1970s the SAM has been showing an increasing tendency to remain in a positive phase during the summer and autumn months (December through to May). This is caused primarily by Antarctic ozone depletion and, to a lesser extent, increasing carbon dioxide. When the SAM is in its positive phase there is a tendency for a rainfall increase over Sydney (Thompson and Solomon 2002 and Gillett and Thompson 2003). (This is in contrast to its influence on south-west Western Australia where a positive phase leads to drier conditions.)
Since the late 1960s, winter and summer westerly winds associated with the SAM at mid-latitudes have strengthened but further south (in the high-latitudes) they have weakened. This drives a stronger Eastern Australian Current, transporting more warm water along the east coast through the Tasman Sea. This, in turn, favours the development of more east coast lows. Together with the impact from stronger on-shore air flows, this tends to increase Sydney’s rainfall.
The contribution that the SAM makes to climate variability in Australia and the apparent positive trend in the SAM are relatively recent discoveries and as such are still active areas of research.
Indian Ocean Dipole
The Indian Ocean Dipole (IOD) is a major contributor to the variability of rainfall over Australia, and the most commonly referred to Indian Ocean influence on Australian climate. When the IOD is in a positive phase, sea surface temperatures (SSTs) around Indonesia are cooler than average while those in the western Indian Ocean are warmer than average. There is an increase in the easterly winds across the Indian Ocean in association with this SST pattern, while convection in areas near Australia reduces. This results in a decrease in rainfall over Australia. Conversely, during a negative phase, there are warmer than average SSTs near Indonesia and cooler than average SSTs in the western Indian Ocean. This results in more westerly winds across the Indian Ocean, greater convection near Australia, and enhanced rainfall over Australia (Cai et al 2009).
Although IOD events have become more frequent in recent decades, their impact on the Sydney region is rather weak. However, in GCMs the impact is overestimated due to the low resolution that does not resolve coastal and inland regions (Shi et al 2008, Cai et all 2009)
The contribution that Indian Ocean SSTs make to Australia's climate is not well understood and is an active area of research.
Human influences on climate
Carbon dioxide
Modelling and observation have found that increasing levels of carbon dioxide (IPCC 2007) lead to an upward trend of the SAM which is conducive to increased rainfall over Sydney. As carbon dioxide concentrations continue to increase, the Tasman Sea warming is expected to persist, and the associated enhancement of convection is expected to provide a mechanism for mitigating the rainfall decrease associated with the impacts of an El Niño-like warming pattern in the Sydney region (Shi et al. 2008) This is shown in Figure 2.9, which plots the annual mean rainfall changes by the year 2070, averaged over four climate model experiments (two with the A2 emission scenario, one with A1B, and the other with B1). It should be noted that these projections have been developed using coarse resolution data.
Further analysis in chapter three of this report provides finer resolution data to estimate impacts on the Sydney region. The figure clearly indicates that rainfall over south-west Western Australia and southern Australia will continue to decrease, but along the east coast, rainfall is maintained and even increases slightly. This rainfall increase over Sydney, due to stronger onshore air flows, is more likely to occur in summer than in winter and along the coastal areas of the catchment.

35 | Summary report
Figure 2.9: Large-scale annual mean rainfall changes by the year 2070 (mm/day) from an average ensemble of four climate model experiments (two with the A2 emission scenario, one with A1B, and one with B1).
Northern hemisphere aerosols
Aerosols are airborne liquid or solid particles, including sulphates, black carbon and dust. They impact on the climate in a number of ways. Some such as black carbon, absorb sunlight and produce a warming effect that might also inhibit rainfall, other (e.g. sulphates) reflect sunlight and therefore have a cooling influence. Aerosols may also impact cloud formation. Their influence on climate is poorly understood and introduces further uncertainty into projections of future climate change impacts (Schiermeier 2010).
Increasing northern hemisphere aerosols, particularly from Asia, could mitigate a possible rainfall decrease associated with the impacts of an El Niño in the Sydney region (Rotstayn et al 2007). One particular model suggests that this impact is particularly strong in the summer and autumn seasons, when most of the annual total rain in Sydney is recorded. That is, aerosols may result in wetter conditions (Rotstayn et al 2007). However, there is no consensus among IPCC assessments regarding this impact.
Inflows and synoptic classifications
In 2008, the NSW Office of Water commissioned an exploratory study to undertake synoptic classification (large-scale weather patterns) of climatic conditions associated with extremely high and low inflows to Sydney catchments (Pepler et al. 2009). The study identified east coast low events as having the single most significant impact on dam levels in the Sydney region. These strong cyclonic systems off the east coast of NSW are associated with prolonged high rainfall and were identified as responsible for 66 percent of high inflow days, including both the major dam-filling events since 1992 and 11 of the 13 largest inflow events.
Easterly winds, which bring moist air ashore along the NSW coast, were also identified as an important influence on inflows. Persistent moist easterly air flow was responsible for the remaining high inflow events, particularly during the 1960s and 1970s. In contrast, westerly wind anomalies, reducing this onshore moisture flow and associated rain events, have been identified as a consistent cause of low inflow events, particularly during spring.

36 | Summary report
While the study found that ENSO is not a factor in high flow events, it appears that it is associated with low flow events. The majority of summer low inflow events occurred during El Niño years, and 80 percent of low inflow events occurred when the SOI was negative. The IOD showed little influence on inflows in this region. However, a strong decadal variation in the frequency of high inflow events was apparent. This strong decadal variation was also found for annual rainfall.
Low inflows generally followed low rainfall, but this is not always the case, especially during summer. This is particularly evident in summer 1997–1998, which had near average rainfall but very low inflows. This may be because of unusually high temperatures during this season. Above average temperatures were associated with all low inflow events, indicating such conditions may have a significant impact on soil moisture and thus on the rainfall-inflow relationship. This warrants further investigation at the regional level, especially in the context of projected temperature increases due to anthropogenic climate change.
Implications for run-off and inflows
As discussed in the previous section, rainfall in the Sydney region is driven by a number of naturally occurring and anthropogenic regional and global factors. However their effect in terms of run-off and inflows is highly catchment-specific.
A study examining the potential impact from rising temperatures in the Murray–Darling Basin found that change in rainfall alone is unable to explain the observed inflow reduction (Cai and Cowan 2008). This study found that a rise of 1ºC in temperature would probably lead to a 15 percent reduction in the annual inflow, even if rainfall does not change. A similar study for Sydney’s Warragamba, Shoalhaven and Woronora catchments indicated that relationship between inflows and temperature fluctuations (independent from rainfall) only occurs in winter and is weak (Sullivan et al. 2009). These two reports highlight the need for catchment-specific analysis of climate change impacts and that the impacts of climate changes to rainfall, temperature and evaporation on catchment run-off is complex and requires detailed hydrologic investigation.
It is important to note that, in addition to long-term trends linked to climate change, naturally occurring climate variability will continue to have a major impact on Sydney’s water supply and demand. While this report focuses on future effects of climate change, related studies, such as the reconstruction of drought history in eastern Australia using speleothems and the historical reconstruction of large flood events in the Nepean and Warragamba catchments (outlined in Appendix 10), will increase our understanding of climate variability and how this may affect Sydney’s climate in coming decades.
37 | Summary report
CHAPTER 3
Climate change projections for Sydney’s catchments
This chapter outlines how Sydney’s climate may be impacted under different climate change scenarios. It presents the results from the CSIRO Mark 3 model, downscaled to the Sydney region.
About these projections
The results of climate change projections relative to the current climate (as described in chapter two) have been prepared for:
seasonal and annual average daily maximum temperature daily temperature extremes (i.e. average maximum temperature) seasonal and annual average rainfall daily rainfall extremes seasonal and annual average pan evaporation.
For all variables, the western part of the study area shows greater sensitivity to the projected changes in the climate in the future.
It should be noted that tables in this chapter present a best estimate projection which is the median (or 50th percentile) value. The uncertainty range is shown with the 5th and 95th percentiles.
The set of results for these variables is large and key results (for emission scenarios A1B and A2 – medium and high, respectively) are presented in this chapter. Additional results are included in Appendix 4 and in the technical paper (Mehrotra and Sharma 2010), which is available on the Water for Life website, www.waterforlife.nsw.gov.au).
Not all of the uncertainty associated with projecting future global and regional climate change can be easily quantified. The projected changes in evaporation, rainfall and daily maximum temperature and those related to hydrologic extremes (because of their rare occurrence) have high degree of uncertainty associated with them. It is important that this uncertainty is considered when making any inferences from these results.
Temperature
Projections for temperature changes refer to changes in the daily maximum temperature and not the daily average temperature.
Projected warming for 2030
The best estimate of annual average warming over the Sydney region by 2030 (for both A1B and A2) compared to the current climate (1960–2002) is around 0.5ºC (with a range from +0.3 to +0.7 ºC), with small variations across the seasons and emission scenarios (Table 3.1). The inland region of the study area shows that future temperatures are expected to be higher than on the coast. The best estimate of the annual warming, from the current climate, for 2030 is +0.3ºC (with a range from +0.3 to +0.4ºC) for A1B and +0.7ºC (with a range from +0.6 to +0.7ºC) for A2 emission scenario. Changes in daily maximum temperature are shown in Figure 3.1.
Projected warming for 2070
By 2070, the annual warming ranges from around 1.3 to 1.6ºC (with best estimate of 1.5ºC) (Table 3.1). Spring and summer seasons are projected to experience greater warming (about 1.5ºC) than autumn and winter seasons (about 1.0ºC). The best warming estimates vary from +1.4ºC (with spread from +1.3 to +1.5ºC) for A1B and +1.6ºC (with spread from +1.5 to +1.6ºC) for the A2 scenario.
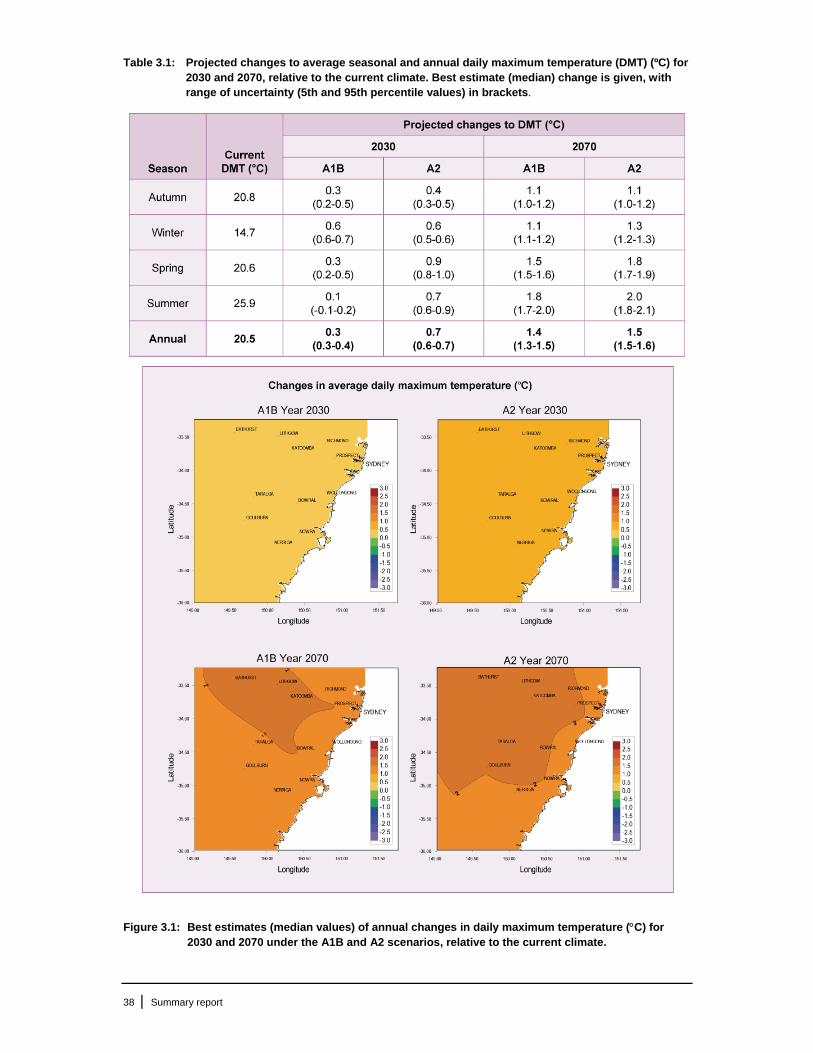
38 | Summary report
Table 3.1: Projected changes to average seasonal and annual daily maximum temperature (DMT) (ºC) for 2030 and 2070, relative to the current climate. Best estimate (median) change is given, with range of uncertainty (5th and 95th percentile values) in brackets.
Figure 3.1: Best estimates (median values) of annual changes in daily maximum temperature (C) for 2030 and 2070 under the A1B and A2 scenarios, relative to the current climate.
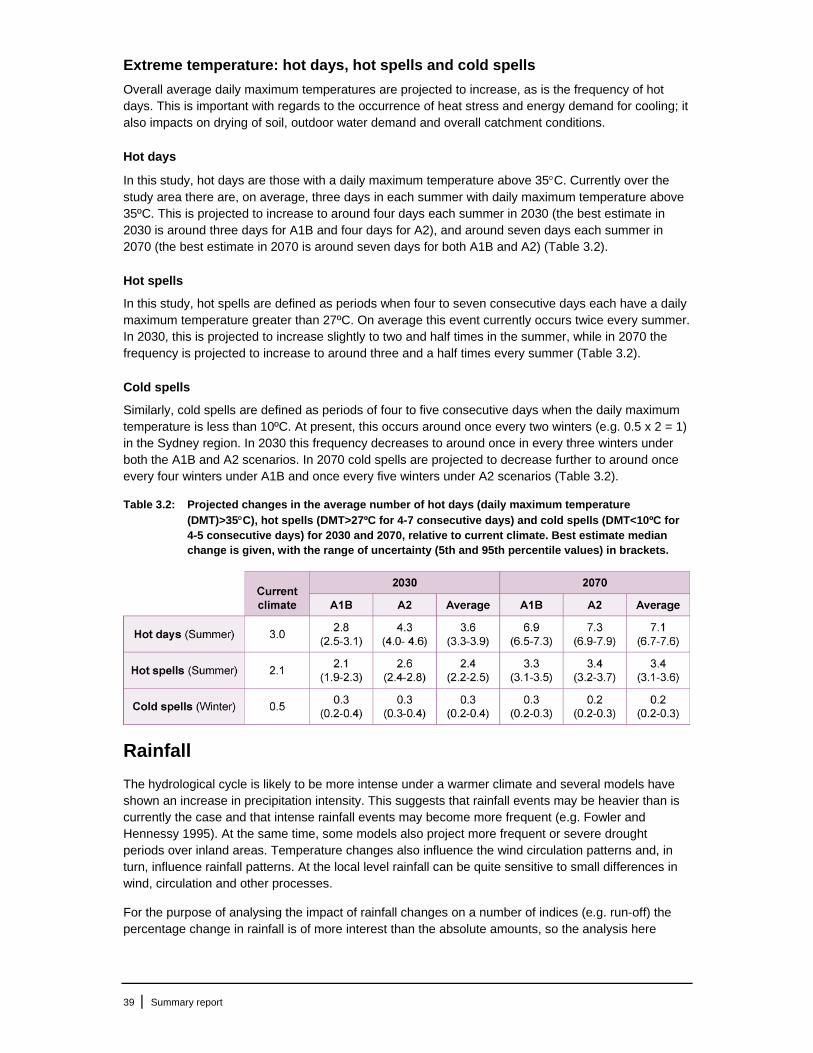
39 | Summary report
Extreme temperature: hot days, hot spells and cold spells
Overall average daily maximum temperatures are projected to increase, as is the frequency of hot days. This is important with regards to the occurrence of heat stress and energy demand for cooling; it also impacts on drying of soil, outdoor water demand and overall catchment conditions.
Hot days
In this study, hot days are those with a daily maximum temperature above 35C. Currently over the study area there are, on average, three days in each summer with daily maximum temperature above 35ºC. This is projected to increase to around four days each summer in 2030 (the best estimate in 2030 is around three days for A1B and four days for A2), and around seven days each summer in 2070 (the best estimate in 2070 is around seven days for both A1B and A2) (Table 3.2).
Hot spells
In this study, hot spells are defined as periods when four to seven consecutive days each have a daily maximum temperature greater than 27ºC. On average this event currently occurs twice every summer. In 2030, this is projected to increase slightly to two and half times in the summer, while in 2070 the frequency is projected to increase to around three and a half times every summer (Table 3.2).
Cold spells
Similarly, cold spells are defined as periods of four to five consecutive days when the daily maximum temperature is less than 10ºC. At present, this occurs around once every two winters (e.g. 0.5 x 2 = 1) in the Sydney region. In 2030 this frequency decreases to around once in every three winters under both the A1B and A2 scenarios. In 2070 cold spells are projected to decrease further to around once every four winters under A1B and once every five winters under A2 scenarios (Table 3.2).
Table 3.2: Projected changes in the average number of hot days (daily maximum temperature
(DMT)>35C), hot spells (DMT>27ºC for 4-7 consecutive days) and cold spells (DMT<10ºC for 4-5 consecutive days) for 2030 and 2070, relative to current climate. Best estimate median change is given, with the range of uncertainty (5th and 95th percentile values) in brackets.
Rainfall
The hydrological cycle is likely to be more intense under a warmer climate and several models have shown an increase in precipitation intensity. This suggests that rainfall events may be heavier than is currently the case and that intense rainfall events may become more frequent (e.g. Fowler and Hennessy 1995). At the same time, some models also project more frequent or severe drought periods over inland areas. Temperature changes also influence the wind circulation patterns and, in turn, influence rainfall patterns. At the local level rainfall can be quite sensitive to small differences in wind, circulation and other processes.
For the purpose of analysing the impact of rainfall changes on a number of indices (e.g. run-off) the percentage change in rainfall is of more interest than the absolute amounts, so the analysis here

40 | Summary report
focuses on percentage changes in seasonal and annual rainfall amounts relative to the current climate.
Projected rainfall changes for 2030
Projections for 2030 indicate wetter autumns and summers over the study region, and drier springs and winters.
The number of wet days (i.e. days with total rainfall greater than 0.3 mm) is projected to change very little, with a slight increase of five percent (ranging from two to eight percent) under the A1B scenario and a slight decrease of three percent (ranging from minus six to zero percent) under the A2 scenario (Table 3.3). The annual rainfall amount under the A1B scenario is projected to increase by 13 percent (ranging from seven to 20 percent), while under the A2 scenario annual rainfall amount is projected to decrease by one percent (ranging from minus six to four percent) (Table 3.4).
Projected rainfall changes for 2070
By 2070, under A1B and A2 scenarios the annual number of wet days decreases slightly by four percent (ranging from minus seven to minus two percent) (Table 3.3). The annual rainfall amount under both A1B and A2 scenarios is projected to decrease slightly by around two percent (ranging from minus seven to three percent) (Table 3.4).
Table 3.3: Projected changes in seasonal and annual number of wet days in years 2030 and 2070. Best estimates (median) percent changes in the number of wet days are given, with range of uncertainty (5th and 95th percentile values) in brackets.
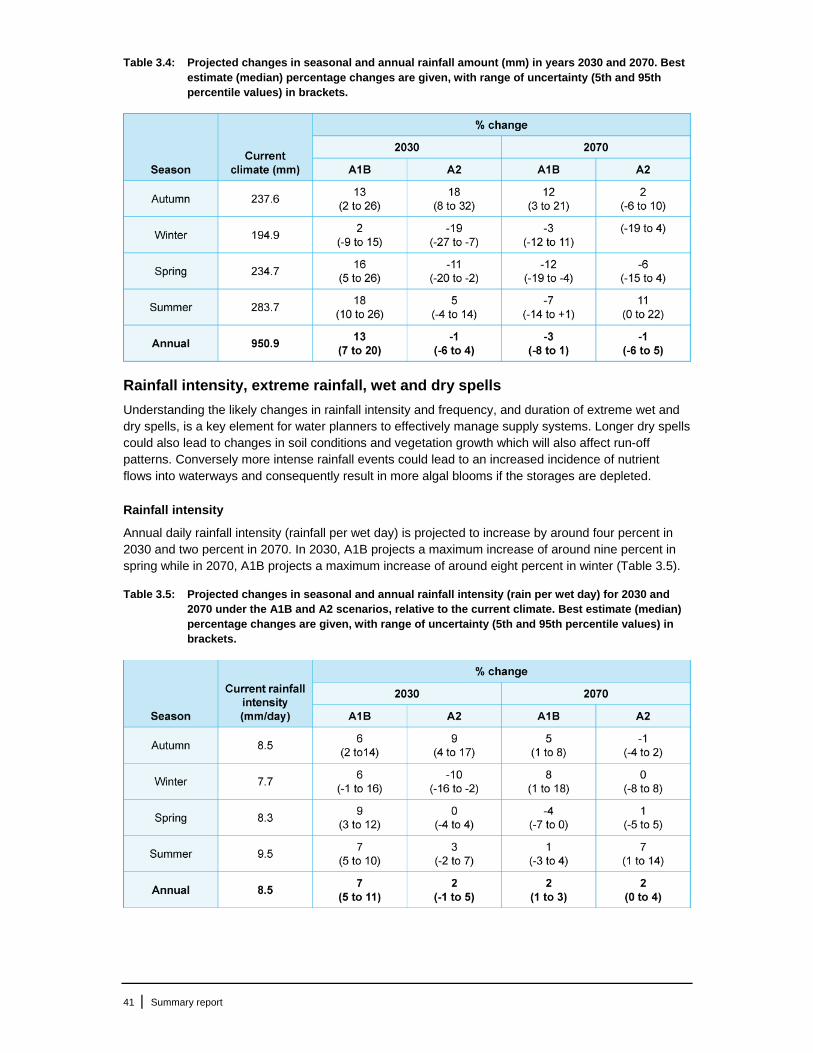
41 | Summary report
Table 3.4: Projected changes in seasonal and annual rainfall amount (mm) in years 2030 and 2070. Best estimate (median) percentage changes are given, with range of uncertainty (5th and 95th percentile values) in brackets.
Rainfall intensity, extreme rainfall, wet and dry spells
Understanding the likely changes in rainfall intensity and frequency, and duration of extreme wet and dry spells, is a key element for water planners to effectively manage supply systems. Longer dry spells could also lead to changes in soil conditions and vegetation growth which will also affect run-off patterns. Conversely more intense rainfall events could lead to an increased incidence of nutrient flows into waterways and consequently result in more algal blooms if the storages are depleted.
Rainfall intensity
Annual daily rainfall intensity (rainfall per wet day) is projected to increase by around four percent in 2030 and two percent in 2070. In 2030, A1B projects a maximum increase of around nine percent in spring while in 2070, A1B projects a maximum increase of around eight percent in winter (Table 3.5).
Table 3.5: Projected changes in seasonal and annual rainfall intensity (rain per wet day) for 2030 and 2070 under the A1B and A2 scenarios, relative to the current climate. Best estimate (median) percentage changes are given, with range of uncertainty (5th and 95th percentile values) in brackets.

42 | Summary report
Extreme rainfall days
The number of extreme rainfall days (where rainfall is greater than 40 mm/day) is likely to increase in some seasons, with a maximum increase of about 30 percent in spring in 2030 under the A1B scenario and about 20 percent in autumn in 2070 under the A1B scenario (Table 3.6). Under both A1B and A2 emission scenarios the number of extreme rainfall days each year is projected to increase only slightly (around three percent) in 2070. In 2070 under A2, the number of extreme days increases by around 18 percent in summer, while there is a decrease of around seven percent in winter. Little change is projected for the number of extreme days in spring or autumn in 2070.
Table 3.6: Projected changes in seasonal and annual number of extreme rainfall days (>40 mm/day) in 2030 and 2070 under the A1B and A2 scenarios, relative to the current climate. Best estimate (median) percentage changes are given, with range of uncertainty (5th and 95th
percentile values) in brackets.
Wet spells
Increased instances of wet spells of seven days or more are likely. This increase is mainly expected to occur in autumn and summer. Rainfall amounts in these longer wet spells are likely to increase annually. In 2030 the annual increase in rainfall amounts for a wet spell is projected to increase by around six percent, while in 2070 the annual increase in rainfall amounts for a wet spell is projected to increase by around two percent (Table 3.7).
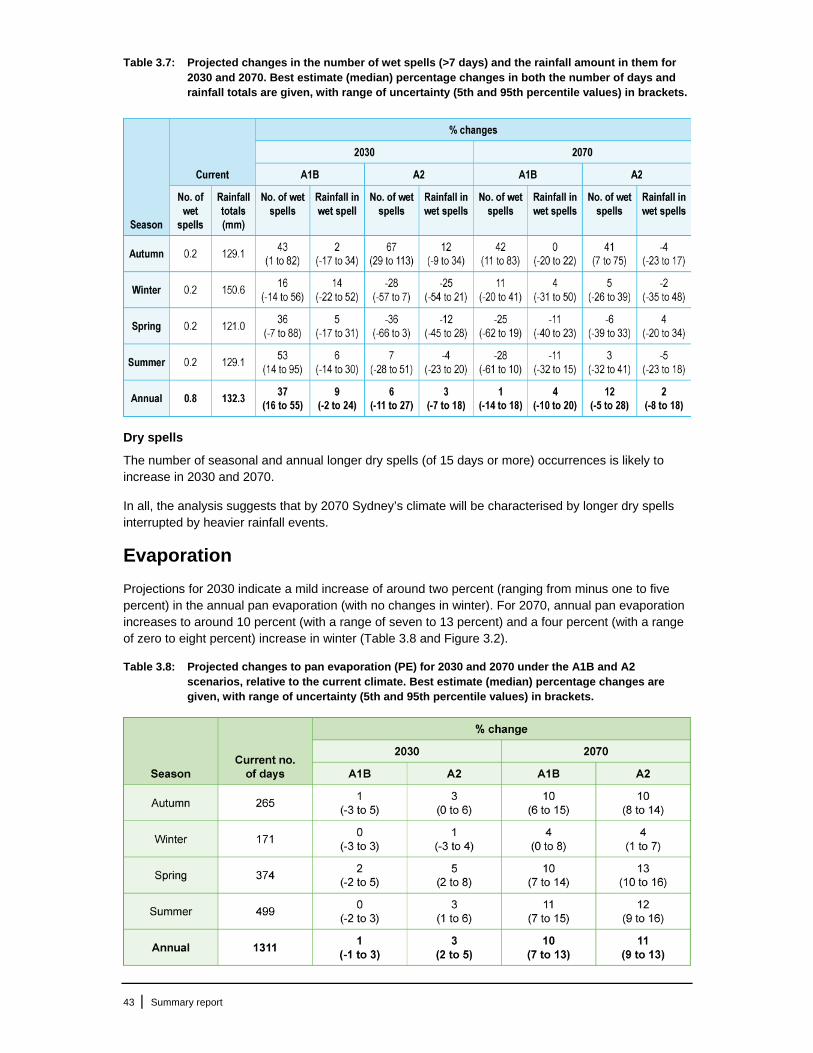
43 | Summary report
Table 3.7: Projected changes in the number of wet spells (>7 days) and the rainfall amount in them for 2030 and 2070. Best estimate (median) percentage changes in both the number of days and rainfall totals are given, with range of uncertainty (5th and 95th percentile values) in brackets.
Dry spells
The number of seasonal and annual longer dry spells (of 15 days or more) occurrences is likely to increase in 2030 and 2070.
In all, the analysis suggests that by 2070 Sydney’s climate will be characterised by longer dry spells interrupted by heavier rainfall events.
Evaporation
Projections for 2030 indicate a mild increase of around two percent (ranging from minus one to five percent) in the annual pan evaporation (with no changes in winter). For 2070, annual pan evaporation increases to around 10 percent (with a range of seven to 13 percent) and a four percent (with a range of zero to eight percent) increase in winter (Table 3.8 and Figure 3.2).
Table 3.8: Projected changes to pan evaporation (PE) for 2030 and 2070 under the A1B and A2 scenarios, relative to the current climate. Best estimate (median) percentage changes are given, with range of uncertainty (5th and 95th percentile values) in brackets.

44 | Summary report
Figure 3.2: Best estimates (50th percentiles) of changes in annual pan evaporation (%) for 2030 and 2070 under the A1B and A2 scenarios, relative to the current climate. Blue indicates a higher percentage change in evaporation.
The number of days in a year where average daily pan evaporation is greater than 9 mm over the study area is also likely to increase in all seasons. In the current climate there are 10.4 days in a year with pan evaporation at a station being more than 9 mm. In a warmer climate, this number is expected to increase to 11.5 (with ranges of 10.5 to 13.5) in 2030, to about 17.4 (with ranges of 15.5 to 19.5) in 2070 (Table 3.9).
Cold/humid conditions occur when there are 15 or more consecutive days where daily pan evaporation is less than 5 mm. These conditions are expected to show a slight decrease, moving from three occurrences per year in the current climate to just under three occurrences per year in 2030 and 2070) (Table 3.9).
Similarly, spells of seven or more days with pan evaporation greater than 7 mm (hot/dry conditions, currently occurring once in every three years) are expected to be more frequent in the future with a return period of about two years in 2030 and one year in 2070.
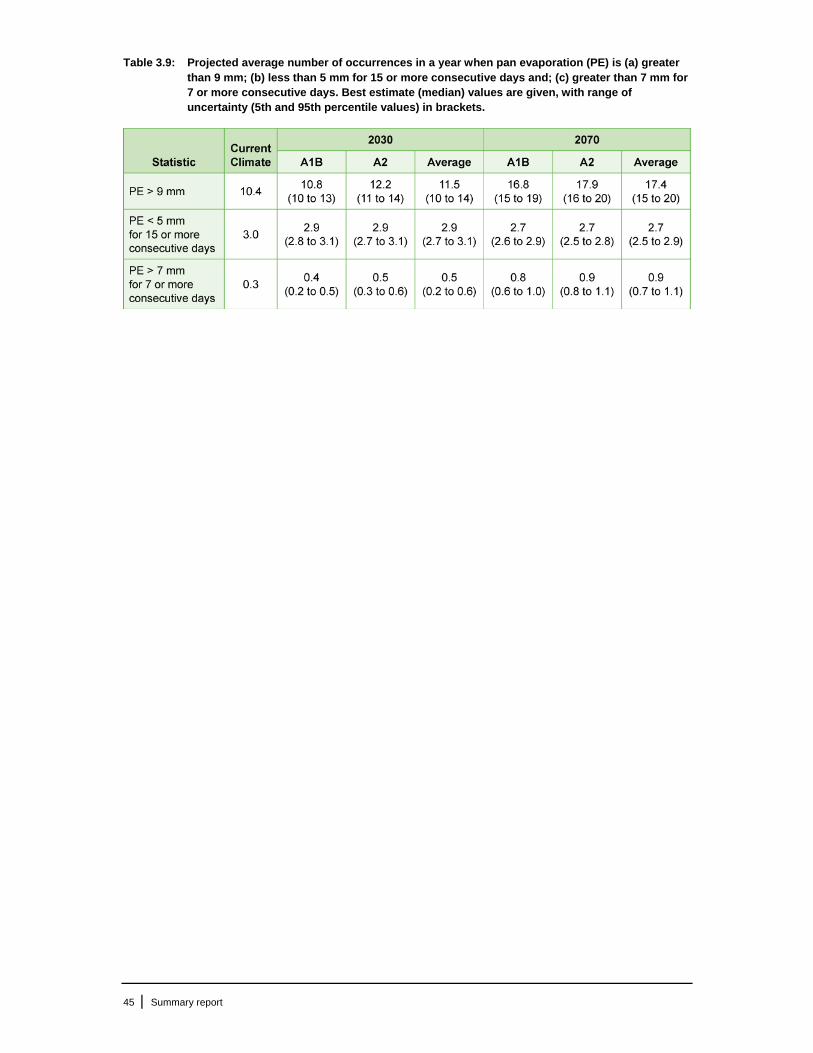
45 | Summary report
Table 3.9: Projected average number of occurrences in a year when pan evaporation (PE) is (a) greater than 9 mm; (b) less than 5 mm for 15 or more consecutive days and; (c) greater than 7 mm for 7 or more consecutive days. Best estimate (median) values are given, with range of uncertainty (5th and 95th percentile values) in brackets.
46 | Summary report
CHAPTER 4
Impacts on water availability
The system’s annual water supply availability is referred to as system yield. The system yield is defined as the annual volume that can safely be drawn from the dam system without compromising system security or triggering unacceptably high frequency of restrictions. This is defined by a set of performance/design criteria as follows:
Security: storages do not approach emptiness (defined as five percent of water in the storage) more often than 0.001 percent of the time.
Robustness: restrictions occur no more often than once every 10 years. That is restrictions are not too frequent.
Reliability: restrictions last no longer than three percent of the time. That is, restrictions do not last for too long during any one drought event.
Currently the amount that can safely be drawn from the Sydney’s water supply system each year over the long term is 570 GL per year.
More detail is provided in Appendix 6.
The assessment of yield is based on system performance/design criteria, the current system’s capacity and constraints combined with 200,000 years (2000 replicates x 100 years) of synthetically generated inflows that represent the historical frequency and severity of low flow (drought) periods. The Sydney Catchment Authority (SCA) uses Water Headwork Network (WATHNET) to assess the system yield.
To estimate future water availability, WATHNET is adjusted to represent the complex set of system constraints, environmental and regulatory releases and operating rules under a variety of different system configurations or climatic considerations.
The normal assessment framework for Sydney’s water supply system uses records from between 1909 and 2008. However to ensure consistency throughout the study, a shorter 43-year period, based on the availability of downscaled global climate model (GCM) simulations between 1960 and 2002, was used to assess the possible impact of climate change on Sydney’s future water supply and should only be used as a relative reference.
Estimating the impacts on water availability
To assess the impacts of future climate change on water availability in Sydney, climate projections from the CSIRO Mark 3 (Mk3) GCM were downscaled to produce daily rainfall and evaporation projections at catchment/local scale. This data was used in catchment-based rainfall/run-off models to develop inflow projections. Inflow and evaporation projections were then used in WATHNET to assess the impacts of climate change on total water supply of the Sydney Catchment Authority (SCA) system and interconnected reservoirs.
For this investigation, the A2 emission scenario was considered as being closest to current projections of the future climate. However, for consistency with other chapters of this report, the results for A1B and A2 emission scenarios are presented in this chapter. Although the best available climate change and hydroclimatological science was used in this study, there were a number of limitations that reduced the confidence in the results for the impacts of climate change of Sydney’s water supply. These limitations are discussed in chapter one of this report.

47 | Summary report
Catchment-scale rainfall, evaporation and inflow projections
Rainfall
To assess the impacts on rainfall, nearly 50 rainfall sites were used to develop catchment average rainfall estimates. The observed estimates were compared with the estimates from statistical downscaling techniques which resulted in a fair representation of the climate between 1960 and 2002. These downscaled estimates were then compared to each of the climate scenarios (A1B and A2) and timeframes (2030 and 2070) (Table 4.1, and Appendix 5 (for A2 only).
Table 4.1: Changes in annual average rainfall (mm/year) for current climate and future climate changes under A1B and A2 emission scenarios for 2030 and 2070.
In summary, the impacts under A1B emission scenario for rainfall projections at 2030 suggest:
average rainfall could increase in the Warragamba Catchment by around eight percent, Shoalhaven Catchment by around 10 percent and in the Upper Nepean Catchment by around 16 percent
Upper Nepean Catchment could see a significant increase in rainfall in low rainfall years an increase in rainfall of around 10 percent during high rainfall years in the Shoalhaven
Catchment.
For A1B emission scenario in 2070, the projections suggest:
reductions in rainfall across all catchments from 2030

48 | Summary report
average rainfall could decrease in the Warragamba Catchment by around seven percent and in the Shoalhaven Catchment by around eight percent but increase for the Upper Nepean Catchment by around three percent, compared to the current climate
the amount of rainfall, in low rainfall years, for the Upper Nepean Catchment may remain similar but may increase by around four percent during the high rainfall years.
The impacts under A2 emission scenario for rainfall projections for 2030 suggest:
average rainfall could decrease in the Warragamba Catchment by around three percent and in the Shoalhaven Catchment by around five percent but increase in the Upper Nepean Catchment by around two percent
Upper Nepean Catchment could see a increase in the amount of rainfall in the low rainfall years
Warragamba Catchment may experience a reduction in average rainfall years (between 20 percent and 60 percent time exceeded) rather than the extreme high and low rainfall years
The amount of rainfall, in high rainfall years, could be reduced by around six percent in the Shoalhaven Catchment.
For A2 emission scenario in 2070, the projections suggest:
Warragamba and Shoalhaven Catchments could experience a further one percent decrease in average rainfall, while the Upper Nepean Catchment may experience a further increase of around three percent compared to 2030
low rainfall years in the Warragamba and Shoalhaven Catchments may be four percent drier, while the high rainfall years could become wetter by up to five percent, compared to 2030
the amount of rainfall in low rainfall years for the Upper Nepean Catchments may remain similar but the amount of rainfall in high rainfall years may increase by six percent, compared to 2030
compared to the current climate, average rainfall could decrease in the Warragamba Catchment by around four percent and the Shoalhaven Catchment by around six percent but increase in the Upper Nepean Catchment by around five percent.
Evaporation
Evaporation results for 2030 and 2070 under both the A1B and A2 emission scenarios are given in Table 4.2. These four sites at Warragamba, Nepean, Wingecarribee and Goulburn reflect the spatial coverage of the supply catchments. Warragamba, Nepean and Wingecarribee provide representation of evaporation at major storages and near coastal catchments, while Goulburn provides an indication of the evaporation changes to the inland catchments.
Evaporation projections for the A1B emission scenario suggest that:
in 2030, compared to the current climate, there is up to two percent increase in pan evaporation spread equally throughout wet and dry years for all stations
in 2070, compared to 2030, all stations increase again from around eight to nine percent for Warragamba, Wingecarribee and Nepean, to 18 percent for Goulburn. The increases in percent difference (from 2030) are similar for A1B and A2 at 2070.
In summary, for the A1B emission scenario at 2070 the pan evaporation for the majority of the stations increases by around nine percent, except for Goulburn where there is a 20 percent increase.
Evaporation observations for the A2 emission scenario suggest that:
in 2030, compared to current climate, there is a three percent increase in pan evaporation spread equally throughout wet and dry years for all stations, except for Goulburn which increases by seven percent
in 2070, compared to 2030, these stations increase again by another six to eight percent, except for Goulburn which increases by 14 percent.
In summary, for the A2 emission scenario in 2070 the pan evaporation for the majority of the stations increases by around 10 percent, except for Goulburn where there is a 22 percent increase.
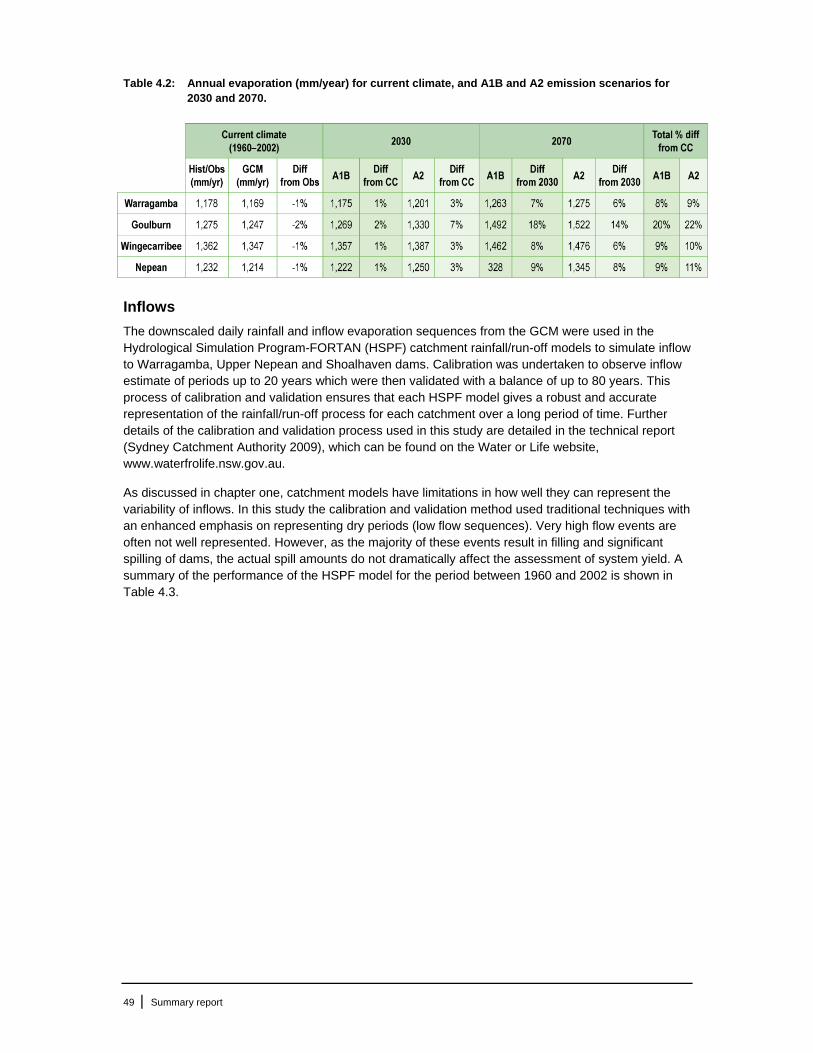
49 | Summary report
Table 4.2: Annual evaporation (mm/year) for current climate, and A1B and A2 emission scenarios for 2030 and 2070.
Inflows
The downscaled daily rainfall and inflow evaporation sequences from the GCM were used in the Hydrological Simulation Program-FORTAN (HSPF) catchment rainfall/run-off models to simulate inflow to Warragamba, Upper Nepean and Shoalhaven dams. Calibration was undertaken to observe inflow estimate of periods up to 20 years which were then validated with a balance of up to 80 years. This process of calibration and validation ensures that each HSPF model gives a robust and accurate representation of the rainfall/run-off process for each catchment over a long period of time. Further details of the calibration and validation process used in this study are detailed in the technical report (Sydney Catchment Authority 2009), which can be found on the Water or Life website, www.waterfrolife.nsw.gov.au.
As discussed in chapter one, catchment models have limitations in how well they can represent the variability of inflows. In this study the calibration and validation method used traditional techniques with an enhanced emphasis on representing dry periods (low flow sequences). Very high flow events are often not well represented. However, as the majority of these events result in filling and significant spilling of dams, the actual spill amounts do not dramatically affect the assessment of system yield. A summary of the performance of the HSPF model for the period between 1960 and 2002 is shown in Table 4.3.

50 | Summary report
Table 4.3: Changes in annual inflow (GL/year) for current climate and future climate change under the A2 emissions scenario.
Downscaled rainfall and evaporation estimates were applied to the HSPF models for the current climate (1960–2002) and for future emission scenarios A2, A1B and B1. Although the downscaled estimates further reduce the inflow variability, which is most likely due to poor reproduction of high flow events, the average and lower inflows (which occur around 50 to 60 percent of the time) are adequately represented. The result for A1B and A2 emission scenarios for 2030 and 2070 are presented in Table 4.4.
Under the A1B emission scenario in 2030, average inflows are projected to increase between 23 percent and 28 percent for all major dams (Warragamba, Upper Nepean and Shoalhaven). In 2070 there is projected to be a significant reduction in inflows for all dams compared to the 2030 projections. Overall for 2030 and 2070 there is a projected decrease in inflows, of around 30 percent from downscaled current climate, for the Warragamba and Shoalhaven dams and a two percent increase in inflows for the Upper Nepean dams.
Under the A2 emission scenario average inflows for Warragamba are projected to be reduced by up to 21 percent in 2030, and further six percent in 2070. For Upper Nepean dams, there is a one percent increase in flows in 2030. In 2070, there is a projected increase of five percent in the Upper Nepean dams, driven by changes in high flow years. Average inflows to the Shoalhaven are projected to be reduced by 20 percent in 2030 and another six percent in 2070. Overall for 2030 and 2070, there is a projected decrease in inflows from the downscaled current climate of around 25 percent for Warragamba and Shoalhaven dams.

51 | Summary report
Table 4.4: Changes in annual inflow (GL/year) for current climate and future climate changes under A1B and A2 emission scenarios for 2030 and 2070.
Summary of impacts on rainfall and inflow
The projections suggest that inland regions (the majority of the Warragamba and Shoalhaven catchments) are getting drier, while the coastal regions (Upper Nepean, Wingecarribee, eastern section of Warragamba and parts of the Shoalhaven catchments) tend to be slightly wetter.
The impacts on inflow in 2070 under both the A2 and A1B emission scenarios are similar. Under emission scenario A2 in 2030, conditions are much drier than the current climate and most of the impacts that are projected for A2 at 2070 have already occurred in 2030. In contrast, under emission scenario A1B in 2030 conditions are much wetter than the conditions under the current climate (1960–2002).
The percent change (compared to current climate) in average annual rainfall (mm/year) and inflow (GL/year), for A1B and A2 emission scenario at 2030 and 2070 are detailed in Table 4.5. These results suggest that a majority of the projected impacts of climate change on inflows would occur by 2030 across the entire supply catchment.
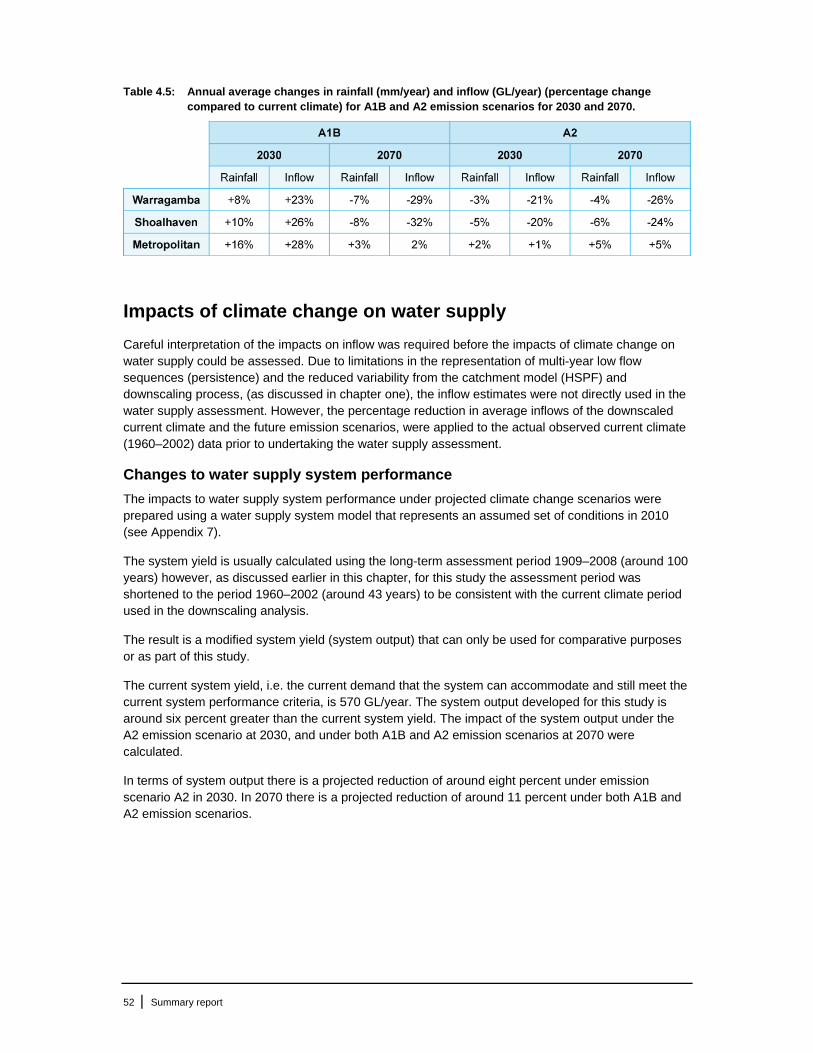
52 | Summary report
Table 4.5: Annual average changes in rainfall (mm/year) and inflow (GL/year) (percentage change compared to current climate) for A1B and A2 emission scenarios for 2030 and 2070.
Impacts of climate change on water supply
Careful interpretation of the impacts on inflow was required before the impacts of climate change on water supply could be assessed. Due to limitations in the representation of multi-year low flow sequences (persistence) and the reduced variability from the catchment model (HSPF) and downscaling process, (as discussed in chapter one), the inflow estimates were not directly used in the water supply assessment. However, the percentage reduction in average inflows of the downscaled current climate and the future emission scenarios, were applied to the actual observed current climate (1960–2002) data prior to undertaking the water supply assessment.
Changes to water supply system performance
The impacts to water supply system performance under projected climate change scenarios were prepared using a water supply system model that represents an assumed set of conditions in 2010 (see Appendix 7).
The system yield is usually calculated using the long-term assessment period 1909–2008 (around 100 years) however, as discussed earlier in this chapter, for this study the assessment period was shortened to the period 1960–2002 (around 43 years) to be consistent with the current climate period used in the downscaling analysis.
The result is a modified system yield (system output) that can only be used for comparative purposes or as part of this study.
The current system yield, i.e. the current demand that the system can accommodate and still meet the current system performance criteria, is 570 GL/year. The system output developed for this study is around six percent greater than the current system yield. The impact of the system output under the A2 emission scenario at 2030, and under both A1B and A2 emission scenarios at 2070 were calculated.
In terms of system output there is a projected reduction of around eight percent under emission scenario A2 in 2030. In 2070 there is a projected reduction of around 11 percent under both A1B and A2 emission scenarios.

53 | Summary report
CHAPTER 5
Implications for demand
Factors influencing demand
The total demand for potable water in Sydney Water’s (Sydney Water) area of operations in the future will be influenced by many factors. Key drivers of the demand for water are likely to be the:
size of the population types of dwellings people live in (houses, townhouses or units) pattern of residential, commercial and industrial activity and associated water use water efficiency of households or businesses price of water weather conditions.
This analysis examines how climate change may influence the demand for water in the future by comparing forecast demand (in 2030 and 2070) under current climate conditions (i.e. no climate change) with forecast demand under different climate change scenarios.
Weather conditions and water use
There is a historical pattern where people use more water when it is hot and dry, especially in summer. For example, compared to January 2000, the weather in January 2001 was drier and hotter with more evaporation. In January 2000 the average demand for potable water was 425 litres per person per day. In January 2001 the demand was 527 litres per person per day, around 25 percent higher than January 2000 (Figure 5.1).
Figure 5.1: Weather conditions and water use, January 2000 and 2001.
Long-term changes in the climate therefore have the potential to increase the underlying demand for potable water in Sydney Water’s area of operation. A drier, hotter future may mean a greater demand for water if all other factors hold constant.
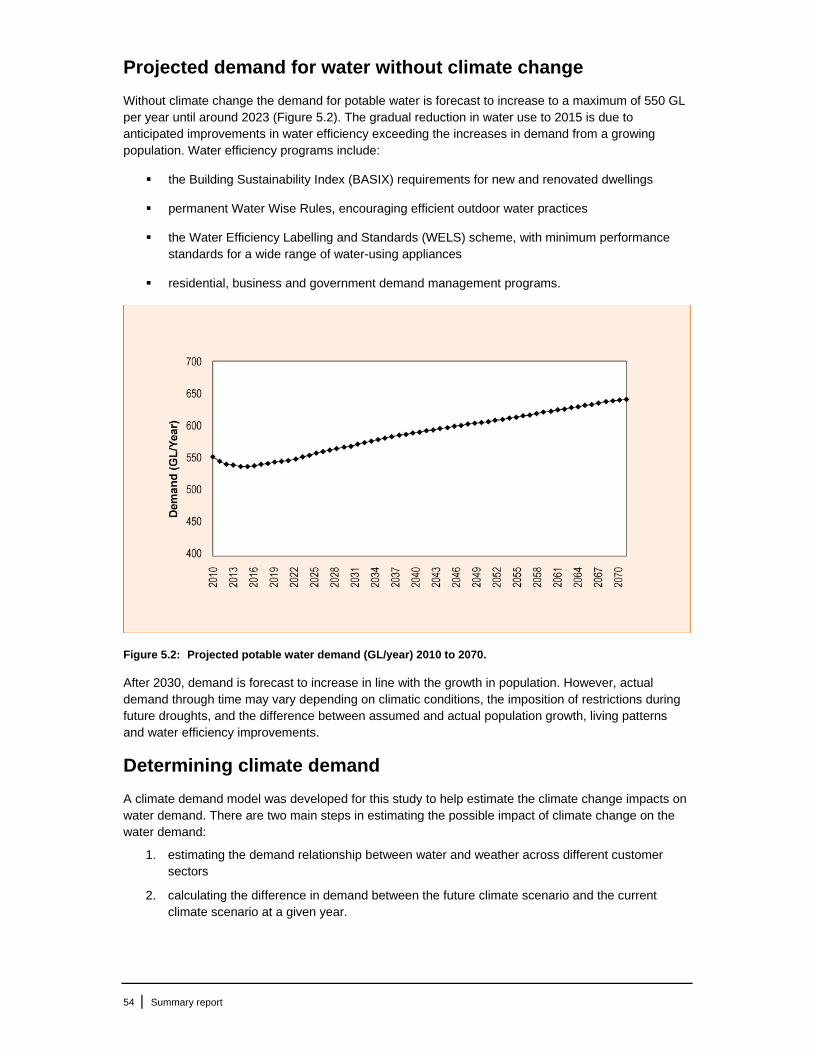
54 | Summary report
Projected demand for water without climate change
Without climate change the demand for potable water is forecast to increase to a maximum of 550 GL per year until around 2023 (Figure 5.2). The gradual reduction in water use to 2015 is due to anticipated improvements in water efficiency exceeding the increases in demand from a growing population. Water efficiency programs include:
the Building Sustainability Index (BASIX) requirements for new and renovated dwellings
permanent Water Wise Rules, encouraging efficient outdoor water practices
the Water Efficiency Labelling and Standards (WELS) scheme, with minimum performance standards for a wide range of water-using appliances
residential, business and government demand management programs.
Figure 5.2: Projected potable water demand (GL/year) 2010 to 2070.
After 2030, demand is forecast to increase in line with the growth in population. However, actual demand through time may vary depending on climatic conditions, the imposition of restrictions during future droughts, and the difference between assumed and actual population growth, living patterns and water efficiency improvements.
Determining climate demand
A climate demand model was developed for this study to help estimate the climate change impacts on water demand. There are two main steps in estimating the possible impact of climate change on the water demand:
1. estimating the demand relationship between water and weather across different customer sectors
2. calculating the difference in demand between the future climate scenario and the current climate scenario at a given year.

55 | Summary report
Water use, weather and customers
It has long been understood that different customer sectors have different responses to weather conditions. As such, six customer sectors across Sydney’s demand catchments have been modelled to capture their different characteristics related to weather conditions. These sectors are:
Single residential: Outdoor consumption in this sector is responsive to climate. This sector has the largest water use and accounts for about 50 percent of the total demand.
Multi-residential: This sector accounts for more than 20 percent of the total demand, however it does not respond to climate as strongly as the single residential sector as it has a smaller outdoor component.
Industrial: Many industries consume water irrespective of climate conditions. The consumption pattern of this sector is dominated by a few large users.
Commercial: Cooling tower and outdoor usage is the main component responsive to climate conditions.
Government and other: This sector has similar characteristics to the commercial sector.
Primary producer: This sector has a strong response to climate, however it accounts for less than one percent of the total consumption. This means that the overall impact of this sector on total consumption is minimal.
To encompass the weather variability across Sydney, the demand catchments were divided into 14 water supply zones. These zones were linked to nine available weather stations located within the demand catchments, which provided the rainfall, maximum temperature and pan evaporation data necessary for the modelling (Appendix 8).
The relationship between weather variables (rainfall, maximum temperature and pan evaporation) and demand of each customer sector was established for each of the 14 different water supply zones across Sydney Water’s area of operations.
The relationships quantify the impact on demand for variations in certain weather conditions. For example, how much does the demand for single dwellings in the Ryde system increase if the temperature increases by one degree?
Demand difference from current climate
The possible impact of climate change on demand was estimated by calculating the difference of demand between future emission scenarios (B1, A1B, and A2) and the current climate scenario at a given year. The predicted changes in demand for water given different climate outcomes were estimated at 2030 and 2070.
Population and dwelling projections, savings from water conservation programs, climate conditions from various emission scenarios and the relationships between demand and climate variables for each sector in each water supply zone were put into the demand model to produce monthly demands for each sector in each water supply zone.
Modelled changes in water demand due to climate
The modelling approach used in this study does not model non-linear responses well. This is critical in relation to demand hardening (the reduction in effectiveness of measures designed to reduce consumption in drought periods due to the increased uptake of these measure over time). To deal with this issue, it is commonly assumed that as water conservation options are exhausted, there will be a reduction in the efficiency of water restrictions as the amount of discretionary water used is reduced. This statistical approach does not take into account social and psychological considerations and water usage, for example, the level of trust between a water utility and their customers, customer attitudes to water conservation options, or the willingness by individuals to cooperate for the common good. These

56 | Summary report
considerations are typically qualitative, difficult and costly to measure, highly dynamic and subjective, and therefore inappropriate for statistical models. However, these considerations are very important for policy makers and must complement the information given by predictions and quantitative models.
Annual average demand
In general, the increase in average demand due to climate change is relatively small, ranging from 0.3 percent to 1.1 percent by 2030 and around 1.4 percent to 3.9 percent by 2070 (Table 5.1). The impacts of climate change under both the A1B and A2 scenarios are more severe in 2070 than in 2030. Demand depends on temperature, evaporation and rainfall, and although the rainfall in 2070 does not change much compared with that in 2030, both evaporation and temperature increase.
Table 5.1: Average annual demand increases due to climate changes for different scenarios. The increase is measured against the current water demand without climate change impacts, i.e. 567 GL/year for 2030 and 639 GL/year for 2070 (see Table 5.3).
The total increases in annual demand under the A2 scenario for individual customer sectors are listed in Table 5.2. As expected the majority of the increase is from the residential and commercial sectors. Within the residential sector, single residential dwellings show the largest increase since the climate impact is mainly from outdoor water uses. Temperature and evaporation increases also impact the use of air conditioners and outdoor use in the commercial sector.
In general, annual demand increases due to climate change are more severe in 2070 than in 2030 in all sectors. In systems such as Orchard Hills, Prospect North and Macarthur, the annual demand increase in the residential sector is highest for the single residential sector (see Appendix 9). This is because most of the dwelling growth in these systems is single residential dwellings in the greenfield areas. On the other hand, the increase is higher for the multi-residential sector in Potts Hill water supply system as the majority of dwelling growth in this system is multi-dwellings.
Given that the impact of climate change on the current demand is around four percent (or around 25 GL/year) in 2070 under the A2 emission scenario, it is difficult to estimate any significant impact on ‘demand hardening’, or the impact of drought restrictions on water use. Importantly, peoples’ attitude to water use, including both their indoor and outdoor water use, will directly impact on the reduction in demand achieved when drought restrictions are implemented. It will therefore be important to continue to monitor peoples’ attitude to water use and drought restrictions.
Table 5.2: Annual demand increases (GL/year) due to climate change under the A2 scenario, by customer sector. Figures are the total demand increases totalled across the 14 supply zones.
* Unaccounted for water (UFW) includes unmetered consumption and leakage. UFW was calculated based on the assumption that by 2030 UFW will be about 9% of the total demand in each water supply system. The small increases in UFW in the table do not signify that UFW is climate dependent but rather that it will increase in proportion to the total demand.

57 | Summary report
Demand variability
Climate change will not only increase the average annual demand, but also increase the variability around the (increased) average annual demand. The maximum difference of annual demand is defined as the difference between the maximum and the minimum annual demand due to year-to-year variability in weather conditions. This value could increase to 75 GL/year under future climate conditions from 64 GL/year under current climate conditions in 2070 (Table 5.3).
Table 5.3: Projected annual demand variability for 2030 and 2070 for different climate scenarios.
* The current climate condition refers to the demand for water without new conservation programs in place (all conservation programs from the 2007–08 Sydney Water’s Water Conservation and Recycling Implementation Report have been included).
Water conservation programs
Climate change also results in a slight increase in the savings from water conservation programs targeting outdoor uses. This may partly offset the impacts of climate change on water demand. However, it is difficult to quantify this effect since there are no data available to establish the relationship between the savings and key climate variables.
Analysis using Sydney Water’s rainwater tank model has confirmed that the future climate conditions under A2 scenario could result in a 7.7 percent increase in savings in demand from the rainwater tank rebate program (from 3.13 GL/year to 3.38 GL/year). This is because the seasonal impacts of climate change may bring more rain in summer and autumn, less rain in winter (see chapter 3, Tables 3.3 and 3.4) and may result in a slight increase in the number of rainfall days. Under current climate conditions outdoor water use (mainly from garden watering) is higher in summer. If it rains more in summer there is less need to water gardens and demand management programs may achieve slightly higher savings under future climate conditions. However, as the increase is very small it should be interpreted that climate change impacts would not significantly affect the savings achieved by demand management programs.

58 | Summary report
CHAPTER 6
Implications for supply and demand planning
The challenge of water resource planning in the Sydney context
Both natural and human-induced phenomena affect regional and local climate. Climate, in turn, not only affects the amount of water in storages, but also the rate at which water is consumed. Management of Sydney’s water supply and demand balance over the long term requires improved understanding of climate cycles and drivers, and of the potential impact of climate change on Sydney’s water balance. This study will inform the Sydney metropolitan water planning process which is subject to regular ongoing review.
There is still significant uncertainty around what climate patterns Sydney’s drinking water catchments will be exposed to in the future. This, along with the current limitations of climate modelling at the regional and local scale, and the uncertainty around how climate change will impact on hydrological systems, reduces our ability to confidently quantify the climate change impacts on Sydney’s water supply system. However, planning for variable rainfall in the short and longer term is a continuing focus for water resource planning and, in the Sydney region, for the Metropolitan Water Plan (the strategic management plan to meet Sydney’s water supply and demand needs).
The characteristics of variable inflow patterns over the past 120 years are taken into account in the investigation, analysis, design and operation of Sydney’s water supply system. Sydney and its catchment area are subject to infrequent but severe droughts, such as the severe droughts in the 1890s, the 1930–40s and the recent drought from 2001–2007. In June 2009 water restrictions were lifted and the permanent Water Wise Rules were imposed by the NSW Government. While there have been periods of low inflows, there have also been numerous large inflow events when storages filled quickly, even when levels were low. In response to these conditions, Sydney has one of the largest per capita storages in the world.
The high variability of inflows to Sydney’s water storages highlights the importance of the adaptive management approach over short, medium and long-term planning timeframes. Clearly, there are benefits from having strategies that can take advantage of new information and technologies to increase water savings and provide more time to capture the large inflow events in existing dams.
Given the uncertainty of climate change impacts on future water supply and demand, it is important to have systems that are both robust and flexible to changing conditions, and that can respond to lower or higher inflows compared with those that have been experienced over the past 100 years.
The Metropolitan Water Plan and adaptive management
The first Metropolitan Water Plan was introduced in 2004. The Plan sets out the course of action for the NSW Government to ensure a sustainable and secure water system for greater Sydney’s population and environment. A range of water demand and supply measures was announced in the 2004 Plan to meet this objective. These measures addressed both growth and security needs in the face of a worsening drought at the time. The measures were selected for their cost-effectiveness, or because they offered potential diversification benefits.
Subsequently, the NSW Government reviewed the 2004 Plan and released an updated plan in 2006. The 2006 Plan’s objective was to devise a set of measures that reflected the NSW Government’s longer-term plan to secure Sydney’s water supply, while responding to the deepening drought.
The 2006 Plan, through a mix of measures, ensured that Sydney, Illawarra, Shoalhaven, Southern Highlands and the Blue Mountains will have enough water to meet the region’s growth needs to 2015
59 | Summary report
and to secure drought needs to 2015 and beyond. These measures included increased water recycling and efficiency, accessing deep water in the water supply storages, construction of a desalination plant, and groundwater, in a timely manner.
The Metropolitan Water Plan incorporates an adaptive management approach, which recommends that regular, four yearly reviews take account of new information and emerging technologies. The 2006 Plan has now been reviewed and the new plan was released in 2010.
The context for the 2010 Plan is different to the 2006 Plan, where immediate water security issues were at the forefront of decision making. The development of the 2010 Plan considers options for ensuring Sydney has secure and reliable supply of water to at least 2025 that meets the demands of population growth, addresses possible prolonged droughts, and provides flows for river health.
The outcomes of this study were considered in the review of the Metropolitan Water Plan. However, while the research indicates potential changes to supply and demand under future climate conditions, the low impact of these changes and the lack of certainty in the findings mean that, for the short term, the research has not fundamentally changed water management planning in the Sydney catchment.
The 2010 Metropolitan Water Plan adopts an adaptive management approach to water planning. This means that, while there is no immediate need to change current management practices to cope with the projected impacts of climate change, the Plan is flexible enough to allow measures to be adjusted in the medium and long-term future, if needed. Through this adaptive management approach the 2010 Plan has the capacity to:
manage risk by having the appropriate buffer between supply and demand
understand the likely pressure points on the supply and demand balances in the future
respond to changing conditions due to both climate change and climate variability
continue to improve our knowledge of climate change impacts on greater Sydney’s water supply
incorporate this knowledge into future strategies.
Implications for Sydney’s water supply systems
Greater Sydney’s bulk water supply is largely reliant on its 11 major dams, one of the largest per capita storages in the world, supported by significant water recycling and efficiency programs. In January 2010, the existing supply system was further supplemented when Sydney’s desalination plant began operating.
However, even with the operation of the desalination plant, a detailed flexible strategy is required to manage Sydney’s water supply needs in the context of highly variable inflows, increasing population, the uncertainties regarding future climate patterns, and the level of success of demand management initiatives.
The findings from this study provide some guidance to the key water agencies to understand and plan for the impact of climate change on Sydney’s water supply system. This report has indicated that the general rainfall patterns across the catchments will change, with slight increases in rainfall in Upper Nepean catchments (more coastal) and reductions in Warragamba and Shoalhaven catchments (inland). Increasing temperatures will lead to higher evaporation rates, potentially resulting in drier catchments. Inflows to inland catchments may be reduced while inflows to the more coastal catchments may increase slightly. These projected conditions may present opportunities for future enhancement to the configuration and performance of the water supply system.
60 | Summary report
While there may be slight changes in inter-seasonal variability for rainfall, there is a balance between increased temperature and evaporation which may result in little change to the overall variability between seasons in terms of dam inflows.
A substantial increase in summer rainfall intensity and increased run-off may also cause greater erosion and associated stream sedimentation and turbidity. The Sydney Catchment Authorities (SCA) and Sydney Water’s existing framework for managing water quality issues are adequate to manage any projected changes to water quality. The implication of this will be reflected in the costs associated with monitoring, modelling and real-time management of minor and major incidents.
The projected higher temperatures, evaporation rates and prolonged drought periods may increase the propensity for algal blooms in Sydney’s water storages. SCA has a framework in place to respond to isolated blooms. However, if the frequency of blooms increases in the future there may be changes in the overall management of the water supply system and its associated catchments to reduce the occurrence or impacts of these blooms.
However, in the short term there are no foreseen management issues for coping with the projected increase in rainfall amounts and events. The SCA will continue to work, with other key water agencies and academic organisations, on evaluating climate change impacts on water supply. This work will reduce uncertainties and provide more robust and accurate information to inform future iterations of the Metropolitan Water Plan.
Implications for Sydney’s urban water demand
Sydney’s water supply is considered to be secure and there will not be a significant increase in urban water demand due to climate change for the next 10 years. However, it is important to monitor storage levels and trends in demand and to have contingency measures in place. For instance, in the unlikely event that the dam levels dropped substantially, the 2010 Metropolitan Water Plan outlines a new, simpler regime of drought restrictions, and measures that could be deployed in extreme drought if needed.
The projected climate change impacts on rainfall means that drought restrictions may have an uneven impact across Sydney Water’s area of operations. Properties closer to the coast may be less affected by drought restrictions because of the additional rainfall, whereas parks, lawns and gardens further west are likely to be more affected given less expected rainfall. In the future consideration may be given to the geographic and socio-economic implications for future drought restrictions and water conservation measures.
The projected increase in summer rainfall events may have implications for assessing the location of stormwater harvesting projects and coping with the capture of the overflows before the water is treated and distributed. However, these issues are not straightforward and more detailed analysis is required on future stormwater projects before any policy decisions can be made.
The increase in inter-seasonal variability in the Sydney region, as detailed in chapter two of this report, could have implications for pipeline infrastructure in terms of increased leakages. The potential changed frequency and intensity of wetting and drying events and the consequent changes to soil chemistry and expansiveness could impact pipe conditions, i.e. cracking. This issue could translate to not only changes in leakage patterns but also lifecycle costs, asset working life and maintenance, and renewal costs. More research is needed in this area before any impacts can be accurately assessed.
While inter-seasonal variability has been identified as a potential issue for urban water demand, Sydney Water is already assessing the implications through their current climate change and risk assessment and adaptation programs, it is difficult to quantify the true impacts because of the limitations in current results.
Another potential issue is the ability of the current stormwater infrastructure to cope with increased flows in the coastal regions of the catchment should this occur. The climate change impact on

61 | Summary report
stormwater infrastructure will depend on how extreme the changes are in heavy rainfall events, something which has not been fully assessed in this study. Another consequential issue is the long-term coupling of sea-level rise and extreme events on low lying stormwater assets. Sydney Water has started looking at the broader issue of potential climate change impacts of its infrastructure and operations with a view to identifying future adaptation options that might be required.

62 | Summary report
CHAPTER 7
Future research needs
This study was undertaken to better understand the impacts of climate change on Sydney’s water supply system and future urban water demand. It broke new ground in modelling climate change impacts at the regional level and has helped identify the next quantum of research needed to improve the confidence of modelling at the regional scale.
There will always be uncertainty associated with climate change projections, due to uncertainties about future levels of greenhouse gas emissions, the lack of consistent climate data and limitations of global climate models. It is not possible to develop absolutely precise projections of future climate change. However, adopting a flexible, adaptive approach we can still plan for future water supply even in the absence of perfect information.
One of the elements of adaptive management is to continually review and update the information base. A number of areas of further research have been identified to improve the methods that were used in this study and to the increase the level of confidence in results projecting the impacts of climate change on water supply and demand systems at the regional/local level. These include the need to:
improve the representation of severe climatic extremes in all aspects of current climate modelling
understand why GCMs are unable to simulate sustained anomalies, such as drought (low frequency variability) in future simulations, with the aim of removing this bias
develop a means by which GCM simulations can be dynamically downscaled4 to enhance their representation of low frequency variability
understand how dynamically downscaled climate simulations can be used to develop stochastic (random) downscaling procedures for climate variables such as rainfall, temperature and evaporation, to give accurate representation of drought and high flows in future climate simulations
model future simulations using at least two GCMs and the more pessimistic A1FI greenhouse gas emission scenario
finalise the current study of palaeological information to better understand natural climate variability (wet and dry cycles) and to assess how representative the past 100 years is of the long-term historical hydrological patterns
understand the climate change impact on the synoptic (large scale weather patterns) classifications driving extremely high and low inflows to the Sydney catchments
make use of advances in climate science and improved climate modelling that will be included in the Intergovernmental Panel for Climate Change’s (IPCC) fifth assessment report.
4 Dynamical downscaling uses regional climate models, driven by GCM outputs, to produce higher resolution results for a small geographic region. This improves the accuracy and spatial patterns of climate variables compared to the GCM but the quality of the results depends on the biases inherited from the GCMs (e.g. the models tendency to produce wet or dry results).
63 | Summary report
References
Cai, W. 2006. Antarctic ozone depletion causes and intensification of the Southern Ocean supergyre circulation, Geophys. Res. Lett., 33,L03712,doi:10.1029/2005GL024911.
Cai, W and Cowan T, 2008. Evidence of impacts from rising temperature on inflows to the Murray–Darling Basin. Geophysical Research Letters, 35, L07701, doi:10.1029/2008GL033390.
Cai, W., T.Cowan, and A. Sullivan (2009), Recent unprecedented skewness towards positive Indian Ocean Dipole occurrences and its impact on Australian rainfall, Geophys. Res. Lett., 36 L11705, doi:10.1029/2009GL037604.
Cai, W.P, van Rensch, T. Cowan, and A Sullivan, 2010: Asymmetry in ENSO teleconnection with regional rainfall, its multi-decadal variability and impact, Journal of Climate, 23, 4944-4955.
Collins, M., S. An, W. Cai, A. Ganachaud, E. Guilyardi, F. Jin, M. Jochum, M. Lengaigne, S. Power, A. Timmermann, G. Vecchi and A. Wittenberg (2010). The impact of global warming on the tropical Pacific Ocean and El Niño. Nature Geoscience 3(6):391-397.
CSIRO and the Bureau of Meteorology, 2007. Climate change in Australia. Technical report. CSIRO.
DECCW, 2010. NSW Climate Impact Profile: The Impacts of Climate Change on the Biophysical Environment of NSW. NSW Department of Environment, Climate Change and Water.
Fowler AM and Hennessy KJ, 1995. Potential impacts of global warming on the frequency and magnitude of heavy precipitation. Natural Hazards, 11, 283-303.
IPCC, 2000, Emission Scenarios Special Report of the IPCC, Nakicenovic, N., and R. Swart, (eds). Cambridge University Press (UK).
IPCC, 2007. Climate Change 2007: Synthesis Report. Contribution of Working Groups I, II and III to the Fourth Assessment Report of the Intergovernmental Panel on Climate Change [Core Writing Team, Pachauri, R.K and Reisinger, A.(eds.)]. IPCC, Geneva, Switzerland, 104pp.
Johnson F and Sharma A, 2009a. A comparison of Australian open water body evaporation trends for current and future climates estimated from Class A evaporation pans and general circulation models. Journal of Hydrometeorology DOI: 10.1175/2009JHM1158.1.
Johnson F and Sharma A, 2009b. Measurement of GCM skill in predicting variables relevant for hydroclimatological assessments, Journal of Climate, accepted for publication. DOI: 10.1175/2009JCLI2681.1.
Jones RN, 2000. Managing uncertainty in climate change projections – Issues for impact assessment,
Climatic Change, 45, 403-419.
Garnaut R, 2008. The Garnaut Climate Change Review: Final Report. Commonwealth of Australia.
Gillett, N.P., and D. W. J. Thompson, 2003, Simulation of recent Southern Hemisphere climate
change, Science, 302, 273-275.
Mehrotra R and Sharma A, 2010. High resolution climate projections and impacts – theme 2 under the Collaborative Research Agreement – Climate change and its impacts on water supply and
demand in Sydney.
NSW Department of Planning, 2008. New South Wales State and Regional Population Projections 2006-2036, 2008 release.
64 | Summary report
Pepler A, Rakich C, Garbers L and Wiles P, 2009. Extreme inflow events and synoptic forcing in Sydney catchments. Report to the NSW Department of Water and Energy.
Power, S. B., and I. N. Smith (2007), Weakening of the Walker Circulation and apparent dominance of El Nño both reach record levels, but has ENSO really changed?, Geophys. Res. Lett., 34 L1872, doi 10. 1029/2007GL030854.
Randall DA, Wood RA, Bony S, Colman R, Fichefet T, Fyfe J, Kattsov V, Pitman A, Shukla J,
Srinivasan J, Stouffer RJ, Sumi A and Taylor KE, 2007. Climate models and their evaluation. In: Climate Change 2007: The Physical Science Basis. Contribution of Working Group I to the
Fourth Assessment Report of the Intergovernmental Panel on Climate Change. [Solomon S, Qin D, Manning M, Chen Z, Marquis M, Averyt KB, Tignor M, Miller HL. (eds)]. Cambridge University Press, Cambridge, United Kingdom and New York, NY, USA.
Rotstayn, L. D., and Co-authors, (2007): Have Australian rainfall and cloudiness increased due to the remote effects of Asian anthropogenic aerosols? J. Geophys. Res., 112, D09202, doi: 10.1029/2006JD007712.
Schiermeier G, 2010. The real holes in climate science, Nature, 463, 284–287.
Shi, G., J. Ribbe, W. Cai, and T. Cowan, (2008). An interpretation of Australian rainfall projections, Geophys.Res. Lett., 35 L02702, doi:10. 1029/2007GL032436.
Shi, G, W. Cai, T. Cowan, J. Ribbe, L. Rotstayn, and M Dix, 2008: Varibility and trend of North West
Australian rainfall: Observations and coupled climate modelling. J. Climate, 21, 2938-2959.
SRES, 2000. Special Report on Emission Scenarios, Intergovernmental Panel on Climate Change.
Sullivan A, Cai W and Cowan T, 2009. Is there an impact from rising temperature on inflow in Sydney Catchments? CSIRO Marine and Atmospheric Research.
Sydney Catchment Authority, 2009. Climate change and its impacts on Sydney’s Water Supply – Technical Report, October 2009.
Sydney Water, 2009. Collaborative Climate Change Study, Theme 4 - Demand side impacts – Final report, October 2009.
Sydney Water, 2007. Submission to IPART – Submission to IPART of Prices for Sydney Water, p 41, 14 September 2007.
Thompson, D.W.J., and S.Solomon, 2002, Interpretation of recent Southern Hemisphere climate change, Science, 296, 895-899.
Visser H, Folkert RJM, Hoekstra J and deWolff, JJ, 2000. Identifying key sources of uncertainty in climate change projections. Climatic Change, 45, 421-457.
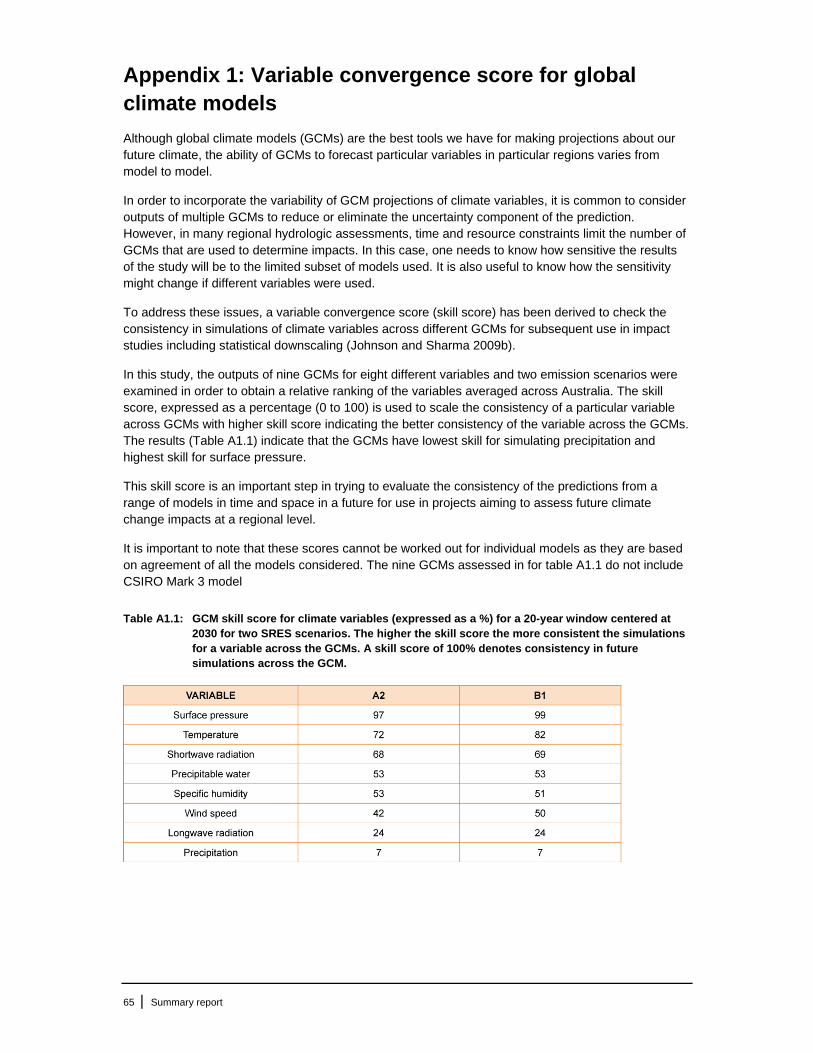
65 | Summary report
Appendix 1: Variable convergence score for global climate models
Although global climate models (GCMs) are the best tools we have for making projections about our future climate, the ability of GCMs to forecast particular variables in particular regions varies from model to model.
In order to incorporate the variability of GCM projections of climate variables, it is common to consider outputs of multiple GCMs to reduce or eliminate the uncertainty component of the prediction. However, in many regional hydrologic assessments, time and resource constraints limit the number of GCMs that are used to determine impacts. In this case, one needs to know how sensitive the results of the study will be to the limited subset of models used. It is also useful to know how the sensitivity might change if different variables were used.
To address these issues, a variable convergence score (skill score) has been derived to check the consistency in simulations of climate variables across different GCMs for subsequent use in impact studies including statistical downscaling (Johnson and Sharma 2009b).
In this study, the outputs of nine GCMs for eight different variables and two emission scenarios were examined in order to obtain a relative ranking of the variables averaged across Australia. The skill score, expressed as a percentage (0 to 100) is used to scale the consistency of a particular variable across GCMs with higher skill score indicating the better consistency of the variable across the GCMs. The results (Table A1.1) indicate that the GCMs have lowest skill for simulating precipitation and highest skill for surface pressure.
This skill score is an important step in trying to evaluate the consistency of the predictions from a range of models in time and space in a future for use in projects aiming to assess future climate change impacts at a regional level.
It is important to note that these scores cannot be worked out for individual models as they are based on agreement of all the models considered. The nine GCMs assessed in for table A1.1 do not include CSIRO Mark 3 model
Table A1.1: GCM skill score for climate variables (expressed as a %) for a 20-year window centered at 2030 for two SRES scenarios. The higher the skill score the more consistent the simulations for a variable across the GCMs. A skill score of 100% denotes consistency in future simulations across the GCM.

66 | Summary report
Appendix 2: SRES scenarios The future climate will depend heavily on human activity. As we cannot see into the future to determine what this activity will be, the Intergovernmental Panel on Climate Change (IPCC) developed a series of potential greenhouse gas emission scenarios. These scenarios were published in the IPCC Special Report on Emissions Scenarios (SRES 2000), and are referred to as the SRES scenarios.
The SRES scenarios are grouped into four scenario families (A1, A2, B1 and B2) that explore different development pathways, covering a wide range of demographic, economic and technological driving forces and resulting greenhouse gas emissions.
A1. The A1 storyline describes a future world of very rapid economic growth, a global population that peaks in mid-century and declines thereafter, and the rapid introduction of new and more efficient technologies. Major underlying themes are convergence among regions, capacity building and increased cultural and social interactions, with a substantial reduction in regional differences in per capita income. The A1 storyline develops into three scenario groups that describe alternative directions of technological change in the energy system. They are distinguished by their technological emphasis: fossil intensive (A1FI), non-fossil energy sources and technologies (A1T), or a balance across all sources (A1B) (where balanced is defined as not relying too heavily on one particular energy source, on the assumption that similar improvement rates apply to all energy supply and end use technologies).
A2. The A2 storyline describes a very heterogeneous world. The underlying theme is self reliance and preservation of local identities. Fertility patterns across regions converge very slowly, which results in continuously increasing population. Economic development is primarily regionally oriented and per capita economic growth and technological change more fragmented and slower than other storylines.
B1. The B1 storyline describes a convergent world with the same global population as in the A1 storyline (one that peaks in midcentury and declines thereafter) but with rapid change in economic structures toward a service and information economy, with reductions in material intensity and the introduction of clean and resource efficient technologies. The emphasis is on global solutions to economic, social and environmental sustainability, including improved equity, but without additional climate initiatives.
B2. The B2 storyline describes a world in which the emphasis is on local solutions to economic, social and environmental sustainability. It is a world with continuously increasing global population, at a rate lower than A2, intermediate levels of economic development, and less rapid and more diverse technological change than in the B1 and A1 storylines.
Figure A2.1 Carbon dioxide (CO2) emissions (a) and concentrations (b) for six SRES scenarios and the IS92a scenario from the Third Assessment Report 2000.
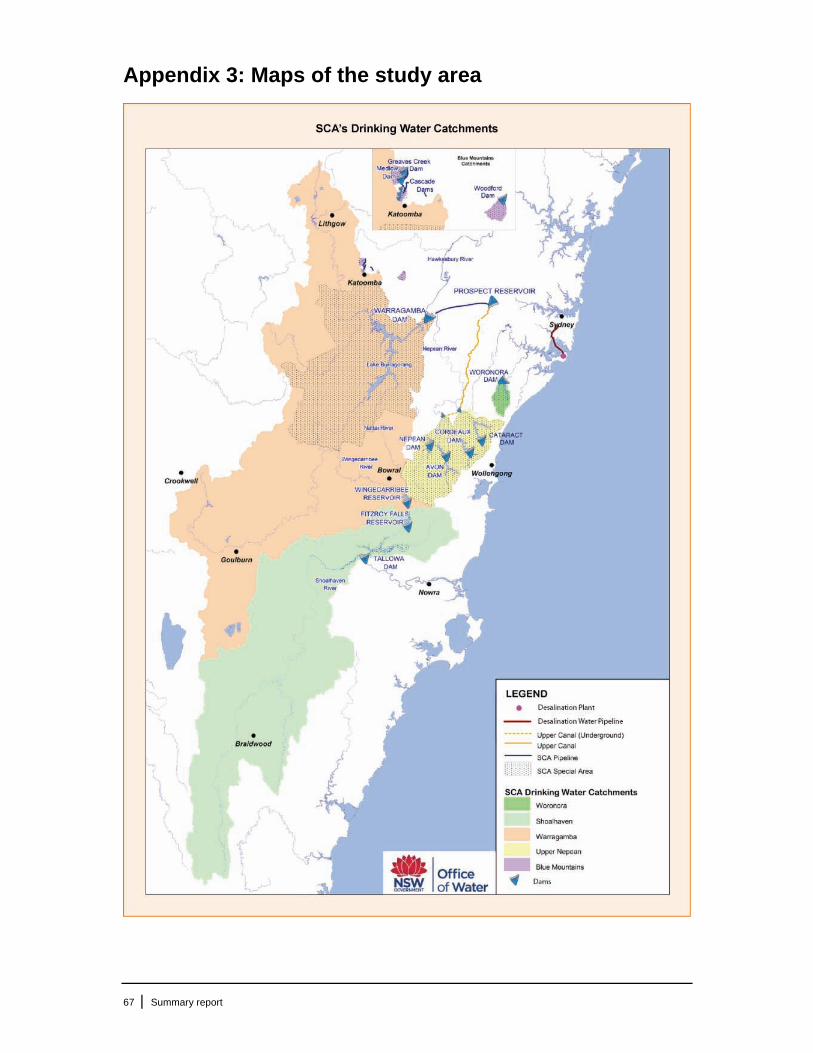
67 | Summary report
Appendix 3: Maps of the study area

68 | Summary report
Appendix 3: Maps of the study area

69 | Summary report
Appendix 4: High resolution climate change projections
Temperature
Daily maximum temperature (C) – 2030
B1 Year 2030 - Autumn
0.30
149.00 149.50 150.00 150.50 151.00 151.50Longitude
-36.00
-35.50
-35.00
-34.50
-34.00
-33.50
Latit
ude
BATHURST
KATOOMBA
LITHGOW
PROSPECT_DAM
RICHMOND
NOWRA
BOWRAL
WOLLONGONG
NERRIGA
TARALGA
GOULBURN
SYDNEY
3.00
2.70
2.40
2.10
1.80
1.50
1.20
0.90
0.60
0.30
0.00
A1B Year 2030 - Autumn
0.30
149.00 149.50 150.00 150.50 151.00 151.50Longitude
-36.00
-35.50
-35.00
-34.50
-34.00
-33.50
Latit
ude
BATHURST
KATOOMBA
LITHGOW
PROSPECT_DAM
RICHMOND
NOWRA
BOWRAL
WOLLONGONG
NERRIGA
TARALGA
GOULBURN
SYDNEY
3.00
2.70
2.40
2.10
1.80
1.50
1.20
0.90
0.60
0.30
0.00
A2 Year 2030 - Autumn
0.45
149.00 149.50 150.00 150.50 151.00 151.50Longitude
-36.00
-35.50
-35.00
-34.50
-34.00
-33.50
Latit
ude
BATHURST
KATOOMBA
LITHGOW
PROSPECT_DAM
RICHMOND
NOWRA
BOWRAL
WOLLONGONG
NERRIGA
TARALGA
GOULBURN
SYDNEY
3.00
2.70
2.40
2.10
1.80
1.50
1.20
0.90
0.60
0.30
0.00
B1 Year 2030 - Winter
0.45
149.00 149.50 150.00 150.50 151.00 151.50Longitude
-36.00
-35.50
-35.00
-34.50
-34.00
-33.50
Latit
ude
BATHURST
KATOOMBA
LITHGOW
PROSPECT_DAM
RICHMOND
NOWRA
BOWRAL
WOLLONGONG
NERRIGA
TARALGA
GOULBURN
SYDNEY
3.00
2.70
2.40
2.10
1.80
1.50
1.20
0.90
0.60
0.30
0.00
A1B Year 2030 - Winter
0.60
149.00 149.50 150.00 150.50 151.00 151.50Longitude
-36.00
-35.50
-35.00
-34.50
-34.00
-33.50La
titud
e
BATHURST
KATOOMBA
LITHGOW
PROSPECT_DAM
RICHMOND
NOWRA
BOWRAL
WOLLONGONG
NERRIGA
TARALGA
GOULBURN
SYDNEY
3.00
2.70
2.40
2.10
1.80
1.50
1.20
0.90
0.60
0.30
0.00
A2 Year 2030 - Winter
0.45
0.60
149.00 149.50 150.00 150.50 151.00 151.50Longitude
-36.00
-35.50
-35.00
-34.50
-34.00
-33.50
Latit
ude
BATHURST
KATOOMBA
LITHGOW
PROSPECT_DAM
RICHMOND
NOWRA
BOWRAL
WOLLONGONG
NERRIGA
TARALGA
GOULBURN
SYDNEY
3.00
2.70
2.40
2.10
1.80
1.50
1.20
0.90
0.60
0.30
0.00
B1 Year 2030 - Spring
149.00 149.50 150.00 150.50 151.00 151.50Longitude
-36.00
-35.50
-35.00
-34.50
-34.00
-33.50
Latit
ude
BATHURST
KATOOMBA
LITHGOW
PROSPECT_DAM
RICHMOND
NOWRA
BOWRAL
WOLLONGONG
NERRIGA
TARALGA
GOULBURN
SYDNEY
3.00
2.70
2.40
2.10
1.80
1.50
1.20
0.90
0.60
0.30
0.00
A1B Year 2030 - Spring
0.30
149.00 149.50 150.00 150.50 151.00 151.50Longitude
-36.00
-35.50
-35.00
-34.50
-34.00
-33.50
Latit
ude
BATHURST
KATOOMBA
LITHGOW
PROSPECT_DAM
RICHMOND
NOWRA
BOWRAL
WOLLONGONG
NERRIGA
TARALGA
GOULBURN
SYDNEY
3.00
2.70
2.40
2.10
1.80
1.50
1.20
0.90
0.60
0.30
0.00
A2 Year 2030 - Spring
0.90
0.90
149.00 149.50 150.00 150.50 151.00 151.50Longitude
-36.00
-35.50
-35.00
-34.50
-34.00
-33.50
Latit
ude
BATHURST
KATOOMBA
LITHGOW
PROSPECT_DAM
RICHMOND
NOWRA
BOWRAL
WOLLONGONG
NERRIGA
TARALGA
GOULBURN
SYDNEY
3.00
2.70
2.40
2.10
1.80
1.50
1.20
0.90
0.60
0.30
0.00
B1 Year 2030 - Summer
0.60
0.60
149.00 149.50 150.00 150.50 151.00 151.50Longitude
-36.00
-35.50
-35.00
-34.50
-34.00
-33.50
Latit
ude
BATHURST
KATOOMBA
LITHGOW
PROSPECT_DAM
RICHMOND
NOWRA
BOWRAL
WOLLONGONG
NERRIGA
TARALGA
GOULBURN
SYDNEY
3.00
2.70
2.40
2.10
1.80
1.50
1.20
0.90
0.60
0.30
0.00
A1B Year 2030 - Summer
149.00 149.50 150.00 150.50 151.00 151.50Longitude
-36.00
-35.50
-35.00
-34.50
-34.00
-33.50
Latit
ude
BATHURST
KATOOMBA
LITHGOW
PROSPECT_DAM
RICHMOND
NOWRA
BOWRAL
WOLLONGONG
NERRIGA
TARALGA
GOULBURN
SYDNEY
3.00
2.70
2.40
2.10
1.80
1.50
1.20
0.90
0.60
0.30
0.00
A2 Year 2030 - Summer
0.75
0.75
149.00 149.50 150.00 150.50 151.00 151.50Longitude
-36.00
-35.50
-35.00
-34.50
-34.00
-33.50
Latit
ude
BATHURST
KATOOMBA
LITHGOW
PROSPECT_DAM
RICHMOND
NOWRA
BOWRAL
WOLLONGONG
NERRIGA
TARALGA
GOULBURN
SYDNEY
3.00
2.70
2.40
2.10
1.80
1.50
1.20
0.90
0.60
0.30
0.00
B1 Year 2030
0.45
0.45
149.00 149.50 150.00 150.50 151.00 151.50Longitude
-36.00
-35.50
-35.00
-34.50
-34.00
-33.50
Latit
ude
BATHURST
KATOOMBA
LITHGOW
PROSPECT_DAM
RICHMOND
NOWRA
BOWRAL
WOLLONGONG
NERRIGA
TARALGA
GOULBURN
SYDNEY
3.00
2.70
2.40
2.10
1.80
1.50
1.20
0.90
0.60
0.30
0.00
A1B Year 2030
0.30
149.00 149.50 150.00 150.50 151.00 151.50Longitude
-36.00
-35.50
-35.00
-34.50
-34.00
-33.50
Latit
ude
BATHURST
KATOOMBA
LITHGOW
PROSPECT_DAM
RICHMOND
NOWRA
BOWRAL
WOLLONGONG
NERRIGA
TARALGA
GOULBURN
SYDNEY
3.00
2.70
2.40
2.10
1.80
1.50
1.20
0.90
0.60
0.30
0.00
A2 Year 2030
0.60
149.00 149.50 150.00 150.50 151.00 151.50Longitude
-36.00
-35.50
-35.00
-34.50
-34.00
-33.50
Latit
ude
BATHURST
KATOOMBA
LITHGOW
PROSPECT_DAM
RICHMOND
NOWRA
BOWRAL
WOLLONGONG
NERRIGA
TARALGA
GOULBURN
SYDNEY
3.00
2.70
2.40
2.10
1.80
1.50
1.20
0.90
0.60
0.30
0.00
Figure A4.1: Best estimate (50th percentile) of changes in annual and seasonal daily maximum temperature (°C) for 2030 under the B1, A1B and A2 scenarios, relative to current climate.
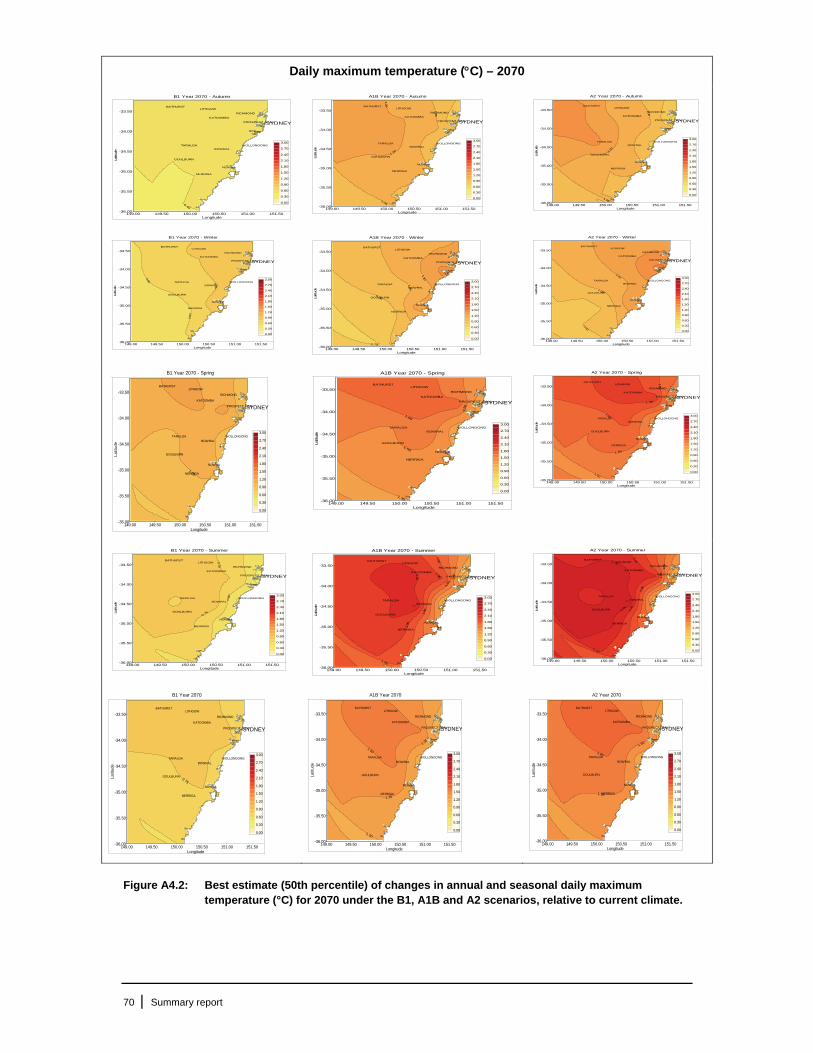
70 | Summary report
Daily maximum temperature (C) – 2070
B1 Year 2070 - Autumn
0.45
149.00 149.50 150.00 150.50 151.00 151.50Longitude
-36.00
-35.50
-35.00
-34.50
-34.00
-33.50La
titud
e
BATHURST
KATOOMBA
LITHGOW
PROSPECT_DAM
RICHMOND
NOWRA
BOWRAL
WOLLONGONG
NERRIGA
TARALGA
GOULBURN
SYDNEY
3.00
2.70
2.40
2.10
1.80
1.50
1.20
0.90
0.60
0.30
0.00
A1B Year 2070 - Autumn
1.05
1.05
1.20
1.20
149.00 149.50 150.00 150.50 151.00 151.50Longitude
-36.00
-35.50
-35.00
-34.50
-34.00
-33.50
Latit
ude
BATHURST
KATOOMBA
LITHGOW
PROSPECT_DAM
RICHMOND
NOWRA
BOWRAL
WOLLONGONG
NERRIGA
TARALGA
GOULBURN
SYDNEY
3.00
2.70
2.40
2.10
1.80
1.50
1.20
0.90
0.60
0.30
0.00
A2 Year 2070 - Autumn
1.05
1.05
1.20
149.00 149.50 150.00 150.50 151.00 151.50Longitude
-36.00
-35.50
-35.00
-34.50
-34.00
-33.50
Latit
ude
BATHURST
KATOOMBA
LITHGOW
PROSPECT_DAM
RICHMOND
NOWRA
BOWRAL
WOLLONGONG
NERRIGA
TARALGA
GOULBURN
SYDNEY
3.00
2.70
2.40
2.10
1.80
1.50
1.20
0.90
0.60
0.30
0.00
B1 Year 2070 - Winter
0.60
0.60
0.75
149.00 149.50 150.00 150.50 151.00 151.50Longitude
-36.00
-35.50
-35.00
-34.50
-34.00
-33.50
Latit
ude
BATHURST
KATOOMBA
LITHGOW
PROSPECT_DAM
RICHMOND
NOWRA
BOWRAL
WOLLONGONG
NERRIGA
TARALGA
GOULBURN
SYDNEY
3.00
2.70
2.40
2.10
1.80
1.50
1.20
0.90
0.60
0.30
0.00
A1B Year 2070 - Winter
0.75
0.90
1.05
1.20
149.00 149.50 150.00 150.50 151.00 151.50Longitude
-36.00
-35.50
-35.00
-34.50
-34.00
-33.50
Latit
ude
BATHURST
KATOOMBA
LITHGOW
PROSPECT_DAM
RICHMOND
NOWRA
BOWRAL
WOLLONGONG
NERRIGA
TARALGA
GOULBURN
SYDNEY
3.00
2.70
2.40
2.10
1.80
1.50
1.20
0.90
0.60
0.30
0.00
A2 Year 2070 - Winter
0.90
1.05
1.20
149.00 149.50 150.00 150.50 151.00 151.50Longitude
-36.00
-35.50
-35.00
-34.50
-34.00
-33.50
Latit
ude
BATHURST
KATOOMBA
LITHGOW
PROSPECT_DAM
RICHMOND
NOWRA
BOWRAL
WOLLONGONG
NERRIGA
TARALGA
GOULBURN
SYDNEY
3.00
2.70
2.40
2.10
1.80
1.50
1.20
0.90
0.60
0.30
0.00
B1 Year 2070 - Spring
1.05
149.00 149.50 150.00 150.50 151.00 151.50Longitude
-36.00
-35.50
-35.00
-34.50
-34.00
-33.50
Latit
ude
BATHURST
KATOOMBA
LITHGOW
PROSPECT_DAM
RICHMOND
NOWRA
BOWRAL
WOLLONGONG
NERRIGA
TARALGA
GOULBURN
SYDNEY
3.00
2.70
2.40
2.10
1.80
1.50
1.20
0.90
0.60
0.30
0.00
A1B Year 2070 - Spring
1.35
1.50
1.50
1.65
149.00 149.50 150.00 150.50 151.00 151.50Longitude
-36.00
-35.50
-35.00
-34.50
-34.00
-33.50
Latit
ude
BATHURST
KATOOMBA
LITHGOW
PROSPECT_DAM
RICHMOND
NOWRA
BOWRAL
WOLLONGONG
NERRIGA
TARALGA
GOULBURN
SYDNEY
3.00
2.70
2.40
2.10
1.80
1.50
1.20
0.90
0.60
0.30
0.00
A2 Year 2070 - Spring
1.50
1.65
1.80
1.80
1.95
149.00 149.50 150.00 150.50 151.00 151.50Longitude
-36.00
-35.50
-35.00
-34.50
-34.00
-33.50
Latit
ude
BATHURST
KATOOMBA
LITHGOW
PROSPECT_DAM
RICHMOND
NOWRA
BOWRAL
WOLLONGONG
NERRIGA
TARALGA
GOULBURN
SYDNEY
3.00
2.70
2.40
2.10
1.80
1.50
1.20
0.90
0.60
0.30
0.00
B1 Year 2070 - Summer
0.60
0.75
0.75
149.00 149.50 150.00 150.50 151.00 151.50Longitude
-36.00
-35.50
-35.00
-34.50
-34.00
-33.50
Latit
ude
BATHURST
KATOOMBA
LITHGOW
PROSPECT_DAM
RICHMOND
NOWRA
BOWRAL
WOLLONGONG
NERRIGA
TARALGA
GOULBURN
SYDNEY
3.00
2.70
2.40
2.10
1.80
1.50
1.20
0.90
0.60
0.30
0.00
A1B Year 2070 - Summer
1.50
1.65
1.80
1.80
1.80
1.95
1.95
2.10
149.00 149.50 150.00 150.50 151.00 151.50Longitude
-36.00
-35.50
-35.00
-34.50
-34.00
-33.50
Latit
ude
BATHURST
KATOOMBA
LITHGOW
PROSPECT_DAM
RICHMOND
NOWRA
BOWRAL
WOLLONGONG
NERRIGA
TARALGA
GOULBURN
SYDNEY
3.00
2.70
2.40
2.10
1.80
1.50
1.20
0.90
0.60
0.30
0.00
A2 Year 2070 - Summer
1.65
1.80
1.95
2.10
2.10
2.10
2.25
2.25
149.00 149.50 150.00 150.50 151.00 151.50Longitude
-36.00
-35.50
-35.00
-34.50
-34.00
-33.50
Latit
ude
BATHURST
KATOOMBA
LITHGOW
PROSPECT_DAM
RICHMOND
NOWRA
BOWRAL
WOLLONGONG
NERRIGA
TARALGA
GOULBURN
SYDNEY
3.00
2.70
2.40
2.10
1.80
1.50
1.20
0.90
0.60
0.30
0.00
B1 Year 2070
0.75
149.00 149.50 150.00 150.50 151.00 151.50Longitude
-36.00
-35.50
-35.00
-34.50
-34.00
-33.50
Latit
ude
BATHURST
KATOOMBA
LITHGOW
PROSPECT_DAM
RICHMOND
NOWRA
BOWRAL
WOLLONGONG
NERRIGA
TARALGA
GOULBURN
SYDNEY
3.00
2.70
2.40
2.10
1.80
1.50
1.20
0.90
0.60
0.30
0.00
A1B Year 2070
1.20
1.35
1.35
1.50
149.00 149.50 150.00 150.50 151.00 151.50Longitude
-36.00
-35.50
-35.00
-34.50
-34.00
-33.50
Latit
ude
BATHURST
KATOOMBA
LITHGOW
PROSPECT_DAM
RICHMOND
NOWRA
BOWRAL
WOLLONGONG
NERRIGA
TARALGA
GOULBURN
SYDNEY
3.00
2.70
2.40
2.10
1.80
1.50
1.20
0.90
0.60
0.30
0.00
A2 Year 2070
1.50
1.50
1.65
149.00 149.50 150.00 150.50 151.00 151.50Longitude
-36.00
-35.50
-35.00
-34.50
-34.00
-33.50
Latit
ude
BATHURST
KATOOMBA
LITHGOW
PROSPECT_DAM
RICHMOND
NOWRA
BOWRAL
WOLLONGONG
NERRIGA
TARALGA
GOULBURN
SYDNEY
3.00
2.70
2.40
2.10
1.80
1.50
1.20
0.90
0.60
0.30
0.00
Figure A4.2: Best estimate (50th percentile) of changes in annual and seasonal daily maximum temperature (°C) for 2070 under the B1, A1B and A2 scenarios, relative to current climate.

71 | Summary report
Figure A4.3: Best estimate (50th percentile) of changes in the number of annual hot days (daily maximum temperature >35°C) (%) for 2030 and 2070 under the B1, A1B and A2 scenarios, relative to current climate.
Table A4.1: Changes in the number of seasonal and annual hot days (daily maximum temperature >35°C) for 2030 and 2070 under the B1, A1B and A2 scenarios, relative to current climate. Best estimate median change is given, with the range of uncertainty (5th and 95th percentile values) in brackets.
Hot days (over 35C) – 2030 and 2070
B1 Year 2030
50
75
75
149.00 149.50 150.00 150.50 151.00 151.50Longitude
-36.00
-35.50
-35.00
-34.50
-34.00
-33.50
Latit
ude
BATHURST
KATOOMBA
LITHGOW
PROSPECT_DAM
RICHMOND
NOWRA
BOWRAL
WOLLONGONG
NERRIGA
TARALGA
GOULBURN
SYDNEY
2001751501251007550250-25-50-75-100-125-150-175-200
A1B Year 2030
0
0
149.00 149.50 150.00 150.50 151.00 151.50Longitude
-36.00
-35.50
-35.00
-34.50
-34.00
-33.50
Latit
ude
BATHURST
KATOOMBA
LITHGOW
PROSPECT_DAM
RICHMOND
NOWRA
BOWRAL
WOLLONGONG
NERRIGA
TARALGA
GOULBURN
SYDNEY
2001751501251007550250-25-50-75-100-125-150-175-200
A2 Year 2030
75
75
149.00 149.50 150.00 150.50 151.00 151.50Longitude
-36.00
-35.50
-35.00
-34.50
-34.00
-33.50
Latit
ude
BATHURST
KATOOMBA
LITHGOW
PROSPECT_DAM
RICHMOND
NOWRA
BOWRAL
WOLLONGONG
NERRIGA
TARALGA
GOULBURN
SYDNEY
2001751501251007550250-25-50-75-100-125-150-175-200
B1 Year 2070
50
75
149.00 149.50 150.00 150.50 151.00 151.50Longitude
-36.00
-35.50
-35.00
-34.50
-34.00
-33.50
Latit
ude
BATHURST
KATOOMBA
LITHGOW
PROSPECT_DAM
RICHMOND
NOWRA
BOWRAL
WOLLONGONG
NERRIGA
TARALGA
GOULBURN
SYDNEY
2001751501251007550250-25-50-75-100-125-150-175-200
A1B Year 2070
150
175
149.00 149.50 150.00 150.50 151.00 151.50Longitude
-36.00
-35.50
-35.00
-34.50
-34.00
-33.50
Latit
ude
BATHURST
KATOOMBA
LITHGOW
PROSPECT_DAM
RICHMOND
NOWRA
BOWRAL
WOLLONGONG
NERRIGA
TARALGA
GOULBURN
SYDNEY
2001751501251007550250-25-50-75-100-125-150-175-200
A2 Year 2070
150
175
149.00 149.50 150.00 150.50 151.00 151.50Longitude
-36.00
-35.50
-35.00
-34.50
-34.00
-33.50
Latit
ude
BATHURST
KATOOMBA
LITHGOW
PROSPECT_DAM
RICHMOND
NOWRA
BOWRAL
WOLLONGONG
NERRIGA
TARALGA
GOULBURN
SYDNEY
2001751501251007550250-25-50-75-100-125-150-175-200

72 | Summary report
Hot spells (>27C for 4-7 consecutive days) – 2030 and 2070
B1 Year 2030
25
50
50
149.00 149.50 150.00 150.50 151.00 151.50Longitude
-36.00
-35.50
-35.00
-34.50
-34.00
-33.50
Latit
ude
BATHURST
KATOOMBA
LITHGOW
PROSPECT_DAM
RICHMOND
NOWRA
BOWRAL
WOLLONGONG
NERRIGA
TARALGA
GOULBURN
SYDNEY
2001751501251007550250-25-50-75-100-125-150-175-200
A1B Year 2030
149.00 149.50 150.00 150.50 151.00 151.50Longitude
-36.00
-35.50
-35.00
-34.50
-34.00
-33.50
Latit
ude
BATHURST
KATOOMBA
LITHGOW
PROSPECT_DAM
RICHMOND
NOWRA
BOWRAL
WOLLONGONG
NERRIGA
TARALGA
GOULBURN
SYDNEY
2001751501251007550250-25-50-75-100-125-150-175-200
A2 Year 2030
25
50
50
149.00 149.50 150.00 150.50 151.00 151.50Longitude
-36.00
-35.50
-35.00
-34.50
-34.00
-33.50
Latit
ude
BATHURST
KATOOMBA
LITHGOW
PROSPECT_DAM
RICHMOND
NOWRA
BOWRAL
WOLLONGONG
NERRIGA
TARALGA
GOULBURN
SYDNEY
2001751501251007550250-25-50-75-100-125-150-175-200
B1 Year 2070
25
50
50
149.00 149.50 150.00 150.50 151.00 151.50Longitude
-36.00
-35.50
-35.00
-34.50
-34.00
-33.50
Latit
ude
BATHURST
KATOOMBA
LITHGOW
PROSPECT_DAM
RICHMOND
NOWRA
BOWRAL
WOLLONGONG
NERRIGA
TARALGA
GOULBURN
SYDNEY
2001751501251007550250-25-50-75-100-125-150-175-200
A1B Year 2070
50
75
100
100
100
125
125
150
150
149.00 149.50 150.00 150.50 151.00 151.50Longitude
-36.00
-35.50
-35.00
-34.50
-34.00
-33.50
Latit
ude
BATHURST
KATOOMBA
LITHGOW
PROSPECT_DAM
RICHMOND
NOWRA
BOWRAL
WOLLONGONG
NERRIGA
TARALGA
GOULBURN
SYDNEY
2001751501251007550250-25-50-75-100-125-150-175-200
A2 Year 2070
50
75
100
100
12512
5150
150
149.00 149.50 150.00 150.50 151.00 151.50Longitude
-36.00
-35.50
-35.00
-34.50
-34.00
-33.50
Latit
ude
BATHURST
KATOOMBA
LITHGOW
PROSPECT_DAM
RICHMOND
NOWRA
BOWRAL
WOLLONGONG
NERRIGA
TARALGA
GOULBURN
SYDNEY
2001751501251007550250-25-50-75-100-125-150-175-200
Figure A4.4: Best estimates (50th percentile) of the changes in number of annual hot spell occurrences (4-7 days with daily maximum temperature >27°C) (expressed as a percent difference of models simulated and current climate values) for 2030 and 2070 under the B1, A1B and A2 scenarios, relative to the current climate.
Table A4.2: Projected changes in number of seasonal and annual hot spell occurrences (4-7 days with daily maximum temperature >27°C) for 2030 and 2070 under the B1, A1B and A2 scenarios, relative to the current climate. Best estimate (median) change is given, with the range of uncertainty (5th and 95th percentile values) in brackets.
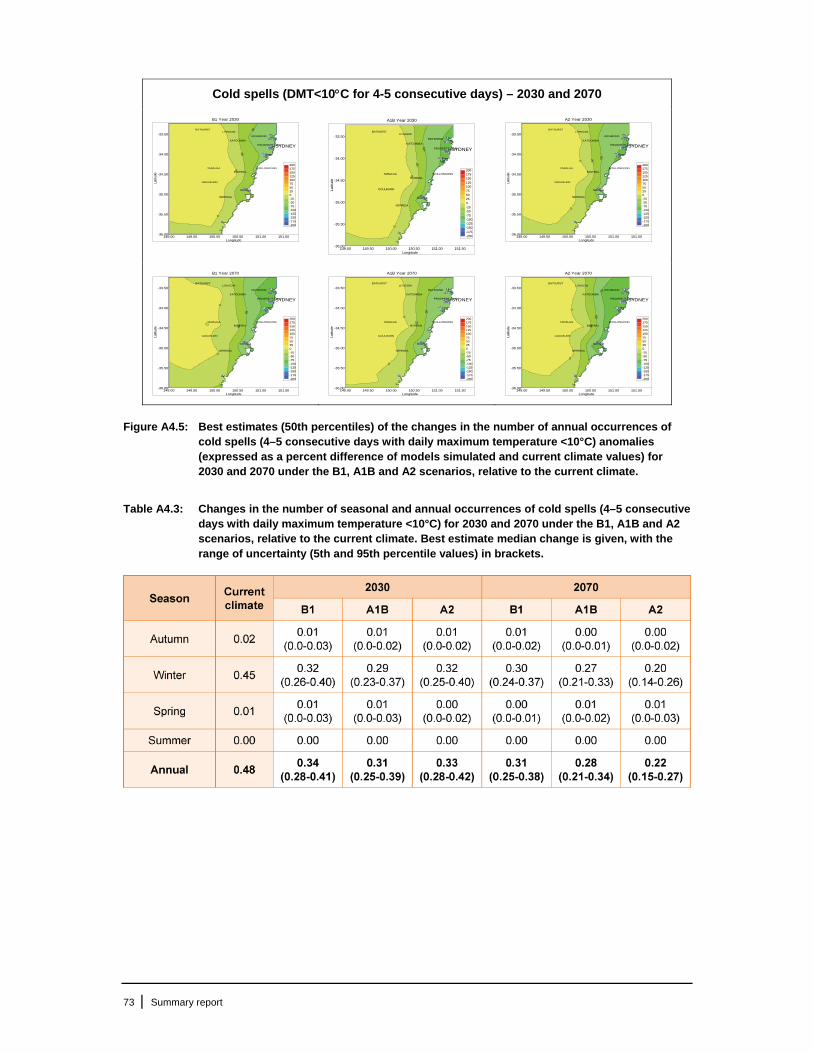
73 | Summary report
Cold spells (DMT<10C for 4-5 consecutive days) – 2030 and 2070
B1 Year 2030
-50
-25
0
0
149.00 149.50 150.00 150.50 151.00 151.50Longitude
-36.00
-35.50
-35.00
-34.50
-34.00
-33.50
Latit
ude
BATHURST
KATOOMBA
LITHGOW
PROSPECT_DAM
RICHMOND
NOWRA
BOWRAL
WOLLONGONG
NERRIGA
TARALGA
GOULBURN
SYDNEY
2001751501251007550250-25-50-75-100-125-150-175-200
A1B Year 2030
-50
-250
0
149.00 149.50 150.00 150.50 151.00 151.50Longitude
-36.00
-35.50
-35.00
-34.50
-34.00
-33.50
Latit
ude
BATHURST
KATOOMBA
LITHGOW
PROSPECT_DAM
RICHMOND
NOWRA
BOWRAL
WOLLONGONG
NERRIGA
TARALGA
GOULBURN
SYDNEY
2001751501251007550250-25-50-75-100-125-150-175-200
A2 Year 2030
-50-25
0
0149.00 149.50 150.00 150.50 151.00 151.50
Longitude
-36.00
-35.50
-35.00
-34.50
-34.00
-33.50
Latit
ude
BATHURST
KATOOMBA
LITHGOW
PROSPECT_DAM
RICHMOND
NOWRA
BOWRAL
WOLLONGONG
NERRIGA
TARALGA
GOULBURN
SYDNEY
2001751501251007550250-25-50-75-100-125-150-175-200
B1 Year 2070
-50
-25
0
0
149.00 149.50 150.00 150.50 151.00 151.50Longitude
-36.00
-35.50
-35.00
-34.50
-34.00
-33.50
Latit
ude
BATHURST
KATOOMBA
LITHGOW
PROSPECT_DAM
RICHMOND
NOWRA
BOWRAL
WOLLONGONG
NERRIGA
TARALGA
GOULBURN
SYDNEY
2001751501251007550250-25-50-75-100-125-150-175-200
A1B Year 2070
-50
-25
0
0
149.00 149.50 150.00 150.50 151.00 151.50Longitude
-36.00
-35.50
-35.00
-34.50
-34.00
-33.50
Latit
ude
BATHURST
KATOOMBA
LITHGOW
PROSPECT_DAM
RICHMOND
NOWRA
BOWRAL
WOLLONGONG
NERRIGA
TARALGA
GOULBURN
SYDNEY
2001751501251007550250-25-50-75-100-125-150-175-200
A2 Year 2070
-75
-50
-25
0
0
149.00 149.50 150.00 150.50 151.00 151.50Longitude
-36.00
-35.50
-35.00
-34.50
-34.00
-33.50
Latit
ude
BATHURST
KATOOMBA
LITHGOW
PROSPECT_DAM
RICHMOND
NOWRA
BOWRAL
WOLLONGONG
NERRIGA
TARALGA
GOULBURN
SYDNEY
2001751501251007550250-25-50-75-100-125-150-175-200
Figure A4.5: Best estimates (50th percentiles) of the changes in the number of annual occurrences of cold spells (4–5 consecutive days with daily maximum temperature <10°C) anomalies (expressed as a percent difference of models simulated and current climate values) for 2030 and 2070 under the B1, A1B and A2 scenarios, relative to the current climate.
Table A4.3: Changes in the number of seasonal and annual occurrences of cold spells (4–5 consecutive days with daily maximum temperature <10°C) for 2030 and 2070 under the B1, A1B and A2 scenarios, relative to the current climate. Best estimate median change is given, with the range of uncertainty (5th and 95th percentile values) in brackets.

74 | Summary report
Rainfall
Wet days – 2030
B1 Year 2030 - Autumn
0
149.00 149.50 150.00 150.50 151.00 151.50Longitude
-36.00
-35.50
-35.00
-34.50
-34.00
-33.50
Latit
ude
KATOOMBA
GURNANG
OBERON
SUNNY
YERRANDERIE
LITHGOW
LEESTON
BANNABY
BRAIDWOOD
BUNGENDORE
BUNGONIA
CHATSBURY
GOULBURN
LOWER_BORO
MAJORS_CREEK
MARULAN
MOUNT
TARALGA
POTTS
PROSPECT_DAM
RICHMOND
BRAIDWOOD
NERRIGA
CAMDEN
BUNDANOON
CATARACT_DAM
DAPTO
HELENSBURGH
KANGAROO_VALLEY
NOWRA
PICTON
ROBERTSON
HIGH_RANGE WOONONA
WORONORA_DAM
WARRAGAMBA
AVON_DAM
SYDNEY
35
30
25
20
15
10
5
0
-5
-10
-15
-20
-25
-30
-35
A1B Year 2030 - Autumn
5
5
149.00 149.50 150.00 150.50 151.00 151.50Longitude
-36.00
-35.50
-35.00
-34.50
-34.00
-33.50
Latit
ude
KATOOMBA
GURNANG
OBERON
SUNNY
YERRANDERIE
LITHGOW
LEESTON
BANNABY
BRAIDWOOD
BUNGENDORE
BUNGONIA
CHATSBURY
GOULBURN
LOWER_BORO
MAJORS_CREEK
MARULAN
MOUNT
TARALGA
POTTS
PROSPECT_DAM
RICHMOND
BRAIDWOOD
NERRIGA
CAMDEN
BUNDANOON
CATARACT_DAM
DAPTO
HELENSBURGH
KANGAROO_VALLEY
NOWRA
PICTON
ROBERTSON
HIGH_RANGE WOONONA
WORONORA_DAM
WARRAGAMBA
AVON_DAM
SYDNEY
35
30
25
20
15
10
5
0
-5
-10
-15
-20
-25
-30
-35
A2 Year 2030 - Autumn
5
5
10
10
149.00 149.50 150.00 150.50 151.00 151.50Longitude
-36.00
-35.50
-35.00
-34.50
-34.00
-33.50
Latit
ude
KATOOMBA
GURNANG
OBERON
SUNNY
YERRANDERIE
LITHGOW
LEESTON
BANNABY
BRAIDWOOD
BUNGENDORE
BUNGONIA
CHATSBURY
GOULBURN
LOWER_BORO
MAJORS_CREEK
MARULAN
MOUNT
TARALGA
POTTS
PROSPECT_DAM
RICHMOND
BRAIDWOOD
NERRIGA
CAMDEN
BUNDANOON
CATARACT_DAM
DAPTO
HELENSBURGH
KANGAROO_VALLEY
NOWRA
PICTON
ROBERTSON
HIGH_RANGE WOONONA
WORONORA_DAM
WARRAGAMBA
AVON_DAM
SYDNEY
35
30
25
20
15
10
5
0
-5
-10
-15
-20
-25
-30
-35
B1 Year 2030 - Winter
-10
-10
149.00 149.50 150.00 150.50 151.00 151.50Longitude
-36.00
-35.50
-35.00
-34.50
-34.00
-33.50
Latit
ude
KATOOMBA
GURNANG
OBERON
SUNNY
YERRANDERIE
LITHGOW
LEESTON
BANNABY
BRAIDWOOD
BUNGENDORE
BUNGONIA
CHATSBURY
GOULBURN
LOWER_BORO
MAJORS_CREEK
MARULAN
MOUNT
TARALGA
POTTS
PROSPECT_DAM
RICHMOND
BRAIDWOOD
NERRIGA
CAMDEN
BUNDANOON
CATARACT_DAM
DAPTO
HELENSBURGH
KANGAROO_VALLEY
NOWRA
PICTON
ROBERTSON
HIGH_RANGE WOONONA
WORONORA_DAM
WARRAGAMBA
AVON_DAM
SYDNEY
35
30
25
20
15
10
5
0
-5
-10
-15
-20
-25
-30
-35
A1B Year 2030 - Winter
-5
-5
149.00 149.50 150.00 150.50 151.00 151.50Longitude
-36.00
-35.50
-35.00
-34.50
-34.00
-33.50
Latit
ude
KATOOMBA
GURNANG
OBERON
SUNNY
YERRANDERIE
LITHGOW
LEESTON
BANNABY
BRAIDWOOD
BUNGENDORE
BUNGONIA
CHATSBURY
GOULBURN
LOWER_BORO
MAJORS_CREEK
MARULAN
MOUNT
TARALGA
POTTS
PROSPECT_DAM
RICHMOND
BRAIDWOOD
NERRIGA
CAMDEN
BUNDANOON
CATARACT_DAM
DAPTO
HELENSBURGH
KANGAROO_VALLEY
NOWRA
PICTON
ROBERTSON
HIGH_RANGE WOONONA
WORONORA_DAM
WARRAGAMBA
AVON_DAM
SYDNEY
35
30
25
20
15
10
5
0
-5
-10
-15
-20
-25
-30
-35
A2 Year 2030 - Winter
-10
149.00 149.50 150.00 150.50 151.00 151.50Longitude
-36.00
-35.50
-35.00
-34.50
-34.00
-33.50
Latit
ude
KATOOMBA
GURNANG
OBERON
SUNNY
YERRANDERIE
LITHGOW
LEESTON
BANNABY
BRAIDWOOD
BUNGENDORE
BUNGONIA
CHATSBURY
GOULBURN
LOWER_BORO
MAJORS_CREEK
MARULAN
MOUNT
TARALGA
POTTS
PROSPECT_DAM
RICHMOND
BRAIDWOOD
NERRIGA
CAMDEN
BUNDANOON
CATARACT_DAM
DAPTO
HELENSBURGH
KANGAROO_VALLEY
NOWRA
PICTON
ROBERTSON
HIGH_RANGE WOONONA
WORONORA_DAM
WARRAGAMBA
AVON_DAM
SYDNEY
35
30
25
20
15
10
5
0
-5
-10
-15
-20
-25
-30
-35
B1 Year 2030 - Spring
-5
-5
0
149.00 149.50 150.00 150.50 151.00 151.50Longitude
-36.00
-35.50
-35.00
-34.50
-34.00
-33.50
Latit
ude
KATOOMBA
GURNANG
OBERON
SUNNY
YERRANDERIE
LITHGOW
LEESTON
BANNABY
BRAIDWOOD
BUNGENDORE
BUNGONIA
CHATSBURY
GOULBURN
LOWER_BORO
MAJORS_CREEK
MARULAN
MOUNT
TARALGA
POTTS
PROSPECT_DAM
RICHMOND
BRAIDWOOD
NERRIGA
CAMDEN
BUNDANOON
CATARACT_DAM
DAPTO
HELENSBURGH
KANGAROO_VALLEY
NOWRA
PICTON
ROBERTSON
HIGH_RANGE WOONONA
WORONORA_DAM
WARRAGAMBA
AVON_DAM
SYDNEY
35
30
25
20
15
10
5
0
-5
-10
-15
-20
-25
-30
-35
A1B Year 2030 - Spring
-5
-5
149.00 149.50 150.00 150.50 151.00 151.50Longitude
-36.00
-35.50
-35.00
-34.50
-34.00
-33.50
Latit
ude
KATOOMBA
GURNANG
OBERON
SUNNY
YERRANDERIE
LITHGOW
LEESTON
BANNABY
BRAIDWOOD
BUNGENDORE
BUNGONIA
CHATSBURY
GOULBURN
LOWER_BORO
MAJORS_CREEK
MARULAN
MOUNT
TARALGA
POTTS
PROSPECT_DAM
RICHMOND
BRAIDWOOD
NERRIGA
CAMDEN
BUNDANOON
CATARACT_DAM
DAPTO
HELENSBURGH
KANGAROO_VALLEY
NOWRA
PICTON
ROBERTSON
HIGH_RANGE WOONONA
WORONORA_DAM
WARRAGAMBA
AVON_DAM
SYDNEY
35
30
25
20
15
10
5
0
-5
-10
-15
-20
-25
-30
-35
A2 Year 2030 - Spring
-15
-15
-10
149.00 149.50 150.00 150.50 151.00 151.50Longitude
-36.00
-35.50
-35.00
-34.50
-34.00
-33.50
Latit
ude
KATOOMBA
GURNANG
OBERON
SUNNY
YERRANDERIE
LITHGOW
LEESTON
BANNABY
BRAIDWOOD
BUNGENDORE
BUNGONIA
CHATSBURY
GOULBURN
LOWER_BORO
MAJORS_CREEK
MARULAN
MOUNT
TARALGA
POTTS
PROSPECT_DAM
RICHMOND
BRAIDWOOD
NERRIGA
CAMDEN
BUNDANOON
CATARACT_DAM
DAPTO
HELENSBURGH
KANGAROO_VALLEY
NOWRA
PICTON
ROBERTSON
HIGH_RANGE WOONONA
WORONORA_DAM
WARRAGAMBA
AVON_DAM
SYDNEY
35
30
25
20
15
10
5
0
-5
-10
-15
-20
-25
-30
-35
B1 Year 2030 - Summer
149.00 149.50 150.00 150.50 151.00 151.50Longitude
-36.00
-35.50
-35.00
-34.50
-34.00
-33.50
Latit
ude
KATOOMBA
GURNANG
OBERON
SUNNY
YERRANDERIE
LITHGOW
LEESTON
BANNABY
BRAIDWOOD
BUNGENDORE
BUNGONIA
CHATSBURY
GOULBURN
LOWER_BORO
MAJORS_CREEK
MARULAN
MOUNT
TARALGA
POTTS
PROSPECT_DAM
RICHMOND
BRAIDWOOD
NERRIGA
CAMDEN
BUNDANOON
CATARACT_DAM
DAPTO
HELENSBURGH
KANGAROO_VALLEY
NOWRA
PICTON
ROBERTSON
HIGH_RANGE WOONONA
WORONORA_DAM
WARRAGAMBA
AVON_DAM
SYDNEY
35
30
25
20
15
10
5
0
-5
-10
-15
-20
-25
-30
-35
A1B Year 2030 - Summer
10
10
149.00 149.50 150.00 150.50 151.00 151.50Longitude
-36.00
-35.50
-35.00
-34.50
-34.00
-33.50
Latit
ude
KATOOMBA
GURNANG
OBERON
SUNNY
YERRANDERIE
LITHGOW
LEESTON
BANNABY
BRAIDWOOD
BUNGENDORE
BUNGONIA
CHATSBURY
GOULBURN
LOWER_BORO
MAJORS_CREEK
MARULAN
MOUNT
TARALGA
POTTS
PROSPECT_DAM
RICHMOND
BRAIDWOOD
NERRIGA
CAMDEN
BUNDANOON
CATARACT_DAM
DAPTO
HELENSBURGH
KANGAROO_VALLEY
NOWRA
PICTON
ROBERTSON
HIGH_RANGE WOONONA
WORONORA_DAM
WARRAGAMBA
AVON_DAM
SYDNEY
35
30
25
20
15
10
5
0
-5
-10
-15
-20
-25
-30
-35
A2 Year 2030 - Summer
149.00 149.50 150.00 150.50 151.00 151.50Longitude
-36.00
-35.50
-35.00
-34.50
-34.00
-33.50
Latit
ude
KATOOMBA
GURNANG
OBERON
SUNNY
YERRANDERIE
LITHGOW
LEESTON
BANNABY
BRAIDWOOD
BUNGENDORE
BUNGONIA
CHATSBURY
GOULBURN
LOWER_BORO
MAJORS_CREEK
MARULAN
MOUNT
TARALGA
POTTS
PROSPECT_DAM
RICHMOND
BRAIDWOOD
NERRIGA
CAMDEN
BUNDANOON
CATARACT_DAM
DAPTO
HELENSBURGH
KANGAROO_VALLEY
NOWRA
PICTON
ROBERTSON
HIGH_RANGE WOONONA
WORONORA_DAM
WARRAGAMBA
AVON_DAM
SYDNEY
35
30
25
20
15
10
5
0
-5
-10
-15
-20
-25
-30
-35
B1 Year 2030
149.00 149.50 150.00 150.50 151.00 151.50Longitude
-36.00
-35.50
-35.00
-34.50
-34.00
-33.50
Latit
ude
KATOOMBA
GURNANG
OBERON
SUNNY
YERRANDERIE
LITHGOW
LEESTON
BANNABY
BRAIDWOOD
BUNGENDORE
BUNGONIA
CHATSBURY
GOULBURN
LOWER_BORO
MAJORS_CREEK
MARULAN
MOUNT
TARALGA
POTTS
PROSPECT_DAM
RICHMOND
BRAIDWOOD
NERRIGA
CAMDEN
BUNDANOON
CATARACT_DAM
DAPTO
HELENSBURGH
KANGAROO_VALLEY
NOWRA
PICTON
ROBERTSON
HIGH_RANGE WOONONA
WORONORA_DAM
WARRAGAMBA
AVON_DAM
SYDNEY
35
30
25
20
15
10
5
0
-5
-10
-15
-20
-25
-30
-35
A1B Year 2030
0
0
5
5
149.00 149.50 150.00 150.50 151.00 151.50Longitude
-36.00
-35.50
-35.00
-34.50
-34.00
-33.50
Latit
ude
KATOOMBA
GURNANG
OBERON
SUNNY
YERRANDERIE
LITHGOW
LEESTON
BANNABY
BRAIDWOOD
BUNGENDORE
BUNGONIA
CHATSBURY
GOULBURN
LOWER_BORO
MAJORS_CREEK
MARULAN
MOUNT
TARALGA
POTTS
PROSPECT_DAM
RICHMOND
BRAIDWOOD
NERRIGA
CAMDEN
BUNDANOON
CATARACT_DAM
DAPTO
HELENSBURGH
KANGAROO_VALLEY
NOWRA
PICTON
ROBERTSON
HIGH_RANGE WOONONA
WORONORA_DAM
WARRAGAMBA
AVON_DAM
SYDNEY
35
30
25
20
15
10
5
0
-5
-10
-15
-20
-25
-30
-35
A2 Year 2030
-5
-5
149.00 149.50 150.00 150.50 151.00 151.50Longitude
-36.00
-35.50
-35.00
-34.50
-34.00
-33.50
Latit
ude
KATOOMBA
GURNANG
OBERON
SUNNY
YERRANDERIE
LITHGOW
LEESTON
BANNABY
BRAIDWOOD
BUNGENDORE
BUNGONIA
CHATSBURY
GOULBURN
LOWER_BORO
MAJORS_CREEK
MARULAN
MOUNT
TARALGA
POTTS
PROSPECT_DAM
RICHMOND
BRAIDWOOD
NERRIGA
CAMDEN
BUNDANOON
CATARACT_DAM
DAPTO
HELENSBURGH
KANGAROO_VALLEY
NOWRA
PICTON
ROBERTSON
HIGH_RANGE WOONONA
WORONORA_DAM
WARRAGAMBA
AVON_DAM
SYDNEY
35
30
25
20
15
10
5
0
-5
-10
-15
-20
-25
-30
-35
Figure A4.6: Best estimates (50th percentiles) of changes in the seasonal and annual number of wet days (%) for 2030 under the B1, A1B and A2 scenarios, relative to the current climate.

75 | Summary report
Wet days – 2070
B1 Year 2070 - Autumn
5
5
10
10
1515
149.00 149.50 150.00 150.50 151.00 151.50Longitude
-36.00
-35.50
-35.00
-34.50
-34.00
-33.50
Latit
ude
KATOOMBA
GURNANG
OBERON
SUNNY
YERRANDERIE
LITHGOW
LEESTON
BANNABY
BRAIDWOOD
BUNGENDORE
BUNGONIA
CHATSBURY
GOULBURN
LOWER_BORO
MAJORS_CREEK
MARULAN
MOUNT
TARALGA
POTTS
PROSPECT_DAM
RICHMOND
BRAIDWOOD
NERRIGA
CAMDEN
BUNDANOON
CATARACT_DAM
DAPTO
HELENSBURGH
KANGAROO_VALLEY
NOWRA
PICTON
ROBERTSON
HIGH_RANGE WOONONA
WORONORA_DAM
WARRAGAMBA
AVON_DAM
SYDNEY
35
30
25
20
15
10
5
0
-5
-10
-15
-20
-25
-30
-35
A1B Year 2070 - Autumn
0
0
5
5
149.00 149.50 150.00 150.50 151.00 151.50Longitude
-36.00
-35.50
-35.00
-34.50
-34.00
-33.50
Latit
ude
KATOOMBA
GURNANG
OBERON
SUNNY
YERRANDERIE
LITHGOW
LEESTON
BANNABY
BRAIDWOOD
BUNGENDORE
BUNGONIA
CHATSBURY
GOULBURN
LOWER_BORO
MAJORS_CREEK
MARULAN
MOUNT
TARALGA
POTTS
PROSPECT_DAM
RICHMOND
BRAIDWOOD
NERRIGA
CAMDEN
BUNDANOON
CATARACT_DAM
DAPTO
HELENSBURGH
KANGAROO_VALLEY
NOWRA
PICTON
ROBERTSON
HIGH_RANGE WOONONA
WORONORA_DAM
WARRAGAMBA
AVON_DAM
SYDNEY
35
30
25
20
15
10
5
0
-5
-10
-15
-20
-25
-30
-35
A2 Year 2070 - Autumn
-5
-5
0
0
5
149.00 149.50 150.00 150.50 151.00 151.50Longitude
-36.00
-35.50
-35.00
-34.50
-34.00
-33.50
Latit
ude
KATOOMBA
GURNANG
OBERON
SUNNY
YERRANDERIE
LITHGOW
LEESTON
BANNABY
BRAIDWOOD
BUNGENDORE
BUNGONIA
CHATSBURY
GOULBURN
LOWER_BORO
MAJORS_CREEK
MARULAN
MOUNT
TARALGA
POTTS
PROSPECT_DAM
RICHMOND
BRAIDWOOD
NERRIGA
CAMDEN
BUNDANOON
CATARACT_DAM
DAPTO
HELENSBURGH
KANGAROO_VALLEY
NOWRA
PICTON
ROBERTSON
HIGH_RANGE WOONONA
WORONORA_DAM
WARRAGAMBA
AVON_DAM
SYDNEY
35
30
25
20
15
10
5
0
-5
-10
-15
-20
-25
-30
-35
B1 Year 2070 - Winter
-15
-15
-10
149.00 149.50 150.00 150.50 151.00 151.50Longitude
-36.00
-35.50
-35.00
-34.50
-34.00
-33.50
Latit
ude
KATOOMBA
GURNANG
OBERON
SUNNY
YERRANDERIE
LITHGOW
LEESTON
BANNABY
BRAIDWOOD
BUNGENDORE
BUNGONIA
CHATSBURY
GOULBURN
LOWER_BORO
MAJORS_CREEK
MARULAN
MOUNT
TARALGA
POTTS
PROSPECT_DAM
RICHMOND
BRAIDWOOD
NERRIGA
CAMDEN
BUNDANOON
CATARACT_DAM
DAPTO
HELENSBURGH
KANGAROO_VALLEY
NOWRA
PICTON
ROBERTSON
HIGH_RANGE WOONONA
WORONORA_DAM
WARRAGAMBA
AVON_DAM
SYDNEY
35
30
25
20
15
10
5
0
-5
-10
-15
-20
-25
-30
-35
A1B Year 2070 - Winter
-15
-15
-10
-10
149.00 149.50 150.00 150.50 151.00 151.50Longitude
-36.00
-35.50
-35.00
-34.50
-34.00
-33.50
Latit
ude
KATOOMBA
GURNANG
OBERON
SUNNY
YERRANDERIE
LITHGOW
LEESTON
BANNABY
BRAIDWOOD
BUNGENDORE
BUNGONIA
CHATSBURY
GOULBURN
LOWER_BORO
MAJORS_CREEK
MARULAN
MOUNT
TARALGA
POTTS
PROSPECT_DAM
RICHMOND
BRAIDWOOD
NERRIGA
CAMDEN
BUNDANOON
CATARACT_DAM
DAPTO
HELENSBURGH
KANGAROO_VALLEY
NOWRA
PICTON
ROBERTSON
HIGH_RANGE WOONONA
WORONORA_DAM
WARRAGAMBA
AVON_DAM
SYDNEY
35
30
25
20
15
10
5
0
-5
-10
-15
-20
-25
-30
-35
A2 Year 2070 - Winter-15
-15
-10
-10
-5
149.00 149.50 150.00 150.50 151.00 151.50Longitude
-36.00
-35.50
-35.00
-34.50
-34.00
-33.50
Latit
ude
KATOOMBA
GURNANG
OBERON
SUNNY
YERRANDERIE
LITHGOW
LEESTON
BANNABY
BRAIDWOOD
BUNGENDORE
BUNGONIA
CHATSBURY
GOULBURN
LOWER_BORO
MAJORS_CREEK
MARULAN
MOUNT
TARALGA
POTTS
PROSPECT_DAM
RICHMOND
BRAIDWOOD
NERRIGA
CAMDEN
BUNDANOON
CATARACT_DAM
DAPTO
HELENSBURGH
KANGAROO_VALLEY
NOWRA
PICTON
ROBERTSON
HIGH_RANGE WOONONA
WORONORA_DAM
WARRAGAMBA
AVON_DAM
SYDNEY
35
30
25
20
15
10
5
0
-5
-10
-15
-20
-25
-30
-35
B1 Year 2070 - Spring
-9
-9
-4
-4
0
149.00 149.50 150.00 150.50 151.00 151.50Longitude
-36.00
-35.50
-35.00
-34.50
-34.00
-33.50
Latit
ude
KATOOMBA
GURNANG
OBERON
SUNNY
YERRANDERIE
LITHGOW
LEESTON
BANNABY
BRAIDWOOD
BUNGENDORE
BUNGONIA
CHATSBURY
GOULBURN
LOWER_BORO
MAJORS_CREEK
MARULAN
MOUNT
TARALGA
POTTS
PROSPECT_DAM
RICHMOND
BRAIDWOOD
NERRIGA
CAMDEN
BUNDANOON
CATARACT_DAM
DAPTO
HELENSBURGH
KANGAROO_VALLEY
NOWRA
PICTON
ROBERTSON
HIGH_RANGE WOONONA
WORONORA_DAM
WARRAGAMBA
AVON_DAM
SYDNEY
353126221813940-4-9-13-18-22-26-31-35
A1B Year 2070 - Spring
-20
-20
-15
-15
-10
-10
-5
149.00 149.50 150.00 150.50 151.00 151.50Longitude
-36.00
-35.50
-35.00
-34.50
-34.00
-33.50
Latit
ude
KATOOMBA
GURNANG
OBERON
SUNNY
YERRANDERIE
LITHGOW
LEESTON
BANNABY
BRAIDWOOD
BUNGENDORE
BUNGONIA
CHATSBURY
GOULBURN
LOWER_BORO
MAJORS_CREEK
MARULAN
MOUNT
TARALGA
POTTS
PROSPECT_DAM
RICHMOND
BRAIDWOOD
NERRIGA
CAMDEN
BUNDANOON
CATARACT_DAM
DAPTO
HELENSBURGH
KANGAROO_VALLEY
NOWRA
PICTON
ROBERTSON
HIGH_RANGE WOONONA
WORONORA_DAM
WARRAGAMBA
AVON_DAM
SYDNEY
35
30
25
20
15
10
5
0
-5
-10
-15
-20
-25
-30
-35
A2 Year 2070 - Spring
-20
-20
-15
-15
-10
-10
-5
0
149.00 149.50 150.00 150.50 151.00 151.50Longitude
-36.00
-35.50
-35.00
-34.50
-34.00
-33.50
Latit
ude
KATOOMBA
GURNANG
OBERON
SUNNY
YERRANDERIE
LITHGOW
LEESTON
BANNABY
BRAIDWOOD
BUNGENDORE
BUNGONIA
CHATSBURY
GOULBURN
LOWER_BORO
MAJORS_CREEK
MARULAN
MOUNT
TARALGA
POTTS
PROSPECT_DAM
RICHMOND
BRAIDWOOD
NERRIGA
CAMDEN
BUNDANOON
CATARACT_DAM
DAPTO
HELENSBURGH
KANGAROO_VALLEY
NOWRA
PICTON
ROBERTSON
HIGH_RANGE WOONONA
WORONORA_DAM
WARRAGAMBA
AVON_DAM
SYDNEY
35
30
25
20
15
10
5
0
-5
-10
-15
-20
-25
-30
-35
B1 Year 2070 - Summer
149.00 149.50 150.00 150.50 151.00 151.50Longitude
-36.00
-35.50
-35.00
-34.50
-34.00
-33.50
Latit
ude
KATOOMBA
GURNANG
OBERON
SUNNY
YERRANDERIE
LITHGOW
LEESTON
BANNABY
BRAIDWOOD
BUNGENDORE
BUNGONIA
CHATSBURY
GOULBURN
LOWER_BORO
MAJORS_CREEK
MARULAN
MOUNT
TARALGA
POTTS
PROSPECT_DAM
RICHMOND
BRAIDWOOD
NERRIGA
CAMDEN
BUNDANOON
CATARACT_DAM
DAPTO
HELENSBURGH
KANGAROO_VALLEY
NOWRA
PICTON
ROBERTSON
HIGH_RANGE WOONONA
WORONORA_DAM
WARRAGAMBA
AVON_DAM
SYDNEY
35
30
25
20
15
10
5
0
-5
-10
-15
-20
-25
-30
-35
A1B Year 2070 - Summer
-10
-5
149.00 149.50 150.00 150.50 151.00 151.50Longitude
-36.00
-35.50
-35.00
-34.50
-34.00
-33.50
Latit
ude
KATOOMBA
GURNANG
OBERON
SUNNY
YERRANDERIE
LITHGOW
LEESTON
BANNABY
BRAIDWOOD
BUNGENDORE
BUNGONIA
CHATSBURY
GOULBURN
LOWER_BORO
MAJORS_CREEK
MARULAN
MOUNT
TARALGA
POTTS
PROSPECT_DAM
RICHMOND
BRAIDWOOD
NERRIGA
CAMDEN
BUNDANOON
CATARACT_DAM
DAPTO
HELENSBURGH
KANGAROO_VALLEY
NOWRA
PICTON
ROBERTSON
HIGH_RANGE WOONONA
WORONORA_DAM
WARRAGAMBA
AVON_DAM
SYDNEY
35
30
25
20
15
10
5
0
-5
-10
-15
-20
-25
-30
-35
A2 Year 2070 - Summer
0
0
5
149.00 149.50 150.00 150.50 151.00 151.50Longitude
-36.00
-35.50
-35.00
-34.50
-34.00
-33.50
Latit
ude
KATOOMBA
GURNANG
OBERON
SUNNY
YERRANDERIE
LITHGOW
LEESTON
BANNABY
BRAIDWOOD
BUNGENDORE
BUNGONIA
CHATSBURY
GOULBURN
LOWER_BORO
MAJORS_CREEK
MARULAN
MOUNT
TARALGA
POTTS
PROSPECT_DAM
RICHMOND
BRAIDWOOD
NERRIGA
CAMDEN
BUNDANOON
CATARACT_DAM
DAPTO
HELENSBURGH
KANGAROO_VALLEY
NOWRA
PICTON
ROBERTSON
HIGH_RANGE WOONONA
WORONORA_DAM
WARRAGAMBA
AVON_DAM
SYDNEY
35
30
25
20
15
10
5
0
-5
-10
-15
-20
-25
-30
-35
B1 Year 2070
-5
0
0
5
149.00 149.50 150.00 150.50 151.00 151.50Longitude
-36.00
-35.50
-35.00
-34.50
-34.00
-33.50
Latit
ude
KATOOMBA
GURNANG
OBERON
SUNNY
YERRANDERIE
LITHGOW
LEESTON
BANNABY
BRAIDWOOD
BUNGENDORE
BUNGONIA
CHATSBURY
GOULBURN
LOWER_BORO
MAJORS_CREEK
MARULAN
MOUNT
TARALGA
POTTS
PROSPECT_DAM
RICHMOND
BRAIDWOOD
NERRIGA
CAMDEN
BUNDANOON
CATARACT_DAM
DAPTO
HELENSBURGH
KANGAROO_VALLEY
NOWRA
PICTON
ROBERTSON
HIGH_RANGE WOONONA
WORONORA_DAM
WARRAGAMBA
AVON_DAM
SYDNEY
35
30
25
20
15
10
5
0
-5
-10
-15
-20
-25
-30
-35
A1B Year 2070
-10
-10
-5
-5
149.00 149.50 150.00 150.50 151.00 151.50Longitude
-36.00
-35.50
-35.00
-34.50
-34.00
-33.50
Latit
ude
KATOOMBA
GURNANG
OBERON
SUNNY
YERRANDERIE
LITHGOW
LEESTON
BANNABY
BRAIDWOOD
BUNGENDORE
BUNGONIA
CHATSBURY
GOULBURN
LOWER_BORO
MAJORS_CREEK
MARULAN
MOUNT
TARALGA
POTTS
PROSPECT_DAM
RICHMOND
BRAIDWOOD
NERRIGA
CAMDEN
BUNDANOON
CATARACT_DAM
DAPTO
HELENSBURGH
KANGAROO_VALLEY
NOWRA
PICTON
ROBERTSON
HIGH_RANGE WOONONA
WORONORA_DAM
WARRAGAMBA
AVON_DAM
SYDNEY
35
30
25
20
15
10
5
0
-5
-10
-15
-20
-25
-30
-35
A2 Year 2070
-10
-10
-5
-5
0
149.00 149.50 150.00 150.50 151.00 151.50Longitude
-36.00
-35.50
-35.00
-34.50
-34.00
-33.50
Latit
ude
KATOOMBA
GURNANG
OBERON
SUNNY
YERRANDERIE
LITHGOW
LEESTON
BANNABY
BRAIDWOOD
BUNGENDORE
BUNGONIA
CHATSBURY
GOULBURN
LOWER_BORO
MAJORS_CREEK
MARULAN
MOUNT
TARALGA
POTTS
PROSPECT_DAM
RICHMOND
BRAIDWOOD
NERRIGA
CAMDEN
BUNDANOON
CATARACT_DAM
DAPTO
HELENSBURGH
KANGAROO_VALLEY
NOWRA
PICTON
ROBERTSON
HIGH_RANGE WOONONA
WORONORA_DAM
WARRAGAMBA
AVON_DAM
SYDNEY
35
30
25
20
15
10
5
0
-5
-10
-15
-20
-25
-30
-35
Figure A4.7: Best estimates (50th percentiles) of changes in the seasonal and annual number of wet days (%) for 2070 under the B1, A1B and A2 scenarios, relative to the current climate.
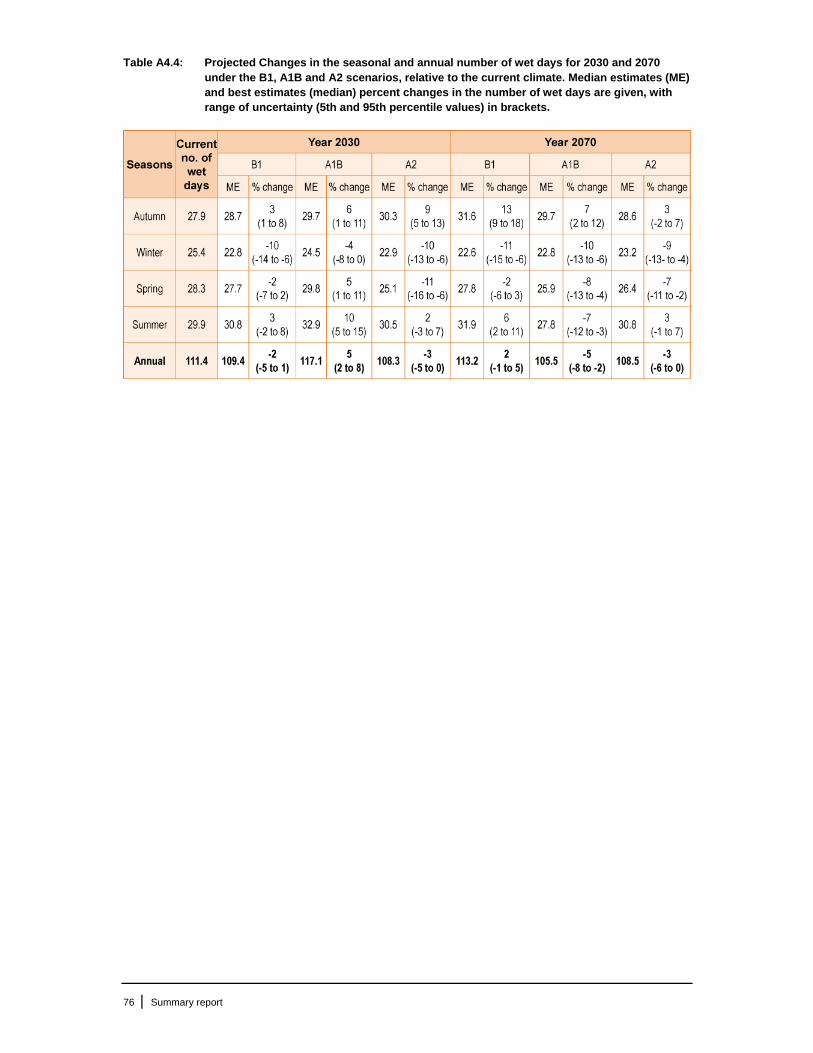
76 | Summary report
Table A4.4: Projected Changes in the seasonal and annual number of wet days for 2030 and 2070 under the B1, A1B and A2 scenarios, relative to the current climate. Median estimates (ME) and best estimates (median) percent changes in the number of wet days are given, with range of uncertainty (5th and 95th percentile values) in brackets.

77 | Summary report
Rainfall – 2030 B1 Year 2030 - Autumn
0
5
5
10
10
149.00 149.50 150.00 150.50 151.00 151.50Longitude
-36.00
-35.50
-35.00
-34.50
-34.00
-33.50
Latit
ude
KATOOMBA
GURNANG
OBERON
SUNNY
YERRANDERIE
LITHGOW
LEESTON
BANNABY
BRAIDWOOD
BUNGENDORE
BUNGONIA
CHATSBURY
GOULBURN
LOWER_BORO
MAJORS_CREEK
MARULAN
MOUNT
TARALGA
POTTS
PROSPECT_DAM
RICHMOND
BRAIDWOOD
NERRIGA
RIVERVIEW
MOSS_VALE
CAMDEN
BUNDANOON
CATARACT_DAM
DAPTO
HELENSBURGH
KANGAROO_VALLEY
NOWRA
PICTON
ROBERTSON
HIGH_RANGE WOONONA
WORONORA_DAM
WARRAGAMBA
AVON_DAM
SYDNEY
35
30
25
20
15
10
5
0
-5
-10
-15
-20
-25
-30
-35
A1B Year 2030 - Autumn
0
0
5
5
10
10
15
149.00 149.50 150.00 150.50 151.00 151.50Longitude
-36.00
-35.50
-35.00
-34.50
-34.00
-33.50
Latit
ude
KATOOMBA
GURNANG
OBERON
SUNNY
YERRANDERIE
LITHGOW
LEESTON
BANNABY
BRAIDWOOD
BUNGENDORE
BUNGONIA
CHATSBURY
GOULBURN
LOWER_BORO
MAJORS_CREEK
MARULAN
MOUNT
TARALGA
POTTS
PROSPECT_DAM
RICHMOND
BRAIDWOOD
NERRIGA
RIVERVIEW
MOSS_VALE
CAMDEN
BUNDANOON
CATARACT_DAM
DAPTO
HELENSBURGH
KANGAROO_VALLEY
NOWRA
PICTON
ROBERTSON
HIGH_RANGE WOONONA
WORONORA_DAM
WARRAGAMBA
AVON_DAM
SYDNEY
35
30
25
20
15
10
5
0
-5
-10
-15
-20
-25
-30
-35
A2 Year 2030 - Autumn
-5
00
5
5
1010
15
20
25
149.00 149.50 150.00 150.50 151.00 151.50Longitude
-36.00
-35.50
-35.00
-34.50
-34.00
-33.50
Latit
ude
KATOOMBA
GURNANG
OBERON
SUNNY
YERRANDERIE
LITHGOW
LEESTON
BANNABY
BRAIDWOOD
BUNGENDORE
BUNGONIA
CHATSBURY
GOULBURN
LOWER_BORO
MAJORS_CREEK
MARULAN
MOUNT
TARALGA
POTTS
PROSPECT_DAM
RICHMOND
BRAIDWOOD
NERRIGA
RIVERVIEW
MOSS_VALE
CAMDEN
BUNDANOON
CATARACT_DAM
DAPTO
HELENSBURGH
KANGAROO_VALLEY
NOWRA
PICTON
ROBERTSON
HIGH_RANGE WOONONA
WORONORA_DAM
WARRAGAMBA
AVON_DAM
SYDNEY
35
30
25
20
15
10
5
0
-5
-10
-15
-20
-25
-30
-35
B1 Year 2030 - Winter
-15
-15
-10
-10
149.00 149.50 150.00 150.50 151.00 151.50Longitude
-36.00
-35.50
-35.00
-34.50
-34.00
-33.50
Latit
ude
KATOOMBA
GURNANG
OBERON
SUNNY
YERRANDERIE
LITHGOW
LEESTON
BANNABY
BRAIDWOOD
BUNGENDORE
BUNGONIA
CHATSBURY
GOULBURN
LOWER_BORO
MAJORS_CREEK
MARULAN
MOUNT
TARALGA
POTTS
PROSPECT_DAM
RICHMOND
BRAIDWOOD
NERRIGA
RIVERVIEW
MOSS_VALE
CAMDEN
BUNDANOON
CATARACT_DAM
DAPTO
HELENSBURGH
KANGAROO_VALLEY
NOWRA
PICTON
ROBERTSON
HIGH_RANGE WOONONA
WORONORA_DAM
WARRAGAMBA
AVON_DAM
SYDNEY
35
30
25
20
15
10
5
0
-5
-10
-15
-20
-25
-30
-35
A1B Year 2030 - Winter
-15
-10
-10
-5
-5
0
5
149.00 149.50 150.00 150.50 151.00 151.50Longitude
-36.00
-35.50
-35.00
-34.50
-34.00
-33.50
Latit
ude
KATOOMBA
GURNANG
OBERON
SUNNY
YERRANDERIE
LITHGOW
LEESTON
BANNABY
BRAIDWOOD
BUNGENDORE
BUNGONIA
CHATSBURY
GOULBURN
LOWER_BORO
MAJORS_CREEK
MARULAN
MOUNT
TARALGA
POTTS
PROSPECT_DAM
RICHMOND
BRAIDWOOD
NERRIGA
RIVERVIEW
MOSS_VALE
CAMDEN
BUNDANOON
CATARACT_DAM
DAPTO
HELENSBURGH
KANGAROO_VALLEY
NOWRA
PICTON
ROBERTSON
HIGH_RANGE WOONONA
WORONORA_DAM
WARRAGAMBA
AVON_DAM
SYDNEY
35
30
25
20
15
10
5
0
-5
-10
-15
-20
-25
-30
-35
A2 Year 2030 - Winter
-20
-20
-15
-15
149.00 149.50 150.00 150.50 151.00 151.50Longitude
-36.00
-35.50
-35.00
-34.50
-34.00
-33.50
Latit
ude
KATOOMBA
GURNANG
OBERON
SUNNY
YERRANDERIE
LITHGOW
LEESTON
BANNABY
BRAIDWOOD
BUNGENDORE
BUNGONIA
CHATSBURY
GOULBURN
LOWER_BORO
MAJORS_CREEK
MARULAN
MOUNT
TARALGA
POTTS
PROSPECT_DAM
RICHMOND
BRAIDWOOD
NERRIGA
RIVERVIEW
MOSS_VALE
CAMDEN
BUNDANOON
CATARACT_DAM
DAPTO
HELENSBURGH
KANGAROO_VALLEY
NOWRA
PICTON
ROBERTSON
HIGH_RANGE WOONONA
WORONORA_DAM
WARRAGAMBA
AVON_DAM
SYDNEY
35
30
25
20
15
10
5
0
-5
-10
-15
-20
-25
-30
-35
B1 Year 2030 - Spring
-10-5
-5
0
0
5
149.00 149.50 150.00 150.50 151.00 151.50Longitude
-36.00
-35.50
-35.00
-34.50
-34.00
-33.50
Latit
ude
KATOOMBA
GURNANG
OBERON
SUNNY
YERRANDERIE
LITHGOW
LEESTON
BANNABY
BRAIDWOOD
BUNGENDORE
BUNGONIA
CHATSBURY
GOULBURN
LOWER_BORO
MAJORS_CREEK
MARULAN
MOUNT
TARALGA
POTTS
PROSPECT_DAM
RICHMOND
BRAIDWOOD
NERRIGA
RIVERVIEW
MOSS_VALE
CAMDEN
BUNDANOON
CATARACT_DAM
DAPTO
HELENSBURGH
KANGAROO_VALLEY
NOWRA
PICTON
ROBERTSON
HIGH_RANGE WOONONA
WORONORA_DAM
WARRAGAMBA
AVON_DAM
SYDNEY
35
30
25
20
15
10
5
0
-5
-10
-15
-20
-25
-30
-35
A1B Year 2030 - Spring
-5
0
0
5
5
10
10
1515
20
20
25
149.00 149.50 150.00 150.50 151.00 151.50Longitude
-36.00
-35.50
-35.00
-34.50
-34.00
-33.50
Latit
ude
KATOOMBA
GURNANG
OBERON
SUNNY
YERRANDERIE
LITHGOW
LEESTON
BANNABY
BRAIDWOOD
BUNGENDORE
BUNGONIA
CHATSBURY
GOULBURN
LOWER_BORO
MAJORS_CREEK
MARULAN
MOUNT
TARALGA
POTTS
PROSPECT_DAM
RICHMOND
BRAIDWOOD
NERRIGA
RIVERVIEW
MOSS_VALE
CAMDEN
BUNDANOON
CATARACT_DAM
DAPTO
HELENSBURGH
KANGAROO_VALLEY
NOWRA
PICTON
ROBERTSON
HIGH_RANGE WOONONA
WORONORA_DAM
WARRAGAMBA
AVON_DAM
SYDNEY
35
30
25
20
15
10
5
0
-5
-10
-15
-20
-25
-30
-35
A2 Year 2030 - Spring
-20
-20
-15
-15
-10
-5
149.00 149.50 150.00 150.50 151.00 151.50Longitude
-36.00
-35.50
-35.00
-34.50
-34.00
-33.50
Latit
ude
KATOOMBA
GURNANG
OBERON
SUNNY
YERRANDERIE
LITHGOW
LEESTON
BANNABY
BRAIDWOOD
BUNGENDORE
BUNGONIA
CHATSBURY
GOULBURN
LOWER_BORO
MAJORS_CREEK
MARULAN
MOUNT
TARALGA
POTTS
PROSPECT_DAM
RICHMOND
BRAIDWOOD
NERRIGA
RIVERVIEW
MOSS_VALE
CAMDEN
BUNDANOON
CATARACT_DAM
DAPTO
HELENSBURGH
KANGAROO_VALLEY
NOWRA
PICTON
ROBERTSON
HIGH_RANGE WOONONA
WORONORA_DAM
WARRAGAMBA
AVON_DAM
SYDNEY
35
30
25
20
15
10
5
0
-5
-10
-15
-20
-25
-30
-35
B1 Year 2030 - Summer
5
5
10
10
149.00 149.50 150.00 150.50 151.00 151.50Longitude
-36.00
-35.50
-35.00
-34.50
-34.00
-33.50
Latit
ude
KATOOMBA
GURNANG
OBERON
SUNNY
YERRANDERIE
LITHGOW
LEESTON
BANNABY
BRAIDWOOD
BUNGENDORE
BUNGONIA
CHATSBURY
GOULBURN
LOWER_BORO
MAJORS_CREEK
MARULAN
MOUNT
TARALGA
POTTS
PROSPECT_DAM
RICHMOND
BRAIDWOOD
NERRIGA
RIVERVIEW
MOSS_VALE
CAMDEN
BUNDANOON
CATARACT_DAM
DAPTO
HELENSBURGH
KANGAROO_VALLEY
NOWRA
PICTON
ROBERTSON
HIGH_RANGE WOONONA
WORONORA_DAM
WARRAGAMBA
AVON_DAM
SYDNEY
35
30
25
20
15
10
5
0
-5
-10
-15
-20
-25
-30
-35
A1B Year 2030 - Summer
15
15
20
149.00 149.50 150.00 150.50 151.00 151.50Longitude
-36.00
-35.50
-35.00
-34.50
-34.00
-33.50
Latit
ude
KATOOMBA
GURNANG
OBERON
SUNNY
YERRANDERIE
LITHGOW
LEESTON
BANNABY
BRAIDWOOD
BUNGENDORE
BUNGONIA
CHATSBURY
GOULBURN
LOWER_BORO
MAJORS_CREEK
MARULAN
MOUNT
TARALGA
POTTS
PROSPECT_DAM
RICHMOND
BRAIDWOOD
NERRIGA
RIVERVIEW
MOSS_VALE
CAMDEN
BUNDANOON
CATARACT_DAM
DAPTO
HELENSBURGH
KANGAROO_VALLEY
NOWRA
PICTON
ROBERTSON
HIGH_RANGE WOONONA
WORONORA_DAM
WARRAGAMBA
AVON_DAM
SYDNEY
35
30
25
20
15
10
5
0
-5
-10
-15
-20
-25
-30
-35
A2 Year 2030 - Summer
5
5
149.00 149.50 150.00 150.50 151.00 151.50Longitude
-36.00
-35.50
-35.00
-34.50
-34.00
-33.50
Latit
ude
KATOOMBA
GURNANG
OBERON
SUNNY
YERRANDERIE
LITHGOW
LEESTON
BANNABY
BRAIDWOOD
BUNGENDORE
BUNGONIA
CHATSBURY
GOULBURN
LOWER_BORO
MAJORS_CREEK
MARULAN
MOUNT
TARALGA
POTTS
PROSPECT_DAM
RICHMOND
BRAIDWOOD
NERRIGA
RIVERVIEW
MOSS_VALE
CAMDEN
BUNDANOON
CATARACT_DAM
DAPTO
HELENSBURGH
KANGAROO_VALLEY
NOWRA
PICTON
ROBERTSON
HIGH_RANGE WOONONA
WORONORA_DAM
WARRAGAMBA
AVON_DAM
SYDNEY
35
30
25
20
15
10
5
0
-5
-10
-15
-20
-25
-30
-35
B1 Year 2030
0
0
5
149.00 149.50 150.00 150.50 151.00 151.50Longitude
-36.00
-35.50
-35.00
-34.50
-34.00
-33.50
Latit
ude
KATOOMBA
GURNANG
OBERON
SUNNY
YERRANDERIE
LITHGOW
LEESTON
BANNABY
BRAIDWOOD
BUNGENDORE
BUNGONIA
CHATSBURY
GOULBURN
LOWER_BORO
MAJORS_CREEK
MARULAN
MOUNT
TARALGA
POTTS
PROSPECT_DAM
RICHMOND
BRAIDWOOD
NERRIGA
RIVERVIEW
MOSS_VALE
CAMDEN
BUNDANOON
CATARACT_DAM
DAPTO
HELENSBURGH
KANGAROO_VALLEY
NOWRA
PICTON
ROBERTSON
HIGH_RANGE WOONONA
WORONORA_DAM
WARRAGAMBA
AVON_DAM
SYDNEY
35
30
25
20
15
10
5
0
-5
-10
-15
-20
-25
-30
-35
A1B Year 2030
0
5
5
1010
15
149.00 149.50 150.00 150.50 151.00 151.50Longitude
-36.00
-35.50
-35.00
-34.50
-34.00
-33.50
Latit
ude
KATOOMBA
GURNANG
OBERON
SUNNY
YERRANDERIE
LITHGOW
LEESTON
BANNABY
BRAIDWOOD
BUNGENDORE
BUNGONIA
CHATSBURY
GOULBURN
LOWER_BORO
MAJORS_CREEK
MARULAN
MOUNT
TARALGA
POTTS
PROSPECT_DAM
RICHMOND
BRAIDWOOD
NERRIGA
RIVERVIEW
MOSS_VALE
CAMDEN
BUNDANOON
CATARACT_DAM
DAPTO
HELENSBURGH
KANGAROO_VALLEY
NOWRA
PICTON
ROBERTSON
HIGH_RANGE WOONONA
WORONORA_DAM
WARRAGAMBA
AVON_DAM
SYDNEY
35
30
25
20
15
10
5
0
-5
-10
-15
-20
-25
-30
-35
A2 Year 2030
-10
-10
-5
-5
0
5
149.00 149.50 150.00 150.50 151.00 151.50Longitude
-36.00
-35.50
-35.00
-34.50
-34.00
-33.50
Latit
ude
KATOOMBA
GURNANG
OBERON
SUNNY
YERRANDERIE
LITHGOW
LEESTON
BANNABY
BRAIDWOOD
BUNGENDORE
BUNGONIA
CHATSBURY
GOULBURN
LOWER_BORO
MAJORS_CREEK
MARULAN
MOUNT
TARALGA
POTTS
PROSPECT_DAM
RICHMOND
BRAIDWOOD
NERRIGA
RIVERVIEW
MOSS_VALE
CAMDEN
BUNDANOON
CATARACT_DAM
DAPTO
HELENSBURGH
KANGAROO_VALLEY
NOWRA
PICTON
ROBERTSON
HIGH_RANGE WOONONA
WORONORA_DAM
WARRAGAMBA
AVON_DAM
SYDNEY
35
30
25
20
15
10
5
0
-5
-10
-15
-20
-25
-30
-35
Figure A4.8: Best estimates (50th percentiles) of changes in seasonal and annual rainfall (%) for 2030 under the B1, A1B and A2 scenarios, relative to current climate. Blue indicates a greater percentage increase in rainfall.
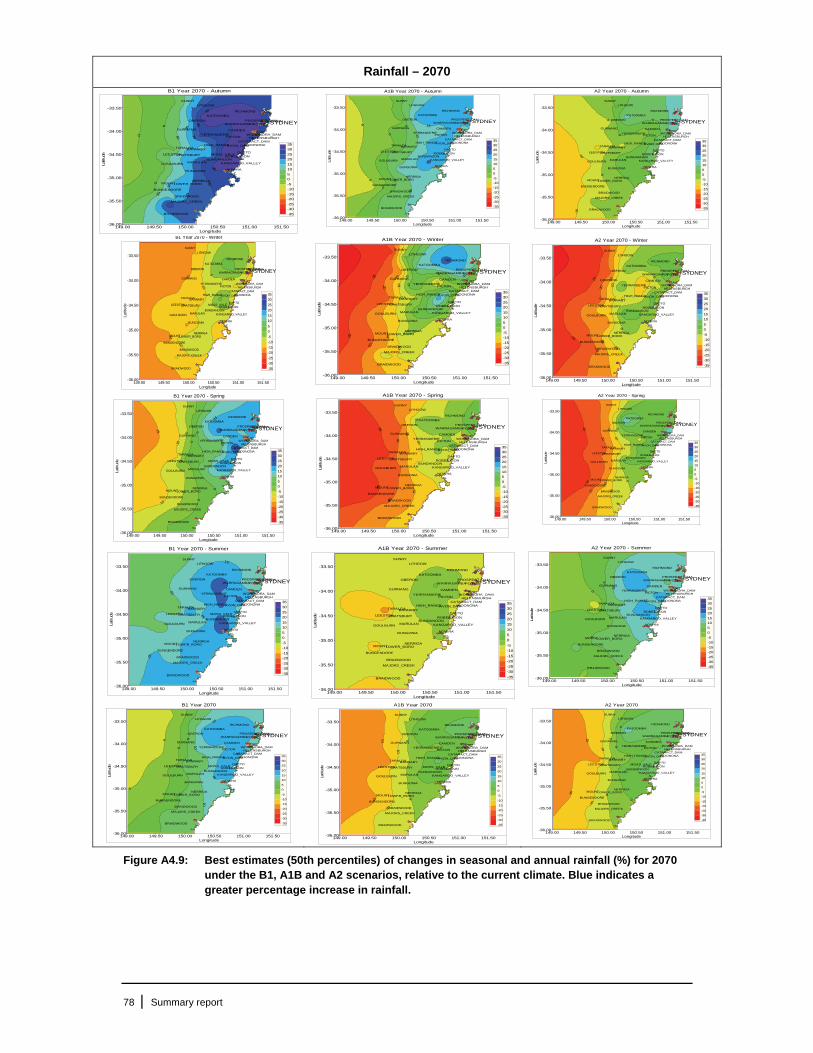
78 | Summary report
Rainfall – 2070 B1 Year 2070 - Autumn
0
5
5
10
10
15
15
20
20
25
25
30
30
149.00 149.50 150.00 150.50 151.00 151.50Longitude
-36.00
-35.50
-35.00
-34.50
-34.00
-33.50La
titud
e
KATOOMBA
GURNANG
OBERON
SUNNY
YERRANDERIE
LITHGOW
LEESTON
BANNABY
BRAIDWOOD
BUNGENDORE
BUNGONIA
CHATSBURY
GOULBURN
LOWER_BORO
MAJORS_CREEK
MARULAN
MOUNT
TARALGA
POTTS
PROSPECT_DAM
RICHMOND
BRAIDWOOD
NERRIGA
RIVERVIEW
MOSS_VALE
CAMDEN
BUNDANOON
CATARACT_DAM
DAPTO
HELENSBURGH
KANGAROO_VALLEY
NOWRA
PICTON
ROBERTSON
HIGH_RANGE WOONONA
WORONORA_DAM
WARRAGAMBA
AVON_DAM
SYDNEY
35
30
25
20
15
10
5
0
-5
-10
-15
-20
-25
-30
-35
A1B Year 2070 - Autumn
-5
-5
0
0
5
5
10
10
15
149.00 149.50 150.00 150.50 151.00 151.50Longitude
-36.00
-35.50
-35.00
-34.50
-34.00
-33.50
Latit
ude
KATOOMBA
GURNANG
OBERON
SUNNY
YERRANDERIE
LITHGOW
LEESTON
BANNABY
BRAIDWOOD
BUNGENDORE
BUNGONIA
CHATSBURY
GOULBURN
LOWER_BORO
MAJORS_CREEK
MARULAN
MOUNT
TARALGA
POTTS
PROSPECT_DAM
RICHMOND
BRAIDWOOD
NERRIGA
CAMDEN
BUNDANOON
CATARACT_DAM
DAPTO
HELENSBURGH
KANGAROO_VALLEY
NOWRA
PICTON
ROBERTSON
HIGH_RANGE WOONONA
WORONORA_DAM
WARRAGAMBA
AVON_DAM
SYDNEY
35
30
25
20
15
10
5
0
-5
-10
-15
-20
-25
-30
-35
A2 Year 2070 - Autumn
-10
-10
-5
-5
0
5
149.00 149.50 150.00 150.50 151.00 151.50Longitude
-36.00
-35.50
-35.00
-34.50
-34.00
-33.50
Latit
ude
KATOOMBA
GURNANG
OBERON
SUNNY
YERRANDERIE
LITHGOW
LEESTON
BANNABY
BRAIDWOOD
BUNGENDORE
BUNGONIA
CHATSBURY
GOULBURN
LOWER_BORO
MAJORS_CREEK
MARULAN
MOUNT
TARALGA
POTTS
PROSPECT_DAM
RICHMOND
BRAIDWOOD
NERRIGA
CAMDEN
BUNDANOON
CATARACT_DAM
DAPTO
HELENSBURGH
KANGAROO_VALLEY
NOWRA
PICTON
ROBERTSON
HIGH_RANGE WOONONA
WORONORA_DAM
WARRAGAMBA
AVON_DAM
SYDNEY
35
30
25
20
15
10
5
0
-5
-10
-15
-20
-25
-30
-35
B1 Year 2070 - Winter
-15
-15
-10
-10
-5
149.00 149.50 150.00 150.50 151.00 151.50Longitude
-36.00
-35.50
-35.00
-34.50
-34.00
-33.50
Latit
ude
KATOOMBA
GURNANG
OBERON
SUNNY
YERRANDERIE
LITHGOW
LEESTON
BANNABY
BRAIDWOOD
BUNGENDORE
BUNGONIA
CHATSBURY
GOULBURN
LOWER_BORO
MAJORS_CREEK
MARULAN
MOUNT
TARALGA
POTTS
PROSPECT_DAM
RICHMOND
BRAIDWOOD
NERRIGA
RIVERVIEW
MOSS_VALE
CAMDEN
BUNDANOON
CATARACT_DAM
DAPTO
HELENSBURGH
KANGAROO_VALLEY
NOWRA
PICTON
ROBERTSON
HIGH_RANGE WOONONA
WORONORA_DAM
WARRAGAMBA
AVON_DAM
SYDNEY
35
30
25
20
15
10
5
0
-5
-10
-15
-20
-25
-30
-35
A1B Year 2070 - Winter
-25
-25
-20
-20
-15
-15
-10
-10
-50
510
149.00 149.50 150.00 150.50 151.00 151.50Longitude
-36.00
-35.50
-35.00
-34.50
-34.00
-33.50
Latit
ude
KATOOMBA
GURNANG
OBERON
SUNNY
YERRANDERIE
LITHGOW
LEESTON
BANNABY
BRAIDWOOD
BUNGENDORE
BUNGONIA
CHATSBURY
GOULBURN
LOWER_BORO
MAJORS_CREEK
MARULAN
MOUNT
TARALGA
POTTS
PROSPECT_DAM
RICHMOND
BRAIDWOOD
NERRIGA
CAMDEN
BUNDANOON
CATARACT_DAM
DAPTO
HELENSBURGH
KANGAROO_VALLEY
NOWRA
PICTON
ROBERTSON
HIGH_RANGE WOONONA
WORONORA_DAM
WARRAGAMBA
AVON_DAM
SYDNEY
35
30
25
20
15
10
5
0
-5
-10
-15
-20
-25
-30
-35
A2 Year 2070 - Winter
-25
-25
-20
-20
-15
-15
-10
-10
-5
-5
149.00 149.50 150.00 150.50 151.00 151.50Longitude
-36.00
-35.50
-35.00
-34.50
-34.00
-33.50
Latit
ude
KATOOMBA
GURNANG
OBERON
SUNNY
YERRANDERIE
LITHGOW
LEESTON
BANNABY
BRAIDWOOD
BUNGENDORE
BUNGONIA
CHATSBURY
GOULBURN
LOWER_BORO
MAJORS_CREEK
MARULAN
MOUNT
TARALGA
POTTS
PROSPECT_DAM
RICHMOND
BRAIDWOOD
NERRIGA
CAMDEN
BUNDANOON
CATARACT_DAM
DAPTO
HELENSBURGH
KANGAROO_VALLEY
NOWRA
PICTON
ROBERTSON
HIGH_RANGE WOONONA
WORONORA_DAM
WARRAGAMBA
AVON_DAM
SYDNEY
35
30
25
20
15
10
5
0
-5
-10
-15
-20
-25
-30
-35
B1 Year 2070 - Spring
-15
-10
-10
-5-5
0
0
5
5
10
15
149.00 149.50 150.00 150.50 151.00 151.50Longitude
-36.00
-35.50
-35.00
-34.50
-34.00
-33.50
Latit
ude
KATOOMBA
GURNANG
OBERON
SUNNY
YERRANDERIE
LITHGOW
LEESTON
BANNABY
BRAIDWOOD
BUNGENDORE
BUNGONIA
CHATSBURY
GOULBURN
LOWER_BORO
MAJORS_CREEK
MARULAN
MOUNT
TARALGA
POTTS
PROSPECT_DAM
RICHMOND
BRAIDWOOD
NERRIGA
RIVERVIEW
MOSS_VALE
CAMDEN
BUNDANOON
CATARACT_DAM
DAPTO
HELENSBURGH
KANGAROO_VALLEY
NOWRA
PICTON
ROBERTSON
HIGH_RANGE WOONONA
WORONORA_DAM
WARRAGAMBA
AVON_DAM
SYDNEY
35
30
25
20
15
10
5
0
-5
-10
-15
-20
-25
-30
-35
A1B Year 2070 - Spring
-25
-25
-20
-20
-15
-15
-10
-5
149.00 149.50 150.00 150.50 151.00 151.50Longitude
-36.00
-35.50
-35.00
-34.50
-34.00
-33.50
Latit
ude
KATOOMBA
GURNANG
OBERON
SUNNY
YERRANDERIE
LITHGOW
LEESTON
BANNABY
BRAIDWOOD
BUNGENDORE
BUNGONIA
CHATSBURY
GOULBURN
LOWER_BORO
MAJORS_CREEK
MARULAN
MOUNT
TARALGA
POTTS
PROSPECT_DAM
RICHMOND
BRAIDWOOD
NERRIGA
CAMDEN
BUNDANOON
CATARACT_DAM
DAPTO
HELENSBURGH
KANGAROO_VALLEY
NOWRA
PICTON
ROBERTSON
HIGH_RANGE WOONONA
WORONORA_DAM
WARRAGAMBA
AVON_DAM
SYDNEY
35
30
25
20
15
10
5
0
-5
-10
-15
-20
-25
-30
-35
A2 Year 2070 - Spring
-25
-25
-20
-20
-15
-15
-10
-10
-5
-5
0
149.00 149.50 150.00 150.50 151.00 151.50Longitude
-36.00
-35.50
-35.00
-34.50
-34.00
-33.50
Latit
ude
KATOOMBA
GURNANG
OBERON
SUNNY
YERRANDERIE
LITHGOW
LEESTON
BANNABY
BRAIDWOOD
BUNGENDORE
BUNGONIA
CHATSBURY
GOULBURN
LOWER_BORO
MAJORS_CREEK
MARULAN
MOUNT
TARALGA
POTTS
PROSPECT_DAM
RICHMOND
BRAIDWOOD
NERRIGA
CAMDEN
BUNDANOON
CATARACT_DAM
DAPTO
HELENSBURGH
KANGAROO_VALLEY
NOWRA
PICTON
ROBERTSON
HIGH_RANGE WOONONA
WORONORA_DAM
WARRAGAMBA
AVON_DAM
SYDNEY
35
30
25
20
15
10
5
0
-5
-10
-15
-20
-25
-30
-35
B1 Year 2070 - Summer
10
15
15
15
149.00 149.50 150.00 150.50 151.00 151.50Longitude
-36.00
-35.50
-35.00
-34.50
-34.00
-33.50
Latit
ude
KATOOMBA
GURNANG
OBERON
SUNNY
YERRANDERIE
LITHGOW
LEESTON
BANNABY
BRAIDWOOD
BUNGENDORE
BUNGONIA
CHATSBURY
GOULBURN
LOWER_BORO
MAJORS_CREEK
MARULAN
MOUNT
TARALGA
POTTS
PROSPECT_DAM
RICHMOND
BRAIDWOOD
NERRIGA
RIVERVIEW
MOSS_VALE
CAMDEN
BUNDANOON
CATARACT_DAM
DAPTO
HELENSBURGH
KANGAROO_VALLEY
NOWRA
PICTON
ROBERTSON
HIGH_RANGE WOONONA
WORONORA_DAM
WARRAGAMBA
AVON_DAM
SYDNEY
35
30
25
20
15
10
5
0
-5
-10
-15
-20
-25
-30
-35
A1B Year 2070 - Summer
-5
-5
149.00 149.50 150.00 150.50 151.00 151.50Longitude
-36.00
-35.50
-35.00
-34.50
-34.00
-33.50
Latit
ude
KATOOMBA
GURNANG
OBERON
SUNNY
YERRANDERIE
LITHGOW
LEESTON
BANNABY
BRAIDWOOD
BUNGENDORE
BUNGONIA
CHATSBURY
GOULBURN
LOWER_BORO
MAJORS_CREEK
MARULAN
MOUNT
TARALGA
POTTS
PROSPECT_DAM
RICHMOND
BRAIDWOOD
NERRIGA
CAMDEN
BUNDANOON
CATARACT_DAM
DAPTO
HELENSBURGH
KANGAROO_VALLEY
NOWRA
PICTON
ROBERTSON
HIGH_RANGE WOONONA
WORONORA_DAM
WARRAGAMBA
AVON_DAM
SYDNEY
35
30
25
20
15
10
5
0
-5
-10
-15
-20
-25
-30
-35
A2 Year 2070 - Summer
0
5
5
10
149.00 149.50 150.00 150.50 151.00 151.50Longitude
-36.00
-35.50
-35.00
-34.50
-34.00
-33.50
Latit
ude
KATOOMBA
GURNANG
OBERON
SUNNY
YERRANDERIE
LITHGOW
LEESTON
BANNABY
BRAIDWOOD
BUNGENDORE
BUNGONIA
CHATSBURY
GOULBURN
LOWER_BORO
MAJORS_CREEK
MARULAN
MOUNT
TARALGA
POTTS
PROSPECT_DAM
RICHMOND
BRAIDWOOD
NERRIGA
CAMDEN
BUNDANOON
CATARACT_DAM
DAPTO
HELENSBURGH
KANGAROO_VALLEY
NOWRA
PICTON
ROBERTSON
HIGH_RANGE WOONONA
WORONORA_DAM
WARRAGAMBA
AVON_DAM
SYDNEY
35
30
25
20
15
10
5
0
-5
-10
-15
-20
-25
-30
-35
B1 Year 2070
-5
-5
0
0
5
5
10
10
15
15
149.00 149.50 150.00 150.50 151.00 151.50Longitude
-36.00
-35.50
-35.00
-34.50
-34.00
-33.50
Latit
ude
KATOOMBA
GURNANG
OBERON
SUNNY
YERRANDERIE
LITHGOW
LEESTON
BANNABY
BRAIDWOOD
BUNGENDORE
BUNGONIA
CHATSBURY
GOULBURN
LOWER_BORO
MAJORS_CREEK
MARULAN
MOUNT
TARALGA
POTTS
PROSPECT_DAM
RICHMOND
BRAIDWOOD
NERRIGA
RIVERVIEW
MOSS_VALE
CAMDEN
BUNDANOON
CATARACT_DAM
DAPTO
HELENSBURGH
KANGAROO_VALLEY
NOWRA
PICTON
ROBERTSON
HIGH_RANGE WOONONA
WORONORA_DAM
WARRAGAMBA
AVON_DAM
SYDNEY
35
30
25
20
15
10
5
0
-5
-10
-15
-20
-25
-30
-35
A1B Year 2070
-15
-15
-10
-10
-5-5
0
149.00 149.50 150.00 150.50 151.00 151.50Longitude
-36.00
-35.50
-35.00
-34.50
-34.00
-33.50
Latit
ude
KATOOMBA
GURNANG
OBERON
SUNNY
YERRANDERIE
LITHGOW
LEESTON
BANNABY
BRAIDWOOD
BUNGENDORE
BUNGONIA
CHATSBURY
GOULBURN
LOWER_BORO
MAJORS_CREEK
MARULAN
MOUNT
TARALGA
POTTS
PROSPECT_DAM
RICHMOND
BRAIDWOOD
NERRIGA
RIVERVIEW
MOSS_VALE
CAMDEN
BUNDANOON
CATARACT_DAM
DAPTO
HELENSBURGH
KANGAROO_VALLEY
NOWRA
PICTON
ROBERTSON
HIGH_RANGE WOONONA
WORONORA_DAM
WARRAGAMBA
AVON_DAM
SYDNEY
35
30
25
20
15
10
5
0
-5
-10
-15
-20
-25
-30
-35
A2 Year 2070
-15
-15
-10
-10
-5
-5
0
0
5
5
149.00 149.50 150.00 150.50 151.00 151.50Longitude
-36.00
-35.50
-35.00
-34.50
-34.00
-33.50
Latit
ude
KATOOMBA
GURNANG
OBERON
SUNNY
YERRANDERIE
LITHGOW
LEESTON
BANNABY
BRAIDWOOD
BUNGENDORE
BUNGONIA
CHATSBURY
GOULBURN
LOWER_BORO
MAJORS_CREEK
MARULAN
MOUNT
TARALGA
POTTS
PROSPECT_DAM
RICHMOND
BRAIDWOOD
NERRIGA
RIVERVIEW
MOSS_VALE
CAMDEN
BUNDANOON
CATARACT_DAM
DAPTO
HELENSBURGH
KANGAROO_VALLEY
NOWRA
PICTON
ROBERTSON
HIGH_RANGE WOONONA
WORONORA_DAM
WARRAGAMBA
AVON_DAM
SYDNEY
35
30
25
20
15
10
5
0
-5
-10
-15
-20
-25
-30
-35
Figure A4.9: Best estimates (50th percentiles) of changes in seasonal and annual rainfall (%) for 2070 under the B1, A1B and A2 scenarios, relative to the current climate. Blue indicates a greater percentage increase in rainfall.

79 | Summary report
Table A4.5: Projected changes in seasonal and annual rainfall (mm) for 2030 and 2070 under the B1, A1B and A2 scenarios, relative to the current climate. Rainfall median estimates (ME) and best estimate (median) percent changes are given, with range of uncertainty (5th and 95th percentile values) in brackets.
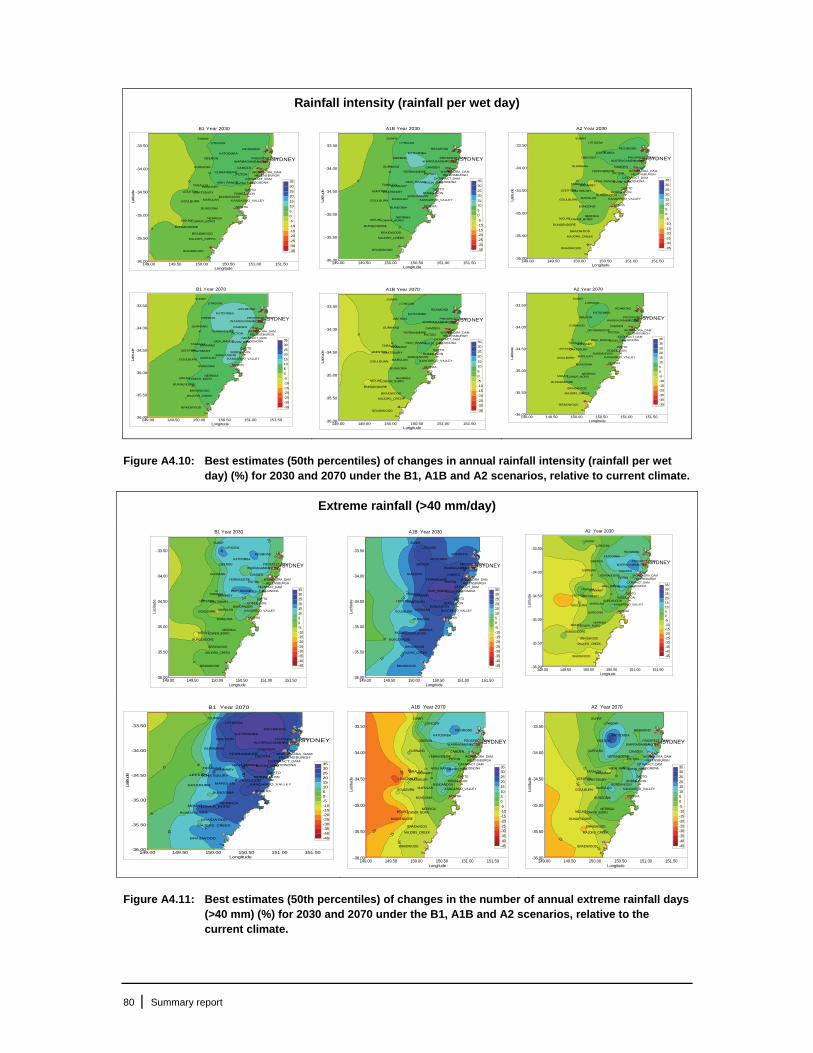
80 | Summary report
Rainfall intensity (rainfall per wet day)
B1 Year 2030
0
0
5
149.00 149.50 150.00 150.50 151.00 151.50Longitude
-36.00
-35.50
-35.00
-34.50
-34.00
-33.50
Latit
ude
KATOOMBA
GURNANG
OBERON
SUNNY
YERRANDERIE
LITHGOW
LEESTON
BANNABY
BRAIDWOOD
BUNGENDORE
BUNGONIA
CHATSBURY
GOULBURN
LOWER_BORO
MAJORS_CREEK
MARULAN
MOUNT
TARALGA
POTTS
PROSPECT_DAM
RICHMOND
BRAIDWOOD
NERRIGA
CAMDEN
BUNDANOON
CATARACT_DAM
DAPTO
HELENSBURGH
KANGAROO_VALLEY
NOWRA
PICTON
ROBERTSON
HIGH_RANGE WOONONA
WORONORA_DAM
WARRAGAMBA
AVON_DAM
SYDNEY
35
30
25
20
15
10
5
0
-5
-10
-15
-20
-25
-30
-35
A1B Year 2030
0
5
5
149.00 149.50 150.00 150.50 151.00 151.50Longitude
-36.00
-35.50
-35.00
-34.50
-34.00
-33.50
Latit
ude
KATOOMBA
GURNANG
OBERON
SUNNY
YERRANDERIE
LITHGOW
LEESTON
BANNABY
BRAIDWOOD
BUNGENDORE
BUNGONIA
CHATSBURY
GOULBURN
LOWER_BORO
MAJORS_CREEK
MARULAN
MOUNT
TARALGA
POTTS
PROSPECT_DAM
RICHMOND
BRAIDWOOD
NERRIGA
CAMDEN
BUNDANOON
CATARACT_DAM
DAPTO
HELENSBURGH
KANGAROO_VALLEY
NOWRA
PICTON
ROBERTSON
HIGH_RANGE WOONONA
WORONORA_DAM
WARRAGAMBA
AVON_DAM
SYDNEY
35
30
25
20
15
10
5
0
-5
-10
-15
-20
-25
-30
-35
A2 Year 2030
0
5
149.00 149.50 150.00 150.50 151.00 151.50Longitude
-36.00
-35.50
-35.00
-34.50
-34.00
-33.50
Latit
ude
KATOOMBA
GURNANG
OBERON
SUNNY
YERRANDERIE
LITHGOW
LEESTON
BANNABY
BRAIDWOOD
BUNGENDORE
BUNGONIA
CHATSBURY
GOULBURN
LOWER_BORO
MAJORS_CREEK
MARULAN
MOUNT
TARALGA
POTTS
PROSPECT_DAM
RICHMOND
BRAIDWOOD
NERRIGA
CAMDEN
BUNDANOON
CATARACT_DAM
DAPTO
HELENSBURGH
KANGAROO_VALLEY
NOWRA
PICTON
ROBERTSON
HIGH_RANGE WOONONA
WORONORA_DAM
WARRAGAMBA
AVON_DAM
SYDNEY
35
30
25
20
15
10
5
0
-5
-10
-15
-20
-25
-30
-35
B1 Year 2070
0
5
5
149.00 149.50 150.00 150.50 151.00 151.50Longitude
-36.00
-35.50
-35.00
-34.50
-34.00
-33.50
Latit
ude
KATOOMBA
GURNANG
OBERON
SUNNY
YERRANDERIE
LITHGOW
LEESTON
BANNABY
BRAIDWOOD
BUNGENDORE
BUNGONIA
CHATSBURY
GOULBURN
LOWER_BORO
MAJORS_CREEK
MARULAN
MOUNT
TARALGA
POTTS
PROSPECT_DAM
RICHMOND
BRAIDWOOD
NERRIGA
CAMDEN
BUNDANOON
CATARACT_DAM
DAPTO
HELENSBURGH
KANGAROO_VALLEY
NOWRA
PICTON
ROBERTSON
HIGH_RANGE WOONONA
WORONORA_DAM
WARRAGAMBA
AVON_DAM
SYDNEY
35
30
25
20
15
10
5
0
-5
-10
-15
-20
-25
-30
-35
A1B Year 2070
-5
0
0
149.00 149.50 150.00 150.50 151.00 151.50Longitude
-36.00
-35.50
-35.00
-34.50
-34.00
-33.50
Latit
ude
KATOOMBA
GURNANG
OBERON
SUNNY
YERRANDERIE
LITHGOW
LEESTON
BANNABY
BRAIDWOOD
BUNGENDORE
BUNGONIA
CHATSBURY
GOULBURN
LOWER_BORO
MAJORS_CREEK
MARULAN
MOUNT
TARALGA
POTTS
PROSPECT_DAM
RICHMOND
BRAIDWOOD
NERRIGA
CAMDEN
BUNDANOON
CATARACT_DAM
DAPTO
HELENSBURGH
KANGAROO_VALLEY
NOWRA
PICTON
ROBERTSON
HIGH_RANGE WOONONA
WORONORA_DAM
WARRAGAMBA
AVON_DAM
SYDNEY
35
30
25
20
15
10
5
0
-5
-10
-15
-20
-25
-30
-35
A2 Year 2070
0
0
149.00 149.50 150.00 150.50 151.00 151.50Longitude
-36.00
-35.50
-35.00
-34.50
-34.00
-33.50
Latit
ude
KATOOMBA
GURNANG
OBERON
SUNNY
YERRANDERIE
LITHGOW
LEESTON
BANNABY
BRAIDWOOD
BUNGENDORE
BUNGONIA
CHATSBURY
GOULBURN
LOWER_BORO
MAJORS_CREEK
MARULAN
MOUNT
TARALGA
POTTS
PROSPECT_DAM
RICHMOND
BRAIDWOOD
NERRIGA
CAMDEN
BUNDANOON
CATARACT_DAM
DAPTO
HELENSBURGH
KANGAROO_VALLEY
NOWRA
PICTON
ROBERTSON
HIGH_RANGE WOONONA
WORONORA_DAM
WARRAGAMBA
AVON_DAM
SYDNEY
35
30
25
20
15
10
5
0
-5
-10
-15
-20
-25
-30
-35
Figure A4.10: Best estimates (50th percentiles) of changes in annual rainfall intensity (rainfall per wet day) (%) for 2030 and 2070 under the B1, A1B and A2 scenarios, relative to current climate.
Extreme rainfall (>40 mm/day)
B1 Year 2030
0
0
510
10
149.00 149.50 150.00 150.50 151.00 151.50Longitude
-36.00
-35.50
-35.00
-34.50
-34.00
-33.50
Latit
ude
KATOOMBA
GURNANG
OBERON
SUNNY
YERRANDERIE
LITHGOW
LEESTON
BANNABY
BRAIDWOOD
BUNGENDORE
BUNGONIA
CHATSBURY
GOULBURN
LOWER_BORO
MAJORS_CREEK
MARULAN
MOUNT
TARALGA
POTTS
PROSPECT_DAM
RICHMOND
BRAIDWOOD
NERRIGA
CAMDEN
BUNDANOON
CATARACT_DAM
DAPTO
HELENSBURGH
KANGAROO_VALLEY
NOWRA
PICTON
ROBERTSON
HIGH_RANGE WOONONA
WORONORA_DAM
WARRAGAMBA
AVON_DAM
SYDNEY
35302520151050-5-10-15-20-25-30-35-40-45
A1B Year 2030
5
10
10
15
15
20
25
149.00 149.50 150.00 150.50 151.00 151.50Longitude
-36.00
-35.50
-35.00
-34.50
-34.00
-33.50
Latit
ude
KATOOMBA
GURNANG
OBERON
SUNNY
YERRANDERIE
LITHGOW
LEESTON
BANNABY
BRAIDWOOD
BUNGENDORE
BUNGONIA
CHATSBURY
GOULBURN
LOWER_BORO
MAJORS_CREEK
MARULAN
MOUNT
TARALGA
POTTS
PROSPECT_DAM
RICHMOND
BRAIDWOOD
NERRIGA
CAMDEN
BUNDANOON
CATARACT_DAM
DAPTO
HELENSBURGH
KANGAROO_VALLEY
NOWRA
PICTON
ROBERTSON
HIGH_RANGE WOONONA
WORONORA_DAM
WARRAGAMBA
AVON_DAM
SYDNEY
35302520151050-5-10-15-20-25-30-35-40-45
A2 Year 2030
-10
-5
0
5
149.00 149.50 150.00 150.50 151.00 151.50Longitude
-36.00
-35.50
-35.00
-34.50
-34.00
-33.50
Latit
ude
KATOOMBA
GURNANG
OBERON
SUNNY
YERRANDERIE
LITHGOW
LEESTON
BANNABY
BRAIDWOOD
BUNGENDORE
BUNGONIA
CHATSBURY
GOULBURN
LOWER_BORO
MAJORS_CREEK
MARULAN
MOUNT
TARALGA
POTTS
PROSPECT_DAM
RICHMOND
BRAIDWOOD
NERRIGA
CAMDEN
BUNDANOON
CATARACT_DAM
DAPTO
HELENSBURGH
KANGAROO_VALLEY
NOWRA
PICTON
ROBERTSON
HIGH_RANGE WOONONA
WORONORA_DAM
WARRAGAMBA
AVON_DAM
SYDNEY
35302520151050-5-10-15-20-25-30-35-40-45
B1 Year 2070
0
5
5
10
10
15
15
2025
149.00 149.50 150.00 150.50 151.00 151.50Longitude
-36.00
-35.50
-35.00
-34.50
-34.00
-33.50
Latit
ude
KATOOMBA
GURNANG
OBERON
SUNNY
YERRANDERIE
LITHGOW
LEESTON
BANNABY
BRAIDWOOD
BUNGENDORE
BUNGONIA
CHATSBURY
GOULBURN
LOWER_BORO
MAJORS_CREEK
MARULAN
MOUNT
TARALGA
POTTS
PROSPECT_DAM
RICHMOND
BRAIDWOOD
NERRIGA
CAMDEN
BUNDANOON
CATARACT_DAM
DAPTO
HELENSBURGH
KANGAROO_VALLEY
NOWRA
PICTON
ROBERTSON
HIGH_RANGE WOONONA
WORONORA_DAM
WARRAGAMBA
AVON_DAM
SYDNEY
35302520151050-5-10-15-20-25-30-35-40-45
A1B Year 2070
-20
-20
-15
-15
-10
-10
-5
0
149.00 149.50 150.00 150.50 151.00 151.50Longitude
-36.00
-35.50
-35.00
-34.50
-34.00
-33.50
Latit
ude
KATOOMBA
GURNANG
OBERON
SUNNY
YERRANDERIE
LITHGOW
LEESTON
BANNABY
BRAIDWOOD
BUNGENDORE
BUNGONIA
CHATSBURY
GOULBURN
LOWER_BORO
MAJORS_CREEK
MARULAN
MOUNT
TARALGA
POTTS
PROSPECT_DAM
RICHMOND
BRAIDWOOD
NERRIGA
CAMDEN
BUNDANOON
CATARACT_DAM
DAPTO
HELENSBURGH
KANGAROO_VALLEY
NOWRA
PICTON
ROBERTSON
HIGH_RANGE WOONONA
WORONORA_DAM
WARRAGAMBA
AVON_DAM
SYDNEY
35302520151050-5-10-15-20-25-30-35-40-45
A2 Year 2070
-15
-10
-10
-5
-5
0
5
149.00 149.50 150.00 150.50 151.00 151.50Longitude
-36.00
-35.50
-35.00
-34.50
-34.00
-33.50
Latit
ude
KATOOMBA
GURNANG
OBERON
SUNNY
YERRANDERIE
LITHGOW
LEESTON
BANNABY
BRAIDWOOD
BUNGENDORE
BUNGONIA
CHATSBURY
GOULBURN
LOWER_BORO
MAJORS_CREEK
MARULAN
MOUNT
TARALGA
POTTS
PROSPECT_DAM
RICHMOND
BRAIDWOOD
NERRIGA
CAMDEN
BUNDANOON
CATARACT_DAM
DAPTO
HELENSBURGH
KANGAROO_VALLEY
NOWRA
PICTON
ROBERTSON
HIGH_RANGE WOONONA
WORONORA_DAM
WARRAGAMBA
AVON_DAM
SYDNEY
35302520151050-5-10-15-20-25-30-35-40-45
Figure A4.11: Best estimates (50th percentiles) of changes in the number of annual extreme rainfall days (>40 mm) (%) for 2030 and 2070 under the B1, A1B and A2 scenarios, relative to the current climate.
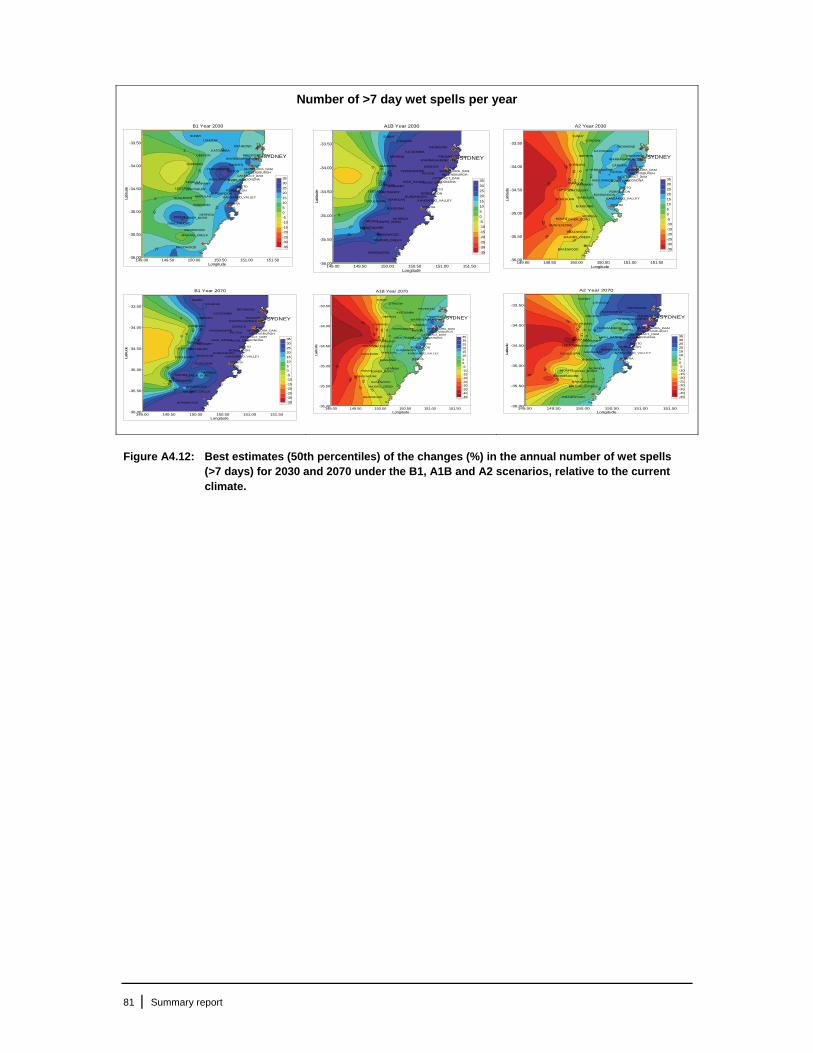
81 | Summary report
Number of >7 day wet spells per year
B1 Year 2030
5
510
10
15
15
15
149.00 149.50 150.00 150.50 151.00 151.50Longitude
-36.00
-35.50
-35.00
-34.50
-34.00
-33.50
Latit
ude
KATOOMBA
GURNANG
OBERON
SUNNY
YERRANDERIE
LITHGOW
LEESTON
BANNABY
BRAIDWOOD
BUNGENDORE
BUNGONIA
CHATSBURY
GOULBURN
LOWER_BORO
MAJORS_CREEK
MARULAN
MOUNT
TARALGA
POTTS
PROSPECT_DAM
RICHMOND
BRAIDWOOD
NERRIGA
CAMDEN
BUNDANOON
CATARACT_DAM
DAPTO
HELENSBURGH
KANGAROO_VALLEY
NOWRA
PICTON
ROBERTSON
HIGH_RANGE WOONONA
WORONORA_DAM
WARRAGAMBA
AVON_DAM
SYDNEY
35
30
25
20
15
10
5
0
-5
-10
-15
-20
-25
-30
-35
A1B Year 2030
-5
05
5
1015
15
20
20
25
25
30
30
149.00 149.50 150.00 150.50 151.00 151.50Longitude
-36.00
-35.50
-35.00
-34.50
-34.00
-33.50
Latit
ude
KATOOMBA
GURNANG
OBERON
SUNNY
YERRANDERIE
LITHGOW
LEESTON
BANNABY
BRAIDWOOD
BUNGENDORE
BUNGONIA
CHATSBURY
GOULBURN
LOWER_BORO
MAJORS_CREEK
MARULAN
MOUNT
TARALGA
POTTS
PROSPECT_DAM
RICHMOND
BRAIDWOOD
NERRIGA
CAMDEN
BUNDANOON
CATARACT_DAM
DAPTO
HELENSBURGH
KANGAROO_VALLEY
NOWRA
PICTON
ROBERTSON
HIGH_RANGE WOONONA
WORONORA_DAM
WARRAGAMBA
AVON_DAM
SYDNEY
35
30
25
20
15
10
5
0
-5
-10
-15
-20
-25
-30
-35
A2 Year 2030
-30
-25
-25
-20
-20
-15
-15
-10
-10
-5
-5
0
510
15
149.00 149.50 150.00 150.50 151.00 151.50Longitude
-36.00
-35.50
-35.00
-34.50
-34.00
-33.50
Latit
ude
KATOOMBA
GURNANG
OBERON
SUNNY
YERRANDERIE
LITHGOW
LEESTON
BANNABY
BRAIDWOOD
BUNGENDORE
BUNGONIA
CHATSBURY
GOULBURN
LOWER_BORO
MAJORS_CREEK
MARULAN
MOUNT
TARALGA
POTTS
PROSPECT_DAM
RICHMOND
BRAIDWOOD
NERRIGA
CAMDEN
BUNDANOON
CATARACT_DAM
DAPTO
HELENSBURGH
KANGAROO_VALLEY
NOWRA
PICTON
ROBERTSON
HIGH_RANGE WOONONA
WORONORA_DAM
WARRAGAMBA
AVON_DAM
SYDNEY
35
30
25
20
15
10
5
0
-5
-10
-15
-20
-25
-30
-35
B1 Year 2070
-5
0
0
5
5
10
10
15
15
20
20
25
25
30
30
149.00 149.50 150.00 150.50 151.00 151.50Longitude
-36.00
-35.50
-35.00
-34.50
-34.00
-33.50
Latit
ude
KATOOMBA
GURNANG
OBERON
SUNNY
YERRANDERIE
LITHGOW
LEESTON
BANNABY
BRAIDWOOD
BUNGENDORE
BUNGONIA
CHATSBURY
GOULBURN
LOWER_BORO
MAJORS_CREEK
MARULAN
MOUNT
TARALGA
POTTS
PROSPECT_DAM
RICHMOND
BRAIDWOOD
NERRIGA
CAMDEN
BUNDANOON
CATARACT_DAM
DAPTO
HELENSBURGH
KANGAROO_VALLEY
NOWRA
PICTON
ROBERTSON
HIGH_RANGE WOONONA
WORONORA_DAM
WARRAGAMBA
AVON_DAM
SYDNEY
35
30
25
20
15
10
5
0
-5
-10
-15
-20
-25
-30
-35
A1B Year 2070
-35
-35
-30
-30
-25
-25
-20
-20
-15
-15
-10
-10
-5
-5
0
05
10
149.00 149.50 150.00 150.50 151.00 151.50Longitude
-36.00
-35.50
-35.00
-34.50
-34.00
-33.50
Latit
ude
KATOOMBA
GURNANG
OBERON
SUNNY
YERRANDERIE
LITHGOW
LEESTON
BANNABY
BRAIDWOOD
BUNGENDORE
BUNGONIA
CHATSBURY
GOULBURN
LOWER_BORO
MAJORS_CREEK
MARULAN
MOUNT
TARALGA
POTTS
PROSPECT_DAM
RICHMOND
BRAIDWOOD
NERRIGA
CAMDEN
BUNDANOON
CATARACT_DAM
DAPTO
HELENSBURGH
KANGAROO_VALLEY
NOWRA
PICTON
ROBERTSON
HIGH_RANGE WOONONA
WORONORA_DAM
WARRAGAMBA
AVON_DAM
SYDNEY
35302520151050-5-10-15-20-25-30-35-40-45
A2 Year 2070
-35-30
-30
-25
-25
-20
-20
-15
-15
-10
-10
-5
-5
00
5
5
10
10
15
20
25
149.00 149.50 150.00 150.50 151.00 151.50Longitude
-36.00
-35.50
-35.00
-34.50
-34.00
-33.50
Latit
ude
KATOOMBA
GURNANG
OBERON
SUNNY
YERRANDERIE
LITHGOW
LEESTON
BANNABY
BRAIDWOOD
BUNGENDORE
BUNGONIA
CHATSBURY
GOULBURN
LOWER_BORO
MAJORS_CREEK
MARULAN
MOUNT
TARALGA
POTTS
PROSPECT_DAM
RICHMOND
BRAIDWOOD
NERRIGA
CAMDEN
BUNDANOON
CATARACT_DAM
DAPTO
HELENSBURGH
KANGAROO_VALLEY
NOWRA
PICTON
ROBERTSON
HIGH_RANGE WOONONA
WORONORA_DAM
WARRAGAMBA
AVON_DAM
SYDNEY
35302520151050-5-10-15-20-25-30-35-40-45
Figure A4.12: Best estimates (50th percentiles) of the changes (%) in the annual number of wet spells (>7 days) for 2030 and 2070 under the B1, A1B and A2 scenarios, relative to the current climate.

82
| S
um
ma
ry r
epor
t
Ta
ble
A4
.6:
P
roje
cte
d i
n n
um
ber
of
wet
sp
ells
(>
7 d
ays)
an
d t
he
ra
infa
ll a
mo
un
t in
th
em
fo
r 2
030
an
d 2
070
un
der
em
iss
ion
sc
en
ario
s, B
1,
A1
B a
nd
A2
. B
est
est
imat
e
(med
ian
) p
erc
ent
ch
an
ges
in
bo
th t
he
nu
mb
er
of
day
s an
d r
ain
fall
to
tals
are
giv
en
, wit
h r
ang
e o
f u
nce
rtai
nty
(5t
h a
nd
95t
h p
erce
nti
le v
alu
es)
in b
rack
ets
.

83 | Summary report
Annual rainfall in >7 day wet spells
B1 Year 2030
0
5
5
149.00 149.50 150.00 150.50 151.00 151.50Longitude
-36.00
-35.50
-35.00
-34.50
-34.00
-33.50
Latit
ude
KATOOMBA
GURNANG
OBERON
SUNNY
YERRANDERIE
LITHGOW
LEESTON
BANNABY
BRAIDWOOD
BUNGENDORE
BUNGONIA
CHATSBURY
GOULBURN
LOWER_BORO
MAJORS_CREEK
MARULAN
MOUNT
TARALGA
POTTS
PROSPECT_DAM
RICHMOND
BRAIDWOOD
NERRIGA
CAMDEN
BUNDANOON
CATARACT_DAM
DAPTO
HELENSBURGH
KANGAROO_VALLEY
NOWRA
PICTON
ROBERTSON
HIGH_RANGE WOONONA
WORONORA_DAM
WARRAGAMBA
AVON_DAM
SYDNEY
35302520151050-5-10-15-20-25-30-35-40-45
A1B Year 2030
0
5
5
1010
149.00 149.50 150.00 150.50 151.00 151.50Longitude
-36.00
-35.50
-35.00
-34.50
-34.00
-33.50
Latit
ude
KATOOMBA
GURNANG
OBERON
SUNNY
YERRANDERIE
LITHGOW
LEESTON
BANNABY
BRAIDWOOD
BUNGENDORE
BUNGONIA
CHATSBURY
GOULBURN
LOWER_BORO
MAJORS_CREEK
MARULAN
MOUNT
TARALGA
POTTS
PROSPECT_DAM
RICHMOND
BRAIDWOOD
NERRIGA
CAMDEN
BUNDANOON
CATARACT_DAM
DAPTO
HELENSBURGH
KANGAROO_VALLEY
NOWRA
PICTON
ROBERTSON
HIGH_RANGE WOONONA
WORONORA_DAM
WARRAGAMBA
AVON_DAM
SYDNEY
35302520151050-5-10-15-20-25-30-35-40-45
A2 Year 2030
-5
0
5
149.00 149.50 150.00 150.50 151.00 151.50Longitude
-36.00
-35.50
-35.00
-34.50
-34.00
-33.50
Latit
ude
KATOOMBA
GURNANG
OBERON
SUNNY
YERRANDERIE
LITHGOW
LEESTON
BANNABY
BRAIDWOOD
BUNGENDORE
BUNGONIA
CHATSBURY
GOULBURN
LOWER_BORO
MAJORS_CREEK
MARULAN
MOUNT
TARALGA
POTTS
PROSPECT_DAM
RICHMOND
BRAIDWOOD
NERRIGA
CAMDEN
BUNDANOON
CATARACT_DAM
DAPTO
HELENSBURGH
KANGAROO_VALLEY
NOWRA
PICTON
ROBERTSON
HIGH_RANGE WOONONA
WORONORA_DAM
WARRAGAMBA
AVON_DAM
SYDNEY
35302520151050-5-10-15-20-25-30-35-40-45
B1 Year 2070
5
5
10
149.00 149.50 150.00 150.50 151.00 151.50Longitude
-36.00
-35.50
-35.00
-34.50
-34.00
-33.50
Latit
ude
KATOOMBA
GURNANG
OBERON
SUNNY
YERRANDERIE
LITHGOW
LEESTON
BANNABY
BRAIDWOOD
BUNGENDORE
BUNGONIA
CHATSBURY
GOULBURN
LOWER_BORO
MAJORS_CREEK
MARULAN
MOUNT
TARALGA
POTTS
PROSPECT_DAM
RICHMOND
BRAIDWOOD
NERRIGA
CAMDEN
BUNDANOON
CATARACT_DAM
DAPTO
HELENSBURGH
KANGAROO_VALLEY
NOWRA
PICTON
ROBERTSON
HIGH_RANGE WOONONA
WORONORA_DAM
WARRAGAMBA
AVON_DAM
SYDNEY
35302520151050-5-10-15-20-25-30-35-40-45
A1B Year 2070
-15-10
-5
-5
0
5
149.00 149.50 150.00 150.50 151.00 151.50Longitude
-36.00
-35.50
-35.00
-34.50
-34.00
-33.50
Latit
ude
KATOOMBA
GURNANG
OBERON
SUNNY
YERRANDERIE
LITHGOW
LEESTON
BANNABY
BRAIDWOOD
BUNGENDORE
BUNGONIA
CHATSBURY
GOULBURN
LOWER_BORO
MAJORS_CREEK
MARULAN
MOUNT
TARALGA
POTTS
PROSPECT_DAM
RICHMOND
BRAIDWOOD
NERRIGA
CAMDEN
BUNDANOON
CATARACT_DAM
DAPTO
HELENSBURGH
KANGAROO_VALLEY
NOWRA
PICTON
ROBERTSON
HIGH_RANGE WOONONA
WORONORA_DAM
WARRAGAMBA
AVON_DAM
SYDNEY
35302520151050-5-10-15-20-25-30-35-40-45
A2 Year 2070
-5
0
0
149.00 149.50 150.00 150.50 151.00 151.50Longitude
-36.00
-35.50
-35.00
-34.50
-34.00
-33.50
Latit
ude
KATOOMBA
GURNANG
OBERON
SUNNY
YERRANDERIE
LITHGOW
LEESTON
BANNABY
BRAIDWOOD
BUNGENDORE
BUNGONIA
CHATSBURY
GOULBURN
LOWER_BORO
MAJORS_CREEK
MARULAN
MOUNT
TARALGA
POTTS
PROSPECT_DAM
RICHMOND
BRAIDWOOD
NERRIGA
CAMDEN
BUNDANOON
CATARACT_DAM
DAPTO
HELENSBURGH
KANGAROO_VALLEY
NOWRA
PICTON
ROBERTSON
HIGH_RANGE WOONONA
WORONORA_DAM
WARRAGAMBA
AVON_DAM
SYDNEY
35302520151050-5-10-15-20-25-30-35-40-45
Figure A4.13: Best estimates (50th percentiles) of changes in annual the total rainfall amount in wet spells of >7 days (%) for 2030 and 2070 under the B1, A1B and A2 scenarios, relative to the current climate.

84 | Summary report
Dry spells (>14 days) in a year
y p y ( y ) ( )B1 Year 2030
-5
0
55
5
10
10
1015
149.00 149.50 150.00 150.50 151.00 151.50Longitude
-36.00
-35.50
-35.00
-34.50
-34.00
-33.50
Latit
ude
KATOOMBA
GURNANG
OBERON
SUNNY
YERRANDERIE
LITHGOW
LEESTON
BANNABY
BRAIDWOOD
BUNGENDORE
BUNGONIA
CHATSBURY
GOULBURN
LOWER_BORO
MAJORS_CREEK
MARULAN
MOUNT
TARALGA
POTTS
PROSPECT_DAM
RICHMOND
BRAIDWOOD
NERRIGA
CAMDEN
BUNDANOON
CATARACT_DAM
DAPTO
HELENSBURGH
KANGAROO_VALLEY
NOWRA
PICTON
ROBERTSON
HIGH_RANGE WOONONA
WORONORA_DAM
WARRAGAMBA
AVON_DAM
SYDNEY
35302520151050-5-10-15-20-25-30-35-40-45
A1B Year 2030
-5
-5
-5
0
0
0 5
149.00 149.50 150.00 150.50 151.00 151.50Longitude
-36.00
-35.50
-35.00
-34.50
-34.00
-33.50
Latit
ude
KATOOMBA
GURNANG
OBERON
SUNNY
YERRANDERIE
LITHGOW
LEESTON
BANNABY
BRAIDWOOD
BUNGENDORE
BUNGONIA
CHATSBURY
GOULBURN
LOWER_BORO
MAJORS_CREEK
MARULAN
MOUNT
TARALGA
POTTS
PROSPECT_DAM
RICHMOND
BRAIDWOOD
NERRIGA
CAMDEN
BUNDANOON
CATARACT_DAM
DAPTO
HELENSBURGH
KANGAROO_VALLEY
NOWRA
PICTON
ROBERTSON
HIGH_RANGE WOONONA
WORONORA_DAM
WARRAGAMBA
AVON_DAM
SYDNEY
35302520151050-5-10-15-20-25-30-35-40-45
A2 Year 2030
20
25
25
25
30
149.00 149.50 150.00 150.50 151.00 151.50Longitude
-36.00
-35.50
-35.00
-34.50
-34.00
-33.50
Latit
ude
KATOOMBA
GURNANG
OBERON
SUNNY
YERRANDERIE
LITHGOW
LEESTON
BANNABY
BRAIDWOOD
BUNGENDORE
BUNGONIA
CHATSBURY
GOULBURN
LOWER_BORO
MAJORS_CREEK
MARULAN
MOUNT
TARALGA
POTTS
PROSPECT_DAM
RICHMOND
BRAIDWOOD
NERRIGA
CAMDEN
BUNDANOON
CATARACT_DAM
DAPTO
HELENSBURGH
KANGAROO_VALLEY
NOWRA
PICTON
ROBERTSON
HIGH_RANGE WOONONA
WORONORA_DAM
WARRAGAMBA
AVON_DAM
SYDNEY
35302520151050-5-10-15-20-25-30-35-40-45
B1 Year 2070
5
5
5
10
10
10
149.00 149.50 150.00 150.50 151.00 151.50Longitude
-36.00
-35.50
-35.00
-34.50
-34.00
-33.50
Latit
ude
KATOOMBA
GURNANG
OBERON
SUNNY
YERRANDERIE
LITHGOW
LEESTON
BANNABY
BRAIDWOOD
BUNGENDORE
BUNGONIA
CHATSBURY
GOULBURN
LOWER_BORO
MAJORS_CREEK
MARULAN
MOUNT
TARALGA
POTTS
PROSPECT_DAM
RICHMOND
BRAIDWOOD
NERRIGA
CAMDEN
BUNDANOON
CATARACT_DAM
DAPTO
HELENSBURGH
KANGAROO_VALLEY
NOWRA
PICTON
ROBERTSON
HIGH_RANGE WOONONA
WORONORA_DAM
WARRAGAMBA
AVON_DAM
SYDNEY
35302520151050-5-10-15-20-25-30-35-40-45
A1B Year 2070
25
25
30
30
149.00 149.50 150.00 150.50 151.00 151.50Longitude
-36.00
-35.50
-35.00
-34.50
-34.00
-33.50
Latit
ude
KATOOMBA
GURNANG
OBERON
SUNNY
YERRANDERIE
LITHGOW
LEESTON
BANNABY
BRAIDWOOD
BUNGENDORE
BUNGONIA
CHATSBURY
GOULBURN
LOWER_BORO
MAJORS_CREEK
MARULAN
MOUNT
TARALGA
POTTS
PROSPECT_DAM
RICHMOND
BRAIDWOOD
NERRIGA
CAMDEN
BUNDANOON
CATARACT_DAM
DAPTO
HELENSBURGH
KANGAROO_VALLEY
NOWRA
PICTON
ROBERTSON
HIGH_RANGE WOONONA
WORONORA_DAM
WARRAGAMBA
AVON_DAM
SYDNEY
35302520151050-5-10-15-20-25-30-35-40-45
A2 Year 2070
-5
-5
-5
-5
05
149.00 149.50 150.00 150.50 151.00 151.50Longitude
-36.00
-35.50
-35.00
-34.50
-34.00
-33.50
Latit
ude
KATOOMBA
GURNANG
OBERON
SUNNY
YERRANDERIE
LITHGOW
LEESTON
BANNABY
BRAIDWOOD
BUNGENDORE
BUNGONIA
CHATSBURY
GOULBURN
LOWER_BORO
MAJORS_CREEK
MARULAN
MOUNT
TARALGA
POTTS
PROSPECT_DAM
RICHMOND
BRAIDWOOD
NERRIGA
CAMDEN
BUNDANOON
CATARACT_DAM
DAPTO
HELENSBURGH
KANGAROO_VALLEY
NOWRA
PICTON
ROBERTSON
HIGH_RANGE WOONONA
WORONORA_DAM
WARRAGAMBA
AVON_DAM
SYDNEY
35302520151050-5-10-15-20-25-30-35-40-45
Figure A4.14: Best estimates (50th percentiles) of changes in the annual number of dry spells (>14 days) (%) for 2030 and 2070 under the B1, A1B and A2 scenarios, relative to the current climate.

85 | Summary report
Evaporation
Pan evaporation – 2030
B1 Year 2030 - Autumn
149.00 149.50 150.00 150.50 151.00 151.50Longitude
-36.00
-35.50
-35.00
-34.50
-34.00
-33.50
Latit
ude
BATHURST
PROSPECT_DAM
RICHMOND
CANBERRA
GOULBURN
WORONORA
WARRAGAMBA
NEPEAN_DAM
WINGECARRIBEE_DAM
BENDEELA
SYDNEY
2624
22
2018
16
1412
10
86
4
20
-2-4
A1B Year 2030 - Autumn
149.00 149.50 150.00 150.50 151.00 151.50Longitude
-36.00
-35.50
-35.00
-34.50
-34.00
-33.50
Latit
ude
BATHURST
PROSPECT_DAM
RICHMOND
CANBERRA
GOULBURN
WORONORA
WARRAGAMBA
NEPEAN_DAM
WINGECARRIBEE_DAM
BENDEELA
SYDNEY
26
24
22
20
18
16
14
12
10
8
6
4
2
0
-2
-4
A2 Year 2030 - Autumn
149.00 149.50 150.00 150.50 151.00 151.50Longitude
-36.00
-35.50
-35.00
-34.50
-34.00
-33.50
Latit
ude
BATHURST
PROSPECT_DAM
RICHMOND
CANBERRA
GOULBURN
WORONORA
WARRAGAMBA
NEPEAN_DAM
WINGECARRIBEE_DAM
BENDEELA
SYDNEY
26
2422
20
1816
1412
10
86
42
0-2
-4
B1 Year 2030 - Winter
0
149.00 149.50 150.00 150.50 151.00 151.50Longitude
-36.00
-35.50
-35.00
-34.50
-34.00
-33.50
Latit
ude
BATHURST
PROSPECT_DAM
RICHMOND
CANBERRA
GOULBURN
WORONORA
WARRAGAMBA
NEPEAN_DAM
WINGECARRIBEE_DAM
BENDEELA
SYDNEY
26
24222018
161412108
6420-2
-4
A1B Year 2030 - Winter
0
0
149.00 149.50 150.00 150.50 151.00 151.50Longitude
-36.00
-35.50
-35.00
-34.50
-34.00
-33.50La
titud
e
BATHURST
PROSPECT_DAM
RICHMOND
CANBERRA
GOULBURN
WORONORA
WARRAGAMBA
NEPEAN_DAM
WINGECARRIBEE_DAM
BENDEELA
SYDNEY
26
24
22
20
18
16
14
12
10
8
6
4
2
0
-2
-4
A2 Year 2030 - Winter
2
2
149.00 149.50 150.00 150.50 151.00 151.50Longitude
-36.00
-35.50
-35.00
-34.50
-34.00
-33.50
Latit
ude
BATHURST
PROSPECT_DAM
RICHMOND
CANBERRA
GOULBURN
WORONORA
WARRAGAMBA
NEPEAN_DAM
WINGECARRIBEE_DAM
BENDEELA
SYDNEY
26
242220
181614
12108
6420
-2-4
B1 Year 2030 - Spring
4
4
149.00 149.50 150.00 150.50 151.00 151.50Longitude
-36.00
-35.50
-35.00
-34.50
-34.00
-33.50
Latit
ude
BATHURST
PROSPECT_DAM
RICHMOND
CANBERRA
GOULBURN
WORONORA
WARRAGAMBA
NEPEAN_DAM
WINGECARRIBEE_DAM
BENDEELA
SYDNEY
2624
22
2018
16
14
1210
8
64
2
0
-2-4
A1B Year 2030 - Spring
2
2
149.00 149.50 150.00 150.50 151.00 151.50Longitude
-36.00
-35.50
-35.00
-34.50
-34.00
-33.50
Latit
ude
BATHURST
PROSPECT_DAM
RICHMOND
CANBERRA
GOULBURN
WORONORA
WARRAGAMBA
NEPEAN_DAM
WINGECARRIBEE_DAM
BENDEELA
SYDNEY
26
2422
20
1816
14
1210
8
64
2
0-2
-4
A2 Year 2030 - Spring
4
6
6
149.00 149.50 150.00 150.50 151.00 151.50Longitude
-36.00
-35.50
-35.00
-34.50
-34.00
-33.50
Latit
ude
BATHURST
PROSPECT_DAM
RICHMOND
CANBERRA
GOULBURN
WORONORA
WARRAGAMBA
NEPEAN_DAM
WINGECARRIBEE_DAM
BENDEELA
SYDNEY
26
2422
2018
1614
1210
864
20
-2-4
B1 Year 2030 - Summer
149.00 149.50 150.00 150.50 151.00 151.50Longitude
-36.00
-35.50
-35.00
-34.50
-34.00
-33.50
Latit
ude
BATHURST
PROSPECT_DAM
RICHMOND
CANBERRA
GOULBURN
WORONORA
WARRAGAMBA
NEPEAN_DAM
WINGECARRIBEE_DAM
BENDEELA
SYDNEY
26
24
22
20
18
16
14
12
10
8
6
4
2
0
-2
-4
A1B Year 2030 - Summer
149.00 149.50 150.00 150.50 151.00 151.50Longitude
-36.00
-35.50
-35.00
-34.50
-34.00
-33.50
Latit
ude
BATHURST
PROSPECT_DAM
RICHMOND
CANBERRA
GOULBURN
WORONORA
WARRAGAMBA
NEPEAN_DAM
WINGECARRIBEE_DAM
BENDEELA
SYDNEY
262422
201816
141210
864
20
-2-4
A2 Year 2030 - Summer
4
149.00 149.50 150.00 150.50 151.00 151.50Longitude
-36.00
-35.50
-35.00
-34.50
-34.00
-33.50
Latit
ude
BATHURST
PROSPECT_DAM
RICHMOND
CANBERRA
GOULBURN
WORONORA
WARRAGAMBA
NEPEAN_DAM
WINGECARRIBEE_DAM
BENDEELA
SYDNEY
2624
2220
18
1614
1210
8
64
20
-2-4
B1 Year 20302
149.00 149.50 150.00 150.50 151.00 151.50Longitude
-36.00
-35.50
-35.00
-34.50
-34.00
-33.50
Latit
ude
BATHURST
PROSPECT_DAM
RICHMOND
CANBERRA
GOULBURN
WORONORA
WARRAGAMBA
NEPEAN_DAM
WINGECARRIBEE_DAM
BENDEELA
SYDNEY
2624
2220
1816
1412
1086
42
0-2
-4
A1B Year 2030
149.00 149.50 150.00 150.50 151.00 151.50Longitude
-36.00
-35.50
-35.00
-34.50
-34.00
-33.50
Latit
ude
BATHURST
PROSPECT_DAM
RICHMOND
CANBERRA
GOULBURN
WORONORA
WARRAGAMBA
NEPEAN_DAM
WINGECARRIBEE_DAM
BENDEELA
SYDNEY
26
2422
2018
1614
12
108
64
20
-2-4
A2 Year 2030
4
4
149.00 149.50 150.00 150.50 151.00 151.50Longitude
-36.00
-35.50
-35.00
-34.50
-34.00
-33.50
Latit
ude
BATHURST
PROSPECT_DAM
RICHMOND
CANBERRA
GOULBURN
WORONORA
WARRAGAMBA
NEPEAN_DAM
WINGECARRIBEE_DAM
BENDEELA
SYDNEY
26
2422
20
18
16
14
12
10
86
4
2
0
-2
-4
Figure A4.15: Best estimates (50th percentiles) of changes in seasonal and annual pan evaporation (%) for 2030 under the B1, A1B and A2 scenarios, relative to the current climate.

86 | Summary report
Pan evaporation - 2070
B1 Year 2070 - Autumn
4
149.00 149.50 150.00 150.50 151.00 151.50Longitude
-36.00
-35.50
-35.00
-34.50
-34.00
-33.50
Latit
ude
BATHURST
PROSPECT_DAM
RICHMOND
CANBERRA
GOULBURN
WORONORA
WARRAGAMBA
NEPEAN_DAM
WINGECARRIBEE_DAM
BENDEELA
SYDNEY
26
24
22
20
18
16
14
12
10
8
6
4
2
0
-2
-4
A1B Year 2070 - Autumn
10
12
12
14
14
149.00 149.50 150.00 150.50 151.00 151.50Longitude
-36.00
-35.50
-35.00
-34.50
-34.00
-33.50
Latit
ude
BATHURST
PROSPECT_DAM
RICHMOND
CANBERRA
GOULBURN
WORONORA
WARRAGAMBA
NEPEAN_DAM
WINGECARRIBEE_DAM
BENDEELA
SYDNEY
26
2422
2018
16
1412
108
64
2
0-2
-4
A2 Year 2070 - Autumn
10
12
14
14
149.00 149.50 150.00 150.50 151.00 151.50Longitude
-36.00
-35.50
-35.00
-34.50
-34.00
-33.50
Latit
ude
BATHURST
PROSPECT_DAM
RICHMOND
CANBERRA
GOULBURN
WORONORA
WARRAGAMBA
NEPEAN_DAM
WINGECARRIBEE_DAM
BENDEELA
SYDNEY
26
24
22
20
1816
14
12
10
8
6
42
0
-2
-4
B1 Year 2070 - Winter
2
4
4
149.00 149.50 150.00 150.50 151.00 151.50Longitude
-36.00
-35.50
-35.00
-34.50
-34.00
-33.50
Latit
ude
BATHURST
PROSPECT_DAM
RICHMOND
CANBERRA
GOULBURN
WORONORA
WARRAGAMBA
NEPEAN_DAM
WINGECARRIBEE_DAM
BENDEELA
SYDNEY
2624
22
20
1816
14
12
108
6
4
20
-2
-4
A1B Year 2070 - Winter
3
5
7
9
9
149.00 149.50 150.00 150.50 151.00 151.50Longitude
-36.00
-35.50
-35.00
-34.50
-34.00
-33.50
Latit
ude
BATHURST
PROSPECT_DAM
RICHMOND
CANBERRA
GOULBURN
WORONORA
WARRAGAMBA
NEPEAN_DAM
WINGECARRIBEE_DAM
BENDEELA
SYDNEY
26
151412
975320
-4
A2 Year 2070 - Winter
4
6
8
8
8
149.00 149.50 150.00 150.50 151.00 151.50Longitude
-36.00
-35.50
-35.00
-34.50
-34.00
-33.50
Latit
ude
BATHURST
PROSPECT_DAM
RICHMOND
CANBERRA
GOULBURN
WORONORA
WARRAGAMBA
NEPEAN_DAM
WINGECARRIBEE_DAM
BENDEELA
SYDNEY
26
24
22
20
18
1614
12
10
8
6
4
2
0
-2
-4
B1 Year 2070 - Spring
6
8
8
8
149.00 149.50 150.00 150.50 151.00 151.50Longitude
-36.00
-35.50
-35.00
-34.50
-34.00
-33.50
Latit
ude
BATHURST
PROSPECT_DAM
RICHMOND
CANBERRA
GOULBURN
WORONORA
WARRAGAMBA
NEPEAN_DAM
WINGECARRIBEE_DAM
BENDEELA
SYDNEY
26
24
22
20
18
16
14
12
10
8
6
4
2
0
-2
-4
A1B Year 2070 - Spring
1012
12
14
14
16
16
149.00 149.50 150.00 150.50 151.00 151.50Longitude
-36.00
-35.50
-35.00
-34.50
-34.00
-33.50
Latit
ude
BATHURST
PROSPECT_DAM
RICHMOND
CANBERRA
GOULBURN
WORONORA
WARRAGAMBA
NEPEAN_DAM
WINGECARRIBEE_DAM
BENDEELA
SYDNEY
2624
222018
1614
12108
64
20-2
-4
A2 Year 2070 - Spring
12
14
16
16
149.00 149.50 150.00 150.50 151.00 151.50Longitude
-36.00
-35.50
-35.00
-34.50
-34.00
-33.50
Latit
ude
BATHURST
PROSPECT_DAM
RICHMOND
CANBERRA
GOULBURN
WORONORA
WARRAGAMBA
NEPEAN_DAM
WINGECARRIBEE_DAM
BENDEELA
SYDNEY
26
24
22
20
18
16
14
12
10
8
6
4
2
0
-2
-4
B1 Year 2070 - Summer
4
149.00 149.50 150.00 150.50 151.00 151.50Longitude
-36.00
-35.50
-35.00
-34.50
-34.00
-33.50
Latit
ude
BATHURST
PROSPECT_DAM
RICHMOND
CANBERRA
GOULBURN
WORONORA
WARRAGAMBA
NEPEAN_DAM
WINGECARRIBEE_DAM
BENDEELA
SYDNEY
26
2422
201816
1412
108
642
0-2
-4
A1B Year 2070 - Summer
12
14
14
149.00 149.50 150.00 150.50 151.00 151.50Longitude
-36.00
-35.50
-35.00
-34.50
-34.00
-33.50
Latit
ude
BATHURST
PROSPECT_DAM
RICHMOND
CANBERRA
GOULBURN
WORONORA
WARRAGAMBA
NEPEAN_DAM
WINGECARRIBEE_DAM
BENDEELA
SYDNEY
26
2422
2018
1614
12
108
64
20
-2-4
A2 Year 2070 - Summer
12
12
14
16
149.00 149.50 150.00 150.50 151.00 151.50Longitude
-36.00
-35.50
-35.00
-34.50
-34.00
-33.50
Latit
ude
BATHURST
PROSPECT_DAM
RICHMOND
CANBERRA
GOULBURN
WORONORA
WARRAGAMBA
NEPEAN_DAM
WINGECARRIBEE_DAM
BENDEELA
SYDNEY
26
2422
20
18
16
14
1210
8
6
4
2
0
-2-4
p p ( )B1 Year 2070
4
149.00 149.50 150.00 150.50 151.00 151.50Longitude
-36.00
-35.50
-35.00
-34.50
-34.00
-33.50
Latit
ude
BATHURST
PROSPECT_DAM
RICHMOND
CANBERRA
GOULBURN
WORONORA
WARRAGAMBA
NEPEAN_DAM
WINGECARRIBEE_DAM
BENDEELA
SYDNEY
26
2422
20
18
16
1412
10
8
6
42
0
-2
-4
p p ( )A1B Year 2070
10
12
149.00 149.50 150.00 150.50 151.00 151.50Longitude
-36.00
-35.50
-35.00
-34.50
-34.00
-33.50
Latit
ude
BATHURST
PROSPECT_DAM
RICHMOND
CANBERRA
GOULBURN
WORONORA
WARRAGAMBA
NEPEAN_DAM
WINGECARRIBEE_DAM
BENDEELA
SYDNEY
26
2422
201816
141210
86
420
-2-4
p p ( )A2 Year 2070
10
12
14
14
16
149.00 149.50 150.00 150.50 151.00 151.50Longitude
-36.00
-35.50
-35.00
-34.50
-34.00
-33.50
Latit
ude
BATHURST
PROSPECT_DAM
RICHMOND
CANBERRA
GOULBURN
WORONORA
WARRAGAMBA
NEPEAN_DAM
WINGECARRIBEE_DAM
BENDEELA
SYDNEY
26
24
22
20
18
16
14
12
10
8
6
4
2
0
-2
-4
Figure A4.16: Best estimates (50th percentiles) of changes in seasonal and annual pan evaporation (%) for 2070 under the B1, A1B and A2 scenarios, relative to the current climate.
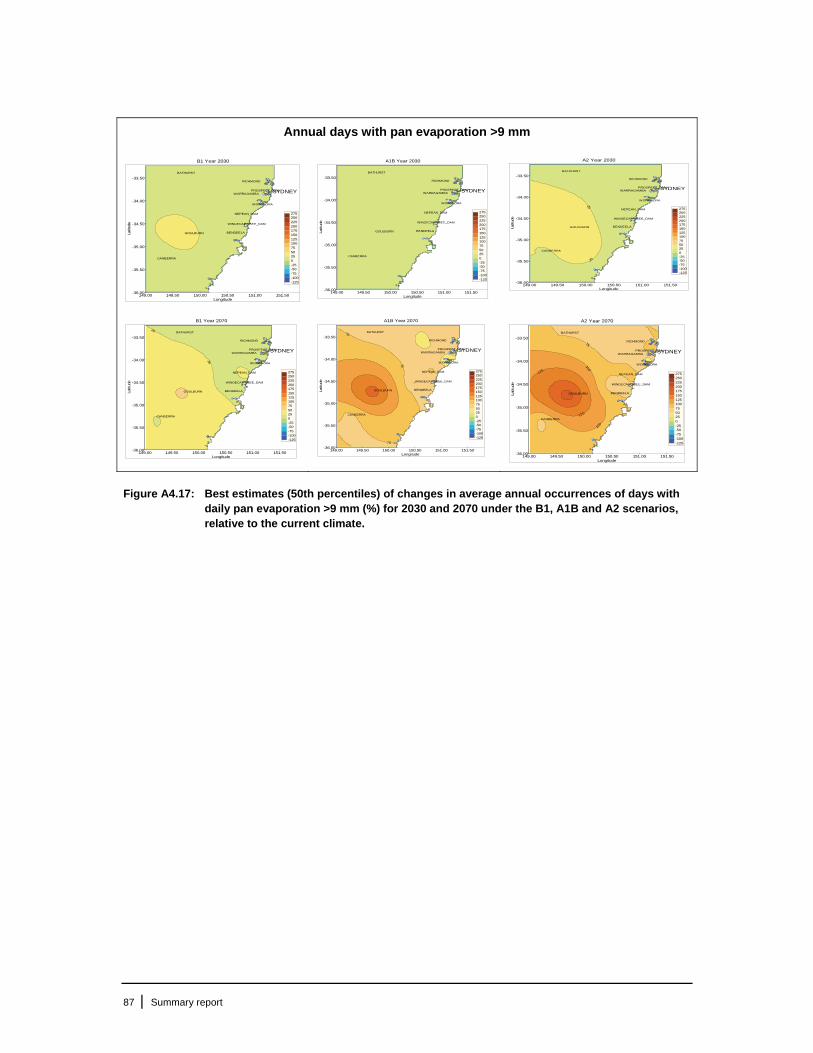
87 | Summary report
Annual days with pan evaporation >9 mm
B1 Year 2030
149.00 149.50 150.00 150.50 151.00 151.50Longitude
-36.00
-35.50
-35.00
-34.50
-34.00
-33.50
Latit
ude
BATHURST
PROSPECT_DAM
RICHMOND
CANBERRA
GOULBURN
WORONORA
WARRAGAMBA
NEPEAN_DAM
WINGECARRIBEE_DAM
BENDEELA
SYDNEY
2752502252001751501251007550250-25-50-75-100-125
A1B Year 2030
149.00 149.50 150.00 150.50 151.00 151.50Longitude
-36.00
-35.50
-35.00
-34.50
-34.00
-33.50
Latit
ude
BATHURST
PROSPECT_DAM
RICHMOND
CANBERRA
GOULBURN
WORONORA
WARRAGAMBA
NEPEAN_DAM
WINGECARRIBEE_DAM
BENDEELA
SYDNEY
2752502252001751501251007550250-25-50-75-100-125
A2 Year 2030
25
25
149.00 149.50 150.00 150.50 151.00 151.50Longitude
-36.00
-35.50
-35.00
-34.50
-34.00
-33.50
Latit
ude
BATHURST
PROSPECT_DAM
RICHMOND
CANBERRA
GOULBURN
WORONORA
WARRAGAMBA
NEPEAN_DAM
WINGECARRIBEE_DAM
BENDEELA
SYDNEY
2752502252001751501251007550250-25-50-75-100-125
B1 Year 2070
25
25
149.00 149.50 150.00 150.50 151.00 151.50Longitude
-36.00
-35.50
-35.00
-34.50
-34.00
-33.50
Latit
ude
BATHURST
PROSPECT_DAM
RICHMOND
CANBERRA
GOULBURN
WORONORA
WARRAGAMBA
NEPEAN_DAM
WINGECARRIBEE_DAM
BENDEELA
SYDNEY
2752502252001751501251007550250-25-50-75-100-125
A1B Year 2070
75
75
75
149.00 149.50 150.00 150.50 151.00 151.50Longitude
-36.00
-35.50
-35.00
-34.50
-34.00
-33.50
Latit
ude
BATHURST
PROSPECT_DAM
RICHMOND
CANBERRA
GOULBURN
WORONORA
WARRAGAMBA
NEPEAN_DAM
WINGECARRIBEE_DAM
BENDEELA
SYDNEY
2752502252001751501251007550250-25-50-75-100-125
A2 Year 2070
75
100
100
125
125
149.00 149.50 150.00 150.50 151.00 151.50Longitude
-36.00
-35.50
-35.00
-34.50
-34.00
-33.50
Latit
ude
BATHURST
PROSPECT_DAM
RICHMOND
CANBERRA
GOULBURN
WORONORA
WARRAGAMBA
NEPEAN_DAM
WINGECARRIBEE_DAM
BENDEELA
SYDNEY
2752502252001751501251007550250-25-50-75-100-125
Figure A4.17: Best estimates (50th percentiles) of changes in average annual occurrences of days with daily pan evaporation >9 mm (%) for 2030 and 2070 under the B1, A1B and A2 scenarios, relative to the current climate.

88 | Summary report
Annual spells of >14 days with pan evaporation <5 mm
B1 Year 2030
0
0
149.00 149.50 150.00 150.50 151.00 151.50Longitude
-36.00
-35.50
-35.00
-34.50
-34.00
-33.50
Latit
ude
BATHURST
PROSPECT_DAM
RICHMOND
CANBERRA
GOULBURN
WORONORA
WARRAGAMBA
NEPEAN_DAM
WINGECARRIBEE_DAM
BENDEELA
SYDNEY
302520151050-5-10-15-20-25-30-35-40-45-50
A1B Year 2030
0
149.00 149.50 150.00 150.50 151.00 151.50Longitude
-36.00
-35.50
-35.00
-34.50
-34.00
-33.50
Latit
ude
BATHURST
PROSPECT_DAM
RICHMOND
CANBERRA
GOULBURN
WORONORA
WARRAGAMBA
NEPEAN_DAM
WINGECARRIBEE_DAM
BENDEELA
SYDNEY
302520151050-5-10-15-20-25-30-35-40-45-50
A2 Year 2030
0
0
149.00 149.50 150.00 150.50 151.00 151.50Longitude
-36.00
-35.50
-35.00
-34.50
-34.00
-33.50
Latit
ude
BATHURST
PROSPECT_DAM
RICHMOND
CANBERRA
GOULBURN
WORONORA
WARRAGAMBA
NEPEAN_DAM
WINGECARRIBEE_DAM
BENDEELA
SYDNEY
302520151050-5-10-15-20-25-30-35-40-45-50
p y ( )B1 Year 2070
149.00 149.50 150.00 150.50 151.00 151.50Longitude
-36.00
-35.50
-35.00
-34.50
-34.00
-33.50
Latit
ude
BATHURST
PROSPECT_DAM
RICHMOND
CANBERRA
GOULBURN
WORONORA
WARRAGAMBA
NEPEAN_DAM
WINGECARRIBEE_DAM
BENDEELA
SYDNEY
302520151050-5-10-15-20-25-30-35-40-45-50
p y ( )A1B Year 2070
-10
-5
-5
149.00 149.50 150.00 150.50 151.00 151.50Longitude
-36.00
-35.50
-35.00
-34.50
-34.00
-33.50
Latit
ude
BATHURST
PROSPECT_DAM
RICHMOND
CANBERRA
GOULBURN
WORONORA
WARRAGAMBA
NEPEAN_DAM
WINGECARRIBEE_DAM
BENDEELA
SYDNEY
302520151050-5-10-15-20-25-30-35-40-45-50
p y ( )A2 Year 2070
-10-10
-5
-5
149.00 149.50 150.00 150.50 151.00 151.50Longitude
-36.00
-35.50
-35.00
-34.50
-34.00
-33.50
Latit
ude
BATHURST
PROSPECT_DAM
RICHMOND
CANBERRA
GOULBURN
WORONORA
WARRAGAMBA
NEPEAN_DAM
WINGECARRIBEE_DAM
BENDEELA
SYDNEY
302520151050-5-10-15-20-25-30-35-40-45-50
Figure A4.18: Best estimates (50th percentiles) of changes in average annual occurrences of 15 or more consecutive days with daily pan evaporation <5 mm (%) for 2030 and 2070 under the B1, A1B and A2 scenarios, relative to the current climate.
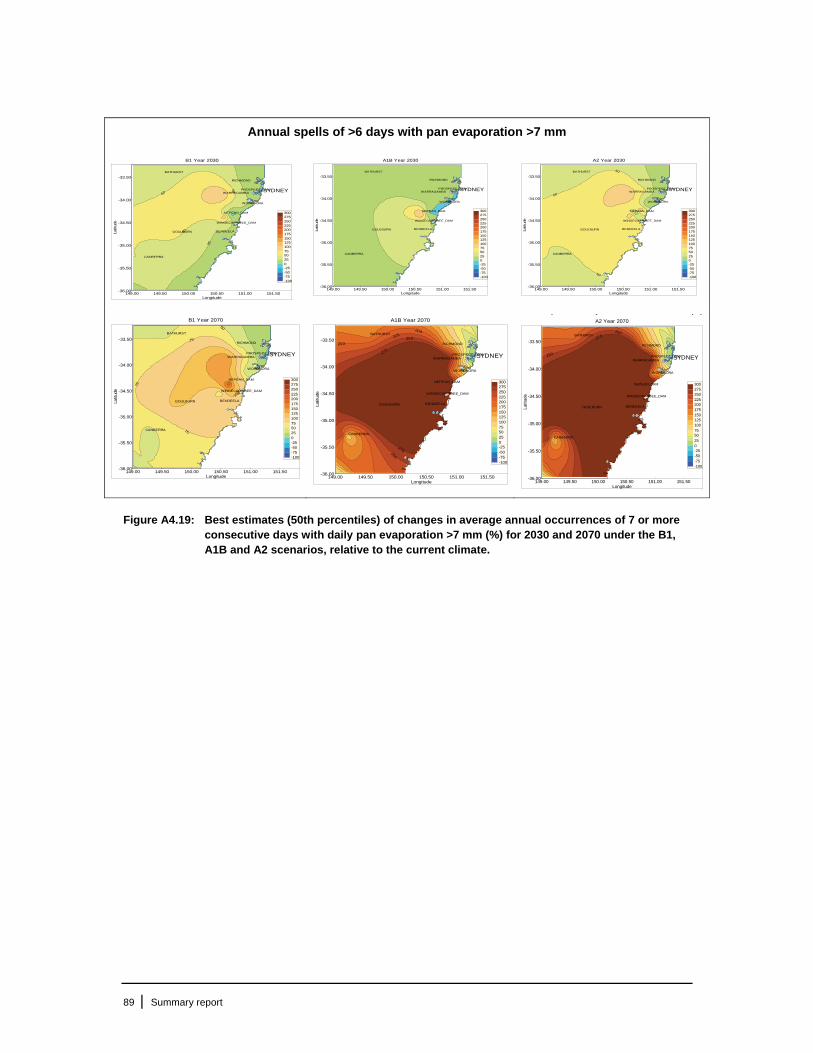
89 | Summary report
Annual spells of >6 days with pan evaporation >7 mm
B1 Year 2030
25
50
50
50
149.00 149.50 150.00 150.50 151.00 151.50Longitude
-36.00
-35.50
-35.00
-34.50
-34.00
-33.50
Latit
ude
BATHURST
PROSPECT_DAM
RICHMOND
CANBERRA
GOULBURN
WORONORA
WARRAGAMBA
NEPEAN_DAM
WINGECARRIBEE_DAM
BENDEELA
SYDNEY
3002752502252001751501251007550250-25-50-75-100
A1B Year 2030
149.00 149.50 150.00 150.50 151.00 151.50Longitude
-36.00
-35.50
-35.00
-34.50
-34.00
-33.50
Latit
ude
BATHURST
PROSPECT_DAM
RICHMOND
CANBERRA
GOULBURN
WORONORA
WARRAGAMBA
NEPEAN_DAM
WINGECARRIBEE_DAM
BENDEELA
SYDNEY
3002752502252001751501251007550250-25-50-75-100
A2 Year 2030
50
50
50
149.00 149.50 150.00 150.50 151.00 151.50Longitude
-36.00
-35.50
-35.00
-34.50
-34.00
-33.50
Latit
ude
BATHURST
PROSPECT_DAM
RICHMOND
CANBERRA
GOULBURN
WORONORA
WARRAGAMBA
NEPEAN_DAM
WINGECARRIBEE_DAM
BENDEELA
SYDNEY
3002752502252001751501251007550250-25-50-75-100
B1 Year 207050
75
75
75
100
149.00 149.50 150.00 150.50 151.00 151.50Longitude
-36.00
-35.50
-35.00
-34.50
-34.00
-33.50
Latit
ude
BATHURST
PROSPECT_DAM
RICHMOND
CANBERRA
GOULBURN
WORONORA
WARRAGAMBA
NEPEAN_DAM
WINGECARRIBEE_DAM
BENDEELA
SYDNEY
3002752502252001751501251007550250-25-50-75-100
A1B Year 2070
200
200
225250
250
275
275
149.00 149.50 150.00 150.50 151.00 151.50Longitude
-36.00
-35.50
-35.00
-34.50
-34.00
-33.50
Latit
ude
BATHURST
PROSPECT_DAM
RICHMOND
CANBERRA
GOULBURN
WORONORA
WARRAGAMBA
NEPEAN_DAM
WINGECARRIBEE_DAM
BENDEELA
SYDNEY
3002752502252001751501251007550250-25-50-75-100
p y ( )A2 Year 2070
250
250
275
149.00 149.50 150.00 150.50 151.00 151.50Longitude
-36.00
-35.50
-35.00
-34.50
-34.00
-33.50
Latit
ude
BATHURST
PROSPECT_DAM
RICHMOND
CANBERRA
GOULBURN
WORONORA
WARRAGAMBA
NEPEAN_DAM
WINGECARRIBEE_DAM
BENDEELA
SYDNEY
3002752502252001751501251007550250-25-50-75-100
Figure A4.19: Best estimates (50th percentiles) of changes in average annual occurrences of 7 or more consecutive days with daily pan evaporation >7 mm (%) for 2030 and 2070 under the B1, A1B and A2 scenarios, relative to the current climate.
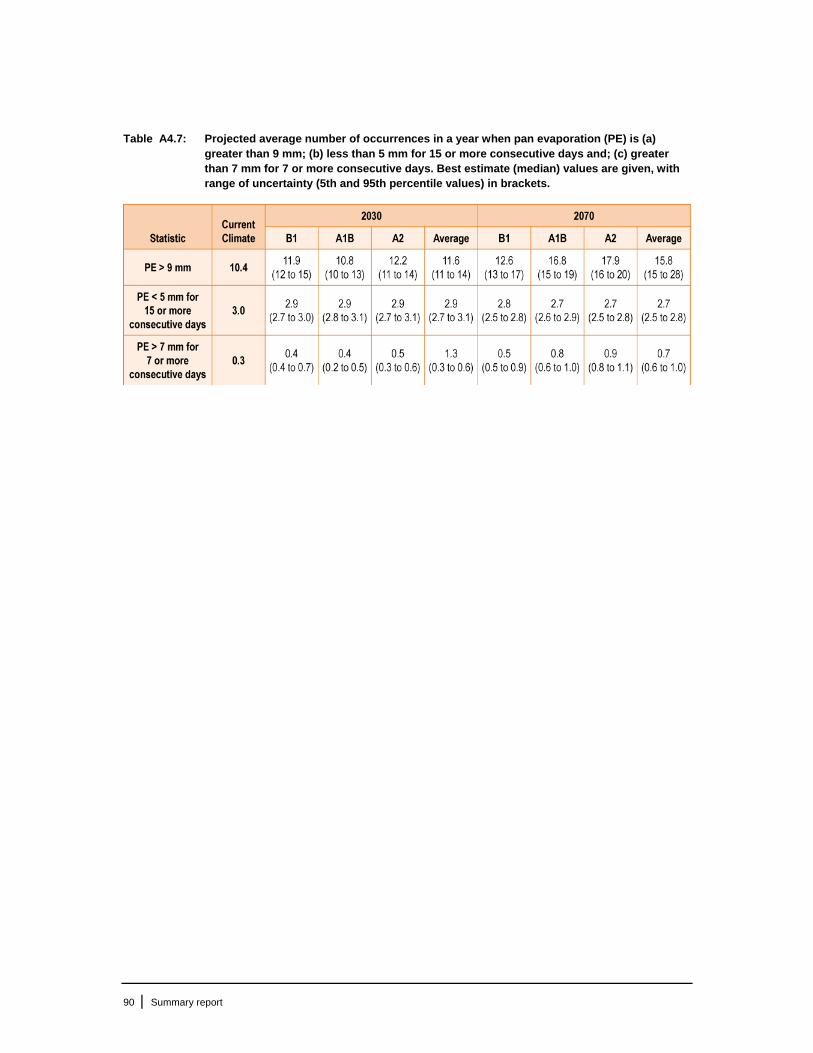
90 | Summary report
Table A4.7: Projected average number of occurrences in a year when pan evaporation (PE) is (a) greater than 9 mm; (b) less than 5 mm for 15 or more consecutive days and; (c) greater than 7 mm for 7 or more consecutive days. Best estimate (median) values are given, with range of uncertainty (5th and 95th percentile values) in brackets.
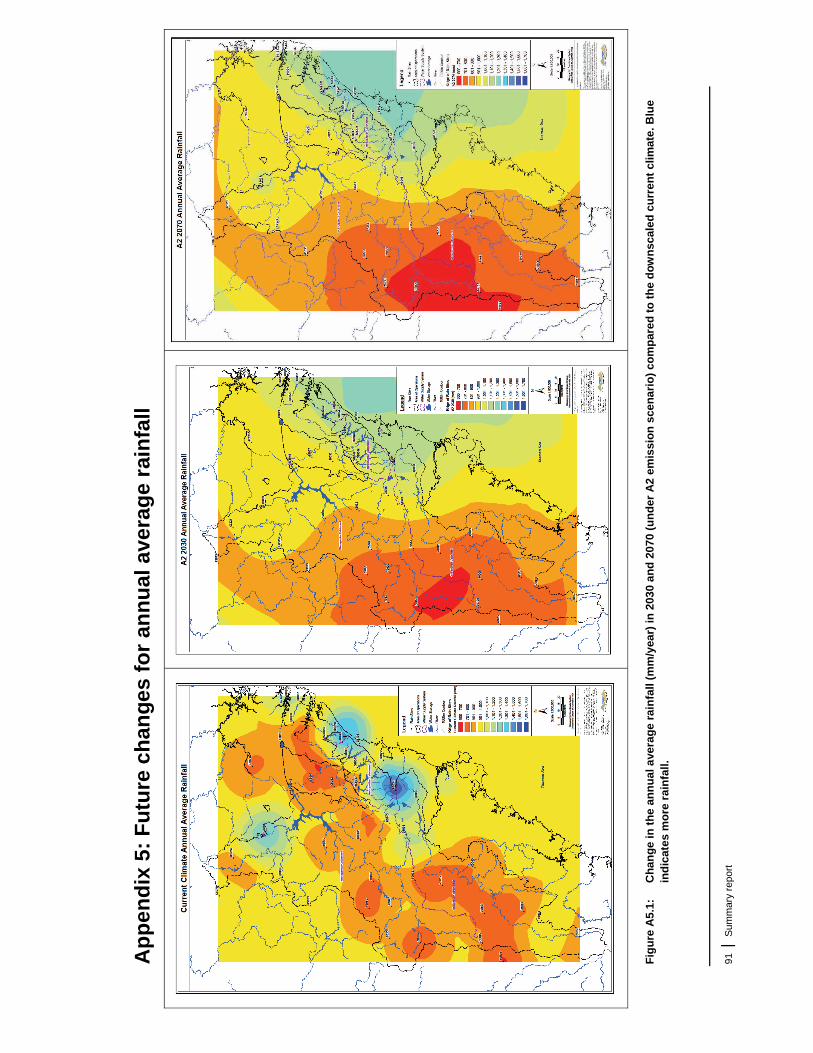
91
| S
um
mar
y re
po
rt
Ap
pen
dix
5:
Fu
ture
ch
ang
es f
or
ann
ual
ave
rag
e ra
infa
ll
Fig
ure
A5
.1:
C
ha
ng
e in
th
e a
nn
ua
l ave
rag
e r
ain
fall
(mm
/yea
r) in
203
0 a
nd
20
70 (
un
der
A2
em
issi
on
sce
na
rio
) c
om
par
ed
to
th
e d
ow
nsc
aled
cu
rre
nt
clim
ate
. Blu
e in
dic
ate
s m
ore
ra
infa
ll.

92 | Summary report
Appendix 6: Sydney Catchment Authority’s water supply planning and assessment
Assessment framework
The Sydney Catchment Authority (SCA) planning framework enables assessment of system performance under current and any future system configurations in both the short and long-term. This framework is recognised as a cornerstone for the assessment of system performance. It is under regular review as detailed by the SCA’s operating licence. Historically this review has spawned other research and development to continuously improve the framework.
The operating licence also requires the SCA to manage the water supply system consistent with the system design criteria set out by the Independent Pricing and Regulatory Tribunal, namely:
Reliability: Reliability is to be not less than 97 percent, and is defined as the percentage of months, on average, that the Authority will meet in full Sydney Water’s Forecast Average Annual Demand requirements referred to in paragraph (f) below. This means it is estimated that, on average, restrictions will not need to be applied more often than 30 months in 1,000 months. (“Reliability”).
Robustness: Robustness is to be not less than 90 percent and is defined as the percentage of years, on average, that the Authority will not require a reduction in Sydney Water’s Forecast Average Annual Demand for Bulk Raw Water. This means it is estimated that, on average, not more than 10 years in 100 years will be affected by restrictions. For the purposes of this clause, a “year” is each period of 12 months commencing on 1 July and a year will have been affected by restrictions if in any day of that year a restriction has been applied.
Security: Security is to be not less than five percent and is defined as the level of the SCA’s operating storage below which actual storage is not to fall, on average, more often than 0.001 percent of the time. This means it is estimated that, on average, the level of operating storage will not fall below five percent more often than one month in 100,000 months.
These system criteria ensure that the system can supply water with a certain frequency of restrictions (defined by reliability and robustness), whilst ensuring that it does not run out of water (as defined by security). These criteria are, by necessity, assessed in a probabilistic manner and the framework has been developed to ensure that an accurate assessment is undertaken.
The framework employs a rigorous analysis of the system and its performance using 200,000 years (2,000 replicates of 100 years) of statistically generated flows. These generated flows are based on 100 years of historical inflow observations and statistical techniques are used to ensure realistic representation of inflow including the frequency and severity of drought periods. These statistical techniques ensure that not only the general statistical properties are maintained such as mean, variability and skew, but also the annual correlation (persistence) and the spatial correlation across all nine major inflows sites. During the generation process checks are made to ensure that a representative sample of droughts occurs in each flow sequence including many that are worse than historically observed.
93 | Summary report
Appendix 7: Assumed system configuration in 2010 for water supply
Key assumptions for 2010 base case
Tallowa Dam
80/20 environmental flows Pump mark at 75 percent. Pumping can occur when storages are below 75 percent and
turned off when storage recover above 80 percent Minimum operating level of -1.0 metre
Upper Nepean Dams (Nepean, Avon, Cataract, Cordeaux)
80/20 environmental flows
Woronora Dam
Average 80/20 environmental flows
Warragamba Dam
Current Warragamba Dam environmental flows and riparian flows replaced with Western Sydney Recycled water in 2010
Desalination
250 megalitres per day (ML/d) plant: commences operating when SCA total system storage level falls below 70 percent and remains operating until the level reaches 80 percent; and
The next 250 ML/d component of the desalination plant would commence operating at 30 percent of total system storage and would continue operating until total system storage level reaches 80 percent.
Hydrology
Hydrology of 1909–2007.
Water restrictions
Water restrictions applied to supply during times of drought. This includes an estimate of these restrictions on the magnitude of demand reduction achieved during current drought. o Level 1 introduced at 55 percent total storage: achieves a seven percent reduction o Level 2 introduced at 45 percent total storage: achieves a 11 percent reduction o Level 3 introduced at 40 percent total storage: achieves a 12 percent reduction.

94 | Summary report
Appendix 8: Water supply zones and weather stations used to determine climate demand in this study
* Sutherland supply zone is treated as a separate zone because it can switch between the Potts Hill and Woronora delivery
systems. Therefore, this area could not be assigned uniquely to a single delivery system and so was kept separate in the model.
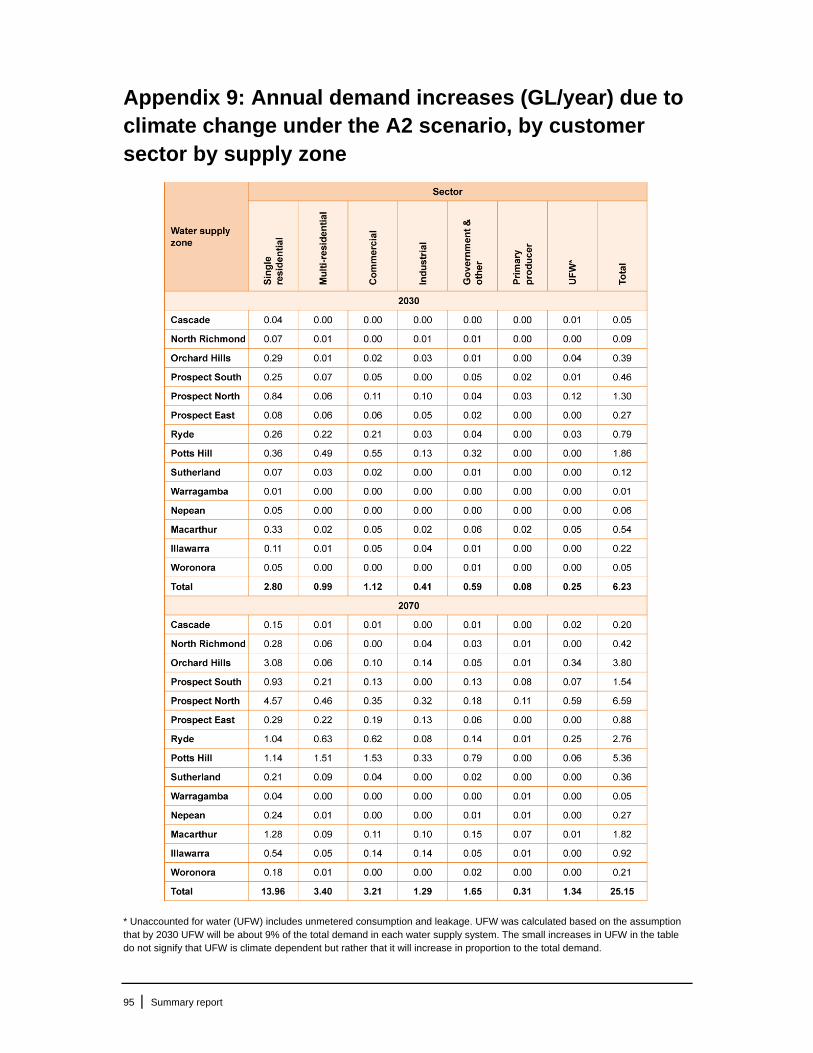
95 | Summary report
Appendix 9: Annual demand increases (GL/year) due to climate change under the A2 scenario, by customer sector by supply zone
* Unaccounted for water (UFW) includes unmetered consumption and leakage. UFW was calculated based on the assumption that by 2030 UFW will be about 9% of the total demand in each water supply system. The small increases in UFW in the table do not signify that UFW is climate dependent but rather that it will increase in proportion to the total demand.
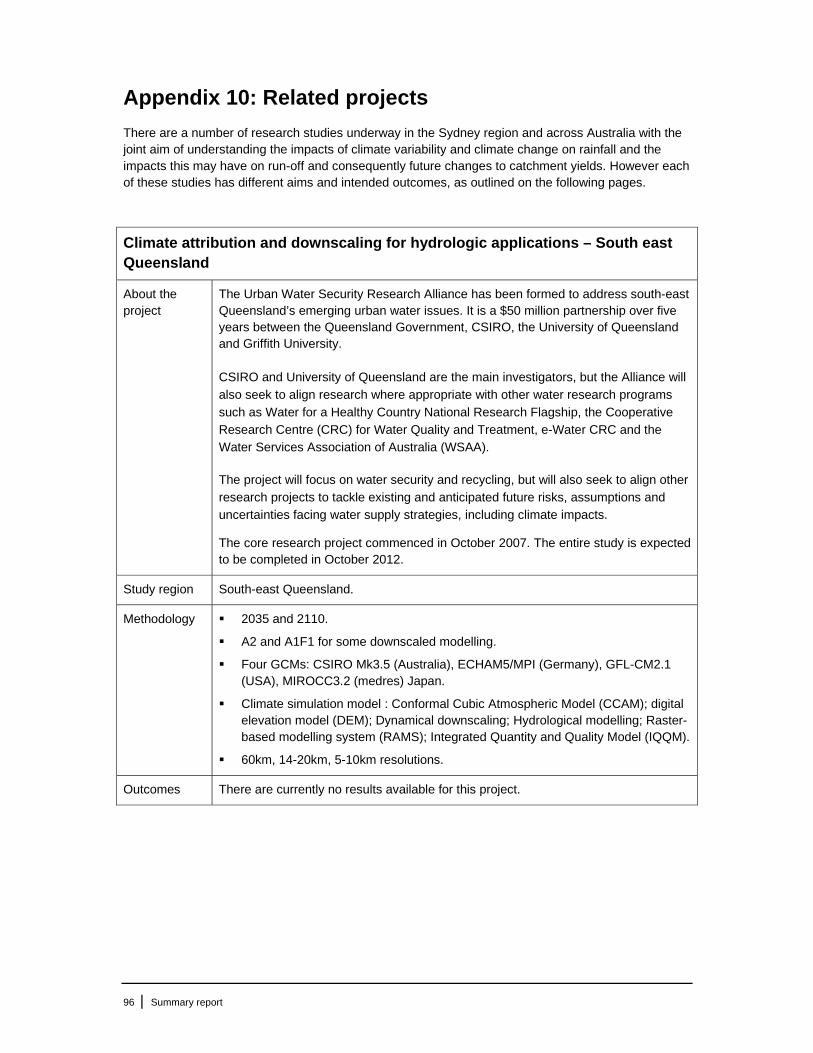
96 | Summary report
Appendix 10: Related projects
There are a number of research studies underway in the Sydney region and across Australia with the joint aim of understanding the impacts of climate variability and climate change on rainfall and the impacts this may have on run-off and consequently future changes to catchment yields. However each of these studies has different aims and intended outcomes, as outlined on the following pages.
Climate attribution and downscaling for hydrologic applications – South east Queensland
About the project
The Urban Water Security Research Alliance has been formed to address south-east Queensland’s emerging urban water issues. It is a $50 million partnership over five years between the Queensland Government, CSIRO, the University of Queensland and Griffith University.
CSIRO and University of Queensland are the main investigators, but the Alliance will
also seek to align research where appropriate with other water research programs
such as Water for a Healthy Country National Research Flagship, the Cooperative Research Centre (CRC) for Water Quality and Treatment, e-Water CRC and the Water Services Association of Australia (WSAA).
The project will focus on water security and recycling, but will also seek to align other
research projects to tackle existing and anticipated future risks, assumptions and uncertainties facing water supply strategies, including climate impacts.
The core research project commenced in October 2007. The entire study is expected to be completed in October 2012.
Study region South-east Queensland.
Methodology 2035 and 2110.
A2 and A1F1 for some downscaled modelling.
Four GCMs: CSIRO Mk3.5 (Australia), ECHAM5/MPI (Germany), GFL-CM2.1 (USA), MIROCC3.2 (medres) Japan.
Climate simulation model : Conformal Cubic Atmospheric Model (CCAM); digital elevation model (DEM); Dynamical downscaling; Hydrological modelling; Raster- based modelling system (RAMS); Integrated Quantity and Quality Model (IQQM).
60km, 14-20km, 5-10km resolutions.
Outcomes There are currently no results available for this project.

97 | Summary report
CSIRO Murray–Darling Basin Sustainable Yields Project
About the project
The project was lead by CSIRO commissioned by the Australian Government, under the National Water Commission’s Raising National Water Standards Program. Important aspects of the work were undertaken by NSW Department of Water and
Energy; QLD Department of Natural Resources and Water; Murray–Darling Basin Commission; Department of Water, South Australian Land and Biodiversity Conservation; Bureau of Rural Sciences; Salient Solutions Australia Pty Ltd; Water
Cooperative Research Centre; University of Melbourne; Webb, McKeown and Associates Pty Ltd; and several individual sub-contractors.
The project was a world first for rigorous and detailed basin-scale assessment of the
anticipated impacts of climate change, catchment development and increasing groundwater extraction on the availability and use of water resources.
The Murray–Darling Basin (MDB) covers more than 1 million km3 (one-seventh) of
mainland Australia including parts of Queensland, New South Wales, Victoria and South Australia and all of the Australian Capital Territory. The study area for this project covered 18 catchments of the MDB region.
The project commenced in 2007 and was completed 2008.
CSIRO, through the Water for a Healthy Country National Research Flagship, has completed a series of reports which assess the current and future water availability in the Murray–Darling Basin.
CSIRO was contracted by the National Water Commission to provide the assessments, which led to the world's largest basin-scale investigation of the impacts on water resources of:
catchment development
changing groundwater extraction
climate variability
climate change.
Study region 18 catchments of the Murray-Darling Basin Region.
Methodology 2030.
15 GCMs.
Based on the IPCC AR4 greenhouse gas emission scenarios: Low, Med, High.
Baseline scenario – is the historical climate from 1895 to 2006 and the current level of water resource development.
Second scenario – is based on the climate of 1997-2006.
Third scenario- considers the climate change by 2030.
Fourth scenario- considers likely future development and the 2030 climate.
98 | Summary report
All four scenarios assume the continuation of the existing surface groundwater sharing plans implemented by the states.
Outcomes Due to water resource development the total flow at the Murray mouth has been reduced by 61 percent; the river now ceases to flow through the mouth 40 percent of the time compared to one percent of the time in the absence of water resource development. Droughts, such as occurred 1997–2006, will become increasingly common with climate change and the drought conditions of the MDB have worsened in 2007 and 2008.
The impacts of climate change by 2030 are uncertain; however, surface water availability across the entire MDB is more likely to decline than increase. The median decline of available surface water for the entire MDB is 11 percent to nine percent in the north of the MDB and 13 percent in the south of the MDB.
The median water decline would reduce total surface water use by four percent under the current water sharing agreements but would further reduce flow at the Murray mouth by 24 percent. The majority of the impact of climate change would be borne by the environment rather than by consumptive water users.
The relative impact of climate change on surface water use would be much greater in dry years. Under the median 2030 climate diversion in the driest years would fall by more than 10 percent in most NSW regions.
Groundwater currently represents 16 percent of the total water use in the MDB but under the current water sharing arrangements groundwater could increase by 2030 to be over one-quarter of total water use.
The results should be valuable in the future assessments which may contribute to the development of the Basin Plan including consideration of (i) the consumptive and other economic uses of MDB water resources; (ii) conservation and sustainable use of biodiversity; and (iii) social, cultural, indigenous and public benefit issues.
99 | Summary report
Future climate and run-off projections (~2030) for New South Wales and Australian Capital Territory
About the project
NSW Government (NSW Office of Water, formerly Department of Water and Energy)
in partnership with CSIRO carried out this project.
This project provides estimate of future climate and run-off across NSW and ACT at a scale which is applicable to hydrological modelling (~ 5 km x 5 km). The project
provides a consistent and scientifically credible future climate and run-off data set for the whole of NSW which can be used by all NSW agencies. The methodology used
in this project is very similar to and based on the Murray–Darling Basin Sustainable
Yield Project (MDBSY) and the South Eastern Australian Climate Initiative (SEACI).
The project commenced in 2007 and was completed in August 2008.
Study region NSW/ACT.
Methodology Generated a reference (with no climate change) time series of run-off estimates for 5km by 5 km area at daily time step for the period between 1895 and 2006. Run-off was generated using the historical daily rainfall record and estimated potential evapotranspiration (PET) applied to rainfall runoff models (SIMHYD and Scaramento) calibrated to over a hundred gauged catchments in NSW.
The study then generated comparable time series of climate change runoff estimates at a reference date of 2030 for 15 global climate models (GCMs) that had daily data available for the A1B emission scenario for the current and future time periods.
Daily scaling method was used to adjust the historical daily rainfall record. The method adjusts daily rainfall totals on a seasonal basis to be higher or lower than the historical and maintains the inter-annual and interdecadal patterns.
The method applied to the results from the 15 GCMs produced a range of
changes to rainfall and resulting run-offs, from significantly wetter to significantly drier futures, reflecting the current level of uncertainty of rainfall projections (but
there is greater consensus for temperature projections).
Outcomes The median or best estimate indicates that future mean annual run-off in the region
in ~2030 relative to ~1990 will be lower by zero to 20 percent in the southern parts, no change to a slight reduction in the eastern parts and higher by zero to 20 percent
in the north-west corner. The modelled mean annual run-off using the climate change
projections from the 15 GCMs range from a 20 percent decrease to a 20 percent increase in the eastern parts of the region, a 30 percent decrease to a 10 percent increase in the southern parts of the region and a 30 percent decrease to a
30 percent increase in the north-west corner.
The results from this project were used as the hydrology input in DECCW NSW Climate Impact Profile Project.

100 | Summary report
Historical reconstruction of the history of large flood events in the Nepean and Warragamba catchments
About the project
This project is being conducted in collaboration between Sydney Catchment Authority (SCA) and University of Newcastle.
To better understand natural climatic variability over long time periods that pre-date
the 200-year historical record, a research project at the University of Newcastle is examining flood-plain deposits in the Nepean River to investigate periods of major
flood events over the past 1,000 years.
The intended outcome of the project is to use the data to input into
hydroclimatological models to improve knowledge of the relationships between
rainfall, catchment moisture, inflows and flood events.
The project commenced in 2008 and is expected to be completed in mid-2010.
Study region Floodplains of Hawkesbury-Nepean river system.
Methodology Analysis of particle size distribution and age dating of floodplain sediment cores. Supplementary OSL (optical stimulated luminescence) dating, taking place in Denmark during November 2009 to March 2010.
Outcomes Preliminary results suggest a return period of approximately 60 years between major flood events, with an extended period of increased flood activity between 550 and 500 years ago.
Comment Results from the speleothem and flood plain projects will be compared to obtain and integrated understanding of long-term drought flood sequences over the last 2,000 years. Expected completion date is late 2010.

101 | Summary report
Impact of climate change on the biophysical environment of NSW –NSW Climate Impact Profile
About the project
The NSW Department of Environment, Climate Change and Water, with assistance
from the NSW Office of Water has prepared a NSW Climate Impact Profile describing some of the likely impacts of future climate change on NSW’s settlements, land and ecosystems.
Regional climate projections developed by the Climate Change Research Centre of the University of NSW were used to assess the likely impacts of future climate
change on biodiversity, soils, streamflow, run-off, the coastal zone and flooding risk
by the year 2050. The Climate Impact Profile includes a summary of the major climate change impacts for NSW, supported by a series of regional impact profiles based on the NSW State Plan regions. The NSW Climate Impact Profile aims to
outline some of the risks NSW may face under a changing climate to help state and
regional decision-makers develop their planning and response strategies.
The project commenced in 2008.
To determine the hydrological impacts of climate change the Office of Water
(formerly DWE) undertook a study as part of the broader DECCW study.
Study region NSW based on NSW State Plan regions.
Methodology 2030 (hydrological impacts), 2050 for other areas of the report.
A1B (hydrological study), A2 for other areas of the report.
15 GCMs for hydrological aspects of the reports.
Four GCMs for other areas of the report: CSIRO Mk 3.0 (Australia), MIROC 3.2 (Japan), MIUB (Germany/Korea), MRICGCM2.3.2 (Japan).
Downscaling model to 5 km x 5 km grid size.
Outcomes The summary of the Climate Change Impacts for the Sydney Region found that:
days are projected to be hotter over all seasons, with the greatest warming in winter and spring (2 to 3˚C). Nights are also projected to be warmer, particularly in spring (2 to 3˚C)
summer rainfall is projected to increase across the region by 20–50 percent, with smaller increase in spring. Winter rainfall is projected to decrease
Higher temperatures and changes to evaporation are likely to create slightly drier conditions in winter and spring.
Comment The final study was released in June 2010.
A data subset from the NSW Office of Water Report ‘Future Climate Change Projections (~2030) for NSW and ACT report ( August 2008), was used for the DECCW study.

102 | Summary report
Implications of potential climate change for Melbourne’s water resources
About the project
Melbourne Water engaged CSIRO to investigate the implications of climate change for Melbourne’s water, sewerage and drainage systems. The project commenced in 2004 and was completed in March 2005.
Study region Melbourne Water operations area.
Methodology 2020 and 2050.
13 GCMs.
Three climate scenarios (mild, medium and severe) based on IPCC scenarios.
The Australian Water Balance Model (AWBM) (Boughton 2002) was used to simulate the effect of climate on daily streamflows in major harvesting catchments and a regression model was developed to simulate the effect of climate on total water supply system demand on a monthly basis.
Outcomes Results
Potential average annual temperature increase projected to range from 0.3 ºC to 1ºC in 2020 and 0.6 ºC to 2.5ºC in 2050. The GCMs used in this project suggested an annual average precipitation change of minus five to zero percent in 2020 and -13 to one percent in 2050 with more likelihood of extreme events.
Application of results/project recommendations
The study found that adaptation will require ongoing review of climate change, population growth, land-use changes, water use, effectiveness of implemented water demand and supply side programs and the capacity of current systems to cope. The study also identified a range of initiatives additional to those currently planned that should be investigated further, including changes to water, sewerage and drainage system design criteria (particularly in greenfield or redevelopment areas) and investigation of additional demand or supply side options including non-traditional sources such as groundwater and desalination.
Comment The report noted that there is a range of uncertainty in the findings due to the GCM modelling uncertainly.

103 | Summary report
Indian Ocean Climate Initiative (IOCI)
About the project
IOCI was established through a partnership of state and federal government agencies. Western Australian contributing partners include Department of Environment Water & Catchment Protection, Department of Conservation & Land
Management, Bureau of Meteorology WA Region, Department of the Premier and
Cabinet, Water Corporation, Department of Agriculture, and Fire and Emergency Services. The Federal partners are CSIRO and the former Bureau of Meteorology
Research Centre.
The core research is conducted by the Bureau of Meteorology and CSIRO.
IOCI is looking into the effects of the Indian and Southern Oceans on inter-seasonal to inter-decadal climate variability in the south-west region of Western Australia,
which will inform the development of operational seasonal outlooks that are sufficient for effective decision-making.
Stage one commenced in 1997, stage two commenced in 2003 and stage three commenced in 2008.
Study region South-west and north-west Western Australia.
Methodology 2030.
A2 A1B, B1 scenarios.
Nine GCMs.
Downscaling; CSIRO general circulation model (CSIRO9 GCM); CSIRO limited
area model (DARLAM).
Outcomes Stage one and two key findings indicate that the underlying cause of the observed winter rainfall decline is not simply due to changes in Indian Ocean sea surface temperatures. There has been an abrupt shift and a clearly defined trend in the frequency characteristics of the synoptic patterns that influence rainfall occurrence which appears to coincide with the well-documented change in the behaviour of the El Niño that occurred in the mid 1970s.
This trend appears to be due to a different mechanism, and its interaction with El Niño; as such a new approach to modelling shifts in, and interactions between, climate processes has been developed to investigate this phenomenon further. In addition the project has found that the long-term climate model simulations indicate that the recent low precipitation sequence is uncommon but not extreme and that natural climate variability is the most likely major cause of the observed reduction in winter rainfall. It is reported however that the enhanced greenhouse effect may have also contributed to the winter rainfall decline.
The results to date indicate that there overall there is some skill in predicting total rainfall and mean temperatures for spring and summer, and extreme temperatures in summer.

104 | Summary report
Melbourne Water – Climate Change Adaptation study
About the project
The Climate Change Adaptation Program was initiated to link the risk areas identified in Melbourne Water’s ‘Implications of potential climate change for Melbourne’s water resources’ project, completed in 2005. The main elements of the program are the development of the Adaptation Actions Plans (AAPs) and an overarching Climate Change Adaptation Strategy for Melbourne Water. Melbourne Water’s climate change and variability science and research program underpins many of actions within the climate change adaptation action plans and the work undertaken across the business. The research assists Melbourne Water to better understand and quantify the projections and risks to their future demand and supply. Melbourne Water is also an industry partner in a number of collaborative research initiatives aimed at improving our understanding of potential climate conditions. These initiatives include:
the reconstruction for the Thomson Reservoir reconstructing pre-20th century south-eastern Australian climate uncertainty assessment of climate change projections of Australian river
flows.
Study region Melbourne Water manages Melbourne’s water supply catchments, removes and treats most of Melbourne’s sewage, and manages rivers and creeks and major drainage systems throughout the Port Phillip and Westernport region.
Methodology Strategic and whole of government responses. Business and Operation Adaptation Action Plans. Climate Change Adaptation Strategy. Climate change research. Collaboration with other agencies and organisations.
Outcomes The improved understanding of climate change science gained from undertaking a number of collaborative studies will be used by Melbourne Water to review the appropriateness of the climate change projections for planning purposes and for use in the development and implementation of AAPs.

105 | Summary report
Reconstruction of drought history in eastern Australia using speleothems
About the project
This collaborative project is being undertaken by the Sydney Catchment Authority via an ARC Linkage project grant and University of Newcastle.
Its aim is to use speleothems (limestone deposits) from the Warragamba catchment (Wombeyan Caves) to reconstruct rainfall history over the past 2,000 years.
Prediction and risk assessment under the existing models are constrained by insufficient knowledge of the relationships between rainfall, catchment moisture and reservoir inflows, and their dependence on the El Niño-Southern Oscillation (ENSO) and the Interdecadal Pacific Oscillation (IPO).
The intended outcome of the project is to integrate the data into hydroclimatological models currently used to forecast inflows to the numerous water storage reservoirs supplying the Sydney region, and assess contemporary and long-term drought risk.
The timeframe of the project is:
Oct 2009 complete speleothem age dating Feb 2010 complete speleothem report and interpretation April 2010 complete flood plain sediment dating September 2010 complete integration of results and final report.
Study region Wombeyan Caves, 100 km south-southwest of Sydney.
Methodology Stage 1 – Relationships between modern stalagmite geochemistry and rainfall. Stage 2 – Palaeohydrological reconstruction from ‘ancient’ stalagmites. Stage 3 – Placing the Wombeyan record into a regional context.
Outcomes Stage 1 Magnesium content reflects the rainfall structure, where lower values equate
to higher rainfall (and vice-versa) and are consistent with Wombeyan drip studies.
The oxygen-18 profile appears to closely match the winter balance. Stage 2
Two older stalagmites span ~2,000 years. The record shows positively co-varying magnesium and carbon-13 signals
driven by moisture supply. The last 100 years or so have been relatively wet compared with the
previous ~ 1,000–1,500 years. Stage 3
Refinements to chronology and palaeo-meteorology and flood/drought risk modelling to be completed.
Comment Preliminary analysis suggests that the 20th century in the Wombeyan region was relatively wet compared to the previous 1,500 years or so. These results will be refined based on further age-dating model calibration and assessment of uncertainties.

106 | Summary report
South Eastern Australian Climate Initiative (SEACI)
About the project
SEACI is a collaboration between the Murray–Darling Basin Authority, Victorian Department of Sustainability and Environment, Department of Climate Change, Managing Climate Variability Program, CSIRO, Bureau of Meteorology. The Murray–Darling Basin Authority is the managing agency, with the research being carried out by CSIRO and the Bureau of Meteorology.
Phase 1 of SEACI began in 2006 and was completed on 30 June 2009. This phase involved 40 research projects in three research themes which aimed to provide authorities with the knowledge required to manage water in a changing climate, including: assessing the current level of knowledge about climate variability and its drivers over south eastern Australia; determining the extent to which climate in south-eastern Australia is likely to change; and applying the improved understanding of south-east Australia’s climate to develop new forecasts for streamflows and crop yields.
Phase 2 of the SEACI program started on 1 July 2009 and is scheduled for completion on 30 June 2012. The program of research for Phase 2 builds on the outcomes of Phase 1 of SEACI, in which detailed findings were made on climate impacts and prediction across the region. Phase 2 has both strategic and applied components, with the results of the strategic research being applied to practical problems in water management. While the applied research is focused on understanding the impacts of climate on water management issues, the research will clearly be applicable to a range of other impact studies.
Study region South-eastern Australia – an area encompassing the Murray–Darling Basin, all of Victoria and parts of South Australia, including the agricultural areas of the Eyre Peninsula.
Methodology 2030 and 2070.
A2, A1F1, A1B, B1 scenarios.
3 GCMs: CSIRO Mk3.5 (Australia); GFDL-CM2.0 (USA); MRI-CGCM2.3.2a (Japan).
Climate simulation model : Conformal Cubic Atmospheric Model (CCAM), statistical downscaling model (SDM), stochastic downscaling model (STM), coupled atmosphere-ocean-land climate model (POAMA), single global circulation model – the NCAR (USA) CCSM3 model.
20 km resolution scale.
Outcomes Suggests that south-eastern Australia is likely to be warmer and drier in future decade, especially in winter.
The identified causes show imprints of climate change, in part through a reduction in the number of La Niña events, and in part through changing weather systems originating from the subtropical Indian Ocean that are conducive to late autumn rainfall across Victoria.
Climate Change and its impacts on water supply and demand in Sydney
NSW Office of Water
October 2010
ISBN 978-1-74263-095-3 (print version)
ISBN 978-1-74263-094-6 (online version)
The NSW Office of Water is a separate office within the Department of Environment, Climate Change and Water.
© State of New South Wales through the Department of Environment, Climate Change and Water, 2010.
This material may be reproduced in whole or in part for educational and non-commercial use, providing the meaning is unchanged and its source, publisher and authorship are clearly and correctly acknowledged.
For enquiries, please contact [email protected]
Disclaimer
While every reasonable effort has been made to ensure that this document is correct at the time of publication, the State of New South Wales, its agents and employees, disclaim any and all liability to any person in respect of anything or the consequences of anything done or omitted to be done in reliance upon the whole or any part of this document.
Printed on Mega Recycled Silk, consisting of 50% post consumer recycled waste and 50% FSC certified fibre.
Related Documents