Climate Change, Agricultural Production and Food Security: Evidence from Yemen by C. Breisinger, O. Ecker, P. Al-Riffai, R. Robertson, R. Thiele, M. Wiebelt No. 1747 | November 2011

Welcome message from author
This document is posted to help you gain knowledge. Please leave a comment to let me know what you think about it! Share it to your friends and learn new things together.
Transcript

Climate Change, Agricultural Production and Food Security: Evidence from Yemen
by C. Breisinger, O. Ecker, P. Al-Riffai, R. Robertson, R. Thiele, M. Wiebelt
No. 1747 | November 2011

Kiel Institute for the World Economy, Hindenburgufer 66, 24105 Kiel, Germany
Kiel Working Paper No. 1747 | November 2011
Climate Change, Agricultural Production and Food Security: Evidence from Yemen
Clemens Breisinger*, Olivier Ecker*, Perrihan Al-Riffai*, Richard Robertson*, Rainer Thiele**, Manfred Wiebelt** Abstract: This paper provides a model-based assessment of local and global climate change impacts for the case of Yemen, focusing on agricultural production, household incomes and food security. Global climate change is mainly transmitted through rising world food prices. Our simulation results suggest that climate change induced price increases for food will raise agricultural GDP while decreasing real household incomes and food security. Rural nonfarm households are hit hardest as they tend to be net food consumers with high food budget shares, but farm households also experience real income losses given that many of them are net buyers of food. The impacts of local climate change are less clear given the ambiguous predictions of global climate models (GCMs) with respect to future rainfall patterns in Yemen. Local climate change impacts manifest itself in long term yield changes, which differ between two alternative climate scenarios considered. Under the MIR scenario, agricultural GDP is somewhat higher than with perfect mitigation and rural incomes rise due to higher yields and lower prices for sorghum and millet. Under the CSI scenario, positive and negative yield changes cancel each other out. As a result, agricultural GDP and household incomes hardly change compared to perfect mitigation.
Keywords: Climate Change, Agriculture, Food Security, Model-based Assessment, Yemen
JEL classification: C63, C68, O13, O53, Q54 *International Food Policy Research Institute (IFPRI) Washington, D.C, USA Telephone: +1(202)862-4638 E-mail: [email protected]
**Institute for the World Economy (IfW) 24100 Kiel, Germany Telephone: +49(0)431-8814 211/-215 E-mail: [email protected] [email protected]
____________________________________ The responsibility for the contents of the working papers rests with the author, not the Institute. Since working papers are of a preliminary nature, it may be useful to contact the author of a particular working paper about results or caveats before referring to, or quoting, a paper. Any comments on working papers should be sent directly to the author.
Coverphoto: uni_com on photocase.com
1
1. Introduction
Climate change impacts countries’ economies and food security through a variety of channels.
Rising temperatures and changes in rainfall patterns affect agricultural yields, of both rainfed and
irrigated crops. The unchecked rise of sea levels leads to loss of land, landscape and
infrastructure. A higher frequency of droughts may impair hydropower production, and an
increase in floods can significantly raise public investment requirements for physical
infrastructure (Stern 2006, World Bank 2007, Garnault 2008, Yu et al. 2010a, Yu et al. 2010b).
These sector-level impacts will have knock-on effects on other sectors and thus impact economic
growth, food security and household incomes.
Global economic effects of climate change also affect individual countries through changes in
food supply, trade flows and commodity prices (Nelson et al. 2010; Breisinger et al. 2011). For
example, Nelson et al. (2009, 2010) project that global food prices are bound to increase
substantially as a consequence of continued high population growth, changing food consumption
patterns and climate change. Taking higher food prices into consideration is therefore important
for any climate change impact assessment at the country level. Depending on the net import or
export position of countries and the net producing and consuming status of households regarding
the specific commodities affected, the agricultural sector, household incomes and food security
are likely to be affected differently. Yet, despite the potentially significant effects of climate
change induced changes in world commodity prices, existing country level economic impact
assessments have largely neglected this global dimension.
To address this gap in the literature, the present paper provides an evaluation of both local and
global climate change for one particular country, Yemen, focusing on the impacts on agriculture
and household-level food security while accounting for economy-wide repercussions. To allow
for such a comprehensive impact assessment, we employ an integrated modeling framework that
combines biophysical, economic and nutrition modules. The integration of a nutrition module,
which enables us to establish a link between climate change and hunger, constitutes a major
innovative feature of our approach.
Yemen is an interesting case in point because both global and local climate change impacts are
likely to matter for its future development, given the country’s high levels of food import

2
dependency, food insecurity and poverty. It imports between 70-90 percent of cereals and is a net
importer of many other food items (Ecker et al. 2010). It is also the poorest country in the Arab
world, with an estimated 43 percent of the people living in poverty, and is among the most food
insecure countries in the world, with 32 percent of the population lacking access to enough food,
most of them in rural areas (Breisinger et al. 2010, Ecker et al. 2010). The ongoing uprising and
the projected sharp declines in oil exports will arguably further increase the number of poor and
food insecure people. Climate change may thus add to the already huge development challenges
that Yemen is facing.
The remainder of the paper is structured as follows. Section 2 introduces the empirical
framework of the study and describes its major components. Section 3 presents the results of the
climate change impact assessment covering the period 2010-2050. Section 4 summarizes the
main findings and provides some policy conclusions.
2. Modeling framework
The analytical framework used in this paper integrates various modeling components that range
from the macro to the micro and from processes that are driven by economics to those that are
essentially biophysical in nature. In a first step, simulations of future climate conditions
(temperature, rainfall) from Global Climate Models (GCMs) are spatially downscaled and fed
into a crop simulation model,1 which assesses the changes in yields for crops in different agro-
ecological zones. Output from the crop simulation model informs IFPRI’s IMPACT model,
which projects climate-related changes in world food prices. Both the simulated yield changes
and the price projections then enter into a Dynamic Computable General Equilibrium (DCGE)
model to assess the local and global impacts of climate change on Yemen’s economy. Finally,
simulated changes in household incomes from the DCGE model are employed to perform
microsimulations of changes in food security.
1 For more information on the downscaling methodology, see Breisinger et al. (2011).

3
2.1 Local impacts: Crop simulation model
Yield changes are determined for the six major agro-ecological zones making up Yemen (see
Figure 1). Four crops important to Yemen are considered: maize, millet, sorghum, and wheat.
The projected yields come from simulations using the DSSAT crop modeling framework. The
DSSAT model is an extremely detailed process-oriented model of the daily development of a
crop, from planting to harvest-ready (Jones et al. 2003). It requires a large amount of input data,
such as daily maximum and minimum temperatures and precipitation, but then is able to step
through the prospective growing season and model how the plant grows, uses water and
nutrients, responds to the weather, and ultimately accumulates mass in the harvested portion of
the plant. This specificity make the crop models a very powerful tool for assessing the potential
effects of climate change on crop yields at a very local geographic level, which can then be
aggregated for being used in economic models.
Figure 1: Agro-ecological zones in Yemen
Zone 1: Upper highlands Zone 2: Lower highlands
Zone 3: Red Sea and Tihama Plain Zone 4: Arabian Sea coast
Zone 5: Internal Plateau Zone 6: Desert
5
6
4
3
1
2

4
The most important inputs for this application were the choice of planting dates and the climatic
conditions. The planting dates were chosen via a two-step process. First, the generally prevalent
planting seasons were determined by region: the evidence suggests that planting occurs roughly
in July in the higher altitudes and roughly in March in the lower ones. This target planting month
was used as the middle of a three month window, with yields predicted for each month in the
window. Within each month, two planting dates were used and all the resulting yields averaged
together. Finally, the overall yield was taken as the highest of the three monthly yields. This
approach allows for some diversity in the timing of planting (as is expected in the real world) as
well as some flexibility since the target planting month might not be quite correct in all locations.
To capture future climate conditions, we used two scenarios (CSIRO A1B and MIROC A1B)
from the IPPC’s Fourth Assessment Report A2. We assume that all climate variables change
linearly between their values in 2000 and 2050. This assumption eliminates any random extreme
events such as droughts or high rainfall periods and also assumes that the forcing effects of GHG
emissions proceed linearly; that is, we do not see a gradual speedup in climate change. The effect
of this assumption is to underestimate negative effects from climate variability.
In general, the seasonal patterns of temperature and precipitation do not change much between
the baseline and 2050 projections, so the same planting date window was used for both. Of
course, the temperatures and rainfall amounts do change, resulting in sometimes dramatically
different yields. Since the crop simulation models require daily weather data and the climate data
are only available as monthly averages, a random weather generator within the DSSAT
framework (SIMMETEO) was used to create daily realizations consistent with the monthly
averages. For each individual planting date, 40 years of simulations were run using different
weather for each one. Thus, for one planting month, the final average yield was based on 80
separate weather realizations.
2.2 Global impacts: IFPRI IMPACT model
The IMPACT model employed to project changes in world food prices is a partial equilibrium
agricultural model with 32 crop and livestock commodities, including cereals, soybeans, roots
5
and tubers, meats, milk, eggs, oilseeds, oilcakes and meals, sugar, and fruits and vegetables.2
IMPACT distinguishes 115 countries (or in a few cases country aggregates), within each of
which supply, demand, and prices for agricultural commodities are determined. Large countries
are further divided into major river basins. The resulting entities are called food production units
(FPUs). The model links the various countries and regions through international trade using a
series of linear and nonlinear equations to approximate the underlying production and demand
relationships. World agricultural commodity prices are determined annually at levels that clear
international markets. Growth in crop production in each country is determined by output and
input prices, exogenous rates of productivity growth and area expansion, investment in irrigation,
and water availability. Demand is a function of prices, income, and population growth. Four
categories of commodity demand are distinguished: food, feed, biofuels feedstock, and other
uses.
To account for the impact of climate change, the IMPACT modeling system combines the
biophysical DSSAT crop modeling suite of responses of selected crops to climate, soil, and
nutrients with the SPAM dataset of crop location and management techniques (You and Wood,
2006). Climate change effects on crop production enter into the IMPACT model by altering
location-specific yield growth rates between 2010 and 2050 for each of the crops modeled with
DSSAT.
A major challenge is to come up with an aggregation scheme to take outputs from the crop
simulation model to the IMPACT FPUs. The process we used is as follows. First, within a FPU,
we chose the appropriate SPAM dataset, with a spatial resolution of 5 arc-minutes
(approximately 10 km at the equator) that corresponds to the crop/management combination. The
physical area in the SPAM data set is then used as the weight to find the weighted-average yield
across the FPU. This is done for each climate scenario (including the no-climate-change
scenario). The ratio of the weighted-average yield in 2050 to the no-climate-change yield is then
used to adjust the yield growth rate in the IMPACT model to reflect the effects of climate
change.
2 For a technical description of the IMPACT model, see e.g. Rosegrant et al. (2008).

6
2.3 Economic model
Climate change affects world prices and local agricultural production with implications for the
whole economy. Moreover, spatial variation in climate change impacts within countries means
that such effects can vary across sub-national regions. We therefore develop a DCGE model for
Yemen, distinguishing the six agro-ecological zones shown in Figure 1 to capture the major
linkages between climate change, production and households. An early version of this DCGE
model can be found in Thurlow (2004), while its recent applications to Yemen include
Breisinger et al. (2009).
Producers in the model are price takers in output and input markets and maximize profits using
constant returns to scale technologies. Primary factor demands are derived from constant
elasticity of substitution (CES) value added functions, while intermediate input demand by
commodity group is determined by a Leontief fixed-coefficient technology. The decision of
producers between production for domestic and foreign markets is governed by constant
elasticity of transformation (CET) functions that distinguish between exported and domestic
goods in each traded commodity group in order to capture any quality-related differences
between the two products. Under the small-country assumption, Yemen faces perfectly elastic
world demand curves for its exports at fixed world prices. On the demand side, imported and
domestic goods are treated as imperfect substitutes in both final and intermediate demand under
a CES Armington specification. Households use their incomes to consume commodities
according to a linear expenditure system (LES) specification.
There are six labor categories in the model, differentiated by their skills (unskilled, semi-skilled,
and skilled) and their dominating employment in public or private sectors. All types of labor are
assumed to be fully employed and mobile across sectors. The assumption of full employment is
consistent with widespread evidence that, while relatively few people have formal sector jobs,
the large majority of working-age people engage in activities that contribute to GDP. Capital is
also assumed to be fully employed and mobile across sectors reflecting the long term perspective
of this study. In agriculture cultivated land is sector-specific, i.e. it cannot be reallocated across
crops in response to shocks. Moreover, cropping decisions are made at the beginning of the
period before the realization of climate shocks is imposed.
7
The DCGE model is specifically built to capture the economic, distributional, and nutrition
effects of climate change in Yemen. Given the importance of agriculture for income generation
and the satisfaction of consumption needs, the model captures both the sectoral and spatial
heterogeneity of crop production and its linkages to other sectors such as food processing,
manufacturing and services. The model includes 26 production activities and commodities, 9
factors of production, including livestock, and 18 household types. The 21 agricultural
production activities are split into livestock (4), fishing (1), forestry (1) and crop production
activities (15), where all agricultural production activities are specific to each agro-ecological
zone. Other production sectors and commodities included in the model are mining, including oil
(1), food processing (1), (other) industry (1), electricity and water (1), and services (1). The
household groups are first separated regionally by agro-ecological zones and, within each agro-
ecological zone, into urban and rural households. We then split rural households in each agro-
ecological zone into farm and nonfarm households. This differentiation of household groups
allows us to capture the distinctive patterns of income generation and consumption as well as the
distributional impacts of climate change.
The model runs from 2009 to 2050 and is recursive dynamic. Investments are savings-driven and
savings grow proportionally to households' income. Capital is fully employed and mobile to
reflect the long term perspective of the analysis. The Yemeni workforce is assumed to grow at
the same rate as the population grows following an average long term trend of 2 percent as
projected by the UN (UN 2010). Land is fixed, which means that current cultivated land cannot
be expanded in the future. This assumption seems reasonable given the limited growth potential
of the agricultural sector due to severe water constraints. Finally, total factor productivity (TFP)
is assumed to grow at 1 percent annually for non agricultural sectors and at 0.5 percent annually
for agricultural sectors over the period 2009-2050. This two-speed TFP growth depicts the
expected structural change under a business as usual scenario that is observed in many
transforming countries (Breisinger and Diao 2008).
The model allows for some autonomous adaptation to climate change. Yield changes from the
DSSAT model enter the production function of the DCGE model. These crop-specific and agro-
ecological zone-specific changes in productivity change the returns to factors and alter output
prices. For example, farm households can decide to employ their factors of production, such as

8
labor, for nonfarm activities instead of growing crops and raising livestock. Or imported food
can replace locally grown food when relative prices of locally grown food increase (and vice
versa). A set of important elasticities guide these adjustments, including the substitution
elasticity between primary inputs in the value-added production function, the elasticity between
domestically produced and consumed goods and exported or imported goods; and the income
elasticity in the demand functions. We estimated the income elasticities for Yemen from a semi-
log inverse function suggested by King and Byerlee (1978). Estimates range from 0.3 for grains
to 2.2 for services. For the factor substitution elasticity we choose 3.0, the elasticity of
transformation is 4.0 and the Armington elasticity is 6.0 for all goods and services.
2.4 Nutrition model
The DCGE model is linked to a nutrition-simulation model, which allows for the endogenous
determination of climate-change impacts on food insecurity. For assessing changes in people’s
food situation as a response to changes in their income levels (measured on the basis of
household total expenditure), we use an expenditure elasticity-based approach that captures the
percentage change in per capita calorie consumption in response to a one percent change in
household total expenditure (Ecker et al. 2011). The calorie consumption elasticities with respect
to household expenditure are derived from a reduced-form demand model. The model has
households’ per capita calorie consumption as dependent variable and total per capita
expenditure (in logarithmic terms) as independent variable and controls for structural differences
between households in their gender and age composition and educational level, their levels of
food self-sufficiency and qat consumption, and regional and seasonality patterns.3 Depending on
the income level, we calculate household-specific calorie consumption elasticities. On average, a
one-percent increase in household per capita income is associated with an increase in people’s
per capita calorie consumption of 0.3 percent.
To simulate the effects of climate change on food security, we combine the annual real income
growth rates obtained from the DCGE model with the calorie consumption elasticities from the
econometric model for each household individually. Assuming specific changes in different
macroeconomic parameters under different climate change scenarios, we predict a new calorie
3 See Appendix 1 for the regression results.

9
consumption level for each household per annum, subject to the estimated annual income
changes. The simulation equation is (neglecting subscripts for households):
)1(ˆ ,1,, jijiji cEyy ,
where jiy ,ˆ is a household’s predicted calorie consumption level under scenario i in year j, 1, jiy
is the calorie consumption level in the previous year, E is the household-specific calorie
consumption-expenditure elasticity, and jic , is the annual income change of the household the
person belongs to under scenario i and in year j. A household’s new calorie consumption level is
then related to its individual requirement level to identify whether the household is suffering
from hunger or is sufficiently supplied with dietary energy. The household-specific requirement
levels are calculated based on the household’s sex and age composition and the individual
physiological dietary energy requirements of the household members, using standard reference
levels from FAO/WHO/UNU (2001). Households with calorie consumption levels below the
household-specific threshold are considered as calorie deficient or hungry. Using household size
and population estimates from the 2010 Revision of World Population Prospects (UN, 2010), we
calculate the prevalence rate and number of hungry people.
Based on the DCGE and hunger micro simulation model we design three sets of scenarios. The
first set of scenarios captures the global impacts of climate change, while the second set of
scenarios assesses the local impacts of climate change. The third set combines the two to assess
the joint effects (Table 1). Within the first set of scenarios, we design three variants: scenario 1
changes the world food prices consistent with IMPACT model results under perfect mitigation of
climate change. Scenario 1A explores climate change-related price effects under MIROC A1B,
with the assumption that no climate change impacts are felt locally in Yemen. Scenario 1B is a
scenario to test the sensitivity of results to alternative price projections under CSIRO A1B (see
Figure 2 below for alternative price changes). Scenario 2 imposes the yield changes from the
DSSAT model on a crop by crop level and by agro-ecological zone. Results for scenarios 1A-3B
are reported as a change from the perfect global mitigation scenario to isolate the climate change
effects.

10
Table 1: Climate change scenarios
Scenarios Change in model Input Baseline See text See text
Global impacts of climate change Scenario 1 Perfect mitigation, compared to base IMPACT, Perfect mitigation Scenario 1A Climate change IMPACT, MIROC A1B Scenario 1B Climate change IMPACT, CSIRO A1B
Local impacts Scenario 2A Crop yield changes DSSAT MIROC A1B Scenario 2B Crop yield changes DSSAT CSIRO A1B
Joint impacts Scenario 3A 1A and 2A IMPACT& DSSAT, MIROC A1B Scenario 3B 1B and 2B IMPACT& DSSAT, CSIRO A1B
3. Impacts of Climate Change
Before turning to the simulations, we briefly describe some structural characteristics of Yemen’s
economy and its food security situation in order to set the stage for the evaluation of climate
change impacts.
3.1 Structure of the economy and food security
Oil and agriculture are the two mainstays of the Yemeni economy, but both are under threat
thereby increasing the country’s vulnerability to global commodity price changes. Oil reserves
are set to run out by the beginning of the next decade, and aquifers upon which irrigated
agriculture depends have been seriously depleted in recent years. Although oil is still the
dominating sector, production is on a declining trend indicating that other sectors in the economy
will have to increasingly contribute to growth. In the absence of new oil discoveries, it is
estimated that Yemen may become a net importer of oil as soon as 2016. This will have a
significant impact on the economy given that oil revenues account for 60 percent of government
receipts and almost 90 percent of exports (IMF 2009 and Table 2). Yemen is also a net importer
of major food items, including maize, wheat, other grains, livestock, fish and processed food.
Agriculture’s trade orientation is very uneven, with imports accounting for more than a third of
total domestic consumption and exports accounting for less than five percent of domestic
production.

11
Table 2: Structure of the Yemeni Economy by Sector, 2009
GDP Private
consumptionExport share
Export intensity
Import share
Import intensity
Sorghum 0.3 0.6 0.0 1.4 0.0 0.4 Maize 0.1 0.8 0.0 1.3 1.1 68.9 Millet 0.1 0.2 Wheat 0.2 5.4 0.1 6.2 8.7 93.6 Barley 0.1 0.2 Other grains 0.0 2.4 3.8 99.8 Fruits 0.9 1.5 0.5 12.0 0.3 10.0 Potatos 0.4 0.7 0.2 9.3 0.0 1.1 Vegetables 1.1 2.3 0.1 2.0 0.1 3.2 Pulses 0.2 0.4 Coffee 0.2 0.5 54.7 0.0 2.6 Sesam 0.0 0.0 10.4 Cotton 0.1 0.0 5.3 0.0 3.3 Qat 2.8 5.5 Tobacco 0.2 0.8 0.8 61.1 Camel 0.1 0.5 71.0 0.0 15.5 Cattle 0.4 0.1 2.3 0.2 10.0 Poultry 0.6 0.5 10.5 Goat&sheep 0.4 0.1 3.1 0.3 15.7 Fish 0.3 0.0 0.1 0.0 0.3 Forestry 0.2 0.7 0.5 41.9 Mining 22.5 1.0 88.7 95.0 Food processing 4.0 26.5 1.5 3.6 13.9 33.8 Other industry 10.9 18.8 1.2 1.9 69.7 61.3 Utilities 1.2 1.9 Services 53.1 30.4 6.6 2.2 TOTAL, of
which: 100.0 100.0 100.0 18.0 100.0 24.0 Agriculture 8.4 21.5 2.1 4.5 16.3 34.4 Non-agriculture 91.6 78.5 97.9 19.2 83.7 22.7
Note: Import intensities are calculated as shares of total domestic consumption (final and intermediate). Export intensities are the ratios of exports to domestic production.
Source: Yemen DCGE model
Agriculture and related processing contribute about 13 percent to GDP, about three quarters of
which is produced in the highly populated agro-ecological zones 1 and 2 (the Upper and Lower
highlands, with 30 and 40 percent of the total population living in these zones). Qat – a mild
narcotic – accounts for over one-third of agricultural GDP and about 40 percent of total water
resource use. Vegetables and fruits make up another one-third of agricultural GDP. Livestock

12
and cereals contribute about 20 and 10 percent to agricultural GDP, respectively (Table 3). Qat is
almost exclusively concentrated in agro-ecological zones 1 and 2, while other water-intensive
crops such as fruits and vegetables are also grown in zone 3 (the Red Sea and Tihama Plain).
Agro-ecological zones 1 and 2 are the two main contributors to agricultural and overall GDP,
followed by zones 3, 5, 4 and 6. The latter three zones together account for only 8 percent of
agricultural GDP. Food and agriculture-related processing makes up about 50 percent of
household consumption expenditures. Within this category, food processing constitutes the
largest share of consumption, followed by cereals, qat, vegetables and fruits (Table 2).
A major determinant of food security at the household level is household income. Dividing up
households according to socio-economic characteristics, such as their location and occupation
allows for the analysis of income and distributional effects of climate change. Farm households,
which make up about 24 percent of total population, earn about 16 percent of all household
incomes, while the population and income shares are 49 and 47 percent for rural non-farm
households and 27 and 37 percent for urban households. As expected, household income levels
are strongly related to factor and human capital endowments. Farm households receive most of
their income from unskilled labor and land (each about 30 percent), while urban households rely
more on skilled labor (about 55 percent). The dominating income source of rural non-farm
households is unskilled and semi-skilled labor.
The food security situation in Yemen is highly vulnerable to shocks such as food price surges
and climate variability. The vulnerability is demonstrated by the relatively small difference
between what Yemenis consume every day and what they need to stave off hunger at their
current level of activity—less than 300 kcal/day nationwide (Table 4). This means that the
average Yemeni consumes only 15 percent more than the 2,019 kcal/day needed to avoid hunger.

13
Table 3: Agricultural value added by zone and crop, 2009 (Billions of Yemeni Rials and percent) Activity Zone 1 Zone 2 Zone 3 Zone 4 Zone 5 Zone 6 Total
billions YR
per-cent
billions YR
per-cent
billions YR
per-cent
billions YR
per-cent
billions YR
per-cent
billions YR
per-cent
billions YR
per-cent
Sorghum 7.36 5.25 5.10 3.09 3.65 4.71 0.07 0.67 0.10 0.54 0.00 0.01 16.29 2.68 Maize 2.50 1.78 4.09 2.48 0.35 0.46 0.01 0.06 0.01 0.04 0.00 0.02 6.96 1.12 Millet 1.83 1.31 0.55 0.33 2.59 3.35 0.03 0.29 0.01 0.03 0.00 0.00 5.01 0.96 Wheat 1.03 0.73 6.05 3.66 0.17 0.22 0.00 0.00 0.19 0.97 0.05 1.95 7.48 1.23 Other grains 0.19 0.14 3.53 2.14 0.04 0.05 0.01 0.05 0.00 0.03 3.76 0.91 Fruits 4.55 3.25 8.35 5.06 23.87 30.80 0.15 1.35 8.81 45.81 0.02 0.84 45.76 13.86 Potatos 15.78 11.26 0.79 0.48 0.86 1.10 0.01 0.05 0.18 0.94 0.00 0.02 17.60 2.62 Vegetables 8.88 6.34 11.67 7.07 7.36 9.49 2.29 20.65 1.33 6.91 0.04 1.34 31.56 8.25 Tomatos 10.78 7.69 3.62 2.19 5.22 6.74 0.20 1.77 2.04 10.62 0.03 1.26 21.90 4.68 Pulses 5.77 4.12 0.70 0.43 1.51 1.95 0.19 1.70 0.05 0.25 0.01 0.34 8.23 1.26 Coffee 0.29 0.21 7.41 4.49 0.02 0.03 7.73 1.21 Sesam 0.03 0.02 0.04 0.02 0.34 0.44 0.00 0.03 0.59 3.07 0.27 10.45 1.27 0.48 Cotton 0.24 0.15 5.02 6.48 0.05 0.41 0.00 0.00 0.00 5.31 5.17 Qat 55.95 39.93 84.18 50.99 0.06 0.08 0.00 0.01 0.00 0.00 0.02 0.57 140.20 18.93 Tobacco 0.11 0.06 8.54 11.01 0.01 0.07 8.65 1.97 Camel 0.22 0.16 0.52 0.31 0.28 0.36 0.52 4.71 1.20 6.23 1.34 51.09 4.07 1.82 Cattle 3.75 2.68 10.25 6.21 3.66 4.72 0.51 4.61 0.12 0.64 0.06 2.45 18.36 4.65 Poultry 17.38 12.40 10.18 6.16 1.42 1.83 0.41 3.65 0.59 3.05 0.03 1.19 29.99 4.69 Goat, sheep 3.83 2.74 7.73 4.68 2.45 3.17 2.58 23.26 4.01 20.86 0.74 28.43 21.36 7.26 Fish 10.09 13.02 4.08 36.71 14.17 16.22 Total 140.11 100.00 165.09 100.00 77.50 100.00 11.10 100.00 19.23 100.00 2.61 100.00 415.66 100.00 Percent 33.71 39.72 18.64 2.67 4.63 0.63 100.00
Source: Yemen DCGE model

14
Table 4: Food insecurity by residential area in 2009 Food
insecurity
rate
(percent)
Number of
food‐insecure
people
(thousand)
Per capita
calorie
consumption
(kcal/day)
Per capita
calorie gap
(kcal/day)
All 32.1 7,481 2,301 282
Urban 17.7 1,102 2,160 380
Rural 37.3 6,378 2,352 246 Source: IFPRI estimation based on 2005–2006 HBS data.
People in rural areas are more likely to fall into food insecurity than people living in urban areas.
Although the average per capita calorie consumption in rural areas is 200 kcal/day higher than in
urban areas, the average per capita calorie gap is lower by about 130 kcal/day. This difference is
the result of the significantly higher calorie needs of rural people (2,106 kcal/day on average)
compared with urban people (1,708 kcal/day on average). Rural people need more calories for
fetching water from wells, carrying goods to and purchases from markets over long distances,
and working hard on farms and in fisheries.
It is against these structural characteristics of the Yemeni economy and its households that the
next sections analyze the potential impacts of climate change.
3.2. Global impacts of climate change
World food prices are projected to increase through demographic and income effects, which are
augmented by climate change. Figure 2 reports the effects of the climate-change scenarios of two
global climate models on world food prices (CSIRO A1B and MIROC A1B). It also shows the
price effects under perfect mitigation. With perfect mitigation, world prices for important
agricultural crops such as wheat and maize will increase between 2000 and 2050 under both
scenarios, driven by population and income growth and biofuels demand. The price of maize and
wheat is projected to rise by 63 percent and 39 percent, respectively. Climate change results in
additional price increases – a total of 52 to 55 percent for maize and 94 to 111 percent for wheat
(Nelson, 2009).4 Prices of vegetables and fruits as well as cotton hardly change over time in the
perfect mitigation scenario, but are expected to rise considerably as a consequence of climate
change. Livestock are not directly affected by climate change in the IMPACT model. However, 4 In addition to various CGMs, Nelson et al. (2010) also include low/medium/high assumptions on population and GDP per capita growth. For this study, we use the medium level assumptions.

15
the effects of higher feed prices caused by climate change pass through to livestock, resulting in
somewhat higher meat prices.
Figure 2: Global food price scenarios
Source: IFPRI IMPACT model.
16
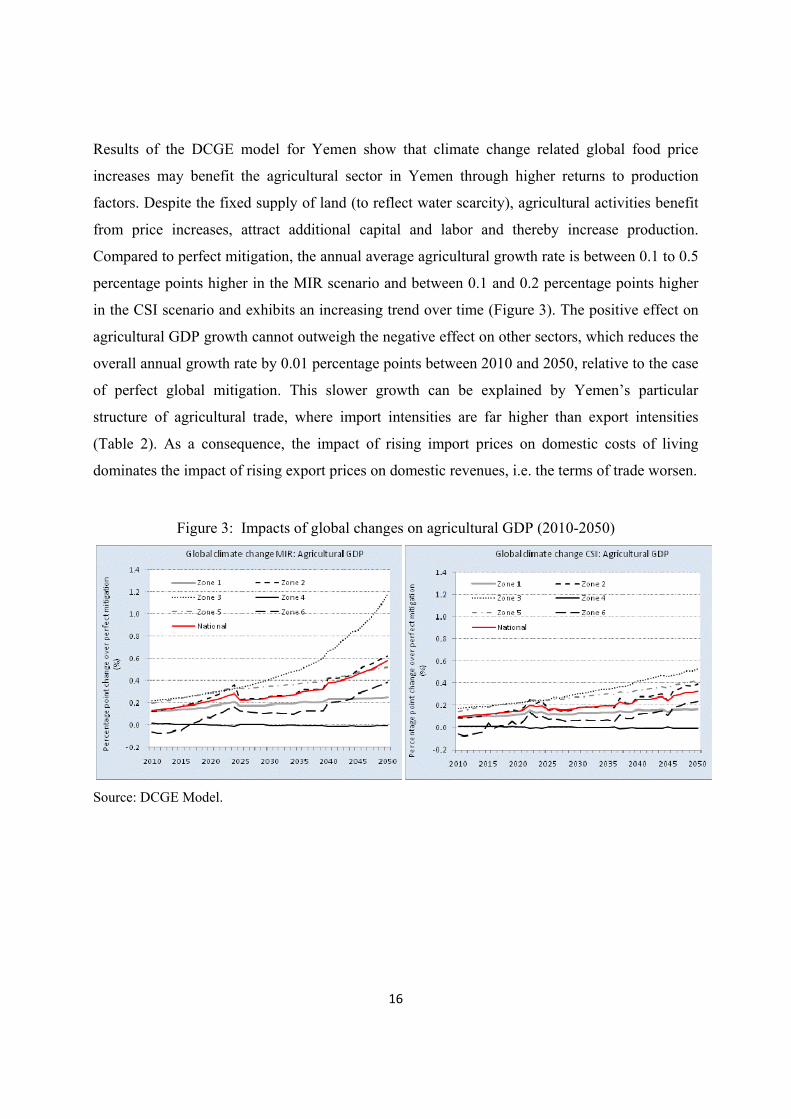
Results of the DCGE model for Yemen show that climate change related global food price
increases may benefit the agricultural sector in Yemen through higher returns to production
factors. Despite the fixed supply of land (to reflect water scarcity), agricultural activities benefit
from price increases, attract additional capital and labor and thereby increase production.
Compared to perfect mitigation, the annual average agricultural growth rate is between 0.1 to 0.5
percentage points higher in the MIR scenario and between 0.1 and 0.2 percentage points higher
in the CSI scenario and exhibits an increasing trend over time (Figure 3). The positive effect on
agricultural GDP growth cannot outweigh the negative effect on other sectors, which reduces the
overall annual growth rate by 0.01 percentage points between 2010 and 2050, relative to the case
of perfect global mitigation. This slower growth can be explained by Yemen’s particular
structure of agricultural trade, where import intensities are far higher than export intensities
(Table 2). As a consequence, the impact of rising import prices on domestic costs of living
dominates the impact of rising export prices on domestic revenues, i.e. the terms of trade worsen.
Figure 3: Impacts of global changes on agricultural GDP (2010-2050)
Source: DCGE Model.

17
Impacts on agricultural GDP growth vary by agro-ecological zone depending on the zones’
production structure. In general, those zones which produce more of the commodities that
experience the largest world market price increases relative to other commodities benefit the
most (Figure 3). The average annual agricultural growth rate in zones 1-6 ranges between -0.06
percentage points below and 1.2 percentage points above the perfect mitigation scenario over the
entire period. Producers in zone 3 disproportionately benefit from rising prices for a range of
commodities such as fruits, vegetables and cotton, whereas at the other extreme agricultural GDP
in zone 4 does not rise at all because a large share of its value added is not affected by price
changes. The pattern of responses of agricultural growth to global climate change is the same
irrespective of which of the two climate scenarios we adopt. Yet, impacts are generally
somewhat dampened in the CSI scenario, which is due to the fact that this scenario predicts a
more moderate rise in global food prices (Figure 2). Most notably, agricultural growth in zone 3
still rises more strongly than in the other zones, but no longer in such an exceptional way as in
the MIR scenario. In absolute terms, zones 1-3 clearly benefit most given that more than 90
percent of agricultural value added is produced in these zones.
Despite the positive effects on agriculture all household groups – rural farm and non-farm
households as well as urban households – see a decline in their real incomes. Consistent with the
changes in agricultural output, the effect is somewhat less pronounced under the CSI scenario.
The household group that could be expected to benefit from the global rise in food prices is the
rural farm household sector. However, the fact that many farm households are net consumers of
food implies that their real income is on balance between 0.01 and 0.7 percent lower per year
compared to the perfect mitigation case (Figure 4). Urban households are also negatively
affected as a result of global climate change, but their losses are not higher than those for rural
farm households. This is because urban households spend a much lower share of their budget on
food, which partly offsets the higher vulnerability to rising food prices resulting from a more
pronounced net food buyer status. The rural nonfarm households are by far hardest hit as they
tend to be net food buyers with high food budget shares. Overall, the adverse effects of global
climate change on households are non-negligible, with incomes lowered by more than one
percent on average in the year 2050.

18
Figure 4: Impacts of global changes on household incomes (2010-2050)
Source: DCGE Model
When interpreting the results of the global scenario it is important to keep in mind that climate
change only affects world food prices through changes in global production and consumption.
This scenario did not capture how Yemeni farmers are affected by locally changing yields and
related spillover effects, to which we turn in the next section.
3.3. Local impacts of climate change
Results from the spatially downscaled climate projections show that temperatures are expected to
rise over their baseline counterpart under both the CSI and the MIR GCM scenarios. However,
the variation in temperatures over their baseline equivalents – both minimum and maximum –
differs between the two scenarios (Figure 5). Under the CSI scenario, variations are limited for
both the minimum and maximum temperatures. CSI monthly maximum temperatures do not rise
beyond 1.7 degrees Celsius above baseline maximum temperatures and rise 2.3 degrees Celsius
above baseline for the average monthly temperatures. Under the MIR scenario, the variations are
far greater for both the minimum and maximum temperatures. For nine months out of the year,
the MIR scenario predicts a more than two degree rise in temperatures by 2050 in minimum
temperatures over the baseline, and in May, the MIR scenario predicts that minimum
temperatures will rise over their baseline values by over three degrees Celsius. Maximum
temperatures are also expected to increase over their baseline values under the MIR scenario. For

19
four months out of the year, MIR temperature highs are expected to rise more than two degrees
Celsius over their baseline equivalents.
Figure 5: Average Monthly Temperature in Yemen (degrees celsius)
Authors’ calculations based on data available from the CCAFS climate data portal (http://ccafs-climate.org/download_temp.html) and documented in Jones, Thornton, and Heinke (2009 and 2010). Variation in average monthly rainfall across Yemen, as predicted by the GCM scenarios CSI and
MIR, is only significant for the latter scenario. As shown in Figure 6, average monthly rainfall
(in mm) of the CSI scenario roughly follows the baseline. However, the MIR scenario predicts
an increase in rainfall5 from June to October across Yemen. From October to December, rainfall
under the MIR scenario is below that predicted under the baseline. This pattern of variation (or
lack thereof for the CSI scenario) is consistent across all of Yemen’s regions with the exception
of the Upper Highlands, where the rainfall predictions under the CSI scenario are significantly
lower than their baseline equivalents.
5 As previously described, variations in average monthly rainfall is compared to the equivalent baseline estimates.
10
15
20
25
30
35
40
45
Degrees Celsius
Yemen: Temperature Highs and Lows
2050 Max Temp 2050 Min Temp 2050 Average Temp
2000 Max Temp 2000 Min Temp 2000 Average Temp
MIR 2050 Max Temp MIR 2050 Min Temp MIR 2050 Average Temp

20
Figure 6: Average monthly rainfall in Yemen (millimeters)
Authors’ calculations based on data available from the CCAFS climate data portal (http://ccafs-climate.org/download_temp.html) and documented in Jones, Thornton, and Heinke (2009 and 2010).
Changes in rainfall and temperature are the main drivers of yield changes: all else was kept the
same for the simulations. Yield changes over time due to climate change are projected to vary
strongly across major grains as well as across agro-ecological zones. Table 5 shows the results
from the DSSAT crop model (section 2.2) by agro-ecological zones. Driven mainly by the
diverging rainfall patterns, projected yield changes for sorghum and millet differ substantially
between the MIR and CSI scenario. Clearly, in an arid region, having more abundant water could
greatly increase yield potentials. Accordingly, average sorghum and millet yields increase
substantially under the MIR scenario, whereas under the CSI scenario they evolve less favorably,
and even decline by 0.6 percent per year in the desert zone.
0
10
20
30
40
50
60
70
80
Millim
eters
Yemen: Average Monthly Rain
Yemen: Rain BASELINE
Yemen: Rain 2050 (CSI)
Yemen: Rain 2050 (MIR)

21
Table 5: Average annual yield changes for selected crops, 2000-2050 Maize Millet Sorghum Wheat
Irrigated Rainfed Irrigated Rainfed Irrigated Rainfed Irrigated Rainfed
MIR (% Yield Changes)
Yemen 0.1 1.4 2.6 4.0 2.4 2.7 -0.3 0.1
Upper highlands 0.3 1.3 3.4 3.6 2.3 2.4 -0.3 0.1
Lower highlands 0.0 1.7 2.6 3.3 2.1 2.4 -0.4 0.3
Red Sea and Tihama -0.2 -0.5 1.7 4.0 3.5 4.0 -0.9 -1.0
Arabian Sea -0.1 0.2 1.8 4.0 4.0 4.0 -0.2 -0.3
Internal Plateau -0.1 0.7 4.0 4.0 4.0 4.0 -0.1 1.6
Desert -0.1 -0.4 1.5 4.0 2.9 4.0 -0.1 -0.8
CSI (% Yield Changes)
Yemen 0.1 0.1 -0.1 0.1 0.3 0.3 -0.2 -0.1
Upper highlands 0.2 0.3 0.8 1.0 0.8 0.8 -0.2 -0.1
Lower highlands -0.1 -0.1 -0.1 0.0 0.1 0.1 -0.5 -0.3
Red Sea and Tihama -0.1 -0.4 -0.2 0.1 0.1 0.2 -0.5 -0.5
Arabian Sea -0.1 -0.3 -0.2 0.2 0.1 0.3 -0.1 -0.3
Internal Plateau 0.0 -0.7 0.3 0.8 0.0 0.2 -0.1 -0.4
Desert 0.0 -0.5 -0.3 -0.9 -0.5 -0.8 -0.1 -0.6 Source: Authors’ calculation based on DSSAT. Given the strong yield results under the MIR scenario, an important question that arises is how
unexpected such a large increase in precipitation is for climate projections in the case of Yemen.
We compared the monthly rainfall projections for the FutureClim downscalings used here with
downscalings using an alternative methodology (Tabor and Williams 2010) with data available at
the same spatial resolution as FutureClim for all of the major GCMs. It turns out that the
summertime increase in precipitation is also found in most of the other GCM projections and as
such does not appear to be a unique feature of our scenario.
Results of the DCGE model show that the local effects of climate change depend to a large
extent on the adopted scenario. Under the MIR scenario, local climate change slightly raises
agricultural growth; the direction and magnitude of the change for the six agro-ecological zones
differs depending on their crop mix (Figure 7). Changes in the agricultural GDP growth rate
compared to perfect mitigation range between 0.05 and 0.6 percentage points. Among the
regions, zone 3 benefits most from local climate change. This is because in this zone sorghum
and millet experience high yield increases and at same time account for a larger share of
agricultural value added than in any other zone, whereas the grains with declining yields (maize

22
and wheat) are hardly produced. Losses are incurred in the desert zone 6 where grain production
is limited to wheat. Under the CSI scenario, positive and negative yield changes cancel each
other out. As a result, agricultural GDP hardly changes compared to the perfect mitigation
scenario.
Figure 7: Impacts of local changes on agricultural GDP (2010-2050)
Source: DCGE model
Local climate change is welfare enhancing for all household groups when we consider the MIR
scenario. The largest beneficiaries are rural farm households, whose annual income is between
0.03 and 1.3 percent higher than under perfect mitigation (Figure 8). They are affected through
two major channels: first, their income gains from higher agricultural yields are not fully
compensated by lower prices they receive for their products. Second, as net consumers they
benefit from decreasing prices for millet and sorghum. The price effect also explains the
considerable increase in real incomes for non-farm rural households. Urban households, by
contrast, hardly consume the commodities that have become cheaper and therefore realize only
negligible income gains. Under the CSI scenario, real income changes are close to zero for all
three household groups.
However, it is important to note that the estimated increase in rainfall and related increase in
yields under MIR may overestimate the overall positive effect. Given Yemen’s topography, it is
likely that an increase in rainfall may also lead to an increase in the occurrences of floods, an
issue that goes beyond the scope of this paper.

23
Figure 8: Impacts of local changes on household incomes (2010-2050)
Source: DCGE model
3.4. Combined climate change impacts
Considering the global and local effects of climate change jointly shows that the effects cancel
each other out at the macro level. Economic growth does on average not differ from the case of
perfect mitigation. While the share of agriculture in the economy falls as part of the general
economic transformation process (Table 6), this pattern of structural change is even slightly
reversed due to the global effects of climate change, which render the production of various
agricultural commodities more profitable.
Results for the agricultural sector differ noticeably between the MIR and CSI scenario.
Agricultural output rises under the combined MIR climate change scenario with increasing speed
over time. As shown in the previous section, the impact of both local and global climate change
in isolation have positive implications for agricultural production. The agricultural growth rate in
the combined scenario is between 0.02 and 1.0 percentage points higher each year than under
perfect mitigation (Figure 9). The overall rise in yields due to the local impacts of climate change
translates into lower domestic agricultural prices and also a fall in imports. Lower domestic
prices enhance competiveness on the world market and thus also affect Yemen’s exports of
agricultural crops. This latter effect is amplified when global climate change is factored in and
globally higher crop prices provide a boost to the agricultural sector and improve agricultural
export performance, thus leading to faster growth of the agricultural sector (compared to perfect

24
mitigation). By contrast, due to less optimistic yield predictions, agricultural growth in the CSI
scenario is only slightly higher than with perfect mitigation when both local and global climate
change is taken into account.
Table 6: Structural change under climate change scenarios (% of GDP)
MIR CSI Initial 2030 2050 2030 2050 Perfect Mitigation
Agriculture 8.4 6.0 4.6 6.0 4.6 Industry 38.5 39.3 39.3 39.3 39.3 Services 53.1 54.7 56.1 54.7 56.1
Global Agriculture 8.4 6.2 5.1 6.1 4.9 Industry 38.5 39.2 39.0 39.3 39.1 Services 53.1 54.6 55.9 54.6 56.0
Local Agriculture 8.4 5.9 4.5 5.8 4.2 Industry 38.5 39.4 39.4 39.4 39.5 Services 53.1 54.8 56.1 54.8 56.3
Combined Agriculture 8.4 6.3 5.4 6.1 4.8 Industry 38.5 39.2 38.9 39.3 39.2 Services 53.1 54.5 55.8 54.6 56.0 Source: DCGE model.
The combined effect of global and local climate change turns out to be favorable for agricultural
production in all economically important zones (Figure 10), but again much less so under the
CSI scenario than under the MIR scenario. In zone 3, the positive impacts of local and global
climate change in the form of rising agricultural yields and rising world food prices add up to
agricultural growth that in the year 2050 is between 0.5 percentage points (CSI scenario) and 2.4
percentage points (MIR scenario) higher compared to perfect mitigation. For the two biggest
regions in terms of agricultural value added, zones 1 and 2, effects are more modest, with a rise
in production by up to 0.4 percentage points in the CIS scenario and 0.6 percentage points in the
MIR scenario. Only in zones 4 and 6, which together account for not more than three percent of
total agricultural value added, agricultural GDP is hardly affected by the combined effect of
climate change.

25
Figure 9: Impacts of local, global, and combined changes on agricultural GDP (2010-2050)
Source: DCGE model
Figure 10: Impacts of combined local and global changes on agro-ecological zones (2010-2050)
Source: DCGE model
Taking the global and local impacts of climate change together in general results in a reduction
of household welfare under both scenarios. Only farm households may benefit under MIR
predictions but incomes for rural non-farm households and urban households fall (Figure 11).
Even though as net consumers farm households end up paying more for their food basket when
world food prices rise, they on balance realize income gains because of the substantial yield
increases for sorghum and millet. Non-farm rural households and urban households, by contrast,
are hit harder by the price effects of global climate change and benefit only indirectly – via
falling prices – from the yield effects of local global climate change. As a consequence, their real
income falls by up to 0.8 an 0.7 percent, respectively. Under the CSI scenario, the gains of farm

26
households turn into losses, and non-farm rural households see much stronger reductions in real
household income as they no longer benefit from lower prices induced by higher yields.
Figure 11: Impacts of combined local and global changes on household incomes
Source: DCGE model
Changes in real incomes do not only differ between household groups but also exhibit
considerable variation across regions. With the exception of rural farm households in zone 3 (and
in zone 2 under the MIR scenario), all households suffer real income losses as a result of the
combined impact of global and local climate change (Table 7). While the effects of climate
change do not reveal a clear distributional pattern, some of the poorest sections of the Yemeni
society are among the hardest hit. Most notably, farm households in the desert zone have the
lowest initial per capita income and are expected to experience the biggest income losses. They
suffer most mainly due the joint effect of being net food buyers, spending a high share of income
on food and specializing in agricultural activities that do not benefit from higher prices and
increasing yields. Non-farm households in zones 4 and 6 are other examples of poor groups
incurring considerable losses.

27
Table 7: Distributional impacts, local and global climate change, and world price changes (first number in each cell indicates result for MRI, second CSI)
Household Group Population Per Capita Income
(Thousand YR)
Average Annual Change, 2010-2050 (%)
2009
Perfect Mitigation
Global Climate Change
Local Climate Change
Combined Climate Change
Combined Climate
Change plus World Price
Changes
Urban 1 2,669,219.1 242 -0.5 -0.5 − -0.4 0.0 -0.4 -1.0 − -0.9
2 1,203,688 161 -0.6 -0.6 − -0.5 0.1 − 0.0 -0.5 -1.1
3 774,200 177 -0.3 -0.4 0.1 − 0.0 -0.3 − -0.4 -0.6 − -0.7
4 1,157,983 170 -0.3 -0.6 − -0.5 0.0 -0.5 -0.8
5 302,989 159 -0.8 -0.9 − -0.8 0.0 -0.8 -1.6
6 41,809 137 -0.8 -0.6 − -0.5 0.0 -0.7 − -0.6 -1.4 − -1.3
Rural Nonfarm 1 1,946,108.60 152 -1.8 -1.2 − -0.9 0.1 − 0.0 -1.1 − -1.0 -2.9 − -2.8
2 5,836,100.10 118 -1.8 -1.2 − -0.9 0.9 − 0.1 -0.3 − -0.9 -2.1 − -2.6
3 1,616,577.60 133 -1.0 -0.9 − -0.8 0.6 - 0.0 -0.3 − -0.8 -1.3 − -1.8
4 320,780.39 100 -0.6 -0.9 − -0.8 0.0 -0.8 -1.5 − -1.4
5 999,507.30 127 -1.1 -1.1 − -0.9 0.0 -1.1 − -1.0 -2.2 − -2.1
6 174,556.80 105 -1.3 -1.0 − -0.8 0.0 -1.0 − -0.9 -2.3 − -2.2
Rural Farm 1 1,601,351.00 147 -1.8 -0.6 − -0.4 0.0 − -0.1 -0.5 -2.4
2 2,544,788.70 90 -2.0 -0.6 − -0.4 1.2 − 0.1 0.6 − -0.3 -1.4 − -2.4
3 737,258.54 108 -1.0 -0.0 − -0.1 1.6 − 0.2 1.6 − 0.1 0.6 − -0.9
4 134,267.62 111 -0.9 -0.7 0.0 -0.7 -1.6
5 208,785.15 105 -1.0 -0.4 0.0 − -0.1 -0.4 − -0.5 -1.5 − -1.6
6 189,341.65 87 -1.5 -1.1 − -0.9 0.0 − -0.1 -1.2 − -1.0 -2.7 − -2.5
Source: DCGE Model.
Climate change also raises the number of hungry people in Yemen. By 2050, between 80,000
and 270,000 people could go hungry due to climate change (Figure 12). Even under perfect
mitigation, the number of hungry people is projected to rise, which can be mainly explained by
rising global food prices caused by global increases in demand.
The negative impacts of climate change on food security are almost exclusively confined to rural
households, because urban households spend a comparatively low share of their income on food
and derive most of their income from sectors that are largely unaffected by climate change
(Table 8). Within rural areas, it is predominantly non-farm households who suffer as they do not
benefit from higher prices for agricultural goods and at the same time have the highest food
expenditure shares of all household groups, which make them particularly vulnerable to food
price changes.

28
Figure 12: Impact of climate change on food security
Source: Microsimulation Model.
4. Summary and policy conclusions
This paper has looked at the global and local climate change impacts on Yemen’s economy,
agriculture and households. Global climate change is mainly transmitted through changing world
food prices, especially since Yemen is a net importer of many food commodities. The impacts of
local climate change manifest itself in long term yield changes. While climate change is very
likely to result in significant world market price increases, the direction of predicted yield
changes is less clear-cut. Yields for wheat and maize are expected to fall in most agro-ecological
zones under both climate scenarios. Yields for sorghum and millet are expected to rise in some
zones and fall in others under the CSI scenario, whereas they are expected to rise considerably
across all zones under the MIR scenario as a result of higher predicted rainfall.
0,0
100,0
200,0
300,0
400,0
500,0
600,0
700,0
2010
2012
2014
2016
2018
2020
2022
2024
2026
2028
2030
2032
2034
2036
2038
2040
2042
2044
2046
2048
2050
in 1,000 hungry people
Change in hungry people
Global change
Climate change (MIR)
Climate change (CSI)
29
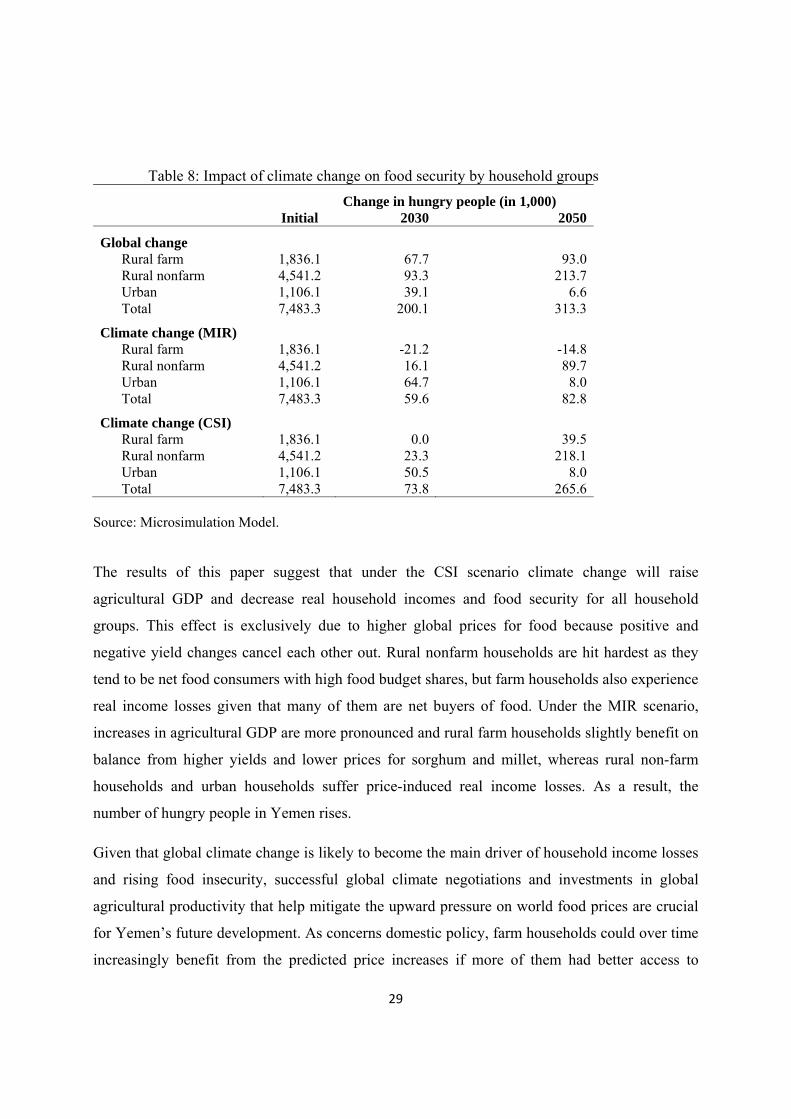
Table 8: Impact of climate change on food security by household groups
Change in hungry people (in 1,000) Initial 2030 2050
Global change Rural farm 1,836.1 67.7 93.0 Rural nonfarm 4,541.2 93.3 213.7 Urban 1,106.1 39.1 6.6 Total 7,483.3 200.1 313.3
Climate change (MIR) Rural farm 1,836.1 -21.2 -14.8 Rural nonfarm 4,541.2 16.1 89.7 Urban 1,106.1 64.7 8.0 Total 7,483.3 59.6 82.8
Climate change (CSI) Rural farm 1,836.1 0.0 39.5 Rural nonfarm 4,541.2 23.3 218.1 Urban 1,106.1 50.5 8.0 Total 7,483.3 73.8 265.6
Source: Microsimulation Model. The results of this paper suggest that under the CSI scenario climate change will raise
agricultural GDP and decrease real household incomes and food security for all household
groups. This effect is exclusively due to higher global prices for food because positive and
negative yield changes cancel each other out. Rural nonfarm households are hit hardest as they
tend to be net food consumers with high food budget shares, but farm households also experience
real income losses given that many of them are net buyers of food. Under the MIR scenario,
increases in agricultural GDP are more pronounced and rural farm households slightly benefit on
balance from higher yields and lower prices for sorghum and millet, whereas rural non-farm
households and urban households suffer price-induced real income losses. As a result, the
number of hungry people in Yemen rises.
Given that global climate change is likely to become the main driver of household income losses
and rising food insecurity, successful global climate negotiations and investments in global
agricultural productivity that help mitigate the upward pressure on world food prices are crucial
for Yemen’s future development. As concerns domestic policy, farm households could over time
increasingly benefit from the predicted price increases if more of them had better access to

30
markets and efficient supply chains. However, the National Food Security Strategy
acknowledges that the potential for accelerated agricultural growth is constrained by Yemen’s
severe scarcity of water and arable land, but at the same time outlines several options for raising
agricultural productivity and food security among farm households. These include investments in
water-saving technologies, incentives that encourage the use of more water-efficient crops and
investments to promote agricultural alternatives such as coffee. The bulk of the adaptation to
climate change would, however, have to come from the non-agricultural sector and from a smart
mix of rural and urban development. Since rural non-farm households are hardest hit by rising
food prices while already exhibiting the highest initial levels of food insecurity, investments that
generate rural non-farm employment in sectors such as food processing and tourism should in
particular be encouraged, e.g. by investing in rural infrastructure. Given the continued high
population growth and shrinking natural resource base in rural areas, rural development should
be complemented by urban development to absorb the growing number of migrants.
Policymakers can facilitate private-sector-led growth in rural and urban areas in various ways,
especially through measures that improve the investment climate, such as establishing security,
sound institutions and access to credit. Better opportunities for private investors have to be
complemented by transfers targeted towards the most food insecure households.

31
References Breisinger, C., T. Zhu, P. Al Riffai, G. Nelson, R. Robertson, J. Funes, and D. Verner (2011).
Global and Local Economic Impacts of Climate Change in Syrian Arab Republic and
Options for Adaptation. IFPRI Discussion Paper 1071. International Food Policy
Research Institute, Washington, D.C.
Breisinger, C., O. Ecker, J. Funes, and B. Yu (2010). Food as the Basis for Development and
Security: A Strategy for Yemen. IFPRI Discussion Paper 1036. International Food Policy
Research Institute, Washington, D.C.
Breisinger, C., X. Diao, and J. Thurlow (2009). Modeling Growth Options and Structural Change
to Reach Middle Income Country Status: The Case of Ghana. Economic Modeling 26:
514–525.
Breisinger C., and X. Diao (2008). Economic Transformation in Theory and Practice: What Are
the Messages for Africa? IFPRI Discussion Paper 797. International Food Policy Research
Institute, Washington, D.C.
Dervis, K., J. de Melo, and S. Robinson (1982). General Equilibrium Models for Development
Policy. Cambridge University Press, New York
Ecker, O., C. Breisinger, and K. Pauw (2011). Growth is Good, but is not Enough to Improve
Nutrition. 2020 Conference Paper 7. Background paper for IFPRI’s 2020 Conference:
Leveraging Agriculture for Improving Nutrition and Health; February 10-12, 2011; New
Delhi, India.
http://www.ifpri.org/sites/default/files/publications/2020anhconfpaper07.pdf.
Ecker, O., C. Breisinger, C. McCool, X. Diao, J. Funes, L. You, and B. Yu (2010). Food Security
in Yemen: An Innovative Integrated, Cross-Sector, and Multi-Level Approach. IFPRI
Discussion Paper 982. International Food Policy Research Institute, Washington, D.C.
FAO/WHO/UNU (2001). Human Energy Requirement. Report of a joint FAO/WHO/UNU
expert consultation. Food and Nutrition Technical Report 1. Food and Agriculture
Organization of the United Nations, Rome.
Garnault, R. (2008). The Garnault Climate Change Review. Available at
http://www.garnautreview.org.au/update-2011/garnaut-review-2011.html

32
IMF (2009). Republic of Yemen. Staff Report for the 2008 Article IV Consultation. International
Monetary Fund, Washington, D.C.
Jones, J.W., G. Hoogenboom, C.H. Porter, K.J. Boote, W.D. Batchelor, L.A. Hunt, P.W.
Wilkens, U. Singh, A. J. Gijsman, and J.T. Ritchie (2003). The DSSAT cropping system
model. European Journal of Agronomy 18 (3-4): 235-265.
Jones, P. G., P.K. Thornton, and J. Heinke (2009). Generating characteristic daily weather data
using downscaled climate model data from the IPCC's Fourth Assessment. Project Report
("Supporting the vulnerable: Increasing the adaptive capacity of agro-pastoralists to
climatic change in West and Southern Africa using a trans-disciplinary research approach")
Jones, P. G., P. K. Thornton, and J. Heinke (2010). Characteristically generated monthly climate
data using downscaled climate model data from the fourth assessment report of the IPCC.
http://futureclim.info/ and http://ccafs-climate.org/download_temp.html. Dataset accessed
August 2010.
King, R. P., and D. Byerlee (1978). Factor Intensities and Locational Linkages of Rural
Consumption Patterns in Sierra Leone. American Journal of Agricultural Economics Vol.
60, No. 2 (May, 1978), pp. 197-206.
Lofgren, H., R. Harris, and S. Robinson (2002). A Standard Computable General Equilibrium
(CGE) Model in GAMS. Trade and Macroeconomics Discussion Paper No. 75,
International Food Policy Research Institute, Washington, D.C.
Nelson, G.C. et al. (2010). Food Security, Farming and Climate Change to 2050: Scenarios,
Results, Policy Options. International Food Policy Research Institute, Washington, D.C.
http://www.ifpri.org/sites/default/files/publications/climatemonograph_advance.pdf
Nelson, G. C., M.W. Rosegrant, J. Koo, R. Robertson, T. Sulser, T. Zhu, C. Ringler, S. Msangi,
A. Palazzo, M. Batka, M. Magalhaes, R. Valmonte-Santos, M. Ewing, and D. Lee (2009).
Climate Change Impact on Agriculture and Costs of Adaptation. Food Policy Report.
International Food Policy Research Institute. Washington D.C.

33
Rosegrant, M.W., S. Msangi, C. Ringler, T.B. Sulser, T. Zhu, and S.A. Cline (2008).
International Model for Policy Analysis of Agricultural Commodities and Trade
(IMPACT): Model description. International Food Policy Research Institute, Washington,
D.C.
http://www.ifpri.org/themes/impact/impactwater.pdf.
Stern, N. (2006). Review on the Economics of Climate Change, H.M. Treasury, UK.
http://www.sternreview.org.uk
Tabor, K., and J.W. Williams (2010). Globally Downscaled Climate Projections for Assessing
the Conservation Impacts of Climate Change. Ecological Applications 20(2): 554-565.
Thurlow, J. (2004). A Dynamic Computable General Equilibrium (CGE) Model for South
Africa: Extending the Static IFPRI Model. TIPS. Working Paper 1. Pretoria.
United Nations Population Division (2010). World Population Prospects: The 2010 Revision
Population Database. Accessed 2011.
http://esa.un.org/unpp/index.asp.
U.S. Energy Information Administration (2010). Monthly Energy Review July 2010 and Annual
Energy Review (AER).
http://www.eia.gov/.
World Bank (2007). The Impact of Sea Level Rise on Developing Countries: A Comparative
Analysis. World Bank Policy Research Working Paper WPS4136. Washington D.C.
You, L., and S. Wood (2006). An Entropy Approach to Spatial Disaggregation of Agricultural
Production. Agricultural Systems 90(1-3): 329-347.
Yu, W, J. Thurlow, M. Alam, A. Hassan, A.S. Khan, A. Ruane, C. Rosenzweig, and D.C. Major
(2010a). Climate Change Risks and Food Security in Bangladesh, EarthScan: London,
United Kingdom, 2010.
Yu, B., T. Zhu, C. Breisinger, and N.M. Hai (2010b). Impacts of Climate Change on Agriculture
and Policy Options for Adaptation: The Case of Vietnam. IFPRI Discussion Paper 1015.
International Food Policy Research Institute, Washington, D.C.

34
Appendix 1: Determinants of Per Capita Calorie Consumption
Variable Coefficient
Standard error
Log of expenditure 0.857 *** 0.045
Log of expenditure squared -0.057 *** 0.004
log of household size 0.209 *** 0.024
log of household size, squared -0.061 *** 0.006
Children -0.186 *** 0.012
Dependency ratio -0.074 *** 0.007
Adult man 0.042 *** 0.016
Adult woman 0.077 *** 0.026
Adult gender ration -0.020 *** 0.005
Log of household head's age 0.380 *** 0.139
Log of household head's age, squared -0.056 *** 0.019
School attendance of household head 0.061 0.305
Education level of household head -0.024 *** 0.003
Qat consumption -0.051 *** 0.012
Share of qat expenditure on total expenditure -0.014 *** 0.004
Self-sufficiency level 0.122 *** 0.025
Constant 3,852 *** 0.421
Observations 12 093
F-value 69.76
R-squared 0.271
Adjusted R-squared 0,267
*** Significant at the one percent level 1.
Related Documents