1 Cape Winelands District Municipality Climate Change Adaption Summary Report November 2017 Draft Version Developed through the Local Government Climate Change Support Program This climate change plan was developed through the Department of Environmental Affairs, Local Government Climate Change Support Program (LGCCSP). The LGCCSP is part of the International Climate Initiative (IKI) and is supported by Deutsche Gesellschaft für Internationale Zusammenarbeit (GIZ) GmbH on behalf of The Federal Ministry for the Environment, Nature Conservation, Building and Nuclear Safety (BMUB).

Welcome message from author
This document is posted to help you gain knowledge. Please leave a comment to let me know what you think about it! Share it to your friends and learn new things together.
Transcript
1
Cape Winelands District Municipality
Climate Change Adaption Summary
Report
November 2017
Draft Version
Developed through the Local Government Climate Change Support Program
This climate change plan was developed through the Department of Environmental Affairs, Local Government Climate
Change Support Program (LGCCSP). The LGCCSP is part of the International Climate Initiative (IKI) and is supported by
Deutsche Gesellschaft für Internationale Zusammenarbeit (GIZ) GmbH on behalf of The Federal Ministry for the
Environment, Nature Conservation, Building and Nuclear Safety (BMUB).
2
Contents 1 Executive Summary .................................................................................................................... 5
1.1 Agriculture......................................................................................................................... 6
1.2 Biodiversity and Environment ......................................................................................... 7
1.3 Disaster Management, Infrastructure and Human Settlements ................................... 7
1.4 Water ................................................................................................................................. 8
2 Introduction ............................................................................................................................... 10
2.1 Climate Change Introduction ......................................................................................... 10
3 Methodology .............................................................................................................................. 16
3.1 What is a Vulnerability Assessment? ............................................................................... 16
3.2 Steps involved in a Vulnerability Assessment .................................................................. 17
3.3 Step 1: Develop Climate Change Indicators ..................................................................... 17
3.4 Step 2: Assessing Exposure ............................................................................................... 17
3.5 Step 3: Assessing Sensitivity ............................................................................................. 18
3.6 Step 4: Assessing Adaptive Capacity ................................................................................ 18
3.7 Step 5: Develop Response Plans for Priority Indicators ................................................... 18
3.8 Desired Adaptation Outcomes ......................................................................................... 18
4 District Snapshot Cape Winelands District Municipality ............................................................ 20
4.1 Key District Indicators ....................................................................................................... 20
4.2 Cape Winelands DM Agriculture Sector Summary ........................................................... 22
4.3 Cape Winelands DM Biodiversity Sector Summary .......................................................... 35
4.4 Cape Winelands DM Health Sector Summary .................................................................. 42
4.5 Cape Winelands DM Human Settlements Sector Summary ............................................ 46
4.6 Cape Winelands DM Water Sector Summary .................................................................. 50
5 Vulnerability Assessment Results ............................................................................................... 57
5.1 Agriculture ........................................................................................................................ 57
5.2 Biodiversity and Environment .......................................................................................... 64
5.3 Human Health................................................................................................................... 69
5.4 Disaster Management, Infrastructure and Human Settlements ...................................... 75
5.5 Water ................................................................................................................................ 82
5.6 Vulnerability Assessment Summary ................................................................................. 87
6 Sector Response Plans ................................................................................................................ 90
6.1 Agriculture ........................................................................................................................ 90
6.2 Biodiversity and Environment .......................................................................................... 93
6.3 Disaster Management, Infrastructure and Human Settlements ...................................... 95
6.4 Water ................................................................................................................................ 98
7 References ................................................................................................................................ 100
3
Table of Figures Figure 1: Hydrological Zones of South Africa ........................................................................................ 13
Figure 2: Vulnerability Assessment Methodology ................................................................................ 17
Figure 3: Percentage of households involved in agricultural activities across the District Municipal
Area (Statistics South Africa 2011)........................................................................................................ 23
Figure 4: SmartAgri Zones in the District Municipal Area (Western Cape Department of Agriculture
2017) ..................................................................................................................................................... 24
Figure 5: Grazing capacity in the District Municipal Area (Western Cape Department of Agriculture
2017) ..................................................................................................................................................... 25
Figure 6: Small stock density levels in the District Municipal Area (Western Cape Department of
Agriculture 2017) .................................................................................................................................. 26
Figure 7: Bovine density levels in the District Municipal Area (Western Cape Department of
Agriculture 2017) .................................................................................................................................. 27
Figure 8: Ostrich density levels in the District Municipal Area (Western Cape Department of
Agriculture 2017) .................................................................................................................................. 28
Figure 9: Crop census in the District Municipal Area (Western Cape Department of Agriculture 2017)
.............................................................................................................................................................. 29
Figure 10: Wine of origin districts in the District Municipal Area (Western Cape Department of
Agriculture 2017) .................................................................................................................................. 30
Figure 11: Commercial forestry distribution across the District Municipal Area (De Lange 2013) ...... 31
Figure 12: Temperature projections in the District Municipal Area (Western Cape Department of
Agriculture 2017) .................................................................................................................................. 32
Figure 13: Mean Annual Rainfall in the District Municipal Area (Western Cape Department of
Agriculture 2017) .................................................................................................................................. 33
Figure 14: Aquifer vulnerability in the District Municipal Area (Western Cape Department of
Agriculture 2017) .................................................................................................................................. 33
Figure 15: Groundwater quality in the District Municipal Area (Western Cape Department of
Agriculture 2017) .................................................................................................................................. 34
Figure 16: Current biome delineation in the District Municipal Area (South African National Parks
2011a) ................................................................................................................................................... 35
Figure 17: Predicted shift in biomes in the District Municipal Area using a medium risk scenario
(South African National Parks 2011c) ................................................................................................... 36
Figure 18: Predicted shift in biomes in the District Municipal Area using a high risk scenario (South
African National Parks 2011b) .............................................................................................................. 37
Figure 19: Threatened ecosystem types in the District Municipal Area (South African National
Biodiversity Institute 2011) ................................................................................................................... 38
Figure 20: Protected areas in the District Municipal Area (South African National Parks / South
African National Biodiversity Institute 2011; Department of Environmental Affairs 2017) ................. 39
Figure 21: Condition of wetlands in the District Municipal Area (Council for Scientific and Industrial
Research 2011) ..................................................................................................................................... 40
Figure 22: Percentage of young (<5yrs age group) and elderly (>64yrs age group) across the Cape
Winelands District Municipal Area (Statistics South Africa 2011) ........................................................ 42
Figure 23: Employment status in the District Municipal Area (Statistics South Africa, 2011) .............. 46
Figure 24: Households by type of dwelling in the District Municipal Area (Statistics South Africa,
2011) ..................................................................................................................................................... 47
Figure 25: Household water sources in the District Municipal Area (Statistics South Africa 2011) ..... 48
Figure 26: Sanitation facilities in the District Municipal Area (Statistics South Africa 2011) ............... 48

4
Figure 27: Veld fire risk for District Municipality Area (Department of Agriculture, Forestry and
Fisheries 2010). ..................................................................................................................................... 49
Figure 28: Hydrological Zone for the District Municipal Area (Department of Environmental Affairs
2013d) ................................................................................................................................................... 50
Figure 29: Water Management Area for the District Municipal Area (Department of Water Affairs
2013) ..................................................................................................................................................... 51
Figure 30: Water resources within the District Municipal Area (Department of Water and Sanitation
2016b) ................................................................................................................................................... 51
Figure 31: State of water quality in rivers in the District Municipal Area (SANBI 2011) ...................... 53
Figure 32: Historical Climate Monthly Averages for Robertson (Climate System Analysis Group
2017b) ................................................................................................................................................... 54
Figure 33: Rainfall Projections for Robertson (Climate System Analysis Group 2017a) ....................... 56
Table of Tables
Table 1: Key Vulnerability indicators for Cape Winelands District Municipality .................................... 5
Table 2: Climate change impacts for the Western Cape province........................................................ 14
Table 3: Priority Climate Change Adaptation Responses for the Western Cape province ................... 15
Table 4: Key District Municipal Indicators for the Cape Winelands DM compared to the National
Average ................................................................................................................................................. 20
Table 5: Agriculture Vulnerability Indicator Table Cape Winelands District Municipality.................... 57
Table 6: Biodiversity Vulnerability Indicator Table Cape Winelands District Municipality................... 64
Table 7: Health Vulnerability Indicator Table Cape Winelands District Municipality ........................... 69
Table 8: Disaster Management, Infrastructure and Human Settlements Vulnerability Indicator Table
Cape Winelands District Municipality ................................................................................................... 75
Table 9: Water Vulnerability Indicator Table Cape Winelands District Municipality ........................... 82
Table 10: High Priority Indicators Cape Winelands District Municipality ............................................. 87
Table 11: Medium Priority Indicators Cape Winelands District Municipality ....................................... 88

5
1 Executive Summary Cape Winelands District Municipality recognises climate change as a threat to the environment, its
residents, and to future development. Therefore, measures should be implemented to reduce or
eliminate carbon emissions and enhance greenhouse gas sinks (mitigation) (Böckmann, M 2015).
However, due to lag times in the climate and biophysical systems, the positive impacts of past and
current mitigation will only be noticeable in the next 25 years (Jiri, O 2016). In the meanwhile,
adaptation is regarded as inevitable and a necessary response to the changes that are projected to
take place in the District. Cape Winelands District Municipality has therefore prioritised the
development of a Climate Change Vulnerability Assessment and Climate Change Response Plan.
The Climate Change Vulnerability Assessment and Response Plan was developed through the Local
Government Climate Change Support (LGCCS) program (http://www.letsrespondtoolkit.org/), led by
the Department of Environmental Affairs. The LGCCSP is part of the International Climate Initiative
(IKI) and is supported by Deutsche Gesellschaft für Internationale Zusammenarbeit (GIZ) GmbH on
behalf of The Federal Ministry for the Environment, Nature Conservation, Building and Nuclear
Safety (BMUB).
Through this program key climate change vulnerability indicators for the Cape Winelands District
Municipality were identified. These indicators demonstrate areas that may be at high risk of climate
change impacts.
A summary of the key vulnerability indicators is provided in the table below.
Table 1: Key Vulnerability indicators for Cape Winelands District Municipality
No Sector Name Indicator Title Exposure Answer
Sensitivity Answer
Adaptive Capacity Answer
5 Agriculture Change in viticulture (grapes) production Yes High Low
6 Agriculture Change in fruit production Yes High Low
10 Agriculture Increased risks to livestock Yes High Low
12 Biodiversity and Environment
Loss of High Priority Biomes Yes High Low
14 Biodiversity and Environment
Increased impacts on environment due to land-use change Yes High Low
28
Human Settlements, Infrastructure and Disaster Management
Loss of industrial and labour productivity Yes High Low
29
Human Settlements, Infrastructure and Disaster Management
Increased impacts on strategic infrastructure Yes High Low

6
No Sector Name Indicator Title Exposure Answer
Sensitivity Answer
Adaptive Capacity Answer
30
Human Settlements, Infrastructure and Disaster Management
Increased impacts on traditional and informal dwellings Yes High Low
31
Human Settlements, Infrastructure and Disaster Management
Increased isolation of rural communities Yes High Low
36 Water
Decreased water quality in ecosystem due to floods and droughts Yes High Low
37 Water Less water available for irrigation and drinking Yes High Low
Based on the key indicators identified in the table above, the following sub-projects and actions are
prioritised as a response to each of the indicators.
1.1 Agriculture The Cape Winelands District Municipality’s agricultural sector will be adversely affected by climate
change. Increased temperatures, drought, and the increase in frequency and severity of storm
events will impact on the crops that can be grown and potentially result in a loss of livestock.
The following key agricultural indicators, sub-projects and actions were identified:
Project Sub-Project
Manage the change in viticulture (grapes) production
Commission research and improve understanding of climate change impacts on viticulture production.
Optimise climate resilient land-uses of existing agricultural areas.
Promote knowledge generation, knowledge sharing, stakeholder participation and raise awareness regarding alternative agricultural production in the western and southern Cape.
Manage the change in viticulture (grapes) production
Promote knowledge generation, knowledge sharing, stakeholder participation and raise awareness regarding viticulture in new growth areas.
Manage the change in fruit production
Generate and share scientific, social and indigenous knowledge that will minimise the loss of areas suitable for the growth of fruit.
Manage the change in fruit production
Identify climate resilient land-uses that will support new agricultural opportunities that will minimise the new areas and new crops thus reducing climate change impacts on current agricultural potential.
`Manage the change in fruit production
Implement evidence based monitoring initiatives that feed into the management systems for fruit production.

7
Project Sub-Project
Manage the change in fruit production
Promote knowledge generation, knowledge sharing, stakeholder participation and raise awareness regarding the decline in suitable areas for the growth of fruit.
Manage the change in fruit production
Research and improve understanding of climate change impacts on fruit.
Manage the change in fruit production
Strengthen management plans, to enable continuous monitoring and the ability to effectively respond to change.
Manage increasing risks to livestock
Commission research and improve understanding of how climate change impacts livestock and land availability.
Manage increasing risks to livestock
Develop a framework that will assist and educate farmers with adjusting to reduced rainfall.
Manage increasing risks to livestock
Generate and share scientific, social and indigenous knowledge that will assist with adapting to the reduction in herbage yields.
Manage increasing risks to livestock
Improve collaboration and partnership on existing programs (e.g. LandCare Programme, EPWP and River Health Programmes).
Manage increasing risks to livestock
Strengthen management plans, to enable continuous monitoring of water and herbage availability for livestock.
1.2 Biodiversity and Environment Climate change predictions include the shifting of biomes across South Africa.
The following key biodiversity indicator, sub-project and actions were identified:
Project Sub-Project
Manage Loss of High Priority Biomes
Implementation of fire breaks in local municipalities (Langeberg) by 2022 through the Disaster Management Unit.
Manage Loss of High Priority Biomes
Identification/Inclusion of high priority biomes in local Spatial Development Frameworks during the review process.
Manage Increased impacts on environment due to land-use change
Develop programmes to diversify community livelihoods strategies to earn income from activities such as ecotourism and other non-farming activities.
Incentivize small scale farmers to practice sustainable and conservation agriculture
Incorporate sustainable land use management and planning into other sectors’ plans.
Research and improve understanding of land use change in the municipality.
Strengthen institutional capacity to deal with pressure on land use change.
1.3 Disaster Management, Infrastructure and Human Settlements Climate change will affect Disaster Management, Infrastructure and Human Settlements in several
ways in Cape Winelands District Municipality. Increases in the severity of storm events and an
increase in flooding will damage infrastructure which may result in a loss of industrial productivity

8
and service delivery. The impacts of storm events will particularly affect communities located in
informal settlements, on flood plains and where there is poor drainage infrastructure. In addition,
communities in rural areas that depend on subsistence farming may be unable to grow crops that
they have grown in the past due to the changing climate. It is predicted therefore, that there will be
an increase in rates of rural-urban migration. Rural communities may also become more physically
isolated due to extreme events impacting on key infrastructure.
The following key human settlement indicators, sub-projects and actions were identified:
Project Sub-Project
Manage potential loss of industrial and labour productivity.
Research and implement water efficiency projects in industrial processes.
Manage potential increased impacts on strategic infrastructure.
Implement a water augmentation project that will help reduce reliance on surface water and seek alternative sources of water (e.g. recycling of water).
Upgrade and maintain storm water infrastructure so that it considers extreme weather events such as flooding.
Upgrading and maintenance of road infrastructure.
Manage increased impacts on traditional and informal dwellings
Develop and upgrade informal settlements.
Manage increased impacts on traditional and informal dwellings
Partner with research institutions to implement a research project to develop a model aimed at achieving sustainable informal settlements with lower risk exposure.
Manage potential increased isolation of rural communities.
Build Climate change resilient road infrastructure that serves as a link for rural areas.
Manage potential increased isolation of rural communities.
Develop economic nodes and improved service provision in rural areas to improve connectivity.
. Identify alternative access routes to rural communities.
Manage potential increased isolation of rural communities.
Identify local responses that will reduce isolation of rural communities.
Manage potential increased isolation of rural communities.
Identify roads at risk of flooding and erosion and prioritise those for upgrading and maintenance.
Manage potential increased isolation of rural communities.
Implement flood drainage systems that will reduce impacts on rural roads.
1.4 Water Water resources are the primary medium through which climate change impacts will be felt by
South Africans (Schulze et al., 2014). Climate change will affect Cape Winelands District
Municipality’s water accessibility, quantity, and quality (Parikh, J 2007) through drought, reduced
runoff, increased evaporation, and an increase in flood events.
9
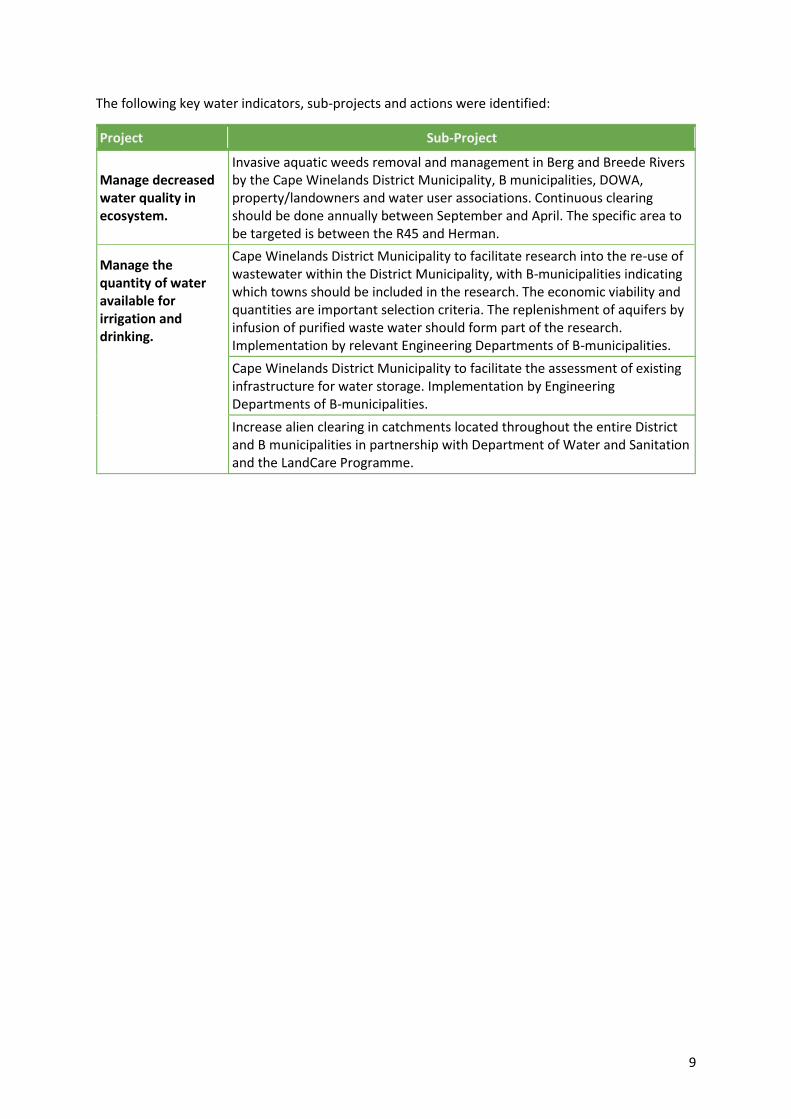
The following key water indicators, sub-projects and actions were identified:
Project Sub-Project
Manage decreased water quality in ecosystem.
Invasive aquatic weeds removal and management in Berg and Breede Rivers by the Cape Winelands District Municipality, B municipalities, DOWA, property/landowners and water user associations. Continuous clearing should be done annually between September and April. The specific area to be targeted is between the R45 and Herman.
Manage the quantity of water available for irrigation and drinking.
Cape Winelands District Municipality to facilitate research into the re-use of wastewater within the District Municipality, with B-municipalities indicating which towns should be included in the research. The economic viability and quantities are important selection criteria. The replenishment of aquifers by infusion of purified waste water should form part of the research. Implementation by relevant Engineering Departments of B-municipalities.
Cape Winelands District Municipality to facilitate the assessment of existing infrastructure for water storage. Implementation by Engineering Departments of B-municipalities.
Increase alien clearing in catchments located throughout the entire District and B municipalities in partnership with Department of Water and Sanitation and the LandCare Programme.

10
2 Introduction This document outlines key climate change vulnerabilities and responses to address these
vulnerabilities for Cape Winelands District Municipality. The Climate Change Vulnerability
Assessment and Response Plan were developed through the Local Government Climate Change
Support Program (LGCCSP), an initiative of the National Department of Environmental Affairs and
the International Climate Initiative (IKI) and is supported by Deutsche Gesellschaft für Internationale
Zusammenarbeit (GIZ) GmbH on behalf of The Federal Ministry for the Environment, Nature
Conservation, Building and Nuclear Safety (BMUB).
The three primary objectives of the LGCCSP are to:
• Undertake a desktop analysis of the municipality to provide context on change
vulnerabilities and responses;
• Undertake district municipal specific engagements to draft climate change vulnerabilities
and responses;
• Facilitate capacity building and knowledge-transfer throughout the program to enhance
implementation of prioritised climate change adaptation options.
For more details on the LGCCSP please visit the website: http://www.letsrespondtoolkit.org/.
Through the LGCCSP, a Climate Change Vulnerability Assessment Toolkit was developed to assist
municipalities to identify and prioritise climate change indicators to facilitate the assessment of
adaptive capacity. Indicators are a range of potential impacts which have been identified using
the Long Term Adaptation Scenario (LTAS) reports (Department of Environmental Affairs 2013e).
Indicators are grouped into the following themes:
• Agriculture
• Biodiversity and Environment
• Human Health
• Disaster Management, Infrastructure and Human Settlements
• Water
The LGCCS Toolkit was applied to the Cape Winelands District Municipality to assist with the
development of its Climate Change Response Plan.
2.1 Climate Change Introduction
2.1.1 Climate change defined Climate change is a natural phenomenon that takes place over geological time. However, over the
past few decades the rate of climate change has been more rapid and the magnitude of global
warming has increased dramatically (Warburton, M.L and Schulze, R 2006; Warburton, M.L 2012).
This change has been attributed to increased anthropogenic greenhouse gas emissions (Koske, J and
Ochieng, M.A 2013). For example, the burning of coal to generate electricity, the burning of petrol in
cars, some chemical processes in industries, and many farming activities all contribute to the
increased concentration of greenhouse gasses in the atmosphere.
Climate change is not just an increase in average global temperatures but changes in regional
climate characteristics such as rainfall, relative humidity and severe weather extremes (Davis, C.L
2011). Climate change can manifest as a shock or a stress (Ziervogel, G and Calder, R 2003). Shocks
are defined as discrete, extreme events (rapid onset) such as floods, while gradual change (slow
onset) such as long-term climate variability is classified as a stress (Ziervogel, G and Calder, R 2003).

11
The negative impacts of climate change “are already felt in many areas, including in relation to, inter
alia, agriculture, and food security; biodiversity and ecosystems; water resources; human health;
human settlements and migration patterns; and energy, transport and industry” (United Nations
WomenWatch 2009, 1).
2.1.2 Climate Change Policy Context in South Africa Climate change is a relatively new area of policy development in South Africa. As policies and
structures are developed, it is necessary to ensure that they are evidence-based, coordinated and
coherent. This section introduces international and national climate change policies and structures:
• The United Nations Framework Convention on Climate Change (UNFCCC). This international
treaty provides guidance on setting agreements pertaining to the reduction of greenhouse
gas emissions.
• The Paris Agreement, came into effect on 4 November 2016. This is the first agreement all
countries have committed to and stipulates that all countries must reduce carbon emissions
to limit global temperature increase to 1.5 degrees Celsius above pre-industrial levels.
• South Africa’s Nationally Determined Contributions, came into effect after the Paris
Agreement was signed. South Africa is therefore required to report on mitigation and
adaptation efforts. Concerning mitigation, South Africa is to reduce emissions by a range
between 398 and 614 million metric tons of carbon equivalent by 2025 and 2030. There are
several instruments to ensure reduction in carbon emissions including car tax and company
carbon budgets among other instruments. With reference to adaptation, a National
Adaptation Plan is currently being developed, and climate change is to be incorporated in all
policy frameworks, institutional capacity is to be enhanced, vulnerability and adaptation
monitoring systems are to be in place, vulnerability assessment and adaptation needs
frameworks are to be developed and there needs to be communication of past investments
in adaptation for education and awareness.
• The National Climate Change Response White Paper (NCCRWP) was adopted in 2011 and
presents the South African Government’s vision for an effective climate change response in
the long-term, to transition to a climate-resilient and lower-carbon economy and society.
• The National Development Plan, focuses on eliminating poverty and reducing inequality by
2030 and creating an environmentally sustainable country through mitigation and
adaptation efforts.
• Long Term Mitigation Scenarios, outline different scenarios of mitigation action for South
Africa.
• Long Term Adaptation Scenarios, consist of two phases. Phase one, was the identification of
climate change trends and projections as well as impacts and responses for the main
sectors. Phase two focussed on integrating issues such as climate information and early
warning systems, disaster risk reduction, human settlements and food security.

12
2.1.3 Climate Change Impacts in South Africa South Africa’s temperature is expected to increase to 1.2o C by 2020, 2.4o C by 2050 and 4.2o C by
2080 (Kruger, A.C and Shongwe, S 2004). Contrary to the global increase in rainfall, South Africa’s
rainfall is expected to decrease by 5.4% by 2020, 6.3% by 2050 and 9.5% by 2080 (Kruger, A.C and
Shongwe, S 2004). The frequency and intensity of climate extremes, inter alia, droughts, floods,
storms and wild fires will increase (Davis, C.L 2011; Böckmann, M 2015). Climate change evidence
indicates changes in frequency and intensity of flood and prolonged drought events at small scales
(Meyiwa, T et al. 2014). Furthermore, the sea level will continue rising and ocean acidification will
get worse (Böckmann, M 2015).
There are however uncertainties associated with climate projections because they are based on the
potential rates of resource use in the future, and associated greenhouse gas emissions (Nicholson-
Cole, S.A 2005).
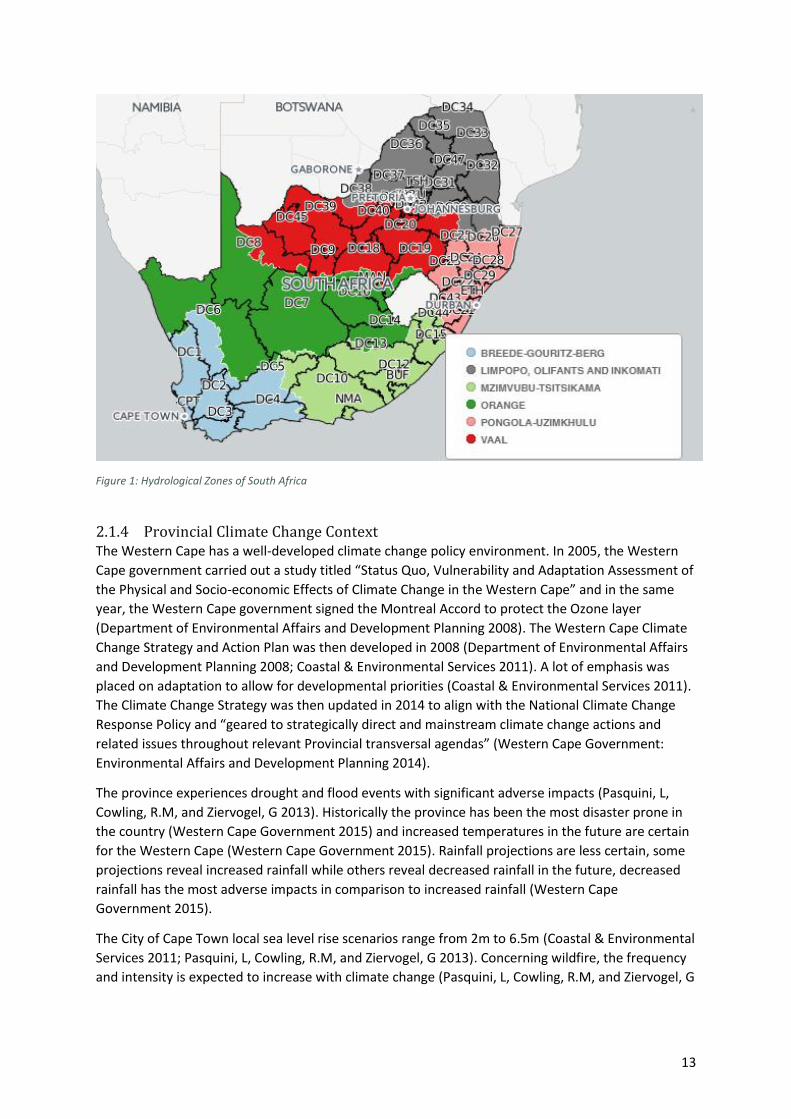
To assist with assessing the potential impacts from climate change, the country has been divided
into six hydrological zones (Figure 1 below). These hydrological zones not only reflect water
management areas but have also been grouped according to common climatic and hydrological
characteristics (Department of Environmental Affairs 2013a). Based on a range of data and
projections, four possible climate scenarios have been identified for South Africa:
• Warmer/wetter (with greater frequency in extreme rainfall events),
• Warmer/drier (with an increase in frequency of drought and somewhat increased frequency
of extreme rainfall events),
• Hotter/wetter (with substantially greater frequency of extreme rainfall events), and,
• Hotter/drier (with a substantial increase in the frequency of drought events and greater
frequency of extreme rainfall events).
Projections on rainfall have also been developed for each of the hydrological zones (Department of
Environmental Affairs 2013a). The following four climate change scenarios have been described for
the Breede-Gouritz-Berg Hydrological Zone (the dominant zone in the Western Cape) in the
Department of Environmental Affairs’ Long Term Adaptation Scenarios Reports. These are:
• Warmer wetter scenario - Decreased rain in autumn & increased in winter & spring
• Hotter drier scenario - Decreased rain in all seasons & strongly decreased in west
• Hotter wetter scenario - Decreased rain in autumn & increased in winter & spring
• Warmer drier scenario - Decreased rain in all seasons & strongly decreased in west
13
Figure 1: Hydrological Zones of South Africa
2.1.4 Provincial Climate Change Context The Western Cape has a well-developed climate change policy environment. In 2005, the Western
Cape government carried out a study titled “Status Quo, Vulnerability and Adaptation Assessment of
the Physical and Socio-economic Effects of Climate Change in the Western Cape” and in the same
year, the Western Cape government signed the Montreal Accord to protect the Ozone layer
(Department of Environmental Affairs and Development Planning 2008). The Western Cape Climate
Change Strategy and Action Plan was then developed in 2008 (Department of Environmental Affairs
and Development Planning 2008; Coastal & Environmental Services 2011). A lot of emphasis was
placed on adaptation to allow for developmental priorities (Coastal & Environmental Services 2011).
The Climate Change Strategy was then updated in 2014 to align with the National Climate Change
Response Policy and “geared to strategically direct and mainstream climate change actions and
related issues throughout relevant Provincial transversal agendas” (Western Cape Government:
Environmental Affairs and Development Planning 2014).
The province experiences drought and flood events with significant adverse impacts (Pasquini, L,
Cowling, R.M, and Ziervogel, G 2013). Historically the province has been the most disaster prone in
the country (Western Cape Government 2015) and increased temperatures in the future are certain
for the Western Cape (Western Cape Government 2015). Rainfall projections are less certain, some
projections reveal increased rainfall while others reveal decreased rainfall in the future, decreased
rainfall has the most adverse impacts in comparison to increased rainfall (Western Cape
Government 2015).
The City of Cape Town local sea level rise scenarios range from 2m to 6.5m (Coastal & Environmental
Services 2011; Pasquini, L, Cowling, R.M, and Ziervogel, G 2013). Concerning wildfire, the frequency
and intensity is expected to increase with climate change (Pasquini, L, Cowling, R.M, and Ziervogel, G

14
2013). The frequency and intensity of other extreme events are expected to increase as well
(Department of Environmental Affairs and Development Planning 2008).
The table below is a summary of the key climate change impacts in the province as outlined in the
climate change strategy and action plan for the Western Cape.
Table 2: Climate change impacts for the Western Cape province
Change to climate variable
Vulnerability Details
Higher mean temperatures
• Increased evaporation and decreased water balance
• Increased wild fire danger (frequency and intensity)
Higher maximum temperatures, more hot days and more heat waves
• Heat stress in humans, livestock, crops and wildlife
• Increased incidence of heat-related illnesses
• Increased incidence of death and serious illness, particularly in older age groups
• Decreased crop yields and rangeland productivity
• Extended range and activity of some pests and disease vectors
• Increased threat to infrastructure exceeding design specifications relating to temperature (e.g. traffic lights, road surfaces, electrical equipment, etc.)
• Increased electric cooling demand increasing pressure on already stretched energy supply reliability
• Exacerbation of urban heat island effect
Higher minimum temperatures, fewer cold days and frost days
• Decreased risk of damage to some crops due to less frost and increased risk to others such as deciduous fruits that rely on a cooling period in autumn
• Reduced heating energy demand
• Extended range and activity of some pests and disease vectors
• Reduced risk of cold-related deaths and illnesses
General drying trend in western part of the country
• Decreased average runoff, and stream flow
• Decreased water resources and potential increases in cost of water resources
• Decreased water quality
• Decrease in shoulder season length threatening the Western Cape fruit crops
• Increased fire danger (drying factor)
• Impacts on rivers and wetland ecosystems
Intensification of rainfall events
• Increased flooding
• Increased demand on storm water systems in urban settlements
• Increased soil erosion
• Increased river bank erosion and demands for protective structures
• Increased pressure on disaster relief systems
• Increased risk to human lives and health
• Negative impact on agriculture such as lower productivity levels and loss of harvest

15
Change to climate variable
Vulnerability Details
Increased mean sea level and associated storm surges
• Salt water intrusion into ground water and coastal wetlands
• Increased storm surges leading to coastal flooding, coastal erosion and damage to coastal infrastructure
• Increased impact on estuaries and associated impacts on fish and other marine species
The provincial climate change strategy also lists a number of priority responses in each of the key
sectors. These are summarised in the table below
Table 3: Priority Climate Change Adaptation Responses for the Western Cape province
Adaptation Category Adaptation Responses
Water Security and Efficiency
• Invasive alien vegetation clearing
• Prioritisation, valuation, mapping, protection, and restoration of ecological infrastructure in catchments
• Effective utilisation of irrigation water • Resource nexus 18 decision support • Develop ecosystem goods and services (EGS) investment
opportunities
Biodiversity and Ecosystem Goods and Services
• Prioritisation, valuation, mapping, protection, and restoration of ecological infrastructure
• Landscape initiatives/biodiversity corridors and identification of requirements for climate change adaptation corridors
• Biodiversity stewardship
• Mainstreaming of conservation planning into decision making
Food Security • Farming practices that are in harmony with nature, i.e. ‘conservation agriculture’;
• Climate smart agriculture; • Agricultural water technologies that reduce consumption and
increase efficiency; • Research on climate resilient and alternative crops and livestock
applicable to the Western Cape; • Addressing climate vulnerability through the Municipal Support
Programme; • Assessing food security in the context of the resource nexus.
Managing the effects of increased temperature on human lives
• Societal adaptation to human health impacts from temperature increases associated with climate change.
Healthy Communities • Monitoring health trends in relation to climate trends; • Research linkages between human health and climate change in
the WC context. These include: Air quality, Water quality, Food security, Heat stress, Disease vectors
16
3 Methodology This climate change response plan was developed through a combination of desktop research and
stakeholder engagement activities. Initially, desktop research was conducted on the climate change
status quo for each of the key sectors in the district. This research was used for the basis of the
stakeholder engagement activities.
The workshop methodologies were based on the active-based learning theory approach. Action
learning is an approach used to train and to encourage stakeholders to solve real life problems. The
workshop methodologies ensured there was a focus on knowledge exchange and capacity building
at the workshops.
There were three stakeholder engagement occurrences. These were:
• Provincial level workshop, where key stakeholders were introduced to the core concepts of
climate change and the LGCCSP program. The exposure component of the vulnerability
assessment was also undertaken by various stakeholders at this workshop, including
government officials and other key community members. The workshop therefore involved
presentations, participatory exercises and associated discussions.
• A District Municipality Level workshop, where the focus was specifically on the identification
and review of key climate change vulnerabilities for the area. A more detailed vulnerability
assessment was undertaken by the participants. The process included the identification of
context specific climate change indicators, assessing exposure, sensitivity and adaptive
capacity. Participants also developed priority climate change responses.
• A final Provincial Level workshop, where key stakeholders were invited to present their
municipal climate change plans.
These workshops aimed to provide the necessary tools, build capacity and provide support to
stakeholders to develop and review existing Climate Change Vulnerability Assessments and response
plans.
3.1 What is a Vulnerability Assessment? According to the IPCC (Parry et al. 2007) "vulnerability to climate change is the degree to which
geophysical, biological and socio-economic systems are susceptible to, and unable to cope with,
adverse impacts of climate change”. A vulnerability assessment therefore is a multifaceted
assessment of an area’s vulnerability to climate change. Nelitz et al. further define a climate change
vulnerability assessment as “a process for assessing, measuring, and/or characterizing the exposure,
sensitivity, and adaptive capacity of a natural or human system to disturbance” (Nelitz, M, Boardley,
S, and Smith, R 2013). The methodology used in assessing climate change vulnerability for the
district used the three assessment criteria, namely: exposure, sensitivity and adaptive capacity.
• Exposure refers to the magnitude and extent, to which a municipal area is exposed to
climate change impacts (Amos, E, Akpan, U, and Ogunjobi, K 2015) and is a function of one’s
location and environment.
• Sensitivity on the other hand refers to the extent to which a municipal area is affected by
the climate change impacts
• The IPCC (Parry et al. 2007) formally defines adaptive capacity as: "The ability of a system to
adjust to climate change to moderate potential damages, to take advantage of
opportunities, or to cope with the consequences".

17
Exposure and sensitivity, increases one’s vulnerability to climate change while adaptive capacity
decreases vulnerability. The above-mentioned components allow for more detailed
characterizations of climate change vulnerability.
3.2 Steps involved in a Vulnerability Assessment Four steps were followed when conducting a vulnerability assessment, they are:
• Step 1: Identify indicators’ potential impacts.
• Step 2: Assess whether the impact will take place (exposure).
• Step 3: Assess how important the risk is (sensitivity).
• Step 4: Assess if you can respond to the risk (adaptive capacity).
Figure 2 below illustrates how the components of a Climate Change Vulnerability Assessment link to
each other.
Figure 2: Vulnerability Assessment Methodology
3.3 Step 1: Develop Climate Change Indicators As mentioned above, the first step in a Climate Change Vulnerability Assessment is the identification
of context specific indicators. Essentially, indicators are potential climate change induced impacts in
a specific area. The LGCCSP Vulnerability Assessment Toolkit developed a draft of several indicators
using the Long Term Adaptation Scenario Reports (Department of Environmental Affairs 2013e). The
indicators are grouped into six sectors (agriculture; biodiversity and environment; coastal and
marine; human health; disaster management, infrastructure and human settlements; and water).
3.4 Step 2: Assessing Exposure The assessment of exposure followed the identification of indicators. Exposure assessment aimed to
ascertain whether the identified indicators are relevant in the District Municipality. If the District
Municipality was exposed to an indicator, stakeholders scored that indicator a ‘yes’.
18
3.5 Step 3: Assessing Sensitivity The third step of the Climate Change Vulnerability Assessment ‘asks’ the question, "if you are
exposed, how important is the potential impact?" This is termed "sensitivity" and is assessed using a
graded scale (High, Medium or Low). If an indicator scored a “yes” in the exposure assessment, the
sensitivity of the Municipality to that indicator was than analysed using the graded scale.
3.6 Step 4: Assessing Adaptive Capacity Once exposure and sensitivity were determined, the next step was the assessment of adaptive
capacity. The question directed at stakeholders during the workshop was "If there are going to be
significant impacts due to climate change, do you have the necessary systems (policy, resources,
social capital) in place to respond to the change?"
The indicators that scored “yes” for the exposure questions and “high” or “medium” for the
sensitivity questions, were then assessed in terms of adaptive capacity. For the LGCCS Vulnerability
Assessment Toolkit, the guiding question was "Do you have high, medium or low adaptive capacity
(policy, institutional, social and finance) to respond to the change?" The adaptive capacity answers
were scored using a graded scale (high, medium or low).
Those that scored a “low” or “medium” were recorded as indicators with potential adaptive capacity
constraints in Cape Winelands District Municipality.
3.7 Step 5: Develop Response Plans for Priority Indicators Upon completion of the exposure, sensitivity and adaptive capacity assessments, priority indicators
were identified using the criteria below:
• Exposure - Yes
• Sensitivity - High or Medium
• Adaptive Capacity - Low or Medium
Priority indicators are perceived to be the ones the district are most vulnerable to. A response plan
was then developed to address climate change vulnerabilities and inform resource allocation for
climate change adaptation. To facilitate the development of a response plan, stakeholders were
given a LGCCS generic response plan template for each sector, which was used as a starting point to
develop sector specific response plans for Cape Winelands District Municipality.
3.8 Desired Adaptation Outcomes The Department of Environmental Affairs (DEA) has developed (ongoing process) a set of Desired
Adaptation Outcomes (DAOs). The DAOs provide evidence of climate change impacts and of
responses to climate change in South Africa. DAOs identify desired states that, individually and in
combination, will contribute to climate resilience in the short to medium-term (i.e. over the next five
to 20 years). They aim to provide clear insights into climate change adaptation in South Africa and
help capture the country’s unique circumstances to aid reporting on adaptation at national and
international levels. They also provide a means of assessing the capacity of ‘at risk’ sectors and their
stakeholders to adapt to climate change and whether the measures being taken are appropriate,
efficient and effective.
The current set of DAOs are provided below:
• G1 - Robust/integrated plans, policies and actions for effective delivery of climate change
adaptation, together with monitoring, evaluation and review over the short, medium and
long term.
19
• G2 - Appropriate resources (including current and past financial investments), capacity and
processes (human, legal and regulatory) and support mechanisms (institutional and
governance structures) to facilitate climate change adaptation.
• G3 - Accurate climate information (e.g. historical trend data, seasonal predictions, future
projections, and early warning of extreme weather and other climate-related events)
provided by existing and new monitoring and forecasting facilities/networks (including their
maintenance and enhancement) to inform adaptation planning and disaster risk reduction.
• G4 - Capacity development, education and awareness programmes (formal and informal) for
climate change adaptation (e.g. with tools to utilise data/outputs and informed by
adaptation research).
• G5 - New and adapted technologies/knowledge and other cost-effective measures (e.g.
nature-based solutions) used in climate change adaptation.
• G6 - Climate change risks, impacts and vulnerabilities identified and addressed.
• G7 - Systems, infrastructure, communities and sectors less vulnerable to climate change
impacts (e.g. through effectiveness of adaptation interventions/response measures).
• G8 - Non-climate pressures and threats to human and natural systems reduced (particularly
where these compound climate change impacts).
• G9 - Secure food, water and energy supplies for all citizens (within the context of sustainable
development).
The activities in the Sector Response Plans below have a column to allocate the DAOs. This will assist
the DEA to monitor and evaluate the implementation of climate change adaptation throughout the
country.

20
4 District Snapshot Cape Winelands District Municipality Cape Winelands District Municipality is one of five district municipalities within the Western Cape
Province. The district is in the Boland region and comprises of the Breede Valley, Drakenstein,
Langeberg, Stellenbosch, and Witzenberg local municipality. The district municipal area has a total
population of 787 491 more than 10% of the province’s total population (Statistics South Africa
2011). Drakenstein local municipality is home to a greatest proportion of the district’s population
and Langeberg local municipality is home to the smallest proportion of the district’s population. The
district is largely rural in nature (Cape Winelands District Municipality 2017) with only 0.5% of land
located to towns (SRK Consulting 2011). Climate related hazards in the district include: floods,
seismic activity, and veld fires (SRK Consulting 2011). Climate change is likely to exacerbate the
above-mentioned hazards in the future. Furthermore, climate projections reveal reduced rainfall and
increased temperatures in the future (SRK Consulting 2011).
4.1 Key District Indicators The table below provides a summary of the key indicators for the District. The table lists the national
indicators for comparison purposes. Many of these indicators are used in the climate change
vulnerability assessment process below.
Table 4: Key District Municipal Indicators for the Cape Winelands DM compared to the National Average
General Information Cape Winelands District
Municipality South Africa
Code DC02
Province Western Cape
Seat Worcester
Area (km²) 22309 1219740
Census Statistics
Criteria Cape Winelands District
Municipality South Africa
Population 787491 51770553
Age Structure
Population under 15 25.84% 29.17%
Population 15 to 39 43.98% 44.30%
Population 40 to 64 25.05% 21.19%
Population over 65 5.13% 5.34%
Dependency Ratio
People in age group 0-14 & 65+, supported by age group 15-64 44.9% 52.7%
Employment (between 15 and 64)
Employed 53.30% 38.87%
Not economically active 35.68% 39.21%
Unemployed 8.74% 16.50%

21
Discouraged work-seeker 2.28% 5.41%
Education (aged 20 +)
Post School Qualification 8.56% 9.94%
Grade 12/Matric 23.33% 27.83%
High School 35.61% 32.16%
Less than High School 21.59% 16.43%
Other 10.90% 13.64%
Vulnerability Indicators
Criteria Cape Winelands District
Municipality South Africa
Household Dynamics
Households 198261 14450151
Average household size 3.97 3.58
Percentage households involved in agricultural activities 7.60% 20.56%
Dwelling Type
Percentage Households that are Informal Dwellings 15.96% 13.58%
Percentage Households that are Traditional Dwellings 0.60% 7.89%
Combined Percentage Households that are Traditional and Informal Dwellings 16.57% 21.47%
Sources of Water
Percentage of Population that sources water from Boreholes 5.21% 1.76%
Percentage of Population that do not source water from piped water schemes 21.55% 21.82%
Percentage of Population that source water from Service Providers (e.g. Municipalities) 78.45% 78.18%
Percentage of Population that sources water from Water Tanks 1.18% 2.67%
Electricity Usage
Percentage of households that use alternatives to electricity for cooking 12.16% 26.12%
Percentage of households that use alternatives to electricity for cooking, heating or lighting 6.60% 17.77%
Sanitation
Percentage Population with flush toilets 91.28% 56.51%
Percentage Population using pit latrines 0.79% 30.73%
Percentage of Population with no toilet facilities 2.41% 5.34%
Percentage of Population with other toilet facilities 5.52% 7.42%

22
Refuse
Percentage of Households with no rubbish disposal 1.45% 5.97%
Percentage of households with refuse removed by local authority/private company 82.66% 59.40%
Health
Percentage of young (<5yrs) and elderly (>64yrs) 14.53% 16.32%
Percentage workforce employed in the informal Sector 16.00% 12.20%
Vulnerability Tool Indicators
Criteria Cape Winelands District
Municipality South Africa
Percentage households involved in agricultural activities 7.60% 20.56%
Percentage Population with flush toilets 91.28% 56.51%
Percentage of young (<5yrs) and elderly (>64yrs) 14.53% 16.32%
Percentage Households that are Traditional and Informal Dwelling 16.57% 21.47%
Percentage of Households with no rubbish disposal 1.45% 5.97%
4.2 Cape Winelands DM Agriculture Sector Summary The agriculture sector in the Cape Winelands District Municipality is a key sector in terms of
employment and food security within the municipality(Cape Winelands District Municipality 2017).
Most of the land in the District Municipal Area that is not either mountains or natural vegetation (i.e.
fynbos and veld) is covered by commercial agriculture and some commercial forestry (Cape
Winelands District Municipality 2017). The main commercial agricultural activities in the district are
the production of grapes, wine, poultry and horticulture such as fruit, nuts and cut flowers (Cape
Winelands District Municipality 2009, 2017). The Cape Winelands District Municipality is known for
its viticulture and it is estimated that roughly 56 % of all South African wine grapes are grown in the
District Municipality (Cape Winelands District Municipality 2009). Additionally, about 68 % of South
Africa’s wine is produced in the District Municipality(Cape Winelands District Municipality 2009).
Much of the agricultural production in the Cape Winelands District Municipal Area is irrigated and
this has led to the agriculture sector becoming the largest water user in the District Municipality
(Cape Winelands District Municipality 2009, 2015). The District Municipality is already a water
stressed area (Cape Winelands District Municipality 2015) and the high use of water in the District
Municipal Area has caused sections of some rivers inside the District Municipal Area to run dry by
midsummer (Cape Winelands District Municipality 2017). This is a failure to meet the obligation of
maintaining the ecological reserve, which requires that a portion of the available water stays in
rivers to maintain the biological life found there (SRK Consulting 2011).
Being so varied and large, the agriculture sector is one of the most important employers in the Cape
Winelands District Municipal Area, however, employment in the agriculture sector is declining (Cape
Winelands District Municipality 2017). Overall, employment in the agriculture, forestry and fisheries
sector accounted for 76,820 or approximately 20.5 % of the total number of people employed within
the District Municipality in 2015 (Cape Winelands District Municipality 2017). However, between
2005 and 2015 the agriculture sector experienced a net decrease in employment of approximately
23
23,334 jobs, which represents an average decrease of 2.3 % per annum (Cape Winelands District
Municipality 2017).
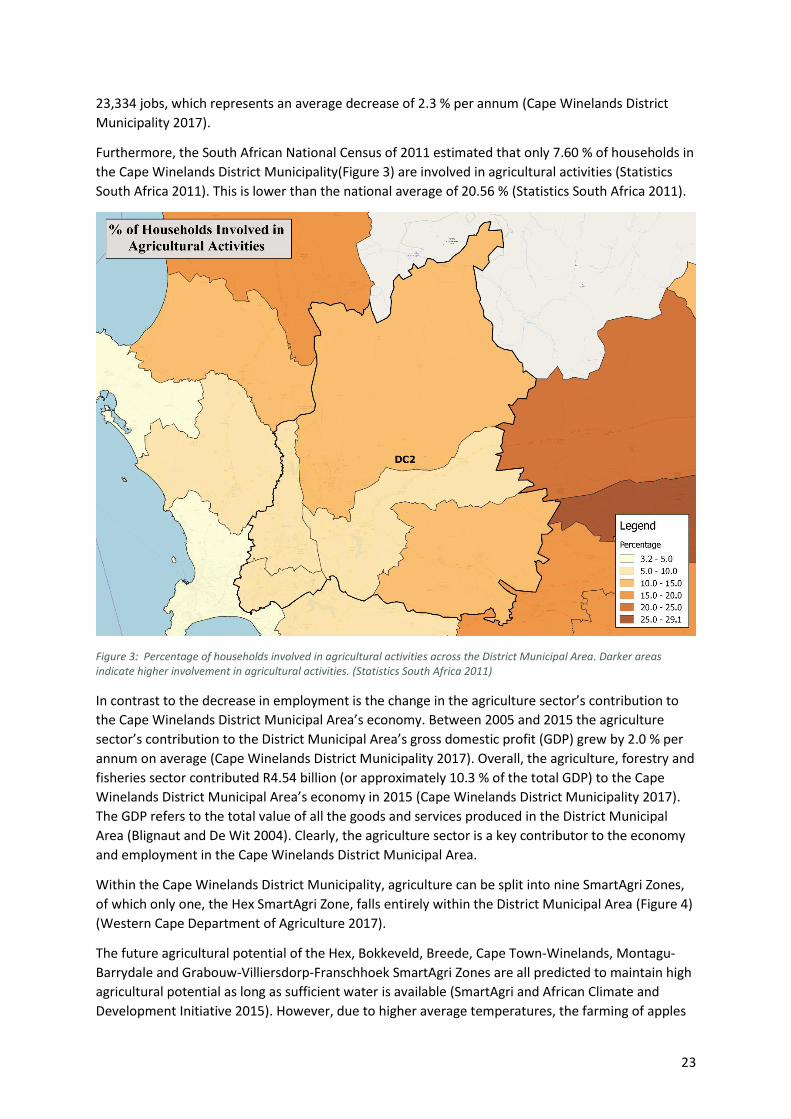
Furthermore, the South African National Census of 2011 estimated that only 7.60 % of households in
the Cape Winelands District Municipality(Figure 3) are involved in agricultural activities (Statistics
South Africa 2011). This is lower than the national average of 20.56 % (Statistics South Africa 2011).
Figure 3: Percentage of households involved in agricultural activities across the District Municipal Area. Darker areas indicate higher involvement in agricultural activities. (Statistics South Africa 2011)
In contrast to the decrease in employment is the change in the agriculture sector’s contribution to
the Cape Winelands District Municipal Area’s economy. Between 2005 and 2015 the agriculture
sector’s contribution to the District Municipal Area’s gross domestic profit (GDP) grew by 2.0 % per
annum on average (Cape Winelands District Municipality 2017). Overall, the agriculture, forestry and
fisheries sector contributed R4.54 billion (or approximately 10.3 % of the total GDP) to the Cape
Winelands District Municipal Area’s economy in 2015 (Cape Winelands District Municipality 2017).
The GDP refers to the total value of all the goods and services produced in the District Municipal
Area (Blignaut and De Wit 2004). Clearly, the agriculture sector is a key contributor to the economy
and employment in the Cape Winelands District Municipal Area.
Within the Cape Winelands District Municipality, agriculture can be split into nine SmartAgri Zones,
of which only one, the Hex SmartAgri Zone, falls entirely within the District Municipal Area (Figure 4)
(Western Cape Department of Agriculture 2017).
The future agricultural potential of the Hex, Bokkeveld, Breede, Cape Town-Winelands, Montagu-
Barrydale and Grabouw-Villiersdorp-Franschhoek SmartAgri Zones are all predicted to maintain high
agricultural potential as long as sufficient water is available (SmartAgri and African Climate and
Development Initiative 2015). However, due to higher average temperatures, the farming of apples

24
in the Grabouw-Villiersdorp-Franschhoek SmartAgri Zone is predicted to become unviable
(SmartAgri and African Climate and Development Initiative 2015). While in the Swartland SmartAgri
Zone, future agricultural potential is predicted to remain high for small grains (such as wheat and
barley), however, the variability of these yields is expected to increase (SmartAgri and African
Climate and Development Initiative 2015).
Additionally, the Tankwa-van Wyksdorp and Cederberg SmartAgri Zones are predicted to become
less productive due to water availability and heat-related issues (SmartAgri and African Climate and
Development Initiative 2015).
Figure 4: SmartAgri Zones in the District Municipal Area (Western Cape Department of Agriculture 2017)
The northern part of the Cape Winelands District Municipal Area has the highest grazing capacity
(i.e. the highest number of hectares required per large stock unit for viable grazing) in the District
Municipal Area, while the west has the lowest grazing capacity (Figure 5) (Western Cape Department
of Agriculture 2017). Much of the south of the District Municipal Area has been categorised as
“Transformed rangeland” and thus has no grazing capacity (Western Cape Department of Agriculture
2017). It should be noted that the data for this map is from 1993 and so the grazing capacities may
have changed somewhat in the intervening years.

25
Figure 5: Grazing capacity in the District Municipal Area (Western Cape Department of Agriculture 2017)
Looking at specific livestock density levels (i.e. the number of animals per square kilometre), small
stock occurs in limited amounts within the Cape Winelands District Municipal Area (Figure 6)
(Western Cape Department of Agriculture 2017). Specifically, the highest density of small stock
occurs in a small area in the centre in the District Municipal Area, followed by the southwest and
southeast with lower small stock density levels (Western Cape Department of Agriculture 2017).

26
Figure 6: Small stock density levels in the District Municipal Area (Western Cape Department of Agriculture 2017)
Similarly, bovine density levels (Figure 7) are mostly low in the Cape Winelands District Municipal
Area (Western Cape Department of Agriculture 2017). Specifically, cattle density levels are at their
highest in the south of the District Municipal Area (Western Cape Department of Agriculture 2017).

27
Figure 7: Bovine density levels in the District Municipal Area (Western Cape Department of Agriculture 2017)
Furthermore, ostrich farming (Figure 8) is very limited in the Cape Winelands District Municipal Area,
occurring in four small areas with limited density levels (Western Cape Department of Agriculture
2017).

28
Figure 8: Ostrich density levels in the District Municipal Area (Western Cape Department of Agriculture 2017)
While the grazing capacities in the Cape Winelands District Municipal Area are mostly low, the crop
census (Figure 9) shows that there is a lot of crop production in the District Municipal Area, largely in
the southern and western parts (Western Cape Department of Agriculture 2017). Much of this crop
production occurs alongside the District Municipal Area’s rivers (Western Cape Department of
Agriculture 2017). The main crops grown in the District Municipal Area are ‘grapes’, ‘planted
pastures’, ‘grains and mixed’, ‘pome fruit’ (such as apples) and ‘citrus’ (Western Cape Department of
Agriculture 2017).

29
Figure 9: Crop census in the District Municipal Area (Western Cape Department of Agriculture 2017)
There are eleven Wine of Origin districts that occur mainly within the Cape Winelands District
Municipal Area (Figure 10), as the District Municipal Area is (unsurprisingly given its name) the most
important viticulture and winemaking area in South Africa (Western Cape Department of Agriculture
2017). Wine of Origin districts are more specific than wine regions and they signify that all the
grapes came from the same specific area (Western Cape Department of Agriculture 2017). The Wine
of Origin districts that occur mainly in the District Municipal Area are the Ceres Plateau, Tulbagh,
Worcester, Wellington, Breedekloof, Franschhoek, Paarl, Stellenbosch and Robertson Wine of Origin
districts.The Overberg and Swellendam Wine of Origin districts fall partially within the District
Municipal Area (Western Cape Department of Agriculture 2017).

30
Figure 10: Wine of origin districts in the District Municipal Area (Western Cape Department of Agriculture 2017)
Additionally, some small commercial plantations consisting of Pinus species are scattered in the
southwest of the Cape Winelands District Municipal Area (Figure 11) (De Lange 2013). Plantations
are predicted to be exposed to greater risk due to an increase in the frequency and severity of fires
caused by climate change related increases in average temperatures (Cape Winelands District
Municipality 2015).

31
Figure 11: Commercial forestry distribution across the District Municipal Area (De Lange 2013)
Despite the potential for expanding agricultural production in the Cape Winelands District Municipal
Area, it is predicted that climate change will affect the agriculture sector both positively and
negatively. The Long Term Adaptation Scenarios Flagship Research Programme (LTAS) has forecast
that climate change is predicted to increase temperatures and rainfall variability, while decreasing
the total average rainfall in the west of South Africa (Department of Environmental Affairs 2013c).
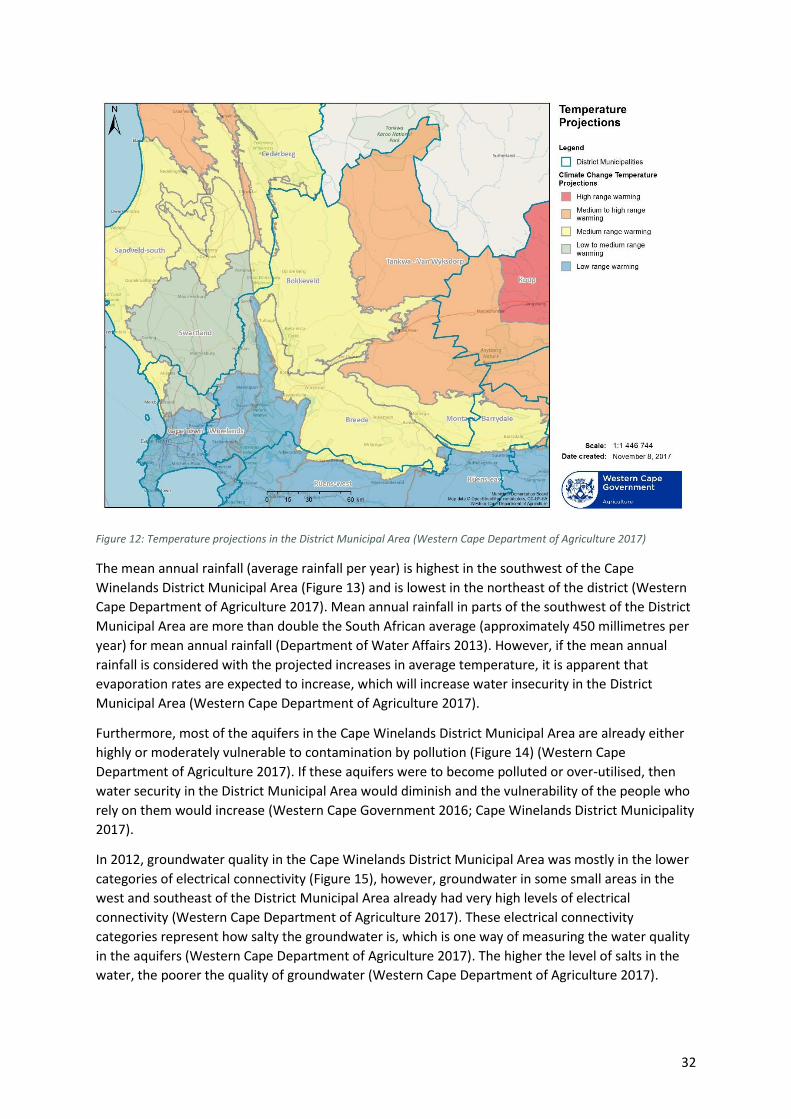
The predicted increases in mean average temperature (Figure 12) in the Cape Winelands District
Municipal Area, show that mean average temperatures are projected to increase in bands from ‘low
range warming’ in the southwest to ‘medium to high range warming’ in the northeast of the District
Municipal Area (Western Cape Department of Agriculture 2017).
32
Figure 12: Temperature projections in the District Municipal Area (Western Cape Department of Agriculture 2017)
The mean annual rainfall (average rainfall per year) is highest in the southwest of the Cape
Winelands District Municipal Area (Figure 13) and is lowest in the northeast of the district (Western
Cape Department of Agriculture 2017). Mean annual rainfall in parts of the southwest of the District
Municipal Area are more than double the South African average (approximately 450 millimetres per
year) for mean annual rainfall (Department of Water Affairs 2013). However, if the mean annual
rainfall is considered with the projected increases in average temperature, it is apparent that
evaporation rates are expected to increase, which will increase water insecurity in the District
Municipal Area (Western Cape Department of Agriculture 2017).
Furthermore, most of the aquifers in the Cape Winelands District Municipal Area are already either
highly or moderately vulnerable to contamination by pollution (Figure 14) (Western Cape
Department of Agriculture 2017). If these aquifers were to become polluted or over-utilised, then
water security in the District Municipal Area would diminish and the vulnerability of the people who
rely on them would increase (Western Cape Government 2016; Cape Winelands District Municipality
2017).
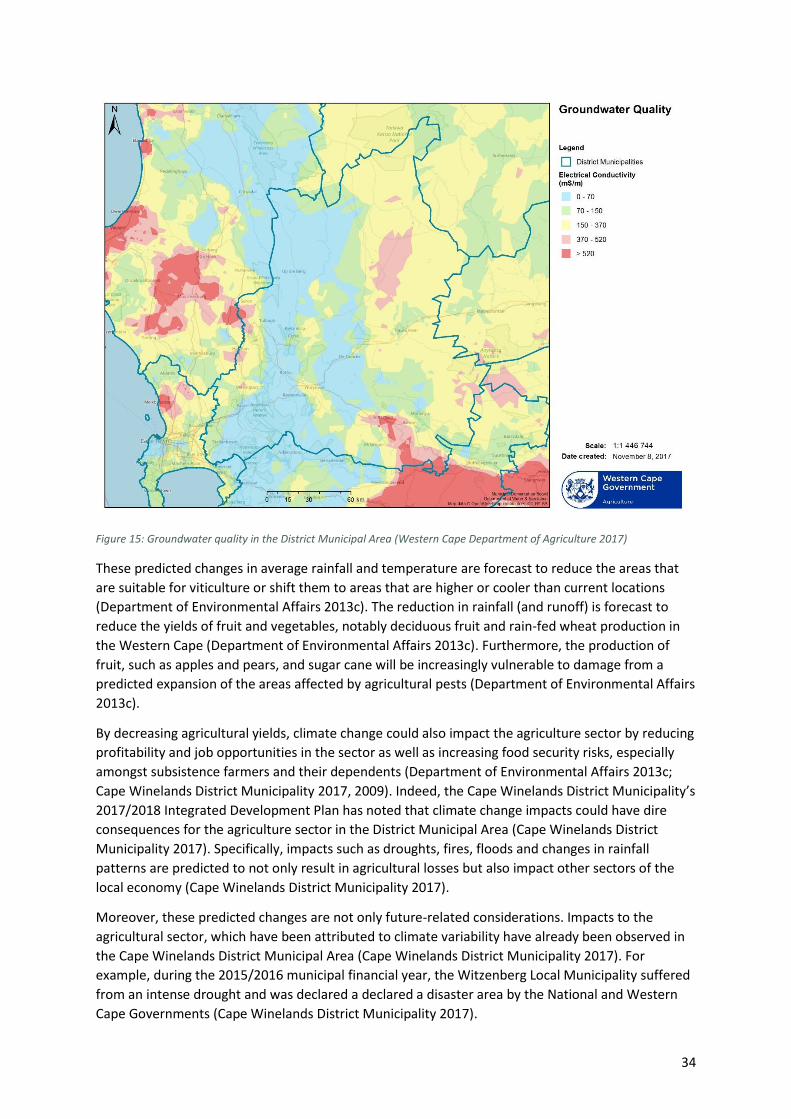
In 2012, groundwater quality in the Cape Winelands District Municipal Area was mostly in the lower
categories of electrical connectivity (Figure 15), however, groundwater in some small areas in the
west and southeast of the District Municipal Area already had very high levels of electrical
connectivity (Western Cape Department of Agriculture 2017). These electrical connectivity
categories represent how salty the groundwater is, which is one way of measuring the water quality
in the aquifers (Western Cape Department of Agriculture 2017). The higher the level of salts in the
water, the poorer the quality of groundwater (Western Cape Department of Agriculture 2017).

33
Figure 13: Mean Annual Rainfall in the District Municipal Area (Western Cape Department of Agriculture 2017)
Figure 14: Aquifer vulnerability in the District Municipal Area (Western Cape Department of Agriculture 2017)
34
Figure 15: Groundwater quality in the District Municipal Area (Western Cape Department of Agriculture 2017)
These predicted changes in average rainfall and temperature are forecast to reduce the areas that
are suitable for viticulture or shift them to areas that are higher or cooler than current locations
(Department of Environmental Affairs 2013c). The reduction in rainfall (and runoff) is forecast to
reduce the yields of fruit and vegetables, notably deciduous fruit and rain-fed wheat production in
the Western Cape (Department of Environmental Affairs 2013c). Furthermore, the production of
fruit, such as apples and pears, and sugar cane will be increasingly vulnerable to damage from a
predicted expansion of the areas affected by agricultural pests (Department of Environmental Affairs
2013c).
By decreasing agricultural yields, climate change could also impact the agriculture sector by reducing
profitability and job opportunities in the sector as well as increasing food security risks, especially
amongst subsistence farmers and their dependents (Department of Environmental Affairs 2013c;
Cape Winelands District Municipality 2017, 2009). Indeed, the Cape Winelands District Municipality’s
2017/2018 Integrated Development Plan has noted that climate change impacts could have dire
consequences for the agriculture sector in the District Municipal Area (Cape Winelands District
Municipality 2017). Specifically, impacts such as droughts, fires, floods and changes in rainfall
patterns are predicted to not only result in agricultural losses but also impact other sectors of the
local economy (Cape Winelands District Municipality 2017).
Moreover, these predicted changes are not only future-related considerations. Impacts to the
agricultural sector, which have been attributed to climate variability have already been observed in
the Cape Winelands District Municipal Area (Cape Winelands District Municipality 2017). For
example, during the 2015/2016 municipal financial year, the Witzenberg Local Municipality suffered
from an intense drought and was declared a declared a disaster area by the National and Western
Cape Governments (Cape Winelands District Municipality 2017).

35
4.3 Cape Winelands DM Biodiversity Sector Summary Most of the Cape Winelands District Municipality is covered by the Fynbos Biome (Figure 16). A
sizable area of Succulent Karoo Biome is also found in the district, mostly in the north and east. The
Fynbos Biome is part of the Cape Floristic Kingdom (one of six recognised floral kingdoms globally),
consisting of the fynbos and renosterveld, and includes an extremely high number of species
(Mucina and Rutherford 2006). Both the Fynbos and Succulent Karroo Biomes are renowned for
their high levels of endemism (Mucina and Rutherford 2006). The Succulent Karoo Biome is
extremely dry and is characterised by low winter rainfallwith prevailing vegetation in the Succulent
Karoo biome being characterised by dwarf, succulent shrubs, and large displays of flowers (annuals)
in the spring (Mucina and Rutherford 2006). For the size and aridity of the Succulent Karoo Biome, it
has a very high number of plant and flower species (Mucina and Rutherford 2006).
Figure 16: Current biome delineation in the District Municipal Area (South African National Parks 2011a)
Climate change is predicted to shift the biomes in South Africa, resulting in a change to the
ecosystems and vegetation found in the Cape Winelands District Municipal Area. The Long Term
Adaptation Scenarios Report on biodiversity highlights the following biomes as the most vulnerable
and “in need of strong protection, restoration and/or research” (Department of Environmental
Affairs 2013b).
• High priority for action: Fynbos and Forest.
• Medium priority for action: Nama Karoo and Succulent Karoo.
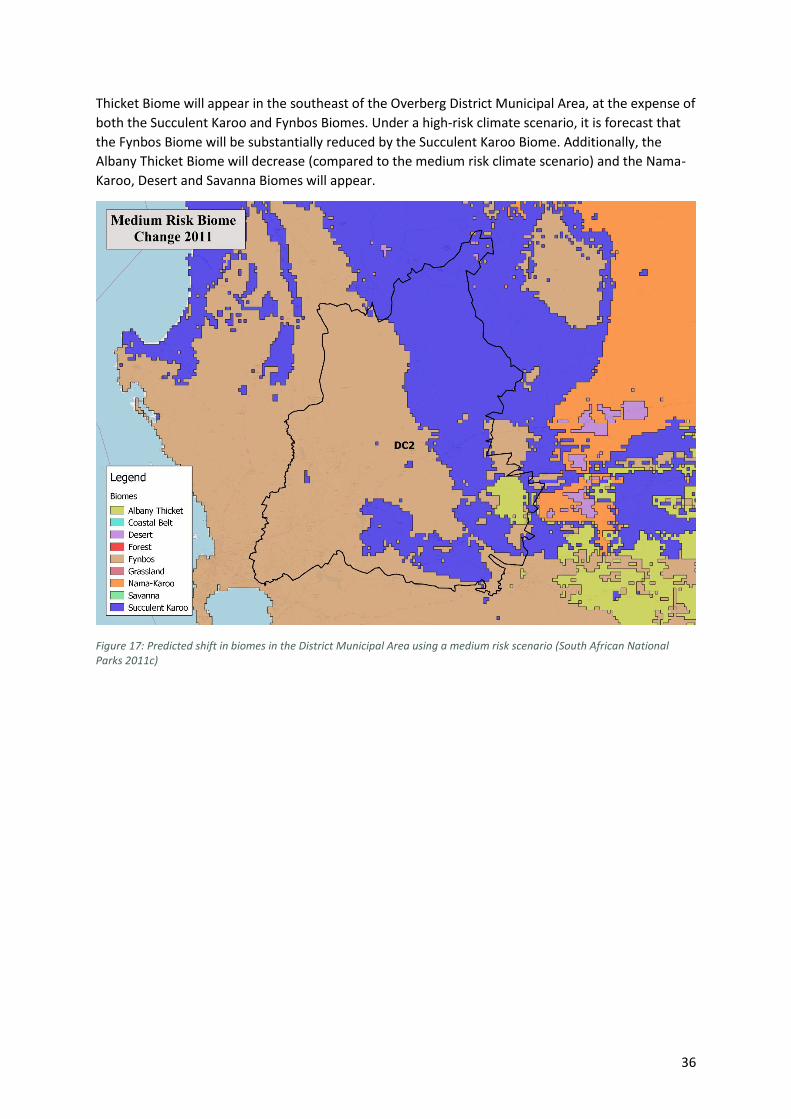
The maps below (Figure 17 and Figure 18) show the shift in biomes in the Cape Winelands District
Municipal Area given different climate scenarios modelled by the South African National Biodiversity
Institute (SANBI) in 2011. It is forecast that under a medium risk climate scenario, the Succulent
Karoo Biome will expand into areas currently covered by the Fynbos Biome. Additionally, the Albany
36
Thicket Biome will appear in the southeast of the Overberg District Municipal Area, at the expense of
both the Succulent Karoo and Fynbos Biomes. Under a high-risk climate scenario, it is forecast that
the Fynbos Biome will be substantially reduced by the Succulent Karoo Biome. Additionally, the
Albany Thicket Biome will decrease (compared to the medium risk climate scenario) and the Nama-
Karoo, Desert and Savanna Biomes will appear.
Figure 17: Predicted shift in biomes in the District Municipal Area using a medium risk scenario (South African National Parks 2011c)

37
Figure 18: Predicted shift in biomes in the District Municipal Area using a high risk scenario (South African National Parks 2011b)
Within the Biomes found in the Cape Winelands District Municipal Area, there are numerous
threatened ecosystem types (Figure 19). The Eastern Rûens Shale Renosterveld, Cape Lowland
Alluvial Vegetation, Muscadel Riviere, Elgin Shale Fynbos, Kogelberg Sandstone Fynbos, Swartland
Granite Renosterveld, Cape Flats Sand Fynbos, Swartland Alluvium Fynbos, Atlantis Sand Fynbos and
Swartland Shale Renosterveld are all categorised as critically endangered ecosystem types (South
African National Biodiversity Institute 2011). There are also a few ecosystem types categorised as
endangered or vulnerable in the Cape Winelands District Municipal Area (South African National
Biodiversity Institute 2011).

38
Figure 19: Threatened ecosystem types in the District Municipal Area (South African National Biodiversity Institute 2011)
In South Africa, a ‘protected area’ is defined as areas of land (e.g. a national park) or ocean (e.g. a
marine protected area) that is legally protected and managed for the conservation of biodiversity, as
per the National Environmental Management: Protected Areas Act (No. 57 of 2003) (Department of
Environmental Affairs 2009). Internationally, the International Union for Conservation of Nature’s
(IUCN) definition of protected area includes areas that are not legally protected, which the
Department of Environmental Affairs refers to as ‘conservation areas’ (Department of Environmental
Affairs 2009). Within the Cape Winelands District Municipal Area there are 50 protected areas
(Figure 20).
39
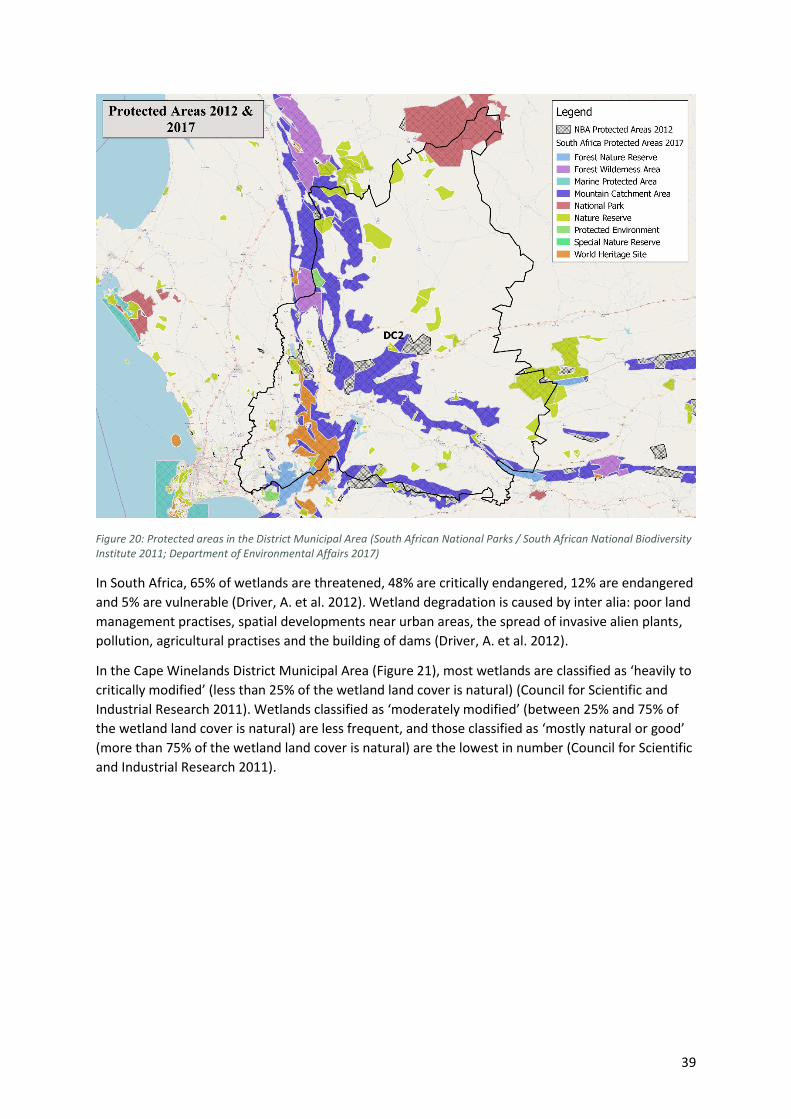
Figure 20: Protected areas in the District Municipal Area (South African National Parks / South African National Biodiversity Institute 2011; Department of Environmental Affairs 2017)
In South Africa, 65% of wetlands are threatened, 48% are critically endangered, 12% are endangered
and 5% are vulnerable (Driver, A. et al. 2012). Wetland degradation is caused by inter alia: poor land
management practises, spatial developments near urban areas, the spread of invasive alien plants,
pollution, agricultural practises and the building of dams (Driver, A. et al. 2012).
In the Cape Winelands District Municipal Area (Figure 21), most wetlands are classified as ‘heavily to
critically modified’ (less than 25% of the wetland land cover is natural) (Council for Scientific and
Industrial Research 2011). Wetlands classified as ‘moderately modified’ (between 25% and 75% of
the wetland land cover is natural) are less frequent, and those classified as ‘mostly natural or good’
(more than 75% of the wetland land cover is natural) are the lowest in number (Council for Scientific
and Industrial Research 2011).

40
Figure 21: Condition of wetlands in the District Municipal Area (Council for Scientific and Industrial Research 2011)
Most of the Cape Winelands District Municipal Area is mountainous. Land use in the Cape Winelands
District Municipality is predominantly agriculture based (Cape Winelands District Municipality 2017,
2016). Other land uses include conservation areas, forestry (plantations), urban areas and some
limited mining areas (Cape Winelands District Municipality 2017, 2016). These land uses have had
varying effects on the biodiversity of the Cape Winelands District Municipal Area.
Biodiversity in the Cape Winelands District Municipal Area has been positively influenced by the
conservation areas. It has been negatively influenced by: the spread of invasive alien species,
unsustainable harvesting of natural resources, land degradation (mainly due to poor land
management practises and overgrazing), soil erosion, increased pollution, population growth, spatial
development (such as the expansion of agricultural and urban areas), an ongoing drought and
climate change (Cape Winelands District Municipality 2017, 2016, 2015).
According to the Millennium Ecosystem Assessment (2005) ecosystem services are “the benefits that
people obtain from ecosystems”, which can be divided into four categories: provisioning (e.g.
timber), supporting (e.g. nutrient recycling), regulating (e.g. water purification), cultural (e.g.
recreational activities) (Millennium Ecosystem Assessment 2005). The existing challenges that
negatively affect the biodiversity in the Cape Winelands District Municipal Area (discussed above)
have also reduced ecosystem services (particularly provisioning services and regulating services) in
the Area and will continue to do so, if these impacts are not reduced.
If the biodiversity and related ecosystem services in the Cape Winelands District Municipal Area are
badly reduced, it could have direct negative consequences for the economy and social structures in
the Cape Winelands District Municipality. These consequences could have a detrimental effect on
efforts to reduce poverty, inequity and unemployment in the Cape Winelands District Municipality.

41
Furthermore, it is predicted that climate change will exacerbate these challenges and their effects on
the biodiversity and related ecosystem in South Africa.
It is widely accepted that in South Africa, climate change is expected to have an impact on socio-
economic development as well as the water and sanitation, food security, health, and energy sectors
(Department of Environmental Affairs 2011). In the Cape Winelands District Municipal Area, it is
predicted that climate change will increase average temperatures and the variability of rainfall as
well as exacerbate the risk and frequency of severe weather events such as floods, droughts, veld
fires and damaging storms (Cape Winelands District Municipality 2017, 2016, 2015).
Climate change has been identified as a key issue and major strategic risk for the Cape Winelands
District Municipality (Cape Winelands District Municipality 2017, 2016, 2015). Following the
publication of the Western Cape Climate Change Response Strategy in 2014, the Cape Winelands
District Municipality developed the Framework for a Draft Climate Change Response Strategy in
2015 (Cape Winelands District Municipality 2015, 2017). The Cape Winelands District Municipality
intends to review the Framework for a Draft Climate Change Response Strategy annually so that
budget-related changes are incorporated (Cape Winelands District Municipality 2017).
The purpose of the Framework for a Draft Climate Change Response Strategy is to identify ongoing
climate change-related projects and programmes in the Cape Winelands District Municipal Area as
well as to provide strategic direction to the various sectors within the Cape Winelands District
Municipality (Cape Winelands District Municipality 2015, 2017). The Framework for a Draft Climate
Change Response Strategy is more focussed on climate change adaptation than on mitigation
because of the Cape Winelands District Municipality’s limited functions (Cape Winelands District
Municipality 2015, 2017).
It has been acknowledged that key barriers to responding to climate change in the Cape Winelands
District Municipal Area (as well as other district municipalities in the Western Cape) include a lack of
capacity and limited financial resources (Cape Winelands District Municipality 2017, 2015). The Cape
Winelands District Municipality has emphasised the need for increased institutional capacity and
capacity-building at both district and local municipality levels (Cape Winelands District Municipality
2017, 2015). It also stressed the need for increased awareness campaigns and education
programmes in the Cape Winelands District Municipality regarding environmental health, water
supply and sanitation, waste management, and climate change and its predicted effects (Cape
Winelands District Municipality 2017, 2016, 2015).
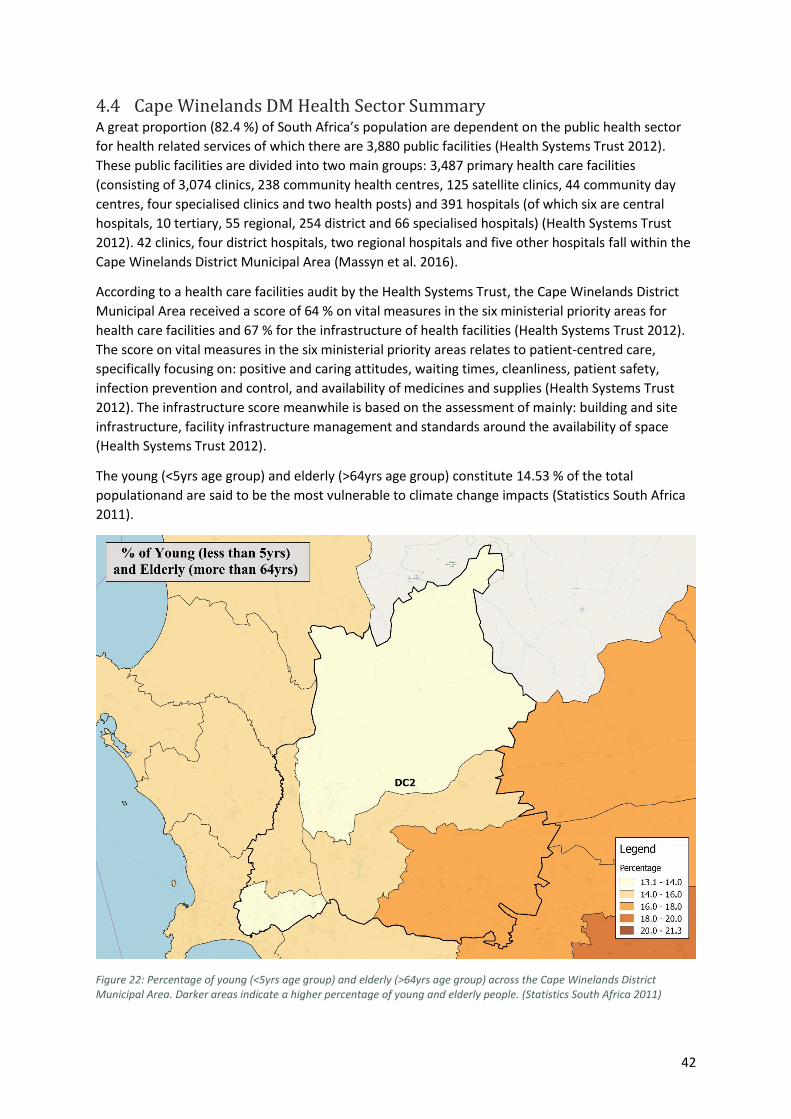
42
4.4 Cape Winelands DM Health Sector Summary A great proportion (82.4 %) of South Africa’s population are dependent on the public health sector
for health related services of which there are 3,880 public facilities (Health Systems Trust 2012).
These public facilities are divided into two main groups: 3,487 primary health care facilities
(consisting of 3,074 clinics, 238 community health centres, 125 satellite clinics, 44 community day
centres, four specialised clinics and two health posts) and 391 hospitals (of which six are central
hospitals, 10 tertiary, 55 regional, 254 district and 66 specialised hospitals) (Health Systems Trust
2012). 42 clinics, four district hospitals, two regional hospitals and five other hospitals fall within the
Cape Winelands District Municipal Area (Massyn et al. 2016).
According to a health care facilities audit by the Health Systems Trust, the Cape Winelands District
Municipal Area received a score of 64 % on vital measures in the six ministerial priority areas for
health care facilities and 67 % for the infrastructure of health facilities (Health Systems Trust 2012).
The score on vital measures in the six ministerial priority areas relates to patient-centred care,
specifically focusing on: positive and caring attitudes, waiting times, cleanliness, patient safety,
infection prevention and control, and availability of medicines and supplies (Health Systems Trust
2012). The infrastructure score meanwhile is based on the assessment of mainly: building and site
infrastructure, facility infrastructure management and standards around the availability of space
(Health Systems Trust 2012).
The young (<5yrs age group) and elderly (>64yrs age group) constitute 14.53 % of the total
populationand are said to be the most vulnerable to climate change impacts (Statistics South Africa
2011).
Figure 22: Percentage of young (<5yrs age group) and elderly (>64yrs age group) across the Cape Winelands District Municipal Area. Darker areas indicate a higher percentage of young and elderly people. (Statistics South Africa 2011)

43
In 2015, the total number of deaths in South Africa was 460,236, of which 6,609 occurred in the
Cape Winelands District Municipal Area (Statistics South Africa 2015). The distribution of deaths by
age for South Africa revealed that in, 2015, 7 % of the deaths occurred in children under the age of
five, while individuals over the age of 64 accounted for 34.4 % of the deaths (Statistics South Africa
2015).
In 2015, the top ten underlying natural causes of death within the Cape Winelands District Municipal
Area were: tuberculosis, HIV, cerebrovascular diseases, diabetes mellitus, tuberculosis, chronic lower
respiratory diseases, ischaemic heart diseases, malignant neoplasms, malignant neoplasms of
respiratory and intrathoracic organs, hypertensive diseases, and other forms of heart disease
(Statistics South Africa 2015).
The leading causes of death for children under five years of age, for the 2009 to 2014 period, in the
Cape Winelands District Municipal Area were a group of communicable (infectious) diseases
together with perinatal, maternal and nutritional conditions (Massyn et al. 2016). Diarrhoeal
diseases (17.5 %) were the leading cause of children’s (<5yrs age group) deaths, followed by preterm
birth complications, which accounted for 16.0 % of deaths (Massyn et al. 2016). The “children under
five years diarrhoea case fatality” (that is children under five years who died in hospital from
diarrhoeal disease) the District Municipal Area ranked 6th (where 1st represents the best
performance and 52nd represents the worst performance in South Africa) with a diarrhoea case
fatality rate of 0.1 % during the 2015/16 period (Massyn et al. 2016). The national average for
“children under five years diarrhoea case fatality” was 2.2 % over the same time period (Massyn et
al. 2016).
Furthermore, for the “Child under 5 years severe acute malnutrition case fatality rate” (that is
children under five years who died from acute malnutrition) the Cape Winelands District Municipal
Area ranks 7th, with a rate of 2.9 % during the 2015/16 period (Massyn et al. 2016). This is below the
national average of 8.9 % over the same time period (Massyn et al. 2016).
Leading causes of death for the elderly (>64yrs age group) in the Cape Winelands District Municipal
Area were a group of non-communicable diseases (which cannot be transferred from one person to
the next) that accounted for 59.0 % of the deaths between 2009 and 2014 (Massyn et al. 2016). Of
these non-communicable diseases, ischaemic heart disease was the leading cause (15.4 %) of
deaths, followed by cerebrovascular disease (15.2 %) (Massyn et al. 2016).
With regards to specific non-communicable diseases for 2015/2016, the number of newly diagnosed
cases of diabetes mellitus was approximately 0.9 occurrences per 1,000 people in the Cape
Winelands District Municipal Area (Massyn et al. 2016). Additionally, the number of newly diagnosed
cases of hypertension in 2015/2016 was approximately 8.4 occurrences (in people over the age of
40) per 1,000 people in the District Municipal Area (Massyn et al. 2016).
Furthermore, in the Cape Winelands District Municipal Area between 2009 and 2014,
meningitis/encephalitis was ranked as the 7th most common cause of death in the age group 5 to 14
years old, accounting for 2.2 % deaths in this age group (Massyn et al. 2016).
Concerning waterborne and communicable diseases, approximately 21.55 % of the Cape Winelands
District Municipal Area’s households do not source water from piped water schemes (Statistics
South Africa 2011) and are therefore vulnerable to waterborne diseases. Presently the water supply
in the District Municipal Area is insufficient with climate change and its associated impacts predicted
to exacerbate this water scarcity (Cape Winelands District Municipality 2017).

44
In terms of risks posed by working conditions, about 53.3 % of the Cape Winelands District Municipal
Area’s economically active population are employed, of which roughly 16.0 % are employed within
the informal sector (Statistics South Africa 2011). Many of the people employed in the informal
sector work outdoors in poor conditions, with limited infrastructure and services such as shade, and
limited access to amenities such as water and sanitation (Statistics South Africa 2011).
Additionally, 7.60 % of the Cape Winelands District Municipal Area’s households are involved in
agricultural activities (Statistics South Africa 2011). People who work outdoors, like those involved in
agricultural activities, are especially vulnerable to the impacts of extreme weather conditions.
Moreover, climate change is forecast to exacerbate the frequency and severity of extreme weather
events (Department of Environmental Affairs 2013c). Consequently, predicted impacts for
households involved in agriculture include reduced agricultural yields and water security as well as
increased food insecurity.
Climate change impacts affect the social and environmental determinants of health which include
clean air, secure shelter, safe drinking water, and sufficient food (World Health Organization 2017).
Below are some general climate change manifestations and their associated impacts on human
health.
• Natural disasters - The frequency and severity of natural disasters has increased. Natural
disasters destroy health facilities and homes. People may be forced to vacate their
properties leading to increased risk to a wide range of health effects including
communicable diseases and mental disorders (World Health Organization 2017).
• Increased storm events - These affect the supply of fresh water consequently increasing the
risk of diarrhoeal diseases (World Health Organization 2017).
• Floods - The frequency and intensity of floods has increased. Floods pollute water supplies
and increase the risk of water borne diseases. In addition, people lose their lives as a result
of drowning or physical injuries, property is damaged and the supply of health services is
disrupted (World Health Organization 2017). Climate change will also impact the distribution
and causes of several communicable diseases including cold-influenza and dry-
meningococcal meningitis among others (Singh and Kistnasamy 2014).
• Changes in climate conditions also affect vector-borne diseases that are transported through
organisms such as snails, insects and other cold-blooded animals (World Health Organization
2017). With climate change the transmission season will lengthen and the geographic range
of some vector borne diseases will change (World Health Organization 2017).
• Increased temperatures and variable rainfall are likely to reduce agricultural yields
consequently increasing the prevalence of malnutrition and hunger as a result of food
insecurity (World Health Organization 2017).
• Increased heat stress leads to death which can be attributed to cardiovascular and
respiratory diseases (World Health Organization 2017).
• Increased air pollution and increased occupational health problems (World Health
Organization 2017).
The main disaster risks that are likely to affect human health in the Cape Winelands District
Municipal Area are wild fires, drought, severe storms and floods (SRK Consulting 2011; Cape
Winelands District Municipality 2017). It is predicted that these disasters will be exacerbated by
climate change (Cape Winelands District Municipality 2015).
From the information above, the predicted impacts of climate change on human health and health
services are mostly negative. Hence, there is a need for climate change adaptation (and mitigation)

45
to limit the negative impacts and encourage any positive effects of climate change on human health
in the Cape Winelands District Municipal Area.

46
4.5 Cape Winelands DM Human Settlements Sector Summary The Cape Winelands District Municipality population is approximately 787,491 (Statistics South
Africa 2011). Of the District Municipalities within the Western Cape, the Cape Winelands District
Municipality has the highest population (Cape Winelands District Municipality 2017).. 43.98% of the
total population are between 15 and 39 years old, while children under 15 years make up 25.84% of
the total population (Statistics South Africa 2011). People between the ages of 40 and 64 constitute
25.05% of the total population, while people over 64 years old constitute the smallest (5.31%) part
of the total population (Statistics South Africa 2011). The most populous Local Municipality within
the District Municipality is the Breede Valley Local Municipality (SRK Consulting 2011)
Regarding education levels in the District, 35.61% of the population have some secondary schooling,
while 21.59% have some or completed primary schooling, 23.33% of the total population have
completed matric and 8.56% of the population have earned post-school qualifications (Statistics
South Africa 2011). The remaining 10.90% have been classified as “other” in terms of their level of
education (Statistics South Africa 2011).
The non-economically active population in the District constitute 35.68% of the District’s working-
age population (those aged 15 to 64) (Statistics South Africa 2011). Approximately 53.30% of the
working-age population is employed (Statistics South Africa 2011). The formal sector is the largest
employer, accounting for 76% of employed people (Statistics South Africa 2011). Within the formal
sector, the agricultural sector employs the highest proportion of people (23%) in comparison to
other sectors (Cape Winelands District Municipality 2017). The unemployed constitute 8.74% of the
working-age population, while 2.28% are discouraged work-seekers (Figure 23) (Statistics South
Africa 2011).
Figure 23: Employment status in the District Municipal Area (Statistics South Africa, 2011)
The District Municipality is described as one of the ‘pearls of South Africa’s rural and small-town sub-
regions’ due to its largely agricultural nature (Cape Winelands District Municipality 2017) with only
0.5% of District’s land located to towns (SRK Consulting 2011). There are 198,261 households and on
average four individuals per household in the District Municipality (Statistics South Africa 2011).
0,0% 10,0% 20,0% 30,0% 40,0% 50,0% 60,0%
Employed
Not economically active
Unemployed
Discouraged work-seeker
Employment (between 15 and 64)

47
About 64.5% of the District Municipality’s dwellings are formal1 (house) , while 5.4% are apartments,
15% are Informal dwellings and about 15.1% of the dwellings have not been specified (Statistics
South Africa 2011) (Figure 24). About 12.16% of the households within the District Municipality use
alternatives to electricity for cooking, while 6.60% use alternatives to electricity for cooking, heating
and lighting (Statistics South Africa 2011). Furthermore, water service providers are the biggest
source of water, they supply 78.45% of the District’s population with water (Figure 24) (Statistics
South Africa 2011). Additionally, 5.21% of the population get water from boreholes and 1.18% from
water tanks.
Figure 24: Households by type of dwelling in the District Municipal Area (Statistics South Africa, 2011)
Concerning sanitation services (Figure 26), 91.28% of the population have access to flush toilets,
while 0.79% use pit latrines, 5.52% have access to other toilet facilities and 2.41% of the population
have no toilet facilities (Statistics South Africa 2011).
1 “Formal House” includes cluster houses, flat or apartment, house/flat/room in backyards, house or
brick/concrete block structure on a separate stand or yard or on a farm, room/flatlet on a property or larger dwelling/servant’s quarters/granny flat and semi-detached houses.
0,0% 5,0% 10,0% 15,0% 20,0%
Percentage Households that areInformal Dwelling
Percentage Households that areTraditional Dwelling
Combined Percentage Householdsthat are Traditional and Informal
Dwelling
Dwelling Type

48
Figure 25: Household water sources in the District Municipal Area (Statistics South Africa 2011)
Figure 26: Sanitation facilities in the District Municipal Area (Statistics South Africa 2011)
National, provincial, main, divisional and minor roads facilitate movement within the District
Municipality (Cape Winelands District Municipality 2007). Rail routes also traverse through the
district (Cape Winelands District Municipality 2017). In addition, two aerodromes are found within
the District’s boundaries, with one aerodrome at Sanbona and the other at Ceres (Cape Winelands
District Municipality 2007). The Sanbona aerodrome is under-developed, not serviced by proper
roads or refuelling facilities among other essential services, and is not used to it fullest potential
because it is leased to an individual (Cape Winelands District Municipality 2007).
0,0% 50,0% 100,0%
Percentage of Population thatsources water from Boreholes
Percentage of Population that do notsource water from piped water
schemes
Percentage of Population that sourcewater from Service Providers (e.g
Municipalities)
Percentage of Population thatsources water from Water Tanks
Source of Water
0,0%10,0%20,0%30,0%40,0%50,0%60,0%70,0%80,0%90,0%100,0%
Percentage Population with flushtoilets
Percentage Population using pitlatrines
Percentage of Population with notoilet facilities
Percentage of Population withother toilet facilities
Sanitation

49
Climate related hazards in the District include: droughts, floods (flood risk in the District is among
the highest in the country), severe storms, seismic activity; and veld fires (SRK Consulting 2011). The
District is prone to veld fire hazards for about six months of the year (Cape Winelands District
Municipality 2017). In addition most of the District has an extremely high veld fire risk, however,
there are areas in the north and east that have low veld fire risks (Figure 27) (Department of
Agriculture, Forestry and Fisheries 2010).
Climate change predications for the District indicate reduced rainfall and increased average
temperatures in the future (SRK Consulting 2011). As water supply is already insufficient in the
District, climate change and associated impacts are predicted to exacerbating water scarcity in the
future (Cape Winelands District Municipality 2017).
Water scarcity and predicted increases in average temperatures will negatively affect the agricultural
sector leading to reduced agricultural production and consequently job and economic losses (Cape
Winelands District Municipality 2015). These job losses may increase pressure on social services and
infrastructure in the District (Cape Winelands District Municipality 2015). Additionally, the reduced
agricultural production coupled with environmental degradation will have direct impacts on benefits
derived from the tourism industry leading to further economic losses (Cape Winelands District
Municipality 2015).
Figure 27: Veld fire risk for District Municipality Area (Department of Agriculture, Forestry and Fisheries 2010).

50
4.6 Cape Winelands DM Water Sector Summary The Cape Winelands District Municipality falls under the Breede-Gouritz/Berg Hydrological Zone
(Figure 28) (Department of Environmental Affairs 2013d). As outlined above (in Figure 1), in the
warmer wetter scenario, the Breede-Gouritz/Berg Hydrological Zone is predicted to experience an
increase in rainfall in winter and spring, and a decrease in autumn (Department of Environmental
Affairs 2013d). While in the hotter and drier scenario, the region will experience a decrease in
rainfall in all seasons and a strong decrease in rainfall in the west of the Hydrological Zone
(Department of Environmental Affairs 2013d).
Figure 28: Hydrological Zone for the District Municipal Area (Department of Environmental Affairs 2013d)
Some hydrological zones cover multiple water management areas. The majority of the Cape
Winelands District Municipality falls into the Berg-Olifants Water Management Area (Figure 29),
while much of the southeast of the District Municipality Area falls into the Breede-Gouritz Water
Management Area (Department of Environmental Affairs 2013d). Within the Cape Winelands District
Municipal Area there are 18 main water resources (such as dams and lakes), some of which are the:
Berg River, Brandvlei, Voelvlei, Keerom and Bushmanskrantz Dams (Department of Water and
Sanitation 2016b). These resources are mostly found in the south of the District Municipal Area
(Figure 30).
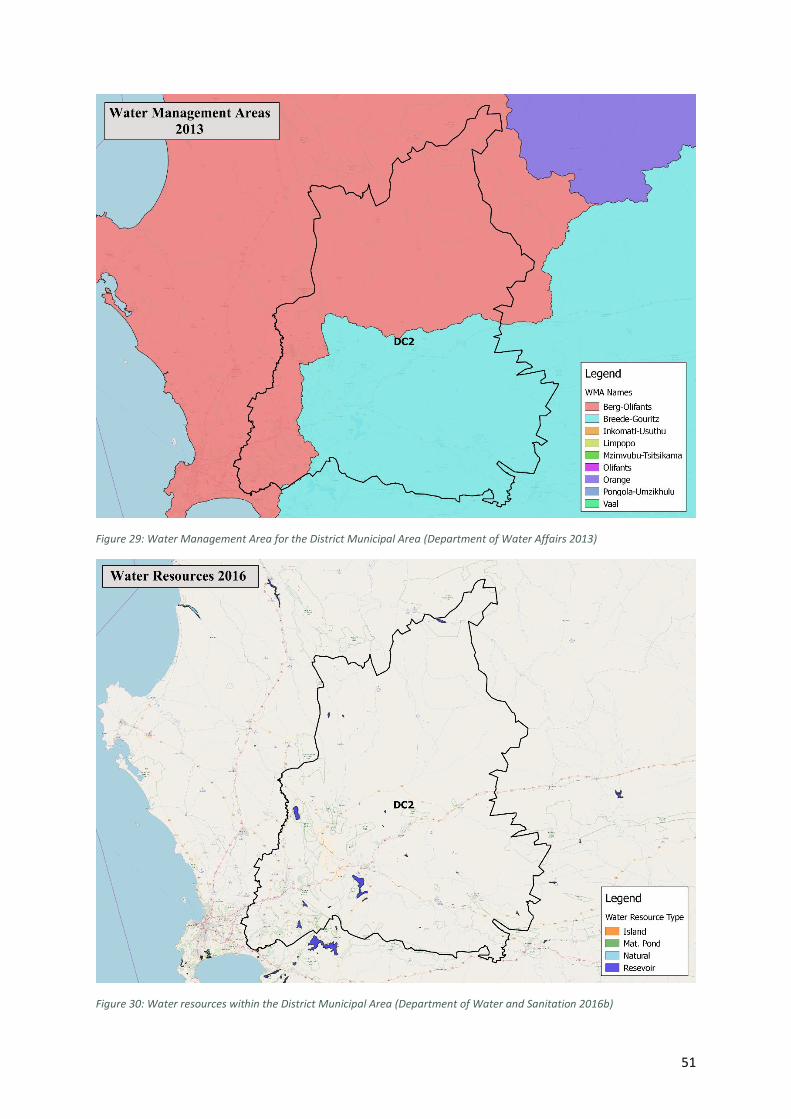
51
Figure 29: Water Management Area for the District Municipal Area (Department of Water Affairs 2013)
Figure 30: Water resources within the District Municipal Area (Department of Water and Sanitation 2016b)

52
The river quality within the Cape Winelands District Municipal Area is varied, which means that only
some rivers are able to contribute towards river ecosystem biodiversity targets (SANBI 2011). The
health of a river system is graded into one of several categories (SANBI 2011). These categories are
listed in Text Box 1.
Text Box 1: Freshwater Ecosystem Priority Areas (FEPAs) classification for river ecosystem conditions
River conditions in South Africa have been classified according to the Freshwater Ecosystem Priority Areas (FEPAs) for river ecosystems (SANBI 2011). The different grades are provided below: A = Unmodified, Natural B = Largely Natural with Few Modifications Ab = A or B Above C = Moderately Modified D = Largely Modified E = Seriously Modified F = Critically/Extremely Modified Ef = E or F Above Z = Tributary Condition Modelled as Not Intact, According to Natural Land Cover Rivers that are unmodified or in their natural state are able to contribute towards river ecosystems biodiversity targets (SANBI 2011). In contrast, rivers that are categorised as ‘largely modified’ or worse are unable to contribute towards river ecosystems as they are not in a good state.
Some of the main rivers in the Cape Winelands District Municipality Area (Figure 31) such as the Hex
and Touws Rivers as well as most of the Berg Rivers are classified as ‘largely modified’ (SANBI 2011).
Additionally, the Breede and Olifants Rivers are classified as ‘moderately modified’, while the Doring
and Riet Rivers and the upper section of the Berg River are classified as ‘largely natural with few
modifications’ (SANBI 2011). Furthermore, most tributaries are classified as ‘largely natural with few
modifications’, while some are classified as ‘tributary conditions modelled as not intact, according to
natural land cover’ (SANBI 2011).
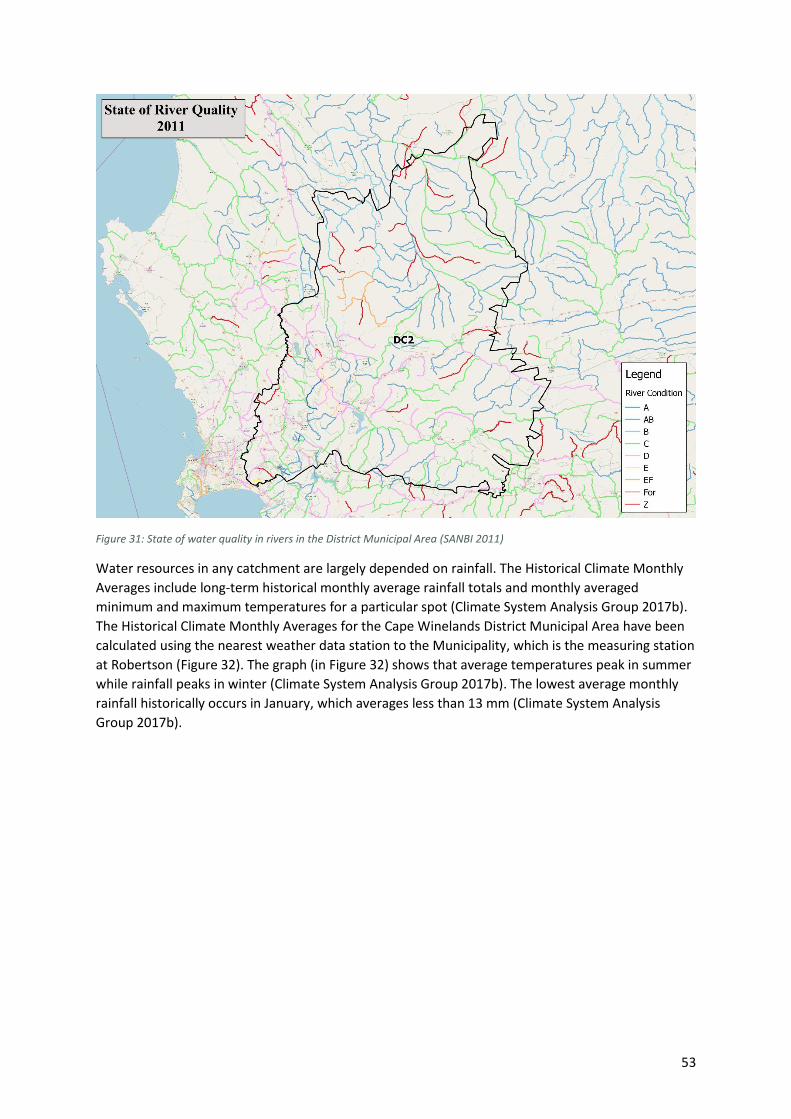
53
Figure 31: State of water quality in rivers in the District Municipal Area (SANBI 2011)
Water resources in any catchment are largely depended on rainfall. The Historical Climate Monthly
Averages include long-term historical monthly average rainfall totals and monthly averaged
minimum and maximum temperatures for a particular spot (Climate System Analysis Group 2017b).
The Historical Climate Monthly Averages for the Cape Winelands District Municipal Area have been
calculated using the nearest weather data station to the Municipality, which is the measuring station
at Robertson (Figure 32). The graph (in Figure 32) shows that average temperatures peak in summer
while rainfall peaks in winter (Climate System Analysis Group 2017b). The lowest average monthly
rainfall historically occurs in January, which averages less than 13 mm (Climate System Analysis
Group 2017b).

54
Figure 32: Historical Climate Monthly Averages for Robertson (Climate System Analysis Group 2017b)
Linked to the rainfall and rivers in the Cape Winelands District Municipal Area are the water and
sanitation services. Specifically, a total of 21.55 % of households in the Cape Winelands District
Municipal Area do not receive their water from piped water schemes, which is slightly lower than
the national average of 21.82 % (Statistics South Africa 2011). Furthermore, the percentage of the
population with flush toilets in the Cape Winelands District Municipal Area is 91.28 % while the
national average is 56.51 % (Statistics South Africa 2011). This indicates a very good spread of
sanitation access within the Cape Winelands District Municipal Area.
Although the Cape Winelands District Municipality has high scores for the provision of water and
sanitation services to households in the District Municipal Area, there are still issue regarding water
quantity and quality in the District Municipal Area. Water resources are very limited in the Cape
Winelands District Municipal Area and overconsumption of available water resources has caused
sections of some rivers to run dry in mid-summer (Cape Winelands District Municipality 2017). The
erosion of river banks (and the resulting siltation of water supply infrastructure) and the invasion of
alien plants have also reduced water quantity and quality in the District Municipal Area (Western
Cape Department of Environmental Affairs and Development Planning 2013; Cape Winelands District
Municipality 2015). Furthermore, pollution from land-fill sites, informal settlements, farming
activities and inadequate wastewater treatments works have negatively affected water quality in the
Cape Winelands District Municipal Area (Cape Winelands District Municipality 2017).
Directly linked to water and sanitation services in the Cape Winelands District Municipal Area are the
Blue and Green Drop scores. Blue Drop scores rate the quality of drinking water, while Green drop
scores rate the quality of wastewater. The Blue Drop score can be understood using the following
scale: 90 – 100 % = ‘Excellent situation’; 75 - <90 % = ‘Good status’; 50 - <75 % = ‘Average
performance’; 33 - <50 % = ‘Very poor performance’; and, 0 - <33 % = ‘Critical status’ (Department of
Water Affairs 2011). There is no 2014 Blue Drop score for the Cape Winelands District Municipality,
rather there is a Blue Drop score for each local municipality within the Cape Winelands District
Municipality (Department of Water and Sanitation 2014).
The 2014 Blue Drop scores of each local municipality within the Cape Winelands District Municipality
are as follows: The Breede Valley Local Municipality scored 89.16 %; the Drakenstein Local
Municipality scored 72.14 %; the Langeberg Local Municipality scored 72.30 %; Stellenbosch Local

55
Municipality scored 80.12 %; and the Witzenberg Local Municipality scored 95.77 % (Department of
Water and Sanitation 2014).
The Green Drop score rates the quality of wastewater management in municipalities. The Green
Drop score can be understood using the following scale: 90 – 100 % = ‘Excellent situation’; 80 - <90 %
= ‘Good status’; 50 - <80 % = ‘Average performance’; 30 - <50 % = ‘Very poor performance’; and, 0 -
<30 % = ‘Critical state’ (Department of Water and Sanitation 2016a). There is no 2013 Green Drop
score for the Cape Winelands District Municipality, rather there is a Green Drop scores for each local
municipality within the Cape Winelands District Municipality (Department of Water and Sanitation
2013).
The 2013 Green Drop scores of each local municipality within the Cape Winelands District
Municipality are as follows: The Breede Valley Local Municipality scored 90.21 %; the Drakenstein
Local Municipality scored 77.79 %; the Langeberg Local Municipality scored 51.58 %; Stellenbosch
Local Municipality scored 40.16 %; and the Witzenberg Local Municipality scored 97.96 %
(Department of Water and Sanitation 2013). This mix of Green Drop scores indicate that the majority
of wastewater services in the Cape Winelands District Municipality are being managed according to
the expectations of the Department of Water and Sanitation as assessed by the Green Drop score.
In addition to the Green Drop scores, 82.66 % of households have their refuse removed by local
authority/private company in the Cape Winelands District Municipal Area (Statistics South Africa
2011). This is much better than the national average for household refuse removal, which is 59.40 %
(Statistics South Africa 2011). Nevertheless, uncollected waste often still ends up in water and
sanitation infrastructure, blocking storm water drains and polluting rivers. It is predicted that climate
change will affect these water and sanitation challenges.
Climate change is predicted to have an impact on rainfall patterns in South Africa. Future rainfall
projections for the Cape Winelands District Municipality (using the measuring station at Robertson)
for the period 2020 to 2040 (Figure 33) are made using the Representative Concentration Pathways
(RCP) 4.5 greenhouse gas concentration trajectories (Climate System Analysis Group 2017a).
The bar charts (Figure 33) show the potential change in rainfall, with the blue bars indicating a
potential increase in average rainfall and the red bars indicate a potential decrease in average
rainfall (Climate System Analysis Group 2017a). The grey lines represent the various models used for
this projection. It is therefore projected across most of the models that Cape Winelands District
Municipality could experience an increase in rainfall in the months of January, February, March,
April, August, September, October and December, and a decrease in rainfall during May, June, July
and November (Climate System Analysis Group 2017a).

56
Figure 33: Rainfall Projections for Robertson (Climate System Analysis Group 2017a)
Climate change is predicted to increase the pressure on the Cape Winelands District Municipal
Area’s already insufficient water supply (Cape Winelands District Municipality 2017, 2015). It is also
predicted to increase the variability of rainfall as well as increase the frequency and severity of
droughts, wildfires and floods in the Cape Winelands District Municipal Area (Cape Winelands
District Municipality 2017, 2015). Increased average temperatures, linked to climate change, are also
predicted to lead to an increase of bacteria concentrations such as E. Coli within the Cape Winelands
District Municipal Area (Cape Winelands District Municipality 2015). These increases could put
additional strain on the human health and water sectors within the Cape Winelands District
Municipal Area (Cape Winelands District Municipality 2015).

57
5 Vulnerability Assessment Results The following section provides a summary of the Vulnerability Assessment conducted for Cape Winelands District Municipality.
5.1 Agriculture Table 5: Agriculture Vulnerability Indicator Table Cape Winelands District Municipality
No Indicator
Title Indicator
Description Exposure Question
Exposure Answer
Exposure Comment
Sensitivity Question
Sensitivity Answer
Sensitivity Comment
Adaptive Capacity Answer
Adaptive Capacity Comment
1
Change in grain (maize, wheat & barley) production
Areas towards the west of RSA are likely to become less suitable for grain production.
Do you grow or have potential to grow grains in your area?
Yes Wheat is grown on a small scale.
How important is grain to the local economy and livelihoods? High Priority Crop = High; Medium Priority Crop = Medium; Low/No Priority Crop = Low
Low
Wheat is a low priority crop in the District. SmartAgri Document for the Province notes that conservation agriculture has increased production and profit from wheat farming.
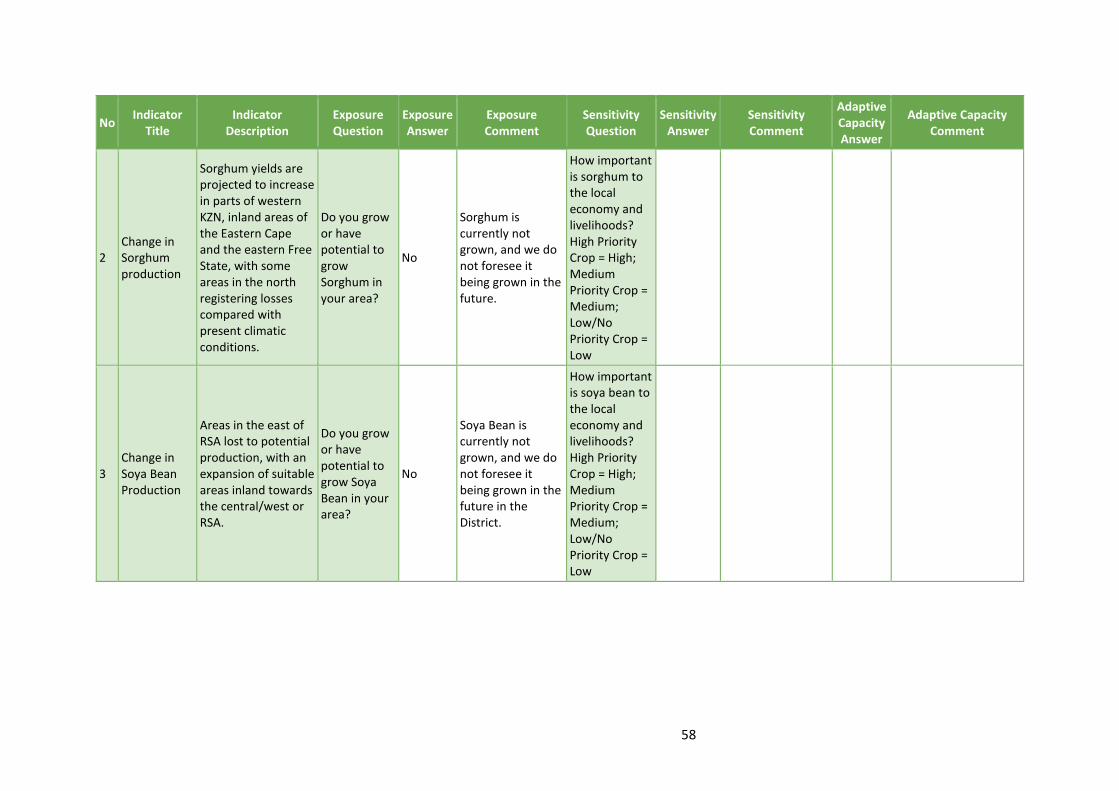
58
No Indicator
Title Indicator
Description Exposure Question
Exposure Answer
Exposure Comment
Sensitivity Question
Sensitivity Answer
Sensitivity Comment
Adaptive Capacity Answer
Adaptive Capacity Comment
2 Change in Sorghum production
Sorghum yields are projected to increase in parts of western KZN, inland areas of the Eastern Cape and the eastern Free State, with some areas in the north registering losses compared with present climatic conditions.
Do you grow or have potential to grow Sorghum in your area?
No
Sorghum is currently not grown, and we do not foresee it being grown in the future.
How important is sorghum to the local economy and livelihoods? High Priority Crop = High; Medium Priority Crop = Medium; Low/No Priority Crop = Low
3 Change in Soya Bean Production
Areas in the east of RSA lost to potential production, with an expansion of suitable areas inland towards the central/west or RSA.
Do you grow or have potential to grow Soya Bean in your area?
No
Soya Bean is currently not grown, and we do not foresee it being grown in the future in the District.
How important is soya bean to the local economy and livelihoods? High Priority Crop = High; Medium Priority Crop = Medium; Low/No Priority Crop = Low

59
No Indicator
Title Indicator
Description Exposure Question
Exposure Answer
Exposure Comment
Sensitivity Question
Sensitivity Answer
Sensitivity Comment
Adaptive Capacity Answer
Adaptive Capacity Comment
4 Change in Sugarcane Production
Increase in <10% in many parts of the present cane growing areas, but by up to 30% in new growth areas further inland.
Do you grow or have potential to grow Sugarcane in your area?
No
Sugarcane is currently not grown, and we do not foresee it being grown in the future in the District.
How important is sugarcane to the local economy and livelihoods? High Priority Crop = High; Medium Priority Crop = Medium; Low/No Priority Crop = Low
5
Change in viticulture (grapes) production
Areas suitable for viticulture could be substantially reduced or shift to higher altitudes and currently cooler, more southerly locations.
Do you grow or have potential to grow grapes in your area?
Yes
Throughout the District, except in Langeberg and Witzenberg based on temperature, rainfall and chill units.
How important is viticulture (grapes) to the local economy and livelihoods? High Priority Crop = High; Medium Priority Crop = Medium; Low /No Priority Crop = Low
High
Viticulture is a high priority crop in the District with 56 % of all South African wine grapes, and 68 % of South Africa’s wine, grown in the District. The District is the most important viticulture and winemaking area in South Africa
Low
Risks highlighted in the W-Cape CC Response Framework, but implementation not clear. SmartAgri, Climate Change Response Strategy. Research has been done on the impacts of climate change on the wine sector in South Africa.

60
No Indicator
Title Indicator
Description Exposure Question
Exposure Answer
Exposure Comment
Sensitivity Question
Sensitivity Answer
Sensitivity Comment
Adaptive Capacity Answer
Adaptive Capacity Comment
6 Change in fruit production
Projected reduction of the area suitable for fruit production (e.g. 28% reduction in apple and pears) by as early as 2020.
Do you grow or have potential to grow fruit in your area?
Yes
Throughout the entire District, except in Langeberg and Witzenberg based on temperature, rainfall and chill units. Includes apples and citrus.
How important is fruit to the local economy and livelihoods? High Priority Crop = High; Medium Priority Crop = Medium; Low/No Priority Crop = Low
High
Already strained by restricted water supply. Impacted more by extreme events than by changes in averages.
Low
Risks highlighted in the W-Cape CC Response Framework, but implementation not clear. SmartAgri, Climate Change Response Strategy.
7
Change in other crop production areas (e.g. vegetables, nuts, etc.)
Crop production may vary depending on a warmer wetter or warmer drier climate.
Do you grow or have potential to grow other crops in your area?
Yes
Vegetables are grown in Witzenberg and Langeberg. Nuts can be found in Langeberg (there are even some farms in Montagu).
How important are other crops to the local economy and livelihoods? High Priority Crop = High; Medium Priority Crop = Medium; Low/No Priority Crop = Low
Medium
Other crop production is of medium contribution to the agricultural sector within the District.
Medium SmartAgri, Climate Change Response Plan
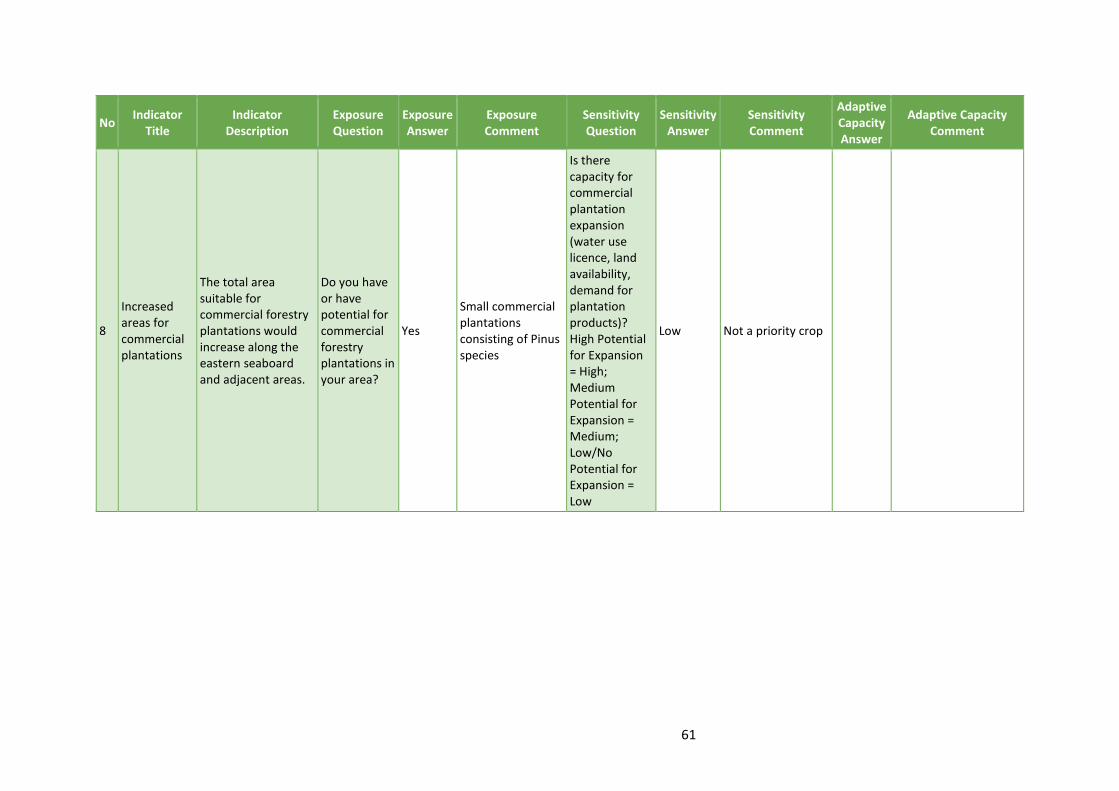
61
No Indicator
Title Indicator
Description Exposure Question
Exposure Answer
Exposure Comment
Sensitivity Question
Sensitivity Answer
Sensitivity Comment
Adaptive Capacity Answer
Adaptive Capacity Comment
8
Increased areas for commercial plantations
The total area suitable for commercial forestry plantations would increase along the eastern seaboard and adjacent areas.
Do you have or have potential for commercial forestry plantations in your area?
Yes
Small commercial plantations consisting of Pinus species
Is there capacity for commercial plantation expansion (water use licence, land availability, demand for plantation products)? High Potential for Expansion = High; Medium Potential for Expansion = Medium; Low/No Potential for Expansion = Low
Low Not a priority crop

62
No Indicator
Title Indicator
Description Exposure Question
Exposure Answer
Exposure Comment
Sensitivity Question
Sensitivity Answer
Sensitivity Comment
Adaptive Capacity Answer
Adaptive Capacity Comment
9
Increased exposure to pests such as eldana, chilo and codling moth
Exposure to eldana would increase in areas suitable for sugarcane by ~10% to > 30%. The area subject to damage by chilo would increase substantially (sugarcane). The area subject to damage by codling moth would increase substantially (apples, pears, walnuts and quince).
Are you or will you be exposed to agricultural pests in your area?
Yes
This is relevant throughout the entire District. This is due to change in climate variables: higher temperatures and less rainfall.
How important are crops that are vulnerable to pests to the local economy and livelihoods? High Priority Crop = High; Medium Priority Crop = Medium; Low/No Priority Crop = Low
High
The production of fruit is increasingly vulnerable to damage due to projected expansion of areas affected by agricultural pests.
Medium
The SmartAgri - Regional and Commodity Briefs highlights the need for innovative responses in order to increase sector resilience to pests and diseases, leading to greater cohesion and giving rise to new industries. SmartAgri.
10 Increased risks to livestock
Projected decreases in rainfall and hence herbage yields would result in negative health impacts for livestock.
Do you or will you have livestock in your area?
Yes
Intensive livestock production- chickens, eggs, pigs.
How important is livestock farming to the local economy and livelihoods? High Priority = High; Medium Priority = Medium; Low/No Priority = Low
High
Poultry farming is one of the most important agricultural activities in the District.
Low
Some adaptive responses highlighted in SmartAgri Plan. Climate Change Response Strategy.

63
No Indicator
Title Indicator
Description Exposure Question
Exposure Answer
Exposure Comment
Sensitivity Question
Sensitivity Answer
Sensitivity Comment
Adaptive Capacity Answer
Adaptive Capacity Comment
11 Reduced food security
Reduced food security, particularly of subsistence farmers, and resultant increase in malnutrition.
Do you or will you have food insecurity in your area?
No
Percentage households involved in agricultural activities More than 20% = High; Between 20% & 10% = Medium; Less than 10% = Low
53 Reduced food and feed security
Reduced food security, particularly of subsistence farmers, and resultant increase in malnutrition.
Do you or will you have food insecurity and feed insecurity in your area?
Yes
Subsistence, emerging and smallholder farming systems are expected to be at high risk due to their poorer access to irrigation water and technologies, financial support and other resources.
Percentage households involved in agricultural activities More than 20% = High; Between 20% & 10% = Medium; Less than 10% = Low
Low
Only 7.6% of households are involved in agricultural activities.
High
The District's 2016/2017 IDP acknowledges the need for a more integrated system-wide response with all role players as this would help the agricultural sector to scale up effective strategies, innovate, and move towards a longer-term transformation.

64
5.2 Biodiversity and Environment Table 6: Biodiversity Vulnerability Indicator Table Cape Winelands District Municipality
No Indicator
Title Indicator
Description Exposure Question
Exposure
Answer
Exposure Comment
Sensitivity Question
Sensitivity
Answer
Sensitivity Comment
Adaptive Capacity Answer
Adaptive Capacity Comment
12 Loss of High Priority Biomes
High Priority Biomes (including Grasslands, Nama-Karoo, Indian Ocean Coastal Belt, Fynbos, Forest) to be replaced by other biomes such as savanna and desert.
Do you currently have high priority biomes in your area?
Yes
Throughout the entire District. This is due to higher temperatures, less rainfall, fire frequencies and invasive alien species.
How much of this High Priority Biome will be lost due to climate change? A significant amount= High; A moderate amount= Medium; None/a low amount = Low
High
It is forecast that the Fynbos Biome will be substantially reduced by the Succulent Karoo Biome.
Low
The 2016 Fynbos Forum: Ecosystem Guidelines document covers the lowland, midland and mountain Fynbos ecosystems in-depth, discussing the current state of the Fynbos biome, how it is being damaged and what is needed to reduce and reverse future degradation and change. Langeberg: The National Fire Protection Agency assisted the municipality with preparing plans and maps on where to implement fire breaks. Langeberg now needs support and financial resources to implement. The Succulent Karoo is currently "taking a punch" due to the increased incidents of veld fires and lower rainfall. There is not enough research being done in the District on the specific impacts of climate change with regards to the loss of high priority biomes. The District needs to understand what the impacts of this loss will be on each sector, e.g. tourism, agriculture, economy etc. Provincial SoER, SDFs, EMF's.
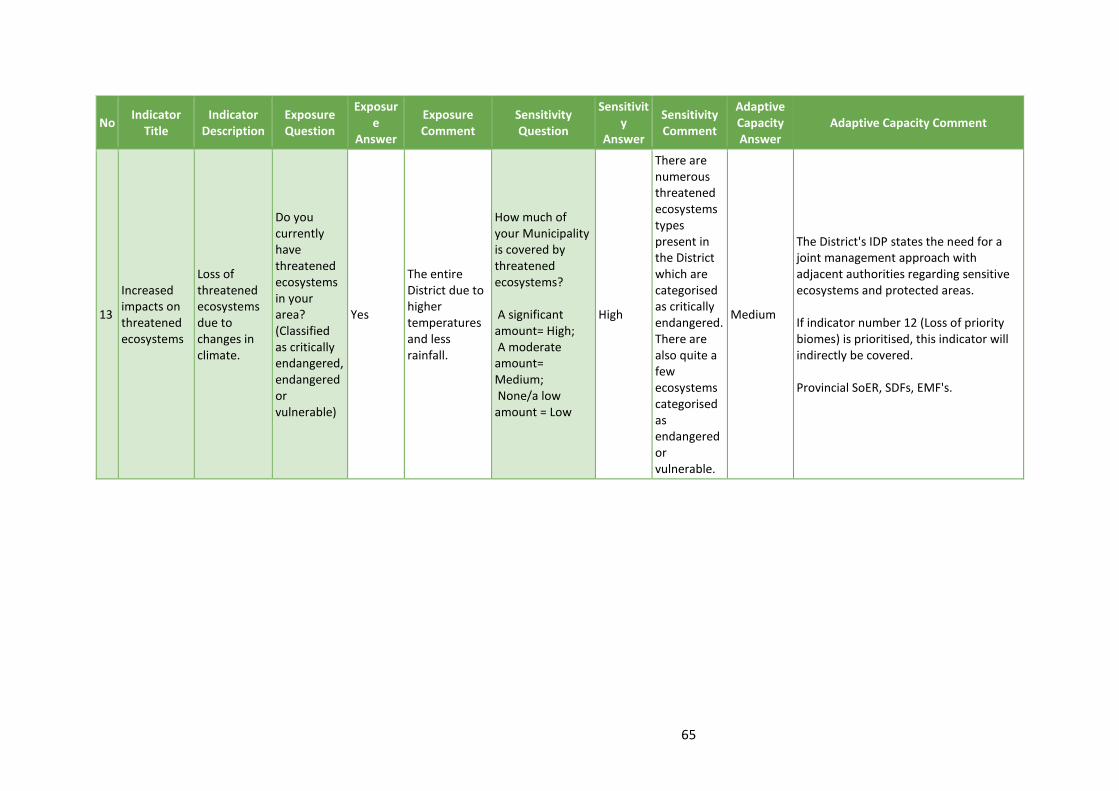
65
No Indicator
Title Indicator
Description Exposure Question
Exposure
Answer
Exposure Comment
Sensitivity Question
Sensitivity
Answer
Sensitivity Comment
Adaptive Capacity Answer
Adaptive Capacity Comment
13
Increased impacts on threatened ecosystems
Loss of threatened ecosystems due to changes in climate.
Do you currently have threatened ecosystems in your area? (Classified as critically endangered, endangered or vulnerable)
Yes
The entire District due to higher temperatures and less rainfall.
How much of your Municipality is covered by threatened ecosystems? A significant amount= High; A moderate amount= Medium; None/a low amount = Low
High
There are numerous threatened ecosystems types present in the District which are categorised as critically endangered. There are also quite a few ecosystems categorised as endangered or vulnerable.
Medium
The District's IDP states the need for a joint management approach with adjacent authorities regarding sensitive ecosystems and protected areas. If indicator number 12 (Loss of priority biomes) is prioritised, this indicator will indirectly be covered. Provincial SoER, SDFs, EMF's.
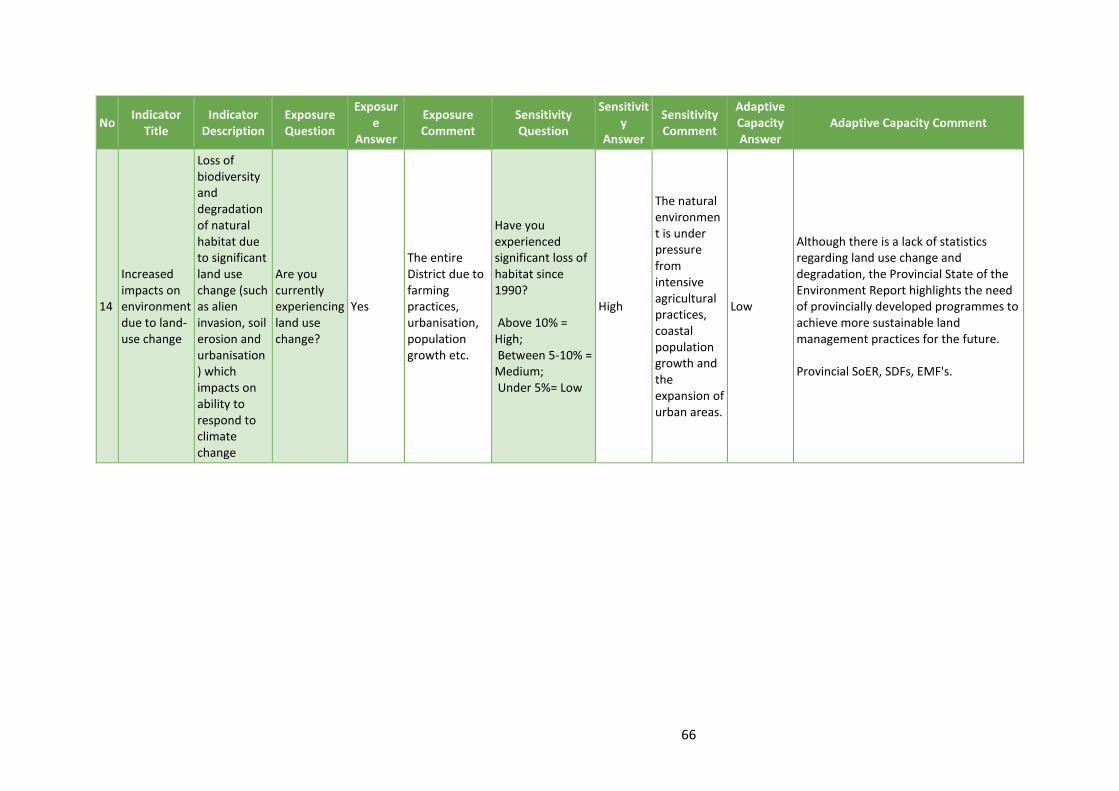
66
No Indicator
Title Indicator
Description Exposure Question
Exposure
Answer
Exposure Comment
Sensitivity Question
Sensitivity
Answer
Sensitivity Comment
Adaptive Capacity Answer
Adaptive Capacity Comment
14
Increased impacts on environment due to land-use change
Loss of biodiversity and degradation of natural habitat due to significant land use change (such as alien invasion, soil erosion and urbanisation) which impacts on ability to respond to climate change
Are you currently experiencing land use change?
Yes
The entire District due to farming practices, urbanisation, population growth etc.
Have you experienced significant loss of habitat since 1990? Above 10% = High; Between 5-10% = Medium; Under 5%= Low
High
The natural environment is under pressure from intensive agricultural practices, coastal population growth and the expansion of urban areas.
Low
Although there is a lack of statistics regarding land use change and degradation, the Provincial State of the Environment Report highlights the need of provincially developed programmes to achieve more sustainable land management practices for the future. Provincial SoER, SDFs, EMF's.

67
No Indicator
Title Indicator
Description Exposure Question
Exposure
Answer
Exposure Comment
Sensitivity Question
Sensitivity
Answer
Sensitivity Comment
Adaptive Capacity Answer
Adaptive Capacity Comment
15
Loss of Priority Wetlands and River ecosystems
Changes in rainfall patterns and temperature are likely to impact on wetlands and the ecosystem services they provide.
Do you have priority wetlands and river ecosystems in your area?
Yes
The entire District, due to development and changes in climate variables (rainfall/temperature). Increase in alien invasive species and animals, plants and animals also play a role.
How important are wetlands and river ecosystems in providing ecosystem services in your Municipality? A significant amount= High; A moderate amount= Medium; None/a low amount = Low
High
Wetlands provide important ecosystem services and have been degraded or irreversibly lost as a result of human activities. A significant number of wetlands in the District have been heavily to critically modified.
Medium
The Working for Wetlands Programme focuses on the rehabilitation of wetlands and has increasingly shifted its emphasis to the protection of targeted wetlands and promoting sustainable use of others. Working for Wetlands is however not active throughout all local municipalities across the District. Funding for these types of programmes is not continuous. The focus of these types of programmes is that most of the emphasis is placed on job creation and sometimes loses focus of the aim of the project. Provincial SoER, SDFs, EMF's.

68
No Indicator
Title Indicator
Description Exposure Question
Exposure
Answer
Exposure Comment
Sensitivity Question
Sensitivity
Answer
Sensitivity Comment
Adaptive Capacity Answer
Adaptive Capacity Comment
55 Loss of Soil Fertility
Changes in rainfall and temperature will impact on the biology, chemistry and physical properties of soil.
Are you expecting drastic changes in rainfall and temperature that may impact on soil fertility?
Yes
Soil conditions are a contributing factor to plant growth and therefore food production.
How important is soil fertility in supporting ecosystems and livelihoods in your Municipality? A significant amount= High; A moderate amount= Medium; None/a low amount = Low
High
Agriculture and infrastructural development have led to the pollution and erosion of soil (particularly on the lower mountain slopes).
Medium
The Department of Agriculture's LandCare Program is an integrated community-based approach to the sustainable management and use of agricultural natural resources, including detailed sections in the guidelines which cover soil and land management.
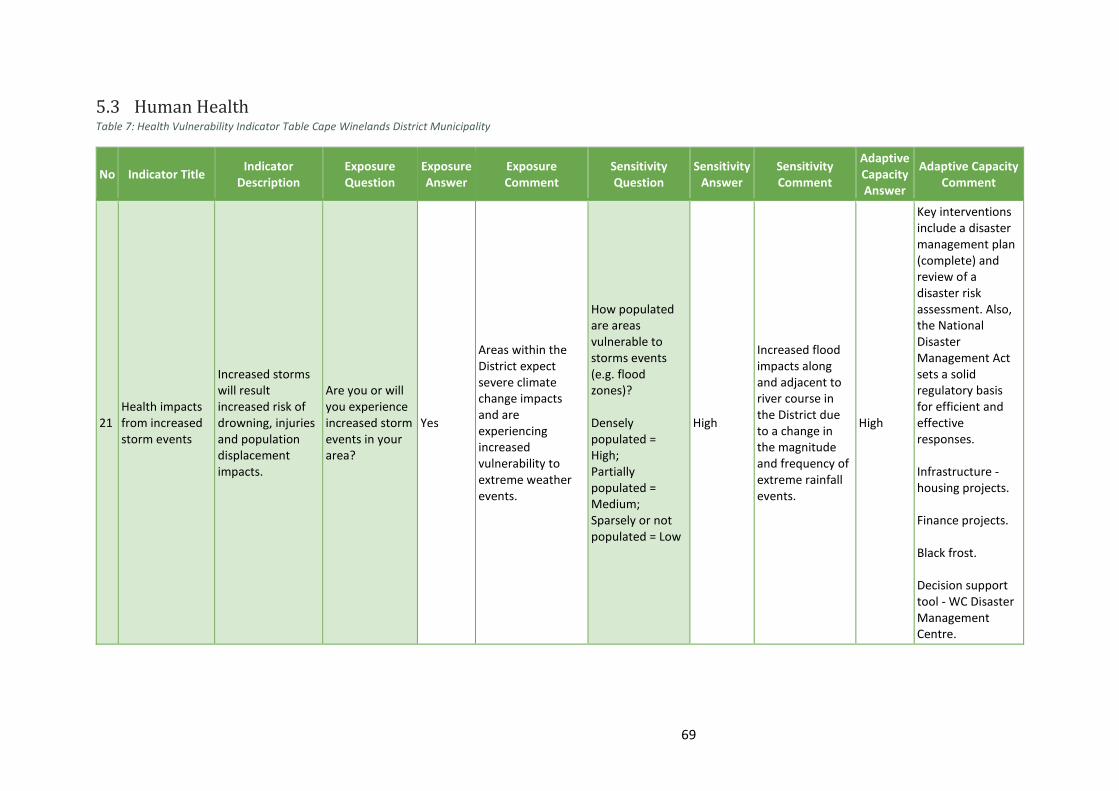
69
5.3 Human Health Table 7: Health Vulnerability Indicator Table Cape Winelands District Municipality
No Indicator Title Indicator
Description Exposure Question
Exposure Answer
Exposure Comment
Sensitivity Question
Sensitivity Answer
Sensitivity Comment
Adaptive Capacity Answer
Adaptive Capacity Comment
21 Health impacts from increased storm events
Increased storms will result increased risk of drowning, injuries and population displacement impacts.
Are you or will you experience increased storm events in your area?
Yes
Areas within the District expect severe climate change impacts and are experiencing increased vulnerability to extreme weather events.
How populated are areas vulnerable to storms events (e.g. flood zones)? Densely populated = High; Partially populated = Medium; Sparsely or not populated = Low
High
Increased flood impacts along and adjacent to river course in the District due to a change in the magnitude and frequency of extreme rainfall events.
High
Key interventions include a disaster management plan (complete) and review of a disaster risk assessment. Also, the National Disaster Management Act sets a solid regulatory basis for efficient and effective responses. Infrastructure - housing projects. Finance projects. Black frost. Decision support tool - WC Disaster Management Centre.

70
No Indicator Title Indicator
Description Exposure Question
Exposure Answer
Exposure Comment
Sensitivity Question
Sensitivity Answer
Sensitivity Comment
Adaptive Capacity Answer
Adaptive Capacity Comment
22 Increased heat stress
Increases in average temperatures and extreme events (such as heat waves) are projected to induce heat stress, increase morbidity, and result in respiratory and cardiovascular diseases.
Are you or will you experience increased heat waves in your area?
Yes
The entire District, due to a change in higher temperatures.
Is there a high percentage of young and elderly in the area? More than 20% = high; Between 15% & 20% = Medium; Less than 15% = low
Medium
Almost 15% of the District's population is young or elderly.
Medium
The District has resources e.g. 40 ambulances, 3 responses and 5 rescue vehicles as well as 83 public health care facilities. Construction, agriculture, impact on burden of diseases. Climate info portal. SmartAgri- doc. WC Climate Change Response Strategy.

71
No Indicator Title Indicator
Description Exposure Question
Exposure Answer
Exposure Comment
Sensitivity Question
Sensitivity Answer
Sensitivity Comment
Adaptive Capacity Answer
Adaptive Capacity Comment
23
Increased vector borne diseases from spread of mosquitoes, ticks, sandflies, and blackflies
Vector borne diseases such as malaria is projected to spread within regions bordering current malaria areas, which are presently too cold for transmission.
Are vector borne diseases present or likely in your area?
No
The District does not border any current malaria regions.
Are you in or neighbouring an area with vector borne diseases (e.g. malaria)? Already in a vector borne disease area = High; Neighbouring a vector borne disease area = Medium; Not near a vector borne disease area = Low
24
Increased water borne and communicable diseases (e.g. typhoid fever, cholera and hepatitis)
Favourable conditions for the incubation and transmission of waterborne diseases may be created by increasing air and water temperatures.
Are waterborne and communicable diseases present or likely in your area?
No
Have you had an incidence of waterborne and communicable diseases (e.g. typhoid fever, cholera and hepatitis) in the past 3 years Yes = High: No = Low
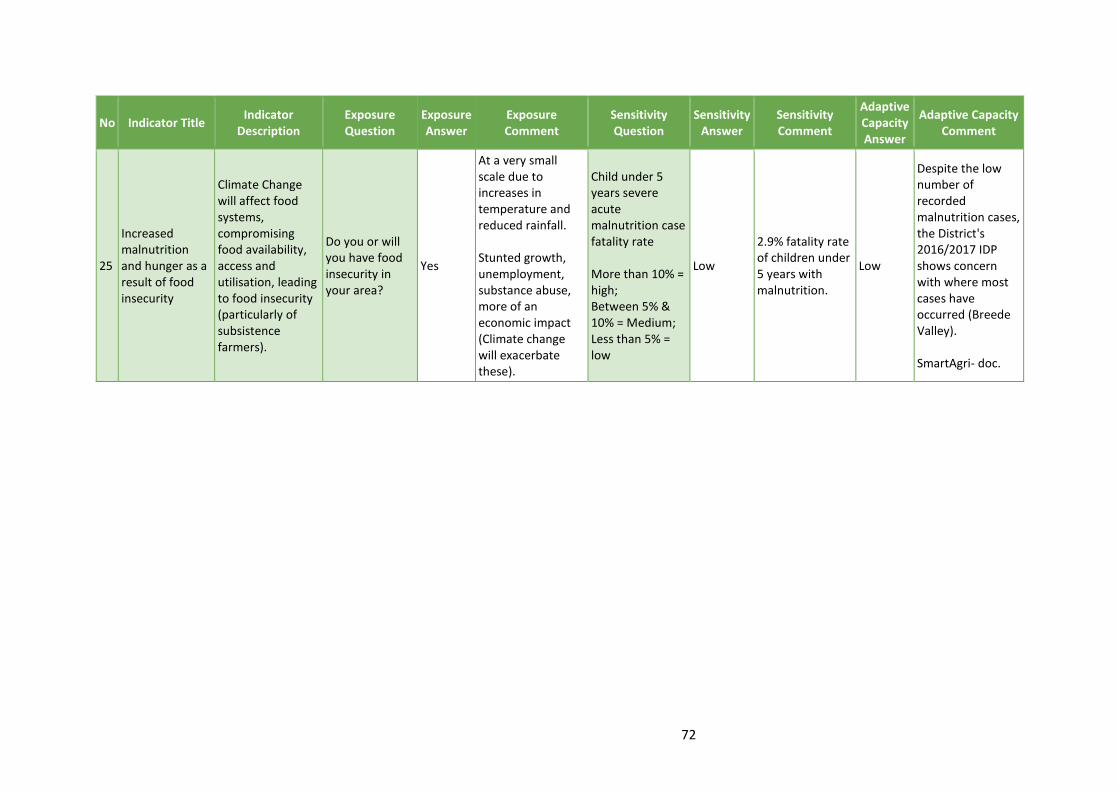
72
No Indicator Title Indicator
Description Exposure Question
Exposure Answer
Exposure Comment
Sensitivity Question
Sensitivity Answer
Sensitivity Comment
Adaptive Capacity Answer
Adaptive Capacity Comment
25
Increased malnutrition and hunger as a result of food insecurity
Climate Change will affect food systems, compromising food availability, access and utilisation, leading to food insecurity (particularly of subsistence farmers).
Do you or will you have food insecurity in your area?
Yes
At a very small scale due to increases in temperature and reduced rainfall. Stunted growth, unemployment, substance abuse, more of an economic impact (Climate change will exacerbate these).
Child under 5 years severe acute malnutrition case fatality rate More than 10% = high; Between 5% & 10% = Medium; Less than 5% = low
Low
2.9% fatality rate of children under 5 years with malnutrition.
Low
Despite the low number of recorded malnutrition cases, the District's 2016/2017 IDP shows concern with where most cases have occurred (Breede Valley). SmartAgri- doc.

73
No Indicator Title Indicator
Description Exposure Question
Exposure Answer
Exposure Comment
Sensitivity Question
Sensitivity Answer
Sensitivity Comment
Adaptive Capacity Answer
Adaptive Capacity Comment
26 Increased air pollution
Health impacts in resulting from exposure to air pollutants include eye irritation, acute respiratory infection, chronic respiratory diseases and TB, and sometimes death.
Do you or will you have air pollution in your area?
Yes
Increasing frequency of fires, air temperature inversions, drier periods, increases in particulate matter, effects of spraying regimes. Urbanisation: Indoor air pollution, particularly in informal dwellings as a result of cooking indoor.
Would you consider your area a high priority in terms of air pollution (e.g. SAAQIS Priority Areas)? Yes = High; Somewhat = Medium; No = Low
Low CWDM is not a high priority area.
Medium
Air pollution priority areas (already identified and potential sources) or 'hotspots' have been identified in the District, and include agricultural areas, landfills, industries and domestic fuel burning areas. 13 industries in CWDM, all of them have AEL's, emitters are controlled. WC Health Impact Report on air quality. AQMP, SoER, Provincial Health Air Quality Report.

74
No Indicator Title Indicator
Description Exposure Question
Exposure Answer
Exposure Comment
Sensitivity Question
Sensitivity Answer
Sensitivity Comment
Adaptive Capacity Answer
Adaptive Capacity Comment
27 Increased Occupational health problems
Temperature is a common climatic factor that affects occupational health (for example, agricultural labourer’s productivity) by causing heat stress and dehydration.
Do people work outside or are in conditions that cannot be cooled in your area?
Yes
Occupational health problems may occur throughout the District in various sectors and may affect farm workers, construction workers and municipal labourers.
Do a significant percentage of people work outside or are in conditions that cannot be cooled? Significant = High; Some = Medium; Low/No = Low
High
The agricultural sector alone is responsible for 23% of formal employment opportunities.
Medium
Occupational health services will be required in all workplaces with heat risks. Informal systems in place. Develop SOP's specific conditions (e.g. morning or night spraying). UCT Research in progress on impacts of climate change on health.
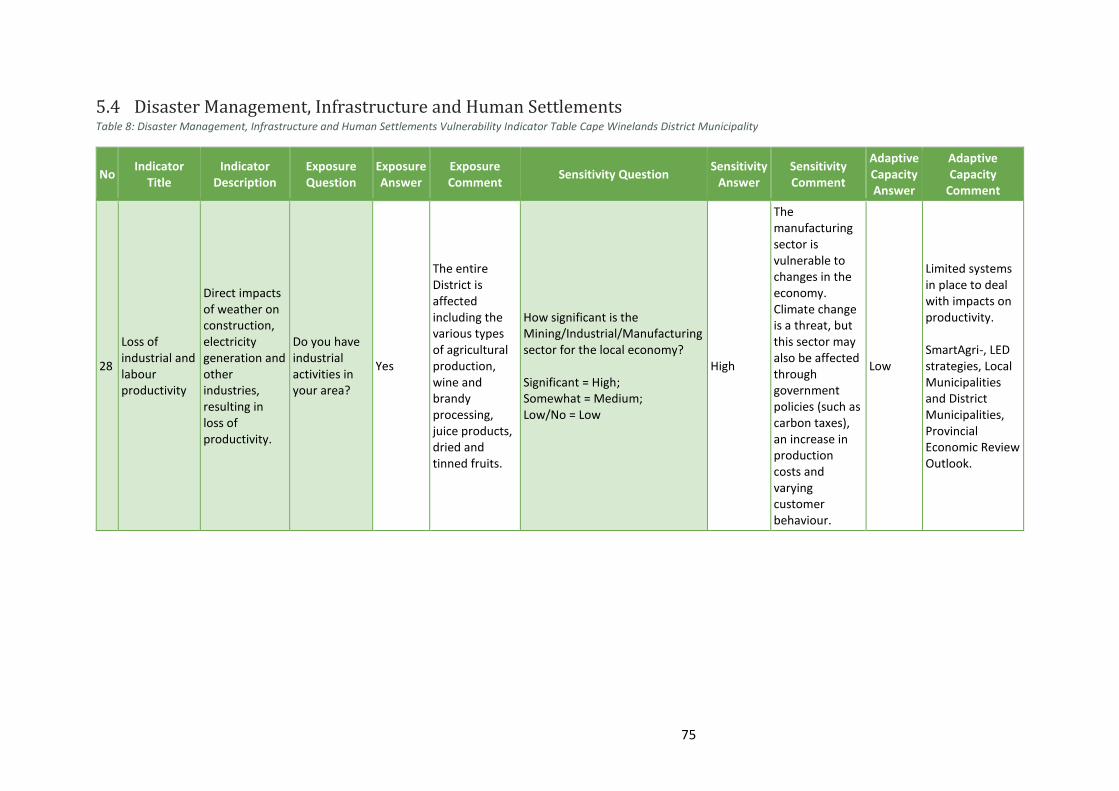
75
5.4 Disaster Management, Infrastructure and Human Settlements Table 8: Disaster Management, Infrastructure and Human Settlements Vulnerability Indicator Table Cape Winelands District Municipality
No Indicator
Title Indicator
Description Exposure Question
Exposure Answer
Exposure Comment
Sensitivity Question Sensitivity
Answer Sensitivity Comment
Adaptive Capacity Answer
Adaptive Capacity
Comment
28
Loss of industrial and labour productivity
Direct impacts of weather on construction, electricity generation and other industries, resulting in loss of productivity.
Do you have industrial activities in your area?
Yes
The entire District is affected including the various types of agricultural production, wine and brandy processing, juice products, dried and tinned fruits.
How significant is the Mining/Industrial/Manufacturing sector for the local economy? Significant = High; Somewhat = Medium; Low/No = Low
High
The manufacturing sector is vulnerable to changes in the economy. Climate change is a threat, but this sector may also be affected through government policies (such as carbon taxes), an increase in production costs and varying customer behaviour.
Low
Limited systems in place to deal with impacts on productivity. SmartAgri-, LED strategies, Local Municipalities and District Municipalities, Provincial Economic Review Outlook.

76
No Indicator
Title Indicator
Description Exposure Question
Exposure Answer
Exposure Comment
Sensitivity Question Sensitivity
Answer Sensitivity Comment
Adaptive Capacity Answer
Adaptive Capacity
Comment
29
Increased impacts on strategic infrastructure
Increased disruptions to key strategic infrastructure (e.g. WWTW, storm water, roads, rail, bridges) as a result of extreme weather events.
Do you have strategic infrastructure in your area?
Yes
The entire District, due to fires and severe weather events.
How important is this strategic infrastructure to the functioning of your municipality? Significant amount = High; Moderate amount = Medium; Minimal or no = Low
High
Floods and fires are disaster risk priorities with reference to the current and future condition of strategic infrastructure.
Low
Additional input from other municipalities and departments is required. Lack of capacity (Disaster Management). Budget constraints. Risk Assessment, Provincial Disaster Risk Profile. Uncertainty around implementation of policies and plans. District's Climate Change Response Adaptation Strategy.

77
No Indicator
Title Indicator
Description Exposure Question
Exposure Answer
Exposure Comment
Sensitivity Question Sensitivity
Answer Sensitivity Comment
Adaptive Capacity Answer
Adaptive Capacity
Comment
30
Increased impacts on traditional and informal dwellings
Increased risk of extreme weather events to already vulnerable traditional and informal dwellings, that are often unplanned, and without extensive service or infrastructure.
Do you have traditional and informal dwellings in your area?
Yes
Only informal dwellings (including backyard dwellings). Areas across all municipalities.
What percentage of households are in traditional and informal dwellings in your area? More than 15% = high; Between 15% & 10% = Medium; Less than 10% = low
High
15.96% of the households within the District are informal settlements. Informal settlements are often located in areas prone to flooding and other natural hazards.
Low
District's Climate Change Response Adaptation Strategy. Specific information is required from all local municipalities. Additional input from other municipalities and departments is required. Lack of capacity (Disaster Management). Budget constraints. SDFs, Provincial Informal Settlement Plan.

78
No Indicator
Title Indicator
Description Exposure Question
Exposure Answer
Exposure Comment
Sensitivity Question Sensitivity
Answer Sensitivity Comment
Adaptive Capacity Answer
Adaptive Capacity
Comment
31
Increased isolation of rural communities
Physical isolation of rural communities as a result poor rural roads and increased flooding and erosion.
Do you have isolated rural communities in your area?
Yes
Farming areas, Witzenberg, Langeberg, and remote towns.
Is your area predominantly Rural? Mostly Rural = High Equally Urban and Rural = Medium Mostly Urban = Low
High
Majority of the area is agricultural land. Remote towns.
Low
District's Climate Change Response Adaptation Strategy. Specific information is required from all local municipalities. Additional input from other municipalities and departments is required. Lack of capacity (Disaster Management). Budget constraints. SDFs, Provincial Informal Settlement Plan.
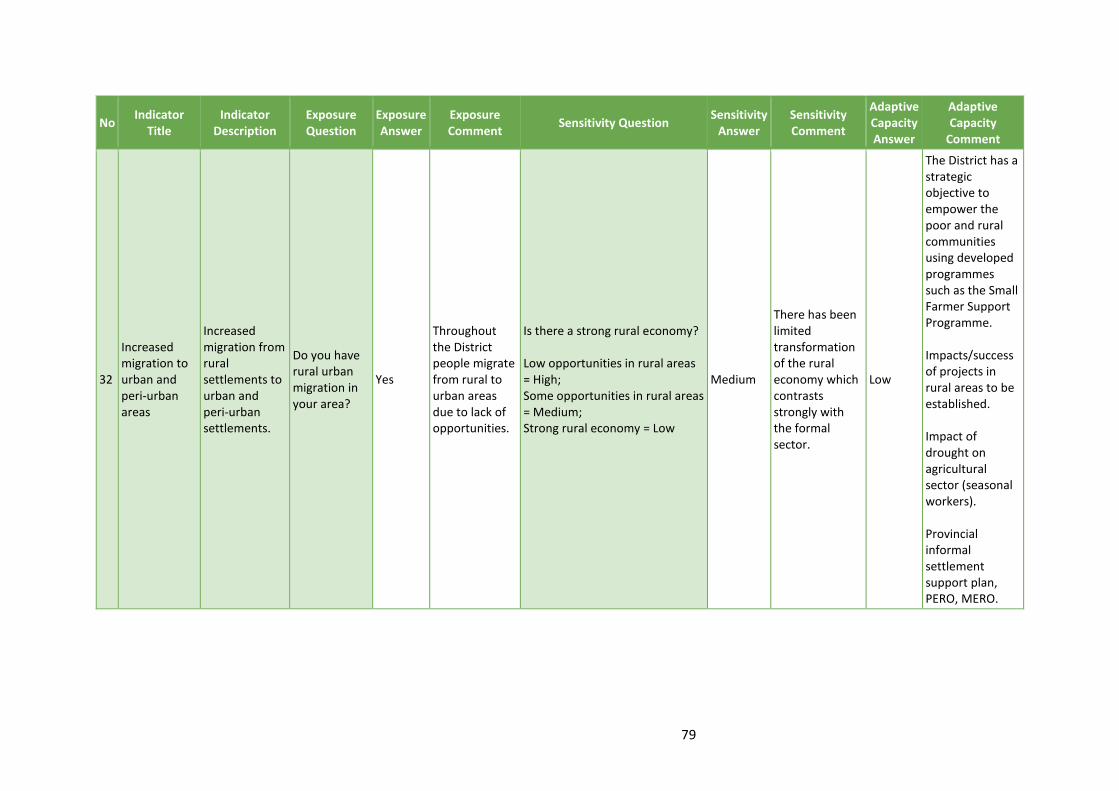
79
No Indicator
Title Indicator
Description Exposure Question
Exposure Answer
Exposure Comment
Sensitivity Question Sensitivity
Answer Sensitivity Comment
Adaptive Capacity Answer
Adaptive Capacity
Comment
32
Increased migration to urban and peri-urban areas
Increased migration from rural settlements to urban and peri-urban settlements.
Do you have rural urban migration in your area?
Yes
Throughout the District people migrate from rural to urban areas due to lack of opportunities.
Is there a strong rural economy? Low opportunities in rural areas = High; Some opportunities in rural areas = Medium; Strong rural economy = Low
Medium
There has been limited transformation of the rural economy which contrasts strongly with the formal sector.
Low
The District has a strategic objective to empower the poor and rural communities using developed programmes such as the Small Farmer Support Programme. Impacts/success of projects in rural areas to be established. Impact of drought on agricultural sector (seasonal workers). Provincial informal settlement support plan, PERO, MERO.

80
No Indicator
Title Indicator
Description Exposure Question
Exposure Answer
Exposure Comment
Sensitivity Question Sensitivity
Answer Sensitivity Comment
Adaptive Capacity Answer
Adaptive Capacity
Comment
33 Increased risk of wildfires
Increased risk of wildfires linked to higher ambient temperatures, dry spells and more frequent lightning storms.
Is this or will this take place in your area?
Yes
Veldfires occur between December and April when temperatures are at their highest with the 2017 season being particularly bad (more than 1500 fires reported costing the District approximately R17 million).
What is the Veld Fire Risk Status of the area? Extreme or High = High; Medium; Low
High
About 75% of the District's land area has a high risk level of veldfires.
Medium
The District's Fire Services prides itself on efficient and effective service delivery and works closely with various role-players (such as Henley Air (helicopter services), SAAF and members of the Winelands Fire Protection Association). Availability of water in firefighting is a challenge. Role of FPA. Risk assessment, Fire Services Seasonal Preparedness Plan.

81
No Indicator
Title Indicator
Description Exposure Question
Exposure Answer
Exposure Comment
Sensitivity Question Sensitivity
Answer Sensitivity Comment
Adaptive Capacity Answer
Adaptive Capacity
Comment
34 Decreased income from tourism
Reduced income from tourism as a result of reduced recreational opportunities and increased impact on tourism-supporting infrastructure, such as conservation area access roads.
Do you have tourism assets that can be impacted by climate change in your area?
Yes
Wine tourism (both domestic and overseas) and Fynbos Biome.
How significant is tourism to the local economy? Significant contributor = High; Some contribution = Medium; Low/No contribution = Low
High
The wine industry is a large contributor to the tourism sector (tourism real estate, wine activities, culinary events, wine competitions, harvest festivals etc). Cultural experiences.
Medium - Low
The provincial Climate Change Response Strategy highlights the importance of safeguarding the unique cultural, scenic and coastal resources on which the tourism economy depends. Biodiversity Strategy and Action Plan, SmartAgri.

82
5.5 Water Table 9: Water Vulnerability Indicator Table Cape Winelands District Municipality
No Indicator Title Indicator
Description Exposure Question
Exposure Answer
Exposure Comment Sensitivity Question
Sensitivity Answer
Sensitivity Comment
Adaptive Capacity Answer
Adaptive Capacity Comment
35 Decreased quality of drinking water
Deterioration in water quality due to increased salt concentrations in dams, wetlands and soil/plant systems from enhanced evaporation rates.
Is this or will this take place in your area?
Yes
The entire District is under pressure due to reduced rainfall, invasive alien species, intensive and poorly managed agricultural activities as well as lime production.
What is the Blue Drop Score for the area (2012 Report)? Less than 50% = high; Between 50% & 90% = Medium; More than 90% = low
Medium - High
Blue Drop scores 2014: Witzenberg LM: 96% Breede Valley LM: 89% Langeberg LM: 72% Drakenstein LM: 72% Stellenbosch LM: 80% Control of water supply is dependent on City of CPT.
Low
The District's Climate Change Adaptation Strategy (draft) highlights various key interventions for securing future water quality such as the Working For Water Programme, Cape Winelands Invasive Alien Vegetation Management Programme and the Cape Winelands River Rehabilitation Programme. Source more information from what local municipalities are doing. Possibility of water augmentation from CPT. Alien cleansing mechanical plans. WC Climate Change Response Strategy. WC Sustainable Water Management Plan. Risk Assessment.

83
No Indicator Title Indicator
Description Exposure Question
Exposure Answer
Exposure Comment Sensitivity Question
Sensitivity Answer
Sensitivity Comment
Adaptive Capacity Answer
Adaptive Capacity Comment
36
Decreased water quality in ecosystem due to floods and droughts
More frequent floods result in increased effluent overflow into rivers. Increased drought means less water is available to dilute wastewater discharges and irrigation return flows to rivers.
Is this or will this take place in your area?
Yes
In the entire District, due to reduced rainfall, invasive alien species, agricultural activities and lime production. Increased pressure on infrastructure as a result of informal settlements.
What is the Green Drop Score for the area? Less than 50% = high; Between 50% & 90% = Medium; More than 90% = low
High
Green Drop Scores for 2013: Witzenberg LM: 97.96% Breede Valley LM: 90.21% Langeberg LM: 51.58% Drakenstein LM: 77.79% Stellenbosch LM: 40.16% Water quality has been identified as a major risk within the District.
Low
The River Health Programme primarily makes use of biological indicators to assess the condition or health of river systems, which is useful for detecting, identifying and reporting on emerging problems facing aquatic ecosystems. Research source of pollution - agriculture fertilisers as source of pollution. Invasive aquatic weeds. Alien cleansing mechanical plans. WC Climate Change Response Strategy. WC Sustainable Water Management Plan. Risk Assessment.
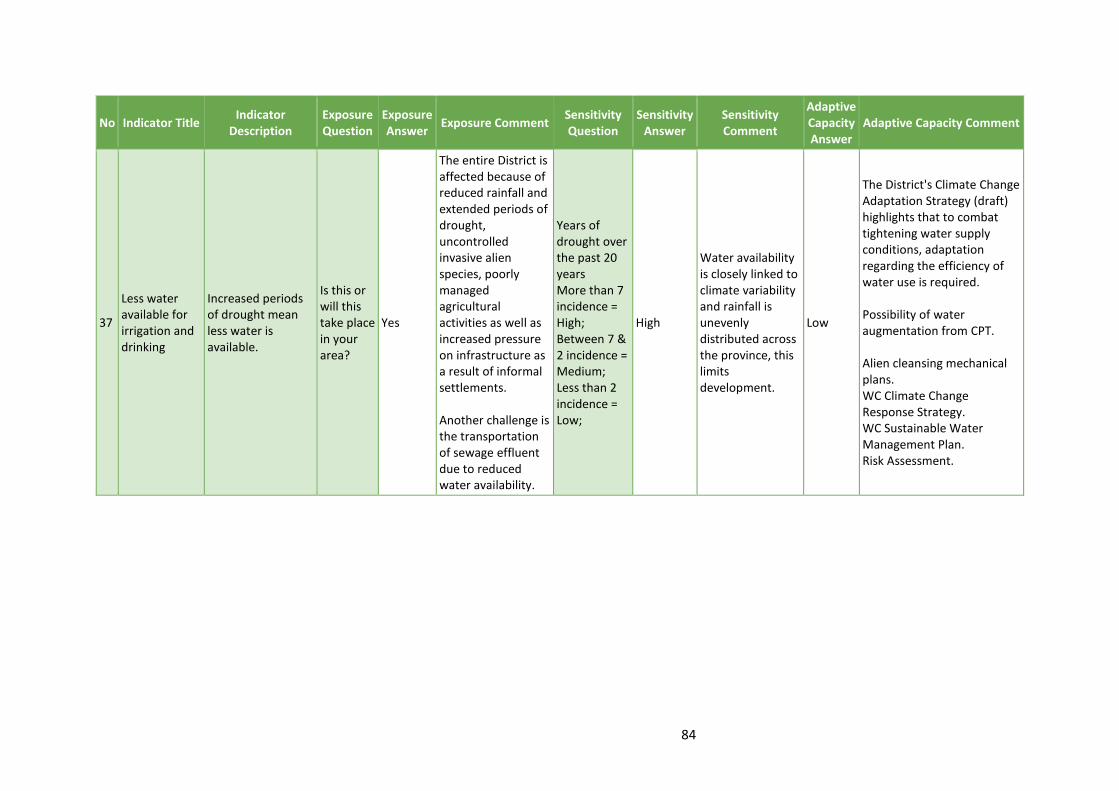
84
No Indicator Title Indicator
Description Exposure Question
Exposure Answer
Exposure Comment Sensitivity Question
Sensitivity Answer
Sensitivity Comment
Adaptive Capacity Answer
Adaptive Capacity Comment
37
Less water available for irrigation and drinking
Increased periods of drought mean less water is available.
Is this or will this take place in your area?
Yes
The entire District is affected because of reduced rainfall and extended periods of drought, uncontrolled invasive alien species, poorly managed agricultural activities as well as increased pressure on infrastructure as a result of informal settlements. Another challenge is the transportation of sewage effluent due to reduced water availability.
Years of drought over the past 20 years More than 7 incidence = High; Between 7 & 2 incidence = Medium; Less than 2 incidence = Low;
High
Water availability is closely linked to climate variability and rainfall is unevenly distributed across the province, this limits development.
Low
The District's Climate Change Adaptation Strategy (draft) highlights that to combat tightening water supply conditions, adaptation regarding the efficiency of water use is required. Possibility of water augmentation from CPT. Alien cleansing mechanical plans. WC Climate Change Response Strategy. WC Sustainable Water Management Plan. Risk Assessment.

85
No Indicator Title Indicator
Description Exposure Question
Exposure Answer
Exposure Comment Sensitivity Question
Sensitivity Answer
Sensitivity Comment
Adaptive Capacity Answer
Adaptive Capacity Comment
38
Increased impacts of flooding from litter blocking storm water and sewer systems
Human health and ecosystem impacts, associated with increased rainfall intensities, flash floods and regional flooding resulting in litter and washed-off debris blocking water and sanitation systems.
Is this or will this take place in your area?
Yes
Increased pressure on infrastructure and service delivery as a result of informal settlements.
Percentage of Households using no rubbish disposal More than 10% = High; Between 10% & 5% = Medium; Less than 5% = Low
Low
Only 1.45% of households no access to rubbish disposal services. Not utilised properly by the community. Informal settlements do not have adequate services.
High
Regarding refuse removal, the District's IDP (2016/2017) shows that it is currently performing better than the national infrastructure performance. Awareness and education campaigns and programmes. Landfill sites capacity decreasing Alien cleansing mechanical plans. WC Climate Change Response Strategy. WC Sustainable Water Management Plan. Risk Assessment.

86
No Indicator Title Indicator
Description Exposure Question
Exposure Answer
Exposure Comment Sensitivity Question
Sensitivity Answer
Sensitivity Comment
Adaptive Capacity Answer
Adaptive Capacity Comment
39 Increased fish mortality
Increased freshwater fish mortality due to reduced oxygen concentrations in aquatic environments and mortality of temperature-sensitive fish species.
Do you have fresh water fish in your area?
Yes
Less rainfall, increased pollution of freshwater resource, and uncontrolled spread of invasive fish species.
How significant is fresh water fish to livelihoods? Significant to livelihoods = High; Some dependence = Medium; Low/No dependence = Low
Medium
Investments are being made in the aquaculture sector and it has become an emerging industry throughout the province.
Medium
The Western Cape State of the Environment Outlook Report states that with careful management, it is possible to support aquaculture farming without compromising the conservation of indigenous fish species. WC SoER, State of River Health Report, Biodiversity Strategy and Action Plan.
52 Less groundwater availability
Increased extraction of ground water results in boreholes collapse and lower water table levels
Is this or will this take place in your area?
Yes
The Breede-Gouritz Water Management Area has a high UGEP (utilisable groundwater exploitable potential) of 362.9 million cubic metres per annum (m3/annum).
If it takes place how significant will it be?
Medium
Regions in the Western Cape have only localised threats of over-abstraction (predominantly in farming areas).
Medium
The District's Climate Change Adaption Strategy (draft) describes how the National Water Policy and the National Water Act will be achieved through the Catchment Management Agencies which have been established in each of the country's Water Management Areas.

87
5.6 Vulnerability Assessment Summary The tables below list the high and medium priority climate change indicators for the municipality.
5.6.1 High Priority Climate Change Indicators Based on the above vulnerability assessment the following indicators were identified as high priority climate change vulnerabilities for the municipality. These
were shortlisted by answering “yes” to exposure, “high” to sensitivity and “low” to adaptive capacity.
Table 10: High Priority Indicators Cape Winelands District Municipality
No Sector Name Indicator Title Exposure Answer
Sensitivity Answer
Adaptive Capacity Answer
5 Agriculture Change in viticulture (grapes) production Yes High Low
6 Agriculture Change in fruit production Yes High Low
10 Agriculture Increased risks to livestock Yes High Low
12 Biodiversity and Environment Loss of High Priority Biomes Yes High Low
14 Biodiversity and Environment Increased impacts on environment due to land-use change
Yes High Low
28 Human Settlements, Infrastructure and Disaster Management
Loss of industrial and labour productivity Yes High Low
29 Human Settlements, Infrastructure and Disaster Management
Increased impacts on strategic infrastructure Yes High Low
30 Human Settlements, Infrastructure and Disaster Management
Increased impacts on traditional and informal dwellings
Yes High Low
31 Human Settlements, Infrastructure and Disaster Management
Increased isolation of rural communities Yes High Low
36 Water Decreased water quality in ecosystem due to floods and droughts
Yes High Low
37 Water Less water available for irrigation and drinking Yes High Low

88
5.6.2 Medium Priority Climate Change Indicators Based on the above vulnerability assessment the following indicators were identified as medium priority climate change vulnerabilities for the municipality.
These were shortlisted by answering “yes” to exposure, “medium” or “high” to sensitivity and “low” or “medium” to adaptive capacity.
Table 11: Medium Priority Indicators Cape Winelands District Municipality
No Sector Name Indicator Title Exposure Answer
Sensitivity Answer
Adaptive Capacity Answer
7 Agriculture Change in other crop production areas (e.g. vegetables, nuts, etc.)
Yes Medium Medium
9 Agriculture Increased exposure to pests such as eldana, chilo and codling moth
Yes High Medium
53 Agriculture Reduced food and feed security Yes Low High
13 Biodiversity and Environment Increased impacts on threatened ecosystems Yes High Medium
15 Biodiversity and Environment Loss of Priority Wetlands and River ecosystems Yes High Medium
55 Biodiversity and Environment Loss of Soil Fertility Yes High Medium
21 Human Health Health impacts from increased storm events Yes High High
22 Human Health Increased heat stress Yes Medium Medium
25 Human Health Increased malnutrition and hunger as a result of food insecurity
Yes Low Low
26 Human Health Increased air pollution Yes Low Medium
27 Human Health Increased Occupational health problems Yes High Medium
32 Human Settlements, Infrastructure and Disaster Management
Increased migration to urban and peri-urban areas Yes Medium Low
33 Human Settlements, Infrastructure and Disaster Management
Increased risk of wildfires Yes High Medium
34 Human Settlements, Infrastructure and Disaster Management
Decreased income from tourism Yes High Medium - Low

89
No Sector Name Indicator Title Exposure Answer
Sensitivity Answer
Adaptive Capacity Answer
35 Water Decreased quality of drinking water Yes Medium - High Low
38 Water Increased impacts of flooding from litter blocking storm water and sewer systems
Yes Low High
39 Water Increased fish mortality Yes Medium Medium
52 Water Less groundwater availability Yes Medium Medium

90
6 Sector Response Plans
6.1 Agriculture
6.1.1 Introduction Project Name
! Agriculture Sector Adaptation to Climate Change
! Project Custodian/Driver
!
! Overview of Key Issues
!
The South African agricultural sector is highly diverse in terms of its activities and socio-economic context. This sector can be described as two-tiered (commercial vs. small-holder and subsistence farmers), with activities across a wide variety of climatic conditions (especially of rainfall). Roughly 90% of the country is sub-arid, semi-arid, or sub-humid, and about 10% is considered hyper-arid. Only 14% of the country is potentially arable, with one fifth of this land having high agricultural potential. Climate is important in determining potential agricultural activities and suitability across the country, especially in smallholding and homestead settings. Irrigation and conservation tillage practices can overcome rainfall constraints, especially in the high-value commercial agricultural sector. Irrigation currently consumes roughly 60% of the country’s surface water resources, with important implications for agricultural exports, and food and water security in the context of climate change.
v Objectives
5 Manage the change in viticulture (grapes) production
6 Manage the change in fruit production
10 Manage increasing risks to livestock
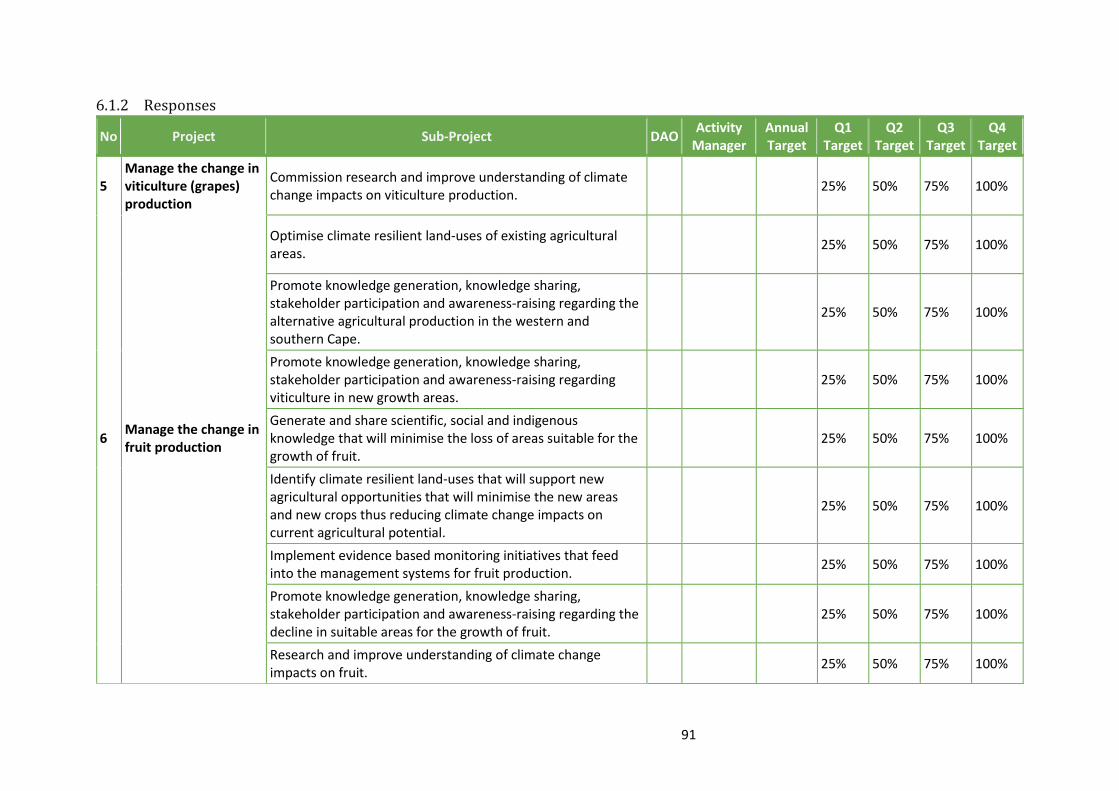
91
6.1.2 Responses
No Project Sub-Project DAO Activity
Manager Annual Target
Q1 Target
Q2 Target
Q3 Target
Q4 Target
5 Manage the change in viticulture (grapes) production
Commission research and improve understanding of climate change impacts on viticulture production.
25% 50% 75% 100%
5 Manage the change in viticulture (grapes) production
Optimise climate resilient land-uses of existing agricultural areas.
25% 50% 75% 100%
5 Manage the change in viticulture (grapes) production
Promote knowledge generation, knowledge sharing, stakeholder participation and awareness-raising regarding the alternative agricultural production in the western and southern Cape.
25% 50% 75% 100%
5 Manage the change in viticulture (grapes) production
Promote knowledge generation, knowledge sharing, stakeholder participation and awareness-raising regarding viticulture in new growth areas.
25% 50% 75% 100%
6 Manage the change in fruit production
Generate and share scientific, social and indigenous knowledge that will minimise the loss of areas suitable for the growth of fruit.
25% 50% 75% 100%
6 Manage the change in fruit production
Identify climate resilient land-uses that will support new agricultural opportunities that will minimise the new areas and new crops thus reducing climate change impacts on current agricultural potential.
25% 50% 75% 100%
6 Manage the change in fruit production
Implement evidence based monitoring initiatives that feed into the management systems for fruit production.
25% 50% 75% 100%
6 Manage the change in fruit production
Promote knowledge generation, knowledge sharing, stakeholder participation and awareness-raising regarding the decline in suitable areas for the growth of fruit.
25% 50% 75% 100%
6 Manage the change in fruit production
Research and improve understanding of climate change impacts on fruit.
25% 50% 75% 100%

92
No Project Sub-Project DAO Activity
Manager Annual Target
Q1 Target
Q2 Target
Q3 Target
Q4 Target
6 Manage the change in fruit production
Strengthen management plans, to enable continuous monitoring and the ability to effectively respond to the change.
25% 50% 75% 100%
10 Manage increasing risks to livestock
Commission research and improve understanding of climate change impacts livestock and land availability
25% 50% 75% 100%
10 Manage increasing risks to livestock
Develop a framework that will assist and educate farmers with adjusting to reduced rainfall.
25% 50% 75% 100%
10 Manage increasing risks to livestock
Generate and share scientific, social and indigenous knowledge that will assist with adapting to the reduction in herbage yields.
25% 50% 75% 100%
10 Manage increasing risks to livestock
Improve collaboration and partnership on existing programs (e.g. LandCare Programme, EPWP and River Health Programmes)
25% 50% 75% 100%
10 Manage increasing risks to livestock
Strengthen management plans, to enable continuous monitoring of water and herbage availability for livestock.
25% 50% 75% 100%

93
6.2 Biodiversity and Environment
6.2.1 Introduction
Project Name
! Biodiversity and Environment Sector Adaptation to Climate Change
! Project Custodian/Driver
!
! Overview of Key Issues
!
Biodiversity is crucial to ecosystem health, and healthy ecosystems are central to human well-being. Healthy ecosystems interlinked with working landscapes and other open spaces form the ecological infrastructure of the country and are the foundation for clean air and water, fertile soil and food. All South Africans depend on healthy ecosystems for economic and livelihood activities, including agriculture, tourism and a number of income generating and subsistence level activities. These natural ecosystems are under pressure from land use change and related processes causing degradation, as well as invasive alien species. Accelerated climate change (resulting in increasing temperature, rising atmospheric CO2 and changing rainfall patterns) is exacerbating these existing pressures. Well-functioning ecosystems provide natural solutions that build resilience and help society adapt to the adverse impacts of climate change. This includes, for example, buffering communities from extreme weather events such as floods and droughts, reducing erosion and trapping sediment, increasing natural resources for diversifying local livelihoods, providing food and fibre, and providing habitats for animals and plants which provide safety nets for communities during times of hardship. Sustainably managed and/or restored ecosystems help in adapting to climate change at local or landscape level.
v Objectives
12 Manage Loss of High Priority Biomes
14 Manage Increased impacts on environment due to land-use change

94
6.2.2 Responses
No Project Sub-Project DAO Activity
Manager Annual Target
Q1 Target
Q2 Target
Q3 Target
Q4 Target
12 Manage Loss of High Priority Biomes
Implementation of fire breaks in local municipalities (Langeberg) by 2022 through the Disaster Management Unit.
25% 50% 75% 100%
12 Manage Loss of High Priority Biomes
Identification/Inclusion of high priority biomes in local Spatial Development Frameworks during the review process.
25% 50% 75% 100%
14 Manage Increased impacts on environment due to land-use change
Develop program to diversify community livelihoods strategies to earn income from other activities such as ecotourism and other non-farming activities.
25% 50% 75% 100%
14 Manage Increased impacts on environment due to land-use change
Incentivize small scale farmers to practice sustainable and conservative agriculture
25% 50% 75% 100%
14 Manage Increased impacts on environment due to land-use change
Incorporate sustainable land use management and planning into other sectors plans.
25% 50% 75% 100%
14 Manage Increased impacts on environment due to land-use change
Research and improve understanding of land use change in the municipality.
25% 50% 75% 100%
14 Manage Increased impacts on environment due to land-use change
Strengthen institutional capacity to deal with pressure on land use change
25% 50% 75% 100%

95
6.3 Disaster Management, Infrastructure and Human Settlements
6.3.1 Introduction
Project Name
! Human Settlements, Infrastructure and Disaster Management Sector Adaptation to Climate Change
! Project Custodian/Driver
!
! Overview of Key Issues
!
South Africa is a diverse country, not just in terms of populations and biodiversity, but also in terms of its human settlements. These settlements face severe challenges, even before climate change is taken into account. The implications of the compounding impacts of climate change will be profound, and human settlements therefore represent a crucial part of national adaptation strategies. The overarching strategic framework for the development of human settlements is described in the National Development Plan (NDP) and, more specifically in relation to the implications for climate change, in the National Climate Change Response (NCCR). However, to develop appropriate adaptation responses a more nuanced understanding of the challenges and options for human settlements is required, building on the insights of the NCCR. This understanding needs to take into account the unusually diverse urban forms of human settlement in the South African context, and the importance of ecological infrastructure in supporting service delivery and building resilient communities.
v Objectives
28 Manage potential loss of industrial and labour productivity.
29 Manage potential increased impacts on strategic infrastructure.
30 Manage increased impacts on traditional and informal dwellings
31 Manage potential increased isolation of rural communities.

96
6.3.2 Responses
No Project Sub-Project DAO Activity
Manager Annual Target
Q1 Target
Q2 Target
Q3 Target
Q4 Target
28 Manage potential loss of industrial and labour productivity.
Research and implement water efficiency projects in industrial processes to improve the efficiency of water usage.
25% 50% 75% 100%
29 Manage potential increased impacts on strategic infrastructure.
Implement a water augmentation project that will help reduce reliance on surface water and seek alternative sources of water (e.g. recycling of water).
25% 50% 75% 100%
29 Manage potential increased impacts on strategic infrastructure.
Upgrade and maintain stormwater infrastructure so that it considers extreme weather events such as flooding.
25% 50% 75% 100%
29 Manage potential increased impacts on strategic infrastructure.
Upgrading and maintenance of road infrastructure. 25% 50% 75% 100%
30 Manage increased impacts on traditional and informal dwellings
Develop and upgrade informal settlements. 25% 50% 75% 100%
30 Manage increased impacts on traditional and informal dwellings
Partner with research institutions to implement a research project to develop a model aimed at achieving sustainable informal settlements with lower risk exposure.
25% 50% 75% 100%
31 Manage potential increased isolation of rural communities.
Build Climate change resilient road infrastructure that serves as a link for rural areas.
25% 50% 75% 100%
31 Manage potential increased isolation of rural communities.
Develop economic nodes and improved service provision in rural areas to improve connectivity.
25% 50% 75% 100%

97
No Project Sub-Project DAO Activity
Manager Annual Target
Q1 Target
Q2 Target
Q3 Target
Q4 Target
31 Manage potential increased isolation of rural communities.
Identify alternative access routes to rural communities. 25% 50% 75% 100%
31 Manage potential increased isolation of rural communities.
Identify local responses that will reduce isolation of rural communities.
25% 50% 75% 100%
31 Manage potential increased isolation of rural communities.
Identify roads at risk of flooding and erosion and prioritise those for upgrading and maintenance.
25% 50% 75% 100%
31 Manage potential increased isolation of rural communities.
Implement flooding drainage systems that will reduce impacts on rural roads.
25% 50% 75% 100%

98
6.4 Water
6.4.1 Introduction
Project Name
! Water Sector Adaptation to Climate Change
! Project Custodian/Driver
!
! Overview of Key Issues
!
South Africa’s climate is generally arid to semi-arid, with less than 9% of annual rainfall ending up in rivers, and only about 5% recharges groundwater in aquifers. In addition, rainfall and river flow are unpredictable in time and unevenly distributed in space, with only 12% of the land area generating 50% of stream flows. Decadal rainfall variability also results in extended dry and wet periods across the country. The main users of surface water resources are agricultural irrigation, domestic, industrial, mining and power generation, while plantation forestry intercepts and reduces runoff before it reaches the rivers and groundwater. Surface water resources were already over-allocated by the year 2000 in five of nineteen water management areas historically used for water planning and management purposes. The potential demand for water is expected to increase with economic growth, increased urbanisation, higher standards of living, and population growth. Because of the critical importance of water in the South African economy the country has a sophisticated water resources planning capacity, founded on a good understanding of the country’s variable rainfall. This planning capacity will be a key capability for adaptation planning under ongoing and future climate change.
v Objectives
36 Manage decreased water quality in ecosystem.
37 Manage the quantity of water available for irrigation and drinking.

99
6.4.2 Responses
No Project Sub-Project DAO Activity
Manager Annual Target
Q1 Target
Q2 Target
Q3 Target
Q4 Target
36 Manage decreased water quality in ecosystem.
Invasive aquatic weeds removal and management in Berg and Breede Rivers by the Cape Winelands District Municipality, B municipalities, DOWA, property/landowners and water user associations. Continuous clearing should be done annually between September and April. The specific area to be targeted is between the R45 and Herman.
25% 50% 75% 100%
37
Manage the quantity of water available for irrigation and drinking.
Cape Winelands District Municipality to facilitate research into the re-use of wastewater within the District Municipality, with B-municipalities indicating which towns should be included in the research. The economic viability and quantities are important selection criteria. The replenishment of aquifers by infusion of purified waste water should form part of the research. Implementation by relevant Engineering Departments of B-municipalities.
25% 50% 75% 100%
37
Manage the quantity of water available for irrigation and drinking.
Cape Winelands District Municipality to facilitate the assessment of existing infrastructure for water storage. Implementation by Engineering Departments of B-municipalities.
25% 50% 75% 100%
37
Manage the quantity of water available for irrigation and drinking.
Increase alien clearing in catchments located throughout the entire District and B municipalities in partnership with Department of Water and Sanitation and LandCare Programme.
25% 50% 75% 100%

100
7 References Amos, E, Akpan, U, and Ogunjobi, K. 2015. “‘Households’ Perception and Livelihood Vulnerability to
Climate Change in a Coastal Area of Akwa Ibom State, Nigeria’” 17 (4):887–908. Blignaut, J. N., and M. P. De Wit. 2004. “Reflecting on Economic Growth.” In Sustainable Options:
Economic Development Lessons from Applied Environmental Economics in South Africa. UCT Press.
Böckmann, M. 2015. “Exploring the Health Context: A Multimethod Approach to Climate Change Adaptation Evaluation.” Bremen: Universität Bremen. https://elib.suub.uni-bremen.de/edocs/00104711-1.pdf.
Cape Winelands District Municipality. 2007. “Spatial Development Framework: District Management Area.”
———. 2009. “Cape Winelands District Spatial Development Framework.” ———. 2015. “Cape Winelands District Municipality - Climate Change Response: Framework for a
Draft Climate Change Adaptation Strategy.” ———. 2016. “Cape Winelands District Municipality Final Review of the 3rd Generation Integrated
Development Plan 2016/2017.” ———. 2017. “Cape Winelands District Municipality 4th Generation Integrated Development Plan
2017/18 to 2021/22.” Climate System Analysis Group. 2017a. “Future Climate Projections.”
http://cip.csag.uct.ac.za/webclient2/datasets/africa-merged-cmip5/#nodes/cmip5-anomalies?folder_id=33&extent=99843.
———. 2017b. “Historical Climate Monthly Averages.” http://cip.csag.uct.ac.za/webclient2/datasets/africa-merged-cmip5/#nodes/seasonality-cmip5?folder_id=33&extent=99843.
Coastal & Environmental Services. 2011. “Eastern Cape Climate Change Response Strategy.” Department of Economic Development and Environmental Affairs. http://www.dedea.gov.za/Policies/Draft%20EC%20Climate%20Change%20Response%20Strategy.pdf.
Council for Scientific and Industrial Research. 2011. “National Freshwater Ecosystem Priority Areas (NFEPA): Wetlands 2011 [Vector Geospatial Dataset].” http://bgis.sanbi.org/SpatialDataset/Detail/395.
Davis, C.L. 2011. “Climate Risk and Vulnerability: A Handbook for Southern Africa.” http://start.org/download/2011/sadc-handbook-11.pdf.
De Lange, B. 2013. “Eskom Internal Report RES/RR/12/35052: Commercial Forests in South Africa.” Eskom. http://bea.dirisa.org/resources/metadata-sheets/WP06_01_META_Commercial.pdf.
Department of Agriculture, Forestry and Fisheries. 2010. “Map Showing the Risk of Veld Fires in South Africa.”
Department of Environmental Affairs. 2009. “National Protected Area Expansion Strategy Resource Document.” https://www.environment.gov.za/sites/default/files/docs/npaes_resource_document.pdf.
———. 2011. “National Climate Change Response White Paper (NCCRWP).” https://www.environment.gov.za/sites/default/files/legislations/national_climatechange_response_whitepaper.pdf.
———. 2013a. “Climate Trends and Scenarios for South Africa; LTAS Phase 1, Technical Report (No. 1 of 6).” https://drive.google.com/open?id=0B88z-WjOEKIlZy0xcG1KTGthSlk.
———. 2013b. “Long Term Adaptation Scenarios: Climate Change and Biodiversity, Climate and Impacts Factsheet Series, Factsheet 7 of 7.” http://www.sanbi.org/sites/default/files/documents/documents/ltas-factsheetclimate-change-and-biodiversity-sector2013.pdf.

101
———. 2013c. “Long Term Adaptation Scenarios: Climate Change and the Agriculture Sector, Climate and Impacts Factsheet Series, Factsheet 4 of 7.” http://www.sanbi.org/sites/default/files/documents/documents/ltas-factsheetclimate-change-and-agriculture-sector2013.pdf.
———. 2013d. “Long Term Adaptation Scenarios, Phase 1 - Technical Report - No 1 of 6 - Climate Trends and Scenarios for South Africa.” https://drive.google.com/file/d/0B88z-WjOEKIlZy0xcG1KTGthSlk/.
———. 2013e. “Long-Term Adaptation Scenarios Flagship Research Programme for South Africa. Climate Trends and Scenarios.” Department of Environmental Affairs. https://www.sanbi.org/sites/default/files/documents/documents/ltasclimate-trends-and-scenarios-tech-report2013low-res.pdf.
———. 2017. “South Africa Protected Areas Database (SAPAD_OR_2017_Q2) [Vector Geospatial Dataset].” http://egis.environment.gov.za.
Department of Environmental Affairs and Development Planning. 2008. “A Climate Change Strategy and Action Plan for the Western Cape.” http://www.cityenergy.org.za/uploads/resource_107.pdf.
Department of Water Affairs. 2011. “2011 Blue Drop Report.” https://www.dwa.gov.za/Documents/BD/BDIntro.pdf.
———. 2013. “National Water Resources Strategy: Second Edition.” https://www.dwaf.gov.za/nwrs/LinkClick.aspx?fileticket=u_qFQycClbI%3d&tabid=91&mid=496.
Department of Water and Sanitation. 2013. “2013 Green Drop Report - Volume 1: Municipal and Private Wastewater Systems.” http://www.dwa.gov.za/Dir_WS/GDS/Docs/UserControls/DownloadSiteFiles.aspx?id=74.
———. 2014. “2014 Blue Drop Report.” https://www.dwa.gov.za/dir_ws/DWQR/subscr/ViewComDoc.asp?Docid=703.
———. 2016a. “Green Drop System.” 2016. https://www.dwa.gov.za/dir_ws/GDS/DefaultTopPerformers.aspx?ProvCode=SA.
———. 2016b. “Dam Hydrological Data.” https://www.dwaf.gov.za/iwqs/wms/data/000key.asp. Driver, A., Sink, K.J., Nel, J.N., Holness, S., Van Niekerk, L., Daniels, F., Jonas, Z., Majiedt, P.A., Harris,
L., and Maze, K. 2012. National Biodiversity Assessment 2011: An Assessment of South Africa’s Biodiversity and Ecosystems: Synthesis Report. Pretoria: South African National Biodiversity Institute and Department of Environmental Affairs.
Eden District Municipality. 2017. “Eden District Municipality Integrated Development Plan 2017/2018 - 2021/2022.”
Health Systems Trust. 2012. “National-Health-Facilities-Audit.pdf.” https://www.health-e.org.za/wp-content/uploads/2013/09/National-Health-Facilities-Audit.pdf.
Jiri, O. 2016. “Climate Change and Variability Impacts on Crop Production in the Low Potential Smallholder Farming Regions of Zimbabwe.” PhD thesis, Pietermaritzburg: University of KwaZulu-Natal. https://researchspace.ukzn.ac.za/bitstream/handle/10413/13962/Jiri_Obert_2016.pdf?sequence=1&isAllowed=y.
Koske, J, and Ochieng, M.A. 2013. “The Level of Climate Change Awareness and Perception among Primary School Teachers in Kisumu Municipality, Kenya” 3 (21):174–79.
Kruger, A.C, and Shongwe, S. 2004. “Temperature Trends in South Africa: 1960–2003” 15 (24):1929–45.
Massyn, N, N Peer, R English, A Padarath, P Barron, and C Day, eds. 2016. “District Health Barometer 2015/16.” Health Systems Trust.
Meyiwa, T, Maseti, T, Ngubane, S, Letsekha, T, and Rozani, C. 2014. “Women in Selected Rural Municipalities: Resilience and Agency against Vulnerabilities to Climate Change” 3 (28):102–14.

102
Millennium Ecosystem Assessment. 2005. Ecosystems and Human Well-Being: A Framework for Assessment. Washington DC: Island Press.
Mucina, L., and M.C. Rutherford, eds. 2006. The Vegetation of South Africa, Lesotho and Swaziland. Strelitzia 19. Pretoria: South African National Biodiversity Institute. https://www.sanbi.org/documents/vegetation-south-africa-lesotho-and-swaziland-strelitzia-19.
Nelitz, M, Boardley, S, and Smith, R. 2013. “Tools for Climate Change Vulnerability Assessments for Watersheds.” http://www.mirocan.org/public/documents/outils/uploaded/nxdzgA3x.pdf.
Nicholson-Cole, S.A. 2005. “Representing Climate Change Futures: A Critique on the Use of Images for Visual Communication” 3 (29):255–273.
Parikh, J. 2007. “Gender and Climate Change Framework for Analysis, Policy & Action.” https://archive.nyu.edu/bitstream/2451/34216/2/gnder_cc.pdf.
Parry, M.L., O.F. Canziani, J.P. Palutikof, P.J. van der Linden, and C.E. Hanson. 2007. “Contribution of Working Group II to the Fourth Assessment Report of the Intergovernmental Panel on Climate Change.” Cambridge University Press. https://www.ipcc.ch/publications_and_data/ar4/wg2/en/contents.html.
Pasquini, L, Cowling, R.M, and Ziervogel, G. 2013. “Facing the Heat: Barriers to Mainstreaming Climate Change Adaptation in Local Government in the Western Cape Province, South Africa,” no. 40:225–32.
SANBI. 2011. “Freshwater Ecosystem Priority Areas (FEPAs) for River Ecosystems [Vector Geospatial Dataset].” South African National Biodiversity Institute.
Singh, V, and E Kistnasamy. 2014. “Potential Climate Change Impacts on Environmental Health Services: Perspectives from a Developing Country” 2 (3):113–18. https://doi.org/DOI:10.12691/ajphr-2-3-9.
SmartAgri, and African Climate and Development Initiative. 2015. “A Status Quo Review of Climate Change and the Agriculture Sector of the Western Cape Province.” Western Cape Department of Agriculture and the Western Cape Department of Environmental Affairs & Development Planning. http://acdi.uct.ac.za/sites/default/files/filesattached/SmartAgri%20Review%20Executive%20Summary.pdf.
South African National Biodiversity Institute. 2011. “National List of Threatened Ecosystems 2011 [Vector Geospatial Dataset].” http://bgis.sanbi.org/SpatialDataset/Detail/501.
South African National Parks. 2011a. “CCAB - Current Biome Delineations 2011 [Vector Geospatial Dataset].” Available from the Biodiversity GIS website. http://bgis.sanbi.org/SpatialDataset/Detail/484.
———. 2011b. “CCAB - High Risk Scenarios - Biome Delineations 2011 [Vector Geospatial Dataset].” Available from the Biodiversity GIS website. http://bgis.sanbi.org/SpatialDataset/Detail/486.
———. 2011c. “CCAB - Medium Risk - Climate Scenarios - Biome Delineations 2011 [Vector Geospatial Dataset].” Available from the Biodiversity GIS website. http://bgis.sanbi.org/SpatialDataset/Detail/475.
South African National Parks / South African National Biodiversity Institute. 2011. “National Biodiversity Assessment 2011: Protect Areas [Vector Geospatial Dataset].”
SRK Consulting. 2011. “Environmental Management Framework: Cape Winelands District Municipality Draft Status Quo Report – Non‐technical Summary.”
Statistics South Africa. 2011. “Census 2011 Statistical Release.” Pretoria. ———. 2015. “Mortality and Causes of Death in South Africa, 2015: Findings from Death
Notification.” United Nations WomenWatch. 2009. “Women, Gender Equality and Climate Change.”
http://www.un.org/womenwatch/feature/climate_change/. Warburton, M.L. 2012. “Challenges in Modelling Hydrological Responses to Impacts and Interactions
of Land Use and Climate Change.” PhD thesis, Pietermaritzburg: University of KwaZulu-Natal.

103
http://researchspace.ukzn.ac.za/xmlui/bitstream/handle/10413/9436/Warburton_Michele_Lynn_2012.pdf?sequence=1.
Warburton, M.L, and Schulze, R. 2006. “Climate Change and the South African Commercial Forestry Sector. An Initial Study.” http://www.forestry.co.za/uploads/File/industry_info/environment/Climate%20change%20on%20forestry.pdf.
Western Cape Department of Agriculture. 2017. “Cape Farm Mapper Ver 2.0.6.1.” 2017. https://gis.elsenburg.com/apps/cfm/.
Western Cape Department of Environmental Affairs and Development Planning. 2013. “State of the Environment Outlook Report for the Western Cape Province: Introductory Matter.” 2013. http://soer.deat.gov.za/dm_documents/Western_Cape_2013_State_of_Environment_Report__Lhiif.pdf.
Western Cape Government. 2015. “A Climate Change Response Framework for the Agriculture Sector of the Western Cape Province (WCCCARF).” http://acdi.uct.ac.za/sites/default/files/filesattached/Draft%20Final%20Western%20Cape%20Climate%20Change%20Response%20Framework%20for%20the%20Agricultural%20Sector.compressed.pdf.
———. 2016. “Central Karoo Climate Change Response Plan - Final Draft.” Western Cape Government: Environmental Affairs and Development Planning. 2014. “Western Cape
Climate Change Response Strategy.” 2014. https://www.westerncape.gov.za/text/2015/march/western_cape_climate_change_response_strategy_2014.pdf.
World Health Organization. 2017. “Climate Change and Health.” http://www.who.int/mediacentre/factsheets/fs266/en/.
Ziervogel, G, and Calder, R. 2003. “Climate Variability and Rural Livelihoods: Assessing the Impact of Seasonal Climate Forecasts in Lesotho” 4 (35):403–17.
Related Documents


